MIMI4 l - Michigan State University
105
MIMI 4 l 142 817 THS
-
Upload
khangminh22 -
Category
Documents
-
view
5 -
download
0
Transcript of MIMI4 l - Michigan State University

MIMI
4 l
142
817
THS

This is to certify that the
thesis entitled
The Effect of Adding Guided-Inquiry to Laboratory Activities in
an Acid Base Unit in a High School Chemistry Classroom
presented by
Kendon Douglas Smith
has been accepted towards fulfillment
of the requirements for the
MS degree in Interdepartmental Biological
Science
(/ ‘
f Major fir‘of/ekipr’s Signature
1:) 7 (’1 f? 5:25.][6)
' I
/
Date
MSU is an Affirmative Action/Equal Opportunity Employer
Infi A DV
L'Dnhr‘I-
Michigan Sta“?
Universrty
~.-_
--
--
--
--
no
oo
In
..-I-O-.-.-.----.-I-.-O-.--.-.-.-I-O-n-n—O-a-o-

PLACE IN RETURN BOX to remove this checkout from your record.
To AVOID FINES return on or before date due.
MAY BE RECALLED with earlier due date if requested.
DATE DUE DATE DUE DATE DUE
5/08 Kilproj/AccaPres/CIRCIDateDue‘indd

THE EFFECT OF ADDING GUIDED-INQUIRY To LABORATORY
ACTIVITIES IN AN ACID BASE UNIT IN A HIGH SCHOOL CHEMISTRY
CLASSROOM
By
Kendon Douglas Smith
A THESIS
Submitted to
Michigan State University
in partial fulfillment of the requirements
for the degree of
MASTER OF SCIENCE
Interdepartmental Biological Sciences
2010
ABSTRACT
THE EFFECT OF ADDING GUIDED-INQUIRY TO LABORATORY
ACTIVITIES IN AN ACID BASE UNIT IN A HIGH SCHOOL CHEMISTRY
CLASSROOM
By
Kendon Douglas Smith
This research project studied the effectiveness of adding guided
inquiry sections to laboratory activities in an acid base unit in a high
school Chemistry classroom. The goals were to promote student interest
and understanding of unit content through the addition of guided inquiry
sections at the end of each activity. Students were asked to investigate
teacher’s questions by designing their own procedure in an effort to
engage them more deeply in the process of pursuing answers. Efforts
were also made to connect these sections with the chemicals and materials
already familiar to students in their daily lives in the expectation of
generating higher levels of individual interest in the subject of acids and
bases. The effectiveness of this unit was determined using surveys,
subjective data, and pre/post test comparisons. The results fiom these
assessments Show that the unit was effective. This document also
examines and critiques each of the six lab activities developed and how
they fit with the unit.

TABLE OF CONTENTS
LIST OF TABLES .............................................................................. v
LIST OF FIGURES ............................................................................. vi
INTRODUCTION ................................................................................. 1
Statement of Problem and Rationale for the Study ................................... 1
The Historical Role of Chemistry Laboratories ....................................... 2
Definitions of Inquiry ..................................................................... 5
Review of Scientific Principles ......................................................... 8
Demographics ........................................................................... 10
IMPLEMENTATION ............................................................................ 12
Explanation of Unit Sequence and Purpose .......................................... 12
Description of and Analysis of Activities ........................................... 14
Teacher Demonstration — The Rainbow Connection ..................... 14
Activity #1 — Observing Various pH Indicators ........................... 15
Activity #2 — Making pH Test Strips ........................................ 17
Activity #3 — A Simple Acid-Base Titration .............................. 18
Activity #4 — Analytical Acid-Base Titration .............................. 20
Activity #5 — Graphing a pH Curve .......................................... 22
Activity #6 - Effects of Acid Rain on Lakes .............................. 23
RESULTS AND EVALUATION ............................................................. 25
Pre/Post Test Analysis .................................................................. 25
Pre/Post Test Statistical Analysis: Multiple Choice ................................ 26
Pre/Post Test Statistical Analysis: Short Answer ................................... 27
Individual Item Analysis: Pre/Post Test Short Answer Questions ................ 29
Question #11: Acid Base Definitions ....................................... 29
Question #12: Definition ofpH and the pH Scale ........................ 30
Question #13: Acid Base Indicators ........................................ 31
Question #14: Buffers ......................................................... 32
Question #15: Neutralization Reactions .................................... 33
Analysis of Post Unit Survey Results ................................................. 34
Category #1: Physically Engaging .......................................... 35
Category #2: Mentally Engaging ........................................... 37
Category #3: Interesting ...................................................... 38
Category #4: Learning .............................................................. 39
Feedback and Student Quotes ................................................ 4O
DISCUSSION/CONCLUSION ................................................................ 43
iii

APPENDICES .................................................................................... 50
Appendix A: Student Assent Form ................................................... 52
Appendix B: Parent Assent Form ..................................................... 55
Appendix C: Acids and Bases Pre-Test .............................................. 58
Appendix D: Acids and Bases — Post Unit Survey ................................. 61
Appendix E: Individual Student Pre/Post Test Scores .............................. 63
Appendix F: The Rainbow Connection Demonstration ............................ 66
Appendix G: Activity #1: Observing Indicators .................................... 69
Appendix H: Activity #2: Making pH Test Strips .................................. 72
Appendix 1: Activity #3: A Simple Acid Base Titration Lab ..................... 77
Appendix J: Activity #4: Analytical Titration Lab ................................. 81
Appendix K: Activity #5: Graphing a pH Curve .................................... 86
Appendix L: Activity #6: Effects of Acid Rain on Lakes ......................... 89
REFERENCES ................................................................................... 93
iv

LIST OF TABLES
Table 1: Unit Activities and Objectives .................................................... 14
Table 2: Pre/Post Test Multiple Choice Statistical Data ................................. 27
Table 3: Pre/Post Test Short Answer Statistical Data .................................... 28
Table 4: Student Post Unit Survey Activity Rating Categories ......................... 34
Table 5: Average Student Activity Ratings on Post Unit Survey ....................... 35
Table 6: Individual Student Pre/Post Test Scores — Multiple Choice .................. 63
Table 7: Individual Student Pre/Post Test Scores — Short Answer ..................... 64

LIST OF FIGURES
Figure 1: Comparison of Student Pre/Post Test Multiple Choice Scores ............ 26
Figure 2: Comparison of Student Pre/Post Test Short Answer Scores ............... 28
Figure 3: Comparison of Pro/Post Test Scores for Short Answer #11 ............... 30
Figure 4: Comparison Of Pre/Post Test Scores for Short Answer #12 ............... 31
Figure 5: Comparison of Pre/Post Test Scores for Short Answer #13 ............... 32
Figure 6: Comparison of Pre/Post Test Scores for Short Answer #14 ................ 33
Figure 7: Comparison of Pre/Post Test Scores for Short Answer #15 ................ 34
vi

INTRODUCTION
Statement of Problem and Rationale for the Study
Chemistry is one of the most challenging classes that many students
undertake during their high school education. It is also one of the most
challenging classes to teach, and while doing so with seemingly good success
over the past nine years, I have continually found myself searching for better
methods for teaching Chemistry to what seem to be increasingly unmotivated
students. Chemistry is most often taught through lectures supported by
laboratory activities. ' Lecture is a teacher-centered mode of instruction that
allows large amounts of material to be covered, but does not ensure that
students learn or understand the material (Francisco, Nicoll, & Trautmann, 1998).
In fact, Horowitz has shown that after a few minutes of a lecture, 50% of students
tune out and never again in the course of the lecture are more than half of the
students attentive (Horowitz, 1988 from Spencer, 1999). Spencer also points out
that the best methodology to enable students to grasp and retain a concept
begins with an exploration or data collection (ibid). Laboratory experiments
present an opportunity for students to not only practice techniques, but also to
bring concepts to life as they move from the page to the real world.
The laboratory setting has the potential to be the most engaging and
enticing facet of the Chemistry classroom; however, after nine years of teaching,
it is the laboratory aspect of my classroom with which I find myself most
dissatisfied. Students seem to be able to follow the list of instructions to

complete a group laboratory exercise; however, they do not seem to be
meaningfully connected to the experience in a way that promotes inquiry and
Ieaming. Hofstein and Lunetta (2003) point out that studies have shown that
during many laboratory experiments teachers and students consume time and
energy preoccupied with technical and manipulative details, which seriously limits
the time they can devote to more meaningful, concept driven inquiry. For this
reason, the research reported here, on the development of a modified laboratory
experimental protocol, was expected to promote higher thinking and increase
learning through forms of guided inquiry.
The Historical Role of Chemistry Laboratories
Almost thirty years ago, in an review entitled “The Role of the Laboratory in
Science Teaching: Neglected Aspects of Research,” Hofsteing & Lunetta (1982)
reported that
for over a century, the laboratory had been given a central and
distinctive role in science education, and science educators have
suggested that there are rich benefits in learning that accrue from
using laboratory activities. In the late 1970s and early 1980s, some
educators began to seriously question both the effectiveness and
the role of laboratory work, and the case for laboratory was not as
self-evident as it seemed.
While many teachers and researchers recognized the potential for Ieaming
science concepts and skills through laboratory activities, there was uncertainty as
to whether the goals and objectives of such experience were being reached.
Novak (1988 from Tobin 1990) articulated the problem:
The science laboratory has always been regarded as the place
where students should learn the process of doing science. But

summaries of research on the value of laboratory for Ieaming
science did not favor laboratory over lecture-demonstration... and
more recent studies also show an appalling lack of effectiveness of
laboratory instruction... Our studies showed that most students in
laboratories gained little insight either regarding the key science
concepts involved or towards the process of knowledge
construction.
Tobin (1990) further suggested that meaningful Ieaming is possible in the
laboratory if the students are given opportunities to manipulate equipment and
materials in an environment suitable for them to construct their own knowledge of
phenomena and related scientific concepts. Hodson (1993 from Hoffstein &
Lunetta 2003) emphasized that the principle focus of laboratory activities should
not be limited to Ieaming specific scientific methods or laboratory techniques, but
rather, students should use the methods and procedures of science to
investigate phenomena, solve problems, and pursue inquiry and interests.
Over time research into the laboratory experience began to focus on
aspects of inquiry and providing opportunities for students to engage in
metacognitive activities. Metacognitive knowledge consists primarily of
knowledge about what factors or variables act and interact in what ways to affect
the course or outcome of cognitive enterprises (Flavell, 1979). Flavell further
suggests that metacognitive experience can help in the process of assimilating
observations to existing knowledge structures and accommodate the knowledge
to the observations. In other words, metacognition is a higher level of thinking
that involves elaboration and application of one's Ieaming, which can result in
enhanced understanding (Hoffsteing & Lunetta, 2003). This concept is also
found in the current Michigan science Grade Level Content Expectations (2007),
which state that teachers can prepare students for academic success by applying
knowledge to new situations, to solve problems by generating new ideas, and to
make connections between what they Ieam in class and the world around them.
This concept as applied to science teaching and Ieaming also drives the
modern theory of constructivism, an underlying doctrine that replaced objectivism
in the 1990s. Objectivism holds that reality is external, and the role of teachers is
to interpret events for students. The learners are simply told about the world and
expected to replicate its content and structure into their thinking (Jonassen,
1991 ). Jonassen further states that constructivism, on the other hand, claims
that reality is in the mind as the knower constructs his or her reality, or interprets
it. Teaching strategies based on constructivism should focus on providing
students with physical experiences that induce cognitive conflict and encourage
students to develop new knowledge schemes (Ketpichainarong et al, 2009).
The constructivist approach often incorporates inquiry based Ieaming as a
method to promote greater student engagement in the Ieaming process. This
may include the implementation of guided inquiry approaches, which require a
change in the traditional roles of students and instructors (Landis et. al. 1998).
The NSF-supported New Traditions Project of reform in teaching chemistry
stated the following (Landis et. al 1998 from Spencer 1999):
The overarching vision of the New Traditions Project is that we can
facilitate a paradigm shift from faculty-centered teaching to student-
centered Ieaming throughout the chemistry curriculum, such that
students obtain a deeper Ieaming experience, improve their
understanding and ability to apply Ieaming to new situations,
enhance their critical thinking and experimental skills, and increase
their enthusiasm for science and Ieaming.

Enthusiasm for science and Ieaming is the most powerful motivating force for any
student to Ieam. A constructivist, and/or inquiry-based, perspective is based on
the premise that the heart of science education is the involvement of the students
in the process of conceiving problems and scientific questions, forming
hypothesis, designing experiments, gathering and analyzing data, and finally
drawing conclusions (Hofstein et al. 2005). Scientific inquiry is a fundamental
principle in the current Michigan High School Content Expectations for Science
(2006), which describes inquiry as a complex process that involves many
aspects of designing experiments and collecting and analyzing data. It also
describes inquiry as being more flexible than a rigid set of steps. It involves
developing habits of the mind, such as openness and curiosity, which engage
students in logical reasoning and the application of imagination as they devise
hypothesis, design experiments, and generate explanations.
Definitions of Inquiry
Inquiry may appear to be a simple process or state of mind at first glance,
but it is in fact a more complicated issue, if it is to be completely described. In
fact, many teachers do not even use inquiry in their classrooms as a method of
teaching. Some of the most common reasons for this include confusion about
the meaning of inquiry, belief that is only works with high achieving students, as
well as feelings of inadequate preparation for such instruction or that it will be
very difficult to manage (Colbum, 2000). The fact is that although inquiry is a

core concept in teaching standards nationwide, teachers are still uncertain as to
its true meaning, and even more uncertain of how exactly to put it into practice.
The National Research Council (1996) states that “scientific inquiry refers to
the diverse ways in which scientists study the natural world and propose
explanations based on the evidence derived from their work. Inquiry also refers
to the activities of students in which they develop knowledge and understanding
of scientific ideas, as well as an understanding of how scientists study the natural
world.”
So what is inquiry? Inquiry is a highly involved and motivating process for
both the students and the teacher, or at least it can be. Inquiry, as practiced in
classrooms, can be described on four different levels according to Henon (1971
from Windschitl, 2002). The lowest level is confirmation experiences, sometimes
called “cookbook labs”, which do not contain any inquiry opportunities since
students are simply required to follow a written procedure in order to verify a
known answer. The next level is called structured inquiry, in which students
search for the answer to a question posed by the teacher by following a given
procedure. In the third level, referred to as guided inquiry, students must design
their own investigation to a question provided by the teacher. In open inquiry,
students generate their own questions and design their own investigations. Each
of these levels requires that the teacher play a slightly different role in the
process. One study suggests that higher levels of inquiry require a more active
participation by the teacher than simply a facilitator or guide through the process.
The teacher must not only carefully develop the initial question, but also

orchestrate the instruction and mentor the students, modeling how scientists
work, as they grapple with data, ask questions, and generate conclusions
(Crawford, 2000).
Inquiry activities have also been described as being “close-ended” or “open-
ended”. Close-ended inquiry provides students with a very limited experience
because they simply follow specific instructions given in a laboratory manual. In
an open-ended inquiry experience, students are much more involved in choosing
a question for further investigation, planning and conducting the experiment, and
analyzing the findings and arriving at conclusions (Hofstein et al., 2005).
Structured inquiry activities would be examples of more close-ended inquiry
activities, while open inquiry activities are designed to be open-ended in nature.
Guided inquiry activities, however, fall somewhere in between, by providing some
structure to get students started, but ending with student generated sections of
more open-ended style.
Inquiry is a broadly defined construct in science education, associated with
a wide range of intellectual activities (Windschitl, 2002). I took on essentially two
specific goals for the inquiry activities in the research documented here. The first
objective was to engage students in investigations that stimulate curiosity or
provoke wonder in a way that produces meaningful Ieaming as they seek
answers or explanations (Haury, 1993). The second objective was to involve
students in the process of designing an investigation, giving them opportunities to
explore and understand the natural world around them by themselves, thus
establishing connections between their prior knowledge and the science of the

natural world (Panasan et al., 2010). It is the expectation that these real world
connections can lead students to experience more authentic Ieaming.
Review of Scientific Principles
Acids and bases can be described and defined in multiple ways.
Arrhenius described acids as compounds that release hydrogen ions, H“, in
aqueous solutions, while bases release hydroxide ions, OH', in aqueous
solutions. Hydrogen ions are protons, and according to Bronsted’s definition,
acids are any compounds that donate protons, while bases are any compounds
that accept protons. This broader definition accounts for some acid base
reactions with compounds that are not traditionally thought of as acids or bases.
Water, for example, is neutral on the pH scale, but has the ability to either donate
a proton or accept a proton, making it an amphoteric substance that can behave
as either an acid or a base, according to Bronsted.
Acids and bases can change the color of chemicals known as acid-base
indicators. These chemical indicators are weak acids or bases that change their
structural conformation, resulting in a visual color change, at specific pH ranges
as the molecules donate or accept a proton. By knowing the range at which
color changes occur for a specific indicator, it is possible to estimate the
unknown pH of solutions. Anthocyanins are a group of naturally occurring plant
pigments that can change their colors depending on pH. They are found in the
flowers, leaves, stems, fruits, and even roots of many different plants. For

example, as the pH in the cytosol of cells changes, the anthocyanins may
change color, signaling that the fruit is becoming ripe for harvest.
pH itself is a calculated value equal to the negative logarithm of the
hydrogen ion (or proton) concentration. The pH scale is made up of values from
0 to 14, and each step in the scale represents a change by a power of 10 in the
concentration of hydrogen ions in a solution. For example, an increase of 3
steps on the pH scale signifies an increase of 1000 times in the concentration of
hydrogen ions. Likewise, the pOH scale represents the same thing for the
concentration of hydroxide ions. Generally, acidic solutions are those with a
higher concentration of hydrogen ions than hydroxide ions, while basic solutions
have a higher concentration of hydroxide ions than hydrogen ions. In neutral ’
solutions, the concentration of hydrogen ions is always equal to the concentration
of hydroxide ions. The product of the hydrogen and hydroxide ion concentrations
is always equal to a value of 1.0 x 10'”, called kw, the ion-product constant for
water.
Titration is a laboratory testing procedure that involves the addition of a
base to an acid solution until the solutions are neutral. If the volumes of both
solutions are carefully measured, and the concentration of one of the solutions is
known, the concentration of an unknown solution can be determined. At the
endpoint, the neutral solution will have equal moles of hydrogen ions and
hydroxide ions, so by calculating the moles of the known solution, and dividing by
the liters of the unknown solution, the molarity of the unknown is determined.

Buffers are solutions made with a mixture of a weak acid and its conjugate
base, or a weak base and its conjugate acid. An acid and its corresponding
conjugate base will differ only by the presence or absence of a hydrogen ion.
According to Le Chatlier’s principle, if a chemical system at equilibrium
experiences a change, then the equilibrium shifts to counteract the imposed
change and a new equilibrium is established. A buffered solution is able to react
with both acids and bases, to the extent of their buffering capacity, in order to
maintain the equilibrium of hydrogen ions. By doing so, the solution’s pH is not
changed, so buffers enable solutions to resist changes in pH. This is critical in
many life systems, including the blood stream and lakes, where changes in pH
could cause problems to organisms or other processes being carried out.
Demographics
Columbia Central High School is a rural school with a population of
approximately 550 students located in Brooklyn, Michigan. The village of
Brooklyn has a population of approximately 13,000 people. However, the
Columbia School District services many of the smaller outlying communities and
families. The average household income for Brooklyn was $49,000 in 2008;
Estimates for the surrounding areas, which are more rural, would be slightly
lower. 29% of high school students qualify for free or reduced lunch. There is
very little diversity within the student body, with 95% white, 2% Hispanic, 1%
Asian, 1% American Indian, & 1% African American. The high school graduation
10

rate in 2009 was 96.27% with 57% of students graduating “with honors”. 70% of
the graduates were college bound.
Columbia Central High School operates on a standard two semester
school year, with two marking periods per semester. Students are required to
complete three years of science credit in order to graduate, including Science 9
(Physical and Earth Science), Biology, and Chemistry. Columbia also offers
several advanced science courses such as Anatomy and Physiology, Physics,
A.P. Biology, and Chemistry II. The second year Chemistry course in which this
study was conducted, is an honors class that requires the completion of
Chemistry I with a grade of C or higher. A typical school day is composed of
seven periods, with duration of 49 minutes each.
I chose to teach my unit to my first and second hour Chemistry II class.
These students consist of mostly high achieving students who successfully
completed the first year of Chemistry. A majority of these students were also
enrolled or planning to enroll in more of the advanced science courses offered at
our school. All of the students had successfully completed Algebra II, with some
enrolled in Pre-Calculus or Calculus I. All forty-six students participating in the
study were juniors and seniors.
11

IMPLEMENTATION
Explanation of Unit Sequence and Purpose
The unit studied addressed acid/base chemistry, and incorporated many
different teaching and assessment techniques. Forty-six students completed
student assent forms (Appendix A) and their parents completed parent consent
forms (Appendix B) to be a part of this research study. All students completed a
pre-test on the first day of the unit. The unit was taught in much the same way it
had been taught previously, with the addition of the newly developed laboratory
activities. General information and explanations were presented through
classroom lectures with fill-in-the-blank style lecture outlines provided by the
teacher. Lectures lasted no more than 20 - 30 minutes in length in order to better
hold student attention. Some concepts and calculations presented during these
lecture periods were practiced and reinforced with worksheets and short quizzes
not included in this study.
For this research project, current and new laboratory activities were
adapted for a high school Chemistry classroom, that were a blend of both close
and open-ended activities. High school students lack the technical knowledge of
laboratory procedures, and they require detailed step-by-step instructions so that
they Ieam how to use basic tools. This is especially true when safety is a
concern in a procedure, such as adding acid to water, and not the other way
around. In this paradigm the teacher is initially more focused on the students’
ability to follow directions and answering questions about the methods being
introduced, such as how to fill, read, or use a buret. At the point when many of
12

the more structured labs are complete, the activities described here continued
with a problem for further investigation of a more open-ended inquiry. In this
phase, students were not given specific instructions, but rather a question was
posed. Students used the knowledge acquired during the structured phase of
the activity to design a simple experiment, set up tables, collect data, and draw
conclusions about the unknown problem. The role of the teacher during this
phase was as a facilitator, encouraging students to consider multiple methods for
collecting or displaying data. Direct answers to student questions were also
avoided by pointing students to resources or reminding them of prior experiences
from the structured portion of the laboratory activity. Another focus in the open-
ended phase is the was the use of materials familiar to students in their daily
lives, such as soda pop or vinegar, and to involve students in connecting the
activities with familiar materials found in their daily lives. These connections are
intended to make the lab experience more real, more personal, increasing
student interest and motivation, and ultimately producing more authentic
Ieaming.
The adapted laboratory activities were spaced evenly throughout the unit,
never allowing students more than a few consecutive days in the classroom
without a day or two of hands on lab work. Table 1 shows the general sequence
of the unit activities and their objectives.
13

Activity Description Objectives
Rainbow Connection Demo To generate interest in the unit through visual
changes of acid base indicators.
Observing Various pH Indicators To observe an array of pH indicators and use
them to estimate pH of unknown solutions.
Making pH Test Strips To create pH test strips using natural
compounds and use them to estimate the pH
of unknown solutions.
Simple Acid Base Titration To learn the basics of titration and observe
differences between monoprotic and diprotic
acids.
Analytical Acid-Base Titration To use titration to determine the accurate
molarities of unknown solutions.
Graphing a pH Curve To observe and create a pH curve on a
logarithmic scale.
Effects of Acid Rain on Lakes To observe the buffering effect of limestone
and dissolved carbonates in a solution.
Table 1: Unit Activities and Objectives
DESCRIPTION OF AND ANALYSIS OF ACTIVITES
Teacher Demonstration - The Rainbow Connection
The teacher demonstration titled “The Rainbow Connection” (Appendix F)
was not an activity developed by me. The title and procedure were given to me
by MSU professor, Dr. Merle Heidemann, and it was performed without any
adaptation the first day of the unit. Five beakers were pre-treated with mixtures
of three different acid base indicators and a base solution was added to each
beaker. Stirring of each beaker instantly turned each colorless solution into a
distinct color of the rainbow as the indicator mixed with the base. Students were
impressed with the sudden nature of the color change, as well as the bright
l4

spectrum of colors that resulted. When all five beakers, now brightly colored,
were poured together into a large beaker containing a small, unseen amount of a
strong acid, the resulting mixed solution returned to a completely colorless state.
Again, students showed wonderment and expressed amazement at the process
and began to ask questions immediately. This demonstration, however, was
intended to pique student interest, so questions were not answered in full with
the promise that the upcoming unit would provide them.
Activity #1 - Observing Various pH Indicators
The purpose of this activity (Appendix G) was for students to observe an
array of natural and synthetic indicators and use them to estimate the pH of
unknown solutions. Students were asked to bring in red, blue, or purple flowers,
leaves, or fmits in order to extract the pigments for testing. Student provided
samples included grapes, blueberries, red cabbage, roses, poinsettias,
camations, and an array of other unknown flower samples they found around
their homes. Plant materials were then boiled briefly to extract the natural
anthocyanin pigments into solution. Buffer solutions with a pH range of 1 - 12
were provided for testing and observing the color changes in the extracted
pigments, as well as those of a wide range of synthetic indicators provided by the
teacher. Students tested a total of 6 natural and 6 synthetic indicators in each of
the 12 buffer solutions, recording the resulting color spectrums onto their papers
using colored pencils. Students then tested four solutions of unknown pH with
their choice of chemical indicators. Color changes of each indicator in the
15

unknown solutions were compared to their color spectrums in order to estimate
the pH of the unknown solutions.
This activity proved to be very engaging, and yet some students found the
procedure and data recording to be a bit tedious. Students spent a lot of time
adding drops of solution to tiny wells in their reaction plates, as wells as coloring
their lab paper. The activity took two days, as most students were only half
done at the end of the first day. Some students reported feeling rushed to
complete the activity at the end of the hour. I was very pleased with the results
as students obtained very colorful trays showing a multitude of color spectrums
and variations in chemical indicators. Students seemed to really enjoy that part
of the activity, but some were discouraged by the tedious nature of the
procedure.
There are several solutions that could eliminate the time problems,
keeping the activity to a single day and allowing students to enjoy the
observation a bit more. Reducing the number of indicators each group tests and
allowing groups to pool their results together would save time and possibly allow
for students to see the results from more indicators. Another option would be to
replace coloring with a digital photograph that each student could attach to their
lab sheet. This would require some technology, but would record the exact
results better than student coloring could show. Another solution would be for
the teacher to prepare solutions of all the natural indicators, however, that part of
the process is intended to generate student interest by creating connections
between the natural indicator pigments and plant products around their homes.
16

Activity #2 - Making pH Test Strips
The goal of this activity (Appendix H) was to introduce students to the
concept of pH testing strips by allowing them to make their own that they could
use to test solutions. The pH strips were made by soaking a piece of filter paper
with the juice extracted from red cabbage leaves. Once the paper had been
allowed to dry overnight, students then cut it into strips which they used to test
pH buffers from 1 — 12. The red cabbage anthocyanins show a broad spectrum
of colors over this pH range. Once the colors were associated to their pH levels,
students made multiple testing solutions using vinegar, ammonia, sodium
hydroxide, orange juice, and even soap, and recorded the estimated pH of the
unknown solutions. Students were then given a small vial of their pH test strips
and asked to design an experiment in which they tested at least 15 different
solutions found at home. Students were required to generate a table or chart in
which to record the results of their tests and identify the solutions as acidic,
basic, or neutral.
Students were very engaged with the hands on approach to making their
own test strips. The strips worked very well, showing distinct color changes
across the pH scale, which were easy for students to observe and record. The
most important objective to this activity was to get students thinking about acid
base chemistry around the house. Students found many different solutions to
test, including juices or sauces from their refrigerator, household cleaners, and
toiletries. Some students tested their make-up, saliva, and even their urine.
Students involved members of their family in this at home chemistry experiment
17

as they explored the house searching for solutions to test. After this activity,
students were better able to categorize general types of solutions and materials
as acids or bases.
Activity #3 - A Simple Acid Base Titration
Acid-base titrations and the required calculations can be complex, so this
simple activity (Appendix I) was designed to introduce students to the concept of
titration, while eliminating some of the complexity. In this stripped down version,
the titration was performed by simply counting the number of drops required to
neutralize each of the acid solutions provided. Students measured out exactly
1.0 mL of acid and added drops of a prepared sodium hydroxide solution until the
phenolphthalein indicator showed a persistent pink color. Students tested three
concentrations of hydrochloric acid, a monoprotic acid, and three concentrations
of sulfuric acid, a diprotic acid. The concentrations of the acid were 0.2M, 0.4M,
and 0.6M, so the number of drops required to neutralize the solutions was
expected to double and triple with the more concentrated solutions. Also, the
diprotic acid was expected to require double the number of drops as the
monoprotic acid. The resulting numbers of drops were plotted on a simple graph,
which revealed two lines with different slopes for the monoprotic and diprotic
acids. In a further investigation, students were asked to estimate the molarity of
vinegar. Students were further required to determine if vinegar was monoprotic
or diprotic in order to make the estimation.
l8

This activity provided very consistent data for almost every group. During
the initial stage of testing the various acid solutions, students were asked to show
their final data to the teacher. At a quick glance, anomalies in data were able to
be spotted and some groups were told to repeat some of their trials. This
seemed to fix the problems, most of which were attributed to inconsistent
technique or simple errors in counting or measurement. It was noted that
answers varied greatly between individuals due to the size of the drops, but this
did not affect the data as long as the same individual performed all the dropping.
The resulting graphs showed a nearly perfect linear relationship, with the diprotic
acid having double the slope of the monoprotic acid as expected. In the further
investigation, students were able to identify the acetic acid in vinegar as a
monoprotic organic acid. Most students performed 3 - 4 trials with samples of
vinegar and averaged the result. When the average number of drops was plotted
on the extrapolated line formed by the monoprotic acid on the graph, a consistent
result of 0.8M - 0.9M was obtained by most groups. Students were successfully
able to explain difference in hydrogen ion concentrations between monoprotic
and diprotic acids after completion of this lab.
This activity also raised awareness of simple issues associated with
titrations. Students learned that a single drop is all that is needed to show the
endpoint of a titration. Some students were frustrated at times, particularly with
the stronger acid concentrations, as the solution would turn pink and then go
back to colorless when stirred. They learned that patience and stirring are
important to finding accurate endpoints of titration. They also were able to
19
explain simple associations between the amounts of base required to neutralize
increasing concentrations of acids, as the number of drops always increased with
concentration. They also were able to note that if a more concentrated base had
been used, fewer drops would have been required.
Activity #4 - Analytical Acid Base Titration
This activity (Appendix J) allowed students to work through the entire
process of a titration on a much more analytical level, since they were required to
make accurate base solutions of very precise concentration. Students also had
to make accurate volume measurements using a buret. which was a new piece
of lab equipment to them. They carried out four titrations on two HCI solutions of
unknown concentration. The resulting volumes were then used to perform higher
level calculations, including finding the moles of OH' and H”, and ultimately the
molarity of each of the unknown acid solutions. In a related investigation,
students titrated fresh carbonated soda, uncarbonated soda, and lemon juice In
order to calculate the concentration of H+ in each solution. Students performed
two trials with each solution for comparison and conducted all the calculations
required for moles and concentration.
This activity was the most challenging activity for the students in terms of
math and calculations. They were much more cautious with their techniques,
measurements, and data as they were being graded on their accuracy. The first
trials went more slowly as students worked through only four titrations the first
day, with some groups unable to complete all the trials. However, all groups to
20

complete their work on the second day. Students found a definite difference
between the acidity of the fresh soda and the flat soda, and were able to explain
that presence of carbon dioxide in the soda produces carbonic acid, making the
fresh soda more acidic. The carbon dioxide was also associated with commonly
experienced flavor differences between fresh and flat soda. Students were also
able to diagram the molecular structure of citric acid found in the beverages and
identify it as a triprotic organic acid. The lemon juice titration produced very
consistent results; however, the soda titrations varied due to changes in the
carbonation. It was also very difficult to measure out exactly 10mL of the initial
carbonated soda with a pipet due to the fact that C02 bubbles being produced
continuously displaced the volume of the liquid. Students did the best they could
and understood that their data may not be reliable, but were intended to show a
trend.
They main purpose of the extension to the activity was to generate more
interest by allowing students to titrate familiar solutions. Most titration
experiments are performed with stockroom supplied chemicals, but every student
has had soda or lemonade to drink, so the experiment became much more
relevant to them. Each titration also gave students another chance to practice
the more complex mathematical processes involved in calculating moles and
concentrations.
21

Activity #5 - Graphing a pH Curve
The main purpose of this activity (Appendix K) was to model the concept
presented in lecture that pH is a logarithmic value, and not linear in nature.
Students worked in groups of 3 - 4 to collect data as aliquots of 0.1 M sodium
hydroxide were added to a sample of 0.1M hydrochloric acid. The pH of the acid
solution was tested with a digital meter after the addition of each aliquot and
recorded. The results were placed on a graph generated by the students.
This activity was one of the simplest to perform by students, and yet the
results seemed to surprise most of the students. The pH of the original acid
changed very little at the beginning, only going up a fraction at a time with the
addition of the base. No chemical indicators were used to visually show the
endpoint of neutralization, so students were surprised as the pH shot up very
suddenly past neutral and the solution became basic. When the seemingly
strange data was graphed by the students, a typical pH curve for the addition of a
strong base to a strong acid emerged.
Many students lacked knowledge of logarithms and what a logarithmic
curve is all about. This simple activity was an introduction to them and reinforced
the concept that each change in pH is actually a tenfold change in the
concentration of H+ ions in the solution. It attacked student misconceptions that
a steady addition of base would have a linear effect on the pH of the solution. It
also allowed students to see how pH changes during a titration, and why a single
drop is all that is needed to reach the endpoint of titration, while any additional
drops quickly raise the pH level above neutral.
22

This activity did not contain any particularly inquiry driven sections;
however, the sequence and method in which it was approached allowed for
some inquiry to take place through the process. Students were not told what the
expected outcome would be. Rather, students were given a simple procedure
and asked to come up with reasons for the surprising results they observed.
These unknown and unexpected results generated a certain level of curiosity and
interest in the students, most of who thought they had done something wrong
until they began to notice other groups getting the same results. They were
successful in developing hypotheses for what they were observing as they
gained new understanding about pH and the pH scale.
Activity #6 - Effects of Acid Rain on Lakes
This activity (Appendix L) was challenging because the concept of buffers
was completely new to students. This unit did not delve deeply into the complex
calculations pertaining to buffers, but rather introduced the concept in some
simple real-world examples, such as the buffers in you blood stream and also
those found in lakes. Students compared the buffering ability of distilled water to
solutions containing limestone and granite. Drops of 1.0M hydrochloric acid were
added to each solution and the pH was measured to observe any changes.
Distilled water and water with granite chips showed no buffering and the pH
dropped dramatically. The calcium carbonate found in limestone became slightly
more soluble as it reacted with the acid, and was able to keep the pH from
changing as much as it reacted to neutralize the acid. Bromcresol green
23

indicator was used in order to visualize the pH changes taking place. The water
and granite solution tumed yellow and stayed yellow, however the limestone
solution turned yellow immediately but slowly turned back to greenish blue as it
reacted with the acid. Students were then asked to crush up rock samples and
test them for the presence of calcium carbonate. They were to design the
experiment, describing the procedure, record their data and observations in a
table, and finally write out their conclusions for each rock sample analyzed.
Students were able to successfully explain how a carbonate buffer system works
as carbonate reacts with hydrogen ions to become bicarbonate and ultimately
carbonic acid. Students were also able to describe how carbonic acid can break
down into water and carbon dioxide, explaining the bubbles they saw during the
reaction. Finally, students were able to explain how pH might or might not
fluctuate in a lake, depending on whether or not the lake bed consisted of
limestone or granite.
This procedure was somewhat effective, and was able to show very
simple reactions between limestone and acid that were not present with the
granite. However, further extensions of this were not as successful. Students
had trouble finding good clean rock samples to test and had further trouble
crushing up the samples to be tested. Smashing rocks with a hammer was
hazardous and produced flying debris. Students were able to test some crushed
up bricks, but none of the rocks tested appeared to have any noticeable calcium
carbonate. In the future, it would be better if clean rock samples were obtained
and crushed and provided for students to investigate.
24

RE
adl
the
an:
ad;
bl
del
obj
elle
Pre
anc
ana
mul
the
eac
DOIr
blasl
ther
RESULTS AND EVALUATION
Objective data for this unit were collected with a fifteen question test
(Appendix C) administered at the start of the unit. The same test was again
administered upon completion of the unit, immediately following the standard
chapter test. The test consisted often multiple choice questions and 5 short
answer questions, which focused on the key objectives covered in the six
adapted guided-inquiry laboratory activities. Subjective data were also collected
by way of a post-unit survey (Appendix D) that was administered upon the
completion of the unit. Both the objective and subjective data were used to
determine the overall effectiveness of the adapted lab activities in the unit. The
objective data were statistically analyzed using a paired t-test to show
effectiveness.
PrelPost Test Analysis
Forty-six students were involved in this study, completing both the pre-test
and post-test for the unit (Appendix C). Data from the test were divided and
analyzed separately in two sections, due to the nature of the responses. In the
multiple choice section, students were encouraged to guess if they did not know
the answer, so the possibility exists of variability due to guessing. In contrast,
each of the five short-answer questions was scored out of a possible four or five
points, which eliminated the element of guesswork. While most students did their
best to come up with answers on the pre-test, in some cases students simply left
them blank or responded with “I don’t know".
25

It is also important to note that all students involved had previously
completed one year of general Chemistry. A majority of the class entered
Chemistry II having completed Chemistry | the previous year, meaning they
should have some prior knowledge of the fundamental concepts of acid-base
chemistry. A few of the students completed Chemistry I two years prior, and did
not complete the acid-base unit during that year. Two students transferred from
other school districts, having completed Chemistry at their previous schools, and
it is unknown how much prior knowledge they may had.
PrelPost Test Statistical Analysis: Multiple Choice
Figure 1 shows the combined results of the 10 question multiple choice
section of the pre-test and post—test. 45 students scored higher on the post-test,
with only one student scoring lower on the post-test. Out of 10 points possible,
the mean score on the pre-test was 3.9, while the post-test was 7.4, giving a
mean difference of 3.5.
Multiple Choice Pro 8. Post Test Score Comparison
16
g 14
'6 12
8 10g CI Pre-Test
.3 I Post-Test
3
(I)
“6
it
9 10
Score
Figure 1: Comparison of Student PrelPost Test Multiple Choice Scores
26

A paired t-test was used to determine if the unit results were statistically
significant. The null hypothesis was that the implemented experiments and
activities would have no effect on student Ieaming as indicated on the pre and
post-test comparisons. Statistical data and calculations are shown in Table 2.
Mean of Difference Scores 3.5
Standard Deviation of Difference Scores 1.9292
Estimated Standard Error 0.2844
Hypothesized Mean of Difference Scores (Null Hypothesis) 0
Degrees of Freedom (n - 1) 45
t-value 1 2.23
p-value 0.000
Table 2: PrelPost Test Multiple Choice Statistical Data
The p-value for the pre and post-test comparison was equal to 0.000.
Therefore, the null hypothesis is rejected indicating that the increase in student
scores was significant, suggesting that the unit with these activities had an effect
on student Ieaming.
PrelPost Test Statistical Analysis: Short-Answer
Figure 2 displays the combined results of the 5 short-answer questions of
the pre/post test. All 46 students scored higher on the post-test. Out of 21 points
possible, the mean score on the pre-test was 7.2, while the post-test was 12.9,
giving a mean difference of 5.7.
27

Short Answer Pre & Post Test Scores
l
p
r
#ofStudentsScoring
:3
—xN
onA
01
a)
s:
on
l
l
12 3 4 5 6 7 8 910111213141516171819202122
Score
[:1 Pre-Test 4
’I Post-Test
Figure 2: Comparison of Student Pre/Post Test Short Answer Scores
A paired t-test was used to determine if these results were statistically
significant. The null hypothesis was that the implemented experiments and
activities would have no effect on student Ieaming as indicated on the pre and
post-test comparisons. Statistical data and resulting calculations are shown in
Table 3.
Mean of Difference Scores 5.7
Standard Deviation of Difference Scores 3.0903
Estimated Standard Error 0.4556
Hypothesized Mean of Difference Scores (Null Hypothesis) 0
Degrees of Freedom (n - 1) 45
t-value 12.50
p-value 0.000 Table 3: Pre/Post Test Short Answer Statistical Data
28

The p-value for the pre and post-test comparison was equal to 0.000.
Therefore, the null hypothesis is rejected, indicating that the increase in student
scores was significant, suggesting that the implemented unit activities had an
effect on student learning.
Individual Item Analysis: Pre/Post Test Short-Answer Questions
The assessment of each short-answer question was based on 4 or 5
points for each question. Students were not able to guess at answers in this
section, as they could in the multiple choice section. However, the teacher was
able to give partial points for answers. It was interesting to note trends and
misconceptions in each of these sections, as students attempted to explain their
answers on the pre-test. A breakdown of overall scores for each individual
question gives a good picture of the prior knowledge or ideas each student
brought to the unit, and clearly shows areas where substantial knowledge was
gained. It also exposes specific areas of weakness that would merit further focus
and attention by the teacher in future units.
Question #11: Acid Base Definitions
Figure 3 shows the overall student scores on the pre and post-test for
question #11. In this 4 point question, students were asked to explain standard
definitions of acids and bases, specifically according to Arrhenius, Bronsted, and
Lewis. It was expected that many of the students would recall definitions from
material covered in the first year of Chemistry. Observation of individual scores
29

(Appendix E) shows that while 11 students increased their scores on the post-
test, 8 students actually scored lower on the post-test (Appendix C). Many of the
incorrect answers on the pre-test centered on descriptions of acids and bases,
such as their taste, or pH, or other physical characteristics, but they lacked actual
definitions. On the post-test, most of the students attempted to give those
definitions, with some mixing up which were the “proton acceptors” or the “proton
donors”. As the question asked students to give two definitions of acids and
bases, many were only given partial credit for only giving a single definition and
failing to contrast the multiple definitions. In all, this question did not reveal
significant progress, and these definitions should be given more attention in the
future.
Question 11: Acid-Base Definitions
30 -—————-———— -~- _-——#—
25
é’o O: 20 fl-
T DPre
13 .5 1
3 3 15 "T j IPost
(D 0 10 ._E J
u- (D lO l
. .- I0 . '
1 2 3 4 5
Score
Figure 3: Comparison of Pre/Post Test Scores for Short Answer #11
Question #12: Definition of pH and the pH Scale
Figure 4 shows the overall student scores on the pre and post-test for
question #12. In this 5 point question, students were asked to explain pH and
30

describe the pH scale. Very few students were able to describe pH as a
calculation derived from the concentration of hydrogen or hydronium ions in a
solution. However, most students had some knowledge of the pH scale and
were able to describe, or at least come close to describing, where acids, bases,
and neutral solutions fall on the scale. Post-test scores show dramatic increase
in scores with nearly half of the students scoring 5 points (See Appendix E).
This result was expected since first year Chemistry students engaged in a more
descriptive acid-base unit, in which they were taught the pH scale, but did not go
into detail about logarithms and hydrogen ion concentrations.
Question 12: pH Scale
N 01 IT..._-_._,
N O
I Re
I Post
.5
U'l
.n
o
5"
l
#ofStudentsScoring
_-_,__
1 2 3 4 5 6
Score
O
Figure 4: Comparison of Pre/Post Test Scores for Short Answer #12
Question #13: Acid-Base Indicators
Figure 5 shows the overall student scores on the pre and post-test for
question #13. In this 4 point question, students were asked to explain what acid-
base indicators were and how they are useful. The most common answer on the
pre-test, which was not accepted, was that “Acid-base indicators indicate
31
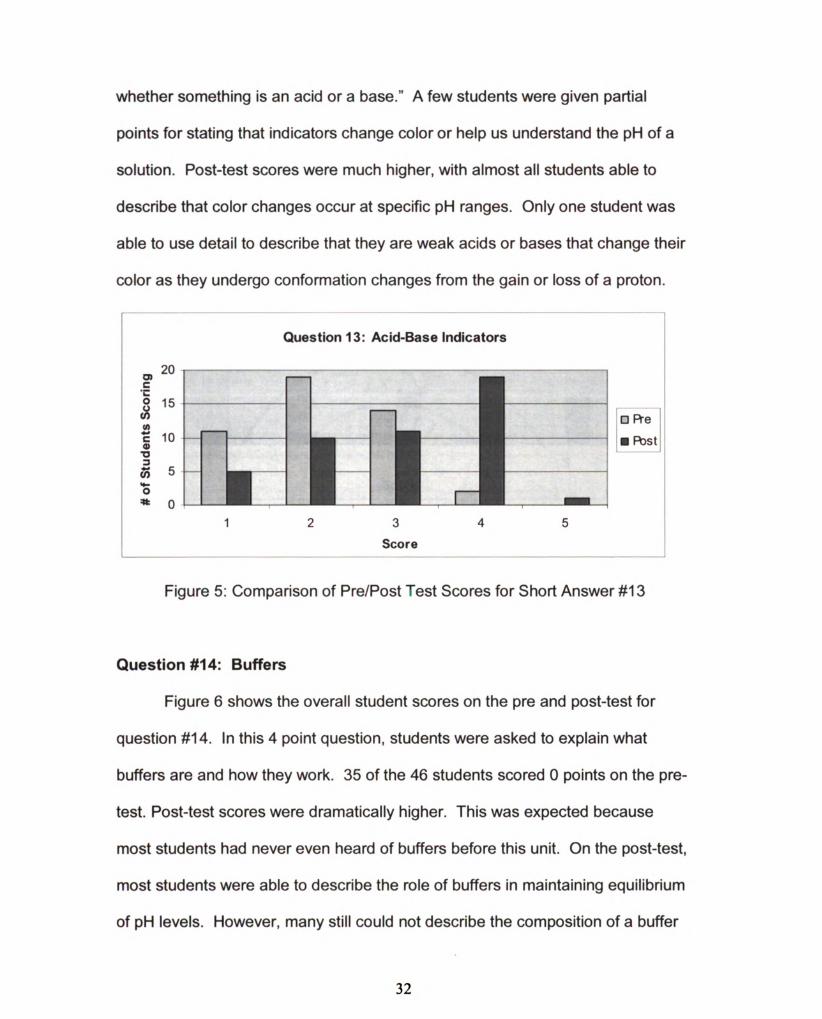
whether something is an acid or a base.” A few students were given partial
points for stating that indicators change color or help us understand the pH of a
solution. Post-test scores were much higher, with almost all students able to
describe that color changes occur at specific pH ranges. Only one student was
able to use detail to describe that they are weak acids or bases that change their
color as they undergo conformation changes from the gain or loss of a proton.
_._2,_,-._-,_-_ ,_ _,,- 2-..,
Question 13: Acid-Base Indicators
20
.E' i”
0 15
3 + . Cl Re
5 101 lest1: -
3
:73 5t
‘6
a: 0-
1 2 3 4 5
Score
Figure 5: Comparison of Pre/Post Test Scores for Short Answer #13
Question #14: Buffers
Figure 6 shows the overall student scores on the pre and post-test for
question #14. In this 4 point question, students were asked to explain what
buffers are and how they work. 35 of the 46 students scored 0 points on the pre-
test. Post-test scores were dramatically higher. This was expected because
most students had never even heard of buffers before this unit. On the post-test,
most students were able to describe the role of buffers in maintaining equilibrium
of pH levels. However, many still could not describe the composition of a buffer
32

as a solution of a weak acid and its conjugate base. Some students also came
away with the misconception that all buffers are neutral, probably due to the fact
that most of the buffer examples we discussed, like those found in lakes or your
bloodstream, do maintain pH levels close to 7.0.
Question 14: Buffers
a:
.E
3o
a: El Pre
23
g I Post
1:
3
en
a.
c
at
1 2 3 4 5 Score
Figure 6: Comparison of Pre/Post Test Scores for Short Answer #14
Question #15: Neutralization Reactions
Figure 7 shows the overall student scores on the pre and post-test for
question #15. In this 4 point question, students were asked to complete a
neutralization reaction for the production of water and a salt. Students were also
asked to identify the reaction as a double-replacement reaction. This topic was
covered in the first year Chemistry course, as noted by the distribution of scores
on the pre-test. The post-test showed a dramatic increase in scores, with nearly
two-thirds of the class scoring 4 points.
33

Question 15: Neutralization Reactions
or
CE
30 _
m 1:] Pre
.“3
dc, I Post1: _-
3
U)h
c
at
1 2 3 4 5 Score
Figure 7: Comparison of Pre/Post Test Scores for Short Answer #15
Analysis of Post-Unit Survey Results
Upon completion of the unit, students were given a post-unit survey
(Appendix 4) as a method of gathering feedback about each of the seven
activities performed throughout the unit. Students were also asked for personal
feedback about their favorite and least favorite parts of the unit and given
permission to give any other comments. Students ranked individual activities in 4
different categories shown in Table 4 on a scale of 1 to 5 (1 = low, 5 = high).
Criteria Description
Students ranked how physically involved they
felt in this lab activity.
Physically Engaging
Students ranked how much the activity seemed
Mentally Engaglng to engage them in thinking about the process.
Students ranked how interesting or enjoyable
Interesting they felt the activity was personally to them.
Students ranked how much they felt the activity
Leammg helped them Ieam about the topic. Table 4: Student Post-Unit Survey Activity Rating Categories
34

The results of the post unit survey, shown in Table 5, show some very
interesting correlations in student opinions in the various categories. These
correlations show that the sequence of activities was intentionally structured to
bring students into the unit and guide them to progressively more challenging
topics. A closer look at each of the four rating categories shows patterns that
may be significant in the development of a successful unit.
Activity 2:223:12 #993911); Interesting Learning
Rainbow Connection Demo 1.1 2.7 3.8 3.2
Observing Various pH Indicators 3.8 3.2 3.7 3.5
Making pH Test Strips 3.7 2.9 3.4 3.3
Simple Acid-Base Titration 3.3 3.3 2.7 3.2
Analytical Acid-Base Titration 3.5 3.6 3.2 3.8
Graphing a pH Curve 3.2 3.3 3.1 3.6
Effects of Acid Rain on Lakes 3.1 3.3 3.4 3.6 Table 5: Average Student Activity Ratings on Post-Unit Survey
Category #1 - Physically Engaging
In the first rating category, students rated how physically engaging each of
the activities was to them. This rating was not intended to rank student Ieaming,
but rather as an observation of how much each individual student felt they
participated in the activity. As expected, the opening demonstration received a
very low rating as students were merely observers as the teacher performed the
35

activity. The first two activities following the demonstration were rated most
physically engaging by the students. The activity “Observing Various pH
Indicators” was a two day activity that kept students involved in combining many
different indicators and buffers, and recording their results with colored pencils. I
believe both the mixing process and the coloring, although viewed as tedious by
some, definitely allowed each student to physically participate in the activity. The
third activity “Making pH Test Strips” also presented each student with individual
hands-on work as each student created their own pH test strips. Each student
then took the strips home that night and tested solutions found around the house.
Each student was intentionally asked to complete their own work in both of these
activities so as to increase physical participation and avoid dependency on a lab
partner to complete the assignment.
Each of the final four lab activities were completed in groups of two or
three partners. A successful lab group shares the responsibilities of the work in a
lab activity. However, this can decrease the feeling of physical involvement as
students find themselves once again playing the role of observers as their
partner completes a step in the activity. For example, in the activity “Graphing a
pH Curve” there were a limited number of digital pH meters. Not only did groups
share the pH meters, but only one individual in each group was involved with
addition of aliquots and the use of the pH meter while the other student recorded
the data. Therefore, the data pattern taught them something very important
about pH curves, in spite of the fact that the collection of data itself was viewed
as less physically engaging.
36

Category #2 - Mentally Engaging
Student opinions of the most mentally engaging activities were exactly the
opposite of the physically engaging activities. The opening demonstration and
first two activities were rated least mentally engaging, while the last four lab
activities were rated most mentally engaging. The first two activities, while the
most physically engaging, were not rated to be most mentally challenging. They
involved strictly observations of color and recording visual results in a table.
There were no complex calculations or high level comprehension questions with
these activities. However, as the unit progressed, the complexity of the activities
and the difficulty of the concepts increased, resulting in activities that were rated
by students to be more mentally engaging. The most mentally engaging activity
was the “Analytical Acid-Base Titration”. This activity challenged students not
only to make very careful measurements, but then process the resulting data
using multiple calculations to discover the molarities of unknown solutions.
These results show an important pattern that is worth mentioning and
studying further in the future. Students do not need to be highly physically
engaged to feel mentally engaged. Teachers often look for hands-on activities
as a way to physically engage their students in a topic, hoping to produce higher
levels of cognitive engagement. However, students in the past have commented
that when they are too focused on the mechanics of completing a procedure,
they sometimes don’t have time to really think about what is taking place. For
example, several years ago I modified my lectures to be “fill in the blank” style
note taking when students reported that they had trouble listening because they
37

were too busy writing. Being both physically and mentally engaged may create a
cognitive overload, so it makes sense that as a unit progresses students may
become more mentally involved without requiring as much physical stimulus.
Category #3 - Interesting
The third category simply asked students to rank how interesting they felt
each of the activities was. One of the goals of the adapted activities was to
increase student interest in the topic and the activities. Simply being physically
or mentally engaged does not necessarily reflect how each student personally
feels about each activity, especially with honor students at this level who are
willing to complete almost any task put before them, whether they like it or not. I
feel that a real connection with the topic and concepts can only take place if there
is a genuine interest held by the student. However, interest can be generated
through a multitude of pathways, which can vary from year to year with different
groups of students.
In these lab activities there is a definite progression of interest that seems
to be tied to specific elements from each activity. The opening demonstration
seems to have accomplished its objective, generating the highest level of interest
on the first day. The primary purpose of this demonstration was to capture their
attention and generate interest in the unit. The first activity “Observing Various
pH Indicators” was also ranked as very interesting to the students. This activity
followed on the heels of the demonstration and allowed students to produce
bright rainbows of colors using a multitude of indicators. “Making pH Test Strips"
38

also rated as very interesting to students, possibly because of the fun colors
involved and also the exploration involved in the at home investigation. Students
really seemed to be fascinated by the “magic" of indicator color changes.
Least interesting to the students were the activities that involved titrations.
These three activities involved more complex concepts surrounding acid base
reactions and required more data collection and calculations by the students.
This suggests that students do not find these types of activities and calculations
to be as fun as the more observational activities. It is also interesting to note that
these three activities were ranked as the least physically engaging, suggesting
that students feel they are having more fun if they feel they are physically
participating in an activity.
Category #4 - Learning
The final category asked students to rate how much they felt the activities
promoted Ieaming about topics. A very distinct pattern emerged once again in
which the last three activities rank the highest. These responses correlate
almost exactly to the rankings in category #2 - mentally engaging. Quite simply,
this means that students felt they learned the most from the activities that were
the most mentally engaging. While they found some of the more physically
engaging activities to be more fun, they did not report feeling that they learned as
much from them. The “Analytical Acid-Base Titration” was the most complex
activity in terms of data collection and calculations. Some students struggled to
39

understand and complete that activity, but in the end, they felt they leamed the
most from it.
The results of the post-unit survey provided valuable feedback. The
activities were structured and organized in a sequence that produced a desired
pattern of student participation, cognitive engagement, interest and Ieaming.
Early activities were meant to introduce topics and generate interest, while later
activities were meant to really challenge students on the topic with information
being covered concurrently in classroom lecture. In the end, students felt they
learned more when they were challenged to be mentally engaged in an activity.
In the future, this progression will be used in all units.
Feedback and Student Quotes
The post unit survey also included three questions where students were
asked to give feedback. In the first question students were asked to share what
part of the unit they felt helped them Ieam the most. In the second question they
were asked what their least favorite part of the unit was. In the final question
they were asked if they would change anything about the unit.
The first question had an ovenlvhelmingly common response. Most of the
students felt that the lab activities were the part that helped them Ieam the most
during the unit. One student wrote, “Doing all the labs. I like doing hands-on
experiments.” Another student responded by saying, “I am a very hands-on
Ieamer and by doing labs it helps me remember things.” A third student put it
this way, “Labs also showed me certain concepts that weren’t portrayed through
40

the lecture.” A few students responded more specifically about the labs, stating a
particular lab or activity that they thought helped the most. “Making the pH strips
and taking them home. It was fun to find out things at home and got me more
interested,” stated one student. Several students mentioned the pH strips activity
and the fact that actually doing chemistry experiments at home was very
interesting. A few students also pointed out the titration and buffer labs because
they were new topics to them and very challenging, again pointing out that the
more mentally engaging material that challenges students helps them Ieam the
most. Only two students responded that they felt they Ieamed better from
lectures than labs, with one of them stating that it was just faster to do lecture
than do an activity.
There were a variety of responses to the second question about their least
favorite part of the unit. A majority of the responses stated that lectures, notes,
or homework were their least favorite. Most students find lecture and note taking
to be the most boring part of any unit. These responses make sense considering
most students had already responded in the first question that labs were their
favorite part of the unit. It was interesting to note the responses of a few
students focused most specifically on certain aspects. One student wrote, “The
graphing. Graphing isn’t all that exciting.” Another student responded with “The
least favorite would be all the equations,” while yet another student said, “The
math because math is just icky.” Students who struggle with mathematical
concepts usually find those parts to be their least favorite. Another student made
a comment about how they felt rushed to complete the labs in the time allotted.
41

Periods are only 49 minutes in length, so we often found ourselves rushing to
complete labs before the bell rang, and sometimes students stayed after to finish.
The length of the labs was one of the greatest challenges teaching these
activities for the first time.
In the final question, students were given a chance to respond with
anything they felt should be done differently in the future. Most of the responses
echoed a student who said, “Not have the unit take so long because it was
difficult to remember everything." Another wrote, “Make the unit go more
quickly.” The unit was spread over almost two months, including two long
holidays, and this made it even more challenging to students. A few students
also noted that “some of the labs could be tweaked” because they “kept running
out of time”. Many of the labs were forced to be stopped and continued the
second day, breaking up the pacing and stretching out the unit, which some
students didn’t like. However, a few students responded by saying “I felt the
chapter was well taught and also fun at the same time.” “I thought the unit was
pretty good, I would keep it the same.” While the positive feedback about the
activities was encouraging, there are many adaptations that should improve the
flow of the unit and activities in the future.
42

DISCUSSION AND CONCLUSION
The data collected (Appendix E) suggest that the adapted activities
(Appendices G - L) implemented in an acid base chemistry unit in a second year
chemistry class were successful in guiding students into the processes of inquiry,
helping to generate more interest through relevance to their daily lives. Data also
suggest that the activities helped students understand and remember the
chemistry concepts that they were intended to teach. Students reported that the
activities that were most physically engaging were the most interesting, however,
they also reported that the activities that were most mentally engaging helped
them Ieam the most (Table 4). This follows the constructivist principles that
believe that students Ieam better when they are actively engaged and thinking in
class (Farrell et al., 1999).
As the teacher and developer of this unit, I believe, on the evidence
collected, that the unit was a successful teaching tool and that activities showed
a greater level of participation, interest, and ultimately Ieaming by the students.
Students were also observed to be facilitating each other’s Ieaming as the
activities presented opportunities for guided inquiry to occur. The implementation
of guided inquiry approaches altered the traditional role of students and
instructors, increasing the use of peer instruction to help students achieve
authentic Ieaming (eg Landis et al., 1998). However, the unit is still a work in
progress and after only the first year teaching it, I found items that could be
tweaked to increase the overall effectiveness of the activities and the unit. I was
very open with the students throughout the unit and encouraged them to give
43
feedback. Their post-unit survey included many comments, both positive and
negative, which I found helpful and will do my best to apply in the future when
teaching this unit.
The most common problem throughout the unit appeared to be the timing
of the unit activities. As previously stated, the unit fell at a difficult time, being
interrupted by two major holidays, Thanksgiving and Christmas. Upon returning
from these holidays, I felt it was important to spend a day reviewing the material
with students before moving on, which extended the length of the unit. In general
students felt the unit took too long, counting from the first day we started to the
day we finally tested, and it was challenging for them to keep their focus and
remember all the information over that vacation time.
Another timing issue was that each of the labs was originally designed to
take one day to complete, with the exception of the pH test strips lab which
required the overnight period to dry the strips. However, students ran out of time
on 4 of the 5 other activities, requiring a second day in the lab. The activities still
worked with good success, but overall, students reported feeling the unit took too
long to complete. In the future, there are some simple modifications and
preparations that could be done to promote the completion of the activities within
the 45 minute time period. Two of the activities, “Analytical Acid Base Titration”
and “Graphing a pH curve” seemed to work better over two days. Students
would be very rushed to complete an analytical titration in a single day, and the
further investigation section is a valuable Ieaming tool. With the pH curve
activity, the students Ieamed the process slowly on the first day, allowing them to
44

obtain more consistent data in their second trial the next day. However, perhaps
combining class data would provide a good representative data set, allowing the
concept to be conveyed in a single day.
Another activity that I believe will be modified will be the Rainbow
Connection demonstration. In order to successfully perform the demonstration,
all the beakers must be prepared the day before. This means that many beakers
are required in order to perform the demonstration for multiple classrooms during
the day. l have come across several different ways to perform the same
demonstration of color and acid base indicators that may require minimal
preparation with the same enticing outcome. In one variation, the beakers, all
filled with colorless solutions, could be transferred to another set of beakers in
which they would change color. Transferring them back would return them to a
colorless state. In another demonstration, a single solution is poured from
beaker to beaker in a long sequence, displaying a new color or reaction each
step of the way. Other chemicals can be added as well that would produce some
other reactions, including bubbles or foam, which might add even greater interest
to the demonstration.
The final experiment on the effects of acid rain on lakes was probably the
weakest activity, producing inconsistent results that were difficult for students to
interpret. The rock samples used may be to blame. More time needs to be
spent experimenting with different types of rock of in a variety of granule sizes in
order to ensure more consistent results. A better technique is also needed for
smashing rocks that does not have the risk of flying rock particles and keeps the
45
sample cleaner. It may be easier to visit a landscape store and purchase pre-
crushed samples of specific rock and provide those for students to use. In spite
of the problems encountered during the activity, students reported this activity
helped them better understand the concepts of buffers.
One of the most beneficial activities for generating interest and producing
Ieaming was the activity in which students were able to make pH test strips and
take them home to do some chemical testing of their own. Rarely, if ever, are
students able to take any chemicals or chemistry equipment home, so this was a
rare treat for them and a chance to make a real connection between their daily
life and the science we were studying. Students, and parents, expressed that
this was one of their favorite parts, and ranked that lab experiment as one of the
most interesting.
Connections to materials and substances found in their daily life appeared
successful in generating higher levels of student interest. Students expressed
interest in exploring for flowers and plants to bring in for the indicator. They also
thought it was very cool that things like soda pop and lemon juice could be
titrated in a Chemistry lab. I find that anytime chemical experiments involve food
or other items familiar to students, that real world connections take place that
promote interest and Ieaming about the subject. It is a goal of science education
to enable students to observe their natural environment in order to develop the
skills required to understand and explain both themselves and their environment
(Marx et al., 2006, from Panasan et al., 2010.) It helps eliminate that age old
question that every teacher has heard, “When in my life am I ever going to need
46

to know this?” While most of chemistry taught in high school falls under the
heading of “pure” chemistry, chemistry simply for the sake of knowing it, any time
it can become applied chemistry, chemistry used to solve problems, students are
likely to make better connections with the material. According to Crawford (2000)
it can be beneficial for teachers to engage students in pursuing answers to
questions important in their lives, as well as questions important to scientists.
There were some student complaints about lectures, note taking,
homework, and especially the math involved in this unit. However, as a whole,
the complaints seemed to be fewer than previous years as students spent more
of this unit working in the lab with the hands-on activities. While lecture and note
taking were still important, they became less of a focus in a unit filled with
activities that gave the students some freedom to perform experiments and
explore their surroundings.
Overall this was a very successful unit, as evidenced by the student
responses on the post-test (Appendix C) and post-unit survey (Appendix D), and
the activities adapted for the unit were essential for increasing the interest and
effectiveness of the unit compared to previous years. Students were successful
in designing and developing simple investigations. The initial guided procedure
played a key role in teaching the students’ techniques that they later used in the
inquiry portions of the activities. The initial phase of each activity resembled
structured inquiry, where students were given a procedure to follow. This was
followed by_a guided inquiry phase that involved students in designing their own
investigations, or ways to collect data, processes that often involves creativity, as
47

well as knowledge of the content and methods of data collection, in order to carry
out analysis (Crawford, 2000, Coburn, 2000 Windschitl, 2002). An open inquiry
activity may be a possibility for taking the students deeper into the process of
inquiry, allowing them to develop their own questions and design their own
investigations (ibid). In the future, I would keep the general structure of this unit
intact, only slightly modifying the activities for smoother performance. As the lab
activities were the main focus of the research, it would also be helpful to spend
some time focusing on the other aspects of the unit, such as the lectures and
worksheets. Behaviorism is the traditional belief that an idea can be transferred
intact from the mind of an instructor to the mind of a student through lectures.
But the best methodology to enable students to grasp and retain a concept
begins with exploration or data collection (Spencer, 1999). The lecture method
misses the opportunity to actively involve students in Ieaming the material during
class by showing students how to engage in chemistry (Francisco et al., 1998).
Lectures in this unit could be reexamined in terms of topic, length, and format, in
order to reduce the amount of time students spend in lecture and increase the
quality of the Ieaming provided by the lecture. Perhaps the addition of class
discussion, or self—guided reading and response might be another way to
accomplish the goal of conveying topical information without spending time in
class lecturing. If students had good resources to work with at home that allowed
them to read through the information, then perhaps class time could be spent
explaining and discussing and performing the activities. However, in the future it
48

would be expected that the lab activities would be implemented the same way to
produce similar success.
49

APPENDICES
50

APPENDIX A
Student Assent Form
51

Improving Student Comprehension Through Inquiry-Based Laboratory Activities
Student Assent Form
I am currently enrolled as a graduate student in Michigan State University’s Department of
Science and Mathematics Education (DSME). For my thesis research, I have developed a unit on
acid-base chemistry that focuses on incorporating inquiry-based Ieaming into laboratory activities.
This means that laboratory activities will contain more than step-by-step guidelines for
completing procedures. They will also provide you with opportunities to design some of your
own experiments that expand on what we’ve Ieamed. There will also be post lab questions
designed to stimulate thinking and application to real-world problems. As a student enrolled in
Chemistry II for the 2008 school year, you may participate in my research study.
Data for the research study will be collected from standard student work generated in the course
of teaching this unit. These will include pre and post tests, lab activities, and quizzes. I am
asking for your permission to include your data in my thesis. Your privacy is a foremost concern.
Your identity will be protected to the maximum extend allowable by law. During this study, I
will collect and copy student work. However, all names will be removed from assignments prior
to use in the study. All of the work being collected will be stored in a locked cabinet until my
thesis is finished, and will be shredded at that time. In addition, your identity will not be attached
to any data in my thesis paper or any images used in the thesis presentation.
Participation in this study is completely voluntary. Students who do not participate will not be
penalized in any way. Students who choose not to participate in this study will still be expected
to participate in class and complete all the assignments. Those students choosing to participate
will not be given any extra work to complete. You may request to not participate in this study at
any time and your request will be honored. There are no known risks associated with
participating in this study as all activities involved will be a part of normal classroom and
laboratory procedures. Participation in this study may contribute to determining better methods
of incorporating inquiry into chemistry laboratory activities for high school students.
If you are willing to participate in this study, please complete and sign the attached form and
return it to Mr. Mike Dickens by September 19, 2008. Please seal it in the provided envelope
with your name on the outside of the envelope. The envelopes will be stored in a locked cabinet
and opened after the unit is completed and grades have been assigned. Any work from students
choosing to not participate in the study will be shredded.
If you have any questions about the study, please contact me by email at [email protected] or
by phone at (517) 414-4945. Questions about the study may also be directed to Dr. Merle
Heidemann at the DSME by email at heidemaZQmsuedu, by phone at (517) 432-2152, or by
mail at l 18 North Kedzie, East Lansing, Michigan 48824.
l f you have questions or concerns about your role and rights as a research participant, or would
like to register a complaint about this study, you may contact, anonymously if you wish, the
Michigan State University's Human Research Protection Program at 517-355-2180, Fax 517-432-
4503, or e-mail irlx’r’i‘lnisuedu or regular mail at 202 Olds Hall, MSU, East Lansing, MI 48824.
Thank you,
Mr. Kendon Smith
Chemistry Teacher
Columbia Central High School
52

Please print Student Name:
I voluntarily agree to participate in this thesis project.
(Student Signature) (Date)
53

APPENDIX 8
Parent Consent Form
54

Improving Student Comprehension Through Inquiry-Based Laboratory Activities
Parent Consent Form
I am currently enrolled as a graduate student in Michigan State University’s Department of
Science and Mathematics Education (DSME). For my thesis research, I have developed a unit on
acid-base chemistry that focuses on incorporating inquiry-based Ieaming into laboratory activities.
This means that laboratory activities will contain more than step-by-step guidelines for
completing procedures. They will also provide your child with opportunities to design some of
their own experiments that expand on what we’ve learned. There will also be post lab questions
designed to stimulate thinking and application to real-world problems. As a student enrolled in
Chemistry II for the 2008 school year, your child may participate in my research study.
Data for the research study will be collected from standard student work generated in the course
of teaching this unit. These will include pre and post tests, lab activities, and quizzes. I am
asking for your permission to include your child’s data in my thesis. Your child’s privacy is a
foremost concern. Their identity will be protected to the maximum extend allowable by law.
During this study, I will collect and copy student work. However, all names will be removed
from assignments prior to use in the study. All of the work being collected will be stored in a
locked cabinet until my thesis is finished, and will be shredded at that time. In addition, your
child’s identity will not be attached to any data in my thesis paper or any images used in the
thesis presentation.
Participation in this study is completely voluntary. Students who do not participate will not be
penalized in any way. Students who choose not to participate in this study will still be expected
to participate in class and complete all the assignments. Those students choosing to participate
will not be given any extra work to complete. You may request that your child’s information not
be included in this study at any time and your request will be honored. There are no known risks
associated with participating in this study, as all activities involved will be a part of normal
classroom and laboratory procedures. Participation in this study may contribute to determining
better methods of incorporating inquiry into chemistry laboratory activities for high school
students.
If you are willing to allow your child to participate in this study, please complete and sign the
attached form and return it to Mr. Mike Dickens by September 19, 2008. Please seal it in the
provided envelope with your child’s name on the outside of the envelope. The envelopes will be
stored in a locked cabinet and opened after the unit is completed and grades have been assigned.
Any work from students choosing to not participate in the study will be shredded.
If you have any questions about the study, please contact me by email at [email protected] or
by phone at (517) 414-4945. Questions about the study may also be directed to Dr. Merle
Heidemann at the DSME by email at [email protected], by phone at (517) 432-2152, or by
mail at l 18 North Kedzie, East Lansing, Michigan 48824.
If you have questions or concerns about your role and rights as a research participant, or would
like to register a complaint about this study, you may contact, anonymously if you wish, the
Michigan State University's Human Research Protection Program at 517-355—2180, Fax 517-432-
4503, or e-mail [email protected] or regular mail at 202 Olds Hall, MSU, East Lansing, MI 48824.
Thank you.
Mr. Kendon Smith
Chemistry Teacher
Columbia Central High School
55

I voluntarily agree to allow to participate in this study.
(Print Student Name)
Please check all that apply.
I give Mr. Smith permission to use data generated from my child’s work in Chemistry II to
be used in the thesis project. I understand that all data from my child will remain
confidential.
I do not wish to have my child’s work used in this thesis project. I acknowledge that my
child’s work will be graded in the same manner regardless of participation in the study.
I give Mr. Smith permission to use pictures of my child during his work on this thesis
project. My child will not be identified in these pictures.
1 do not wish to have my child’s picture used at any time during this thesis project.
(Parent/Guardian Signature) (Date)
56

APPENDIX C
Acids and Bases Pre/Post Test
57

Name: Date: Hour:
Acids and Bases Pre—Test
Directions: Read each of the following questions carefully and select the correct answer.
_ 1. Which of the following general properties describe bases?
a. Sour taste, corrosive, turn litmus from blue to red
b. Sour taste, corrosive, turn litmus from red to blue
c. Bitter taste, slippery, turn litmus from blue to red
(1. Bitter taste, slippery, tum litmus fiom red to blue
2. A substance that can behave as both an acid and a base is called
a. binary b. amphoteric c. dibasic d. diprotic
3. A substance that has a pH of 5.6 would be considered .
a. very basic (1. very acidic
b. slightly basic e. slightly acidic
0. neutral
4. By definition, weak acids are __
a. substances that do not completely dissociate in water.
b. substances that do completely dissociate in water.
c. substances that don not dissociate at all in water.
5. What is the pOH of a solution with a pH of 10.5?
a. pOH = 3.5 b. pOH = 5.5 c. pOH = 7.0 d. pOH = 10.5
_6. What is the pH of a solution if [H+] = 3.2 x 10'5 M?
a. pH = 3.2 b. pH = 4.5 c. pH = 5.0 (1. pH = 5.5
_ 7. What is the concentration ofhydrogen ion in a solution if [OH'] = 1.0 x 10'5 M?
a. [H+]=1.Ox10'5M C. [W] = 1.0x 10“°M
b. [n+1 = 1.0x 10'9M d. [W] = 1.0x 10"“M
8. If [H+] = 1.0 x 10'7 M, then the solution is .
a. a base b. an acid c. neutral
9. Which of the following shows a conjugate acid/base pair?
a. H2PO4", PO4‘3 c. NH3, NH4OH
b. H2804, H804" d. HCI, NaOH
_ 10. How many milliliters of 0. 1MNaOH would be needed to neutralize 15.0 mL of
0.3M HCI?
a. 5.0 mL b. 15.0 mL c. 30 mL d. 45 mL
58
Short Answer: Read each of the following statements and answer the questions as completely
ll.
12.
13.
14.
15.
as you possibly can.
Acids and bases have multiple definitions, including those proposed by Arrhenius, Bronsted,
and Lewis. What are acids and bases? Explain the difference between them using multiple
definitions, if possible.
The most common method for comparing acids or bases is by measuring pH levels. What is
pH? What does it measure? Describe the pH scale and what it means for a solution to be
acidic, basic, or neutral.
There are many different types of acid-base indicators. Some are found naturally in things
like flowers and fruits, while others are man-made. What are acid-base indicators? Why are
they so useful? In simple terms, how do they work?
Buffers are found in many places in nature, including lakes, plant fluids, and even your blood,
where they are important in maintaining homeostasis. What is a buffer? What is its job?
How does it do its job?
Complete the neutralization reaction: HNO3 + NaOH —)
a. What type of reaction is it?
b. What kinds of products are formed in neutralization reactions? Describe the nature of
these products and where they come from.
59

APPENDIX D
Acids and Bases — Post Unit Survey
60
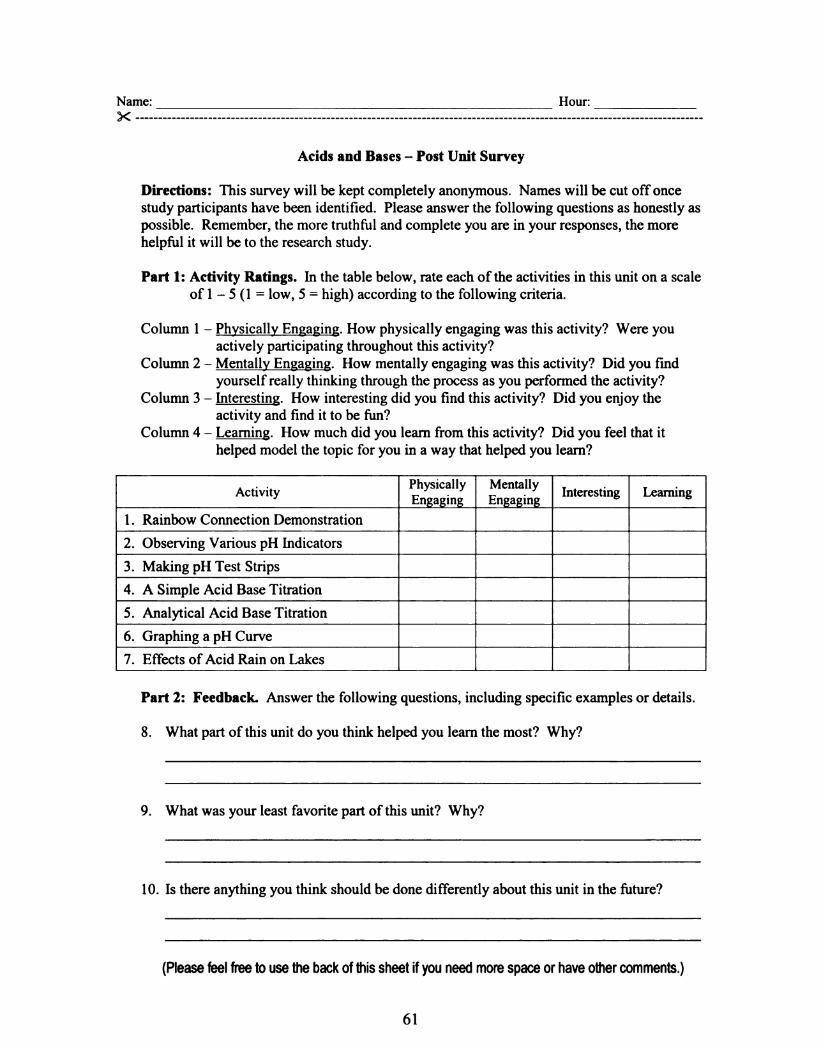
Name: Hour:
Acids and Bases — Post Unit Survey
Directions: This survey will be kept completely anonymous. Names will be cut off once
study participants have been identified. Please answer the following questions as honestly as
possible. Remember, the more truthful and complete you are in your responses, the more
helpful it will be to the research study.
Part 1: Activity Ratings. In the table below, rate each of the activities in this unit on a scale
of 1 - 5 (l = low, 5 = high) according to the following criteria.
Column 1 — Physically Engaging. How physically engaging was this activity? Were you
actively participating throughout this activity?
Column 2 — Mentally Engaging. How mentally engaging was this activity? Did you find
yourself really thinking through the process as you performed the activity?
Column 3 — Interesting. How interesting did you find this activity? Did you enjoy the
activity and find it to be fun?
Column 4 — Learning. How much did you learn from this activity? Did you feel that it
helped model the topic for you in a way that helped you learn?
Physically MentallyActivrty
Bum Engaging
Interesting Learning
. Rainbow Connection Demonstration
. Observing Various pH Indicators
. Making pH Test Strips
. A Simple Acid Base Titration
. Analytical Acid Base Titration
. Graphing a pH Curve
\IOU‘AMN—I
. Effects of Acid Rain on Lakes Part 2: Feedback. Answer the following questions, including specific examples or details.
8. What part of this unit do you think helped you learn the most? Why?
9. What was your least favorite part of this unit? Why?
10. Is there anything you think should be done differently about this unit in the future?
(Please feel free to use the back of this sheet if you need more space or have other comments.)
61

APPENDIX E
Individual Student Pre/Post Test Scores
62

3
“W1X111X11X11111111X11X111X1XXX1X111111X1XX1XX11Mm
M9X11X111XX1XXXe-XX1X1111XXX11X11XX1XX11XXXXXX111fi«v.v
nus111111111111111111111XX1X111111111111111X11111QW
W71X111111111X111111111111111111111111X111X11111Qm
MC1x11111111XX11X111X11111X11X11XX1X1X1111X11X11$
M51x11111111111.111111......11.1.l1111111.X11111111x11111mm.v
M41X11X11X111X1X1X1111X11111111XX1X1X11111X11X11Mw
P31X11111111111111111111111111111X11X1X11XXXX1X1T].
2XXX1XXXXXXXXX1XX1XXX1XX11111X1X1X11111XXX11111~0
111111X111XXX11X1X11111X11X111111111X1111111111W
m2175636362345525521832165425352235374633461447
90¢.
WXX111X1111XX1XX1XXX1XXXX1XX111XXXXXXX1X1XXX1X1WW
WQXXIXXX1XXX1XXXX1XXX1XXX1X1XXXXXXXXX1X1XXX1XXXXWor»
NMDXXX1X1XX1X1X1X1X1XX11XX1XX11X1XXX111111X11X111flW
W7XXXXXXXX11XXX1XXXXXXXX1XX1XXXXXXXXXXXXXXXXXXX16m
WGXXXX1X1XXXX1XXXXXXXXXXXXX1XXXXXXXXXXXX1111XXXX8
MSXX111XXXXXXX11X1XXX1XXX11XXXXXXXXXX1XXXXXXXX11MII.
H4XX1XX11X1XXXX1XX11X1X1XX1111111111X111X1111XX1W
W31X1111111X111111111111X11XX1111X1111111X11X1X1y
2XX1X1XXXXXX1XXXX1XX1XXX1XXXXXXXXX1X1XXXXXXXX1X9
111111x111xX111x11xx11xx11XX1X1X1111111XXX1X111m
.
mmwmwmmmmmmmmmwmmmmmmmmmmmmmmmmmwmmmmmmmmmmmmmmm
cmmmmmwnmmmwwwwwwmummmmmmmmmmnnmmmmuuwmmwmmmmmmn
..m
m1111111111111111111111122222222222222222222222000
I
63
Table 6: Individual Student Pre/Post Test Scores — Multiple Choice

rmnAtrohst8.Jfl0P
343
433244
01222224
01202
u«40203m394464m68mWBHfiHfiWZ
01258968789HQ53688fiHm
m
s
r.
99
“630002303120134344134143100012322334223413133349W
8
mms
«0.410000000000001002202020000—000020000010200001203
m.
.n
m
a2
«”101012221021200211321310
011102222122110011112
A
Tm3—
2”
Pn001003142022203134553241
000233231324302323555mm
“”0000020002202221022444400000002001023300040424mw
9h.
24
773
71
94
543
713
73
55
«m11mo1ommosm1m2w2m112m2mimmaowmomomrmzmzxanmmmm
ommm2w90377%W7wm17%W1mom3$11wmm1fl1omww01%2m652m
c0
01000
000
11
001
1101
10
10001
T
NMMPCESJLAMLRRMJPLMMMJDKNKMWMMLJFDRMRALMJJKALWn
,m
H
Individual Student Pre/Post Test Scores — Short AnswerTable 7:
64

APPENDIX F
The Rainbow Connection Demonstration
65

The Rainbow Connection Demonstration
An acid/base demonstration using colorful indicators
Overview: Acid/base indicators change color in response to changes in pH. Each indicator has
characteristic color forms and a narrow pH range over which color change occurs. By using a
combination of indicators, we are able to create a colorful palette that changes over desired pH
ranges. The three indicators used in this demonstration are colorless in acidic solutions, but
produce the three primary colors in basic solutions.
Objectives: To vividly show reversibility of indicator colors in response to pH changes.
To show the formation of new indicator colors through the combination of indicators.
Materials: This demonstration requires that a series of solutions be prepared in advance.
“Doctored” beakers must also be prepared in advance.
A. Indicators: Each of these recipes makes 15 mL of indicator solution, which is plenty for
lots of go arounds of the demo. If you think you’ll need more, please adjust accordingly.
Please note that the indicators should be made up at least one day ahead of time so that
the solutes are fully dissolved. Dissolve each indicator combination in 15 mL of95%
ethanol. Store in properly labeled dropper bottles.
a
b
c
Q.
7'30
. Red
. Blue
- 0.44 g phenolphthalein, 1.0 g m-nitrophenol
. Orange - 0.15 g phenolphthalein, 2.0 g m-nitrophenol
. Yello - 2.0 g m-nitrophenol
. Green - 0.2 g thymolphthalein, 2.0 g m-nitrophenol
- 0.5 g thymolphthalein
Violet - 0.3 g phenolphthalein, 0.13 g thymolphthalein
B. Solutions
Acid-glcohol solution - Mix 250 mL of0.05M sulfuric acid" and 250 mL of 95%
ethanol. Transfer into a vessel from which you can easily pour this solution.
*Add 0.7 mL of 18M H2S04 to 250 mL of distilled water.
0.012MNaOH solution — Prepare 1,200 mL of 0.012MNaOH" in a large flask
or beaker. Can transfer into a large water pitcher for pouring.
"Add 0.58 g ofNaOH to 1200 mL of distilled water.
0.2MNaOH solution —- Prepare 100 mL of0.2M NaOH*** in a beaker. Transfer
to dropper bottle.
"*Add 0.8 g ofNaOH to 100 mL of distilled water.
HZSO4/glycerine solution — Dissolve 10 mL of 18M H2S04 in 20 mL of
glycerine. Transfer to a dropper bottle. This allows for drops to sink readily to
the bottom and not mix quickly so that the colors will not change until stirred.
66

C. Preparing the Beakers
Arrange six clean 250 mL beakers in a row in clear view of the class or audience.
Carefully place 2 drops of the proper indicator solution into each of the beakers. Be sure
not to splash the indicator solutions on the sides. The vessels should be line up in proper
rainbow sequence: ROYGBV. The drops take about 30 min to dry and the beakers
should be prepared ahead of time. You now have six beakers, each with the appropriate
dry indicator on the bottom.
D. The Demo
a. An equal volume, about 35 mL, of the acid-alcohol solution is carefully poured
into each glass vessel. Tilt the beaker and pour the solution in carefully down the
side so as not to disturb the dry indicator on the bottom of the glass. This will
give the best results.
b. Slowly fill each beaker about ‘/2 full with 0.012M NaOH solution, again being
careful to pour the solution slowly down the side and not disturb the indicator.
This volume ofNaOH is weak enough that it should not yet make the solution
basic. All beakers should appear as though they are filled with a clear solution.
c. Rapidly pour in just enough of the 0.12M NaOH solution to the beakers to almost
fill them. The rainbow colors should appear as the excess base is added to each
beaker. Try not to add too much base past the endpoint. You may need to stir
with a glass rod if the acid solution has not fully dissolved the indicator.
(1. Add 2-3 drops of H2SO4/glycerin solution to each beaker. The drops should
sink to the bottom so that the solutions only change back to clear after vigorous
stirring. Try to sneak a few drops ofHZSOS into your original large container
that held the 0.012M NaOH to turn it acidic. This will be used in the last step.
e. “Titrate” each beaker back to its basic color by adding drops of 0.2M NaOH
while stirring vigorously.
f. The contents of each beaker can now be poured back into the original large
beaker or pitcher (now made acidic) one at a time. Because of the acid/glycerin
“sneaked” into this container, the solutions should all turn colorless when they
are poured.
Based on: JChemEd, Feb 84; p. 172-173, adapted from Hedemann, MSU by K. Smith
67'

APPENDIX G
Activity #1: Observing Indicators
68

Observing Indicators Name: Hour:
Objective: To observe a wide array of natural and synthetic indicators and use them to
estimate the pH ofunknown solutions.
Introduction:
Acid-base indicators can be found almost anywhere. They are very common in
plants and are often found in petals, leaves, and even fi'uits. These naturally occurring
chemical indicators largely belong to a group of special compounds called anthocyanins.
Some plants contain only a single anthocyanin compound, while many contain several
anthocyanins that may change into a variety of colors. Most anthocyanins are found in
fruits or leaves or petals that contain red, blue, or purple colors.
There also exist a wide array of specific chemical indicators that change various
colors at narrow, known pH ranges. Today you will be placing indicators, both natural
and synthetic, into solutions of various pH ranges, to develop a sense ofthe color
spectrum exhibited by each indicator. This will allow us to identify the pH ranges over
which specific color changes occur. You will then use these indicators to estimate the pH
values of several unknown solutions.
Materials:
96 well reaction plate
pH 1 — 12 standard solutions
various indicators
Part 1 — Natural Indicator Extraction
1. Obtain a sample of a fruit or flower to extract the color from. Your teacher will
tell you how much you need in order to get enough color to test.
2. Break up, out up, or crush your sample into your 125 mL Erlenmeyer flask.
3. Pour just enough water into your flask to cover your sample. You want to ake
sure you will have enough liquid to use for your experiment and share with
neighbors.
4. Heat your flask over a Bunsen burner on medium heat until it begins to boil, or
the color appears to be extracting into the liquid. Shut off the burner as soon as it
begins to boil or the extraction appears to be completing.
5. Allow the extract solution to cool for a few minutes before using.
Part 2: Observing Indicators
1. Obtain and rinse a 96 well reaction plate.
2. At the bottom of the plate are the numbers 1 — 12. These are to represent the pH
of each well. Add two drops of the appropriate pH buffer solutions to each well.
3. Add 1 or 2 drops of an indicator solution to each cell in row A. Repeat for
various indicator solutions in each row. Record your results.
69

Data and Observations:
Label the contents of each row of wells on the right. Then use colored pencils to record
the colors and color changes you observe as best as you can.
A.
B.
C.
D.
E.
F.
G.
H.
A
ofiuuuqu’M Bhuuuuuuppppw C
eeeeeeeeeeeec444¢4¢+§4¢+ D Deeeeeeeeeeee44444444444Eeeeeeeeeeeee E¢o§++¢§o4o¢peeeeeeeeeeee F
GUUUUUUUUUUbG44¢.444444+.¢ H G
H
123456789101112 Part 3: pH of Unknown Solutions
1. Rows G & H should be empty. Obtain an unknown solution and place two drops
into each of the cells in row G. Repeat with a second unknown solution in row H
and rows G & H on the second reaction plate.
2. Add two drops of each of the 12 different indicator solutions you tested into each
indicator and record your results. Record the estimated pH values for the
unknown solutions below.
Unknown #1: Unknown #3:
Unknown #2: Unknown #4:
70

APPENDIX H
Activity #2: Making pH Test Strips
71

Making pH Test Strips Name: Hour:
Objective: To create pH test strips using natural anthocyanins and generate a color
coding chart that can be used to find the pH ofunknown solutions.
Introduction:
pH can be easily estimated using strips ofpaper that contain acid—base indicator
dyes. pH strips can be made using a variety of indicators that function over different pH
ranges. Litmus paper is a simple indicator that changes from red to blue at a pH of about
7.0. Other indicating strips contain a mixture of various chemical indicators that give
multiple color changes over a broader spectrum. Universal indicator, for example,
contains chemicals that produce virtually all the colors of the rainbow across a pH range
of 2.0 — 12.0, making it possible to identify a more specific pH within that range.
Anthocyanins are a class of water-soluble plant pigments that are most often
found in flowers or fruits, but may also be found in leaves, stems, and even roots. These
pigments manifest different colors depending on pH levels. These pigments can easily be
extracted and applied to paper to form a natural pH test strip.
In this lab you will be extracting anthocyanins from red cabbage leaves and using
the extract to create red cabbage pH test strips. The strips will be dipped in to solutions
of known pH in order to create a color chart that can be used to find the pH ofunknown
solutions.
Materials:
Red cabbage leaves
Distilled water
9.0 cm filter paper circles
Small foam plates
pH 2.0 — 12.0 buffers
1.0M HCl solution
Various acid/base unknowns
.
—
Day 1 Procedure:
1. Weigh out about 30 grams of red cabbage leaves. Tear them into small pieces and
add them to a clean 250 mL Erlenmeyer flask.
2. Add 100 mL of distilled water to the flask. Using a Bunsen burner, heat the
mixture on high until it begins to boil vigorously. Shut off the burner
immediately and stir the contents for a few minutes as the solution cools, allowing
the water to extract as much of the pigment as possible.
3. Decant the liquid into a clean 125 mL Erlenmeyer flask and discard the boiled
cabbage leaves.
4. Label two small foam plates with your name and place a 9.0 cm filter paper circle
in the center of each.
72

5. Using a disposable pipet, add about 70 — 80 drops of red cabbage extract to each
of the filter paper circles. You should add enough to completely saturate the
paper without overflowing onto the plate. Carefully set the plates in an area
designated by your teacher to dry overnight.
6. Label your flask of cabbage extract with your name and place foil over the
opening. Place it in the refrigerator to save for later use.
pH Strig Cutting Temglate
Use the template on the left as a
guide as you cut your circular filter
‘ __ _ __ _____ papers into strips. You should be
able to get 20 — 24 strips from a
single piece of filter paper.
Start by cutting off the top and
bottom of the filter paper as shown
by the two dotted lines. This
center section can now be cut into
strips that are about 5.0 cm long
and 0.4 cm wide.
The top and bottom sections
you cut off can be cut into 2 — 3
strips of the same size as those
from the center section.
Day 2 Procedure:
1. Use the template and instructions in the box above to cut your dry filter paper
circles into strips. Place your strips in a small vial for storage.
2. Obtain and wash a 24 well reaction plate. After washing, rinse the plate with
some distilled water and dry it.
3. Into the first cell, add 10 drops of 1.0MHC1. Into the next 11 cells, add 10 drops
of each buffer solution, from 2.0 — 12.0.
*Note: It is important to keep track ofwhich solutions are in each cell. You may
want to place the reaction plate on a blank piece of scrap paer and make notes
about which solutions are in each row of cells.
4. Obtain a 5 inch wide piece ofplastic coated bench liner paper. Lay it on your lab
bench with the plastic side facing upward.
5. Dip a single test strip into each of the twelve wells, starting with the 1.0M HC1
and proceeding in order up to pH 12.0. Lay the test strips side by side on the
plastic coated paper. Use a marker to label the pH of each solution tested by each
strip. (1 .0M HCI = pH 1.0) This is your color chart to be used with testing your
unknown solutions. Complete the table on the following page describing with
words the colors you see the indicator form at each pH.
73

Red Cabbage Indicator Colors at Various pH Levels
[111 Color of Indicator pH Color of Indicator
1.0 7.0
2.0 8.0
3.0 9.0
4.0 10.0
5.0 l 1.0
6.0 12.0
Estimating pH of Solutions Using Strips
Use your pH test strips to estimate the pH of the following solution in the remaining 12
wells of your reaction plate. Make up each of the solutions as described in the table
below. Be sure to GENTLY SWIRL the plate in order to mix the solutions before
. dipping your test paper. Dip your test strips in each solution and compare them to the 12
standards previously made and estimate the pH of the solution. Use only distilled water
to prepare your solutions.
Estimated pH of Various Unknown Solutions
Solution Estimated pH
10 drops vinegar
5 drops vinegar, 5 drops water
1 drop vinegar, 9 drops water
10 drops ammonia
5 drops ammonia, 5 drops water
1 drop ammonia, 9 drops water
10 drops water
10 drops 0.2MNaOH
5 drops 0.2M NaOH, 5 drops water
1 drop 0.2MNaOH, 9 drops water
10 drops orange juice
10 drops soap solution
74
Design an Experiment: Testing pH of Solutions at Home
There are many different household solutions that may be acids or bases. Take your
remaining pH paper strips home in a small sealed vial and see how many solutions
you can find. Create a table or chart in the space below to present all the data you
collect. Be sure to identify all the solutions you test and record the results of your
tests, even for solutions that may not appear to be acids or bases.
Post Lab Questions:
1. What general types of solutions or materials did you find to be acidic? Alkaline?
2. How is it possible for red cabbage anthocyanins to show so many different color
changes across the pH spectrum when most indicators only show two colors?
75

APPENDIX I
Activity #3: A Simple Acid/Base Titration Lab
76

A Simple Acid/Base Titration Lab Name: Hour:
Introduction:
Acid-base indicators are weak acids and bases that change their color at specific pH
ranges. Most indicators have two molecular forms that differ only by the presence or absence of
a hydrogen ion. What makes an indicator useful is that each of its forms appears as a different
color. Indicators change their molecular structure in the presence of acids and bases and allow us
to see by their color when a solution reaches a certain, specific pH.
HIn : H+1 + In'1
Acid Form Base Form
Phenolphthalein is a very commonly used indicator in reaction that involve neutralizing
an acid by adding a base to it. In the presence of an acidic solution, phenolphthalein is
completely colorless. However, once a solution is neutralized to a pH of around 8.0, the indicator
turns a very bright pink color.
HO OH O OH
+ \c\ -H co\ 4._——a. -
c=o Co:
phenolphthalein phenolphthalein
pH < 8.2 (clear) ph > 8.2 (pink)
Acids have low pH values, less than 7.0, while bases have high pH values, from 7.0 to
14.0. The addition of a base to an acid will begin to neutralize the acid and raise the pH level.
Bases neutralize acids by absorbing the extra hydrogen ions in solution. The most common bases
contain the hydroxide ion, which can join together with the hydrogen ions from acids to form
water, a completely neutral substance, as shown in the reaction below.
OH'1 + H"1 H20
In this lab exercise you will be titrating various acid solutions with sodium hydroxide, a
strong base. Titration is a process in which a titrant of known concentration is added to unknown
solutions until an endpoint is reached or exceeded. The endpoint is usually signaled visually by
use of a chemical indicator. Comparison of the volume of titrant used to the volume ofunknown
allows for the molarity ofthe unknown to be calculated. How will you know that you have added
enough base to neutralize the acid? What would happen if you continued to add more base even
after the solution was neutralized?
Safety: Acid and bases are corrosive chemicals and may cause irritation or
severe burns to skin and eyes. Wear safety goggles at all times when
handling acids and bases. Move carefirlly around the lab to avoid accidents
or spills. Wash your hands thoroughly before leaving the laboratory. Acids
and bases may bleach or destroy clothing on contact.
77

Procedure: Read through ALL steps carefully before beginning.
Carefully clean and dry 6 large test tubes. Label each 1 — 6 with a marker.
Add 1.0 mL of0.2M HCl, 0.4M HCl, and 0.6M HCI to tubes 1 — 3 respectively.
Add 1.0 mL of0.2M H2804, 0.4M H2804, and 0.6M H2804 to tubes 4 — 6.
Add 1 drop ofphenolphthalein indicator to each test tube.
Add 20 mL of0.35MNaOH solution to a clean 150 mL beaker.
Count the number of drops ofNaOH solution required to turn the solution pink.
Slow to ONE DROP AT A TIME when you see the pink begin to persist, making
sure to swirl and mix the contents between each drop. Stop when it STAYS pink.
Repeat with the other five test tubes and record your results in the table.
7. Add 2 drops of vinegar to one of your test tubes and stir.
8. Add 10 drops of sodium hydroxide solution to this test tube and stir.
9. Pour all solutions down the drain and clean and wash your equipment.
QMPPPI‘
Data Table:
Number of Drops of NaOH Added
Solution
0.2 M 0.4 M 0.6 M
Hydrochloric Acid
HCI
Sulfuric Acid
H2804 Create a Graph: On the chart below, graph the number of drops required to titrate each acid
molarity. Create a separate line for each of the two acids by connecting the three points as best as
possible and extend the lines beyond your data points up to 1.0 M.
Drops of NaOH vs. Molarities of Given Acids
100
80
60
40
20
0.1 0.2 0.3 0.4 0.5 0.6 0.7 0.8 0.9 1.0
Molarity (M)
78

Design an Experiment: Molarity of Vinegar
Set up an experiment to test the molarity of vinegar using the solutions provided in this lab. Run
the test on a vinegar sample and use the graph you made on the previous page to associate the
number of drops with the concentration of acid in vinegar.
Note: Vinegar contains acetic acid, a two carbon organic acid that contains a carboxyl group.
a. Draw the structure of acetic acid in the box to the right.
b. Is acetic acid a strong or weak acid?
o. Is acetic acid monoprotic or diprotic?
Data and Observations: Use the space below to record your data and observations or create
charts or tables for your vinegar investigation.
Graphing the Molarity of Vinegar: Plot 3 point to the graph on the previous page that shows
your estimation of the molarity of vinegar.
a. What do you estimate the molarity of vinegar to be?
Post-Lab Question: Answer the following question as completely as possible.
1. Explain why the titration of sulfuric acid, H2SO4, did not require the same amount
of sodium hydroxide as the titration ofhydrochloric acid, HCl.
79

APPENDIX J
Activity #4: Analytical Titration Lab
80

Analytical Titration Lab Name: Hour:
Acid/Base Review:
In a neutralization reaction, an acid and a base are combined to form a neutral
product, usually a salt and water. The combination ofhydrochloric acid and sodium
hydroxide is the best example of a neutralization reaction. Hydrochloric acid is a strong
acid and sodium hydroxide is a strong base. They combine to form sodium chloride
(table salt) and water in the following reaction:
HCI + NaOH —> NaCl + HOH
Today we will be observing this reaction with a technique known as titration. In
titration, we add the base solution to the acid solution until it is completely neutralized.
In order for us to tell when we have completely neutralized the acid, we will use an
indicator called phenolphthalein. Phenolphthalein indicator remains completely colorless
when it is mixed with an acid solution. When the solution reaches a pH level of about
8.0, the phenolphthalein indicator undergoes a color change and remains pink.
You will be preparing your own base solutions for this experiement. Be carefirl
when handling acid and base solutions. Always wear safety goggles!
Materials:
Acid solutions of unknown concentration
NaOH pellets
Phenolphthalein indicator solution
50 mL buret
Buret Clamp
100 mL volumetric flask
Ex
Step 1: Preparing a Base Solution of Known Concentration
Prepare a solution of sodium hydroxide by weighing out 5 pellets and adding them to a
100 mL volumetric flask of distilled water. Use the exact mass of the 5 pellets to
calculate the exact concentration of your sodium hydroxide solution before starting the
lab.
Step 2: Testing Your Unknown Solutions
1. Rinse your buret with distilled water and drain it completely.
2. Add your sodium hydroxide solution to the buret. DO NOT fill it above the zero
mark. Never allow it to drain below the 50 mL mark. Pour enough in so that it is
filled between the 0 — 5 mL marks. You don ’t have to start exactly on zero!
Record the initial volume in the buret in your data table to the nearest 0.01 of a
milliliter. (Remember to estimate between the lines!)
81

3. Measure out exactly 10 mL of your acid solution into a clean and dry 50 mL
beaker. Add a drop of phenolphthalein indicator to this acid solution before
testing.
4. Begin slowly adding the sodium hydroxide solution to the acid. You may add the
solution more quickly at first, but you should slow it down to drop by drop as
soon as you begin to see pink forming. Gently swirl the beaker continuously to
mix it thoroughly as you add the base. Stop adding your solution as soon as the
acid barely turns pink and stays pink.
5. Record the final volume in the buret in your table and discard your pink solution.
Clean your beaker to try another sample.
Data Table: Record your data below and show your work on a separate piece of paper.
Sample HCI Trial 1 HCI Trial 2 H2804 Trial 1 H2804 Trial 2
Initial Volume
of NaOH in
Buret
Final Volume
of NaOH in
Buret
Total Volume
of NaOH Used
Molarity of
NaOH
Solution
Volume of
Acid Sample
Tested
Moles of
NaOH Used
Moles of
Acid Tested
Molarity of
Acid Solution
82

83
DataTable:
TitrationofSodaandLemonJuice
FreshSoda
FlatSoda
LemonJuice
Trial
1Trial2
Trial
1Trial2
Trial
1Trial2
InitialVolume
ofNaOH
in
Buret
FinalVolume
ofNaOH
in
Buret
TotalVolume
ofNaOHUsed
Molarityof
NaOH
Solution
VolumeofAcid
SampleTested
Molesof
NaOHUsed
Molesof
AcidTested
Molarityof
AcidSolution
Questions and Calculations:
1. Use your notes to write the complete structural formula of citric acid below. How
many ionizable hydrogen atoms does it have? Circle them in the structure below.
Write the balanced equation for the complete neutralization of citric acid with
sodium hydroxide using the condensed chemical formula for citric acid.
In the space below, show the work you would do to solve for each of the values in
the data table for trial 1 of your lemon juice titration. Circle each answer that was
recorded in the table as you arrive at it below.
Carbon dioxide reacts with water in a synthesis reaction to form carbonic acid.
Write the equation for that reaction below. (It will balance with 1:1 ratios.)
Explain the difference observed between the titration of the fresh soda and the flat
soda.
84

APPENDIX K
Activity #5: Graphing a pH Curve
85

Name: Date: Hour:
Graphing a pH Curve
Procedure:
1.
2.
3.
4.
5
10.
ll.
12.
Set up a buret on a ring stand with a buret clamp. _
Fill the buret to just over the 0 mL mark with 0.1MNaOH solution.
Place a 250 mL beaker below your buret and drain out the excess NaOH solution until the
meniscus is exactly on the 0 mL line. Discard this NaOH in the sink.
Add exactly 18.0 mL of 0.1M HCI to a clean 150 mL beaker.
Place the beaker of acid below the buret and adjust the height so the tip of the buret is
about even with the top of the beaker.
Use a digital pH meter to measure the pH of the acid in the beaker before adding any
NaOH and record it in the chart as the first pH at 0 mL. Submerge only the tip of the pH
probe and stir. Wait for the pH meter to stabilize before recording.
Fill a 400 mL beaker about halfway with distilled water and set it aside for rinsing your
pH meter.
Between measurements, rinse your pH meter’s electrode under a stream of tap water and
dip it into the beaker of distilled water. Gently shake off the excess water on the
electrode before making your next measurement.
Begin adding aliquots ofNaOH to the acid solution as shown in the chart below, starting
with 1 mL aliquots. Note that part way through the aliquots change to 0.5 mL.
After the addition of each aliquot, use the pH meter to check the pH of the solution and
record it in the table.
Continue until 37 mL ofNaOH have been added to the acid. If there is time, refill your
buret and get a fresh sample of acid to repeat for a second trial.
Dispose of all solutions down the sink when done and wash all your glassware. Flush the
buret completely with tap water AND distilled water and leave it with the valve OPEN to
dry.
Buret Volume pH Buret Volume pH Buret Volume pH
15 23
15.5 24
' 16 25
16.5 26
17 27
17.5 28
18 29
18.5 30
19 31
19.5 32
20 33
:SOOONQUIAOJN—‘O
20.5 34
21 353—5
N
21.5 36.—s
U)
22 37p—A
h
86

Day 2: Repeat the procedure from the first day and obtain a second data set to compare with.
Buret Volume pH Buret Volume pH Buret Volume pH
0 15 23
1 15.5 24
2 16 25
3 16.5 26
4 17 27
5 17.5 28
6 18 29
7 18.5 30
8 19 31
9 19.5 32
10 20 33
1 1 20.5 34
12 21 35
13 21.5 36
14 22 37
Graphing pH Curves: Carefully graph your data from day 2 in the space below. Be sure to
label your x-axis and y-axis values.
pH . ‘ TI
._
.._.__..
_.
.—
L ll L
Volume ofNaOH added in milliliters
87

APPENDIX L
Activity #6: Effects of Acid Rain on Lakes
88

Effects of Acid Rain on Lakes Name: Hour:
Objective: To explain why lakes with limestone or calcium carbonate beds experience
less adverse effects from acid rain than lakes with granite beds.
Introduction:
Limestone is a sedimentary rock composed largely of the mineral calcite, which is
calcium carbonate. Calcium carbonate (CaC03) is also found in materials such as
marble, chalk, and the shells of marine organisms. It is a mineral that is slightly soluble
in water, and its solubility is affected significantly by factors such as pH, water
temperature, or concentration of dissolved ions. Calcium carbonate exhibits a unique
property known as retrograde solubility, which means that it becomes less soluble as the
temperature of the water is increased. Marble is made up of calcium carbonate that has
been transformed through the process of metamorphism, in which it is exposed to great
amounts of heat and pressure.
Granite is a type of igneous rock, formed from the solidification of cooling
magma. Granites vary in their crystalline compositions, producing many different color
combinations depending on the minerals contained. Quartz is the most abundant mineral
in most granites, along with many other metal oxides. Quartz is composed of silicon
dioxide (Si02), which is the main component of sand and glass. Quartz, as well aas most
minerals in granite, is insoluble in water.
Compounds containing the carbonate ion react with strong acids to form carbonic
acid, a weak acid, as shown in the reaction below:
C3CO3 1' ZHCl : CaCl2 + H2CO3
Carbonic acid exists in equilibrium with carbon dioxide (CO2) in aqueous
solutions. Water can only hold a given amount of C02 at any given moment, depending
on its temperature. As carbonic acid builds up in water, it separates into water and C02.
These excess levels of C02 will then be released to the air in order for water to maintain
its maximum C02 level. The reversible equation is shown below:
H2CO3 H20 + C02
In this lab, you will be observing the buffering effect of carbonate on aqueous
solutions. You will then design a test to determine if various rock samples contain the
carbonate ion.
Materials:
Limestone chips
Granite chips .
1.0M & 0.01M HCI solutions
Bromcresol green solution
3 x 150 mL beakers —
Distilled water
100 mL graduated cylinder
pH paper or pH meter
89
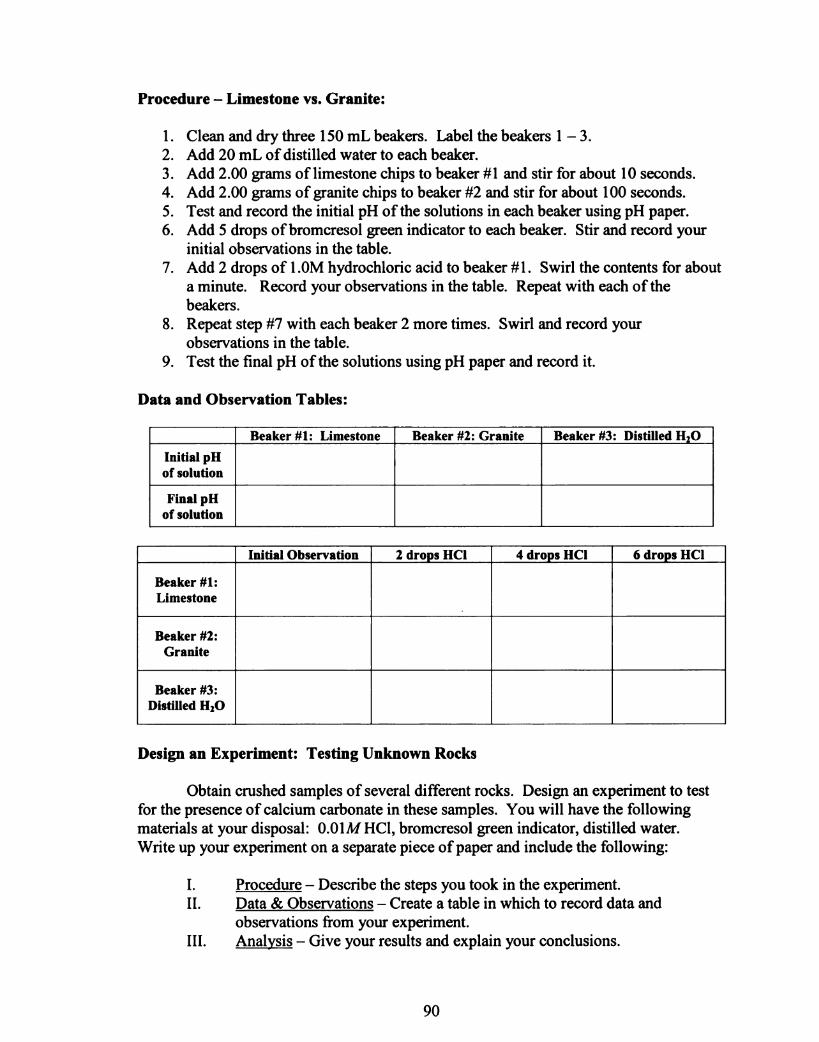
Procedure — Limestone vs. Granite:
Clean and dry three 150 mL beakers. Label the beakers 1 - 3.
Add 20 mL of distilled water to each beaker.
Add 2.00 grams of limestone chips to beaker #1 and stir for about 10 seconds.
Add 2.00 grams of granite chips to beaker #2 and stir for about 100 seconds.
Test and record the initial pH of the solutions in each beaker using pH paper.
Add 5 drops ofbromcresol green indicator to each beaker. Stir and record your
initial observations in the table.
7. Add 2 drops of 1.0M hydrochloric acid to beaker #1. Swirl the contents for about
a minute. Record your observations in the table. Repeat with each of the
beakers.
8. Repeat step #7 with each beaker 2 more times. Swirl and record your
observations in the table.
9. Test the final pH of the solutions using pH paper and record it.
P‘V'PP’N?‘
Data and Observation Tables:
Beaker #1: Limestone Beaker #2: Granite Beaker #3: Distilled H2O
Initial pH
of solution
Final pH
of solution
Initial Observation 2 drops HCI 4 drops HCI 6 drops HCI
Beaker #1:
Limestone
Beaker #2:
Granite
Beaker #3:
Distilled H20
Design an Experiment: Testing Unknown Rocks
Obtain crushed samples of several different rocks. Design an experiment to test
for the presence of calcium carbonate in these samples. You will have the following
materials at your disposal: 0.01M HCl, bromcresol green indicator, distilled water.
Write up your experiment on a separate piece ofpaper and include the following:
1. Procedure - Describe the steps you took in the experiment.
11. Dgta & Observations — Create a table in which to record data and
observations from your experiment.
III. Analysi — Give your results and explain your conclusions.
90

Post-Lab Questions:
1. What did you see happen in the beaker containing limestone when the drops of
acid were added to it? Explain these changes.
2. What is the pH of the initial solution containing the calcium carbonate mineral?
Consider the effect calcium carbonate has on the pH of solutions. Is calcium
carbonate an acid or a base? How can this be? Explain.
3. If a strong acid is added to a solution containing solid calcium carbonate, bubbles
are generated. What are these bubbles? Where do they come from?
4. Explain why lakes with limestone beds experience less adverse effects from the
acid rain than lakes with granite beds.
91

REFERENCES
92

REFERENCES
Colburn, Alan. 2000. An Inquiry Primer. Science Scope, 23 (6), 42.
Crawford, Barbara. 2000. Embracing the Essence of Inquiry: New Roles for Science
Teachers. Journal ofResearch in Science Thinking, 37 (9), 916-937.
Flavell, John H. 1979. Metacognition and Cognitive Monitoring: A New Area of
Cognitive-Developmental Inquiry. American Psychologist, 34 (10), 906-911.
Francisco, Joseph S., Nicoll, Gayle & Trautmann, Marcella. 1998. Integrating Multiple
Teaching Methods into a General Chemistry Classroom. Journal ofChemical Education,
75 (2), 210.
Haury, David. 1993. Teaching Science Through Inquiry. ERIC Clearinghousefor
Science Mathematics and Environmental Education Digest. ED359048, Columbus, OH.
Herron, Marshall D. 1971. The Nature of Scientific Enquiry. The School Review, 79 (2),
171-212.
Hodson, D. 1993. Re—Thinking 01d Ways: Towards a Critical Approach to Practical
Work in School Science. Studies in Science Education, 22, 85-142.
Hofstein, A., & Lunetta, V. N. 1982. The Role of Laboratory in Science Teaching;
Neglected Aspects of research. Review ofEducational Research, 52 (2), 201-217.
Hofstein, Avi & Lunetta, Vincent N. 2003. The Laboratory in Science Education:
Foundations for the Twenty-First Century. Science Education, 88 (1), 28-54.
Hofstein, A., Navon, 0., Kipnis, M., Manlok-Naaman, R. 2005. Developing Students’
Ability to Ask More and Better Questions Resulting from Inquiry-Type Chemistry
Laboratories. Journal ofResearch in Science Teaching, 42 (7), 791-806.
Horowitz, H. M. 1988. Student Response Systems: Interactivity in a Classroom
Environment. Proceedings ofthe 6th Annual Conference an Interactive Instruction
Delivery, Societyfor Applied Learning Technology. Warrenton, VA; pp 8-15.
Jonassen, David H. 1991. Objectivism versus Constructivism: Do We Need a New
Philosophical Paradigm? Educational Technology Research and Development, 39 (3), 5-
14.
Ketpichainarong, W., Panijpan, B., & Ruenwongsa, P. 2009. Enhanced learning of
biotechnology students by an inquiry-based cellulase laboratory. International Journal of
Environmental & Science Education, 5 (2), 169-187.
93

Marx, R.W., P.C. Blumenfeld, j.S. Krajcik, B. Fishman and E. Soloway, 2004. Inquiry-
based science in the middle grades: Assessment of learning in urban systemic reform.
Journal ofResearch in science Teaching, 41 , 1063-1080.
Michigan Department of Education. 2006. High School Science Content Expectations /
Chemistry.
National Research Council. 1996. National Science Education Standards. Washington,
DC: National Academy Press.
National Research Council. 2002. Inquiry and the National Science Education
Standards: A Guidefor Teaching and Learning. Washington, DC: National Academy
Press.
Panasan, M., Nuangcharlerrn, P., School, M., & Muang, A. 2010. Learning Outcomes of
Project-Based and Inquiry-Based Learning Activities. Journal ofSocial Sciences, 6(2),
252-255.
Spencer, James N. 1999. New Directions in Teaching Chemistry: A Philosophical and
Pedagogical Basis. Journal ofChemical Education, 76 (4), 566-569.
Windschitl, Mark. 2002. Inquiry Projects in Science Teacher Education: What Can
Investigative Experiences Reveal About Teacher Thinking and Eventual Classroom
Practice? Science Education, 87 (1), 112-143.
94