Millenium Development Goal - MDG
61
Rehovot , Israel , 10-03 feb. 2011 Weitz Center for Development Studies Seminar on Leveraging LocaL Assets for Community and Economic Millenium Development Goals MDG´s Rosane Fontoura- Brazil
-
Upload
independent -
Category
Documents
-
view
6 -
download
0
Transcript of Millenium Development Goal - MDG

Rehovot , Israel , 10-03 feb. 2011
Weitz Center for Development Studies
Seminar on Leveraging LocaL Assets for Community and Economic
Millenium Development Goals MDG´s Rosane Fontoura- Brazil
MDG – around the world
One of Brazil’s Contributions
Creation of the 8 icons for the Millennium
Development Goals, now used in over 70
countries

New York from 20 to 22 September 2010, Reaffirmations
• - continue to be guided by the purposes and
principles of the Charter of the United Nations, with
full respect for international law and its principles
• importance of freedom, peace and security, respect
for all human rights, including the right to
development, the rule of law, gender equality
• and an overall commitment to just and democratic
societies for development

World `s challenges
• Extreme poverty and hunger surpasses 1 billion and
that inequalities between and within countries
remains a significant challenge.
• Malaria affects an estimated 300-500 million people
worldwide each year, resulting in 1.5-2.7 million
deaths yearly, the majority of whom are children.

Challenges
• National ownership and leadership are indispensable in the development process.
• That good governance and the rule of law at the national and international levels are essential for sustained, inclusive and equitable economic growth, sustainable development and the eradication of poverty and hunger
• The diversity of the world and recognize that all cultures and civilizations contribute to the enrichment of humankind

Worlds
• As bandeiras

• Modern science is capable to possible new
answers!
• Never giving up on hope, we found that the
future is in our hands. We leanerd that people
can erich land no less than land can nourish
the people.
• My dream is to see the world as a great kibutz:
free, peaceful and productive. Shimon Peres
Israel Declaration
New York from 20 to
22 September 2010

Brazil´s Declaration New York
•We recognize that progress, including on poverty
eradication, is being made despite setbacks, including
setbacks caused by the financial and economic crisis but
any country s inability to achieve its national goal is also
responsability fof us all. There are many challengers still
ahead of us but Brazil remains commited to promitng the
achievment of all the MDGs and to ensure a fairer world for
all women and all men. We cal al do better!
20 to 22 September 2010
Lula and Dilma Roussef

BRAZIL

Faces of Brazil

States of Brazil
Estados
Objetivo 1 Objetivo 2 Objetivo 3 Objetivo 4 Objetivo 5 Objetivo 6 Objetivo 7
Meta 1 Meta 2 Meta 3 Meta 4 meta 5 meta 6 meta 7 meta 10
1. Paraná 120% 9,3 9,9 0,6 72% 21% 117%
2. Minas Gerais 106% 5,2 11,6 0,8 136% 59% 120%
3. Espírito Santo 102% 7,5 9,7 1,3 73% -21% 103%
4. Rio de Janeiro 100% 6,9 9,0 0,8 79% 28% 69%
5. Goiás 105% 7,0 9,7 1,2 84% -167% 121%
6. Santa Catarina 134% 19,5 5,5 1,1 73% 18% 95%
7. São Paulo 60% 7,6 6,2 0,5 74% 9% 137%
8. Rio Grande do Sul 108% 10,1 9,9 0,6 51% -18% 98%
9. Distrito Federal 50% 3,6 8,4 0,7 71% -97% 146%
10. Paraíba 66% 6,6 16,9 1,3 119% -21% 104%
11. Bahia 68% 5,4 14,8 0,9 98% -26% 117%
12. Mato Grosso do Sul 96% 4,5 10,7 0,7 64% -63% 110%
13. Ceará 70% 4,3 12,7 0,7 108% 66% 118%
14. Tocantins 93% 5,1 5,4 1,0 10% -143% 138%
15. Sergipe 68% 3,9 12,3 1,8 63% 9% 131%
16. Mato Grosso 99% 7,8 3,7 0,6 40% -66% 92%
17. Rio Grande do Norte 78% 6,1 18,8 1,0 92% 9% 142%
18. Amapá 61% 4,7 6,4 1,0 49% -88% 102%
19 Roraima 7% 7,2 15,5 0,4 104% -230% 153%
20. Alagoas 47% 5,2 13,1 0,8 85% -33% 89%
21. Amazonas 42% 7,6 12,5 0,6 86% -4% 87%
22. Maranhão 64% 4,5 11,9 1,3 6% 10% 103%
23. Pernambuco 54% 7,4 18,4 1,1 105% -12% 79%
24. Piauí 70% 6,3 11,3 0,6 38% -214% 84%
25. Acre 64% 4,7 15,9 0,5 79% 74% 56%
26. Pará 67% 4,7 19,6 0,5 54% -1% 35%
27. Rondônia 82% 3,7 14,0 0,8 50% -164% 44%
1991-2008 1999-2008 2008 2008 1994-2008 1996-2008 1990-2007 1991-2008
Muito aquém do necessário para atingir a meta até 2015
Ritmo insuficiente para atingir a meta até 2015
Ritmo suficiente para atingira meta até 2015
Meta atingida
Muito aquém do necessário para atingir a meta até 2015
Ritmo insuficiente para atingir a meta até 2015
Ritmo suficiente para atingira meta até 2015
Meta atingida
Legenda

Curitiba – Paraná - Brazil
Unless the LORD builds the house,
They labor in vain who build it;
Unless the LORD guards the city,
The watchman keeps awake in vain.
Palsm 157
Jerusalem Monument in Curitiba - Brazil


MDG 2 Fundamental School
81,3
86,2
66,5
87,5
75,3
94,4 95,092,3
95,493,6
94,9 95,1 94,3 95,4 94,7
0,0
10,0
20,0
30,0
40,0
50,0
60,0
70,0
80,0
90,0
100,0
Brasil Urbana Rural Branca Preta e parda
1992
2005
2008
Taxa de escolarização líquida, faixa etária de 7 a 14 anos (Fundamental)


MDG 3 Segmentation in the knoweldge area
91,72
90,69
82,27
81,78
74,27
73,76
69,32
63,42
38,58
37,87
18,11
16,95
8,28
9,31
17,73
18,22
25,73
26,24
30,68
36,58
61,42
62,13
81,89
83,05
0% 10% 20% 30% 40% 50% 60% 70% 80% 90% 100%
Serviço social
Pedagogia
Enfermagem
Psicologia, Fisioterapia, Nutrição, Fonoaudiologia
Gestão de pessoal / recursos humanos
Letras
Turismo
Odontologia
Economia
Física, Química, Matemática
Engenharias
Informática, dados, informação
Feminino Masculino
% matrículas por sexo, cursos superiores selecionados - Brasil, 2007
Fonte: INEP MEC. Censo da Educação Superior. Elaborado pelo Ipea.

MDG 3 ..power space
% de mulheres ocupando vagas eletivas no Congresso Nacional
Fonte: Câmara dos Deputados e Senado Federal.
Região Senadoras (%) Deputadas (%)
Centro-Oeste 25,00 7,50
Norte 14,29 20,31
Nordeste 11,11 5,63
Sul 11,11 5,63
Sudeste 0,00 9,30
Brasil 12,35 9,00


Fonte:
CGIAE/DASIS/SVS/MS
* Dado preliminar
Taxa de mortalidade na infância (menos de 5 anos)/mil nascidos vivos.
Brasil, 1990 a 2008* e projeção até 2015
MDG 4 Brazil can achieve the goal before
2015
53,7
22,8
17,9
0,0
10,0
20,0
30,0
40,0
50,0
60,0
1990
1991
1992
1993
1994
1995
1996
1997
1998
1999
2000
2001
2002
2003
2004
2005
2006
2007
2008
*
2009
2010
2011
2012
2013
2014
2015
Ób
ito
s p
or
mil
na
sc
ido
s v
ivo
s
Brasil Projeção Meta
Redução de 58% entre 1990 e 2008

MDG 4- Reducing in all regions of the country
0,0
10,0
20,0
30,0
40,0
50,0
60,0
70,0
80,0
1990
1991
1992
1993
1994
1995
1996
1997
1998
1999
2000
2001
2002
2003
2004
2005
2006
2007
2008
*
2009
2010
2011
2012
2013
2014
2015
Brasil Norte Nordeste Sudeste Sul Centro-Oeste Projeção
Meta = 15,7
Taxa de mortalidade infantil (menores de 1 ano)/mil nascidos vivos
Brasil e regiões, 1990 a 2008 e projeção até 2015
Fonte: CGIAE/DASIS/SVS/MS


75
140
Meta = 35
0
25
50
75
100
125
150
1990 1991 1992 1993 1994 1995 1996 1997 1998 1999 2000 2001 2002 2003 2004 2005 2006 2007 2008 2009 2010 2011 2012 2013 2014 2015
Ób
itos
po
r 1
00
mil
na
scid
os
vivo
s
RMM Projeção Meta
Fonte: CGIAE/DASIS/SVS/MS
Nota: Valores ajustados
Razão de mortalidade materna (por 100 mil nascidos vivos)*.
Brasil, 1990 a 2007 e projeção até 2015
MDG 5 – Maternal Mortality


MDG 6 Reducing Malaria – Amazon, 1990 to 2008
Incidência parasitária anual de malária (casos por mil habitantes). Amazônia Legal brasileira, 1990 a 2008
Fonte: SISMAL/SIVEP-MALÁRIA/SVS/MS
31,9
29,1
18,020,4
22,8
18,7
12,9
24,0
38,0
23,5
30,0
30,1
26,8
32,7
31,4
33,1
15,918,3
25,7
0,0
5,0
10,0
15,0
20,0
25,0
30,0
35,0
1990
1991
1992
1993
1994
1995
1996
1997
1998
1999
2000
2001
2002
2003
2004
2005
2006
2007
2008
Caso
s p
or
mil
hab
itan
tes

MDG 6 AIDS until 2002 – It distributes preventive materials and ensure
acess to antiretroviral drugs to around 220 thousand people
0,0
5,0
10,0
15,0
20,0
25,0
1997 1998 1999 2000 2001 2002 2003 2004 2005 2006 2007 2008
Taxa d
e i
ncid
ên
cia
po
r 100 m
il
hab
itan
tes
0,0
1,0
2,0
3,0
4,0
5,0
6,0
7,0
8,0
Co
efi
cie
nte
de m
ort
ali
dad
e p
or
100 m
il
hab
itan
tes
Incidência Mortalidade
Taxa de incidência e coeficiente de mortalidade por AIDS (por 100 mil hab.) Brasil, 1997 a 2008
Fonte: MS/SVS/Departamento de DST/Aids e Hepatites Virais.

MDG 6 Tuberculose – reducing from 2003
41.2
42.8
44.3 44.443.8
41.5
38.8
38,037.2
32
34
36
38
40
42
44
46
2000 2001 2002 2003 2004 2005 2006 2007 2008
Caso
s n
ovo
s p
or
100 m
il
hab
itan
tes
Taxa de incidência de tuberculose/100 mil habitantes - Brasil, 2000-2008
Fonte: SINAN-TB/SVS/MS

Reducing hanseníase
7,3
5,96,16,2
5,7
6,2
7,5
8,3
7,9
7,36,7 38,0
7,5
8,07,7
0,0
1,0
2,0
3,0
4,0
5,0
6,0
7,0
8,0
9,0
1994 1995 1996 1997 1998 1999 2000 2001 2002 2003 2004 2005 2006 2007 2008Co
efi
cie
nte
de
de
tec
çã
o p
or
10
0 m
il h
ab
ita
nte
s <
15
an
os
Coeficiente de detecção de hanseníase em menores de 15 anos (por 100 mil habitantes). Brasil, 1994 a 2008


Regarding MDG 7 Brazil has reduced deforestation levels in the Amazon and establish a system to monitor the deflorestaion in te cerrado (Brazilian Savana)
Desmatamento da Amazônia Legal Brasileira, 1988-2009, km2/ano
11.030
27.423
7.008
12.911
18.846
14.109
11.532
21.394
29.059
18.161
13.227
21.050
17.770
13.730
13.78617.259
17.38318.226
18.16514.896
14.896
25.247
88* 89 90 91 92 93** 94** 95 96 97 98 99 00 01 02 03 04 05 06 07 08 09***
Fonte: INPE (Instituto de Pesquisas Espaciais)* Média entre 1977 e 1988; ** Media entre 1993 e 1994 *** Taxa Estimada

MDG 7 76% CO2 from desforestion process
Contribuição para as emissões de CO2 por setor - Brasil, 2005 (%)
76%
7%9%5%1%2%
Mudança no uso da terra e florestas
Queima de combustíveis setor
industrial
Queima de combustíveis setor
transporte
Queima de combustíveis outros
setores
Emissões Fugitivas
Processos industriais
Fonte: MCT (2009)

MDG 7 Conservation Units 17,3% of the surface
Unidades de conservação federais e estaduais*, 2002-2009**
903.494948.546
997.025
1.095.021
1.423.082 1.427.4601.497.167 1.523.955
724 746 772814
865 883 912 923
0
200.000
400.000
600.000
800.000
1.000.000
1.200.000
1.400.000
1.600.000
1.800.000
Até 2002 2003 2004 2005 2006 2007 2008 2009
0
200
400
600
800
1000
1200
1400
1600
1800
2000
Área acumulada (Km²)
N° acumulado de UC
Fonte: DAP/SBF/Ministério do Meio Ambiente. * Estimada baseada em informações de órgãos estaduais
** Não inclui RPPN (Reserva Particular do Patrimônio Natural)

MDG 7 91,6% of the population acess to safe drinking water
in urban areas of the population
% da população com acesso à água canalizada interna de
rede geral, segundo situação censitária - Brasil - 1992,
1995, 1999, 2003, 2006 e 2008
82,3 84,588,5 88,8 90,9 91,6
9,1 11,5
18,8 19,623,1
27,4
0,0
10,0
20,0
30,0
40,0
50,0
60,0
70,0
80,0
90,0
100,0
1992 1995 1999 2003 2006 2008
urbana rural*
Fonte: IPEA, base PNAD IBGE 1992-2008* exclusive a população rural de RO, AC, AM. RR,
PA e AP, que passou a fazer parte da amostra da PNAD a partir de 2004


MDG 8 – Stabilish a Global partnership for development
Brazil is increasingly contributing to the global partnership for for development, sharing successful experiences and deepening cpooperation , though a South – South perpesctive (Senai in Angola, Timor Leste, Paraguai, Cabo Verde e Guiné-Bissau, Haiti, Guatemala, Bolívia, Jamaica e Moçambique São Tomé e Príncipe).
Between 2003 a 2009, the Brazilian government conclued over 400 cooperation agreements with others developing countries

National Movement Citizenship and Solidaridaty
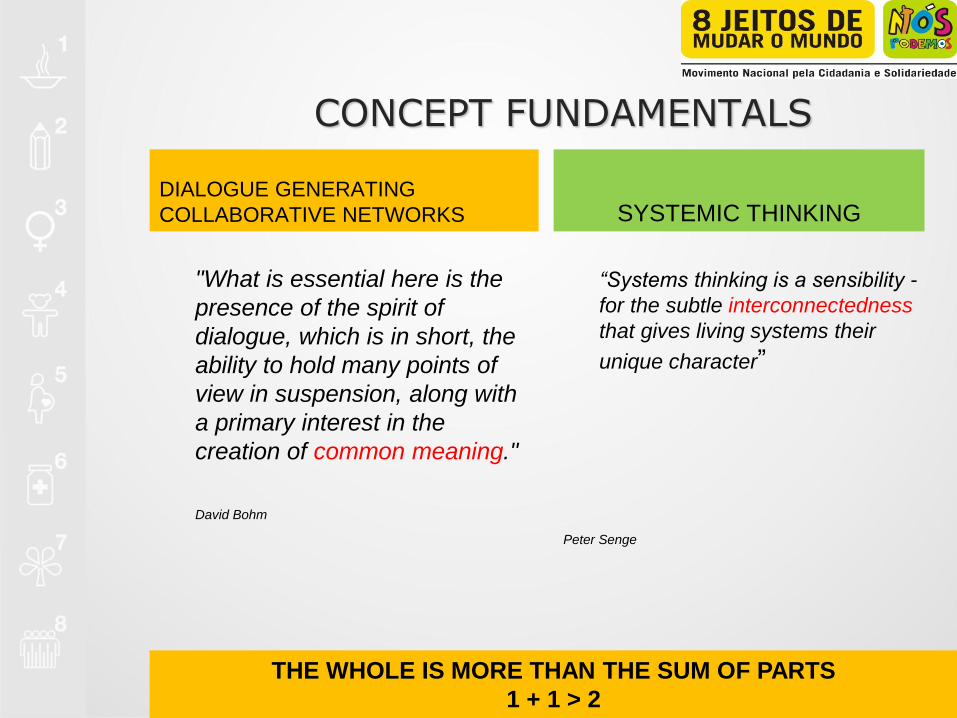
CONCEPT FUNDAMENTALS
DIALOGUE GENERATING
COLLABORATIVE NETWORKS
"What is essential here is the
presence of the spirit of
dialogue, which is in short, the
ability to hold many points of
view in suspension, along with
a primary interest in the
creation of common meaning."
David Bohm
SYSTEMIC THINKING
“Systems thinking is a sensibility -
for the subtle interconnectedness
that gives living systems their
unique character”
Peter Senge
THE WHOLE IS MORE THAN THE SUM OF PARTS
1 + 1 > 2


MDG
Target
2011
2015
A systemic constellation for change

METHODOLOGY
WORK CIRCLES
Establishment of partnerships
between the various social actors, to
ensure and facilitate implementation,
and to monitor results
KNOWLEDGE CIRCLES Group gathering people various skills
and competences, to identify and
analyze opportunities, and develop local
capacity to implement projects.
DIALOGUE CIRCLES
Dialogues to define in a participative way
what wil be the main priority projects for
each community, and to draw the action
plans to implement them.

Synthesis of the process
A platform of CATALYZING EFFORTS
Testimony
“I participated in the Dialogue Circle and understood we could better contribute by taking the idea to the entire company, to all the collaborators; and excellent ideas have emerged for cultural change, destined for the preservation of the planet. Even the company’s catalogs began to indicate responsible actions”.
Business owner participating in the MNPP.

CREATION OF THE WE CAN PARANÁ MOVEMENT
MOBILIZE social players in voluntary actions
DISSEMINATE structured information
PROMOTE development actions in every city of Paraná.

DEVINFO
• DevInfo is a powerful database system
for organizing, storing and presenting data in a
uniform way to facilitate data sharing across
government departments
• MDGs for all 5,565 Brazilian municipalities and a
very

Using DevInfo
• Comprehensive Data Display and Dissemination
• Policy makers, non-governmental organizations (NGOs),
nonprofits, the private sector, and the general public all rely on
accurate data.
• Data management, including powerful display tools, plays a
key role in how that data is interpreted and is crucial in
developing a strong civil society.
• For instance, specific indicators such as those of the
Millennium Development Goals (MDGs) may tell a number of
different narratives when seen at the national, sub-national,
and local level.
Testimony:
“ORBIS and the We Can Paraná Movement: a
perfect marriage for this work geared towards
achieving the Millennium Goals by 2010.”

First, it was important to aligning the MDGs with public policy in
the state For that, it was useful that we connected the local circles to a National platform
and the unified social agenda
We also engaged civil society and private sector, showing them that
achievement of development goals is also their responsibility
We made na effort to work both with the “top” (leaders from all social sectors)
and the “bottom” (communities and beneficiaries)
We combined action – monitoring and dissemination, wich reinforced each
other.
Second, sensitization of State / Municipal authorities (Executive
and Parliament) We develop a permanent mobilization process to
Include the MDGs in the public agenda for that, and here we get the third key
element...
Third, community pressure for action was key, that is why awareness
raising and monitoring were so important
KEY SUCESS ELEMENTS, we learned many lessons during our program;

Fourth - localization, alignment, zeal, care
• Our methodology was able to create a common dialogue platform, with
clear process and goals, that involved all volunteers in the actions needed
• It was important to constantly show commitment to results and give the
appropriete incentives, through awards and public recognition
• We relied on voluntary mobilization, believing that people do more when
they have the right motivation, when they care about results
• Our process incentived joint, participatory work, to coordinate and articulate
the actions towards the same goals.
• It was key to be able to provide technical support and capacity
development for partners that wanted to contribute: we needed to
overcome the barrier of wanting to do something but not knowing what or
how.
Finally, the key lesson is that we need to motivate participation and
add quality to the decision and implementation processes
Other KEY SUCESS ELEMENT, we learned many lessons during our program;

TESTIMONIES:
“We began to include awareness about the MDG in the adaptation process for each new collaborator.” Business Owner participating at the MNPP
“I became very sensitized with the MDG, due to the scope they represent in
their entirety and the possibility I have to participate in the solution; be able to participate in an action structured in goals and indicators, which is a global
concern, highly mobilizing; know that my action, regardless how small, contributes towards improving the quality of life is very gratifying.”
Volunteer at MNPP
“Participating in the Movement, I learned to write projects; capture funds and obtain technical support, which made it possible to act successfully, with results, improving life in my community." Volunteer at MNPP

PARANÁ STATE
• Between 1991 and 2004 the percentage of the “paranaenses”
below the poverty line dropped from 40% to 19,9% of
population.
• In 13 years, between 1990 and 2003, Paraná reduced almost to
half the rate of mortality in children under 5 years of age
passing from 39 to 20 the number of deaths for each thousand
children born alive (achievement of 74% if the established
goal)
• During the same period there was a 61% drop in the rate of
maternal mortality.
• People without access to canalized water in at least one room
dropped from 34% to 16% between 1990 and 2004

•Between 1991 and 2004 the percentage of the “paranaenses” below the poverty line
dropped from 40% to 19,9% of population.


ESTABLISH BASELINES AND DISSEMINATE the situation of the
Millennium Development Goals in Paraná.
Encourage the voluntary commitment of people and institutions to
reach the MDGs .
Create spaces for dialogue and for prototyping new projects and
initiatives, consolidating a PARANÁ NETWORK for the MDGs.
Encourage the IMPLEMENTATION OF PROJECTS, PROGRAMS
AND INITIATIVES to achieve the MDGs in the State.
Monitor the Millennium Indicators to CHECK PROGRESS.
Encourage the organization of COMMUNITIES OF PRACTICE aimed
at sharing information and multiplying successful efforts.
OBJECTIVES OF “YES WE CAN PARANÁ”

DIALOGUE CIRCLES
APPRECIATIVE INVESTIGATION
Constructivist methodology, which brings to
light the collective imagination of the
dreamed future, planning and putting
shared actions into action.
Testimony:
“I participated in the Dialogue Circle and understood we could better contribute by taking the idea to the entire company, to all the collaborators; and excellent ideas have
emerged for cultural change, destined for the preservation of the planet. Even the company’s catalogs began to indicate responsible actions.”
Business owner participating in the MNPP.
In 2010 352 Dialogue Circles and more than 35 thousand participants.


PROJECTS IN 2011
You can help Brazil to
achieve the Millenium Goal!
Ask me how?

Project: “We can” work together
Cooperatives Leardership: Woman and Youth population
Family Agricultural and Biodiversity Conservations Handcraft
•change lives and make significant contributions toward human development on the ground.


Thank you for your attention!
Rosane Fontoura Federation of Industries of the State of Paraná - Brazil
55 41 3271-7708
www.nospodemos.org.br
www.nospodemosparana.org.br
www.portalodm.org.br
www.orbis.org.br
Rocha Loures - National Secretary of the Movement
Maria Aparecida Zago Udenal -Coordinator of the MNPP