Migration to cities in Burkina Faso: Does the level of development in sending areas matter?
24
Migration to Cities in Burkina Faso: Does the Level of Development in Sending Areas Matter? CRIS BEAUCHEMIN Institut National des Etudes De ´ mographiques, Paris, France and BRUNO SCHOUMAKER * Universite ´ Catholique de Louvain, Louvain-la-Neuve, Belgium Summary. — The growth of large cities in the developing world is a major concern and many devel- oping countries have developed policies to reduce migration to cities. These policies usually rely on the assumption that improving the quality of life in rural areas and secondary towns will reduce out-migration to cities. While this may at first glance seem a reasonable assumption, very few empirical studies support this view. Using recent longitudinal individual and community-level data on migration and local development, this paper provides new empirical evidence on this question in Burkina Faso. Overall, our results show that, contrary to policy expectations, most components of rural development either have no effect on migration or rather tend to encourage migration to cit- ies. Ó 2005 Elsevier Ltd. All rights reserved. Key words — Sub-Saharan Africa, Burkina Faso, urbanization, rural out-migration, secondary towns, population policy, local development 1. INTRODUCTION The growth of large cities in the developing world is a major concern and many developing countries have designed policies to reduce migration to cities (United Nations, 1998). These policies usually target two kinds of places: rural areas and secondary towns (i.e., all urban centers, except cities). In both cases, they rely on the assumption that improving the quality of life and the economic conditions in sending areas will reduce out-migration to cities. While this may at first glance seem a rea- sonable assumption, few empirical studies sup- port this view. In fact, studies on the impact of rural development policies on city-ward migra- tion show that the effects on migration are mixed or, more often, that the availability of public amenities or economic opportunities tends to encourage migration. Moreover, very few analyses have been undertaken on the effect of migration policies aimed at developing secondary urban centers. Overall, empirical studies are often hampered by the lack of appropriate data. The objective of this paper is to establish new empirical evidence on the effects of local devel- opment policies implemented both in rural areas and in secondary towns in order to reduce * Most of this research was done when the authors were post-doctoral fellows at the Department of Demography of the University of Montreal. This has been supported by the Canadian International Development Agency, the Andrew Mellon foundation, and the Agence Universi- taire de la Francophonie. We are grateful to the Unite ´ d’Enseignement et de Recherche en De ´mographie (Burk- ina Faso), the Universite ´ de Montre ´al (Canada), and the Programme Majeur en Population et De ´veloppement (Mali) for granting us access to the demographic and community data. We thank Victor Piche ´ and three an- onymous reviewers for their comments and suggestions. Final revision accepted: March 4, 2005. World Development Vol. xx, No. x, pp. xxx–xxx, 2005 Ó 2005 Elsevier Ltd. All rights reserved Printed in Great Britain 0305-750X/$ - see front matter doi:10.1016/j.worlddev.2005.04.007 www.elsevier.com/locate/worlddev 1 ARTICLE IN PRESS
Transcript of Migration to cities in Burkina Faso: Does the level of development in sending areas matter?

World Development Vol. xx, No. x, pp. xxx–xxx, 2005� 2005 Elsevier Ltd. All rights reserved
Printed in Great Britain
ARTICLE IN PRESS
0305-750X/$ - see front matterdoi:10.1016/j.worlddev.2005.04.007
www.elsevier.com/locate/worlddev
Migration to Cities in Burkina Faso: Does the Level
of Development in Sending Areas Matter?
CRIS BEAUCHEMINInstitut National des Etudes Demographiques, Paris, France
and
BRUNO SCHOUMAKER *
Universite Catholique de Louvain, Louvain-la-Neuve, Belgium
Summary.— The growth of large cities in the developing world is a major concern and many devel-oping countries have developed policies to reduce migration to cities. These policies usually rely onthe assumption that improving the quality of life in rural areas and secondary towns will reduceout-migration to cities. While this may at first glance seem a reasonable assumption, very fewempirical studies support this view. Using recent longitudinal individual and community-level dataon migration and local development, this paper provides new empirical evidence on this question inBurkina Faso. Overall, our results show that, contrary to policy expectations, most components ofrural development either have no effect on migration or rather tend to encourage migration to cit-ies.
� 2005 Elsevier Ltd. All rights reserved.Key words — Sub-Saharan Africa, Burkina Faso, urbanization, rural out-migration, secondary
towns, population policy, local development
* Most of this research was done when the authors were
post-doctoral fellows at the Department of Demography
of the University of Montreal. This has been supported
by the Canadian International Development Agency, the
Andrew Mellon foundation, and the Agence Universi-
taire de la Francophonie. We are grateful to the Unite
d’Enseignement et de Recherche en Demographie (Burk-
ina Faso), the Universite de Montreal (Canada), and the
Programme Majeur en Population et Developpement
(Mali) for granting us access to the demographic and
community data. We thank Victor Piche and three an-
onymous reviewers for their comments and suggestions.
Final revision accepted: March 4, 2005.
1. INTRODUCTION
The growth of large cities in the developingworld is a major concern and many developingcountries have designed policies to reducemigration to cities (United Nations, 1998).These policies usually target two kinds ofplaces: rural areas and secondary towns (i.e.,all urban centers, except cities). In both cases,they rely on the assumption that improvingthe quality of life and the economic conditionsin sending areas will reduce out-migration tocities. While this may at first glance seem a rea-sonable assumption, few empirical studies sup-port this view. In fact, studies on the impact ofrural development policies on city-ward migra-tion show that the effects on migration aremixed or, more often, that the availability ofpublic amenities or economic opportunitiestends to encourage migration. Moreover, veryfew analyses have been undertaken on the effectof migration policies aimed at developing
1
secondary urban centers. Overall, empiricalstudies are often hampered by the lack ofappropriate data.The objective of this paper is to establish new
empirical evidence on the effects of local devel-opment policies implemented both in ruralareas and in secondary towns in order to reduce
2 WORLD DEVELOPMENT
ARTICLE IN PRESS
migration to cities. Local development is heredefined in terms of availability of public facili-ties, infrastructure, income-generating activi-ties, and commercial services. The main issueis whether a higher level of development insending areas tends to decrease migration toBurkina Faso’s two cities: Ouagadougou andBobo Dioulasso. By combining a retrospectivecommunity survey with a retrospective individ-ual survey comprising 9,000 life histories, weare able to (1) compare trends in migrationand trends in local development and (2) testthe effect of the presence of various kinds ofamenities or economic opportunities in a villageor town—and thus of the level of develop-ment—on the probability that an individualwill migrate to a city.Following this introduction, Section 2 of the
paper consists of a review of the literature pre-senting the policy strategies aimed at reducingmigration flows toward cities, as well as theirknown effects in Burkina Faso and in other re-gions of the developing world. Section 3 pre-sents the data sources and the method used totest our hypotheses. The expected effects ofthe explanatory variables are also presented inthat section. Results are reported and discussedin Section 4 and Section 5 provides a conclu-sion.
2. REDUCING MIGRATION TO CITIES:AN OVERVIEW OF POLICIES AND
THEIR IMPACT
(a) Why migration to cities is a subject ofpolicy concern
The rapid growth of cities in developingcountries is sometimes presented as the mostsignificant of all postwar demographic phe-nomena (Todaro, 1997). It is the subject of agrowing policy concern in the vast majority ofless developed countries, especially in Africa 1
(United Nations, 2004). With approximatelyone-third of its population living in urbanareas, the level of urbanization in Sub-SaharanAfrica is low in comparison with other regions.Nonetheless, countries of this region have expe-rienced high rates of urban growth over the lastdecades: the subcontinent’s urban populationhas increased more than threefold since 1975at an annual rate close to 5% (United Nations,2002). Huge growth rates have been observedin some cities, especially in the 1960s and1970s (Todaro, 1997). Burkina Faso provides
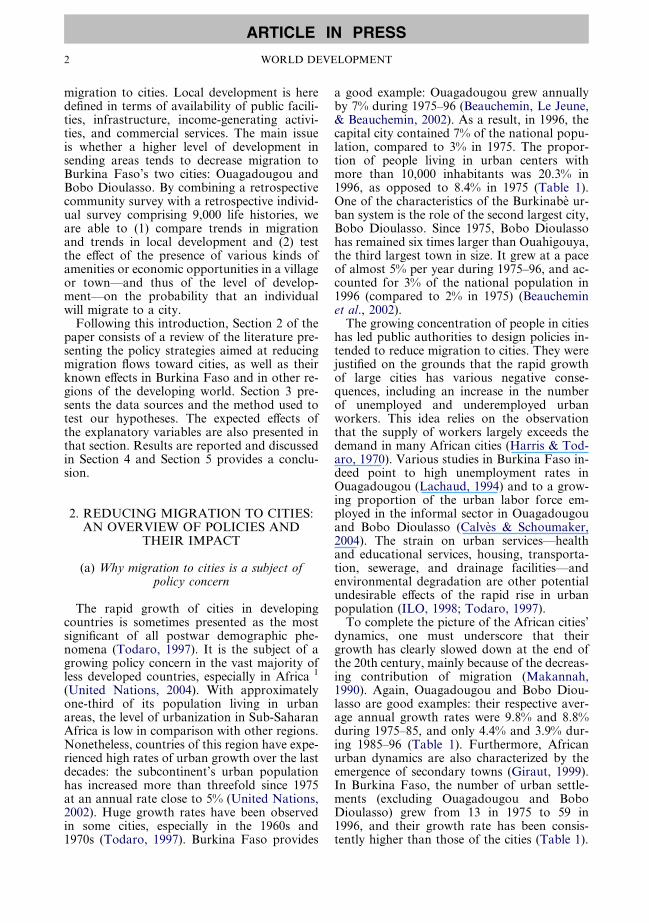
a good example: Ouagadougou grew annuallyby 7% during 1975–96 (Beauchemin, Le Jeune,& Beauchemin, 2002). As a result, in 1996, thecapital city contained 7% of the national popu-lation, compared to 3% in 1975. The propor-tion of people living in urban centers withmore than 10,000 inhabitants was 20.3% in1996, as opposed to 8.4% in 1975 (Table 1).One of the characteristics of the Burkinabe ur-ban system is the role of the second largest city,Bobo Dioulasso. Since 1975, Bobo Dioulassohas remained six times larger than Ouahigouya,the third largest town in size. It grew at a paceof almost 5% per year during 1975–96, and ac-counted for 3% of the national population in1996 (compared to 2% in 1975) (Beaucheminet al., 2002).The growing concentration of people in cities
has led public authorities to design policies in-tended to reduce migration to cities. They werejustified on the grounds that the rapid growthof large cities has various negative conse-quences, including an increase in the numberof unemployed and underemployed urbanworkers. This idea relies on the observationthat the supply of workers largely exceeds thedemand in many African cities (Harris & Tod-aro, 1970). Various studies in Burkina Faso in-deed point to high unemployment rates inOuagadougou (Lachaud, 1994) and to a grow-ing proportion of the urban labor force em-ployed in the informal sector in Ouagadougouand Bobo Dioulasso (Calves & Schoumaker,2004). The strain on urban services—healthand educational services, housing, transporta-tion, sewerage, and drainage facilities—andenvironmental degradation are other potentialundesirable effects of the rapid rise in urbanpopulation (ILO, 1998; Todaro, 1997).To complete the picture of the African cities’
dynamics, one must underscore that theirgrowth has clearly slowed down at the end ofthe 20th century, mainly because of the decreas-ing contribution of migration (Makannah,1990). Again, Ouagadougou and Bobo Diou-lasso are good examples: their respective aver-age annual growth rates were 9.8% and 8.8%during 1975–85, and only 4.4% and 3.9% dur-ing 1985–96 (Table 1). Furthermore, Africanurban dynamics are also characterized by theemergence of secondary towns (Giraut, 1999).In Burkina Faso, the number of urban settle-ments (excluding Ouagadougou and BoboDioulasso) grew from 13 in 1975 to 59 in1996, and their growth rate has been consis-tently higher than those of the cities (Table 1).

Table 1. Evolution of the urban population and of the number of towns in Burkina Faso during 1975–96
1975 1985 1996 Annual growth rates
1975–85 (%) 1985–96 (%) 1975–96 (%)
Ouagadougou 172,661 441,514 709,736 9.8 4.4 7.0
Bobo Dioulasso 115,063 228,668 309,771 7.1 2.8 4.8
Other urban centers 184,791 508,875 1,079,600 10.7 7.1 8.8
Total urban 472,515 1,179,057 2,099,107 9.6 5.4 7.4
Total Burkina Faso 5,638,203 7,964,705 10,312,609 3.5 2.4 2.9
Percent urban 8.4 14.8 20.3 – – –
Percent of urban in cities 60.9 56.8 48.6 – – –
Number of towns 13 31 59 – – –
Source: Beauchemin et al. (2002), using census data.
MIGRATION TO CITIES IN BURKINA FASO 3
ARTICLE IN PRESS
The impact of the cities’ growth on the urbaneconomy in Africa also needs to be re-examinedin light of recent research, especially pertainingto the role of migrants. For instance, contraryto conventional wisdom, analyses of longitudi-nal surveys in the 1990s have shown that mi-grants integrate quite well into the urbaneconomy of large cities in Francophone WestAfrica (Antoine, Ouedraogo, & Piche, 1998).One should keep in mind that migration wasthe source of only 25% of urban growth inSub-Saharan Africa in the 1980s (Chen, Va-lente, & Zlotnik, 1998). Therefore, in compari-son to urban natural growth, the specific role ofmigration in all the negative impacts of urbangrowth is probably not predominant. Finally,several authors also point out that rural–urbanmigration may have positive effects on the wel-fare of the migrants, on the country’s GDP,and on rural populations as well (Becker, Ha-mer, & Morrison, 1994; ILO, 1998; Lucas,1997; Njoh, 2003; Stark, 1991).In spite of the falling growth rates of large
cities and the evolution of academic thoughton the links between city-ward migration anddevelopment, most developing countries—including Burkina Faso—still consider it neces-sary to implement measures to reduce or evento reverse rural–urban migration, with theaim of controlling the growth of the prime cityor other large metropolitan areas (United Na-tions, 2004). Several strategies have been usedto stem migration to large cities. A common ap-proach—the ‘‘rural development strategy’’—consists in trying to decrease migration flowsto cities by inducing potential migrants to stayin rural areas (Becker et al., 1994; Findley,1977). A second strategy—the ‘‘urban dispersalstrategy’’—aims to redirect migration flowsaway from large cities to smaller secondary
towns (Becker et al., 1994; Oberai, 1989). Thesetwo approaches are discussed below.
(b) Rural development as a tool to reducemigration to the cities
The rural development strategy focuses onboth farm and off-farm employment genera-tion, infrastructure development (electricity,water, roads, etc.), access to credit for smallfarmers, delivery of health-care services, educa-tional improvement, land reform, etc. Themotivation for such interventions is thatimproving the quality of life and increasing in-comes in rural areas should reduce the propen-sity for out-migration (Rhoda, 1983). This is anindirect strategy, in that rural development usu-ally does not seek population retention aloneand is more generally directed toward improv-ing rural welfare. Rural development programsare nevertheless often justified on the groundsthat they will reduce rural–urban migration(Ezra, 2001; Rhoda, 1983). For example, theProgram of Action of the 1994 InternationalConference on Population and Developmentencourages, among other things, the develop-ment of rural infrastructure, social services, ac-cess to water resources, and access to landownership to ‘‘create alternatives to out-migra-tion from rural areas’’ (United Nations, 1995,p. 63).In Burkina Faso, various policy actions and
prescriptions have gone in the same directionsince the early 1960s. Since Independence in1960, public investments in rural areas haveaimed indirectly at reducing rural out-migra-tion. It was one of the goals of the Voltaicdevelopment policy in the 1960s through, forinstance, the creation of the Regional Officesfor Rural Development (ORD). Their objec-

4 WORLD DEVELOPMENT
ARTICLE IN PRESS
tives were, among others, to increase services tothe population, to encourage the moderniza-tion and commercialization of agriculture, andto reinforce the rural craft sector (Gregory,1974). Over the last decades, several ruraldevelopment programs have been designedwith similar objectives: the National Programagainst Desertification (1986) is responsiblefor the installation of various amenities; theProgram for the Improvement of Living Condi-tions (PC-ACV, 1991) includes measures tospread boreholes, schools, and health centers;and the National Environmental Action Plansuggests that infrastructure should be devel-oped in rural areas to retain potential rural–urban migrants (Burkina Faso, 1994). BurkinaFaso’s Poverty Reduction Strategy also in-tends, among others things, to develop ruralroads to create temporary jobs and open uprural areas in order to reduce rural out-migra-tion (Burkina Faso, 2000). Finally, curbing rur-al–urban migration is an explicit goal of theBurkinabe population policy which recom-mends the development of income-generatingactivities and the improvement of living condi-tions in rural areas (Burkina Faso, 2001).In summary, policy makers often seem to be-
lieve that improving living conditions anddiversifying economic opportunities in ruralareas will stem migration to cities. While thismay seem intuitively obvious, the impact ofrural development programs on rural–urbanmigration cannot be taken for granted, andthe question has, in fact, generated much dis-cussion. For example, Todaro (1997) and Lip-ton (1988), in line with the common policypoint of view, claim that rural developmentprograms are an essential solution to impedeexcessive rural–urban migration. Several ana-lysts believe, on the other hand, that such pro-grams have not been successful in stemmingmigration (Adepoju, 1983; Becker et al., 1994;Campbell, 1988; Lucas, 1997; Rhoda, 1983;Rondinelli, 1994). For instance, the authors ofa review on this issue in developing countriesconcluded that
rural development activities that increase access tocities, commercialize agriculture, strengthen rural–urban integration, raise education and skill levels[. . .] appear to lead to accelerated rates of rural–urban migration (ILO, 1998, p. 344).
In a review centered on Africa, Grosse (1986)found no clear and systematic relationship be-tween the level of rural development and therate of rural-to-urban migration. Finally, even
though there is no assesment of the effects onmigration of recent policies and programs inBurkina Faso, Cordell Dennis, Gregory Joel,and Piche (1996) assert that, in the 1960s and1970s,‘‘rural development policies did little toconvince Burkinabe men to remain in their vil-lages. . .’’ All in all, there appears to be a con-tradiction between the widespread belief thatrural development is a sensible strategy to re-duce rural–urban migration and the lack ofconvincing empirical results (United Nations,2004). Stark (1991) explains this paradox byan ambivalence of governments’ interventionistposition: governments, according to him, donot really want to contain migration becausetheir actions are influenced by profitearners,whose interest is to maintain low wages, andthus to sustain migration to cities.
(c) The urban dispersal strategy
The urban dispersal strategy, also called ‘‘dif-fuse urbanization policy’’ (De Jong & Harbison,1981), has long been widely used in developingcountries to curb migration to large cities (Uni-ted Nations, 2004). Essentially, the urban dis-persal strategy aims to increase economicopportunities and to improve living conditionsin secondary towns in order to persuade ruralmigrants to modify their choice of destination(to these towns rather than to large cities) andto induce potential migrants to stay in towns(Adepoju, 1983; Becker et al., 1994). This strat-egy relies primarily on measures to expandemployment in preferred locations, such aspublic investment in infrastructure and stateindustries, assistance to local governments toupgrade services and amenities, incentives toencourage private investments, employmentdecentralization strategies, etc. (Nelson, 1983).What is the effectiveness of such policies?
Overall, for developing nations, there has beenremarkably little attempt to assess their impact.Nelson (1983) and Oberai (1989) reviewed someof the experiences in both developed and devel-oping countries. In short, the urban dispersalstrategy seems to have worked in countries suchas Japan, Cuba, Poland, and South Korea, butfailed in a number of other countries such asTanzania and Colombia. One drawback of thisstrategy is that it necessitates large publicinvestments, which may in the end prove coun-terproductive in regard to the migratory objec-tive: there is indeed a risk that the secondarytowns ‘‘will serve as just so many more ‘‘steps’’in the step-wise migration process to the primate

MIGRATION TO CITIES IN BURKINA FASO 5
ARTICLE IN PRESS
city’’ (Becker et al., 1994, p. 123). Yet, thedevelopment of secondary towns often remainsan essential element of public policies in devel-oping countries, maybe because it serves notonly migration goals, but also other objectivessuch as narrowing inter-regional inequalities(Nelson, 1983).Urban dispersal strategy is also part of the
measures taken in Burkina Faso to reduce thegrowth of Ouagadougou and Bobo Dioulasso.For example, the Burkinabe population policystates that investments by the private sector insecondary towns should be encouraged to con-tribute to a better spatial distribution of thepopulation (Burkina Faso, 2001). Of particularinterest in this regard is the policy of promotionof secondary towns that emerged in the late1980s (Bolay, 2000), in line with the recommen-dations of the 1985 conference of the UnitedNations center for Human Settlements(UNCHS-Habitat). The Secondary TownsDevelopment Program aimed to reinforce thedevelopment of these towns by improvinginfrastructure (roads, markets, etc.) and hous-ing, and by helping to develop small- andmedium-sized firms. The program was designedas an integrated effort to develop secondarytowns, which was supposed to be more efficientthan the dispersed investments which had pre-vailed until then and had had little impact(Ganne, Ouedraogo, Ouattara, Ilboudo, &Compaore, 1988). Sectoral programs (electrifi-cation, 1984; water conveyance, 1985) were alsointended to reinforce secondary towns. Fur-thermore, the decentralization of some govern-ment activities from Ouagadougou tosecondary towns (1987–88) aimed to create jobsand to improve the quality of public services inthese towns. However, the impact of the devel-opment of secondary towns on migration inBurkina Faso is still unexplored.
3. METHOD AND DATA:A LONGITUDINAL APPROACH USING
MULTILEVEL DATA
For many years, the assessment of the effec-tiveness of migration policies has mainly reliedon macro, and often inappropriate, data. Sinceaggregate migration rates are rarely available,the global growth rates (without distinction be-tween migration and natural increase) of citiesand medium-size towns are commonly takenas the main indicator to judge the success orthe failure of the policies implemented (Nelson,
1983). However, the recent development oflongitudinal data sources, both at the individ-ual level (migration histories) and at thecommunity-level (village and town histories),allows us to perform more refined analyses(Bilsborrow, Delargy, & UNFPA, 1985).According to this approach, the key to theassessment is no longer the pace of urbangrowth but rather the relationship betweenthe level of local development and individualmigration behavior. Unique data are availablein Burkina Faso to search for causal relation-ships between the level of local developmentand migration. In line with the two primarystrategies of migration policies (rural develop-ment and urban dispersal strategies), the aimof this paper is to test the two followinghypotheses:
—a higher level of local development in vil-lages, defined in terms of availability of pub-lic amenities (infrastructure, services, etc.)and economic opportunities, tends to determigration to the largest urban centers;—a higher level of socioeconomic develop-ment in secondary towns keeps people frommoving to Ouagadougou and BoboDioulasso.
(a) Data source
This study uses data from two sources: Theindividual life history data come from theMigration Dynamics, Urban Integration andEnvironment Survey of Burkina Faso (EMIUB).It is a nationally representative survey, con-ducted in 2000 by the Demography Unit atthe University of Ouagadougou (UERD), theDemography Department of the University ofMontreal, and the CERPOD (Poirier, Dabire,Le Jeune, Piche, & Wane, 2001). The sampleis a two-stage stratified probability sample.Sampling fractions differed across the eightstrata and sampling weights were thus used inthe analyses. The full sample comprises 4,258households and almost 9,000 individuals (menand women) aged between 15 and 64 at the timeof the survey. 2 The questionnaire covered sev-eral topics such as migration, employment,marital, and birth histories. For each sampledindividual, a complete migration history fromthe age of 6 was collected (for more details,see Poirier et al., 2001).The community-level data come from a ret-
rospective community survey conducted inearly 2002 (Schoumaker, Dabire, & Gnou-mou-Thiombiano, 2004). The survey was de-

6 WORLD DEVELOPMENT
ARTICLE IN PRESS
signed to be linked with the individual migra-tion survey. In order to study the influence ofcommunity variables on migration, the idealoption would have been to collect data in allthe villages and towns cited in the migrationhistories collected in 2000. This was not possi-ble for financial and logistic reasons, and itwas decided to select only the communities thatwere cited at least three times in all the migra-tion histories. As a result, the sample comprises600 communities out of a total of 1,700 villagesand towns reported in all the migration histo-ries (out of approximatively 8,000 in the wholecountry). These selected places are all the settle-ments in which survey respondents lived at thetime of the survey and also a large sample ofvillages and towns in which they had lived inthe past. Retrospective data were collectedfrom groups of community informants, consist-ing of ‘‘delegues de village’’ (administrative rep-resentatives), village chiefs, and otherknowledgeable informants. The survey covereda broad range of topics including land avail-ability, transportation, health centers, schools,employment opportunities, and agriculturalmechanization. Efforts were made to obtain ret-rospective information since 1960 for most vil-lage characteristics. Respondents were asked torecall, for instance, the years when the schoolsopened or the year after which uncleared landwas no longer available.As mentioned above, community-level data
were only collected for a sample of settlements.There are no missing data for towns, that isplaces with more than 10,000 residents, butcommunity-level variables are missing for 17%of the spells of residence in rural areas amongthe 5,630 individuals in the rural dataset (11%of the 280,000 person-periods). Random hot-deck imputation supplied the missing valuesat the village level. The imputation is basedon two classification variables: the province(45 provinces) in which the village is locatedand the size of the settlement (less than 5,000or between 5,000 and 10,000 inhabitants).Adjustment cells were formed by combiningthese two variables, and the missing values fora village were replaced by the values from arandomly selected village in the same cell, thatis, a village of the same size located in the sameprovince.
(b) Datasets and statistical model
The data were analyzed with discrete-timeevent history models, using person-period data-
sets. They have been organized into two sets:one for each hypothesis. In both cases, thedatasets are designed to test whether the avail-ability of public amenities or economic oppor-tunities at the place of origin is a determinantof migration to cities. Migration is defined hereas a change of residence involving a departurefrom rural areas (hypothesis #1) or from sec-ondary-towns (hypothesis #2) to Ouagadougouor Bobo Dioulasso for a duration of at least 2years. 3 At any time, towns are defined as settle-ments above 10,000 inhabitants. Thus, overtime, villages become towns as soon as theirpopulation crosses the 10,000 threshold. Bothdatasets cover the 1980–97 period. Previousyears are not included in the explanatory anal-yses because the level of development was verylow and unchanging before 1980 (see Section4(a)). Males and females have been pooled inthe same datasets, preliminary analyses havingshown that effects are fairly similar for bothsexes (the few nuances between males and fe-males will be indicated in the text, althoughseparate results are not shown for the sake ofparsimony). 4 The datasets include people aged6 and over; however, individuals entering intothe riskset in 1980 may be more than 6 yearsold at the time of entry. This is a situation oflate entry into the riskset that is easily handledin discrete-time event history models (Allison,1995). For the purpose of model estimation,the datasets are organized as person-period filesin which each line represents a three-monthperiod. In each dataset, the dependent variableindicates whether a migration occurs duringeach three-month interval. Table 2 providessome details about the two datasets (contents,sources of censoring, sample size).Both datasets are used to estimate discrete-
time event history models through binary logis-tic regression (Allison, 1995). The statisticalmodel is specified as follows:
logpti
1� pti
� �¼ at þ b0 � X ti;
where pti is the conditional probability thatindividual i experiences the event (migration)at duration t, given that the event has not al-ready occurred. at represents the baseline haz-ard function, modeled by a function of theduration of stay in the current place of resi-dence and of its logarithm. This clock is resetto zero each time an individual moves to an-other place. Xti is a vector of individual andcontextual covariates. All models take into ac-

Table 2. Regression parameters
Models 1a and 1b Models 2a and 2b
Event studied Migration from a villagea to a city
(Ouagadougou or Bobo-Dioulasso)
for at least 2 years
Migration from a secondary towna to
a city (Ouagadougou or Bobo-Dioulasso)
for at least 2 years
Population Males and females, aged 6 and over,
living in a village
Males and females, aged 6 and over,
living in a secondary town
Left
truncation
Each individual enters the riskset:
—in 1980 if he/she is living in a village
and if he/she is at least 6 years old
(start of the analysis period)
—when he/she reaches the age of 6 if
he/she is already living in a village at that time
—each time he/she arrives in a
village after the age of 6
Each individual enters the riskset:
—in 1980 if he/she is living in a
secondary town and if he/she is at
least 6 years old (start of the
analysis period)
—when he/she reaches the age of
6 if he/she is already living in a
secondary town at that time
—each time he/she arrives in a
secondary town after the age of 6
Right
censoring
Each individual leaves the riskset:
—when he/she migrates to a city
(event under study)
—when his/her village becomes a town
(settlement reclassified when the number
of inhabitants exceeds 10,000)
—when he/she migrates to a foreign
country or a secondary town
—in 1997 (end of the analysis period)
Each individual leaves the riskset:
—when he/she migrates to a city
(event under study);
—when he/she migrates to a foreign
country or a village
—in 1997 (end of the analysis period)
Sample size 5,630 individuals (2,568 men and 3,062 women)
282,986 person-periods
1,820 individuals (867 men and 953 women)
63,695 person-periods
a At any time, settlements are considered to be rural if their population is less than 10,000 inhabitants (Beaucheminet al., 2002). Secondary towns are the settlements with more than 10,000 inhabitants, except for Ouagadougouand Bobo-Dioulasso.
MIGRATION TO CITIES IN BURKINA FASO 7
ARTICLE IN PRESS
count the fact that the data are clustered, usingHuber–White standard errors. Clustering is ta-ken into account at the sample cluster level.Clustering due to repeated events from thesame individual is not accounted for becauseof the small number of individuals who wereat risk of migrating to Ouagadougou and BoboDioulasso more than once in the data files. 5
Multiple imputation was also performed tocorrect for the underestimation of standard er-rors due to missing community-level data (Alli-son, 2002). To test the sensitivity of the resultsto the potential collinearity of explanatory vari-ables (described below), models with variablesentered separately were also fitted. Although afew coefficients varied depending on whetherother variables were included in the model ornot, the main conclusions are robust to the dif-ferent specifications. For the sake of parsi-mony, we present only the results of the fullmodels.
Finally, let us briefly discuss the potential is-sue of endogeneity. Although our study con-siders the effects of local development onout-migration, reverse causation may arise ifsome amenities have been located preferen-tially in places where out-migration is higher.This could result for instance from investmentsin their place of origin by migrants associa-tions or by successful emigrants 6 or frompolicies targeting settlements with high out-migration rates. Although there is no clear evi-dence of such facts in Burkina Faso, oneshould keep in mind that the effect of the levelof development on the probability of migra-tion may be biased, that is the expected (nega-tive) effect of development on migration couldbe underestimated or even become positive. Itis beyond the scope of this paper to technicallysolve this problem, but this issue will be men-tioned when we suspect it may influence ourresults.

8 WORLD DEVELOPMENT
ARTICLE IN PRESS
(c) Variables: definition and expected results
For an individual, the risk of moving fromone place to another changes over time,depending on the evolution of his/her owncharacteristics and on the evolution of the fea-tures of his/her environment. Therefore, bothtime-constant and time-varying covariates areincluded in the models. Table 3 presents allthe variables used in this study, showing thedistribution of respondents in each categoryat the time of the last event or at the time ofcensoring. Some of them, whose effects are wellknown, are simply used as control variables. Atthe individual level, we control for gender, age,education, economic activity, ethnic group, andmigratory experience. Other control variablesare introduced in the models at the contextuallevel: the period and, for each place of resi-dence, the distance to the nearest city, the sizeof the settlement, and the agroclimatic condi-tions (average annual rainfall).Explanatory variables are those pertaining to
local development. Fifteen time-varying vari-ables measuring the availability of public ame-nities and economic opportunities at each pointin time are taken into account to evaluate theeffects of local development on the risk of mov-ing to a city. They have been grouped into fourbroad categories:
—Income-generating activities. Two vari-ables measure the presence of commercial-ized agriculture: market gardening(tomatoes, onions, green beans, etc.) or cashcrops (mainly cotton and rice). It is worthnoting that these activities are also takeninto account in secondary towns, where peo-ple often combine agriculture with othernonfarm occupations (Satterthwaite &Tacoli, 2003). Two other variables informus of the existence in the community of paidemployment in the agricultural sector(mainly seasonal activities such as weedingor livestock tending) or in another sector.A fifth variable indicates whether there is alarge company in the village or the town.These are mainly stateowned or recentlyprivatized companies involved in industrialactivities (processing of sugar cane, cotton,soap, etc.) or in tertiary activities (telephone,electricity supply, etc.). In any case, largecompanies refer to the modern sector ofthe economy.—Commercial services. These variables indi-cate the presence of a market (in towns, onlypermanent markets are considered), of a
video club or a cinema, and of a refreshmentstall (only in rural areas because all townshave at least one).—Public facilities. One variable indicateswhether at least one primary school is avail-able in the village (this variable is notretained in secondary towns where primaryschools are almost always available).Another variable indicates whether at leastone secondary school was available to thecommunity (village or town). The existenceof health facilities is also taken into accountin the analyses: in rural areas, the variableindicates whether a health center is avail-able, while in secondary towns, the variabledistinguishes communities with a hospital.—Infrastructure. The variables indicate ifthe community is connected by telephone,electricity (in rural areas, any source of elec-tricity is taken into account—power station,solar panels, or generating set—while onlytowns with electricity from a power stationare considered as having electricity), or aroad (all-weather roads are considered inrural areas, but only tarred road in urbanareas). A last variable measures the avail-ability of water infrastructure in the commu-nity (piped or borehole water in rural areas,piped water in towns).Finally, four composite indicators have been
created by summing the variables in each ofthe four broad categories described above.For instance, the indicator related to publicfacilities is equal to the sum of the variablesindicating the presence of educational andhealth facilities. In rural areas, if all amenities(primary and secondary schools, in additionto a health center) are available, the value ofthe variable is 3, and the value is 0 if thereare no public facilities. These composite indica-tors are included in a first series of models (1aand 2a) to evaluate whether the accumulationof local opportunities, a proxy for the level ofdevelopment, has a deterrent effect on migra-tion.What are the expected results of all these
variables? Table 4 provides some argumentsand examples regarding the expected effects ofeach variable. On the one hand, the availabilityof amenities or economic options is usuallyconsidered to provide better living conditionsand, as a result, to increase the staying powerof places of origin. But, on the other hand,the different components of local developmentmay act as facilitators for migration becausethey reduce the departure constraints in social

Table 3. Descriptive statistics of factors affecting migration considered in the analyses
Variables Categories % of the sample at the time of last
event or at the time of censoring
Rural areas Secondary towns
Individual-level variables
Gender Males 45.6 47.6
Females 54.4 52.4
AgeTV 6–9 1.1 2.6
10–14 13.5 10.1
15–19 19.7 19.7
20–24 15.1 19.0
25–29 10.2 12.5
30+ 40.4 36.1
ActivityTV Agricultural 66.0 52.5
Agricultural and nonagricultural 17.2 11.0
Nonagricultural 10.7 21.8
Nonworking 2.4 3.2
Student 3.7 11.5
Ethnic group Mossi 47.7 64.4
Fulani 8.9 11.9
Other 43.4 23.7
EducationTV No education 86.6 71.6
Less than 6 years 7.3 8.4
6 years and over 6.1 20.0
Migratory experienceTV Nonmigrant 44.6 34.7
Migrant native of rural areas 49.6 53.4
Other migrant 5.8 12.0
General context
PeriodTV 1980–84 1.9 2.3
1985–89 2.7 5.0
1990–94 9.6 13.1
1995–97 85.9 79.7
Settlement sizeLV,TV Less than 5,000 inhabitants 88.1 –
5,000–10,000 11.9 –
10,000–20,000 – 72.8
20,000–40,000 – 18.3
40,000 and over – 8.9
Distance to cityLV Less than 100 km 31.2 66.1
100–200 km 50.5 27.1
200 km and over 18.3 6.8
Agro-climatic regionLV
(ave. annual rainfall)
200–499 mm 4.7 1.0
500–699 mm 24.8 8.9
700–899 mm 49.5 70.1
900 mm and + 21.1 20.0
Community-level variables
Income-generating activitiesTV,LV Market gardening 47.4 95.6
Cash cropsa 30.2 62.2
Agricultural employment 47.3 82.0
Nonagricultural employment 18.6 47.6
Large company 1.2 30.6
Commercial servicesTV,LV Market (any type) 75.8 –
Permanent market – 22.4
Cinema or video club 9.5 93.1
Refreshment stall 29.3 –
(continued next page)
MIGRATION TO CITIES IN BURKINA FASO 9
ARTICLE IN PRESS

Table 3—continued
Variables Categories % of the sample at the time of
last event or at the time of
censoring
Rural areas Secondary towns
Public facilitiesTV,LV Primary school 74.4 –
Secondary school 7.6 94.6
Health center 26.5 –
Hospital – 19.5
InfrastructureTV,LV All-weather road 49.6 –
Tarred road – 74.8
Electricity (any source) 10.8 –
Power station – 25.5
Telephone 7.4 53.1
Piped or borehole water 88.3 –
Piped water – 38.1
Sample size Individuals 5630 1820
Person-periods 282,986 63,695
TV Time varying variables. LV Location varying variables.a At least one of the two most important crops is a cash crop.
10 WORLD DEVELOPMENT
ARTICLE IN PRESS
terms (education), in financial terms (economicopportunities provide money for migration), inphysical terms (roads facilitate movements),and in information terms (roads, electricity,and telephones transmit information on urbanopportunities).
4. RESULTS
The main question this paper aims to answeris whether progress in local development tendsto diminish the propensity to migrate to largecities. In order to answer this question, we firstlook at some descriptive results to search forpotential correlations in migration and devel-opment trends. Then, we turn to multivariateanalyses to assess the influence of the compo-nents of local development on the likelihood,for an individual living in a village or a smalltown, of moving to a large city.
(a) Trends in migrationand local development
Descriptive results on migration trends andon the evolution of the availability of variousamenities and economic opportunities givesome insights on the links between rural out-migration and local development. In line withthe policy viewpoint, we expect that the diffu-sion of facilities, infrastructure, etc. shouldcoincide with a slowdown of out-migration
from villages and secondary towns. Is thereany evidence on this matter?
(i) Rural out-migration and rural developmentUsing data from the retrospective commu-
nity-level survey, Figure 1(a)–(d) illustratesthe evolution of public facilities, infrastructure,income-generating activities, and commercialservices during 1960–99. 7 Although theSankarist revolution (1984) is often presentedas a starting point for the expansion of ruraldevelopment, the figures show that publicfacilities and economic opportunities startedto spread in rural areas in the late 1970s. Tosome extent, this might be a consequenceof the severe droughts of the 1970s thatturned the attention of internationalnongovernmental organizations to BurkinaFaso. This is especially true in the matter ofwater supply.Interestingly, the period of expansion of
facilities, infrastructure, and economic oppor-tunities in rural areas roughly corresponds toa slowing down in migration to Ouagadougouand Bobo Dioulasso. Figure 2 shows that theprobabilities of moving from a village to acity 8 stopped increasing while rural develop-ment clearly progressed. These results do notallow us to infer causal links between the devel-opment of rural communities and migrationtrends, although they suggest that community-level factors may have an effect on migrationto cities.

Table 4. Expected effects of the explanatory variables: arguments and examples from previous studies
Variables Arguments and
examples in favor
of a deterrent effect
Arguments and
examples in favor of an
encouraging effect
Arguments and
examples in favor of
an absence of effect
Income-generating activities
Agricultural sector
—Market gardening
—Cash crops
—Paid employment
—Provide local economic
opportunities and thus may augment the
standards of living
—Provide the financial means for leaving (Rhoda, 1983)
—Provide workers with skills and experience
that increase their chance of finding a job in large
cities (ILO, 1998)
—Favor rural–urban contacts
—Tend to loosen the pressure on the familial
workforce through the use of more intensive
farming methods (Grosse, 1986)
—The commercialization of agricultural products
creates regional and social inequalities that forces
some peasants to sell their lands (Piche, Gregory, &
Desrosiers, 1981)
E.g.: In Ecuador, women are less likely to
leave villages that have a high level of
agricultural development (Katz, 2000)
E.g.: Findley (1987) found in the Philippines that
migration was more frequent from localities where
the agricultural sector was more commercialized
Nonagricultural sector
—Large company
—Paid employment
E.g.: In Ecuador, the availability of off-farm
rural employment opportunities in the canton
had a significant downward effect on migration
among men (Bilsborrow et al., 1987) and
women (Katz, 2000)
E.g.: Bilsborrow et al. (1987) found that the
availability of urban employment in the canton
/ce:italic> tended to increase male migration to urban
areas in another canton
E.g.: In China, employment opportunities
provided by rural industrialization tend to
reduce rural out-migration (Junming, 1997)
E.g.: the development of small-scale cottage
industries in rural India increased out-migration
(ILO, 1998)
Commercial services
—Market
—Cinema or video club
—Tend to improve the quality of life, the
liveliness, and the economic opportunities
in rural areas and small towns
(continued next page)
MIG
RATIO
NTO
CIT
IESIN
BURKIN
AFASO
11
ARTICLE
INPRESS

Table 4—continued
Variables Arguments and
examples in favor
of a deterrent effect
Arguments and
examples in favor of an
encouraging effect
Arguments and
examples in favor of
an absence of effect
Public facilities
—School —The presence of schools could reduce
children’s moves to urban areas since
they can receive a modern education in
their place of origin (Stark, 1986)
—On the grounds that education has a positive
effect on migration at the individual level,
educational facilities are believed to encourage
out-migration (Lucas, 1997; Makinwa-Adebusoye,
1989; Rhoda, 1983)
E.g.: In Burkina Faso,
centers for Rural Education
(CER) have failed to retain
people (Gregory, 1974;
Yaro, 1994)
E.g.: In India, Lipton (1988) found that
primary schools had a retention effect
E.g.: On the Senegalese bank of the Senegal
river valley, schools have a deterrent
effect (Guilmoto, 1998)
E.g.: In India, Lipton (1988) found that secondary
schools had a repellent effect E.g.: On the Malian
bank of the Senegal river valley, people in villages
with schools have a higher propensity of
migration (Marcoux, 1990)
These centers, which do not
exist anymore, were created
in the 1960s to provide a
rural-oriented education
—Health center —Improve the quality of life in sending
areas (Lipton 1988; Rhoda, 1983;
Findley, 1977)
—Give a better access to contraception and thus
make women’s moves easier (Katz, 2000)
E.g.: No effect was found
in the Philippines
(Findley, 1987)
E.g.: Guilmoto (1998) found a retention
effect in villages of the Senegalese bank
of the Senegal River Valley
E.g.: Marcoux (1990) found a push effect in
villages of the Malian bank of the Senegal
River Valley
E.g.: No evidence was
found in African countries
(Owen, 1986)
Infrastructure
—Road
—Electricty
—Telephone
—Water
—Improve the quality of life in sending
areas (Oberai, 1992)
—May contribute to income diversification
(Reardon et al., 1988)
—The availability of piped and borehole
water improves the quality of life, especially
of women, who are partially freed of the
water chores
—Tend to increase migration by reducing the
costs of moving
—Increase the flow of information on
employment opportunities and on urban
lifestyle (Bilsborrow et al., 1985; De Jong
and Harbison, 1981; Lucas, 1997; Oberai, 1992)
12
WORLD
DEVELOPMENT
ARTICLE
INPRESS

(a)
0%
20%
40%
60%
80%
100%
1960 1970 1980 1990 2000
Primary schools
Sec. SchoolsHealth centres
(b)
0%
20%
40%
60%
80%
100%
1960 1970 1980 1990 2000
Electricity
Borehole/piped waterTelephone
All-season road
(c)
0%
20%
40%
60%
80%
100%
1960 1970 1980 1990 2000
Market gardening
Large business
Agric. employment
Non agric. employment
Cash crops
(d)
0%
20%
40%
60%
80%
100%
1960 1970 1980 1990 2000
Refreshment stall
Cinema/videoMarket
Figure 1. Evolution of the level of development in rural areas in Burkina Faso, 1960–99: (a) Public facilities; (b)
infrastructure; (c) income-generating activities; (d) commercial services. The ordinate axis represents the proportion of
villages.
MIGRATION TO CITIES IN BURKINA FASO 13
ARTICLE IN PRESS
(ii) Secondary towns: progress in localdevelopment and migratory trendsTwo kinds of information are available about
migration trends in secondary urban centers.First, Figure 3 shows that secondary townsare less and less repelling, the odds of movingout of secondary towns having fallen threefoldover the last 40 years. Even though odds arenot always significantly different from the refer-
Ref.
0
1
2
3
4
5
6
7
8
9
1960
-64
1965
-69
1970
-74
1975
-79
Odd
s ra
tio
Rural to a city
Rural to a medium-sized tow
Figure 2. Evolution of the risk of moving out
ence period (1960–64), it seems that the early1980s were a turning point preceding a sharpdecline in migration to cities. Second, Figure2 also suggests that secondary urban centersare becoming more and more attractive for ruralsettlers compared to the largest cities: the oddsof moving to a secondary town increased four-fold between the early 1980s and the late 1990s,while, during the same period, the odds of mov-
NB: White symbols indicate non-significant results (p<0.2)
1980
-84
1985
-89
1990
-94
1995
-99
n
of a village for a rural resident, 1960–99.

NB: White symbols indicate non-significant results (p<0.2)
Ref.
0
0.2
0.4
0.6
0.8
1
1.2
1960
-64
1965
-69
1970
-74
1975
-79
1980
-84
1985
-89
1990
-94
1995
-99
Odd
s ra
tio
Figure 3. Evolution of the risk of moving from a secondary town to a city for an urban resident, 1960–99.
14 WORLD DEVELOPMENT
ARTICLE IN PRESS
ing out of a village to Ouagadougou or BoboDioulasso stagnated. This trend may resultfrom the increasing number of towns (59 townsin 1996 as opposed to 13 towns in 1975, Table1), which logically explains the growing proba-bility of moving from a village to such a settle-
0%
20%
40%
60%
80%
100%
1960 1970 1980 1990 2000
Sec. Schools Hospitals
(c)
0%
20%
40%
60%
80%
100%
1960 1970 1980 1990 2000
Market gardening Large businessAgric. employment Non agric.employment Cash crops
(a)
Figure 4. Evolution of the level of development in secondary
infrastructure; (c) income-generating
ment. Nonetheless, one can also hypothesizethat secondary towns have become more attrac-tive and less repellent places because of theimprovement in their development level.The evolution of the various community-level
features in secondary towns proves to be much
0%
20%
40%
60%
80%
100%
1960 1970 1980 1990 2000
Electricity Piped waterTelephone Tarred road
(d)
0%
20%
40%
60%
80%
100%
1960 1970 1980 1990 2000
Cinema/video Permanent market
(b)
towns in Burkina Faso, 1960–99: (a) public facilities; (b)
activities; (d) commercial services.

Table 5. Event history models of individual and community effects on the risk of moving from rural areas toOuagadougou or Bobo Dioulasso, 1980–97
Variables Categories Odds-ratio
Model 1a Model 1b
Baseline hazard
Duration of stayTV Duration 0.99*** 0.99***
Logarithm of
duration
1.50*** 1.48***
Individual-level variables
Gender Males 1.00 1.00
Females 0.77 0.75*
AgeTV 6–9 0.36** 0.36**
10–14 0.32*** 0.32***
15–19 0.82 0.83
20–24 1.00 1.00
25–29 0.90 0.92
30+ 0.41*** 0.39***
ActivityTV Agricultural 1.00 1.00
Agricultural and
nonagricultural
0.53** 0.57**
Nonagricultural 2.71*** 2.53***
Nonworking 9.32*** 9.09***
Student 2.94*** 2.96***
Ethnic group Mossi 1.00 1.00
Fulani 0.14*** 0.16***
Other 0.57** 0.64**
EducationTV No education 1.00 1.00
Less than 6 years 1.68* 1.69*
6 years and over 5.32*** 5.42***
Migratory experienceTV Nonmigrant 1.00 1.00
Migrant native
of rural areas
0.52** 0.52**
Other migrant 1.50** 1.45*
General context
PeriodTV 1980–84 1.00 1.00
1985–89 0.78 0.91
1990–94 0.67** 0.81
1995–97 0.67 0.92
Settlement sizeLV,TV Less than 5,000
people
1.00 1.00
5,000–10,000 0.74 0.80
Distance to cityLV Less than 100 km 1.00 1.00
100–200 km 0.48*** 0.45***
200 km and over 0.19*** 0.14***
Agroclimatic regionLV 200–499 mm 1.00 1.00
500–699 mm 1.62 1.45
700–899 mm 1.62 1.40
900 mm and + 2.02 1.92
(continued next page)
MIGRATION TO CITIES IN BURKINA FASO 15
ARTICLE IN PRESS

Table 5—continued
Variables Model 1a Model 1b
Categoriesa Odds-ratios Categoriesa Odds-ratios
Community-level variables
Income-generating activitiesTV,LV One 1.80 Market gardening 0.99
Two 1.94 Cash crops 0.80
Three 2.00* Agricultural employment 1.50*
Four 0.50 Nonagricultural employment 1.39
Five 6.32 Large company 0.45
Commercial servicesTV,LV One 0.37** Market (any type) 0.43***
Two 0.27*** Cinema or video club 1.20
Three 0.25** Refreshment stall 0.70
Public facilitiesTV,LV One 1.13 Primary school 1.17
Two 3.02*** Secondary school 1.28
Three 5.03*** Health center 2.52***
InfrastructureTV,LV One 1.53 All-weather road 2.29***
Two 2.00** Electricty (any source) 1.04
Three 2.69** Telephone 1.38
Four 3.41** Piped or borehole water 0.87
TV Time-varying variables. LV Location-varying variables.a Category of reference: absence of any amenity or economic opportunity.*** p < 0.01; ** p < 0.05; * p < 0.10 (two-tailed tests).
16 WORLD DEVELOPMENT
ARTICLE IN PRESS
more complex than in rural areas (Figure 4(a)–(d)). Trends are quite varied depending on thetype of amenity considered: public facilitieshave experienced regressive periods; 9 on thecontrary, all types of infrastructure kept devel-oping from 1965–75 until the mid-1980s whenthey began to stagnate; eventually, economicopportunities as a whole have generally pro-gressed since the mid-1970s. 10 Ultimately, par-allels are rather difficult to establish withmigratory trends. However, keeping in mindthe migration turning point of the early 1980s,there seems to be a correlation between thedevelopment of income-generating activitiesand the period when secondary towns startedto be more attractive for rural out-migrantsand less repellent for their residents. Do multi-variate analyses clarify this relationship?
(b) Explanatory results
This section is devoted to the issue of whetherlocal development has an effect on the migra-tion decisions of people living in villages or insecondary towns. Results from rural areas(from Table 5, models 1a and 1b) and from sec-ondary towns (from Table 6, models 2a and 2b)are jointly considered since, for the most part,they are rather similar. The effects of the indi-vidual and contextual control variables will
not be discussed because they are all of the ex-pected sign. In summary, young educatedadults without employment or with a nonagric-utural activity are more likely to move to a city,whatever their place of residence (a village or asecondary town). Focused on communityeffects, this section is divided into three parts.The first one examines the impact of the accu-mulation of public amenities or economicopportunities on movements to Ouagadougouand Bobo Dioulasso. The second and thirdparts turn to the specific effects of each kindof community-level variable, one being cen-tered on economic opportunities and the otherone on public amenities.
(i) Is there a cumulative effect?Here we use composite indicators (described
in Section 3(c)) to measure the cumulative im-pact of different kinds of amenities or economicopportunities on the risk of moving to a city.Introduced in the models in addition to thecontrol variables, these indicators allow us totest whether the better endowed settlements,in other terms those who have the higher levelof development, are those who are most likelyto retain their population. Overall, the answerseems to be no. In secondary towns, the accu-mulation of amenities or economic opportuni-ties has no significant effect on out-migration

Table 6. Event history models of individual and community effects on the risk of moving from secondary townsto Ouagadougou or Bobo Dioulasso, 1980–97
Variables Categories Odds-ratio
Model 2a Model 2b
Baseline hazard
Duration of stayTV Duration 1.00 1.00
Logarithm of
duration
1.18 1.21
Individual-level variables
Gender Males 1.00 1.00
Females 0.81 0.82
AgeTV 6–9 0.46** 0.41**
10–14 0.54*** 0.49***
15–19 0.92 0.90
20–24 1.00 1.00
25–29 0.67* 0.63**
30+ 0.54*** 0.52***
ActivityTV Agricultural 1.00 1.00
Agricultural and
nonagricultural
0.48 0.50
Nonagricultural 2.83*** 2.81***
Nonworking 4.07*** 3.99***
Student 2.38*** 2.20***
Ethnic group Mossi 1.00 1.00
Fulani 0.29* 0.24**
Other 0.82 0.84
EducationTV No education 1.00 1.00
Less than 6 years 1.08 1.08
6 years and over 1.83*** 1.83***
Migratory experienceTV Nonmigrant 1.00 1.00
Migrant native of
rural areas
0.84 0.78
Other migrant 2.58** 2.48**
General context
PeriodTV 1980–84 1.00 1.00
1985–89 0.86 0.88
1990–94 0.73 0.88
1995–97 0.68 0.82
Settlement sizeTV,LV 10,000–20,000
people
1.00 1.00
20,000–40,000 0.69 0.65
40,000 and over 0.65 0.52
Distance to cityLV Less than 100 km 1.00 1.00
100–200 km 1.29 1.21
200 km and over 0.50 0.33**
Agro-climatic regionLV 200–499 mm 1.00 1.00
500–699 mm 0.38* 0.36*
700–899 mm 0.52 0.63
900 mm and + 0.35* 0.45
(continued next page)
MIGRATION TO CITIES IN BURKINA FASO 17
ARTICLE IN PRESS

Table 6—continued
Variables Model 2a Model 2b
Categoriesa Odds-ratios Categoriesa Odds-ratios
Community-level variables
Income-generating activitiesTV,LV One 0.79 Market gardening 1.08
Two 0.67 Cash crops 0.56*
Three 0.62 Agricultural employment 0.72*
Four 0.48 Nonagricultural employment 1.10
Five 0.26 Large company 0.54***
Commercial servicesTV,LV One 2.28** Market (permanent) 1.23
Two 1.94 Cinema or video club 1.44
Public facilitiesTV,LV One 1.72 Secondary school 1.51
Two 1.59 Hospital 1.14
InfrastructureTV,LV One 0.24*** Tarred road 1.49
Two 0.58 Electricty (power st.) 1.04
Three 1.19 Telephone 0.89
Four 0.77 Piped water 1.48*
TV Time-varying variables. LV Location-varying variables.a Category of reference: absence of any amenity or economic opportunity.*** p < 0.01; ** p < 0.05; * p < 0.10 (two-tailed tests).
18 WORLD DEVELOPMENT
ARTICLE IN PRESS
(Table 6, model 2a). And in villages, it hasunexpected effects. Better infrastructure, morepublic facilities and more diversified income-generating activities all tend to increase the riskof moving to cities (Table 5, model 1a). Forexample, an individual living in a village wherea primary school, a secondary school, and ahealth center are all available is (all else beingequal) five times as likely to move to Ouaga-dougou or Bobo Dioulasso as an individual liv-ing in a place where none of these facilities areavailable. People in rural places with an all-weather road, telephone, water, and electricityalso experience risks of migration to cities morethan three times as high as those living in placeswithout any infrastructure. The effects of in-come-generating activities are less clearcut(rarely significant) but go in the same direction.In fact, among our variables, only the accumu-lation of commercial services, that is, marketsand places of entertainment, seem to deter ruralpopulations from moving to cities. People liv-ing in places with a market, a refreshment stall,and a video club are indeed four times lesslikely to move to cities than those living in vil-lages without such amenities.
(ii) The contrasted impact of theeconomic opportunitiesIn both villages and secondary towns, it ap-
pears that economic opportunities mostly havea deterring effect on migration (three out of
four significant results are negatively associatedwith migration into a city). Nonetheless, somenuances need to be highlighted according tothe type of activity.Overall, the presence of nonagricultural eco-
nomic opportunities (large company, market)tends to encourage people to stay in their placeof residence. The existence of a large companyseems to be very critical in secondary towns:it significantly reduces the likelihood of movingto a city by 50% (Table 6). In villages, the effectgoes in the same direction but is not significant(Table 5), probably because of the relative scar-city of such businesses in rural areas (Table 3).Exploratory analyses have also shown thatlarge companies have a strong and significanteffect on the probability of returning to the vil-lages of origin among those who left for a city(results not displayed). All in all, these resultssuggest that the presence of an important activ-ity in the modern sector may indeed reduce out-migration and also act as a magnet for thosewho had previously left. Given the strength ofthe effect in secondary towns, it is highly prob-able that it is due only in part to the employ-ment provided by the company. Part of theeffect may also be due to the opportunities cre-ated by the presence of the company on thewhole urban economy (subcontracting, com-mercial activities to supply the consumption de-mand of the wage earners, etc.) (Dubresson,1989). In rural areas, markets seem to act in a

MIGRATION TO CITIES IN BURKINA FASO 19
ARTICLE IN PRESS
similar way as large firms in towns (Table 5).They have indeed a very strong and significantdownward effect on migration: rural residentsare two times less likely to move to a city whenthere is a market in their village. This retentioneffect is even stronger on female out-migration(results not shown), probably because they aremore involved in the local, commercial activi-ties than their male counterparts. Various rea-sons may be found for this deterring effect. Ofcourse, it represents a significant income-gener-ating activity since it facilitates the commercial-ization of craft, farm, and food products. Itcould also be linked to the liveliness and theintensity of social interactions in the endowedvillages: the existence of a market means thatpeople from all the neighboring settlementsgather in the village every 3, 5, or 7 days, andit is possible that the mere presence of a marketjust makes life more ‘‘fun’’ in the village.Agricultural economic opportunities have a
more varied impact on migration than nonagri-cultural ones. A striking result is that the effectof agricultural employment varies according tothe place of residence: it tends to increase out-migration from rural areas (Table 5) but, onthe contrary, it reduces out-migration from sec-ondary towns. The same is true for the presenceof cash crops (Table 6). The push effect of agri-cultural employment in rural areas is not totallyunexpected given that similar results werefound in other settings. The availability of paidwork helps people to obtain the financial meansnecessary to migrate to a city. The availabilityof agricultural employment opportunities in vil-lages may also raise people’s aspirations forsuch jobs while at the same time not be suffi-cient to fulfill them, thus encouraging peopleto move to the cities for better employmentprospects. In secondary towns, the context dif-fers: people usually associate agricultural activ-ities with other activities (Satterthwaite &Tacoli, 2003). Thus, agricultural employmentacts as a complement in the domestic economyso that people do not need to move to find eco-nomic alternatives.
(iii) The repellent role of public amenitiesContrary to economic opportunities, which
generally have a retention power, the presenceof public facilities and infrastructure has mostlya push effect, when results are significant. Insecondary towns, only one variable has a signif-icant, though somewhat puzzling, result: peopleliving in secondary urban centers provided with
piped water have 50% higher odds of moving toa city than those living in towns without piped-water (Table 6). As discussed before, suchinfrastructure may increase people’s tastes forurban lifestyle. There are other possible expla-nations for this result: (1) it could reflect a biasresulting from the endogeneity of this variableor (2) the availability of piped water may cap-ture the effect of an unobserved variable thattends to increase migration.In rural areas, two variables are highly sig-
nificant and positively related to the risk ofmigration: roads and health centers (Table 5).People living in villages connected by an all-weather road are 2.3 times as likely to moveto Ouagadougou or Bobo Dioulasso as thoseliving in places with no road. This finding con-firms results in other settings (Findley, 1987;Marcoux, 1990), suggesting that the facilitat-ing effect of a road on migration more thancounterbalances its potential retention effect.However, this finding is in clear contradictionwith statements in Burkina Faso’s PovertyReduction Strategy Paper predicting that theconstruction of roads will stem rural exodus(Burkina Faso, 2000). The diffusion of healthcenters is not an explicit goal of the Burkinabepopulation policy, though it is a component ofthe rural development strategy. However, re-sults show that it has a strong repellent effect(Table 5): people living in a village with ahealth center are more than two times as likelyto leave their place of residence as those livingin places with no health facility. Various fac-tors could explain this deterring effect. First,health centers may have an impact on thework allocation in domestic groups: if every-one is in good health in a household, the work-force may be in excess; therefore, somemembers may be allowed to migrate in orderto diversify the incomes of the group (Mar-coux, 1990). Second, the negative effect ofhealth centers could partly reflect a bias dueto the endogeneity of the placement of healthfacilities.Finally, let us emphasize that neither primary
nor secondary schools have a significant effecton the chances of moving to cities whateverthe place of residence. This result may be ex-plained by the fact that education is controlledat the individual level. At that level, the effect ispositive and strongly significant, though it ismuch less pronounced in urban than in ruralareas. The more educated (6 years of schoolingand over) people in villages are more than fivetimes as likely to move to a city as those with

20 WORLD DEVELOPMENT
ARTICLE IN PRESS
no formal schooling (Table 5). Odds ratios areonly close to 2 for those living in secondarytowns (Table 6). This difference may be ex-plained by the fact that prospects for educatedpeople are better in small towns than in ruralareas.
5. DISCUSSION AND CONCLUSION
Let us come back to the main issue of the pa-per: does the level of development in rural orurban sending areas reduce migration to thelargest cities in Burkina Faso? In fact, the an-swer depends on the level of analysis, on thetype of settlement considered (village or sec-ondary town), and also on the components oflocal development taken into account.At the macrolevel, descriptive results are in
line with the policy expectations, which assertthat increasing the level of local developmentby providing economic opportunities and publicamenities is a means to encourage people to stayat their place of residence. In rural areas, there isa clear correlation between the expansion offacilities, infrastructure, and income-generatingactivities and the reduction of the likelihood, fora villager, of moving to one or the other city. Insecondary towns, the correlation betweenmigration and local development trends is lessclearcut. The evolution of migration trendsseems to be independent of the development ofpublic amenities (facilities and infrastructure).Nevertheless, the migratory turning point ofthe 1980s—when secondary towns became moreand more attractive and less and less repellent—is roughly associated with the development ofeconomic opportunities. All in all, these descrip-tive results suggest that the promotion of ruraldevelopment, and especially of its economiccomponents, has an impact on migration to cit-ies. Still, the parallel trajectories of the migra-tion trends and of the development of ruralcommunities and secondary towns do not implya causal link between these evolutions.Using multilevel data, the microlevel approach
provides more specific information on the cau-sal mechanisms linking local development andmigration. Overall, regardless the type of settle-ment, few community-level variables have a sig-nificant impact on the risk of moving toOuagadougou or Bobo Dioulasso. In villages,only four out of the 15 components of localdevelopment have a significant effect on migra-tion; in secondary towns, the ratio is 4:13. How-ever, contrary to the policy expectations, public
amenities mainly act to encourage migration,especially in rural areas. The positive effect ofroads in villages is easily understandable: itobviously facilitates movement. As for theretention effect of rural health centers, explana-tions are probably related to the use of theworkforce in households; however the issue ofendogeneity would need to be further explored.Above all, the components of local developmentrelated to economic context have a large reten-tion effect. Markets in villages and large compa-nies in secondary towns reduce the risk ofmoving to Ouagadougou or Bobo Dioulassoby about 50%. These results confirm that,among other community variables, local eco-nomic factors play a significant role in themigration decision process (De Jong & Harbi-son, 1981; Nelson, 1983).What might be the policy implications of
these results on the impact of the level of localdevelopment in sending areas? First, since pub-lic facilities and infrastructure have either noeffect or even tend to encourage migration,policy makers should, perhaps, simply not ex-pect that providing villages and small townswith these amenities will reduce migration tocities. Even though the development ofschools, health centers, roads, etc. is certainlybeneficial to rural and urban populations andshould be encouraged, their developmentshould probably not be justified on thegrounds that it reduces migration to cities.Rural development should not be seen onlyas a means of retaining population in ruralareas (Chen et al., 1998; Rhoda, 1983). Yet,some economic factors do reduce out-migra-tion. In rural areas, the retention effect of mar-kets that include a large range of activities inwhich women are especially involved reflectsthe dynamism of the local economies. Support-ing them may be an efficient way to deter out-migration, especially for women. As for sec-ondary towns, results suggest that agriculturalactivities play a significant role in the urbaneconomy, a fact that is not always recognizedbecause of its apparent paradoxical character.For these settlements, one should also keepin mind that the retention effect of large firmsis mainly due to public investments in theindustrial sector. Additionally as a result, thestate withdrawal encouraged by the structuraladjustment program (1990) may undermine inthe medium or long term this moderating fac-tor of city-ward migration. Additionally,though it is clearly a policy objective, the slow-down of rural-to-city migration should con-

MIGRATION TO CITIES IN BURKINA FASO 21
ARTICLE IN PRESS
cern policy makers. One should recognize thatit does not result from rural development pol-icies (markets, the only variable with a deter-rent effect, have always been there, see Figure3(d)), but rather probably from the socioeco-nomic difficulties endured by city dwellers.The growth of unemployment rates (Lachaud,1994), the increasing incidence of poverty (Fo-fack, Monga, & Tuluy, 2001), and the risingproportion of urban workers in the informal
sector in Ouagadougou and Bobo Dioulasso(Calves & Schoumaker, 2004) may in fact bemore relevant than the conditions at the placeof origin in explaining new migration trends. Itis all the more worrying that recent studieshave underscored the positive impact of urbanmigration on social well-being (Stark, 1991)and on national economic development (Beck-er et al., 1994; Bilsborrow, 1998; Chen et al.,1998).
NOTES
1. In 2003, 81% of African Governments declared they
were implementing policies to lower internal migration
into metropolitan areas, compared to 54% in 1996. The
concern is clearly more important in Africa than in the
rest of the world: 45% of all the governments were
concerned in 1996, the ratio was 52% in 2003 (United
Nations, 2004).
2. Sample design. The country has been divided in
eight strata (two cities, Ouagadougou and Bobo-Diou-
lasso; a secondary town, Banfora; and five regions
covering the rest of the country). At the first stage, 157
primary sampling units (census enumeration areas) were
randomly selected with a probability proportional to
their estimated size. The sampling units were selected
independently in each strata with a different sampling
fraction in each strata. In each selected primary
sampling unit, 20–25 households were randomly se-
lected. Within households, life histories were collected
for every individual aged 25 and over and for one
person out of two among those under 25. For more
details on the sample design, see Poirier et al. (2001).
For the purpose of this research, we had to distinguish
the two cities (Ouagadougou and Bobo-Dioulasso)
from the rest of the urban areas and from the villages
(rural areas). Because this distinction was not explicitly
taken into account in the sampling design, secondary
towns happened to be under-represented in the sample.
We computed post-stratification weights for the distri-
bution of the sample by place of residence (cities,
secondary towns, rural) to correspond to the distribu-
tion of the population based on census data (Schou-
maker, 2002).
3. As we are mainly interested in the effects of
development policies on long-term migration to cities,
we isolate long-term migration from short-term migra-
tion. We have shown elsewhere that most temporary
migrants tend to return to their place of origin within
two years (Henry, Schoumaker, & Beauchemin, 2004).
Finally, using a 2-year criteria allows us to study the
effects of development on ‘‘permanent’’ moves.
4. Table 2 shows that the number of males is smaller
than that of women. This is probably due to the selection
of international emigration from Burkina Faso: move-
ments to Cote d’Ivoire are esssentially fed by males.
5. It means that, once people have migrated to a city
for at least 2 years, only a small proportion of them
goes back to rural areas or an intermediate town,
where they would be at a risk of moving to a city
again.
6. In some African regions (for instance along the
Senegal River Valley), migrants act as real agents of
local development through the intervention of emi-
grant associations which collect funds in order to
finance socioeconomic amenities in the regions of
origin (Lavigne-Delville, 1990). In Cote d’Ivoire, some
villages and small towns have been transformed by
the investments of executives who personally pay or
are able to raise funds to provide various amenities to
their place of origin (Vidal, 1991). In Burkina Faso,
emigrant associations do exist (Mande, 1996), but so
far, there is no clear evidence on their potential
investments in villages and intermediary urban cen-
ters, nor do we have information on the influence of
urban executives on the development of their place of
origin.
7. Because the sample of communities is not random,
post-stratification weights were computed (using the
raking ratio method) in rural areas so that the distribu-
tion of the sampled communities by province, popula-
tion size, and administrative status is identical to the
distribution of the communities in the country as a
whole (Schoumaker et al., 2004).
8. Odds ratios were computed using a discrete-time
event history model similar to the one presented in
Section 3(b). The period effects have been estimated
controlling for age and gender. The baseline hazard is
modeled by a function of the duration of stay and of its
logarithm.

22 WORLD DEVELOPMENT
ARTICLE IN PRESS
9. Regarding public facilities (Figure 4(a)), a striking
fact is the decrease of the proportion of urban centers
provided with a hospital since 1970 and with a secondary
school during 1972–82. These downward trends are
explained by the increasing number of urban centers
resulting from the reclassification of villages into towns
when their size exceeds the threshold of 10,000 inhab-
itants (see Table 1). For secondary schools, public
investments have caught up with population growth
with some delay (increase after 1982). On the contrary,
investments in hospitals have never caught up with the
growing number of urban centers because of the focus of
public authorities on primary health care since the end
of the 1970s (Alma Ata declaration, 1978).
10. The decreasing proportion of towns provided with
a large enterprise and nonagricultural employment at the
beginning of the 1990s may result from the implemen-
tation of the first Structural Adjustment Plan (Diabre,
1998).
REFERENCES
Adepoju, A. (1983). Issues in the study of migration andurbanization in Africa south of the Sahara. In P. A.Morrison (Ed.), Population movements: Their formsand functions in urbanization and development(pp. 115–149). Liege: Ordina – IUSSP.
Allison, P. (1995). Survival analysis using the SASsystem. A practical guide. Cary: SAS Institute.
Allison, P. (2002). Missing data. Thousand Oaks: Sage.Antoine, P., Ouedraogo, D., & Piche, V. (Eds.). (1998).
Trois generations de citadins au Sahel: 30 ansd’histoire sociale a Dakar et Bamako. Paris: L’Har-mattan.
Beauchemin, C., Le Jeune, G., Beauchemin, E., 2002.Tabvilles BF: Rapport de presentation (EnqueteEMIUB. Document technique d’analyse No. 2002-01). Montreal: Departement de demographie, Uni-versite de Montreal.
Becker, C. M., Hamer, A. M., & Morrison, A. R. (1994).Beyond urban bias in Africa: Urbanization in an era ofstructural adjustment. Portsmouth – London: Heine-mann – J. Currey.
Bilsborrow, R., McDevitt, T., Kossoudji, S., & Fuller,R. (1987). The impact of origin community charac-teristics on rural–urban out-migration in a develop-ing country. Demography, 24(2), 191–210.
Bilsborrow, R. E., Delargy, P. F., & UNFPA (1985).Impact of rural development projects on demographicbehaviour. New York: United Nations Fund forPopulations Activities.
Bilsborrow, R. E. (1998). The state of the art andoverview of the chapters. In R. E. Bilsborrow (Ed.),Migration, urbanization, and development: New direc-tions and issues (pp. 1–56). New York: UnitedNations Population Fund (UNFPA) and KluwerAcademic Publishers.
Bolay, J.-C. (2000). Renforcement des competencesurbaines et decentralisation : le programme ‘‘Villesmoyennes’’ au Burkina Faso. Urbanews(2), 1–2.
Burkina Faso (1994). Plan d’action national pour l’envi-ronnement (PANE). Tome 1 (2eme edition). Ouaga-dougou:Ministere de l’environnement et du tourisme.
Burkina Faso (2000). Burkina Faso. Poverty reductionstrategy paper. Ouagadougou: Ministere de l’Econ-omie et des Finances.
Burkina Faso (2001). Decret no 2001-624/PRES/MEFportant adoption de la Politique Nationale depopulation. Journal officiel du Burkina Faso (6).
Calves, A.-E., & Schoumaker, B. (2004). Deterioratingeconomic context and changing patterns of youthemployment in urban Burkina Faso: 1980–2000.World Development, 32(8), 1341–1354.
Campbell, E. K. (1988). Rural urban migration andrural development interrelations in West Africa:Some obstacles to goal achievement. African urbanquarterly, 3(1–2), 34–49.
Chen, N., Valente, P., & Zlotnik, H., 1998. What do weknow about recent trends in urbanization. In R. E.Bilsborrow (Ed.), Migration, urbanization, and devel-opment: New directions and issues (United NationsPopulation Fund (UNFPA) and Kluwer AcademicPublishers ed., pp. 59–88). New York: UNFPA –Kluwer Academic Publishers.
Cordell Dennis, D., Gregory Joel, W., & Piche, Victor(1996). Hoe and Wage: A Social History of a CircularMigration System in West Africa. Boulder, Colo.:Westview Press, p 384.
De Jong, G. F., & Harbison, S. F. (1981). Policyintervention consideration: The relationship of the-oritical models to planning. In G. F. De Jong & R.W. Gardner (Eds.), Migration decision making:Multidisciplinary approaches to microlevel studies indeveloped and developing countries (pp. 394). NewYork, Toronto: Pergamon Press.
Diabre, Zephirin (1998). The Political Economy ofAdjustment in Burkina Faso (CAER II–DiscussionPaper 28). Cambridge: Harvard Institute for Inter-national Development, p 140.
Dubresson, A. (1989). Villes et industries en Coted’Ivoire. Pour une geographie de l’accumulation urba-ine. Paris: Karthala.
Ezra, M. (2001). Ecological degradation, rural poverty,and migration in Ethiopia: A contextual analysis.Policy Research Division Working Papers No. 149,Population Council, New York.
Findley, S. (1977). Planning for internal migration: Areview of issues and policies in developing countries.Washington: US Bureau of the Census, InternationalStatistical Programs Center.

MIGRATION TO CITIES IN BURKINA FASO 23
ARTICLE IN PRESS
Findley, S. (1987). Rural development and migration. Astudy of family choices in the Philippines. Boulder:Westview Press.
Fofack, H., Monga, C., & Tuluy, H. (2001). Householdwelfare and poverty dynamics in Burkina Faso:Empirical evidence from household surveys. PolicyResearch Paper No. 2590. The World Bank, Wash-ington DC.
Ganne, B., Ouedraogo, J.-B., Ouattara, A., Ilboudo, E.,& Compaore, G. (1988). Evolution recente des villesmoyennes du Burkina Faso: investissements publicset politiques de developpement a Koudougou, Ban-fora, Ouahigouya, Kaya, Fada N’Gourma, Gaoua.Lyon, Ouagadougou: GLYSI-CNRS, CNRST-IRSSH-Universite de Ouagadougou.
Giraut, F. (1999). Les racines et le reseau: les petitesvilles dans la transition territoriale ouest-africaine. InJ.-L. Chaleard & A. Dubresson (Eds.), Villes etcampagnes dans les pays du Sud: geographie desrelationsHommes (pp. 207–236). Paris: Karthala.
Gregory, J. (1974). Underdevelopment, dependency andmigration in Upper Volta. Unpublished PhD Thesis,Cornell University.
Grosse, S. D. (1986). La retention et la migration despopulations rurales africaines: une nouvelle synthesede la litterature. In J. Havet (Ed.), Le village et lebidonville: retention et migration des populationsrurales d’Afrique (pp. 37–62). Ottawa: Presses uni-versitaires d’Ottawa/IDIC.
Guilmoto, C. (1998). Institutions and migrations. Short-term versus long-term moves in rural West Africa.Population Studies, 52(1), 85–103.
Harris, J. R., & Todaro, M. P. (1970). Migration,unemployment, and development: A two sectoranalysis. American Economic Review(60), 126–142.
Henry, S., Schoumaker, B., & Beauchemin, C. (2004).The impact of rainfall on the first out-migration inBurkina Faso: A multilevel event history analysis inBurkina Faso. Population and Environment, 25(5),423–460.
ILO (1998). Migration and population distribution indeveloping countries: Problems and policies. InUnited Nations (Ed.), Population distribution andmigration. Proceedings of the United Nations expertgroup meeting on population distribution and migra-tion, Santa Cruz, Bolivia, January 18–22, 1993. NewYork: United Nations.
Junming, Z., (1997). Multilevel Analysis of RuralOutmigration in Guandong, China. Working Paper,97.03, Cambridge: Harvard Center for Populationand Development Studies.
Katz, E. (2000). Individual, household and community-level determinants of migration in Ecuador: Arethere gender differences? Paper presented at theAnnual Meeting of the Population Association ofAmerica, Los Angeles.
Lachaud, J.-P. (1994). Marche du travail et exclusionsociale en Afrique francophone: quelques elementsd’analyse (No. 1). Bordeaux: center d’economie dudeveloppement.
Lavigne-Delville, P. (1990). Les projets de developpe-ment inities par les migrants. Hommes et Migra-tions(1131), 25–27.
Lipton (1988). Rural development and the retention of therural population in the countryside of developingcountries. Havet Jose Ottawa: University of OttawaPress, p 24–50.
Lucas, R. (1997). Internal migration in developingcountries. In M. R. Rosenzweig & O. Stark (Eds.),Handbook of population and family economics(pp. 721–798). Amsterdam: Elsevier Science Publish-ers.
Makannah, T. J. (1990). Policy measures for stemmingurban in-migration. Paper presented at theConference on the role of Migration in AfricanDevelopment: Issues and policies for the ’90s,Nairobi.
Makinwa-Adebusoye, P. (1989). Migration and urban-ization policies in Sub-Saharan Africa: Drawing oninternational experience. In IUSSP (Ed.), PopulationPolicy in Sub-Saharan Africa: Drawing on Interna-tional Experience. Liege: Ordina, p. 155–190.
Mande, I. (1996). Les associations d’originaires, prom-oteur du developpement regional en Haute-Volta de1959 a 1982?. In C. Coquery-Vidrovitch, H. D.Almeida-Topor, & J. Senechal (Eds.), Interdepen-dances villes-campagnes en Afrique: mobilite deshommes, circulation des biens et diffusion des modelesdepuis les independances (pp. 113–138). Paris: L’Har-mattan.
Marcoux, R. (1990). Caracteristiques villageoises etretention des populations: le cas de la vallee dufleuve Senegal. Labor, Capital and Society, 23(1),100–133.
Nelson, J. M. (1983). Population redistribution policiesand migrants’ choices. In P. A. Morrison (Ed.),Population movements: Their forms and functions inurbanization and development (pp. 281–312). Liege:Ordina – IUSSP.
Njoh, A. J. (2003). Urbanization and development insub-Saharan Africa. Cities, 20(3), 167–174.
Oberai, A. (1989). Migration, urbanisation et developp-ement. Geneve: Bureau International du Travail.
Oberai, A. (1992). Assessing the demographic impact ofdevelopment projects. London: Routledge.
Owen, J. S. (1986). Une amelioration des servicesruraux de sante peut-elle contribuer a la retentiondans les campagnes des populations africaines. In J.Havet (Ed.), Le village et le bidonville: retention etmigration des populations rurales d’Afrique(pp. 169–185). Ottawa: Presses universitaires d’Ot-tawa/IDIC.
Piche, V., Gregory, J., & Desrosiers, D. (1981). Migra-tion et sous-developpement en Haute-Volta: essai detypologie. Cahiers quebecois de demographie, 10(1),87–120.
Poirier, J., Dabire, B., Le Jeune, G., Piche, V., & Wane,H. R. (2001). Projet d’etude des strategies de repro-duction des populations saheliennes a partir del’enquete Dynamique migratoire, insertion urbaineet environnement au Burkina Faso. Cahiers quebec-ois de demographie, 30(2), 289–309.
Reardon, T., Matlon, P. M., & Delgado, C. L. (1988).Coping with household-level food insecurity indrought-affected areas of Burkina Faso. WorldDevelopment, 16(9), 1065–1074.

24 WORLD DEVELOPMENT
ARTICLE IN PRESS
Rhoda, R. (1983). Rural development and urbanmigration. Can we keep them down on the farm?.International Migration Review, 17(1), 34–64.
Rondinelli, D. A. (1994). Urbanization policy andeconomic growth in Sub-Saharan Africa: The privatesector’s role in urban development. In J. D. Tarver(Ed.), Urbanization in Africa: A handbook(pp. 365–387). Westport, London: Greenwood Press.
Satterthwaite, D., & Tacoli, C. (2003). A critical reviewof the role of small and intermediate centers innational, regional and local economies of low- andmiddle-income nations, with particular reference torural development and poverty reduction (Section3)—Prepared for the workshop ‘‘Integrating ruraldevelopment and small urban centers: An evolvingframework for effective regional and local economicdevelopment (March 18–19, 2003). Washington, DC:World Bank – IFC Headquarters.
Schoumaker, B., Dabire, B., & Gnoumou-Thiombiano,B. (2004). La collecte de biographies communau-taires pour l’analyse des determinants contextuels descomportements demographiques. L’experience d’uneenquete au Burkina Faso. Les travaux de l’UERD,14, 38.
Schoumaker, B. (2002). Note de synthese sur le plan desondage et le calcul des ponderations dans l’enquetebiographique EMIUB 2000 (EMIUB – Documenttechnique d’analyse No. 2002-02). Montreal: Uni-versite de Montreal, Departement de demographie.
Stark, O. (1986). Les recherches portant sur les migra-tions des campagnes vers les villes dans les PVD: etat
de la question et perspectives. In J. Havet (Ed.), Levillage et le bidonville: retention et migration despopulations rurales d’Afrique (pp. 63–78). Ottawa:Presses universitaires d’Ottawa/IDIC.
Stark, O. (1991). The migration of labor. Cambridge,Oxford: B. Blackwell.
Todaro, M. (1997). Urbanization, unemployment andmigration in Africa: Theory and policy. PolicyResearch Division Working Paper No. 104, Popula-tion Council, New York.
United Nations (1995). Report of the internationalconference on population and development. NewYork: United Nations.
United Nations (1998). National population policies.New York: United Nations (Department ofEconomic and Social Affairs, PopulationDivision).
United Nations (2002). World urbanization prospects:The 2001 revision. Data tables and highlights (Annualreport). New York: United Nations Secretariat,Population Division.
United Nations (2004). World population policies 2003.New York: United Nations (Department of Eco-nomic and Social Affairs, Population Division).
Vidal, C. (1991). Sociologie des passions. Paris: Karthala.Yaro, Y. C. (1994). Pourquoi l’expansion de l’ecole
primaire est-elle si difficile au Burkina Faso? Uneanalyse socio-demographique des determinants etdes perspectives scolaires de 1960 a 2006.Unpublished These de doctorat, Universite ParisI, Paris.