Migration and public policies: a further empirical analysis
12
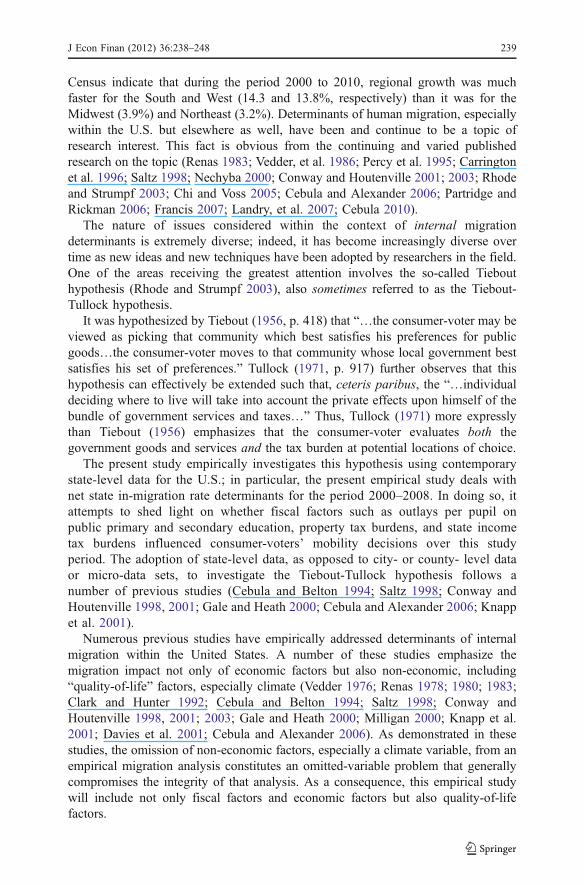
Migration and public policies: a further empirical analysis Richard J. Cebula & Usha Nair-Reichert Published online: 26 April 2011 # Springer Science+Business Media, LLC 2011 Abstract This study of internal migration at the state level empirically investigates the Tiebout hypothesis (as extended by Tullock) of “voting with one’ s feet.” In addition to its adoption of more current data (net migration from July, 2000 through July, 2008) than other related studies to date, the model differs from most previous comparable studies by including a separate cost of living variable and a measure of per capita state income tax burdens. We also test the hypothesis using two alternative specifications: one linear and the other semi-log. Finally, the analysis also provides both OLS and 2SLS estimates. The advantage of this multi-faceted approach is that it permits an assessment of how sensitive the results are to specification changes and to different estimation procedures. After controlling for economic factors and a quality of life/climate variable, migrants (consumer- voters) appear to prefer lower state income tax burdens, lower state plus local property tax burdens, and higher per pupil outlays on primary and secondary public education. Keywords Migration . State Income Taxation . Per-pupil Public Education Spending . Per-capita Property Taxation JEL Classification D72 . H71 . H72 1 Introduction Internal migration has increasingly become an important aspect of regional demographic change and economic growth. Preliminary results from the 2010 J Econ Finan (2012) 36:238–248 DOI 10.1007/s12197-011-9181-z R. J. Cebula (*) Walker/Wells Fargo Endowed Chair of Finance, Jacksonville University, Davis College of Business, Jacksonville, FL 32211, USA e-mail: [email protected] U. Nair-Reichert Economics Department, Georgia Institute of Technology, Atlanta, GA 30332, USA e-mail: [email protected]
-
Upload
independent -
Category
Documents
-
view
0 -
download
0
Transcript of Migration and public policies: a further empirical analysis
Migration and public policies: a furtherempirical analysis
Richard J. Cebula & Usha Nair-Reichert
Published online: 26 April 2011# Springer Science+Business Media, LLC 2011
Abstract This study of internal migration at the state level empirically investigates theTiebout hypothesis (as extended by Tullock) of “voting with one’s feet.” In addition to itsadoption of more current data (net migration from July, 2000 through July, 2008) thanother related studies to date, the model differs from most previous comparable studies byincluding a separate cost of living variable and a measure of per capita state income taxburdens.We also test the hypothesis using two alternative specifications: one linear and theother semi-log. Finally, the analysis also provides both OLS and 2SLS estimates. Theadvantage of this multi-faceted approach is that it permits an assessment of how sensitivethe results are to specification changes and to different estimation procedures. Aftercontrolling for economic factors and a quality of life/climate variable, migrants (consumer-voters) appear to prefer lower state income tax burdens, lower state plus local property taxburdens, and higher per pupil outlays on primary and secondary public education.
Keywords Migration . State IncomeTaxation . Per-pupil PublicEducationSpending .
Per-capita Property Taxation
JEL Classification D72 . H71 . H72
1 Introduction
Internal migration has increasingly become an important aspect of regionaldemographic change and economic growth. Preliminary results from the 2010
J Econ Finan (2012) 36:238–248DOI 10.1007/s12197-011-9181-z
R. J. Cebula (*)Walker/Wells Fargo Endowed Chair of Finance, Jacksonville University, Davis College of Business,Jacksonville, FL 32211, USAe-mail: [email protected]
U. Nair-ReichertEconomics Department, Georgia Institute of Technology, Atlanta, GA 30332, USAe-mail: [email protected]
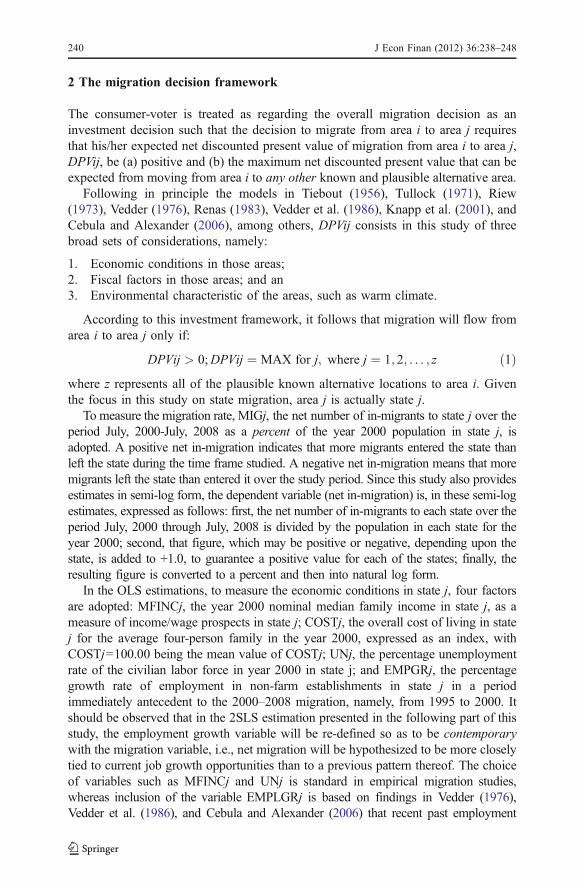
Census indicate that during the period 2000 to 2010, regional growth was muchfaster for the South and West (14.3 and 13.8%, respectively) than it was for theMidwest (3.9%) and Northeast (3.2%). Determinants of human migration, especiallywithin the U.S. but elsewhere as well, have been and continue to be a topic ofresearch interest. This fact is obvious from the continuing and varied publishedresearch on the topic (Renas 1983; Vedder, et al. 1986; Percy et al. 1995; Carringtonet al. 1996; Saltz 1998; Nechyba 2000; Conway and Houtenville 2001; 2003; Rhodeand Strumpf 2003; Chi and Voss 2005; Cebula and Alexander 2006; Partridge andRickman 2006; Francis 2007; Landry, et al. 2007; Cebula 2010).
The nature of issues considered within the context of internal migrationdeterminants is extremely diverse; indeed, it has become increasingly diverse overtime as new ideas and new techniques have been adopted by researchers in the field.One of the areas receiving the greatest attention involves the so-called Tiebouthypothesis (Rhode and Strumpf 2003), also sometimes referred to as the Tiebout-Tullock hypothesis.
It was hypothesized by Tiebout (1956, p. 418) that “…the consumer-voter may beviewed as picking that community which best satisfies his preferences for publicgoods…the consumer-voter moves to that community whose local government bestsatisfies his set of preferences.” Tullock (1971, p. 917) further observes that thishypothesis can effectively be extended such that, ceteris paribus, the “…individualdeciding where to live will take into account the private effects upon himself of thebundle of government services and taxes…” Thus, Tullock (1971) more expresslythan Tiebout (1956) emphasizes that the consumer-voter evaluates both thegovernment goods and services and the tax burden at potential locations of choice.
The present study empirically investigates this hypothesis using contemporarystate-level data for the U.S.; in particular, the present empirical study deals withnet state in-migration rate determinants for the period 2000–2008. In doing so, itattempts to shed light on whether fiscal factors such as outlays per pupil onpublic primary and secondary education, property tax burdens, and state incometax burdens influenced consumer-voters’ mobility decisions over this studyperiod. The adoption of state-level data, as opposed to city- or county- level dataor micro-data sets, to investigate the Tiebout-Tullock hypothesis follows anumber of previous studies (Cebula and Belton 1994; Saltz 1998; Conway andHoutenville 1998, 2001; Gale and Heath 2000; Cebula and Alexander 2006; Knappet al. 2001).
Numerous previous studies have empirically addressed determinants of internalmigration within the United States. A number of these studies emphasize themigration impact not only of economic factors but also non-economic, including“quality-of-life” factors, especially climate (Vedder 1976; Renas 1978; 1980; 1983;Clark and Hunter 1992; Cebula and Belton 1994; Saltz 1998; Conway andHoutenville 1998, 2001; 2003; Gale and Heath 2000; Milligan 2000; Knapp et al.2001; Davies et al. 2001; Cebula and Alexander 2006). As demonstrated in thesestudies, the omission of non-economic factors, especially a climate variable, from anempirical migration analysis constitutes an omitted-variable problem that generallycompromises the integrity of that analysis. As a consequence, this empirical studywill include not only fiscal factors and economic factors but also quality-of-lifefactors.
J Econ Finan (2012) 36:238–248 239
2 The migration decision framework
The consumer-voter is treated as regarding the overall migration decision as aninvestment decision such that the decision to migrate from area i to area j requiresthat his/her expected net discounted present value of migration from area i to area j,DPVij, be (a) positive and (b) the maximum net discounted present value that can beexpected from moving from area i to any other known and plausible alternative area.
Following in principle the models in Tiebout (1956), Tullock (1971), Riew(1973), Vedder (1976), Renas (1983), Vedder et al. (1986), Knapp et al. (2001), andCebula and Alexander (2006), among others, DPVij consists in this study of threebroad sets of considerations, namely:
1. Economic conditions in those areas;2. Fiscal factors in those areas; and an3. Environmental characteristic of the areas, such as warm climate.
According to this investment framework, it follows that migration will flow fromarea i to area j only if:
DPVij > 0;DPVij ¼ MAX for j; where j ¼ 1; 2; . . . ; z ð1Þwhere z represents all of the plausible known alternative locations to area i. Giventhe focus in this study on state migration, area j is actually state j.
To measure the migration rate, MIGj, the net number of in-migrants to state j over theperiod July, 2000-July, 2008 as a percent of the year 2000 population in state j, isadopted. A positive net in-migration indicates that more migrants entered the state thanleft the state during the time frame studied. A negative net in-migration means that moremigrants left the state than entered it over the study period. Since this study also providesestimates in semi-log form, the dependent variable (net in-migration) is, in these semi-logestimates, expressed as follows: first, the net number of in-migrants to each state over theperiod July, 2000 through July, 2008 is divided by the population in each state for theyear 2000; second, that figure, which may be positive or negative, depending upon thestate, is added to +1.0, to guarantee a positive value for each of the states; finally, theresulting figure is converted to a percent and then into natural log form.
In the OLS estimations, to measure the economic conditions in state j, four factorsare adopted: MFINCj, the year 2000 nominal median family income in state j, as ameasure of income/wage prospects in state j; COSTj, the overall cost of living in statej for the average four-person family in the year 2000, expressed as an index, withCOSTj=100.00 being the mean value of COSTj; UNj, the percentage unemploymentrate of the civilian labor force in year 2000 in state j; and EMPGRj, the percentagegrowth rate of employment in non-farm establishments in state j in a periodimmediately antecedent to the 2000–2008 migration, namely, from 1995 to 2000. Itshould be observed that in the 2SLS estimation presented in the following part of thisstudy, the employment growth variable will be re-defined so as to be contemporarywith the migration variable, i.e., net migration will be hypothesized to be more closelytied to current job growth opportunities than to a previous pattern thereof. The choiceof variables such as MFINCj and UNj is standard in empirical migration studies,whereas inclusion of the variable EMPLGRj is based on findings in Vedder (1976),Vedder et al. (1986), and Cebula and Alexander (2006) that recent past employment
240 J Econ Finan (2012) 36:238–248
growth is a magnet for migrants. The adoption of a variable such as COSTj is becomingmore common (Renas 1978, 1980, 1983; Cebula 1979; Conway and Houtenville 1998,2001; 2003; Gale and Heath 2000; Cebula and Alexander 2006).
To measure fiscal factors, three variables are adopted. PCPERSINCTXj is theyear 2000 nominal per capita state personal income tax liability in state j, which hasoften been overlooked in studies of a Tiebout-type framework, although it has beenconsidered more recently (Conway and Houtenville 2001; Cebula and Alexander2006). PCLPROPTXj is defined as the year 2000 state plus local (city plus county)property tax liability per capita in state j, which has historically been considered instudies of a Tiebout-type framework (Pack 1973; Barsby and Cox 1975; Greene1977; Liu 1977; Renas 1980; Conway and Houtenville 1998, 2001; Gale and Heath2000; Rhode and Strumpf 2003; Cebula 2010). Finally, the variable PPUPILj is thenominal outlay in state j per pupil on primary and secondary public education in theyear 2000; PPUPILj replaces the very commonly adopted variable per capita publiceducation outlays (Pack 1973; Greene 1977; Hinze 1977; Cebula 1979; Renas 1980;Conway and Houtenville 1998, 2001; Gale and Heath 2000; Rhode and Strumpf2003).
Finally, to measure environmental conditions in state j, the focus is on a singlefactor, JANTEMPj, the mean January temperature in state j (1971–2000), as ameasure of warmer climatic conditions. As in so many migration studies (Renas1978; 1980; 1983; Clark and Hunter 1992; Cebula and Belton 1994; Saltz 1998;Conway and Houtenville 1998, 2001; 2003; Gale and Heath 2000; Milligan 2000;Davies et al. 2001; Cebula and Alexander 2006), this variable or a close substitutefor same is adopted as a quality-of-life control variable. As is typically the casein these studies, it is expected that warm climate is likely to increase the netinflow of migrants as a reflection of their typical preference for warmer climate,ceteris paribus. Interestingly, although alternative quality-of-life variables, suchas toxic chemical releases and the number of hazardous waste sites in a state wereconsidered, they tended to have two common traits in this model: (a) themanifesting of statistical insignificance at even the 10% level; and (b) theintroduction of multicollinearity into the system, especially with MFINCj, COSTj,and UNj. Hence, we simply adopted the JANTEMP variable.
The initially reduced-form equations to be estimated are given by (2) and (3):
MIGj ¼ a0 þ a1 MFINCjþ a2 COSTjþ a3 PCPERSINCTXjþ a4 EMPLGRj
þ a5 PPUPILjþ a6 UNjþ a7 JANTEMPjþ a8 PCLPROPTXjþ u
ð2Þwhere a1 >0, a2 <0, a3 <0, a4 >0, a5>0, a6<0, a7>0, a8<0
lnMIG j ¼ b0 þ b1 MFINCjþ b2 COSTjþ b3 PCPERSINCTXj
þ b4 EMPLGRjþ b5 PPUPILjþ b6 UNjþ b7 JANTEMPj
þ b8 PCLPROPTXjþ u0 ð3Þ
where b1 >0, b2 <0, b3 <0, b4 >0, b5>0, b6<0, b7>0, b8<0In Eq. (3), +
J Econ Finan (2012) 36:238–248 241
lnMIGj=the natural log of MIGj, as explained above; a0, b0=constant terms; andu, u’=stochastic error terms.
The study includes all 50 states but excludes Washington, D.C. as an outlier;indeed, its inclusion altered the results for several variables. Moreover, it can beargued as a legitimate omission since it is technically not a state. In fact, inclusion ofWashington, D.C. could well raise the question of whether Puerto Rico should havebeen included in the study. Finally, omission of Washington, D.C. is consistent withmost previous migration studies of the U.S.
The data source for the variable MIGj is the U.S. Census Bureau (2010,Tables 12, 15). The sources for variables MFINCj, and COSTj are the U.S. CensusBureau (2005, Table 572) and ACCRA (2001), respectively. The data for variableUNj were obtained from the U.S. Census Bureau (2009, Table 609). The data forvariable EMPLGRj were generated from the U.S. Census Bureau (2002, Table 602).The source for variable TEMPj was the U.S. Census Bureau (2005, Table 377). Thedata for the variables PCPERSINCTXj, PCLPROPTXj, and PPUPILj are from U.S.Census Bureau (2005, Tables 455, 456). Based on the conventional wisdom, asexpressed by Tiebout (1956), Tullock (1971), as well as Riew (1973), and morerecently by Conway and Houtenville (2001) and Cebula and Alexander (2006),among others, the following coefficient signs (each case assumes ceteris paribus) arehypothesized:
3 Empirical results: OLS, 2SLS
3.1 OLS estimations
This empirical sub-section of this study first provides the OLS estimation results,which arguably are less compelling than the 2SLS results found in the followingempirical section. The reasoning underlying this qualifying statement is provided ata later stage of the study.
The model expressed in Eq. (2) is in linear form (Model 1), whereas the modelexpressed in Eq. (3) is in semi-log form (Model 2). Table 1 below presents bothspecifications (Model 1 and Model 2) estimated by ordinary least squares (OLS),with the White (1980) correction for heteroskedasticity adopted.
The results in estimates in Model 1 and Model 2 are qualitatively very similar toone another, as well as entirely consistent with the expected signs summarized in (2)and (3) above. In Model 1, all eight of the estimated coefficients exhibit thehypothesized signs, with four statistically significant at the 1% level, threestatistically significant at the 5% level, and one statistically significant at the 10%level. The coefficient of determination indicates that the model explains two-fifths ofthe migration rate variation. The F-statistic is significant at the 1% level, indicatingthe overall strength of the model.
In Model 2, all eight of the estimated coefficients exhibit the expected signs, withseven being statistically significant at the 1% level and one being statisticallysignificant at the 10% level. The coefficient of determination indicates that thevariables in the model explain roughly two-thirds of the variation in the dependentvariable. The F-statistic is significant at the 1% level, attesting to the overall strength
242 J Econ Finan (2012) 36:238–248

of the model. Overall, a comparison of the two sets of results provided in Table 1could lead to the conclusion that the semi-log specification yields more robust resultsthan the linear specification.
These two OLS estimates, which arguably should be regarded as preliminary dueto the simplicity of the relationship assumed between migration and past job growth,imply that both the net state in-migration rate per se, and the net state in-migrationrate expressed in natural log form per se, over the study period were, ashypothesized, an increasing function of nominal median family income and adecreasing function of the overall cost of living. These results would certainly appearto conform to the conventional wisdom, and they imply that migrants (consumer-voters) prefer higher income locations and also manifest an aversion to states withhigher living-cost levels, the latter suggesting that consumer-voters are not subject to“money illusion.” In addition, as shown in both models, the coefficient on the recentpast employment growth rate variable is positive and statistically significant at the1% level, leading to the inference that migrants prefer to move to states with higherprevious-period employment growth rates, everything else the same. Finally, there ismodest evidence (10% statistical significance levels) that higher unemployment ratesacted as a deterrent to net in-migration, presumably as reflection of less favorableprospects of employment. This variable complements the results for variablesEMPLGRj and MFINCj.
Table 1 OLS estimates of the Tiebout-Tullock hypothesis
Model 1 dependent variable: MIG Model 2 dependent variable: lnMIG
MFINC 0.00018* 0.00004 *
(+2.82) (+4.29)
COST −0.152** −0.0335 *
(−2.65) (−5.51)EMPLGR 0.005** 0.00125 *
(+2.33) (+4.05)
PCPERSINCTX −0.0032** −0.0005 *
(−2.12) (−3.46)PPUPIL 0.00067** 0.00013*
(+2.43) (+3.39)
UN −0.583*** −0.094 ***
(−1.93) (−1.98)JANTEMP 0.117* 0.021 *
(+3.38) (+5.08)
PCLPROPTX −0.0003* −0.00008 *
(−3.17) (−5.76)No. observations 50 50
R2 0.40 0.67
adjR2 0.30 0.60
T-values are in parentheses. ***, **, and * indicate 10%, 5% and 1% level of significance respectively
J Econ Finan (2012) 36:238–248 243
The estimated coefficient on JANTEMPj is positive and statistically significant atthe 1% level in both estimates, suggesting that environments having warmer climatesappear to be more attractive to migrants (Renas 1983; Clark and Hunter 1992; Saltz1998; Conway and Houtenville 1998, 2001; Gale and Heath 2000; Cebula 2010).
Next, the three variables reflecting our interpretation of the Tiebout-Tullockhypothesis are considered. The coefficient on the nominal per capita state personalincome tax burden (PCPERSINCTXj) is negative, as hypothesized, and statisticallysignificant at the 5% and 1% levels in models 1 and 2, respectively. Thus, consumer-voters appear to have an aversion to higher state personal income tax burdens. Inaddition, the estimated coefficient on the variable reflecting the nominal outlay perpupil in states on primary and secondary public education (PPUPILj) is positive andstatistically significant at the 3% level in model 1 and at the 1% level in model 2.Hence, it appears that, overall, consumer-voters prefer locating in states committinggreater financial resources per pupil to primary and secondary public education. This“appreciation” for public education prioritization could reflect expected directbenefits (e.g., for parents with school-age children) and/or an awareness of thepositive externalities of education. Finally, the estimated coefficients on the propertytax variable (PCLPROPTXj) are negative and statistically significant at the 1% levelin both models, implying that consumer-voters prefer residence in states with lowerstate plus local property tax liabilities. All of these results are generally consistentwith most of the earlier studies of the Tiebout or Tiebout/Tullock framework.
3.2 2SLS estimation
This sub-section of the study seeks not only to test the robustness of the variables inthe basic model in Eqs. (2) and (3) and thereby to confirm insights into the Tiebout(1956)-Tullock (1971) hypothesis but also to test a somewhat different and perhapsmore plausible specification of the original model. In particular, it could bereasonably argued that net in-migration is influenced more extensively by thecurrent growth pattern in employment than by employment growth patterns from aprevious time period. This is because current job growth is clearly a more directmeasure of potential current job opportunities than employment growth from anearlier period. Thus, it can be inferred that current employment growth positivelyimpacts current migration decisions, at least for those consumer-voters still in thelabor force. Thus, the greater the percentage employment growth rate in state j from2000 through 2008 (EMPLGR00-08j), the greater the overall net in-migration rate tostate j is likely to be, ceteris paribus.
Naturally, given that migration and EMPLGR00-08j are contemporaneous in thisnew specification, the possibility of simultaneity bias (two-way causality) clearlyexists, a perspective overlooked by many previous related studies (e.g., DeJong andDonnelly 1973; Sommers and Suits 1973; Renas 1980; Cebula 2010), but not by allsuch studies (Liu 1977; Cebula 1979). Accordingly, the model, with the variableEMPLGR00-08j replacing variable EMPLGRj, is to be estimated by 2SLS. Theinstrument for the new employment growth variable is the percentage growth rate ofthe per capita gross state product in state j over the period 1995–1999,PGRPCGSP95-99j (U.S. Census Bureau 2002, Tables 607, 17). The choice ofinstrument is based on the findings that PGRPCGSP95-99j is highly correlated with
244 J Econ Finan (2012) 36:238–248
the variable EMPLGR00-08j while being uncorrelated with the error terms in thesystem.
Based upon the new specification, the following two models are now to beestimated by 2SLS:
MIGj ¼ c0 þ c1 MFINCjþ c2 COSTjþ c3 PCPERSINCTXjþ c4 EMPLGR00
� 08jþ c5 PPUPILjþ c6 UNjþ c7 JANTEMPjþ c8 PCLPROPTXjþ u0
ð4Þ
lnMIGj ¼ c0 þ c1 MFINCjþ c2 COSTjþ c3 PCPERSINCTXj
þ c4 EMPLGR00� 08jþ c5 PPUPILjþ c6 UNjþ c7 JANTEMPj
þ c8 PCLPROPTXjþ u0 ð5Þ
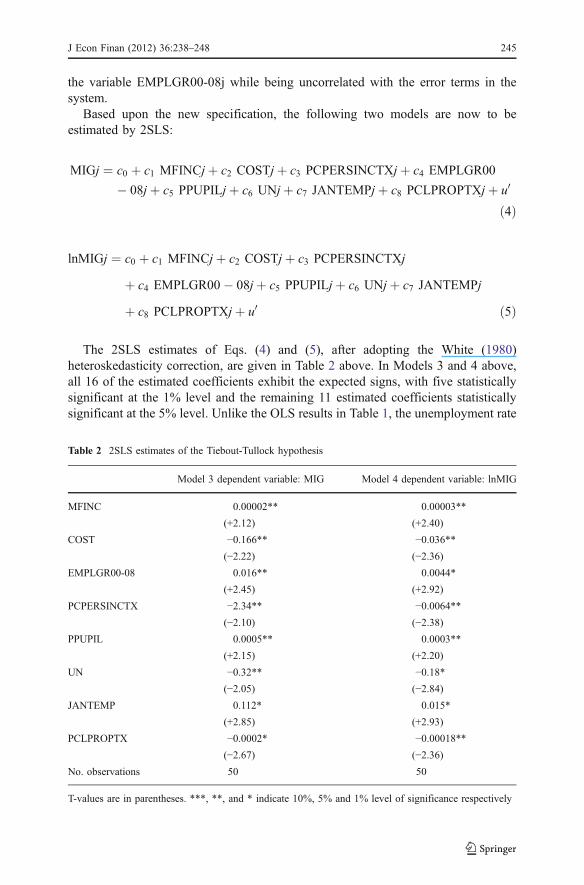
The 2SLS estimates of Eqs. (4) and (5), after adopting the White (1980)heteroskedasticity correction, are given in Table 2 above. In Models 3 and 4 above,all 16 of the estimated coefficients exhibit the expected signs, with five statisticallysignificant at the 1% level and the remaining 11 estimated coefficients statisticallysignificant at the 5% level. Unlike the OLS results in Table 1, the unemployment rate
Table 2 2SLS estimates of the Tiebout-Tullock hypothesis
Model 3 dependent variable: MIG Model 4 dependent variable: lnMIG
MFINC 0.00002** 0.00003**
(+2.12) (+2.40)
COST −0.166** −0.036**(−2.22) (−2.36)
EMPLGR00-08 0.016** 0.0044*
(+2.45) (+2.92)
PCPERSINCTX −2.34** −0.0064**(−2.10) (−2.38)
PPUPIL 0.0005** 0.0003**
(+2.15) (+2.20)
UN −0.32** −0.18*(−2.05) (−2.84)
JANTEMP 0.112* 0.015*
(+2.85) (+2.93)
PCLPROPTX −0.0002* −0.00018**(−2.67) (−2.36)
No. observations 50 50
T-values are in parentheses. ***, **, and * indicate 10%, 5% and 1% level of significance respectively
J Econ Finan (2012) 36:238–248 245
variable is now statistically significant at either the 5% level [in Model 3] or at the1% level [in Model 4] rather than at only the 10% level, whereas all of the otherregressors in the model remain statistically significant at the 5% level or beyond.Thus, these 2SLS estimates may provide more useful results than the OLS estimatesdo. Furthermore, the new employment growth variable (EMPLGR00-08j), which iscontemporaneous with the migration variable, is more appealing analytically than itspredecessor (EMPLGRj) while being statistically significant at the 1% level. Indeed,its magnitude is more than three times the size of its counterpart in both Models 1and 2.
Clearly, these 2SLS findings imply that the net in-migration rate as well as thenatural log of the net in-migration rate are an increasing function of median familyincome, current/recent employment growth, and warmer climate and a decreasingfunction of the cost of living and the unemployment rate. Furthermore, net state in-migration per se and net state migration in its natural log form are a decreasingfunction of state income tax burdens and state plus local property tax burdens and anincreasing function of per pupil public primary and secondary education funding.Obviously, the latter three results are compatible with Tiebout (1956) and Tullock(1971).
4 Conclusions
This empirical study has investigated economic, fiscal, and non-economic (quality-of-life) determinants of net in-migration in the U.S. over the 2000–2008 period, withthe specific intent of investigating whether there continues to be empirical supportfor the Tiebout (1956)-Tullock (1971) hypothesis. Both OLS and 2SLS results areprovided. Indeed, using each estimation technique, both a linear model is estimatedand then a semi-log model is estimated, with the 2SLS estimations involving anewly specified employment growth variable that is contemporaneous with themigration flow.
The findings provided in this study do in fact support the hypothesis from Tiebout(1956) and Tullock (1971) in terms of the contemporary mobility of consumer-voters. Both the linear and semi-log specifications allow for four purely economicfactors, a climate control variable, and three fiscal factors.
All four of the estimates yield results suggesting consistently that migrants(consumer-voters) prefer lower state income tax burdens, lower state plus localproperty tax burdens, and higher per pupil outlays on public primary and secondaryeducation in states. Thus, the search for “fiscal surplus” appears to be ongoing.1
Consequently, policymakers in each of the states should be very cautious inestablishing income tax policies and those policies involving per pupil publiceducation spending as well as property tax burdens, lest they suffer the wrath ofconsumer-voter flight to more fiscally appealing states.
1 The reader may wish to see the earlier observations by Buchanan (1950) and West, Hamilton, andLoomis (1976).
246 J Econ Finan (2012) 36:238–248

References
ACCRA (2001) The council for community and economic research.Barsby SL, Cox DR (1975) Interstate migration of the elderly. Lexington Books, LexingtonBuchanan JM (1950) Federalism and fiscal equity. Am Econ Rev 54(5):583–589Carrington W, Detragiache E, Vishwanath T (1996) Migration and Endogenous moving costs. Am Econ
Rev 86(4):909–930Cebula RJ (1979) The determinants of human migration. Lexington Books, LexingtonCebula RJ (2010) The effect of state and local taxes and spending in migration. State Tax Notes 56
(13):1029–1035Cebula RJ, Alexander G (2006) Determinants of net interstate migration, 2000–2004. J Reg Anal Policy
27(2):116–123Cebula RJ, Belton WJ (1994) Voting with one’s feet: an analysis of public welfare and migration of the
American Indian. Am J Econ Sociol 53(3):273–280Census Bureau US (2002) Statistical abstract of the United States, 2002. U.S. Government Printing Office,
Washington, D.CCensus Bureau US (2005) Statistical abstract of the United States, 2004–2005. U.S. Government Printing
Office, Washington, D.CCensus Bureau US (2009) Statistical abstract of the United States, 2009. U.S. Government Printing Office,
Washington, D.CCensus Bureau US (2010) Statistical abstract of the United States, 2010. U.S. Government Printing Office,
Washington, D.CChi G, Voss PR (2005) Migration decision-making: a hierarchical regression approach. J Reg Anal Policy
35(2):11–22Clark DE, Hunter WJ (1992) The impact of economic opportunity, amenities, and fiscal factors in age-
specific migration rates. J Reg Sci 32(3):349–365Conway KS, Houtenvile AJ (2003) Out with the old, in with the old: a closer look at younger versus older
elderly migration. Soc Sci Q 84(2):309–328Conway KS, Houtenville AJ (1998) Do the elderly ‘vote with their feet’? Public Choice 97(1):63–85Conway KS, Houtenville AJ (2001) Elderly migration and state fiscal policy: evidence from the 1990
census migration flows. Natl Tax J 54(1):103–123Davies PS, Greenwood MJ, Li H (2001) A conditional logit approach to U.S. state-to-state migration. J
Reg Sci 41(2):337–357DeJong GJ, Donnelly WL (1973) Public welfare and migration of the poor. Soc Sci Q 16(1):329–344Francis J (2007) Asymmetries in regional labor markets, migration, and economic geography. Ann Reg
Sci 41(1):124–144Gale LR, Heath WC (2000) Elderly internal migration in the U.S. revisited. Public Finance Rev 28
(2):153–157Greene KV (1977) Spillovers, migration, and public school expenditures: the repetition of an experiment.
Public Choice 29(1):85–93Hinze KE (1977) Net migration to metropolitan areas. University of Chicago Press, ChicagoKnapp TA, White NE, Clark DE (2001) A nested logit approach to household mobility. J Reg Sci 41(1):1–
22Landry CE, Bin O, Hindsley P, Whitehead JC, Wilson K (2007) Going home: evacuation migration
decisions of hurricane katrina Survivors. South Econ J 74(2):326–343Liu BC (1977) Local government finance and metropolitan employment growth: a simultaneous-equations
model. South Econ J 43(4):1379–1385Milligan J (2000) Migration and age: the effects of age on sensitivity to migration stimuli. Reg Stud 34
(4):521–533Nechyba T (2000) Mobility, targeting, and private-school vouchers. Am Econ Rev 90(1):130–146Pack JR (1973) Determinants of migration to central cities. J Reg Sci 13(2):249–260Partridge MD, Rickman DS (2006) An SVAR model of fluctuations in U.S. migration flows and state
labor markets. South Econ J 72(4):958–980Percy SL, Hawhins BW, Maier PE (1995) Revisiting Tiebout: moving rationales and interjurisdictional
relocation. Publius J Federalism 25(2):1–17Renas SM (1978) The cost of living, labor market opportunities, and the migration decision. Ann Reg Sci
15(1):95–104Renas SM (1980) An empirical note on the Tiebout-tullock hypothesis: comment. Q J Econ 94(3):619–623
J Econ Finan (2012) 36:238–248 247

Renas SM (1983) The cost of living, labor market opportunities, and the migration decision: more onproblems of misspecification and Aggregation Bias. Ann Reg Sci 17(1):98–110
Rhode PW, Strumpf KS (2003) Assessing the importance of Tiebout sorting: local heterogeneity from1950 to 1990. Am Econ Rev 93(5):1648–1677
Riew J (1973) Migration and public policy. J Reg Sci 12(2):65–73Saltz IS (1998) State income taxation and geographic labor force mobility in the United States. Appl Econ
Lett 5(5):599–604Sommers PM, Suits DB (1973) An analysis of net interstate migration. South Econ J 40(2):193–201Tiebout CM (1956) A pure theory of local expenditures. J Polit Econ 64(1):416–424Tullock G (1971) Public expenditures as public goods. J Polit Econ 79(5):913–918Vedder RK (1976) The American economy in historical perspective. Wadsworth, BelmontVedder RK, Gallaway LE, Graves PE, Sexton R (1986) An historical perspective in interregional
migration in the U.S. In: Krumm RJ (ed) Housing and migration. Blackstone Books, Mount Pleasant,MI, pp 101–124
West DA, Hamilton JR, Loomis RA (1976) A conceptual framework for guiding policy-related researchon migration. Land Econ 52(1):66–76
White H (1980) A heteroskedasticity-consistent covariance matrix and a direct test for heteroskedasticity.Econometrica 48(4):817–838
248 J Econ Finan (2012) 36:238–248

Copyright of Journal of Economics & Finance is the property of Springer Science & Business Media B.V. and
its content may not be copied or emailed to multiple sites or posted to a listserv without the copyright holder's
express written permission. However, users may print, download, or email articles for individual use.