Testing and Further Development of RIVPACS
145
Research Contractor CEH Dorset Testing and Further Development of RIVPACS Stage 3 Report R&D Technical Report E1-007/TR J F Wright, J M Winder, R T Clarke and J Davy-Bowker
-
Upload
khangminh22 -
Category
Documents
-
view
3 -
download
0
Transcript of Testing and Further Development of RIVPACS
Research ContractorCEH Dorset
Testing and Further Development of RIVPACSStage 3 Report
R&D Technical Report E1-007/TR
J F Wright, J M Winder, R T Clarke and J Davy-Bowker

R&D TECHNICAL REPORT E1-007/TR
Publishing OrganisationEnvironment Agency, Rio House, Waterside Drive, Aztec West, Almondsbury, BristolBS32 4UDTel: 01454 624400 Fax: 01454 624409Website: www.environment-agency.gov.uk
ISBN : 1 8570 56922
© Environment Agency 2002
All rights reserved. No part of this document may be produced, stored in a retrieval system, ortransmitted, in any form or by any means, electronic, mechanical, photocopying, recording orotherwise without the prior permission of the Environment Agency.
The views expressed in this document are not necessarily those of the Environment Agency. Itsofficers, servants or agents accept no liability whatsoever for any loss or damage arising fromthe interpretation or use of the information, or reliance upon the views contained herein.
Dissemination StatusInternal: Released to RegionsExternal: Released to Public Domain
Statement of UseThis report is part of the output from a project to test and further develop RIVPACS (acomputer programme which predicts the river macroinvertebrate communities to be expected athigh quality sites). It comprises four chapters which evaluate:
• The possible external market for RIVPACS (Package 2)• The educational value of RIVPACS (Package 4)• The use of RIVPACS for evaluating trophic structure (Package 8)• The use of RIVPACS in the context of biodiversity and sustainability (Package 13)
The report is to be used by the Agency to:• Inform biologists of the value of using RIVPACS in relation to trophic structure and
biodiversity• Advise the Agency on the use of RIVPACS in an educational context• Guide the Agency to ensure that the most appropriate options are progressed in any
future RIVPACS development
KeywordsRIVPACS; Biological monitoring; macroinvertebrates; market evaluation; educational tools;functional feeding groups; biodiversity; sustainability.
Research ContractorThis document was produced under R&D Project E1-007 by:CEH Dorset, Winfrith Technology Centre, Winfrith Newburgh, Dorchester DT2 8ZDTel : 01305 213500 Fax : 01305 213600
Environment Agency Project ManagerThe Environment Agency’s Project Manager for R&D Project E1-007 was:Dr R A Dines, Southern Region
Further copies of this report are available from:Environment Agency R&D Dissemination CentreWRc, Frankland Road, Swindon, Wilts. SN5 8YFTel: 01793 865000 Fax: 01793 514562 E-mail: [email protected]

R&D TECHNICAL REPORT E1-007/TR i
ACKNOWLEDGEMENTS
This research project was funded by the Environment Agency. We would like to thankthe Agency for continuing to support the development of RIVPACS. In particular, weare grateful for the help and guidance provided by the Agency’s designated ProjectManager, Dr R A Dines and Management Coordinator, Ms P Mardon. Thanks also toMr B Hemsley-Flint, who managed the early stages of the project, and toDr J Murray-Bligh for the initial specification. Finally, we also acknowledge thedetailed information provided by Ms L Taylor, the National Education ProgrammeCoordinator at the Environment Agency.

R&D TECHNICAL REPORT E1-007/TR ii

R&D TECHNICAL REPORT E1-007/TR iii
EXECUTIVE SUMMARY
This project on the development of new RIVPACS methodologies comprises a total often separate work packages of which four received attention in earlier reports (Wright etal. 1999, Clarke and Wright 2000). The current report presents the results of a furtherfour packages (numbers 2, 4, 8 and 13). The final two packages (9 and 12) will bereported separately in Stages 4 and 5 reports respectively.
Package 2: Market evaluation of the β-test version of RIVPACSby J F Wright
The development of a β-test version of RIVPACS III, primarily for purchase bycommercial organisations, is described. The package, which included the 1995RIVPACS III software, various manuals and software support from the Institute ofHydrology was launched in January 1997 at a cost of £2,200 + Value Added Tax(VAT).
Uptake has been minimal (2 copies sold) with most potential buyers probably beingdeterred by a combination of the price, the need for stringent field and laboratoryprotocols and the fact that the current software is not particularly user-friendly.
However, enquiries from a range of educational establishments on the availability ofRIVPACS have been substantial, confirming our view that there would be a market fora simplified and user-friendly version of the system for purchase at nominal cost (seebelow).
Package 4: Development of educational tools based on RIVPACSby J M Winder
The overall objective of this limited desk-study is to provide the Environment Agencywith the major options for future development of educational tools based on RIVPACS.The Agency now has its own Education Section and the expertise to undertake a fullscoping study prior to any specific developments.
Initially, a review was undertaken of the main subjects at primary, secondary andtertiary level where educational tools based on RIVPACS could be relevant.
A more detailed assessment of the need for, and relevance of, new educational materialwas then obtained through liaison with the Communications Directorate of NERC andmore particularly through the National Education Programme Coordinator of theEnvironment Agency. The procedures followed by the Agency when undertaking fullscoping studies, including broad educational principles, subject-specific considerationsand practical issues were all reviewed with respect to educational tools based onRIVPACS.
This was followed by an attempt to provide sound advice on potential educationalproducts for which there is the greatest need. It is now clear that the first priority mustbe to develop a user-friendly Windows version of RIVPACS, initially for use by theEnvironment Agency, but also with the capability of being further modified. The

R&D TECHNICAL REPORT E1-007/TR iv
creation of a web site would be an efficient way of making the new version accessibleto the Agency but would also enable customised versions with appropriate manuals tobe accessed by paying professional customers through the use of passwords.
Simplified and user-friendly versions of RIVPACS for use at the undergraduate leveland within secondary schools at both A and GCSE levels, could be delivered via thesame route together with ancillary products geared to the appropriate level. BelowGCSE level in secondary schools and within primary schools, the emphasis should beon appropriate ancillary products aimed at National Curriculum Key Stages 1-4, withonly brief reference to RIVPACS or possibly a simple ‘play’ version of the system.
Foremost amongst the ancillary products would be development of an interactive on-line key for identifying macroinvertebrates at Biological Monitoring Working Party(BMWP) family level based on ‘LucID’. An ability to identify the fauna to the level ofBMWP families is essential when using RIVPACS and is an ideal route for introducingthe effects of organic pollution on stream fauna to undergraduates and school children.
A number of other ancillary products which meet the requirements of the NationalCurriculum are also proposed. These include downloadable information for bothteachers and students relating to the habitats and life histories of macroinvertebrates,illustrative material, sampling kit lists and simplified versions of field manuals andsampling videos.
Whereas CEH would need to have major input to the development of the Windowsversion of RIVPACS and a number of the ancillary products, it is clear that theEnvironment Agency is best placed to undertake the full scoping study, interact withcomputer software development companies and approach potential sponsors of theeducational products.
Finally, the report indicates how potential RIVPACS products would link to the policiesof the Environment Agency and integrate with and complement existing Agencyinitiatives in the field of education.
Package 8: An appraisal of RIVPACS for evaluating trophic structureby R T Clarke, J F Wright and J Davy-Bowker
RIVPACS currently offers a procedure for predicting the taxa to be expected at a goodquality site, that is, it provides information on the structure of the expectedmacroinvertebrate assemblage. Benthic invertebrates play an essential role in foodwebs, productivity, nutrient cycling and decomposition processes, and hence newinsights may result from considering the functioning of these complex assemblages oforganisms.
Schemes based on macroinvertebrate functional feeding groups (e.g. shredders,scrapers, collector gatherers, collector filterers and predators) have often been usedalongside the ‘River Continuum Concept’ in an attempt to demonstrate progressivechanges in the relative importance of these functional feeding groups as environmentalconditions and available food resources change along the length of a river system.

R&D TECHNICAL REPORT E1-007/TR v
The 614 reference sites in the RIVPACS dataset provide a means of examining whetherthere are meaningful Functional Feeding Group (FFG) patterns and downstream trendsacross a range of high quality sites. If clear patterns were to be found, then they wouldprovide a baseline against which to assess FFGs from impacted sites and a newviewpoint from which to interpret the cause of the stress.
All analyses were undertaken at family level so that log abundance data could be used.Abundance data, rather than presence/absence data, is crucial to a study designed toprovide insights into the functioning of the system. Following a literature review, eachfamily in the RIVPACS dataset was assigned to one or more functional feeding groupson a proportional basis. A dominant FFG was also assigned, but only used in somepreliminary analyses because the use of the proportional approach to assigning FFGswas regarded as more realistic and robust. Procedures were then devised for calculatingthe observed and expected relative abundance of the various FFGs by summing the logabundance categories.
When the mean relative abundances of the five FFGs were examined in relation todistance downstream using the 614 RIVPACS sites, the observed patterns were in broadagreement with the predictions of the River Continuum Concept (RCC). That is,shredders had their highest relative abundance in headwater streams (<5 km fromsource), whilst scrapers increased very slightly downstream, peaking in the 41-84 kmdownstream category. Collectors (gatherers and filterers) maintained a dominant andrelatively stable role downstream, except in the 85-203 km downstream category wherethere was a slight increase in the gatherer filterer component. The predator category wasalso very stable downstream, with only a very slight rise with increasing distancedownstream.
Overall, the mean relative abundances derived from the 614 RIVPACS reference siteswere 10% shredders, 27% scrapers, 30% collector gatherers, 10% collector filterer and23% predators. These average percentages were approximately the same, regardless ofseason.
Examination of the relative abundance of each FFG along the length of each of threecontrasting rivers in England and Wales provided some evidence of longitudinalpattern, as expected in the RCC, but it also highlighted some unexpected between-sitevariations. These may have been the result of discontinuities along the rivers whichimpacted on food resources and hence FFGs. Alternatively, they could be ademonstration of the limitations of the RIVPACS sampling technique, which isdesigned to acquire maximum information for limited effort, without resorting to a verytime-consuming quantitative sampling programme.
Differences between the observed relative abundance of each FFG in the 35TWINSPAN groups of the RIVPACS classification were shown to be statisticallyhighly significant. Despite this, the relative abundance of the five FFGs varied in a lessconsistent manner with the environmental characteristics of the sites than the BMWPindices and in particular ASPT. Hence, RIVPACS will be less effective at predicting theexpected relative abundance of FFGs than the expected value of BMWP indices.
Following this appraisal of the behaviour of the FFGs across the RIVPACS sites, it wasnecessary to examine how the relative abundance of the FFGs varied with site quality.
R&D TECHNICAL REPORT E1-007/TR vi
The 16 BAMS study sites (Furse et al 1995) were particularly useful because theyincluded different river types and also sites which differed in quality. In all cases,replicated samples were available in each of three seasons, so sampling variability inthe relative abundance of the FFGs could be examined. Clearly, if sampling variabilityis high, it will be difficult to detect differences between sites due to site quality and/orsite type.
Additional assessments of the response of the FFGs to site quality were made using6016 General Quality Assessment (GQA) sites from the 1995 GQA survey. In bothdatasets, the most striking trend was an increase in the relative importance of gatherersat poor quality sites. The GQA dataset also demonstrated that there was considerablevariation in the relative abundance of any given FFG amongst sites of a given biologicalquality.
It was therefore apparent that the relative abundance of the various FFGs varied onlyweakly with the environmental characteristics of a wide range of high quality sites andsubstantial differences in FFGs only occurred at very poor quality sites. These sites canbe recognised very effectively using the existing EQITAXA and EQIASPT approach. Thus,there would be little to be gained at present by incorporating the facility to generateexpected FFGs in the next version of RIVPACS.
However, the proportional approach for designating family-level FFGs for GreatBritain, although relatively crude and subject to further improvement, may be of valuein other studies undertaken by the Environment Agency and their contractors. Inparticular, the use of FFGs may have greater credibility where quantitative samplingprocedures involving numerical and/or biomass data are used to investigate spatialchange along a river system or temporal change at a site subject to periodic stress.
In future, there will be an increasing need to designate FFGs at the species level andmake these and other attributes more easily accessible for use in conservation and rivermanagement.
Package 13: Evaluation of the use of RIVPACS in the context ofbiodiversity and sustainabilityby J F Wright
The objective of this scoping report is to assess the current role of RIVPACS in thecontext of biodiversity and sustainability and determine whether its value may beenhanced by minor developments within or alongside the current version of the system.
In 2001, the Environment Agency published ‘An Environmental Vision: TheEnvironment Agency’s contribution to a sustainable environment’ which includes aconsideration of nine separate themes. RIVPACS has some contribution to make to fiveof these themes including: ‘a better quality of life’; ‘an enhanced environment forwildlife’; ‘improved and protected inland and coastal waters’; ‘wiser, sustainable use ofnatural resources’; ‘limiting and adapting to climate change’. The relevance ofRIVPACS to each of these themes is detailed in the current report.
The meaning of biodiversity is discussed at the genetic, species and community leveland this is followed by further background information on the recording and

R&D TECHNICAL REPORT E1-007/TR vii
conservation of the freshwater fauna in the UK, including progress on theimplementation of the UK Biodiversity Action Plan.
RIVPACS contributes to the field of sustainability and more specifically to the topic ofbiodiversity in two main ways. First, by providing a system for the appraisal of site (orhabitat) quality and second, by offering a listing of the observed (and expected) taxa ata site.
Since 1990, the Observed/Expected ratios derived by RIVPACS and based on BMWPfamily-level data have been used for the biological appraisal of site quality in nationalquinquennial surveys and also in local monitoring programmes. As biodiversity issuesassume a higher profile, there will be an increasing need for family or species levelidentifications at selected sites. Hence, there will be a future need to automate thecalculation of O/E ratios at family and standardized species level, in line with theprocedures currently available at BMWP family level.
RIVPACS predicts taxonomic composition by providing a listing of taxa for a given siteat the chosen taxonomic level (species, family or BMWP family) for comparison withthe fauna observed at the site. Given that biodiversity issues require species-level data,the provision of additional information on the status of each species would bebeneficial. The species level printouts could be modified to include the frequency ofeach species in the 614 site reference dataset (to distinguish common from infrequentlotic species) and all species with Red Data Book or Nationally Scarce status could beflagged.
Before these and other potential changes are incorporated into RIVPACS, there is anurgent need to develop a more user-friendly Windows version of the system. In future,the benefits of having RIVPACS accessible on a CD-ROM or via the World Wide Web,with access operated via a password system, may also become compelling. If theseproposals are accepted, then the provision of supplementary information would besimplified. This could include dot maps giving the geographical distribution of theRIVPACS species together with information on their environmental ranges.

R&D TECHNICAL REPORT E1-007/TR viii

R&D TECHNICAL REPORT E1-007/TR ix
CONTENTS
ACKNOWLEDGEMENTS i
EXECUTIVE SUMMARY iii
LIST OF FIGURES xi
LIST OF TABLES xiii
1. INTRODUCTION 1
1.1 Programme of Work for Stages 1 and 2 11.2 Stage 3 Programme of Work 2
2. MARKET EVALUATION OF THE β-TEST VERSION OFRIVPACS IIIBY J F WRIGHT 3
2.1 Introduction 32.2 Objectives 32.3 Development of the β-test Version of RIVPACS III 32.4 Marketing of the β-test Version of RIVPACS III 42.5 Uptake of the β-test Version of RIVPACS III 52.6 Conclusions 5
3. DEVELOPMENT OF EDUCATIONAL TOOLS BASED ONRIVPACSBY J M WINDER 7
3.1 Introduction 73.2 Objectives 73.3 Objective 1 83.4 Objective 2 113.5 Objective 3 233.6 Objective 4 303.7 Recommendations 353.8 References 36
4. AN APPRAISAL OF RIVPACS FOR EVALUATING TROPHICSTRUCTUREBY R T CLARKE, J F WRIGHT AND J DAVY-BOWKER 39
4.1 Introduction 394.2 Objectives 404.3 Literature Review 404.4 Assignment of RIVPACS Families to Functional Feeding Groups 444.5 Calculating the Observed and Expected Relative Abundance of Functional Feeding Groups 494.6 Abundance of each Functional Feeding Group for the RIVPACS
Reference Sites in Relation to Site Characteristics 55
R&D TECHNICAL REPORT E1-007/TR x
4.7 Functional Feeding Groups and Site Quality 654.8 Trends in Functional Feeding Group Abundance along Individual
Rivers 804.9 Summary and Conclusions 834.10 Recommendations 864.11 References 86
5. EVALUATION OF THE USE OF RIVPACS IN THECONTEXT OF BIODIVERSITY AND SUSTAINABILITYBY J F WRIGHT 91
5.1 Introduction 915.2 Objectives 925.3 Sustainability/Sustainable Development 935.4 Biodiversity 965.5 Current outputs from RIVPACS relevant to biodiversity and/or
sustainability 1025.6 Opportunities for developments within or alongside RIVPACS 1055.7 Recommendations for future developments 1105.8 References 113
APPENDIX 1: Provisional Listing of Macroinvertebrates inthe British Isles with Red Data Book orNationally Scarce Status A-1 to A-12

R&D TECHNICAL REPORT E1-007/TR xi
LIST OF FIGURES
Page
Figure 4.1 Comparison of the four different methods of calculating thepercentage of the sum of the observed log abundances in eachfunctional feeding groups for the 614 RIVPACS Referencesites. The four methods are denoted by a combination of F/Mdefined as: F= Families used (i.e. All families or just BMWPfamilies); M= Method of assigning families to feeding group(i.e. Proportional or using Dominant group) 52
Figure 4.2 Boxplot of the sum of the log abundances of all families for the614 RIVPACS references sites, classified according to theirTWINSPAN site group (1-35). Results are given separately foreach season. [Boxplot interpretation: box denotes range ofmiddle half of data values (25-75 percentile values); middleline denotes median (i.e. 50 percentile); outer lines denoterange of values except for outliers which are markedindividually by a *] 57
Figure 4.3 Boxplot of the relative abundances of each functional feedinggroup for the 614 RIVPACS reference sites, classified byTWINSPAN site group (1-35). See Figure 4.2 for explanationof boxplot. Vertical lines differentiate the four major sitegroups: 1-9 = “small streams”; 10-17 = “upland streams”; 18-24 = “intermediate streams and rivers”; 25-35 = “lowlandstreams and rivers” 61
Figure 4.4 Average percentage of the sum of the observed log abundancesin each of five functional feeding groups for the 614 RIVPACSsites classified by major TWINSPAN site group 62
Figure 4.5 Average percentage of the sum of the observed log abundancesin each of five functional feeding groups for the 614 RIVPACSsites classified by distance from source (km) 63
Figure 4.6 Average percentage of the sum of the observed log abundancesin each of five functional feeding groups for the 614 RIVPACSsites classified by alkalinity (mg l-1 CaCO3) 64
Figure 4.7 Sum of log abundances of each functional feeding group for allreplicate samples from the BAMS sites plotted against sampleO/E for number of taxa (LHS) and O/E for ASPT (RHS). n =16 sites x 3 seasons x 3 samples = 144 68

R&D TECHNICAL REPORT E1-007/TR xii
Figure 4.8 Ratio O/E of observed to expected sum of log abundances ofeach functional feeding group for all replicate samples fromthe BAMS sites plotted against sample O/E for number of taxa(LHS) and O/E for ASPT (RHS) 69
Figure 4.9 Relative abundance of each functional feeding group for allreplicate samples from the BAMS sites plotted against sampleO/E for number of taxa (LHS) and O/E for ASPT (RHS). n =16 sites x 3 seasons x 3 samples = 144 71
Figure 4.10 Ratio O/E of observed to expected relative abundance of eachfunctional feeding group for all replicate samples from theBAMS sites plotted against sample O/E for number of taxa(LHS) and O/E for ASPT (RHS) 72
Figure 4.11 Sum of log abundances of each functional feeding groupplotted against sample O/E for number of taxa (LHS) and O/Efor ASPT (RHS) for 6016 GQA sites sampled in autumn 1995 74
Figure 4.12 Ratio O/E of observed to expected sum of log abundances ofeach functional feeding group plotted against sample O/E fornumber of taxa (LHS) and O/E for ASPT (RHS) for 6016GQA sites sampled in autumn 1995 75
Figure 4.13 Relative abundances of each functional feeding group plottedagainst sample O/E for number of taxa (LHS) and O/E forASPT (RHS) for 6016 GQA sites sampled in autumn 1995 78
Figure 4.14 Ratio O/E of observed to expected relative abundances of eachfunctional feeding group plotted against sample O/E fornumber of taxa (LHS) and O/E for ASPT (RHS) for 6016GQA sites sampled in autumn 1995 79
Figure 4.15 Percentage abundance of each functional feeding group inrelation to distance from source (7, 14, 29, 44, 70, 94, 114, 129and 144 km) of sites down the Swale-Ure-Ouse river 80
Figure 4.16 Percentage abundance of each functional feeding group inrelation to distance from source (4, 9, 17, 29, 41, 59 and 78km) of sites down the River Exe 81
Figure 4.17 Percentage abundance of each functional feeding group inrelation to distance from source (4, 8, 13, 21, 33, 46, 58, 70and 90 km) of sites down the River Usk 82
R&D TECHNICAL REPORT E1-007/TR xiii
LIST OF TABLES
Page
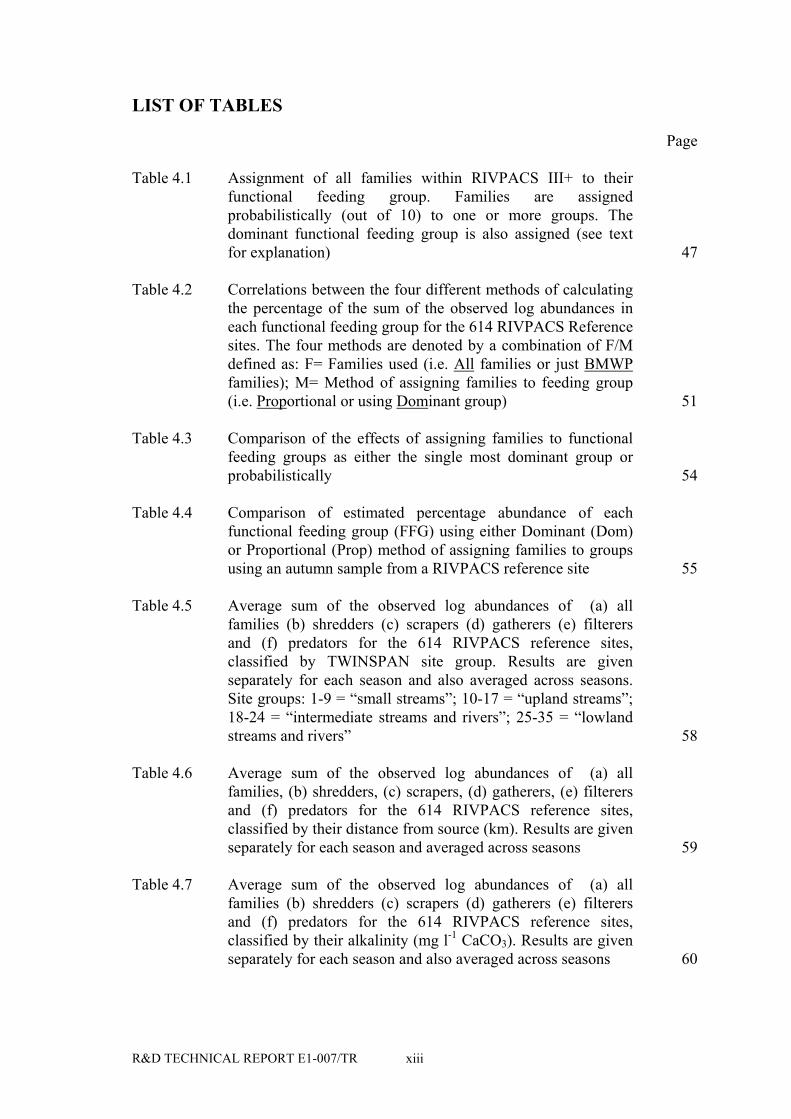
Table 4.1 Assignment of all families within RIVPACS III+ to theirfunctional feeding group. Families are assignedprobabilistically (out of 10) to one or more groups. Thedominant functional feeding group is also assigned (see textfor explanation) 47
Table 4.2 Correlations between the four different methods of calculatingthe percentage of the sum of the observed log abundances ineach functional feeding group for the 614 RIVPACS Referencesites. The four methods are denoted by a combination of F/Mdefined as: F= Families used (i.e. All families or just BMWPfamilies); M= Method of assigning families to feeding group(i.e. Proportional or using Dominant group) 51
Table 4.3 Comparison of the effects of assigning families to functionalfeeding groups as either the single most dominant group orprobabilistically 54
Table 4.4 Comparison of estimated percentage abundance of eachfunctional feeding group (FFG) using either Dominant (Dom)or Proportional (Prop) method of assigning families to groupsusing an autumn sample from a RIVPACS reference site 55
Table 4.5 Average sum of the observed log abundances of (a) allfamilies (b) shredders (c) scrapers (d) gatherers (e) filterersand (f) predators for the 614 RIVPACS reference sites,classified by TWINSPAN site group. Results are givenseparately for each season and also averaged across seasons.Site groups: 1-9 = “small streams”; 10-17 = “upland streams”;18-24 = “intermediate streams and rivers”; 25-35 = “lowlandstreams and rivers” 58
Table 4.6 Average sum of the observed log abundances of (a) allfamilies, (b) shredders, (c) scrapers, (d) gatherers, (e) filterersand (f) predators for the 614 RIVPACS reference sites,classified by their distance from source (km). Results are givenseparately for each season and averaged across seasons 59
Table 4.7 Average sum of the observed log abundances of (a) allfamilies (b) shredders (c) scrapers (d) gatherers (e) filterersand (f) predators for the 614 RIVPACS reference sites,classified by their alkalinity (mg l-1 CaCO3). Results are givenseparately for each season and also averaged across seasons 60

R&D TECHNICAL REPORT E1-007/TR xiv
Table 4.8 Average percentage of sum of the observed log abundanceswhich are (a) shredders, (b) scrapers, (c) gatherers, (d) filterersand (e) predators for the 614 RIVPACS sites, classified byTWINSPAN site group; Results are given separately for eachseason and also averaged across seasons. Site groups: 1-9 =“small streams”; 10-17 = “upland streams”; 18-24 =“intermediate streams and rivers”; 25-35 = “lowland streamsand rivers” 62
Table 4.9 Average percentage of sum of the observed log abundanceswhich are (a) shredders, (b) scrapers, (c) gatherers, (d) filterersand (e) predators for the 614 RIVPACS sites, classified bytheir distance from source (km). Results are given separatelyfor each season and also averaged across seasons 63
Table 4.10 Average percentage of sum of the observed log abundanceswhich are (a) shredders, (b) scrapers, (c) gatherers, (d) filterersand (e) predators for the 614 RIVPACS sites, classified byalkalinity (mg l-1 CaCO3). Results are given separately for eachseason and also averaged across seasons 64
Table 4.11 Range of expected values predicted by RIVPACS for thepercentage abundance of each functional feeding group basedon the 614 RIVPACS reference sites for all three single seasonexpected values 65
Table 4.12 Characteristics of the stratified random selection of the 16 BAMSstudy sites in terms of (a) their quality bands as defined by rangeof O/E BMWP quality index values; (b) RIVPACS IIenvironmental group type and (c) the full list of the 16 sitesselected for replicate sampling 67
Table 4.13 Correlations of the observed or observed to expected ratio(O/E) of either the abundance (i.e. sum of log abundances) orrelative abundance of the functional feeding groups withEQITAXA and EQIASPT for the BAMS sites (n = 16 sites xseasons x 3 replicates) 70
Table 4.14 Correlations of the observed or observed to expected ratio(O/E) of either the abundance (i.e. sum of log abundances) orrelative abundance of the functional feeding groups withEQITAXA and EQIASPT for 6016 GQA sites sampled in autumn1995 73
Table 4.15 Average observed relative abundance of the functional feedinggroups for 6016 GQA sites sampled in autumn 1995 in relationto their values of EQITAXA and EQIASPT. Number of sites perEQI class given in brackets 76

R&D TECHNICAL REPORT E1-007/TR xv
Table 4.16 Average observed to expected ratio (O/E) of the relativeabundance of the functional feeding groups for 6016 GQAsites sampled in autumn 1995 in relation to their values ofEQITAXA and EQIASPT. Number of site per EQI class given inbrackets 77
Table 5.1 Contribution of each major taxonomic group to the 637standardised taxa within the 614 GB reference sites inRIVPACS III. Groups for which Red Data Book (RDB) andNationally Scarce (NS) designations have been made areshown, together with the supporting reference. A 'YES' inparentheses indicates that species have been designated in thattaxonomic group but none is represented in the RIVPACS IIIdata-set. 107
Table 5.2 Freshwater Invertebrates on the ‘priority’ listing for SpeciesAction Plans. Species in bold were recorded in the 614 siteRIVPACS III GB dataset. The frequency of occurrence ofthese species, as recorded in Wright et al. (1996), is also given 109

R&D TECHNICAL REPORT E1-007/TR xvi

R&D TECHNCIAL REPORT E1-007/TR 1
1. INTRODUCTION
1.1 Programme of Work for Stages 1 and 2
Research and Development (R&D) Project E1-007, which started in January 1998,includes ten separate work packages, the majority of which are desk studies designed toinvestigate potential developments and improvements to RIVPACS. The time allottedto each package varied from one to two years. To date, four packages have beencompleted and reported as Stage 1 R&D Technical Report E71 (Wright et al 1999) andStage 2 R&D Technical Report E124 (Clarke and Wright 2000).
Note that the Package numbering system is as given in the contract specification.
The Stage 1 report presented an account of progress with Packages 5 and 6 and gave thefinal results for two scoping studies (Packages 3 and 10).
Package 5. An International Workshop on RIVPACS, attended by approximately60 participants from 22 countries took place at Jesus College, Oxford, in September1997. Time was allotted within this package for editorial work by J F Wright and M TFurse on the manuscripts presented by Workshop contributors. This resulted in thepublication in June 2000 of a 24 chapter book by the Freshwater Biological Associationon the RIVPACS approach. Details are given below:
Wright, J F, Sutcliffe, D W and Furse M T. (2000) (Eds.) Assessing the biologicalquality of fresh waters: RIVPACS and other techniques. Freshwater BiologicalAssociation, Ambleside, 373pp.
Package 6. Development of the use of abundance data for biological quality assessmentwas undertaken over a two-year period. Interim results were presented in Wright et al(1999), and the package was completed and reported at the end of the second year in theStage 2 report. Details are given below:
Clarke, R T and Wright J F (2000) Testing and Further Development of RIVPACS.Package 6. Development of the use of abundance data for biological quality assessment:Testing and assessment of new abundance-based indices. R&D Technical Report E124.Environment Agency, 95pp.
Package 3. This one-year scoping study to re-evaluate methods for collectingRIVPACS samples from deep waters was reported in Wright et al (1999).
Following the scoping study, the Environment Agency commissioned a separate fieldstudy to compare the effectiveness of three sampling devices for collectingmacroinvertebrates in deep watercourses and recommend standard sampling protocolsfor deep-water sites. This project is complete and has been reported in:
Bass J A B, Wright J F, Clarke R T, Gunn R J M and Davy-Bowker J, 2001.Assessment of sampling methods for macroinvertebrates (RIVPACS) in deepwatercourses. R&D Technical Report E134. Environment Agency, Bristol. 52 pp plustwo Appendices.

R&D TECHNCIAL REPORT E1-007/TR 2
Package 10. This one-year scoping study to consider the development of a RIVPACSmethodology for canals was also reported in Wright et al (1999).
1.2 Stage 3 Programme of Work
Of the remaining six packages, four are presented in this report, and the other two willbe issued as separate reports at a later date. The details of these packages are as follows.
First, the four packages included within this report:
Package 2. Market evaluation of the β-test version of RIVPACS (Year 3)
Package 4. Development of educational tools based on RIVPACS (Year 3)
Package 8. An appraisal of RIVPACS for evaluating trophic structure (Years 2 and 3)
Package 13. Evaluation of the use of RIVPACS in the context of biodiversity andsustainability (Year 3).
The remaining two packages (numbers 9 and 12) are as follows:
Package 9. An evaluation of procedures for acquiring environmental variables for usein RIVPACS (Years 2 and 3) Stage 4 R&D Technical Report E1-007/TR1.
Package 12. Development of a dynamic model to predict the biological consequencesof changes in water quality. (Years 2 and 3) Stage 5 R&D Technical Report E1-007/TR2.
The progress of this final package has been slowed by significant difficulties relating tosome datasets required for the work. These difficulties have been outside of our directcontrol and therefore some delay is anticipated before Package 12 appears as a separateStage 5 report.
R&D TECHNCIAL REPORT E1-007/TR 3
2. MARKET EVALUATION OF THE β-TEST VERSION OFRIVPACS IIIBY J F WRIGHT
2.1 Introduction
In the original specification, this package was always seen as a minor item, with just£1K allotted. In view of the fact that the market for RIVPACS III has proved to be verysmall, the project manager has indicated that the original specific objectives were toodetailed and that a minimal report is required.
2.2 Objectives
The overall objective was as follows:
‘To produce a report on the development and market evaluation of the β-test version ofRIVPACS III’.
The specific objectives (modified from the original specification with the agreement ofthe nominated officer) were as follows:
1. To describe the development needed to produce the β-test version of RIVPACSIII.
2. To describe the publicity material and marketing procedures used by theInstitute of Hydrology in marketing the β-test version of RIVPACS III.
3. To indicate the range of organisations expressing interest in the purchase of theβ-test version of RIVPACS III and the reasons why they decided not topurchase.
4. To provide basic information on the organisations which purchased RIVPACSIII and on the subsequent training workshop.
2.3 Development of the β-test Version of RIVPACS III
The development of RIVPACS III was completed in late 1995, and at that time it wasonly available for use by the Institute of Freshwater Ecology (IFE), the EnvironmentAgency, the Scottish Environment Protection Agency and the Department of theEnvironment for Northern Ireland (DOE(NI)). However, both the Institute ofFreshwater Ecology and the Environment Agency were aware that there was an interestin access to the RIVPACS software from a variety of sources, including commercialorganisations and educational institutions such as Universities, colleges and evenschools who saw the potential of the system as a teaching aid.
Prior to the development of the β-test version of RIVPACS III, commercialorganisations only had access to RIVPACS by subcontracting their requirement forRIVPACS predictions to the IFE and this had happened on a small number ofoccasions. Discussions took place within the IFE, more widely within NERC, and also

R&D TECHNCIAL REPORT E1-007/TR 4
between the IFE/NERC and the Environment Agency on possible future commercialexploitation of the RIVPACS software. In reality, the current software is somewhatdated and not particularly user-friendly, and ideally there would be merit in developinga windows version with user-friendly procedures for data-input and presentation ofresults. However, at that time, this was regarded as a substantial and time-consumingtask and in the meantime, it was important to satisfy a perceived, if limited, need for apre-commercial version of the RIVPACS III software for purchase by commercialfirms.
By the summer of 1996 most of the work to be undertaken before release of thesoftware had been identified and detailed discussions had taken place between the IFEand the Environment Agency. An early decision related to the inclusion or otherwise ofthe separate module for Northern Ireland. The DOE(NI) were consulted on this issueand decided that they did not want the module for Northern Ireland included within thepackage. Hence, development went ahead on the Great Britain (GB) module only.
The RIVPACS III software itself was put onto disc in a compressed form, tested andidentified with appropriate logos and labels. A number of minor amendments weremade to the RIVPACS III software manual and new copies were produced. The IFEalso produced a booklet with practical sessions on RIVPACS III to help users getstarted. The procedures manual, which describes the standard methodologies forcollecting and analysing RIVPACS samples, was essentially the same as the manualproduced by the Environment Agency. Once copies of the software and manuals wereready, they were delivered to the Institute of Hydrology at Wallingford, who agreed toundertake the marketing of the product.
2.4 Marketing of the β-test Version of RIVPACS III
Prior to the launch of the β-test version of RIVPACS in January 1997, a number ofadditional actions and decisions were taken. First, a publicity leaflet advertising theavailability and key features of the software and the accompanying items was produced.The format was based on that used for previous software products marketed by theInstitute of Hydrology (IH). Second, the normal price for the software, accompanyingmanuals and one year's software support from the Institute of Hydrology was set at£2,200 plus VAT. Further copies could be purchased at a lower price, but there wouldnot be an educational discount because, at some later date, a separate educationalversion would be produced. Third, a separate leaflet was produced recommending thatthose purchasing the software should undertake a one-day accreditation course at theIFE River Laboratory before using RIVPACS III for commercial purposes.
In January 1997, a software exhibition was held at the IH office, Wallingford, at whichMrs K Symes of the IFE River Laboratory was present to answer questions frompotential customers. A number of people expressed interest in the product and tookaway publicity material.
Two years later, in February 1999, a mailshot, describing the availability, uses and costof RIVPACS III was sent out to 150 Environmental Consultancies throughout GreatBritain.

R&D TECHNCIAL REPORT E1-007/TR 5
2.5 Uptake of the β-test Version of RIVPACS III
There has been a steady stream of enquiries regarding the availability of RIVPACS inthe form of letters, e-mails and telephone calls, both before and since the launch of theβ-test version of RIVPACS III. A majority of the enquiries from within the UnitedKingdom (UK) have come from University and College lecturers hoping to acquire orpurchase the software at minimal cost for teaching purposes. Invariably, the limited sizeof their teaching budgets prevents them purchasing the software. However, theyfrequently express considerable interest in the possibility of a more user-friendlyeducational version of the system at a nominal cost in the future. The remainingenquires have encompassed research organisations, study centres and a range ofenvironmental consultants. Again, some organisations have assumed that the softwarewould be available at a nominal price, or even downloadable from the internet.
A number of additional enquiries have come from abroad, including, for example, theNetherlands, Germany, Italy and the USA. In these cases it has been important for us topoint out that RIVPACS III is designed for use within the UK and although theprinciple of RIVPACS and the reference condition is widely applicable, each regionrequires information on local reference sites in order to develop an appropriateprediction system.
In practice, just two copies of RIVPACS III have been purchased since the decision tomake the system more widely available. One copy was purchased by Zeneca Ltd for useby their staff based at the Brixham Environmental Laboratory. A second expression ofinterest in RIVPACS III came from the Freshwater Biologist at the Isle of ManGovernment Laboratory, who wanted to utilise the same procedures for assessing thebiological quality of rivers as used throughout the UK. In this second case, it was clearthat it would not be appropriate to use the GB module, as in the β-test version ofRIVPACS III. Instead, permission was sought and granted, by the Environment andHeritage Service in Northern Ireland, for the Northern Ireland module to be used fromthe original version of RIVPACS III. Clearly, in the absence of local reference sites forthe Isle of Man, the predictions cannot be expected to be as reliable as in NorthernIreland, but they will be more reliable than predictions based on the GB module, simplybecause both the Isle of Man and Ireland have a restricted freshwater fauna compared toGreat Britain.
Staff from both Zeneca Ltd and the Isle of Man Government Laboratory attended a one-day accreditation course at the IFE River Laboratory covering field procedures,laboratory protocols and hands-on experience in the use of the RIVPACS III software.
2.6 Conclusions
In marketing the β-test version of RIVPACS III, along with the accompanying manuals,software support and accreditation course, the IFE was fulfilling what it regarded as anobligation to make the system more widely available for purchase by environmentalconsultants. It was accepted by both the IFE and the Agency, that this initial version hadnot been optimised for the commercial market and that this prototype, involvingminimal change to RIVPACS III as developed for the Environment Agency in late

R&D TECHNCIAL REPORT E1-007/TR 6
1995, would be used to sound out the market. The purchase price, whilst substantial,was not unreasonable when viewed in relation to the long-term development costs andthe fact that an environmental consultancy with access to RIVPACS could, in theory,recoup the purchase price and make a substantial profit if it won contracts requiring theuse of RIVPACS predictions. In the event, it appears that most potential buyers wereprobably deterred by factors which included the price, the stringent field and laboratoryprotocols required and the software itself which is not very user-friendly compared withmost modern windows-operated systems.
The separate question of developing an educational version of RIVPACS is beingaddressed in chapter 3.

R&D TECHNCIAL REPORT E1-007/TR 7
3. DEVELOPMENT OF EDUCATIONAL TOOLS BASED ON RIVPACS by J M WINDER
3.1 Introduction
RIVPACS (River Invertebrate Prediction and Classification System) is a softwarepackage developed by the former Institute of Freshwater Ecology (now Centre forEcology and Hydrology). The use of communities of macroinvertebrates in surveillanceand monitoring of freshwater is well-established (Cairns & Pratt 1993; Hellawell 1986;Rosenberg & Resh 1993). The primary application of RIVPACS is to assess thebiological quality of rivers within the United Kingdom. RIVPACS offers site-specificpredictions of the macroinvertebrate fauna to be expected in the absence of majorenvironmental stress (Wright 2000). The expected fauna is derived by RIVPACS usinga small suite of environmental characteristics. The biological evaluation is thenobtained by comparing the fauna observed at the site with the expected fauna.
The RIVPACS programme could be of value, not only to professionals, but also in thewider field of education. Hence in 1995, a detailed specification for this package of theRIVPACS development programme was drawn up. At the time, the Education Sectionwithin the Environment Agency was in the process of being established and had notdecided upon strategies and policies. A consequence of this set of circumstances hasbeen that the original specification was unrealistic in terms of what was appropriate forCEH Dorset to undertake. In addition, the financial constraints on this package alsolimited the scope of the study. Subsequent to the production of the originalspecification, the Education Section developed methodologies and expertise that wouldenable it to routinely undertake such scoping studies as required by the EnvironmentAgency for the development of educational tools based on RIVPACS.
In the early part of 2000, Dr R Dines took over from Mr B Hemsley-Flint as ProjectManager for Phase 3 of the Testing and Further Development of RIVPACS –Development of new RIVPACS Methodologies. A Progress Meeting was held on11 July 2000 attended by Dr R Dines and Ms P Mardon of the Environment Agency andstaff from CEH Dorset. At this meeting the shortcomings of the original specificationfor Package 4 (Development of educational tools based on RIVPACS) were recognised.It was agreed that the specific objectives should be revised, following the main items inthe schedule, together with the best, but easily available guidance to likely costs.
3.2 Objectives
The overall objective was as follows:
‘To produce a desk-study report entitled ‘Development of educational tools based onRIVPACS’ which outlines the major options for future consideration by theEnvironment Agency’.

R&D TECHNCIAL REPORT E1-007/TR 8
The revised specific objectives were:
1. To review the main educational subjects which could be addressed byRIVPACS from primary school to University level and the potential range ofeducational material which could be produced.
2. To liaise with the Education Section of the Environment Agency and the NERCand document the procedures used within the Environment Agency whenundertaking full scoping studies designed to assess the need for and relevance ofnew educational material.
3. To make a judgement on the potential educational products for which there isthe greatest need, and provide guidance on the likely costs, development timesand potential developers.
4. To review the extent to which potential RIVPACS products link to theeducational strategies of the Environment Agency and could be integrated withexisting educational material.
3.3 Objective 1
To review the main educational subjects which could be addressed by RIVPACS fromprimary school to University level and the potential range of educational materialwhich could be produced.
3.3.1 Main educational subjects
Primary and secondary level education
There are various sources where it is possible to obtain detailed information about themain educational subjects which could be addressed using RIVPACS. These includeboth hard copy and Internet sources. The most important source of information is theNational Curriculum. A hard copy can be obtained from Regional Environment Agencylibraries, or can be downloaded from the web site at http://www.nc.uk.net/.
The National Curriculum is necessarily very detailed; this means that it is not alwayseasy to quickly look up specific areas of interest. For this reason the EnvironmentAgency Education Section has produced The Concise Curriculum. These fact sheets andbooklets highlight particular areas of the curriculum, which are relevant to EnvironmentAgency work and give a brief background that enables the delivery of targettedmessages to pupils, teachers and Agency staff.
The main subjects in the curriculum to which educational tools based on RIVPACScould be relevant are science, geography, information and communication technology,English and numeracy. [For further details of curriculum requirements in the mainsubject areas see below.]
Included with the Concise Curriculum is the Simple Schools Education Guide whichprovides the age groups in the different Key Stages; the types of schools; the ages in theyear groups within the key stages; the examination years; the subjects studied at each

R&D TECHNCIAL REPORT E1-007/TR 9
key stage. It also states that ‘unless specific qualifications are available and selected inenvironmental studies at General Certificate of School Education (GCSE) or A-level(e.g. earth sciences), the Environment does not have its own subject area in thecurriculum’. At Key Stages 1, 2 and 3 Environmental topics are found predominantly inthe Geography curriculum but also in Science. However, there are also opportunities forthe environment to feature in other subjects such as English (e.g. through drama), Artand Design (e.g. designing sculpture from recycled materials) and Maths (e.g. throughwater quality sampling and data handling).
Also included with the Concise Curriculum is Working with schools by C Jones,produced by the Community Education Development Centre with the Department forEducation and Employment and Marks & Spencer (ISBN 0 947607 38 2). Thisdocument aims to help busy people in industry and commerce find out about theeducation system quickly and easily so that they can make an effective contribution. Itis a comprehensive guide to school-business partnerships for business people who wantto develop effective contacts with schools and is divided into two parts: ‘Understandingschools’ and ‘Taking Practical Action’. The first part covers what teachers do, thedifferent types of school, how schools are organised, what schools teach, understandingschool inspection, understanding qualifications, and making effective contact withschools. The second part contains a step-by-step guide to developing a policy, andsections on work experience, careers programmes, sponsorship, industrial governors,Compact*, teacher placement service, Young Enterprise and mentoring.
*A Compact agreement is one set up between a group of students, the schools theyattend and local companies, in order to provide additional support to young people,especially those for whom the transition from school to the world of work is likely to bedifficult.
Also included with the Concise Curriculum is Supporting sustainable developmentthrough educational resources – a voluntary code of practice by the Council forEnvironmental Education, Department for Education and Employment and Departmentof the Environment, Transport and Regions. (DfEE Crown Copyright 1999). This setsout ten principles of good practice when producing educational resources.
The National Curriculum Key Stages 1 to 4 requirements cover both primary educationand secondary level education up to GCSE. The subjects to which RIVPACS could beapplied include Science, Geography, Information and Communication Technology,Literacy, Numeracy and Citizenship.
At the higher level of secondary education, after the GCSE stage, and leading to thequalifications of AS and A level GCE the main subjects to which RIVPACS could berelevant include Biology, Geography, Environmental Science, Computing andInformation Technology. Details of the specifications for these subjects can be found onthe Qualifications Curriculum and Assessment web site http://www.qca.org.uk and asfollows:

R&D TECHNCIAL REPORT E1-007/TR 10
Biology http://www.aqa.org.ukBiology/Biology (Human) A http://www.aqa.org.uk/qual/gceasa/bioA.htmlBiology B http://www.aqa.org.uk/qual/gceasa/bioB.htmlGeography http://www.aqa.org.ukGeography A http://www.aqa.org.uk/qual/gceasa/geoA.html.Geography B http://www.aqa.org.uk/qual/gceasa/geoB.htmlEnvironmental science http://www.aqa.org.uk/qual/gceasa/env.htmlComputing http://www.aqa.org.uk/qual/gceasa/comp.htmlInformation & technology http://www.aqa.org.uk/qual/gceasa/inf.html
Tertiary level education
In addition to schools teaching at primary and secondary level there are about sixtyFurther Education Colleges in the UK. These establishments straddle the boundarybetween secondary and tertiary level education. They prepare students for GCSE, ASand A Level subjects as well as other more vocational qualifications including HigherNational Certificates and Higher National Diplomas. These colleges are listed by theUniversities and Colleges Admissions Service (UCAS) on their web site athttp://www.ucas.com/. Further Education Colleges offer courses in AppliedEnvironmental Science (2), Biological science (1), Biology (54), Applied Biology (15),and Ecology (30) in which subjects educational material based on the RIVPACSprogramme could be applied.
At the tertiary level of education there are 259 universities and university colleges.These are listed on the web site: http://www.england.thecountry.com/universities.htm.
The University prospectuses describing the courses available for study can be found onthe UCAS web site at http://www.ucas.com/. Subjects to which RIVPACS might berelevant include the following (although there may be some overlap or cross-referencing in the courses: applied environmental science (87 courses); aquatic (10);biodiversity (3); biogeography (1); biological science (2631); biology (1754); biologyapplied (1); combined science (275); conservation (299); country (8); country planning(292); countryside (120); ecology (235); ecosystems (5); environmental (2091);environmental biology (159); environmental conservation (18); environmentalmanagement (236); environmental pollution management (2); environmental pollutionscience (25); environmental protection (16); environmental quality (1); environmentalscience (1586); environmental studies (520); environmental sustainability (2);environmental systems (5); freshwater ecology; habitat (5); and water (121).
3.3.2 Potential range of educational material
RIVPACS could be exploited to develop a diverse range of materials to meet specifiededucational needs at different levels. Potential products could be books, leaflets,posters, slides, videos, CD-ROMs, floppy discs, DVDs, web site, activity kits, teachers’notes and handouts, activities, and ancillary materials – e.g. a taxonomic key at BMWPfamily level, or combinations of materials. Details concerning those materials for whichit is considered there is the greatest need, are given later in Objective 3.

R&D TECHNCIAL REPORT E1-007/TR 11
3.4 Objective 2
To liaise with the Education Section of the Environment Agency and the NERC anddocument the procedures used within the Environment Agency when undertaking fullscoping studies designed to assess the need for and relevance of new educationalmaterial.
There are three stages in assessing the need for, and relevance of, new educationalmaterial. These are:
• firstly, the broad educational principles• secondly, the detailed subject-specific considerations and• finally, practical issues.
3.4.1 Broad educational principles with some examples
This section covers some of the more general educational principles, particularly withregard to the application of educational material to the subjects of biodiversity andeducation for sustainability, which generally supersede the formerly studied area knownas environmental science. Educational tools based on the RIVPACS programme wouldneed to relate to these major concepts within subject areas such as science andgeography. These subjects continue to provide opportunities for teaching and learningabout environmental change alongside sustainable development as themes withinCurriculum 2000. It is in these subjects that it is possible to see a role for educationaltools based on RIVPACS.
TEC 2000 Conference
(Contact details for organisations mentioned below are given at the end of the section)
The importance of teaching about environmental change, and methodologies by whichthis might be achieved, was the subject of a conference called TEC 2000 – TeachingEnvironmental Change (http://www.nmw.ac.uk/tec2000/) held at The Royal Society inLondon on 27 October 2000. This conference dealt with the need to communicate andeducate about environmental change, particularly through the use of electronic media.Presentations were given on assessing educational needs and describing initiatives andmethodologies produced by various organisations. The conference was aimed at anaudience of teachers, representatives of teaching associations, curriculum advisers andscientists with an interest in promoting the teaching of environmental change in schools.The objectives of the conference were:
• to promote the teaching of environmental change in schools;• to demonstrate computer-based tools developed to facilitate learning about
environmental change; and• to steer the development of teaching aids by research and monitoring
organisations.
R&D TECHNCIAL REPORT E1-007/TR 12
Educating the public about science and environmental issues is considered an area ofhigh priority within the Environment Agency and the Natural Environment ResearchCouncil.
Environment Agency
The Environment Agency has a network of Regional Education Officers under theguidance of a National Education Programme Co-ordinator. The Agency has alsodeveloped educational resources including a web site (http://www.environment-agency.gov.uk/education/), the Riverside Explorer CD-ROM, and the Greener FuturesCD-ROM. Their Education on the Internet initiative is designed for schools, further andhigher education. It provides ideas for activities, is interactive, has partnership andawards information, and is available in either English or Welsh versions.
The Riverside Explorer CD-ROM deals with how rivers shape the land, describes riverwildlife habitats, allows students to practice their own survey, provides a glossary ofterms and key words, and provides teacher support notes together with case studies andworksheets.
The Greener Futures CD-ROM is the result of a partnership project involvingPeterborough Environment City Trust and Cambridgeshire Environment EducationService. It is a lifestyles audit, recording data by area as an indicator of keyenvironment issues as a means of monitoring change. The lifestyle audit comprises apupil questionnaire, family questionnaire, interactive games, and data interpreter. Theresults from the audit have local and national implications for shaping environmentalpolicies.
Natural Environment Research Council
Ms S Anderson of the Communications Directorate at the Natural EnvironmentResearch Council (NERC) spoke at TEC 2000 about the role of the organisation in thepublic understanding of science, while B Knowles presented a poster display on theeducational role of the organisation. NERC supports research on issues includingbiodiversity, environmental risks and hazards, global change, natural resources, andpollution. The NERC schools programme comprises three main elements: the CrestAward scheme, Researchers in Residence and the schools liaison network. TheRIVPACS programme relates directly to environmental change because it is animportant means of assessing water quality and monitoring change in UK rivers throughan examination of the macroinvertebrate fauna in relation to environmental features.Ideas for the development of educational tools based on the RIVPACS programme (asoutlined below in Objective 3) would be outside the existing educational schemes inwhich NERC participates but these schemes could nonetheless enhance the use of aneducational RIVPACS package.
The pressure to move schools, the curriculum and communities away fromenvironmental education towards education for sustainable development was discussedby A Reid of the University of Bath at the TEC 2000 conference.

R&D TECHNCIAL REPORT E1-007/TR 13
Pupil Researcher Initiative
The Pupil Researcher Initiative (PRI) is a major UK school science curriculum projectsupported by the Engineering and Physical Sciences Research Council (EPSRC) and theParticle Physics and Astronomy Research Council (PPARC) and managed by the Centrefor Science Education at Sheffield Hallam University. PRI aims to raise pupilmotivation and achievement in science particularly in investigative and ICT skills andincrease the interaction between schools and the science and engineering researchcommunity. To achieve these aims PRI has three main areas of activity: producingcurriculum activities and materials; promoting events to celebrate the scienceachievements of pupils; and mobilising the science and engineering researchcommunity to support science education.
The components of PRI designed to achieve these aims include:
1. Curriculum materials that cover essential syllabus content but also providemotivating contexts based on real research scenarios that present pupils with arealistic image of what science and engineering is all about. Pupil research briefs(PRBs) aim to put the student in the role of researcher, to provide active learningapproaches, together with context and scenario based learning, by providingopportunities for teaching investigative skills and opportunities for pupils todevelop scientific capability;
2. Researchers in Residence: PhD student placements in secondary school sciencedepartments to support investigative work and the development of good scientistrole models for pupils;
3. “Express Yourself” Science conferences: pupil conferences with the pupilsattending poster sessions and workshops where they present investigationreports to their peers and professional researchers; and
4. PRI web site www.shu.ac.uk/pri: this contains a wealth of information about theproject and its components including new learning resources, PRISM-Online(the PRI pupil journal), networking opportunities (school-to-school and school-to-researcher) and up-to-date project information.
It is possible to see how a RIVPACS educational package could be used to fulfil someof these aims and initiatives, and also to learn from the Pupil Researcher Initiative waysin which it could be used – for example, by researchers in school using RIVPACS.
British Educational Communications and Technology Agency
Information and communications technology can help pupils by enhancing enquiryskills, providing access to sources, developing understanding, providing access toperspectives, and contributing to pupil awareness of ICT in society. There is also arequirement in the National Curriculum to use information and communicationstechnology. The British Educational Communications and Technology Agency(BECTa) is a Government Agency responsible for Information and CommunicationsTechnology in education. Development of an educational package based on theRIVPACS software thus meets needs for educating all sectors of the public about

R&D TECHNCIAL REPORT E1-007/TR 14
environmental concerns while affording an opportunity to familiarise with computertechnology and its application in science.
Association for Science Education
The Association for Science Education is for teachers, advisers, technicians,industrialists and others contributing to science education. It promotes, supports anddevelops science education from primary through to tertiary levels. It is independent inits thinking and in its finance. It is a registered charity, financed by members’contributions and receives no government funding. It provides a forum for the views ofmembers on science education issues through its regional and national committeestructures. Those in authority and in government, industry and Local EducationAuthorities frequently and regularly consult ASE. Among its many functions it supportsrelevant curriculum support materials. It provides ASE Inset (In-service Training)Services 2000/2001. Inset days are a useful and recommended way in which teacherscan take time out from the classroom to attend short training courses, workshops ordemonstrations of new or developing educational support materials. Assessing whatproducts teachers really need to deliver curriculum requirements, and allowing teacherinput at the development stage of new educational products ensures that the educationaltools are appropriate, relevant and required.
ASE also runs the on-line SciShop, which is a resource area to support teachers andstudents in KS3 Science. The resources are related to specific learning objectives of theKS3 National Curriculum. The Editors of SciShop will be pleased to accept ideas andnew resources for inclusion in the database. There is a possibility that a wider marketfor educational tools based on RIVPACS could be reached by uploading material ontoone of the SciShop servers.
Council for Environmental Education
Finally, the Council for Environmental Education, in collaboration with the Departmentfor Education and Employment and the former Department of the Environment,Transport and the Regions, has written a voluntary code of practice for producingeducation resources entitled Supporting sustainable development through educationalresources – a voluntary code of practice (DfEE Crown Copyright 1999). It provides tenprinciples of good practice, in order to ‘raise standards of educational resourcesdesigned to support education for sustainable development’. These are:
Content (what resources contain)
• Principle 1: Principles of sustainable development. Resources should fosterunderstanding of the principles of sustainable development and the aims andsignificance of Agenda 21 (1992).
• Principle 2: Integrity. Any information and data provided should be accurate,current and verifiable.

R&D TECHNCIAL REPORT E1-007/TR 15
• Principle 3: Balance. When purporting to give a balanced account of an issue,resources should accurately reflect the broad range of informed opinion on thesubject.
• Principle 4: Values and attitudes. Resources should help people to explorevalues and develop responsible attitudes in relation to their fellow citizens andthe environment, from local to global level.
• Principle 5: Knowledge and skills. In addressing environmental anddevelopment issues, resources should help develop the knowledge, skills andcompetencies to enable people to participate effectively in their resolution.
• Principle 6: User-centred approach. To ensure maximum take-up, resourcesshould be easy to use and appropriate for the intended audience.
Process (how the resources have been developed)
• Principle 7: Need. Producers should be able to demonstrate there is an identifiedneed for the proposed resource.
• Principle 8: Development. Producers should ensure that the development of theresource is inclusive, participative and has drawn on appropriate educationalexpertise.
• Principle 9: Production. Producers should demonstrate that the productionprocess has followed best sustainable practice wherever possible.
• Principle 10: Promotion and distribution. Producers should consider theimplications of promotion and distribution from the outset and ensure that theyare effective, appropriate and accessible.
Detailed guidance statements are provided for each principle.
CONTACTS FOR THE ABOVE MENTIONED ORGANISATIONS
Environment AgencyNational Education Programme Co-ordinator, The Environment Agency, Block 1,Government Buildings, Burghill Road, Westbury-on-Trym, Bristol, BS10 6BF, Phone0117 914 2824, Fax 0117 914 2606.Regional Education Co-ordinator, Environment Agency, Anglian Region, KingfisherHouse, Goldhay Way, Orton Goldhay, Peterborough, PE2 5ZR.
Natural Environment Research CouncilNatural Environment Research Council, Communications Directorate, Polaris House,North Star Avenue, Swindon, SN2 1EU, Phone: 01793 411500, Fax: 01793 411501,www: http://www.nerc.ac.uk.

R&D TECHNCIAL REPORT E1-007/TR 16
UniversitiesUniversity of Bath, Department of Education, Bath, BA2 7AY; Phone: 01225 826225;Fax: 01225 826113; www: http://www.bath.ac.uk/ Departments/Education.
Pupil Researcher InitiativeCentre for Science Education, Sheffield Hallam University, City Campus, Sheffield, S11WB. Phone: 0114 225 4876.
British Educational Communications and Technology AgencyHead of Curriculum and Institutional Development for Schools, The British EducationalCommunications and Technology Agency (BECTa), Millburn Hill Road, Science Park,Coventry, CV4 7JJ; Phone: 024 7641 6994; Fax: 024 7641 1418; www:http://www.becta.org.uk.
Association for Science EducationThe Association for Science Education, College Lane, Hatfield, Herts, AL10 9AA; ASEHQ Telephone: 01707 283000; www: http://www.ase.org.uk/
ASE Inset (In-service Training) Services 2000/2001 Tel: 024 7669 0053, Fax: 0247669 0726.
Council for Environmental EducationCEE, 94 London Street, Reading, RG1 4SJ, http://www.cee.org.uk
3.4.2 Subject-specific considerations
This section indicates potential links between RIVPACS and associated ideas ormaterials on the one hand and primary and secondary level curricula at Key Stages 1 – 4(including GCSE), and specifications for AS and A level GCE.
Primary and secondary education to GCSE level (age 5 to 16 years)
“It is important to ensure that the National Curriculum guidelines are referred to, andincluded, in any method of delivery to the formal education sector (e.g. Directinvolvement, production of education resources, INSET (In-service Training) forteachers, field trips) to make most efficient use of time for teachers, and no less, for theAgency’s own time and financial resources.” (The Concise Curriculum - Introduction)
The National Curriculum states the requirements for each subject and key stage. Thisinformation is summarised in the Environment Agency’s Concise Curriculum.Programmes of work regarding what pupils should be taught at each key stage aretabulated in the Concise Curriculum.
Science, for example, is an obvious area to which RIVPACS is relevant. In thisparticular section the requirements at each Key stage are outlined. We are told thatpupils should gain knowledge, a variety of skills and understanding through the subjectof science at key stages 1- 4 (5-16 years). They will:

R&D TECHNCIAL REPORT E1-007/TR 17
• gain knowledge of ‘the cultural significance of science and world-widedevelopment’; ‘phenomena and events in the world around them’ and means of‘scientific method’;
• gain ‘questioning, developmental and evaluative’ skills as well as initiatingcritical and creative thought; and
• gain understanding of ‘major scientific ideas which contribute to technologicalchange’ and how ‘issues may affect their own lives, the direction of society andthe future of the world’.
Throughout all four key stages (KS 1-4) for Science, the National Curriculum states thatpupils should make progress in scientific enquiry, life processes and living things,materials and their properties, and physical processes. Of these, scientific enquiry, andlife processes and living things are most relevant to a RIVPACS educational package.
At all Key Stages from 1 to 4, scientific enquiry deals with ideas and evidence inscience, and the development of investigative skills including planning, obtaining andpresenting evidence, and considering and evaluating evidence. Similarly, under theheading of life processes and living things, pupils must examine life processes, humansand other animals, variation and classification, and living things and their environment.
Some of the specifications in the full National curriculum for Science are of particularrelevance if the anticipated RIVPACS educational package incorporates a web site, CD-ROM or computer-based identification key. It should be noted in Sc2 Life processesand living things (p 24) under the heading Variation and Classification it is stated thatpupils at Key Stage 2 (children 7-11 years) should be taught to make and use keys, howlocally occurring animals and plants can be identified and assigned to groups, that thevariety of plants and animals makes it important to identify them and assign them togroups. It is also noted that this provides an ICT opportunity where pupils could use abranching database to develop and use keys. By Key stage 3 (11-14 years) (NationalCurriculum p 28) pupils should be taught about environmental and inherited causes ofvariation within a species, and to classify living things into the major taxonomic groups.
Under the heading of Living things in their environment the National Curriculum saysthat Key Stage 2 pupils should be taught about ways in which living things and theenvironment need protection. Within this section pupils should learn about adaptation –about the different plants and animals found in different habitats, and how animals andplants in two different habitats are suited to their environment. This provides an ICTopportunity in which pupils could use video or CD-ROM to compare non-local habitats.By Key Stage 3, pupils should be taught about ways in which living things and theenvironment can be protected and the importance of sustainable development; thathabitats support a diversity of plants and animals that are interdependent; how someorganisms are adapted to survive daily and seasonal changes in their habitats; and howpredation and competition for resources affect the size of populations.
At Key stage 4, involving children from 14 to16 years, (Science Single p 37, ScienceDouble p 46) RIVPACS may be relevant to the curriculum in most of the Sc1 ScientificEnquiry, Sc2 Life Processes and Living Things, and some areas of Variation,

R&D TECHNCIAL REPORT E1-007/TR 18
Inheritance and Evolution, and of Living Things in their Environment under Adaptationand Competition but the application of RIVPACS based educational tools may be lessappropriate than at earlier Key stages 1 – 3. Many of these parts of the curriculum couldbe developed as add-ons related to the RIVPACS package.
Similarly the curricula for the other main subjects are dealt with. However, theapplication of a RIVPACS educational package to other subjects such as geography,literacy, numeracy, and citizenship is less relevant and more peripheral than in thesubject of science.
Secondary level education to AS and A level (age 16 to 18 years)
School education for pupils above the age of sixteen years is no longer governed by therequirements of the National Curriculum but is geared towards the acquisition ofqualifications based on examination syllabi (now referred to as specifications) set outby the newly unified Examining Boards. These examinations lead to AS and A levelqualifications. Details of the specifications for each subject can be found at theQualifications Curriculum and Assessment web site http://www.qca.org.uk.
The subjects to which educational tools based on RIVPACS most readily apply arebiology, geography, and environmental science.
Biology
The broad aims of the AS and A level specification in biology are to encourage studentsto:
• develop essential knowledge and understanding of concepts of biology, andskills needed for the use of these in new and changing situations;
• develop an understanding of scientific methods;• be aware of advances in technology, including information technology, relevant
to biology;• recognise the value and responsible use of biology in society; and• sustain and develop their enjoyment of, and interest in, biology.
In addition, A level specifications in biology should encourage students to:
• show an understanding of knowledge, facts, principles and concepts fromdifferent areas of biology and to make and use connections between them.
Certain AS and A level specifications in Biology refer to areas of study to whichRIVPACS is relevant. For example, students should learn about the adaptation ofspecies to survive in particular environmental conditions (3.11); that species areclassified into groups – the principles and importance of taxonomy (3.18); the dynamicnature of ecosystems (3.20) and the ecological impact of human activities (3.21).
In the area of experiment and investigation, students are required to plan, carry out andevaluate their work using information technology where appropriate. Students should be

R&D TECHNCIAL REPORT E1-007/TR 19
able to understand the principles of sampling as applied to biological data and theimportance of chance in interpreting data (3.23).
Specifications for the subject of Biology can be found at http://www.aqa.org.uk, and forBiology/Biology (Human) A at http://www.aqa.org.uk/qual/gceasa/bioA.html. Thecourse is divided into modules, to some of which the application of a RIVPACSeducational package would be appropriate. These include Module 5 – Inheritance,Evolution and Ecosystems (Biology and Human Biology) in which the biology ofecosystems is studied. It states that living organisms do not live in isolation but formstructured communities within dynamic and well-defined ecosystems through whichenergy flows and in which nutrients are cycled. This module also allows considerationof some of the ways in which human activity can impose far-reaching effects on theenvironment. It is expected that candidates will carry out fieldwork involving thecollection of quantitative data from at least one habitat and the application ofelementary statistical analysis to the results. A critical appreciation is required of someof the ways in which the numbers and distribution of organisms may be investigated;and an understanding is needed of the concept of diversity in the context of ecologicalstability; and of the concept of succession - from pioneer species to climax community;and that changes in abiotic factors can result in a less hostile environment andincreasing diversity.
Biology B specification can be found at http://www.aqa.org.uk/qual/gceasa/bioB.html.Modules in which the use of educational tools based on RIVPACS might be especiallyapt include Modules 5 and 6. Module 5(a) deals in a general way with the environment,energy flow through ecosystems, materials recycled in ecosystems, dynamics ofecosystems, and the impacts of human activities on the environment. Module 5 (b) is anassessment of a practical investigation.
Module 6 concerns applied ecology. It deals with the concept of diversity through aknowledge of sampling techniques including netting and trapping; diversity indices;abiotic and biotic factors; and stability of ecosystems. The effects of pollution ondiversity are studied through a knowledge of pollution of aquatic ecosystems; the use ofdiversity indices and indicator species in monitoring freshwater pollution; the effects oforganic effluents and also heavy metal ions, acid rain and oil spillage on aquaticecosystems. Knowledge is required that organisms show structural, physiological andbehavioural adaptations for survival in a given niche. Agricultural ecosystems,harvesting from a natural ecosystem, and conservation (species, nature, biological,environmental and global) are also studied.
Specifications for Geography, Geography A and Geography B can be found at web siteshttp://www.aqa.org.uk, http://www.aqa.org.uk/qual/gceasa/geoA.html andhttp://www.aqa. org.uk/qual/gceasa/geoB.html respectively. The specification containsaquatic components, such as, Water on Land, River Systems and River Regime,Channel Processes and Landforms, Flooding as a Hazard and River Basin Management.However, as all the components are related to physical systems rather than biological, itis likely that an educational package based on RIVPACS would have a limitedapplication in A level geography.
The specification for Environmental Science can be found on the Web athttp://www.aqa.org.uk/qual/gceasa/env.html. Various aquatic themes, to which

R&D TECHNCIAL REPORT E1-007/TR 20
RIVPACS might be relevant and useful, are contained in the study modules. At ASlevel, Module 1 deals with Energy, the Atmosphere and Hydrosphere. This moduleincludes the study of the need for energy and water by humans, which is linked topossible environmental consequences, for instance the ‘Greenhouse Effect’ and globalclimate change. Some of these consequences, especially pollution, are explored ingreater depth in Module 5, and selected themes link to Modules 2, 3 and 4. Detailedstudies are outlined in 10 especially 10.1 - Hydrological cycle, and 10.3 - Water Use.Module 3 deals with The Biosphere. It includes the productivity and dynamic nature ofecosystems and the size, density and dynamics of populations in relation to humanpopulation growth and the concept of sustainability (see Module 4). The final sectiondeals with the need for biodiversity and indicates the methods and strategies ofconservation. Detailed studies are outlined in section 12 - especially 12.3 The Ecologyof Ecosystems (food chains and webs illustrated by at least one aquatic and oneterrestrial ecosystem using local examples where possible); Changes in Ecosystems(changes in abiotic factors and species diversity in an ecosystem); Diversity andEcological Stability; 12.4 Populations; 12.5 Wildlife Conservation.
Educational materials derived from RIVPACS are also applicable to A levelEnvironmental Science modules. Module 4 - Biotic Resource Management – studies themanagement of biotic resources through an examination of the production processeswhich manipulate the biotic and abiotic components of ecosystems to satisfy theincreasing demand of human population for biological resources. The module builds onprinciples established in the first three modules and links to Module 5 especiallythrough the study of the impacts of the production of waste, and pollution pathways inthe environment.
Module 5 - Pollution and Physical Resource Management develops concepts establishedin Modules 1, 2 and 3 and introduces the idea of sustainable development through astudy of the management of resources. Details in section 14, especially 14.3, on WaterConservation and Pollution, deal with water pollution monitoring by the EnvironmentAgency and water quality standards. Students should be aware of the advantages anddisadvantages of assessment of water quality by physical, chemical and biologicalmethods. Students should also know about the measurement of temperature, totalsuspended solids, oxygen content, nitrate, phosphate, ammonium, pH and BiochemicalOxygen Demand; and the use of Biotic Indices and Indicator Species.
3.4.3 Practical considerations
In this section we deal with the mechanisms used by the Agency to determine the needfor and relevance of new educational material.
The Environment Agency’s booklet entitled Developing Education Resources – A BestPractice Guide covers key aspects for consideration, so that the resulting educationalresource production meets a need and will be used by the target audience. A pre-projectchecklist establishes whether or not to proceed with a project. It asks a series ofquestions which are listed below, together with some demonstration answers usingRIVPACS as the example resource.Name of resource
RIVPACSType of resource

R&D TECHNCIAL REPORT E1-007/TR 21
Web siteProgramme and ancillary on-line material including video footage and down-loadable teacher’s notes and information sheets
Agency’s key themes and issuesManaging Water ResourcesEnhancing biodiversity
Target audienceFormal education (schools and colleges)Business and industry (i.e. environmental consultants & other scientificprofessionals)
The need for the projectSimplified user-friendly Windows version required by professionals includingEA biologistsProgramme and ancillary material can fulfil many requirements of the NationalCurriculum, GCSE, A level and degree courses
Project checksNeed to check with EA databaseNeed to discuss with national and regional education co-ordinators
Working with partnersEnvironment Agency Education Co-ordinatorsEducational consultantsCEH Dorset, River Communities TeamProgramme designer/statistician and computing specialistsSoftware designersExternal partners
Scope of the project (for adapting for wider use)Customised versions of software
Promotional benefits to the AgencyIncreased awareness of projects that the Agency undertakesPromotion of elements of the Agency VisionGood PR
Use of the resourceFormal education sectorSpecifically targeted to meet requirements of curriculum or syllabus, andrequirements of teachers and lecturers – direct consultation with usersnecessaryEnvironmental consultants, freshwater ecologists, other professionals with aconcern for the environment
Method of promotione.g. Formal launch, press releases, local and regional eventsConsultation with Environment Agency Public Relations Department needed atearliest opportunity
DistributionHow?Cost?Public Relations Department advice required
Method of evaluationHave the aims and objectives of developing an educational resource been met?Is it a useful tool?Does it meet the needs of the target audience?

R&D TECHNCIAL REPORT E1-007/TR 22
Does it need further development?Is there scope for enhancement?Questionnaire distributed with resource?Follow-up survey?Follow-up workshop?EA evaluation panel*
FeedbackPart of evaluationHow well or badly has the product been received?
Project costsActual costAll elements of projectFunding streamIs the Agency the sole contributor? Which function or department budget?Other financial partners?Accessibility of external funds or grants?
Value for moneyDoes the resource being developed justify its expenditure?Is the most effective medium being used?
TimescalesProject manager
* Evaluation Panel’s key tasks:
• To identify gaps in the environmental education provision within the Agency• To identify resources which have potential for national development• To act as a forum for assessing the potential for developing inter-regional
projects• To commission independent research that will establish best practice
The pre-project checklist is part of the assessment of the need for and relevance of neweducational material. Once the checklist has been completed in full, it is possible tocarry the project forwards towards potential development. The guidance manual entitledProject Management in the Agency Volume 14 Version 2 04/97 is used to achieve bestpractice in the appraisal and management of projects. The guidance must be applied toall Agency projects and it will need to be applied to the proposed development of anyeducational tools based on RIVPACS.
The Project Executive and Project Manager are responsible for ensuring that the needsand opinions of users of the end product are properly considered throughout theplanning and appraisal process. Guidance is given on the application of appropriateappraisal methodologies. The Project Initiation Document sets out clearly why theproject is being undertaken, what products and benefits it is to deliver, and to whom.
3.5 Objective 3

R&D TECHNCIAL REPORT E1-007/TR 23
To make a judgement on the potential educational products for which there is thegreatest need, and provide guidance on the likely costs, development times andpotential developers.
3.5.1 Options
1. Professional and tertiary educational level products - user-friendly Windowsversion of RIVPACS, together with ancillary products geared to the appropriatelevel, for which there is a definite market amongst professional academics,environmental consultants and in universities and colleges.
2. Senior scholastic level products - simplified version of user-friendly RIVPACSplus ancillary products geared to the appropriate level aimed at GCSE, AS andA level students.
3. Primary and secondary educational level products - references only toRIVPACS and its capabilities and relevance – ancillary products aimed atNational Curriculum Key Stages 1-3 or 4.
4. A combination of options 1, 2 and 3 introduced sequentially.
Potential educational products for which there is the greatest need:
• Revised Windows user-friendly version of the RIVPACS programme andmanual (on-line information and help, and hard copy).
• Different versions of programme available for different educational levels usinga built-in system permitting the required level of access and options, andappropriate manual for each level.
• Customised versions for paying professional customers accessed on the webwith special passwords, including manuals.
• Creation of web site with a user-friendly version of RIVPACS.• On-line aquatic macroinvertebrate BMWP family level key.• Reference list of published identification guides.• Macroinvertebrate specimen reference material.• Illustrative material.• Habitat and life history notes for macroinvertebrates.• Down-loadable information for teachers and students.• Kit list for sampling rivers.• Simplified versions of manual instructions/sampling video.
User-friendly version of RIVPACS
There is the greatest need for educational products based on RIVPACS at a fairly highlevel within the educational system, that is, from perhaps GCSE, through GCE AS/Alevel to higher education courses in Further Education colleges and Universities.Specialist professionals in the field of freshwater ecology, including Agency biologists,would also benefit a great deal from the core product, which would be a revised user-friendly Windows version of the RIVPACS III+ programme. The production ofsimplified versions of the programme, aimed at more junior levels of schooling, might

R&D TECHNCIAL REPORT E1-007/TR 24
not be so useful as the proposed ancillary parts of the package. These would lay afoundation for understanding what RIVPACS is all about and integrate more closelywith the needs of the National Curriculum 2000.
The programme needs to be altered to accept batch loading of data, reading from anExcel spreadsheet or Access Database instead of an ASCII file, as well as retaining theinteractive method of data input. The core programme which does all the calculationsfor expected values and simulation of errors in O/E (observed over expected) ratioscould remain but with a complete new Windows front and back end to make it user-friendly. The user would only work in the Windows medium for input of data, selectionof run options and retrieval of output. Ralph Clarke, as the developer of the latestversion of this complex statistical programme, should be responsible for modificationsto the RIVPACS III+ programme and for overseeing the Windows additions. Thiswould require assistance from another person within the CEH Dorset organisation.Modifications to the main programme could involve the incorporation of ‘blocks’ orpre-set restrictions which would effectively make different versions of the programmeavailable to different groups of users.
Outside Windows programming expertise would be required to make this user-friendlyversion of RIVPACS visually and audibly attractive for both the professional and theeducational market. Computer software designers (outside of CEH Dorset and perhapsCEH) would also be required to incorporate any additional components specificallyconstructed for different levels of the educational market.Access to the full RIVPACS protocol manual would be an essential element of this partof the package. This could be available for downloading from the web site either free ofcharge or on payment using a password. Alternatively, the manual might be madeavailable for purchase as hard copy. Simplified versions of the manual could be writtento suit the specific requirements of each education level. These would tie-in exactlywith the course material in the educational RIVPACS package.
Similarly, a sampling training video should be made available. The existing trainingvideo would need to be updated. There is also scope for a much briefer, simplified andconcise version of the videotape on sampling procedures suitable for NationalCurriculum Key Stages 1 to 4.
Creation of web site with the user-friendly RIVPACS
The creation of a web site would be a cost-effective and efficient way of making theuser-friendly version of RIVPACS, and the educational tools based upon it, accessibleto the widest possible market. Advantages would include:
• the ease of making modifications or updating material as required;• minimisation or avoidance of distribution costs;• the facility of making tailored versions of products accessible to paying
customers through a combination of password system and blocking lines in thesoftware;
• the cost of hard copies of products would be borne by the customer;• a web-site could provide the main method for obtaining feedback on the
products; and

R&D TECHNCIAL REPORT E1-007/TR 25
• access to the RIVPACS educational package via the World Wide Web meansthat it would be available to a very wide audience of students, the generalpublic, and professional/academic workers interested in the British freshwaterenvironment.
Aquatic macroinvertebrate BMWP family level key
Using the RIVPACS computer programme to predict which aquatic macroinvertebrateanimals should occur at specified locations in unimpacted rivers depends on accurateidentification of the animals in the samples. At the simplest level, animals are identifiedto family or group; at the more advanced level, they are identified to species or speciesgroup. Certain commonly occurring families of aquatic macroinvertebrates are knownto have greater or lesser tolerance to pollution and, on this basis, the families have beenassigned different scores. For example, a mayfly larva of the family Ephemerellidaewhich is intolerant of pollution has a score of 10, while worms or Oligochaeta which arehighly tolerant of pollution have a score of 1. These scores were assigned by theBiological Monitoring Working Party, and the families are consequently referred to asBMWP families. A table, giving the scoring system as used in the 1980 River QualitySurvey and later surveys may be found in the 1980 survey report (National WaterCouncil 1981). The ability to identify specimens of the BMWP families ofmacroinvertebrates is essential when comparing the observed fauna at a site withpredictions at BMWP family level using RIVPACS.
Various keys, and in particular the scientific publications of the Freshwater BiologicalAssociation exist to help with the task of species level identifications. However, there isalso a need for a reliable key to the families of macroinvertebrates (and particularly theBMWP families) found in freshwaters. It is suggested, therefore, that a new kind ofinteractive on-line key should be developed specifically for the task of helping novicesto make correct identifications of the BMWP families of animals because this isnecessary for an understanding of freshwater communities of animals and, as previouslyindicated, is essential for the running of the RIVPACS programme.
LucID is a system for devising the required type of identification key. LucIDProfessional for Windows is an interactive matrix-based key designed specifically forcreating powerful but easy–to-use identification keys(http://www.publish.csiro.au/lucid/). The Windows program consists of the LucIDBuilder, which allows you to design and build your own identification keys for anymaterial; and the LucID Player, which allows interactive use of those identificationkeys.
Features of LucID Professional:
• Identification is easy – start with any character.• The point and click interface is elegant and straightforward.• Images, videos and sounds can be included.• States are coded as common or rare, and misinterpretations are allowed for.• Discrete character data and continuous numeric data are supported.• ‘Best’ can be asked for the optimum route to identification.• Related sub-keys can be loaded from the main key.

R&D TECHNCIAL REPORT E1-007/TR 26
• Errors can be tolerated and set to your requirements; material within keys can becompared for similarities and differences.
• Remaining possible answers are ranked according to their probability of beingcorrect.
• Keys can be created in languages other than English.
LucID solves several identification key problems. When identifying material, how doyou identify something if you do not already know what it is? Generally, you need touse some kind of identification key, a structure built to help you identify an unknownitem. Keys can be built to identify members of any group of things. All keys use acommon principle: you answer questions about the item until the key can tell you whatthe item is. Some keys ask questions in turn, others (e.g. LucID keys) present you with alist of questions, and you can choose which you would like to answer first.
Existing keys have certain limitations. Most existing keys are text-based branching keysin which they present you with a first choice from which you make a decision,proceeding to where the answer leads. This works well if you can answer each of thequestions in turn, but becomes difficult if you encounter one or more questions that youcannot answer. LucID combats these limitations by being based on a matrix, whichmeans that the key is a list of questions, from which you choose one to answer,depending on the material in your hand. Also LucID is highly graphics-based, enablingcomplex concepts to be explained simply, with coloured illustrations. Because LucIDProfessional produces electronic keys that are distributed on CD-ROM, the use ofillustrations, video and sound is restricted only by the memory of the CD.
Reference lists to key works such as published (hard copy) identification keys tofamily and species level of freshwater macroinvertebrates should be included in thepackage to supplement the LucID BMWP key for higher educational levels andprofessional use where species identification may be required for use alongsideRIVPACS species-level predictions.Illustrative material would be an essential part of any educational package based onRIVPACS. These would be necessary both to inform and to entertain. They couldinclude colour photographs, line drawings, video footage, and animations. Theseillustrations could be used to show:
• the types of rivers in different geographical locations;• rivers in varying states from clean to impacted;• the equipment used for sampling and identification;• sampling methodologies with demonstrations by professional biologists;• macroinvertebrate sample sorting techniques;• the range of aquatic macroinvertebrates occurring in different types of running
waters.• living animals in natural situations; and• preserved animals belonging to the full range of BMWP (Biological Monitoring
Working Party) groups or families as used in the RIVPACS programme.
Macroinvertebrate reference material

R&D TECHNCIAL REPORT E1-007/TR 27
After examining an animal from a sample, and consulting an identification key,professional biologists frequently check their identifications by referring to a collectionof preserved reference specimens, for which the identity of the animals has previouslybeen verified. Provision of reference specimens could be considered as part of theeducational package based on RIVPACS although there might be practical difficultiesassociated with the provision of complete sets of BMWP family specimens.
Habitat and life history notes
As mentioned above, different freshwater macroinvertebrates exhibit differenttolerances to water quality. Additionally, they have preferences for different habitats.On a broad scale this could be fast or slow flowing water, upland or lowland locations,and chalk or acidic streams. On a smaller scale, their habitat preferences might beassociated with certain plant types or riverbed substrates. The life histories and habits offreshwater macroinvertebrates are varied and interesting. The natural history ofindividual families and species, and information about the communities living indifferent habitats, provides the background for RIVPACS as a monitoring andassessment tool. This knowledge also fulfils many of the requirements of the NationalCurriculum regarding such elements as life processes, ecosystems, and biodiversity.
Habitat and life history notes could be made available interactively when on-lineidentifications are being made, or these notes could be downloaded separately as hardcopy.
Downloadable information
Habitat and life history notes are not the only information that could be made availablefor downloading from the web-site. Teachers need to know which parts of thecurriculum can be addressed by which parts of the package. Everything the packagecontains should be cross-referenced to the National Curriculum and examinationspecifications. Teachers will more readily use the package if it is organised in such away that it is easy to apply in the classroom. What teachers might want to find are:-lesson plans and teacher notes; project ideas; instruction sheets for obtaining biologicalsamples and for recording environmental information in the field and from maps; andfinally, procedures for sorting samples. Pupils would need work sheets andsupplementary information and illustrations. All this information would need to beclearly linked to the RIVPACS programme and to specific items within the NationalCurriculum.
Kit list
There could be two ways in which the RIVPACS programme is used in an educationalpackage. For most of Key Stages 1 to 4, it is unlikely that pupils would be able to useeven a simplified version of the RIVPACS programme to assess the ecological qualityof a river as a real-time exercise. The ancillary information, which puts RIVPACS intocontext, might be more relevant to the curriculum. However, an on-line ‘play’ versionof RIVPACS might be feasible (see Riverside Explorer).
At GCSE, AS/A level, and undergraduate level, students would be able to undertakepredictions using a simplified version of the RIVPACS programme. However, at all

R&D TECHNCIAL REPORT E1-007/TR 28
stages there could be an opportunity to carry out fieldwork to collect macroinvertebratesamples and subsequent sorting and identification of specimens.
3.5.2 Likely costs and development times
In his letter of 19 July 2000 Dr R Dines requested ‘the best, but easily availableguidance, to likely costs (for example, derived from experience with the RHS CD)’ forthe proposed educational tools based on RIVPACS.
An example of the overall costs involved in the exploitation of an Environment Agencyproduct for its educational potential, is provided by the development of the interactiveCD-ROM, The Riverside Explorer – Investigating rivers and their habitats in Englandand Wales Version 1, that was launched in May 2000. This educational tool is based ona database of habitat features recorded during a national survey of rivers (River HabitatSurvey), which was conducted jointly by the Environment Agency and the Centre forEcology and Hydrology. Information on more than 45,000 river sites in England andWales may be explored and searched by means of an easy to use geographicinformation system based on Ordnance Survey maps.
The Advisory Unit “Computers in Education” [126 Great North Road, Hatfield, Herts,AL9 5JZ, Tel 01707 266714, Fax 01707 273684, www: http://www.advisory-unit.org.uk] was commissioned to produce the CD-ROM. The assessment of teacherneeds, testing in primary and secondary schools, evaluation by an educational andtechnical panel, and software design were all contracted out to independent specialists.Data and quality assessment were provided by CEH. The CD-ROM was distributed to28,000 schools for a cost in the region of £300K to which the Ordnance Surveycontributed. Further details are available from: Environment Agency, Rio House,Waterside Drive, Aztec West, Almondsbury, Bristol, BS32 4UD, 01454 624400, Fax:01454 624409,www: http://www.environment-agency.gov.uk.
Further ideas regarding costs and development times might be available from theexperiences of other organisations that have already produced educational resourcesrelated to the environment, mostly in the form of a CD-ROM or Web site. However,useful information on development costs has not been forthcoming in consultations withother web site producers within CEH.
The Centre for Ecology and Hydrology (CEH) produces SCHOOLNET, an Internetteaching resource that is interactive and easy to update [Centre for Ecology andHydrology, Monks Wood, Abbots Ripton, Huntingdon, Cambs, PE28 2LS, 01487772534, Fax: 01487 772535, www: http://www.ceh.ac.uk/subsites/ schoolnet]. This is afairly basic web site, which was researched and established over a six-month period bya sandwich student. Costs were therefore minimal, in this instance, and confined to thecost of student supervision by CEH staff.
CEH also runs The Environmental Change Network web site that provides easy accessto information resources from the long-term integrated environmental monitoringprogramme. It allows teachers and students to explore environmental change issues[Centre for Ecology and Hydrology, Environmental Change Network, CEH-Merlewood, Windermere Road, Grange-over-Sands, Cumbria, LA11 6JU, 01539532264, Fax: 013595 34705, www: www.ecn.ac.uk/]. Although this web site is more

R&D TECHNCIAL REPORT E1-007/TR 29
complex than SCHOOLNET, and more in line with the proposed RIVPACS web site,development times and costs are not available, as the relevant activities are notdistinguished in the financial records from other functions and costs.
The Environment Agency itself seems, therefore, to be best placed to readily assessproject costs and development times based on the experience of developing RiversideExplorer and the Greener Futures Lifestyles Audit.
A crucial first step is to produce a Windows version of RIVPACS with the samefunctionality as the current DOS version, but also including many of the outputs asExcel files. CEH Dorset staff would need to undertake this initial work, which isestimated to cost in the region of £40K (see section 5.7.2 of this report for a widerdiscussion of the need for a Windows version of RIVPACS before any further additionsare made to the software, for use by the Environment Agency itself).
Once the Windows version is available, decisions on the sequence of developmentsrequired for Educational RIVPACS must be made by the Education Section of theEnvironment Agency. The following list of possible developments includes some itemswhich would need to be undertaken by staff at CEH Dorset whilst others might best behandled by software designers and those with specialist knowledge in the field ofeducation. As yet, it is premature to clarify this area. However, this breakdown of allpossible elements of the RIVPACS educational package, for each level of educationalor professional use, may assist with the estimation of costs and development times.
FLOW CHART OF POTENTIAL DEVELOPMENTS
TERTIARY Professional & RIVPACS III+ & manualUndergraduate 1. Convert to Windows version
2. Add blocking facilities for different levels& customised versions
3. Create web site4. Remake sampling training video5. Compile list of published identification
keys6. Consider preserved reference specimens7. Interactive BMWP family identification key

R&D TECHNCIAL REPORT E1-007/TR 30
SECONDARY AS/A level RIVPACS blocked to BMWP family level8. Simplified version of the manual
9. Shortened version of sampling trainingvideo
10. Sampling kit list11. Illustrations12. Habitat & life history notes13. Case study materials14. Teachers’ notes
Lesson plansWorksheetsProject ideas
GCSE - As for A level(Key Stage 4) 15. Teaching materials at appropriate level.Key Stage 4 - 16. “Play” version of RIVPACS.(Non-GCSE) 17. Instruction sheets for programme
operation.18. Instruction sheets for sampling procedures.
Other materials as for GCSE.19. Teaching materials at appropriate level.
Key Stage 3 As for Key Stage 4 non-GCSE20. Teaching materials at appropriate level
PRIMARY Key Stage 2 As for Key Stage 321. Teaching materials at appropriate level
Key Stage 1 As for Key Stage 222. Teaching materials at appropriate level
3.5.3 Potential developers
As with costs, ideas about potential developers or sponsors for educational materialbased on RIVPACS may best be provided by the Environment Agency itself, drawingon its wide experience of project funding and sponsorship in many fields includingeducation. The Environment Agency would naturally be the main developer butinvolvement and possibly financial sponsorship might involve various types oforganisation. These could include Local Education Authorities, through their Educationand Business Partnerships; major businesses or industries with a concern for theenvironment; computer or software development companies because the RIVPACSeducational package would encourage use of information and communicationtechnology; and charitable foundations concerned with wildlife conservation and theenvironment.
3.6 Objective 4
To review the extent to which potential RIVPACS products link to the educationalstrategies of the Environment Agency and could be integrated with existingeducational material.
R&D TECHNCIAL REPORT E1-007/TR 31
3.6.1 Environment Agency policy
There are many ways in which the proposed educational products based on RIVPACSaccord with the overall policies of the Environment Agency, in addition to their detailededucational strategies. Before considering the educational strategies, it is worth taking abroader view of the relevance of RIVPACS by way of a recent consultation draftproduced by the Agency entitled Creating an Environmental Vision - Progressing theEnvironment Agency’s contribution to sustainable development by way of a betterenvironment in England and Wales (Consultation Draft June 2000http://www.environment-agency.gov.uk).
Increased access to information
In the Foreword to their document the Chairman, Sir John Harman, says “We recognisethe power of information and we will make data about the environment as widelyaccessible as we can to effect change and stimulate involvement”.
The educational RIVPACS package would make data about the freshwater environmentaccessible to both students and professionals. It would promote an understanding of theinteraction between aquatic macroinvertebrate communities and their physical andchemical environment, and stimulate involvement in the monitoring and assessment ofrivers through examination of the animals that live in them.
Education, information and influence
In Creating an Environmental Vision (page 11, 2.12) the Environment Agency says“We recognise that we have many roles to play: we regulate, but we can also influence,persuade, educate and inform” and later (page 12, 2.18) “We will develop a strongapproach to education, not just of the young but of those we regulate, and of the publicitself. We will aim to spend more time on education and influencing than we have donein the past, in order to change understanding and behaviour. We aim to achieve morevia this approach than can be achieved by imposing regulations upon those who intendto comply with them; our regulatory effort in the future will be concentrated upon thosewho do not intend to comply”.
The exploitation of the RIVPACS programme for the development of educational toolsaligns with the Environment Agency’s aim to educate about environmental concerns, inthis case the health of British rivers, in order to change perceptions and conduct.
Increased public awareness
In Creating an Environmental Vision (page 16), a long-term objective is stated as“People will have peace of mind from knowing that they live in a clean, safe, anddiverse environment that they can use, appreciate, and enjoy. And therefore: people willbe confident that the environment is well cared for, is not damaged by pollution, anddoes not provide a health risk because of human activities. The environment will begreatly valued and cared for by all sectors of society, as a source of income, recreation,sport, and wildlife conservation. Public awareness of local environmental matters willbe high because of the ready availability of high quality local environmentalinformation”.

R&D TECHNCIAL REPORT E1-007/TR 32
The educational packaging of RIVPACS through the proposed web site, and ancillaryproducts, will supply knowledge of the environment, including local environmentalinformation, and provide public access to that information. Through improved softwarewith databases, information sheets, identification keys, opportunities for interaction,guidelines for fieldwork activities in local rivers, and analysis of the results, publicawareness and understanding of both the local and wider freshwater environment canbe increased. One of the ways in which the freshwater environment is cared for,through regular monitoring and assessment of its biological communities, will becomemore apparent and lead to confidence in the efforts to protect the quality of the aquaticenvironment.
Use of the Internet
The Environment Agency expresses the view (page 5, 1.5) that “The use of our internetsite has played an important role in our strategy by providing national and regionalinformation…”
The Agency therefore recognises that use of the Internet as a means of disseminatinginformation is an efficient system. The suggestion that the Educational RIVPACSpackage might be best delivered via the World Wide Web is endorsed by this view.
Reliance on biological ‘health’
In considering the improvement and protection of inland waters, the Agency (page 28)says “And we will place greater reliance on using information on biology, and thebiological ‘health’ of our aquatic wildlife, to tell us where future improvements need tobe made”.
RIVPACS is the method used throughout the UK and Northern Ireland for determiningthe biological ‘health’ of our rivers. A RIVPACS educational package would be anexcellent means of demonstrating to the general public the reasons why the monitoringof aquatic macroinvertebrates is so important to the determination of ecologicalquality.
3.6.2 Detailed educational strategies
In 1996 the Education Section of the Environment Agency set out its strategy in theFramework Business Plan 1996-2001 (Version 4 October 1996). Under the headingBackground and Brief it states that ‘Education is accepted amongst informed opinion asbeing crucial to the delivery of an improved environment for future generations. TheAgency has a duty to disseminate information about the environment …; the educationstrategy will contribute towards that environmental information being used by society atlarge in support of environmental improvement.’
The mission of the education strategy is: ‘To initiate, advance and supportenvironmental education, at a local, national and international level in order to developand influence an environmentally conscious and responsible society.’The aims of the strategy are:

R&D TECHNCIAL REPORT E1-007/TR 33
• to promote greater understanding of the environment and environmental issues,through partnership;
• to educate society to protect and enhance the environment; and
• to improve the environmental behaviour and practice of specific stakeholdergroups by the provision of relevant and timely information.
The mission and aims will be implemented via six objectives which target specificgroups.
• To build partnerships through consultation, joint ventures and sponsorship andto enhance and protect the environment for future generations.The development of an educational package based on RIVPACS would resultfrom a partnership between the Environment Agency, the Centre for Ecologyand Hydrology, educational consultants and software designers. It would be ajoint venture, involving sponsorship, that would promote knowledge of thefreshwater environment and provide a means of monitoring, and thereforeprotecting, that environment for the future.
• To educate young people through teaching aids, educational materials and otherinitiatives to equip them to make informed judgements about futureenvironmental decisions.The information, understanding, biological and technical expertise that wouldbe imparted by the educational materials and activities designed around theRIVPACS programme would help to educate and equip young people to makeknowledgeable decisions about environmental matters in the future.
• To enhance practitioner understanding of environmental issues, both inside andoutside the Agency, through links with tertiary education, workplacements/secondments and an awards scheme to achieve alignment with theAgency’s aims.A simplified and user-friendly Windows version of RIVPACS would be thecentral feature of the educational package together with a wide range ofancillary products and information. These products could provide an elevatedunderstanding of environmental issues concerning the freshwater environmentamongst Environment Agency biologists, professional environmentalconsultants, research scientists, and prospective freshwater ecologists beingtrained in universities. Work placements, the Researchers in Residence andCrest Award schemes, jointly sponsored by the Natural Environment ResearchCouncil and the Environment Agency could be used as vehicles through whichthe RIVPACS package could promote the Agency’s aims.
• To educate industry through consultation, collaborative activities and targetedcampaigns to promote a culture of ‘prevention’ rather than ‘cure’.A Windows version of RIVPACS could be made available for purchase byorganisations whose own activities may influence river quality.

R&D TECHNCIAL REPORT E1-007/TR 34
• To foster public awareness of environmental issues and concerns throughpublicity, media relations and campaigns, to engender in society a commonownership of the environment and its challenges.Not only the direct use of the RIVPACS educational package, but also thepromotion of it (for example, through direct advertising, media involvement andconferences) could play a part in raising public awareness of environmentalissues and change attitudes from passive to participative.
• To add the international/European dimension to environmental educationthrough the Agency’s existing remit and links to the European EnvironmentAgency and by building on established international relationships, to contributeto the common goal of global sustainable development.The RIVPACS educational package could potentially provide an internationaland European dimension to environmental education in order to contribute tothe common goal of sustainable development. RIVPACS has formed the basis ofother techniques for assessing biological quality in fresh waters such asAUSRIVAS in Australia (Davies, 2000; Simpson & Norris, 2000; Humphrey,Storey and Thurtell, 2000) and BEAST – BEnthic Assessment of SedimenT - inCanada (Reynoldson, Day & Pascoe, 2000; Rosenberg, Reynoldson & Resh,2000). Additionally, a current initiative is attempting to standardisemacroinvertebrate sampling methods used in the European Union, tounderstand errors associated with each method, and integrate data fromsamples with other taxonomic groups, in order to provide a unified assessmentof the Ecological Status of sites in accordance with the Water FrameworkDirective. This is attempting to integrate RIVPACS with other methods inEurope.
With particular regard to environmental education, the educational strategy specifiesthat environmental education should be seen as an ongoing activity concerned not onlywith passing on information but also with changing attitudes and raising awareness sothat people can make value-based decisions on environmental matters. The targetaudience is not just children but also other identified important groups. Environmentaleducation should involve additional methods to the provision of resource materials.
The proposed RIVPACS educational package could conform in all these areas.
The overall approach would be for every activity to be linked to one or more of the sixobjectives in the strategy while ongoing discussion with appropriate governmentdepartments and other environmental education providers will ensure that due regard isgiven to existing education strategies and policies. Likewise, curricular considerationswill be paramount if the Agency decides to develop resource materials forschools/colleges.
The proposed RIVPACS educational package readily accords with the six objectives inthe Environment Agency educational strategy, and it is a fundamental requirement of itsdevelopment that it should pay heed to national education strategies and policies andcurriculum objectives. Thus, the proposed RIVPACS educational package links well tothe general and specific educational strategies of the Environment Agency.
3.6.3 Integration with existing Environment Agency educational material
R&D TECHNCIAL REPORT E1-007/TR 35
A wide range of materials from leaflets and posters, to activity ideas generated in thedifferent Environment Agency regions has been collated into a central educationalresource database which is available to regional Environment Agency educationalofficers. Resource packs and data are also available through local area offices. A morerecent innovation has been the development of the Agency’s Education web site:http://www.environment-agency.gov.uk/ education/.
This provides resources for further and higher education, and for schoolteachers. Thematerials for further and higher education include case studies, simulations and role-play exercises to develop students’ personal and interpersonal skills through teamworking, problem-solving, decision making and presenting in a way that integratespersonal development into the normal academic curriculum. They also place academiclearning into the work context using real scenarios. Each case study includes bothstudent and tutor notes. Education resources for schoolteachers incorporate worksheetsand activities for teachers of key stages 1, 2 and 3 including numeracy and literacyworksheets and follow-up activities; and Ripples and Stepping Stones worksheets whichillustrate the activities of the Environment Agency (the information is complemented bysuggested questions and activities). The Ripples worksheets for younger pupils coverthe topics of the story of a river, droughts and floods, holding back the sea, pollution,conservation, river life. The Stepping Stones worksheets for older pupils cover suchsubjects as river flooding, coastal flooding, the water cycle, pollution, waste control,uses of the water environment, environmental management (including biologicalmonitoring) and conservation. These resources can be downloaded for use in theclassroom. There are also lists and summaries of a range of education resources,together with contact details, available to teachers.
The Activities page of the web site is designed not only to raise awareness ofenvironmental issues but also to encourage students to get involved in practicalactivities. These activities include details of an aquatic invertebrate sampling kit andbasic sampling methodology. Details of partnerships and awards, and interactive gamesare also provided.
In common with the Agency’s education web site, one based on the RIVPACSprogramme could present related case materials, worksheets and activities allspecifically keyed in to the requirements of the National Curriculum and examinationspecifications. However, it would concentrate on aspects related to the biologicalmonitoring of rivers, and could present information in a wider range of formats, andaddress the needs of a much wider audience. Clearly, to fulfil all these needs it may benecessary to implement the package in stages.
3.7 Recommendations
This report demonstrates the considerable potential for the development of educationaltools based on RIVPACS from primary, through secondary, to tertiary level.
‘We recommend that the Environment Agency Education Unit considers the need fora full scoping study into the merits of developing educational tools based onRIVPACS’.

R&D TECHNCIAL REPORT E1-007/TR 36
There is also an urgent need to develop a Windows version of RIVPACS, not only foruse by the Environment Agency, but as the necessary precursor to the development of avariety of educational tools based on RIVPACS.
‘We recommend early consultation between the Environment Agency and CEHDorset with regard to the funding of a Windows version of RIVPACS and forclarification of future Intellectual Property Rights’.
3.8 References
Agenda 21, 1992. Programme of action for sustainable development. United NationsConference on Environment and Development. New York: United Nations, 1992.
Cairns J and Pratt J R, 1993. A history of biological monitoring using benthicmacroinvertebrates. In Freshwater Biomonitoring and Benthic Macroinvertebrates(Eds. D M Rosenberg and V H Resh), pp. 10-27. Chapman and Hall, New York.
Davies P E, 2000. Development of a national river bioassessment system (AUSRIVAS)in Australia. Chapter 8 in Assessing the biological quality of freshwaters – RIVPACSand other techniques Wright J F, Sutcliffe D W and Furse M T (Eds.), pp. 113-124.Freshwater Biological Association.
Hellawell J M, 1986. Biological Indicators of Freshwater Pollution and EnvironmentalManagement. Elsevier Applied Science, London and New York. 546 pp.
Humphrey C L, Storey A W and Thurtell L, 2000. AUSRIVAS: operator sampleprocessing errors and temporal variability – implications for model sensitivity. Chapter10 in Assessing the biological quality of freshwaters – RIVPACS and other techniquesWright J F, Sutcliffe D W and Furse M T (Eds.), pp. 143-164. Freshwater BiologicalAssociation.
National Water Council, 1981. River quality: The 1980 survey and future outlook.National Water Council, UK.
Reynoldson T B, Day K E and Pascoe T, 2000. The development of the BEAST: apredictive approach for assessing sediment quality in the North American Great Lakes.Chapter 11 in Assessing the biological quality of freshwaters – RIVPACS and othertechniques Wright J F, Sutcliffe D W and Furse M T (Eds.), pp. 165-180. FreshwaterBiological Association.
Rosenberg D M, Reynoldson B R and Resh V H, 2000. Establishing referenceconditions in the Fraser River catchment, British Columbia, Canada, using the BEAST(Benthic Assessment of SedimenT) predictive model. Chapter 12 in Assessing thebiological quality of freshwaters – RIVPACS and other techniques Wright J F, SutcliffeD W and Furse M T (Eds.), pp. 181-194. Freshwater Biological Association.
Rosenberg D M and Resh V H (Eds.), 1993. Freshwater Biomonitoring and BenthicMacroinvertebrates. Chapman and Hall, New York. 488 pp.

R&D TECHNCIAL REPORT E1-007/TR 37
Simpson J C and Norris R H, 2000. Biological Assessment of river quality:development of AUSRIVAS models and outputs. Chapter 9 in Assessing the biologicalquality of freshwaters – RIVPACS and other techniques Wright J F, Sutcliffe D W andFurse M T (Eds.), pp 125-142. Freshwater Biological Association.
Wright J F, 2000. An introduction to RIVPACS. In Assessing the biological quality offreshwaters – RIVPACS and other techniques Wright J F, Sutcliffe D W and Furse M T(Eds.), pp. 1-23. Freshwater Biological Association.

R&D TECHNCIAL REPORT E1-007/TR 38

R&D TECHNCIAL REPORT E1-007/TR 39
4. AN APPRAISAL OF RIVPACS FOR EVALUATINGTROPHIC STRUCTUREBY R T CLARKE, J F WRIGHT AND J DAVY-BOWKER
4.1 Introduction
In its present form, RIVPACS offers a classification of running-water sites based on thestructure of the macroinvertebrate communities at the component reference sites. Moreimportantly, it provides a procedure for predicting the species to be expected at a newsite with specified environmental features, if it is of high quality, (i.e. the structure ofthe expected community). This approach to biological surveillance, based on thecharacterisation of taxonomic richness and composition, represents a sensitivetechnique for the detection of alterations in aquatic ecosystems (Cairns and Pratt 1993).However, given that benthic invertebrates play an essential role in the food chain,productivity, nutrient cycling and in decomposition processes (Reice and Wohlenberg1993), new insights may be available by considering the functioning of this diverse andcomplex assemblage of organisms.
The role of macroinvertebrates in stream ecosystem functioning has been considered ina review by Wallace and Webster (1996). They point out that benthicmacroinvertebrates are critical to the maintenance of stream functional integrity and thatthey have evolved a diverse array of morphological and behavioural mechanisms forexploiting foods. Some years ago, a scheme was devised for allocatingmacroinvertebrates to a series of functional feeding groups (guilds) based on themorpho-behavioural mechanisms they use to acquire foods (Cummins and Klug 1979,Merritt and Cummins 1984). The groups include scrapers, shredders, gatherers, filterersand predators. It is important to recognise that these functional feeding groups referprimarily to modes of feeding or to food-acquisition systems and not to the type of foodper se, as determined from gut analysis.
The ‘River Continuum Concept’ (Vannote, Minshall, Cummins, Sedell and Cushing,1980) proposed progressive physico-chemical changes along the length of a riversystem and concurrent change in species composition along the system such that thelocal benthic communities are adapted to exploit the particular conditions and foodresources available to them. More recently, there have been criticisms of this concept(Statzner and Higler, 1985) and also additional proposals such as the SerialDiscontinuity Concept (Ward and Stanford, 1983). Although it is true that there arealways discontinuities along river systems, nevertheless, rivers normally present acontinuum of water flow from source to mouth. As a consequence many authors haveattempted to detect progressive changes in the functional feeding groups along thelength of river systems.
The RIVPACS reference sites provide a very substantial dataset on which to examinethis idea. If meaningful Functional Feeding Group (FFG) patterns and trends can bedetected across the range of high quality sites, this would improve our understanding ofbenthic communities in UK rivers. Such information would also provide a baselineagainst which to assess the FFGs reported from impacted sites. This approach wouldoffer an alternative viewpoint from which to interpret the particular form of stress orstresses to which a site is exposed. The potential of RIVPACS to generate expected

R&D TECHNCIAL REPORT E1-007/TR 40
FFG information for new sites would then enable indices or other tools based oncommunity functioning to become a practical proposition. It is anticipated that anydevelopments in this area would be based on family-level data, because this is the levelat which log abundance data are available.
4.2 Objectives
The overall objective is as follows:
‘To produce a scoping report on how RIVPACS could be modified to evaluate trophicstructure’
The specific objectives are:
1. To identify the feeding guild of each family. Identify families where individualspecies or different life stages are likely to belong to different guilds. This willindicate whether the guilds to which taxa are assigned should be absolute orprobabilistic, and depend on season or location. If preliminary investigationsindicate that further work is necessary to identify the guilds of every species inRIVPACS, this work should be described and costed.
2. To assess the correlation of trophic structure with geology, river type, EQIs andother factors.
3. To evaluate the mechanisms by which information about trophic structure fromRIVPACS could be used to evaluate ecological quality.
4. To evaluate the mechanisms by which information about trophic structure fromRIVPACS could be used to provide information about the ecological structureof communities to assist with the understanding of invertebrate communities.
5. To identify the mechanisms in specific objectives 3 and 4 which have thegreatest practical use as well as those whose integration into RIVPACS wouldinvolve the least effort.
6. To evaluate the mechanisms by which information about trophic structure fromRIVPACS could be used to provide information for water management in thelonger term.
7. To describe the means by which mechanisms identified in specific objective 6should be incorporated into RIVPACS. Modifications to RIVPACS are to bedescribed in detail and costed.
4.3 Literature Review
4.3.1 Development of the Functional Feeding Group approach
The functional feeding group approach was first proposed in North America byCummins (1973) and was then developed and modified in later publications (Cumminsand Klug 1979, Merritt and Cummins 1984). Cummins and Klug (1979) observed that

R&D TECHNCIAL REPORT E1-007/TR 41
almost all aquatic insects are omnivorous and therefore a single species can encapsulatedifferent trophic levels such as detritivore, herbivore and carnivore. For example, anymoderately sized invertebrate which eats autumn-shed leaves (a shredder) will alsoingest associated fungi, bacteria, protozoa and microarthropods plus any algae on theleaf surface and even small macroinvertebrates such as first instar chironomid larvae.Hence, the trophic level approach (Lindeman, 1942) favoured by marine and terrestrialecologists is less helpful to stream biologists interested in understanding the functioningof the system.
Instead, the functional feeding group approach is based on a limited set of morpho-behavioural feeding mechanisms found in freshwater macroinvertebrates and somebasic food resource categories. The latter include (Cummins, 1974):
1. Detritus This can be coarse particulate organic matter (CPOM) orfine particulate organic matter (FPOM) and associatedmicrobiota.
2. Periphyton Attached algae and associated material.
3. Live macrophytes
4. Prey
It appears that the mouthparts and associated feeding behaviour of many aquatic insectsdemonstrate convergent evolution, leading to functionally similar organisms wheresimilar food resource categories are exploited.
The main functional feeding groups proposed by Merritt and Cummins (1984) are:
Shredders – organisms that feed on CPOM - primarily large pieces of decomposingplant tissue, living macrophytes or decomposing wood.
Scrapers (grazers) – animals adapted to graze or scrape periphyton, and associatedmicrobiota from mineral and organic substrates.
Gatherers (collectors) – animals that feed primarily on FPOM deposited in streams.
Filterers (collectors) – animals with specialized anatomical structures or silk-likesecretions that act as sieves to remove FPOM from the water column.
Predators – organisms that feed primarily on animal tissue by engulfing their prey.
Piercers –organisms that pierce and suck the body contents of animals or plants.
Note that piercers represent a minor category, not always recognised by other authors.For example, Wallace and Webster (1996) include the animal element of piercers withinthe predator category.
Merritt and Cummins (1984) argue that the functional feeding group approach providesan assessment, numerically or by standing crop biomass and more significantly by
R&D TECHNCIAL REPORT E1-007/TR 42
production, of the degree to which the invertebrate biota of a given aquatic system isdependant upon a particular food (nutritional) resource. It also makes more apparent thelinkages that exist between food sources and insect morpho-behavioural adaptations.
More recently, Moog (1995) has used the functional feeding group (guild) approachwithin Europe. He has extended the range of feeding types to ten categories, partly bysubdividing some existing groups. Most importantly, he has attempted to categorise theAustrian freshwater fauna into these ten categories on a proportional basis at each ofspecies, genus and family level. Initially, a team of taxonomic specialists and fieldworkers constructed a ‘proposed’ listing based on the literature, unpublishedinformation, professional judgement and educated assumptions. The draft version wasthen widely circulated throughout Austria and Germany and criticisms and commentswere discussed before the standardised list was agreed upon. However, Moog (1995)correctly emphasises that this procedure is not without its difficulties and that moreresearch is needed to confirm and complete the categorisation process. Nevertheless,this information was regarded as the best currently available and in view of the need forunification of assessment methods and the sparse funding available for species-specificstudies, this compromise was the only realistic solution.
4.3.2 Previous use of Functional Feeding Groups
The River Continuum Concept (RCC) developed by Vannote et al (1980) predictschanging food availability and utilisation along the longitudinal course of a river andtherefore offers a practical test of the value of the Functional Feeding Group approach.Vannote et al. (1980) envisage progressive changes from the upper reaches of thesystem (stream orders 1-3) through the middle reaches (stream orders 4-6) to the lowerreaches (stream orders 7 and upwards).
The upper reaches are normally expected to be subject to at least some shading byriparian vegetation including tree cover, resulting in high input of allochthonousmaterial in the form of coarse particulate organic matter (CPOM) and consequentlymore limited autochthonous production in the form of algae and/or macrophytes. As aresult, the shredders are expected to dominate the macroinvertebrate community,thereby generating fine particulate organic matter (FPOM) which is exploited furtherdownstream.
In the middle reaches, as the stream widens, the influence of the riparian zonediminishes and autochthonous production increases. Hence, shredders can be expectedto be less abundant, scrapers can exploit the increased algal production and collectorgatherers and collector filterers utilise the FPOM generated upstream and within thiszone.
Finally, in the lower reaches of large rivers, depositional conditions favour the collectorgatherers and collector filterers. Throughout the system, predators can be expected toexploit all the available categories of prey organisms.
During the 1980s, a number of substantial studies took place in the USA and Canadathat demonstrated longitudinal changes in FFGs and provided support for the RiverContinuum Concept. They included studies in Oregon (Hawkins and Sedell, 1981),Idaho (Bruns et al. 1982), four different biomes across the USA (Minshall et al. 1983),

R&D TECHNCIAL REPORT E1-007/TR 43
Florida (Scheiring, 1985) and also in Canada (Culp and Davies, 1982). More recently, acomprehensive study involving a first to seventh order river continuum in the southernAppalachian Mountains of the USA using FFGs generally supported the predictions ofthe RCC when based on production estimates (Grubaugh et al. 1997) and also whenbased on biomass estimates (Grubaugh et al. 1996). However, the use of habitat-weighted abundance estimates did not produce similar trends (Grubaugh et al. 1996).Within Europe, an investigation of functional feeding groups in Austrian rivers withinthe range of stream orders 1-4 (Schwingshandl, 1992) provided additional support forthe predictions of the RCC.
Nevertheless, some studies have not supported the RCC. For example, Van-der-Veldeand Van-den-Brink (1993) made a structural and functional analysis of themacroinvertebrate fauna along the entire length of the River Rhine. The relativecontributions of the macroinvertebrate fauna to the various functional feeding groupswas remarkably constant, with collectors dominating species composition in all riversections. In New Zealand, Ryder and Scott (1988) studied a series of twelve first tosixth order streams in the South Island to examine the longitudinal distribution offunctional feeding groups. They concluded that the predictions of the River Continuumwere not confirmed in some cases and that a world-wide evaluation of the RCC wasneeded because it may only apply to a limited set of rivers.
If reference sites do exhibit predictable patterns in the relative importance of theirfunctional feeding groups along the length of river systems, then there may be potentialfor using functional feeding groups as indicators of biological quality. In practice, alarge number of studies have already found that changes in the absolute or relativeimportance of FFG categories are useful methods of detecting an impact and that theyhave added value beyond the structural information present in a species list or statementon richness.
Upstream-downstream changes in FFGs were noted by Poulton et al. (1997) after an oilspill and by Camargo (1994) and also by Darschnik and Schumache (1987) as a resultof the impact of fish farm effluents. Garcia de Jalon et al. (1994) observed changes inFFGs on a river by comparing the fauna prior to and after the construction of areservoir, whilst Canton et al. (1984) also noted changes in FFGs as a result of adrought. Rabeni et al. (1985) observed structural and functional aspects of the benthicfauna over a period of seven years when large amounts of money were spent oncleaning up pulp and paper manufacture effluent. They also found that the relativeabundances of the FFGs changed and that functional analyses were valuable. Finally,Chung et al. (1993) used both control and experimental streams to monitor the initialimpact of an insecticide on the macroinvertebrate fauna and the subsequent recoveryprocess, using FFG categories.
However, it would be incorrect to assume that all studies came to a positive conclusionon the value of FFGs. For example, Quinn and Hickey (1993) examined the ecologicalimpact of the discharge of domestic sewage effluent to streams in New Zealand.Benthic invertebrates were compared upstream and downstream of discharges to eightstreams. No general relationships were found between relative densities of functionalfeeding groups and water quality variables. They took the view that early warning ofenrichment is more easily seen at the species level than at the functional level.

R&D TECHNCIAL REPORT E1-007/TR 44
There have also been some more fundamental criticisms levelled at the use of FFGs. Amajor concern has been that it may be difficult to assign a single FFG to amacroinvertebrate taxon because diet may change with life stage and/or size of taxon,with season, or due to spatial variation in food availability (King et al. 1988). There areways of taking some account of this criticism (see next section), but when using largedatasets with many taxa, it is inevitable that some broad generalisations will be made.
Recently, there has also been further debate on the meaning of FFG results and theextent to which they are genuinely capable of providing information on the‘functioning’ of the system. Palmer, O’Keeffe and Palmer (1993) discuss this topic andask the question: What are the functions in streams which the feeding activities ofmacroinvertebrates facilitate? They conclude that shredders facilitate organic matterparticle size reduction and mobilisation and the enhancement of substrates for microbialcolonisation. In contrast, filterers convert fine particulate organic matter to biomass andfaeces, thus increasing organic particle size and retaining organic matter. Collectorsfeed on and excrete fine particles, again leading to retention and enhancement ofsubstrates for microbial activities.
Mihuc (1997) levels more fundamental criticisms. He emphasises that Cummins (1973)originally stated that a functional feeding group denotes a hypothetical particle sizerange ingested or mode of feeding, and not a food type or resource assimilated. TheFFG concept is valid in that it allows grouping of a complex benthic community intocomponents based on particle size ingested and mouthpart morphology. Thus FFGsshould be useful when describing the mode of feeding or food acquisition and the roleof invertebrates in processing of food by particle size. However, Mihuc (1997) pointsout that some authors have used FFG assignments to infer assimilation of resources andhave assumed a strong correspondence between FFGs and trophic role. In other words,they have assumed that shredders are essentially detritivores and scrapers areherbivores. Mihuc (1997) also emphasizes the difficulty of grouping taxa into singleFFGs and therefore queries whether FFG assignments can accurately describe theprocess of energy flow and material transfer between trophic levels in streamecosystems.
In view of these criticisms, it may be argued that the use of the term ‘trophic structure’in the title of this chapter and within the stated objectives is overstating what can beachieved through the use of the Functional Feeding Group approach. Nevertheless, asrecognised above, the approach is still a useful way of viewing the range of feedingactivities utilised by the benthic fauna and the consequences of these activities for thecommunities further downstream.
4.4 Assignment of RIVPACS Families to Functional Feeding Groups
From the outset, it was clear that practical considerations would dictate that assignmentof taxa to functional feeding groups would need to be at family rather than at generic orspecies level. This was because the RIVPACS sampling protocol is based on timedpond-net collections and not on a quantitative sampling regime. For each site,qualitative listings of taxa are then derived, typically at the species/generic level(Wright et al. 1996). In view of the observation that there were often substantialdifferences in the abundance of given taxa at different sites, log abundance categorieswere assigned to encapsulate these differences. However, this could only be done at the
R&D TECHNCIAL REPORT E1-007/TR 45
family level, where taxa were easily distinguished by eye. To attempt the same exerciseat species/generic level was always recognised as unrealistic, given the need formicroscopic examination of many specimens. When considering the functional role ofmacroinvertebrates in running waters it is essential to take account of the abundance (orpreferably the biomass or production) of taxa and hence the available data dictated thatthis assessment would have to be at family level.
The assignment of each RIVPACS family to one or more functional feeding groups wasan iterative process which utilised existing information held within our research group,together with the major publications of Merritt and Cummins (1984) and Moog (1995)and some recent publications to fill in remaining gaps.
Initially, a series of independent lists were developed. The first was our own researchgroup list of RIVPACS families in which an attempt was made to assign each family toone of five functional feeding group categories (shredders, scrapers, gatherers, filterers,predators). In cases where more than one functional feeding group category wasbelieved to be important this was flagged. Second, we tabulated the Merritt andCummins (1984) assignments, which only apply to insects. Here, the predators(engulfers) are separated from piercers. In the Merritt and Cummins (1984) system, agiven family is sometimes assigned to two or more functional feeding groups.
Next, we listed the Moog (1995) assignments (with some modifications, see below)derived from his classification of functional feeding groups at the family/generic level.As previously indicated, Moog (1995) derived ten separate categories, but we havechosen to reduce these to the original five major groupings for the purposes of thisanalysis. This is because two categories are easily merged and the remaining four arevery minor categories within our dataset. Hence, they do not warrant separateconsideration in the current exploratory analyses in which we are looking for generalpatterns. As a result:
‘Active’ and ‘passive’ filterers have been combined as filterersLeaf borers, miners - of minor significance in our datasetXylophagous taxa (consumers of woody debris) have been reallocated to shreddersParasites have been reallocated to predatorsOther feeding types –not classified by Moog (1995).
Moog (1995) reiterated that few species are obligate feeders on a specific food resourceand that diet may change with developmental stage. Hence, he attempted to encapsulatecurrent knowledge at the family/generic level by offering a probabilistic view of thefunctional feeding groups. If a taxon was a predator and ate nothing else it was assigneda value of 10 in the predator category. However, if it exploited the scraper and gathererroles in equal measure, it was assigned 5 points in each category.
In attempting to apply the information in Moog (1995) to the RIVPACS families, thegeneric level values (out of 10) for the genera present in the UK were examined andcollated in order to generate new values with the greatest relevance to family-level datawithin the UK. This offers the best available source of information at present and, withonly minor additions to complete some gaps, has been used in the analyses that follow.

R&D TECHNCIAL REPORT E1-007/TR 46
The full listing of all RIVPACS III+ families with their functional feeding groups on aproportional basis is given in Table 4.1. This is subsequently referred to as method‘Prop’. The same table also proposes for each family the ‘dominant’ functional feedinggroup (Method ‘Dom’). This was derived from the probabilities in Table 4.1 withfurther consideration of those families with co-dominant functional feeding groups inorder to assign a single dominant.
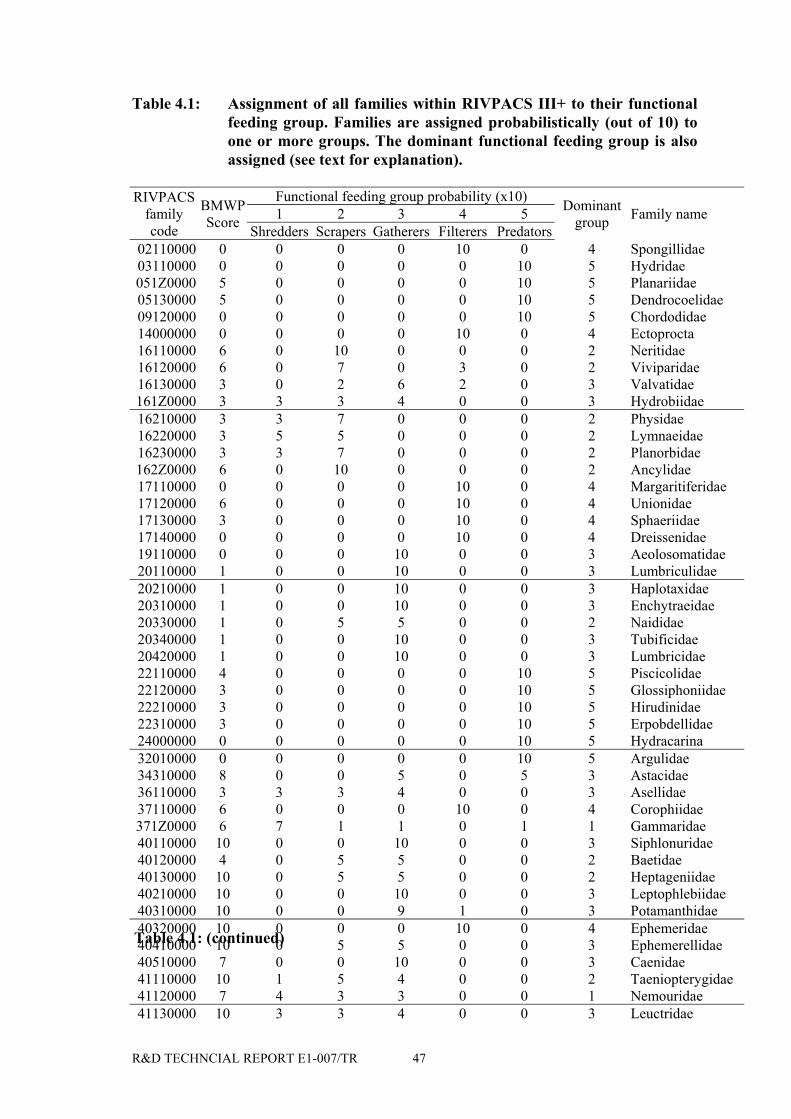
R&D TECHNCIAL REPORT E1-007/TR 47
Table 4.1: Assignment of all families within RIVPACS III+ to their functionalfeeding group. Families are assigned probabilistically (out of 10) toone or more groups. The dominant functional feeding group is alsoassigned (see text for explanation).
Functional feeding group probability (x10)1 2 3 4 5
RIVPACSfamilycode
BMWPScore Shredders Scrapers Gatherers Filterers Predators
Dominantgroup Family name
02110000 0 0 0 0 10 0 4 Spongillidae03110000 0 0 0 0 0 10 5 Hydridae051Z0000 5 0 0 0 0 10 5 Planariidae05130000 5 0 0 0 0 10 5 Dendrocoelidae09120000 0 0 0 0 0 10 5 Chordodidae14000000 0 0 0 0 10 0 4 Ectoprocta16110000 6 0 10 0 0 0 2 Neritidae16120000 6 0 7 0 3 0 2 Viviparidae16130000 3 0 2 6 2 0 3 Valvatidae161Z0000 3 3 3 4 0 0 3 Hydrobiidae16210000 3 3 7 0 0 0 2 Physidae16220000 3 5 5 0 0 0 2 Lymnaeidae16230000 3 3 7 0 0 0 2 Planorbidae162Z0000 6 0 10 0 0 0 2 Ancylidae17110000 0 0 0 0 10 0 4 Margaritiferidae17120000 6 0 0 0 10 0 4 Unionidae17130000 3 0 0 0 10 0 4 Sphaeriidae17140000 0 0 0 0 10 0 4 Dreissenidae19110000 0 0 0 10 0 0 3 Aeolosomatidae20110000 1 0 0 10 0 0 3 Lumbriculidae20210000 1 0 0 10 0 0 3 Haplotaxidae20310000 1 0 0 10 0 0 3 Enchytraeidae20330000 1 0 5 5 0 0 2 Naididae20340000 1 0 0 10 0 0 3 Tubificidae20420000 1 0 0 10 0 0 3 Lumbricidae22110000 4 0 0 0 0 10 5 Piscicolidae22120000 3 0 0 0 0 10 5 Glossiphoniidae22210000 3 0 0 0 0 10 5 Hirudinidae22310000 3 0 0 0 0 10 5 Erpobdellidae24000000 0 0 0 0 0 10 5 Hydracarina32010000 0 0 0 0 0 10 5 Argulidae34310000 8 0 0 5 0 5 3 Astacidae36110000 3 3 3 4 0 0 3 Asellidae37110000 6 0 0 0 10 0 4 Corophiidae371Z0000 6 7 1 1 0 1 1 Gammaridae40110000 10 0 0 10 0 0 3 Siphlonuridae40120000 4 0 5 5 0 0 2 Baetidae40130000 10 0 5 5 0 0 2 Heptageniidae40210000 10 0 0 10 0 0 3 Leptophlebiidae40310000 10 0 0 9 1 0 3 Potamanthidae40320000 10 0 0 0 10 0 4 Ephemeridae40410000 10 0 5 5 0 0 3 Ephemerellidae40510000 7 0 0 10 0 0 3 Caenidae41110000 10 1 5 4 0 0 2 Taeniopterygidae41120000 7 4 3 3 0 0 1 Nemouridae41130000 10 3 3 4 0 0 3 Leuctridae
Table 4.1: (continued)

R&D TECHNCIAL REPORT E1-007/TR 48
Functional feeding group probability (x10)1 2 3 4 5
RIVPACSfamilycode
BMWPScore Shredders Scrapers Gatherers Filterers Predators
Dominantgroup Family name
41140000 10 6 2 2 0 0 1 Capniidae41210000 10 0 2 0 0 8 5 Perlodidae41220000 10 0 1 0 0 9 5 Perlidae41230000 10 1 1 2 0 6 5 Chloroperlidae42110000 6 0 0 0 0 10 5 Platycnemididae42120000 6 0 0 0 0 10 5 Coenagriidae42130000 8 0 0 0 0 10 5 Lestidae42140000 8 0 0 0 0 10 5 Calopterygidae42210000 8 0 0 0 0 10 5 Gomphidae42220000 8 0 0 0 0 10 5 Cordulegasteridae42230000 8 0 0 0 0 10 5 Aeshnidae42240000 8 0 0 0 0 10 5 Corduliidae42250000 8 0 0 0 0 10 5 Libellulidae43110000 5 0 0 0 0 10 5 Mesovelidae43210000 5 0 0 0 0 10 5 Hydrometridae43220000 0 0 0 0 0 10 5 Veliidae43230000 5 0 0 0 0 10 5 Gerridae43310000 5 0 0 0 0 10 5 Nepidae43410000 5 0 0 0 0 10 5 Naucoridae43420000 10 0 0 0 0 10 5 Aphelocheiridae43510000 5 0 0 0 0 10 5 Notonectidae43520000 5 0 0 0 0 10 5 Pleidae43610000 5 0 4 4 0 2 3 Corixidae45110000 5 0 6 2 0 2 2 Haliplidae45120000 5 0 0 0 0 10 5 Hygrobiidae451Z0000 5 0 0 0 0 10 5 Dytiscidae45150000 5 0 0 0 0 10 5 Gyrinidae453Z0000 5 2 4 3 0 1 2 Hydrophilidae45510000 5 0 0 10 0 0 3 Scirtidae45620000 5 0 5 5 0 0 2 Dryopidae45630000 5 0 10 0 0 0 2 Elmidae46110000 4 0 0 0 0 10 5 Sialidae47110000 0 0 0 0 0 10 5 Osmylidae47120000 0 0 0 0 0 10 5 Sisyridae481Z0000 7 0 4 1 0 5 5 Rhyacophilidae48130000 6 0 10 0 0 0 2 Hydroptilidae48210000 8 0 0 0 10 0 4 Philopotamidae482Z0000 8 0 8 1 1 0 2 Psychomyiidae48240000 7 0 0 0 1 9 5 Polycentropodidae48250000 5 0 2 0 5 3 4 Hydropsychidae48310000 10 2 1 1 0 6 5 Phyrganeidae48320000 10 0 2 0 5 3 4 Brachycentridae48330000 10 5 5 0 0 0 1 Lepidostomatidae48340000 7 5 2 1 0 2 1 Limnephilidae48350000 10 0 9 1 0 0 2 Goeridae48360000 10 0 10 0 0 0 2 Beraeidae48370000 10 10 0 0 0 0 1 Sericostomatidae48380000 10 3 3 4 0 0 3 Odontoceridae48390000 10 0 0 3 0 7 5 Molannidae48410000 10 5 2 1 0 2 1 Leptoceridae49110000 0 5 5 0 0 0 1 Pyralidae
Table 4.1: (continued)

R&D TECHNCIAL REPORT E1-007/TR 49
Functional feeding group probability (x10)1 2 3 4 5
RIVPACSfamilycode
BMWPScore Shredders Scrapers Gatherers Filterers Predators
Dominantgroup Family name
50100000 5 2 0 4 0 4 5 Tipulidae50210000 0 0 5 5 0 0 3 Psychodidae50220000 0 5 0 5 0 0 3 Ptychopteridae50310000 0 0 0 3 7 0 4 Dixidae50320000 0 0 0 0 0 10 5 Chaoboridae50330000 0 0 10 0 0 0 2 Culicidae50340000 0 0 10 0 0 0 2 Thaumaleidae50350000 0 0 0 0 0 10 5 Ceratopogonidae50360000 5 0 0 0 10 0 4 Simuliidae50420000 2 0 0 1 0 9 5 Tanypodinae50440000 2 0 8 1 0 1 2 Diamesinae50450000 2 0 0 8 2 0 3 Prodiamesinae50460000 2 0 5 5 0 0 3 Orthocladiinae50470000 2 0 2 5 2 1 3 Chironomini50490000 2 0 2 4 4 0 3 Tanytarsini50610000 0 3 3 3 1 0 3 Stratiomyidae50620000 0 0 0 0 0 10 5 Rhagionidae50630000 0 0 0 0 0 10 5 Tabanidae50710000 0 0 0 5 0 5 5 Empididae50720000 0 0 0 0 0 10 5 Dolichopodidae50810000 0 0 0 10 0 0 3 Syrphidae50820000 0 0 0 0 0 10 5 Sciomyzidae50830000 0 2 4 2 0 2 2 Ephydridae50850000 0 0 0 0 0 10 5 Muscidae20000000 1 0 1 9 0 0 3 Oligochaeta50400000 2 0 3 5 1 1 3 Chironomidae
4.5 Calculating the Observed and Expected Relative Abundance of FunctionalFeeding Groups
4.5.1 Use of log abundance categories
All previous RIVPACS analyses involving the use of taxon abundances have beenbased on the RIVPACS log abundance categories, (i.e. 0 = absent, 1=1-9 individuals,2=10-99, 3=100-999, 4=1000-9999, 5=10000+) rather than back-transformed estimatesof the raw abundances or, where available, the recorded raw abundances (Clarke et al.1997, Clarke and Wright 2000). This was done for several reasons. In most cases theraw abundances were not readily available and there is considerable subjectivity inestimating the abundances from the RIVPACS integer log categories. More importantly,it was felt that the relative or proportional abundance of all taxa in a sample should notbe dominated by the abundance of any one very common family. This is a frequentapproach in scientific ecological studies. The influence of the most common taxa isdown-weighted by transforming the abundances and working with the square roots orthe logarithms of the raw abundances or abundance densities. In studies of marine faunacommunity composition using multivariate clustering and ordination techniques, thedouble square root (√√x) transformation of all abundance or biomass data isrecommended and often used (Clarke and Green 1988, Clarke, 1993). Clarke andWarwick (1994) from the Plymouth Marine Laboratory comment that this double
R&D TECHNCIAL REPORT E1-007/TR 50
square root transformation gives very similar results to using logarithms and that bothtransformations focus attention on the whole community structure, mixing contributionsfrom both common and rare species. We have continued with this general approach andassessments of the relative abundance of the various functional feeding groups havebeen based on summing the log abundance categories. This prevents a few verynumerous taxa, such as Chironomidae and Oligochaeta, from dominating theassessment.
4.5.2 Methods of calculating observed and expected abundance of each group
The observed total log abundance of a functional feeding group (FFG) at a site wascalculated as follows:
For method Dom: sum the observed log abundance categories of all families for whichthe FFG in question is the dominant group; and
For method Prop: for each family multiply its observed log abundance category by itsprobability of belonging to the FFG and sum the products across all families.
RIVPACS calculates the expected log abundance value for a particular family at a testsite as a weighted average of the observed log abundance categories for that family atall environmentally similar RIVPACS reference sites (with site weightings proportionalto the environmental similarity to the test site). Unlike the observed log abundancecategories, the expected log abundance values are not generally integer numbers. Theexpected total log abundance of a FFG at a site was calculated as follows:
For method Dom: sum the expected log abundance value of all families for which theFFG in question is the dominant group; and
For method Prop: for each family multiply its expected log abundance category by itsprobability of belonging to the FFG and sum the products across all families.
This calculation is most naturally performed using all macroinvertebrate families,because all families contribute to the functioning of the system. However, it is commonto only record the presence and abundance of BMWP scoring families (Table 4.1).There are therefore four possible methods for calculating the relative abundance of eachfunctional feeding group: using the dominant (Dom) or proportional (Prop) assignmentof families to groups and using all or just the BMWP scoring families. Figure 4.1 andTable 4.2 assess the effect of using the four different methods by plotting the values andcalculating the correlations between the estimates of the relative abundance of afunctional feeding group for any two methods for the 614 RIVPACS reference sites.

R&D TECHNCIAL REPORT E1-007/TR 51
Table 4.2: Correlations between the four different methods of calculating thepercentage of the sum of the observed log abundances in eachfunctional feeding group for the 614 RIVPACS Reference sites. Thefour methods are denoted by a combination of F/M defined as: F=Families used (i.e. All families or just BMWP families); M= Methodof assigning families to feeding group (i.e. Proportional or usingDominant group)
Methods correlatedF/M F/M Shredders Scrapers Gatherers Filterers Predators
All/Prop All/Dom 0.83 0.84 0.58 0.88 0.89All/Prop BMWP/Prop 0.97 0.92 0.84 0.97 0.95All/Prop BMWP/Dom 0.80 0.78 0.45 0.90 0.81All/Dom BMWP/Prop 0.80 0.76 0.43 0.92 0.84All/Dom BMWP/Dom 0.99 0.92 0.86 0.98 0.94
BMWP/Prop BMWP/Dom 0.81 0.83 0.54 0.94 0.88
It appears to make very little difference whether all families or just the BMWP scoringfamilies are used as the two sets of estimates are very highly correlated for eachfunctional feeding group, irrespective of the method (Proportional or Dominant) ofassigning families to FFGs. The lowest correlations and hence the greatestdiscrepancies between the four methods occurs for gatherers (Table 4.2). The reasonswere not initially obvious, but appear to be due to the fact that of the large number offamilies which are at least partly classified as gatherers, a high percentage are assignedas 0.4-0.5 gatherers, but are not necessarily treated as being dominated by gatherers(Table 4.3). Table 4.4 gives a real example illustrating the potentially large discrepancybetween using Proportional and Dominant assignment to FFGs. In contrast to gatherers,of the 64 families which were classed as at least partly predators, 50 were classed asbeing dominated by predators. This explains why using the Dom and Prop methods givesimilar relative abundances for the predators FFG and their correlations are all high(Table 4.2, Figure 4.1(e)).
This is not a criticism of the particular choice of assigning families to FFGs, but merelyshows the potential for differences between the Dom and Prop methods. Moreover, theweight of published literature suggests that it is more realistic and robust toproportionally assign each family to the FFGs rather than commit a family to be in justone FFG when it is known that its component species and/or their life stages belong todifferent FFGs.
The remainder of our analyses will therefore be based on using the proportional (Prop)method of assigning families to FFGs as specified in Table 4.1.

R&D TECHNCIAL REPORT E1-007/TR 52
Figure 4.1: Comparison of the four different methods of calculating thepercentage of the sum of the observed log abundances in eachfunctional feeding groups for the 614 RIVPACS Reference sites. Thefour methods are denoted by a combination of F/M defined as: F=Families used (i.e. All families or just BMWP families); M= Methodof assigning families to feeding group (i.e. Proportional or usingDominant group)

R&D TECHNCIAL REPORT E1-007/TR 53
Figure 4.1: (continued)

R&D TECHNCIAL REPORT E1-007/TR 54
Figure 4.1: (continued)
Table 4.3: Comparison of the effects of assigning families to functional feedinggroups as either the single most dominant group or probabilistically.
Functional Feeding Group (FFG)Shredders Scrapers Gatherers Filterers Predators
Number of families for which FFGwas dominant 8 22 29 13 51
Sum of probabilities of belonging toFFG 8.8 23.7 26.6 13.5 50.4
Number of families with non-zeroassignment to FFG 23 50 53 23 64
Percentage of families with non-zeroassignment to FFG with proportionalassignment of 0.4-0.5
30% 30% 38% 13% 6%

R&D TECHNCIAL REPORT E1-007/TR 55
Table 4.4: Comparison of estimated percentage abundance of each functionalfeeding group (FFG) using either Dominant (Dom) or Proportional(Prop) method of assigning families to groups using an autumnsample from a RIVPACS reference site.
Functional Feeding Group Probability (x10)Family 1 2 3 4 5Code Name
LogAbudanceCategory
DominantFFG Shredders Scrapers Gatherers Filterers Predators
4012 Baetidae 1 2 0 5 5 0 04013 Heptageniidae 2 2 0 5 5 0 04112 Nemouridae 1 1 4 3 3 0 04121 Perlodidae 1 5 0 2 0 0 84122 Perlidae 1 5 0 1 0 0 94123 Chloroperlidae 1 5 1 1 2 0 64563 Elmidae 1 2 0 10 0 0 0481Z Rhyacophilidae 1 5 0 4 1 0 55010 Tipulidae 1 5 2 0 4 0 4
Dom 10% 40% 0% 0% 50%Percentage abundance of each FFGestimated using method: Prop 7% 36% 25% 0% 32%
4.6 Abundance of Each Functional Feeding Group for the RIVPACS ReferenceSites in Relation to Site Characteristics
The initial analyses were based on the 614 RIVPACS III reference sites for GreatBritain and were conducted on each of the data-sets for spring, summer and autumn.
4.6.1 Relationships with TWINSPAN group, distance from source andalkalinity
The total log abundances summed over all families showed large and statisticallysignificant (p<0.001) differences between the 35 RIVPACS biological site groups(Figure 4.2). The 35 TWINSPAN groups were subdivided into four major TWINSPANsubgroups to assess differences in FFG patterns between the main types of biologicalcommunity and site type. Total abundances tended to be lowest in small and/or uplandstreams and highest in large and/or lowland rivers (Table 4.5). It was therefore notparticularly surprising that the total log abundances of each FFG also showed the samegeneral pattern, being highest in large lowland sites (Table 4.5). The patterns in terms ofaverage total log abundances were similar in all three seasons. However, summersamples had the highest total log abundance summed over all families and the highesttotal log abundances for each FFG except for shredders. Shredders were marginallymore abundant overall in autumn samples, probably because sampling followed leaf fallin some of the sites (Table 4.5).
The changing importance of the FFGs downstream was examined by grouping thereference sites into a series of distance downstream categories. These categories weredefined using the same approach as that used in previous analyses of environmentalpatterns of the biological condition of the 1995 GQA sites (Clarke et al. 1999; Davy-Bowker et al. 2000). The distance categories were chosen so that roughly 20% of allsites fell into each category but with the most downstream category being subdivided toseparate off the 3% of sites which were furthest from source (Table 4.6). Sites within5km of their source had about 20% fewer individuals in total than sites further

R&D TECHNCIAL REPORT E1-007/TR 56
downstream. Moreover, all the FFGs except shredders had, on average, fewerindividuals in sites near their source (Table 4.6). Shredders were least abundant in thesites over 84 km from their source.In-stream alkalinity is measured or estimated for every RIVPACS site and can used as asurrogate to represent some aspects of differences in upstream catchment geology. Siteswith very low alkalinity (<23 mg l-1 CaCO3) had fewer individuals of each of the fiveFFGs than sites with any other class of alkalinity; this was a clear pattern in each season(Table 4.7).
The above analyses based on summing the log abundances for each FFG suggest thatthe total number of macroinvertebrates is less in headwater streams, highest in lowlandrivers and varies with stream type. The aim of this section is to assess whether and howthe "trophic structure" of the macroinvertebrate community varies with river type. Inother words, does the relative abundance of the FFGs vary with stream type. Therefore,all subsequent analyses were based on the relative abundance of each FFG. Inparticular, the relative abundance of, for example, shredders is defined as the sum of thelog abundance categories attributable to shredders as a percentage of the sum of logabundance categories of all families.
The mean relative abundances of the FFGs (as defined above), averaged over all thetypes of RIVPACS reference site were 10% shredders, 27% scrapers, 30% gatherers,10% filterers and 23% predators; these average percentages were approximately thesame regardless of season (Table 4.8).

R&D TECHNCIAL REPORT E1-007/TR 57
Figure 4.2: Boxplot of the sum of the log abundances of all families for the 614RIVPACS references sites, classified according to their TWINSPANsite group (1-35). Results are given separately for each season.[Boxplot interpretation: box denotes range of middle half of datavalues (25-75 percentile values); middle line denotes median (i.e. 50percentile); outer lines denote range of values except for outlierswhich are marked individually by a *].
1 3 5 7 9 11 13 15 17 19 21 23 25 27 29 31 33 350
50
100Sp
ring
TWINSPAN_GRP
1 3 5 7 9 11 13 15 17 19 21 23 25 27 29 31 33 350
50
100
Sum
mer
TWINSPAN_GRP
1 3 5 7 9 11 13 15 17 19 21 23 25 27 29 31 33 350
50
100
Autu
mn
TWINSPAN_GRP

R&D TECHNCIAL REPORT E1-007/TR 58
Table 4.5: Average sum of the observed log abundances of (a) all families (b)shredders (c) scrapers (d) gatherers (e) filterers and (f) predators forthe 614 RIVPACS reference sites, classified by TWINSPAN sitegroup. Results are given separately for each season and alsoaveraged across seasons. Site groups: 1-9 = “small streams”; 10-17 =“upland streams”; 18-24 = “intermediate streams and rivers”; 25-35= “lowland streams and rivers”.
TWINSPAN site groups1-9 10-17 18-24 25-35 Overall
(a) all familiesSpring 41.8 42.5 59.1 55.4 49.8Summer 42.4 44.3 58.1 60.1 51.5Autumn 40.2 37.9 54.9 56.5 47.6Overall 41.5 41.6 57.4 57.3 49.6
(b) shreddersSpring 4.9 4.0 5.6 5.4 5.0Summer 4.4 3.5 5.4 5.8 4.8Autumn 4.9 3.9 5.7 5.7 5.1Overall 4.7 3.8 5.6 5.6 5.0
(c) scrapersSpring 10.7 12.3 15.7 14.1 13.2Summer 10.7 12.8 15.9 16.0 13.9Autumn 10.1 11.2 15.0 14.5 12.8Overall 10.5 12.1 15.5 14.9 13.3
(d) gatherersSpring 12.7 13.3 18.2 15.7 14.9Summer 13.3 13.9 16.9 16.3 15.1Autumn 12.3 11.6 15.5 14.8 13.5Overall 12.8 12.9 16.9 15.6 14.5
(e) filterersSpring 4.1 3.6 6.0 6.5 5.1Summer 4.9 4.2 6.7 6.9 5.7Autumn 4.2 3.0 6.1 6.8 5.1Overall 4.4 3.6 6.2 6.7 5.3
(f) predatorsSpring 9.3 9.4 13.6 13.7 11.6Summer 9.1 9.8 13.2 15.2 12.0Autumn 8.7 8.2 12.7 14.6 11.2Overall 9.1 9.1 13.1 14.5 11.6
There were highly statistically significant differences between TWINSPAN groups (allp<0.001) in the percentage abundance of each of the five FFGs (Figure 4.3). This showsthat the relative abundance of the FFGs definitely changes with the environmentalcharacteristics of river sites. Classifying the sites into their four major TWINSPANgroups, re-enforced the conclusion that large lowland rivers have a slightly lowerproportion of shredders and a higher proportion of filterers and predators (Table 4.8,Figure 4.4).

R&D TECHNCIAL REPORT E1-007/TR 59
Table 4.6: Average sum of the observed log abundances of (a) all families, (b)shredders, (c) scrapers, (d) gatherers, (e) filterers and (f) predatorsfor the 614 RIVPACS reference sites, classified by their distancefrom source (km). Results are given separately for each season andaveraged across seasons.
Distance from Source (km)<5 5-11.9 12-22.9 23-40.9 41-84 85-203 Overall
n = 108 132 129 121 102 22 614(a) all families
Spring 42.8 50.0 53.3 51.8 51.1 44.4 49.8Summer 43.3 51.3 55.8 51.7 54.6 52.4 51.5Autumn 40.2 46.9 50.0 49.8 50.0 50.7 47.6Overall 42.1 49.4 53.0 51.1 51.9 49.2 49.6
(b) shreddersSpring 5.1 5.4 5.3 4.8 4.5 3.2 5.0Summer 4.6 4.9 5.2 4.6 4.8 4.2 4.8Autumn 5.0 5.1 5.2 5.1 4.9 4.5 5.1Overall 4.9 5.1 5.2 4.8 4.7 4.0 4.9
(c) scrapersSpring 10.7 13.3 14.4 14.0 13.7 11.4 13.2Summer 10.9 13.7 15.2 14.3 15.3 14.2 13.9Autumn 9.9 12.5 13.6 13.7 13.8 13.4 12.8Overall 10.5 13.1 14.4 14.0 14.3 13.0 13.3
(d) gatherersSpring 12.7 14.9 16.1 15.9 15.1 13.7 15.0Summer 13.2 15.2 16.3 15.0 15.8 14.8 15.1Autumn 11.8 13.6 14.3 13.9 13.7 13.8 13.5Overall 12.6 14.6 15.6 14.9 14.9 14.1 14.5
(e) filterersSpring 4.3 5.1 5.3 5.2 5.4 6.0 5.1Summer 5.0 5.6 6.1 5.7 5.8 7.2 5.7Autumn 4.5 4.9 5.3 5.2 5.3 6.6 5.1Overall 4.6 5.2 5.5 5.4 5.5 6.6 5.3
(f) predatorsSpring 10.0 11.3 12.3 12.0 12.4 10.2 11.6Summer 9.6 11.8 13.1 12.0 13.0 12.0 11.9Autumn 9.0 10.8 11.5 11.8 12.3 12.4 11.2Overall 9.5 11.3 12.3 11.9 12.6 11.5 11.6
The basic patterns to emerge in relation to distance downstream, based on the meanrelative abundance of the five different categories were as anticipated from the RiverContinuum Concept (Table 4.9, Figure 4.5). In each season, shredders had their highestrelative abundance in headwater streams (i.e. <5 km from their source) and formed thelowest percentage of the total abundance in the sites furthest from source (i.e. >84 km).The relative abundance of scrapers, although not varying much with distancedownstream, did peak at intermediate distances, as predicted by the RCC. Filterers wererelatively most abundant in the sites furthest from source, which would tend to be largelowland rivers (Table 4.9). The relative abundance of gatherers showed no consistenttrend with distance from source. Predators formed a slightly lower percentage of totallog abundance in headwaters streams (Figure 4.5).

R&D TECHNCIAL REPORT E1-007/TR 60
Table 4.7: Average sum of the observed log abundances of (a) all families (b)shredders (c) scrapers (d) gatherers (e) filterers and (f) predators forthe 614 RIVPACS reference sites, classified by their alkalinity (mg l-
1 CaCO3). Results are given separately for each season and alsoaveraged across seasons.
Alkalinity (mg l-1 CaCO3)<23 23-62 63-127 128-206 206-365 Overall
n = 120 125 122 122 124 614(a) all families
Spring 42.5 48.2 50.3 53.6 54.2 49.8Summer 42.7 49.9 51.8 55.5 57.4 51.5Autumn 38.0 46.1 46.5 54.5 52.7 47.6Overall 41.0 48.1 49.5 54.5 54.8 49.6
(b) shreddersSpring 4.3 4.6 4.9 5.5 5.5 5.0Summer 3.6 4.5 4.7 5.5 5.7 4.8Autumn 4.1 5.0 4.8 5.7 5.6 5.1Overall 4.0 4.7 4.8 5.6 5.6 4.9
(c) scrapersSpring 11.4 13.0 13.4 14.3 13.9 13.2Summer 11.7 13.7 14.2 15.0 14.9 13.9Autumn 10.6 12.7 12.6 14.3 13.5 12.8Overall 11.2 13.2 13.4 14.5 14.1 13.3
(d) gatherersSpring 13.1 14.9 15.7 15.6 15.5 15.0Summer 13.2 15.0 15.7 15.8 15.8 15.1Autumn 11.6 13.4 13.8 15.1 13.9 13.5Overall 12.6 14.4 15.1 15.5 15.1 14.5
(e) filterersSpring 3.8 4.4 5.1 5.8 6.2 5.1Summer 4.5 5.1 5.7 6.5 6.7 5.7Autumn 3.4 4.4 4.8 6.6 6.3 5.1Overall 3.9 4.6 5.2 6.3 6.4 5.3
(f) predatorsSpring 9.8 11.2 11.3 12.3 13.1 11.6Summer 9.6 11.6 11.5 12.6 14.3 11.9Autumn 8.4 10.6 10.5 12.9 13.4 11.2Overall 9.3 11.1 11.1 12.6 13.6 11.6
Although the relative abundance of the FFGs did not show major differences in relationto site alkalinity, scrapers were slightly less relatively abundant at high alkalinity siteswhilst filterers and predators were slightly more abundant (Table 4.10, Figure 4.6).
In summary, the above analyses have shown that although there is considerablevariation between the reference sites in the absolute and relative abundance of thevarious functional feeding groups, there are definite trends in abundance of the FFGs inrelation to site type, distance from source and in-stream alkalinity. Amongst highquality sites, large lowland river sites a long way from source have relatively morefilterers and predators and less shredders than small upland headwater streams (Table4.6).

R&D TECHNCIAL REPORT E1-007/TR 61
Figure 4.3: Boxplot of the relative abundances of each functional feeding groupfor the 614 RIVPACS reference sites, classified by TWINSPAN sitegroup (1-35). See Figure 4.2 for explanation of boxplot. Vertical linesdifferentiate the four major site groups: 1-9 = “small streams”; 10-17 = “upland streams”; 18-24 = “intermediate streams and rivers”;25-35 = “lowland streams and rivers”.
1 3 5 7 9 11 13 15 17 19 21 23 25 27 29 31 33 350
10
20
30
shre
dder
s
1 3 5 7 9 11 13 15 17 19 21 23 25 27 29 31 33 350
10
20
30
40
50
scra
pers
1 3 5 7 9 11 13 15 17 19 21 23 25 27 29 31 33 350
10
20
30
40
50
60
gath
erer
s
1 3 5 7 9 11 13 15 17 19 21 23 25 27 29 31 33 350
10
20
30
filte
rers
1 3 5 7 9 11 13 15 17 19 21 23 25 27 29 31 33 350
10
20
30
40
pred
ator
s
TWINSPAN group

R&D TECHNCIAL REPORT E1-007/TR 62
Table 4.8: Average percentage of sum of the observed log abundances whichare (a) shredders, (b) scrapers, (c) gatherers, (d) filterers and (e)predators for the 614 RIVPACS sites, classified by TWINSPAN sitegroup; Results are given separately for each season and alsoaveraged across seasons. Site groups: 1-9 = “small streams”; 10-17 =“upland streams”; 18-24 = “intermediate streams and rivers”; 25-35= “lowland streams and rivers”.
TWINSPAN site groups1-9 10-17 18-24 25-35 Overall
(a) shreddersSpring 11.7 9.1 9.2 9.8 9.9Summer 10.5 7.6 9.2 9.6 9.2Autumn 12.3 10.0 10.3 10.2 10.7
(b) scrapersSpring 25.9 29.3 26.8 25.3 26.8Summer 25.4 29.4 27.7 26.5 27.2Autumn 25.4 29.8 27.5 25.6 27.0
(c) gatherersSpring 30.8 31.4 31.2 28.7 30.4Summer 31.9 31.6 29.2 27.3 29.9Autumn 31.0 31.4 28.4 26.3 29.2
(d) filterersSpring 9.4 8.3 10.1 11.8 10.0Summer 11.4 9.5 11.6 11.6 11.0Autumn 10.1 7.6 11.0 12.1 10.3
(e) predatorsSpring 22.3 21.9 22.6 24.4 22.9Summer 20.9 21.9 22.2 25.0 22.6Autumn 21.1 21.2 22.9 25.7 22.9
Figure 4.4: Average percentage of the sum of the observed log abundances ineach of five functional feeding groups for the 614 RIVPACS sitesclassified by major TWINSPAN site group.
���������������������������������������������������������������������������������������������������
������������������������������������������������������������������������������������������������
������������������������������������������������������������������������������������������������
���������������������������������������������������������������������������������������������������
0%
20%
40%
60%
80%
100%
predators 21.4 21.7 22.6 25.1
filterers 10.3 8.4 10.9 11.8������ gatherers 31.2 31.5 29.6 27.5
scrapers 25.5 29.5 27.3 25.8
shredders 11.5 8.9 9.6 9.9
Groups 1-9 10-17 18-24 25-35

R&D TECHNCIAL REPORT E1-007/TR 63
Table 4.9: Average percentage of sum of the observed log abundances whichare (a) shredders, (b) scrapers, (c) gatherers, (d) filterers and (e)predators for the 614 RIVPACS sites, classified by their distancefrom source (km). Results are given separately for each season andalso averaged across seasons.
Distance from Source (km)<5 5-11.9 12-22.9 23-40.9 41-84 85-203 Overall
n = 108 132 129 121 102 22 614(a) shredders
Spring 12.0 10.7 9.8 9.1 8.6 7.1 9.9Summer 10.8 9.5 8.9 8.7 8.5 7.7 9.2Autumn 12.8 10.7 10.6 10.3 9.5 8.6 10.7
(b) scrapersSpring 25.3 27.1 27.2 27.1 27.2 25.9 26.8Summer 25.2 27.2 27.6 27.8 28.4 27.1 27.2Autumn 24.7 27.0 27.7 27.7 27.9 26.6 27.0
(c) gatherersSpring 29.9 30.3 30.6 31.1 30.2 31.7 30.5Summer 31.0 30.1 29.7 29.6 29.3 28.8 29.9Autumn 29.6 29.9 29.2 28.8 28.5 27.7 29.2
(d) filterersSpring 9.7 9.7 9.6 9.9 10.5 13.2 10.0Summer 11.6 10.8 10.8 11.0 10.5 13.7 11.0Autumn 11.0 9.7 9.9 10.1 10.2 12.7 10.3
(e) predatorsSpring 23.2 22.3 22.9 22.8 23.6 22.1 22.9Summer 21.4 22.5 23.0 22.8 23.3 22.8 22.6Autumn 21.9 22.6 22.6 23.1 23.9 24.3 22.9
Figure 4.5: Average percentage of the sum of the observed log abundances ineach of five functional feeding groups for the 614 RIVPACS sitesclassified by distance from source (km).
��������������������������������������������������������������������������������
���������������������������������������������������������������
���������������������������������������������������������������
��������������������������������������������������������������������������������
��������������������������������������������������������������������������������
������������������������������������������������������������������������������������
0%
20%
40%
60%
80%
100%
predators 22.2 22.5 22.8 22.9 23.6 23.1
filterers 10.8 10.1 10.1 10.3 10.4 13.2����
gatherers 30.2 30.1 29.8 29.8 29.3 29.4
scrapers 25.1 27.1 27.5 27.6 27.8 26.5
shredders 11.8 10.3 9.7 9.4 8.9 7.8
<5 km 5-11.9 12-22.9 23-40.9 41-84 85-203

R&D TECHNCIAL REPORT E1-007/TR 64
Table 4.10: Average percentage of sum of the observed log abundances whichare (a) shredders, (b) scrapers, (c) gatherers, (d) filterers and (e)predators for the 614 RIVPACS sites, classified by alkalinity (mg l-1
CaCO3). Results are given separately for each season and alsoaveraged across seasons.
Alkalinity (mg l-1 CaCO3)<23 23-62 63-127 128-206 206-365 Overall
n = 120 125 122 122 124 614(a) shredders
Spring 10.0 9.3 9.7 10.4 10.2 9.9Summer 8.0 8.7 9.0 10.2 10.0 9.2Autumn 10.9 10.6 10.3 10.7 10.9 10.7
(b) scrapersSpring 27.2 27.7 26.9 26.7 25.4 26.8Summer 28.1 27.9 27.6 27.0 25.6 27.2Autumn 27.9 28.2 27.4 26.1 25.4 27.0
(c) gatherersSpring 31.4 31.4 31.4 29.3 28.9 30.5Summer 31.6 30.6 30.6 28.8 27.9 29.9Autumn 31.5 29.7 30.2 28.0 26.5 29.2
(d) filterersSpring 8.7 8.9 9.9 10.9 11.4 10.0Summer 10.3 10.1 11.0 11.9 11.8 11.0Autumn 8.1 9.0 10.1 12.1 12.0 10.3
(e) predatorsSpring 22.7 22.8 22.1 22.7 24.0 22.9Summer 22.0 22.6 21.8 22.0 24.5 22.6Autumn 21.6 22.5 21.9 23.1 25.2 22.9
Figure 4.6: Average percentage of the sum of the observed log abundances ineach of five functional feeding groups for the 614 RIVPACS sitesclassified by alkalinity (mg l-1 CaCO3).
������������������������������������������������������������������������������������������������
������������������������������������������������������������������������������������������������
����������������������������������������������������������������������������������������������������
������������������������������������������������������������������������������������������������
���������������������������������������������������������������������������
0%
20%
40%
60%
80%
100%
predators 22.1 22.6 22.0 22.6 24.6
filterers 9.0 9.3 10.3 11.7 11.7��������gatherers 31.5 30.5 30.7 28.7 27.8
scrapers 27.7 28.0 27.3 26.6 25.5
shredders 9.6 9.6 9.7 10.4 10.4
<23 mg/l 23-62 63-127 128-206 206-365

R&D TECHNCIAL REPORT E1-007/TR 65
4.6.2 Effectiveness of RIVPACS predictions of expected relative abundances ofeach Functional Feeding Group
The differences between TWINSPAN site groups 1-35 in the observed relativeabundance of each FFG were statistically highly significant. However, the averagepercentage of total variance in the relative abundance of each FFG amongst the 614sites explained by site group type for any single season samples was only 31%(shredders), 27% (scrapers), 16% (gatherers), 29% (filterers) and 18% (predators). Thiscompares with equivalent figures of 45% and 68% for number of BMWP taxa andASPT respectively. Thus the relative abundance of the five FFGs varies in a lessconsistent manner with the environmental characteristics of sites than do the BMWPindices, especially ASPT. This means that RIVPACS is less effective at predicting theexpected relative abundance of FFGs than the expected values of BMWP indices.
Because the relative abundances of the FFGs do not vary greatly between theTWINSPAN site groups, the expected values predicted by RIVPACS, which areweighted averages of the site group means, do not vary much across all types of site(Table 4.11). The consequence of the expected (E) values having a low coefficient ofvariation (CV = standard deviation divided by mean) is that the observed to expectedratios (O/E) of the relative abundance of the FFGs will be very highly correlated withthe observed (O) relative abundances and hence the pattern of values for the O and O/Evalues across a wide range of sites will be similar and they will lead to similarconclusions. This is discussed further in the next section which assesses the way inwhich the relative abundance of the FFGs varies with the site quality.
Table 4.11: Range of expected values predicted by RIVPACS for the percentageabundance of each functional feeding group based on the 614RIVPACS reference sites for all three single season expected values.
Mean %CV Min Max Rangeshredders 9.9 18% 6.1 17.3 11.2scrapers 26.8 8% 18.9 32.9 14.0gatherers 29.5 7% 24.9 34.2 9.3filterers 10.5 17% 6.1 15.8 9.7
predators 23.3 10% 16.7 31.8 15.1
4.7 Functional Feeding Groups and Site Quality
In the previous section, patterns in the relative abundance of the five functional feedinggroups (FFGs) were examined across the full range of high quality RIVPACS referencesites. This provided the basis from which to assess the “natural” variation in FFGswithout the confounding effects caused by environmental stress and pollution in poorerquality sites. The current section assesses whether there are discernible trends in therelative abundance of FFGs in relation to the quality of sites. Where necessary, theobserved trends will be assessed in relation to the “natural” patterns expected from thesites’ characteristics through the use of RIVPACS observed to expected (O/E) ratios ofthe abundances of the various FFGs.
4.7.1 Assessments based on the BAMS sites

R&D TECHNCIAL REPORT E1-007/TR 66
Initially, assessments were carried out using the sites available in the BiologicalAssessment Methods Study (BAMS) of Furse et al. (1995). The BAMS sites wereselected from the NRA’s 1990 River Quality Survey (RQS) using a stratified randomscheme to cover a wide range of types and quality of site. Four sites were selected fromeach of the four major types (from the then latest RIVPACS, version II) and within eachtype one site was selected from each of the four 1990 River Quality Survey (RQS)bands A, B, C and D (Table 4.12). In each of the three RIVPACS seasons at each of the16 BAMS sites, three replicate samples were taken, two by an IFE biologist (person A)and one by a local NRA biologist (person B). This provided a total of 144 samplesalthough they are not independent. However, having replicate samples from the samesite in any one season enabled an assessment to be made of the variability in the relativeabundance of the FFGs due to sampling variation. This was important because ifsampling variability is very high, it is difficult to detect differences and trends betweensites and types of site.
For each of the 144 samples, we calculated the observed (O), expected (E) and ratioO/E of relative abundance of each FFG together with the standard RIVPACS O/Eratios for number of BMWP taxa and for ASPT, referred to as Ecological QualityIndices (EQI) in the Environment Agency’s national General Quality Assessment(GQA) surveys, and denoted here as EQITAXA and EQIASPT. The EQI values for asample are used here to represent the estimated biological quality or condition of asample or site.
Figure 4.7 plots the observed sum of log abundances of each FFG in a BAMS sample inrelation to the value of EQITAXA and EQIASPT for the sample. The observed abundancesof each FFG all tend to decline with site quality with correlations in the range 0.62-0.87(Table 4.13). Figure x.8 plots the observed to expected ratio (O/E) of the sum of logabundances of each FFG in a BAMS sample in relation to the value of EQITAXA andEQIASPT for the sample. Figures 4.7 and 4.8 show very similar patterns. Because therange of expected values for the sum of log abundances of a FFG is relatively small, thecorrelation of observed sum of log abundances and O/E of sum of log abundances withthe EQIs are very similar and standardising by RIVPACS expected values does notimprove relationships between the observed abundances of each FFG and site quality.The general decrease in the abundance of all FFGs with declining site quality is asimilar result to that of Clarke et al. (1999), who found that a trial index, Q19, equal tothe observed to expected ratio of the sum of abundances of all families, also declinedlinearly with site quality with correlations of 0.94 and 0.82 with EQITAXA and EQIASPTrespectively for the BAMS sites.

R&D TECHNCIAL REPORT E1-007/TR 67
Table 4.12: Characteristics of the stratified random selection of the 16 BAMSstudy sites in terms of (a) their quality bands as defined by range ofO/E BMWP quality index values; (b) RIVPACS II environmentalgroup type and (c) the full list of the 16 sites selected for replicatesampling.
(a) quality band:Range of O/E values based on:
band A“best” condition
B C D“worst”
conditionBMWP score 0.91 - 1.09 0.52 - 0.62 0.29 - 0.39 < 0.18Number of BMWP taxa 0.94 - 1.06 0.64 - 0.72 0.41 - 0.53 < 0.30ASPT 0.97 - 1.03 0.80 - 0.85 0.68 - 0.74 < 0.60(b) RIVPACS Site type groupmean value ofenvironmental variable
group 3a 5b 8a 9b
distance from source (km) 15.3 8.2 11.3 33.0width (m) 7.5 4.8 4.8 13.1depth (cm) 19.8 21.7 32.5 77.5altitude (m) 74 40 40 5alkalinity (mg l-1 CaCO3) 81 153 229 170predominant substratum cobbles/pebbles gravel gravel/sand siltRegions of England and Wales SW, NE, Wales central south
+ midlandseast Wales toEast Anglia +southern chalk
streams
SE + EastAnglia
(c)Site group
Qualityband
River name Site name Nationalgrid ref.
NRA Region
3a A River Okement South Dornaford SS 600 000 South Western 3a B River Darracott Tantons Plain SS 494 198 South Western 3a C River Croxdale Croxdale House NZ 272 379 Northumbria&
Yorkshire 3a D Twyzell Burn B6313 Bridge NZ 257 517 Northumbria &
Yorkshire 5b A Petworth Brook Haslingbourne
BridgeSU 982 204 Southern
5b B Sheppey River Woodford ST 537 441 South Western 5b C Sheppey River Bowlish ST 613 440 South Western 5b D Moss Brook PTC Bedford Brook SJ 676 983 North West 8a A Summerham Brook Seend Bridge ST 945 595 South Western 8a B Cuttle Brook Swarkestone SK 375 288 Severn Trent 8a C Poulshot Stream Jenny Mill ST 979 592 South Western 8a D Spen Beck Dewsbury SE 225 208 Northumbria &
Yorkshire 9b A Old River Ancholme Brigg TA 001 065 Anglian 9b B Broad Rife Ferry Sluice SZ 854 963 Southern 9b C Skellingthorpe Drain U/S Skellingthorpe SK 937 727 Anglian 9b D Keyingham Drain Cherry Cob TA 219 224 Northumbria &
Yorkshire

R&D TECHNCIAL REPORT E1-007/TR 68
0.0 0.2 0.4 0.6 0.8 1.0 1.20
5
10
15
shre
dder
s
0.4 0.6 0.8 1.00
5
10
15
0.0 0.2 0.4 0.6 0.8 1.0 1.20
5
10
15
scra
pers
0.4 0.6 0.8 1.00
5
10
15
0.0 0.2 0.4 0.6 0.8 1.0 1.20
5
10
15
gath
erer
s
0.4 0.6 0.8 1.00
5
10
15
0.0 0.2 0.4 0.6 0.8 1.0 1.20
5
10
15
filte
rers
0.4 0.6 0.8 1.00
5
10
15
0.0 0.2 0.4 0.6 0.8 1.0 1.20
5
10
15
pred
ator
s
0.4 0.6 0.8 1.00
5
10
15
O/E for TAXA O/E for ASPT
Figure 4.7: Sum of log abundances of each functional feeding group for allreplicate samples from the BAMS sites plotted against sample O/Efor number of taxa (LHS) and O/E for ASPT (RHS). n = 16 sites x 3seasons x 3 samples = 144.

R&D TECHNCIAL REPORT E1-007/TR 69
Figure 4.8: Ratio O/E of observed to expected sum of log abundances of eachfunctional feeding group for all replicate samples from the BAMSsites plotted against sample O/E for number of taxa (LHS) and O/Efor ASPT (RHS).
0.0 0.2 0.4 0.6 0.8 1.0 1.20.0
0.5
1.0
1.5
shre
dder
s
0.4 0.6 0.8 1.00.0
0.5
1.0
1.5
0.0 0.2 0.4 0.6 0.8 1.0 1.20.0
0.5
1.0
1.5
scra
pers
0.4 0.6 0.8 1.00.0
0.5
1.0
1.5
0.0 0.2 0.4 0.6 0.8 1.0 1.20.0
0.5
1.0
1.5
gath
erer
s
0.4 0.6 0.8 1.00.0
0.5
1.0
1.5
0.0 0.2 0.4 0.6 0.8 1.0 1.20.0
0.5
1.0
1.5
filte
rers
0.4 0.6 0.8 1.00.0
0.5
1.0
1.5
0.0 0.2 0.4 0.6 0.8 1.0 1.20.0
0.5
1.0
1.5
pred
ator
s
0.4 0.6 0.8 1.00.0
0.5
1.0
1.5
O/E for TAXA O/E for ASPT
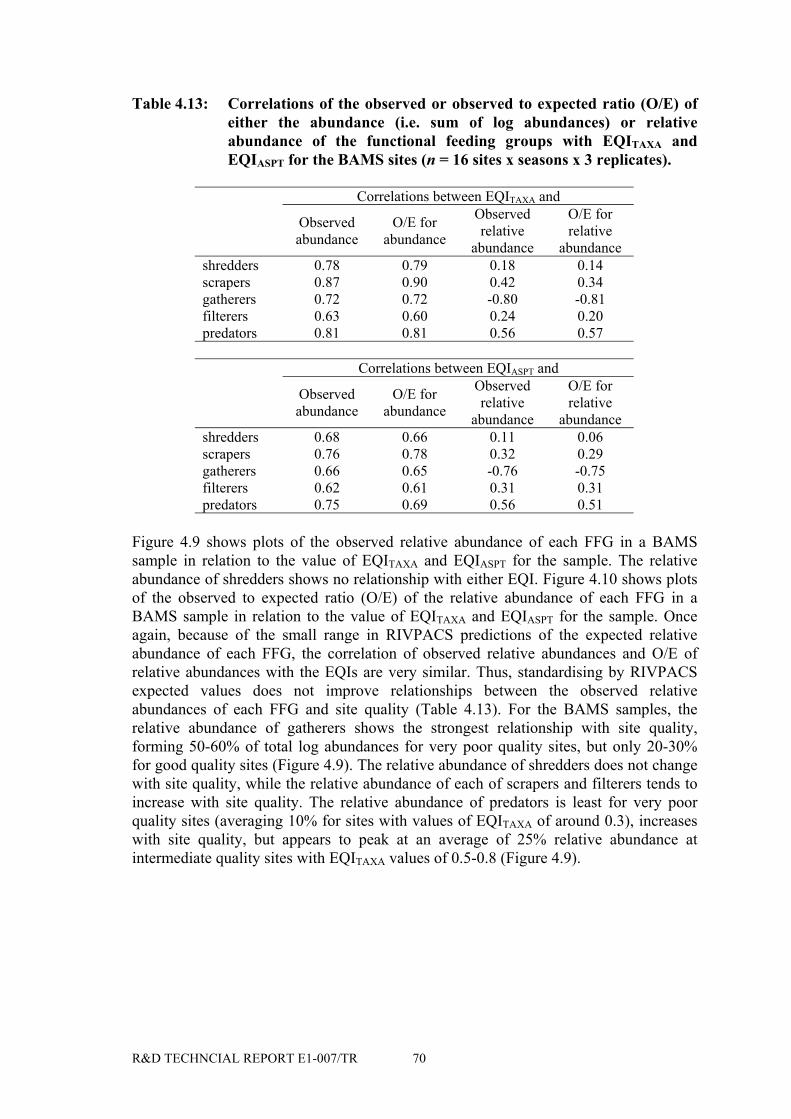
R&D TECHNCIAL REPORT E1-007/TR 70
Table 4.13: Correlations of the observed or observed to expected ratio (O/E) ofeither the abundance (i.e. sum of log abundances) or relativeabundance of the functional feeding groups with EQITAXA andEQIASPT for the BAMS sites (n = 16 sites x seasons x 3 replicates).
Correlations between EQITAXA and
Observedabundance
O/E forabundance
Observedrelative
abundance
O/E forrelative
abundanceshredders 0.78 0.79 0.18 0.14scrapers 0.87 0.90 0.42 0.34gatherers 0.72 0.72 -0.80 -0.81filterers 0.63 0.60 0.24 0.20predators 0.81 0.81 0.56 0.57
Correlations between EQIASPT and
Observedabundance
O/E forabundance
Observedrelative
abundance
O/E forrelative
abundanceshredders 0.68 0.66 0.11 0.06scrapers 0.76 0.78 0.32 0.29gatherers 0.66 0.65 -0.76 -0.75filterers 0.62 0.61 0.31 0.31predators 0.75 0.69 0.56 0.51
Figure 4.9 shows plots of the observed relative abundance of each FFG in a BAMSsample in relation to the value of EQITAXA and EQIASPT for the sample. The relativeabundance of shredders shows no relationship with either EQI. Figure 4.10 shows plotsof the observed to expected ratio (O/E) of the relative abundance of each FFG in aBAMS sample in relation to the value of EQITAXA and EQIASPT for the sample. Onceagain, because of the small range in RIVPACS predictions of the expected relativeabundance of each FFG, the correlation of observed relative abundances and O/E ofrelative abundances with the EQIs are very similar. Thus, standardising by RIVPACSexpected values does not improve relationships between the observed relativeabundances of each FFG and site quality (Table 4.13). For the BAMS samples, therelative abundance of gatherers shows the strongest relationship with site quality,forming 50-60% of total log abundances for very poor quality sites, but only 20-30%for good quality sites (Figure 4.9). The relative abundance of shredders does not changewith site quality, while the relative abundance of each of scrapers and filterers tends toincrease with site quality. The relative abundance of predators is least for very poorquality sites (averaging 10% for sites with values of EQITAXA of around 0.3), increaseswith site quality, but appears to peak at an average of 25% relative abundance atintermediate quality sites with EQITAXA values of 0.5-0.8 (Figure 4.9).
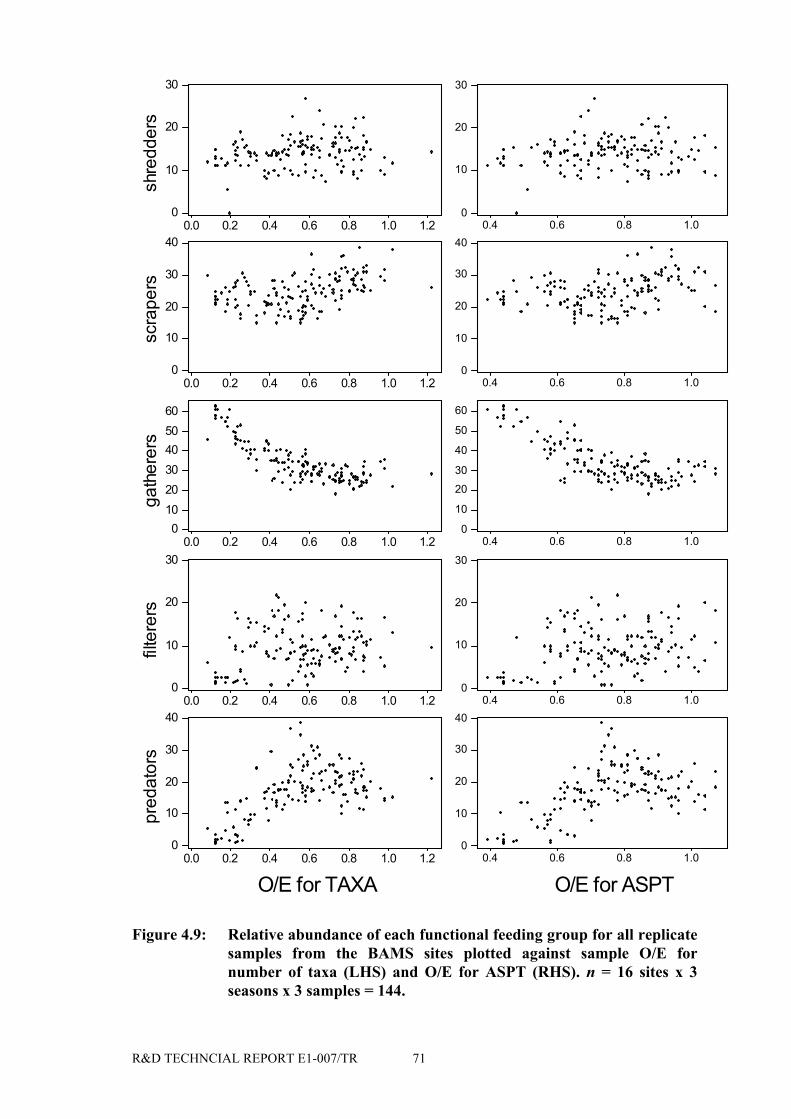
R&D TECHNCIAL REPORT E1-007/TR 71
Figure 4.9: Relative abundance of each functional feeding group for all replicatesamples from the BAMS sites plotted against sample O/E fornumber of taxa (LHS) and O/E for ASPT (RHS). n = 16 sites x 3seasons x 3 samples = 144.
0.0 0.2 0.4 0.6 0.8 1.0 1.20
10
20
30
shre
dder
s
0.4 0.6 0.8 1.00
10
20
30
0.0 0.2 0.4 0.6 0.8 1.0 1.20
10
20
30
40
scra
pers
0.4 0.6 0.8 1.00
10
20
30
40
0.0 0.2 0.4 0.6 0.8 1.0 1.20
102030405060
gath
erer
s
0.4 0.6 0.8 1.00
10
2030
40
50
60
0.0 0.2 0.4 0.6 0.8 1.0 1.20
10
20
30
filte
rers
0.4 0.6 0.8 1.00
10
20
30
0.0 0.2 0.4 0.6 0.8 1.0 1.20
10
20
30
40
pred
ator
s
0.4 0.6 0.8 1.00
10
20
30
40
O/E for TAXA O/E for ASPT

R&D TECHNCIAL REPORT E1-007/TR 72
Figure 4.10: Ratio O/E of observed to expected relative abundance of eachfunctional feeding group for all replicate samples from the BAMSsites plotted against sample O/E for number of taxa (LHS) and O/Efor ASPT (RHS).
0.0 0.2 0.4 0.6 0.8 1.0 1.20.0
0.5
1.0
1.5
2.0
2.5
shre
dder
s
0.4 0.6 0.8 1.00.0
0.5
1.0
1.5
2.0
2.5
0.0 0.2 0.4 0.6 0.8 1.0 1.20.0
0.5
1.0
1.5
2.0
2.5
scra
pers
0.4 0.6 0.8 1.00.0
0.5
1.0
1.5
2.0
2.5
0.0 0.2 0.4 0.6 0.8 1.0 1.20.0
0.5
1.0
1.5
2.0
2.5
gath
erer
s
0.4 0.6 0.8 1.00.0
0.5
1.0
1.5
2.0
2.5
0.0 0.2 0.4 0.6 0.8 1.0 1.20.0
0.5
1.0
1.5
2.0
2.5
3.0
filte
rers
0.4 0.6 0.8 1.00.0
0.5
1.0
1.5
2.0
2.5
3.0
0.0 0.2 0.4 0.6 0.8 1.0 1.20.0
0.5
1.0
1.5
2.0
2.5
pred
ator
s
0.4 0.6 0.8 1.00.0
0.5
1.0
1.5
2.0
2.5
O/E for TAXA O/E for ASPT

R&D TECHNCIAL REPORT E1-007/TR 73
4.7.2 Assessments based on the 1995 GQA sites
The analyses based on the BAMS samples involved only 16 sites, albeit with threereplicate samples in each of three seasons, giving a total of 144 samples. Thus theestimated correlations and relationships between the relative abundance of each FFGand site quality must be rather tentative as the plots in Figures 4.9 and 4.10 contain, in asense “pseudo-replication”.
Therefore, it was considered important to check these relationships using a much largerdataset of GQA sites from the 1995 GQA survey. Specifically, these were the 6106validated GQA sites available to CEH for which both spring and autumn samples wereavailable, as used by Clarke and Wright (2000) and Davy-Bowker et al. (2000) in theiranalyses of the GQA survey data. To do this, it was necessary to run these GQA sitesthrough RIVPACS III+ to obtain spring and autumn single season values for EQITAXAand EQIASPT. (All previous analyses of these sites had been for the best available seasoncombination, namely the spring and autumn combined season samples). In separateanalyses of the abundance data for these GQA sites, we then calculated the observedtotal abundance, observed relative abundance and their O/E ratio equivalents for eachfunctional feeding group.
As with the BAMS samples, the observed total abundance (and its O/E ratio) for each ofthe FFGs declines with site quality (Table 4.14, Figures 4.11 and 4.12). Therefore, weneed to assess whether and how the relative abundance of the FFGs changes with sitequality, as this will provide more independent information on the effects of reduction inthe quality of river sites.
Table 4.14: Correlations of the observed or observed to expected ratio (O/E) ofeither the abundance (i.e. sum of log abundances) or relativeabundance of the functional feeding groups with EQITAXA andEQIASPT for 6016 GQA sites sampled in autumn 1995.
Correlations between EQITAXA and
Observedabundance
O/E forabundance
Observedrelative
abundance
O/E forrelative
abundanceshredders 0.78 0.78 0.05 0.05scrapers 0.83 0.83 024 024gatherers 0.74 0.74 -0.48 -0.48filterers 0.65 0.65 0.09 0.09predators 0.80 0.80 0.14 0.14
Correlations between EQIASPT and
Observedabundance
O/E forabundance
Observedrelative
abundance
O/E forrelative
abundanceshredders 0.62 0.62 0.14 0.14scrapers 0.64 0.64 0.24 0.24gatherers 0.56 0.65 -0.40 -0.40filterers 0.48 0.48 0.08 0.08predators 0.53 0.53 0.03 0.03

R&D TECHNCIAL REPORT E1-007/TR 74
Figure 4.11: Sum of log abundances of each functional feeding group plottedagainst sample O/E for number of taxa (LHS) and O/E for ASPT(RHS) for 6016 GQA sites sampled in autumn 1995.

R&D TECHNCIAL REPORT E1-007/TR 75
Figure 4.12: Ratio O/E of observed to expected sum of log abundances of eachfunctional feeding group plotted against sample O/E for number oftaxa (LHS) and O/E for ASPT (RHS) for 6016 GQA sites sampled inautumn 1995.
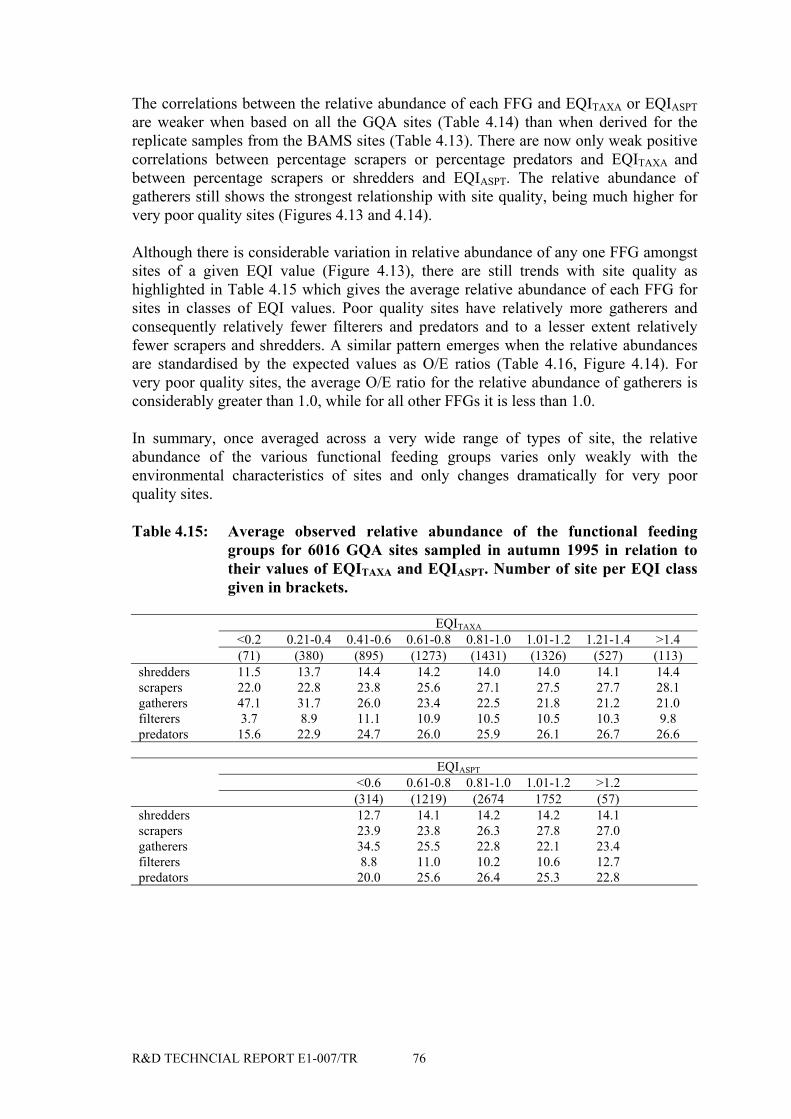
R&D TECHNCIAL REPORT E1-007/TR 76
The correlations between the relative abundance of each FFG and EQITAXA or EQIASPTare weaker when based on all the GQA sites (Table 4.14) than when derived for thereplicate samples from the BAMS sites (Table 4.13). There are now only weak positivecorrelations between percentage scrapers or percentage predators and EQITAXA andbetween percentage scrapers or shredders and EQIASPT. The relative abundance ofgatherers still shows the strongest relationship with site quality, being much higher forvery poor quality sites (Figures 4.13 and 4.14).
Although there is considerable variation in relative abundance of any one FFG amongstsites of a given EQI value (Figure 4.13), there are still trends with site quality ashighlighted in Table 4.15 which gives the average relative abundance of each FFG forsites in classes of EQI values. Poor quality sites have relatively more gatherers andconsequently relatively fewer filterers and predators and to a lesser extent relativelyfewer scrapers and shredders. A similar pattern emerges when the relative abundancesare standardised by the expected values as O/E ratios (Table 4.16, Figure 4.14). Forvery poor quality sites, the average O/E ratio for the relative abundance of gatherers isconsiderably greater than 1.0, while for all other FFGs it is less than 1.0.
In summary, once averaged across a very wide range of types of site, the relativeabundance of the various functional feeding groups varies only weakly with theenvironmental characteristics of sites and only changes dramatically for very poorquality sites.
Table 4.15: Average observed relative abundance of the functional feedinggroups for 6016 GQA sites sampled in autumn 1995 in relation totheir values of EQITAXA and EQIASPT. Number of site per EQI classgiven in brackets.
EQITAXA
<0.2 0.21-0.4 0.41-0.6 0.61-0.8 0.81-1.0 1.01-1.2 1.21-1.4 >1.4(71) (380) (895) (1273) (1431) (1326) (527) (113)
shredders 11.5 13.7 14.4 14.2 14.0 14.0 14.1 14.4scrapers 22.0 22.8 23.8 25.6 27.1 27.5 27.7 28.1gatherers 47.1 31.7 26.0 23.4 22.5 21.8 21.2 21.0filterers 3.7 8.9 11.1 10.9 10.5 10.5 10.3 9.8predators 15.6 22.9 24.7 26.0 25.9 26.1 26.7 26.6
EQIASPT
<0.6 0.61-0.8 0.81-1.0 1.01-1.2 >1.2(314) (1219) (2674 1752 (57)
shredders 12.7 14.1 14.2 14.2 14.1scrapers 23.9 23.8 26.3 27.8 27.0gatherers 34.5 25.5 22.8 22.1 23.4filterers 8.8 11.0 10.2 10.6 12.7predators 20.0 25.6 26.4 25.3 22.8

R&D TECHNCIAL REPORT E1-007/TR 77
Table 4.16: Average observed to expected ratio (O/E) of the relative abundanceof the functional feeding groups for 6016 GQA sites sampled inautumn 1995 in relation to their values of EQITAXA and EQIASPT.Number of site per EQI class given in brackets.
EQITAXA
<0.2 0.21-0.4 0.41-0.6 0.61-0.8 0.81-1.0 1.01-1.2 1.21-1.4 >1.4(71) (380) (895) (1273) (1431) (1326) (527) (113)
shredders 0.95 1.08 1.15 1.14 1.14 1.15 1.16 1.19scrapers 0.84 0.86 0.90 0.96 1.00 1.00 1.01 1.01gatherers 2.09 1.39 1.13 1.02 0.98 0.95 0.92 0.90filterers 0.30 0.72 0.93 0.93 0.92 0.92 0.90 0.93predators 0.62 0.90 0.96 1.00 0.99 1.01 1.04 1.05
EQIASPT
<0.6 0.61-0.8 0.81-1.0 1.01-1.2 >1.2(314) (1219) (2674 1752 (57)
shredders 0.99 1.10 1.16 1.17 1.25scrapers 0.90 0.90 0.97 1.02 1.02gatherers 1.50 1.11 0.99 0.97 1.03filterers 0.73 0.92 0.90 0.92 1.01predators 0.81 1.01 1.01 0.97 0.85

R&D TECHNCIAL REPORT E1-007/TR 78
Figure 4.13: Relative abundances of each functional feeding group plotted againstsample O/E for number of taxa (LHS) and O/E for ASPT (RHS) for6016 GQA sites sampled in autumn 1995.

R&D TECHNCIAL REPORT E1-007/TR 79
Figure 4.14: Ratio O/E of observed to expected relative abundances of eachfunctional feeding group plotted against sample O/E for number oftaxa (LHS) and O/E for ASPT (RHS) for 6016 GQA sites sampled inautumn 1995.

R&D TECHNCIAL REPORT E1-007/TR 80
4.8 Trends in Functional Feeding Group Abundance Along Individual Rivers
The River Continuum Concept (RCC) proposes that local benthic communities areadapted to exploit changing food resources along the length of a river system. Usingthis concept, it is reasonable to anticipate that the relative abundance of the functionalfeeding groups may change in a systematic pattern with progression downstream. Theanalyses above do show up the expected RCC patterns with distance from source whenaveraged across all the RIVPACS reference sites but the trends are not dramatic. Thismay be because rivers with different environmental attributes may exhibit differenceswith respect to the FFGs for a given distance from source. Therefore we also assessedwhether the RCC was supported by the changes in FFG abundance with distancedownstream along some individual rivers for which we had a series of high qualityreference sites (Figure 4.15 to 4.17).
The longest river chosen for this analysis was the Swale-Ure-Ouse system in northernEngland (Figure 4.15) with nine sites over a 144 km length of river incorporating bothupland and lowland sections. Sites 1-6 were on the River Swale and whereas sites 1-4were above 100 m in altitude with a relatively steep (gradient ca. 10-4 m per km), sites5 and 6 were at an altitude of 27 and 18 m with slope of 0.3 m per km. Nevertheless, allsix sites were shallow (< 0.4 m) with a coarse substratum. By site 7 the Swale hadjoined the River Ure and sites 8 and 9 were on the River Ouse, as a result of the entry offurther tributaries. All three of sites 7-9 on the Ure/Ouse system were much deeper (1.6-2.0 m) and with a finer substratum than the Swale.
Figure 4.15: Percentage abundance of each functional feeding group in relationto distance from source (7, 14, 29, 44, 70, 94, 114, 129 and 144 km) ofsites down the Swale-Ure-Ouse river.
Given the length of this river system and the substantial differences in the physicalcharacteristics of the system downstream, was there evidence of a pattern in thepercentage abundance of each functional feeding group downstream?
�������������������������������������������������������������������������������������
�������������������������������������������������������������������������������������
�������������������������������������������������������������������������������������
�������������������������������������������������������������������������������������
��������������������������������������������������������������������������������
��������������������������������������������������������������������
������������������������������������������������
��������������������������������������������������������������������
������������������������������������������������
0%
20%
40%
60%
80%
100%
predators 22.5 24.7 27.8 21.2 20.6 20.0 28.4 30.7 29.3filterers 11.3 8.1 6.9 8.5 17.1 18.8 14.8 13.9 14.9gatherers 29.2 30.3 24.1 30.9 28.1 26.1 29.8 28.0 33.9���scrapers 30.4 29.7 32.2 31.8 29.0 26.9 19.1 21.5 17.8shredders 6.7 7.2 9.1 7.6 5.2 8.2 8.0 5.9 4.1
7 14 29 44 70 94 114 129 144

R&D TECHNCIAL REPORT E1-007/TR 81
In the case of shredders, which were generally under-represented in this system(compared to 10% in the 614 RIVPACS reference sites) there is no evidence of a clearpattern of change downstream. This also applies in the case of the gatherers, which tendto be the dominant FFG group at most sites. However, the scrapers do show more of aconsistent pattern with highest values at sites 1-4, somewhat lower values at 5 and 6 anda further decrease at sites 7-9. In contrast, filterers exhibit a consistently lowerpercentage abundance at sites 1-4 than at all sites further downstream, as expected inthe RCC. Finally, predators show substantial changes between sites, but with theirgreatest representation at sites 7-9. In conclusion, although some features of thescrapers and filterers follow the expectations of the RCC, this is not the case in theremaining three functional feeding groups.
The River Exe in south-west England, with 7 sites over a distance of 78 km, shows amore even progression in physical change downstream whilst retaining a coarsesubstratum throughout. The most downstream site is substantially wider and deeper thanall upstream sites. Shredders have a higher percentage abundance at sites 1-4 than atsites 5-7, as anticipated by the RCC. Scrapers achieve highest percentage abundance atsites 5 and 6 before decreasing substantially at site 7. Gatherers exhibit a relatively evenpattern of abundance throughout, although there are undoubted changes in taxonomiccomposition downstream. Filterers have their highest percentage abundance atdownstream sites 6 and 7, whilst there is no clear pattern for predators, although thehighest percentage occurrence is at site 7. Thus, shredders, scrapers and filterers allshow some conformity with the predictions of the RCC on this river system.
Figure 4.16: Percentage abundance of each functional feeding group in relationto distance from source (4, 9, 17, 29, 41, 59 and 78 km) of sites downthe River Exe.
Finally, nine sites were available for analysis on the River Usk in south Wales. Like theRiver Exe, the Usk showed some progressive changes in its physical features
���������������������������������������������������������������������������������������������������������
������������������������������������������������������������������������������������
���������������������������������������������������������������������������������������������������������
���������������������������������������������������������������������������������������������������������
��������������������������������������������������������������������������������������������������������������
������������������������������������������������������������������������������������������������������������������������������
������������������������������������������������������������������������������������
0%
20%
40%
60%
80%
100%
predators 21.6 25.6 24.4 23.6 25.5 22.7 27.0filterers 7.9 4.9 5.6 6.9 6.3 9.5 10.2gatherers 30.5 28.4 31.8 29.1 28.4 28.5 31.3
����scrapers 28.9 28.7 26.4 29.9 33.3 35.9 23.2shredders 11.1 12.5 11.8 10.6 6.5 3.4 8.3
4 9 17 29 41 59 78

R&D TECHNCIAL REPORT E1-007/TR 82
downstream, whilst retaining a coarse substratum. However, Usk reservoir was presentbetween sites 1 and 2. Shredders were normally present in higher percentage abundanceat upstream sites (1-5) than at downstream sites, but site 4 was an exception. In thisriver scrapers were better represented at the most upstream sites 1-4 than furtherdownstream, although site 8 also had high representation of scrapers. Gatherers showedsubstantial between site differences, in contrast to the River Exe and whereaspercentage representation at sites 1 and 2 was low, it was unusually high at site 8.Filterers assumed greatest percentage abundance at downstream sites 7 and 9. Predatorsexhibited a considerable degree of between-site variation in percentage abundance withunusually low representation at sites 4 and 8. Thus, on the Usk, only shredders and to acertain degree the scrapers and filterers conformed to expectation with respect to theRCC.
In summary, although each of shredders, scrapers and filterers did on some rivers, andin particular on the River Exe, provide some evidence of progressive changedownstream in the manner expected by the RCC, there were frequent exceptions andlittle in the way of pattern in the case of the gatherers and predators. We can thereforeconclude that, based on numerical data (as opposed to biomass or production data)obtained from RIVPACS samples identified to family level with attached abundancecategories, three rivers in different locations within England gave differing results andonly weak evidence in support of the RCC.
Figure 4.17: Percentage abundance of each functional feeding group in relationto distance from source (4, 8, 13, 21, 33, 46, 58, 70 and 90 km) of sitesdown the River Usk.
��������������������������������������������������������������������������������
�������������������������������������������������������������������������������������
��������������������������������������������������������������������������������
�������������������������������������������������������������������������������������
��������������������������������������������������������������������
����������������������������������������������������������������
��������������������������������������������������������������������
��������������������������������������������������������������������������������
��������������������������������������������������������������������
0%
20%
40%
60%
80%
100%
predators 25.1 20.0 22.1 14.1 25.7 23.5 25.3 11.3 22.8filterers 8.7 10.5 9.6 9.6 7.4 9.7 11.8 9.0 13.8gatherers 21.9 21.6 28.8 30.4 25.2 27.1 28.5 38.3 30.7
����scrapers 30.6 33.7 29.0 31.4 25.7 26.8 22.6 31.3 24.3shredders 13.8 14.2 10.4 14.5 15.9 12.9 11.8 10.0 8.5
4 8 13 21 33 46 58 70 90

R&D TECHNCIAL REPORT E1-007/TR 83
4.9 Summary and Conclusions
In this package, an attempt has been made to provide a new viewpoint on themacroinvertebrate community data collected for RIVPACS through the application ofthe functional feeding group (FFG) approach, in order to shed light on the functioningof the system.
Use of information on abundance is critical to studies designed to provide insights intothe functioning of running-water systems and therefore, in using information acquiredfor RIVPACS, it was necessary to utilise the family-level log category data. The lack ofabundance data relating to individual species within the RIVPACS dataset meant thatspecies-level analyses could not be attempted.
Five functional feeding groups were defined for this study, namely shredders, scrapers,gatherers, filterers and predators. Each family recorded in the RIVPACS III dataset wasassigned to the FFG system using two separate methods. These were a) the proportionalmethod and b) the use of the dominant FFG. The former method was used for all themain analyses because it is more realistic and robust.
RIVPACS samples are timed pond-net samples designed to include all availablehabitats in proportion to their occurrence. They may be viewed as a short cut/crudeattempt to encapsulate at least some of the basic features of community structure, butcannot take the place of a replicated quantitative sampling programme which takesaccount of each habitat at a site. In addition, the direct use of logarithmic categoryabundance data, which ignores the fact that the various families differ in the body sizeof individuals, is not ideal. The use of biomass or even production data would be moreappropriate, but is unrealistic in the present assessment.
The River Continuum Concept (RCC) of Vannote et al. (1980) predicts changes inrelative dominance (as biomass) of functional feeding groups along the length of(pristine) running-water systems. Shredders, in utilizing coarse particulate organicmatter such as leaf litter, are predicted to be co-dominant with collectors in headwaters.Scrapers are expected to follow shifts in primary production and therefore becomerelatively more important in midsized rivers. As river size increases, there will be ageneral reduction in detrital particle size, enabling collectors (both collector gatherersand filterers) to dominate the macroinvertebrate assemblages of large rivers. Thepredator component of the fauna is expected to change very little with stream order.
Of the many published studies around the world which have examined this concept, amajority have provided qualified support, but others have not. The 614 reference sites inthe Great Britain module of RIVPACS III were examined from several viewpoints,including a series of distance downstream categories. This was considered to be moreappropriate than the use of stream order because drainage pattern, which has a majorinfluence on stream order, depends upon underlying geology and Great Britain isnotable for the diversity of its geology.
When the mean relative abundance of the five functional feeding groups was examinedin relation to distance downstream across the 614 RIVPACS sites, it was found that thebasic pattern to emerge was in broad agreement with the predictions of the RCC (Table4.9 and Figure 4.5). That is, shredders had their highest relative abundance in

R&D TECHNCIAL REPORT E1-007/TR 84
headwaters (< 5 km from source) and decreased downstream. The relative abundance ofscrapers increased very slightly downstream, peaking in the 41-84 km downstreamcategory. Collector gatherers and filterers together maintained a dominant rolethroughout the dataset. This broad gatherer category remained very stable downstream,apart from in the 85-203 km distance category, where there was a slight overall increasecaused by the gatherer filterer component. The predator category was also very stabledownstream, with only a very slight rise with increasing distance downstream.
It is worth bearing in mind that the relatively small landmass of Britain means that itonly has small river systems compared to continental catchments. Therefore, the FFGpatterns expected in high-order river systems, including an overwhelming dominance ofthe collector group, are unlikely to emerge in their final form.
Overall, the mean relative abundances derived from the 614 RIVPACS reference siteswere 10% shredders, 27% scrapers, 30% collector gatherers, 10% collector filterers and23% predators. These average percentages were approximately the same, regardless ofseason (i.e. the spring, summer and autumn RIVPACS sampling seasons).
Examination of the relative abundance of each FFG on three river systems in differentgeographical locations in England and Wales provided some evidence of pattern, aspredicted by the RCC. However, there was also some unexplained between-sitevariation. This may have been the result of discontinuities along the river systemimpacting on available food resources (and hence FFGs), but could also be ademonstration that the RIVPACS sampling technique is incapable of documentingchanges in FFGs with sufficient accuracy. The real reason is unclear.
When differences between the observed relative abundances of each FFG were analysedin relation to TWINSPAN groups 1-35, they were shown to be statistically highlysignificant. Nevertheless, the relative abundances of the five FFGs varied in a lessconsistent manner with the environmental characteristics of sites than did the variousBMWP indices, and especially ASPT. Thus, RIVPACS will be less effective atpredicting the expected relative abundance of FFGs than the expected values of BMWPindices.
Because the relative abundances of the FFGs vary little between TWINSPAN groups,the expected (E) values predicted by RIVPACS are fairly similar across the full range ofsites. As a result, O/E ratios of the relative abundance of the FFGs will be very highlycorrelated with observed (O) relative abundances and hence the pattern of values for theO and O/E values across a wide range of sites will be similar and lead to similarconclusions.
Following on from this appraisal of the behaviour of the five FFGs across the full rangeof high quality RIVPACS reference sites, the next step was to assess whether there weretrends in the relative abundance of FFGs in relation to site quality. The BAMS studysites (Furse et al. 1995), which included sites of differing quality in different river typeswere of particular value because they included replicated samples in each of threeseasons. Replication enables an assessment to be made of the variability in the relativeabundance of FFGs due to sampling variation. Clearly, if sampling variability is high, itwill be difficult to detect differences between sites due to site quality and/or site type.

R&D TECHNCIAL REPORT E1-007/TR 85
The observed relative abundance of each FFG from each of the 144 BAMS replicateswas plotted against EQITAXA and also against EQIASPT. Only two FFGs demonstrated astrong relationship with site quality. Whereas gatherers formed 20-30% of total logabundance at good quality sites, their relative importance increased as site qualitydecreased such that they contributed 50-60% of total log abundance at very poor qualitysites (Figure 4.9). In contrast, the relative abundance of predators was least at very poorquality sites (ca. 10% for sites with values of EQITAXA of 0.3) and peaked at ca 25%relative abundance at sites with intermediate site quality (EQITAXA of 0.5 - 0.8).
As anticipated, the small range of expected relative abundances predicted by RIVPACSmeant that the correlation of observed relative abundances and O/E relative abundanceswith the EQIs were very similar. In other words, standardising by the RIVPACSexpected values did not improve relationships between the observed relativeabundances of each FFG and site quality. In view of the limited number of BAMS sites(16) and the amount of scatter in the relative abundance of each FFG at any given riverquality, it was considered important to examine these relationships using the muchlarger 1995 GQA dataset.
Correlations between the relative abundance of each FFG and EQITAXA and alsoEQIASPT were found to be weaker for the available 6106 GQA sites than for the morelimited BAMS dataset. (See Tables 4.14 and 4.13). It was also apparent that there wasconsiderable variation in the relative abundance of any given FFG amongst sites of agiven EQI value. Despite this, there were still trends in the relative abundance of eachFFG with respect to site quality (Table 4.15). Thus, poor quality sites had relativelymore gatherers and consequently relatively fewer filterers and predators, and to a lesserextent relatively fewer scrapers and shredders. Once again, as anticipated, a similarpattern of results was obtained when the relative abundances were standardised by theexpected values as O/E ratios.
In conclusion, it was apparent that the relative abundance of the various FFGs variedonly weakly with the environmental characteristics of a wide range of high qualityreference sites and substantial differences in FFGs only occurred at very poor qualitysites.
These findings increase our knowledge and understanding of macroinvertebrateassemblages in British rivers. However, several factors indicate that there would belittle to be gained at present by incorporating the facility to generate expected FFGs inthe next version of RIVPACS. These factors include the marginal differences in FFGsacross reference sites, the high level of variation in FFGs for a given quality of site, andthe fact that extreme response in FFG behaviour is limited to poor quality sites only.These sites can be recognised very effectively using the existing EQITAXA and EQIASPTapproach.

R&D TECHNCIAL REPORT E1-007/TR 86
4.10 Recommendations
1. In view of the limited practical application of FFGs based on RIVPACSsamples, it is recommended that no attempt is made to incorporate proceduresfor calculating the expected relative abundances of each FFG for any given sitewith stated environmental features into the next version of RIVPACS.
2. However, the possibility that this approach might have some practicalapplication at a future date should be kept under periodic review. Thus, thepossibility of calculating the estimated biomass of each FFG or understandingthe factors contributing to variability in relative abundances of FFGs at poorquality sites (different forms of stress?) may repay future investigation.
3. The family-level designation of FFGs for Great Britain, although relativelycrude and subject to future improvement may, nevertheless, be of value in otherstudies undertaken by the Environment Agency or their contractors. Inparticular, the probability-based system for designating FFGs is more realisticand robust than the simpler version which designates one dominant FFG foreach family.
4. The use of FFGs has greater credibility where quantitative sampling proceduresare being used by the Agency or their contractors. For example, numerical (orbiomass) data could be used to investigate spatial change along a river system ortemporal change at a site subject to periodic stress. In each case, changes in therelative abundance of FFGs might provide understanding of changes in availablefood resources.
5. Within Europe, attempts have already been made to designate FFGs at specieslevel (Moog 1995). Issues related to conservation and biodiversity are nowreceiving a higher profile within the Agency, and there is an argument forgenerating FFGs at the species level in order to acquire more comprehensiveknowledge of the British macroinvertebrate fauna. In the future, there will be anincreasing need for this and other forms of information on the biologicalattributes of individual species to be easily accessible from a database forapplication to a wide range of conservation and management issues.
4.11 References
Bruns D A, Minshall G W, Brock J T, Cushing C E, Cummins K W and Vannote R L,1982. Ordination of functional groups and organic matter parameters from the MiddleFork of the Salmon River, Idaho. Freshwater Invertebrate Biology, 1,3, 2- 12.
Cairns J and Pratt J R, 1993. A history of biological monitoring using benthicmacroinvertebrates. In: Freshwater biomonitoring and benthic macroinvertebrates (Eds.D M Rosenberg and V H Resh), pp10-27. Chapman and Hall, New York.
Camargo J A, 1994. The importance of biological monitoring for the ecological riskassessment of freshwater pollution: A case study. Environment International. 20, 229-238.

R&D TECHNCIAL REPORT E1-007/TR 87
Canton S P, Cline L D, Short R A, and Ward J V, 1984. Macroinvertebrates and Fish ofa Colorado Stream During a Period of Fluctuating Discharge. Freshwater Biology, 14,311-316.
Chung K, Wallace J R and Grubaugh J W, 1993. The impact of insecticide treatment onabundance, biomass and production of litterbag fauna in a headwater stream: a study ofpretreatment, treatment and recovery. Limnologica, 23, 93-106.
Clarke K R, 1993. Non-parametric multivariate analyses of changes in communitystructure. Australian Journal of Ecology, 18, 117-143.
Clarke K R and Warwick R M, 1994. Changes in marine communities: An approach tostatistical analysis and interpretation. Plymouth Marine Laboratory, Plymouth.
Clarke K R and Green R H, 1988. Statistical design and analysis for a ‘biologicaleffects’ study. Marine Ecology Progress Series, 46, 213-226.
Clarke R T, Cox R, Furse M T, Wright J F and Moss D, 1997. RIVPACS III+ RiverInVertebrate Prediction and Classification System with error assessments. User Manual.R&D Technical Report E26. Environment Agency, Bristol.
Clarke R T, Furse M T and Davy-Bowker J. 1999. Analysis of the 1995 survey data.Phase 2 Post-survey appraisal. Unit II: Post-survey appraisal. R&D Technical ReportE101. Environment Agency, Bristol.
Clarke R T and Wright J F, 2000. Testing and Further development of RIVPACS Phase3. Development of new RIVPACS Methodologies. Stage 2. R&D Technical ReportE124. Environment Agency, Bristol.
Culp J M and Davies R W, 1982. Analysis of Longitudinal Zonation and the RiverContinuum Concept in the Oldman-South Saskatchewan River System. CanadianJournal of Fisheries and Aquatic Sciences, 39, 1258-1266.
Cummins K W, 1973. Trophic relations of aquatic insects. Annual review ofEntomology, 18, 183-206.
Cummins K W, 1974. Structure and function of stream ecosystems. Bioscience, 24,631-41.
Cummins K W and Klug M J. 1979. Feeding ecology of stream invertebrates. AnnualReview of Ecology and Systematics., 10, 147-172.
Davy-Bowker J, Furse M T, Clarke R T and Gravelle M J. 2000. Analysis of the 1995survey data. Phase 2 Post-survey appraisal. Unit I: Taxon distribution studies. R&DTechnical Report E103. Environment Agency, Bristol.
Darschnik V S and Schumacher H. 1987. Trout Farms Causing Disturbance in theNatural Stream Continuum (Stoerung des Natuerlichen Laengsgradienten einesBergbaches durch Forellenteichanlagen). Archiv fur Hydrobiologie, 110, 3, 409-439.

R&D TECHNCIAL REPORT E1-007/TR 88
Furse M T, Clarke R T, Winder J M, Symes K L, Blackburn J H, Grieve N J and GunnR J M, 1995. Biological Assessment Methods: controlling the quality of biological data.Package 1. The variability of data used for assessing the biological condition of rivers.R&D Note 412, Environment Agency, Bristol.
Garcia De Jalon D, Sanchez P and Camargo J A, 1994. Downstream effects of a newhydropower impoundment on macrophyte, macroinvertebrate and fish communities.Regulated Rivers: Research and Management, 9, 253-261.
Grubaugh J W, Wallace J B and Houston E S, 1996. Longitudinal changes ofmacroinvertebrate communities along an Appalachian stream continuum. CanadianJournal of Fisheries and Aquatic Sciences. 53, 896-909.
Grubaugh J W, Wallace J B and Houston E S, 1997. Production of benthicmacroinvertebrate communities along a southern Appalachian river continuum.Freshwater Biology, 37, 581-596.
Hawkins C P and Sedell J R, 1981. Longitudinal and Seasonal Changes in FunctionalOrganization of Macroinvertebrate Communities in Four Oregon Streams. Ecology, 62,387-397.
King J M, Day J A, Hurly P R, Henshall-Howard M P, and Davies B R, 1988.Macroinvertebrate Communities and Environment in a Southern African MountainStream. Canadian Journal of Fisheries and Aquatic Sciences, 45, 2168-2181.
Lindemann R L, 1942. The trophic-dynamic aspect of ecology, Ecology, 23, 399-416.
Merritt R W and Cummins K W (Eds.), 1984. An Introduction to the Aquatic Insects ofNorth America. Dubuque: Kendall/Hunt.
Mihuc T B, 1997. The functional trophic role of lotic primary consumers: Generalistversus specialist strategies. Freshwater Biology, 37, 455-462.
Minshall G W, Petersen R C, Cummins K W, Bott T L.and Sedell J R, 1983. InterbiomeComparison of Stream Ecosystem Dynamics. Ecological Monographs, 53, 1-25.
Moog O (Ed.) 1995. Fauna Aquatica Austriaca, Version 1995.Wasserwirtschaftskataster, Bundesministerium fur Land- und Forstwirtschaft, Wien.
Palmer C, O' Keeffe J and Palmer A, 1993. Macroinvertebrate functional feeding groupsin the middle and lower reaches of the Buffalo River, eastern Cape, South Africa. 2.Functional morphology and behaviour. Freshwater Biology, 29, 455-462.
Poulton B C, Finger S E and Humphrey S A, 1997. Effects of a crude oil spill on thebenthic invertebrate community in the Gasconade River, Missouri. Arch. Environ.Contam. Toxicol. 33, 3, 268-276.

R&D TECHNCIAL REPORT E1-007/TR 89
Quinn J M and Hickey C W. 1993. Effects of sewage waste stabilization lagooneffluent on stream invertebrates. Journal of Aquatic Ecosystem Health, 2, 3, 205-219.
Rabeni C F, Davies S P and Gibbs K E, 1985. Benthic Invertebrate Response toPollution Abatement: Structural Changes and Functional Implications. Water ResourcesBulletin, 21, 3, 489-497.
Reice S R and Wohlenberg M, 1993. Monitoring freshwater benthic macroinvertebratesand benthic processes. Measures for assessment of ecosystem health. In: Freshwaterbiomonitoring and benthic macroinvertebrates (Eds. D M Rosenberg and V H Resh), pp287-305. Chapman and Hall, New York.
Ryder G I and Scott D, 1988. Applicability of the River Continuum Concept to NewZealand Streams. Internationale Vereinigung fur Theoretische und AngewandteLimnologie. Verhandlungen, 23, 1441-1445.
Scheiring J F, 1985. Longitudinal and seasonal patterns of insect trophic structure in aFlorida sand-hill stream. Journal of the Kansas Entomological society, 58, 207-219.
Schwingshandl A, 1992. Analyse der funkionellen Ernahrungsgruppen benthischerInvertebraten im Langenschnitt eines Baches der subalpinen Molasse im Bregenzerwald(Schwarzach, Vorarlberg), Diplomarbeit, Universitat fur Bodenkultur, 160pp.
Statzner B and Higler B, 1985. Questions and comments on the Continuum Concept.Canadian Journal of Fisheries and Aquatic Sciences, 42,1038-1044.
Van-der-Velde G and Van-den-Brink F W B, 1993. Does the Rhine still havecharacteristics of a river ecosystem? The longitudinal distribution ofmacroinvertebrates. International Conference on Rehabilitation of the River Rhine,Arnhem (Netherlands), 15-19.
Vannote R L, Minshall G W, Cummins K W, Sedell J R and Cushing C E, 1980. TheRiver Continuum Concept, Canadian Journal of Fisheries and Aquatic Sciences, 37,130-137.
Wallace J B and Webster J R, 1996. The role of macroinvertebrates in stream ecosystemfunction. Annual Review of Entomology, 41, 115-39.
Ward J V and Stanford J A, 1983. The serial discontinuity concept in lotic ecosystems.In: Fontain T D and Bartell S M, (Eds.). Dynamics of lotic ecosystems, Ann. Arbor.Science Publisher Inc., Ann. Arbor. MI., 29-41.
Wright J F, Blackburn J H, Gunn R J M, Furse M T, Armitage P D, Winder J M andSymes K L, 1996. Macroinvertebrate frequency data for the RIVPACS III sites in GreatBritain and their use in conservation evaluation, Aquatic Conservation: Marine andfreshwater ecosystems, 6, 141-167.

R&D TECHNCIAL REPORT E1-007/TR 90

R&D TECHNCIAL REPORT E1-007/TR 91
5. EVALUATION OF THE USE OF RIVPACS IN THECONTEXT OF BIODIVERSITY AND SUSTAINABILITYBY J F WRIGHT
5.1 Introduction
In 1990, the government published a White Paper entitled ‘This common inheritance,Britain’s environmental strategy’. In this document sustainable development wasdescribed as follows:
Living on the earth’s income rather than eroding its capital. Keeping the consumptionof renewable natural resources within the limits of their replenishment. Handing downto successive generations not only man-made wealth, but also natural wealth, such asclean and adequate water supplies, good arable land, a wealth of wildlife, and ampleforests.
In 1992, at the Earth Summit held at Rio de Janeiro, a total of 157 governments signedthe Convention on Biological Diversity and in so doing, agreed to take positive actionto halt and reverse the alarming loss of habitats and also animal and plant speciesaround the world.
The Convention required the development of national plans for the conservation andsustainable use of biological diversity, and in 1994, the UK Government launched‘Biodiversity: the UK Action Plan’ (Department of the Environment, 1994). Theobjective was to conserve and enhance biological diversity within the UK and tocontribute to the conservation of global biodiversity through all appropriatemechanisms. The responsibility for overseeing implementation of this objective wasaddressed by a steering group whose 1995 report (Department of the Environment,1995) included the principles for delivering the plan and a number of costed actionsplans for species and habitats considered to be under greatest threat.
The Environment Agency has a more holistic role than the organisations from which itwas formed. Its principal aim, as set out in the Environment Act 1995, is ‘to protect orenhance the environment, taken as a whole, in order to play its part in attaining theobjective of sustainable development, as guided from time to time by Ministers’.
Statutory guidance has now been issued by Ministers with respect to the Agency’soverall objectives and its contribution to sustainable development. Amongst therequirements included in this guidance is the need to conserve and enhance biodiversity.In response to this guidance, the Agency reassessed its environmental monitoring andassessment programme. In January 1997, the Agency issued a consultation documententitled ‘Viewpoints on the Environment: developing a national environmentalmonitoring and assessment framework’. The proposed framework includes sixcomplimentary ‘viewpoints’ of which one – the status of biological communities andpopulations, and of biodiversity – is of particular relevance to this package.
The Agency continues to play a very important role in the issues of biodiversity andsustainability. Two recent examples include the following. First, the publication inApril 2000 of ‘Focus on Biodiversity: The Environment Agency’s contribution to

R&D TECHNCIAL REPORT E1-007/TR 92
wildlife conservation’, which provides an excellent summary of the contribution madeby the Agency to the UK Biodiversity Action Plan. Second, the production in June 2000of a consultation draft entitled ‘Creating an Environmental Vision’ which progressesthe Environment Agency’s contribution to sustainable development by way of a betterenvironment in England and Wales. Recently, the final version of this document hasappeared under the title 'An Environmental Vision: The Environment Agency'scontribution to Sustainable Development'.
The purpose of the current package is to assess the current role of RIVPACS in thewider context of biodiversity and sustainability and determine whether its value may beenhanced.
5.2 Objectives
The overall objective is as follows:
‘To produce a scoping report on how RIVPACS may be modified or used to address theneeds of the Agency for monitoring and assessing sustainability and contributing to themaintenance of biodiversity and to identify small modifications to the output of theexisting RIVPACS which could be implemented at the next revision of the software’.
The specific objectives (modified from the original specification with the agreement ofthe nominated officer) are as follows:
1. To identify, in broad terms, how the current version of RIVPACS couldcontribute to the UK’s responsibilities under the Convention on BiologicalDiversity.
2. To describe outputs which could be generated from RIVPACS that would be ofuse in assessing biodiversity, species rarity and threat status, and also habitatrarity. This may include flagging the Red Data Book status and otherconservation status of taxa, and providing information on the commonness oftaxa in the RIVPACS reference data-set.
3. To identify any species in RIVPACS that are in any of the biodiversity listsdrawn-up by the UK Biodiversity Steering Group. If there are any, indicate howmuch data is included in RIVPACS, and how reliable RIVPACS predictionsmay be for them.
4. To identify modifications to RIVPACS which may assist with the UK’sresponsibilities under the Convention on Biological Diversity. To recommendwhich of these should be implemented and describe the modifications requiredto RIVPACS.

R&D TECHNCIAL REPORT E1-007/TR 93
5.3 Sustainability/Sustainable Development
5.3.1 Background
A definition of ‘sustainable development ‘ was provided at the beginning of thischapter, taken from the Government White paper published in 1990 and entitled ‘Thiscommon inheritance, Britain’s environmental strategy’. Since then, a considerableamount of thought has gone into this subject at national and international level, but alsoat regional and local levels within this country. The UK Government strategy forsustainable development, entitled ‘A better Quality of Life’ has four main aims. Theseare:
• Social progress which recognises the needs of everyone• Effective protection of the environment• Prudent use of natural resources• Maintenance of high and stable levels of economic growth and employment
The Environment Agency, in responding to the Government’s strategy for sustainabledevelopment, has now set out a thematic approach in their document entitled 'AnEnvironmental Vision: The Environment Agency's contribution to SustainableDevelopment'. This represents a new attempt to define long-term objectives within thebroader social context which is essential to sustainable development. In all, there arenine themes as follows:
1. a better quality of life2. an enhanced environment for wildlife3. cleaner air for everyone4. improved and protected inland and coastal waters5. restored, protected land with healthier soils6. a 'greener' business world7. wiser, sustainable use of natural resources8. limiting and adapting to climate change9. reducing flood risks
This is a very wide-ranging subject and one in which the current version of RIVPACS,and future developments based on the system and its supporting dataset, do have a role.Given that this package is essentially concerned with exploring new ideas, it isappropriate to start with a broad canvas before starting to focus in on the particularareas where RIVPACS and associated data can make a genuine contribution.
Within 'An environmental vision' each of the above nine themes is explored and throughthis document it is possible to flag areas where RIVPACS currently plays a role andwhere there is potential for enhancement of that role in the future. In order not to restrictthis process from the outset, a majority of the above nine themes will be consideredbriefly. However, four of them, including 3 (cleaner air for everyone), 5 (restored,protected land with healthier soils), 6 (a 'greener' business world) and 9 (reducing floodrisks) will be excluded because their potential for impacting on river systems is alreadycovered by other themes.

R&D TECHNCIAL REPORT E1-007/TR 94
'An environmental vision' provides a long-term objective for each theme, together withsome consequences which follow on as result of pursuing that goal. Both the statedEnvironment Agency long-term objective and selected consequences for the remainingsix themes are listed below. These are followed by some very brief comments, inbracketed italics, giving instances where RIVPACS is currently relevant or may berelevant in the future.
5.3.2 A better quality of life
Long-term objective: People will have peace of mind from knowing that they live in ahealthier environment, richer in wildlife and natural diversity - an environment that theycare for and can use, appreciate and enjoy.
Therefore:
• People will be confident that the environment is well cared for, is not damagedby pollution, and does not provide a health risk because of human activities.(RIVPACS currently provides a mechanism for determining whether a running-water site is of high biological quality)
• The environment will be greatly valued and cared for by all sectors of society, asa source of food, water, materials, income, recreation, sport and wildlifeconservation.(There is the potential for further information on the freshwater fauna to bemade more widely available, first to the Environment Agency and later to thepublic at large on the occurrence of both common and rare species of running-water macroinvertebrates and on locations where taxon richness is high).
• Information and processes will be readily available to enable citizens,communities, businesses and government and its agencies to agree quality of lifeand environmental targets and the plans that will realise them.(RIVPACS currently offers to the Environment Agency a clear demonstration ofthe biological quality of a given site and whether quality has changed over time.There is potential for this information to be made more widely available).
5.3.3 An enhanced environment for wildlife
Long-term objective: Wildlife will thrive in urban and rural areas. Habitats will improvein their extent and quality to sustainable levels for the benefit of all species. Everyonewill understand the importance of safeguarding biodiversity.
Therefore:
• Degraded habitats, especially rivers, estuaries, and wetlands, will have beenrestored.(The process of restoration, in terms of the return of the expected fauna, can bedocumented using RIVPACS. Questions related to the local availability of losttaxa may also be addressed using the RIVPACS dataset)

R&D TECHNCIAL REPORT E1-007/TR 95
• Wildlife corridors and their associated habitats will be of high quality, with noartificial barriers to wildlife movement.(Sites of high biological quality, as determined using RIVPACS, require bothhigh quality habitat and the absence of major instream stresses such as waterpollution)
• The UK's Biodiversity Action Plan will have been successfully delivered andpriority species will no longer be under threat.(Over the past 20 years, sampling at RIVPACS reference sites has increased ourknowledge of some BAP species. The current extensive network of BiologicalGQA sites operated by the Environment Agency may have some potential fordocumenting the future spread of BAP species)
• There will be a broad consensus on how biodiversity should be managed againsta background of climate change.(The RIVPACS dataset provides a unique historical record of the geographicaldistribution of 642 taxa throughout the UK in the last 20 years of the 20th
Century)
• Threats to the genetic integrity of our native wildlife will be greatly reduced.(The occurrence and spread of alien species is of continuing concern. Samplingat RIVPACS reference sites and also the more extensive quinquennial samplingat the Environment Agency Biological GQA sites may help to document the rateof spread of alien species and their future impact on the native fauna)
5.3.4 Improved and protected inland and coastal waters
Long-term objective: Our rivers, lakes and coastal waters will be far cleaner. They willsustain diverse and healthy ecosystems, water sports and recreation such as boating andfishing, and those uses needed by a thriving and healthy community.
Therefore:
• Abstractions and discharges will neither damage the environment, nor threatenhuman health.
• Damaging pollution incidents will have been prevented at source.
• The causes of water pollution, eutrophication, and acidification will have beenfully controlled.(Again, for abstractions and pollution as listed in the three bullet points above,the use of RIVPACS O/E ratios can establish whether damage has occurred anddocumentt improvement over time).
• Surface waters will sustain a diverse variety of habitats and wildlife.(Because RIVPACS offers site-specific predictions of the macroinvertebratefauna to be expected at a given site, it provides relevant information on both thespecies composition and the site richness to be expected at a site with givenenvironmental features).

R&D TECHNCIAL REPORT E1-007/TR 96
5.3.5 Wiser, sustainable use of natural resources
Long-term objective: Business, public agencies, other organisations and individuals willminimise the waste they produce. They will reuse and recycle materials far moreintensively, and make more efficient use of energy and materials.
Therefore:
• People will be aware of their natural resource consumption and takeresponsibility for its environmental impact.(RIVPACS O/E ratios provide an important method for measuringenvironmental impact and subsequent improvement over time).
• Water will be acknowledged as a valuable resource and will be used wisely byall sectors of society. The justifiable demands for water use will be understoodand the means of meeting them in place.(RIVPACS may provide one means of early warning to ensure that excessivegroundwater and surface water abstraction, with undesirable consequences forthe macroinvertebrate fauna as a result of man-induced low flows, is avoided).
5.3.6 Limiting and adapting to climate change
Long-term objective: Drastic cuts will have been made in the emission of 'greenhousegases' such as carbon dioxide and society as a whole will have taken account of, and beprepared for, the probable changes to our climate. Therefore:
• Environmental monitoring programmes will provide accurate information on thedirect effects of climate change.(As previously indicated, the RIVPACS dataset is a unique historical record ofthe geographical distribution of 642 taxa throughout the UK over the last 20years. As such, it has some potential value as a yardstick against which tomeasure any future changes in the fauna resulting from the long-term effects oftemperature changes and the impact of more floods and droughts. Similarly,RIVPACS outputs may help to assess some of these changes).
5.4 Biodiversity
5.4.1 Definition of Biodiversity
The word ‘biodiversity’ is a contraction of the term ‘biological diversity’. The latter hasa long history of use in a variety of contexts but its current usage dates from the 1980s.Norse et al. (1986) were the first to refer unequivocally to biological diversity at threedifferent levels, namely genetic (within species), species (species numbers) andecological (community) diversity. The contracted form ‘biodiversity’ was coined by anAmerican, W. R. Rosen, in 1985 prior to a key meeting, the National Forum onBiodiversity, convened in Washington D.C. in September 1986.
‘Biodiversity’ can be considered as synonymous with ‘biological diversity’ and this isreinforced by the official definition in Article 2 of the ‘Convention on Biological
R&D TECHNCIAL REPORT E1-007/TR 97
Diversity’ signed by 156 nations and the European Community at the United NationsConference on the Environment and Development, ‘The Earth Summit’ in 1992. Thus:
‘Biological diversity’ means the variability among living organisms from all sourcesincluding, inter alia, terrestrial, marine and other aquatic systems and the ecologicalcomplexes of which they are part; this includes diversity within species, betweenspecies and of ecosystems.
Clearly, when using the term biological diversity or biodiversity in a scientific context,it is important to convey whether you are using the term in its general sense to embraceall three levels, or whether one specific level is intended. Some clarification of each ofthese three levels is provided below.
Genetic Diversity
This is the heritable variation within and between populations of organisms. Ultimately,it is represented in the sequence of the four base-pairs which, as components of nucleicacids, constitute the genetic code. The genetic variation present within an interbreedingpopulation is acted upon by selection and the consequent differential survival results inchanges in gene frequencies, which are equivalent to population evolution. Thus,genetic variation enables natural evolutionary change to occur.
Within the scientific community there is an increasing awareness and concern over lossof genetic diversity. The Environment Agency share this concern and are pledged toensure that the genetic integrity of aquatic life, and in particular the genetic integrity offreshwater fish is conserved. Threats can come from several directions includingpollution, habitat loss and also the introduction of alien species. In reality, resources arelikely to be focussed on a small number of high profile species. The genetic variationwithin and between populations of macroinvertebrates is largely unknown and currentactions to limit pollution, habitat loss and the spread of alien species are probably themost realistic approaches for the conservation of genetic diversity. The importance ofmaintaining genetic diversity becomes ever more relevant as the Agency considers theconsequences of climate change.
Species diversity
Biodiversity is often used as a synonym of species diversity, and in particular of speciesrichness, which is simply the number of species in a site or habitat. Consideration ofrichness for a given taxonomic group in, for example, a river system, a country orglobally is also most naturally done at species level. It is, after all, at the species levelthat evolutionary mechanisms act, and the origin and extinction of species are theprincipal agents in governing biological diversity.
However, it is not always possible to recognise and enumerate taxa at the species level,and for this reason some scientists prefer to use the term ‘organismal diversity’ in orderto embrace taxonomic categories above species rank. Because of the common problemof identifying all the species present at a site, scientists have also been investigating thequestion of whether the number of higher taxa, such as phyla, orders and familiesprovide a more appropriate (and more easily acquired) measure of biodiversity.

R&D TECHNCIAL REPORT E1-007/TR 98
A further consideration is whether all species at a site, within and across the systematicgroups represented at that site, contribute equally to biodiversity. It is generallyaccepted that a site with many different higher taxa has more ‘taxonomic diversity’ thana site with fewer higher taxa but more species. Ideally, a measure of the biodiversity ofa site should therefore indicate how different the organisms are from each other. Forexample, marine habitats frequently have more different phyla but fewer species thanterrestrial habitats, that is, they have higher taxonomic diversity but lower speciesdiversity. Measures are currently under development to try to encapsulate thesefeatures.
Ecosystem Diversity
It is questionable whether the term ‘ecosystem diversity’ should be used, and some havepreferred the term ‘community diversity’ or even ‘ecological diversity’. The word‘ecosystem’ was first use by Tansley (1935) to refer to a community of organisms inrelation to their physical environment. Given that the physical environment does nothave biodiversity, the term ecosystem diversity does not seem appropriate.
In practice, assessment of diversity at ecosystem, community or habitat level is fraughtwith problems because there are no global systems of classification through which tocompare diversity. Hence ecosystem/community diversity is frequently assessed on aregional or local basis using well-studied life forms. It may be evaluated using anassessment of the relative abundance of different species as well as a consideration ofthe types of species present. Community A would be regarded as more diverse thancommunity B when the total number of individuals present in A was shared moreequitably between the component species than in B, where a few species accounted formost of the individuals. With regard to types of species, a community might be regardedas more diverse when it included different size classes of organisms, several differenttrophic levels or different taxonomic groups. The problem with such schemes is thatdifferent weightings can be given to different factors and, without agreed standards, itbecomes difficult to rank different areas.
In conclusion, many basic and difficult questions remain on the practicalities ofmeasuring biodiversity at the genetic, species and community level. Undoubtedly, themajor focus for the Environment Agency at present is on species diversity. The recentEnvironment Agency publication entitled ‘Focus on Biodiversity’ provides a clear andsimple answer to the question ‘What is biodiversity?’ It is repeated below.
‘Biological diversity, or biodiversity, is the living component of the natural world andembraces all plant and animal species and communities associated with terrestrial,aquatic and marine habitats. It also includes genetic variation within species. Wildlifeconservation generally aims to maintain or enhance natural biodiversity’.

R&D TECHNCIAL REPORT E1-007/TR 99
5.4.2 Wildlife conservation and the UK Biodiversity Action Plan
Recording and conservation of the freshwater fauna in the UK
Although the primary function of the Environment Agency is not wildlife conservation,it does make a major contribution to the conservation of wetland and riverine habitatsand their biota through its functions in pollution control and water management. Inaddition, there are many specific ways in which the Agency contributes to wildlifeconservation. A number of these are outlined in ‘Focus on Biodiversity’.
Before providing brief details on the UK Biodiversity Action Plan, it is worth making afew introductory remarks on some aspects of research and survey in river ecologywhich have laid the groundwork on which the present actions can proceed. First, it iscritical to be able to identify organisms accurately and the UK is particularly fortunatein having access to reliable keys to most major groups of freshwater macroinvertebratesas a result of the efforts of past and present generations of taxonomists. The number ofspecies known to occur in fresh water in the British Isles has increased since the initialcoded checklist published by Maitland (1977). An up-to-date version of the presentMaitland/Furse coded checklist is available on the CEH website(www.ceh.ac.uk/subsites/eic/ddc/furselist/index.htm).
Second, the long-term efforts of both amateur and professional collectors have provideddetailed knowledge of the geographical distribution of selected groups of freshwatermacroinvertebrates. The Biological Records Centre co-ordinates a number of BiologicalRecording Schemes for freshwater invertebrates and again, further information on thesecan be accessed on the CEH website (www.ceh.ac.uk/subsites/eic/brc/index.htm).
However, there are a number of groups of freshwater macroinvertebrates for whichthere are no recording schemes. The RIVPACS database, which includes a total of 642taxa recorded at the 614 sites in Great Britain plus the 70 reference sites in NorthernIreland, represents a unique historical record of the macroinvertebrate fauna at thesesites, because they were all subjected to the same level of identification. A full listing ofthe 637 taxa recorded at the 614 sites in Great Britain, together with their frequency ofoccurrence may be found in Wright et al. (1996). An equivalent listing for the 313 taxarecorded at the 70 sites in Northern Ireland may be found in Wright et al. (2000).
For some time the statutory nature conservation organisations have developedprocedures for recognising threatened species in order to take action when this wasconsidered necessary. Species with Red Data Book status are regarded as threatened.There are two Red Data Books for invertebrates: one for invertebrates other than insects(Bratton, 1991) and a second for insects (Shirt, 1987). These books, which includeterrestrial and freshwater species, use a series of progressive threat categories, whichdefine the extent of the perceived threat. The threat categories used in these booksinclude RDB 1 (Endangered), RDB 2 (Vulnerable) and RDB 3 (Rare). Although it isimportant to recognise that the species are categorized according to degree of threat andnot rarity, taxa in RDB categories 1-3 are unlikely to occur in more than 15 10 x 10 kmsquares of the National Grid.
Rare species may be accorded ‘Nationally Scarce’ status (previously referred to as‘Nationally Notable’), in which case they should be known from 100 or fewer 10 x 10

R&D TECHNCIAL REPORT E1-007/TR 100
km squares. A further division into Nationally Scarce A (30 or fewer 10 x 10 squares)and Nationally Scarce B (31-100 squares) has also been used for some groups.
All Red Data Book and Nationally Scarce species, as defined above, which occurred atany of the 614 reference sites in the RIVPACS data-set for Great Britain have beenflagged in Wright et al.(1996).
However, in 1994 the World Conservation Union (IUCN) adopted a revised list of RedList categories and criteria (IUCN, 1994). The new system of threat assessment reliesheavily on quantitative criteria and has been designated for use at the global scale. It isalso being recommended for use at regional and national levels. This system is morerigorous than the previous version, and results in fewer species being assigned to theRed Lists (now defined as Critically Endangered, Endangered and Vulnerable). Furthercategories including Data Deficient (not Red List, but may be when more dataavailable) and Near Threatened (not Red List, but present in 15 or fewer 10 x 10 kmsquares in GB) are also available. In addition, the IUCN has accepted that individualcountries are entitled to create their own categories. Hence, the British system ofdesignating Nationally Scarce species will continue.
As yet, the new system has not been widely applied to freshwater macroinvertebratesand the old system is still in use, with the exception of one major group, the Coleoptera.The Joint Nature Conservation Committee plan to publish a review of the scarce andthreatened Coleoptera of Great Britain (Foster, in press) which will give listings of boththe present IUCN categories and also the previous RDB and Nationally Scarcecategories.
Protection of freshwater species within Great Britain is through the Wildlife andCountryside Act 1981, together with subsequent quinquennial reviews. Schedule 5 ofthe Act has a select list of freshwater invertebrates, most of which are Red Data Bookspecies, where legal protection is considered likely to bring tangible conservationbenefits. It also includes a few additional species which are giving cause for concern,including the white-clawed crayfish (Austropotamobius pallipes) and the freshwaterpearl mussel (Margaritifera margaritifera).
The UK Biodiversity Action Plan
The Earth Summit in Rio de Janeiro in 1992 resulted in an International Agreement onsustainable development which included amongst its major initiatives, the Conventionon Biological Diversity. This is essentially a commitment to conserving and sustainingthe variety of life on earth. Each of the 157 governments which signed the agreementaccepted the need to develop national strategies, plans and programmes for theconservation and sustainable use of biological diversity, and to share resources to helpimplement such programmes.
The UK Government response to the Biodiversity Convention appeared in 1994 underthe title Biodiversity: The UK Action Plan. This sets out the broad strategy forconserving and enhancing wild species and wildlife habitats in the UK for the next 20years. The overall goal of the plan is ‘to conserve and enhance biological diversitywithin the UK and to contribute to the conservation of global biodiversity through all

R&D TECHNCIAL REPORT E1-007/TR 101
appropriate mechanisms’. The objectives for conserving biodiversity which underpinthis goal are to conserve and, where practicable, to enhance:
• the overall populations and natural ranges of native species and the quality andrange of wildlife habitats and ecosystems;
• internationally important and threatened species, habitats and ecosystems;
• species, habitats and natural and managed ecosystems that are characteristic oflocal areas; and
• the biodiversity of natural and semi-natural habitats where this has beendiminished over recent decades.
A UK Biodiversity Steering Group was set up with the task of preparing a detailedprogramme of action in order to achieve the above objectives. Biodiversity: The UKSteering Group Report was published in December 1995 and included the followingkey components:
• Developing costed targets for our most threatened and declining species andhabitats.
• Establishing an effective system for handling the necessary biological data atboth local and national level.
• Promoting increased public awareness of the importance of biodiversity, andbroadening public involvement.
• Promoting Local Biodiversity Action Plans as a means of implementing thenational plan.
The selection of what are now called ‘priority’ species and habitats is an ongoingprocess and is based on a detailed appraisal of the current status of critical species andhabitats in the UK, together with the threats to their survival. Since the publication ofthe first group of costed action plans in 1995, which provided a way ahead for 116priority species and 14 habitats under the greatest threat, there have been six furthervolumes of action plans, covering a total of 391 species and 45 habitats. Note, however,that only a small fraction of these relate to freshwater invertebrates found in flowingwaters or to lotic habitats. For each priority species and habitat, quantifiable targets arebeing set, defining clear objectives for their conservation. Some examples related tofreshwater species may be found in Focus on Biodiversity. By monitoring futureprogress in achieving stated objectives, it will be possible to measure the successachieved for individual species and habitats.
The UK Steering Group recognised early on the need for and benefits to be gained byinvolving a broader range of organisations in the process. In fact, over the last fewyears, there has been a remarkable awakening of interest and concern over the future ofthe flora and fauna of the UK, and the Steering Group were able to build on theenthusiasm of a number of non-governmental organisations to participate in the process.

R&D TECHNCIAL REPORT E1-007/TR 102
As a result, individual action plans to safeguard species and habitats have frequentlyinvolved not only the participation of the statutory nature conservation agencies(English Nature, Countryside Council for Wales, Scottish Natural Heritage), togetherwith the Environment Agency, but also organisations such as the Royal Society for theProtection of Birds and the Wildlife Trusts partnership.
5.5 Current Outputs from RIVPACS Relevant to Biodiversity and/orSustainability
5.5.1 Background
From the previous sections, it is apparent that RIVPACS is relevant to the field ofsustainability, and more specifically to the topic of biodiversity. Hence, in this sectionwe will identify, in broad terms, how the current version of RIVPACS can contribute tothe UK’s responsibilities under the Convention on Biological Diversity (specificobjective 1).
Essentially, RIVPACS contributes to two separate, but interconnected, topics:
• the appraisal of site (or habitat) quality; and
• the appraisal of the component taxa (at species, family or BMWP family level).
From the broad perspective of sustainability the first topic (site quality) is relevant tothree headings included in the publication entitled 'An Environmental Vision: TheEnvironment Agency's contribution to Sustainable Development'. They are A betterquality of life, Wiser, sustainable use of natural resources and Improved and protectedinland and coastal waters. The second topic (appraisal of taxa) is relevant to Anenhanced environment for wildlife and Limiting and adapting to climate change.
The first objective of the UK Action Plan is ‘to conserve and where practicable, toenhance the overall populations and natural ranges of native species and the quality andrange of wildlife habitats and ecosystems’. Although the focus is on species, there is aclear understanding of the need to maintain high quality habitat for long-term survivalof the biota.
Further, in the consultation document produced by the Environment Agency in 1997entitled ‘Viewpoints on the Environment: developing a national environmentalmonitoring and assessment framework’, two of the six ‘viewpoints’ in the proposedframework for use in appraising the state of the environment are:
• the quality of the environment as determined by assessing compliance withexisting standards and targets; and
• the status of key biological communities and populations, and of biodiversity.
Thus, the current version of RIVPACS has a role to play in both of these areas ofinterest.
5.5.2 Appraisal of site quality

R&D TECHNCIAL REPORT E1-007/TR 103
It has been said that biological surveillance of communities, with special emphasis oncharacterising taxonomic richness and composition, is perhaps the most sensitive toolnow available for quickly and accurately detecting alterations in aquatic ecosystems(Cairns and Pratt, 1993). Different sites along the course of a single river and differenttypes of rivers all have their own characteristic macroinvertebrate assemblages andhence this must be taken into account when considering the fauna to be expected at apreviously unsampled site. RIVPACS has been developed to provide site-specificpredictions of both the expected taxon richness and composition for a site with statedenvironmental features for comparison with the observed taxon composition andrichness at that site (Wright, Sutcliffe and Furse 2000). The assessment can beundertaken for single seasons (spring, summer or autumn), paired seasons or threeseasons combined. Within the Environment Agency, routine assessments are normallyundertaken at BMWP family level, but family and species level are also available asoptions.
Appraisal of the biological quality of a site involves a comparison of the observed faunain relation to the expected fauna. This observed/expected ratio may be in the form of theobserved/expected number of taxa at the site, but in the case of BMWP family level, canalso be expressed in the form of biological indices, such as O/E N-TAXA (number ofBMWP taxa), O/E ASPT (Average Score Per Taxon) and O/E BMWP Score(Biological Monitoring Working Party Score).
O/E ratios (sometimes referred to as Ecological Quality Indices or EQIs) were first usedon a large scale by the National Rivers Authority (NRA) in the 1990 NationalBiological Survey. Later research by Clarke et al. (1994) recommended that O/E ratiosfor N-TAXA and ASPT provided the most meaningful information. Following on fromthis, regional biologists within the NRA met to consider how best to integrate the O/Eratios for these two indices and to define a series of quality grades for use in the 1995National biological General Quality Assessment (GQA) survey (Hemsley-Flint, 2000).Their final decision was to adopt six biological quality grades (a-f) ranging from verygood (a) to bad (f).
By the end of 1995 the IFE delivered the new RIVPACS III software and this formedthe basic framework for reporting the results of the 1995 National Biological survey.Then followed RIVPACS III+ (Clarke, 2000) which provided new procedures fordetecting statistically significant temporal and spatial changes. These new procedureswere applied to the data obtained during the 1995 and the previous 1990 survey in orderto make between-year comparisons. An ability to make such detailed comparisons overtime is critical if we are to detect a loss of biological quality due to pollutants/habitatchange or, alternatively, a gain in quality as a result of pollution control or habitatrestoration.
5.5.3 Appraisal of the taxa at species, family or BMWP family level
The term biodiversity is intended to include all the taxa within a community and is notrestricted to rare and threatened species. RIVPACS offers a prediction for each site of

R&D TECHNCIAL REPORT E1-007/TR 104
the expected taxon richness at the site and also the taxonomic composition at the levelof identification requested.Considering first taxonomic richness, the prediction can be made at species level (inwhich case it will draw on the 637 standardized taxa in the 614 site Great Britainreference dataset) but more frequently the Environment Agency uses BMWP familylevel data (based on the 82 BMWP families). The O/E N-TAXA ratio at BMWP familylevel provides information on whether macroinvertebrate biodiversity reachesexpectation for the site whose environmental features were used in the prediction. O/EN-TAXA ratios below unity may indicate loss of quality due to pollution or poor habitatquality, but ratios in excess of unity are also possible and indicate that site richnessexceeds expectation. The reasons for this would need to be assessed for each individualcase but might, for example, indicate the presence of a high quality site with diversehabitats and/or extra features (e.g. a tributary stream) which was capable of supportingadditional taxa.
In a recent study, Wright et al. (1998) used the 614 reference sites of the RIVPACS IIIdataset for Great Britain to compare macroinvertebrate site richness at three taxonomiclevels (standardised species level, family level and BMWP family level). The studydemonstrated very highly significant correlation coefficients between the number ofspecies and families (r = 0.890) and between the number of species and BMWP families(r = 0.854) based on this comprehensive dataset. This result is not unexpected, but it haspractical application in so far as BMWP family level data are available for a very widerange of sites in England and Wales as a result of the quinquennial GQA surveysundertaken by the Environment Agency. Sites shown to have high O/E N-TAXA atBMWP family level can be expected to be taxon rich at species level and hence theGQA survey results have broader relevance to the statutory conservation agencies inEngland and Wales with responsibilities for appraising the conservation value of riverreaches.
RIVPACS also predicts taxonomic composition by providing a listing of taxa at thechosen taxonomic level, with expected probabilities of occurrence for each taxon, basedon the standard sampling protocol. In other words, for any site with specifiedenvironmental features, the user is given the likelihood of capturing particular taxa aftera standard sampling effort, based on the assumption that the site of interest is notsubject to some form of stress. The taxa will include common, infrequent, andoccasionally rare and also threatened species within the UK, although the last twocategories will, inevitably, be listed very infrequently.
When considering the component taxa as opposed to site richness, species levelpredictions are more likely to be the focus of attention rather than family or BMWPfamily predictions. Whereas species predictions are offered with an attached probabilityof occurrence, the actual faunal listing for the site based on the standardized samplingperiod will record taxa as either present or absent. At a high quality site the expectationis that almost all taxa with a very high probability of capture will be present, thatroughly half the taxa listed with a probability of capture around 50% will be present andthat taxon occurrence will progressively tail off as predicted probability decreasesfurther.
If one particular species is of interest then its absence at a site, despite a high predictedprobability of occurrence, may imply that the site conditions are, or have recently been,

R&D TECHNCIAL REPORT E1-007/TR 105
unsuitable for that species. It is also possible to amalgamate the predicted probabilitiesof a number of taxa within one or more major taxonomic groups (e.g. Ephemeroptera,Plecoptera, Trichoptera etc.) and then compare the number of observed and expectedtaxa within each group (see Wright 1995). Knowledge of the susceptibilities of aparticular taxonomic group or groups to particular forms of stress may help to explainthe reason for under representation of one or more taxonomic groups at a site. As yet,little attention has been paid to interpretation of the significance of the absence ofparticular species at stressed sites. Instead, the concurrent use of O/E N-TAXA and O/EASPT based on BMWP level data has been used to document the impact of stress onrichness and composition.
5.6 Opportunities for Developments Within or Alongside RIVPACS
5.6.1 Introduction
RIVPACS has already progressed through three major versions and the last of these hasbeen subject to some important additional features. These developments will continueinto the future and are likely to include a user-friendly Windows version of the systemand further developments currently being explored in other packages of this contract. Infuture, the benefits of having RIVPACS accessible on the World Wide Web, withaccess operated via a password system, may also become compelling. This approachhas been adopted for AUSRIVAS, the Australian river assessment system (Simpson andNorris, 2000) which is based on the RIVPACS approach. This allows the Australianresearch group with responsibility for developing AUSRIVAS models for the differentStates and Territories in Australia to provide the latest updates and improvements withthe minimum of delay.
In view of the probability of so many new developments in the next few years, it issensible to consider which potential developments in the area of biodiversity are bestplaced within a future version of RIVPACS and which developments are best madealongside RIVPACS with easy access as and when required. Hence, Section 5.6.2 dealswith specific objective 2 while section 5.6.3 extends the scope of this objective. Oncethese aspects have been explored, specific objective 3, which relates to the separatequestion of BAP species within the RIVPACS III standardised species list, isconsidered in section 5.6.4.
5.6.2 Potential developments within RIVPACS
Site richness
At present, a high proportion of the predictions undertaken using RIVPACS are atBMWP family level. This is in line with the use of RIVPACS as a rapid and effectivemethod of assessing the biological quality of large numbers of sites, as undertaken inthe quinquennial GQA surveys. As a consequence, all the procedures for calculatingO/E ratios and for the subsequent grading of sites are centred around the use of BMWPfamily level data.
In future, as the need for information on the occurrence of individual species and siterichness increases as a consequence of the higher profile of biodiversity and related

R&D TECHNCIAL REPORT E1-007/TR 106
issues, there may be growing pressure within the Agency for identification at family orspecies level at selected sites. As a consequence there will be a future need to:
• automate the calculation of O/E ratios at both family and standardized specieslevel, in line with procedures currently available at BMWP family level
Site Composition
RIVPACS predictions offer a listing of the taxa expected at a given site with definedenvironmental features in the absence of major environmental stress. The sequence ofthe listing is from the taxon with the highest expected probability of occurrence to thelowest expected probability. Where biological data for the site and season(s) are alsoavailable, the printout can indicate (with an asterisk) which of the taxa on theprobability listing are actually present at the site.
Additional information could be added to the printout in order to increase theinformation content for individual taxa. In the context of biodiversity, the logicaltaxonomic level to use is the standardized species level. First, there is an opportunity toprovide a broad indication of whether individual taxa are common, frequent or rare inrunning waters within Great Britain as follows:
• append to the probability listing the frequency of occurrence of each speciesderived from the 637 species in the 614 site Great Britain reference dataset
In theory, frequency of occurrence data could also be provided at family and BMWPfamily level. However, this is less relevant to the issue of biodiversity and mostEnvironment Agency biologists will be familiar with the status of each family inrunning waters.
Another topic relevant to biodiversity is provision of information to identify threatenedspecies with Red Data Book (RDB) status and those relatively rare species with‘Nationally Scarce (NS) status’. (See section 5.4.1. for further details). It is apparentfrom Table 5.1 that although RDB and NS designations have been applied to a majorityof the major taxonomic groups to be found in freshwaters, the listings are by no meanscomplete. For taxa with no RDB and/or NS designations, frequency of occurrence datafor the 614 RIVPACS III sites is the only source relating to rarity.
It would be useful to add the RDB/NS designations to species level predictions in orderto alert biologists to the status of these species in the printout. If species in either ofthese categories were recorded at the site, this would provide a clear signal regardingthe conservation interest of the freshwater assemblage. Hence:
• identify within the probability listing any species with Red Data Bookstatus; and
• identify within the probability listing any species with Nationally Scarcestatus

R&D TECHNCIAL REPORT E1-007/TR 107
As noted in an earlier section, all Red Data Book and Nationally Scarce species whichoccurred at any of the 614 reference sites in the RIVPACS data-set for Great Britainhave been flagged in Wright et al.(1996). A first attempt at a listing of all freshwatermacroinvertebrates in the British Isles with Red Data Book status or Nationally Scarcestatus is offered in Appendix 1. It is important to recognise that the status of species willchange over time as new information is collated, and therefore this listing should not beseen as definitive. Note also that the original RDB system applies throughout thisAppendix. Refer to Foster (in press) to obtain the revised IUCN Red List categories foraquatic Coleoptera.
Table 5.1: Contribution of each major taxonomic group to the 637standardized taxa within the 614 GB reference sites in RIVPACS III.Groups for which Red Data Book (RDB) and Nationally Scarce (NS)designations have been made are shown, together with thesupporting reference. A 'YES' in parentheses indicates that specieshave been designated in that taxonomic group but none isrepresented in the RIVPACS III data-set.
Major Group No. taxa in 614site dataset
RDB speciesdesignated?
Reference NS speciesdesignated?
Reference
Tricladida 9 NO - NO -
Gastropoda 29 YES Bratton 1991 YES Ball 1986
Bivalvia 22 YES Bratton 1991 YES Ball 1986
Oligochaeta 51 NO - NO -
Hirudinea 14 (YES) Bratton 1991 NO -
Crustacea 11 (YES) Bratton 1991 (YES) Ball 1986
Ephemeroptera 37 YES Bratton 1990 YES Bratton 1990
Plecoptera 27 (YES) Bratton 1990 YES Bratton 1990
Odonata 13 (YES) NCC 1989 YES NCC 1989
Hemiptera 28 (YES) Kirby 1992 (YES) Kirby 1992
Coleoptera 104 YES Foster 1992* YES Foster 1992
Megaloptera 3 NO Kirby 1991 YES Kirby 1991
Neuroptera 2 NO Kirby 1991 (YES) Kirby 1991
Trichoptera 98 YES Wallace 1991 YES Wallace 1991
Diptera 182 SOME Falk 1991 SOME Falk 1991A further seven taxonomic groups were recorded, but not identified to species:Spongillidae; Hydridae; Chordodidae; Ectoprocta; Aeolosomatidae; Hydracarina;Lepidoptera
*A new publication (Foster, in press) which gives the revised IUCN Red List categoriesfor the aquatic Coleoptera will soon be available.
5.6.3 Potential developments alongside RIVPACS

R&D TECHNCIAL REPORT E1-007/TR 108
In theory, information relevant to biodiversity for the 637 running-water taxa present atthe 614 reference sites in RIVPACS III could be made available as hardcopy, on a CD-ROM or via the World Wide Web. If a future version of RIVPACS were to be madeavailable on the World Wide Web, then links to this ancillary information source wouldbecome even simpler. The two major sources of information are:
• dot maps to indicate the geographical distribution of standardized taxa presentat the 614 RIVPACS sites*; and
• information on the environmental ranges of the above species.* Information on taxa recorded at few sites may only warrant a descriptivestatement.
Detailed information on the distribution and environmental ranges of the British faunais valuable as a source of reference for current and future use by Environment Agencybiologists. It provides a baseline against which to assess new and unexpectedinformation. Over the last 25 years our knowledge in this field has increasedconsiderably and some changes in the geographical distribution of both native andinvading non-native species have been observed (Wright and Armitage, 2001). Thereare good reasons to anticipate further changes in the future (e.g. climate change) and areliable source of information which can be built upon with new data is essential forfuture documentation and understanding of the processes at work.
The format for presentation of these datasets would be a matter for discussion, but therewould be merit in keeping the distribution and environmental range data for a givenspecies together. In hard copy format, this might mean presenting the two datasets onadjacent sides of a page. All RDB and Nationally Scarce species could be flagged assuch and brief notes provided on additional points of interest. Suitable keys foridentification could also be listed.
There would also be potential for adding further distributional records acquired throughother projects and currently held on the CEH National Invertebrate Database.
There are, of course, a number of National Biological Recording schemes for freshwaterinvertebrates supported by the Biological Records Centre (list given in Table 13.1 ofWright and Armitage, 2001). These include taxa present in both still and runningwaters. The focus of attention for these schemes is the acquisition of comprehensivedata on species distribution and in a number of cases, distribution maps are alreadyavailable. Some excellent recent examples include an Atlas of Land and FreshwaterMolluscs of Britain and Ireland (Kerney, 1999), which represents almost 40 years ofrecording and an Atlas of the Dragonflies of Britain and Ireland (Merritt et al. 1996),also representing an enormous amount of effort by many volunteers with an interest inthis popular group of insects. The distributional data available from the RIVPACSreference sites cannot match these examples, but does provide distributional data formany groups and species not covered by BRC schemes, together with someenvironmental data.

R&D TECHNCIAL REPORT E1-007/TR 109
5.6.4 Information on Biodiversity Action Plan species within the RIVPACS IIIdataset
After the 1992 Earth Summit in Rio de Janeiro, the government published the UKBiodiversity Action Plan (DOE, 1994) followed by the UK Steering Group Report(DOE, 1995) which outlined a major programme for the conservation of biodiversity.The Steering Group Report included 'short' and 'middle' lists representing species whichare either globally threatened or are rapidly declining in the UK. At that time, actionplans had already been developed for the short list species and the intention was togenerate action plans for the middle list species in later years. The short list includedaction plans for 11 freshwater invertebrates, representing both still and running-waterspecies. Since then, a 'priority' listing has been drawn up (Table 5.2) which includes theshort list species plus another 14 additional freshwater invertebrates largely, but notexclusively, drawn from the original middle list. More recently, further freshwaterspecies have been added, including a freshwater bryozoan, beetles and true flies, all ofwhich are detailed in Focus on Biodiversity (Environment Agency, 2000). However, ofall the freshwater species with current action plans, only three have been confirmed inthe RIVPACS III dataset. They are the bivalve molluscs Margaritifera margaritifera (1site) and Pisidium tenuilineatum (2 sites) and the stonefly Brachyptera putata (10 sites).
Table 5.2: Freshwater Invertebrates on the ‘priority’ listing for Species ActionPlans. Species in bold were recorded in the 614 site RIVPACS IIIGB dataset. The frequency of occurrence of these species, asrecorded in Wright et al. (1996), is also given.
Major group Species Major Group SpeciesNemertea Prostoma jenningsi Plecoptera Brachyptera putata (10)Hirudinea Hirudo medicinalis* Odonata Coenagrion mercuriale*Gastropoda Anisus vorticulus* Hemiptera Hydrometra gracilenta
Catinella arenaria* Coleoptera Agabus brunneusMyxas glutinosa* Bidessus minutissimusSegmentina nitida* (1)# Bidessus unistriatusVertigo moulinsiana* Helophorus laticollis
Bivalvia Margaritifera margaritifera*(1) Hydrochara caraboidesPseudanodonta complanata* Hydroprus cantabricusPisidium tenuilineatum* (2) Hydroporus rufifrons
Crustacea Austropotamobius pallipes* Laccophilus poecilusTriops cancriformis Graphoderus zonatus
Paracymus aeneus
* Species on the ‘short’ list with Action Plans in the UK Steering Group Report(1995)
# More recent examination of this single specimen, which is now in poorcondition, has failed to provide conclusive corroboration of the earlieridentification and this must therefore be rejected.
Given the very restricted data available in RIVPACS for the two molluscs, it is apparentthat RIVPACS can offer very little information. Margaritifera margaritifera, thefreshwater pearl mussel, is a species of global conservation concern and the subject of a

R&D TECHNCIAL REPORT E1-007/TR 110
substantial body of detailed research into its biology and ecological requirements. TheEnvironment Agency and Scottish Natural Heritage are lead partners in the BAP.Pisidium tenuilineatum, the fine-lined pea mussel, is a small, little-known species, butrecent surveys sponsored by the Environment Agency are providing some encouraginginformation on its distribution and status (John Murray-Bligh, pers. comm).
The stonefly, Brachyptera putata, is endemic to the British mainland and is also aNationally Scarce species. Scottish Natural Heritage has prepared a dossier on thisspecies which indicates that within Scotland it occurs in just 13 Hectads. In Englandand Wales it is only known from the R. Wye in Herefordshire and the R. Usk in Gwent.All RIVPACS records refer to sites in Scotland and provide the bulk of the recentrecords. Hence, they form a very important source of information on this species. TheEnvironment Agency, whilst neither the contact point nor lead partner, does haveactions within the BAP.
5.7 Recommendations for Future Developments
A number of modifications to RIVPACS which may assist with the UK’sresponsibilities under the Convention on Biological Diversity (part of specific objective4) have been flagged in a previous section (5.6.2). In this concluding section, we areasked to recommend which of these should be implemented in a future version ofRIVPACS and how this may be achieved.
5.7.1 Some specific recommendations
In section 5.6.2, four items were flagged as potential developments within RIVPACS.The first related to site richness and was to:
• automate the calculation of O/E ratios at both family and standardized specieslevel, in line with procedures currently available at BMWP family level.
When calculating O/E ratios at BMWP family level, all BMWP families are included inthe calculation, even if the requested printout of family probabilities stops at 50%.
This practice should continue at family level. However, at standardized species level,where a full printout would be excessively long, there would be merit in having theoption of both printing and calculating O/E ratios down to, for example, the 50% and25% probability levels.
Current practice within the Environment Agency suggests a heavy reliance on BMWPfamily level predictions, and the corresponding O/E ratios. It appears that the familylevel, standardized species and customised level options are still largely unused byAgency staff. Therefore, a perceived need for O/E ratios at these taxonomic levels isrequired within the Agency before this development can be regarded as important.
Recommendation 1 Automation of O/E ratios at family and standardisedspecies level is a relatively low priority at present, but should be borne in mind as afuture option if biodiversity issues related to site richness assume a higher profile

R&D TECHNCIAL REPORT E1-007/TR 111
The remaining three items relate to site composition and involve the frequency ofoccurrence, threat status and rarity of the individual species:
• Append to the probability listing the frequency of occurrence of each speciesderived from the 637 species in the 614 site Great Britain dataset
• Identify within the probability listing any species with Red Data Book status
• Identify within the probability listing any species with Nationally Scarce status
These three items are best viewed as a single unit which may be requested (or not) whena standardised species level prediction is undertaken. The simplest form of presentationin a single line across the page would be:
probability of occurrence of the species, followed byname of species, thenfrequency of occurrence in the 614 site dataset, and finallyRed Data Book/Nationally Scarce status (if relevant)The frequency could be expressed as a percentage only or as a fraction and apercentage, as in the case of the oligochaete, Vejdovskyella comata 7 / 614 = 1.1%. Thissecond option has the advantage, particularly for the less frequent and rare lotic speciesfor which there are no RDB or Nationally Scarce designations, of providing more directinformation on the number of times the species has been recorded in the RIVPACSdataset.
It would be important to ensure, through adequate explanation within the manual, oreven by comment at the head of the printout, that no confusion was possible betweenthe percentage before the species name, representing the probability of occurrence ofthe species, and the percentage offered after the species name, representing thefrequency of occurrence in the RIVPACS dataset. Some examples, as they might appearin a printout are given below.
91.2%Baetis rhodani 550 / 614 = 89.6%51.3%Isoperla grammatica 391 / 614 = 63.7%3.7%Heptagenia fuscogrisea 6 / 614 = 1.0% N1.1%Pisidium tenuilineatum 2 / 614 = 0.3% RDB3
Recommendation 2 Incorporation of information on frequency ofoccurrence in the 614 site RIVPACS III dataset, together with information onthreat status and rarity is a relatively simple operation and should be implementedas a high priority, given the need for Agency biologists to be familiar with thestatus of a wide range of freshwater macroinvertebrates
5.7.2 Some wider considerations
The current RIVPACS R & D contract, which incorporates a total of ten separate workpackages, includes a number of scoping studies and other investigations, of which asmany as six may lead to further developments of RIVPACS in the future.

R&D TECHNCIAL REPORT E1-007/TR 112
They are:
• Scoping study on sampling procedures for deep river sites (Wright et al. 1999).This led to a new contract involving field trials in which three separate deepwater sampling techniques were examined and a marginal habitat technique wasdeveloped (Bass et al. 2000). This report proposed the future development ofnew RIVPACS modules for benthic and marginal samples taken at deep waterlocations;
• Development of new abundance indices (Clarke and Wright, 2000);
• Scoping study on the development of educational RIVPACS (separate packagein this report);
• Evaluation of the use of RIVPACS in the context of biodiversity andsustainability (this package);
• New environmental variables for RIVPACS (in progress); and
• Dynamic RIVPACS (in progress).
A two-year contract funded by the Environment and Heritage Service, Northern Ireland,is underway to enlarge the present Northern Ireland RIVPACS III module from 70 to110 sites by spring 2002. In addition, a further two-year project, funded by the ScottishEnvironment Protection Agency, to develop two new RIVPACS modules for theHighlands of Scotland and the Western and Northern Isles has just commenced. Theconcept of developing a headwater stream module of RIVPACS has also been raised(Furse, 2000).
Separate from the above RIVPACS contracts, but of relevance to the current discussion,is research currently underway at CEH Dorset on the LIFE (Lotic-invertebrate Index forFlow Evaluation) system recently developed by Extence et al. (1999). Methods havebeen derived for making RIVPACS predictions of the expected LIFE scores based onfamily data with abundances (i.e. LIFE F). CEH are assessing the potential of using theO/E ratio of observed to expected LIFE scores as an indicator of flow-related stresses(Clarke et al. 2001). The Agency are also proposing to use both expected LIFE scoreand LIFE O/E ratios as part of an Environmental Weighting system in the RiverAssessment Methodology (RAM) Framework of the Surface Water AbstractionLicensing Policy (SWALP) for use within the Catchment Abstraction ManagementStrategy (CAMS).
Thus, with so many actual and potential developments for the future, it is crucial that astrategic view is taken at an early stage, in consultation with the Environment Agency,to ensure that all developments are undertaken in a logical and efficient sequence. Aspreviously stated in this package, our view is that a Windows version of RIVPACS isnow essential before major changes are made to the existing software. The cost ofdeveloping a Windows version of RIVPACS with the same functionality as the currentDOS version, but including many of the outputs as Excel files, is estimated to be in theregion of £40K.
R&D TECHNCIAL REPORT E1-007/TR 113
5.8 References
Ball S G, 1986. Terrestrial and freshwater invertebrates with Red Data Book, Notableor Habitat Indicator status. Invertebrate Site Register Report Number 66. NatureConservancy Council, Peterborough.
Bass J A B, Wright J F, Clarke R T, Gunn R J M and Davy-Bowker J, 2000. Anassessment of sampling methods for macroinvertebrates (RIVPACS) in deepwatercourses. Report to the Environment Agency. R&D Technical Report E134.
Bratton J H (Ed.), 1991. ‘British Red Data Books: 3. Invertebrates other than Insects’,Joint Nature Conservation Committee, Peterborough.
Bratton J H, 1990. ‘A review of the scarcer Ephemeroptera and Plecoptera of GreatBritain’ Research and Survey in Nature Conservation, No. 29, Nature ConservancyCouncil, Peterborough.
Cairns J and Pratt J R, 1993. A history of biological monitoring using benthicmacroinvertebrates. In: Freshwater Biomonitoring and Benthic Macroinvertebrates(Eds. D M Rosenberg and V H Resh) pp. 10-27. Chapman and Hall, New York.
Clarke R T, Furse M T and Wright J F, 1994. Testing and further development ofRIVPACS. Phase II: Aspects of Robustness. IFE Interim report (R & D 243/7/Y) to theNational Rivers Authority, Bristol.
Clarke R T, 2000. Uncertainty in estimates of biological quality based on RIVPACS. In:Assessing the biological quality of freshwaters: RIVPACS and other techniques. Editedby Wright J F, Sutcliffe D W and Furse M T, pages 39-54, Freshwater BiologicalAssociation, Ambleside.
Clarke R T and Wright J F, 2000. Testing and Further development of RIVPACS. Phase3. Development of new RIVPACS methodologies. Stage 2. Development of the use ofabundance data for biological quality assessment: Testing and assessment of newabundance-based indices. Report to the Environment Agency. R&D Technical ReportE124.
Clarke R T, Armitage P D, Davy-Bowker J and Hornby D D, 2001. Investigation of therelationship between the LIFE index and RIVPACS. Environment Agency R&DProgress report for the period 1st November 2000 - 31st January 2001.
Department of the Environment, 1994. Biodiversity. The UK Action Plan. London,HMSO.
Department of the Environment, 1995. Biodiversity: The UK Steering Group Report.London, HMSO.
Environment Agency, 1997. Viewpoints on the environment. Developing a nationalenvironmental monitoring and assessment framework. The Environment Agency,Bristol.
R&D TECHNCIAL REPORT E1-007/TR 114
Environment Agency, 2000. Focus on biodiversity. The Environment Agency'scontribution to wildlife conservation. The Environment Agency, Bristol.
Environment Agency, 2001. An Environmental Vision. The Environment Agency'scontribution to sustainable development. Environment Agency, Bristol.
Extence C A, Balbi D M and Chadd R P, 1999. River flow indexing using Britishbenthic macroinvertebrates: a framework for setting hydroecological objectives.Regulated Rivers: Research & Management, 15, 543-574.
Falk S J, 1991. A review of the scarce and threatened flies of Great Britain. Part 1.Research and Survey in Nature Conservation, No. 39, Joint Nature ConservationCommittee, Peterborough.
Foster G N, 1992. British beetle conservation categories. Balfour-Browne ClubNewsletter, 50, 23-25.
Foster G N, in press. A review of the scarce and threatened Coleoptera of Great Britain.Part 3. Aquatic Coleoptera. Species Status No.1. Peterborough, Joint NatureConservation Committee.
Furse M T, 2000. The application of RIVPACS procedures in headwater streams - anextensive and important national resource. In: Assessing the biological quality offreshwaters: RIVPACS and other techniques. Edited by Wright J F, Sutcliffe, D W andFurse M T, pages 79-91, Freshwater Biological Association, Ambleside.
Hemsley-Flint B, 2000. Classification of the biological quality of rivers in England andWales. In: Assessing the biological quality of freshwaters: RIVPACS and othertechniques. Edited by Wright, J F, Sutcliffe, D W and Furse, M T, pages 55-69,Freshwater Biological Association, Ambleside.
IUCN, 1994. IUCN Red List Categories. Prepared by the IUCN Species SurvivalCommission. As approved by the 40th Meeting of the IUCN Council, Gland,Switzerland, The World Conservation Union, Gland.
Kerney M P, 1999. Atlas of Land and Freshwater Molluscs of Britain and Ireland,Harley Books, Colchester.
Kirby P, 1991. A review of the scarcer Neuroptera of Great Britain. Research andSurvey in Nature Conservation, No. 34. Nature Conservancy Council, Peterborough.
Kirby P, 1992. A review of the scarce and threatened Hemiptera of Great Britain. UKNature Conservation, No. 2. Joint Nature Conservation Committee, Peterborough.
Maitland P S, 1977. A Coded Checklist of Animals occurring in Fresh Water in theBritish Isles. Edinburgh, Institute of Terrestrial Ecology.
Merritt R, Moore N M and Eversham B C, 1996. Atlas of the dragonflies of Britain andIreland. Natural Environment Research Council. London, HMSO.

R&D TECHNCIAL REPORT E1-007/TR 115
Norse E A, Rosenbaum K L, Wilcove D S, Wilcox B A, Romme W H, Johnston D Wand Stout M L, 1986. Conserving biological diversity in our national forests.Washington, D C: The Wilderness Society.
NCC, 1989. Guidelines for the selection of Biological SSSIs, Nature ConservancyCouncil, Peterborough.
Shirt D B, 1987. British Red Data Books. 2. Insects. Nature Conservancy Council,Peterborough.
Simpson J C and Norris R H, 2000. Biological assessment of river quality:developmentof AUSRIVAS models and outputs. In: Assessing the biological quality of freshwaters:RIVPACS and other techniques. Edited by Wright, J F, Sutcliffe, D W and Furse, M T,pages 125-42, Freshwater Biological Association, Ambleside.
Tansley A G, 1935. The use and abuse of vegetational concepts and terms. Ecology, 16,284-307.
Wallace I D, 1991. A review of the Trichoptera of Great Britain. Research and Surveyin Nature Conservation, No. 32, Nature Conservancy Council, Peterborough.
Wright J F, 1995. Development and use of a system for predicting macroinvertebrates inflowing waters. Australian Journal of Ecology, 20, 181-197.
Wright J F, Blackburn J H, Gunn R J M, Furse M T, Armitage P D, Winder J M andSymes K L, 1996. Macroinvertebrate frequency data for the RIVPACS III sites in GreatBritain and their use in conservation evaluation. Aquatic Conservation: Marine andfreshwater ecosystems, 6, 141-167.
Wright J F, Moss D and Furse M T, 1998. Macroinvertebrate Richness at Running-Water Sites in Great Britain: A Comparison of Species and Family Richness. Verh IntVer Limnol; 26. 1174-1178.
Wright J F, Clarke R T, Gunn R J M, Blackburn J H and Davy-Bowker J, 1999. Testingand Further Development of RIVPACS -Phase 3. Development of new RIVPACSmethodologies. Stage 1. Report to the Environment Agency. R & D Technical ReportE71.Wright J F, Sutcliffe D W, Furse M T, 2000, (Editors). Assessing the biological qualityof freshwaters: RIVPACS and other techniques. Freshwater Biological Association,Ambleside, 373pp.
Wright J F, Gunn R J M, Blackburn J H, Grieve N J, Winder J M and Davy-Bowker J,2000. Macroinvertebrate frequency data for the RIVPACS III sites in Northern Irelandand some comparisons with the equivalent data for Great Britain. Aquatic ConservationMarine and Freshwater Ecosystems. 10, 371-389.
Wright J F and Armitage P D, 2001. Freshwater Invertebrates In: The ChangingWildlife of Great Britain and Ireland. Edited by D. L. Hawksworth. Taylor and FrancisGroup. pp.188-209.

R&D TECHNCIAL REPORT E1-007/TR A-1
APPENDIX 1
PROVISIONAL LISTING OF MACROINVERTEBRATES IN THEBRITISH ISLES WITH RED DATA BOOK OR NATIONALLYSCARCE STATUS
Notes:
1. This list should not be regarded as definitive, but simply as a working documentfor updating as appropriate - the status of some species may have changed since it wascompiled.
2. The original RDB system applies; as yet the new categories for aquaticColeoptera (Foster, in press) have not been applied
Species Name National Status Species CodeNemerteaProstoma jenningsi Gibson & Young Red Data Book K 08110102
EctoproctaLophopus crystallinus Pallas Red Data Book 3 14130101Victorella pavida Saville Kent Red Data Book K 14220101
GastropodaValvata macrostoma Morch Red Data Book 2 16130102Pseudamnicola confusa Frauenfeld Red Data Book 1 16140201Marstoniopsis scholtzi Schmidt Red Data Book 3 16140401Assiminea grayana Fleming Nationally Scarce B 16170101Lymnaea glabra Muller Red Data Book 2 16220102Myxas glutinosa Muller Red Data Book 1 16220201Anisus vorticulus Troschel Red Data Book 2 16230203Gyraulus acronicus Ferussac Red Data Book 2 16230401Gyraulus laevis Alder Nationally Scarce B 16230403Segmentina nitida Muller Red Data Book 1 16230701Catinella arenaria Bouchard-Chantereaux Red Data Book 1 16320101Oxyloma sarsi Esmark Red Data Book 2 16320302Vertigo angustior Jeffreys Red Data Book 1 16330201Vertigo geyeri Lindholm Red Data Book 1 16330203Vertigo lilljeborgi Westerlund Red Data Book 3 16330204Vertigo moulinsiana Dupuy Red Data Book 3 16330205
BivalviaMargaritifera margaritifera L. Nationally Scarce B 17110101Pseudanodonta complanata Rossmassler Nationally Scarce B 17120301

R&D TECHNCIAL REPORT E1-007/TR A-2
Species Name National Status Species CodeSphaerium solidum Normand Red Data Book 1 17130104Pisidium conventus Clessin Nationally Scarce A 17130203Pisidium moitessierianum Paladilhe Nationally Scarce B 17130208Pisidium pseudosphaerium Schlesch Red Data Book 3 17130213Pisidium pulchellum Jenyns Nationally Scarce B 17130214Pisidium supinum Schmidt Nationally Scarce B 17130216Pisidium tenuilineatum Stelfox Red Data Book 3 17130217
HirudineaHirudo medicinalis L. Red Data Book 3 22210201
AnostracaArtemia salina L. Red Data Book 0 27010101Chirocephalus diaphanus Prevost Red Data Book 2 27020101Triops cancriformis L. Red Data Book 1 28010101
MysidaceaMysis relicta Loven Red Data Book 1 35110101
AmphipodaCorophium lacustre Vanhoffen Red Data Book 3 37110103Niphargellus glenniei Spooner Red Data Book K 37150101
EphemeropteraHeptagenia fuscogrisea Retzius Nationally Scarce 40130201Heptagenia longicauda Stephens Red Data Book 1 40130203Paraleptophlebia werneri Ulmer Red Data Book 3 40210203Potamanthus luteus L. Red Data Book 2 40310101Ephemera lineata Eaton Red Data Book 2 40320102
PlecopteraTaeniopteryx nebulosa L. Red Data Book 5 41110101Rhabdiopteryx acuminata Klapalek Nationally Scarce 41110201Brachyptera putata Newman Red Data Book 5 41110301Nemoura dubitans Morton Nationally Scarce 41120404Capnia vidua Klapalek Red Data Book 5 41140103Isogenus nubecula Newman Red Data Book 2 41210101Isoperla obscura Zetterstedt Red Data Book 0 41210402
OdonataIschnura pumilio Charpentier Nationally Scarce 42120202Coenagrion hastulatum Charpentier Red Data Book 2 42120402
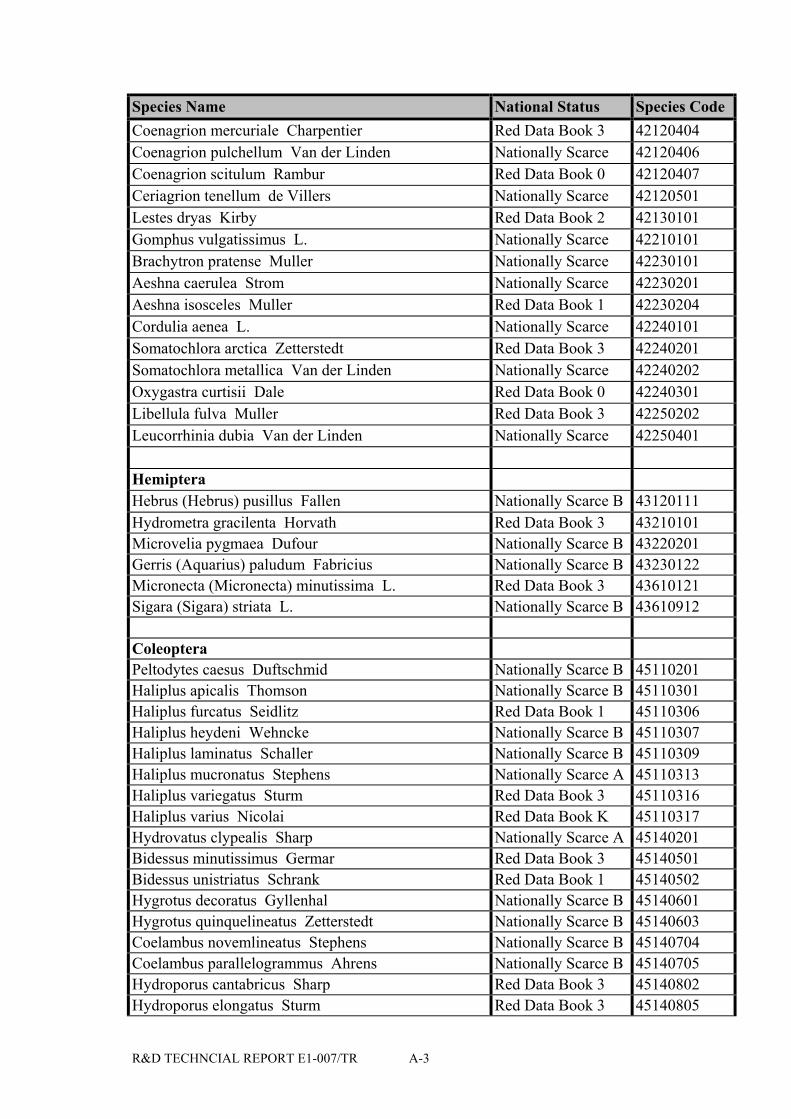
R&D TECHNCIAL REPORT E1-007/TR A-3
Species Name National Status Species CodeCoenagrion mercuriale Charpentier Red Data Book 3 42120404Coenagrion pulchellum Van der Linden Nationally Scarce 42120406Coenagrion scitulum Rambur Red Data Book 0 42120407Ceriagrion tenellum de Villers Nationally Scarce 42120501Lestes dryas Kirby Red Data Book 2 42130101Gomphus vulgatissimus L. Nationally Scarce 42210101Brachytron pratense Muller Nationally Scarce 42230101Aeshna caerulea Strom Nationally Scarce 42230201Aeshna isosceles Muller Red Data Book 1 42230204Cordulia aenea L. Nationally Scarce 42240101Somatochlora arctica Zetterstedt Red Data Book 3 42240201Somatochlora metallica Van der Linden Nationally Scarce 42240202Oxygastra curtisii Dale Red Data Book 0 42240301Libellula fulva Muller Red Data Book 3 42250202Leucorrhinia dubia Van der Linden Nationally Scarce 42250401
HemipteraHebrus (Hebrus) pusillus Fallen Nationally Scarce B 43120111Hydrometra gracilenta Horvath Red Data Book 3 43210101Microvelia pygmaea Dufour Nationally Scarce B 43220201Gerris (Aquarius) paludum Fabricius Nationally Scarce B 43230122Micronecta (Micronecta) minutissima L. Red Data Book 3 43610121Sigara (Sigara) striata L. Nationally Scarce B 43610912
ColeopteraPeltodytes caesus Duftschmid Nationally Scarce B 45110201Haliplus apicalis Thomson Nationally Scarce B 45110301Haliplus furcatus Seidlitz Red Data Book 1 45110306Haliplus heydeni Wehncke Nationally Scarce B 45110307Haliplus laminatus Schaller Nationally Scarce B 45110309Haliplus mucronatus Stephens Nationally Scarce A 45110313Haliplus variegatus Sturm Red Data Book 3 45110316Haliplus varius Nicolai Red Data Book K 45110317Hydrovatus clypealis Sharp Nationally Scarce A 45140201Bidessus minutissimus Germar Red Data Book 3 45140501Bidessus unistriatus Schrank Red Data Book 1 45140502Hygrotus decoratus Gyllenhal Nationally Scarce B 45140601Hygrotus quinquelineatus Zetterstedt Nationally Scarce B 45140603Coelambus novemlineatus Stephens Nationally Scarce B 45140704Coelambus parallelogrammus Ahrens Nationally Scarce B 45140705Hydroporus cantabricus Sharp Red Data Book 3 45140802Hydroporus elongatus Sturm Red Data Book 3 45140805
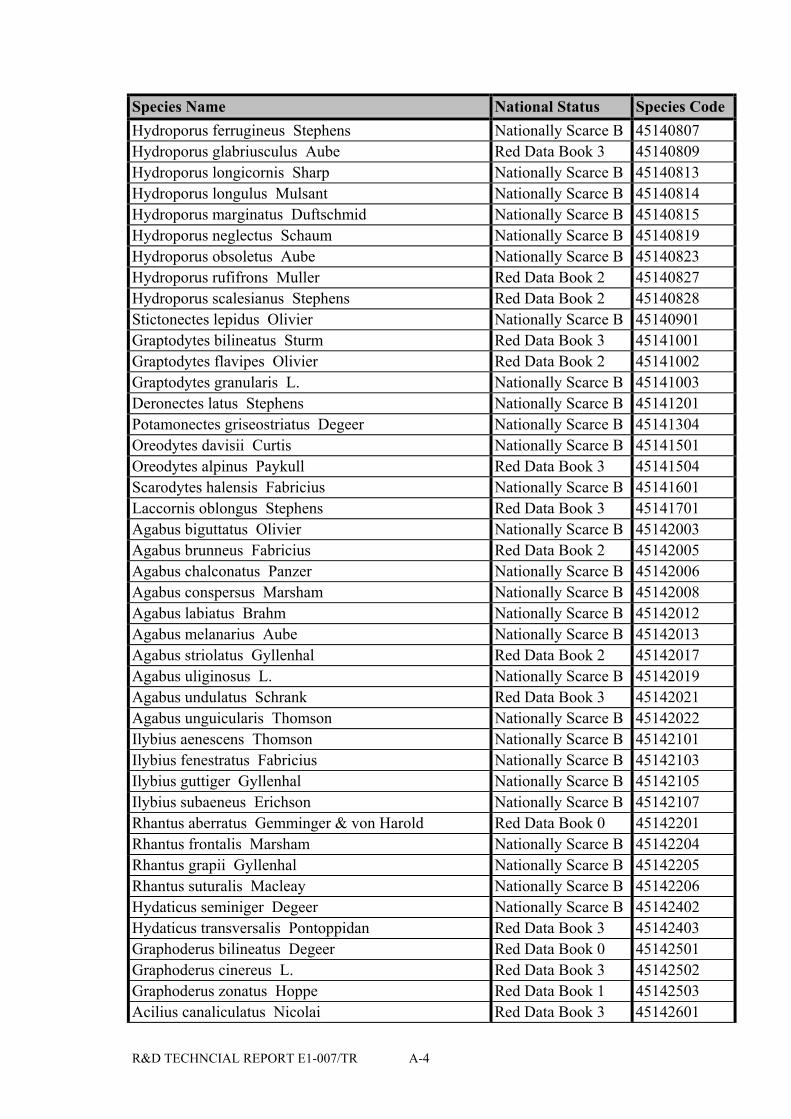
R&D TECHNCIAL REPORT E1-007/TR A-4
Species Name National Status Species CodeHydroporus ferrugineus Stephens Nationally Scarce B 45140807Hydroporus glabriusculus Aube Red Data Book 3 45140809Hydroporus longicornis Sharp Nationally Scarce B 45140813Hydroporus longulus Mulsant Nationally Scarce B 45140814Hydroporus marginatus Duftschmid Nationally Scarce B 45140815Hydroporus neglectus Schaum Nationally Scarce B 45140819Hydroporus obsoletus Aube Nationally Scarce B 45140823Hydroporus rufifrons Muller Red Data Book 2 45140827Hydroporus scalesianus Stephens Red Data Book 2 45140828Stictonectes lepidus Olivier Nationally Scarce B 45140901Graptodytes bilineatus Sturm Red Data Book 3 45141001Graptodytes flavipes Olivier Red Data Book 2 45141002Graptodytes granularis L. Nationally Scarce B 45141003Deronectes latus Stephens Nationally Scarce B 45141201Potamonectes griseostriatus Degeer Nationally Scarce B 45141304Oreodytes davisii Curtis Nationally Scarce B 45141501Oreodytes alpinus Paykull Red Data Book 3 45141504Scarodytes halensis Fabricius Nationally Scarce B 45141601Laccornis oblongus Stephens Red Data Book 3 45141701Agabus biguttatus Olivier Nationally Scarce B 45142003Agabus brunneus Fabricius Red Data Book 2 45142005Agabus chalconatus Panzer Nationally Scarce B 45142006Agabus conspersus Marsham Nationally Scarce B 45142008Agabus labiatus Brahm Nationally Scarce B 45142012Agabus melanarius Aube Nationally Scarce B 45142013Agabus striolatus Gyllenhal Red Data Book 2 45142017Agabus uliginosus L. Nationally Scarce B 45142019Agabus undulatus Schrank Red Data Book 3 45142021Agabus unguicularis Thomson Nationally Scarce B 45142022Ilybius aenescens Thomson Nationally Scarce B 45142101Ilybius fenestratus Fabricius Nationally Scarce B 45142103Ilybius guttiger Gyllenhal Nationally Scarce B 45142105Ilybius subaeneus Erichson Nationally Scarce B 45142107Rhantus aberratus Gemminger & von Harold Red Data Book 0 45142201Rhantus frontalis Marsham Nationally Scarce B 45142204Rhantus grapii Gyllenhal Nationally Scarce B 45142205Rhantus suturalis Macleay Nationally Scarce B 45142206Hydaticus seminiger Degeer Nationally Scarce B 45142402Hydaticus transversalis Pontoppidan Red Data Book 3 45142403Graphoderus bilineatus Degeer Red Data Book 0 45142501Graphoderus cinereus L. Red Data Book 3 45142502Graphoderus zonatus Hoppe Red Data Book 1 45142503Acilius canaliculatus Nicolai Red Data Book 3 45142601

R&D TECHNCIAL REPORT E1-007/TR A-5
Species Name National Status Species CodeDytiscus circumcinctus Ahrens Nationally Scarce A 45142701Dytiscus circumflexus Fabricius Nationally Scarce B 45142702Dytiscus dimidiatus Bergstraesser Red Data Book 3 45142703Dytiscus lapponicus Gyllenhal Nationally Scarce B 45142704Gyrinus aeratus Stephens Nationally Scarce B 45150201Gyrinus distinctus Aube Red Data Book 3 45150204Gyrinus minutus Fabricius Nationally Scarce B 45150206Gyrinus natator L. Red Data Book 0 45150207Gyrinus opacus Sahlberg Nationally Scarce A 45150208Gyrinus suffriani Scriba Red Data Book 3 45150211Gyrinus urinator Illiger Nationally Scarce B 45150212Spercheus emarginatus Schaller Red Data Book 1 45310101Hydrochus angustatus Germar Nationally Scarce B 45310201Hydrochus brevis Herbst Red Data Book 3 45310202Hydrochus carinatus Germar Red Data Book 3 45310203Hydrochus elongatus Schaller Red Data Book 3 45310204Hydrochus ignicollis Motschulsky Red Data Book 3 45310205Hydrochus nitidicollis Mulsant Red Data Book 3 45310206Helophorus (Cyphelophorus) tuberculatus Gyllenhal Red Data Book 3 45310321Helophorus (Trichelophorus) alternans Gene Nationally Scarce A 45310331Helophorus (Atracthelophorus) arvernicus Mulsant Nationally Scarce B 45310351Helophorus (Helophorus) dorsalis Marsham Nationally Scarce B 45310361Helophorus (Helophorus) fulgidicollis Motschulsky Nationally Scarce B 45310363Helophorus (Helophorus) griseus Herbst Nationally Scarce B 45310365Helophorus (Helophorus) laticollis Thomson Red Data Book 2 45310366Helophorus (Helophorus) longitarsis Wollaston Red Data Book 3 45310367Helophorus (Helophorus) nanus Sturm Nationally Scarce B 45310369Helophorus (Helophorus) strigifrons Thomson Nationally Scarce B 45310372Paracymus aeneus Germar Red Data Book 1 45311001Paracymus scutellaris Rosenhauer Nationally Scarce B 45311002Limnoxenus niger Zschach Nationally Scarce B 45311201Anacaena bipustulata Marsham Nationally Scarce B 45311301Laccobius (Macrolaccobius) atratus Rottenburg Nationally Scarce B 45311421Laccobius (Macrolaccobius) atrocephalus Reitter Nationally Scarce B 45311422Laccobius (Macrolaccobius) sinuatus Motschulsky Nationally Scarce B 45311426Helochares lividus Forster Nationally Scarce B 45311601Helochares obscurus Muller Red Data Book 3 45311602Helochares punctatus Sharp Nationally Scarce B 45311603Enochrus affinis Thunberg Nationally Scarce B 45311701Enochrus bicolor Fabricius Nationally Scarce B 45311702Enochrus isotae Hebauer Red Data Book 3 45311704Enochrus melanocephalus Olivier Nationally Scarce B 45311705Enochrus ochropterus Marsham Nationally Scarce B 45311706

R&D TECHNCIAL REPORT E1-007/TR A-6
Species Name National Status Species CodeEnochrus quadripunctatus Herbst Nationally Scarce B 45311707Chaetarthria seminulum Herbst Nationally Scarce B 45312101Hydrochara caraboides L. Red Data Book 1 45312201Hydrophilus piceus L. Red Data Book 3 45312301Berosus affinis Brulle Nationally Scarce B 45312401Berosus luridus L. Nationally Scarce B 45312402Berosus signaticollis Charpentier Nationally Scarce B 45312403Ochthebius aeneus Stephens Red Data Book 0 45410101Ochthebius auriculatus Rey Nationally Scarce B 45410102Ochthebius bicolon Germar Nationally Scarce B 45410103Ochthebius exaratus Mulsant Red Data Book 3 45410105Ochthebius exsculptus Germar Nationally Scarce B 45410106Ochthebius lenensis Poppius Red Data Book 2 45410107Ochthebius marinus Paykull Nationally Scarce B 45410108Ochthebius nanus Stephens Nationally Scarce B 45410111Ochthebius poweri Rye Red Data Book 3 45410112Ochthebius punctatus Stephens Nationally Scarce B 45410113Ochthebius pusillus Stephens Red Data Book 3 45410114Ochthebius viridis Peyron Nationally Scarce B 45410116Hydraena minutissima Stephens Nationally Scarce B 45410203Hydraena nigrita Germar Nationally Scarce B 45410204Hydraena palustris Erichson Red Data Book 2 45410205Hydraena pulchella Germar Red Data Book 3 45410206Hydraena pygmaea Waterhouse Red Data Book 3 45410207Hydraena rufipes Curtis Nationally Scarce B 45410209Hydraena testacea Curtis Nationally Scarce B 45410211Limnebius aluta Bedel Red Data Book 3 45410301Limnebius crinifer Rey Red Data Book I 45410302Limnebius nitidus Marsham Nationally Scarce B 45410303Limnebius papposus Mulsant Nationally Scarce B 45410304Eubria palustris Germar Red Data Book 3 45610101Dryops anglicanus Edwards Red Data Book 3 45620201Dryops auriculatus Fourcroy Nationally Scarce B 45620202Dryops griseus Erichson Red Data Book 3 45620204Dryops nitidulus Heer Red Data Book 3 45620206Dryops striatellus Fairmaire & Brisout Red Data Book 3 45620207Macronychus quadrituberculatus Muller Red Data Book 3 45630401Normandia nitens Muller Red Data Book 2 45630501Oulimnius major Rey Nationally Scarce A 45630601Oulimnius rivularis Rosenhauer Nationally Scarce A 45630602Oulimnius troglodytes Gyllenhal Nationally Scarce B 45630603Riolus cupreus Muller Nationally Scarce B 45630701Riolus subviolaceus Muller Nationally Scarce B 45630702

R&D TECHNCIAL REPORT E1-007/TR A-7
Species Name National Status Species CodeStenelmis canaliculata Gyllenhal Red Data Book 2 45630801Macroplea appendiculata Panzer Red Data Book 3 45710101Macroplea mutica Fabricius Nationally Scarce A 45710102Donacia aquatica L. Red Data Book 3 45710201Donacia bicolora Zschach Red Data Book 2 45710202Donacia cinerea Herbst Nationally Scarce B 45710203Donacia clavipes Fabricius Nationally Scarce B 45710204Donacia crassipes Fabricius Nationally Scarce B 45710205Donacia dentata Hoppe Nationally Scarce A 45710206Donacia impressa Paykull Nationally Scarce A 45710207Donacia obscura Gyllenhal Nationally Scarce A 45710209Donacia sparganii Ahrens Nationally Scarce A 45710213Donacia thalassina Germar Nationally Scarce B 45710214Plateumaris affinis Kunze Nationally Scarce B 45710301Plateumaris braccata Scopoli Nationally Scarce A 45710302Bagous argillaceus Gyllenhal Red Data Book 2 45810601Bagous binodulus Herbst Red Data Book 0 45810602Bagous cylindrus Paykull Red Data Book 2 45810603Bagous glabrirostris Herbst Nationally Scarce B 45810604Bagous lutulentus Gyllenhal Nationally Scarce B 45810605Bagous petro Herbst Red Data Book 0 45810607Hydronomus alismatis Marsham Nationally Scarce B 45810701Eubrychius velutus Beck Nationally Scarce B 45811301Litodactylus leucogaster Marsham Nationally Scarce B 45811401Phytobius waltoni Boheman Nationally Scarce B 45811601Drupenatus nasturtii Germar Nationally Scarce B 45811801Tapinotus sellatus Fabricius Nationally Scarce A 45811901
MegalopteraSialis nigripes Pictet Nationally Scarce B 46110103
NeuropteraSisyra dalii Mclachlan Nationally Scarce B 47120101Sisyra terminalis Curtis Nationally Scarce B 47120103
TrichopteraRhyacophila septentrionis Mclachlan Nationally Scarce 48110104Glossosoma intermedium Klapalek Red Data Book 3 48120103Hydroptila cornuta Mosely Nationally Scarce 48130302Hydroptila lotensis Mosely Red Data Book 2 48130304Hydroptila sylvestris Morton Red Data Book K 48130311Hydroptila tigurina Ris Red Data Book K 48130312

R&D TECHNCIAL REPORT E1-007/TR A-8
Species Name National Status Species CodeHydroptila valesiaca Schmid Nationally Scarce 48130314Oxyethira mirabilis Morton Red Data Book K 48130405Oxyethira tristella Klapalek Red Data Book K 48130408Tricholeiochiton fagesii Guinard Nationally Scarce 48130501Ithytrichia clavata Morton Red Data Book 3 48130601Orthotrichia tragetti Mosely Red Data Book 0 48130703Metalype fragilis Pictet Nationally Scarce 48220201Tinodes dives Pictet Nationally Scarce 48220402Tinodes pallidulus Mclachlan Red Data Book 1 48220405Tinodes rostocki Mclachlan Nationally Scarce 48220406Tinodes unicolor Pictet Nationally Scarce 48220407Cyrnus insolutus Mclachlan Red Data Book K 48240102Plectrocnemia brevis Mclachlan Nationally Scarce 48240401Hydropsyche bulgaromanorum Malicky Red Data Book 0 48250202Hydropsyche exocellata Dufour Red Data Book 0 48250204Hydropsyche fulvipes Curtis Nationally Scarce 48250205Hydropsyche saxonica Mclachlan Red Data Book 1 48250208Agrypnia crassicornis Mclachlan Red Data Book 1 48310101Agrypnia picta Kolenati Red Data Book K 48310104Hagenella clathrata Kolenati Red Data Book 1 48310301Ironoquia dubia Stephens Red Data Book 2 48340101Mesophylax aspersus Rambur Red Data Book K 48340901Grammotaulius nitidus Muller Red Data Book 1 48341602Limnephilus borealis Zetterstedt Nationally Scarce 48341705Limnephilus pati O'Connor Red Data Book 1 48341724Limnephilus subcentralis Brauer Nationally Scarce 48341729Limnephilus tauricus Schmid Red Data Book 1 48341731Nemotaulius punctatolineatus Retzius Red Data Book 2 48341801Phacopteryx brevipennis Curtis Nationally Scarce 48341901Ernodes articularis Pictet Nationally Scarce 48360301Ceraclea senilis Burmeister Nationally Scarce 48410206Leptocerus interruptus Fabricius Red Data Book 3 48410301Leptocerus lusitanicus Mclachlan Red Data Book 2 48410302Adicella filicornis Pictet Red Data Book 3 48410501Erotesis sp. Red Data Book 2 48410600Ylodes conspersus Rambur Nationally Scarce 48410801Ylodes reuteri Mclachlan Red Data Book 2 48410802Ylodes simulans Tjeder Red Data Book 3 48410803Oecetis notata Rambur Red Data Book 3 48410903Setodes argentipunctellus Mclachlan Red Data Book 3 48411001Setodes punctatus Fabricius Red Data Book 2 48411002
Diptera

R&D TECHNCIAL REPORT E1-007/TR A-9
Species Name National Status Species CodePrionocera pubescens Loew Red Data Book 2 50110101Prionocera subserricornis Zetterstedt Red Data Book 2 50110102Tipula (Savtshenkia) cheethami Edwards Nationally Scarce 50110332Tipula (Savtshenkia) gimmerthali Lackschewitz Red Data Book 3 50110333Tipula (Savtshenkia) grisescens Zetterstedt Red Data Book 3 50110334Tipula (Savtshenkia) limbata Zetterstedt Red Data Book 3 50110335Tipula (Lindnerina) bistilata Lindstroem Red Data Book 2 50110381Tipula (Yamatotipula) coerulescens Lackschewitz Red Data Book 3 50110411Tipula (Yamatotipula) marginata Meigen Red Data Book 3 50110414Nephrotoma crocata L. Red Data Book 3 50110502Triogma trisulcata Schummel Red Data Book 3 50120101Phalacrocera replicata L. Nationally Scarce 50120201Limonia (Dicranomyia) aperta Wahlgren Red Data Book 1 50130111Limonia (Dicranomyia) aquosa Verrall Nationally Scarce 50130112Limonia (Dicranomyia) complicata de Meijere Nationally Scarce 50130115Limonia (Dicranomyia) consimilis Zetterstedt Red Data Book 3 50130116Limonia (Dicranomyia) danica Kuntze Red Data Book 3 50130117Limonia (Dicranomyia) distendens Lundstroem Nationally Scarce 50130119Limonia (Dicranomyia) frontalis Staeger Red Data Book 1 50130121Limonia (Dicranomyia) goritiensis Mik Red Data Book 3 50130123Limonia (Dicranomyia) halterella Edwards Nationally Scarce 50130124Limonia (Dicranomyia) lucida de Meijere Nationally Scarce 50130125Limonia (Dicranomyia) omissinervis de Meijere Red Data Book 2 50130127Limonia (Dicranomyia) ornata Meigen Nationally Scarce 50130128Limonia (Dicranomyia) stigmatica Meigen Nationally Scarce 50130131Limonia (Dicranomyia) ventralis Schummel Nationally Scarce 50130132Limonia (Melanolimonia) caledonica Edwards Nationally Scarce 50130141Limonia (Melanolimonia) occidua Edwards Nationally Scarce 50130143Limonia (Melanolimonia) rufiventris Strobl Red Data Book 3 50130144Limonia (Melanolimonia) stylifera Lackschewitz Red Data Book 2 50130145Limonia (Geranomyia) bezzii Alexander & Leonard Red Data Book 2 50130151Thaumastoptera calceata Mik Nationally Scarce 50130601Orimarga juvenilis Zetterstedt Nationally Scarce 50130701Orimarga virgo Zetterstedt Red Data Book 3 50130702Elliptera omissa Schiner Red Data Book K 50130801Helius pallirostris Edwards Nationally Scarce 50130903Pedicia (Tricyphona) unicolor Schummel Nationally Scarce 50131043Pedicia (Ludicia) lucidipennis Edwards Nationally Scarce 50131052Dicranota (Paradicranota) gracilipes Wahlgren Nationally Scarce 50131522Dicranota (Paradicranota) robusta Lundstroem Nationally Scarce 50131524Dicranota (Paradicranota) simulans Lackschewitz Red Data Book 3 50131526Paradelphomyia (Oxyrhiza) ecalcarata Edwards Red Data Book 2 50131622Paradelphomyia (Oxyrhiza) fuscula Loew Red Data Book 2 50131623

R&D TECHNCIAL REPORT E1-007/TR A-10
Species Name National Status Species CodeParadelphomyia (Oxyrhiza) nielseni Kuntze Nationally Scarce 50131624Limnophila (Eloeophila) apicata Loew Nationally Scarce 50132011Limnophila (Eloeophila) mundata Loew Nationally Scarce 50132013Limnophila (Eloeophila) trimaculata Zetterstedt Nationally Scarce 50132015Limnophila (Eloeophila) verralli Bergroth Nationally Scarce 50132016Limnophila (Idioptera) fasciata L. Red Data Book 1 50132021Limnophila (Idioptera) pulchella Meigen Nationally Scarce 50132022Limnophila (Phylidorea) abdominalis Staeger Nationally Scarce 50132031Limnophila (Phylidorea) glabricula Meigen Nationally Scarce 50132033Limnophila (Phylidorea) heterogyna Bergroth Red Data Book 1 50132034Limnophila (Limnophila) pictipennis Meigen Red Data Book 2 50132051Pilaria (Pilaria) fuscipennis Meigen Nationally Scarce 50132622Pilaria (Pilaria) meridiana Staeger Nationally Scarce 50132623Pilaria (Pilaria) scutellata Staeger Nationally Scarce 50132624Neolimnophila carteri Tonnoir Nationally Scarce 50132901Neolimnophila placida Meigen Nationally Scarce 50132902Gonomyia (Protogonomyia) alboscutellata Von Roser Red Data Book 1 50133121Gonomyia (Idiocera) bradleyi Edwards Red Data Book 2 50133131Gonomyia (Idiocera) connexa Loew Red Data Book 2 50133132Gonomyia (Idiocera) punctata Edwards Red Data Book 2 50133133Gonomyia (Idiocera) sexguttata Dale Red Data Book 1 50133134Gonomyia (Gonomyia) bifida Tonnoir Nationally Scarce 50133141Gonomyia (Gonomyia) conoviensis Barnes Nationally Scarce 50133142Gonomyia (Prolipophleps) abbreviata Loew Red Data Book 3 50133151Rhabdomastix (Sacandaga) hilaris Edwards Red Data Book 3 50133622Rhabdomastix (Sacandaga) inclinata Edwards Red Data Book 2 50133623Cheilotrichia (Cheilotrichia) imbuta Meigen Nationally Scarce 50133911Erioptera (Symplecta) scotica Edwards Red Data Book 1 50134122Erioptera (Erioptera) limbata Loew Red Data Book 2 50134137Erioptera (Erioptera) meijerei Edwards Red Data Book 2 50134139Erioptera (Erioptera) nielseni de Meijere Nationally Scarce 50134141Erioptera (Erioptera) nigripalpis Goetghebuer Red Data Book 3 50134142Erioptera (Erioptera) sordida Zetterstedt Red Data Book 3 50134143Erioptera (Mesocyphona) bivittata Loew Red Data Book 2 50134161Erioptera (Psiloconopa) meigeni Zetterstedt Red Data Book 3 50134171Erioptera (Psiloconopa) pusilla Schiner Red Data Book 1 50134172Arctoconopa melampodia Loew Red Data Book 2 50134701Ormosia (Ormosia) aciculata Edwards Red Data Book 2 50134811Ormosia (Ormosia) bicornis de Meijere Red Data Book 2 50134813Ormosia (Ormosia) staegeriana Alexander Nationally Scarce 50134819Scleroprocta pentagonalis Loew Red Data Book 3 50135001Scleroprocta sororcula Zetterstedt Nationally Scarce 50135002Tasiocera (Dasymolophilus) collini Freeman Red Data Book 1 50135121

R&D TECHNCIAL REPORT E1-007/TR A-11
Species Name National Status Species CodeTasiocera (Dasymolophilus) jenkinsoni Freeman Red Data Book 1 50135123Tasiocera (Dasymolophilus) laminata Freeman Nationally Scarce 50135124Molophilus bihamatus de Meijere Nationally Scarce 50135304Molophilus corniger de Meijere Nationally Scarce 50135306Molophilus czizeki Lackschewitz Red Data Book 3 50135308Molophilus lackschewitzianus Alexander Red Data Book 3 50135312Molophilus niger Goetghebuer Nationally Scarce 50135314Molophilus propinquus Egger Nationally Scarce 50135321Beris clavipes L. Nationally Scarce 50610101Beris fuscipes Meigen Nationally Scarce 50610102Oxycera analis Meigen Red Data Book 2 50610301Oxycera dives Loew Red Data Book 3 50610302Oxycera morrisii Curtis Nationally Scarce 50610305Oxycera pardalina Meigen Nationally Scarce 50610307Oxycera pygmaea Fallen Nationally Scarce 50610309Oxycera terminata Meigen Red Data Book 2 50610311Vanoyia tenuicornis Macquart Nationally Scarce 50610401Odontomyia angulata Panzer Red Data Book 1 50610501Odontomyia argentata Fabricius Red Data Book 2 50610502Odontomyia hydroleon L. Red Data Book 1 50610503Odontomyia ornata Meigen Red Data Book 2 50610504Odontomyia tigrina Fabricius Nationally Scarce 50610505Stratiomys chamaeleon L. Red Data Book 1 50610601Stratiomys longicornis Scopoli Red Data Book 2 50610603Stratiomys potamida Meigen Nationally Scarce 50610604Atrichops crassipes Meigen Red Data Book 3 50620201Chrysops sepulcralis Fabricius Red Data Book 1 50630103Haematopota grandis Meigen Red Data Book 3 50630203Tabanus bovinus L. Red Data Book K 50630502Tabanus cordiger Meigen Nationally Scarce 50630504Tabanus glaucopis Meigen Red Data Book 3 50630505Helophilus groenlandicus Fabricius Red Data Book 2 50810501Anasimyia interpuncta Harris Red Data Book 3 50810602Anasimyia lunulata Meigen Nationally Scarce 50810604Lejops vittata Meigen Red Data Book 2 50810701Parhelophilus consimilis Malm Red Data Book 2 50810801Mallota cimbiciformis Fallen Nationally Scarce 50810901Eristalis (Eoseristalis) cryptarum Fabricius Red Data Book 2 50811013Eristalis (Eoseristalis) rupium Fabricius Nationally Scarce 50811018Colobaea bifasciella Fallen Nationally Scarce 50820101Colobaea distincta Meigen Nationally Scarce 50820102Colobaea pectoralis Zetterstedt Red Data Book 2 50820103Colobaea punctata Lundbeck Nationally Scarce 50820104

R&D TECHNCIAL REPORT E1-007/TR A-12
Species Name National Status Species CodePherbellia argyra Verbeke Red Data Book 2 50820203Pherbellia brunnipes Meigen Nationally Scarce 50820204Pherbellia griseola Fallen Nationally Scarce 50820209Pherbellia grisescens Meigen Nationally Scarce 50820211Pteromicra glabricula Fallen Nationally Scarce 50820302Pteromicra leucopeza Meigen Red Data Book 2 50820303Pteromicra pectorosa Hendel Red Data Book 2 50820304Sciomyza dryomyzina Zetterstedt Red Data Book 2 50820401Sciomyza simplex Fallen Nationally Scarce 50820402Antichaeta analis Meigen Red Data Book 3 50820501Antichaeta brevipennis Zetterstedt Red Data Book 2 50820502Dictya umbrarum L. Nationally Scarce 50820601Psacadina vittigera Schiner Red Data Book 3 50821202Psacadina zernyi Mayer Red Data Book 2 50821203Renocera striata Meigen Nationally Scarce 50821303Tetanocera freyi Stackelberg Red Data Book 3 50821504