COMPLIANCE WITH OPEN GOVERNMENT DATA POLICIES: AN EMPIRICAL EVALUATION OF ITALIAN LOCAL PUBLIC...
10
Twenty Second European Conference on Information Systems, Tel Aviv 2014 1 COMPLIANCE WITH OPEN GOVERNMENT DATA POLICIES: AN EMPIRICAL EVALUATION OF ITALIAN LOCAL PUBLIC ADMINISTRATIONS Research in Progress Andrea Maurino, Blerina Spahiu, Carlo Batini University of Milano-Bicocca – DISCo – viale Sarca 336 – U14 – 20126 Milano, Italy Gianluigi Viscusi EPFL-CDM-CSI - Odyssea - Station 5, CH-1015 Lausanne, Switzerland Abstract Open government is emerging as a core issue for increasing, on the one hand, participation of citizens, and, on the other hand, accountability, transparency, and the capability of delivering digital services by Public Administrations, with a consequent interest into public and social value as final outcomes. However, most of the open government initiatives actually concern the provision of public data under an open license and in an open and accessible format. From a policy as well as from a research point of view, open government data (OGD in what follows) rise a set of questions about how to manage and evaluate their quality, also considering the alignment or compliance with enforced legal frameworks, if any available focused specifically on open government issues. Thus, the paper discusses a quality-based framework for open government data compliance evaluation, made up of quality dimensions and a set of criteria contributing to the measurement of a compliance index. The framework is then applied for the evaluation of the open government data initiatives of a sample of local public administration in Italy Keywords: Open government data, alignment policy and ICT strategy, transparency
Transcript of COMPLIANCE WITH OPEN GOVERNMENT DATA POLICIES: AN EMPIRICAL EVALUATION OF ITALIAN LOCAL PUBLIC...

Twenty Second European Conference on Information Systems, Tel Aviv 2014 1
COMPLIANCE WITH OPEN GOVERNMENT DATA POLICIES: AN EMPIRICAL EVALUATION OF ITALIAN
LOCAL PUBLIC ADMINISTRATIONS
Research in Progress
Andrea Maurino, Blerina Spahiu, Carlo Batini
University of Milano-Bicocca – DISCo – viale Sarca 336 – U14 – 20126 Milano, Italy
Gianluigi Viscusi
EPFL-CDM-CSI - Odyssea - Station 5, CH-1015
Lausanne, Switzerland
Abstract Open government is emerging as a core issue for increasing, on the one hand, participation of citizens, and, on the other hand, accountability, transparency, and the capability of delivering digital services by Public Administrations, with a consequent interest into public and social value as final outcomes. However, most of the open government initiatives actually concern the provision of public data under an open license and in an open and accessible format. From a policy as well as from a research point of view, open government data (OGD in what follows) rise a set of questions about how to manage and evaluate their quality, also considering the alignment or compliance with enforced legal frameworks, if any available focused specifically on open government issues. Thus, the paper discusses a quality-based framework for open government data compliance evaluation, made up of quality dimensions and a set of criteria contributing to the measurement of a compliance index. The framework is then applied for the evaluation of the open government data initiatives of a sample of local public administration in Italy
Keywords: Open government data, alignment policy and ICT strategy, transparency
xxxxxx /on the compliance of open government data policy
Twenty Second European Conference on Information Systems, Tel Aviv 2014 2
1 Introduction
Open government is emerging as a core issue for increasing, on the one hand, participation of citizens, and, on the other hand, accountability, transparency, and the capability of delivering digital services by Public Administrations, with a consequent interest into public and social value as final outcomes (Benington & Moore, 2011). Thus, the phenomenon can be seen as the convergence of the research and action streams that have been in the last ten years the focus as well the target of government funding, policy annalists, and academia efforts, that is e-Government, e-Governance, e-Participation, and e-Democracy, just to mention the relevant ones. Taking these issues into account, it is worth noting that most of the open government initiatives actually concern the provision of public data under an open license and in an open and accessible format. From a policy as well as from a research point of view, open government data (OGD in what follows) rise a set of questions about how to manage and evaluate their quality, also considering the alignment or compliance with enforced legal frameworks, if any available focused specifically on open government issues. However, at the state of the art the academic research has devoted attention to behavioural and institutional analysis of the open government data phenomenon, whereas design at societal level (Simon, 1996) of evaluation frameworks has been considered mainly by practitioners and policy analysts from international organisations. This paper aims to fill this gap, presenting a quality-based index for open government data compliance evaluation. The framework is then applied for the evaluation of the open government data initiatives of a sample of local public administration in Italy. Consequently, the paper is structured as follows. First, a summary of the relevant background is provided, pointing out the motivations for the research presented in this paper. Then, the research method is outlined together with a discussion of the assessment model and the compliance index. Subsequently, the findings of the evaluation applied to the considered case study are detailed. Finally, conclusive remarks and future work summary end the paper.
2 Background and motivations
The open government has been placed at the core of the political agenda at international level, following the national oriented directives such as, e.g., the US Transparency and Open Government Memorandum (Obama, 2009), further detailed in the Open Government Directive – OGD (Orszag, 2009) and the EU directive 2003/98/EC on the Re-use of Public Sector Information – PSI Directive (European Parliament and Council, 2003). Subsequently, the European e-Government Action Plan 2011-2015 gave another ambition to European efforts on open government by identifying as policy priorities “User Empowerment”, including the “Re-use of Public Sector Information”, the “Improvement of Transparency”, the “Involvement of citizens and businesses in policy-making processes”, and the “Collaborative Production of Services. Furthermore, at the state of the art Linders and Wilson (2011) suggested to decompose “the ‘Open Government’ universe into its discrete, actionable components” which the authors named Open Government Objectives:
• Transparency: Accountability and Public Reuse
• Participation: Citizen Engagement and Citizen Sourcing
• Collaboration: Collaborative Service Delivery and Inter-agency Partnering
This taxonomy distinguishes between two types of transparency as information disclosure:
• information provision regarding government’s internal workings, which is associated with political accountability, and
• open data and information (as a service) provision, which is associated with efforts to make freely available information collected and produced as part of government functions (e.g., statistics) for public reuse of citizens and companies.
xxxxxx /on the compliance of open government data policy
Twenty Second European Conference on Information Systems, Tel Aviv 2014 3
As for information disclosure, however, the evaluation of application of OGD policies to public administration is an emerging topic due to also to the relative novelty of OGD. A first attempt has been carried out by Zuiderwijk and Janssen (2014), who have proposed a qualitative framework to assess the implementation and impact of OGD Dutch governmental policies at different government levels. Furthermore, Lourenço et al (2013) realize an assessing model for measuring on line transparency and accountability, two important issues related to the use of open data. The proposed assessment model comprises a Transparency Index related to the use made by public sector entities, aiming to disclose detailed data according to the principles of OGD. The model is based on three different components, such as, visibility, format, and delivery mode, and it has been applied to 94 Municipalities in Italy and Portugal. However, apart the above mentioned contributions attempting to identify frameworks for assessing the degree of compliance of OGD policies and their implementation, there is still a few studies focused on quantitative evaluation of the quality of the alignment to a reference legal framework. As for these issues, we point out the relevance of a systemic perspective on quality assessment also in the case of OGD compliance with regulations. At the state of art, examples of such a systemic perspective can actually be found in the e-Government literature applied, e.g., to strategic planning (Viscusi, Batini, & Mecella, 2010), and policy making (Dawes, 2010; Gelders, 2005; Misuraca, Alfano, & Viscusi, 2011). Taking these issues into account, in what follows we propose a quality-based framework to monitor the degree of compliance of OGD policies, considering three different quality dimensions: completeness, accuracy and timeliness. It is worth noting that these dimensions have been extensively investigated in the area of the data and information quality research: for example, according to Batini et al. (2009), completeness aims to capture the degree a given data collection includes data describing the corresponding set of real-world objects. Furthermore, several definitions are provided for the term accuracy. Among others, Wang and Strong (1996) define accuracy as “the extent to which data are correct, reliable and certified.” Ballou and Pazer (1985) specify that data are accurate when the data values stored in the database correspond to real-world values. In Redman (1996), accuracy is defined as a measure of the proximity of a data value, v, to some other value, v’, that is considered correct. In our model the accuracy is related to the degree of the data provided in institutional web site are related to the 5 stars scale of open data, as proposed by Berners-Lee (2006). Finally, according to Liu and Chi (2002), timeliness dimension is the extent to which data are sufficiently up-to-date for a task; in our model the timeliness dimension refers to the degree of which a give dataset is up-to-date.
3 Research method
This study presents the results of an empirical pilot analysis of the degree of compliance of OGD by institutional web portal in Italian public administrations. First a purposive sample has been defined, actually a nonprobability sampling, however helping to select subjects on the basis of specific characteristics (Bryman, 2008). Then the following criteria have been actually identified for the purpose of sample selection:
- dimension of the pilot sample: medium;
- geographical distribution: country wide (all Regions);
- type of public administration: Region, county, municipalities,
- Municipality size (by number of inhabitants): Small-Medium-Large (according to the classification provided by ISTAT- the Italian National Statistics Institute).
On the basis of these criteria, we decided to consider all Italian regions (20), 10% of the Italian provinces (10 out of 105), and 15 out of 8100 municipalities as our pilot sample: as a result, the
xxxxxx /on the compliance of open government data policy
Twenty Second European Conference on Information Systems, Tel Aviv 2014 4
research sample resulted made up of the websites of 45 Italian public administrations. Once defined the sample as well as the target population, a comprehensive analysis of the contents of the 50 websites has been carried out between January and March 2014, using an evaluation checklist structured as follows: 56 items grouped under the completeness dimension, 56 belonging to the accuracy dimension, and 20 to the timeliness dimension. As for the completeness dimension, it represents the way in which the required information is made available or is accessible. In particular, such a dimension is suitable to measure how munch an institutional web portal satisfies what is required by the legislative decree 33/2013. Completeness may have the following values:
• N/A Not applicable (the document is actually not available)
• 0 Document is not available
• 1 Document is available and accessible using other external links
• 2 Document is available and accessible using other internal or external links
• 3 Document is available and accessible using internal links
• 4 Document is available
The accuracy dimension is related to the kind of available format of the required information; the possible values are
• N/A The document is not available
• 1 Document cannot be downloaded but is available online / Format of the document is HTML (1 star)
• 2 Format of the document is Word / PDF / Power Point (1 star)
• 3 Format of the document is Excel (2 stars)
• 4 Format of the document is CSV (3 stars)
• 5 Format of the document is XML (3 stars)
• 6 Format of the document is JSON (3 stars)
We provide a higher value to xml and json due to its ability to be processed by automatic tools.
Finally, the timeliness dimension is evaluated on the basis of whether the information made available on the websites is up to date or not: the values for the dimension of timeliness are:
• N/A not applicable (the document is not available)
• 0 Update not available
• 3 Update is available
To assess the compliance index we first calculate the completeness/accuracy/timeliness sub index. Each sub index is a linear combination of items related to each dimension weighted by the frequency of assessed values. We use weights based on the importance of each attribute of a given dimension, consequently assigning a bigger weight to the highest value of it. This means that the total number of frequencies of the highest attribute for each sub index will have the highest weight. We explain this in details for completeness. The highest attribute for completeness is the value 4 (Document is available), so this attribute will have the highest weight in our calculations and the highest weighted score is 1. The attribute 0 has a negative impact on completeness, so the assigned value should be negative. Other values (1,2,3) have positive impact on completeness so we assign positive weights, likewise.
xxxxxx /on the compliance of open government data policy
Twenty Second European Conference on Information Systems, Tel Aviv 2014 5
Afterwards, these values are used to measure each sub index. The same logic is applied to calculate accuracy and timeliness sub-indexes.
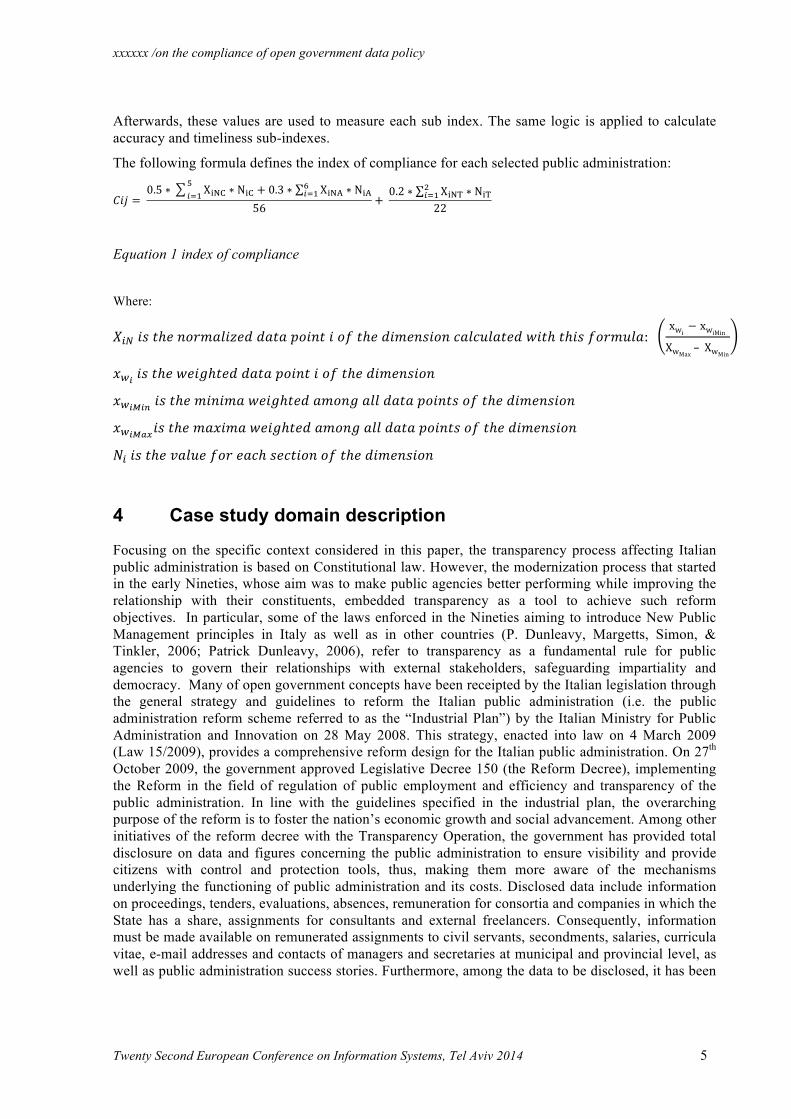
The following formula defines the index of compliance for each selected public administration:
𝐶𝑖𝑗 = 0.5 ∗ X!"# ∗ N!" + 0.3 ∗ X!"# ∗ N!"!
!!!!!!!
56+ 0.2 ∗ X!"# ∗ N!"!
!!!22
Equation 1 index of compliance
Where:
𝑋!" 𝑖𝑠 𝑡ℎ𝑒 𝑛𝑜𝑟𝑚𝑎𝑙𝑖𝑧𝑒𝑑 𝑑𝑎𝑡𝑎 𝑝𝑜𝑖𝑛𝑡 𝑖 𝑜𝑓 𝑡ℎ𝑒 𝑑𝑖𝑚𝑒𝑛𝑠𝑖𝑜𝑛 𝑐𝑎𝑙𝑐𝑢𝑙𝑎𝑡𝑒𝑑 𝑤𝑖𝑡ℎ 𝑡ℎ𝑖𝑠 𝑓𝑜𝑟𝑚𝑢𝑙𝑎: xwi
− xwiMin
XwMax – XwMin
𝑥!! 𝑖𝑠 𝑡ℎ𝑒 𝑤𝑒𝑖𝑔ℎ𝑡𝑒𝑑 𝑑𝑎𝑡𝑎 𝑝𝑜𝑖𝑛𝑡 𝑖 𝑜𝑓 𝑡ℎ𝑒 𝑑𝑖𝑚𝑒𝑛𝑠𝑖𝑜𝑛
𝑥!!"!# 𝑖𝑠 𝑡ℎ𝑒 𝑚𝑖𝑛𝑖𝑚𝑎 𝑤𝑒𝑖𝑔ℎ𝑡𝑒𝑑 𝑎𝑚𝑜𝑛𝑔 𝑎𝑙𝑙 𝑑𝑎𝑡𝑎 𝑝𝑜𝑖𝑛𝑡𝑠 𝑜𝑓 𝑡ℎ𝑒 𝑑𝑖𝑚𝑒𝑛𝑠𝑖𝑜𝑛
𝑥!!"#$𝑖𝑠 𝑡ℎ𝑒 𝑚𝑎𝑥𝑖𝑚𝑎 𝑤𝑒𝑖𝑔ℎ𝑡𝑒𝑑 𝑎𝑚𝑜𝑛𝑔 𝑎𝑙𝑙 𝑑𝑎𝑡𝑎 𝑝𝑜𝑖𝑛𝑡𝑠 𝑜𝑓 𝑡ℎ𝑒 𝑑𝑖𝑚𝑒𝑛𝑠𝑖𝑜𝑛
𝑁! 𝑖𝑠 𝑡ℎ𝑒 𝑣𝑎𝑙𝑢𝑒 𝑓𝑜𝑟 𝑒𝑎𝑐ℎ 𝑠𝑒𝑐𝑡𝑖𝑜𝑛 𝑜𝑓 𝑡ℎ𝑒 𝑑𝑖𝑚𝑒𝑛𝑠𝑖𝑜𝑛
4 Case study domain description
Focusing on the specific context considered in this paper, the transparency process affecting Italian public administration is based on Constitutional law. However, the modernization process that started in the early Nineties, whose aim was to make public agencies better performing while improving the relationship with their constituents, embedded transparency as a tool to achieve such reform objectives. In particular, some of the laws enforced in the Nineties aiming to introduce New Public Management principles in Italy as well as in other countries (P. Dunleavy, Margetts, Simon, & Tinkler, 2006; Patrick Dunleavy, 2006), refer to transparency as a fundamental rule for public agencies to govern their relationships with external stakeholders, safeguarding impartiality and democracy. Many of open government concepts have been receipted by the Italian legislation through the general strategy and guidelines to reform the Italian public administration (i.e. the public administration reform scheme referred to as the “Industrial Plan”) by the Italian Ministry for Public Administration and Innovation on 28 May 2008. This strategy, enacted into law on 4 March 2009 (Law 15/2009), provides a comprehensive reform design for the Italian public administration. On 27th October 2009, the government approved Legislative Decree 150 (the Reform Decree), implementing the Reform in the field of regulation of public employment and efficiency and transparency of the public administration. In line with the guidelines specified in the industrial plan, the overarching purpose of the reform is to foster the nation’s economic growth and social advancement. Among other initiatives of the reform decree with the Transparency Operation, the government has provided total disclosure on data and figures concerning the public administration to ensure visibility and provide citizens with control and protection tools, thus, making them more aware of the mechanisms underlying the functioning of public administration and its costs. Disclosed data include information on proceedings, tenders, evaluations, absences, remuneration for consortia and companies in which the State has a share, assignments for consultants and external freelancers. Consequently, information must be made available on remunerated assignments to civil servants, secondments, salaries, curricula vitae, e-mail addresses and contacts of managers and secretaries at municipal and provincial level, as well as public administration success stories. Furthermore, among the data to be disclosed, it has been

xxxxxx /on the compliance of open government data policy
Twenty Second European Conference on Information Systems, Tel Aviv 2014 6
included information on leaves granted by public administrations to civil servants to participate in trade union activities (secondments, “leaves of absence” and time off work) or elected public office activities also must be published on line. In 2012 the art 18 of the so called development decree (“decreto sviluppo”, Decree Law 22 June 2012 number 83) for the first time the Italian government imposed the use of OGD as the way in which information of tenders, assignment of consultants and external freelancers must to be released to public. In April 2013 with the legislative decree 33, the Italian government released its policy on transparency to all public administrations. In particular the legislative decree 33 requests that all institutional web portals follow a strict schema where information must to be placed. Finally, the legislative decree 150 imposes to public administrations to public documents in open format that correspond to the 1 star of the 5 stars scale proposed by Berners-Lee (2006).
• 1 star Datasets are available on the web (whatever format) but with an open license
• 2 stars Datasets are available as machine-readable structured data (e.g. excel instead of image scan of a table)
• 3 stars as (2) plus non-proprietary format (e.g. CSV instead of excel)
• 4 stars Datasets satisfy the above plus, use open standards from W3C (RDF and SPARQL) to identify things,
• 5 stars Datasets satisfy all the above, plus: Link your data to other people’s data to provide context
Anyway, each public administration is free to release requested information also in structured (2-3 stars) or linked format (4-5 stars).
5 Findings
5.1 Degree of Completeness
The average index of completeness for Italian Regions is 0,577. Veneto (a northern region of Italy) has the highest index for completeness (0,9163), while Campania (a southern region of Italy) has the lowest one (0.053). However, more than 65% of the regions have an index above the mean. The mean of this index for the northern regions is 0.628, for the central regions the index is 0.711, and for the southern regions is 0.459. Furthermore, calculating this index based on the dimension of the regions, the ones categorised as “Large” have an index of 0.583, those catogorized as “Medium”, 0.640, and the regions categorized as “Small” have an index of 0.490
The avarage index of completeness for the selected Italian Provinces is 0.622. The province with the highest score for completeness is Catanzaro in Calabria (a southern region) with an index of 0.876, while the Massa Carrara, in the Toscana Region (a central region) has the lowest value for this index 0.327. However, 40% of the selected provinces have an index below the mean. Based on the criteria of geographical distribution the northern provinces have the highest score (0.676), while the lower value is for the provinces belonging to the Central and South Italy, having an approximate score of 0.589 and 0.599. As for the criteria of size, provinces categorized as large and medium have an approximate score, while for the smallest the score is lower (0,489).
The average index of completeness for the selected Italian municipalities is 0.543. The municipalities with the highest score for completeness are Voghera (Lombardia Region) and Livorno (Toscana Region) with 0.826. The lowes score for this criteria belongs to Vallefiorita (Calabria Region) with 0.247. However, 60% of the selected municipalities has the completeness score above the mean. Based on the criteria of the geographical distribution the Central Italy municipalities have the highest score,

xxxxxx /on the compliance of open government data policy
Twenty Second European Conference on Information Systems, Tel Aviv 2014 7
while southern Italy municipalities have the lowest score. 0.629 is the completeness score for municipalities categorized as large, 0.577 for medium and 0.319 for small municipalities.
5.2 Degree of Accuracy
The average score for accuracy for the Regions of Italy is 0.445. More than 50% of them have a score below the mean. Once again, Veneto has the highest value 0.784, while Campania has also the lowest score for accuracy 0.054. Based on the criteria of geographical distribution the northern regions have a score for accuracy equal to 0.473, the central regions 0.576 and the regions in the south Italy have a score of 0.351. Based on size medium regions have the highest score.
As for the provinces the index of accuracy is 0.575. More than 50% of the selected provinces have an index above the mean. The province of Catanzaro in the region of Calabria has the highest score 0.899, while again Massa Carrara has the lowest score of 0.342. Based on the geographical distribution, the northest provinces have the highest score, while the central and southern ones have a lower approximate score. Based on size, the largest provinces have a score of 0.613 for accuracy, and the smallest ones have a score of 0.479. The medium sized provinces have a score that is in the interval of large-small ones.
The mean for the accuracy index for the italian municipalities is 0.422. Voghera has the highest score 0.729 while Ozegna in the region of Piemonte has the lowest score of 0.117. More than half of the municipalities have an accuracy score below the mean. Municiplaities in the north of Italy have a higher score for accuracy of 0.238 than those in the south of Italy. The municipalities categorized as large have a score of 0.6481, those categorized as medium have a score of 0.471 while small comunes have a score of 0.209.
5.3 Degree of Timeliness
Considering now timeliness, 0.327 is the mean score for all the regions of Italy. The central region of Toscana has the highest score of 0.772 while 8 regions (20%) do not update the information available in their websites. The mean score of the regions in the north Italy is 0.409, for those in center is 0.522 and those in south Italy 0.147. The largest regions have the highest score for timeliness while the small regions have a score of 0.109.
The timeliness score for provinces is 0.388. Milano and Bergamo has the same highest score of 0.772 while for four provinces we do not have an updated information in their websites. Based on geographical distribution the provinces in the central of Italy have the lowest score of timeliness while the northen and southern provinces have a higher approximate score. The highest score of 0.472 belongs to the provinces categorized as large in the size criteria.
The mean for timeliness for municipalities is 0.318. Livorno and Senigallia (central Italy municipalities ) have the highest score for timeliness of 0.681 while there are 5 municipalities without up to date information available. Based on the geographical distribution, the municipalities in the north of Italy have the lowest score of timeliness with regard to the municipalities in the south and center of Italy. The largest municipalities have a score of 0.409 for timeliness, medium municipalities have a score of 0.337 and the smallest municipalities have a score of 0.121.

xxxxxx /on the compliance of open government data policy
Twenty Second European Conference on Information Systems, Tel Aviv 2014 8
5.4 Degree of Compliance
The mean index of compliance for the Italian Regions is 0,488. Veneto has the highest index of compliance (0,839) while Campania has the lowest one (0.043). Half of the regions have an index lower than the mean. For the regions in the north the compliance index is 0.538, for the central regions is 0.633 and for the south regions is 0.365. We have the following value if we calculate this index based on the size of the regions. The regions categorised as “Large” have an approximate index with those catogorized as Medium, respectively 0.508 and 0.545 while the regions categorized as small have an index of 0.388.
The mean index of compliance for Italian Provinces is 0,561. As we can see from the graphic the province of Bergamo has the highest index of compliance 0,759 while Massa Carrara has the lowest 0.266. More than half of the provinces have an index lower than the mean. For the provinces in the north the complienace index is 0.602, for the central provinces is 0.516 and for the southern provinces is 0.564. We have the following value if we calculate this index based on the size of the provinces. The provinces categorised as Large have an index 0.618, those catogorized as Medium have an index of 0.578 and 0.464 for provinces categorized as small.
The mean index of compliance for Italian municipalities is 0,462. As we can see from the graphic the municipality of Voghera has the highest index of compliance 0,759 while Ozegna has the lowest 0.164. More than half of the municipalities have an index lower than the mean. For the municipalities in the north of Italy the complienace index is 0.5, for the central municipalities is 0.464 and for the southern is 0.353. Considering the size of the municipalities, the ones categorised as “Large” have an index 0.541, those catogorized as “Medium” have an index of 0.497, while the index is 0.247 for municipalities categorized as “Small”.
6 Conclusion and Future work
This paper has discussed a quality-based framework to monitor the degree of compliance of OGD policies. The framework has been then applied to a pilot case study on a sample of Italian local public administrations. As for the findings, among the selected set of regions, provinces, and municipalities the compliance index is higher for provinces, thus showing that, on average regions, and municipalities seem less oriented towards the information disclosure and openness as requested by law. Moreover, public administrations in the south of Italy seem to have the lower quality as for their institutional websites sections. Only 28% of website analyzed for regions have the highest value for completeness. Almost 40% of website analyzed for the whole regions do not have the documents requested by the law. As for provinces, 46% of websites have the highest value for completeness, and only 26% do not have the documents requested by the law. Considering the municipalities, almost 42% of the websites checked do not have the document requested by the law, and only 25% of them have the highest value for completeness. Among the regions, only Lombardia has the required format of the document for “Telephones and e-mail addresses” in a JSON format. However, more than 40% of websites sections checked for the regions of Italy have documents in a format not suitable for machine processing and re-usability such as Word/PDF/Power Point. None of the provinces have at least one of the documents in the checked sections in JSON format. Only the province of Udine and Roma are using the XML format for one of their documents. As for provinces more than 55% of the documents formats are Word/PDF/Power Point. Whereas for municipalities these formats are used in 41% of sections and only 1.2% of documents are in CVS, and none of them uses XML or JSON. As for the regions, 64% do not update the information available in the institutional websites. 57% of the
xxxxxx /on the compliance of open government data policy
Twenty Second European Conference on Information Systems, Tel Aviv 2014 9
information available in the province public administration websites is not up to date, while for municipalities is 64%.
Notwithstanding the above findings from preliminary descriptive statistics may provide some insights to policy makers, at the current level the research limitations concern the statistics validity of the index proposed as well as the need to complete the pilot case study presented in this paper including all Italian provinces and municipalities. Furthermore, dependences among quality dimensions and criteria, such as, the size and location of a public administration should be further investigated. Finally, the current exploratory research design should be enriched by a further analysis of the literature, guided by the findings of the preliminary analyses discussed in this paper, thus leading to the identification of a theoretical framework for further inquiries.
Acknowledgments We acknowledge Matteo Frassoni for its fundamental contribution to data collection and preparation.
References
Ballou, D., & Pazer, H. (1985). Modeling data and process quality in multi-input, multi-output information systems. Manag. Sci., 31(2).
Batini, C., Cappiello, C., Francalanci, C., & Maurino, A. (2009). Methodologies for data quality assessment and improvement. ACM Computing Surveys, 41(3).
Benington, J., & Moore, M. H. (2011). Public Value - Theory and Practice. Palgrave Macmillan.
Berners-Lee, T. (2006). Linked Data - Design Issues. Retrieved March 24, 2014, from http://www.w3.org/DesignIssues/LinkedData.html
Bryman, A. (2008). Social Research Methods. Oxford.
Dawes, S. S. (2010). Stewardship and usefulness: Policy principles for information-based transparency. Government Information Quarterly, 27(4), 377–383.
Dunleavy, P. (2006). New Public Management Is Dead—Long Live Digital-Era Governance . Journal of Public Administration Research and Theory, 16(3), 467–494.
Dunleavy, P., Margetts, H., Simon, B., & Tinkler, J. (2006). Digital Era Governance – IT Corporations, The State, and E-Government. London: Oxford University Press.
Gelders, D. (2005). Public information problems in the implementation of public policy: The long road of the reflecting license plate in Belgium. Government Information Quarterly, 22(3), 374–388. doi:10.1016/j.giq.2005.05.006
Linders, D., & Wilson, S. C. (2011). What is open government?: one year after the directive. In Proceedings of the 12th Annual International Digital Government Research Conference (dg.o
xxxxxx /on the compliance of open government data policy
Twenty Second European Conference on Information Systems, Tel Aviv 2014 10
2011) (pp. 262–271). College Park, MD, USA: ACM. Retrieved from http://doi.acm.org/10.1145/2037556.2037599
Liu, L., & Chi, L. (2002). Evolutionary data quality. In the 7th International Conference on Information Quality.
Lourenço, R. P., Sá, P. M. e, Jorge, S., & Pattaro, A. P. (2013). Online Transparency for Accountability: One Assessing Model and two Applications. Electronic Journal of E-Government, 11(2), 280–292.
Misuraca, G., Alfano, G., & Viscusi, G. (2011). Interoperability Challenges for ICT-enabled Governance: Towards a pan-European Conceptual Framework. Journal of Theoretical and Applied Electronic Commerce Research, ISSN 0718–1876 Electronic Version, 6(1), 95–111.
Obama, B. (2009). Transparency and open government. Memorandum for the heads of executive departments and agencies. Retrieved March 24, 2014, from http://www.whitehouse.gov/the_press_office/TransparencyandOpenGovernment
Orszag, P. (2009). Open government directive. Memorandum for the Heads of Executive Departments and Agencies. Retrieved March 24, 2014, from http://www.whitehouse.gov/open/documents/open-government-directive
Redman, T. (1996). Data Quality for the Information Age. Artech House.
Simon, H. A. (1996). The Sciences of the Artificial (3rd ed.). Cambridge (Mass.): The MIT Press.
Viscusi, G., Batini, C., & Mecella, M. (2010). Information Systems for eGovernment: A Quality-of-Service Perspective. Springer.
Wang, R. Y., & Strong, D. M. (1996). Beyond accuracy: what data quality means to data consumers. Journal of Management Information Systems, 12(4), 5–33.
Zuiderwijk, A., & Janssen, M. (2014). Open data policies, their implementation and impact: A framework for comparison. Government Information Quarterly, 31(1), 17–29. doi:10.1016/j.giq.2013.04.003