Microstructure design and mechanical properties in a near-alpha Ti–4Mo alloy
14
Microstructure design and mechanical properties in a near-a Ti–4Mo alloy Z. Tarzimoghadam, S. Sandlöbes ⇑ , K.G. Pradeep, D. Raabe Max-Planck-Institut für Eisenforschung GmbH, Max-Planck-Straße 1, 40237 Düsseldorf, Germany article info Article history: Received 13 February 2015 Revised 16 June 2015 Accepted 21 June 2015 Keywords: Ti alloy Microstructure engineering Mechanical properties Microstructure characterization Electron microscopy Atom probe tomography abstract We study the effects of different heat treatment routes on microstructure engineering and the resulting mechanical response in a plain binary Ti–4Mo (wt%) model alloy. We observe a broad variety of microstructure formation mechanisms including diffusion driven allotropic phase transformations as well as shear and/or diffusion dominated modes of martensitic transformations, enabling a wealth of effective microstructure design options even in such a simple binary Ti alloy. This wide variety of microstructures allows tailoring the mechanical properties ranging from low yield strength (350 MPa) and high ductility (30–35% tensile elongation) to very high yield strength (1100 MPa) and medium duc- tility (10–15% tensile elongation) as well as a variety of intermediate states. Mechanical testing and microstructure characterization using optical microscopy, scanning electron microscopy based techniques, transmission electron microscopy and atom probe tomography were per- formed revealing that minor variations in the heat treatment cause significant changes in the resulting microstructures (e.g. structural refinement, transition between diffusive and martensitic transforma- tions). The experimental results on microstructure evolution during the applied different heat treatment routes are discussed with respect to the mechanical properties. Ó 2015 Acta Materialia Inc. Published by Elsevier Ltd. All rights reserved. 1. Introduction Titanium and its alloys exhibit an excellent combination of mechanical and physical properties for key applications in aero- space, energy and chemical industry [1–3]. The mechanical proper- ties of titanium alloys are important criteria for the material service capabilities both in aerospace and industrial applications. Most titanium alloys used in structural applications consist of two-phase mixtures of a and b phases combined in different mor- phologies and relative volume fractions [4,8]. Two-phase a + b alloys offer a range of combinations of strength, toughness and high temperature properties up to 600 °C [4–6]. Solid state phase transformations are the main factors determining the functional characteristics of these alloys. Manipulation of the mechanical properties depends on the effect of alloying additions and thermo-mechanical processing on the stability and mechanical behavior of the two phases, both individually and in a variety of microstructural combinations [4,7,9]. The solid-state b ? b + a transformation in titanium alloys can take place either diffusionless, i.e. martensitic, or by diffusion controlled nucleation and growth processes depending on cooling rate and alloy composition. This transition in transformation kinet- ics and kinematics enables the design of complex microstructures with features spanning across a broad range of length scales [10]. Thermo-mechanical processing is a useful method to tailor the microstructure and, thus, to control the size and morphology of different phases in Ti alloys [11–14]. Particularly, the control of the morphology of the a phase is one of the most important keys to improve the properties of a + b Ti alloys [4,12,15–17]. The mechanical properties of two-phase (a + b) titanium alloys are very sensitive to the morphology and geometrical arrangement of the two phases, similar as in dual phase steels [18,19]. A fully lamellar structure is characterized by high fatigue crack propaga- tion resistance and high fracture toughness. Important parameters for a lamellar microstructure with respect to the mechanical properties are the b-grain size, the size of the colonies of a-phase lamellae, the thickness of the a-lamellae, and the nature of the inter-lamellar interfaces (b-phase) [20–22]. One of the most influential microstructural parameters is the a colony size since it determines the effective slip length in lamellar microstructures [21–23]. The cooling rate from the homogenization temperature determines the a colony size and width of the a-lamellae within the b grains and the extent of continuous a-layers at b grain boundaries [7,21,24–26]. http://dx.doi.org/10.1016/j.actamat.2015.06.043 1359-6454/Ó 2015 Acta Materialia Inc. Published by Elsevier Ltd. All rights reserved. ⇑ Corresponding author. E-mail address: [email protected] (S. Sandlöbes). Acta Materialia 97 (2015) 291–304 Contents lists available at ScienceDirect Acta Materialia journal homepage: www.elsevier.com/locate/actamat
Transcript of Microstructure design and mechanical properties in a near-alpha Ti–4Mo alloy

Microstructure design and mechanical properties in a near-a Ti–4Mo
alloy
Z. Tarzimoghadam, S. Sandlöbes ⇑, K.G. Pradeep, D. Raabe
Max-Planck-Institut für Eisenforschung GmbH, Max-Planck-Straße 1, 40237 Düsseldorf, Germany
a r t i c l e i n f o
Article history:
Received 13 February 2015
Revised 16 June 2015
Accepted 21 June 2015
Keywords:
Ti alloy
Microstructure engineering
Mechanical properties
Microstructure characterization
Electron microscopy
Atom probe tomography
a b s t r a c t
We study the effects of different heat treatment routes on microstructure engineering and the resulting
mechanical response in a plain binary Ti–4Mo (wt%) model alloy. We observe a broad variety of
microstructure formation mechanisms including diffusion driven allotropic phase transformations as
well as shear and/or diffusion dominated modes of martensitic transformations, enabling a wealth of
effective microstructure design options even in such a simple binary Ti alloy. This wide variety of
microstructures allows tailoring the mechanical properties ranging from low yield strength (350 MPa)
and high ductility (30–35% tensile elongation) to very high yield strength (1100 MPa) and medium duc-
tility (10–15% tensile elongation) as well as a variety of intermediate states.
Mechanical testing and microstructure characterization using optical microscopy, scanning electron
microscopy based techniques, transmission electron microscopy and atom probe tomography were per-
formed revealing that minor variations in the heat treatment cause significant changes in the resulting
microstructures (e.g. structural refinement, transition between diffusive and martensitic transforma-
tions). The experimental results on microstructure evolution during the applied different heat treatment
routes are discussed with respect to the mechanical properties.
Ó 2015 Acta Materialia Inc. Published by Elsevier Ltd. All rights reserved.
1. Introduction
Titanium and its alloys exhibit an excellent combination of
mechanical and physical properties for key applications in aero-
space, energy and chemical industry [1–3]. The mechanical proper-
ties of titanium alloys are important criteria for the material
service capabilities both in aerospace and industrial applications.
Most titanium alloys used in structural applications consist of
two-phase mixtures of a and b phases combined in different mor-
phologies and relative volume fractions [4,8]. Two-phase a + b
alloys offer a range of combinations of strength, toughness and
high temperature properties up to �600 °C [4–6]. Solid state phase
transformations are the main factors determining the functional
characteristics of these alloys. Manipulation of the mechanical
properties depends on the effect of alloying additions and
thermo-mechanical processing on the stability and mechanical
behavior of the two phases, both individually and in a variety of
microstructural combinations [4,7,9].
The solid-state b? b + a transformation in titanium alloys can
take place either diffusionless, i.e. martensitic, or by diffusion
controlled nucleation and growth processes depending on cooling
rate and alloy composition. This transition in transformation kinet-
ics and kinematics enables the design of complex microstructures
with features spanning across a broad range of length scales [10].
Thermo-mechanical processing is a useful method to tailor the
microstructure and, thus, to control the size and morphology of
different phases in Ti alloys [11–14]. Particularly, the control of
the morphology of the a phase is one of the most important keys
to improve the properties of a + b Ti alloys [4,12,15–17]. The
mechanical properties of two-phase (a + b) titanium alloys are
very sensitive to the morphology and geometrical arrangement
of the two phases, similar as in dual phase steels [18,19]. A fully
lamellar structure is characterized by high fatigue crack propaga-
tion resistance and high fracture toughness. Important parameters
for a lamellar microstructure with respect to the mechanical
properties are the b-grain size, the size of the colonies of a-phaselamellae, the thickness of the a-lamellae, and the nature of the
inter-lamellar interfaces (b-phase) [20–22]. One of the most
influential microstructural parameters is the a colony size since
it determines the effective slip length in lamellar microstructures
[21–23]. The cooling rate from the homogenization temperature
determines the a colony size and width of the a-lamellae within
the b grains and the extent of continuous a-layers at b grain
boundaries [7,21,24–26].
http://dx.doi.org/10.1016/j.actamat.2015.06.043
1359-6454/Ó 2015 Acta Materialia Inc. Published by Elsevier Ltd. All rights reserved.
⇑ Corresponding author.
E-mail address: [email protected] (S. Sandlöbes).
Acta Materialia 97 (2015) 291–304
Contents lists available at ScienceDirect
Acta Materialia
journal homepage: www.elsevier .com/locate /actamat
Most of these earlier studies use more complex ternary or qua-
ternary Ti-alloys and include variations in the alloying content. In
this study we systematically investigate microstructure variations
by different heat treatment routes in a plain binary Ti–4Mo (wt%)
alloy. Specifically, we study segregation, partitioning and phase
transformation mechanisms and their impact on microstructural
variations in order to tailor the mechanical properties. For the
same alloy composition we observe a huge variety of different
mechanisms of microstructure formation including diffusion
driven allotropic phase transformations as well as shear and/or
diffusion dominated modes of martensitic transformations. Such
a high variety of solid-state phase transitions and transformations
in one simple binary alloy is known only from binary Fe–C
alloys [27,28], where minor variations in the heat treatment
conditions significantly affect the local C-distribution, the phase
transformation reactions, the resulting microstructure and the
macroscopic properties. Here we compare the influence of heat
treatments at different annealing temperatures and different
cooling rates on the occurring phase transformation reactions
and the associated microstructural evolution as well as their
impact on the resulting mechanical properties in a basic binary
Ti–4Mo alloy.
2. Experimental procedure
The Ti–4Mo alloy was produced using an electric arc fur-
nace under Ar atmosphere and cast in a copper mold.
Table 1 shows the chemical composition of the as-cast alloy.
The as-cast billets were subjected to high-strain-rate unidirec-
tional hot rolling at 875 °C (b phase region) with 50% thickness
reduction per pass.
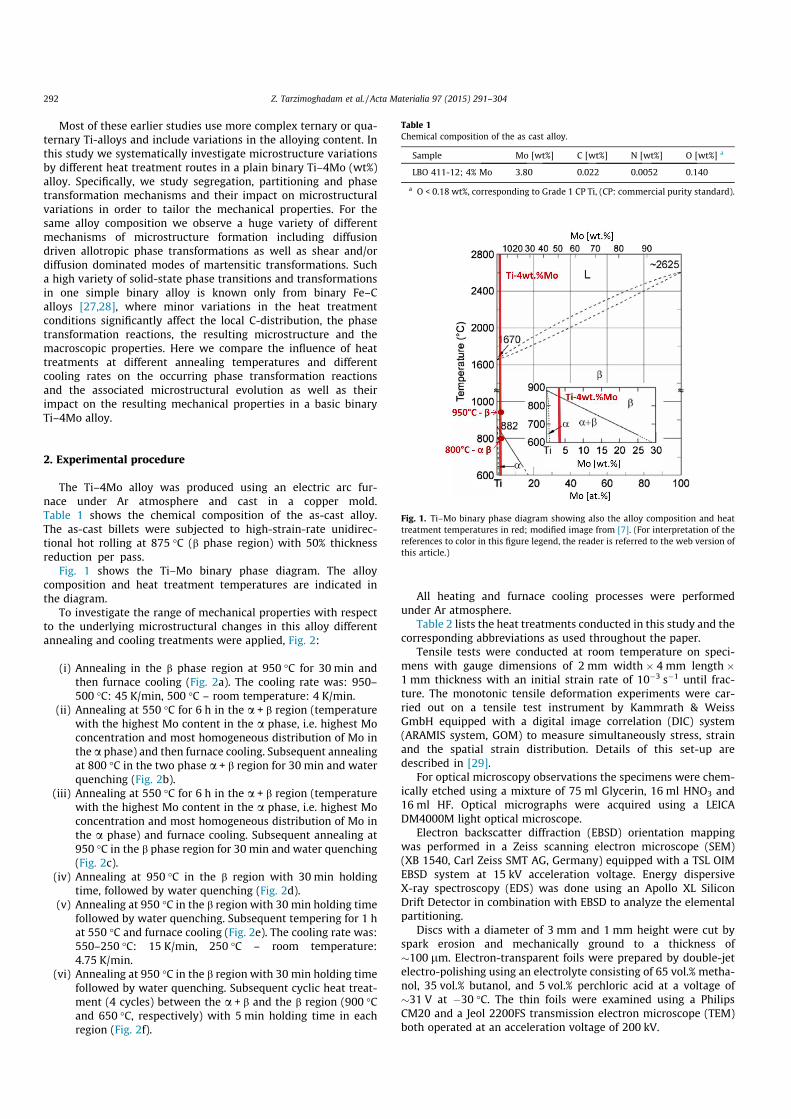
Fig. 1 shows the Ti–Mo binary phase diagram. The alloy
composition and heat treatment temperatures are indicated in
the diagram.
To investigate the range of mechanical properties with respect
to the underlying microstructural changes in this alloy different
annealing and cooling treatments were applied, Fig. 2:
(i) Annealing in the b phase region at 950 °C for 30 min and
then furnace cooling (Fig. 2a). The cooling rate was: 950–
500 °C: 45 K/min, 500 °C – room temperature: 4 K/min.
(ii) Annealing at 550 °C for 6 h in the a + b region (temperature
with the highest Mo content in the a phase, i.e. highest Mo
concentration and most homogeneous distribution of Mo in
the a phase) and then furnace cooling. Subsequent annealing
at 800 °C in the two phase a + b region for 30 min and water
quenching (Fig. 2b).
(iii) Annealing at 550 °C for 6 h in the a + b region (temperature
with the highest Mo content in the a phase, i.e. highest Mo
concentration and most homogeneous distribution of Mo in
the a phase) and furnace cooling. Subsequent annealing at
950 °C in the b phase region for 30 min and water quenching
(Fig. 2c).
(iv) Annealing at 950 °C in the b region with 30 min holding
time, followed by water quenching (Fig. 2d).
(v) Annealing at 950 °C in the b region with 30 min holding time
followed by water quenching. Subsequent tempering for 1 h
at 550 °C and furnace cooling (Fig. 2e). The cooling rate was:
550–250 °C: 15 K/min, 250 °C – room temperature:
4.75 K/min.
(vi) Annealing at 950 °C in the b region with 30 min holding time
followed by water quenching. Subsequent cyclic heat treat-
ment (4 cycles) between the a + b and the b region (900 °C
and 650 °C, respectively) with 5 min holding time in each
region (Fig. 2f).
All heating and furnace cooling processes were performed
under Ar atmosphere.
Table 2 lists the heat treatments conducted in this study and the
corresponding abbreviations as used throughout the paper.
Tensile tests were conducted at room temperature on speci-
mens with gauge dimensions of 2 mm width � 4 mm length �
1 mm thickness with an initial strain rate of 10ÿ3 sÿ1 until frac-
ture. The monotonic tensile deformation experiments were car-
ried out on a tensile test instrument by Kammrath & Weiss
GmbH equipped with a digital image correlation (DIC) system
(ARAMIS system, GOM) to measure simultaneously stress, strain
and the spatial strain distribution. Details of this set-up are
described in [29].
For optical microscopy observations the specimens were chem-
ically etched using a mixture of 75 ml Glycerin, 16 ml HNO3 and
16 ml HF. Optical micrographs were acquired using a LEICA
DM4000M light optical microscope.
Electron backscatter diffraction (EBSD) orientation mapping
was performed in a Zeiss scanning electron microscope (SEM)
(XB 1540, Carl Zeiss SMT AG, Germany) equipped with a TSL OIM
EBSD system at 15 kV acceleration voltage. Energy dispersive
X-ray spectroscopy (EDS) was done using an Apollo XL Silicon
Drift Detector in combination with EBSD to analyze the elemental
partitioning.
Discs with a diameter of 3 mm and 1 mm height were cut by
spark erosion and mechanically ground to a thickness of
�100 lm. Electron-transparent foils were prepared by double-jet
electro-polishing using an electrolyte consisting of 65 vol.% metha-
nol, 35 vol.% butanol, and 5 vol.% perchloric acid at a voltage of
�31 V at ÿ30 °C. The thin foils were examined using a Philips
CM20 and a Jeol 2200FS transmission electron microscope (TEM)
both operated at an acceleration voltage of 200 kV.
Table 1
Chemical composition of the as cast alloy.
Sample Mo [wt%] C [wt%] N [wt%] O [wt%] a
LBO 411-12; 4% Mo 3.80 0.022 0.0052 0.140
a O < 0.18 wt%, corresponding to Grade 1 CP Ti, (CP: commercial purity standard).
Fig. 1. Ti–Mo binary phase diagram showing also the alloy composition and heat
treatment temperatures in red; modified image from [7]. (For interpretation of the
references to color in this figure legend, the reader is referred to the web version of
this article.)
292 Z. Tarzimoghadam et al. / Acta Materialia 97 (2015) 291–304

Atomic-scale chemical analysis was conducted using atom
probe tomography (APT). APT samples were prepared site specific
using focused ion beam (FIB) (dual-beam FEI Helios Nanolab 600)
following the procedure described in [30]. Pulsed voltage APT was
performed using a local electrode atom probe (LEAP 3000X HR,
Cameca Instruments) at a specimen temperature of 60 K. The
pulse frequency was kept at 200 kHz. Data analysis was per-
formed using the software IVAS 3.6.6 provided by Cameca
Instruments.
3. Results
Fig. 3 shows the engineering stress-strain curves of the Ti–4Mo
alloy after different heat treatments. It is evident that the mechan-
ical properties change significantly with the heat treatment condi-
tions. Annealing at 950 °C (b-region) followed by furnace cooling
(950 °C-FC) results in a tensile strength of 500 MPa and 25% elon-
gation to fracture. Annealing in the a + b region and subsequent
water quenching (550 °C + 800 °C-WQ) gives an increase in tensile
Fig. 2. Schematic drawings of the applied heat treatment routes, (a) 950 °C-FC, (b) 550 °C + 800 °C-WQ, (c) 550 °C + 950 °C-WQ, (d) 950 °C-WQ, (e) 950 °C-WQ + 550 °C, (f)
950 °C-WQ + 4 cycles; AC: air cooling, WQ: water quenching, FC: furnace cooling.
Z. Tarzimoghadam et al. / Acta Materialia 97 (2015) 291–304 293

strength of about 100 MPa and a slight decrease (to 22.5%) of the
elongation to fracture. Annealing at 950 °C and water quenching
(550 °C + 950 °C-WQ) brings a tensile strength of 1100 MPa and
12% elongation to fracture, which is twice the strength and half
the elongation than observed for annealing at 950 °C and
furnace cooling. Tensile tests after heat treatments 950 °C-WQ,
950 °C-WQ +550 °C and 950 °C-WQ + 4 cycles (Fig. 3b) show that
the tensile strength decreases and ductility increases upon temper-
ing the water quenched structure. Cyclic heat treatment at 550 °C
similarly results in a further decrease of the tensile strength con-
comitant with an increase of the tensile elongation to fracture.
Fig. 4 shows light optical micrographs of the microstructures of
Ti–4Mo subjected to heat treatments 950 °C-FC, 550 °C +
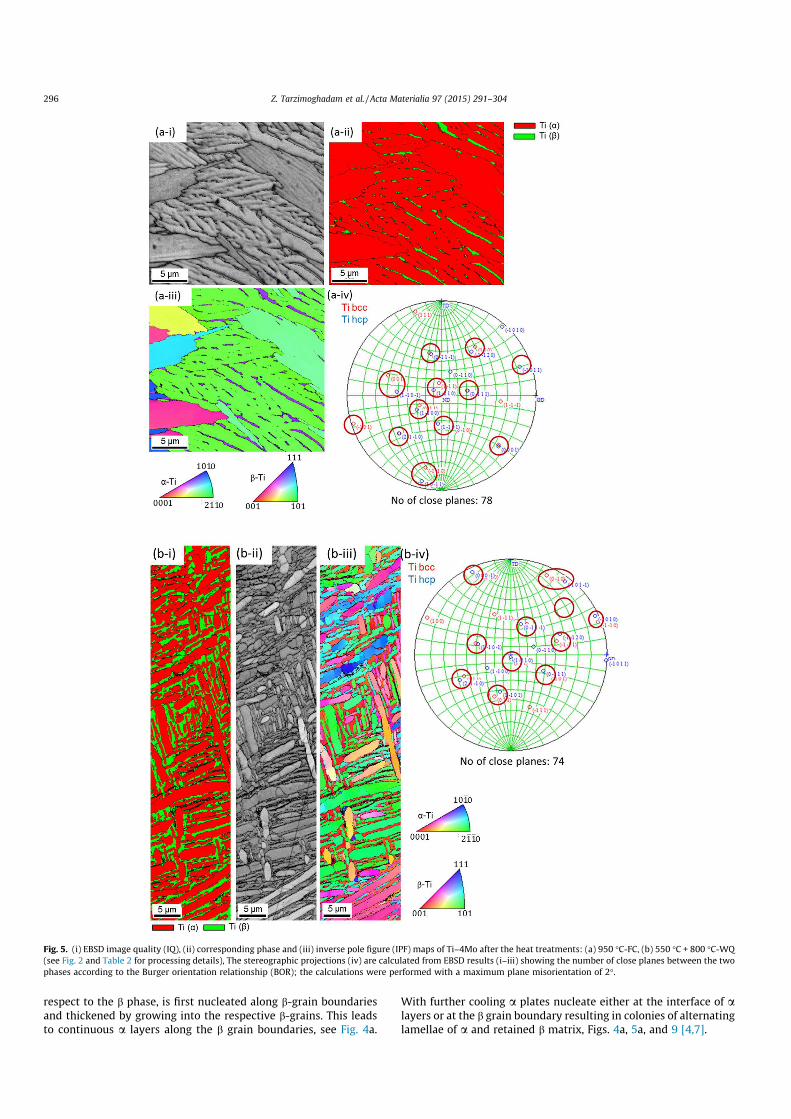
800 °C-WQ and 550 °C + 950 °C-WQ and Figs. 5–7 present EBSD
analyses in terms of image quality (IQ) maps, phase maps and
inverse pole figure (IPF) maps of Ti–4Mo after heat treatment
routes 950 °C-FC, 550 °C + 800 °C-WQ, 550 °C + 950 °C-WQ,
950 °C-WQ, 950 °C-WQ + 550 °C, 950 °C-WQ + 4 cycles.
All EBSD measurements were performed with a small step size
of 50 nm to identify and index the fine a/b lamellar structures. The
image quality and phase maps show the different dispersions
and morphologies of a and b and the IPF maps present the
corresponding orientations of a and b, respectively. From
the EBSD results the number of planes between the two phases
that match the Burger orientation relationship (BOR) was
calculated using a maximum plane misorientation of 2°. The
Burgers orientation relationship between a and b phase crystals
((110)b||(0002)a; [1 �11]b||[11 �20]a) was confirmed in all cases,
as shown by corresponding stereographic projections for the
different heat treatments in Figs. 5–7.
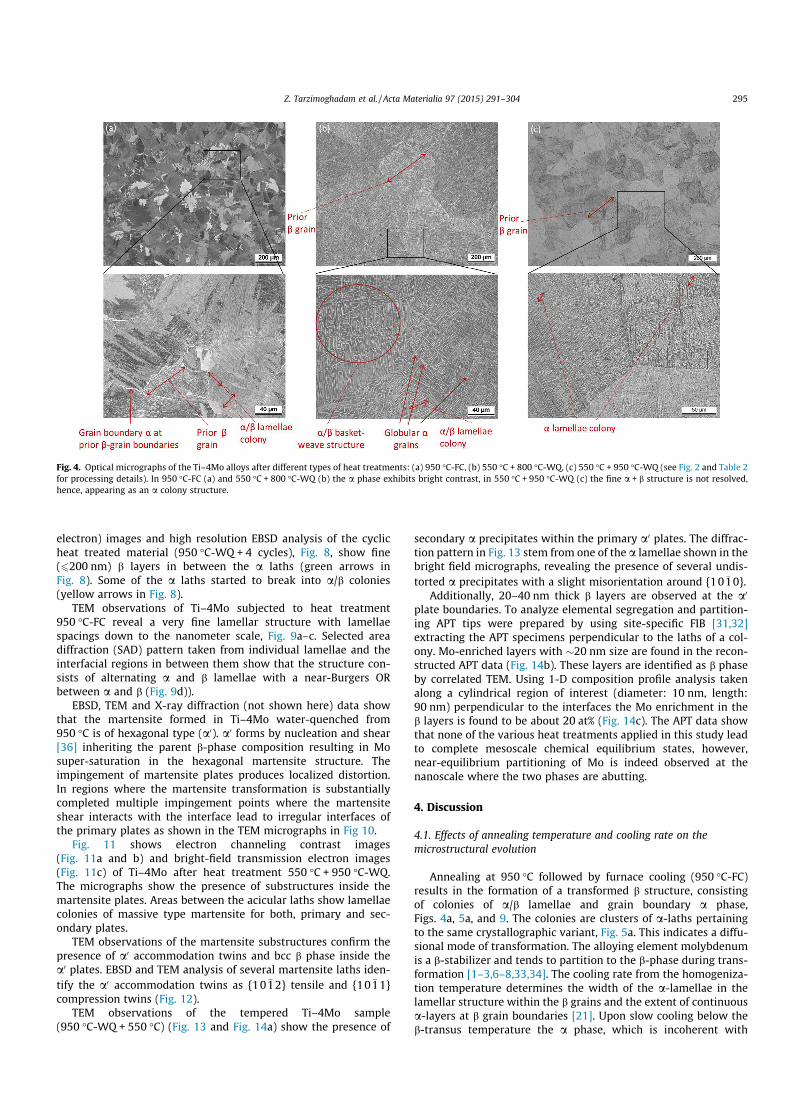
Annealing at 950 °C followed by furnace cooling (950 °C-FC)
results in a transformed-b structure consisting of colonies of a/blamellae and grain boundary a decorating the prior b-grain
boundaries (Figs. 4a and 5a). The a-laths pertain to the same
crystallographic variant, Fig. 5a-(iii). Annealing in the two phase
region below the b-transus temperature (550 °C + 800 °C-WQ)
causes softening of the a lamellae at the edges, Fig. 5b-(ii). The
resulting microstructure is a dual-phase structure with globular
and lamellar a phase grains (Figs. 4b and 5b) including coarse
colonies of a with a typical basket-weave structure with a
multi-variant distribution of small colonies and retained b phase.
The Ti–4Mo sample water-cooled from the b region
(550 °C + 950 °C-WQ) reveals a transformed b structure with a high
density of a lamellae colonies within the prior b grains
(Figs. 4c and 6a). A continuous network of grain boundary a along
the entire prior-b grains as in 950 °C-FC is not present. The alloy
transformed to martensite during water-quenching from the
b-phase field.
The fine a/b lamellae structure observed for 950 °C-FC and
550 °C + 800 °C-WQ is clearly visible from the image quality and
phase maps in Fig. 5a and b. By reducing the annealing tempera-
ture to 800 °C, hence shifting it into the a + b region, the volume
fraction and lamellae thickness of retained b phase is increased
when compared to 950 °C-FC (volume fraction of about 0.5 in
950 °C-FC; volume fraction of about 2.5 in 550 °C + 800 °C-WQ).
The microstructures formed during heat treatments
550 °C + 950 °C-WQ (Fig. 6a) and 950 °C-WQ consist of primary
laths with an average thickness of 1 lm and fine (0.2 lm average
thickness) secondary laths in between. The microstructure of
550 °C + 950 °C-WQ and 950 °C-WQ is of acicular plate martensite
morphology, Fig. 5a and b, which is typical of martensite in tita-
nium alloys [7].
Additional tempering at 550 °C (950 °C-WQ + 550 °C) results in
an increased size of the a lamellae colonies, increased thickness of
individual a lamellae and growth of the b phase lamellae com-
pared to the microstructure observed for the 950 °C-WQ specimen
(Fig. 6a).
During cyclic heat treatment at 550 °C (950 °C-WQ + 4 cycles) a
colony structure started to form (Fig. 6b). BSE (backscattered
Table 2
Different heat treatment routes and corresponding abbreviations as used throughout.
Heat treatment Corresponding
nomenclature
950 °C, 30 min, furnace cooling* 950 °C-FC
550 °C, 6 h, furnace cooling + 800 °C, 30 min, water
quenching
550 °C + 800 °C-WQ
550 °C, 6 h, furnace cooling + 950 °C, 30 min, water
quenching
550 °C+950 °C-WQ
950 °C, 30 min, water quenching 950 °C-WQ
950 °C, 30 min, water quenching + 550 °C, 60 min,
furnace cooling
950 °C-WQ+550 °C
950 °C, 30 min, water quenching + 4 cycles between
900 °C and 650 °C, 5 min holding time each,
followed by air cooling
950 °C-WQ + 4
cycles
* Cooling rate: 950–500 °C: 45 K/min, 500 °C – room temperature: 4 K/min.
Fig. 3. Engineering stress–strain curves of Ti–4Mo subjected to (a) 950 °C-FC, 550 °C + 800 °C-WQ, 550 °C + 950 °C-WQ and (b) 950 °C-WQ, 950 °C-WQ + 550 °C, 950 °C-
WQ + 4 cycles. An initial strain rate of 10ÿ3 sÿ1 was applied.
294 Z. Tarzimoghadam et al. / Acta Materialia 97 (2015) 291–304
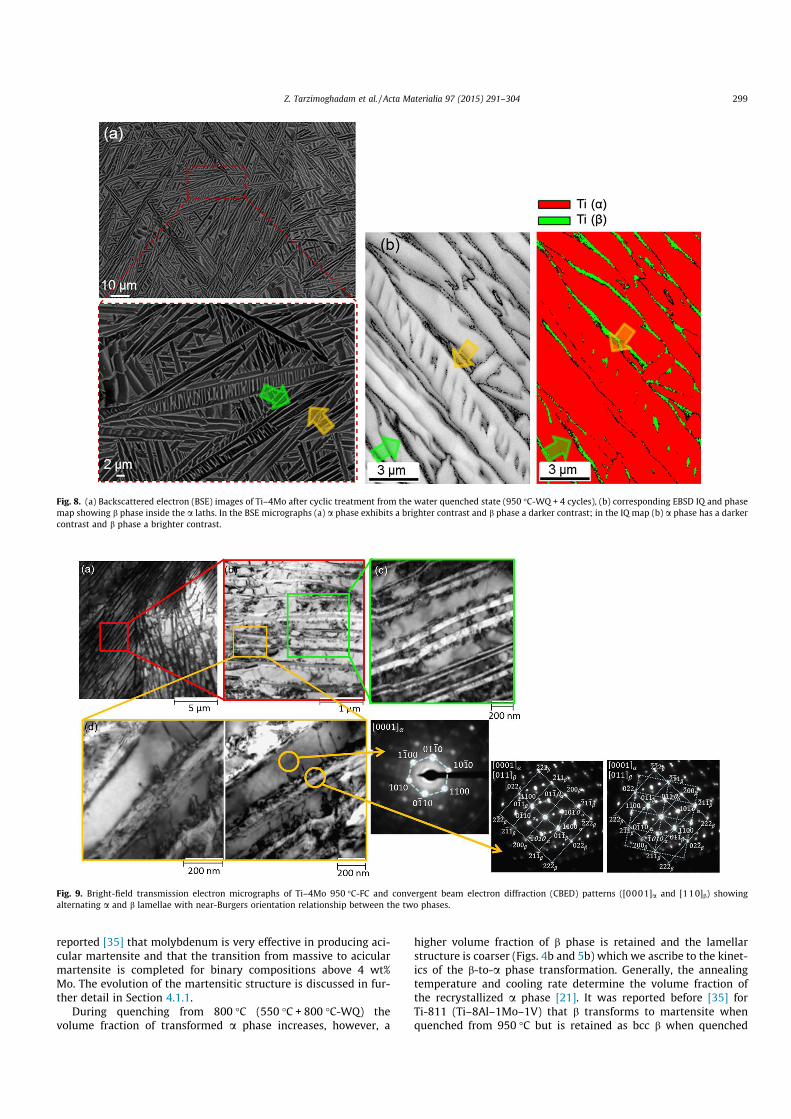
electron) images and high resolution EBSD analysis of the cyclic
heat treated material (950 °C-WQ + 4 cycles), Fig. 8, show fine
(6200 nm) b layers in between the a laths (green arrows in
Fig. 8). Some of the a laths started to break into a/b colonies
(yellow arrows in Fig. 8).
TEM observations of Ti–4Mo subjected to heat treatment
950 °C-FC reveal a very fine lamellar structure with lamellae
spacings down to the nanometer scale, Fig. 9a–c. Selected area
diffraction (SAD) pattern taken from individual lamellae and the
interfacial regions in between them show that the structure con-
sists of alternating a and b lamellae with a near-Burgers OR
between a and b (Fig. 9d)).
EBSD, TEM and X-ray diffraction (not shown here) data show
that the martensite formed in Ti–4Mo water-quenched from
950 °C is of hexagonal type (a0). a0 forms by nucleation and shear
[36] inheriting the parent b-phase composition resulting in Mo
super-saturation in the hexagonal martensite structure. The
impingement of martensite plates produces localized distortion.
In regions where the martensite transformation is substantially
completed multiple impingement points where the martensite
shear interacts with the interface lead to irregular interfaces of
the primary plates as shown in the TEM micrographs in Fig 10.
Fig. 11 shows electron channeling contrast images
(Fig. 11a and b) and bright-field transmission electron images
(Fig. 11c) of Ti–4Mo after heat treatment 550 °C + 950 °C-WQ.
The micrographs show the presence of substructures inside the
martensite plates. Areas between the acicular laths show lamellae
colonies of massive type martensite for both, primary and sec-
ondary plates.
TEM observations of the martensite substructures confirm the
presence of a0 accommodation twins and bcc b phase inside the
a0 plates. EBSD and TEM analysis of several martensite laths iden-
tify the a0 accommodation twins as {10 �12} tensile and {10 �11}
compression twins (Fig. 12).
TEM observations of the tempered Ti–4Mo sample
(950 °C-WQ + 550 °C) (Fig. 13 and Fig. 14a) show the presence of
secondary a precipitates within the primary a0 plates. The diffrac-
tion pattern in Fig. 13 stem from one of the a lamellae shown in the
bright field micrographs, revealing the presence of several undis-
torted a precipitates with a slight misorientation around {10 �10}.
Additionally, 20–40 nm thick b layers are observed at the a0
plate boundaries. To analyze elemental segregation and partition-
ing APT tips were prepared by using site-specific FIB [31,32]
extracting the APT specimens perpendicular to the laths of a col-
ony. Mo-enriched layers with �20 nm size are found in the recon-
structed APT data (Fig. 14b). These layers are identified as b phase
by correlated TEM. Using 1-D composition profile analysis taken
along a cylindrical region of interest (diameter: 10 nm, length:
90 nm) perpendicular to the interfaces the Mo enrichment in the
b layers is found to be about 20 at% (Fig. 14c). The APT data show
that none of the various heat treatments applied in this study lead
to complete mesoscale chemical equilibrium states, however,
near-equilibrium partitioning of Mo is indeed observed at the
nanoscale where the two phases are abutting.
4. Discussion
4.1. Effects of annealing temperature and cooling rate on the
microstructural evolution
Annealing at 950 °C followed by furnace cooling (950 °C-FC)
results in the formation of a transformed b structure, consisting
of colonies of a/b lamellae and grain boundary a phase,
Figs. 4a, 5a, and 9. The colonies are clusters of a-laths pertaining
to the same crystallographic variant, Fig. 5a. This indicates a diffu-
sional mode of transformation. The alloying element molybdenum
is a b-stabilizer and tends to partition to the b-phase during trans-
formation [1–3,6–8,33,34]. The cooling rate from the homogeniza-
tion temperature determines the width of the a-lamellae in the
lamellar structure within the b grains and the extent of continuous
a-layers at b grain boundaries [21]. Upon slow cooling below the
b-transus temperature the a phase, which is incoherent with
Fig. 4. Optical micrographs of the Ti–4Mo alloys after different types of heat treatments: (a) 950 °C-FC, (b) 550 °C + 800 °C-WQ, (c) 550 °C + 950 °C-WQ (see Fig. 2 and Table 2
for processing details). In 950 °C-FC (a) and 550 °C + 800 °C-WQ (b) the a phase exhibits bright contrast, in 550 °C + 950 °C-WQ (c) the fine a + b structure is not resolved,
hence, appearing as an a colony structure.
Z. Tarzimoghadam et al. / Acta Materialia 97 (2015) 291–304 295
respect to the b phase, is first nucleated along b-grain boundaries
and thickened by growing into the respective b-grains. This leads
to continuous a layers along the b grain boundaries, see Fig. 4a.
With further cooling a plates nucleate either at the interface of alayers or at the b grain boundary resulting in colonies of alternating
lamellae of a and retained b matrix, Figs. 4a, 5a, and 9 [4,7].
Fig. 5. (i) EBSD image quality (IQ), (ii) corresponding phase and (iii) inverse pole figure (IPF) maps of Ti–4Mo after the heat treatments: (a) 950 °C-FC, (b) 550 °C + 800 °C-WQ
(see Fig. 2 and Table 2 for processing details), The stereographic projections (iv) are calculated from EBSD results (i–iii) showing the number of close planes between the two
phases according to the Burger orientation relationship (BOR); the calculations were performed with a maximum plane misorientation of 2°.
296 Z. Tarzimoghadam et al. / Acta Materialia 97 (2015) 291–304

By increasing the cooling rate from the b-phase field (water
quenching, heat treatments 550 °C + 950 °C-WQ and 950 °C-WQ)
the Ti–4Mo transforms to a0 martensite with a hexagonal crystal
structure, Fig. 6a and b. The observed martensite morphology is a
mixture of massive and acicular martensite with b-layers at some
of the martensite plate boundaries, Fig. 6a and b. It has been
Fig. 6. (i) EBSD image quality (IQ), (ii) corresponding phase and (iii) inverse pole figure (IPF) maps of Ti–4Mo after the heat treatments: (a) 550 °C + 950 °C-WQ, (b) 950 °C-
WQ (see Fig. 2 and Table 2 for processing details), The stereographic projections (iv) are calculated from EBSD results (i-iii) showing the number of close planes between the
two phases according to the Burger orientation relationship (BOR); the calculations were performed with a maximum plane misorientation of 2°.
Z. Tarzimoghadam et al. / Acta Materialia 97 (2015) 291–304 297

Fig. 7. (i) EBSD image quality (IQ), (ii) corresponding phase and (iii) inverse pole figure (IPF) maps of Ti–4Mo after the heat treatments: (a) 950 °C-WQ + 550 °C, (b) 950 °C-
WQ + 4 cycles (see Fig. 2 and Table 2 for processing details), the stereographic projections (iv) are calculated from EBSD results (i–iii) showing the number of close planes
between the two phases according to the Burger orientation relationship (BOR); the calculations were performed with a maximum plane misorientation of 2°.
298 Z. Tarzimoghadam et al. / Acta Materialia 97 (2015) 291–304
reported [35] that molybdenum is very effective in producing aci-
cular martensite and that the transition from massive to acicular
martensite is completed for binary compositions above 4 wt%
Mo. The evolution of the martensitic structure is discussed in fur-
ther detail in Section 4.1.1.
During quenching from 800 °C (550 °C + 800 °C-WQ) the
volume fraction of transformed a phase increases, however, a
higher volume fraction of b phase is retained and the lamellar
structure is coarser (Figs. 4b and 5b) which we ascribe to the kinet-
ics of the b-to-a phase transformation. Generally, the annealing
temperature and cooling rate determine the volume fraction of
the recrystallized a phase [21]. It was reported before [35] for
Ti-811 (Ti–8Al–1Mo–1V) that b transforms to martensite when
quenched from 950 °C but is retained as bcc b when quenched
Fig. 8. (a) Backscattered electron (BSE) images of Ti–4Mo after cyclic treatment from the water quenched state (950 °C-WQ + 4 cycles), (b) corresponding EBSD IQ and phase
map showing b phase inside the a laths. In the BSE micrographs (a) a phase exhibits a brighter contrast and b phase a darker contrast; in the IQ map (b) a phase has a darker
contrast and b phase a brighter contrast.
Fig. 9. Bright-field transmission electron micrographs of Ti–4Mo 950 °C-FC and convergent beam electron diffraction (CBED) patterns ([0001]a and [110]b) showing
alternating a and b lamellae with near-Burgers orientation relationship between the two phases.
Z. Tarzimoghadam et al. / Acta Materialia 97 (2015) 291–304 299

from 800 °C. Annealing in the a + b field (800 °C, heat treatment
550 °C + 800 °C-WQ) produces a microstructure with primary aphase surrounded by retained b phase, Figs. 4b and 5b. The recrys-
tallized b phase penetrates into recrystallized a lamellae along the
a/a grain boundaries, Fig. 5b. During separation into a and b par-
titioning of the alloying element Mo, which is a strong b stabilizer,
into the b phase was observed, Fig. 15. The solutes are quenched
into the b phase during cooling and the b phase is thus preserved
at room temperature.
4.1.1. Martensitic transformation and structures
Decomposition of the high temperature bcc b-phase upon cool-
ing may proceed via diffusional, shear or mixed diffusional and
shear modes [36]. Water-quenching from 950 °C produces a
martensitic microstructure (550 °C + 950 °C-WQ and 950 °C-WQ),
Figs. 4c and 6a,b. Our current microstructure observations show
that some of the larger (1-2 lm thickness) martensite plates of
Ti–4Mo 550 °C + 950 °C-WQ consist of a number of parallel plates
separated by sub-boundaries representing a morphology between
Fig. 10. TEM bright-field micrographs showing the structure and interfaces of primary and secondary martensite plates of 550 °C + 950 °C-WQ. Irregular interfaces of the
primary martensite plates are marked by red arrows. The yellow arrow points at a primary plate boundary with a ‘‘step-like’’ interface structure. (For interpretation of the
references to color in this figure legend, the reader is referred to the web version of this article.)
Fig. 11. (a, b) Electron channeling contrast images and c) bright-field transmission electron micrograph of Ti–4Mo after heat treatment 550 °C + 950 °C-WQ revealing the
substructure inside martensite plates. The contrast is due to the crystallographic orientation.
Fig. 12. (a) Image quality (IQ) and (b) inverse pole figure (IPF) map of sample 550 °C + 950 °C-WQ showing {10 �12} (tensile) and {10 �11} (compression) accommodation twins
in Ti–4Mo (IPF map), (c) bright-field transmission electron micrographs and selected area diffraction pattern taken from a single plate showing {10 �12} (tensile)
accommodation twins inside the martensite plate. The yellow arrow shows the ‘‘step-like’’ interface structure of an accommodation twinned martensite plate. (For
interpretation of the references to color in this figure legend, the reader is referred to the web version of this article.)
300 Z. Tarzimoghadam et al. / Acta Materialia 97 (2015) 291–304

massive colonies and single crystalline acicular martensite plates,
Figs. 4c and 6a,b. The presence of colonies of secondary plates with
massive morphology between primary acicular martensite plates is
assumed to result from the local release of latent heat as the pri-
mary plates are formed. The martensite plates contain a high num-
ber of {10 �12} and {10 �11} accommodation twins, Fig. 12. We
assume that the shear strain associated with {10 �12} and {10 �11}
twinning (0.171 and 0.101, respectively [7]) causes the observed
step-like appearance of accommodation twins with martensite
plate boundaries [37–39], see e.g. the yellow arrows in Figs. 10
and 12.
Davis et al. [36] conducted a detailed study on a series of Ti–Mo
alloys containing up to 10 wt% Mo, water-quenched from the
b-phase region. They assumed that Mo segregated to the b-phase
during quenching and concluded that, although shear holds the
main contribution during the transformation, diffusion also plays
a role in the nucleation and growth of martensitic structures in
Ti4-Mo. Contrary to this study [36] we observed no Mo
partitioning but a homogeneous Mo distribution in Ti4-Mo
550 °C + 950 °C-WQ and Ti4-Mo 950 °C-WQ using EDX and APT.
In Fig. 16 we show EBSD-EDS and APT analysis of the
550 °C + 950 °C-WQ sample and high resolution TEM-EDX analysis
of 950 °C-WQ. APT analysis and TEM-EDX analysis were performed
at a/b interfaces. The APT tips were prepared via a site-specific FIB
method [31,32], extracting the specimen parallel to the a/binterfaces. No Mo partitioning but a homogenous solid solution
was observed for both conditions, 550 °C + 950 °C-WQ and
950 °C-WQ, indicating a displacive martensitic transformation
upon quenching. It should be noticed here that the statistical rele-
vance is low in the case of APT analysis; however, these results
indicate a non-diffusional martensitic transformation upon
quenching in the present study.
Martensitic structures in titanium alloys decompose when a
quenched alloy is subjected to subsequent heat treatments [40].
The decomposition reaction occurs above the Mf temperature1
and depends on the martensite crystal structure and the alloy com-
position [40]. Tempering of a0 martensite in b-isomorphous alloys
was reported to proceed through a0? a + b causing the precipita-
tion of secondary a and b [40]. b was reported to nucleate heteroge-
neously at the a0 plate boundaries with a very coarse distribution
[40]. Williams et al. [41] found no significant strengthening by these
precipitates. Our observations show that such decomposition occurs
already after 30 min tempering at 550 °C, Figs. 13 and 14. The TEM
analysis shows the presence of secondary a and b phase precipitates
and lamellae in the tempered structure, Figs. 13 and 14. The decom-
position reaction involves Mo diffusion and partitioning as revealed
by APT analysis, Fig. 14. Tempering and decomposition of the a0
martensite results in slightly decreased strength and significantly
enhanced ductility, Fig. 3. This observation indicates that solid solu-
tion and martensite distortion affect the alloy’s strength more than
the formation of b precipitates in the present case.
During cyclic heat treatment at 550 °C (950 °C-WQ + 4 cycles)
an a/b colony structure starts to form, Fig. 7b. b nucleates at the
primary a0 lath boundaries and the existing boundary b grows in
thickness, Fig. 7b. The b phase precipitates inside some of the pri-
mary a0 laths are assumed to have nucleated from twin boundaries
inside the laths.
4.2. Relationship between the microstructures and the mechanical
properties
Fig. 17 shows the tensile mechanical properties of the investi-
gated Ti–4Mo alloys for the different applied heat treatments. For
comparison the mechanical properties of grade 1 CP Ti and grade
2 CP Ti are also shown.
According to [7] grade 1 commercially pure (CP) titanium exhi-
bits an ultimate tensile strength (UTS) of 240 MPa with 24% total
elongation and grade 2 CP Ti an UTS of 345 MPa and 20% elonga-
tion, respectively (CP: commercial purity standard). Our study
shows that by minor alloying and appropriate heat treatment sig-
nificant modifications of the mechanical properties can be
achieved.
The main source of strength, strain incompatibility, and stress
inhomogeneity in titanium alloys are the a/b interfaces acting as
barriers against dislocation motion [4,42,43]. Generally, the
b-grain size, size of the colonies of a-phase lamellae, thickness of
the a-lamellae and the interlamellar interface character are con-
sidered as important microstructural parameters determining the
mechanical properties of a/b Ti alloys [21,22].
It was shown that the peak stress values for transformed
microstructures at low strain follow a Hall–Petch dependence on
the lath thickness [5,12]. Therefore, we assume that a similar
Hall–Petch behavior was active in the two-phase a–b titanium
alloys with Widmanstätten and/or colony a microstructures;
meaning that the Hall–Petch effect was controlled by the proper-
ties and thickness of the a laths and platelets. The a colony size
determines the effective slip length in lamellar microstructures
across similarly oriented laths [12,44]. The width of the alamellae and the colony size in Widmanstätten structures
(550 °C + 950 °C-WQ, 950 °C-WQ) are significantly smaller
than in a/b colony structures (950 °C-FC, 550 °C + 800 °C-WQ),
Fig. 13. (a) Bright-field transmission electron micrographs of Ti–4Mo 950 °C-WQ + 550 °C, (b) magnified region of (a) and corresponding diffraction pattern, revealing the
presence of secondary a precipitates in a0 martensite.
1 Mf temperature: Martensite finish temperature, temperature at which the b-to-
a0-martensite-transformation finishes during cooling.
Z. Tarzimoghadam et al. / Acta Materialia 97 (2015) 291–304 301

Figs. 4–6, presumably causing the observed enhanced tensile
strength. At the same time it was reported that microcracks often
nucleate at grain boundaries and a/b phase boundaries due to the
local stress field induced by dislocation accumulations and
pile-ups [44,45], which is assumed to be the reason for the
observed reduction in ductility.
Another reason for the ductility enhancement of Ti4Mo
950 °C-FC and Ti4Mo550 °C + 800 °C-WQ with respect to Ti4Mo
550 °C + 950 °C-WQ is the volume fraction of the b-phase [46]. In
Ti alloys a and b phases are both ductile and it is generally
assumed that the a-phase is softer than the b-phase and, hence,
dislocation slip is initiated in the a-phase [4,35,45]. Even though
slip initiates in the softer of the two lamellar phases and impinges
on the harder phase, macroscopic yielding occurs when a slip sys-
tem, once activated in the softer phase, has the ability to shear the
harder phase [35]. However, with increasing volume fraction of the
b phase the effective length scale reduces and eventually elimi-
nates the plastic constraint. Then it is likely that this phase will
become the softer of the two phases initiating dislocation slip [4].
By comparing the properties of Ti–4Mo quenched from the b
region (950 °C) with and without prior holding at 550 °C
(550 °C + 950 °C-WQ and 950 °C-WQ) we observe that annealing
at 550 °C before b annealing increases the tensile strength without
any significant decrease in ductility. Holding at 550 °C for 6 h leads
Fig. 14. (a) Bright-field transmission electron micrograph and selected area diffraction pattern depicting the near-Burgers orientation relationship observed between the a(hcp) and b (bcc) phases in Ti–4Mo after heat treatment 950 °C-WQ + 550 °C. (b) TEM bright field image, APT elemental map showing Mo atoms and (c) the corresponding 1-D
concentration profile (bin width 0.5 nm) across the Mo enriched layer (cylindrical region of interest in (b)) showing very pronounced partitioning of Mo (red) of about 20 at%
into a �20 nm thick b lamellar zone, strongly enhancing its stability against phase transformation. (For interpretation of the references to color in this figure legend, the
reader is referred to the web version of this article.)
Fig. 15. (a) EBSD phase map and (b) corresponding EDS map for Mo of Ti–4Mo after
heat treatment 550 °C + 800 °C-WQ. The data clearly reveal the partitioning of Mo
into the bcc b phase promoting its stability.
302 Z. Tarzimoghadam et al. / Acta Materialia 97 (2015) 291–304

to a high Mo concentration and homogeneous Mo distribution in
the a phase causing a finer microstructure after quenching from
the b region and, hence, higher strength. Generally, massive
accommodation twinning is observed in the martensitic structures
of Ti–4Mo 550 °C + 950 °C-WQ and Ti–4Mo 950 °C-WQ, Figs. 11
and 12, leading to structural refinement. Besides the martensitic
distortion this structural refinement is supposed to contribute to
the lower uniform elongation and higher strength. Tempering of
the martensitic structure (950 °C-WQ + 550 °C) leads to an increase
in the lath thickness (Fig. 7a), growth of the b phase (Fig. 7a), and
relaxation of the distorted martensitic structure. These factors
result in a reduction of the tensile strength and increase in tensile
elongation when compared to the primary martensitic structures
(550 °C + 950 °C-WQ and 950 °C-WQ).
When applying a cyclic heat treatment b layers systematically
form in between the a laths and the primary a laths start to break
into smaller colonies subdivided by b films, Figs. 7b and 8. We
assume that the twin boundaries inside the laths are acting as pref-
erential nucleation sites for b. When comparing the quenched state
(950 °C-WQ) with cyclic heat treated samples (950 °C-WQ + 4
cycles) a slight decrease in strength (from 800 MPa to 700 MPa)
with a doubling in tensile elongation (from 12% to about 25%)
was achieved. Such finely scaled laminate metallic dual phase
microstructures consisting of a martensite matrix and reverted
austenite layers were also earlier reported to increase both, ductil-
ity and strength at the same time in a Fe-Mn steel [47].
5. Conclusions
(1) A broad variety of different mechanisms and kinetics of
microstructure formation including diffusion driven allotro-
pic phase transformations as well as shear and/or diffusion
dominated modes of martensitic transformations was
observed in a simple binary Ti–4Mo alloy. Depending on
the applied heat treatment the topology, size and chemistry
of a, b, a0 phases can be varied leading to a wide spectrum of
mechanical properties.
(2) Variation in the heat treatment parameters (annealing
temperature and cooling rate) enable accessing the full
range of mechanical properties from low strength and
high ductility (500 MPa, 25% elongation) to high
strength and lower ductility (1100 MPa, 12% elongation)
in a binary near-a Ti–Mo alloy. Laminate dual phase
Fig. 16. SEM-EDX and corresponding phase map (a) of 550 °C + 950 °C-WQ, Mo EDX map (b), (c) APT elemental map showing Mo atoms and (d) the corresponding 1-D
concentration profile (bin width 0.5 nm) of 550 °C + 950 °C-WQ. The APT tip was prepared site specific with an a/b interface vertically aligned in the tip. (d) High resolution
TEM-EDX analysis of an a/b interface in 950 °C-WQ. No Mo partitioning but solid solution is revealed for 550 °C + 950 °C-WQ and 950 °C-WQ.
Fig. 17. Tensile mechanical properties of Ti–4Mo after different heat treatments
conducted in this work compared with grade 1 and 2 CP titanium [7]; (CP:
commercial purity standard).
Z. Tarzimoghadam et al. / Acta Materialia 97 (2015) 291–304 303

microstructures obtained by tempering and thermal
cycling increase both, strength and ductility at the same
time.
(3) Water quenching from the b phase region (950 °C) causes
the formation of hexagonal type (a0) martensite, showing a
tensile strength of 1100 MPa at 12% elongation. This is
attributed to the reduction of a colony size and martensite
formation.
(4) b transforms to a0 martensite when the alloy is
quenched from the b-phase field (950 °C) but it is
retained as bcc b when quenched from the two phase
region (800 °C).
(5) The martensitic structures in Ti–4Mo represent a morphol-
ogy intermediate between massive colonies and acicular
martensite plates. It is found that shear and diffusional com-
ponents contribute to the transformation of Ti–4Mo depend-
ing on the cooling rate.
(6) Tempering and cyclic heat treatment of quenched Ti–4Mo
cause microstructure coarsening and tempering of the
martensite resulting in a minor decrease in strength but sig-
nificant increase in ductility.
(7) We observed that none of the various heat treatments
applied in this study lead to complete mesoscale chemical
equilibrium states, however, near-equilibrium partitioning
of Mo is indeed observed at the nanoscale where the two
phases are abutting.
References
[1] E.W. Collings, The Physical Metallurgy of Titanium Alloys, American Society of
Metals, 1984.[2] R. Boyer et al., Materials Property Handbook: Titanium Alloys, ASM
International, 1994.
[3] S.L. Semiatin, V. Seetharaman, I. Weiss, Advances in Science and Technology ofTi Alloy Processing, Metals and Materials Society, The Minerals, 1997.
[4] D. Banerjee, J.C. Williams, Acta Mater. 61 (2013) 844–879.[5] S.L. Semiatin, T.R. Bieler, Acta Mater. 49 (2001) 3565–3573.
[6] G. Lütjering, J. Albrecht, O.M. Ivasishin, in: Proceedings of the Titanium’95:
Science and Technology, TMS, 1995, pp. 1163–1170.[7] G. Lütjering, J.C. Williams, Titanium, 2nd ed., Springer, Berlin, 2007.
[8] C. Leyens, M. Peters, Titanium and Titanium Alloys, Wiley-VCH, Weinheim,2003.
[9] B. Liu, Y.P. Li, H. Matsumoto, Y.B. Liu, Y. Lib, A. Chiba, Mater. Sci. Eng., A 528(2011) 2345–2352.
[10] S. Banerjee, P. Mukhopadhyay, Phase Transformations, Examples from
Titanium and Zirconium Alloys, Elsevier, Oxford, 2007.[11] T. Ahmed, H.J. Rack, Mater. Sci. Eng., A 243 (1998) 206–211.
[12] J. Tiley, T. Searles, E. Lee, S. Kar, R. Banerjee, J.C. Russ, H.L. Fraser, Mater. Sci.
Eng., A 372 (2004) 191–198.[13] D. He, J. Zhu, S. Zaefferer, D. Raabe, Mater. Des. 56 (2014) 937–942.
[14] L. He, A. Dehghan-Manshadi, R.J. Dippenaar, Mater. Sci. Eng., A 549 (2012)163–167.
[15] S.L. Semiatin, V. Seetharaman, I. Weiss, Mater. Sci. Eng., A 263 (1999) 257–271.
[16] L. Wang, R.I. Barabash, Y. Yang, T.R. Bieler, M.A. Crimp, P. Eisenlohr, W. Liu, G.E.Ice, Metall. Mater. Trans. A 42 (2011) 626–635.
[17] T.R. Bieler, S.L. Semiatin, Int. J. Plasticity 18 (2002) 1165–1189.[18] C.C. Tasan, M. Diehl, D. Yan, C. Zambaldi, P. Shanthraj, F. Roters, D. Raabe, Acta
Mater. 81 (2014) 386–400.
[19] C.C. Tasan, J.P.M. Hoefnagels, M. Diehl, D. Yan, F. Roters, D. Raabe, Int. J.Plasticity 63 (2014) 198–210.
[20] L. Zeng, T.R. Bieler, Mater. Sci. Eng., A 392 (2005) 403–414.[21] G. Lütjering, Mater. Sci. Eng., A 243 (1998) 32–45.
[22] R. Filip, K. Kubiak, W. Ziaja, J. Sieniawski, J. Mater. Process. Technol. 133 (2003)84–89.
[23] J.H. Kim, S.L. Semiatin, C.S. Lee, Acta Mater. 51 (2003) 5613–5626.
[24] S.V. Zherebtsov, G.A. Salishchev, R.M. Galeyev, O.R. Valiakhmetov, S. YuMironov, S.L. Semiatin, Scripta Mater. 51 (2004) 1147–1151.
[25] D. He, J.C. Zhu, S. Zaefferer, D. Raabe, Y. Liu, Z.L. Lai, X.W. Yang, Mater. Sci. Eng.,A 549 (2012) 20–29.
[26] B. Sander, D. Raabe, Mater. Sci. Eng., A 479 (2008) 236–247.
[27] D.A. Porter, K.E. Easterling, Phase Transformations in Metals and Alloys, 2nded., Chapman and Hall, London, 1992.
[28] E. Pereloma, D.V. Edmonds (Eds.), Phase Transformations in Steels, WoodheadPublishing, Cambridge, 2012.
[29] D. Raabe, M. Sachtleber, Z. Zhao, F. Roters, S. Zaefferer, Acta Mater. 49 (2001)
3433–3441.[30] K. Thompson, D. Lawrence, D.J. Larson, J.D. Olson, T.F. Kelly, B. Gorman,
Ultramicroscopy 107 (2007) 131–139.[31] M. Herbig, D. Raabe, Y.J. Li, P. Choi, S. Zaefferer, S. Goto, Phys. Rev. Lett. 112
(2014) 1–5.[32] Y. Toji, H. Matsuda, M. Herbig, P.-P. Choi, D. Raabe, Acta Mater. 65 (2014) 215–
228.
[33] D. Raabe, B. Sander, M. Friak, D. Ma, J. Neugebauer, Acta Mater. 55 (2007)4475–4487.
[34] M. Friak, B. Sander, D. Raabe, J. Neugebauer, J. Phys.: Condens. Matter. 20(2008).
[35] K.S. Chan, C.C. Wojcik, D.A. Koss, Metall. Trans. A 12 (1981) 1899–1907.
[36] R. Davis, H.M. Flower, D.R.F. West, J. Mater. Sci. 14 (1979) 712–722.[37] D. Bhattacharyya, G.B. Viswanathan, R. Denkenberger, D. Furrer, H.L. Fraser,
Acta Mater. 51 (2003) 4679–4691.[38] J.C. Williams, R. Taggart, D.H. Polonis, Metall. Trans. 1 (1970) 2265–2270.
[39] R.H. Ericksen, R. Taggart, D.H. Polonis, Acta Metall. 17 (1969) 553–564.[40] F.X. Gil Mur, D. Rodriguez, J.A. Planell, J. Alloys Compd. 234 (1996) 287–289.
[41] J.C. Williams, B.S. Hickman, Metall. Trans. 1 (1970) 2648–2650.
[42] S. Suri, G.B. Viswanathan, T. Neeraj, D.-H. Hou, M.J. Mills, Acta Mater. 47 (1999)1019–1034.
[43] M.F. Savage, J. Tatalovich, M. Zupan, K.J. Hemker, M.J. Mills, Mater. Sci. Eng., A319–321 (2001) 398–403.
[44] R. Liu, S. Hui, W. Ye, Y. Yu, Y. Fu, X. Song, X. Deng, Rare Met. 31 (2012) 420–423.
[45] T.R. Bieler, A. Fallahi, B.C. Ng, D. Kumar, M.A. Crimp, B.A. Simkin, A. Zamiri, F.Pourboghrat, D.E. Mason, Intermetallics 13 (2005) 979–984.
[46] Y. Liu, L.F. Chen, H.P. Tang, C.T. Liu, B. Liu, B.Y. Huang, Mater. Sci. Eng., A 418(2006) 25–35.
[47] M.-M. Wang, C.C. Tasan, D. Ponge, A. Kostka, D. Raabe, Acta Mater. 79 (2014)268–281.
304 Z. Tarzimoghadam et al. / Acta Materialia 97 (2015) 291–304