MicroRNA Fingerprints Identify miR150 as a Plasma Prognostic Marker in Patients with Sepsis
10
MicroRNA Fingerprints Identify miR-150 as a Plasma Prognostic Marker in Patients with Sepsis Catalin Vasilescu 1. , Simona Rossi 2. , Masayoshi Shimizu 2 , Stefan Tudor 1 , Angelo Veronese 3 , Manuela Ferracin 3 , Milena S. Nicoloso 2 , Elisa Barbarotto 2 , Monica Popa 1 , Oana Stanciulea 1 , Michael H. Fernandez 4 , Dan Tulbure 5 , Carlos E. Bueso-Ramos 4 , Massimo Negrini 3 , George A. Calin 2 * 1 Department of Surgery, Fundeni Clinical Hospital, Bucharest, Romania, 2 Department of Experimental Therapeutics, The University of Texas M. D. Anderson Cancer Center, Houston, Texas, United States of America, 3 Department of Experimental and Diagnostic Medicine, Interdepartmental Center for Cancer Research, University of Ferrara, Ferrara, Italy, 4 Department of Hematopathology, The University of Texas M. D. Anderson Cancer Center, Houston, Texas, United States of America, 5 Department of Anesthesiology, Fundeni Clinical Hospital, Bucharest, Romania Abstract Background: The physiopathology of sepsis continues to be poorly understood, and despite recent advances in its management, sepsis is still a life-threatening condition with a poor outcome. If new diagnostic markers related to sepsis pathogenesis will be identified, new specific therapies might be developed and mortality reduced. Small regulatory non- coding RNAs, microRNAs (miRNAs), were recently linked to various diseases; the aim of our prospective study was to identify miRNAs that can differentiate patients with early-stage sepsis from healthy controls and to determine if miRNA levels correlate with the severity assessed by the Sequential Organ Failure Assessment (SOFA) score. Methodology/Principal Findings: By using genome-wide miRNA profiling by microarray in peripheral blood leukocytes, we found that miR-150, miR-182, miR-342-5p, and miR-486 expression profiles differentiated sepsis patients from healthy controls. We also proved by quantitative reverse transcription-polymerase chain reaction that miR-150 levels were significantly reduced in plasma samples of sepsis patients and correlated with the level of disease severity measured by the SOFA score, but were independent of the white blood counts (WBC). We found that plasma levels of tumor necrosis factor alpha, interleukin-10, and interleukin-18, all genes with sequence complementarity to miR-150, were negatively correlated with the plasma levels of this miRNA. Furthermore, we identified that the plasma levels ratio for miR-150/interleukin-18 can be used for assessing the severity of the sepsis. Conclusions/Significance: We propose that miR-150 levels in both leukocytes and plasma correlate with the aggressiveness of sepsis and can be used as a marker of early sepsis. Furthermore, we envision miR-150 restoration as a future therapeutic option in sepsis patients. Citation: Vasilescu C, Rossi S, Shimizu M, Tudor S, Veronese A, et al. (2009) MicroRNA Fingerprints Identify miR-150 as a Plasma Prognostic Marker in Patients with Sepsis. PLoS ONE 4(10): e7405. doi:10.1371/journal.pone.0007405 Editor: Jeffrey A. Gold, Oregon Health & Science University, United States of America Received July 16, 2009; Accepted September 17, 2009; Published October 12, 2009 Copyright: ß 2009 Vasilescu et al. This is an open-access article distributed under the terms of the Creative Commons Attribution License, which permits unrestricted use, distribution, and reproduction in any medium, provided the original author and source are credited. Funding: GAC was supported as a Fellow of The University of Texas M. D. Anderson Research Trust, a Fellow of The University of Texas System Regents Research Scholar, and by the Ladjevardian Regents Research Scholar Fund. MN was supported by funding from the Italian Ministry of University and Research and the Italian Ministry of Health. CV was supported by grant CEEX 187/2006 (The Program for Excellence in Research). The funders had no role in study design, data collection and analysis, decision to publish, or preparation of the manuscript. Competing Interests: The authors have declared that no competing interests exist. * E-mail: [email protected] . These authors contributed equally to this work. Introduction Sepsis represents a serious medical condition characterized by a whole-body inflammatory state called systemic inflammatory response syndrome, which is caused by a suspected or proven severe infection [1–3]. Severe sepsis occurs when sepsis leads to dysfunction of at least one organ or system due to hypoperfusion or hypotension, while septic shock is associated with refractory arterial hypotension despite aggressive fluid resuscitation and with multiple organ dysfunction syndrome. The criteria for diagnosis of sepsis and severity were established by the American College of Chest Physicians and the Society of Critical Care Medicine Consensus in 1992 and remain valid [2]. Despite recent advances in management, sepsis is still a life-threatening condition with a poor outcome and is the major cause of death among critically ill patients in intensive care units (ICUs) [3]. The physiopathology of sepsis continues to be poorly understood and, consequently, only a few specific therapies are available to treat this condition. Several scoring systems are used, including the sequential organ failure assessment (SOFA) score, but these systems evaluate clinical parameters related to the associated multiple organ dysfunction syndrome and do not include any factor involved in pathogenesis of the sepsis itself. Intraabdominal sepsis after abdominal surgery is responsible for approximately 13% of all ICU admissions [4,5]. Studies have suggested that clearance of intraperitoneal sepsis may be beneficial when patients develop signs of intraabdominal sepsis PLoS ONE | www.plosone.org 1 October 2009 | Volume 4 | Issue 10 | e7405
-
Upload
independent -
Category
Documents
-
view
1 -
download
0
Transcript of MicroRNA Fingerprints Identify miR150 as a Plasma Prognostic Marker in Patients with Sepsis

MicroRNA Fingerprints Identify miR-150 as a PlasmaPrognostic Marker in Patients with SepsisCatalin Vasilescu1., Simona Rossi2., Masayoshi Shimizu2, Stefan Tudor1, Angelo Veronese3, Manuela
Ferracin3, Milena S. Nicoloso2, Elisa Barbarotto2, Monica Popa1, Oana Stanciulea1, Michael H.
Fernandez4, Dan Tulbure5, Carlos E. Bueso-Ramos4, Massimo Negrini3, George A. Calin2*
1 Department of Surgery, Fundeni Clinical Hospital, Bucharest, Romania, 2 Department of Experimental Therapeutics, The University of Texas M. D. Anderson Cancer
Center, Houston, Texas, United States of America, 3 Department of Experimental and Diagnostic Medicine, Interdepartmental Center for Cancer Research, University of
Ferrara, Ferrara, Italy, 4 Department of Hematopathology, The University of Texas M. D. Anderson Cancer Center, Houston, Texas, United States of America, 5 Department
of Anesthesiology, Fundeni Clinical Hospital, Bucharest, Romania
Abstract
Background: The physiopathology of sepsis continues to be poorly understood, and despite recent advances in itsmanagement, sepsis is still a life-threatening condition with a poor outcome. If new diagnostic markers related to sepsispathogenesis will be identified, new specific therapies might be developed and mortality reduced. Small regulatory non-coding RNAs, microRNAs (miRNAs), were recently linked to various diseases; the aim of our prospective study was to identifymiRNAs that can differentiate patients with early-stage sepsis from healthy controls and to determine if miRNA levelscorrelate with the severity assessed by the Sequential Organ Failure Assessment (SOFA) score.
Methodology/Principal Findings: By using genome-wide miRNA profiling by microarray in peripheral blood leukocytes, wefound that miR-150, miR-182, miR-342-5p, and miR-486 expression profiles differentiated sepsis patients from healthycontrols. We also proved by quantitative reverse transcription-polymerase chain reaction that miR-150 levels weresignificantly reduced in plasma samples of sepsis patients and correlated with the level of disease severity measured by theSOFA score, but were independent of the white blood counts (WBC). We found that plasma levels of tumor necrosis factoralpha, interleukin-10, and interleukin-18, all genes with sequence complementarity to miR-150, were negatively correlatedwith the plasma levels of this miRNA. Furthermore, we identified that the plasma levels ratio for miR-150/interleukin-18 canbe used for assessing the severity of the sepsis.
Conclusions/Significance: We propose that miR-150 levels in both leukocytes and plasma correlate with the aggressivenessof sepsis and can be used as a marker of early sepsis. Furthermore, we envision miR-150 restoration as a future therapeuticoption in sepsis patients.
Citation: Vasilescu C, Rossi S, Shimizu M, Tudor S, Veronese A, et al. (2009) MicroRNA Fingerprints Identify miR-150 as a Plasma Prognostic Marker in Patients withSepsis. PLoS ONE 4(10): e7405. doi:10.1371/journal.pone.0007405
Editor: Jeffrey A. Gold, Oregon Health & Science University, United States of America
Received July 16, 2009; Accepted September 17, 2009; Published October 12, 2009
Copyright: � 2009 Vasilescu et al. This is an open-access article distributed under the terms of the Creative Commons Attribution License, which permitsunrestricted use, distribution, and reproduction in any medium, provided the original author and source are credited.
Funding: GAC was supported as a Fellow of The University of Texas M. D. Anderson Research Trust, a Fellow of The University of Texas System Regents ResearchScholar, and by the Ladjevardian Regents Research Scholar Fund. MN was supported by funding from the Italian Ministry of University and Research and theItalian Ministry of Health. CV was supported by grant CEEX 187/2006 (The Program for Excellence in Research). The funders had no role in study design, datacollection and analysis, decision to publish, or preparation of the manuscript.
Competing Interests: The authors have declared that no competing interests exist.
* E-mail: [email protected]
. These authors contributed equally to this work.
Introduction
Sepsis represents a serious medical condition characterized by a
whole-body inflammatory state called systemic inflammatory
response syndrome, which is caused by a suspected or proven
severe infection [1–3]. Severe sepsis occurs when sepsis leads to
dysfunction of at least one organ or system due to hypoperfusion
or hypotension, while septic shock is associated with refractory
arterial hypotension despite aggressive fluid resuscitation and with
multiple organ dysfunction syndrome. The criteria for diagnosis of
sepsis and severity were established by the American College of
Chest Physicians and the Society of Critical Care Medicine
Consensus in 1992 and remain valid [2]. Despite recent advances
in management, sepsis is still a life-threatening condition with a
poor outcome and is the major cause of death among critically ill
patients in intensive care units (ICUs) [3]. The physiopathology of
sepsis continues to be poorly understood and, consequently, only a
few specific therapies are available to treat this condition. Several
scoring systems are used, including the sequential organ failure
assessment (SOFA) score, but these systems evaluate clinical
parameters related to the associated multiple organ dysfunction
syndrome and do not include any factor involved in pathogenesis
of the sepsis itself. Intraabdominal sepsis after abdominal surgery is
responsible for approximately 13% of all ICU admissions [4,5].
Studies have suggested that clearance of intraperitoneal sepsis may
be beneficial when patients develop signs of intraabdominal sepsis
PLoS ONE | www.plosone.org 1 October 2009 | Volume 4 | Issue 10 | e7405

after abdominal procedures [4]. However, the diagnosis of
postoperative infections is difficult because clinical signs (e.g.,
pain, changes in level of consciousness, etc.) and laboratory
findings, such as elevated acute-phase reactants (e.g., C-reactive
protein), or fever are unspecific [5]. Therefore, new diagnostic
markers could offer advantages over routine clinical and
laboratory parameters in identifying postoperative patients with
early-stage sepsis.
Recently, a new category of non-coding RNAs (RNAs that do
not codify for proteins), named microRNAs (miRNAs), was found
to be involved in the initiation, progression, and metastasis of any
type of analyzed human cancer [6,7]; miRNAs also play a role in
other diseases, such as schizophrenia [8], diabetes [9], inflamma-
tory bowel disease [10], and renal disease [11]. miRNAs are small
RNAs that regulate expression of protein-coding genes by direct
(sequence complementarity) interaction with and degradation of
messenger RNAs (mRNAs) or by inhibition of protein translation
[12]. miRNAs have been implicated in a wide array of cellular and
developmental processes such as cell proliferation, apoptosis, and
differentiation [12]. In a previous experimental study on mice, we
demonstrated that miR-155 and miR-125b play a role in innate
immune response [13]. We found that lipopolysaccharide (LPS)
stimulation of mouse Raw 264.7 macrophages resulted in the
upregulation of miR-155 and downregulation of miR-125b levels.
The same changes also occurred when C57BL/6 mice were
intraperitonealy injected with LPS. The data suggest that the
LPS/tumor necrosis factor-alpha- (TNF-alpha) dependent regula-
tion of miR-155 and miR-125b may be implicated in the response
to endotoxin shock, thus offering new targets for drug design [13].
As a continuation of our previous work, in the present study we
interrogated miRNA expression in a set of sepsis patients by
performing genome-wide profiling by microarray in leukocytes
followed by quantitative reverse transcription-polymerase chain
reaction (qRT-PCR) on plasma samples; we then compared the
levels of miRNA expression in the sepsis patients with the miRNA
levels in a series of healthy controls. Furthermore, we identified a
plasma miRNA ratio (miR-150/IL-18) that can be used for
assessing the severity of the sepsis.
Materials and Methods
Sepsis Patients and Healthy ControlsIn the present study, we prospectively collected 24 samples from
17 sepsis patients (mean age +/2 standard deviation
(SD) = 55.4+/217.13 y; 9 women, 8 men) and 32 samples from
32 healthy controls (mean age+/2SD = 49.2+/220.12 y; 9
women, 23 men; p = 0.267 for age variation; p = 0.081 for gender)
of peripheral blood leukocytes and/or plasma. All patients were
admitted between November 2006 and March 2008 to the ICU at
Fundeni University Hospital, Bucharest, Romania, after various
types of abdominal surgeries (n = 8) or non-surgical related
infections (n = 9) (Table 1). SOFA scores were assessed at day 1
and day 7; we also scored the outcome of each patient (alive or
dead). The controls were healthy individuals selected from blood
donors, patients’ families, or research staff involved in the present
study. ‘‘Healthy’’ was defined as the absence of any type of
infection or known medical condition at the time of the study. All
patients and controls were white Caucasians (according to medical
records for patients and interview for controls).
We obtained both peripheral blood leukocytes and plasma for
10 sepsis patients and 12 controls and only plasma samples for the
remaining 7 sepsis patients and 20 controls. For seven of the
patients, we collected plasma samples at two time points (days 1
and 7 after admission); for one patient, we collected a sample only
at day 7 (Table 1). Peripheral blood leukocytes were obtained
from 5 ml blood, and total RNA was purified using Trizol
(Invitrogen, Carlsbad, CA). RNA quality was assessed by Agilent
2100 Bioanalyzer (Agilent Technologies, Palo Alto, CA), and only
RNA with an RNA integrity number (a measure of RNA quality)
higher than 7 was used for the expression-profiling study. Total
RNA in plasma was isolated using Total RNA purification Kit
(Norgen Biotek Corporation, Ontario, Canada) according to the
manufacturer’s instructions.
Ethics StatementFor de-identification, the samples were codified S (for sepsis)
and C (for controls) followed by a codified number to protect the
privacy of individuals during all the further molecular study. All
participants gave informed written consent to participate in this
study and the samples were processed under approval of the
Fundeni Hospital Ethics Committee.
Genome-wide Human miRNA Expression DetectionSixteen RNA samples from leukocyte (8 control, 8 sepsis) were
hybridized on a human miRNA microarray (G4470A, Agilent
Technologies). This microarray consisted of 60-mer DNA probes
for 470 human miRNAs, sourced from the Sanger miRBase public
database (Release 9.1). One-color miRNA expression was
performed according to the manufacturer’s procedure. Briefly,
total RNA was obtained from samples by using the Trizol reagent
(Invitrogen). Labeled miRNAs were obtained from 500 ng of total
RNA through the ligation of a 59-cytidine bisphosphate-Cy3 (pCp-
Cy3, Agilent Technologies) group at the 39-end of each miRNA.
To enhance the T4 RNA-ligase (Promega, Madison, WI)
efficiency, we had previously treated total RNA with alkaline
phosphatase (Amersham, Piscataway, NJ) at 37uC for 30 min.
Labeled miRNAs were purified on chromatography columns
(Micro Biospin 6, Biorad Laboratories, Hercules, CA) and then
hybridized on a microarray. Hybridizations were performed at
55uC for 17 h in a rotating oven. Images at 5-mm resolution were
generated by a scanner (Agilent Technologies), and the Feature
Extraction 9.5 software (Agilent Technologies) was used to obtain
the microarray raw data.
Microarray Data AnalysisMicroarray results were independently analyzed in two distinct
ways by MF in Ferrara, Italy and by SR in Houston, TX,
respectively. First, using GeneSpring GX software version 7.3
(Agilent Technologies), we preprocessed data files with the plug-in
for the Agilent Feature Extraction software results. Data
transformation was applied to set all negative raw values at 5.0,
followed by on-chip and on-gene median normalization. We
filtered data for low gene expression so that only probes expressed
(flagged as ‘‘present’’) in at least one sample were kept; probes that
did not change between samples, i.e., identified as having an
expression value across all samples between median61.5, were
removed. Next, samples were grouped according to their status
and then compared. Differentially expressed genes were selected as
having a 2-fold expression difference between their geometrical
mean in the two groups of interest (sepsis and control) and a
statistically significant p-value (p,0.05) by analysis of variance
statistics.
Independently, a second type of data analysis was performed
by using extracted fluorescence intensity values (Agilent Feature
Extraction) from all 16 hybridizations. The data were imported
into Biometric Research Branch (BRB) array tool version 3.7.0
(http://linus.nci.nih.gov/BRB-ArrayTools.html) for subsequent
microarray analysis. MiRNAs with less than 20% expression
miR-150 as Marker in Sepsis
PLoS ONE | www.plosone.org 2 October 2009 | Volume 4 | Issue 10 | e7405

data with at least 1.5-fold (expression between median61.5)
change and probes with values missing from more than 50% of
the arrays were removed, leaving 88 probes to be included in
data analysis. Absent calls were assigned at a threshold of 7
(log2) before statistical analysis. Intensities were normalized
using average factors scaled to the median array intensities over
the entire array by using the median array as a reference. This
filtering method was decided a priori to eliminate probes whose
miRNA expression levels were thought to be unreliable. Class-
comparison analysis using two-sided Student t-tests identified
miRNAs that were differentially expressed between sepsis and
control samples (p,0.05) and had a false discovery rate (FDR)
of less than 9%. Cluster analysis was done with Cluster 3.0
(http://linus.nci.nih.gov/BRB-ArrayTools.html) and displayed
using TreeView program (http://rana.lbl.gov/EisenSoftware.
htm). Microarray raw data are MIAME compliant and were
deposited in the public repository (ArrayExpress accession: E-
TABM-713).
qRT-PCR for miRNA ExpressionMiRNA levels were detected by qRT-PCR using the TaqMan
MicroRNA Assays (Applied Biosystems, Foster City, CA),
according to the manufacturer’s instructions. Experiments were
performed in triplicate wells. To normalize the expression levels of
target genes, we used U6B small nuclear RNA for the experiment
performed with RNAs from leukocytes, while miR-192 was used
for plasma RNA normalization. The relative expression of each
miRNA was calculated from the equation 2-DCT, where DCT = mean CtmiRNA – mean Ctinternal control (where Ct is the
threshold cycle for a sample). Briefly, the relative abundance of
each miRNA was calculated as the ratio of the value from sepsis to
the value from controls, producing a fold-change value. Data for
sepsis/control samples were compared using the two-sided Student
t-test (p,0.05).
MiRNA Target PredictionWe used two independent and complementary ways to predict
miRNA targets. First, we used miRGen at http://www.diana.
pcbi.upenn.edu/miRGen.html, which contains animal miRNA
targets according to combinations of the widely used target-
prediction programs miRanda, TargetScanS, and PicTar and
experimentally supported targets from TarBase. Second, we used
RNA22 at http://cbcsrv.watson.ibm.com/rna22.html, a pattern-
based method for identifying miRNA-target sites and their
corresponding RNA/RNA complexes, by using not only the 39
untranslated region of the mRNA but also the full messenger
sequence. We used the Database for Annotation, Visualization,
and Integrated Discovery (http://david.abcc.ncifcrf.gov) to
identify the pathway distribution of predicted targets. These
pathways were presented according to the Kyoto Encyclopedia of
Genes and Genomes (KEGG) database (http://www.genome.jp/
kegg/). This is a database of biological systems, consisting of the
genetic building blocks of genes and proteins; the identified
pathways are composed by molecular interactions and reaction
networks for metabolism, various cellular processes, and human
diseases.
Enzyme-Linked Immunosorbent Assay (ELISA)Due to the availability of material, the levels of human tumor
necrosis factor alpha (TNF-alpha, 12 control and 11 sepsis
samples), human interleukin-10 (IL-10, 11 control and 20 sepsis
samples), and human interleukin-18 (IL-18, 22 control and 18
sepsis samples) were measured by ELISA in undiluted plasma
samples. Commercially available ELISA kits for TNF-alpha and
IL-18 (R & D Systems, Minneapolis, MN) and IL-10 (BD
Biosciences, San Jose, CA) were used according to the manufac-
turers’ instructions. Results were read at an optical density of
450 nm using a Spectra Max Plus plate reader (Molecular
Devices, Sunnyvale, CA). Measurements were performed in
Table 1. Clinical Data, SOFA Score, and Plasma Ratio miR-150/192 for Analyzed Sepsis Patients.
Patient ID Sex Age EtiologySOFADay 1
Ratio miR-150/192 Day 1
WBC (x109/L)Day 1
SOFADay 7
Ratio miR-150/192 Day 7
WBC (x109/L)Day 7 Type Survival
S-1-76 F 76 Post-Surgery 1 0.442 15.7 NA NA 10.2 SSP alive
S-2-42 F 42 Post-Surgery 6 2.144 26.3 NA NA 16.2 SSP alive
S-3-78 F 78 Post-Surgery 1 2.307 25.4 NA NA 14.4 SP alive
S-4-78 M 78 Pulmonary infection 8 2.341 18.7 18 NA 26.4 SoP alive
S-5-23 F 23 Pulmonary infection 18 3.704 26.6 NA NA NA SoP dead
S-6-62 M 62 Post-surgery 4 3.749 21.2 NA NA 18.6 SSP alive
S-7-55 M 55 Pulmonary infection 9 5.567 13.9 NA NA 15.7 SSP alive
S-8-39 M 39 Pulmonary infection 12 6.812 29.9 NA NA 13.8 SoP alive
S-9-62 M 62 ThymectomyMiastenia Gravis
6 8.176 8.3 5 15.363 9.2 SSP alive
S-10-55 M 55 Post-surgery 13 8.203 3.2 NA NA NA SSP dead
S-11-73 F 73 Post-surgery 2 15.071 12.3 0 20.618 7.2 SP alive
S-12-28 F 28 Acute hepatic failure 7 37.683 20.8 6 60.803 12.3 SSP alive
S-13-43 M 43 Acute pancreatitis 2 45.776 19.9 0 0.528 16.6 SP alive
S-14-43 F 43 Acute pancreatitis 1 47.310 15 0 23.970 NA SP dead
S-15-51 F 51 Intestinal occlusion 5 56.595 25.7 2 65.922 18 SSP alive
S-16-65 M 65 Post-surgery 0 97.248 8.4 0 9.339 7.6 SP alive
S-17-69a F 69 Post-surgery 4 NA 14 6 48.940 10.2 SSP dead
aSample collected only at day 7.; SP, sepsis; SSP, severe sepsis; SoP, septic shock.doi:10.1371/journal.pone.0007405.t001
miR-150 as Marker in Sepsis
PLoS ONE | www.plosone.org 3 October 2009 | Volume 4 | Issue 10 | e7405

duplicate, and p-values were computed using the two-sided
Student t-test (p,0.05).
Statistical AnalysisThe t-test on microarray data identified miRNAs that were
differentially expressed between sepsis and control patients
(p,0.01, FDR,0.09). We also identified miRNAs and cytokines
that were differentially expressed in sepsis and control subjects
for qRT-PCR data using t-test (p,0.05). Matlab 6.5 (www.
mathworks.com) analysis was used for the Pearson’s correlation.
All statistical tests were two-sided, and statistical significance was
defined as p,0.05.
Results
MiRNA Genome-Wide Profiling in Peripheral BloodLeukocytes Differentiate Sepsis Patients from HealthyControls
To determine if miRNA patterns in patients with sepsis are
significantly different from those in healthy controls, we first used
microarray to compare the expression of 470 human miRNAs in
leukocytes from eight patients at day 1 (first day in ICU) with
expression profiles from eight healthy controls (Figure 1). As
array data analyses could be performed by several methods that
could reciprocally confirm each other, independent investigators
performed this essential step using two different tools—the BRB
array and GeneSpring GX software, respectively (see Materials
and Methods). We found that a set of 17 miRNAs correctly
differentiated 100% of the samples belonging to the two groups
(sepsis and control), meaning that expression of these miRNAs was
a good classifier for each category (Figure 1A). In both types of
analyses, we identified four miRNAs— miR-150, miR-182, miR-
342-5p and miR-486 —whose expression levels differed by at least
a factor of 2 between sepsis and healthy samples (p#0.01;
FDR,0.08): miR-486 and miR-182 were overexpressed, while
miR-150 and miR-342-5p were downregulated in sepsis patients. Of
note, miR-155 and miR-125b, the former upregulated, while the
latter down-regulated by LPS stimulation of Raw 264.7 mouse
macrophages [13], were not statistically significant dysregulated in
the analyzed set of patients.
For independent confirmation, we performed a distinct type of
quantification, qRT-PCR amplification for the active miRNA
molecule in a set of 10 sepsis and 12 control leukocyte samples,
including the 16 samples analyzed by the array. qRT-PCR was
performed for miR-150, miR-182, miR-342-5p, and miR-486 using
the same total RNA as for the array; we used U6B as control. For
all four genes we confirmed the same variation identified by the
array, and in all instances, except for miR-486, with both methods
the ratio was at least 2-fold between sepsis patients and controls
(Figure 1B). Therefore, we were able to identify a miRNA
signature that was associated with early stages of sepsis (on first day
of admission to ICU). To get a higher confidence, we
independently confirmed this signature using two types of
statistical analysis and two types of miRNA quantification.
MiR-150 Levels in Plasma Are Significantly Reduced inSepsis Patients Compared with Controls and Correlatewith the Level of Sepsis Severity
Recently, miRNA expression in plasma was detected by using
qRT-PCR techniques [14]. We focused for the present study on
miR-150, as it has the highest levels of dysregulation in sepsis
samples versus controls (Figure 1B). Therefore, we investigated
the expression of miR-150 in plasma by performing qRT-PCR on
24 sepsis (including 16 at day 1 and 8 at day 7) and 32 control
samples. We initially used U6 and U6B for the selection of the
normalizer gene, but since these RNAs were degraded in plasma
we could not obtain reproducible results in triplicate experiments.
Thereafter, we analyzed two miRNAs (miR-192 and let-7a) that,
according to the array data, had no variance in expression
between sepsis samples and controls. The best reproducible results
were obtained with miR-192; therefore, we used the expression of
this miRNA as a reference value (Figure 2A). We found that miR-
150 was significantly down regulated in plasma from sepsis
patients compared with controls at both days 1 and 7 at highly
statistically significant values (p = 0.001 and p = 0.005, respectively)
(Figure 2A). Therefore, plasma levels of miR-150 (expressed as
ratio with miR-192) reproduced the variations in leukocytes, and
represent a reliable indicator of early sepsis. Importantly, we did
not find any correlation between the plasma levels of miR-150 and
the number of leukocytes (expressed as white blood count, WBC)
in sepsis patients (Figure S1), meaning that this downregulation is
not just a biomarkers for the amount of circulating leukocytes.
MiR-182 and miR-342-5p, differentially expressed in leukocytes
were studied also in plasma; the trend of variation was as in
leukocytes for miR-342-5p and opposite for miR-182, and both of
them were not significantly differentially expressed, probably due
to the small number of sepsis samples with detectable expression (4
for miR-182 and 3 for miR-342-5p).
In studying the expression of miR-150 in plasma of the sepsis
patients (qRT-PCR data), we noticed a correlation between the
fold-difference value and SOFA score and/or associated severity
of sepsis (grades labeled as sepsis, severe sepsis, and septic shock).
Interestingly, by considering an 8.5-fold cutoff value for the
expression ratio miR-150/miR-192 (meaning at least three
amplification cycles’ difference for the DCt between miR-150
and miR-192) at day 1 (Figure 2B), we found that the 6 patients
with higher ratios (15.07 to 97.24) had significantly lower SOFA
scores than the 10 patients with lower ratios (0.44 to 8.20) (2.83+/
22.64 versus 7.80+/25.41 mean ratio 6 SD, respectively;
p = 0.028) (Table 1). All three patients with septic shock had
levels of miR-150 lower than 8.5. Furthermore the miR-150/miR-
192 relative expression was negatively correlated with the SOFA
score (Figure 2C) and this ratio decreased from the sepsis to
severe sepsis to sepsis shock patients (Figure S2). These data are
in agreement with our initial observation that sepsis patients have
lower levels of miR-150 than healthy controls; in fact, the patient
with the highest miR-150/192 ratio (97.24) had the lowest SOFA
score at both days 1 and 7. Further strengthening this conclusion,
we did not find any significant differences in miR-150 expression
between day 1 and day 7 (43.98+/229.35 versus 28.08+/225.32;
p not significant), as the SOFA score was quite similar for this
limited set of patients (day 1+/2SD = 3.28+/22.69 versus 1.86+/
22.61 for day 7; p not significant). Also, six of seven patients with
measurements on both day 1 and day 7 had miR-150/miR-192
ratios concordant with their SOFA scores (Table 1). Therefore,
consistently lower levels of miR-150 were found in both leukocyte
and plasma samples from sepsis patients than in healthy controls,
and lower expression was associated with poor clinical condition as
indicated by the SOFA score.
MiR-150 Expression Profile Is Correlated with Expressionof Immune System Genes
As the next step, we tried to understand if the variations in miR-
150 expression were only bystanders for other unknown causal
effects or if they were linked to the pathogenesis of this disease.
One way to do this was to identify correlations in clinical samples
between levels of miR-150 expression and that of important
miR-150 as Marker in Sepsis
PLoS ONE | www.plosone.org 4 October 2009 | Volume 4 | Issue 10 | e7405

protein-coding genes involved in the pathogenesis of sepsis.
Dysregulation of miRNA levels would be anticipated to affect
the translation of multiple protein-coding genes. Therefore, first
we performed target prediction for miR-150 by using miRGen and
found that among the predicted targets, at least 20 genes were
functionally related to immune system processes; among these
was IL-18, which is reportedly increased in patients with sepsis
[15–17]. Using the Database for Annotation, Visualization, and
Integrated Discovery (http://david.abcc.ncifcrf.gov) to identify
overrepresented pathways, we found that predicted miR-150
targets were significantly (p,0.05) clustered in a few KEGG
pathways, and the five most overrepresented pathways were all
Figure 1. Leukocyte miRNA Signature Differentiates Early Sepsis Patients from Healthy Controls. (A) The cluster shows a perfectseparation between the two classes of samples (sepsis vs. controls). The miRNA expression (log2) cluster shows differentially expressed genes asdetermined by t-test analysis. Yellow indicates high expression, and blue indicates low expression, relative to the median. (B) Fold change by qRT-PCRand array is shown for the leukocyte signature miRNAs. The most conspicuous differentially expressed miRNAs (sepsis vs. control) identified by bothBRB array tools and GeneSpring GX software and also by qRT-PCR in leukocyte cells are shown.doi:10.1371/journal.pone.0007405.g001
miR-150 as Marker in Sepsis
PLoS ONE | www.plosone.org 5 October 2009 | Volume 4 | Issue 10 | e7405
known to be involved in sepsis (Table 2): MAPK inhibition
improves survival in endotoxin shock and prevents sepsis [18];
Wnt has a role in regulation of inflammation [19]; and insulin
resistance [20,21], ErbB (EGFR) [22], and mTOR [23] are
related to immune and inflammatory response. As it is well known
that IL-10 and TNF-alpha play an important role in immune
response and are dysregulated in sepsis patients [24,25], we
checked by using an additional target prediction program
(RNA22) to identify possible regions of interaction with miR-150.
As shown in Figure 3A, miR-150 has regions of complementarity
to IL-10, TNF-alpha, and IL-18 mainly in the 59-end, the most
extended with IL-18. These data suggest possible direct interac-
tions and, more important for our clinical study, suggest possible
negative correlations between the expression of cytokines and miR-
150 in patient samples.
Therefore, we performed ELISA to determine levels of pro-
inflammatory TNF-alpha and anti-inflammatory IL-10 and IL-18
by using the same plasma samples in which the miRNA detection
was performed. We found significant differences in expression
levels between sepsis patients and controls (p = 0.026; p = 6.0E-04
and p = 6.8E-04, respectively) (Table 3), and these levels
correlated with the plasma levels of miR-150 in patients and
controls (Figures 3B). These data confirmed the imbalance
between pro-inflammatory and anti-inflammatory cytokines in our
sepsis patients, further confirming the selection of the patients for
this study. Supporting the separation of patients according to miR-
150 expression based on miR-192 normalization levels in plasma,
we found that IL-18 expression was markedly different between
the two categories of patients (greater than 8.5 ratio versus less
than 8.5 ratio). Therefore, we computed a ratio between IL-18
ELISA assay expression and miR-150 expression: patients with
miR-150/miR-192 fold difference less than 8.5 provided an IL-
18/miR-150 ratio statistically significantly higher (more than 10
times higher, p,0.05) than the group of patients with miR-150/
miR-192 expression of more than 8.5 (Figure 4). Although we did
not ruled out a casual association by performing functional studies
to prove the direct interaction between miR-150 and one/several
cytokines, these data suggest a possible functional correlation
between miR-150 plasma levels and cytokine expression in sepsis
patients and that the plasma levels ratio for miR-150/interleukin-
18 can be used for assessing the severity of the sepsis.
Discussion
In the present prospective study we interrogated miRNA
expression in a set of sepsis patients and found, by performing
genome-wide profiling by microarray in leukocytes followed by
quantitative reverse transcription-polymerase chain reaction
(qRT-PCR) on plasma samples that miR-150 is significantly down
regulated in respect with healthy controls levels and can be used
for assessing the severity of the sepsis.
This study is novel in several aspects. First, it addresses a
significant medical condition, the sepsis, from a new perspective—
the involvement of small non-coding RNAs. Sepsis is the major
cause of death among critically ill patients in ICU. Total mortality
for patients with acute postoperative sepsis is about 30%–35%;
however, the mortality rate for patients with severe sepsis is over
50% [1,26]. Consequently, severe sepsis is a disease in the need for
critical care resources. We found that in sepsis patients the
microRNoma (defined as the full spectrum of expressed miRNAs)
is different from that in healthy controls, both in leukocytes
(considered the cells involved in the immune disturbances
characteristic of sepsis) and plasma on the first day of admission
to the ICU. We found by microarray or qRT-PCR that the levels
Figure 2. Plasma Level of miR-150 is Significantly Lower inSepsis Patients as in Controls. (A) Microarray analysis of miR-192levels in leukocytes found no variance in expression between patientsand controls; qRT-PCR confirmed the same finding in plasma. Therefore,we used this miRNA as reference and normalized miR-150 levels inrespect to miR-192 and found significant downregulation at both day 1and day 7. Mean Ct plus standard deviation have been reported. Thelower panel represents the combination of data from the upper two. (B)The miR-150 and miR-192 levels of 16 sepsis patients are plotted by theirmean Ct values at day 1 after ICU admission. The round grey dotsrepresent the patients with lower expression levels (2-DCt) and lowerSOFA scores than the patients identified by square black dots. The greyshaded region indicates the threshold to classify miR-150, showing aclear division between samples with high and low expression levelsbased on miR-192 as the normalizer. (C) The miR-150 and miR-192 levelsof 16 sepsis patients are plotted by their miR-150/miR-192 relativeexpression values at day 1 after ICU admission related to the respectiveSOFA score. Interpolation line was reported.doi:10.1371/journal.pone.0007405.g002
miR-150 as Marker in Sepsis
PLoS ONE | www.plosone.org 6 October 2009 | Volume 4 | Issue 10 | e7405

of three miRNAs — miR-150, miR-182, and miR-342-5p — are at
least twice as dysregulated in leukocytes from patients than in
those from healthy controls. Supporting these findings is a recent in
vitro profile of the human leukocyte miRNA response to
endotoxemia in which leukocyte RNA was isolated from venous
blood samples obtained from three healthy male volunteers before
and 4 h after LPS infusion and profiled for miRNA expression
[27]. Five miRNAs consistently responded to LPS infusion, four of
which were downregulated (miR-146b, miR-150, miR-342, and
let-7g) and one of which was upregulated (miR-143) [27]. Also, miR-
150 was found to control c-Myb expression in vivo in a dose-
dependent manner over a narrow range of miRNA and c-Myb
concentrations, and this dramatically affected lymphocyte devel-
opment and response [28]. These data further strengthen the
functional significance of miR-150 downregulation in sepsis
patients. Furthermore, abnormal processing of miR-21 transcript
was recently reported in ICU patients suffering from sepsis-
induced multiple organ failure [29], expanding the spectrum of
miRNA alterations in sepsis.
Second, the recent identification of miRNAs in serum and
plasma from healthy individuals and individuals with pathologic
conditions, such as cancer, opens up the possibility of exploring
miRNAs as biomarkers of disease [14]. To our knowledge, this is
the first report of miRNA measurement in plasma from sepsis
patients. We found not only that miR-150 levels are significantly
different in patients and healthy controls, but also that the levels of
miR-150 correlate with SOFA scores (but not with WBC). SOFA is
a scoring system used to track a patient’s status while in the ICU; it
is based on six different scores, one each for the respiratory,
cardiovascular, hepatic, coagulation, renal, and neurological
systems [30]. We identified a ratio between the quantitative RT-
PCR expression of miR-150 and a nonvariable control miR-192
that can be used to assess the severity of sepsis based on its
correlation with the SOFA score. Additional candidates for large
studies could be miR-182 and miR-342-5p that we found
differentially expressed in sepsis versus control leukocytes.
Finally, we revealed a new potential pathogenetic mechanism
explaining some of the immune system dysfunctions in sepsis
patients. The malfunction of regulatory mechanisms during sepsis
can result in a loss of control of inflammation, eventually leading
to profound immunosuppression and host damage [31–33]. Our
study points to a miRNA regulation of pro- and anti-inflammatory
genes involved in sepsis. We found that the expression levels of
miR-150 correlated with those of main immune response genes,
such as TNF-alpha, IL-10, and IL-18. Furthermore, the putative
spectrum of targets of miR-150 is highly enriched in genes involved
in immune system functions. Therefore, in addition to miR-155
[34] and miR-125 [35], miR-150 could be one of the main
regulatory miRNAs of immune function, and our study unraveled
the clinical significance of the miR-150 expression correlation with
cytokine expression in patients with sepsis.
In conclusion, although the functions of most human miRNAs
have yet to be discovered, miRNAs have emerged as key
regulators of gene expression. The present data support the
hypothesis that miRNAs are main regulators of the immune
system, and abnormal expression has been found and can be used
as a diagnostic and prognostic marker in immune disease. Sepsis is
the newest addition to the long list of disease states proved by
studies in patients to be linked to abnormal miRNA expression.
One of the important regulators is miR-150, and this is significantly
abnormally expressed in both leukocytes and plasma from sepsis
patients. Our study is the first to identify a specific miRNA profile
and to interrogate about the clinical significance of miRNA
variations in sepsis patients. Due to the limited number of cases
originating in the same center and to the bias toward intra-
abdominal causes of sepsis, larger multi-institutional studies with
higher numbers of patients will establish the final prognostic
significance of our initial findings.
Supporting Information
Figure S1 White blood count (WBC) and miR-150/miR-192
relative expression plot. No correlation was found in 23 sepsis
samples (the WBC was missing for one sample) after standardi-
zation of miR-150 relative expression values and WBC values
meaning that miR-150/miR-192 ratio is not just a biomarker for
presence or absence of circulating leukocytes in sepsis. The
standard values were derived by subtracting the mean of the
relative expressions for miR-150 and miR-192 and mean of the
WBC, respectively from each individual relative expression value
and WBC value, respectively, and then dividing the difference by
the standard deviation, calculated for each one of the data series.
Found at: doi:10.1371/journal.pone.0007405.s001 (2.61 MB TIF)
Figure S2 miR-150/miR-192 relative expression correlates with
sepsis grade. The mean +/2 standard deviation of miR-150/miR-
192 fold difference related to sepsis grade (labeled as sepsis, SP,
severe sepsis, SSP, and septic shock, SoP) is reported. As expected,
miR-150 relative expression is higher in low sepsis grade samples
Table 2. The Most Overrepresented Pathways for miR-150 targets According to KEGG *.
KEGG Pathway Term Count % P value GENE NAMES
hsa04010: MAPK signalingpathway
26 3.25% 4.73E-04 ACVR1B, ARRB2, CACNA1G, CACNB3, CACNG1, CACNG3, CACNG6, CACNA1D, DDIT3,DUSP16, DUSP3, ELK1, GADD45B, MAPK8IP1, MAPK9, MAP2K4, MAP3K12, MAP3K13,NFATC4, PAK1, PRKCA, PRKACG, SRF, TP53, AKT3, CRKL
hsa04150: mTOR signalingpathway
8 1.00% 0.009812 EIF4B, EIF4E, IGF1, RHEB, STK11, ULK2, AKT3, VEGFA
hsa04910: Insulin signalingpathway
14 1.75% 0.010769 CBL, CBLB, ELK1, EIF4E, FLOT2, MAPK9, PPARGC1A, PRKACG, PRKAR1A, RHEB, SLC2A4,SOCS1, AKT3, CRKL
hsa04012: ErbB signalingpathway
10 1.25% 0.018937 CBL, CBLB, ELK1, MAPK9, MAP2K4, PAK1, PRKCA, AKT3, CRKL, ERBB2
hsa04310: Wnt signalingpathway
14 1.75% 0.026812 APC, DVL2, EP300, FBXW11, FZD4, FZD7, MAPK9, NFATC4, PRKCA, PRKACG, PPP2CB,PPP2R1A, SOX17, TP53
*- Count, number of potential target genes in the pathway; %, percentage of pathway genes that are targeted by miR-150. The gene name is presented as in NCBI athttp://www.ncbi.nlm.nih.gov.
doi:10.1371/journal.pone.0007405.t002
miR-150 as Marker in Sepsis
PLoS ONE | www.plosone.org 7 October 2009 | Volume 4 | Issue 10 | e7405

Figure 3. Negative Correlation Between Plasma Levels of miR-150 and Cytokines. (A) The complementary sequence between miR-150 andthe mRNAs of TNF-alpha, IL-10, and IL-18 is shown. Complementary sequences are reported, as well as the relative folding energy between miR-150and mRNAs by using RNA22. (B) ELISA determination for plasma markers of sepsis and correlation with miR-150 expression in plasma are depicted inthe graphs. The left panels show IL-10, IL-18 and TNF-alpha measurements by ELISA in plasma, mean Ct +/2 standard deviation have been reported.The right panels show the negative correlation between miR-150 and IL-10, IL-18 and TNF-alpha, respectively. Values, on a patient by patient basis,have been reported for each cytokine studied.doi:10.1371/journal.pone.0007405.g003
miR-150 as Marker in Sepsis
PLoS ONE | www.plosone.org 8 October 2009 | Volume 4 | Issue 10 | e7405
(SP). P values were not statistically significant, probably due to the
limited number of analyzed samples.
Found at: doi:10.1371/journal.pone.0007405.s002 (1.98 MB TIF)
Acknowledgments
We wish to thank Dr. Ileana Constantinescu and Mihaela Sora for initial
samples processing. We also thank Sue Moreau from the Department of
Scientific Publications at The University of Texas M. D. Anderson Cancer
Center for expert editorial assistance.
Author Contributions
Conceived and designed the experiments: CV GC. Performed the
experiments: SR MS AV MF MN EB MHF. Analyzed the data: CV SR
MF MN EB MN GC. Contributed reagents/materials/analysis tools: ST
MP OS DT CEBR. Wrote the paper: CV SR GC.
References
1. Hotchkiss RS, Karl IE (2003) The pathophysiology and treatment of sepsis.
N Engl J Med 348: 138–150.
2. Bone RC, Balk RA, Cerra FB, Dellinger RP, Fein AM, et al. (1992) Definitions
for sepsis and organ failure and guidelines for the use of innovative therapies in
sepsis. The ACCP/SCCM Consensus Conference Committee. American
College of Chest Physicians/Society of Critical Care Medicine. Chest 101:
1644–1655.
3. Dombrovskiy VY, Martin AA, Sunderram J, Paz HL (2003) Rapid increase in
hospitalization and DEADality rates for severe sepsis in the United States: a
trend analysis from 1993 to 2003. Crit Care Med 35: 1244–50.
4. Hutchins RR, Gunning PM, Lucas DN, Allen-Mersh TG, Soni NC (2004)
Relaparotomy for suspected intraperitoneal sepsis after abdominal surgery.
World J Surg 28: 137–141.
5. Lichtenstern C, Schmidt J, Knaebel HP, Martin E, Buchler MW, et al. (2007)
Postoperative Bacterial/Fungal Infections: A Challenging Problem in Critically
Ill Patients after Abdominal Surgery. Dig Surg 24: 1–11.
6. Calin GA, Croce CM (2006) MicroRNA signatures in human cancers. Nat Rev
Cancer 6: 857–866.
7. Nicoloso MS, Spizzo R, Shimizu M, Rossi S, Calin GA (2009) MicroRNAs—
The micro steering wheel of tumor metastases. Nat Rev Cancer 9: 293–302.
8. Perkins DO, Jeffries CD, Jarskog LF, Thomson JM, Woods K, et al. (2007)
microRNA expression in the prefrontal cortex of individuals with schizophrenia
and schizoaffective disorder. Genome Biol 8: R27.
9. Wang Q, Wang Y, Minto AW, Wang J, Shi Q, et al. (2008) MicroRNA-377 is
up-regulated and can lead to increased fibronectin production in diabetic
nephropathy. FASEB J 22: 4126–4135.
10. Wu F, Zikusoka M, Trindade A, Dassopoulos T, Harris ML, et al. (2008)
MicroRNAs are differentially expressed in ulcerative colitis and alter expression
of macrophage inflammatory peptide-2 alpha. Gastroenterology 135:
1624–1635.
11. Anglicheau D, Sharma VK, Ding R, Hummel A, Snopkowski C, et al. (2009)
MicroRNA expression profiles predictive of human renal allograft status. Proc
Natl Acad Sci U S A 106: 5330–5335.
12. Ambros V (2004) The functions of animal microRNAs. Nature 431: 350–355.
13. Tili E, Michaille JJ, Cimino A, Costinean S, Dumitru CD, et al. (2007)
Modulation of miR-155 and miR-125b levels following lipopolysaccharide/
TNF-alpha stimulation and their possible roles in regulating the response to
endotoxin shock. J Immunol 179: 5082–5089.
14. Cortez A, Calin GA (2009) MicroRNA identification in plasma and serum: a
novel tool to diagnose and monitor diseases. Expert Opinion in Biological
Therapy 9: 703–711.
15. Grobmyer SR, Lin E, Lowry SF, Rivadeneira DE, Potter S, et al. (2000)
Elevation of IL-18 in human sepsis. J Clin Immunol 20: 212–215.
16. Oberholzer A, Steckholzer U, Kurimoto M, Trentz O, Ertel W (2001)
Interleukin-18 plasma levels are increased in patients with sepsis compared to
severely injured patients. Shock 16: 411–414.
17. ZakiMel-S, Elgendy MY, El-Mashad NB, Farahat ME (2007) IL-18 level
correlates with development of sepsis in surgical patients. Immunol Invest 36:
403–411.
18. Pereira C, Schaer DJ, Bachli EB, Kurrer MO, Schoedon G (2008) Wnt5A/
CaMKII signaling contributes to the inflammatory response of macrophages
and is a target for the antiinflammatory action of activated protein C and
interleukin-10. Arterioscler Thromb Vasc Biol 28: 504–510.
19. George SJ (2008) Wnt pathway: a new role in regulation of inflammation.
Arterioscler Thromb Vasc Biol 28: 400–402.
20. Das S, Misra B, Roul L, Minz NT, Pattnaik M, Baig MA (2008) Insulin
Resistance and beta Cell Function As Prognostic Indicator in Multi-Organ
Dysfunction Syndrome. Metab Syndr Relat Disord. (Epub ahead of print).
21. Barkhausen T, Probst C, Hildebrand F, Pape HC, Krettek C, van Griensven M
(2009) Insulin therapy induces changes in the inflammatory response in a murine
2-hit model. Injury. (Epub ahead of print).
22. Koff JL, Shao MX, Ueki IF, Nadel JA (2008) Multiple TLRs activate EGFR via
a signaling cascade to produce innate immune responses in airway epithelium.
Am J Physiol Lung Cell Mol Physiol 294: L1068–1075.
23. Weichhart T, G. Costantino G, Poglitsch M, Rosner M, Zeyda M, et al. (2008)
The TSC-mTOR signaling pathway regulates the innate inflammatory
response. Immunity 29: 565–577.
24. Nemeth K, Leelahavanichkul A, Yuen PS, Mayer B, Parmelee A, et al. (2009)
Bone marrow stromal cells attenuate sepsis via prostaglandin E(2)-dependent
reprogramming of host macrophages to increase their interleukin-10 production.
Nat Med 15: 42–49.
25. Abe R, Hirasawa H, Oda S, Sadahiro T, Nakamura M, et al. (2008) Up-
regulation of interleukin-10 mRNA expression in peripheral leukocytes predicts
poor outcome and diminished human leukocyte antigen-DR expression on
monocytes in septic patients. J Surg Res 147: 1–8.
26. Libert C (2003) Inflammation: A nervous connection. Nature 421: 328–329.
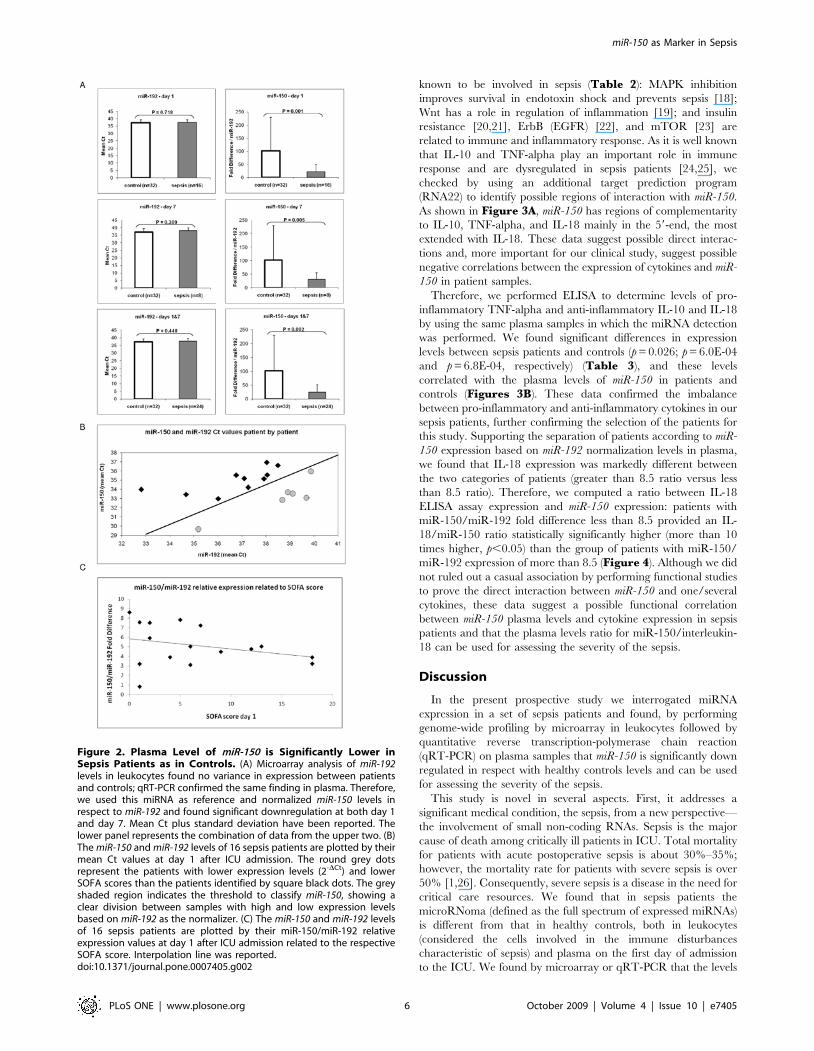
Table 3. Cytokine measurements from Septic Shock casesand Controls.
Cytokine Control Subjects Patients with Sepsis P value
IL-10 6.55, 21 , DL 33.39 (5.79–112.1) 6E-04
IL-18 162.05 (15.23–532.60) 672.08 (107.55–2201.15) 6.8E-04
TNF-alpha 24.69 (11.05–31.85) 34.51 (26.01–44.16) 0.026
Definition of abbreviations: ,DL = less than the detectable limit of 4 pg/ml forTNF-alpha or 5 pg/ml for IL-10 and IL-18.Displayed are the plasma cytokine determinations quantified bychemiluminescence in picograms per millimeter (median+/2range). The actualnumber of analyzed patients and controls are as in Materials and Methods.doi:10.1371/journal.pone.0007405.t003
Figure 4. Ratio Between IL-18 and miR-150/miR-192 in Plasmaof Sepsis Patients. A ratio between IL-18 ELISA assay expression andmiR-150 expression based on miR-192 normalization was computed.Patients were separated into two groups related to the miR-150expression before the threshold was established (8.5). Patients withmiR-150 fold difference less than 8.5 provided an IL-18/miR-150 ratiostatistically significantly higher than the group of patients with miR-150expression of more than 8.5 (P,0.05 by two-side t-test). Mean Ct +/2standard deviation have been reported.doi:10.1371/journal.pone.0007405.g004
miR-150 as Marker in Sepsis
PLoS ONE | www.plosone.org 9 October 2009 | Volume 4 | Issue 10 | e7405

27. Schmidt WM, Spiel AO, Jilma B, Wolzt M, Muller M (2009) In vivo profile of
the human leukocyte microRNA response to endotoxemia. Biochem Biophys
Res Commun 380: 437–441.
28. Xiao C, Calado DP, Galler G, Thai TH, Patterson HC, et al. (2007) MiR-150
controls B cell differentiation by targeting the transcription factor c-Myb. Cell
131: 146–159.
29. Fredriksson K, Tjader I, Keller P, Petrovic N, Ahlman B, et al. (2008)
Dysregulation of mitochondrial dynamics and the muscle transcriptome in ICU
patients suffering from sepsis-induced multiple organ failure. PLoS ONE 3:
e3686.
30. Minne L, Abu-Hanna A, de Jonge E (2008) Evaluation of SOFA-based models
for predicting mortality in the ICU: A systematic review. Crit Care 12(6): R161.
31. Hotchkiss RS, Nicholson DW (2006) Apoptosis and caspases regulate death and
inflammation in sepsis. Nat Rev Immunol 6: 813–822.32. Hotchkiss RS, Tinsley KW, Swanson PE, Schmieg Jr RE, Hui JJ, et al. (2001)
Sepsis-induced apoptosis causes progressive profound depletion of B and CD4+T lymphocytes in humans. J Immunol 166: 6952–6963.
33. Hotchkiss RS, Tinsley KW, Swanson PE, Grayson MH, Osborne DF, et al.
(2002) Depletion of dendritic cells, but not macrophages, in patients with sepsis.J Immunol 168: 2493–2500.
34. Baltimore D, Boldin MP, O’Connell RM, Rao DS, Taganov KD (2008)
MicroRNAs: new regulators of immune cell development and function. NatImmunol 9: 839–845.
35. Tili E, Michaille JJ, Calin GA (2008) Expression and function of micro-RNAs inimmune cells during normal or disease state. Int J Med Sci 5: 73–79.
miR-150 as Marker in Sepsis
PLoS ONE | www.plosone.org 10 October 2009 | Volume 4 | Issue 10 | e7405