Microglia Modelling and Analysis using L-Systems Grammar
6
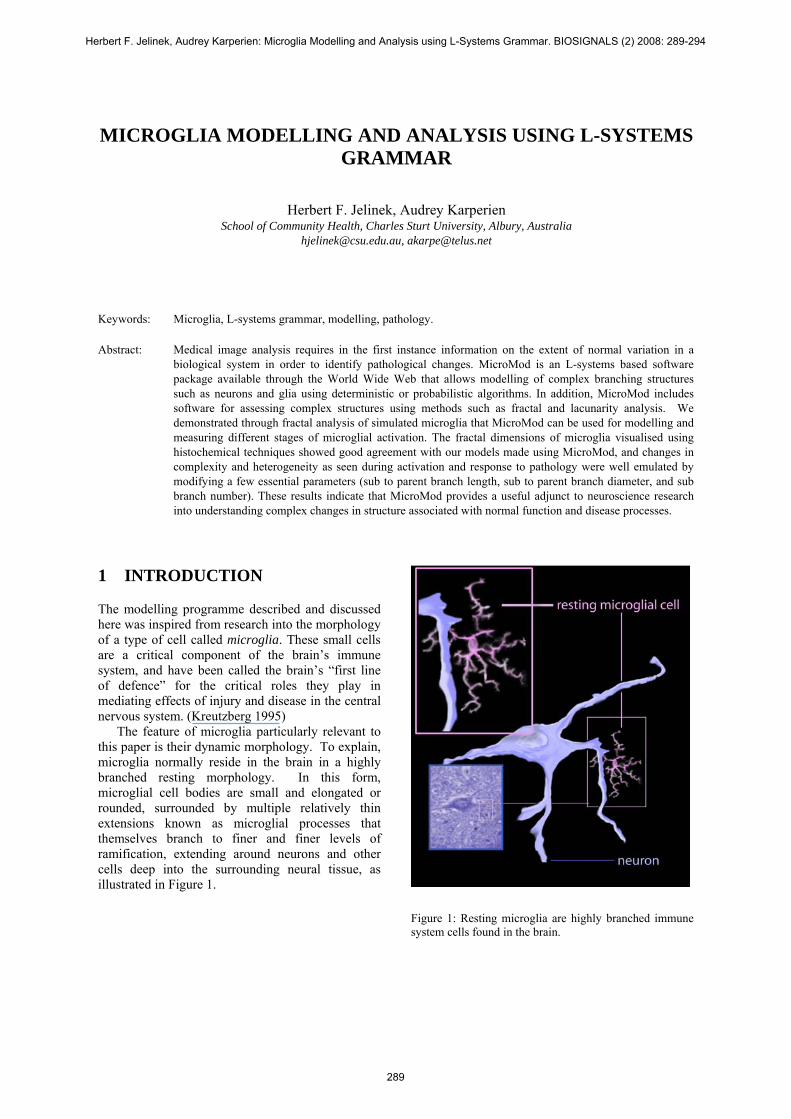
MICROGLIA MODELLING AND ANALYSIS USING L-SYSTEMS GRAMMAR Herbert F. Jelinek, Audrey Karperien School of Community Health, Charles Sturt University, Albury, Australia [email protected], [email protected] Keywords: Microglia, L-systems grammar, modelling, pathology. Abstract: Medical image analysis requires in the first instance information on the extent of normal variation in a biological system in order to identify pathological changes. MicroMod is an L-systems based software package available through the World Wide Web that allows modelling of complex branching structures such as neurons and glia using deterministic or probabilistic algorithms. In addition, MicroMod includes software for assessing complex structures using methods such as fractal and lacunarity analysis. We demonstrated through fractal analysis of simulated microglia that MicroMod can be used for modelling and measuring different stages of microglial activation. The fractal dimensions of microglia visualised using histochemical techniques showed good agreement with our models made using MicroMod, and changes in complexity and heterogeneity as seen during activation and response to pathology were well emulated by modifying a few essential parameters (sub to parent branch length, sub to parent branch diameter, and sub branch number). These results indicate that MicroMod provides a useful adjunct to neuroscience research into understanding complex changes in structure associated with normal function and disease processes. 1 INTRODUCTION The modelling programme described and discussed here was inspired from research into the morphology of a type of cell called microglia. These small cells are a critical component of the brain’s immune system, and have been called the brain’s “first line of defence” for the critical roles they play in mediating effects of injury and disease in the central nervous system. (Kreutzberg 1995) The feature of microglia particularly relevant to this paper is their dynamic morphology. To explain, microglia normally reside in the brain in a highly branched resting morphology. In this form, microglial cell bodies are small and elongated or rounded, surrounded by multiple relatively thin extensions known as microglial processes that themselves branch to finer and finer levels of ramification, extending around neurons and other cells deep into the surrounding neural tissue, as illustrated in Figure 1. Figure 1: Resting microglia are highly branched immune system cells found in the brain. Herbert F. Jelinek, Audrey Karperien: Microglia Modelling and Analysis using L-Systems Grammar. BIOSIGNALS (2) 2008: 289-294 289
Transcript of Microglia Modelling and Analysis using L-Systems Grammar
MICROGLIA MODELLING AND ANALYSIS USING L-SYSTEMS GRAMMAR
Herbert F. Jelinek, Audrey Karperien School of Community Health, Charles Sturt University, Albury, Australia
[email protected], [email protected]
Keywords: Microglia, L-systems grammar, modelling, pathology.
Abstract: Medical image analysis requires in the first instance information on the extent of normal variation in a biological system in order to identify pathological changes. MicroMod is an L-systems based software package available through the World Wide Web that allows modelling of complex branching structures such as neurons and glia using deterministic or probabilistic algorithms. In addition, MicroMod includes software for assessing complex structures using methods such as fractal and lacunarity analysis. We demonstrated through fractal analysis of simulated microglia that MicroMod can be used for modelling and measuring different stages of microglial activation. The fractal dimensions of microglia visualised using histochemical techniques showed good agreement with our models made using MicroMod, and changes in complexity and heterogeneity as seen during activation and response to pathology were well emulated by modifying a few essential parameters (sub to parent branch length, sub to parent branch diameter, and sub branch number). These results indicate that MicroMod provides a useful adjunct to neuroscience research into understanding complex changes in structure associated with normal function and disease processes.
1 INTRODUCTION
The modelling programme described and discussed here was inspired from research into the morphology of a type of cell called microglia. These small cells are a critical component of the brain’s immune system, and have been called the brain’s “first line of defence” for the critical roles they play in mediating effects of injury and disease in the central nervous system. (Kreutzberg 1995)
The feature of microglia particularly relevant to this paper is their dynamic morphology. To explain, microglia normally reside in the brain in a highly branched resting morphology. In this form, microglial cell bodies are small and elongated or rounded, surrounded by multiple relatively thin extensions known as microglial processes that themselves branch to finer and finer levels of ramification, extending around neurons and other cells deep into the surrounding neural tissue, as illustrated in Figure 1.
Figure 1: Resting microglia are highly branched immune system cells found in the brain.
Herbert F. Jelinek, Audrey Karperien: Microglia Modelling and Analysis using L-Systems Grammar. BIOSIGNALS (2) 2008: 289-294
289
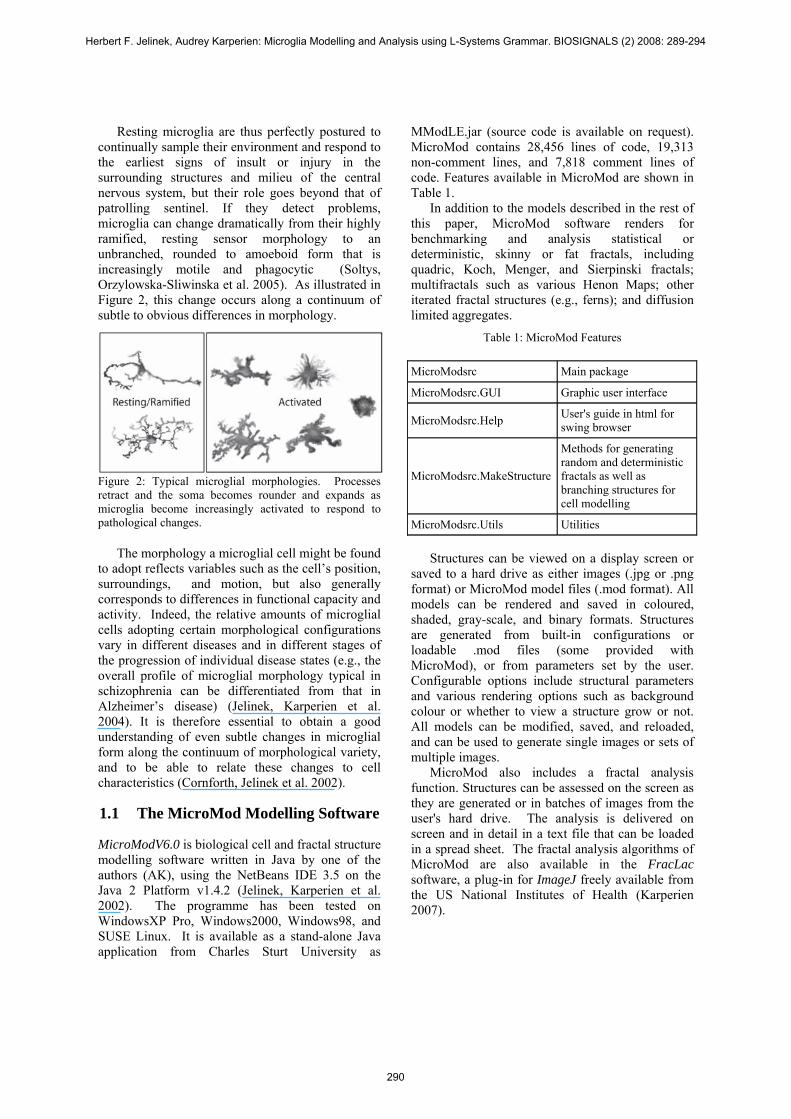
Resting microglia are thus perfectly postured to continually sample their environment and respond to the earliest signs of insult or injury in the surrounding structures and milieu of the central nervous system, but their role goes beyond that of patrolling sentinel. If they detect problems, microglia can change dramatically from their highly ramified, resting sensor morphology to an unbranched, rounded to amoeboid form that is increasingly motile and phagocytic (Soltys, Orzylowska-Sliwinska et al. 2005). As illustrated in Figure 2, this change occurs along a continuum of subtle to obvious differences in morphology.
Figure 2: Typical microglial morphologies. Processes retract and the soma becomes rounder and expands as microglia become increasingly activated to respond to pathological changes.
The morphology a microglial cell might be found to adopt reflects variables such as the cell’s position, surroundings, and motion, but also generally corresponds to differences in functional capacity and activity. Indeed, the relative amounts of microglial cells adopting certain morphological configurations vary in different diseases and in different stages of the progression of individual disease states (e.g., the overall profile of microglial morphology typical in schizophrenia can be differentiated from that in Alzheimer’s disease) (Jelinek, Karperien et al. 2004). It is therefore essential to obtain a good understanding of even subtle changes in microglial form along the continuum of morphological variety, and to be able to relate these changes to cell characteristics (Cornforth, Jelinek et al. 2002).
1.1 The MicroMod Modelling Software
MicroModV6.0 is biological cell and fractal structure modelling software written in Java by one of the authors (AK), using the NetBeans IDE 3.5 on the Java 2 Platform v1.4.2 (Jelinek, Karperien et al. 2002). The programme has been tested on WindowsXP Pro, Windows2000, Windows98, and SUSE Linux. It is available as a stand-alone Java application from Charles Sturt University as
MModLE.jar (source code is available on request). MicroMod contains 28,456 lines of code, 19,313 non-comment lines, and 7,818 comment lines of code. Features available in MicroMod are shown in Table 1.
In addition to the models described in the rest of this paper, MicroMod software renders for benchmarking and analysis statistical or deterministic, skinny or fat fractals, including quadric, Koch, Menger, and Sierpinski fractals; multifractals such as various Henon Maps; other iterated fractal structures (e.g., ferns); and diffusion limited aggregates.
Table 1: MicroMod Features
MicroModsrc Main package
MicroModsrc.GUI Graphic user interface
MicroModsrc.Help User's guide in html for swing browser
MicroModsrc.MakeStructure
Methods for generating random and deterministic fractals as well as branching structures for cell modelling
MicroModsrc.Utils Utilities
Structures can be viewed on a display screen or saved to a hard drive as either images (.jpg or .png format) or MicroMod model files (.mod format). All models can be rendered and saved in coloured, shaded, gray-scale, and binary formats. Structures are generated from built-in configurations or loadable .mod files (some provided with MicroMod), or from parameters set by the user. Configurable options include structural parameters and various rendering options such as background colour or whether to view a structure grow or not. All models can be modified, saved, and reloaded, and can be used to generate single images or sets of multiple images.
MicroMod also includes a fractal analysis function. Structures can be assessed on the screen as they are generated or in batches of images from the user's hard drive. The analysis is delivered on screen and in detail in a text file that can be loaded in a spread sheet. The fractal analysis algorithms of MicroMod are also available in the FracLac software, a plug-in for ImageJ freely available from the US National Institutes of Health (Karperien 2007).
Herbert F. Jelinek, Audrey Karperien: Microglia Modelling and Analysis using L-Systems Grammar. BIOSIGNALS (2) 2008: 289-294
290

2 MODELLING WITH MICROMOD
To simulate biological structures such as microglia, MicroMod employs L-systems principles. As illustrated in Figure 3, a variety of structures at different levels of complexity can be generated using L-systems.
Figure 3: Examples of structures modelled in MicroMod using L-systems principles.
The fundamental algorithm used for modelling microglia is based on MicroMod’s built-in branching model. The algorithm generates sets of symbols to be rendered on the computer screen. For modelling microglia, one set specifies features for one microglial process, where each point within each set specifies the size, shape, colour, and location of a structural element of the process, and rules set by the user are applied recursively to evolve each original set into a more complex structure.
To elaborate, the simplest branching model is a set of points representing straight lines, and the next level of complexity is a set with one level of sub-branches (Figure 4). Such a model can be altered by changing various parameters including the rate of acquiring branching points and the number of branches that sprout at each branching point; the ratio of the length and diameter of daughter branches to the length of the parent; and the taper for each branch.
Figure 4: Radial model generated by specifying a minimum number of parameters.
Gross structural features such as the area and general shape of the central soma and the number, length, and diameter of primary branches can also be changed. In addition, directional features such as the probability of a branch continuing in a direction (related to the tortuousness of a process) and the angle of branching can be set. Moreover, to further explore variation within a cell or compare cells, the user can modify individual processes of a cell separately.
Furthermore, several of the parameters describing a process, such as branching rate and tortuousity, can be applied as probabilities rather than fixed values (Figure 5). Figure 5A, for instance, illustrates a simple radial model generated using a probability (rather than a deterministic value) for the number of branches along each primary branch, whereas Figure 5B shows a simple radial model rendered with a deterministic branching rate but probabilistic tortuousity features.
Figure 5: Simple branching models. Within each model, all branches are statistically identical. 5A. Random Variation in Branching Frequency. Nodes show locations for daughter branches on primary branches. All nodes were sprouted at one statistically identical rate; however, nodes on branches extending right were generated deterministically and on branches extending left were generated probabilistically. 5B. Random Variation in Branching Angle and Tortuousity. Daughter branches were sprouted at one deterministic rate on all primary branches, but their rate and angle of change in direction were determined probabilistically.
The significance of having probabilistic parameters available for modelling microglia is that the opportunity exists to generate each cell process as a statistically identical but unique structure. The user can, accordingly, explore overall features of a class of structures by generating groups of statistically identical but unique images from a single set of parameters (Figure 6).
Figure 6: Statistically identical but unique models of resting microglia generated using one set of parameters.
Herbert F. Jelinek, Audrey Karperien: Microglia Modelling and Analysis using L-Systems Grammar. BIOSIGNALS (2) 2008: 289-294
291

As was noted in the introduction, microglia adopt a wide variety of conformations when they respond to events in nervous tissue. For modelling microglia and other biological cells, MicroMod has several models in addition to the radial model just discussed. Examples of the MicroMod outputs of the Y-model, the bushy and narrow models, and the B-model are shown in Figure 7. The Y-model (top of Figure 7) provides large spherical to amorphous structures with short tapered and unbranched projections. The bushy model and the narrow model are similar, but allow branch diameters and the degree of sprouting to be set. These models specify how tortuous images are using the single angle functions in MicroMod. The B-Model includes options for multiple, bifurcating branches as well as for setting branch angle, length, tortuosity and twist. The number of branches and number of sprouts can be modified using the menus.
Figure 7: Modelling options for branched cell structures available in MicroMod.
3 ANALYSING MICROGLIAL ACTIVATION USING SIMULATED MICROGLIA
Populations of cells were modelled from real microglia, based on measurements such as the length
and number of branches and the ratios of daughter to parent branch length and diameter. To most closely emulate real, dynamic microglia in their natural environment, cells were generated using probabilistic values. Using box-counting fractal analysis we compared the simulated cells to the real after converting digital images to binary in order to assess the complexity of the cell contour. As indicated in previous research, there was close agreement between simulated and real cells (Figure 8) on the box counting dimension (DB). (Smith, Marks et al. 1989; Jelinek, Karperien et al. 2002)
Figure 8: Real compared to simulated microglia. The real cell had a fractal dimension of 1.423 compared to the simulated of 1.425.
3.1 Scaling Features
To assess the sensitivity of MicroMod for modelling subtle morphological changes associated with different levels of microglial activation, we manipulated several features of the models and assessed both complexity as measured by the DB and heterogeneity (lacunarity or Λ). Manipulating the size and shape of the modelled soma had essentially no effect on the DB, but a slight effect on Λ, where in general models with larger and more elongated somata had lower values for Λ. Both the DB and Λ were affected by changing the number of primary branches, but the effects were not consistent. Changing scaling features, in contrast, had several noteworthy effects. Changes were made in a manner consistent with fractal changes, as the results are predictable and therefore useful in judging the utility of the software.
Figure 9 shows that the DB and Λ changed when the length of sub-branches relative to the parent
Herbert F. Jelinek, Audrey Karperien: Microglia Modelling and Analysis using L-Systems Grammar. BIOSIGNALS (2) 2008: 289-294
292
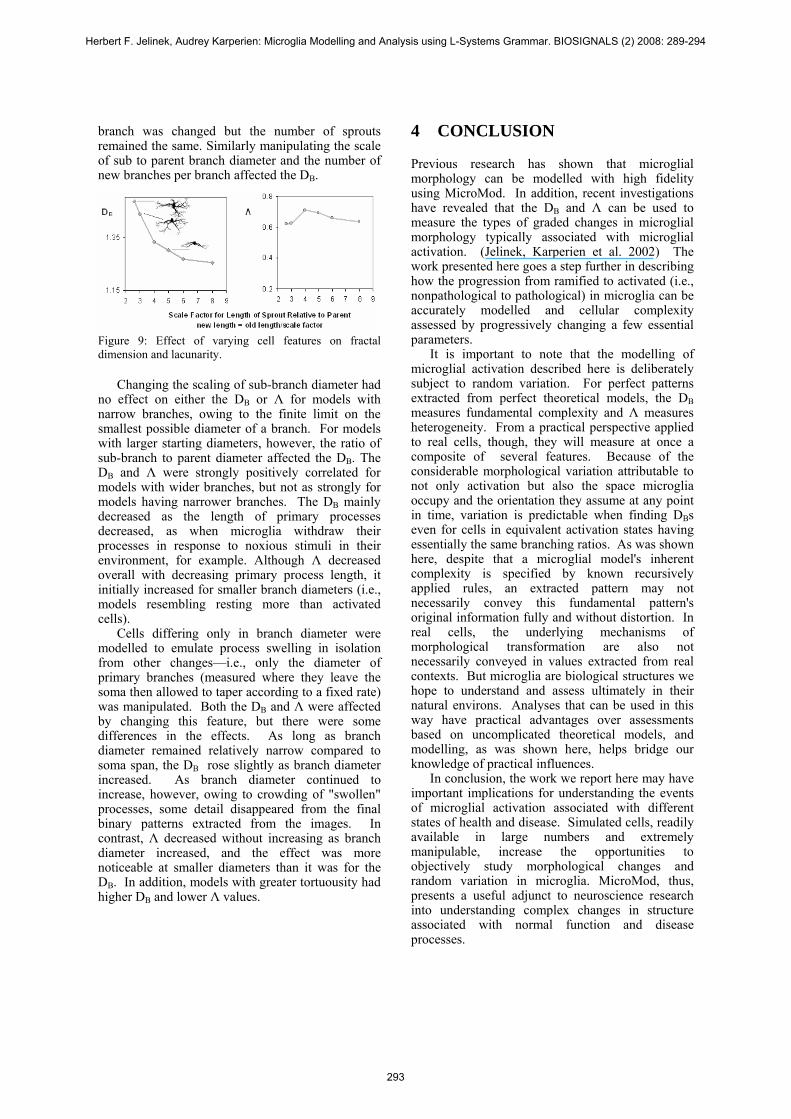
branch was changed but the number of sprouts remained the same. Similarly manipulating the scale of sub to parent branch diameter and the number of new branches per branch affected the DB.
Figure 9: Effect of varying cell features on fractal dimension and lacunarity.
Changing the scaling of sub-branch diameter had no effect on either the DB or Λ for models with narrow branches, owing to the finite limit on the smallest possible diameter of a branch. For models with larger starting diameters, however, the ratio of sub-branch to parent diameter affected the DB. The DB and Λ were strongly positively correlated for models with wider branches, but not as strongly for models having narrower branches. The DB mainly decreased as the length of primary processes decreased, as when microglia withdraw their processes in response to noxious stimuli in their environment, for example. Although Λ decreased overall with decreasing primary process length, it initially increased for smaller branch diameters (i.e., models resembling resting more than activated cells).
Cells differing only in branch diameter were modelled to emulate process swelling in isolation from other changes—i.e., only the diameter of primary branches (measured where they leave the soma then allowed to taper according to a fixed rate) was manipulated. Both the DB and Λ were affected by changing this feature, but there were some differences in the effects. As long as branch diameter remained relatively narrow compared to soma span, the DB rose slightly as branch diameter increased. As branch diameter continued to increase, however, owing to crowding of "swollen" processes, some detail disappeared from the final binary patterns extracted from the images. In contrast, Λ decreased without increasing as branch diameter increased, and the effect was more noticeable at smaller diameters than it was for the DB. In addition, models with greater tortuousity had higher DB and lower Λ values.
4 CONCLUSION
Previous research has shown that microglial morphology can be modelled with high fidelity using MicroMod. In addition, recent investigations have revealed that the DB and Λ can be used to measure the types of graded changes in microglial morphology typically associated with microglial activation. (Jelinek, Karperien et al. 2002) The work presented here goes a step further in describing how the progression from ramified to activated (i.e., nonpathological to pathological) in microglia can be accurately modelled and cellular complexity assessed by progressively changing a few essential parameters.
It is important to note that the modelling of microglial activation described here is deliberately subject to random variation. For perfect patterns extracted from perfect theoretical models, the DB measures fundamental complexity and Λ measures heterogeneity. From a practical perspective applied to real cells, though, they will measure at once a composite of several features. Because of the considerable morphological variation attributable to not only activation but also the space microglia occupy and the orientation they assume at any point in time, variation is predictable when finding DBs even for cells in equivalent activation states having essentially the same branching ratios. As was shown here, despite that a microglial model's inherent complexity is specified by known recursively applied rules, an extracted pattern may not necessarily convey this fundamental pattern's original information fully and without distortion. In real cells, the underlying mechanisms of morphological transformation are also not necessarily conveyed in values extracted from real contexts. But microglia are biological structures we hope to understand and assess ultimately in their natural environs. Analyses that can be used in this way have practical advantages over assessments based on uncomplicated theoretical models, and modelling, as was shown here, helps bridge our knowledge of practical influences.
In conclusion, the work we report here may have important implications for understanding the events of microglial activation associated with different states of health and disease. Simulated cells, readily available in large numbers and extremely manipulable, increase the opportunities to objectively study morphological changes and random variation in microglia. MicroMod, thus, presents a useful adjunct to neuroscience research into understanding complex changes in structure associated with normal function and disease processes.
Herbert F. Jelinek, Audrey Karperien: Microglia Modelling and Analysis using L-Systems Grammar. BIOSIGNALS (2) 2008: 289-294
293
REFERENCES
Cornforth, D., H. F. Jelinek, et al. (2002). Fractop: a tool for automated biological image classification. 6th AI Australasia-Japan Joint Workshop, Australian National University, Canberra.
Jelinek, H. F., A. Karperien, et al. (2004). Differentiating grades of microglia activation with fractal analysis. Proceedings of the Complex Systems Conference, Cairns, Australia, IOS Press.
Jelinek, H. F., A. Karperien, et al. (2002). MicroMod - an L-systems approach to neuron modelling. 6th AI Australasia-Japan Joint Workshop, Australian National University, Canberra.
Karperien, A. (2007). FracLac for ImageJ. FracLac for ImageJ 2000-2007. Bethesda, Maryland, Research Services Branch, National Institutes of Health: Morphological digital image analysis software for fractal, multifractal, lacunarity, and other morphometrics.
Kreutzberg, G. W. (1995). "Microglia, the first line of defence in brain pathologies." Arzneimittelforschung 45(3A): 357-60.
Smith, T. G., W. B. Marks, et al. (1989). "A fractal analysis of cell images." Journal of Neuroscience Methods 27: 173-180.
Soltys, Z., O. Orzylowska-Sliwinska, et al. (2005). "Quantitative morphological study of microglia cells in the ischaemic rat brain using principle component analysis." Journal of Neuroscience Methods.
Herbert F. Jelinek, Audrey Karperien: Microglia Modelling and Analysis using L-Systems Grammar. BIOSIGNALS (2) 2008: 289-294
294