Custom-Made Cloud Enterprise Architecture for Small Medium and Micro Enterprises

ERF RESEARCH REPORT Project on “Promoting Competitiveness in
Micro and Small Enterprises in the MENA Region”
MICRO AND SMALL ENTERPRISES IN TURKEY: UNEASY DEVELOPMENT
Research Report Series No.: 0420
Semsa Ozar Bogazici University
This research has been produced with the financial contributions of the The Arab Fund for Economic and Social Development (AFESD), the European Union (EU), and the International Development Research Center, Canada (IDRC). The content of this publication is the sole responsibility of the authors and can in no way be taken to reflect the views of those donors.
The production of this publication has benefited from the European Union funding (through the Femise program). Contributions from other donors are also gratefully acknowledged. The content of this publication is the sole responsibility of the authors and can in no way be taken to reflect the views of the European Union.

1
Table of contents Acknowledgements ------------------------------------------------------------------------------------------- 7 Section 1: Introduction ------------------------------------------------------------------------------- 8 Section 2: Literature Review ------------------------------------------------------------------------- 9 Section 3: Description of the Study ----------------------------------------------------------------- 11 3.1. Research design ---------------------------------------------------------------------------- 11 3.2. Concepts and definitions ------------------------------------------------------------------ 12 3.3. Base studies --------------------------------------------------------------------------------- 12 3.4. Data collection instruments -------------------------------------------------------------- 13 3.5. Sampling ------------------------------------------------------------------------------------ 14 3.6. Fieldwork ------------------------------------------------------------------------------------ 14 3.7. Data cleaning and processing ------------------------------------------------------------- 17 3.8. Weighting and extrapolation -------------------------------------------------------------- 17 3.9. Case studies and focus groups ------------------------------------------------------------ 18 3.10. Comparison with comparable official statistics ---------------------------------------- 19 3.11. Econometric study ------------------------------------------------------------------------- 20 Section 4: The Role of MSEs in the Turkish Economy ---------------------------------------- 24 Section 5: Business Environment and the Economic Crisis of 2001 ------------------------- 26 Section 6: General Findings ------------------------------------------------------------------------- 28 6.1. Distribution of MSEs by size, economic activity and gender ----------------------- 28 6.1.1. Distribution of MSEs by size and economic activity -------------------------- 28 6.1.2. Distribution of MSEs by gender ------------------------------------------------- 29 6.2. Performance and dynamics of MSEs ---------------------------------------------------- 31 6.2.1. Performance of MSEs -------------------------------------------------------------- 31
6.2.2. Productivity differences of MSEs with the national total and larger enterprises --------------------------------------------------------------------------- 32
6.2.3. Dynamics of the performance of MSEs ------------------------------------------ 33 6.2.4. Dynamics of growth of MSEs ----------------------------------------------------- 36 6.3. Institutional framework and support services ------------------------------------------ 37 6.4. Characteristics of the entrepreneur ------------------------------------------------------ 41
6.4.1. Owner or manager ------------------------------------------------------------------ 41 6.4.2. Age of the entrepreneur ----------------------------------------------------------- 42 6.4.3. Education level --------------------------------------------------------------------- 43 6.4.4. Employment characteristics of the entrepreneur prior to current position 45 6.4.5. Number of years in present job -------------------------------------------------- 47 6.4.6. Social insurance -------------------------------------------------------------------- 48 6.4.7. Women entrepreneurs ------------------------------------------------------------- 49
6.5. Characteristics of the Enterprise -------------------------------------------------------- 52 6.5.1. Place of work ----------------------------------------------------------------------- 52
6.5.2. Legal form of the enterprise ---------------------------------------------------------------- 53 6.5.3. Extension of informality ------------------------------------------------------------ -------- 55 6.5.4. The impact of clusters ---------------------------------------------------------------------- 56 6.5.5. Linkages with other enterprises ----------------------------------------------------------- 58
6.5.6. Exporting MSEs ------------------------------------------------------------------ 60 6.5.7. Access to financial resources -------------------------------------------------- 61 6.5.8. Characteristics of the workforce ------------------------------------------------- 64
Section 7: Policy Recommendations -------------------------------------------------------------- 70 References -------------------------------------------------------------------------------------------------- 74 List of Abbreviations --------------------------------------------------------------------------------------- 76 Appendices: Appendix 1: Definition of SMEs in the EU ---------------------------------------------------------------- 77 Appendix 2: List of Concepts and their Definitions Used in the Survey ------------------------------- 78 Appendix 3: List of Analytical Variables (Data Structure) ----------------------------------------------- 79 Appendix 4: The Location of Selected Provinces in the Sample ---------------------------------------- 90 Appendix 5: The Sampling Process -------------------------------------------------------------------- 91

2
Appendix 6: List of Participants of the Case Studies ------------------------------------------------------ 92 Appendix 7: List of Participants of Focus Groups --------------------------------------------------------- 93 Appendix 8: The Distribution of Enterprises that Responded to the Questions
Regarding the Value Added of the Enterprise -------------------------------------------- 95

3
List of Graphs Graph 6.1: Distribution of Enterprises by Size (number of persons engaged) (%) ------------- 29 Graph 6.2: Distribution of Enterprises by Economic Activity (%) -------------------------------- 29 Graph 6.3: Distribution of Enterprises by Gender of the Entrepreneur and by Economic Activity
------------------------------------------------------------------------------------------------- 30 Graph 6.4: Average Number of Persons Engaged Per Enterprise by Economic Activity,
2000-2002 ------------------------------------------------------------------------------------ 34 Graph 6.5: Monthly Value Added Per Person Engaged by Economic Activity, 2000-2002 (in
producer’s prices, million TL., 1994=100) ---------------------------------------------- 34 Graph 6.6: Monthly Value Added Per Person Engaged by Size, 2000-2002 (in producer’s prices,
million TL., 1994=100) -------------------------------------------------------------------- 35

4
List of Tables: Table 3.1: Number of Enterprises Screened and Interviewed during the Canvassing Stage and
Main Survey --------------------------------------------------------------------------------- 16 Table 3.2: Reasons of Decline in the Follow-Up Survey ------------------------------------------ 16 Table 3.3: Calculation of the Third Weighting Multiplier (w3) ----------------------------------- 18 Table 3.4: The Distribution of the Sample and the Weighted Number of Enterprises by Size of
the Enterprise ------------------------------------------------------------------------------ 18 Table 3.5: Comparison of Establishment Census with the MSE Main Survey Results ------- 20 Table 3.6: Regression Results and Parameter Estimates ------------------------------------------ 23 Table 4.1: Distribution of Enterprises by Size, 2002 ---------------------------------------------- 24 Table 4.2: The Share of MSE Non-Agricultural Gross Value-added in the National Total Non-
Agricultural Gross Value-added, 2001 (in producer’s value, billion TL) ----------- 25 Table 6.1: Distribution of Enterprises by Size and Economic Activity -------------------------- 28 Table 6.2: Distribution of Enterprises by Size and Economic Activity (%) --------------------- 28 Table 6.3: Distribution of Enterprises by Size and Economic Activity (%) --------------------- 28 Table 6.4: Distribution of Enterprises by Gender of the Entrepreneur and by Economic Activity Table 6.5: Distribution of Enterprises of Men Entrepreneurs by Size of the Enterprise and
Economic Activity (%) --------------------------------------------------------------------- 30 Table 6.6: Distribution of Enterprises of Women Entrepreneurs by Size of the Enterprise and
Economic Activity (%) -------------------------------------------------------------------- 30 Table 6.7: Monthly Value-added Per Person Engaged - Current Prices (million TL) --------- 31 Table 6.8: Monthly Mixed Income Per Enterprise, Main Survey, 2001 - Current Prices (million
TL) ----------------------------------------------------------------------------------------- 31 Table 6.9: Comparison of National Non-Agricultural Gross Value-added Per Employed with
MSE and Survey Gross Value-added Per Person Engaged, 2001 (in producer’s value, million TL) ---------------------------------------------------------------------------------- 32
Table 6.10: The Top 1,000 Industrial Enterprises in Turkey, 2001 (million TL) ---------------- 33 Table 6.11: Average Number of Persons Engaged Per Enterprise by Economic Activity, 2000-
2002 ------------------------------------------------------------------------------------------ 33 Table 6.12: Monthly Value-added Per Person Engaged by Economic Activity, 2000-2002 (in
producer’s prices, million TL., 1994=100) --------------------------------------------- 34 Table 6.13: Monthly Value-dded Per Person Engaged by Size, 2000-2002 (in producer’s prices,
million TL., 1994=100) ----------------------------------------------------------------- 34 Table 6.14: The Percentage of MSEs that Grew, Shrank or Remained the Same in terms of
Persons Engaged between the Start-Up and 2001 (%) -------------------------------- 36 Table 6.15: Investment and Operation Credits Allocated for Small and Medium Size Enterprises
(million TL) ------------------------------------------------------------------------------- 37 Table 6.16: Distribution of Enterprises by Type of affiliated Business Association and by
Economic Activity ----------------------------------------------------------------------- 41 Table 6.17: Distribution of Entrepreneurs by Status, Economic Activity and Sex ------------ 41 Table 6.18: Distribution of Entrepreneurs by Status, Economic Activity and Sex (%) -------- 42 Table 6.19: Average Age of the Entrepreneurs by Economic Activity and Size of the Enterprise
------------------------------------------------------------------------------------------------ 42 Table 6.20: Average Number of Years of Education of the Entrepreneurs by Economic Activity
and Size of the Enterprise ---------------------------------------------------------------- 43 Table 6.21: Average Number of Years of Education of the Entrepreneurs by Economic Activity
and by Sex ----------------------------------------------------------------------------------- 43 Table 6.22: Distribution of Enterprises by Number of Years of Education of the Entrepreneurs by
Economic Activity ------------------------------------------------------------------------- 44 Table 6.23: Distribution of Enterprises by Type of Labor Force Participation of Men
entrepreneurs and by Economic Activity (%) ------------------------------------------ 45 Table 6.24: Distribution of Enterprises by Type of Labor Force Participation of Women
entrepreneurs by Economic Activity (%)------------------------------------------------- 45 Table 6.25: Distribution of Enterprises by Type of Labor Force Participation of Men
Entrepreneurs and by size of the Enterprise (%)----------------------------------------- 46
5
Table 6.26: Distribution of Enterprises by Type of Labor Force Participation of Women Entrepreneurs by Size of the Enterprise (%) -------------------------------------------- 46
Table 6.27: Distribution of Enterprises by Type of Prior Employment Status of the Entrepreneur and by Economic Activity (%)------------------------------------------------------------- 46
Table 6.28: Distribution of Enterprises by Type of Prior Employment Status of Men entrepreneurs and by Economic Activity (%)------------------------------------------- 47
Table 6.29: Distribution of Enterprises by Type of Prior Employment Status of Women Entrepreneurs and by Economic Activity (%) ------------------------------------------ 47
Table 6.30: Average Number of Years in Present Job by Economic Activity and Size of the Enterprise ------------------------------------------------------------------------------------ 47
Table 6.31: Average Number of Years in Present Job by Economic Activity and Size of the Enterprise (Men) ---------------------------------------------------------------------------- 48
Table 6.32: Average Number of Years in Present Job by Economic Activity and Size of the Enterprise (Women) ------------------------------------------------------------------------ 48
Table 6.33: Distribution of Entrepreneurs by Social Insurance Coverage and by Economic Activity -------------------------------------------------------------------------------------- 48
Table 6.34: Distribution of Enterprises by Reasons for Joining Social Insurance and by Economic Activity (%) ---------------------------------------------------------------------------------- 49
Table 6.35: Distribution of Enterprises by whether Women Entrepreneurs Face Special Problems by Economic Activity (%) (Men) --------------------------------------------------------- 49
Table 6.36: Distribution of Enterprises by whether Women Entrepreneurs Face Special Problems by Economic Activity (%) (Women) ---------------------------------------------------- 49
Table 6.37: Distribution of Women Entrepreneurs by whether they Need Permission to be in Business from Household and by Economic Activity --------------------------------- 50
Table 6.38: Distribution of Women Entrepreneurs by whether they Need Permission to be in Business from Household and by Economic Activity (%) -------------------------- 50
Table 6.39: Distribution of Women Entrepreneurs by from Whom in the Household they Need Permission to be in Business and by Economic Activity -------------------------- 50
Table 6.40: Distribution of Women Entrepreneurs by from Whom in the Household they Need Permission to be in Business (C362) by Economic Activity (%)-------------------- 51
Table 6.41: Distribution of Women Entrepreneurs by Conflicts between Home and Work Duties and by Economic Activity (%)------------------------------------------------------ 51
Table 6.42: Distribution of Women Entrepreneurs by Empowerment & by Economic Activity (%) ------------------------------------------------------------------------------------------------- 51
Table 6.43: Distribution of Women Entrepreneurs by Empowerment & by Size of the Enterprise (%)--------------------------------------------------------------------------------------------- 51
Table 6.44: Distribution of Enterprises by Type of the Work Place and by Economic Activity (%) -------------------------------------------------------------------------------------------------- 52 Table 6.45: Distribution of Enterprises by Type of the Work Place & by Economic Activity
(Men) --------------------------------------------------------------------------------------- 52 Table 6.46: Distribution of Enterprises by Type of the Work Place and by Economic Activity
(Women) -------------------------------------------------------------------------------------- 52 Table 6.47: Distribution of Enterprises by Type of Legal Form and by Economic Activity (%)
------------------------------------------------------------------------------------------------- 53 Table 6.48: Distribution of Enterprises by Type of Legal Form and by Size (%) ---------------- 53 Table 6.49: Distribution of Enterprises by Type of Legal Form and by Size (%) (Men) ------- 53 Table 6.50: Distribution of Enterprises by Type of Legal Form and by Size (%) (Women) --- 54 Table 6.51: Distribution of Enterprises by Registration with Professional Organizations and by
Size (%) ------------------------------------------------------------------------------------- 55 Table 6.52: Distribution of Enterprises by Keeping Accounts and by Economic Activity ----- 56 Table 6.53: Distribution of Enterprises by Keeping Accounts and by Size --------------------- 56 Table 6.54: Distribution of Enterprises by Keeping Accounts and by Years of Education (%) ------------------------------------------------------------------------------------------------- 56 Table 6.55: Distribution of Enterprises by Location and by Economic Activity (%) ----------- 57 Table 6.56: Distribution of Enterprises by Location and by Economic Activity (%) (Women) ------------------------------------------------------------------------------------------------- 58

6
Table 6.57: Distribution of Enterprises by Linkages with other Enterprises & by Economic Activity -------------------------------------------------------------------------------------- 58
Table 6.58: Distribution of Enterprises by Linkages with other Enterprises & by Economic Activity (%)-------------------------------------------------------------------------------- 59
Table 6.59: Distribution of Enterprises by Linkages with other Enterprises and by Size of the Enterprise (%)-------------------------------------------------------------------------------- 59
Table 6.60: Distribution of Enterprises with Type of Linkages and Economic Activity ------ 59 Table 6.61: Distribution of Enterprises by Type of Linkages and by Economic Activity (%) -- 59 Table 6.62: Distribution of Enterprises by Type of Linkages and by Size of the Enterprise (%) ----------------------------------------------------------------------------------------------- 60 Table 6.63: Distribution of Enterprises by Main Source of Initial Capital and by Economic
Activity (%)------------------------------------------------------------------------------- 61 Table 6.64: Distribution of Enterprises by Main Source of Initial Capital and by Economic
Activity (%) (Women) ---------------------------------------------------------------- 61 Table 6.65: Distribution of Enterprises by Main Source of Initial Capital and by Economic
Activity (%) (Men) ----------------------------------------------------------------------- 61 Table 6.66: Distribution of Enterprises by Main Source of Initial Capital and by Size of the
Enterprise (%) ------------------------------------------------------------------------------ 62 Table 6.67: Distribution of Total Workforce by Economic Activity and Age Groups --------- 64 Table 6.68: Distribution of Total Workforce by Economic Activity and Age Groups ---------- 64 Table 6.69: Distribution of Female Workforce by Economic Activity and Age Groups -------- 65 Table 6.70: Distribution of Female Workforce by Economic Activity and Age Groups -------- 65 Table 6.71: Distribution of Male Workforce by Economic Activity and Age Groups ----------- 65 Table 6.72: Distribution of Male Workforce by Economic Activity and Age Groups (%) ----- 65 Table 6.73: Distribution of Male Workforce by Economic Activity & Permanency of
Employment --------------------------------------------------------------------------------- 66 Table 6.74: Distribution of Female Workforce by Economic Activity and Permanency of
Employment --------------------------------------------------------------------------------- 66 Table 6.75: Distribution of Female Workers by Economic Activity and Skill Structure -------- 66 Table 6.76: Distribution of Male Workers by Economic Activity and Skill Structure ----------- 66 Table 6.77: Distribution of Female Workers by Size and Skill Structure ------------------------ 67 Table 6.78: Distribution of Male Workers by Size and Skill Structure ---------------------------- 67 Table 6.79: Distribution of Workers Related to the Entrepreneur ---------------------------------- 67 Table 6.80: Distribution of Workers Related to the Entrepreneur by Size ------------------------ 67 Table 6.81: Distribution of Workers with Written Contract & Availability of Social Security
Provisions ---------------------------------------------------------------------------------- 68 Table 6.82: Distribution of Workers with Written Contract by Size (%)-------------------------- 68 Table 6.83: Distribution of Workers with Availability of Social Security Provisions by Size (%) ------------------------------------------------------------------------------------------------- 68 Table 6.84: Monthly Wage Bill Per Worker, 2001 - Current Prices (million TL) ---------------- 69

7
Acknowledgements
This study is a product of the ERF Research Programme on Promoting Competitiveness in the Micro and Small Enterprise (MSE) Sector in the Middle East and North Africa. I am grateful to ERF for initiating and funding this project. In that regard, I would like to express my gratitude to the former ERF Managing Director, Heba Handoussa, for initiating this research project and to the present Managing Director, Samir Radwan, not only for his support and encouragement as the Director of the ERF, but also for his helpful guidance as one of the advisors of the MSE Research Programme.
This report benefited from the work of a large number of people, whose generous and valuable contributions cannot be properly acknowledged here.
I would like to thank the Program Director, Nader Fergany, for his contributions as well as the advisors of the research project; Donald Mead, for the preparation of the guidelines on the conceptual issues, and Fahrad Mehran, particularly for his very helpful guidance on sampling and weighting procedures. My deepest thanks go to Jacques Charmes, for his guidance in tabulations; reviewing the draft of the study; his very helpful and constructive comments and for his ever present encouragement.
I would like to thank the principal investigators; Alia El-Mahdi (Egypt), Kamal Hamdan (Lebanon) and Bachir Hamdouch (Morocco) for sharing with me their own country survey experiences and for their warm friendship throughout the times we worked together.
I am also grateful to the Program Coordinator, Maryse Louis, and the former Program Coordinator, Azza El-Shinnawy, for their proficient coordination, and to the ERF team for their support in the preparations of the meetings logistics.
Thanks to all those who commented on the earlier drafts of this study, including Umit Izmen, Nurhan Davudyan, and Serdar Sayan. Also, I gratefully acknowledge the contributions of the participants of the “Final Conference of the Research Project” held in Cairo, on December 18, 2005.
My very special thanks go to the Turkish team of the research project, the interviewers, the supervisors and the field officers. I am particularly grateful to Ayse Eyuboglu and Engin Pulhan for their contribution in the field study.
This study would have not been possible without the diligence and hard work of Askın Suzuk, in preparing the background papers and his contribution in carrying out and writing reports on the case studies. I am enormously indebted to him for his contributions and always smiling face.
I would also like to thank Gokhan Ozertan and Burcu Songur, particularly for their contribution in the econometric study. Very useful guidance was received from Erdogan Ozotun in the preparation of the statistics on national accounts.
Last but not least, I would like to thank all the entrepreneurs as well as the representatives of both the public institutions and the professional organizations who generously gave their time during the interviews, in order to provide the information and data basis of this study.

8
Section 1: Introduction
The role played by Micro and Small Enterprises (MSEs)1 in the Turkish economy has attracted a considerable attention in recent years, but mainly from two sources. The first, originated from the emergence of new technologies and restructuring of the production processes in the world since the late 1970s, which favours MSEs in comparison with the larger enterprises. In this context, there is a growing recognition of MSEs innovative character, their flexibility in adapting to unstable and unpredictable situations, and their ability to integrate to global production chains. As such, MSEs are perceived as engines of growth in the economy. This standpoint also conforms with the importance given to Small and Medium-sized Enterprises (SMEs)2 in the European Union (EU). EU considers SMEs as “a key source of jobs, business dynamism and innovation”.3 The second position, on the other hand, emphasizes the potential of MSEs in employment generation and poverty alleviation, in an environment of increasing unemployment and widening income inequalities. However, the real level of knowledge about MSEs in Turkey is surprisingly low.
This study attempts to make an essential contribution to the knowledge of MSEs in Turkey by investigating both the internal conditions and the dynamics of MSEs as well as examining the external economic and social conditions pertaining to their performance and development.
For the most part, studies of small enterprises in Turkey focus on the SMEs operating in the manufacturing sector. Furthermore, they lay emphasis on larger SMEs. The present study, by contrast, focuses on a neglected group of enterprises in the Turkish economy, namely, the portion of the SMEs which contain smaller enterprises. This portion is significant; it constitutes 99.4% of the total non-agricultural enterprises in Turkey (TURKSTAT, 2002). Moreover, this study does not only cover the manufacturing sector, but all sectors of the economy except the agricultural sector. It is also distinguished by its scope of investigation as it provides an assessment of MSEs in the economy as a whole within a dynamic context.
The present study attempts to identify the following:
i. the importance of MSEs in the economy vis-à-vis their contribution to the national value-added and employment in the main sectors of the economy;
ii. the characteristics of MSEs and their entrepreneurs, with particular emphasize on their similarities, differences, and the ways in which they affect the performance of the MSEs;
iii. the dynamics of success and failure of MSEs; iv. the role played by the economic and social environment in enabling or hindering the performance
of MSEs, thus focusing on the legal, bureaucratic, economic, financial and social conditions that constrain or facilitate the operation of MSEs; and
v. the policy recommendations that would enable MSEs to perform their activities in a more efficient way, and at the same time contributing to their growth and generation of decent and productive work.
The field survey of this research project has been carried out in 2001-2004 when Turkish economy was experiencing a serious economic crisis. Thus, in addition to providing general knowledge about MSEs, results of this survey also highlight the ways in which MSEs cope with the crisis situations.
The study is organized as follows: (a) Section 2, presents an overview of the literature on MSEs in Turkey; (b) Section 3, provides a description of the scope of the research project, the stages of the fieldwork as well as the various research instruments and techniques used in the study including the econometric study; (c) Section 4, focuses on the role of MSEs in the Turkish economy; (d) Section 5, provides a brief account of the impact of 2001 crisis on MSEs in Turkey; (e) Section 6, presents the general findings; and (f) Section 7, provides policy recommendations.
1 Our definition of MSEs: Are those non-agricultural enterprises with less than 50 persons engaged. 2 Research, policy design and implementation in the EU and in Turkey usually draws on SMEs rather than MSEs. EU defines SMEs as enterprises with less than 250 employees. See App. 1 and http://europa.eu.int/comm/enterprise. 3 See for example, the Report on the “Implementation of the European Charter for Small Enterprises”, Brussels, 11.02.2004, Report from the Commission to the Council and the European Parliament.
9
Section 2: Literature review
Studies on small enterprises in Turkey are, for the most part, concerned with the dynamics of the Small and Medium-sized Enterprises (SMEs), especially with those operating in the manufacturing industry. They, therefore, focus primarily on the issues of technology, productivity, innovations, research and development, as well as marketing and competitiveness in the manufacturing sector by drawing on manufacturing industry survey data collected by the Turkish Statistical Institute (TURKSTAT) (Aktan 1998; Erzan and Filiztekin, 1997 and 2005; Kaytaz, 1995; Kuruuzum 1998; Taymaz, 1997; Taymaz and Kilicaslan, 2000). Other studies are based on small-sample survey data and focus on the sub-sectors of the manufacturing industry (predominantly the textile sector) (Aktar, 1990; Ayata, 1986 and 1987; Cinar et al, 1987 and 1988; Evcimen et al, 1991; Ozcan, 1995; Van Velzen, 1978). This study is the first of its kind, as it represents the enterprises in the urban areas in Turkey, and at the same time covers all sectors except agriculture. The focus of the study is also different as it does not concentrate on small and medium-sized enterprises, but rather on micro and small enterprises, an area of the economy marked by the dearth of serious research.
There are studies which focus on MSEs employing up to 50 persons and operating in the manufacturing industry, but predominantly in the textile sector (Cinar et al. 1987, 1988 and Evcimen et al. 1991). These studies are based on data collected, using a sample survey in the province of Bursa. Cinar et al. argues that the determinants of survival and growth of small enterprises originate from both the demand and the supply side of the market. Producing a product that is complementary to those produced by large-scale enterprises, or a low quality product to fulfil the needs of low-income consumers are the factors that originate from the demand side. Being located in an industrial site or employing family members which contributes to the survival of the small enterprises constitute the factors originating from the supply side.
Evcimen et al. (1991), observes that starting with a small initial capacity, employing at most three workers and operating at low levels of profitability are the general characteristics of sub-contractors in textile industry located in Bursa. Moreover, these sub-contractor enterprises are worse off in terms of efficiency, productivity, as well as viability and liability management compared to those small enterprises that are not involved in the sub-contracting. The inverse relationship between sub-contracting and enterprise size is another issue dealt with in this study. Although enterprises without sub-contracting relations achieve higher average profitability relative to small enterprises with sub-contracting relations, the average annual rate of capacity expansion of both is not statistically different. A more recent research on SMEs in the textile industry focusing on sub-contracting relations argues that sub-contracting may enhance efficiency and productivity by a refined division of labor and innovativeness through cooperation among enterprises (Taymaz and Kilicarslan, 2000). The contradictory outcome may be a consequence of the group of enterprises both studies deal with. Evcimen et al.’s study focuses on the small sized segment of the enterprises in the textile sector, whereas Taymaz and Kilicarslan deal with the small to medium sized enterprises which may be expected to perform more efficiently.
Erzan and Filiztekin (1997) investigate the impact of the Customs Union (CU) on SMEs in the manufacturing sector. They conclude that, although effects of the CU will be severe on the Turkish SMEs on the short run, due to their low level of competitiveness compared to the SMEs in the European countries, but in the long run, positive impacts of the CU on the macro-economic stability in Turkey may lead the SMEs to be better off in terms of survival chances. For Erzan and Filiztekin, the industry characteristics are more important than the enterprise size in explaining value-added and productivity growth.
In a more recent study Erzan and Filiztekin (2005), find that while factors such as the level of the exchange rate, volatility of inflation and nominal interest rates as well as changes in domestic demand had exerted negative effects on value-added growth in SMEs in the manufacturing sector. By contrast, nominal interest rates, real wages and import penetration, affected positively their growth potential. Additionally, another significant conclusion that Erzan and Filiztekin (2005) reached is that, those variables that significantly affect SMEs seemed to have had no significant effect on value-added growth of large enterprises. Further, Erzan and Filiztekin claimed in the same study, that the
10
sensitivity of the SMEs in the manufacturing sector to macro-economic conditions should be attributed to their flexibility rather than their vulnerability.
The OECD’s (2004) study of SMEs in Turkey evaluates the business environment surrounding the SMEs, as well as the existing SME-specific policies on financial support, training and certification issues, support services, technology and innovation services, export promotion and non-financial services. It also makes policy recommendations. In this study, the focus is on how to strengthen the business environment in which SMEs operate, rather than on the examination of constraints to the development of SMEs from within. Thus, the link between the macro and micro is overlooked in this study.
While studies on SMEs and MSEs without a gender perspective, concentrate on issues related to the performance of the business, research on women owned enterprises focuses primarily on the personal characteristics of the women entrepreneurs (Celebi, 1997; C elebi et al, 1993; KOSGEB, 2000). Of the existing studies, only few attempted to identify the problems encountered by women entrepreneurs while setting-up and running their enterprises (DGSPW, 1993 and1996; Ozar, 2005).

11
Section 3: Description of the study 3.1. Research design
The investigations of the dynamics of MSE development need examination of a wide range of variables and issues, emanating both from within and out side the enterprise. The dynamics of success and failure of MSEs can be better understood by using information generated by longitudinal studies that can focus on the enterprise through different phases of its development. But, MSEs do not function in a vacuum. The macro-economic and business environment has significant impact on the performance of the MSEs. In view of these conditions, this research programme adopted a combination of quantitative and qualitative approaches to data collection, in order to capture both the context and dynamics of the issue within a national and comparative scope for the MENA region.
This research programme comprised of several phases, which are: The preparatory phase consisting of a comprehensive analysis of available data sources. This included a literature review, analysis of existing data, and two base studies, (one on the financial and the other on the institutional framework in which MSEs perform their activities). The analysis of the existing data demonstrated that information on the MSEs is scarce, and most of the existing data does not include enterprises engaging less than 10 persons and are usually confined to the manufacturing sector.
The main survey is national in scope. It is based on a complete enumeration of all enterprises including those performing in the households in the sampling areas. The main survey is, therefore, widely represented offering a good opportunity to cover all sectors including home-based enterprises.
The scope of the survey is universal, containing all enterprises engaging up to 50 people including the working proprietors and unpaid family workers. A number of activities have been excluded from the investigations because they were of lower priority in relation to the focus of the research project. This means that the definition of MSEs refers to enterprises consisting of a person producing accessories for sale in the market, as well as factories with 30 or 40 workers. Both formal and informal enterprises falling within the MSE universe were the subject of investigations.
The limitations of cross-section data was partially overcame by collecting data regarding the start-up phase of the enterprise, and one year before the interview time in the course of the main survey. Liedholm and Mead (1999), suggest adding two questions concerning the year and number of workers to the survey at the start-up phase, to enable it to incorporate an important element of dynamic information. This study, however, goes further, producing and collecting information on four points in time for each enterprise in the sample. The flow variables, such as expenditures, sales and revenues are included both in the main survey and its follow-up, to generate information for enterprise growth estimates based on measures other than employment. During the main survey, information was collected in relation to the time when the enterprise was initially set up, as well as on the year before the main survey and at the interview time. After a year the same flow data was gathered in the follow-up survey. Thus, the survey was designed to have longitudinal information on the enterprise’s performance, as much as possible.
The weighted results of the survey represent Turkey, and capture the actual distribution of MSEs across sectors of activity, size, location and gender.
The survey is supplemented by 6 focus group sessions in order to discuss and obtain collective opinions of entrepreneurs on issues such as; home-based work, access to credit, problems related to exporting, problems of young entrepreneurs, women and entrepreneurship, and impact of clusters on the MSE performance. The focus group sessions also proved useful as a medium to discuss and evaluate policy implementation and proposed new directions.
Ten in-depth case studies were also conducted, to elucidate the critical events and conditions leading to success and failure of MSEs that had not been elaborated properly in the main survey and in the follow-up.
Interviews with the local officials of relevant business associations, public and NGO representatives were carried out during the main survey and the follow-up in order to better understand the extent of their activities in promoting MSEs.

12
3.2 Concepts and definitions4
Though definitions of MSEs vary widely, there is a consensus among statisticians that the number of people engaged in the enterprise is the most reliable basis for measurement of the enterprise size. In this study, the size of the enterprise is defined in terms of persons engaged, and all enterprises engaging up to 50 people are considered as MSEs. An enterprise consists of all subsidiary units, even if they do not all exist in the Primary Sampling Unit (PSU).
Entrepreneur is the principal owner, or the manager of the MSE, that is, the person who makes the main decisions regarding the affairs of the enterprise.
Number of persons engaged consists of the total number of people actively working in the MSE, including the owner(s) of the enterprise and the unpaid family workers.
Besides the variation in the number of persons engaged, the value-added and mixed income generated, are the other two major indicators for assessing the performance of the enterprises.
Value-added5 is the difference between production (or output) that is assimilated to total sales-revenues in the questionnaire on the one hand, and intermediate consumption which is comprised of raw materials and purchase of goods, energy consumption and other expenditures on the other hand.
Production (or output) is assimilated in the total sales-revenue. This is because there is no information for stocks variations.
By subtracting the wage bill (equivalent to compensation of employees) from value-added, we obtain the mixed income6, which is the income of the entrepreneur (the information on taxes on production is missing in the questionnaire; therefore, we can assume that it is negligible). Mixed income for individual entrepreneurs is equivalent to the operating surplus for incorporated firms. In the survey some firms are incorporated. In this case, the operating surplus is calculated the same way as the mixed income.
It should be noted that neither rents nor financial costs are intermediate consumption in this conception of the enterprise accounts. The interest of such a conception of the indicators is that they are comparable with the indicators of incorporated firms as well as un-incorporated firms as calculated by National Accounts. Total wage bill per worker7 equals to total wage bill divided by the total number of workers (women and men).
3.3. Base studies
Literature review and the analysis of the existing data which highlights the conditions of MSEs, especially from a vantage point of this study, show that the information necessary for the analysis of the enterprise dynamics is scarce, and that the available information tends to focus on the manufacturing sector and larger enterprises.
Two base studies were prepared in order to accumulate knowledge about the macro-economic and business environment surrounding the MSEs, as well as to update the survey questionnaire so as to sharpen the questions and use the appropriate language:
1. Financial Framework of the MSEs in Turkey aimed to investigate conditions governing the financial market and constraints that are faced by MSEs in accessing credit and other financial services including savings instruments.
2. Institutional Framework of the MSEs in Turkey aimed to investigate the conditions and constraints that MSEs faces in relation to the body of legislation and regulations, law enforcement
4 See Appendix 2 for more comprehensive list of concepts and their definitions used in the survey. 5 Value-added = Q262 – (Q254 + Q255 + Q259). Q’s indicate the question numbers in the main survey and follow-up questionnaire. See App. 3, Form III. Enterprise/entrepreneur questionnaire for the Qs. 6 Mixed income = Value-added – Q253. See App. 3, Form III. Enterprise/entrepreneur questionnaire for the Qs. 7 Total wage bill per worker = Total wage bill (Q253) / total number of workers (Q290 + Q295). See App. 3, Form III. Enterprise/entrepreneur questionnaire for the Qs.

13
and the judicial process, bureaucratic procedures and administration as well as the attitude of relevant public agencies and non-governmental organizations towards MSEs.
3.4. Data collection instruments The questionnaire8 used in the main survey included four different forms:
Form I. The enterprise list, used for listing all the enterprises within the PSU9 to identify the enterprise, entrepreneur, and associated household. All members of the enterprise universe were included in the first listing (identifying nature of enterprise), but those in excluded activities were not given the Form II used in the main survey.
Exclusion rules concern agricultural and non-market activities, illegal activities, production for own personal use, mobile vendors, domestic services, professional services (except ICT) and enterprises with 50 and more persons engaged.
Sampling rule designed to under-sample smaller sizes and men entrepreneurs Entrepreneur women: (size 1=>1/5; size 2-9 =>1/1; size 10-49=>1/1)
Entrepreneur men: (size 1=>1/10; size 2-9 =>1/2; size 10-49=>1/1)
The size 1 enterprises were deliberately under-sampled to avoid dominating the sample by enterprises size 1, and therefore have statistically significant number of enterprises in the sample for the larger size. The over sampling of enterprises with women entrepreneurs was necessary in order to ensure that the sample included sufficient number of women entrepreneurs to obtain statistically significant results.
Form II. Household roster-enterprise identification. This type of questionnaire included identification variables for the members of the household and possible MSEs at home.
Form III. Enterprise-entrepreneur questionnaire focused on characteristics of the entrepreneur and enterprise. Form III contained 322 questions related to the characteristics of the entrepreneur and the enterprise, growth performance, access to credit, financial and business services, relations with business associations, status of registration, level of technology, value of assets, main customers, exports, linkages with other enterprises, constraints to business activity, the problems specific to women entrepreneurs and characteristics of the work force.
Form IV. Household questionnaire dealt with the characteristics of the members of the entrepreneur’s household and the analysis of the inter-relations between the household and the enterprise.
The advantage of this mode of approach, which was having four different forms of questionnaires, is that it allowed investigation of the economic units for which we do not have a complete list. Area sampling, followed by door to door surveying ensured that establishments and household components are combined into one operation, with canvassing of all production units, whether in establishments, household premises, fixed units, in the street or market places. This method avoided the complications of going through the household, getting addresses for economic units/establishments but not finding them.
Although the questions in these forms mostly specified a number of possible answers, some questions were nonetheless deliberately left “open” to encourage free expression of attitudes and opinions by the respondents when none of the existing answers matched the respondent’s answer, or when “other” categories were marked and the answer given by the respondent was written precisely in the space provided.
The questionnaire was originally written in English and then translated into Turkish. The final changes were based on the inputs from the pre-test and comments made by experts and experienced bodies at the Turkish Statistical Institute (TURKSTAT) and the Istanbul Chamber of Industry. Wording of the instrument questions and alternative response categories for instrument items were refined to ensure accuracy and comparability. 8 See Appendix 3 for a comprehensive account of the questionnaire design for the main survey. 9 A PSU (primary sampling unit) is a geographical area with an estimated minimum of 45 enterprises in the urban areas.

14
3.5 Sampling
The sampling was national in coverage and is chosen by stratified, multi-stage systematic sampling method by the TURKSTAT.
In Stage 1, 19 provinces10 were selected from 5 strata11 that were stratified in terms of socio-economic development level of the provinces compiled by the State Planning Organization (SPO). The selection of provinces from each stratum was carried out by weighted probability regarding the number of enterprises in each province.
In stage 2, 432 PSUs with a minimum of 45 enterprises in urban areas of the 19 provinces were selected based on census of buildings for the year 2000 by the SIS, and 100 villages were selected in the rural area.
Urban areas: Settlements with population over 20,000. These settlements include the central city of the province and district centers (ilce) with a population over 20,000.
Rural areas: Villages with a population between 500 and 2,000.
Some of the sample villages visited during the survey selected by the TURKSTAT, were more or less deserted and usually had only one grocery shop as an enterprise. But this was not always clearly reflected in the Population Census. This is because the municipalities receive their budget from the central administration in proportion to their population. Thus in order to compensate for the dearth of population in the villages, most of the municipalities arrange bus trips for migrants living in the big cities like Istanbul, taking them to their home towns and villages during the national census in order to increase their allowances from the public sources. The persistence of this practice means that the population of some villages is not reflected accurately in the population census. They are usually inflated.
Due to the lack of a nation-wide survey of establishments for both rural and urban areas, the selection of villages was carried out without a reliable stratification process. It was decided to exclude the rural enterprises from the sample before the weighting and extrapolating process. The rural MSEs interviewed could be evaluated separately from the urban MSEs that constitute a representative sample of MSEs for the urban areas.
3.6. Fieldwork The fieldwork consisted of successive stages of pre-test, canvassing of the sampling units, the main survey during 2001 and the follow-up survey in 2002.
Pre-test Pre-test was carried out in February 2001 in a limited number of selected streets in two neighbourhoods of Istanbul (Merter, and Gultepe) known for having a variety of MSEs in terms of size and sector, and at a small industrial estate (Ikitelli sanayi sitesi) with a sample of 102 MSEs. Merter neighbourhood includes both manufacturing workshops, wholesale and retail shops. On the other hand, migrants from rural areas live and perform small-sized economic activities including home-based work in Gultepe neighbourhood.
During the pre-test, an additional questionnaire was used for the workers of the enterprise. A selected number of workers were asked to respond to a separate questionnaire about the conditions of the workplace, work contract, social security and their salaries. In most cases, during the interviews the presence of the entrepreneur made the workers hesitant to answer questions, particularly those related to legal obligations of the employer. Thus in order to avoid the risk of using unreliable data, the MSE team decided, during the evaluation of the pre-test results, to exclude the workers questionnaire from consideration.
10Adana, Adiyaman, Afyon, Agri, Bursa, Corum, Erzurum, Eskisehir, Gaziantep, Istanbul, Izmir, Kahramanmaras, Kirsehir, Konya, Manisa, Mugla, Sanlıurfa, Trabzon, Van are the 19 provinces selected. See Appendix 4 for the location of the provinces in the sample on the map of Turkey. 11 See Appendix 5 for a detailed illustration of the sampling process.

15
On the basis of the assessment of the field experience and results of the pre-test, questions judged to be inaccurate or otherwise unacceptable were modified or excluded from the instruments. Some response categories for open questions through classification of responses in pre-test were devised.
On the basis of review of pre-test experience in the four countries involved in the research program, namely Egypt, Lebanon, Morocco and Turkey, it was agreed to adopt the “combined” approach, i.e., door-to-door canvassing of entrepreneurs and households followed by sampling in the office and interviewing later on.
Training of the fieldwork personnel Fieldwork personnel are one of the major determinants of the quality of the fieldwork and the resulting data. Training for the pre-test was carried out with individuals experienced in fieldwork. The supervisors of the main survey were selected from among the people who had already gained experience in the pre-test. Fieldwork personnel were organised in teams comprising a number of interviewers, a field checker, and a supervisor. The training programme started with a number of candidates larger than the number of individuals needed for the actual fieldwork. This was intended to provide for the natural depletion and ensure selection of a more qualified and competent fieldwork personnel. Trainees were evaluated continuously throughout the programme on the basis of their performance. A comprehensive manual along with a glossary including comprehensible definitions of concepts used in the survey, were distributed during the training programme. The training programme included interactive sessions on the objectives of the survey, definitions of the concepts used in the questionnaire, sessions on improving interviewing skills with the help of role playing and field practices.
40 interviewers and 11 field checkers and supervisors were selected and organized into 8 teams. Local interviewers were recruited from provinces in the sample to avoid the difficulties that may arise with local dialects and traditions. Training sessions were held in 8 different regions.
Main survey The main survey fieldwork started on the last week of June 2001 with training, and completed in the last week of September 2001.
The selected streets comprising the PSUs given by the TURKSTAT, were marked on the maps of the neighbourhoods and visited by the field team before the interviews started.
A special team were formed to undertake independent random checking of the field teams on the field, and at the office by contacting the entrepreneurs by phone or by re-interviewing the MSEs in order to check the reliability of the interviews. Quality control of the data collected was carried out both in the field and in the office.
The interviews were carried out at the enterprise with the entrepreneurs or one of the partners in the enterprise. The respondents were assured of complete anonymity throughout the survey.
All housing and establishment units were visited by the interviewers by knocking all the doors in the selected PSUs to survey the individual enterprises located in establishments, as well as economic activities performed on own-account basis (or for sub-contract) in homes. As such, the survey offered a good opportunity to cover home-based workers be they own-account or dependent workers. The listing of enterprises through door-to-door canvassing was followed by sub-sampling in the office. The rules of exclusion covered the following activities: agricultural and non-market activities; illegal activities; production for own-use; mobile vendors; domestic services; professional services (except ICT) and enterprises employing more than 50 persons engaged. Those excluded activities were not given the full questionnaire in the main survey and the follow-up.
Fieldwork strategy Form I Enterprise List First Stage Listing Form II Household Roster-enterprise Identification
Exclusion-Sampling in the Office Form III Enterprise/Entrepreneur Questionnaire Second Stage Interviewing Form IV Household Questionnaire

16
Out of the 52,485 enterprises and households screened during the canvassing, form I and IV were completed for 34,795 units (Table 3.1). The high rate of non-completion of the forms during the canvassing was mainly due to the high non-response rate of entrepreneurs and households. The eligible units in the PSUs were more than expected by the TURKSTAT. Out of 9,280 eligible enterprises, 7,335 were selected randomly with respect to the proportions by sub-categories of gender, size and location. A total of 5,000 interviews were carried out, of which 4,776 were in the urban areas.
Table 3.1: Number of enterprises screened and interviewed during the canvassing stage and main survey
Canvassing - 2001 Total Screened 52,485 Roaster Completed 34,795 Not Completed 18,253 Main Survey - 2001 Eligible 9,280 Sample Units 7,335 Interviews Completed 5,000 Not Completed 2,335 Reasons for not completed Door not opened 55 Refused to respond 1.012 Entrepreneur not present 814 Temporarily absent 454
Follow-up
Follow-up was conducted in July 2002. The questionnaire used in the follow-up was a shorter version of the main survey questionnaire with identical questions as the main survey, in order to capture the performance dynamics of the MSEs. Some new questions regarding the change in the activities of the enterprise or the entrepreneur were also included.
Owing to reasons listed in Table 3.2, the number of interviews in the main survey fell to 3,852 in the follow-up survey. Unfortunately, it was not possible to generate information on the enterprises that had been closed or that disappeared in the course of a year. We could not determine the cause of the closing down; whether they moved to a different location and continued to survive or closed permanently. Liedhold and Mead (1999:24) consider this the indeterminacy of the cause as an inevitable outcome of the follow-up surveys.
Table 3.2: Reasons of decline in the follow-up survey
Number of Enterprises Enterprises Contacted 5,000 Interviews Completed 3,852 Not Completed 1,148 Reasons for not completed Enterprise closed, different one is acting at the same address 245 Enterprise closed, no enterprise at the same address 301 Entrepreneur rejected the interview 387 Entrepreneur was not available 188 Temporarily closed 27
During the pre-test, the main survey and the follow-up, the principal investigator and the members of the core team visited the sites of the survey, held interviews with relevant business associations, professional organizations, public agencies and NGOs, such as KOSGEB (Small and Medium
17
Industry Development Organization), KUGEM (Small Enterprise Development Centres), MEKSA (Vocational Training and Small Industries Support Foundation), TOBB (The Union of Chambers of Commerce, Industry), TESK (Confederation of Turkish Tradesperson and Artisans), and TOSYÖV (Turkish Foundation for Small and Medium Business). Clusters, small enterprise districts and organized industrial estates in the provinces were also visited and interviews were carried out with the entrepreneurs and officials.
3.7 Data cleaning and processing Data collected through the questionnaires were coded and entered into excel sheets in the office. Senior personnel carried out the correction of inconsistencies frequently by phoning or revisiting the entrepreneurs in order to get the correct responses.
Several check questions were identified to ensure the consistency among the responses of the interviewees. For example, the number of people engaged was among the information that was addressed several times in the questionnaire. Responses by the interviewees were checked in the office, as for the cases that could not be resolved in the office interviewees were contacted in order to clarify the inconsistencies.
Entries in the response category for “other” were listed and response categories were reformulated, to ensure that the category “other” does not contain more than 10% of the cases.
The International Standard Industrial Classification (ISIC, 3rd Revision) were used for the classification of economic activities.
Classification of occupations was carried out according to the adapted version of the International Standard Classification of Occupations ISCO-88 for Turkey by the Turkish Statistical Institute.
3.8 Weighting and extrapolation A survey analysis is usually conducted as if all sample observations were independently selected with equal probability of selection. This analysis is correct if simple random sampling (SRS) with replacement is used. However, in practice sample selection is more complex than SRS. Some sample observations may be weighted more heavily than others, and some are included in the sample by virtue of their membership in a certain group (e.g. household) rather than being selected independently. Thus, rather than simple statistical techniques, this complexity requires special analytic considerations such as inserting sampling weights into the sample analysis.
Since our sample provides a complex sampling design, our weights are generated by the multiplication of three different sample weights each of which is calculated for a certain stage.
3
1i
i
W w=
=∏ (1)
where, iw for i =1,2 are obtained by the TURKSTAT, whereas 3w is calculated according to our canvassing and sampling results. The details about iw ’s are as follows:
1 :w In our sample, there are 19 provinces selected by the TURKSTAT. 1w represents the inverse of the selection probability of a province that the enterprise is located in.
2 :w depends on the enumeration results of year 2000 of TURKSTAT. With the help of the data of a complete enumeration of all enterprises in the sample areas and urban-rural stratification, the blocks were selected. However, due to TURKSTAT’s provision of limited data on MSEs such as, having no data base for the number of enterprises in rural areas, our survey data collected in rural areas had been omitted and only the data of enterprises selected from 432 different blocks in urban areas were used in the remaining analyses. 2w 12 represents the reciprocal of the selection probability of a block that the enterprise operates in.
12 Since no database exits in Turkey for the distribution and the number of enterprises in rural areas, we were unable to obtain weights of enterprises in rural areas. We preferred to omit the data of enterprises in the rural areas from our analyses,

18
3 :w The canvassing procedure was conducted by visiting 36,692 enterprises located in one of these 432 blocks, in order to collect data about their general characteristics like the gender of the entrepreneur, the number of persons engaged and the type of the production activity. However, due to the non-responses, interviews have been completed with only 24,968 of them. Due to these insolvable obstacles like refusing to respond, being temporarily absent, we had to assume that these 11,724 enterprises have the same distributions (in terms of gender of the entrepreneur, the number of persons engaged) with their counterparts that accepted the interview. With the help of this assumption we were able to expand our canvassing data set from 24,968 to 36,692 enterprises. We obtained 3w as illustrated in Table 3.3.
Table 3.3: Calculation of the third weighting multiplier (w3)
Canvassing Sample w3 Gender Size Gender Size Gender Size 1 2-9 10-49 1 2-9 10-49 1 2-9 10-49 Women A B C Women a b c Women A / a B / b C / c Men D E F Men d e f Men D / d E / e F / f Gender Size 1 2-9 10-49 Women 4.602273 2.894495 1.473684 Men 7.782927 4.577913 4.400531
Due to the sampling rules regarding the gender and size criteria, the third weighting multiplier ( 3w ) is obtained over the sub-groups of sample divided according to the gender of the entrepreneur and the size of the enterprise. For instance, while one out of 10 enterprises with working proprietor (single-person engaged) among men entrepreneurs was visited for the interview, this ratio is one over five for their women counterparts. Furthermore, while each woman entrepreneur of an enterprise with 2-9 persons engaged was interviewed, only half of their men counterparts were visited. However no sampling rule was carried out for enterprises with 10-49 persons and the main survey was conducted with each of them due to their rare presence in the economy.
Table 3.4 shows the distribution of interviews carried out in urban areas both in the main survey and follow-up along with the distribution of weighted number of enterprises.
Table 3.4: The Distribution of the Sample and the Weighted Number of Enterprises by Size of the Enterprise
Main Survey (2001) Follow-Up Survey (2002) Number of Persons Engaged n % Weighted n % n % Weighted n % 1 839 17.57 348,556 24.34 571 15.43 211,356 20.84 2-9 3,524 73.79 962,319 67.21 2,811 75.97 717,734 70.75 10-49 413 8.65 120,957 8.45 314 8.49 83,880 8.27 50+ - - - - 4 0.11 1,427 0.14 Total 4,776 100.00 1,431,832 100.00 3,700 100.00 1,014,398 100.00
3.9 Case Studies and Focus Groups These components of the research design are meant to complement the quantitative results of the surveys and enrich the research findings with qualitative insights into aspects of MSEs dynamics and prospects.
The Case Studies concentrated on cases of notable success (or failure). Criteria for success/failure were derived from preliminary analysis of survey results and field observations. Rise in employment between 2000 and 2001 were used as the main measure of success/failure. Gender, age and education
due to the possibility of this assumption producing misleading results. Thus, our remaining analyses were based on the main survey data set with 4,776 observations and the follow-up survey data set with 3,700 observations.
19
levels of the entrepreneur; sector, legal status, place of activity, sub-contracting relations, membership of business associations, existence of exports, use of credit and sources of credit were other variables used to diversify the selection of cases.
Enterprises were selected and were visited in Istanbul and Bursa with reference to their performance. Finally, 10 enterprises were selected on the basis of these field observations for case studies to be performed.13 6 Out of 10 enterprises were located in Istanbul and 4 in Bursa. Bursa is one of the few provinces in Turkey that succeeded in industrialization and integration to the national and international industrial production through backward and forward linkages. 6 of the enterprises were performing in the manufacturing sector and 4 were in trade and services. The entrepreneurs of those 10 enterprises were interviewed at their workplaces. In family enterprises interviews were also conducted with entrepreneurs of the earlier generation. A customer, representing the main customer profile of the enterprise, also participated in one of the case studies.
These case studies have given us the opportunity to re-interpret the survey results obtained in the past years and to assess the situation from the point of view of MSE entrepreneurs. As the survey information belonged to the years 2001 and 2002, it was possible to assess the changes in the performance of enterprises by the year 2004 when these case studies were conducted. The two-year period was a quite long period for MSEs and, moreover this period followed the deep economic crisis the country underwent in 2001. Liedholm and Mead (1999), in their study of small enterprises in Africa, report that the closure rate of small enterprises is above 20%. The fact that the enterprises still continue their activities after the two years mentioned, while the closure rate is at such a high level in the MSE sector, represents a “success” independent of the performance indicated in the past data.
The survey was supplemented by 6 focus group14 sessions in order to discuss and obtain collective opinions of entrepreneurs on issues such as home-based work, problems of credit recipients, problems related to exporting, young entrepreneurs, women and entrepreneurship, and impact of clusters. The focus group sessions also proved useful as a medium to discuss and evaluate policy relevance especially with regard to enhancing the productivity and competitiveness of MSEs.
Two reports were produced out of case studies and focus groups. Micro and Small Enterprises in Turkey: Rethinking MSEs evaluates the results of the case studies and Focus Group Report analyzes the outcomes of the focus groups.
3.10 Comparison with comparable official statistics
The last three Establishment Census carried out by the TURKSTAT pertain to the years 1985, 1992 and 2002. The results of the 2002 Census have not been fully published yet. Preliminary results of the 2002 Census provided only limited information about the nature and distribution of the enterprises in Turkey. The distribution of enterprises by economic activity in the urban and rural areas in the years 1985, 1992 and 2002 were compared with MSE results (Table 3.5). The comparison should be assessed with caution since the MSE coverage of enterprises does not fully correspond to the coverage of total enterprises in the Census. The distribution of enterprises by activity between 1985 and 2002 indicates that the TURKSTAT must have changed the classification of sub-sectors within the service sector. Distribution of MSE survey seems to be in correspondence with the 1985 and 1992 data rather than the distribution in the year 2002. The share of the transportation, communication and storage increased from 1% and 1.3% in 1985 and 1992 respectively to 14.2% in 2002 whereas the share of community, social and personal services decreased to 7.4% in 2002 from 15.6% in both 1895 and 1992. Moreover, real estate, leasing and business services appear as a new category for the year 2002. MSE survey has a higher share of enterprises performing in the trade sector and manufacturing sector and a lower share of enterprises in the service sector compared to the results of the Establishment Census. This outcome may be a result of excluded activities in the MSE survey such as professional activities and the coverage of the Census at the national level compared to the coverage of the MSE survey only in the urban areas.
13 See Appendix 6 for a list of participants of the 10 case studies. 14 See Appendix 7 for a list of participants of the focus groups.

20
Table 3.5: Comparison of establishment census with the MSE main survey results
Distribution of Enterprises in terms of Main Sectors
Sectors TURKSTAT Establishment Census (Urban and Rural)
MSE 2001 Main Survey (Urban)
1985 % 1992 % 2002* % 2001 % Mining and Quarrying 800 0.1 1,923 0.2 1,809 0.1 508 0.0 Manufacturing 183,573 20.9 186,574 17.5 246,899 14.3 276,046 19.3 Electricity, Gas and Water
- - 2,031 0.2 1,703 0.1 - -
Construction 8,642 1.0 14,859 1.4 35,702 2.1 35,820 2.5 Wholesale and Retail Trade
423,914 48.2 517,335 48.6 794,715 46.2 807,325 56.4
Restaurants and Hotels 84,441 9.6 117,136 11.0 163,112 9.5 152,956 10.7 Transportation, Commun. and Storage
8,819 1.0 14,283 1.3 244,490 14.2 17,954 1.3
Finance, and Insurance 31,506 3.6 43,679 4.1 13,538 0.8 9,694 0.7 Real estate, Leasing and Business Services
- - - - 90,473 5.3 47,947 3.3
Community, Social and Personal Services
137,508 15.6 165,918 15.6 128,157 7.4 83,582 5.8
TOTAL 879,173 100.0 1,063,738 100.0 1,720,598 100.0 1,431,832 100.0 Source: TURKSTAT Establishment Census, various years and MSE 2001 main survey.
*Preliminary results. www.die.gov.tr
3.11 Econometric study An econometric study is conducted to estimate the determinants of growth performance of the MSEs.15 The results of the econometric study (Table 3.6) regarding the independent variables will be displayed under the relevant themes in the following section where the main findings of the study are presented.
The Estimation Equation The cross-sectional estimate for the determinants of growth is conducted through the following model:
1 2 3
4 5 6
3
7 8 91
4
10 111
12 13 143
151
( )
i ii
i ii
i ii
GROWTH LNAGE LNSIZELNAGE LNSIZE SERVICE TRADE
EXPORT LINKAGE ASSOC LEGAL
SPO CLUSTER INDESTATE
TECHNOLOGY FORMAL INFORMAL
EDU REL
β β ββ β β
β β β λ
δ β β
β β β
γ β
=
=
=
= + ++ ⋅ + +
+ + + +
+ + +
+ + +
+ +
∑
∑
∑ 16 .ATIVE GENDERβ ε+ +
(1)
In this study, the growth rate in terms of the number of persons engaged16 is used in order to measure the growth performance of MSEs. Similar to Johnson, et al. (1999) we used the following formula to calculate the dependent variable:
15 The econometric study is conducted by the author of this study, Gokhan Ozertan and Burcu Songur. 16 We also run regressions with the value-added as the dependent variable, but the results were relatively weak in the sense that the co-efficient estimates were insignificant.

21
,2001 ,2000
,2001 ,2000
, 0.5 0.5
i ii
i i
EMP EMPGROWTH
EMP EMP−
=⋅ + ⋅
(2)
where i represents individual enterprises and EMP represents number of persons engaged.
The Explanatory Variables
Age and Size LNAGE, the logarithm of the enterprise age, and LNSIZE, the logarithm of the number of persons engaged at start-up, are included in the model to test the dependence of enterprise growth to its age and initial size. We expect these variables to be inversely related with GROWTH consistent with the recent theoretical literature on the size distribution. Moreover the cross product, LNAGE LNSIZE⋅ is added to test the presence of any non-linear relation between growth rate and age and initial size of an enterprise.17
Sector The sector dummies SERVICE and TRADE are included in the model in order to capture any possible effects of operating in the services or the trade sector compared with the manufacturing as the base sector.
Legal Status The reason of adding the legal status dummies iLEGAL ( 1,2,3i = ) is to test whether any significant effects of being registered as sole proprietorship, partnership or limited liability on enterprise growth compared to joint stock as the base exists. Since the number of unregistered enterprises is too small, the data of unregistered enterprises are omitted from the sample. We expect a negative relationship between enterprise growth and sole proprietorship and partnership. As Becchetti and Trovato (2002) also stated, higher personal wealth at risk is expected to cause reluctance in investing in risky ventures.
Export We added the variable EXPORT for controlling the effects of access to foreign markets. The sign of this variable is expected to be positive due to the fact that exporting usually substitutes the fall in domestic demand. However, one should treat this variable with caution, since by their nature, MSEs mainly serve local markets and do not target international customers.
External Finance Variables FORMAL and INFORMAL are added into the model in order to observe the effects of external financial resources during the financial crisis. FORMAL is defined as credits taken from banks, development funds, private enterprises, NGO’s and government agencies. Whereas INFORMAL is defined as inheritance of assets or borrowing from family members, relatives, neighbors and friends. Expecting a positive impact of external finance on MSE growth is relatively more relevant for the periods of macro-economic boom. Due to rapid increases in the interest rates and acute shortage of liquid assets during the recent crisis FORMAL and INFORMAL may have negative effects on MSE growth.
Linkage which takes value one in case of having any kind of linkage with other enterprises, is added since being related with other enterprises may have positive effects on growth in terms of business opportunities which could open up new markets or increase productivity by sharing equipment or skilled personnel.
Association which takes the value one if the enterprise is formally registered to any kind of commercial or business association, is added to our model in order to control the effect of being a member of an association on the MSE growth.
Location The location dummies iSPO ( 1,2,3, 4i = ) test the effect of the socio-economic development level of the province in which the enterprise is located. The stratification of provinces according to their socio-economic development level is conducted by the State Planning Organization (SPO)18. While 1SPO refers to the most socio-economically developed provinces, 5SPO , which is the base, refers to the least developed provinces.
17 See Evans (1987). 18 See Appendix 5.

22
CLUSTER and INDESTATE are two dummies used for the location of the enterprise in a cluster or an industrial estate, respectively, against the base of being located in none of them.
Human Capital The educational level variables iEDU ( 1, 2,3i = ) are the human capital determinants. By incorporating these variables into the model we would like to test whether the education level of the entrepreneur has an impact on the growth of his/her enterprise. 1EDU is defined as the number of grades completed in formal education and takes discrete values. 2EDU is a dummy that takes the value one if the entrepreneur had formal technical or vocational education related to present activity. 3EDU is another dummy and takes the value one if the entrepreneur had a training-apprenticeship experience related to his/her present activity.
Technology a dummy that takes the value one if the entrepreneur stated that he/she uses the latest technology in the sector she/he is active. This variable should be interpreted with caution, since some entrepreneurs consider the use of even very simple devices as high technology.
Characteristics of persons engaged in the enterprise GENDER, a dummy taking the value one if the entrepreneur is male.
The impact of employing relatives and/or family members on the MSE growth is tested by including the variable RELATIVE in the model. The variable represents the number of relatives engaged in the operation. As Çınar et.al. (1987) finds, we expect a positive relationship between RELATIVE and GROWTH due to the advantages of hiring relatives in terms of flexible working hours and payments. In addition, due to the cost and the complexity of social insurance procedures, hiring relatives may give the entrepreneur the opportunity to avoid such types of costs.
Tests The presence of heteroskedasticity in the regression analysis is tested by “White’s Heteroskedasticity Test”, and it is found that the residuals are heteroskedastic. This problem is eliminated by replacing the conventional estimator of the asymptotic covariance estimator with White’s Heteroskedasticity Consistent Estimator (White, 1980b). The GMM estimator is not employed since regardless of covariance matrix of moments, the GMM estimator for the heteroskedasticity regression model is equivalent to ordinary least squares (OLS)19. Regressions run with the White’s Heteroskedasticity Consistent Estimator generate unbiased and consistent but inefficient estimators. Thus, in order to solve the inefficiency problem we could have used the feasible GLS estimator, but this method requires the knowledge of the structural form of the heteroskedasticity.20 Even if it were assumed that the structural form was known, it is ambiguous how much of the gain in efficiency would be captured.
After running the Jarque - Bera Normality Test on the residuals obtained from the regression on the dataset, we conclude that the residuals are not normally distributed.21 Without the assumption of normally distributed disturbances it is not eligible to construct statistics for testing hypothesis. However, according to the large–sample results, even though the residuals are not normally distributed, the distributions of F, t and 2χ can still be used. In fact the values obtained from these distributions should not be considered as if they are exact. They should be viewed as approximations, and the accuracy of these approximations increases with the increase in sample size (Greene, 2003:105). An ‘F Test’ on joint significance of co-efficient estimates gives a p-value of zero ( 7.4734F = ) and we conclude that the estimates are statistically significant if tested jointly.
19 See Greene (2003:221) for details. 20 See Johnston and Dinardo (1997:170). 21 All test results mentioned in this study can be obtained from the authors upon request.

23
Variable Estimate Std. Error t-statistic p-value
C -0.0593 0.0528 -1.1224 0.2618LNAGE -0.0196 ** 0.0098 -1.9893 0.0467LNSIZE -0.0564 *** 0.0199 -2.8383 0.0046LNAGE*LNSIZE 0.0049 0.0083 0.5951 0.5518SERVICE 0.0845 *** 0.0193 4.3726 0.0000TRADE 0.0848 *** 0.0150 5.6691 0.0000EXPORT -0.1061 0.1009 -1.0513 0.2932LINKAGE -0.0041 0.0168 -0.2437 0.8075ASSOC -0.0228 0.0154 -1.4734 0.1407LEGAL1 0.0040 0.0327 0.1231 0.9021LEGAL2 0.0456 0.0352 1.2966 0.1948LEGAL3 0.0331 0.0340 0.9737 0.3302SPO1 0.0429 * 0.0242 1.7688 0.0770SPO2 0.0492 * 0.0256 1.9188 0.0551SPO3 0.0516 ** 0.0250 2.0671 0.0388SPO4 0.0379 0.0282 1.3427 0.1794CLUSTER -0.0478 * 0.0253 -1.8867 0.0593INDESTATE -0.0417 ** 0.0175 -2.3860 0.0171TECHNOLOGY 0.0277 ** 0.0141 1.9562 0.0505FORMAL -0.0565 *** 0.0173 -3.2770 0.0011INFORMAL -0.0507 *** 0.0176 -2.8858 0.0039EDU1 0.0016 0.0016 0.9553 0.3395EDU2 0.0348 0.0237 1.4695 0.1418EDU3 -0.0234 * 0.0136 -1.7213 0.0853RELATIVE 0.0287 *** 0.0055 5.2536 0.0000GENDER -0.0641 *** 0.0233 -2.7444 0.0061
R-squared 0.0429 Adj. R-squared 0.0372 F-statistic 7.4666 Prob (F-statistic) 0.0000 N 4192
Note: Absolute value of standard error in parentheses. * Statistically significant at 10% level ** Statistically significant at 5% level *** Statistically significant at 1% level
Table 3.6: Regression Results and Parameter Estimates

24
Section 4: The role of MSEs in the Turkish economy
MSEs in Turkey contributed significantly to the national economy in terms of both employment and value-added. From the period 1970 to 199222, the share of MSEs in generating employment in the manufacturing sector remained fairly stable decreasing only from 48% to 43%. During the same period, their share of value-added in the manufacturing sector remained around 18% to 19%. On the other hand, the trade sector has been increasingly dominated by the MSEs. Between 1970 and 1992 the employment share of the MSEs accounted for 98% of the total employment in the trade sector. The value-added generated by MSEs in the trade sector, throughout the same period, remained as high as 94%. Between 1980 and 1992, the service sector as a whole experienced the highest growth rate in terms of value-added compared to the manufacturing and the trade sector. Although MSEs in the service sector experienced higher growth rates than the MSEs in other sectors, their employment share declined from 92% to 87% and their value-added share fell from 79% to 61%. It seems that during this period there was a significant shift from smaller to larger enterprises in the service sector.
The preliminary summary results of the General Census of Industry and Business Establishments (GSIS) for the year 2002, shows that MSEs continue to play an important role in the economy in terms of their share in total number of enterprises. The distribution of size categories in terms of persons engaged is given in Table 4.1. The enterprises with 1-49 persons engaged constitute 99.41% of the total enterprises in Turkey. According to GSIS 2002, the average size of the enterprises in Turkey is 3.68 persons engaged. This figure is greater for the manufacturing sector (8.27 persons engaged) and smaller for the trade sector (2.58 persons engaged).
Table 4.1: Distribution of Enterprises by Size, 2002
Persons Engaged No. of Enterprises Share (%) 1-9 1,657,271 96.32 10-49 53,246 3.09 50-99 5,080 0.30 100-150 1,804 0.10 151-250 1,387 0.08 251+ 1,810 0.11 Total 1,720,598 100.00
Source: General Census of Industry and Business Establishments 2002, TURKSTAT.
For information on the employment share of MSEs in the economy we should look at the Household Labour Force Surveys. At present, MSEs are a major source of employment in Turkey. In 2001, at the time of the main survey, the share of non-agricultural MSE employment in total non-agricultural employment was 73%, whereas 51% of the non-agricultural workforce was employed by the non-agricultural micro enterprises (1-9 employees).
The data provided by our survey allows us to demonstrate the role played by MSEs in the economy as a whole in terms of value-added. Total extrapolated gross value-added23 created by MSEs in the non-agricultural sector in the urban areas is compared with the total non-agricultural gross value-added in Turkey24 (Table 4.2). As a whole, MSEs produce 68.4% of the total gross non-agricultural value-added in Turkey.
22 The last General Census of Industry and Business Establishments (GSIS) with disaggregated data by size and sector dates back to 1992. The preliminary results of the GSIS for the year 2002 recently announced by the TURKSTAT, contain very limited data on the MSEs. They do not provide information about the share of MSEs in terms of value-added or employment of main sectors. 23 Appendix 8 provides the number of enterprises that responded to all the questions on sales and production that are required to compute the value-added. Enterprises with missing values were assigned the mean values of value-added in terms of size and economic activity to compute the total extrapolated gross value-added by the MSEs. 24 Gross value-added values for the national economy and the MSEs do not correspond to the same economic activities and geographical areas exclusively. MSE survey includes non-agricultural activities in the urban areas (covers cities with 20,000 and more inhabitants) with a number of exclusions, whereas the national gross value-added covers all non-agricultural economic activities in both urban and rural areas.

25
The MSEs in the manufacturing sector play a significant role by producing 33.6% of the total non-agricultural gross value-added. According to the Istanbul Chamber of Industry (ISO), the first top 500 enterprises in the manufacturing sector in Turkey in 2001 created a value-added of 19,139,029 billion TL. and the second top 500 enterprises 1,810,348 billion TL. Thus, in total the top 1,000 industrial enterprises in the manufacturing sector in Turkey created a value-added of 20,949,377 billion TL. corresponding to 53.9% of the total value-added in the sector (Table 6.10). The difference in value-added created by the top 1,000 industrial enterprises and the MSEs in the manufacturing sector amount to a total of 4,848,249 billion TL. Thus, 12.5% of the value-added is likely to be produced by enterprises smaller than the top 1,000 and larger than the MSEs.
Table 4.2: The share of MSE non-agricultural gross value-added in the national total non-agricultural gross value-added, 2001 (in producer’s value, billion TL)
Economic activity
National Total Non-Agricultural
Gross Value-added1 (1)
MSE Non-Agricultural Gross Value-added, Urban2
(2)
(2)/(1) %
Manufacturing3 38,859,269 13,061,643 33.6 Construction 9,202,185 539,688 5.9 Trade 30,125,927 25,194,537 83.6 Hotels/Restaurants 7,741,932 2,427,570 31.4 Other services4 41,806,372 46,117,910 110.3 Total 127,735,687 87,341,348 68.4
1 Turkish Statistical Institute, National Accounts. www.die.gov.tr. 2 MSE Survey Results, covers only cities with 20,000 and more inhabitants. 3 Including mining and quarrying. 4 Ownership of dwellings and imputed bank service charges are not included in total services.
Our survey data shows that MSEs contribute only by 5.9% of value-added to the construction sector. However, this outcome should be handled with caution. It is extremely difficult to identify construction enterprises in a survey, and it is a common practice to compute the value-added for the construction sector by using other sources.
Although large enterprises are increasingly entering the trade activities in Turkey, particularly in the area of provision of consumer goods through supermarket chains, MSEs are still maintaining their role as the major type of enterprise in the trade sector contributing a higher value-added (83.6%) compared to the MSEs in the manufacturing sector (33.6%).
The survey results point to a higher value-added in other services category than that shown in the total value-added given in the National Accounts. It is commonly known that those activities which come under the category of other services are particularly underestimated in the National Accounts.25
25 We are informed that the TURKSTAT is in the process of updating the procedures followed in the computation of the National Accounts which would likely lead to an increase in the national gross value-added.
26
Section 5: Business environment and the economic crisis of 2001
The entrepreneurial activities in developing countries are faced with serious obstacles stemming from both macro-economic uncertainties and instabilities. The field survey of this study has been carried out in 2001-2002 when Turkey was going through a serious economic crisis. Thus, in addition to providing a general view of the MSEs in Turkey, the results of this survey highlights the ways in which MSEs deal with crisis situations.
The deteriorating economic conditions throughout the year 2000 and the sub-sequent economic crisis in 2001 led to a substantial fall in the domestic demand. While GDP fell by 7.5% in 2001, manufacturing and trade sectors shrank by 8.1% and 9.45 respectively.26 A large number of MSEs were thus affected quite severely by the falling demand. There is, however, no reliable data on the actual number of the MSEs that were closed down as a result of this economic crisis. But, our observations on the field suggest that actual cases of closure were less than initially anticipated for such a crisis. In most cases the lack of a viable alternative, a means to enable the entrepreneurs to earn a living, played an important role in their determination to continue their business in such adverse circumstances. From a pure economic standpoint it is difficult to explain the persistence of these entrepreneurs in the market. Contrary to the commonplace view, low demand and high competition do not lead to a fall in the entry of new enterprises to the market. Evidently, under the conditions of high and persistent unemployment, the failed entrepreneurs have no choice but continue with their business or start new enterprises that are likely to be unsuccessful too. Survival of such enterprises is maintained by the conduct of the entrepreneur himself/herself in the market place rather than by the economic functioning of the enterprise or its engagement in any kind of productive activities. The system is generally based on the personal ability of the entrepreneur to start-up a business usually from scratch. Entrepreneurs of failed enterprises usually point to the lack of information on the nature of their businesses. Such enterprises often could only survive in the market by engaging in self-exploitation, exploitation of the family labor as well as hired labor. Most of the entrepreneurs work for long hours and use family labor including the labor of children, often far beyond the physical limits of an average human being. MSEs usually face volatile demand and hire labor when family labor is incapable of producing the required amounts on time. On the other hand, unemployed people are prepared to work hard and for long hours for very little.
This situation may be taken to represent the existence of functioning markets, and as such may be perceived as a positive indication of opportunities for the people to participate in the economy to sustain themselves and their dependents who are generally very disadvantaged. From another point of view, however, the increase in the number of people engaged in MSEs may be considered as a sign of failure of the economy to provide productive jobs, thus forcing the people to start up businesses that provide only minimal subsistence support for themselves and for their families. The investigation of these diverse views is of great importance to those who wish to address the problems of poverty and growth in the economy.27
The effects of the macro-economic conditions are reflected in the activities of the enterprises through the sectors in which they perform. Usually, the structure of the related sector in Turkey determines the nature of the influence on MSEs. The enterprises engaged in fragile sectors or those which have linkages with enterprises engaged in such sectors, are in serious risk. For example, an enterprise manufacturing spare parts for the automotive sector, was found to be the most successful enterprise in the sample of case studies. The fact that automotive sector was the first to overcome the crisis through its international connections explains this success to a great extent. The enterprise and its entrepreneur did not seem to possess distinctive factors that can explain its success compared to other enterprises. On the other hand, an enterprise engaged in the construction sector, which was one of the sectors affected most thoroughly during the crisis, did not fare well. The demise of the construction sector had resulted in decline of this enterprise.
Entrepreneurs themselves also consider the situation using a sector-based rather than a scale-based approach, in order to evaluate the impact of macro-economic conditions. The entrepreneur engaged in 26State Planning Organization (SPO) Economic Developments, 2005, www.spo.gov.tr. 27See Liedholm (2002) for the case of African and Latin American countries.

27
a sector usually identifies himself/herself not in terms of the scale of the enterprise, but by the belonging of the enterprises to the sector in question.
The common problem during the crisis, mentioned by the entrepreneurs, was the uncertainties originating from macro-economic instability. The entrepreneurs stated that these uncertainties affect their conduct, resulting in hesitation in decision making about their enterprises. The most obvious indication of general economic instability leading to uncertainties is price instability. Price instability create difficulties in drafting the enterprise plans. Moreover, the real interest rates were and still are high in Turkey. The decreasing trend in rate of inflation since 2003 have not exerted a downward pressure on real interest rates as expected. The real interest rates are still at the level of 15-20%.
Fluctuations in foreign exchange rates also create negative effects on the commercial relations of the enterprises with the markets abroad. The entrepreneurs engaged in exports have stated that, due to fluctuations in the foreign exchange rates, they have started to think more carefully when making decisions on exports.
As Mead and Liedholm (1998) stated in their studies, the tendency to generate employment of MSEs in less developed and developing countries is significantly weak and only a minority of MSEs generate most of the expansion. Stability and sustainability of the growth performance depends closely on the macro-economic structure. Mead and Liedholm (1998) emphasized the direct impact of macro-economic circumstances on the MSE growth. The authors observed that when the economy itself is growing the major source for generating employment is the MSEs expansion. On the other hand, in times of stagnation, existing MSEs are not as able to create new jobs as new business-starts. When the economy is stagnant, workers who are laid off by the existing MSEs prefer to establish their own enterprises. Thus, during economic stagnations, new starts rather than MSEs, are the main contributors to employment growth. However, this dynamic is reversed when the economy is growing and the existing MSEs becomes the major source of employment growth.
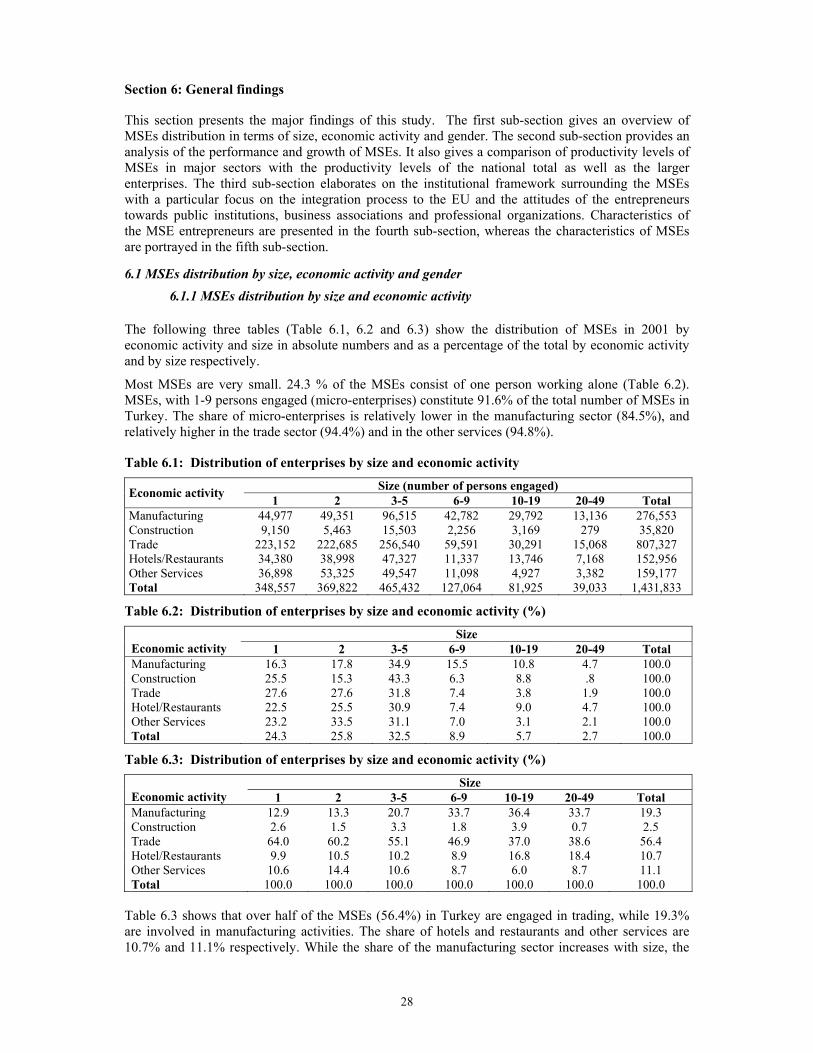
28
Section 6: General findings
This section presents the major findings of this study. The first sub-section gives an overview of MSEs distribution in terms of size, economic activity and gender. The second sub-section provides an analysis of the performance and growth of MSEs. It also gives a comparison of productivity levels of MSEs in major sectors with the productivity levels of the national total as well as the larger enterprises. The third sub-section elaborates on the institutional framework surrounding the MSEs with a particular focus on the integration process to the EU and the attitudes of the entrepreneurs towards public institutions, business associations and professional organizations. Characteristics of the MSE entrepreneurs are presented in the fourth sub-section, whereas the characteristics of MSEs are portrayed in the fifth sub-section.
6.1 MSEs distribution by size, economic activity and gender 6.1.1 MSEs distribution by size and economic activity
The following three tables (Table 6.1, 6.2 and 6.3) show the distribution of MSEs in 2001 by economic activity and size in absolute numbers and as a percentage of the total by economic activity and by size respectively.
Most MSEs are very small. 24.3 % of the MSEs consist of one person working alone (Table 6.2). MSEs, with 1-9 persons engaged (micro-enterprises) constitute 91.6% of the total number of MSEs in Turkey. The share of micro-enterprises is relatively lower in the manufacturing sector (84.5%), and relatively higher in the trade sector (94.4%) and in the other services (94.8%).
Table 6.1: Distribution of enterprises by size and economic activity
Size (number of persons engaged) Economic activity 1 2 3-5 6-9 10-19 20-49 Total Manufacturing 44,977 49,351 96,515 42,782 29,792 13,136 276,553 Construction 9,150 5,463 15,503 2,256 3,169 279 35,820 Trade 223,152 222,685 256,540 59,591 30,291 15,068 807,327 Hotels/Restaurants 34,380 38,998 47,327 11,337 13,746 7,168 152,956 Other Services 36,898 53,325 49,547 11,098 4,927 3,382 159,177 Total 348,557 369,822 465,432 127,064 81,925 39,033 1,431,833
Table 6.2: Distribution of enterprises by size and economic activity (%)
Size Economic activity 1 2 3-5 6-9 10-19 20-49 Total Manufacturing 16.3 17.8 34.9 15.5 10.8 4.7 100.0 Construction 25.5 15.3 43.3 6.3 8.8 .8 100.0 Trade 27.6 27.6 31.8 7.4 3.8 1.9 100.0 Hotel/Restaurants 22.5 25.5 30.9 7.4 9.0 4.7 100.0 Other Services 23.2 33.5 31.1 7.0 3.1 2.1 100.0 Total 24.3 25.8 32.5 8.9 5.7 2.7 100.0
Table 6.3: Distribution of enterprises by size and economic activity (%)
Size Economic activity 1 2 3-5 6-9 10-19 20-49 Total Manufacturing 12.9 13.3 20.7 33.7 36.4 33.7 19.3 Construction 2.6 1.5 3.3 1.8 3.9 0.7 2.5 Trade 64.0 60.2 55.1 46.9 37.0 38.6 56.4 Hotel/Restaurants 9.9 10.5 10.2 8.9 16.8 18.4 10.7 Other Services 10.6 14.4 10.6 8.7 6.0 8.7 11.1 Total 100.0 100.0 100.0 100.0 100.0 100.0 100.0
Table 6.3 shows that over half of the MSEs (56.4%) in Turkey are engaged in trading, while 19.3% are involved in manufacturing activities. The share of hotels and restaurants and other services are 10.7% and 11.1% respectively. While the share of the manufacturing sector increases with size, the

29
share of the trade sector falls. Most of the enterprises with one or two persons engaged in the trade sector are small retail shops with customers from their closest neighbourhood.
Graph 6.1: Distribution of enterprises by size (number of persons engaged) (%)
24.3%
25.8%32.5%
5.7% 2.7%8.9%
1 2 3-5 6-9 10-19 20-49
Graph 6.2: Distribution of enterprises by economic activity (%)
19.3%
2.5%
56.4%
10.7%11.1%
Manufacturing Construction TradeHotels-restaurants Other services
6.1.2 MSEs distribution by gender There is a huge gender difference among the entrepreneurs of the MSEs in favour of men. Contrary to the situation in other developing countries of Africa and Latin America where large numbers of MSEs are owned and operated by women, our results show that, in urban Turkey, only 6.1% of the MSE entrepreneurs are women (Graph 6.1 and Table 6.4). The share of women entrepreneurs is proportionately higher in manufacturing and service sector than in other sectors.

30
Graph 6.3: Distribution of enterprises by gender of the entrepreneur and by economic activity
10.1
3.7
4.9
2.7
8.7
6.1
89.9
96.3
95.1
97.3
91.3
93.9
0 20 40 60 80 100
Manufacturing
Construction
Trade
Hotels-rest.
Other services
Total
(%)
WomenMen
Table 6.4: Distribution of enterprises by gender of the entrepreneur and by economic activity
Gender of the Entrepreneur Economic activity Women % Men % Total Manufacturing 28,044 10.1 248,510 89.9 100.0 Construction 1,326 3.7 34,494 96.3 100.0 Trade 39,817 4.9 767,507 95.1 100.0 Hotels/Restaurants 4,142 2.7 148,813 97.3 100.0 Other Services 13,898 8.7 145,279 91.3 100.0 Total 87,227 6.1 1,344,603 93.9 100.0
Women entrepreneurs are proportionately more concentrated in sole proprietorship. The findings display that 51.8% of women in the manufacturing sector are sole proprietors, usually performing subsistence activities, whereas only 12.2% of men entrepreneurs in the manufacturing sector are sole proprietors (Table 6.5 and 6.6).
Table 6.5: Distribution of enterprises of men entrepreneurs by size of the enterprise and economic activity (%)
Size Economic activity 1 2 3-5 6-9 10-19 20-49 Total Manufacturing 12.2 19.3 36.5 16.0 11.5 4.5 100.0 Construction 26.5 15.8 41.1 6.5 9.2 0.8 100.0 Trade 27.4 27.7 31.9 7.2 3.9 1.9 100.0 Hotels/Restaurants 23.0 24.1 31.6 7.5 9.0 4.8 100.0 Other Services 23.5 34.4 30.5 6.5 2.8 2.3 100.0 Total 23.7 26.2 32.8 8.8 5.9 2.7 100.0
Table 6.6: Distribution of enterprises of women entrepreneurs by size of the enterprise and economic activity (%)
Size of Enterprise Economic activity 1 2 3-5 6-9 10-19 20-49 Total Manufacturing 51.8 5.3 20.6 11.0 3.9 7.3 100.0 Construction - - 99.4 .6 - - 100.0 Trade 32.2 24.9 29.7 10.4 .9 1.9 100.0 Hotels/Restaurants 5.0 75.1 7.8 4.4 7.7 - 100.0 Other Services 19.7 24.0 37.2 12.3 6.6 .2 100.0 Total 34.7 20.5 28.0 10.5 3.1 3.2 100.0
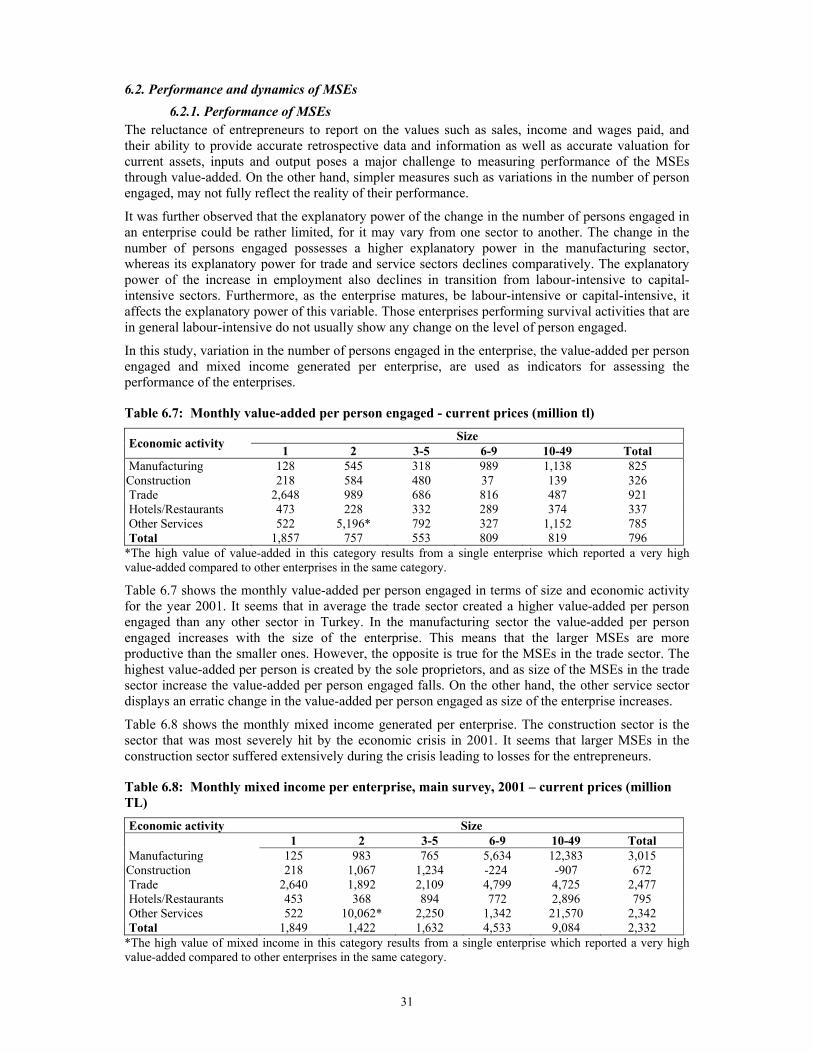
31
6.2. Performance and dynamics of MSEs 6.2.1. Performance of MSEs
The reluctance of entrepreneurs to report on the values such as sales, income and wages paid, and their ability to provide accurate retrospective data and information as well as accurate valuation for current assets, inputs and output poses a major challenge to measuring performance of the MSEs through value-added. On the other hand, simpler measures such as variations in the number of person engaged, may not fully reflect the reality of their performance.
It was further observed that the explanatory power of the change in the number of persons engaged in an enterprise could be rather limited, for it may vary from one sector to another. The change in the number of persons engaged possesses a higher explanatory power in the manufacturing sector, whereas its explanatory power for trade and service sectors declines comparatively. The explanatory power of the increase in employment also declines in transition from labour-intensive to capital-intensive sectors. Furthermore, as the enterprise matures, be labour-intensive or capital-intensive, it affects the explanatory power of this variable. Those enterprises performing survival activities that are in general labour-intensive do not usually show any change on the level of person engaged.
In this study, variation in the number of persons engaged in the enterprise, the value-added per person engaged and mixed income generated per enterprise, are used as indicators for assessing the performance of the enterprises.
Table 6.7: Monthly value-added per person engaged - current prices (million tl)
Size Economic activity 1 2 3-5 6-9 10-49 Total Manufacturing 128 545 318 989 1,138 825 Construction 218 584 480 37 139 326 Trade 2,648 989 686 816 487 921 Hotels/Restaurants 473 228 332 289 374 337 Other Services 522 5,196* 792 327 1,152 785 Total 1,857 757 553 809 819 796
*The high value of value-added in this category results from a single enterprise which reported a very high value-added compared to other enterprises in the same category.
Table 6.7 shows the monthly value-added per person engaged in terms of size and economic activity for the year 2001. It seems that in average the trade sector created a higher value-added per person engaged than any other sector in Turkey. In the manufacturing sector the value-added per person engaged increases with the size of the enterprise. This means that the larger MSEs are more productive than the smaller ones. However, the opposite is true for the MSEs in the trade sector. The highest value-added per person is created by the sole proprietors, and as size of the MSEs in the trade sector increase the value-added per person engaged falls. On the other hand, the other service sector displays an erratic change in the value-added per person engaged as size of the enterprise increases.
Table 6.8 shows the monthly mixed income generated per enterprise. The construction sector is the sector that was most severely hit by the economic crisis in 2001. It seems that larger MSEs in the construction sector suffered extensively during the crisis leading to losses for the entrepreneurs.
Table 6.8: Monthly mixed income per enterprise, main survey, 2001 – current prices (million TL)
Economic activity Size 1 2 3-5 6-9 10-49 Total Manufacturing 125 983 765 5,634 12,383 3,015 Construction 218 1,067 1,234 -224 -907 672 Trade 2,640 1,892 2,109 4,799 4,725 2,477 Hotels/Restaurants 453 368 894 772 2,896 795 Other Services 522 10,062* 2,250 1,342 21,570 2,342 Total 1,849 1,422 1,632 4,533 9,084 2,332
*The high value of mixed income in this category results from a single enterprise which reported a very high value-added compared to other enterprises in the same category.

32
The returns to the entrepreneur increase significantly with size of the enterprise particularly in the manufacturing sector and the other services. The manufacturing sector does not only practice the highest productivity in terms of value-added per person, but also generate the highest returns for the entrepreneur in general. However, this fact is true for manufacturing enterprises larger than 5 persons engaged.
6.2.2. Productivity differences of MSEs with the national total and larger enterprises Table 6.9 shows a comparison of gross value-added per person engaged by the MSEs in the urban areas to the national total non-agricultural gross value per employed. This comparison reflects the fact that apart from the construction sector the average value-added per person engaged in MSEs is quite similar to the figures for the national total, indicating that the productivity achieved in MSEs in average could be considered as competitive at the national level.28
Table 6.9: Comparison of national non-agricultural gross value-added per employed with mse and survey gross value-added per person engaged, 2001 (in producer’s value, million TL)
Economic activity
National Total Non-Agricultural
Gross Value- added1
(million TL)
HLFS 2001 National Total Non-
Agricultural Employment2 (thousands)
National Total Non-Agricultural
Gross Value- added per Employed
(million TL)
MSE Non-Agricultural
Gross Value- added per Person
Engaged, Urban3 (million TL)
Manufacturing4 38,859,269,504 3,689 10,533 9,900 Construction 9,202,185,300 1,110 8,290 3,912 Trade 30,125,927,350 11,052 Hotels/Restaurants
7,741,932,778 3,737
10,133
4,044 Other Services5 41,806,372,334 4,814 8,684 9,420 Total 127,735,687,266 13,350 9,568 9,552
1 Turkish Statistical Institute (TURKSTAT), National Accounts, www.die.gov.tr. 2 Household Labor Force Survey, TURKSTAT, www.die.gov.tr. 3 MSE survey results. 4 Including mining and quarrying. 5 Owner-occupied dwellings and imputed bank service charges are not included in total services.
For information on value-added differences in terms of size in the manufacturing sector, we rely on the information provided by the ‘First and Second Top 500 Industrial Enterprises in Turkey’ published annually by the Istanbul Chamber of Industry (ISO). Table 6.10 shows the gross value-added for the top 1,000 industrial enterprises in Turkey. The top 500 industrial enterprises make up 49.3% of the value-added in the total national value-added in the manufacturing sector, whereas the contribution of the second top 500 industrial enterprises to the manufacturing sector falls significantly to a ratio of 4.7%. This enourmous difference in the value-added generated by the first and second top 500 industrial enterprises also indicates the existence of a high concentration in the manufacturing sector.
Table 6.10 also shows the value-added per worker for the first and second top industrial enterprises (500 each). The productivity difference between the two groups of enterprises is about 3 folds. The value-added per worker in the second top 500 industrial enterprises in the manufacturing sector are
28 Table 6.9 synthesizes data collected from different sources such as the National Accounts and Household Labor Force Surveys which have different bases and data collection methods. Gross value-added in the National Accounts should be related to employment as in the National Accounts (in full-time equivalents), while employment figures in the Household Labor Force Survey may count temporary workers in total employment resulting in over-estimation of employment. However, National Accounts do not provide statistics on employment in terms of main sectors. Additionally, the coverage of the National Accounts and the MSE data is not matching exclusively in terms of geographical location and sectors. For those reasons, the assessment should be interpreted with caution.

33
closer to the figures we found for the MSEs. These data clearly show that the manufacturing sector in Turkey is significantly dominated by large-sized enterprises.
Table 6.10: The top 1,000 industrial enterprises in Turkey, 2001
Economic Activity
Annual Gross Value-added
Total Number of Wage Workers
Annual Gross Value-added per Worker
First 500 19,139,029,323 526 314 36,364 Second 500 1,810,348,075 149 869 12,079 Total 20,949,377,398 676 183 30,981
Source: First and Second Top 500 Industrial Enterprises, Istanbul Chamber of Industry, Special Issue (ISO), 2002.
6.2.3 Dynamics of the performance of MSEs The dynamics of the performance of MSEs is measured by two indicators: the first is the average number of persons engaged in MSEs, and the second is the value-added per person engaged over the period 2000-2002.
Graph 6.4 and Table 6.11 show that in all sectors there has been a decline in the average number of persons engaged from 2000 to 2001 indicating an immediate response of MSEs to the economic crisis of 2001 by shrinking in size in terms of employment.29 However, changes in employment level do not always indicate failure. For some enterprises decreasing employment could be considered as a survival strategy.
In 2002, minor increases were observed in the manufacturing and trade sectors, while the construction sector and other services continued to shrink. The new additions, however, did not reach the numbers in 2000.
Table 6.11: Average number of persons engaged per enterprise by economic activity, 2000-2002
Economic Activity 2000 2001 2002 Manufacturing 7.4 5.3 5.7 Construction 6.4 3.5 3.0 Trade 3.6 3.0 3.1 Hotels/Restaurants 4.5 3.9 3.9 Other Services 4.2 3.7 3.4 Total 4.6 3.6 3.7
In 2001, it seems that MSEs in the manufacturing sector could sustain the value-added per person engaged at a high level as in 2000 by laying off some of their employees (Graph 6.4, 6.5 and Table 6.11, 6.12). The value-added per person engaged in the manufacturing sector continued to fall in 2002, although the average number of persons engaged remained about the same. It is likely that the minimum limits of employment were reached for being able to continue production. In the category of other services, however, both average number of persons engaged and value-added per person engaged continued to fall in 2002, the fact that indicates that the manufacturing sector is less flexible than the other services sector in terms of employment. It seems that the trade sector was the least affected sector from the economic crisis. It even enjoyed an increase in value-added per person engaged during the crisis.
29 It should be noted that the follow-up survey carried out in 2002 covers only those enterprises that were found at their location in 2001. The 2002 data do not include those enterprises that had been closed or moved to another location during the preceding year.
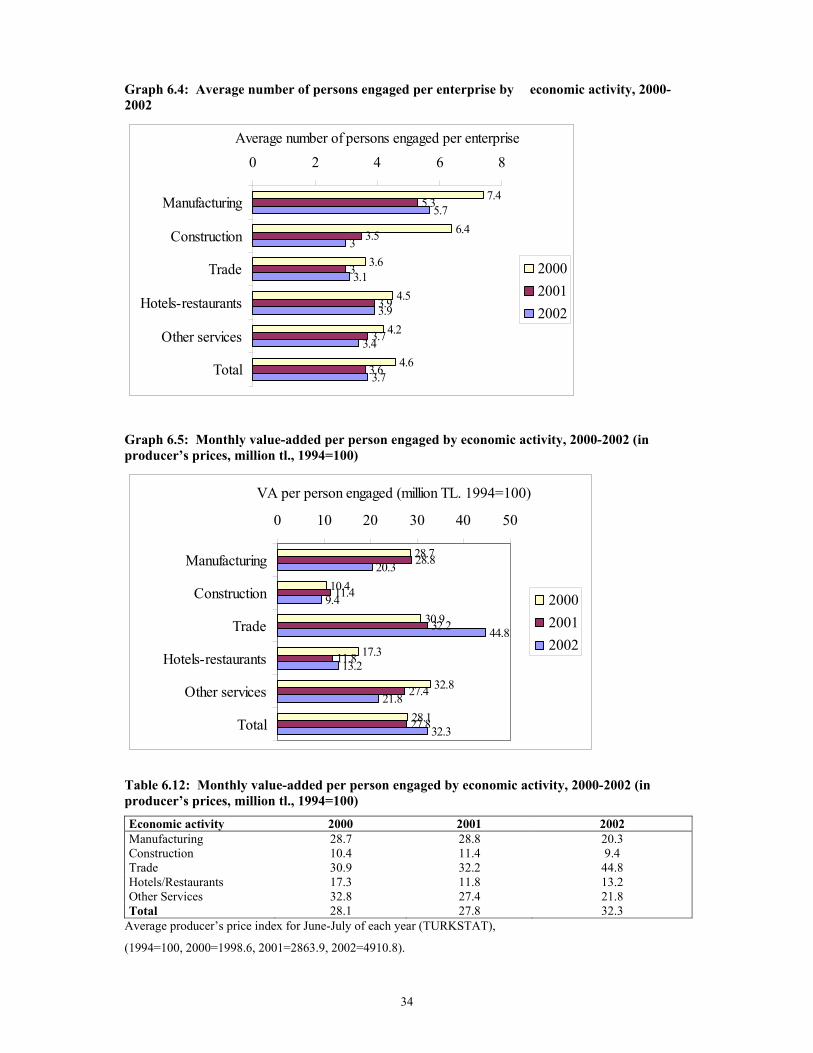
34
Graph 6.4: Average number of persons engaged per enterprise by economic activity, 2000-2002
7.4
6.4
3.6
4.5
4.2
4.6
5.3
3.5
3
3.9
3.7
3.6
5.7
3
3.1
3.9
3.4
3.7
0 2 4 6 8
Manufacturing
Construction
Trade
Hotels-restaurants
Other services
Total
Average number of persons engaged per enterprise
200020012002
Graph 6.5: Monthly value-added per person engaged by economic activity, 2000-2002 (in producer’s prices, million tl., 1994=100)
28.7
10.4
30.9
17.3
32.8
28.8
11.4
32.2
11.8
27.4
27.8
20.3
9.4
44.8
13.2
21.8
32.328.1
0 10 20 30 40 50
Manufacturing
Construction
Trade
Hotels-restaurants
Other services
Total
VA per person engaged (million TL. 1994=100)
200020012002
Table 6.12: Monthly value-added per person engaged by economic activity, 2000-2002 (in producer’s prices, million tl., 1994=100)
Economic activity 2000 2001 2002 Manufacturing 28.7 28.8 20.3 Construction 10.4 11.4 9.4 Trade 30.9 32.2 44.8 Hotels/Restaurants 17.3 11.8 13.2 Other Services 32.8 27.4 21.8 Total 28.1 27.8 32.3
Average producer’s price index for June-July of each year (TURKSTAT),
(1994=100, 2000=1998.6, 2001=2863.9, 2002=4910.8).

35
Substantial differences in value-added per person engaged are detected by size (Graph 6.6 and Table 6.13). It seems that micro-enterprises were severely hit by the economic crisis, whereas larger MSEs, particularly those with 10-49 persons engaged, not only have not been negatively affected by the crisis, but also enhanced their performance positively. 30
Graph 6.6: Monthly Value-added Per Person Engaged by Size, 2000-2002 (in producer’s prices, million TL., 1994=100)
33
30.4
30.8
32
22.5
64.8
26.5
19.3
28.2
28.6
27.8
16.1
27.2
26.2
33
46
32.328.1
0 20 40 60 80
1
2
3-5
6-9
10-49
Total
size
of t
he e
nter
pris
e
VA per person engaged (million TL. 1994=100)
200020012002
Table 6.13: Monthly value-added per person engaged by size, 2000-2002 (in producer’s prices, million TL., 1994=100) Number of persons engaged 2000 2001 2002 1 33.0 64.8 16.1 2 30.4 26.5 27.2 3-5 30.8 19.3 26.2 6-9 32.0 28.2 33.0 10-49 22.5 28.6 46.0 Total 28.1 27.8 32.3
Average producer’s price index for June-July of each year (TURKSTAT),
(1994=100, 2000=1998.6, 2001=2863.9, 2002=4910.8).
The results of the survey show that the size of the enterprise matters in the performance of the manufacturing sector, and thus larger manufacturing MSEs perform better than the smaller ones. In the trade sector, however, the highest value-added per person engaged is achieved by MSEs with 1 or 2 persons engaged. On the whole, the trade sector was better off than any other sector. This outcome is supported by the results of the econometric study. The enterprises operating in the service and trade sector are significantly better than those in the manufacturing sector. It seems that substantial price rises during the economic crisis of 2001 helped the trade sector to improve its performance, whereas the fall in demand as a consequence of price rises were damaging for the manufacturing sector and services.
30 This assessment should be interpreted with caution. Those enterprises that were not found at their 2001 location in 2002 follow-up survey may well be closed down or remained the same/grown/shrank and moved to another location. 2002 data corresponds to the enterprises that were found at their 2001 location.

36
6.2.4. Dynamics of growth of MSEs Table 6.14 shows the percentage of MSEs that grew/shrank or remained the same in terms of persons engaged between start-up and 2001. The figures at the diagonal cells of the table show the percentage of MSEs that remained at their start-up size. Left side of the diagonal figures show the percentage of MSEs that shrank in size and the right side show the percentage of MSEs that grew to larger size categories. Table 6.14 makes clear that most of the MSEs do not grow, and the majority of those that grew could only graduate to one upper category.31 The same is true for those enterprises that shrank between their start-up and 2001.
Table 6.14: The percentage of mses that grew, shrank or remained the same in terms of persons engaged between the start-up and 2001 (%)
Number of Persons Engaged in 2001 Number of Persons Engaged at Start-Up 1 2 3-5 6-9 10-49 Total 1 87.3 7.5 4.6 0.5 0.1 100 2 4.0 84.6 10.0 0.8 0.6 100 3-5 3.0 5.1 85.2 4.4 2.3 100 6-9 0.4 4.0 11.8 78.1 5.7 100 10-49 2.1 2.3 2.9 8.2 84.5 100
The fact that most of the MSEs in developing countries, including Turkey, are established as a survival activity is the most important factor inhibiting their growth. As a matter of fact, in the enterprises established for survival reasons, entrepreneurs tend to add the new resources they receive from their activities to their personal assets and welfare. These resources do not lead to capital accumulation or growth, but do provide survival income for their owners and employees. This type of enterprise is usually found in trade and service sectors due to the relative ease and low cost of entry. One can see in every high street in every city retail shops which are almost identical, standing side by side and selling the same goods such as mobile phones, and television sets produced by few major enterprises.
MSEs do not constitute a homogenous group of enterprises. The differences among the MSEs, however, do not only pertain to their size or the sector to which they belong. Rather, it is necessary to make a distinction between MSEs that are being started as survival activities of a person who has no other choice but earn his/her living by doing a business on the one hand, and the entrepreneurial and forms of business proprietorship which differ in their orientation to capital accumulation. Individuals may be able to operate between these two forms of economic activity in more than one occasion. Scase (1997) argues that “entrepreneurship refers to a person’s commitment to capital accumulation and to business growth”, whereas proprietorship is rather a survival activity and surpluses generated in these activities are likely to be consumed rather than utilized for new investment and growth. Proprietorship offers employment and may open possibilities for raising, at least to some extent, the living standards of those who cannot find jobs as wage/salary earners. But they offer little in developing innovative products and in generating dynamic economic growth. In fact, High number of turnover, start-ups and close-downs, in Turkey, indicates that the majority of the enterprises swim with the current. These enterprises are likely to be engaged in activities responding to existing or potential demand for a good or service rather than for longer term capital growth. Such entrepreneurs, for the most part, have acquired skills in trading and possess the capability for a new start-up when the old one fails.
However, decisions for growth can be made more easily among the MSEs engaged in the manufacturing sector. These decisions are sometimes necessarily for not losing competitive power in the market, given the relatively dynamic structure of the manufacturing sector. Thus, there is a segment of MSEs or SMEs that are dynamic and modernizing.
The differences between sectors is significant regarding the criterion of success of the enterprise, not only in terms of main sectors, but also sub-sectors. Geographical differences and inequalities have direct effects on the performance of the enterprises. The 2001 survey points to a more stagnant course
31 Table 6.14 does not show those enterprises that grew to larger sizes than 10-49 persons engaged.

37
of development in the enterprises established in the least developed provinces in Turkey. The regression results reflect the fact that out of five groups of provinces listed in terms of their socio-economic development level, the MSEs in the least developed stratum are less likely to grow compared to the better-off strata (Appendix 4).
Diverse and complex characteristics of the enterprises investigated seriously complicate the measurement of performance. Therefore, the policies and programs orientated to increasing the performance of MSEs should be designed taking into account the specific characteristics of the targeted enterprises.
6.3. Institutional framework and support services Successful development of MSEs beyond subsistence activities requires a complex set of diverse institutions and behavior patterns as well as an active state involvement in order to create an MSE-friendly environment. Institutional framework, in this respect, can be considered as the total of regulation, supervision and incentive mechanisms in an economy. It is widely acknowledged that the institutional framework in which enterprises perform their activities has direct effects on their future expectations and decisions as well as their present performance. Acs and Karlsson (2002), stated that beside the institutional framework in an economy, there are a series of other factors such as macro-economic situation, supply and demand conditions, the presence and quality of infrastructure, as well as the nature of the labor market that have substantial influence on entrepreneurial activities. Of these factors, what assigns the institutional framework such a great capacity to influence the performance of entrepreneurial activities, is the fact that it facilitates, directly or indirectly, the influence of other elements enhancing their efficacy on entrepreneurial activities.
Although MSEs occupy a great share in terms of number of enterprises, employment and value-added in the economy, there a striking dearth of institutionalized support for the MSEs in Turkey. The situation is worse for the group of micro-enterprises which make up 96% of the total number of enterprises in the non-agricultural sector. In general, the programs targeting the micro-enterprises are designed on the basis of fighting against poverty and as such, the notion of development of the enterprises is underemphasized. This situation has deteriorated during the economic crisis of 2001. The institutional support and services received by MSEs declined due to two factors that are inter-related. The first, as sheer survival was the main aim of the enterprises during the crisis, most of them postponed decisions regarding development and investment. Due to this fact, the demand by the entrepreneurs for institutional support and services had diminished significantly. Secondly, budget cuts by the government during the crisis were another factor leading to a decline in the support services. The budget cuts led to decrease in the variety of the services and supports provided by the public agencies.
Table 6.15: Investment and operation credits allocated for small and medium size enterprises (million TL)
Number of certificates
Investment credit
Operation credit Total credit Fixed
investment Employment
(persons) 1997 1,550 16,358,069 3,279,409 19,637,478 37,375,880 14,974 1998 1,171 15,577,254 3,856,490 19,433,744 33,188,559 12,117 1999 1,695 25,637,264 16,763,835 42,401,099 57,979,689 10,222 2000 1,229 21,685,308 15,072,550 36,757,858 49,100,269 5,587 2001 244 4,542,510 3,467,605 8,010,115 14,985,866 669 2002 382 19,302,495 7,725,412 27,027,907 63,725,062 1,484 2003 458 35,501,847 11,051,223 46,553,070 108,416,461 2,047 2004 416 50,568,289 10,338,093 60,906,382 109,513,028 2,960
Source: The Under Secretariat of Treasury, www.treasury.gov.tr.
Table 6.15 shows the number of investment certificates32 given by the Treasury to the SMEs and the credits used with reference to these certificates. In 2001 the number of the investment certificates received from Treasury fell to its lowest level between the years 1997 and 2004. Also, the additional employment created by the investment certificates decreased to its lowest level for the same period 32 Enterprises that receive investment certificates are exempted of various taxes and import duties.

38
with 669 persons. The increases in investment certificates and the related amounts of investment achieved by the year 2004 were still below the level reached before the crisis. The fall in the number of investment certificates indicates the severe impact of economic crisis on the SMEs especially on the level of investment and the ability to generate employment. There are very few consulting agencies in Turkey that offer administrative, financial, marketing and industrial information that is required to start and run a business. There is a regional organization (GAP-GIDEM, Entrepreneur Support and Guidance Center) established in 1997, as a joint project of GAP Administration (Southeastern Anatolia Project) with UNDP, to provide business development services in the southeastern region of Turkey. Consulting and training services are provided at a very limited scale by TESK (Turkish Confederation of Tradesmen and Craftsmen). KOSGEB (Small and Medium Industry Development Organization) has a wider spectrum of services and support programs for the SMEs operating in the manufacturing sector. However, all organisations that target the promotion of MSEs in Turkey, as an appropriate strategy for national development, almost invariably target larger SMEs, better-off firms and certain sectors like manufacturing.
KOSGEB, that provids the most extensive support to SMEs in the industrial sector, defines its objectives as follows: “It [the KOSGEB] has been established to increase the share and efficacy of the Small and Medium-sized Industrial Enterprises in provision of the economic and social needs of the country, and to increase their competitive power as well as level of competition, achieving industrial integration in compatible terms with economic development.”33 These objectives indicate that KOSGEB has also adopted social aims such as increasing employment through various forms of intervention in the SME sector. However, as it is known, the KOSGEB, has two main functions: first, it only provides services to enterprises in the manufacturing sector; and secondly, it focuses on support services such as training, counselling and participation in fairs rather than financial services.
Nearly all of the support and service programs that are recently developed by the professional organizations, as semi-formal institutions, regulating the activities of the MSEs, are implemented via EU-origin resources. For instance, the only project of the TESK has been implemented through the EU funds in order to develop entrepreneurship. Many of the fundamental functions of the professional organizations and business associations, as the largest component of the institutional structure regarding MSEs, have been turned into projects with the EU and World Bank funds. It should be remembered that these associations and organizations also receive dues from their members in order to develop and regulate their activities.
Integration to the European Union and the MSEs Since Turkey received the formal status of candidacy to the European Union, adjustment to EU norms and criteria by the public and private organizations has been accelerated. One of the pillars of this adjustment process has been concerned with the definition of the micro, small and medium size enterprises as well as the adoption and implementation of the programs oriented to these enterprises. In this respect, one of the initial steps taken by all the formal institutions providing services for SMEs has been to adjust to the definitions of enterprise size with reference to the norms of the EU.
In 2003, the EU decided on the definition of the enterprise sizes to be used by all the member countries. The European Investment Bank and the European Investment Fund have also adopted a definition that has been operationalized since January 2005.34
Before Turkey’s decision to adopt the definition of the enterprise size suggested by the EU, public and private institutions in Turkey used different definitions for the SMEs and MSEs without reaching a consensus about a uniform definition. In our interviews with the representatives of these institutions we observed that former pre-EU definitions are virtually still being used in these institutions, without any change. It seems that a certain period of time is necessary in order to convince all public institutions to adopt and use the same definition in their activities. However, this process should necessarily take into account the specific conditions of Turkey rather than simply duplicating the EU norms and criteria in enterprises singled out for support. 33 “Küçük ve Orta Ölçekli Sanayi Geliştirme ve Destekleme İdaresi Başkanlığı Kurulması Hakkında Kanun”, Kanun No.3624, 20 April 1990, T.C. Official Gazette. 34 See Appendix 1 for the definition of SMEs in EU.
39
As Turkey entered in a process of adjusting to EU norms, the number of projects introduced by public institutions, non-governmental organizations and professional organizations supported by the EU funds, proliferated to a great extent. The EU has developed various policies in order to promote entrepreneurship, and to increase the effectiveness of the SMEs in the economy as well as established economic and structural funds in order to implement these policies.
Attitudes of MSE entrepreneurs towards public institutions, business associations and professional organizations
In the case studies, the entrepreneurs were asked about their opinions on their relations with the public institutions, business associations and professional and vocational organizations. Among other public institutions, special attention was paid to the KOSGEB (Small and Medium Industry Development Organization) which was established for supporting the small and medium-sized enterprises.
The MSE entrepreneurs have mostly remained detached from the public institutions, trying to minimize their relations with them. This attitude could be understood if the bureaucratic structure and heavy taxes as well as the deficiencies in the services provided by most of the public institutions are considered. In general MSE entrepreneurs believe that the state hinders entrepreneurial activities particularly through high rates of taxes. For this reason, there is also a hesitant approach towards the KOSGEB. One of the entrepreneurs interviewed in the case study stated that some entrepreneurs may to some extent even fear the KOSGEB, only because it is a public organization: “We are afraid of legal authorities in general. There are no legal provisions at the KOSGEB. If somebody receives a letter from it, he will start thinking about the possible adverse motive behind such a letter... And then he will start searching for the reason. The first thing he will do is to call his accountant to try to find out the probable motive/reason for the letter. He will then call the bank he is working... It should change its image first, as there is fear of legal authorities in general. An entrepreneur may suffer serious troubles when he gets an invitation from a tax office or social security department.”
The majority of the enterprises interviewed during the case studies were aware of the activities of the KOSGEB. Some had communicated with this institution for the support it grants to enterprises, and one of them had already received support from this institution. The only entrepreneur that received support from the KOSGEB referred to the contribution of this institution as the success story of his enterprise. The support he received was to participat in exhibitions, to receive ISO 9001 quality system and technical help for mould programming. He stated that, if conditions allow, he would like to apply for support to purchase machinery. The entrepreneur of this successful enterprise felt the need for participating in exhibitions when he decided to start exporting his products and he was able to establish his first international connection in one of these exhibitions. He participated into that exhibition with the support of the KOSGEB. In the same way, the need for acquiring a quality standard has appeared as a result of his efforts for exporting since the customers in the international markets demanded certain standards for the products. This problem was resolved by the ISO 9001 support received from the KOSGEB. The story of a successful enterprise clearly shows the importance of support from a specialized institutions such as the KOSGEB in the process of exporting and modernizing the production in the MSEs. The study clearly indicates that institutional support is essential for promoting competitiveness of MSEs in domestic and foreign markets, for the most successful enterprise in the sample of case studies had received support from the KOSGEB. However, on the other hand our observations also indicate that this enterprises gained access to support programmes of the KOSGEB, because it was a relatively successful enterprise compared to other MSEs prior to applying for support.
The entrepreneurs’ experience in relation to the KOSGEB further demonstrated that the KOSGEB support could be accessed by a limited number of enterprises, mainly those which could fulfil relatively higher standards than the MSEs generally posses. It seems therefore that the KOSGEB should make more effort to advertise its activities and support programmes and make it accessible to a wider number of MSEs.
The case studies showed that the way the entrepreneurs perceived the business associations, professional and vocational organizations were not much different from their attitude and perceptions of the public institutions. The legal obligation for membership of professional and vocational organizations in the process of establishment results in a perception of these organizations as being

40
mere extensions of state organizations. The entrepreneurs consider the professional and vocational organizations as semi-official institutions. They collect membership fees in the same way as the state collects taxes. These institutions have a cumbersome bureaucracy similar to the bureaucratic structure in public organizations. Entrepreneurs stated that the executive bodies of these organizations recognize the problems and needs of the enterprises only during election periods, exactly the same way as the government does for its citizens in periods of election. The opinions of the entrepreneurs about the professional organizations are in line with their perceptions of the state and state organizations. State organizations are sometimes preferred to professional and vocational organizations in the sense that, as in the case of the KOSGEB, the state is at least considered to be trying to support entrepreneurial activities. However, they point out that professional and vocational organizations offer no contributions in this respect. Almost all entrepreneurs interviewed in our studies complained about professional organizations. The situation can be summarized by a statement of one of the entrepreneurs: “They collect their membership fees and we have no other relations at all.”
The most crucial demands of the entrepreneurs from the professional organizations are the sector-based regulations. It is stated that the absence of such regulations leads to unfair competition and that a series of measures have to be taken into consideration by the professional organizations, including the regulations regarding the entry into the sector and price levels as well as the controls over the activities of the enterprises. An entrepreneur providing computer services and another operating in a cluster, emphasized their demands for regulation and control regarding the entry and exit from the sector. These two entrepreneurs expressed that the unregistered enterprises cause reduction in price levels of all enterprises and, consequently, in profit margins. The entrepreneurs’ demand that if professional organizations are to undertake a more regulative role, it may be considered as contradicting with their perception of the state and professional and vocational organizations as bureaucratic entities. In fact, the complaints about bureaucracy are mostly related to the nature rather than the number of regulations and controls. The entrepreneurs themselves also demand correct and appropriate controls. An entrepreneur owning a small enterprise stated his demand for regulation and control in the following terms: Everybody is opening up a business nowadays. There are thousands of computer companies around. I think it’s too much. The Chamber of Commerce must organize this. Where are the inspectors of the Chamber? The Chamber must specify the criteria. Some say $1000 for a computer, while the other says $900. Tell me who’s making a 10% [profit] from such a sale which is good money for us. The margin in the market is around $50-60; we are making $10-20 from a computer. Is this free market? I don’t think so my friend, something must be done about it as from now on.
Attitudes of young entrepreneurs to support services and programmes In the focus groups and the case studies we have observed that the approach of young entrepreneurs towards institutions differs from old generations in various ways. The main reason for this difference is that the young entrepreneurs adopt a perspective of innovation and development. The young entrepreneurs with a growth perspective demand financial and institutional support. For this reason, it is observed that they search for support more rigorously than old generations. Therefore, young entrepreneurs confront more often with the problems and deficiencies of mechanisms regarding the institutional and financial support. The complaints stated by young entrepreneurs in the focus group discussions are about the conditions set for provision of institutional support. Both the data from MSE survey and findings of case studies demonstrate that the majority of the entrepreneurs would not tend to receive financial and institutional support even if the conditions are rendered appropriate. In this respect, young entrepreneurs have a different point of view. Their willingness for development and innovations create need for support from specialized institutions.
Support mechanisms specially designed for young entrepreneurs are very limited in Turkey. There is only a credit program entitled “Young Entrepreneurs” provided by the KOSGEB. However, very few entrepreneurs have access to these credits due to the conditions of eligibility. None of the young entrepreneurs in the focus group had been informed about this credit facility. It is thus clear that a program involving a more extensive and sustained support and broader scope and application, focusing on the young as the most dynamic group of among the entrepreneurs, is necessary.

41
The findings of the main survey The results of the main survey show that business support services provided by public agencies or private associations reach only a very small fraction of MSEs. For example, only 3.2% of the manufacturing enterprises received business support services on production and 1.1% on exporting.
In addition, our findings show that 29.3% of the MSE entrepreneurs have no affiliation with a business association (Table 6.16). More dramatically, 72.5% of the entrepreneurs with a membership status reported that they receive no support from the business associations they belong to and that their relationship is generally limited to the payment of regular membership fees. Most of the MSEs rely on self-supporting and informal institutional arrangements. This finding was confirmed by the regression analysis indicating that affiliation with a business institution was bound to be insignificant in terms of growth performance of MSEs.
Table 6.16: Distribution of enterprises by type of affiliated business association and by economic activity
Type of Business Association Economic Activity None Chamber of
Commerce Specialized Federation
Assoc. of Tradesmen
Vocation Assoc.
Vocation Union
Chamber of Industry Other Total
Manufacturing 24.9 34.4 29.4 3.3 3.5 0.8 3.0 0.7 100 Construction 50.4 31.4 6.6 3.9 6.5 - 1.2 0.0 100 Trade 29.0 31.2 27.9 6.1 4.9 0.1 0.8 0.2 100 Hotels/ Restaurants 40.1 15.6 27.4 7.0 7.4 - 0.1 2.3 100 Other Services 23.5 25.4 35.9 5.6 6.4 1.7 1.4 0.1 100 Total 29.3 29.5 28.5 5.5 5.1 0.4 1.2 0.5 100
6.4. Characteristics of the entrepreneur35 In this section, the characteristics of the entrepreneur will be described in terms of his/her status in the enterprise, age, gender, education, previous job before setting-up the enterprise, experience in the present job and social insurance coverage. A sub-section is devoted to women entrepreneurs.
6.4.1. Owner or manager The majority of the enterprises (80.6%) are operated by the owner of the enterprise (Table 6.17 and 6.18). In the construction sector the percentage of enterprises operated by the owners (88.7%) are highest whereas in the hotels-restaurants sector the managers (23.3%) constitute the highest share. There is a significant difference between women and men entrepreneurs in terms of status in the enterprise. 81.6% of male entrepreneurs own the MSEs they manage. The highest share of managers among the men entrepreneurs is in the hotels-restaurant sector (21.6%) and the lowest share is in the constrution sector (8.2%).
Among the women entrepreneurs, managers have a relatively higher share than owners of the enterprise compared to men entrepreneurs. As mentioned above, women make up only 6.1% of the MSE entrepreneurs. The findings indicate that 34.6% of women entrepreneurs are not owners but professional managers of the enterprises they operate. This outcome shows that although women are capable of managing enterprises, it is less likely that they own them. It seems that the comparatively low number of women entrepreneurs could not be attributed to their ability to manage the enterprise.
Table 6.17: Distribution of entrepreneurs by status, economic activity and sex
Women Men Total Economic Activity Owner Manager Owner Manager Owner Manager Manufacturing 20,044 7,999 201,480 47,030 221,524 55,030 Construction 99 1,227 31,675 2,819 31,773 4,047 Trade 27,324 12,494 617,689 149,819 645,013 162,313 Hotels/ Restaurants 695 3,448 116,691 32,122 117,386 35,570 Other Services 8,916 4,982 128,963 16,316 137,878 21,299 Total 57,077 30,151 1,096,498 248,106 1,153,575 278,258
35 In this study entrepreneur is considered as the person who makes the main decisions in the affairs of the enterprise.

42
Table 6.18: Distribution of entrepreneurs by status, economic activity and sex (%)
Women Men Total Economic Activity Owner Manager Owner Manager Owner Manager Total Manufacturing 71.5 28.5 81.1 18.9 80.1 19.9 100.0 Construction 7.5 92.5 91.8 8.2 88.7 11.3 100.0 Trade 68.6 31.4 80.5 19.5 79.9 20.1 100.0 Hotels/ Restaurants 16.8 83.2 78.4 21.6 76.7 23.3 100.0 Other Services 64.2 35.8 88.8 11.2 86.6 13.4 100.0 Total 65.4 34.6 81.6 18.4 80.6 19.4 100.0
There are very few women entrepreneurs in the construction sector. The overwhelming majority of those women entrepreneurs operating in the construction sector are professional managers. It seems that the probability of women owning a construction MSE is extremely low. The share of women managers are also higher in the hotels-restaurants sector compared to other sectors such as trade, manufacturing and other services.
6.4.2. Age of the entrepreneur Average age of a MSE entrepreneur is 36.8 years old. Table 6.19 shows that the sole proprietors are relatively older with an average age of 39.9 particularly in the manufacturing sector with an average age of 41.5.
Table 6.19: Average age of the entrepreneurs by economic activity and size of the enterprise
Size Economic Activity 1 2 3-5 6-9 10-19 20-49 Total Manufacturing 41.5 37.7 37.1 38.7 37.9 36.1 38.0 Construction 38.0 37.4 35.4 36.5 36.8 48.0 36.7 Trade 39.6 35.7 35.7 35.1 34.8 36.1 36.4 Hotels/Restaurants 36.8 37.2 36.1 40.8 38.4 35.3 37.1 Other Services 46.3 36.6 34.8 39.8 38.2 31.0 36.5 Total 39.9 36.2 35.8 37.0 36.6 36.2 36.8
Women are in average younger than men entrepreneurs. The average age of women entrepreneurs is 32.9 years, whereas the average age of the men entrepreneurs is 37.1 years. The reason underlying the difference in age between men and women entrepreneurs is likely to be an outcome of the higher share of managers rather than owners among the women entrepreneurs compared to men entrepreneurs.
It is known that young entrepreneurs are more inclined to innovations and to take risks in business in comparison to older generations. The young entrepreneurs36 that participated in focus group discussions also underlined this fact. All the group members indicated that older generations are not very inclined to innovations.
The differences in conceptions of young and older entrepreneurs do not only become apparent when investment decisions or undertaking risks are concerned, but also when practical needs arise from the activities of the enterprise. The experiences of the entrepreneurs working in family enterprises are informative in this respect. As a young entrepreneur in a family enterprise stated, he was not able to persuade his father to arrange an advertisement campaign in order to expand their market. Another young entrepreneur, who had been running a tourism agency before he closed down his business and became unemployed, stated that local or foreign tourists communicate with young entrepreneurs more easily. This statement indicates that the difference in conceptions of new and old generations has become more evident in some specific sectors.
It seems that conservative attitudes of old generation entrepreneurs are also manifested in setting the profit margins of the enterprise. The young entrepreneurs stated that old generation entrepreneurs can risk to loose their customers and market and not to decrease their profit margins. On the contrary, the
36 See Appendix 7, focus group 2 for a list of participants of young entrepreneurs group.

43
young entrepreneurs can confront decreases in their profit margins more easily in order to maintain their markets and expand them. One of the young entrepreneurs stated that during the economic crisis he chose to increase the sales through decreasing profit margins in order to maintain the continuity of cash flow in the enterprise.
On the other hand, young entrepreneurs seem rather pessimistic about both the future of the country and the economy. However, there are reasonable justifications for this pessimistic point of view that seems contradictory with innovative and risk-taking attitudes. These young entrepreneurs have suffered three major economic crises occurring only in a decade. During the same period the incidence of corruption and bank bail-outs have shaken their confidence in the society and the government.
6.4.3. Education level The average MSE entrepreneur has an education of 8.8 years37 (Table 6.20) As expected, the level of education among the entrepreneurs increases with the size of the enterprise. Entrepreneurs of small-sized MSEs are less educated than those of larger MSE.
Table 6.20: Average number of years of education of the entrepreneurs by economic activity and size of the enterprise
Size Economic Activity 1 2 3-5 6-9 10-19 20-49 Total Manufacturing 6.4 8.3 9.0 9.2 10.5 10.2 8.7 Construction 7.2 6.9 10.0 11.3 11.1 7.6 9.0 Trade 7.9 8.6 9.2 10.5 11.3 11.1 8.9 Hotels/ Restaurants 6.0 7.1 8.4 10.2 9.9 12.0 8.0 Other Services 8.3 8.4 9.0 12.8 11.9 6.9 8.9 Total 7.6 8.3 9.1 10.3 10.8 10.6 8.8
Table 6.21: Average number of years of education of the entrepreneurs by economic activity and by sex
Years of Education Economic Activity Women Men Total Manufacturing 7.8 8.8 8.7 Construction 12.6 8.8 9.0 Trade 10.1 8.8 8.9 Hotels/Restaurants 12.5 7.9 8.0 Other Services 11.8 8.7 8.9 Total 9.8 8.7 8.8
Women entrepreneurs are more educated than men entrepreneurs (Table 6.21). This finding together with the results of the survey that indicate that women entrepreneurs are in average younger than men entrepreneurs and is likely to be the manager of an MSE rather than the owner, shows that women could become entrepreneurs at a younger age than men but with higher formal education. Women in the manufacturing sector have the least education and the majority are sole proprietors performing subsistence activities.
The educational level of MSE entrepreneurs is similar to that of all working people in the urban areas in Turkey (Table 6.22). The percentage of MSE entrepreneurs with no formal education is 0.8% whereas this ratio is 2.2% for total working population in the urban areas. Those with an education level of more than 12 years have a slightly higher share among the MSE entrepreneurs (18.5%) than in the total working populaton in the urban areas (15.3%).
37 According to the educational system in Turkey, 8 years of education corresponds to primary school while 11 years to the high-school education. An education period of above 11 years indicates attendance to college or university.
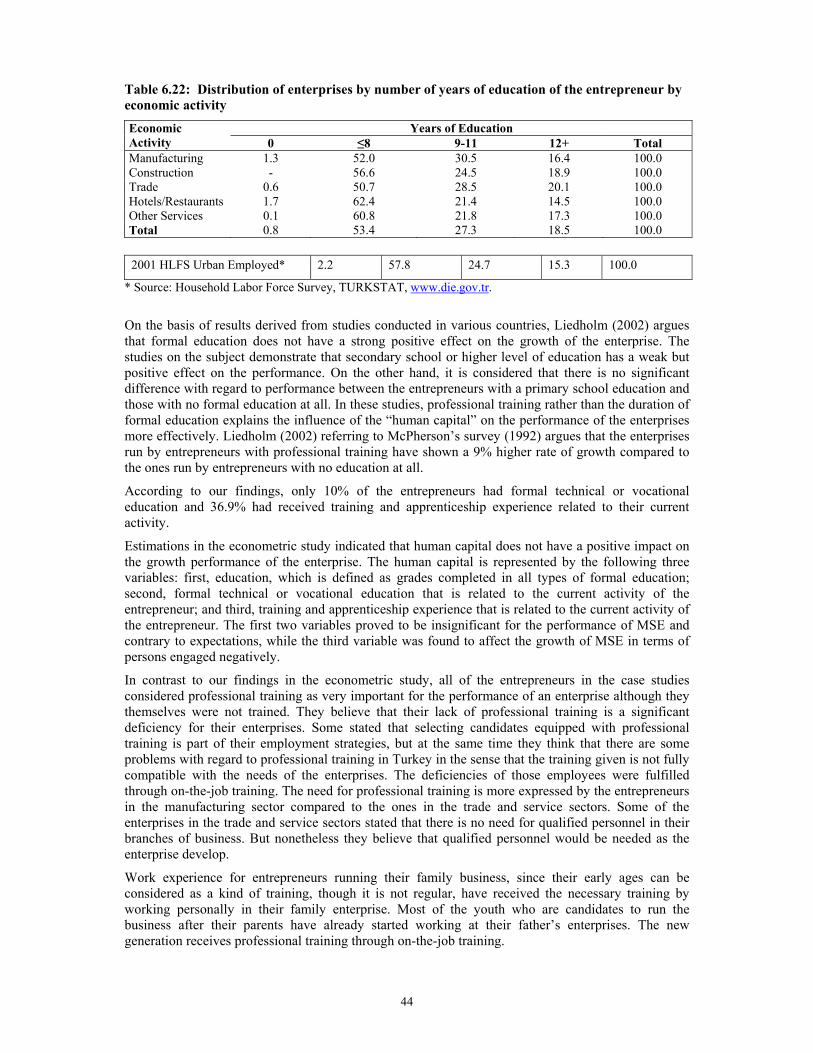
44
Table 6.22: Distribution of enterprises by number of years of education of the entrepreneur by economic activity
Years of Education Economic Activity 0 ≤8 9-11 12+ Total Manufacturing 1.3 52.0 30.5 16.4 100.0 Construction - 56.6 24.5 18.9 100.0 Trade 0.6 50.7 28.5 20.1 100.0 Hotels/Restaurants 1.7 62.4 21.4 14.5 100.0 Other Services 0.1 60.8 21.8 17.3 100.0 Total 0.8 53.4 27.3 18.5 100.0
2001 HLFS Urban Employed* 2.2 57.8 24.7 15.3 100.0
* Source: Household Labor Force Survey, TURKSTAT, www.die.gov.tr.
On the basis of results derived from studies conducted in various countries, Liedholm (2002) argues that formal education does not have a strong positive effect on the growth of the enterprise. The studies on the subject demonstrate that secondary school or higher level of education has a weak but positive effect on the performance. On the other hand, it is considered that there is no significant difference with regard to performance between the entrepreneurs with a primary school education and those with no formal education at all. In these studies, professional training rather than the duration of formal education explains the influence of the “human capital” on the performance of the enterprises more effectively. Liedholm (2002) referring to McPherson’s survey (1992) argues that the enterprises run by entrepreneurs with professional training have shown a 9% higher rate of growth compared to the ones run by entrepreneurs with no education at all.
According to our findings, only 10% of the entrepreneurs had formal technical or vocational education and 36.9% had received training and apprenticeship experience related to their current activity.
Estimations in the econometric study indicated that human capital does not have a positive impact on the growth performance of the enterprise. The human capital is represented by the following three variables: first, education, which is defined as grades completed in all types of formal education; second, formal technical or vocational education that is related to the current activity of the entrepreneur; and third, training and apprenticeship experience that is related to the current activity of the entrepreneur. The first two variables proved to be insignificant for the performance of MSE and contrary to expectations, while the third variable was found to affect the growth of MSE in terms of persons engaged negatively.
In contrast to our findings in the econometric study, all of the entrepreneurs in the case studies considered professional training as very important for the performance of an enterprise although they themselves were not trained. They believe that their lack of professional training is a significant deficiency for their enterprises. Some stated that selecting candidates equipped with professional training is part of their employment strategies, but at the same time they think that there are some problems with regard to professional training in Turkey in the sense that the training given is not fully compatible with the needs of the enterprises. The deficiencies of those employees were fulfilled through on-the-job training. The need for professional training is more expressed by the entrepreneurs in the manufacturing sector compared to the ones in the trade and service sectors. Some of the enterprises in the trade and service sectors stated that there is no need for qualified personnel in their branches of business. But nonetheless they believe that qualified personnel would be needed as the enterprise develop.
Work experience for entrepreneurs running their family business, since their early ages can be considered as a kind of training, though it is not regular, have received the necessary training by working personally in their family enterprise. Most of the youth who are candidates to run the business after their parents have already started working at their father’s enterprises. The new generation receives professional training through on-the-job training.
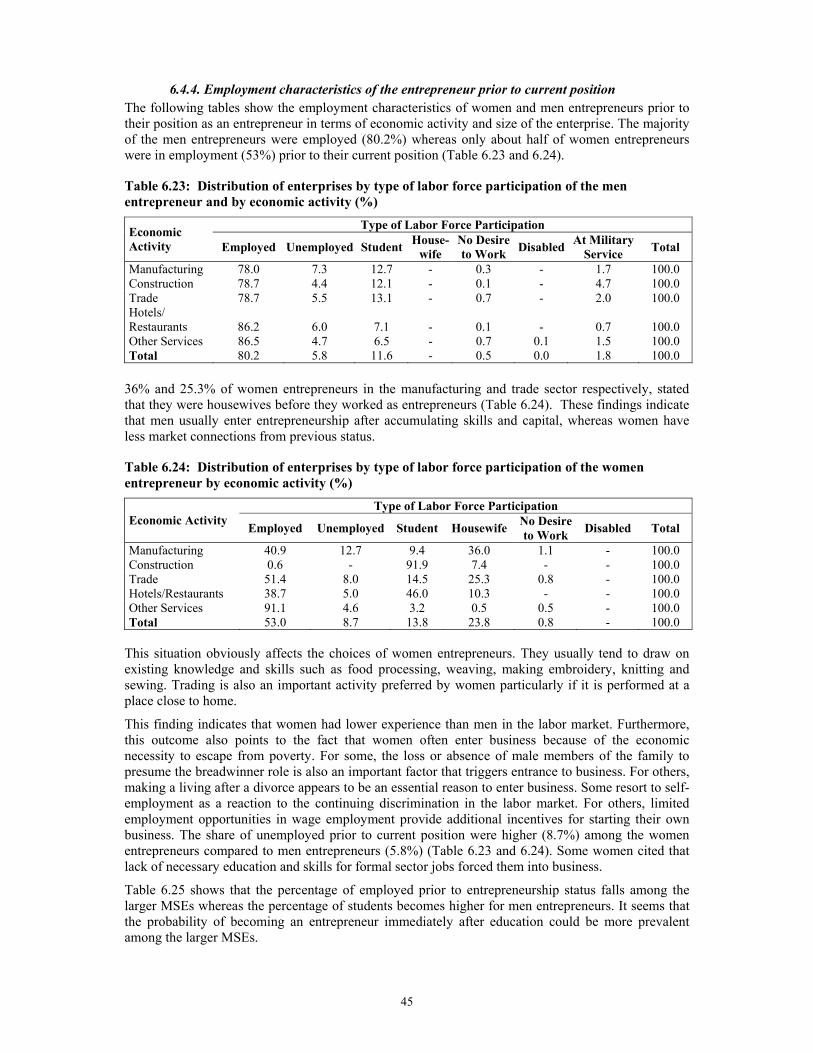
45
6.4.4. Employment characteristics of the entrepreneur prior to current position The following tables show the employment characteristics of women and men entrepreneurs prior to their position as an entrepreneur in terms of economic activity and size of the enterprise. The majority of the men entrepreneurs were employed (80.2%) whereas only about half of women entrepreneurs were in employment (53%) prior to their current position (Table 6.23 and 6.24).
Table 6.23: Distribution of enterprises by type of labor force participation of the men entrepreneur and by economic activity (%)
Type of Labor Force Participation Economic Activity Employed Unemployed Student House-
wife No Desire to Work Disabled At Military
Service Total
Manufacturing 78.0 7.3 12.7 - 0.3 - 1.7 100.0 Construction 78.7 4.4 12.1 - 0.1 - 4.7 100.0 Trade 78.7 5.5 13.1 - 0.7 - 2.0 100.0 Hotels/ Restaurants 86.2 6.0 7.1 - 0.1 - 0.7 100.0 Other Services 86.5 4.7 6.5 - 0.7 0.1 1.5 100.0 Total 80.2 5.8 11.6 - 0.5 0.0 1.8 100.0
36% and 25.3% of women entrepreneurs in the manufacturing and trade sector respectively, stated that they were housewives before they worked as entrepreneurs (Table 6.24). These findings indicate that men usually enter entrepreneurship after accumulating skills and capital, whereas women have less market connections from previous status.
Table 6.24: Distribution of enterprises by type of labor force participation of the women entrepreneur by economic activity (%)
Type of Labor Force Participation Economic Activity Employed Unemployed Student Housewife No Desire
to Work Disabled Total
Manufacturing 40.9 12.7 9.4 36.0 1.1 - 100.0 Construction 0.6 - 91.9 7.4 - - 100.0 Trade 51.4 8.0 14.5 25.3 0.8 - 100.0 Hotels/Restaurants 38.7 5.0 46.0 10.3 - - 100.0 Other Services 91.1 4.6 3.2 0.5 0.5 - 100.0 Total 53.0 8.7 13.8 23.8 0.8 - 100.0
This situation obviously affects the choices of women entrepreneurs. They usually tend to draw on existing knowledge and skills such as food processing, weaving, making embroidery, knitting and sewing. Trading is also an important activity preferred by women particularly if it is performed at a place close to home.
This finding indicates that women had lower experience than men in the labor market. Furthermore, this outcome also points to the fact that women often enter business because of the economic necessity to escape from poverty. For some, the loss or absence of male members of the family to presume the breadwinner role is also an important factor that triggers entrance to business. For others, making a living after a divorce appears to be an essential reason to enter business. Some resort to self-employment as a reaction to the continuing discrimination in the labor market. For others, limited employment opportunities in wage employment provide additional incentives for starting their own business. The share of unemployed prior to current position were higher (8.7%) among the women entrepreneurs compared to men entrepreneurs (5.8%) (Table 6.23 and 6.24). Some women cited that lack of necessary education and skills for formal sector jobs forced them into business.
Table 6.25 shows that the percentage of employed prior to entrepreneurship status falls among the larger MSEs whereas the percentage of students becomes higher for men entrepreneurs. It seems that the probability of becoming an entrepreneur immediately after education could be more prevalent among the larger MSEs.

46
Table 6.25: Distribution of enterprises by type of labor force participation of the men entrepreneur and by size of the enterprise (%)
Type of Labor Force Participation
Size Employed Unemployed Student Housewife No Desire
to Work Disable
d
At Military Service
Total
1 84.9 5.3 7.9 - 0.1 - 1.8 100.0 2 82.5 5.5 9.7 - 0.8 - 1.4 100.0 3-5 78.7 5.8 12.7 - 0.5 - 2.4 100.0 6-9 73.4 9.1 16.2 - 0.8 - 0.5 100.0 10-19 77.7 2.4 15.8 - 1.1 - 3.0 100.0 20-49 63.1 9.8 27.1 - - - - 100.0 Total 80.2 5.8 11.6 - 0.5 - 1.8 100.0
Table 6.26: Distribution of enterprises by type of labor force participation of the women entrepreneurs by size of the enterprise (%)
Type of Labor Force Participation
Size Employed Unemployed Student Housewife No Desire to Work Disabled At Military
Service Total
1 52.4 7.7 3.0 36.7 0.3 - - 100.0 2 67.8 3.0 14.7 12.0 2.5 - - 100.0 3-5 50.9 2.9 28.2 17.6 0.3 - - 100.0 6-9 43.1 22.2 4.0 29.7 0.9 - - 100.0 10-19 44.3 - 40.0 15.8 - - - 100.0 20-49 22.8 70.4 4.7 2.1 - - - 100.0 Total 53.0 8.7 13.8 23.8 0.8 - - 100.0
The entrepreneur’s previous experiences could be considered as one of the factors determining the performance of the enterprise. It is possible to distinguish the direct and indirect influences of the entrepreneur’s start-up age and his/her previous experiences on the activities of the enterprise. It is observed that the performance of the enterprise is positively influenced if the entrepreneur is experienced in the sector he/she is presently engaged. In one of the case studies that was conducted, one of the entrepreneurs started his work career at 13 years old as an apprentice in a printing house and established his own workplace at the age of 30 in the same sector. The entrepreneur stated that starting up his career at an early age and especially in the same sector has been very effective on his present success. The positive effect of this factor on the success of the enterprise usually takes two forms. Firstly, the entrepreneur starts the business having all the knowledge required for the activities in the related sector, which reduces the high risks involved during the first years of business. Secondly, the entrepreneur has the chance to convey his previous relations with customers, raw material suppliers, etc within the related sector to his/her own enterprise.
Table 6.27: Distribution of enterprises by type of prior employment status of the entrepreneur and by economic activity (%)
Type of Prior Employment Status Economic Activity Employee Employer Own-
Account Family Worker Other Total
Manufacturing 82.6 5.3 5.9 5.0 1.1 100.0 Construction 68.4 17.4 12.1 2.1 - 100.0 Trade 70.5 11.4 13.7 4.0 0.3 100.0 Hotels/ Restaurants 71.6 14.8 11.2 2.3 0.1 100.0 Other Services 80.1 9.9 8.7 0.1 1.2 100.0 Total 74.0 10.7 11.3 3.5 0.6 100.0
Table 6.27 shows the employment status of those entrepreneurs who were employed before setting/managing an enterprise. Most of the entrepreneurs had previous job experience as an employee

47
(74%), only 10.7% were employers and 11.3% worked on their own account. Family workers, both women and men, are less likely to become entrepreneurs. (Tables 6.28 and 6.29). It seems that the experiences required to become an entrepreneur was acquired by working as an employee in somebody else’s enterprise.
Table 6.28: Distribution of enterprises by type of prior employment status of the men entrepreneurs and by economic activity (%)
Type of Prior Employment Status Economic Activity Employee Employer Own-
Account Family Worker Other Total
Manufacturing 82.5 5.6 5.9 4.9 1.2 100.0 Construction 68.4 17.4 12.1 2.1 - 100.0 Trade 70.1 11.5 13.9 4.1 0.4 100.0 Hotels/Restaurants 71.3 15.0 11.3 2.3 0.1 100.0 Other Services 80.4 8.7 9.5 0.1 1.3 100.0 Total 73.6 10.7 11.6 3.5 0.6 100.0
Table 6.29: Distribution of enterprises by type of prior employment status of the women entrepreneurs and by economic activity (%)
Type of Prior Employment Status Economic Activity Employee Employer Own-
Account Family Worker Other Total
Manufacturing 85.3 0.3 7.1 7.4 - 100.0 Construction 100.0 - - - - 100.0 Trade 82.6 10.7 6.3 0.4 - 100.0 Hotels/estaurants 100.0 - - - - 100.0 Other Services 77.6 21.6 0.4 - 0.4 100.0 Total 82.5 10.7 4.7 2.0 0.1 100.0
6.4.5 Number of years in present job
Table 6.30: Average number of years in present job by economic activity and size of the enterprise
Size Economic Activity 1 2 3-5 6-9 10-19 20-49 Total Manufacturing 15.68 13.58 13.09 10.94 10.78 9.55 12.85 Construction 15.88 8.14 8.88 14.73 9.55 19.30 11.06 Trade 10.40 9.36 10.01 8.82 8.75 12.08 9.84 Hotels/Restaurants 7.08 6.37 8.34 7.35 9.45 9.17 7.62 Other Services 13.48 9.50 8.15 9.03 5.24 10.98 9.87 Total 11.22 9.61 10.24 9.52 9.43 10.65 10.22
For the entrepreneurs, the average number of years spent in their present job is over 10 years. Among entrepreneurs in general, the sole proprietors and the entrepreneurs of the larger MSEs have spent the highest number of years in average in their present job. The sole proprietors in the manufacturing, construction, trade and other services sector are more likely to be practicing in activities that do not have a growth prospect. Particularly those sole proprietors in the manufacturing sector that have spent the highest number of years (15.68) in the present job are likely to be performing crafts work (Table 6.30).
The average number of years spent in the present job by women entrepreneurs is almost half of that spent by men entreprenurs. The minimum time spent by the women entrepreneurs in the present job is 4.31 years in the trade sector (Tables 6.31 and 6.32).
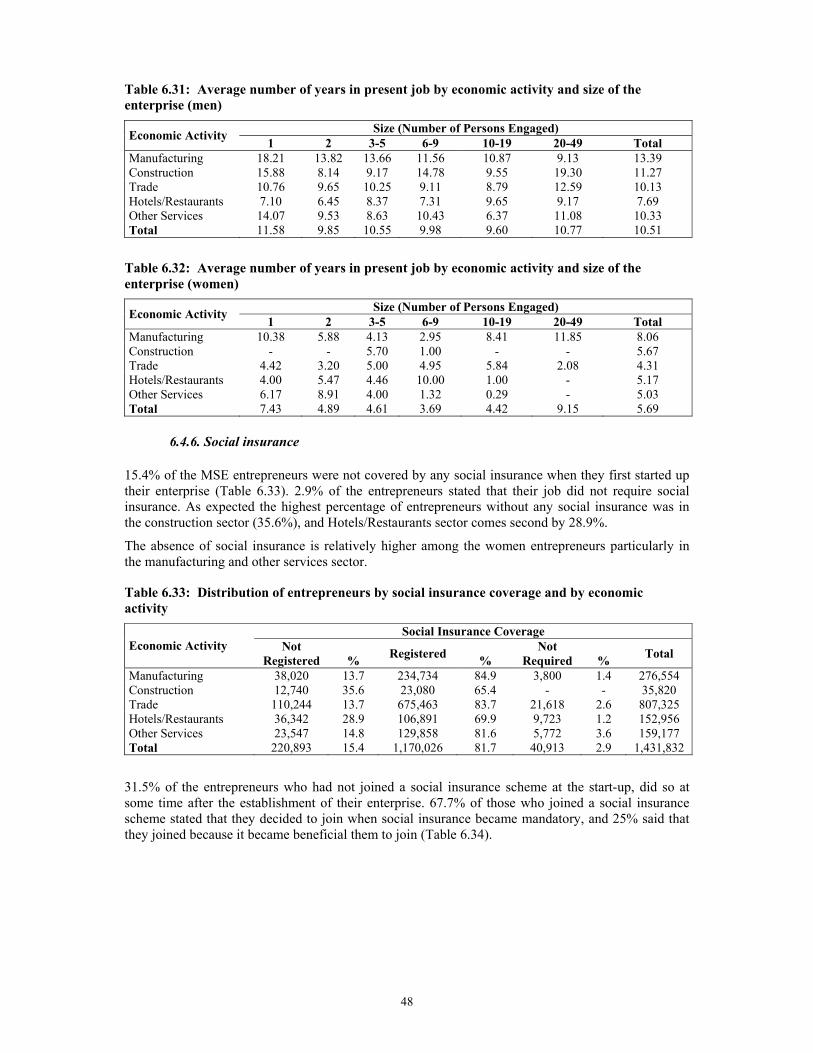
48
Table 6.31: Average number of years in present job by economic activity and size of the enterprise (men)
Size (Number of Persons Engaged) Economic Activity 1 2 3-5 6-9 10-19 20-49 Total Manufacturing 18.21 13.82 13.66 11.56 10.87 9.13 13.39 Construction 15.88 8.14 9.17 14.78 9.55 19.30 11.27 Trade 10.76 9.65 10.25 9.11 8.79 12.59 10.13 Hotels/Restaurants 7.10 6.45 8.37 7.31 9.65 9.17 7.69 Other Services 14.07 9.53 8.63 10.43 6.37 11.08 10.33 Total 11.58 9.85 10.55 9.98 9.60 10.77 10.51
Table 6.32: Average number of years in present job by economic activity and size of the enterprise (women)
Size (Number of Persons Engaged) Economic Activity 1 2 3-5 6-9 10-19 20-49 Total Manufacturing 10.38 5.88 4.13 2.95 8.41 11.85 8.06 Construction - - 5.70 1.00 - - 5.67 Trade 4.42 3.20 5.00 4.95 5.84 2.08 4.31 Hotels/Restaurants 4.00 5.47 4.46 10.00 1.00 - 5.17 Other Services 6.17 8.91 4.00 1.32 0.29 - 5.03 Total 7.43 4.89 4.61 3.69 4.42 9.15 5.69
6.4.6. Social insurance
15.4% of the MSE entrepreneurs were not covered by any social insurance when they first started up their enterprise (Table 6.33). 2.9% of the entrepreneurs stated that their job did not require social insurance. As expected the highest percentage of entrepreneurs without any social insurance was in the construction sector (35.6%), and Hotels/Restaurants sector comes second by 28.9%.
The absence of social insurance is relatively higher among the women entrepreneurs particularly in the manufacturing and other services sector.
Table 6.33: Distribution of entrepreneurs by social insurance coverage and by economic activity
Social Insurance Coverage Economic Activity Not
Registered
% Registered %
Not Required
% Total
Manufacturing 38,020 13.7 234,734 84.9 3,800 1.4 276,554 Construction 12,740 35.6 23,080 65.4 - - 35,820 Trade 110,244 13.7 675,463 83.7 21,618 2.6 807,325 Hotels/Restaurants 36,342 28.9 106,891 69.9 9,723 1.2 152,956 Other Services 23,547 14.8 129,858 81.6 5,772 3.6 159,177 Total 220,893 15.4 1,170,026 81.7 40,913 2.9 1,431,832
31.5% of the entrepreneurs who had not joined a social insurance scheme at the start-up, did so at some time after the establishment of their enterprise. 67.7% of those who joined a social insurance scheme stated that they decided to join when social insurance became mandatory, and 25% said that they joined because it became beneficial them to join (Table 6.34).

49
Table 6.34: Distribution of entrepreneurs by reason for joining social insurance and by economic activity (%).
Reason for Social Insurance Economic Activity became
mandatory procedures simplified
cost declined
became advantageous other Total
Manufacturing 62.0 15.6 .3 22.1 - 100.0 Construction 100.0 - - - - 100.0 Trade 71.6 .2 .5 22.5 5.1 100.0 Hotels-restaurants 61.2 - - 38.8 - 100.0 Other services 46.3 - -- 53.7 - 100.0 Total 67.7 3.4 .4 25.0 3.5 100.0
6.4.7. Women entrepreneurs Since women entrepreneurs make up a very small portion of the MSE entrepreneurs in total (6.1%), this study attempts to explore the problems and barriers specific to women entrepreneurs. In general, the specific problems faced by women entrepreneurs are presented under relavant sections in this study. In this section, issues such as the perception of men and women entrepreneurs on the specific problems women entrepreneurs face, the need for permission to start up an enteprise, conflicts between home and work duties and whether women entrepreneurs feel empowered is presented.
In the main survey men and women entrepreneurs were asked whether women entrpereneurs face special problems other than men entrepreneurs. Relatively less men (52.7%) than women (65.6%) stated that women as entrepreneurs face special problems other than men (Table 35 and 36).
Table 6.35: Distribution of enterprises by whether woman entrepreneurs face special problems by economic activity (%) (men)
Whether women entrepreneurs face special problems Economic Activity No Yes Total Manufacturing 50.1 49.9 100.0 Construction 38.3 61.7 100.0 Trade 53.9 46.1 100.0 Hotels-restaurants 49.6 50.4 100.0 Other services 54.4 45.6 100.0 Total 52.7 47.3 100.0
Table 6.36: Distribution of enterprises by whether woman entrepreneurs face special problems by economic activity (%). (women)
Whether women entrepreneurs face special problems Economic activity No Yes Total Manufacturing 77.9 22.1 100.0 Construction 100.0 - 100.0 Trade 64.1 35.9 100.0 Hotels-restaurants 22.3 77.7 100.0 Other services 54.8 45.2 100.0 Total 65.6 34.4 100.0
Women entrepreneurs have various motivations for starting-up an enterprise. Some start their enterprise in the same area with their previous waged work building on their previous experience, while some others leave their jobs when they get married or bear children and attempt to start working again nearly at the end of their forties. Some others become entrepreneurs out of necessity although this is not their first wish. One of the women entrepreneurs who participated in the focus group discussion with women entrepreneurs stated that she was a housewife with two children and was forced to take over the enterprise her husband owned after he died. She stated that she became an entrepreneur only to raise up her children and would immediately close the enterprise if it were possible. On the other hand, some other women entrepreneurs are quite ambitious about their

50
business. It is observed that those women with entrepreneurial spirits are keen on developing their enterprises and do not give up when they face difficulties in business.
Women entrepreneurs face diverse responses from their families while attempting to start a business. While some families strongly oppose the idea of women setting up an enterprise, others lent significant support.
Table 6.37: Distribution of women entrepreneurs by whether they need permission to be in business from household and by economic activity
Whether women entrepreneurs need permission Economic activity No Yes Total Manufacturing 18,348 9,696 28,044 Construction 107 1,219 1,326 Trade 31,868 7,950 39,818 Hotels-restaurants 2,423 1,720 4,143 Other services 11,039 2,859 13,898 Total 63,785 23,444 87,229
Table 6.38: Distribution of women entrepreneurs by whether they need permission to be in business from household and by economic activity (%).
Whether women entrepreneurs need permission Economic Activity No Yes Total Manufacturing 65.4 34.6 100.0 Construction 8.1 91.9 100.0 Trade 80.0 20.0 100.0 Hotels-restaurants 58.5 41.5 100.0 Other services 79.4 20.6 100.0 Total 73.1 26.9 100.0
Our findings indicate to the fact that majority of the women (73.1%) did not need to take any permission from their families to start up an enterprise (Table 6.37 and 6.38). However, this outcome should be interpreted with caution since we do not know the number of women that could not enter business only because they were not given permission by their families, particularly by the male members of their families.
64.1% and 30% of women that needed to take permission from their families received it from their fathers and husband respectively (Table 6.39).
Table 6.39: Distribution of women entrepreneurs by from whom in the household they need permission to be in business and by economic activity.
From whom women entrepreneurs need permission Economic Activity Husband Father Brother Father in
law Mother Mother in law Other Total
Manufacturing 8,584 996 55 - 60 - 9,695 Construction 0 1,219 - - 0 - - 1,219 Trade 4,320 2,798 - - 720 - 112 7,950 Hotels-restaurants 197 1,524 - - 0 - - 1,721 Other services 1,929 486 - - 373 - 72 2,860 Total 15,030 7,023 55 - 1,153 - 184 23,445

51
Table 6.40: Distribution of women entrepreneurs by from whom in the household they need permission to be in business (C362) by economic activity (%)
From whom women entrepreneurs need permission Economic Activity Husband Father Brother Father in
law Mother Mother in law Other Total
Manufacturing 88.5 10.3 .6 - .6 - - 100.0 Construction - 100.0 - - - - 100.0 Trade 54.3 35.2 - - 9.1 - 1.4 100.0 Hotels-restaurants 11.4 88.6 - - - - 100.0 Other services 67.4 17.0 - - 13.0 - 2.5 100.0 Total 64.1 30.0 .2 - 4.9 - .8 100.0
The conflicts faced between home and work duties are discussed extensively in the focus group with women entrepreneurs. It seems that, although in varying degrees, all women entrepreneurs fulfill their traditional roles at home. Some of the married women with children stated that conflicts between home and work were partially resolved by the support they received from their mothers especially in child caring. Table 6.41, on the other hand, shows that while half of the women entrepreneurs experience no conflict between home and work duties the other half suffers from conflicts.
Table 6.41: Distribution of women entrepreneurs by conflicts between home and work duties and by economic activity (%)
Conflicts Economic Activity No Yes Total Manufacturing 60.3 39.7 100.0 Construction .6 99.4 100.0 Trade 43.2 56.8 100.0 Hotels-restaurants 51.4 48.6 100.0 Other services 44.1 55.9 100.0 Total 48.6 51.4 100.0
Majority of women entrepreneurs (76.7) consider that they are empowered by managing their own business (Table 6.42). As expected, the percentage of women that experiences empowerment increase with the size of the enterprise they own/manage. 98.1% of the women entrepreneurs managing/owning enterprises with 20-49 persons engaged believe that their work has an empowering effect on their status. This ratio falls to 67.1% among the sole proprietors (Table 6.43).
Table 6.42: Distribution of women entrepreneurs by empowerment and by economic activity (%)
Empowerment Economic Activity No Yes Total Manufacturing 18.7 81.3 100.0 Construction 91.9 8.1 100.0 Trade 30.4 69.6 100.0 Hotels-restaurants .5 99.5 100.0 Other services 12.2 87.8 100.0 Total 23.3 76.7 100.0
Table 6.43: Distribution of women entrepreneurs by empowerment and by size of the enterprise (%)
Empowerment Size No Yes Total 1 32.9 67.1 100.0 2 21.3 78.7 100.0 3-5 20.9 79.1 100.0 6-9 13.7 86.3 100.0 10-19 3.2 96.8 100.0 20-49 1.9 98.1 100.0 Total 23.3 76.7 100.0

52
6.5. Characteristics of the Enterprise In this section, characteristics of the MSEs is elaborated in terms of the place of work, legal form of the enterprise, extension of informality, impact of clusters, linkages with other enterprises, exporting, access to financial services, and the characteristics of the workforce.
6.5.1. Place of work As was expected, due to the high share of trade sector in the total number of MSEs in Turkey the majority of the enterprises perform their activities in shops (68.6%), whereas 19.5% of the enteprises operate in workshops or factories (Table 6.44). The number of enterprises located in a room or apartment is rather low indicating that home-based activities are quite limited.
Table 6.44: Distribution of enterprises by type of place of work and by economic activity (%)
Place of Work Economic activity workshop
/factory shop office room apartment separate building kiosk other Total
Manufacturing 49.8 42.3 3.0 0.9 3.1 0.9 - - 100.0Construction 12.6 75.7 11.7 - - - - - 100.0Trade 16.2 76.7 4.0 - - - 2.1 0.9 100.0Hotels-restaurants 0.1 75.7 0.4 8.7 2.0 6.7 5.8 0.6 100.0Other services 3.8 64.6 27.2 0.5 0.0 0.6 1.1 2.2 100.0Total 19.5 68.6 6.2 1.2 0.8 1.0 1.9 0.8 100.0
Table 6.45: Distribution of enterprises by type of place of work and by economic activity (men)
Place of Work Economic activity workshop
/factory shop office room and apartment
separate building kiosk other Total
Manufacturing 52.7 44.1 3.0 - 0.1 - - 100.0 Construction 13.1 74.8 12.2 - - - - 100.0 Trade 16.8 76.4 3.9 - - 2.0 1.0 100.0 Hotels-restaurants 0.1 75.1 0.4 11.1 6.9 5.9 0.6 100.0 Other services 4.2 66.4 24.6 0.5 0.6 1.2 2.4 100.0 Total 20.1 69.1 5.8 1.3 0.9 1.9 0.9 100.0
Table 6.46: Distribution of enterprises by type of place of work and by economic activity (women
Place of Work Economic activity workshop
/factory shop office room and apartment
separate building kiosk other Total
Manufacturing 23.5 26.1 3.4 39.4 7.6 - - 100.0 Construction - 100.0 - - - - - 100.0 Trade 5.4 83.9 5.6 - - 5.1 - 100.0 Hotels-restaurants - 95.0 - - - 5.0 - 100.0 Other services - 45.9 54.1 - - - - 100.0 Total 10.0 60.0 12.3 12.6 2.5 2.6 - 100.0
Table 6.46 shows that 39.4% of women entrepreneurs in the manufacturing sector work in a room or an apartment, and 7.6% in a separate building whereas only 23.5% work in workshops or factories. On the other hand, none of the men entrepreneurs in the manufacturing sector work in a room or an apartment and only 0.1% work in a separate building, while 52.75% of them are located in a workshop or factory (Table 6.45). These findings show that in the manufacturing sector home-based work is prevalent among women entrepreneurs, whereas men entrepreneurs have workshops and factories as their workplace.
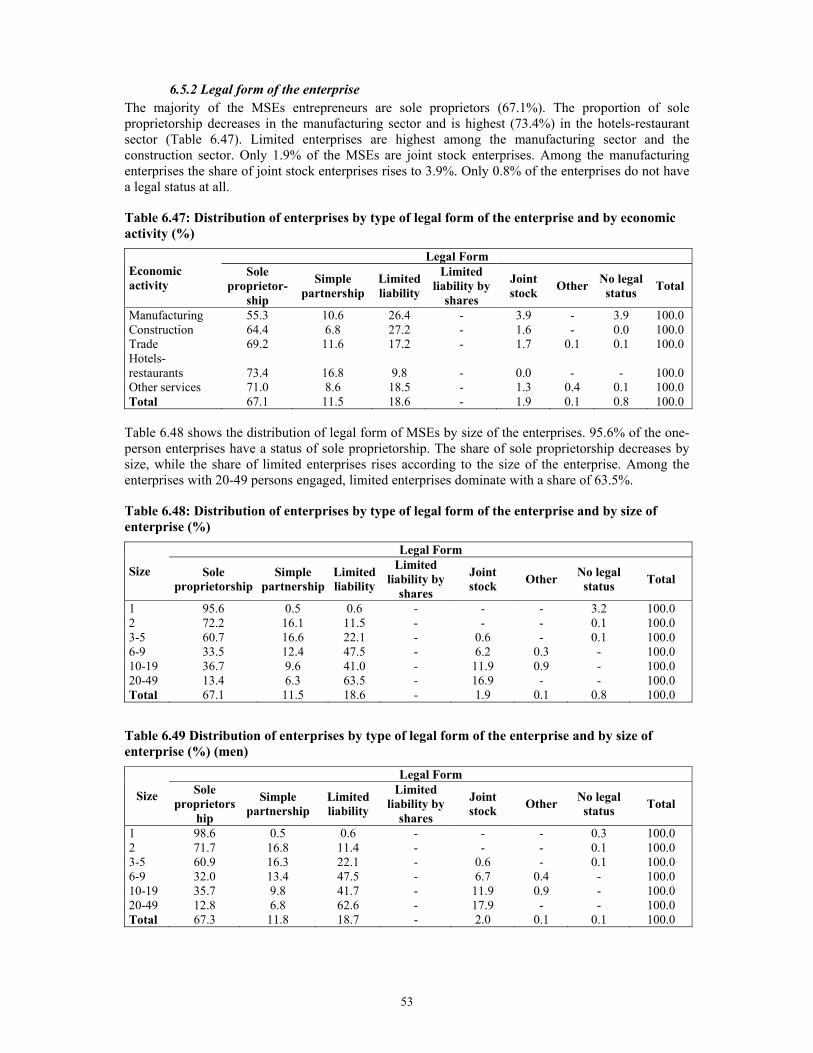
53
6.5.2 Legal form of the enterprise The majority of the MSEs entrepreneurs are sole proprietors (67.1%). The proportion of sole proprietorship decreases in the manufacturing sector and is highest (73.4%) in the hotels-restaurant sector (Table 6.47). Limited enterprises are highest among the manufacturing sector and the construction sector. Only 1.9% of the MSEs are joint stock enterprises. Among the manufacturing enterprises the share of joint stock enterprises rises to 3.9%. Only 0.8% of the enterprises do not have a legal status at all.
Table 6.47: Distribution of enterprises by type of legal form of the enterprise and by economic activity (%)
Legal Form Economic activity
Sole proprietor-
ship
Simple partnership
Limited liability
Limited liability by
shares
Joint stock Other No legal
status Total
Manufacturing 55.3 10.6 26.4 - 3.9 - 3.9 100.0 Construction 64.4 6.8 27.2 - 1.6 - 0.0 100.0 Trade 69.2 11.6 17.2 - 1.7 0.1 0.1 100.0 Hotels-restaurants 73.4 16.8 9.8 - 0.0 - - 100.0 Other services 71.0 8.6 18.5 - 1.3 0.4 0.1 100.0 Total 67.1 11.5 18.6 - 1.9 0.1 0.8 100.0
Table 6.48 shows the distribution of legal form of MSEs by size of the enterprises. 95.6% of the one-person enterprises have a status of sole proprietorship. The share of sole proprietorship decreases by size, while the share of limited enterprises rises according to the size of the enterprise. Among the enterprises with 20-49 persons engaged, limited enterprises dominate with a share of 63.5%.
Table 6.48: Distribution of enterprises by type of legal form of the enterprise and by size of enterprise (%)
Legal Form
Size Sole proprietorship
Simple partnership
Limited liability
Limited liability by
shares
Joint stock Other No legal
status Total
1 95.6 0.5 0.6 - - - 3.2 100.0 2 72.2 16.1 11.5 - - - 0.1 100.0 3-5 60.7 16.6 22.1 - 0.6 - 0.1 100.0 6-9 33.5 12.4 47.5 - 6.2 0.3 - 100.0 10-19 36.7 9.6 41.0 - 11.9 0.9 - 100.0 20-49 13.4 6.3 63.5 - 16.9 - - 100.0 Total 67.1 11.5 18.6 - 1.9 0.1 0.8 100.0
Table 6.49 Distribution of enterprises by type of legal form of the enterprise and by size of enterprise (%) (men)
Legal Form
Size Sole proprietors
hip
Simple partnership
Limited liability
Limited liability by
shares
Joint stock Other No legal
status Total
1 98.6 0.5 0.6 - - - 0.3 100.0 2 71.7 16.8 11.4 - - - 0.1 100.0 3-5 60.9 16.3 22.1 - 0.6 - 0.1 100.0 6-9 32.0 13.4 47.5 - 6.7 0.4 - 100.0 10-19 35.7 9.8 41.7 - 11.9 0.9 - 100.0 20-49 12.8 6.8 62.6 - 17.9 - - 100.0 Total 67.3 11.8 18.7 - 2.0 0.1 0.1 100.0

54
Tables 6.49 and 6.50 show that men entrepreneurs are more inclined to establish simple partnerships, that is, relatively more than women entrepreneurs. 12% of the enterprises run by women entrepreneurs have no legal status. Among the one-person enterprises of women entrepreneurs the enterprises with no legal status form 34.6% of the total whereas this figure is only 0.3% among the men entrepreneurs. Women entrepreneurs are more likely to perform activities particularly from home without any legal status.
Table 6.50: Distribution of enterprises by type of legal form of the enterprise and by size (%) (women)
Legal Form
Size Sole proprietorship
Simple partnership
Limited liability
Limited liability by
shares Joint stock Other No legal
status Total
1 63.7 0.9 0.8 - - 34.6 100.0 2 82.3 3.6 14.1 - - 100.0 3-5 56.2 22.7 21.2 - - - 100.0 6-9 51.7 - 47.8 - 0.5 - - 100.0 10-19 65.0 3.2 18.9 - 12.9 - - 100.0 20-49 21.1 - 75.1 - 3.8 - - 100.0 Total 62.8 7.5 17.1 - 0.6 - 12.0 100.0
Various tax concessions like VAT (value-added tax) granted to the enterprises in Turkey motivate the establishment of or transformation into limited enterprises for many entrepreneurs. However, establishment of a limited enterprise requires partners and a certain amount of start-up capital and these requirements constrain start-up of enterprises as limited enterprises. Usually, enterprises have been transformed into limited enterprises at certain phases of their activities after start-up. In other words, they have “turned to enterprises” as was put by the entrepreneurs.
All the risks in the sole proprietorships that may arise from their activities are undertaken by the entrepreneur himself/herself. However, this is not the case in the limited enterprises where the risks for the entrepreneur are limited.
It is known that the sole proprietorships have a higher tendency to informal relations in their activities compared to limited enterprises. In this respect, transformation from a sole proprietorship to a limited enterprise may be considered to indicate formalization of enterprises. However this does not mean that such informal relations completely disappear at the enterprise that has been turned into a limited enterprise. On the contrary, advantages of both formal and informal relations are completely appropriated by many of the successful enterprises. For example, enterprises having subcontracting relationships with small workshops, particularly in the textile sector in Turkey, usually operate in informal relations.
Advantages of becoming a limited enterprise are not limited only to obtaining of tax concessions. In our case study entrepreneurs of the limited enterprises all agreed that the customers’ perception of the enterprise as a formal enterprise increases its prestige significantly. The importance of the increase in prestige for the enterprise becomes more comprehensible if we bear in mind that trade relations among MSEs in Turkey are mostly based on mutual trust. The institutional deficiencies in the business environment usually lead to conducting business relations on the basis of personal trust rather than complying with the institutional rules and regulations in the system. This explains why the prestige created by turning into a limited enterprise is so important. Customers actually prefer to trust institutions rather than persons. The opinion expressed by an entrepreneur explains the matter quite clearly: “Limited enterprises like to work with limited enterprises.”
Furthermore, in some sectors such as construction the legal status did not affect their activities significantly as they were mostly working with individual consumers and construction workers who are generally unregistered casual workers.
The econometric study carried out for estimating the determinants of growth of the MSEs used three legal status dummies, namely sole proprietorship, limited liability and joint stock enterprises as
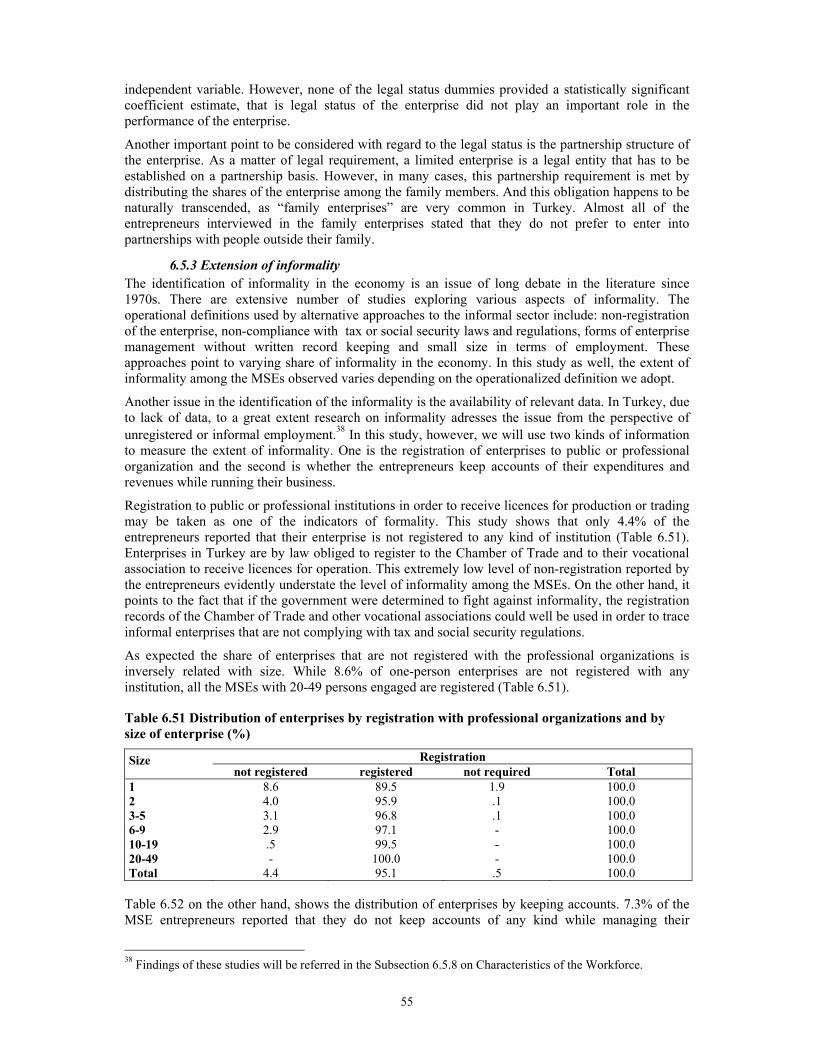
55
independent variable. However, none of the legal status dummies provided a statistically significant coefficient estimate, that is legal status of the enterprise did not play an important role in the performance of the enterprise.
Another important point to be considered with regard to the legal status is the partnership structure of the enterprise. As a matter of legal requirement, a limited enterprise is a legal entity that has to be established on a partnership basis. However, in many cases, this partnership requirement is met by distributing the shares of the enterprise among the family members. And this obligation happens to be naturally transcended, as “family enterprises” are very common in Turkey. Almost all of the entrepreneurs interviewed in the family enterprises stated that they do not prefer to enter into partnerships with people outside their family.
6.5.3 Extension of informality The identification of informality in the economy is an issue of long debate in the literature since 1970s. There are extensive number of studies exploring various aspects of informality. The operational definitions used by alternative approaches to the informal sector include: non-registration of the enterprise, non-compliance with tax or social security laws and regulations, forms of enterprise management without written record keeping and small size in terms of employment. These approaches point to varying share of informality in the economy. In this study as well, the extent of informality among the MSEs observed varies depending on the operationalized definition we adopt.
Another issue in the identification of the informality is the availability of relevant data. In Turkey, due to lack of data, to a great extent research on informality adresses the issue from the perspective of unregistered or informal employment.38 In this study, however, we will use two kinds of information to measure the extent of informality. One is the registration of enterprises to public or professional organization and the second is whether the entrepreneurs keep accounts of their expenditures and revenues while running their business.
Registration to public or professional institutions in order to receive licences for production or trading may be taken as one of the indicators of formality. This study shows that only 4.4% of the entrepreneurs reported that their enterprise is not registered to any kind of institution (Table 6.51). Enterprises in Turkey are by law obliged to register to the Chamber of Trade and to their vocational association to receive licences for operation. This extremely low level of non-registration reported by the entrepreneurs evidently understate the level of informality among the MSEs. On the other hand, it points to the fact that if the government were determined to fight against informality, the registration records of the Chamber of Trade and other vocational associations could well be used in order to trace informal enterprises that are not complying with tax and social security regulations.
As expected the share of enterprises that are not registered with the professional organizations is inversely related with size. While 8.6% of one-person enterprises are not registered with any institution, all the MSEs with 20-49 persons engaged are registered (Table 6.51).
Table 6.51 Distribution of enterprises by registration with professional organizations and by size of enterprise (%)
Registration Size not registered registered not required Total
1 8.6 89.5 1.9 100.0 2 4.0 95.9 .1 100.0 3-5 3.1 96.8 .1 100.0 6-9 2.9 97.1 - 100.0 10-19 .5 99.5 - 100.0 20-49 - 100.0 - 100.0 Total 4.4 95.1 .5 100.0
Table 6.52 on the other hand, shows the distribution of enterprises by keeping accounts. 7.3% of the MSE entrepreneurs reported that they do not keep accounts of any kind while managing their
38 Findings of these studies will be referred in the Subsection 6.5.8 on Characteristics of the Workforce.

56
enterprise. Construction sector has the lowest percentage of entrepreneurs (%2.1) whereas the hotels and restaurants sector has the highest percentage of entrepreneurs (10.1%) that perform their activities without keeping accounts.
Table 6.52: Distribution of enterprises by keeping of accounts and by economic activity
Keeping of Accounts Economic Activity does not keep
accounts
(%) keeps
accounts (%) Total (%)
Manufacturing 21,900 7.9 254,653 92.1 276,553 100.0 Construction 5,876 2.1 29,944 97.9 35,820 100.0 Trade 49,620 6.2 757,706 93.8 807,326 100.0 Hotels-restaurants 15,414
10.1 137,542 89.9 152,956 100.0
Other services 11,514 7.2 147,663 92.8 159,177 100.0 Total 104,324 7.3 1,327,508 92.7 1,431,832 100.0
The share of entrepreneurs not keeping accounts are relatively higher among the smaller MSEs and declines with the size of the enterprise (Table 6.53). It should be difficult for larger MSEs, particularly for those with linkages with other enterprise to manage without written account keeping.
Table 6.53: Distribution of enterprises by keeping of accounts and by size of the enterprise
Keeping of Accounts Size does not keep
accounts
(%) keeps
accounts (%) Total (%)
1 56,036 16.1 292,520 83.9 348,556 100.0 2 21,258 5.8 348,565 94.2 369,823 100.0 3-5 23,432 5.0 442,000 95.0 465,432 100.0 6-9 2,750 2.2 124,314 97.8 127,064 100.0 10-19 604 0.7 81,321 99.3 81,925 100.0 20-49 244 0.6 38,788 99.4 39,032 100.0 Total 104,324 7.3 1,327,508 92.7 1,431,832 100.0
Not keeping accounts are closely related to the education level of the entrepreneurs. 27.6% of entrepreneurs with no education do not keep accounts. However, it is also interesting to see that among the entrepreneurs with an education level of 12 years and more 3.3% do not keep accounts of their enterprises (Table 6.54).
Table 6.54: Distribution of enterprises by keeping of accounts and by years of education (%)
Keeping of Accounts Years of Education
does not keep accounts keeps accounts Total 0 27.6 72.4 100.0 <5 34.8 65.2 100.0 5-8 9.6 90.4 100.0 9-11 4.2 95.8 100.0 12+ 3.3 96.7 100.0 Total 7.3 92.7 100.0
6.5.4 The impact of clusters The impact of clusters on the performance of the MSEs is one the issues that is extensively studied in the literature on MSEs.39 The advantages of having similar enterprises at the same location are considered as motivating information exchange and subcontracting relations, transfer of experiences, exchange of qualified personnel, and opportunities for provision of raw materials. In case that the location is an industrial estate, these advantages will also include a better infrastructure, cheaper energy usage and lower rents offered for workplaces. Furthermore, in Turkey, various concessions 39 See for example, Iqbal and Urata (2002) and Yamawaki (2002).

57
and incentives are available at the industrial estates provided by governmental authorities. Industrial estates are established according to legislation and the incentives and other provisions for the enterprises in the industrial estates are determined by laws. For this reason, relations among the enterprises and with the administration of the industrial estate are established on a more formal basis in the industrial estates compared to the clusters.
Contrary to the findings of studies that identified the advantages of industrial estates and clusters for MSEs, in the econometric study conducted we have found that operating in an industrial estate or a cluster compared to not being located in one of them had a statistically significant negative impact on the growth performance of the MSEs. This result contradicting with the findings of empirical studies conducted in both developed and developing countries may be a consequence of harsh price competition among the MSEs during the economic crisis. Schmitz (2003) claims that impact of clusters is not only confined to cooperation between enterprises, but rivalry as well. Price competition, imitation of product models and transfer of the qualified personnel by competitors are considered as disadvantages of operating in an industrial estate or a cluster. It is likely that rivalry activities increase during the time of crisis.
Entrepreneurs also agree upon the fact that the major disadvantage of sharing the same location with other enterprises performing similar activities is the price competition. Easy entry to labour-intensive sectors mostly results in surplus of supply. While MSEs predominantly produce for internal markets in which the quality of production is less important, there are considerably low barriers to entry of new enterprises. An entrepreneur in the focus group on enterprises operating in the clusters summarized the situation as: “…There were groceries in every neighborhood before, now there are workshops. Those who find 3 machines and five men say I have a workshop”.
Furthermore, in clusters where enterprises involved in similar activities the transfer of trained personnel between enterprises is a widespread phenomenon. These transfers of personnel are considered as “stealing personnel” and lead to tensions between enterprises.
The entrepreneurs, on the other hand, consider the complementary nature of the activities performed by the enterprises as the greatest advantage of the clusters. The entrepreneurs stated that being located in a cluster facilitated their access to subcontracting relations. They could only overcome negative conditions of competition by getting into upward and downward subcontracting relations. On the other hand, engaging in those relations could usually be sustained with very low profit margins due to intensive price competition.
In our survey we have found that only 9.3% and 4% of the MSEs perform their activities in industrial estates and clusters respectively. 12.6% of the manufacturing sector MSEs is located in the industrial estates and 7.4% in clusters (Table 6.55).
Table 6.55: Distribution of enterprises by location of the enterprise and by economic activity (%)
Location Economic activity cluster industrial estate none Total Manufacturing 7.4 12.6 80.0 100.0 Construction 0.2 2.9 96.8 100.0 Trade 3.6 11.0 85.4 100.0 Hotels-restaurants 4.0 3.8 92.1 100.0 Other services 1.0 0.6 98.4 100.0 Total 4.0 9.3 86.6 100.0
Table 6.56 reflects the fact that women entrepreneurs could only enter clusters in the trade sector. Our observations on the field also pointed to the fact that industrial estates and industrial clusters are dominated by men and extremely few women entrepreneurs that are operating in the industrial estates and clusters are usually managers rather than the owners of the enterprises.
In general, entrepreneurs do not consider clusters as permanent places for performing their activities. They tend to move out of the cluster as they grow. For example, clusters in Istanbul mostly consisting of small workplaces impose some physical limitations over the growth of enterprises. Growing

58
enterprises in the clusters firstly incorporate some neighboring workplaces spatially. As renting or purchasing new space in order to expand their production becomes difficult they start looking for new places where they can establish bigger workshops or directly move on to factory production. Sometimes limited infrastructure of the clusters force the entrepreneurs to move into new clusters with better infrastructures than their current clusters.
Table 6.56: Distribution of enterprises by location of the enterprise and by economic activity (%) (women)
Location Economic activity cluster industrial estate none Total Manufacturing 1.8 1.4 96.8 100.0 Construction - - 100.0 100.0 Trade 7.1 0.5 92.5 100.0 Hotels-restaurants 1.0 - 99.0 100.0 Other services - - 100.0 100.0 Total 4.2 0.7 95.1 100.0
6.5.5 Linkages with other enterprises
Both our observations on site and the results of the survey indicate that linkages among enterprises are rather weak in Turkey. Only 18.7% of the MSEs reported that they have established linkages with other enterprises such as subcontracting relations, collaboration in bidding for contracts, utilizing machinery and for marketing purposes. It seems that among the MSEs there is an established culture of “better be little but mine”. As can be expected, the highest percentage of enterprises having linkages with other enterprises is in the manufacturing sector (29.5%) (Table 6.57 and 6.58).
Table 6.57: Distribution of enterprises by linkages with other enterprises and by economic activity
Linkages with other enterprises Economic Activity No Yes Total Manufacturing 194,899 81,655 276,554 Construction 30,182 5,639 35,821 Trade 662,295 145,030 807,325 Hotels-restaurants 138,039 14,916 152,955 Other services 138,062 21,115 159,177 Total 1,163,477 268,355 1,431,832
Table 6.58: Distribution of enterprises by linkages with other enterprises and by economic activity (%)
Linkages with other enterprises Economic Activity No Yes Total Manufacturing 70.5 29.5 100.0 Construction 84.3 15.7 100.0 Trade 82.0 18.0 100.0 Hotels-restaurants 90.2 9.8 100.0 Other services 86.7 13.3 100.0 Total 81.3 18.7 100.0
Table 6.59 shows that establishing linkages with other enterprises increases with size and almost 40% of the MSEs with 20-49 persons engaged are involved in some kind of linkage with other enterprises.
Among those MSEs that have established linkages with other enterprises 34.8% of them have entered collaborative relations with other enterprises to utilize advanced equipment and 19.0% of them subcontracted work to other enterprises whereas 19.4% of the MSEs were subcontracted by other enterprises (Table 6.60 and 6.61). In the manufacturing sector, among 29.5% of enterprises that established linkages with other enterprises 28.9% had subcontracted work to other enterprises, whereas 50.6% were subcontracted by other enterprises.

59
Table 6.59: Distribution of enterprises by linkages with other enterprises and by size of the enterprise (%)
Size Linkages with other enterprises No Yes Total 1 90.6 9.4 100.0 2 82.3 17.7 100.0 3-5 80.4 19.6 100.0 6-9 67.2 32.8 100.0 10-19 73.6 26.4 100.0 20-49 60.2 39.8 100.0 Total 81.3 18.7 100.0
Table 6.60: Distribution of enterprises with type of linkages and economic activity Type of linkage
Economic activity Sub-
contracting Sub-
contracted
collaboration in bidding for
contracts
collaboration in utilizing equipment
collaboration in utilizing advanced equipment
domestic marketing
to do business (selling
and buying)
Total
Manufacturing 22,947 40,202 5,484 6,796 10,076 7,061 1,623 79,453 Construction 36 469 119 863 2,399 754 1,095 5,639 Trade 27,300 10,486 13,740 13,662 58,482 31,640 5,404 144,776Hotels-restaurants - - 293 - 11,329 3,295 - 14,916 Other services 211 318 3,869 8,230 10,256 - 1,020 21,019 Total 50,493 51,475 23,505 29,551 92,542 42,750 9,142 265,802
Table 6.61 Distribution of enterprises by type of linkage and by economic activity (%)
Type of linkage
Economic activity Sub-
contracting Sub-
contracted
collaboration in bidding
for contracts
Collaborationin utilizing equipment
collaboration in utilizing
advanced equipment
domestic marketin
g
to do business (selling
and buying)
Total*
Manufacturing 28.9 50.6 6.9 8.6 12.7 8.9 2.0 118.6Construction 0.6 8.3 2.1 15.3 42.5 13.4 19.4 101.6Trade 18.9 7.2 9.5 9.4 40.4 21.9 3.7 111.0Hotels/restaurants - - 2.0 - 76.0 22.1 - 100.1Other services 1.0 1.5 18.4 39.2 48.8 - 4.9 108.9Total 19.0 19.4 8.8 11.1 34.8 16.1 3.4 112.6*Total does not add up to 100.0 since one enterprise may be involved in more than one type of linkages with other enterprises.
Whether subcontracting provides a positive impact on the enterprise growth or not is a controversial issue in the studies conducted in Turkey on MSEs and SMEs. Taymaz and Kilicaslan (2000) finds that subcontracting has a significantly positive impact on growth of Turkish SMEs. Their study covers only SMEs and micro enterprises are not included in their analysis. On the other hand, Evcimen et al. (1991) find that subcontracting enterprises are worse off than their non-subcontracting counterparts in terms of MSE growth and additionally, their average annual rate of capacity expansion is not statistically different from the latter. Our estimation results of the econometric study achieved the same results as Evcimen et al. The contradicting results of these studies may stem from the fact that medium-sized enterprises are in an advantageous position compared to small and micro enterprises in subcontracting relations owing to their dominance over small enterprises.
Our results also show that larger manufacturing enterprises among the MSEs are more likely to involve into subcontracting relations (Table 6.62). Enterprises with 10-49 persons engaged are more likely to subcontract to other enterprises and MSEs with 3-9 persons engaged are more likely to be subcontracted by other enterprises.

60
Some entrepreneurs enter into subcontracting relationships only when they are not able to produce products with their own facilities that are demanded by their customers. Some others prefer subcontracting due to their limited capacity.40 An entrepreneur that produced for larger enterprises on subcontracting basis stated that these connections are of great advantage for his enterprise, but he also added that the nature and scope of these relations depend closely on the performance of the economy in general: “We are engaged in subcontracting. This is a great advantage for us. However, the extent of such relations change depending on the situation of the Turkish economy. For example, it was weaker in 2002 and we were sometimes producing only for ourselves. There has been a forward push in 2003, but, now we can’t see the same increase in 2004.”
Table 6.62: Distribution of enterprises by type of linkage and by size of the enterprise (%) Type of linkage
Size Sub-contracting subcontracted
collaboration in bidding for
contracts
collaboration in utilizing
equipment
collaboration in utilizing advanced equipment
domestic marketing
to do business (selling
and buying)
Total*
1 7.7 6.1 5.0 8.9 39.2 32.1 3.5 102.5 2 18.1 8.6 7.0 9.1 32.9 23.5 2.8 102.0 3-5 16.1 32.8 11.7 12.1 40.9 7.2 3.9 124.7 6-9 24.0 20.5 10.1 14.4 26.3 13.1 4.8 113.2 10-19 36.2 17.9 10.8 12.0 19.2 12.3 2.8 111.2 20-49 27.2 12.0 0.4 8.1 43.9 17.1 0.6 109.3 Total 19.0 19.4 8.8 11.1 34.8 16.1 3.4 112.6
*Total do not add up to 100.0 since one enterprise may be involved in more than one type of linkages with other enterprises.
6.5.6 Exporting MSEs The findings of the survey show that the number of exporting MSEs is extremely low (0.5%). At the same time, the estimation results of the econometric study show that there is no significant relationship between exporting and growth performance of the MSEs.
Most of the MSEs target domestic markets and look for foreign markets only when demand for their products in domestic markets fall. The shrinking domestic demand resulting from the economic crisis of 2001, re-orientated MSEs, though very few in number, to external markets but mainly as a survival strategy. Some of those exporting enterprises were even able to improve their situation rapidly during the crisis. Weak domestic demand still continues to be the most important factor forcing MSEs to shift their sales to export markets. Entrepreneurs consider foreign markets as more stable and reliable. What leads them to this consideration is the insecure and unstable nature of the domestic market compared to the foreign markets. Furthermore, the “modernizing” effect of the exporting activity over MSEs is known. Those enterprises producing for internal markets mostly do not have to maintain particular standards of quality and trademarks. They usually focus on minimizing the production costs. By contrast, enterprises producing for external markets have to adopt various regulations to comply with the standards of production and quality control required by the target countries. Sometimes it is also necessary to obtain special certificates of quality standard (In Turkey, ISO quality standards are received from Turkish Institute of Standards) or engage in licensed production. The enterprises that do not adapt themselves to these standards lose their customers abroad. At the same time, complying with the standards lead to decline in informal relations and processes. For instance, registration to social insurance is a requirement in order to receive certificate of quality. On the other hand, the process of formalization usually has an increasing effect on cost of production. Mostly, the increase in costs is transferred on to the prices which may in turn affect the competitiveness of the enterprise adversely in foreign markets.
Our observations indicate that, in general, MSEs do not have knowledge, experience or infrastructure required for exporting. While very few MSEs enjoyed the benefits of exporting, others experienced serious problems and due to their inexperience, in some cases, they were cheated by foreign and domestic intermediary enterprises. The entrepreneurs stated that the absence of support services in 40 See Taymaz and Kılıçaslan (2000) for different forms of subcontracting relations in Turkey.

61
Turkey pushes them into an unfair competition with enterprises that receive numerous support services in their home countries.
6.5.7 Access to financial resources Banks in Turkey advance credit only to businesses which could fulfil the established legal requirements, especially those regarding the collateral. Banks generally offer credits only to larger and more successful enterprises or to large family holding companies to which they are affiliated. But majority of the MSE entrepreneurs lack assets necessary for collateral requirements. Usually MSEs start up with very little assets. Consequently, MSEs are almost entirely self-financed, with friends and relatives being the only other appreciable source of funds.
Table 6.63 Distribution of enterprises by main source of initial capital and by economic activity (%)
Main source of initial capital Economic Activity inheritance own
savings liquidation
of assets formal
loan informal
loan own
remittancesothers’
remittances other Total
Manufacturing 6.7 73.8 5.4 1.7 8.6 1.6 - 2.2 100.0Construction 13.9 53.1 13.0 0.5 11.7 6.7 - 1.2 100.0Trade 8.8 76.0 5.5 1.2 7.4 0.5 - 0.6 100.0Hotels-restaurants 8.0 70.9 3.0 3.8 11.7 1.5 0.1 1.0 100.0Other services 3.6 79.1 3.9 0.8 10.5 0.9 - 1.2 100.0Total 7.9 74.8 5.2 1.5 8.5 1.0 - 1.0 100.0
Our findings show that very few MSEs relied on bank loans at the start-up stage. Only 1.5% of them reported that they had obtained credit from formal sources while establishing their enterprises (Table 6.63). 74.8% used their own savings and 8.5% relied on informal loans. Women entrepreneurs are less likely to use formal loans (0.6%) and more likely to use their own savings as start-up capital compared to men entrepreneurs (Table 6.64 and 6.65).
Table 6.64 Distribution of enterprises by main source of initial capital and by economic activity (%) (women)
Main source of initial capital Economic Activity inheritance own
savings liquidation
of assets formal
loan informal
loan own
remittancesothers’
remittances other Total
Manufacturing 0.3 80.0 0.7 - 4.7 0.3 - 14.0 100.0Construction - 100.0 - - - - - - 100.0Trade 8.1 78.9 1.9 1.1 9.7 0.1 - 0.1 100.0Hotels-restaurants - 60.6 2.7 - 36.8 - - - 100.0Other services 8.5 82.4 3.8 0.4 4.9 - - - 100.0Total 5.3 78.9 1.9 0.6 8.8 0.1 - 4.5 100.0
Table 6.65 Distribution of enterprises by main source of initial capital and by economic activity (%) (men)
Main source of initial capital Economic Activity inheritance own
savingsliquidation
of assets formal
loan informal
loan own
remittancesothers’
remittances other Total
Manufacturing 7.4 73.2 5.9 1.8 9.0 1.7 - 0.9 100.0Construction 13.9 52.9 13.0 0.5 11.8 6.7 - 1.2 100.0Trade 8.9 75.8 5.6 1.2 7.3 0.5 - 0.6 100.0Hotels-restaurants 8.3 71.2 3.0 3.9 11.0 1.5 0.1 1.0 100.0Other services 3.2 78.8 3.9 0.9 11.0 1.0 - 1.3 100.0Total 8.1 74.5 5.4 1.6 8.5 1.1 - 0.8 100.0
It is interesting to see that entrepreneurs of larger MSEs rely on their own savings rather than formal loan for establishing their enterprises compared to smaller MSEs (Table 6.66).
Informants were also asked whether they had obtained credit during the past 12 months at the time of the interview (2001). Only around 11% of the MSE entrepreneurs used formal bank credit as a source of finance. 12% of the entrepreneurs had borrowed money from friends, family and relatives.

62
Table 6.66 Distribution of enterprises by main source of initial capital and by size of the enterprise (%)
Main source of initial capital Size inheritance own
savings liquidation
of assets formal
loan informal
loan own
remittancesothers’
remittances other Total
1 11.2 68.4 5.4 1.1 11.4 0.8 - 1.6 100.0 2 7.1 73.4 5.9 2.0 9.6 1.0 - 0.9 100.0 3-5 6.6 78.6 5.0 1.6 6.7 1.2 - 0.4 100.0 6-9 6.5 81.3 4.6 1.1 4.9 0.9 - 0.6 100.0 10-19 7.0 74.4 5.5 2.0 5.8 1.4 - 3.9 100.0 20-49 8.0 79.8 0.6 0.2 11.4 - - - 100.0 Total 7.9 74.8 5.2 1.5 8.5 1.0 - 1.0 100.0
Those entrepreneurs who have received credits from the banks have mostly suffered from high interest rates and inflexible repayment arrangements attached to these loans.41 This was particularly true during the economic crisis of 2001, when many MSE entrepreneurs ended up selling their houses and other properties in order to pay back their loans. The findings of the econometric study also reflect this fact clearly. Regression results show that there is a significant negative relationship between receiving both formal and informal loans and growth of the MSEs.
It was further seen that inflexible repayment conditions, a distinguishing feature of formal credits in contrast to informal credits, have a direct effect on the decisions and choices made by the entrepreneurs. The entrepreneurs state that delays in repayment date may occur resulting from irregular cash flow in the enterprise. The irregular character of the MSEs stems from their limited market options as well as their high vulnerability to macro economic fluctuations. Consequently, these entrepreneurs usually shy away from signing a regular repayment schedule in order to receive credit. An entrepreneur was asked whether he could have started his enterprise if he had not provided the necessary initial capital from his sister, he responded as: “If I had not found this money, I would have searched for other people around me. If I had not, I would have preferred not to start till I found somewhere else. I would not have dared to try banks.” As a matter of fact, it is known that the informal relations of credits have also shrunk as an effect of the financial crisis in 2001 in the country. Today not only the severe conditions of formal credits but also the decrease in informal credit opportunities creates significant problems for the entrepreneurs.
The cumbersome bureaucratic processes in the state institutions and public or private banks prepared to advance credits and similar financial services to the MSEs also add to the existing difficulties. The entrepreneurs stated that these bureaucratic processes can only be accessed by enterprises with regular and professional management.
In many cases lack of access to formal financial sources is a consequence of deficiencies in management and human capital on the part of MSEs and their entrepreneurs. It is thus necessary for public policy processes to address both sides of the issue, aiming to raise the capacity of the enterprise by providing training and counselling on the one hand and encouraging the financial sector to launch multiple and diverse sources of finance to the MSEs on the other.
Leasing and venture capital were rarely used as a form of financing investment in the MSEs. Only O.85% and 0.68% of the MSEs received funding through leasing and venture capital respectively.
Given the dearth of the relevant data no precise information on the exact volume of credit extended to SMEs could be provided here. The share of credit provided by Halkbank (The Turkish Popular Bank), the greatest funding institution in the SME sector, fell from 4.6% in 1999 to 2.5% in 2002 as a percentage of total volume of credits in Turkey. It could thus be concluded from these figures that the recent crises have led to a decline in the share of the credit used by SMEs in the Turkish banking
41 In the last economic crisis in February 2001, the interest rates in the market rose to 200% nominally whereas in April 2001, TL was devalued by 80% in terms of dollar in comparison to the end of 2000.

63
system. Recently, there has been an upward trend in the provision of credit to SME as well as to other sectors of the economy.42
There are also problems with definitions of credits granted by the banks through foreign funds. The definitions of these funds are usually determined by the criteria established in the countries in which funds originate. For this reason, these credits are not compatible with the enterprise structure in Turkey. The credits provided by the European Investment Bank are delivered to the enterprises employing 1-500 persons. Such enterprises constitute nearly the total of the enterprises operating in Turkey. Adjustment to EU norms and criteria is currently proceeding with full speed in Turkey. However, this process should necessarily take into account the specific conditions of Turkey rather than simply replicating the EU norms and criteria in the case of enterprises singled out for support.
Recently, Turkey has adjusted the definitions of the enterprise size with those of the EU. The enterprises that are included in the definition of SMEs in Turkey employing 1-250 persons account for 99.9% of the total enterprises. This number nearly equals the total of the enterprises operating in Turkey. On the other hand, MSEs in Turkey employing 1-49 persons have a share of 99.4%. The present structure of enterprise size in Turkey demonstrates that the number of employees, as one of the most important criteria for financial support and credit programs, is not a distinctive feature in the categorization of the MSEs. Here it should be remembered that the number of employees defined for SMEs is 1-250 persons for Halkbank credits. The wide range of employees defined for SMEs is the common feature of local and foreign funds reserved for financing SMEs. As different from the local funds, it is observed that the ceiling volume of fixed capital determined as a conditional for the foreign funds is too high for Turkey. Thus, the selection of the SMEs as the targeted enterprise group is defined in very broad terms. This seriously limits the opportunities for the smaller enterprises to receive these services. As such, the majority of the MSEs are left to their own fate. They are practically required to fend for themselves in the market.
There is another problem with the definition of SMEs specified for credits by public institutions or financial sector. The credit programmes do not usually include specific features related to the different sectors of the economy. For example, using the same employment criteria for both capital-intensive sectors and labour-intensive sectors may lead to problems in defining the size of the enterprises. Furthermore, there are no regional criteria taken into consideration in the definitions. It is widely known that regional socio-economic inequalities are very prominent in Turkey. For instance, the amount of support lent by the Undersecretary of Treasury to fixed investments authorized by the Incentive Certificates for SMEs corresponds to a higher amount of fixed investment in KOY (The Priority Regions in Development) compared to other regions. At the same time, the interest rates determined for the investment credits in KOYs are five points less than those in other regions. That is, in so far as credits and subsidies are concerned, the regional inequalities8 are taken into account only in the process of repayment and not in the process of determining their scope and target.
In Turkey, neither the financial sector nor the concerned public institutions provide services for micro enterprises. Today, there is only one definition of “micro enterprises” given by the Undersecretary of Treasury. Inclusion of the definition of micro enterprise in the Legislation for Incentives for SMEs produced by the Undersecretary of Treasury43, does not, however, correspond to any services or facilities in practice yet. In terms of financial services provided to micro enterprises, only the Micro Credit Pilot Project started in Diyarbakir and Batman in the southeastern Turkey and MAYA Enterprise for Microfinance delivering micro credits to low income women in Izmit supervised by KEDV (Foundation for the Support of Women's Work) can be stated in this connection. 42 Definitely, in Turkey where 99.9% of enterprises are considered as SMEs, the share of credits used by SMEs in the system is much higher than the numbers stated above. However, the point to be emphasized here is the size of the credit programmes with specific conditions orientated to SMEs in total. It should be noted that in addition to Halkbank, the private banks have also recently started to introduce such special credit programs. 8 In terms of regional inequalities, there are not any definitions except the criterion of The Priority Regions in Development vs. Normal Regions. This distinction that points to regional differences are mostly taken into account in the Incentive Certificates for SMEs delivered by the Undersecretary of Treasury and the supports lend by KOSGEB. 43 In the provision of no. 2000/1822 legislated on 18 January 2001 about “The State Assistance in Investments of the Small and Medium-Sized Enterprises”, the enterprises with 1-9 employees are defined as micro-sized. (The Undersecretary of Treasury, www.hazine.gov.tr).

64
The percentage of women entrepreneurs that had access to formal credits is very low. Women entrepreneurs reported that they were reluctant to apply for a loan usually because of high risks or lack of assets required for collateral. Women were usually not allowed to use family assets as collateral. Even though lack of adequate financing created problems for their business, applying for loans was never been their number one priority. Women entrepreneurs cited high interest rates, lack of knowledge about application procedures as the most important reasons for not applying for a loan.
6.5.8 Characteristics of the workforce44 According to our findings, 5,892,739 people are engaged in the MSEs performing in the non-agricultural sector in the urban areas of Turkey of which 13% are women.45
Distribution of workforce by age groups The distribution of the workforce in terms of age shows that 71.9% of the workforce is in the prime age group (25-59 years) (Table 6.68). Early exit of workers is a well documented fact in Turkey’s labour markets.46 Our findings also show that workers above the age of 60 years consitute only 1.8% of the total workforce. Low percentage of older workers hold for all economic sectors, only the manufacturing sector has a relatively older workforce (7.1%) compared to other sectors.
Even though our observations on site indicated a relatively high rate of child labour, the results of the survey show that only 1% of the workforce in the MSEs is less than 15 years of age (Table 6.68).47
Table 6.67: Distribution of total workforce* by economic activity and age groups
Age groups Economic activity <15 15-24 25-59 60+ Total Manufacturing 20,312 368,119 1,091,914 113,216 1,593,561 Construction 3,542 40,183 93,765 1,477 138,967 Trade 29,353 609,949 2,109,848 52,836 2,801,986 Hotels-restaurants 2,653 248,842 496,495 13,582 761,571 Other services 3,081 137,886 444,783 10,903 596,653 Total 58,941 1,404,979 4,236,804 192,014 5,892,739 *all persons engaged in all locations including the entrepreneur
Table 6.68: Distribution of total workforce by economic activity and age groups
Age groups Economic activity <15 15-24 25-59 60+ Total Manufacturing 1.3 23.1 68.5 7.1 100.0 Construction 2.5 28.9 67.5 1.1 100.0 Trade 1.0 21.8 75.3 1.9 100.0 Hotels-restaurants 0.3 32.7 65.2 1.8 100.0 Other services 0.5 23.1 74.5 1.8 100.0 Total 1.0 23.8 71.9 3.3 100.0
Although the female workforce constitutes a smaller fraction of the total workforce (13.0%), its share in the total workforce is ralatively higher compared to the share of women entrepreneurs (6.1%) in the total entrepreneurs. The percentage of female workforce is higher (%41.3%) in the age group 15-24, and lower (57.1%) in the age group 25-59 compared to male workforce (21.2%and 74.1%
44 Workforce refers to all persons engaged in all locations of the MSEs including the entrepreneur. 45 General Census of Industry and Business Establishments (GSIS) in 2002 finds the total number of people engaged in all non-agricultural enterprises in Turkey as 6,484,168, of which 14.8% is women. 46 See for example World Bank (2005). 47 Here it is important to note that, in the whole survey including including the information on the workforce we rely on the statements of the enterpreneurs as source of evidence.

65
respectively) indicating early withdrawal of women from the workforce often upon marriage48 (Table 6.70-6.72).
Table 6.69: Distribution of female workforce by economic activity and age groups
Age groups Economic activity <15 15-24 25-59 60+ Total Manufacturing 616 116,586 137,414 2,642 257,258 Construction 0 3,157 5,496 0 8,654 Trade 634 100,786 174,155 3,023 278,598 Hotels-restaurants 632 52,110 59,222 3,098 115,062 Other services 44 44,277 62,621 1,602 108,545 Total 1,926 316,917 438,907 10,365 768,115
Table 6.70: Distribution of female workforce by economic activity and age groups
Age groups Economic activity <15 15-24 25-59 60+ Total Manufacturing 0.2 45.3 53.4 1.0 100.0 Construction 0.0 36.5 63.5 0.0 100.0 Trade 0.2 36.2 62.5 1.1 100.0 Hotels-restaurants 0.5 45.3 51.5 2.7 100.0 Other services 0.0 40.8 57.7 1.5 100.0 Total 0.3 41.3 57.1 1.3 100.0
Table 6.71: Distribution of male workforce by economic activity and age groups
Age groups Economic activity <15 15-24 25-59 60+ Total Manufacturing 19,696 251,533 954,500 110,574 1,336,303 Construction 3,542 37,026 88,268 1,477 130,313 Trade 28,720 509,163 1,935,693 49,813 2,523,389 Hotels-restaurants 2,021 196,732 437,273 10,484 646,509 Other services 3,036 93,609 382,162 9,301 488,109 Total 57,015 1,088,062 3,797,897 181,649 5,124,623
Table 6.72: Distribution of male workforce by economic activity and age groups (%)
Age groups Economic activity <15 15-24 25-59 60+ Total Manufacturing 1.5 18.8 71.4 8.3 100.0 Construction 2.7 28.4 67.7 1.1 100.0 Trade 1.1 20.2 76.7 2.0 100.0 Hotels-restaurants 0.3 30.4 67.6 1.6 100.0 Other services 0.6 19.2 78.3 1.9 100.0 Total 1.1 21.2 74.1 3.6 100.0
Permanency of employment
The majority of the workforce works on permanent basis (94.7% of the workforce both for female and male) rather than on temporary or casual basis (Tables 6.73 and 6.74). Permanent employment in Turkey’s labour markets do not necessarily correspond to labour under protection of labour market regulations. From entrepreneur’s perspective it usually refers to long-duration employment. There are significant differences in the share of permanency of employment in terms of economic sectors and gender. 30% of the male workforce is employed on temporary basis in the construction sector whereas hotels and restaurants have the highest share of female employment on temporary basis (10.3%).
48 For patterns of female labour force participation, see for example Eyuboglu et al (2000) and World Bank (2005).

66
Table 6.73: Distribution of male workforce by economic activity and permanency of employment
Permanency of employment Economic activity permanent temporary casual Total Manufacturing 97.0 2.6 0.4 100.0 Construction 66.4 30.0 3.5 100.0 Trade 96.8 3.1 0.1 100.0 Hotels-restaurants 85.9 13.7 0.4 100.0 Other services 97.0 2.1 0.9 100.0 Total 94.7 4.9 0.4 100.0
Table 6.74: Distribution of female workforce by economic activity and permanency of employment
Permanency of employment Economic activity permanent temporary casual Total Manufacturing 97.6 2.2 0.2 100.0 Construction 100.0 0.0 0.0 100.0 Trade 94.3 5.6 0.1 100.0 Hotels-restaurants 89.6 10.3 0.1 100.0 Other services 93.6 6.4 0.0 100.0 Total 94.7 5.2 0.1 100.0
Skill structure of the workers49
Eentrepreneurs of the MSEs qualify the majority of their workers as skilled for the tasks they perform. It is reported that relatively the highest percentage of unskilled workers is employed in the construction sector (Table 6.75 and 6.76).
Table 6.75: Distribution of female workers by economic activity and skill structure
Skill structure Economic activity Skilled semi-skilled unskilled apprentices Total Manufacturing 73.5 9.2 17.1 0.3 100.0 Construction 25.5 8.2 36.5 29.8 100.0 Trade 74.6 12.5 12.9 0.0 100.0 Hotels-restaurants 69.3 5.9 24.7 0.0 100.0 Other services 83.1 4.1 8.2 4.6 100.0 Total 74.0 9.0 15.9 1.1 100.0
Table 6.76 Distribution of male workers by economic activity and skill structure
Skill structure Economic activity skilled semi-skilled unskilled apprentices Total Manufacturing 72.2 10.7 13.8 3.3 100.0 Construction 55.9 4.0 39.0 1.1 100.0 Trade 74.5 10.3 10.2 5.0 100.0 Hotels-restaurants 64.1 13.8 18.2 3.9 100.0 Other services 74.8 7.6 14.9 2.7 100.0 Total 71.9 10.5 13.5 4.0 100.0
As expected the share of skilled workers increases with size, larger MSEs employ higher share of skilled workers than their smaller counterprats. Contrary to the expectations, apprentices do not constitute a significant part of employment. They comprise 1.1% of female workers and 4.0% of male workers (Table 6.77 and 6.78). Apprentices share is relatively higher in the MSEs with less than 5 persons suggesting that smaller MSEs can only afford to hire apprentices.
49 This part is only on the characteristics of the workers; it does not include the entrepreneur and his/her partners.

67
Table 6.77: Distribution of female workers by size and skill structure
Skill structure Size skilled semi-skilled unskilled apprentices Total 1 0.0 0.0 0.0 0.0 0.0 2 2.9 2.6 6.0 34.0 3.7 3-5 16.9 26.8 17.7 56.1 18.3 6-9 16.7 30.7 13.5 2.8 17.3 10-19 27.7 24.8 20.1 0.2 25.9 20-49 35.8 15.2 42.7 6.9 34.7 Total 100.0 100.0 100.0 100.0 100.0
Table 6.78: Distribution of male workers by size and skill structure
Skill structure Size skilled semi-skilled unskilled apprentices Total 1 0.0 0.0 0.0 0.0 0.0 2 62.0 14.4 15.6 8.0 100.0 3-5 67.4 10.8 12.4 9.4 100.0 6-9 79.5 10.5 7.1 2.9 100.0 10-19 66.1 13.7 19.2 1.1 100.0 20-49 77.8 7.2 13.4 1.5 100.0 Total 71.9 10.5 13.5 4.0 100.0
Workers related to the entrepreneur
Employment of workers related to the entrepreneur constitutes 15.5% of the total number of workers (Table 6.79).
Table 6.79: Distribution of workers related to the entrepreneur50
Related to the entrepreneur N % Yes 535,692 15.5 No 2,922,357 84.5 Total 3,458,049 100.0
The findings of the econometric study show that the number of relatives engaged in the enterprise is a significant determinant of growth. At the focus group meetings and in-depth interviews entrepreneurs have several times stated that they have subsituted paid labour with family labour in order to be able to survive under the severe financial crisis. This result is purely consistent with one of the features of the MSEs: Unpaid or low-paid family members increase the level of flexibility of MSEs and hence decrease the level of its vulnerability against macroeconomic conditions. A similar result is stated in the study of Çınar et. al. (1987).
Table 6.80: Distribution of workers related to the entrepreneur by size
Size Related to the entrepreneur 1 2 3-5 6-9 10-19 20-49 Total Yes 0.0 44.0 28.3 16.7 10.2 3.5 15.5 No 0.0 56.0 71.7 83.3 89.8 96.5 84.5 Total 0.0 100.0 100.0 100.0 100.0 100.0 100.0
The share of employing people related to the entrepreneur is inversely related to the size of the enterprise; the highest share being 44% in the enterprises with 2 persons engaged (Table 6.80).
Informal employment Mainly two types of indicators are used to identify the extent of informal employment in Turkey. One, is the size criterion that considers the enterprises with less than 5 or 10 persons engaged as informal and the other is the non-registration of workers with the social security institutions. TURKSTAT 50 Gender-based data does not exist for this and the following data on the workforce.
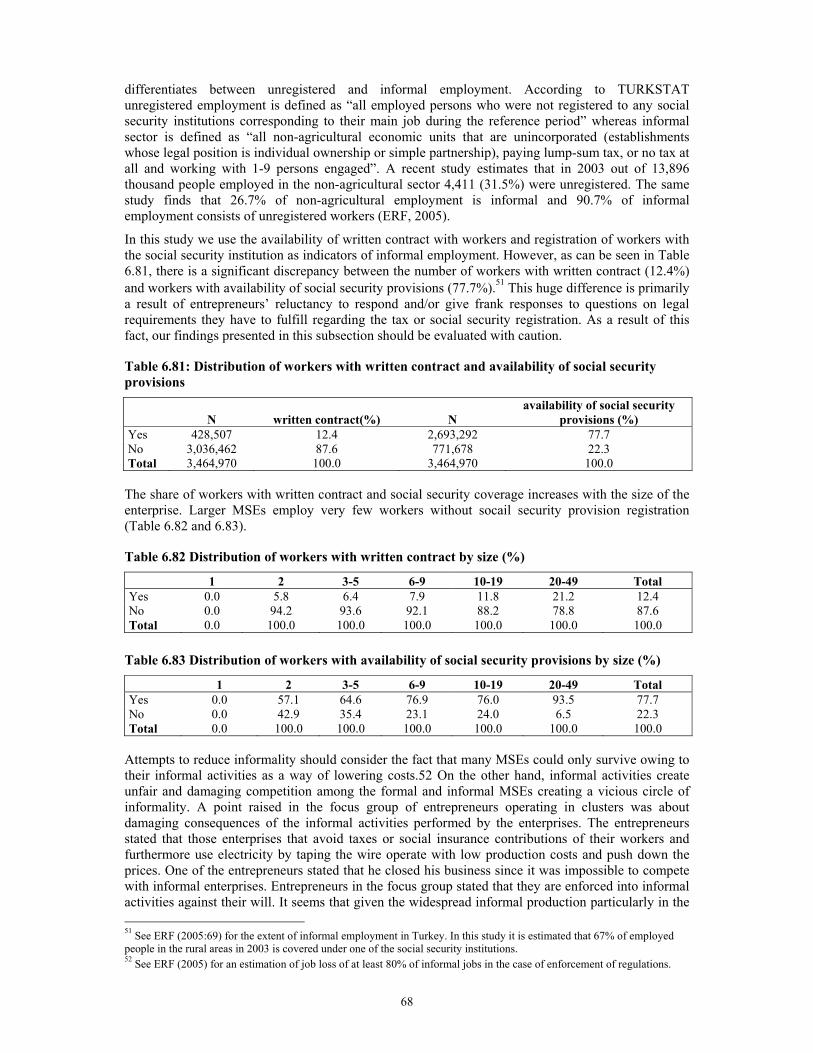
68
differentiates between unregistered and informal employment. According to TURKSTAT unregistered employment is defined as “all employed persons who were not registered to any social security institutions corresponding to their main job during the reference period” whereas informal sector is defined as “all non-agricultural economic units that are unincorporated (establishments whose legal position is individual ownership or simple partnership), paying lump-sum tax, or no tax at all and working with 1-9 persons engaged”. A recent study estimates that in 2003 out of 13,896 thousand people employed in the non-agricultural sector 4,411 (31.5%) were unregistered. The same study finds that 26.7% of non-agricultural employment is informal and 90.7% of informal employment consists of unregistered workers (ERF, 2005).
In this study we use the availability of written contract with workers and registration of workers with the social security institution as indicators of informal employment. However, as can be seen in Table 6.81, there is a significant discrepancy between the number of workers with written contract (12.4%) and workers with availability of social security provisions (77.7%).51 This huge difference is primarily a result of entrepreneurs’ reluctancy to respond and/or give frank responses to questions on legal requirements they have to fulfill regarding the tax or social security registration. As a result of this fact, our findings presented in this subsection should be evaluated with caution.
Table 6.81: Distribution of workers with written contract and availability of social security provisions
N written contract(%) N availability of social security
provisions (%) Yes 428,507 12.4 2,693,292 77.7 No 3,036,462 87.6 771,678 22.3 Total 3,464,970 100.0 3,464,970 100.0
The share of workers with written contract and social security coverage increases with the size of the enterprise. Larger MSEs employ very few workers without socail security provision registration (Table 6.82 and 6.83).
Table 6.82 Distribution of workers with written contract by size (%)
1 2 3-5 6-9 10-19 20-49 Total Yes 0.0 5.8 6.4 7.9 11.8 21.2 12.4 No 0.0 94.2 93.6 92.1 88.2 78.8 87.6 Total 0.0 100.0 100.0 100.0 100.0 100.0 100.0
Table 6.83 Distribution of workers with availability of social security provisions by size (%)
1 2 3-5 6-9 10-19 20-49 Total Yes 0.0 57.1 64.6 76.9 76.0 93.5 77.7 No 0.0 42.9 35.4 23.1 24.0 6.5 22.3 Total 0.0 100.0 100.0 100.0 100.0 100.0 100.0
Attempts to reduce informality should consider the fact that many MSEs could only survive owing to their informal activities as a way of lowering costs.52 On the other hand, informal activities create unfair and damaging competition among the formal and informal MSEs creating a vicious circle of informality. A point raised in the focus group of entrepreneurs operating in clusters was about damaging consequences of the informal activities performed by the enterprises. The entrepreneurs stated that those enterprises that avoid taxes or social insurance contributions of their workers and furthermore use electricity by taping the wire operate with low production costs and push down the prices. One of the entrepreneurs stated that he closed his business since it was impossible to compete with informal enterprises. Entrepreneurs in the focus group stated that they are enforced into informal activities against their will. It seems that given the widespread informal production particularly in the 51 See ERF (2005:69) for the extent of informal employment in Turkey. In this study it is estimated that 67% of employed people in the rural areas in 2003 is covered under one of the social security institutions. 52 See ERF (2005) for an estimation of job loss of at least 80% of informal jobs in the case of enforcement of regulations.

69
labor-intensive sectors, the enterprises were forced to perform some of their activities informally in order to be able to compete.
Recent research on reducing informal employment suggests that “without reducing the large wedges between cost of labor to the employer and the net labor income received by workers, it is not possible to reduce informal employment without adverse effects on employment.” (ERF 2005:141). Among the OECD countries, Turkey has the heaviest tax and social security premiums on employee basis. Given that taxes and social security premiums are mostly paid by the employer, the cost of employing workers for the entrepreneurs is still high despite the real reduction in wages during the financial crisis. The complaints made about high costs of employment by almost all the entrepreneurs have a real basis. This fact as well explains why cutting employment is frequently used as a survival strategy.
Monthly wage bill paid to the workers increases with size of the enterprise (Table 6.84). The highest wage bill are incurred in the manufacturing sector indicating that in general the workers in the manufacturing sector are relatively more skilled and less in supply than in any other sector. In all sectors, except in some size categories of the construction sector, the wage bill in average is higher than the cost of legal minimum wage per worker paid by the entrepreneurs.53
Table 6.84: Monthly wage bill per worker*, 2001, current prices (million TL)
Size of enterprise Economic activity 1 2 3-5 6-9 10-49 Total Manufacturing - 182 206 308 490 385 Construction - 110 343 113 228 243 Trade - 139 200 261 243 219 Hotels-restaurants - 135 178 242 245 218 Other services - 175 185 172 288 240 Total - 148 201 270 350 277
Wage bill per worker = Total wage bill (Q253) / total number of workers (Q290 + Q295). See App. 3, Form III. Enterprise-entrepreneur questionnaire for the Qs.
53 The cost of minimum wage to the entrepreneur: 1.01.2001: 139.9 million TL/month. 1.07.2001: 146.9 million TL/month. 1.08.2001: 167.9 million TL/month.

70
Section 7: Policy recommendations
The survey findings suggest that there is much scope for action by the public and private institutions to develop a more supportive policy towards the MSEs. Mobilising the necessary political support for reforming MSEs is one of the most important strategic roles that the MSE policy makers should play. Therefore, developing a lively public-private sector dialogue and nurturing a common understanding as well as a framework of reference are essential for an effective complementary policy design and implementation.
The need for a macro plan
At present, there are not any macro plans in the public and private sector institutions that are capable of incorporating the policies devised to promote MSEs/SMEs into their long term strategic programs. The most important function of this kind of plan would be to determine the actual reason for assisting and supporting MSEs and thus defining the nature of services and financial support accordingly. After targets and objectives (it can also be read as priorities) are determined as such, then the definitions and forms of support can be shaped in terms of those objectives. Although the need to accelerate the process of integration into the EU put the formation of this sort of macro plans on the agenda, the efforts related to this issue are still limited mainly to adapting definitions of SMEs which are in line with those provided by the EU. The definitions/concepts of SMEs contained in the document entitled “Turkey’s Industrial Policy (Towards the EU Membership)”, approved by the High Board of Planning (YPK) on 30 September 2003, are expressed only in general terms. Although the document assigns an important role to the SMEs in the process of economic growth, employment, and income distribution, it does not specify the methods and means which should be deployed by the public and private bodies to achieve these objectives. At the same time, it is clear that such a macro plan should be collaborative in nature, including the state institutions, professional organizations, business associations, NGOs and the private sector.
The policies proposed for promoting the development of MSEs can be mainly summarized under the following two categories:
1. Policies aiming to establish and sustain an enabling environment in which MSEs can develop and expand their activities.
2. Policies aiming to enhance the capabilities and competence of entrepreneurs and the enterprises. 1. Policies Aiming to Establish and Sustain an Enabling Environment Entrepreneurial activities are affected adversely by macro-economic uncertainties and instabilities. Unstable macro-economic environment, high interest rates and unstable exchange rates have a direct impact on the creation, survival, productivity and competitiveness of MSEs. The establishment of “free-market” conditions does not automatically lead to favourable conditions for the MSEs. If surrounding conditions such as stability and sustained growth, access to markets, fair competition are not actively monitored considering the interest of MSEs, then it is difficult to expect the MSEs to play a significant role in enhancing growth and generating employment in the economy. An active monitoring of the economic conditions needs a complex set of institutions and behaviour patterns that only emerge slowly and requires active participation by governmental institutions.
The role of the institutions The government should make a serious effort to improve the regulatory environment of the MSEs. Although certain attempts are made by the government in this regard, still there is a long way to go to simplify legislation, regulations and adopt user-friendly administration documents in the ministries and other public agencies. Previously, the procedures to establish an enterprise comprised 19 stages. Recently, this is reduced to 3 stages and can be finalized in a one centre, which is the “Chamber of Commerce and Industry”. However, the number of documents required and the costs incurred to establish an enterprise is still very high. Easier and cheaper registration is the first step in drawing MSEs into formal arrangements.
Business support services provided by the public agencies or business associations reach only a very small fraction of the MSEs. One way to facilitate this would be to broaden the KOSGEB’s mandate to

71
make it the support agency for SMEs in all sectors of the economy, with the exception of agriculture. This can be done through an expanded presence and cooperative efforts with professional organizations and business associations.
At present, the relationship between MSE entrepreneurs and professional organizations and business associations to which they belong is limited. This is mainly due to the fact that the entrepreneurs do not trust these organizations and associations. Consequently the MSEs mostly rely on self-supporting and informal institutional arrangements. Therefore, the governing bodies of the professional organizations and business associations should take appropriate steps to strengthen their working relationships with the MSEs. They should try to facilitate the active participation of the MSEs in the processes of policy and decision making in these associations. This would enable the associations to identify the specific problems and needs of MSEs and act with mutual cooperation and trust.
It is also recognized that unfair competition stemming from informal business practices damage the performance of the MSEs. It is thus suggested that these professional organizations and business associations should take an active role in establishing sector-based regulations to monitor and minimize unfair competition and protect the MSEs.
Access to financial resources The banking system is unable to provide funds to support the MSEs. They often perceive lending to MSEs as a high cost and high risk activity. Public policies should aim at encouraging the financial sector to launch multiple and diverse sources of finance for the MSEs. Locally-owned banking institutions, such as credit cooperatives, tasked with serving local MSE interests, may be a better option for the provision of funding to MSEs than private banks, as is shown by the experiences of developed as well as developing countries.
Furthermore, the existing credit programmes specified for MSEs do not usually include specific features related to the different sectors of the economy. For example, using the same employment criteria for both capital-intensive and labor-intensive sectors leads to problems in defining the size of the enterprises. It follows that existing credit programmes should be revised to take into account the specific features of the MSEs in selecting target groups for funding.
The majority of the MSE entrepreneurs lack assets necessary for collateral requirements. Therefore, there is a need for a particular policy measure to help MSEs in overcoming the difficulties arising from the lack of collateral. Such a policy measure, if conceived and implemented properly, may well function as an effective guarantee scheme. Guarantee schemes operate on the principle of shared risk between the bank and the guarantee association, thereby significantly reduces the level of risk for the bank. But, the existing guarantee schemes in Turkey favour larger SMEs. Special guarantee schemes that target MSEs, particularly at their start-up period, are therefore required to bolster more effectively the creation of MSEs with better facilities and personnel.
Although interest rates have recently fallen in Turkey, still they are higher than most of its trading partners. High interest rates are one of the most important factors keeping entrepreneurs away from bank loans. This fact, in turn, restrains the growth and performance of the MSEs.
Inflexible repayment conditions, which is a distinguishing feature of formal credits in contrast to informal credits, have a direct effect on the decisions and choices made by the entrepreneurs. Delays in repayment dates may occur as a result of the irregular cash flow in the enterprise. The irregular character of the MSEs stems from their limited market options as well as their high vulnerability to macro-economic fluctuations. Consequently, entrepreneurs usually shy away from borrowing loans and signing a regular repayment schedule in order to receive credit.
The cumbersome bureaucratic processes in the state institutions and public or private banks prepared to advance credits and similar financial services to the MSEs, can not be easily accessed by MSEs without a regular and professional management. Public and private institutions should make an effort to simplify the procedures used for applying credits and funding.
Leasing and venture capital were rarely used as a form of financing investments in MSEs. Information about advantages of leasing and venture capital should be disseminated to MSE entrepreneurs.

72
Tax and social security premiums Among the OECD countries, Turkey has the heaviest tax and social security premiums on employee basis. Given that taxes and social security premiums are mostly paid by the employer, the cost of employing workers on formal basis for the entrepreneurs is still high. Reductions in tax and social security payments for employees would encourage formal employment.
High energy costs High energy costs are another impediment. They stifle the competitiveness of MSE. This problem has serious adverse effects and should be addressed accordingly.
2. Policies Aiming to Enhance the Capabilities and Competence of the Entrepreneur and the Enterprise Policy interventions should recognize the fact that MSEs are far from being homogenous. They exhibit distinct variations in size, economic activity, region, etc. Thus, specialized programmes should be established taking into account the specificities of the MSEs. This is essential if they are to respond to their specific needs effectively.
Most of the MSEs do not grow. Thus, policies for promoting MSEs should not only focus on enhancing growth, but should also pay attention to developing the MSEs in terms of both higher efficiency and decent work conditions. At present, in most of the MSEs, higher returns is maintained by working very long hours (11.4 hours per day and 6.2 days per week).
Trust building Over years, the continuation of the adverse practices resulted in the accumulation of mistrust on the part of the entrepreneurs. They tend not to trust the aims and intentions of public institutions, professional organizations and business associations. This lack of confidence continues to affect the performance of the MSEs. On the other hand, the public institutions attitude towards MSEs also involve mistrust to a certain extent due to their participation in informal activities and relations. A trust building process should be initiated between MSEs and public and professional institutions.
Education and training Most of the entrepreneurs lack entrepreneurial skills. Very few public and private organizations provides training for entrepreneurs. Moreover, it seems that the training given is not fully compatible with the needs of the MSEs, particularly for those in the manufacturing sector. Appropriate training programmes that meet the needs of the MSE entrepreneurs should be developed. In particular, specific needs of women entrepreneurs should be addressed. Training programs should be launched to introduce the EU norms and regulations to entrepreneurs. This concerns the training of the apprentices and workers, as the existing training programmes are inadequate. They should be expanded and spread with an emphasis on the needs of the MSEs.
In many cases, lack of access to formal financial sources is a result of deficiencies in management and human capital on the part of MSEs and their entrepreneurs. It is thus necessary for public policy processes to aim at raising the capacity of the enterprise by providing training and counselling.
The Small and Medium Industry Development Organization (KOSGEB) provides the most extensive support to SMEs in the industrial sector. It has been undergoing a restructuring process since 2003 aiming at “adjusting to the process of reducing the role of the state, realization of decentralization, and ensuring SMEs adjustment to EU norms and regulations”. In this restructuring process, KOSGEB is seeking to reach greater numbers and broader classes of SMEs. In this framework, KOSGEB should also pay a particular attention to the needs of the micro enterprises and smaller SMEs and outline the methods which would enable them to overcome the constraints they encounter continuously.
Geographical differences Geographical differences and inequalities have direct effects on the performance of the enterprises. Support programmes and services for the MSEs should be diversified taking into account these differences.

73
Problems of micro enterprises Micro enterprises in the manufacturing sector, with 1-5 persons engaged, create relatively lower value-added than similar size MSEs in other sectors. Special attention should be paid to the production and marketing problems of the micro enterprises in the manufacturing sector.
Clustering and networking Most of the entrepreneurs do not appreciate the benefits of clustering and networking. Counselling and support services given by public agencies and particularly local professional organizations and business associations, should therefore pay more attention to informing the entrepreneurs about the advantages of clustering and networking.
Sub-contracting relations Sub-contracting relations are considerably weak among the MSEs, particularly among the smaller ones. They are less likely to possess the technological and/or management capabilities required for sub-contracting activities. The technological capacity of MSEs needs strengthening.
On the other hand, our findings indicate that not all sub-contracting relations are beneficial to all parties. This was particularly the case during the economic crisis when some enterprises, with better market connections, forced other enterprises facing weak demand to reduce prices to a level which was sometimes lower than their cost of production and thus pushing them into bankruptcy. The implications of weak sub-contracting practices and unfair trade for the survival and development of the MSE’s should be addressed in their appropriate economic contexts.
Exporting The number of exporting MSEs is extremely low. They do not have the knowledge, experience or infrastructure required for exporting. In addition to training and counselling services on exporting, the creation of specialized exporting enterprises capable of mediating between export markets and MSEs could be an effective way to promote an export culture among the MSEs. MSEs with export potential should be informed about foreign markets as well as foreign enterprises to enhance the possibility of an active cooperation.
Women entrepreneurs Women comprise only 6.1% of the MSE entrepreneurs in Turkey. Women entrepreneurs face constraints at every stage of their business. Thus, specific support mechanisms such as training and counselling services and special financial opportunities are essential for promoting women in entrepreneurship. On the other hand, male-dominated culture in the society as well as in the organizational culture and administrative policies both in the public and private organizations and institutions, often affect women’s ability to participate in entrepreneurial activities adversely. Thus, It is necessary to initiate a process of organisational overhaul in those institutions restructuring and redesigning their policies so as to respond to the needs of their women members and to open their doors to potential women entrepreneurs.
Young entrepreneurs Young entrepreneurs are more inclined to risky business and innovations, but in view of the existing corruption and unstable economic circumstances, have less confidence in the future . They thus need more active support and specific programmes with a scope broad enough to take into consideration their specific feature and needs. These measures are crucial to enhance the significant degree of willingness to engage in risk taking.
In conclusion, this study proposes that the design and implementation of effective policies and programs require establishment and improvement of institutions dedicated to nurturing and supporting the MSEs. The governmental agencies and public organisations should play a leading role in this process. Their active support is believed to be crucial for the success of the MSEs in Turkey. This proposition, along with a number of policy proposals indicated in this study, point to the way forward for the MSEs in Turkey.

74
References Aktan, O. (1998), “Customs Union: Impact on Small and Medium Sized Enterprises,” in Turkish
Small and Medium Sized Enterprises in the Integration process of Turkey with the European Union: Implications and Consequences, edited by Y. Tekelioglu, Friedrich Neumann Foundation and Akdeniz University Faculty of Economics and Administrative Sciences, Ankara.
Aktar, A. (1990), Kapitalizm, Az Gelişmişlik ve Türkiye’de Küçük Sanayi (Capitalism, Underdevelopment and Small Industry in Turkey), Afa, İstanbul.
Ayata, S. (1987), Kapitalizm ve Küçük Üreticilik-Türkiye'de Halı Dokumacılığı, Yurt Yayınları, Ankara.
Becchetti, L., and Trovato, G. (2002), ”The Determinants of Growth for Small and Medium Sized Firms. The Role of the Availability of External Finance”, Small Business Economics, Vol. 19, pp.291-306.
Celebi, N. (1997), Turizm Sektorundeki Kucuk Isyeri Orgutlerinde Kadin Girisimciler, (Women Entrepreneurs of Small Enterprises in the Tourism Sector), Directorate General on the Status and Problems of Women, Ankara.
Celebi, N., B. Tokuroglu and A. Baran (1993), Bagimsiz Isyeri Sahibi Kadinlarin Aile ve Is Iliskileri (Family and Business Relations of Women Owning Autonomous Enterprises), T.C. Basbakanlik Kadin ve Sosyal Hizmetler Mustesarligi Yayinlari. No.76, Ankara.
Cinar, E. M., M. Kaytaz and G. Evcimen (1987), “A Case Study on the Growth Potential of Small Scale Manufacturing Enterprises in Bursa, Turkey”, METU Studies in Development, Vol.24, No.2, pp.123-146.
Cinar, E. M., G. Evcimen and M. Kaytaz (1988), “The Present Day Status of Small Scale Industries (Sanatkar) in Bursa, Turkey”, International Journal of Middle Eastern Studies, Vol.20, pp.287-301.
DGSPW (Directorate General on the Status and Problems of Women) (1993), Proceedings of the Plenary Session on Encouraging and Supporting Women Entrepreneurship, General Directorate for the Status and Problems of Women, Ankara.
DGSPW (Directorate General on the Status and Problems of Women) (1996), Supporting Women-Owned Businesses in Turkey: A Discussion of Needs, Problems, Opportunities, and Strategies, by Development Alternatives Inc. and the Strategic Research Foundation, Ankara.
ERF (2005) Turkey Country Profile. The Road Ahead for Turkey, ERF, Cairo. Erzan, R. and A. Filiztekin (1997), “Competitiveness of Turkish SMSEs in the Customs Union”,
European Economic Review, Vol.41, pp.881-892. Erzan, R. and A. Filiztekin (2005), “Does Size Matter in Growth, Productivity, Employment, and
Vulnerability/Flexibility in Turkish Manufacturing?” Turkish Studies, Vol.6, No.1, pp.113-126. Evans, D. (1987), “Tests of Alternative Theories of Firm Growth”, Journal of Political Economy,
Vol. 95, No.4, pp.657-674. Evcimen, G., M. Kaytaz and E. M. Cinar (1991), “Subcontracting, Growth and Capital Accumulation
in Small-Scale Firms in the Textile Industry in Turkey”, The Journal of Development Studies, Vol.28, No.1, pp.130-149.
Eyüboğlu, A., Ş. Özar ve H. Tufan Tanrıöver (2000), Kentlerde Kadınların İş Yaşamına Katılım Sorunlarının Sosyo-Ekonomik ve Kültürel Boyutları (Socio-economic and Cultural Barriers Inhibiting Female Labor Force Participation), T.C. Başbakanlık Kadının Statüsü ve Sorunları Genel Müdürlüğü, Ankara.
Greene, W. H. (2003), Econometric Analysis, New Jersey: Prentice Hall. Johnson, P., Conway, C., and Kattuman, P. (1999), “Small Business Growth in the Short Run”, Small
Business Economics. Vol. 12, pp. 103-112. Johnston, J., and Dinardo, J. (eds. 4). (1997), Econometric Methods, McGraw-Hill.

75
Kaytaz, M. (1995), “The Development and Nature of Small and Medium-Scale Manufacturing Enterprises in Turkey” in Turkey: Political, Social and Economic Challenges in the 1990s, edited by Cigdem Balim et al., E.J. Brill, Leiden.
KOSGEB (2000), Kadin Girisimcilerin Sosyo-Kulturel ve Ekonomik Profili. Ankara Ornegi. (Socio-Cultural and Economic Profile of Women Entrepreneurs - Ankara as a Case) by H. Ufuk and O. Ozgen, Ankara.
KOSGEB (2002), EU CC BEST (Business Environment Simplification Task Force), Turkey Report, Ankara. http://europa.eu.int/comm/enterprise/enlargement/index.htm
Kuruuzum, O. (1998), “SMEs in Turkey: A Structural Evaluation,” in Turkish Small and Medium Sized Enterprises in the Integration process of Turkey with the European Union: Implications and Consequences, edited by Yavuz Tekelioglu, Friedrich Neumann Foundation and Akdeniz University Faculty of Economics and Administrative Sciences, Ankara.
Liedholm, C. (2002), “Small Firm Dynamics: Evidence from Africa and Latin America”, Small Business Economics, Vol.18, pp.227-242.
Liedholm, C. and D. C. Mead (1999), Small Enterprises and Economic Development: The Dynamics of Micro and Small enterprises, Routledge, London.
Mead, D. C. and C. Liedholm (1998), “The Dynamics of Micro and Small Enterprises in Developing Countries,” World Development, Vol.26, No.1, pp. 61-74.
Meyer, G. (2000), Survival of Small-scale Manufacturing in Cairo during Structural Adjustment – Results from a Long-term Study, mimeo.
Otero, M. (1994), “The Role of Governments and Private Institutions in Addressing the Informal Sector in Latin America” in Contrapunto: The Informal Sector Debate in Latin America, edited by C. A. Rakowski, SUNY Press, Albany, pp. 177-97.
OECD (1998), Women Entrepreneurs in Small and Medium Enterprises, OECD, Paris. OECD (2004), Small and Medium-Size Enterprises in Turkey. Issues and Policies, OECD, Paris,
www.oecd.org. Ozar, S. (2005), Women’s Entrepreneurship in the GAP Region, GAP Entrepreneur Support and
Guidance Centres Publications, Ankara, 2nd edition. Ozcan, G. B. (1995), Small Firms and Local Economic Development, Avebury, Aldershot. case, R. (1997), “The Role of Small Businesses in the Economic Transformation of Eastern Europe:
Real but Relatively Unimportant?” International Small Business Journal, Vol.16, No.1, pp.13-21.
Schmitz, H. 2004, "Globalized Localities: Introduction," in Local Enterprises in the Global Economy. Issues of Governance and Upgrading, edited by Hubert Schmitz, Edward Elgar, Cheltenham, UK, pp. 1-19.
Taymaz, E. (1997), Small and Medium-Sized Industry in Turkey, SIS, Ankara. Taymaz, E. and Y. Kilicaslan (2000), “Sub-contracting: A Model for Industrial Development”, paper
prepared for the ERF 7th Annual Conference, Amman, October 26-29 October, 2000. TURKSTAT (2002), General Census of Industry and Business Establishments, www.die.gov.tr TURKSTAT. Household Labour Force Surveys, various issues, www.die.gov.tr. TUSIAD (2004), Turkiye’de Isgucu Piyasasinin Kurumsal Yapisi ve Issizlik, No. TUSIAD-T/2004-
11/381, Istanbul. White, H. (1980), “A Heteroskedasticity – Consistent Covariance Matrix Estimator and a Direct Test
for Heteroskedasticity”, Econometrica, Vol.48, pp.817-832. World Bank (2005), Turkey Labor Market Study, World Bank, Washington, DC.

76
List of abbreviations ABIGEM European Union Business Development Centres
CU Customs Union
EU European Union
GAP-GIDEM South East Anatolia Project Entrepreneur Support and Guidance Centres
ISO Istanbul Chamber of Industry
KOSGEB Small and Medium Sized Industry Development Organization
KUGEM Small Enterprise Development Centre
MEKSA Vocational Training and Small Industries Support Foundation
MENA Middle East and North Africa
MSE Micro and Small Enterprise
OECD Organization for Economic Co-operation and Development
SME Small and medium sized enterprise
SPO State Planning Organization
TESK Turkish Confederation of Tradesmen and Craftsmen
TL Turkish Lira
TOBB The Union of Chambers and Commodity Exchanges of Turkey
TOSYÖV Turkish Foundation for Small and Medium Enterprises
TURKSTAT Turkish Statistical Institute
UNDP United Nations Development Program

77
Appendix 1: Definition of SMEs in the EU*
On the 6th of May 2003, the Commission adopted a new Recommendation 2003/361/EC regarding its definition of SMEs (replacing Recommendation 96/280/EC). The revision increased legal certainty, while reducing possibilities of its circumvention to ensure that only enterprises facing the specific handicaps of SMEs would be considered as SMEs, particularly with regard to state aid, Structural Funds or Research and Development (R&D) Programs. The Recommendation provides a definition of small and medium sized enterprises as follows:
- Micro enterprises: employ fewer than 10 persons and have either an annual turnover not exceeding EUR 2 million, or an annual balance-sheet total not exceeding EUR 2 million;
- Small enterprises: employ fewer than 50 persons and have either an annual turnover not exceeding EUR 10 million, or an annual balance-sheet total not exceeding EUR 10 million;
- Medium-sized enterprises: employ fewer than 250 persons and have either an annual turnover not exceeding EUR 50 million, or an annual balance-sheet total not exceeding EUR 43 million.
Various rules on enterprise independence exist, whereby SMEs that are controlled by larger enterprises should not qualify for aid directed at independent SMEs.
This Recommendation concerns the definition of micro, small and medium-sized enterprises in Community policies applied within the European Economic Area and is addressed to the Member States, the European Investment Bank and the European Investment Fund. It will be applied as of 1 January 2005. *Source: http://europa.eu.int/comm/enterprise/enterprise_policy/sme_definition/index_en.htm.

78
Appendix 2: List of Concepts and their Definitions Used in the Survey
Cluster An essentially spontaneous, geographically-proximate collection of enterprise in a related set of activities with significant inter-firm relations.
Credit Firm A private firm specialising in providing credit.
Entrepreneur Principal owner/manager – the person who makes the main decisions related to the enterprise.
Establishment Fixed structure, or part of a structure, used regularly for economic activity.
Formal Loan A legally binding contractual agreement for providing credit.
Formal Training Medium or long-term training in an educational institution (school or institute).
Household A group of individuals, not necessarily related by blood or marriage, who share food and lodging.
Household Head The household member who takes the main financial decisions in the household as recognised by members of the household.
Illegal Activity Activity which constitutes a criminal offence under the laws of the country.
Industrial Estate (zone)
A (government) regulated, geographically-proximate collection of enterprises in a related set of activities.
Mobile Vendor A trader constantly on the move.
Partner An individual or a firm that shares decision-making with the entrepreneur.
Regular Accounts At minimum, a regular record of revenues and expenditure.
Start-Up Time The date of establishing the enterprise in the current location and same activity.
Subsidiary A business outfit belonging to the same legal entity and managed by the same entrepreneur. The enterprise comprises all subsidiaries.
Working Capital Funds needed to meet current expenditures of the enterprise.
Simple Partnership
The partnership is not recognized as an entity by the trade code. Two or more people establish a partnership usually with very small capital. Partners keep their books and pay their taxes separately.
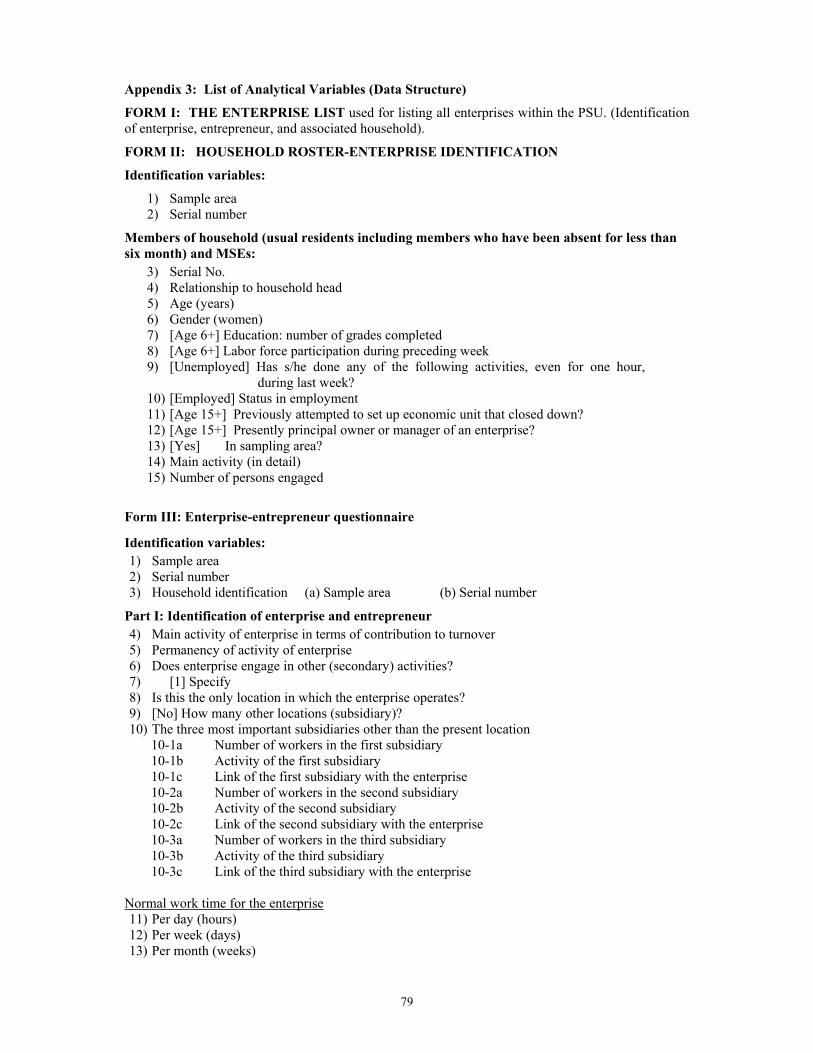
79
Appendix 3: List of Analytical Variables (Data Structure)
FORM I: THE ENTERPRISE LIST used for listing all enterprises within the PSU. (Identification of enterprise, entrepreneur, and associated household).
FORM II: HOUSEHOLD ROSTER-ENTERPRISE IDENTIFICATION
Identification variables:
1) Sample area 2) Serial number
Members of household (usual residents including members who have been absent for less than six month) and MSEs:
3) Serial No. 4) Relationship to household head 5) Age (years) 6) Gender (women) 7) [Age 6+] Education: number of grades completed 8) [Age 6+] Labor force participation during preceding week 9) [Unemployed] Has s/he done any of the following activities, even for one hour,
during last week? 10) [Employed] Status in employment 11) [Age 15+] Previously attempted to set up economic unit that closed down? 12) [Age 15+] Presently principal owner or manager of an enterprise? 13) [Yes] In sampling area? 14) Main activity (in detail) 15) Number of persons engaged
Form III: Enterprise-entrepreneur questionnaire
Identification variables: 1) Sample area 2) Serial number 3) Household identification (a) Sample area (b) Serial number
Part I: Identification of enterprise and entrepreneur 4) Main activity of enterprise in terms of contribution to turnover 5) Permanency of activity of enterprise 6) Does enterprise engage in other (secondary) activities? 7) [1] Specify 8) Is this the only location in which the enterprise operates? 9) [No] How many other locations (subsidiary)? 10) The three most important subsidiaries other than the present location
10-1a Number of workers in the first subsidiary 10-1b Activity of the first subsidiary 10-1c Link of the first subsidiary with the enterprise 10-2a Number of workers in the second subsidiary 10-2b Activity of the second subsidiary 10-2c Link of the second subsidiary with the enterprise 10-3a Number of workers in the third subsidiary 10-3b Activity of the third subsidiary 10-3c Link of the third subsidiary with the enterprise
Normal work time for the enterprise 11) Per day (hours) 12) Per week (days) 13) Per month (weeks)

80
14) Per year (months) 15) Sector of ownership 16) Sex of principal owner/manager
Part II: Characteristics of the Entrepreneur and Enterprise
II-a: Characteristics of the Entrepreneur 17) Owner or manager? 18) Is this your sole economic activity? 19) [No] What other economic activity do you engage in? 20) Age (in years) 21) Age at starting first job (in years) 22) Where born? 23) [In the country] Urban/Rural 24) Nationality 25) Marital status 26) [Ever married] Number of children (less than 18 years of age) 27) Educational attainment (number of grades completed in all types of formal education) 28) Had formal technical or vocational education (related to present activity)? 29) [Yes] For how long (in years)? 30) Training-apprenticeship experience (related to present activity)? 31) [Yes] For how long (in month)? 32) In what type of enterprise was the training provided?
Employment Characteristics Prior to Present Position (last job)
33) Labor force participation 34) [Employed] Status in employment 35) Occupation 36) Sector of ownership 37) In establishment? 38) Economic activity 39) Geographic location 40) Main reason for changing last job?
Present Activity:
41) Status in employment 42) Main reason for choosing present job? 43) How long have been in present job (in years) ?
Place of Work:
44) Works at home? 45) [No] Distance from home (travel time in minutes)? 46) Description of the place of work 47) Ownership of the place of work 48) Does owner have partners? 49) [Yes] How many? 50) Who are they?
50-1 Family and relatives 50-2 Birth place friends 50-3 Other friends 50-4 Neighbors 50-5 Business colleagues 50-6 Domestic firms 50-7 Foreign firms 50-8 Other
51) Belongs to a business association?
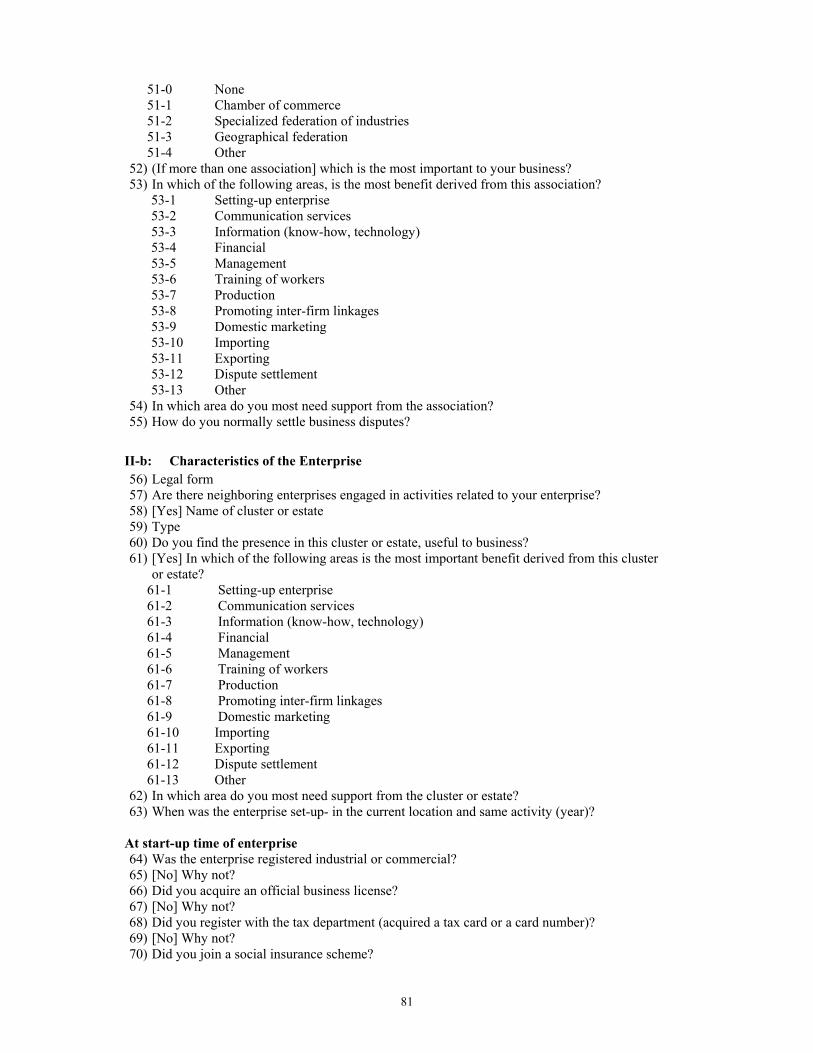
81
51-0 None 51-1 Chamber of commerce 51-2 Specialized federation of industries 51-3 Geographical federation 51-4 Other
52) (If more than one association] which is the most important to your business? 53) In which of the following areas, is the most benefit derived from this association?
53-1 Setting-up enterprise 53-2 Communication services 53-3 Information (know-how, technology) 53-4 Financial 53-5 Management 53-6 Training of workers 53-7 Production 53-8 Promoting inter-firm linkages 53-9 Domestic marketing 53-10 Importing 53-11 Exporting 53-12 Dispute settlement 53-13 Other
54) In which area do you most need support from the association? 55) How do you normally settle business disputes?
II-b: Characteristics of the Enterprise 56) Legal form 57) Are there neighboring enterprises engaged in activities related to your enterprise? 58) [Yes] Name of cluster or estate 59) Type 60) Do you find the presence in this cluster or estate, useful to business? 61) [Yes] In which of the following areas is the most important benefit derived from this cluster
or estate? 61-1 Setting-up enterprise 61-2 Communication services 61-3 Information (know-how, technology) 61-4 Financial 61-5 Management 61-6 Training of workers 61-7 Production 61-8 Promoting inter-firm linkages 61-9 Domestic marketing 61-10 Importing 61-11 Exporting 61-12 Dispute settlement 61-13 Other
62) In which area do you most need support from the cluster or estate? 63) When was the enterprise set-up- in the current location and same activity (year)?
At start-up time of enterprise 64) Was the enterprise registered industrial or commercial? 65) [No] Why not? 66) Did you acquire an official business license? 67) [No] Why not? 68) Did you register with the tax department (acquired a tax card or a card number)? 69) [No] Why not? 70) Did you join a social insurance scheme?
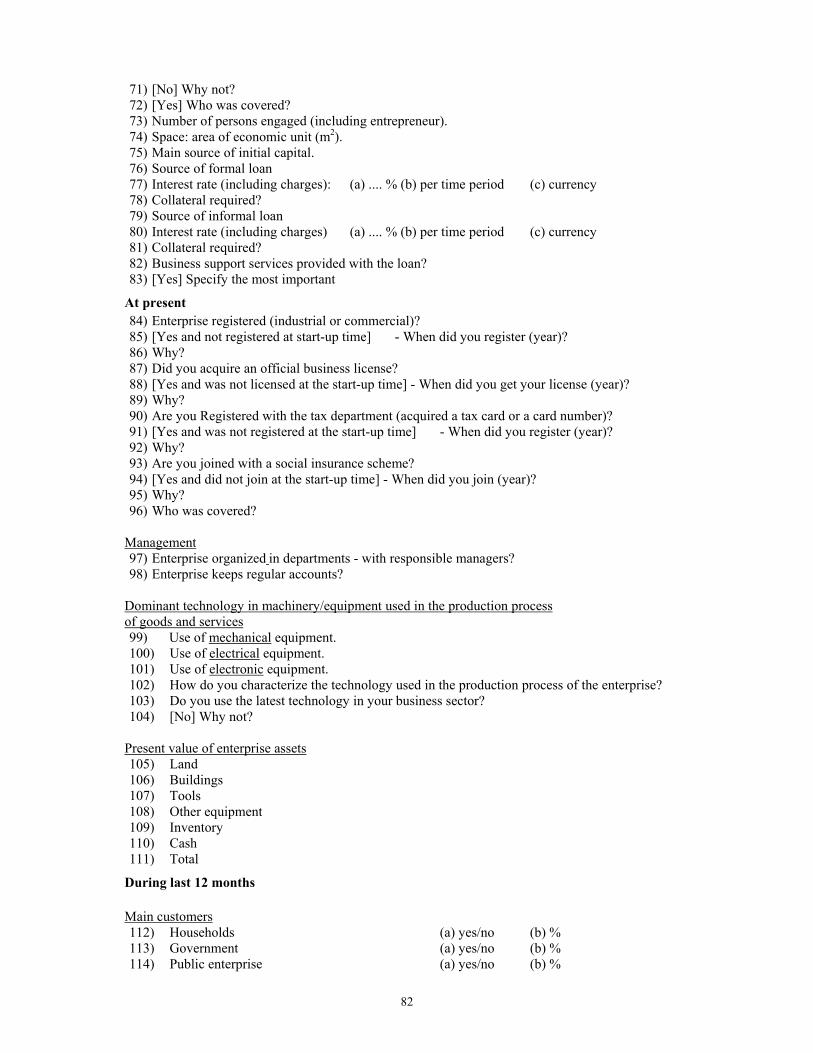
82
71) [No] Why not? 72) [Yes] Who was covered? 73) Number of persons engaged (including entrepreneur). 74) Space: area of economic unit (m2). 75) Main source of initial capital. 76) Source of formal loan 77) Interest rate (including charges): (a) .... % (b) per time period (c) currency 78) Collateral required? 79) Source of informal loan 80) Interest rate (including charges) (a) .... % (b) per time period (c) currency 81) Collateral required? 82) Business support services provided with the loan? 83) [Yes] Specify the most important
At present 84) Enterprise registered (industrial or commercial)? 85) [Yes and not registered at start-up time] - When did you register (year)? 86) Why? 87) Did you acquire an official business license? 88) [Yes and was not licensed at the start-up time] - When did you get your license (year)? 89) Why? 90) Are you Registered with the tax department (acquired a tax card or a card number)? 91) [Yes and was not registered at the start-up time] - When did you register (year)? 92) Why? 93) Are you joined with a social insurance scheme? 94) [Yes and did not join at the start-up time] - When did you join (year)? 95) Why? 96) Who was covered?
Management 97) Enterprise organized in departments - with responsible managers? 98) Enterprise keeps regular accounts?
Dominant technology in machinery/equipment used in the production process of goods and services 99) Use of mechanical equipment. 100) Use of electrical equipment. 101) Use of electronic equipment. 102) How do you characterize the technology used in the production process of the enterprise? 103) Do you use the latest technology in your business sector? 104) [No] Why not?
Present value of enterprise assets 105) Land 106) Buildings 107) Tools 108) Other equipment 109) Inventory 110) Cash 111) Total
During last 12 months Main customers 112) Households (a) yes/no (b) % 113) Government (a) yes/no (b) % 114) Public enterprise (a) yes/no (b) %

83
115) Domestic NGO (a) yes/no (b) % 116) Foreign NGO (a) yes/no (b) % 117) Co-operative (a) yes/no (b) % 118) Home-based workers (a) yes/no (b) % 119) Micro (<10 persons) private sector enterprises (a) yes/no (b) % 120) Small (<50 persons) private sector enterprises (a) yes/no (b) % 121) Large (50+ persons) private sector enterprises (a) yes/no (b) % 122) Foreign firms (a) yes/no (b) % 123) Other (a) yes/no (b) %
Scope of market 124) Local (a) yes/no (b) % 125) Regional (a) yes/no (b) % 126) National (a) yes/no (b) % 127) International (a) yes/no (b) %
Enterprise had access to financial services 128) Credit? 129) [Yes] Source 130) Satisfied? 131) Savings? 132) [Yes] Means 133) Satisfied? 134) Leasing? 135) [Yes] Source 136) Satisfied? 137) Venture capital? 138) [Yes] Source 139) Satisfied?
Enterprise had access to other business support services 140) Information (know-how technology)? 141) [Yes] Source 142) Satisfied? 143) Management? 144) [Yes] Source 145) Satisfied? 146) Training of workers? 147) [Yes] Source 148) Satisfied? 149) Production? 150) [Yes] Source 151) Satisfied? 152) Promoting inter-firm linkages? 153) [Yes] Source 154) Satisfied? 155) Domestic marketing? 156) [Yes] Source 157) Satisfied? 158) Exporting? 159) [Yes] Source 160) Satisfied?
Source of working capital during the last three months (value of each source) 161) Own savings (excluding remittances) 162) Liquidation of assets

84
163) Suppliers 164) Contractors 165) Formal loan* 166) Informal loan** 167) Own remittances 168) Other remittances 169) Customers 170) Other 171) Total 172) *[Formal loan] Source of formal loan 173) Interest rate (including charges) (a) .... % (b) per time period (c) currency 174) Collateral required? 175) **[Informal loan] Source of informal loan 176) Interest rate (including charges) (a) .... % (b) per time period (c) currency 177) Collateral required? 178) Business support services provided? 179) [Yes], Specify the most important
Linkages with other enterprises 180) Had links with other enterprises? 181) [Yes], With how many approximately? 182) Type of linkages
182-1 Sub-contracting to other enterprises 182-2 Sub-contracting by other enterprises 182-3 Collaboration in bidding for contracts 182-4 Collaboration in utilizing equipment 182-5 Collaboration in utilizing advanced equipment 182-6 Domestic marketing 182-7 Exporting 182-8 Other
[Sub-contracting to other enterprises] 183) Percentage of purchases 184) Type of most important linked enterprises 185) Subject to a contract 186) Typical activity of most important linked enterprises 187) Is this enterprise in same cluster or estate?
[Sub-contracting by other enterprises] 188) Percentage of turnover (sales) 189) Type of most important linked enterprises 190) Subject to a contract 191) Percentage of sub-contracted goods exported 192) Typical activity of most important linked enterprises 193) Is this enterprise in same cluster-estate?
Constraints to business activity
Infrastructure 194-a Access to water
194-b [Yes], Adequate? 195-a Access to electricity
195-b [Yes], Adequate? 196-a Access to telephone
196-b [Yes], Adequate? 197-a Access to sewage
197-b [Yes], Adequate?

85
198-a Access to roads 198-b [Yes], Adequate?
199-a Access to transportation for workers 199-b [Yes], Adequate? 200-a Access to transportation for goods 200-b [Yes], Adequate?
Social facilities
201-a Access to day care centers 201-b [Yes], Adequate?
Constraint (severity)
202) Securing initial capital 203) Licensing and registration procedures 204) Labor law 205) Labor inspection 206) Labor cost 207) Meeting environmental requirements 208) Finding qualified workers 209) Retaining qualified workers 210) Availability of raw materials 211) Cost of raw materials
212-a Unutilized capacity (average during the last 12 months) 212-b Percentage 213) Low demand for output 214) Strong domestic competition from micro enterprises (<10) 215) Strong domestic competition from small enterprises (<50) 216) Strong domestic competition from large enterprises (50+) 217) Strong competition from imports 218) Financial services 219) Other business support services 220) Profitability 221) Tax rates 222) Custom duties 223) Tax administration 224) Other 225) Financial services most needed 226) Other business support services most needed 227) Three most important suggestions to improve business
227-1 First suggestion 227-2 Second suggestion 227-3 Third suggestion
Problems specific to women entrepreneurs (Both men and women entrepreneurs were asked) 228) Do you know of any woman entrepreneur in this type of activity? 229) [Yes], Do women entrepreneurs have certain advantages in this type of activity? 230) [Yes], What is the most important advantage? 231) Do women entrepreneurs face special problems in this type of activity?
[Yes], In what areas? 232) Problems in setting up enterprise 233) Problems in hiring workers 234) Problems in managing business 235) Problems in marketing 236) Problems in benefiting from the financial services
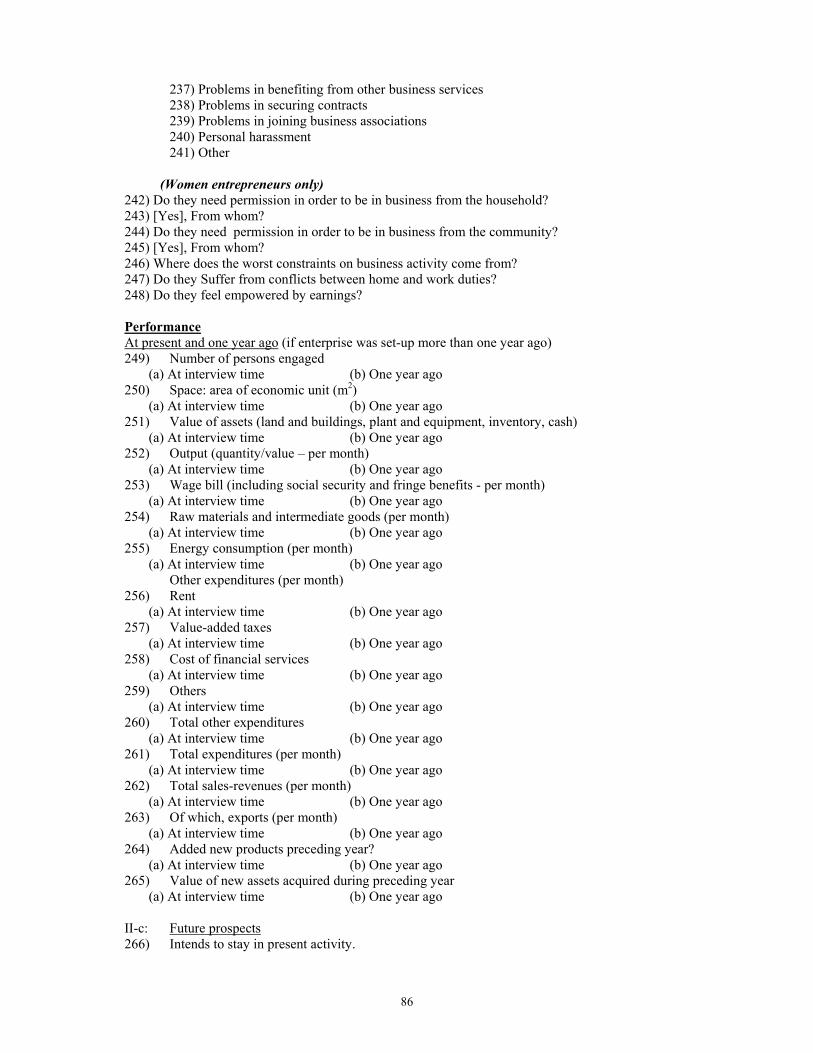
86
237) Problems in benefiting from other business services 238) Problems in securing contracts 239) Problems in joining business associations 240) Personal harassment 241) Other
(Women entrepreneurs only) 242) Do they need permission in order to be in business from the household? 243) [Yes], From whom? 244) Do they need permission in order to be in business from the community? 245) [Yes], From whom? 246) Where does the worst constraints on business activity come from? 247) Do they Suffer from conflicts between home and work duties? 248) Do they feel empowered by earnings?
Performance At present and one year ago (if enterprise was set-up more than one year ago) 249) Number of persons engaged
(a) At interview time (b) One year ago 250) Space: area of economic unit (m2)
(a) At interview time (b) One year ago 251) Value of assets (land and buildings, plant and equipment, inventory, cash)
(a) At interview time (b) One year ago 252) Output (quantity/value – per month)
(a) At interview time (b) One year ago 253) Wage bill (including social security and fringe benefits - per month)
(a) At interview time (b) One year ago 254) Raw materials and intermediate goods (per month)
(a) At interview time (b) One year ago 255) Energy consumption (per month)
(a) At interview time (b) One year ago Other expenditures (per month) 256) Rent
(a) At interview time (b) One year ago 257) Value-added taxes
(a) At interview time (b) One year ago 258) Cost of financial services
(a) At interview time (b) One year ago 259) Others
(a) At interview time (b) One year ago 260) Total other expenditures
(a) At interview time (b) One year ago 261) Total expenditures (per month)
(a) At interview time (b) One year ago 262) Total sales-revenues (per month)
(a) At interview time (b) One year ago 263) Of which, exports (per month)
(a) At interview time (b) One year ago 264) Added new products preceding year?
(a) At interview time (b) One year ago 265) Value of new assets acquired during preceding year
(a) At interview time (b) One year ago II-c: Future prospects 266) Intends to stay in present activity.

87
Expectations for the future (during next year) 267) Employment 268) Area of economic unit (m2) 269) Output 270) Assets (land, buildings, equipment) 271) Acquisition of modern technology 272) Revenues 273) Domestic sales 274) Exports 275) Adding new products Part III: Section on workers
Work force Age-sex structure of employment 276) Number of workers (<15) (a) Female (b) Male 277) Number of workers (15-24) (a) Female (b) Male 278) Number of workers (25-59) (a) Female (b) Male 279) Number of workers (60+) (a) Female (b) Male 280) Total number of workers (a) Female (b) Male Permanency of employment 281) Number of permanent workers (a) Female (b) Male 282) Number of temporary workers (a) Female (b) Male 283) Number of casual workers (a) Female (b) Male Nationality composition of employment 284) Number of national workers (a) Female (b) Male 285) Number of non-national workers (a) Female (b) Male
Skill structure and wage rate (female workers) 286) Skilled (a) Number (b) Wage rate (c) Time period 287) Semi-skilled (a) Number (b) Wage rate (c) Time period 288) Unskilled (a) Number (b) Wage rate (c) Time period 289) Apprentices (a) Number (b) Wage rate (c) Time period 290) All female workers (a) Number (b) Wage rate (c) Time period
Skill structure and wage rate (male workers) 291) Skilled (a) Number (b) Wage rate (c) Time period 292) Semi-skilled (a) Number (b) Wage rate (c) Time period 293) Unskilled (a) Number (b) Wage rate (c) Time period 294) Apprentices (a) Number (b) Wage rate (c) Time period 295) All male workers (a) Number (b) Wage rate (c) Time period
Most important recruitment criterion 296-a For skilled workers 296-b For unskilled workers
Workers related to entrepreneur 297) Number of workers related to entrepreneur 298) Number of workers not related to entrepreneur 299) Total number of workers Workers had training-apprenticeship experience (related to present activity) 300) Number of workers who had training-apprenticeship experience 301) Number of workers who did not have training-apprenticeship experience

88
Workers have written contract 302) Number of workers who have written contract 303) Number of workers who do not have written contract
Availability of social security provisions for workers 304) Number of workers for whom social security provisions are available 305) Number of workers for whom social security provisions are not available
Availability of health care provisions for workers 306) Number of workers for whom health care provisions are available 307) Number of workers for whom health care provisions are not available
Workers have paid vacations 308) Number of workers who have paid vacations 309) Number of workers who do not have paid vacations
Fringe benefits available to workers 310) Food (a) Available? (b) Total cost during last month 311) Lodging (a) Available? (b) Total cost during last month 312) Transport (a) Available? (b) Total cost during last month 313) Clothes (a) Available? (b) Total cost during last month 314) Allowance for children's education (a) Available? (b) Total cost during last month 315) Cash payments on special occasions (a) Available? (b) Total cost during last month 316) Other (a) Available? (b) Total cost during last month
Work environment for workers
317) Safe 318) Comfortable 319) Accidents likely to happen 320) [Yes], How often accidents happen? 321) Accidents lead to injury 322) Adequacy of first aid arrangements adequate Form iv: Household questionnaire
A. Member’s data file Identification variables 1- Sample area 2- Serial number 3- Enterprise identification (a) Sample area (b) Serial number Part I: Previous attempts by household members to set-up enterprises that closed down in reverse chronological order 4- Serial No. of member in household roster 5- Relationship to household head 6- Main activity 7- When started? (Year) 8- When closed down? (Year) 9- Reasons for closing down 10- Number of workers when closed down

89
B. Household data file
Serial in Household Questionnaire
Identification variables 1-Sample area 1 2-Serial number 2 3-Enterprise identification (a) Sample area (b) Serial number
3
Part II: Living standards of the household Household average monthly expenditure 4-Total 11 5-Food 12 6-Electricity consumption (if connected) 13 7-Household in-debt? 14 8-[Yes] Amount 15 9- Source 16 10- Enterprise related? 17
Household average monthly income by source 11- Wages and salaries 18 12- Agriculture– cash 19 13- Agriculture– in kind 20 14- Business revenues from MSEs 21 15- Other business revenues 22 16- Returns to financial assets 23 17- Returns on other capital assets (real estate) 24 18- Remittances 25 19- Other public transfers 26 20- Other private transfers 27 21- Other 28 22- Total 29
Ownership of consumer durable 23- Telephone 30 24- Private motor vehicle 31 25- Air conditioner 32 26- Refrigerator 33 27- Washing machine 34 28- Sewing machine 35 29- Dishwasher 36 30- Computer 37 31- Cellular phone 38
Housing-unit characteristics 32- Number of rooms 39 33- Ownership of housing unit 40
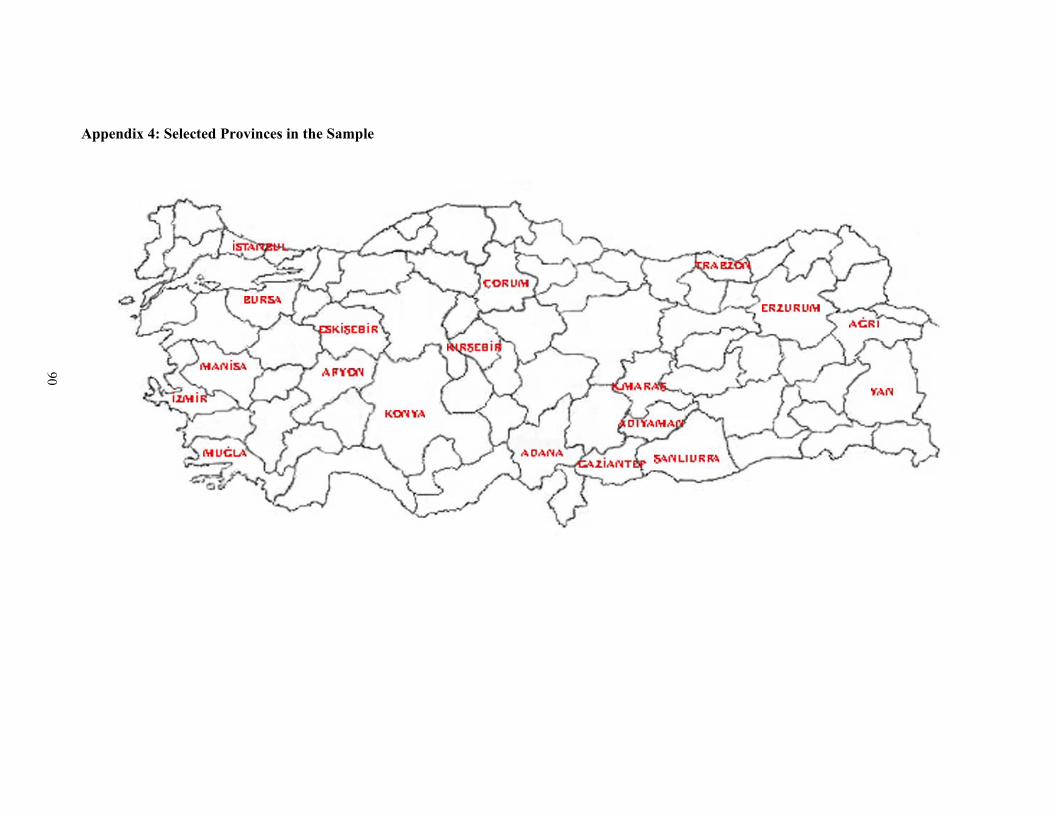
90
Appendix 4: Selected Provinces in the Sample

91
Appendix 5: The Sampling Process
1. Selection of Provinces
Strata According to Socio-Economic Development 1 2 3 4 5 Strata
Total # of Enterprise in
Strata Selected Provinces
# of Enterprise in the Selected
Provinces # of Provinces 6 11 27 19 18 1 1,317,210 # of Provinces in our Sample 3 3 6 4 3 ISTANBUL 505,865 BURSA 239,638 IZMIR 213,660 2 464,415 MUGLA 36,536 ADANA 78,433 ESKISEHIR 23,302 3 472,271 MANISA 39,359 TRABZON 31,356 GAZIANTEP 42,047 KONYA 56,344 KIRSEHIR 6,842 AFYON 16,359 4 232,136 K.MARAS 20,107 CORUM 16,244 ERZURUM 21,728 SANLIURFA 18,152 5 68,313 VAN 11,811 AGRI 8,108 ADIYAMAN 6,229 Total 2,554,345 1,392,120
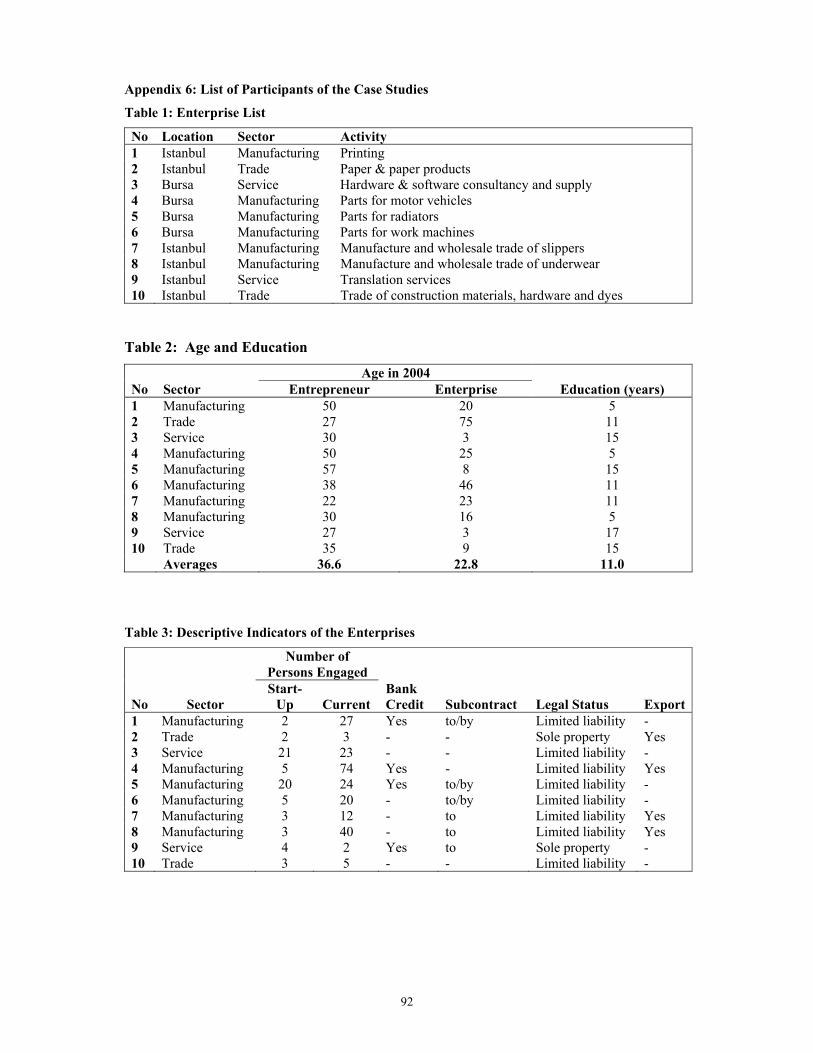
92
Appendix 6: List of Participants of the Case Studies
Table 1: Enterprise List
No Location Sector Activity 1 Istanbul Manufacturing Printing 2 Istanbul Trade Paper & paper products 3 Bursa Service Hardware & software consultancy and supply 4 Bursa Manufacturing Parts for motor vehicles 5 Bursa Manufacturing Parts for radiators 6 Bursa Manufacturing Parts for work machines 7 Istanbul Manufacturing Manufacture and wholesale trade of slippers 8 Istanbul Manufacturing Manufacture and wholesale trade of underwear 9 Istanbul Service Translation services 10 Istanbul Trade Trade of construction materials, hardware and dyes
Table 2: Age and Education
Age in 2004 No Sector Entrepreneur Enterprise Education (years) 1 Manufacturing 50 20 5 2 Trade 27 75 11 3 Service 30 3 15 4 Manufacturing 50 25 5 5 Manufacturing 57 8 15 6 Manufacturing 38 46 11 7 Manufacturing 22 23 11 8 Manufacturing 30 16 5 9 Service 27 3 17 10 Trade 35 9 15 Averages 36.6 22.8 11.0
Table 3: Descriptive Indicators of the Enterprises
Number of
Persons Engaged
No Sector Start-
Up Current Bank Credit Subcontract Legal Status Export
1 Manufacturing 2 27 Yes to/by Limited liability - 2 Trade 2 3 - - Sole property Yes 3 Service 21 23 - - Limited liability - 4 Manufacturing 5 74 Yes - Limited liability Yes 5 Manufacturing 20 24 Yes to/by Limited liability - 6 Manufacturing 5 20 - to/by Limited liability - 7 Manufacturing 3 12 - to Limited liability Yes 8 Manufacturing 3 40 - to Limited liability Yes 9 Service 4 2 Yes to Sole property - 10 Trade 3 5 - - Limited liability -
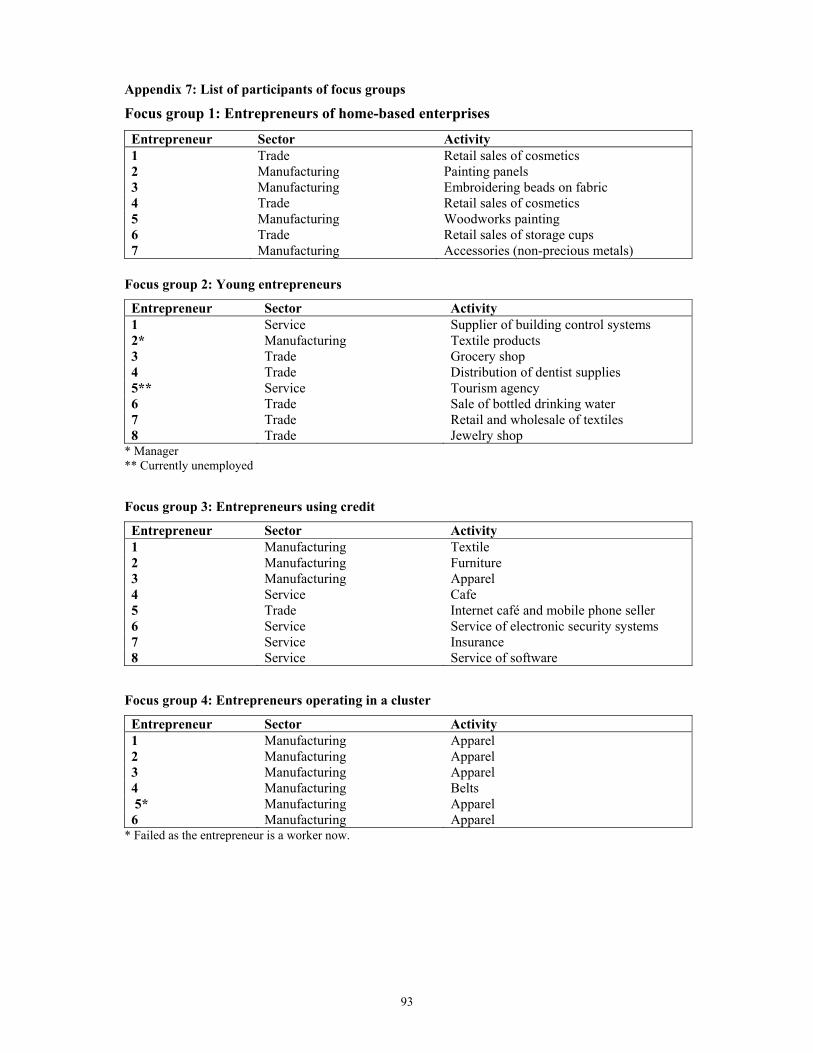
93
Appendix 7: List of participants of focus groups
Focus group 1: Entrepreneurs of home-based enterprises
Entrepreneur Sector Activity 1 Trade Retail sales of cosmetics 2 Manufacturing Painting panels 3 Manufacturing Embroidering beads on fabric 4 Trade Retail sales of cosmetics 5 Manufacturing Woodworks painting 6 Trade Retail sales of storage cups 7 Manufacturing Accessories (non-precious metals)
Focus group 2: Young entrepreneurs
Entrepreneur Sector Activity 1 Service Supplier of building control systems 2* Manufacturing Textile products 3 Trade Grocery shop 4 Trade Distribution of dentist supplies 5** Service Tourism agency 6 Trade Sale of bottled drinking water 7 Trade Retail and wholesale of textiles 8 Trade Jewelry shop
* Manager ** Currently unemployed
Focus group 3: Entrepreneurs using credit
Entrepreneur Sector Activity 1 Manufacturing Textile 2 Manufacturing Furniture 3 Manufacturing Apparel 4 Service Cafe 5 Trade Internet café and mobile phone seller 6 Service Service of electronic security systems 7 Service Insurance 8 Service Service of software
Focus group 4: Entrepreneurs operating in a cluster
Entrepreneur Sector Activity 1 Manufacturing Apparel 2 Manufacturing Apparel 3 Manufacturing Apparel 4 Manufacturing Belts 5* Manufacturing Apparel 6 Manufacturing Apparel
* Failed as the entrepreneur is a worker now.

94
Focus Group 5: Exporting Entrepreneurs
Entrepreneur Sector Activity 1* Manufacturing Footwear 2 Manufacturing Belts 3 Manufacturing Textile products 4 Manufacturing Medical equipment 5 Manufacturing Apparel 6 Manufacturing Apparel (sub-contractor) 7 Manufacturing Mechanical blinds
* Manager
Focus Group 6: Women Entrepreneurs
Entrepreneur Sector Activity 1 Service Insurance Agency 2 Manufacturing Dressmaking 3 Trade Variety shop 4 Trade Sale of under-ware 5 Service Hairdresser 6 Trade Jewelry shop

95
Appendix 8: Distribution of Enterprises Responded to the Questions regarding the Value-Added of the Enterprise
Economic Activity 2000 2001 2002 n* 844 935 609 Manufacturing N** 170,436 202,323 109,320 n 46 51 27 Construction N 26,847 31,492 12,919 n 1,984 2,219 1,370 Trade N 511,515 592,593 419,346 n 258 303 231 Hotel/Restaurants N 96,710 112,368 75,304 n 220 264 197 Other Services N 95,912 117,365 71,990 n 3,352 3,772 2,434 Total N 901,420 1,056,141 688,879
*n: Number of enterprises interviewed. **N: Extrapolated number of enterprises.
Copyright © 2022 FDOKUMEN