The use of performance indicators for small and micro enterprises (SMEs): A Brazilian regional...
12
African Journal of Business Management Vol. 6(28), pp. 8378-8389, 18 July, 2012 Available online at http://www.academicjournals.org/AJBM DOI: 10.5897/AJBM11.1023 ISSN 1993-8233 ©2012 Academic Journals Full Length Research Paper The use of performance indicators for small and micro enterprises (SMEs): A Brazilian regional experience Arcenildo Valderes Da Silva Nunes, Eric Dorion*, Pelayo Munhoz Olea, Cristine Hermann Nodari, Adrieli Alves Pereira and Eliana Andréa Severo University of Caxias do Sul, rua Francisco Getúlio Vargas, 1130 – Petrópolis Caxias do Sul, 95070-560, Brasil. Accepted 4 August, 2011 Micro and small enterprises represent approximately 98.4% of private enterprises in Brazil. Those small businesses are placed in a highly competitive environment and they need management practices to pursue greater competitiveness, resulting in a demand for performance indicators that can better assist entrepreneurs in small business management. The aim of the research is to verify if the micro and small enterprises (SMEs) associated with the MICROEMPA association of Caxias do Sul, Brazil, use performance indicators and what are these specifically. The research is exploratory with a descriptive study. The sample was completed with 42 companies from a universe of 561 companies. The results show that majority of companies use performance indicators to monitor the management of the business, but nevertheless, a small proportion of existing indicators are being by SMEs. Key words: SMEs, performance indicators, Brazilian industry. INTRODUCTION Business perspectives and relations between markets have suffered important changes in recent years, more specifically concerning the aspects of profitability and assets. Most of the South American countries are characterized by economies with heavy reliance on foreign capital and fierce competition, imposed by developed countries. In this context, companies seek other management models, grounded in knowledge mechanisms that provide information in order to minimize the negative effects of an economy that generates unexpected and increasing difficulties. Thus, a systematic evaluation of effective management performance becomes a tool of fundamental importance for organizational success, especially for micro and small businesses which constitute the main source of revenue for the South American population. In this competitive environment, management models, theories on human resource management, process management, systems and organizational structures are *Corresponding author. E-mail: [email protected]. Tel/Fax: +55 (54) 3218 2100. constantly being re-modeled. Over the past two centuries, were formulated various models and theories in the field of administration, but more recently, there was an analysis, reflection and reformulation of ideas in order to conform them to an information and knowledge based society (Mintzberg et al., 1998). Bond (2007) claim that organizational performance depends on the integration of all its activities; from the formulation of its strategies and through the actions that contribute to the achievement of the prescribed goals. Therefore, performance management may transform behaviour, improve the organization’s activities and indicate where problems may arise and why. Over time, performance measurement systems have been developed to monitor and maintain control in the organizations, meaning that performance measurement is necessary for organizational growth and continuous improvement. This leads to the importance related to the use of operation control indicators, which identify the critical aspects that generate or impair business performance and which contribute to the implementation of management improvements and changes (Bond, 2007). In this context, entrepreneurs and business
Transcript of The use of performance indicators for small and micro enterprises (SMEs): A Brazilian regional...

African Journal of Business Management Vol. 6(28), pp. 8378-8389, 18 July, 2012 Available online at http://www.academicjournals.org/AJBM DOI: 10.5897/AJBM11.1023 ISSN 1993-8233 ©2012 Academic Journals
Full Length Research Paper
The use of performance indicators for small and micro enterprises (SMEs): A Brazilian regional experience
Arcenildo Valderes Da Silva Nunes, Eric Dorion*, Pelayo Munhoz Olea, Cristine Hermann Nodari, Adrieli Alves Pereira and Eliana Andréa Severo
University of Caxias do Sul, rua Francisco Getúlio Vargas, 1130 – Petrópolis Caxias do Sul, 95070-560, Brasil.
Accepted 4 August, 2011
Micro and small enterprises represent approximately 98.4% of private enterprises in Brazil. Those small businesses are placed in a highly competitive environment and they need management practices to pursue greater competitiveness, resulting in a demand for performance indicators that can better assist entrepreneurs in small business management. The aim of the research is to verify if the micro and small enterprises (SMEs) associated with the MICROEMPA association of Caxias do Sul, Brazil, use performance indicators and what are these specifically. The research is exploratory with a descriptive study. The sample was completed with 42 companies from a universe of 561 companies. The results show that majority of companies use performance indicators to monitor the management of the business, but nevertheless, a small proportion of existing indicators are being by SMEs. Key words: SMEs, performance indicators, Brazilian industry.
INTRODUCTION Business perspectives and relations between markets have suffered important changes in recent years, more specifically concerning the aspects of profitability and assets. Most of the South American countries are characterized by economies with heavy reliance on foreign capital and fierce competition, imposed by developed countries. In this context, companies seek other management models, grounded in knowledge mechanisms that provide information in order to minimize the negative effects of an economy that generates unexpected and increasing difficulties. Thus, a systematic evaluation of effective management performance becomes a tool of fundamental importance for organizational success, especially for micro and small businesses which constitute the main source of revenue for the South American population.
In this competitive environment, management models, theories on human resource management, process management, systems and organizational structures are
*Corresponding author. E-mail: [email protected]. Tel/Fax: +55 (54) 3218 2100.
constantly being re-modeled. Over the past two centuries, were formulated various models and theories in the field of administration, but more recently, there was an analysis, reflection and reformulation of ideas in order to conform them to an information and knowledge based society (Mintzberg et al., 1998).
Bond (2007) claim that organizational performance depends on the integration of all its activities; from the formulation of its strategies and through the actions that contribute to the achievement of the prescribed goals. Therefore, performance management may transform behaviour, improve the organization’s activities and indicate where problems may arise and why.
Over time, performance measurement systems have been developed to monitor and maintain control in the organizations, meaning that performance measurement is necessary for organizational growth and continuous improvement.
This leads to the importance related to the use of operation control indicators, which identify the critical aspects that generate or impair business performance and which contribute to the implementation of management improvements and changes (Bond, 2007). In this context, entrepreneurs and business

Nunes et al. 8379
Table 1. Gross domestic product, total and per capita in 2004 - Brazil, RS and Caxias do Sul.
Brazil Rio Grande do Sul Caxias do Sul
GDP total
(R$ millions)
GDP per capita (R$)
GDP total
(R$ millions) GDP Per capita (R$)
GDP total
(R$ millions)
GDP per capita (R$)
1.766.620 9.729 142.874 13.320 8.117 20.485
managers, who require a constant monitoring and evaluation of their organization, do need to use patronized indicators that guide strategies and business performance. These indicators need to go beyond financial data to allow change; and these indicators must provide knowledge support in a competitive perspective, to improve the business processes and therefore to give a better understanding and prevision of the future. The importance of entrepreneurship Entrepreneurship has become a recognized field of research which is directly associated to the growth of nations and the development of their economies. It is also considered the main source of formal employment and information and the major driver of growth and income (Filion, 1998). Business venture is one of the causes of the prosperity of nations, being the consequence of opportunities, job creation and wealth. The existence of entrepreneurs willing to take risks is one of the pillars of economic development. Entrepreneurs are agents of change (Schumpeter, 1934).
From the researchers conducted by the Global Entrepreneurship Monitor (GEM), since it was first published, Brazil has always occupied one of the best 15 positions in the ranking of entrepreneurship by opportunity and best positions in the ranking of entrepreneurship by necessity. These data show the increasing presence of entrepreneurship by necessity in Brazil, compared to other countries. These GEM researches demonstrate that the less known any offer is, smaller is the number of competitors, more recent are the technologies and processes and higher is the expectation to generate jobs; creating a greater potential of entrepreneurship which shall have a more positive impact on the market.
One of the researches realized before the 2008 world economical crisis reveals that Brazil was already following the international dynamics of high competition, considering that the country was positioning itself slightly higher than the others, reaching 66.0% of entrepreneurs and 72.5% of new ventures; and the portion of entrepreneurs who say they did not have competitors was significantly lower than in the other countries, with 4.1% of the new ventures and 2.9% of the established enterprises (GEM, 2006).
The vast majority of Brazilian entrepreneurs choose to
start a rather prosaic business, which is more or less ready to start and that was already tested in areas of high competition. On one hand, it partly explains the low level of product and market innovation, considering the totality of the entrepreneurial population; on the other hand, this may give a clue about the obstacles faced by the entrepreneurs to maintain their businesses for a longer period of time.
For the purpose of data collection on business activities in the city of Caxias do Sul/RS, the Social Information Annual Report [Relação Anual de Informações Sociais (RAIS)] and the General Register of Employed and Unemployed Citizens [Cadastro Geral de Empregados e Desempregados (CAGED)] were consulted as the research sources of data.
According to the data from RAIS, the municipality of Caxias do Sul/RS had 28,310 registered businesses in 2004, generating 123,281 formal jobs. This year, the population was estimated at 396,000 inhabitants, representing one business for every 14 inhabitants, far outpacing the national average which is about one formal business for every 35 inhabitants. The state of Rio Grande do Sul (RS) has 496 municipalities, and in 2004, the city of Caxias do Sul accounted for 5.7% of gross domestic product (GDP) of RS, only behind the cities of Porto Alegre and Canoas, from the Capital’s metropolitan area. The income per capita in Caxias do Sul is of R$ 20,485, being well above the State and national average, as presented in Table 1.
The municipality of Caxias do Sul has its main economic activity a metal-mechanic pole; however, it has many other economic activities, such as a production of grapes, wine, furniture and several other service sectors such as computer services. Due to a high GDP per capita, the city of Caxias do Sul is also distinguished by having an important trade activity, attracting to the city a range of large department stores of various types. Decision making indicators Starting a business requires courage, energy and vision to seize any opportunity. The entrepreneur has to develop these characteristics to be successful, but however, not always these skills are sufficient to ensure the business maturity and profitability. According to Longenecker et al. (1997), many small firms are marginal or unprofitable, "struggling to survive each day or month,
8380 Afr. J. Bus. Manage. and at best, yield only an insignificant amount of profit to their owners. [...] They 'run' their business, but is it exaggerated to say that these are 'managed'? "
A research published by SEBRAE-SP in Bedê (2005) reveals that, among the major factors affecting the mortality of businesses are: the underdeveloped entrepreneurial profile among most people who start a company, the lack of business planning before the initiation of activities; corporate mismanagement during the first year of activity, the failure of public policies to support small businesses, the low growth rate of the Brazilian economy and the personal problems of the business partners.
The high mortality rate of new ventures in Brazil may be the reason why entrepreneurship is of increasing interest within the government, the support institutions and the academic researchers themselves (Dornelas, 2001). In that sense, there are several programs, supported by the federal government, mainly through the SEBRAE and "S" Systems (Sebrae, SESI, SESC, Senac, Senai, Sennar, Senat, and Sescoop SEST), ranging from the orientation on the opening of a new business, to subsidized low-cost consulting, in order to minimize this situation (Botelho and Souza, 2001).
Therefore, it can be concluded that the establishment of measurement criteria and constant monitoring of the business environment, both internally and externally, could be factors that increase the business survival rate and the competitiveness of micro and small businesses (SMEs).
Neely et al. (1997) define performance indicators as a means used to quantify the efficiency and the effectiveness of a decision taken by a company. Therefore, a performance indicator allows the organizations to understand what they are doing and what the results of their actions are.
In general terms, a performance indicator is a tool used to measure and analyze the results of a company for a certain period of time. The application of this tool can be examined from various aspects, to meet the needs of different areas of a company or any of its specific strategies.
Drucker (1992) argues that computers store a large volume of data, but data are not information. Information has relevance and purpose, and a company needs to decide what information it would need to operate its business. It is necessary to know how to enhance some information, clearly, objectively and at the right time, so that it can value the management decision making process. Knowing how to define what to measure, and evaluate the different activities performed by a company becomes a very complex task. To establish what measures should be taken depends on the complexity and the importance of the process that should be analyzed in relation to the established goals, and also in function of the management.
The author mentions that, for company which operate
in the information area, it needs to be structured around goals that clearly define the expectations and the objectives of the organization. Nakamura and Mineta (2001) highlight that, there is a growing trend among executives to review corporate performance measure and to formulate indicators to monitor implementation of the strategy.
Chang and Young (1995) justify the need to use performance measures, based on the complexity of today's business environment on the demands for quality and productivity; and to establish reasons, focus, direction and common understanding, to provide knowledge for decision support. Beuren (2000) believes that decision makers require adequate measures to support decision making. Kendall and Kendall (1999), Mcgee and Prusak (1994) and Harrington (1988) argue about the importance of information, and therefore, indicators should be emphasized in any organization; and Beuren (2000) says that "through a model of organization, the manager can better understand the structure and its complex relationships and consequently, the changes to be studied and implemented in the organization".
Drucker (1992) argues that most experienced executives learned that there is no magic formula for measuring the performance of a business. Comparing the management with the function of a car, he says: Like a car needs a certain number of control panel, and also that the tire pressure need to be checked frequently, a company needs a certain number of 'panels' to have control. But the number is small; five of these 'scales' can give information on how the company is going and whether it is moving in the right direction (Drucker, 1992).
The small business world has recognized the importance of business evaluation to measure the performance of companies. However, since the 80's, several authors have begun to criticize the traditional method, because of the performance measurement tools being restricted to financial measures, not including non-financial performance measures and not considering intangibles in business management.
From the 90’s, an intense development of performance measurement tools and strategies have been noticed, called the "revolution of measurement" (Neely et al., 1997). Ghalayini and Noble (1996) divide the literature on performance measurement in two phases. The first phase, until the 1980’s, has been emphasized on financial performance measures such as profit, return on investment and productivity. In the early 1990’s, global competition has brought major changes and a new level of consumer demand, which forced companies to deploy new technologies and management philosophies, giving rise to a second phase of performance measurement.
Much of the new management theories have shown that, performance evaluation is a complex administrative process, which should take into consideration issues such as customer satisfaction, motivation, intellectual
capital, the environment and other elements which refers to the organization.
The great challenge of contemporary business management is to consider values in non-financial performance evaluation. Banker et al. (2000) consider that non financial measures are better indicators of future performance than financial measures and assist managers to focus their actions on long-term prospects.
Kaplan (1983) argues that the system of performance measurement is too much based on traditional financial measures. It contains only a limited financial vision that leads to short-term optimization of the evaluation of new investments and the introduction of new products. Moreover, there is a lack of performance measures on quality, productivity and inventory. Chakravarthy (1986) mentioned that the traditional measures of performance such as productivity, profitability and other financial measure itself has made it difficult to clearly understand strategic performance.
Schmidt (2002) emphasized that there is no recipe for choosing the best indicators which can be financial or not financial. What really matters is to demonstrate the reality with more transparency. This requirement increases the responsibility for whom defines the new indicators, but it gives room to the use of creativity, since there are no businesses alike, and so, the indicators used successfully in a company are not necessarily the same in another organization. For the author, to create performance indicators is to develop feedback instruments for management.
According to Hronec (1994), the criteria to establish the performance measures can be summarized in three categories: quality, time and cost. Kaplan and Norton (1992) mentioned that, performance measures are divided into four perspectives: financial, customers, internal business processes and learning and growth.
The question about what are the best performance measures is the subject of much debate among economists, accountants, scientists and administrators. However, for business managers, it does not matter. No action chosen will be perfect, but it is fundamental that, such action be appropriate to the company's reality. Any measure adopted will bring a margin of error, so an accurate reading cannot be expected. The most important is that, the measures chosen demonstrate the trend, proving that the company is heading toward the right direction (Drucker, 1992). Each manager has the duty to select between ranges of indicators the ones that best fit the reality of his business to generate better business performance. Key performance indicators To define performance indicators to measure results is extremely important for business success, however, it is important to know how to determine what to measure,
Nunes et al. 8381 which indicators are most relevant and which grounds will be used for this measurement. According to Brown (2000), the term “outcome” refers to the effects of the activities generated by the organization in meeting the requirements of its management model. For this research, were used indicators based on financial statements, indicators used by the national quality award [Prêmio Nacional da Qualidade (PNQ)[, the generic indicators from the balanced score card (BSC) and competitiveness indicators award for SMEs.
The indicators based on financial statements are widely disseminated and used by large companies and accounting departments have long used these indicators to assist in business management. The indicators used by PNQ involve a wide range of indicators, internationally recognized, and being used by a good part of Brazilian companies. The generic indicators of the BSC, as a tool used worldwide for a wide range of companies, is being widely disseminated and recognized as a modern tool of business management, which includes indicators of all company levels, such as the ones of the competitiveness indicators award for SMEs, which is the focus of this research.
There is a wide diversity of literature on indicators. The economic and financial indicators have devoted their use over the years, especially in large companies. In that case, literature has become redundant.
Through the review of the literature, were selected a set of indicators for the implementation of the research on SMEs. The selection criterion is based on the frequency that each one appears in the bibliography, considering that the research focuses on SMEs. The indicators chosen are listed in Table 2.
Large corporations use sophisticated tools based on information technology, often through large investments, for the constant monitoring of its indicators. However, this cannot constitute a limiting factor for the SMEs to implement business development with the use of indicators. The selection and the number of indicators that should be used it is up to each company to decide, according to their level of competitiveness and strategies defined. Definition of small and micro enterprises (SMEs) There is no consensus regarding a clear definition of what are SMEs. Bedê (2005) warn that the definition and the implementation of concepts on SMEs is an issue that still generates major discussions, not only in Brazil but in the world. Considering that there is no universally accepted definition, each country and sometimes each regions within a country, use their own specific criteria, according to their characteristics and with the purpose of the classification. There is a variety of criteria to rank the companies by its size because there are many variables that can be adopted.

8382 Afr. J. Bus. Manage.
Table 2. Performance indicators on MSEs.
Group Indicator
Financial
Sales growth
Sales profit (Net margin)
Return n invested capital
Profit by product
Profit per customer
Cash flow
Liquidity ratio
Turnover or inventory turnover
Purchase payment medium period
Sales payment medium period
Indebtedness Level
Immobilization of own resources
Market - Clients
Market Share
Customer retention (number of customers with multiple purchases)
Customer acquisition (new customers)
Customer Satisfaction
Customer complaints
Customer returns Index
Number of exclusive clients
Process
New products acceptance Rate
Lack of products Index
Number of orders delivered as promised
Quantity of unplanned production failures
Product Quality
Human resource
Employee satisfaction
Employee retention
Employee productivity
Percentage of hours employed in training
Frequency of job
Frequency of job accidents
Others
Percentage of products / services received from suppliers within the required specifications
Percentage met environmental requirements (environmental law)
Amount invested in social programs
Longenecker et al. (1997) mention that, to specify any size standard for defining business is necessarily somewhat arbitrary because people adopt different standards for different purposes [...]. A company can be described as "small" compared to any larger companies, or 'large' compared to any smaller company.
A micro-enterprise or small business is typically run by a business owner and his family, having a small number of employees and who develop activities that fulfill the locality where they are installed in products. Leone (1999) says that small businesses are identified as being
more centralized organizations, with a simple organizational structure, requiring a smaller amount of administrative functions.
The number of employees is the criterion adopted by two sources of classification used in Brazil; the RAIS of the Ministry of Labour and SEBRAE. In addition to the criteria adopted by the Statute of SMEs, SEBRAE (2007) classifies the size of the companies according to Table 3.
In Brazil, the statistics which constitutes the source of data are from the Brazilian Institute of Geography and Statistics (IBGE) on SMEs, using the above criteria

Nunes et al. 8383
Table 3. Classification of companies by the criteria of persons employed.
Company size Industry Commercial and services
Micro Up to 19 employed persons Up to9 employed persons
Small From 20 to 99 employed persons From 10 to 49 employed persons
Medium From 100 to 499 employed persons From 50 to 99 employed persons
Large Over 499 employed persons Over 99 employed persons
Table 4. Total companies by activity and by size.
Activity Company size
Total ME % S/Total SE % S/Total
Industry 13 31.0 8 19.0 21 50.0%
Commerce 2 4.8 4 9.5 6 14.3%
Service 6 14.3 9 21.4 15 35.7%
Total 21 50.0 21 50.0 42 100.0%
presented in Table 2. In all their surveys, IBGE classifies the firms according to the number of total employed persons. It also refers to the complementary law (LC), number 123 of 14/12/2006, with the statute of establishing the new National Micro and Small Businesses law, which is based on a quantitative criterion of billing or using the term "gross income".
It can be concluded that, there are two criteria for the classification of SMEs in Brazil. The criterion of billing value is most often used for tax purposes, while the criterion of number of persons employed is used by entities of the "S" system and for the calculation of most statistics on company size in the country. This research used data from SEBRAE. METHODS Starting from the empirical assumption that SMEs use few or even make no use of performance indicators for their results evaluation, this research was realized in two steps. The first part was exploratory, from the review of literature, and the second step, was a survey through the use of a questionnaire, selecting, by means of statistical procedures, a sample of the MICROEMPA (Small and Micro Businesses Association) population (Clarke and Cook, 1983).
The study is characterized as exploratory. In the first stage, a research was carried out on the concepts of entrepreneurship and on the concepts and criteria for the classification of SMEs. In the second stage of the research, study on business performance indicators was carried out, through a review of the accounting and financial indicators from the Brazilian literature, the generic indicators of BSC and the indicators used in the National Quality Award PNQ.
The survey was realized with a directed questionnaire. The choice of collection data instrument presented various advantages: the answers to closed questions are easy to code, the interviewee does not need to write, and closed questions facilitate the completion of the questionnaire (Richardson, 1999). The survey was conducted in two phases, the first of a sample of ten companies belonging to the population studied, aiming to test the questionnaire. The second phase included the necessary
adjustments and the application to all the selected companies in the sample.
The studied population consists in all companies associated with MICROEMPA, which possess 5 or more persons working (and staff members) in the segments of industry, commerce and services. The survey of companies showed there are 561 member companies in MICROEMPA that meet the criterion of at least five working persons. The establishment of this criterion seeks to prevent the survey of companies that have only members providing direct services to one company.
Through the list of SMEs that constitute the population, a sample of 83 companies was chosen randomly, because each SME has the same chance of being selected (Clarke and Cook, 1983; Cooper and Schindler, 1998). The companies surveyed were chosen by systematic sampling (Clarke and Cook, 1983), since they were registered in the computer system MICROEMPA, and were selected by their position in the listing. Rea and Parker (2000) classified this sample as "systematic random sample".
A total of 249 questionnaires were sent, observing the same selection criteria for all companies. The questionnaires were mailed through the pouch MICROEMPA, along with a letter of response. Subsequently, telephone contacts were made with the companies and contact was maintained by e-mail. Finally, 32 companies were visited to seek their participation in the survey. However, it was not possible to get 83 responses, since only 42 firms replied the questions in the questionnaire, which created a limitation in this research. Considering that 42 companies replied the questions in the questionnaire, the reliability coefficient decreased to 90% and the error rate increased to 12%, a fact that ultimately do not allow inferences to the entire population.
RESULTS ANALYSIS
The survey showed that all 42 companies have been active in the market for at least three years, 15 are service companies, 6 are trade companies and 21 are industrial companies. Of these, 50% are micro enterprises (ME) and 50% are small enterprises (SE), as shown in Table 4.
From the period of 2005 to 2007, the company had employed from 102 people, showing an increase in
8384 Afr. J. Bus. Manage.
Industry Commerce Service
Year 2005 428 94 192
Year 2006 447 97 194
Year 2007 513 107 196
0
75
150
225
300
375
450
525
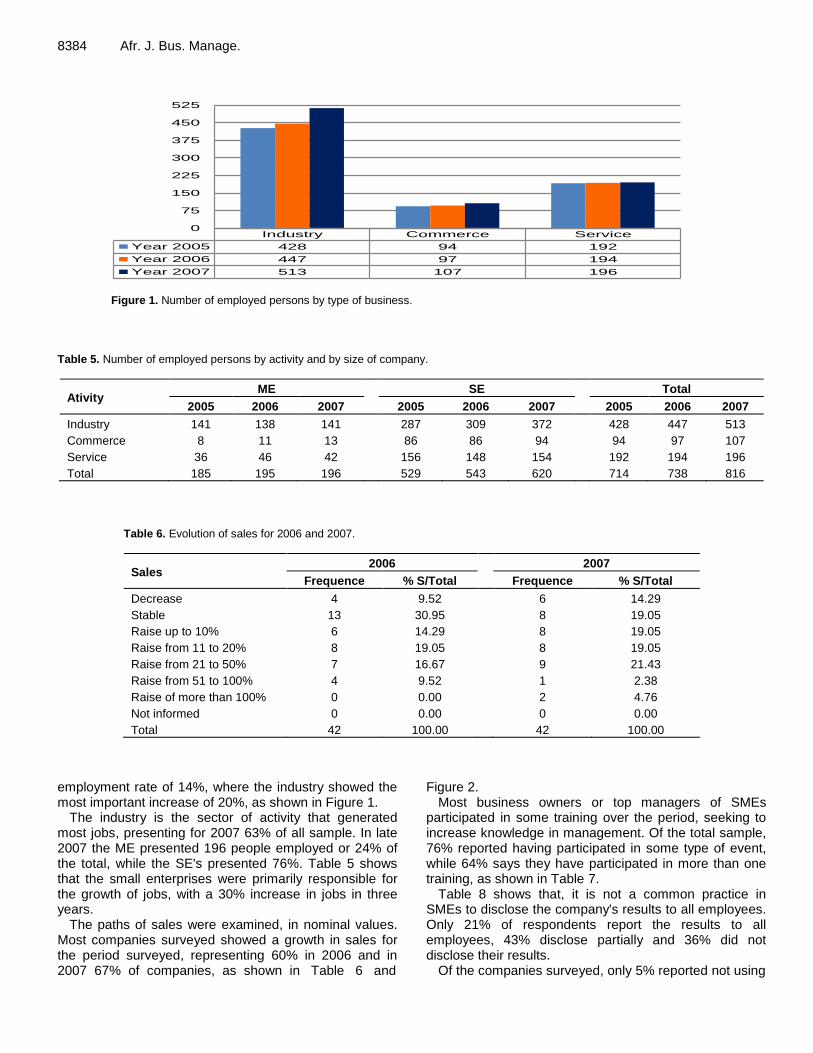
Figure 1. Number of employed persons by type of business.
Table 5. Number of employed persons by activity and by size of company.
Ativity ME
SE
Total
2005 2006 2007 2005 2006 2007 2005 2006 2007
Industry 141 138 141 287 309 372 428 447 513
Commerce 8 11 13 86 86 94 94 97 107
Service 36 46 42 156 148 154 192 194 196
Total 185 195 196 529 543 620 714 738 816
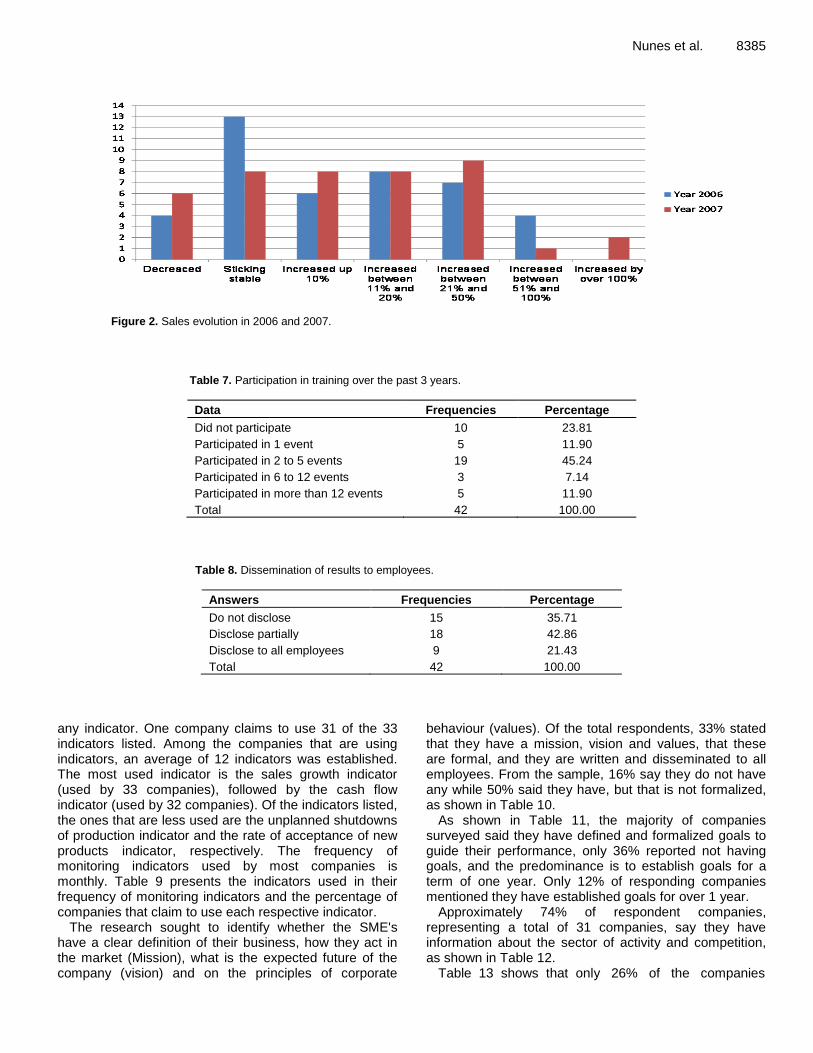
Table 6. Evolution of sales for 2006 and 2007.
Sales 2006
2007
Frequence % S/Total Frequence % S/Total
Decrease 4 9.52 6 14.29
Stable 13 30.95 8 19.05
Raise up to 10% 6 14.29 8 19.05
Raise from 11 to 20% 8 19.05 8 19.05
Raise from 21 to 50% 7 16.67 9 21.43
Raise from 51 to 100% 4 9.52 1 2.38
Raise of more than 100% 0 0.00 2 4.76
Not informed 0 0.00 0 0.00
Total 42 100.00 42 100.00
employment rate of 14%, where the industry showed the most important increase of 20%, as shown in Figure 1.
The industry is the sector of activity that generated most jobs, presenting for 2007 63% of all sample. In late 2007 the ME presented 196 people employed or 24% of the total, while the SE's presented 76%. Table 5 shows that the small enterprises were primarily responsible for the growth of jobs, with a 30% increase in jobs in three years.
The paths of sales were examined, in nominal values. Most companies surveyed showed a growth in sales for the period surveyed, representing 60% in 2006 and in 2007 67% of companies, as shown in Table 6 and
Figure 2. Most business owners or top managers of SMEs
participated in some training over the period, seeking to increase knowledge in management. Of the total sample, 76% reported having participated in some type of event, while 64% says they have participated in more than one training, as shown in Table 7.
Table 8 shows that, it is not a common practice in SMEs to disclose the company's results to all employees. Only 21% of respondents report the results to all employees, 43% disclose partially and 36% did not disclose their results.
Of the companies surveyed, only 5% reported not using
Nunes et al. 8385
Figure 2. Sales evolution in 2006 and 2007.
Table 7. Participation in training over the past 3 years.
Data Frequencies Percentage
Did not participate 10 23.81
Participated in 1 event 5 11.90
Participated in 2 to 5 events 19 45.24
Participated in 6 to 12 events 3 7.14
Participated in more than 12 events 5 11.90
Total 42 100.00
Table 8. Dissemination of results to employees.
Answers Frequencies Percentage
Do not disclose 15 35.71
Disclose partially 18 42.86
Disclose to all employees 9 21.43
Total 42 100.00
any indicator. One company claims to use 31 of the 33 indicators listed. Among the companies that are using indicators, an average of 12 indicators was established. The most used indicator is the sales growth indicator (used by 33 companies), followed by the cash flow indicator (used by 32 companies). Of the indicators listed, the ones that are less used are the unplanned shutdowns of production indicator and the rate of acceptance of new products indicator, respectively. The frequency of monitoring indicators used by most companies is monthly. Table 9 presents the indicators used in their frequency of monitoring indicators and the percentage of companies that claim to use each respective indicator.
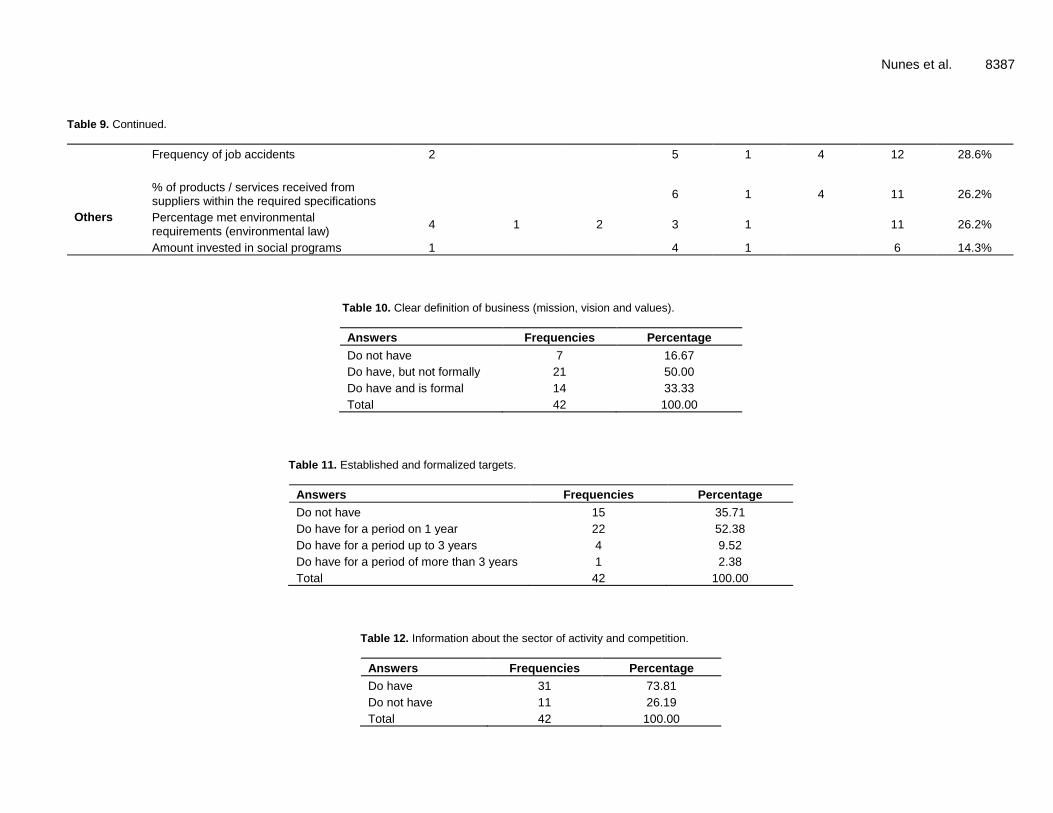
The research sought to identify whether the SME's have a clear definition of their business, how they act in the market (Mission), what is the expected future of the company (vision) and on the principles of corporate
behaviour (values). Of the total respondents, 33% stated that they have a mission, vision and values, that these are formal, and they are written and disseminated to all employees. From the sample, 16% say they do not have any while 50% said they have, but that is not formalized, as shown in Table 10.
As shown in Table 11, the majority of companies surveyed said they have defined and formalized goals to guide their performance, only 36% reported not having goals, and the predominance is to establish goals for a term of one year. Only 12% of responding companies mentioned they have established goals for over 1 year.
Approximately 74% of respondent companies, representing a total of 31 companies, say they have information about the sector of activity and competition, as shown in Table 12.
Table 13 shows that only 26% of the companies
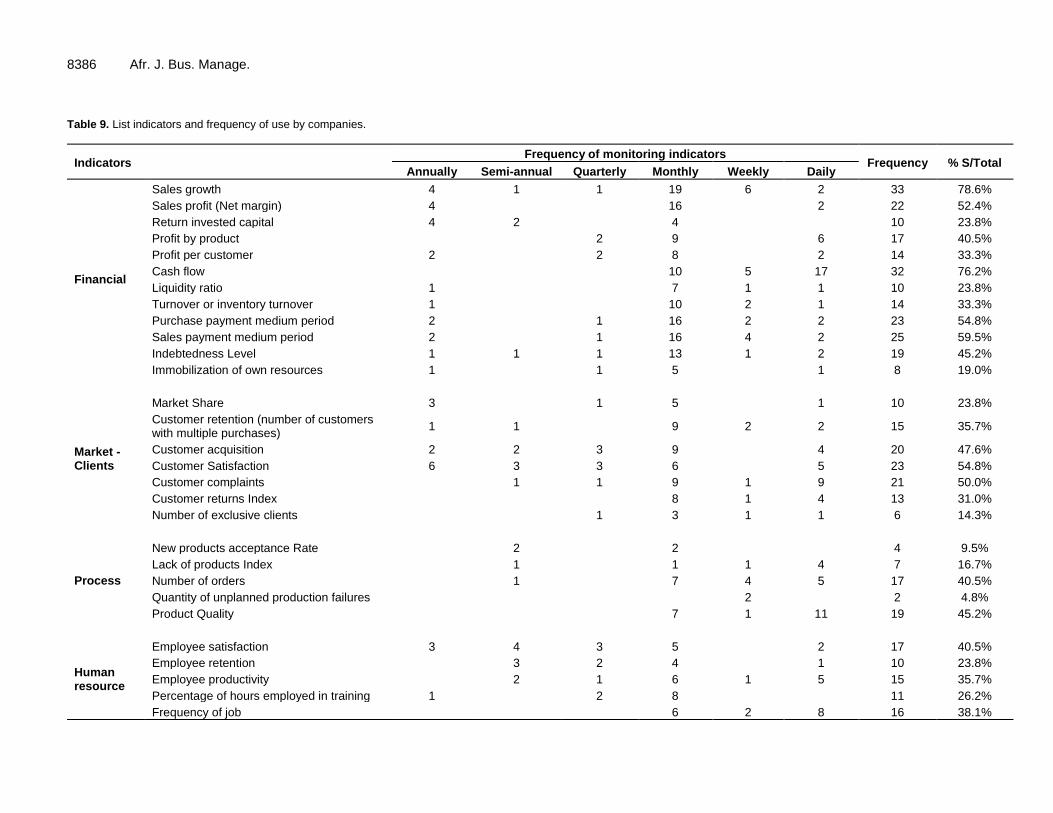
8386 Afr. J. Bus. Manage. Table 9. List indicators and frequency of use by companies.
Indicators Frequency of monitoring indicators
Frequency % S/Total Annually Semi-annual Quarterly Monthly Weekly Daily
Financial
Sales growth 4 1 1 19 6 2 33 78.6%
Sales profit (Net margin) 4 16 2 22 52.4%
Return invested capital 4 2 4 10 23.8%
Profit by product 2 9 6 17 40.5%
Profit per customer 2 2 8 2 14 33.3%
Cash flow 10 5 17 32 76.2%
Liquidity ratio 1 7 1 1 10 23.8%
Turnover or inventory turnover 1 10 2 1 14 33.3%
Purchase payment medium period 2 1 16 2 2 23 54.8%
Sales payment medium period 2 1 16 4 2 25 59.5%
Indebtedness Level 1 1 1 13 1 2 19 45.2%
Immobilization of own resources 1 1 5 1 8 19.0%
Market - Clients
Market Share 3 1 5 1 10 23.8%
Customer retention (number of customers with multiple purchases)
1 1 9 2 2 15 35.7%
Customer acquisition 2 2 3 9 4 20 47.6%
Customer Satisfaction 6 3 3 6 5 23 54.8%
Customer complaints 1 1 9 1 9 21 50.0%
Customer returns Index 8 1 4 13 31.0%
Number of exclusive clients 1 3 1 1 6 14.3%
Process
New products acceptance Rate 2 2 4 9.5%
Lack of products Index 1 1 1 4 7 16.7%
Number of orders 1 7 4 5 17 40.5%
Quantity of unplanned production failures 2 2 4.8%
Product Quality 7 1 11 19 45.2%
Human resource
Employee satisfaction 3 4 3 5 2 17 40.5%
Employee retention 3 2 4 1 10 23.8%
Employee productivity 2 1 6 1 5 15 35.7%
Percentage of hours employed in training 1 2 8 11 26.2%
Frequency of job 6 2 8 16 38.1%
Nunes et al. 8387 Table 9. Continued.
Frequency of job accidents 2 5 1 4 12 28.6%
Others
% of products / services received from suppliers within the required specifications
6 1 4 11 26.2%
Percentage met environmental requirements (environmental law)
4 1 2 3 1 11 26.2%
Amount invested in social programs 1 4 1 6 14.3%
Table 10. Clear definition of business (mission, vision and values).
Answers Frequencies Percentage
Do not have 7 16.67
Do have, but not formally 21 50.00
Do have and is formal 14 33.33
Total 42 100.00
Table 11. Established and formalized targets.
Answers Frequencies Percentage
Do not have 15 35.71
Do have for a period on 1 year 22 52.38
Do have for a period up to 3 years 4 9.52
Do have for a period of more than 3 years 1 2.38
Total 42 100.00
Table 12. Information about the sector of activity and competition.
Answers Frequencies Percentage
Do have 31 73.81
Do not have 11 26.19
Total 42 100.00
8388 Afr. J. Bus. Manage.
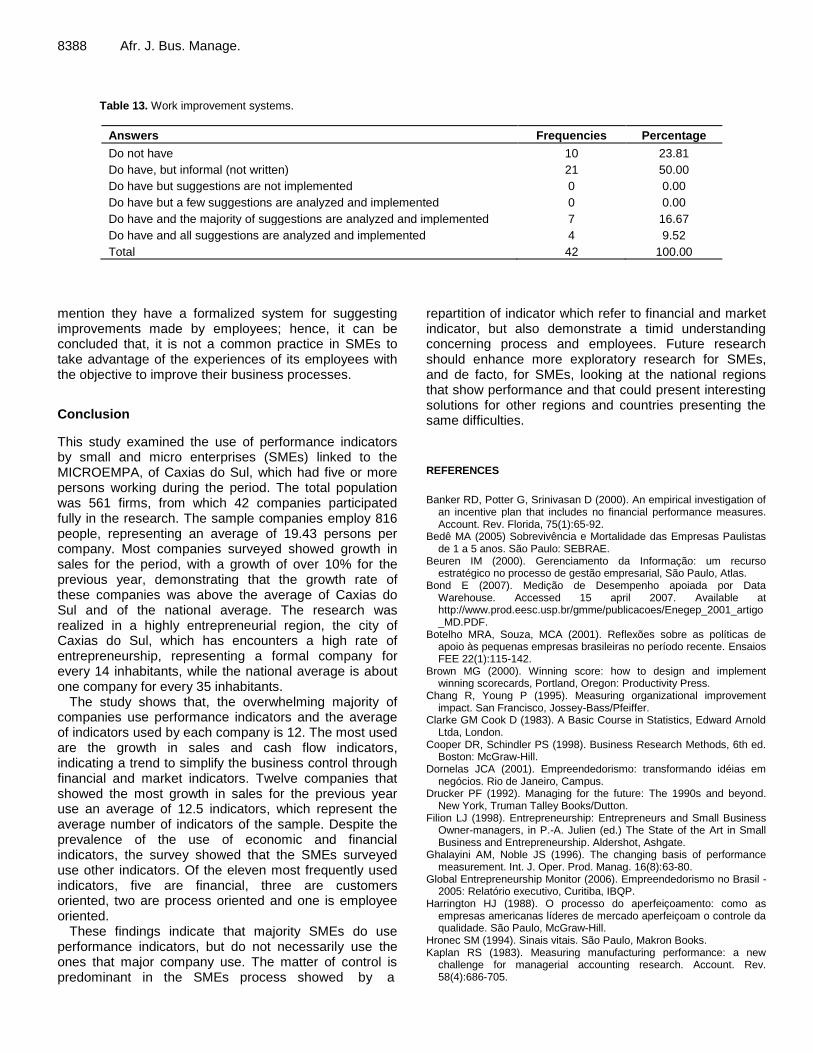
Table 13. Work improvement systems.
Answers Frequencies Percentage
Do not have 10 23.81
Do have, but informal (not written) 21 50.00
Do have but suggestions are not implemented 0 0.00
Do have but a few suggestions are analyzed and implemented 0 0.00
Do have and the majority of suggestions are analyzed and implemented 7 16.67
Do have and all suggestions are analyzed and implemented 4 9.52
Total 42 100.00
mention they have a formalized system for suggesting improvements made by employees; hence, it can be concluded that, it is not a common practice in SMEs to take advantage of the experiences of its employees with the objective to improve their business processes.
Conclusion
This study examined the use of performance indicators by small and micro enterprises (SMEs) linked to the MICROEMPA, of Caxias do Sul, which had five or more persons working during the period. The total population was 561 firms, from which 42 companies participated fully in the research. The sample companies employ 816 people, representing an average of 19.43 persons per company. Most companies surveyed showed growth in sales for the period, with a growth of over 10% for the previous year, demonstrating that the growth rate of these companies was above the average of Caxias do Sul and of the national average. The research was realized in a highly entrepreneurial region, the city of Caxias do Sul, which has encounters a high rate of entrepreneurship, representing a formal company for every 14 inhabitants, while the national average is about one company for every 35 inhabitants.
The study shows that, the overwhelming majority of companies use performance indicators and the average of indicators used by each company is 12. The most used are the growth in sales and cash flow indicators, indicating a trend to simplify the business control through financial and market indicators. Twelve companies that showed the most growth in sales for the previous year use an average of 12.5 indicators, which represent the average number of indicators of the sample. Despite the prevalence of the use of economic and financial indicators, the survey showed that the SMEs surveyed use other indicators. Of the eleven most frequently used indicators, five are financial, three are customers oriented, two are process oriented and one is employee oriented.
These findings indicate that majority SMEs do use performance indicators, but do not necessarily use the ones that major company use. The matter of control is predominant in the SMEs process showed by a
repartition of indicator which refer to financial and market indicator, but also demonstrate a timid understanding concerning process and employees. Future research should enhance more exploratory research for SMEs, and de facto, for SMEs, looking at the national regions that show performance and that could present interesting solutions for other regions and countries presenting the same difficulties.
REFERENCES
Banker RD, Potter G, Srinivasan D (2000). An empirical investigation of
an incentive plan that includes no financial performance measures. Account. Rev. Florida, 75(1):65-92.
Bedê MA (2005) Sobrevivência e Mortalidade das Empresas Paulistas de 1 a 5 anos. São Paulo: SEBRAE.
Beuren IM (2000). Gerenciamento da Informação: um recurso estratégico no processo de gestão empresarial, São Paulo, Atlas.
Bond E (2007). Medição de Desempenho apoiada por Data Warehouse. Accessed 15 april 2007. Available at http://www.prod.eesc.usp.br/gmme/publicacoes/Enegep_2001_artigo_MD.PDF.
Botelho MRA, Souza, MCA (2001). Reflexões sobre as políticas de apoio às pequenas empresas brasileiras no período recente. Ensaios FEE 22(1):115-142.
Brown MG (2000). Winning score: how to design and implement winning scorecards, Portland, Oregon: Productivity Press.
Chang R, Young P (1995). Measuring organizational improvement impact. San Francisco, Jossey-Bass/Pfeiffer.
Clarke GM Cook D (1983). A Basic Course in Statistics, Edward Arnold Ltda, London.
Cooper DR, Schindler PS (1998). Business Research Methods, 6th ed. Boston: McGraw-Hill.
Dornelas JCA (2001). Empreendedorismo: transformando idéias em negócios. Rio de Janeiro, Campus.
Drucker PF (1992). Managing for the future: The 1990s and beyond. New York, Truman Talley Books/Dutton.
Filion LJ (1998). Entrepreneurship: Entrepreneurs and Small Business Owner-managers, in P.-A. Julien (ed.) The State of the Art in Small Business and Entrepreneurship. Aldershot, Ashgate.
Ghalayini AM, Noble JS (1996). The changing basis of performance measurement. Int. J. Oper. Prod. Manag. 16(8):63-80.
Global Entrepreneurship Monitor (2006). Empreendedorismo no Brasil - 2005: Relatório executivo, Curitiba, IBQP.
Harrington HJ (1988). O processo do aperfeiçoamento: como as empresas americanas líderes de mercado aperfeiçoam o controle da qualidade. São Paulo, McGraw-Hill.
Hronec SM (1994). Sinais vitais. São Paulo, Makron Books. Kaplan RS (1983). Measuring manufacturing performance: a new
challenge for managerial accounting research. Account. Rev. 58(4):686-705.

Kaplan RS, Norton DP (1992). The Balanced Score Card – measures
that drive performance. Harv. Bus. Rev. 70(1):71-79. Kendall KE, Kendall JE (1999). Systems analysis and design. Upper
Saddle River, Prentice Hall. Leone NM (1999). As especificidades das pequenas e médias
empresas. Revista de Administração 34(2):91-94. Longenecker JG, Moore CW, Petty JW (1997). Administração de
pequenas empresas: ênfase na gerência empresarial. São Paulo, Makron Books.
Mcgee J, Prusak L (1994). Gerenciamento estratégico da informação: aumente a competitividade e a eficiência da sua empresa utilizando a informação como uma ferramenta estratégica. Rio de Janeiro, Campus.
Mintzberg H, Ahlstrand B, Lampel J (1998). Strategy Safari: The Complete Guide Through the Wilds of Strategic Management, FT Prentice Hall.
MTE.Ministério do Trabalho e Emprego (2007). Dados e Estatísticas. Accessed 15 november 2007. Avaiable at: http://www.mte.gov.br.
Nakamura WT, Mineta RKN (2001). Identificação dos fatores que induzem ao uso do Balanced Scorecardcomo instrumento de gestão estratégica. In: Encontro Da Associação Nacional Dos Programas De Pós-Graduação Em Administração. Campinas. Anais, Campinas, ANPAD.
Nunes et al. 8389 Neely A, Richards JM, Platts K, Bourne M (1997). Designing
performance measures: a structured approach. Int. J. Oper. Prod. Manag. 17(11):1131-1152.
Rea LM, Parker RA (2000). Metodologia de pesquisa: do planejamento à execução. São Paulo, Pioneira.
Richardson RJ (1999). Pesquisa social: métodos e técnicas. 3. ed. São Paulo: Atlas.
Schmidt P (2002). Controladoria: agregando valor para a empresa. Porto Alegre, Bookman.
Schumpeter JA (1934). The theory of economic development. Cambridge, Harvard University Press.