Mice with neuron-specific accumulation of mitochondrial DNA mutations show mood disorder-like...
17
ORIGINAL ARTICLE Mice with neuron-specific accumulation of mitochondrial DNA mutations show mood disorder-like phenotypes T Kasahara 1 , M Kubota 1 , T Miyauchi 1 , Y Noda 2 , A Mouri 2 , T Nabeshima 2 and T Kato 1 1 Laboratory for Molecular Dynamics of Mental Disorders, RIKEN Brain Science Institute, Wako-shi, Saitama, Japan and 2 Department of Neuropsychopharmacology and Hospital Pharmacy, Nagoya University Graduate School of Medicine, Nagoya-shi, Aichi, Japan There is no established genetic model of bipolar disorder or major depression, which hampers research of these mood disorders. Although mood disorders are multifactorial diseases, they are sometimes manifested by one of pleiotropic effects of a single major gene defect. We focused on chronic progressive external ophthalmoplegia (CPEO), patients with which sometimes have comorbid mood disorders. Chronic progressive external ophthalmoplegia is a mitochondrial disease, which is accompanied by accumulation of mitochondrial DNA (mtDNA) deletions caused by mutations in nuclear-encoded genes such as POLG (mtDNA polymerase). We generated transgenic mice, in which mutant POLG was expressed in a neuron-specific manner. The mice showed forebrain-specific defects of mtDNA and had altered monoaminergic functions in the brain. The mutant mice exhibited characteristic behavioral phenotypes, a distorted day–night rhythm and a robust periodic activity pattern associated with estrous cycle. These abnormal behaviors resembling mood disorder were worsened by tricyclic antidepressant treatment and improved by lithium, a mood stabilizer. We also observed antidepressant-induced mania-like behavior and long-lasting irregularity of activity in some mutant animals. Our data suggest that accumulation of mtDNA defects in brain caused mood disorder-like mental symptoms with similar treatment responses to bipolar disorder. These findings are compatible with mitochondrial dysfunction hypothesis of bipolar disorder. Molecular Psychiatry (2006) 11, 577–593. doi:10.1038/sj.mp.4001824; published online 18 April 2006 Keywords: bipolar disorder; chronic progressive external ophthalmoplegia; mitochondria; POLG; lithium; wheel-running activity; circadian rhythm Introduction Mood refers to a prolonged emotion that colors the whole psychic life. As mood is difficult to unequi- vocally define in non-human animals, an animal model of human mood disorder may help the under- standing of biological background of mood. In Diagnostic and Statistical Manual of Mental Disorders (DSM)-IV, 1 mood disorders are divided into bipolar disorders, major depressions, and others. The lifetime prevalence of mood disorders is considerably high; for example, 10–15% for major depression and about 1% for bipolar disorder. Family, twin, and adoption studies have strongly suggested a genetic contribution to the onset of mood disorders, particularly bipolar disorder; however, the etiologies remain largely enigmatic. 2,3 As a potential etiology of the disorder, we have been focusing on mitochondrial dysfunction 4 that was initially sug- gested by altered energy metabolism in the brains of patients as detected by magnetic resonance spectro- scopy (MRS). 5 Genetic analyses of mitochondrial DNA (mtDNA) demonstrated a significant association between several mtDNA polymorphisms or mutations and bipolar disorder. 6–8 MtDNA, inherited only from the mother, contains two ribosomal RNA genes, 22 transfer RNA genes, and 13 protein-encoding genes. All of the 13 gene products function in the mitochon- drial respiratory (electron transport) chain; and, in addition to the mtDNA-encoded proteins, a great number of nuclear genome-encoded proteins are sorted into and function in the mitochondria. Re- cently, the contribution of such mitochondrial pro- tein-encoding nuclear genes to bipolar disorder was revealed by a genetic study 9 and also by genome-wide gene expression analyses. 10,11 Patients with bipolar disorder sometimes show somatic symptoms charac- teristic to mitochondrial diseases, such as ptosis, myophathy, headache, diabetes, etc. 7 Diabetes melli- tus and migraine are especially known to comorbid frequently with the disorder. 12 Conversely, in some pedigrees with hereditary chronic progressive exter- nal ophthalmoplegia (CPEO), a mitochondrial disease caused by multiple deletions of mtDNA, affected Received 10 November 2005; revised 28 February 2006; accepted 3 March 2006; published online 18 April 2006 Correspondence: Dr T Kato, Laboratory for Molecular Dynamics of Mental Disorders, RIKEN Brain Science Institute, 2-1 Hirosawa, Wako-shi, Saitama 351-0198, Japan. E-mail: [email protected] Molecular Psychiatry (2006) 11, 577–593 & 2006 Nature Publishing Group All rights reserved 1359-4184/06 $30.00 www.nature.com/mp
Transcript of Mice with neuron-specific accumulation of mitochondrial DNA mutations show mood disorder-like...

ORIGINAL ARTICLE
Mice with neuron-specific accumulation of mitochondrialDNA mutations show mood disorder-like phenotypesT Kasahara1, M Kubota1, T Miyauchi1, Y Noda2, A Mouri2, T Nabeshima2 and T Kato1
1Laboratory for Molecular Dynamics of Mental Disorders, RIKEN Brain Science Institute, Wako-shi, Saitama, Japan and2Department of Neuropsychopharmacology and Hospital Pharmacy, Nagoya University Graduate School of Medicine,Nagoya-shi, Aichi, Japan
There is no established genetic model of bipolar disorder or major depression, which hampersresearch of these mood disorders. Although mood disorders are multifactorial diseases, theyare sometimes manifested by one of pleiotropic effects of a single major gene defect. Wefocused on chronic progressive external ophthalmoplegia (CPEO), patients with whichsometimes have comorbid mood disorders. Chronic progressive external ophthalmoplegiais a mitochondrial disease, which is accompanied by accumulation of mitochondrial DNA(mtDNA) deletions caused by mutations in nuclear-encoded genes such as POLG (mtDNApolymerase). We generated transgenic mice, in which mutant POLG was expressed in aneuron-specific manner. The mice showed forebrain-specific defects of mtDNA and hadaltered monoaminergic functions in the brain. The mutant mice exhibited characteristicbehavioral phenotypes, a distorted day–night rhythm and a robust periodic activity patternassociated with estrous cycle. These abnormal behaviors resembling mood disorder wereworsened by tricyclic antidepressant treatment and improved by lithium, a mood stabilizer. Wealso observed antidepressant-induced mania-like behavior and long-lasting irregularity ofactivity in some mutant animals. Our data suggest that accumulation of mtDNA defects in braincaused mood disorder-like mental symptoms with similar treatment responses to bipolardisorder. These findings are compatible with mitochondrial dysfunction hypothesis of bipolardisorder.Molecular Psychiatry (2006) 11, 577–593. doi:10.1038/sj.mp.4001824; published online 18 April 2006
Keywords: bipolar disorder; chronic progressive external ophthalmoplegia; mitochondria; POLG;lithium; wheel-running activity; circadian rhythm
Introduction
Mood refers to a prolonged emotion that colors thewhole psychic life. As mood is difficult to unequi-vocally define in non-human animals, an animalmodel of human mood disorder may help the under-standing of biological background of mood. InDiagnostic and Statistical Manual of Mental Disorders(DSM)-IV,1 mood disorders are divided into bipolardisorders, major depressions, and others. The lifetimeprevalence of mood disorders is considerably high;for example, 10–15% for major depression and about1% for bipolar disorder.
Family, twin, and adoption studies have stronglysuggested a genetic contribution to the onset of mooddisorders, particularly bipolar disorder; however, theetiologies remain largely enigmatic.2,3 As a potentialetiology of the disorder, we have been focusing onmitochondrial dysfunction4 that was initially sug-
gested by altered energy metabolism in the brains ofpatients as detected by magnetic resonance spectro-scopy (MRS).5 Genetic analyses of mitochondrialDNA (mtDNA) demonstrated a significant associationbetween several mtDNA polymorphisms or mutationsand bipolar disorder.6–8 MtDNA, inherited only fromthe mother, contains two ribosomal RNA genes, 22transfer RNA genes, and 13 protein-encoding genes.All of the 13 gene products function in the mitochon-drial respiratory (electron transport) chain; and, inaddition to the mtDNA-encoded proteins, a greatnumber of nuclear genome-encoded proteins aresorted into and function in the mitochondria. Re-cently, the contribution of such mitochondrial pro-tein-encoding nuclear genes to bipolar disorder wasrevealed by a genetic study9 and also by genome-widegene expression analyses.10,11 Patients with bipolardisorder sometimes show somatic symptoms charac-teristic to mitochondrial diseases, such as ptosis,myophathy, headache, diabetes, etc.7 Diabetes melli-tus and migraine are especially known to comorbidfrequently with the disorder.12 Conversely, in somepedigrees with hereditary chronic progressive exter-nal ophthalmoplegia (CPEO), a mitochondrial diseasecaused by multiple deletions of mtDNA, affected
Received 10 November 2005; revised 28 February 2006; accepted3 March 2006; published online 18 April 2006
Correspondence: Dr T Kato, Laboratory for Molecular Dynamics ofMental Disorders, RIKEN Brain Science Institute, 2-1 Hirosawa,Wako-shi, Saitama 351-0198, Japan.E-mail: [email protected]
Molecular Psychiatry (2006) 11, 577–593& 2006 Nature Publishing Group All rights reserved 1359-4184/06 $30.00
www.nature.com/mp
members have comorbid mood disorders (Table1).13,14,17,18,20,21 Deleted mtDNA was detected in thepostmortem brains of bipolar patients,22 and MRSfeatures in bipolar disorder23,24 resembled those seenin CPEO.25,26 These findings prompted us to propose‘mitochondrial dysfunction hypothesis of bipolardisorder’,4 and other researchers have recently sup-ported this hypothesis.10,27,28
On the basis of the hypothesis, we planned todevelop a genetically engineered mouse carryingmtDNA deletions in the brain as an animal model.Although there had been no report describing causa-tive genes for CPEO comorbid with mood disorderswhen we started this study in 2001, the pointmutation D181A of mouse mtDNA polymerase(POLG) was reported to ablate the 30-50 exonucleaseactivity without affecting the polymerase activity andto cause mtDNA deletions.29 We generated transgenic(Tg) mice expressing this proofreading-deficientPOLG in the brain. If mtDNA is affected in the wholebody, the mice would suffer from myopathy and otherphysical disorders as observed in patients withmitochondrial diseases. Actually, a mutant POLGknock-in mouse with accumulating mtDNA defectsin the whole body has been recently proven to show avariety of physical symptoms.30,31 Thus, the promoterof Ca2þ/calmodulin-activated protein kinase II a(CaMKIIa), a neuron-specific promoter,32 was used.After we generated the Tg mice, three genes, mtDNAhelicase (Twinkle), adenine nucleotide translocatoron the inner membrane of mitochondria (ANT1), andPOLG, were reported to cause hereditary CPEOcomorbid with mood disorders (Table 1).
Mood disorder is clinically diagnosed by psychia-trists solely based on the symptoms detected byclinical interviews, because there is no establishedbiological marker (i.e. endophenotype). DSM-IV-TR(American Psychiatric Association)1 and Interna-tional Classification of Diseases (ICD)-10 (WorldHealth Organization)33 are most widely used asdiagnostic criteria for mood disorders at the presenttime, but such criteria are difficult to apply straight-forward to non-human animals. Thus, the followingthree validations have been proposed to appraiseanimal models:34,35 (1) face validity, commonaltiesbetween the behavioral features of the model and ofthe human disorder being modeled; (2) constructvalidity, a possible common mechanistic theory thatcan explain both the model and the human disorder;and (3) predictive validity, the efficacy of treatmentdrugs used for human disease for the phenotype ofthe model animal. In this study, we demonstratedmood disorder-like characteristics of the Tg mice withneuron-specific mtDNA defects in accordance withthe validations.
Materials and methods
Generation of transgenic miceA cDNA for mouse POLG was cloned from whole-brainmRNA of C57BL/6J mouse. There were several differ-
ences in nucleotide sequence and deduced amino-acidsequence, between the cDNA we cloned and thesequence that had been recorded in the databases(DDBJ/EMBL/GenBank accession number, U53584; ver-sion U53584.1). Based on the mouse genome sequence(NT_039428, Mus musculus chromosome 7 genomiccontig) and comparison with POLG cDNAs of othermammalian species, we concluded that the recordedsequence contained sequencing errors and we depos-ited the sequence we determined to the public databaseunder accession number AB121698.
The aspartate residue at position 181 of mousePOLG was replaced with an alanine by QuikChangeSite-Directed Mutagenesis Kit (Stratagene, La Jolla,CA, USA) using the following oligonucleotide pri-mers: 50-GCC CTG GTG TTC GCC GTG GAG GTCTGC-30 and 50-GCA GAC CTC CAC GGC GAA CACCAG GGC-30. For the convenience of the transgeneconstruction, two NotI restriction enzyme digestionsites in the POLG coding sequence (CDS) wereremoved by site-directed mutagenesis without alter-ing the amino-acid sequence using the followingoligonucleotide primers: 50-GTC CCC AGC GAC GGTCGG CCG CCG TC-30, 50-GAC GGC GGC CGA CCGTCG CTG GGG AC-30; and 50-CCT TAC TTG GAG GCTGCC GCC TCG-30, 50-CGA GGC GGC AGC CTC CAAGTA AGG-30. The mutant POLG CDS was amplifiedby PCR using the following primers containing eitherXhoI or SfiI site: 50-CTC GAG CCA TGA GCC GCCTGC TCT GGA AGA AG-30 and 50-GGC CAA TTG GGCCTT CCG TTA GGA GGA C-30. After subcloning andchecking of the sequence, the XhoI–SfiI fragment wasisolated, blunt-ended, and inserted into the EcoRVsite of pNN265 (a gift from Dr Mark Mayford) to giverise to pNN265-mutPOLG. A NotI fragment contain-ing the SV40 small-T antigen intron and earlypolyadenylation sequences as well as the mutantPOLG CDS was isolated from pNN265-mutPOLG andinserted into pMM403 plasmid (a gift from Dr MarkMayford), which contains the promoter of mouseCa2þ/calmodulin-activated protein kinase II a (CaM-KIIa).32 The final plasmid pMM403-mutPOLG wasmaintained in Stbl2 cells (Invitrogen) incubated at301C. The linearized transgene construct, releasedfrom the plasmid vector by SfiI digestion, wasmicroinjected into 894 fertilized eggs from C57BL/6Jmice, and the transgenic offspring were screened byPCR using the following primers: 50-TTG AGG TTTTCC AGC AGC AG-30 and 50-AAG GAC TCG ATG GCTCTG TAG G-30. Three transgenic offspring wereobtained by the screening of 27 weaned pups.
The Animal Experiment Committee of RIKENapproved all animal experiment protocols. Transgenicmice were always used as heterozygotes, and controlswere non-Tg littermates as far as possible. Female Tgmice were not used for breeding in order to preventtransmission of mutated mtDNA from mothers topups, although expression of the transgene is re-stricted in neuronal tissues. Therefore, only male Tgmice were mated with wild-type mice (C57BL/6J)purchased from CLEA Japan (Tokyo, Japan).
A genetic animal model for mood disorderT Kasahara et al
578
Molecular Psychiatry

Transgene mRNA expression analysisTotal RNAs were extracted from five areas of thebrain (frontal lobe, hippocampus, (other) cortex, basalganglia, and cerebellum) and various somatic tissuesusing TRIzol reagent (Invitrogen). DNase I-treatedtotal RNA was reverse-transcribed using the anchoroligo(dT) primer (50-TTT TTT TTT TTT TTT TV-30),and the cDNA was used for quantification of relativemRNA levels detected by real-time PCR technologywith SYBR Green PCR Master Mix (Applied Biosys-tems). The relative levels of each mRNA werecalculated by 2�CT (CT standing for the cycle numberat which the signal reached the threshold) andnormalized to the corresponding GAPDH mRNAlevels. Each CT value used for these calculationswas the mean of quadruplicate of the same reaction.Before we performed this assay for POLG mRNAexpression, we developed two pairs of PCR primersthat annealed at the site-direct mutagenesis positionsand amplified specifically either mutant (transgenic)or wild-type (endogenous) POLG cDNA. The follow-ing primers were used: mutant POLG primers, 50-CTGCCT TAC TTG GAG GCT-30 and 50-CAA GCA GACCTC CAC GG-30; wild-type POLG primers, 50-CTGCCT TAC TTG GAG GCG-30 and 50-CAA GCA GACCTC CAC GT-30; and GAPDH primers 50-TGC ACCACC AAC TGC TTA G-30 and 50-GGA TGC AGG GATGAT GTT C-30.
Assessment of mtDNA deletions and mutations inmouse tissues
Southern blot analysis. DNA was isolated frommouse tissues of various ages using automatic DNAisolation system PI50 (Kurabo, Osaka, Japan) anddigested with BglII, which cuts once the C57BL/6Jmouse mtDNA (AY172335). The digested DNA (4 mgper lane) was electrophoresed on 0.8% agarose gel,treated with 0.25 M HCl for 5 min, and transferredonto a nylon membrane (Hybond-Nþ , AmershamBiosciences) by capillary blotting with 0.4 M NaOH.The membranes were hybridized with a digoxigenin(DIG)-labeled DNA probe at 421C overnight in DIGEasy hybridization buffer (Roche Diagnostics GmbH,Mannheim, Germany) following to pre-hybridizationwith the same buffer at 421C for 1 h. The hybridizedmembrane was washed at 681C in 0.5� SSC, 0.1%SDS, and hybridization signals were detected byusing DIG Luminescent Detection Kit (RocheDiagnostics) and a luminescent image analyzer(LAS-3000, Fujifilm, Tokyo, Japan). DIG-labeledDNA probes for control region of mouse mtDNAwere prepared from plasmid clones by using PCR DIGProbe Synthesis Kit (Roche Diagnostics). The controlregion was isolated by PCR from liver DNA of aC57BL/6J mouse using the following primer set: 50-GCT AGT ACA TTA AAT CAA TGG TTC AGG-30 and50-CTA CTA GAA TTG ATC AGG ACA TAG G-30. ThePCR products amplified with LA Taq DNApolymerase (Takara Bio, Shiga, Japan) were clonedin pCR2.1-TOPO plasmid vector (Invitrogen) andverified the sequences. These primers were also
used to prepare DIG-labeled probes using PCR DIGProbe Synthesis Kit.
PCR amplification, cloning, and sequencing of smallmtDNA. Three sets of PCR primers, of which 30 endswere almost adjacent, were designed to anneal to thecontrol region of mouse mtDNA as follows: set A, 50-GCT AGT ACA TTA AAT CAA TGG TTC AGG-30 and50-CGA TAT ACA TAA ATG TAC TGT TGT ACT ATG-30; set B, 50-GTC TAG ACG CAC CTA CGG TG-30 and50-TGT GTG CTG TCC TTT CAT GCC-30, and set C, 50-AAC TCT AAT CAT ACT CTA TTA CGC-30 and 50-CTACTA GAA TTG ATC AGG ACA TAG G-30. Using theseprimer sets, short-extension PCR was employed toamplify small mtDNAs. The thermal cycling protocolused was 951C for 20 s, 551C for 30 s, 721C for 90 s for28–30 cycles. LA Taq DNA polymerase was usedwhen the PCR products were subsequently clonedand sequenced; or otherwise Ex Taq DNA polymerase(Takara Bio) was used. The PCR products were clonedinto pCR2.1-TOPO plasmid vector and sequenced.
Mutation search in mtDNA. MtDNA fragmentscorresponding to the control region and ND4-codingregion were amplified from DNA extracted from thehippocampus of a 68-week-old Tg mouse or a non-Tglittermate by PCR using the same primers described inabove Southern blot analysis. The PCR productsamplified with PfuUltra DNA polymerase(Stratagene) were cloned in pCR-blunt II-TOPOplasmid vector (Invitrogen), and sequenced. Weperformed PCR and cloning two times andsequenced total B100 independent clones toanalyze the Tg sample.
Conventional behavioral testsProcedures for the behavioral tests are provided in theSupplementary information.
Quantitative determination of monoamines and theirmetabolitesThree weeks after the conventional test battery, themale mice (n = 8 for each genotype) were also used forthe analysis of monoamine levels. After decapitation,each brain region was dissected on ice, and stored at�801C until use. Tissues were homogenized by anultrasonic homogenizer following addition of aninternal standard (isoproterenol) and perchloric acid.After centrifugation, pH of the filtered supernatantwas adjusted by sodium acetate. The contents ofmonoamines and their metabolites were determinedusing an HPLC system with an electrochemicaldetector as described previously.36
Long-term recording of wheel-running activity andanalysisMice were individually housed in cages (24 cmwide� 11 cm deep� 14 cm high) equipped with asteel wheel (5 cm wide� 14 cm in diameter). Wheel-running activity (3 counts per rotation) was mon-itored by an online PC computer system (O’Hara &Co., Tokyo, Japan). LD 12:12 h cycles (lights on at
A genetic animal model for mood disorderT Kasahara et al
579
Molecular Psychiatry

0800 JST) were controlled by an automatic timer.Light was provided by a white fluorescent tube andthe light intensity was 30–50 lux at the level ofmouse’s eyes in the cage. Food and water wereavailable ad libitum at all time. We supplemented orchanged water and food towards the end of the lightperiod. In the case of females, only virgin mice wereused. Some of mice did not learn the wheel running atall or stopped for several days presumably due toobstruction by chips for bedding. Data from thesemice were not used in the following analyses. Inaddition, since it takes about 1 week till mice wereused to the wheel running, data of the first 7–10 daysof each recording were omitted.
Delayed and anticipatory activity indices. Delayedactivity index is defined as a percent of the activityduring the first 3 h of the light period with the totalactivity during the previous dark period (12 h).Anticipatory activity index is defined as a percent ofthe activity during the last 3 h of the light period withthe activity during the following dark period (12 h).
Lomb–Scargle periodogram. To detect periodiccomponents with duration of 4–5 days in the wheel-running activity of female mice, we used the Lomb-Scargle periodogram, a modified method of theFourier spectrum analysis.37
Day-to-day variation. Day-to-day variation in wheel-running activity was estimated by the unevenness indaily wheel-running activity that is a total number ofcounts of wheel running per day. Day-to-day variationduring a certain period (days 1–N) is calculated asfollows:
FN ¼
ffiffiffiffiffiffiffiffiffiffiffiffiffiffiffiffiffiffiffiffiffiffiffiffiffiffiffiffiffiffiffiffiffiffiffiffiffiffiffiffiffiffiffiffiffi1
N
X1pipN
faðiÞ � mg2
sP
1pipN
aðiÞ
where a(n) indicates a daily wheel-running activity ofday n, and m is a mean value of daily wheel-runningactivities
m ¼ 1
N
X1pipN
aðiÞ !
:
DrugsAmitriptyline (AMT) hydrochloride (Sigma-Aldrich,St. Louis, MO, USA) was administered in drinkingwater at a concentration of 200 mg l�1. The plasmalevel of AMT after 10-days administration wasexamined by HPLC in a preliminary experiment(JCL Bioassay, Nishiwaki, Japan). The level of AMTwas 7.979.1 ng ml�1. Lithium was administered inthe diet at a concentration of 2.4 g Li2CO3 per 1 kg dryfood (Oriental Yeast Co., Tokyo, Japan). In a pre-liminary experiment, we administered Li2CO3-con-taining diet at various concentrations (1.6, 2.0, and2.4 g kg�1) to C57BL/6J mice for 4 weeks. The plasma
levels of Liþ , measured by atomic absorption spectro-scopy (SRL Inc., Tokyo, Japan), were 0.4270.11 mM
(mean7s.d.), 0.5170.05, and 0.6370.17, respec-tively. The amount of drinking water consumed bymice given the Li2CO3-containing diet (2.4 g kg�1) wasapproximately 2.5 times more than the control miceeating a normal diet.
Results
Generation of transgenic mice with accumulatingmtDNA mutations in the brainWe designed a transgene construct comprising acoding sequence for the mutant mouse POLG(mPOLG) (D181A) operatively linked to the CaMKIIapromoter (Figure 1a) and generated Tg mice using astandard method. Among three lines (A, B, and C) ofTg mice established, mutant mPOLG mRNA was mostabundantly expressed in the brain in line B, weakly inline C, and only marginally in line A (data notshown). Hence, line B was used to analyze in detail.We analyzed the mPOLG expression in the varioustissues of mice (20 weeks old) of line B by quantitativeRT-PCR. The transgenic mutant mPOLG mRNA was asabundant as the endogenous (wild-type) mPOLGmRNA in the most parts of forebrain, and the mutantmPOLG expression was nearly restricted in the brain(Figure 1b).
MtDNA defects in the brain of transgenic miceWe first performed Southern blot analysis to assessmtDNA deletions in the Tg mice. Using a probe for thecontrol region of mtDNA (see Figure 1d), deletedmtDNAs of approximately 2 kb were found in thebrain (frontal lobe, hippocampus, other cortex, andbasal ganglia) of 68-week-old Tg mouse (Figure 1c).The small mtDNAs were not found in the non-Tglittermate, and neither in the other tissues of the Tgmouse, such as cerebellum, liver, and kidney. Inanother independent experiment using much olderTg mice (98 weeks old), the deleted mtDNAs weresurely detected in the forebrain but not in the somatictissues, liver, heart, and skeletal muscle (data notshown). This tissue-specific occurrence of the smallmtDNA was in accordance with the expressionpattern of mutant POLG mRNA in Tg mice (Figure1b). We also assayed younger mice and found thesmall mtDNAs in Tg mice of 17, 23, and 38 weeks old,but not in 8-week-old Tg mice and in any non-Tglittermates (Supplementary Figure S1). The deletedmtDNA was accumulated first in the hippocampusand cortex (17 weeks old). This may also beaccounted for by the tissue-dependent difference inmutant POLG expression level (Figure 1b). The smallmtDNAs (0.5–2.5 kb) were cloned by PCR andsequenced, revealing that the deletion breakpoints(rearrangement points) had diverse sequences (Figure1d and Supplementary Figure S2). Next, we investi-gated whether point mutations of mtDNA wereaccumulated in the brain of Tg mice. The controlregion of mtDNA was amplified by PCR using DNA
A genetic animal model for mood disorderT Kasahara et al
580
Molecular Psychiatry

extracted from 68-week-old littermates as a templateand cloned into a plasmid vector. We sequencedapproximately 100 clones and found point mutationsin the Tg mouse (6 of 48,114 bases), but not in thenon-Tg littermate (0 of 23,814 bases). The content ofmtDNA was not influenced in the Tg mice byoverexpression of POLG, though deletions and muta-tions in mtDNA were accumulated (Figure 1c).
Conventional behavioral testsThe Tg mice weighed approximately 10% less thantheir non-Tg littermates (Supplementary Figure S3a).We measured voluntary food intake and body weightin male Tg and their non-Tg littermates (21–28 weeks
old, n = 10 for each genotype) and observed that Tgmice ate less than non-Tg mice (SupplementaryFigure S3b). However, there was no significantdifference in food intake per body weight betweenthe genotype, suggesting that lower body weight of Tgmice corresponded to reduced food intake. The Tgmice did not differ from their non-Tg littermates inphysical health, fertility, and longevity except forlower weight; and no gross abnormality of brainstructure was noted by visual or microscopic inspec-tion.
Motor function and fatigue resistance assessed byrotarod and treadmill tests, respectively. The testswere performed with 22–29-week-old male mice.
Figure 1 Specific expression of mutant POLG in the forebrain of transgenic (Tg) mice. (a) Schematic representation of themutant POLG transgene construct used for generation of the Tg mice. A cDNA encoding proofreading-deficient POLG(D181A) was placed under the control of the CaMKIIa promoter. (b) Expression levels of the mutant and intrinsic mPOLGmRNAs measured by quantitative RT-PCR. Seven tissues indicated were dissected from Tg mice and non-Tg littermates (20weeks old). mRNA levels for transgenic (mutant) mPOLG and endogenous (wild-type) mPOLG, normalized to that for mouseGAPDH, are indicated as the mean7s.e.m. (n = 3). ND, not detected. (c) Accumulation of mtDNA defects detected bySouthern blot analysis using a probe for the control region of mtDNA. Arrows indicate small mtDNAs with large-scaledeletions. Full-length mtDNA was indicated by arrowheads, and asterisks represent possible 7S DNA forming thedisplacement loop (D-loop) at the control region of mtDNA.69 Results in mice of other ages are shown in SupplementaryFigure S1. (d) Molecular identification of small circular mtDNA. A schematic diagram of a full-length mouse mtDNA (top).Short-extension PCR using primers oriented in opposing directions amplified the small mtDNA, and the PCR products wereelectrophoresed on an agarose gel (middle). A typical representation of cloned PCR products of the circular small mtDNA(bottom). Letters in red indicate the rearrangement site where mispairing occurred, and dots point to same bases located inthe two regions in mtDNA. In this case, a mispairing occurred between imperfect repeats around nucleotides 105–135 and14381–14411 of mtDNA (L-strand), resulting a small circular mtDNA of 2,023 bp. Other small mtDNAs identified are shownin Supplementary Figure S2.
A genetic animal model for mood disorderT Kasahara et al
581
Molecular Psychiatry
There was no significant difference in these perfor-mances between Tg and non-Tg mice (SupplementaryFigure S4), indicating that the Tg mice have normalmotor coordination and normal fatigue resistance.
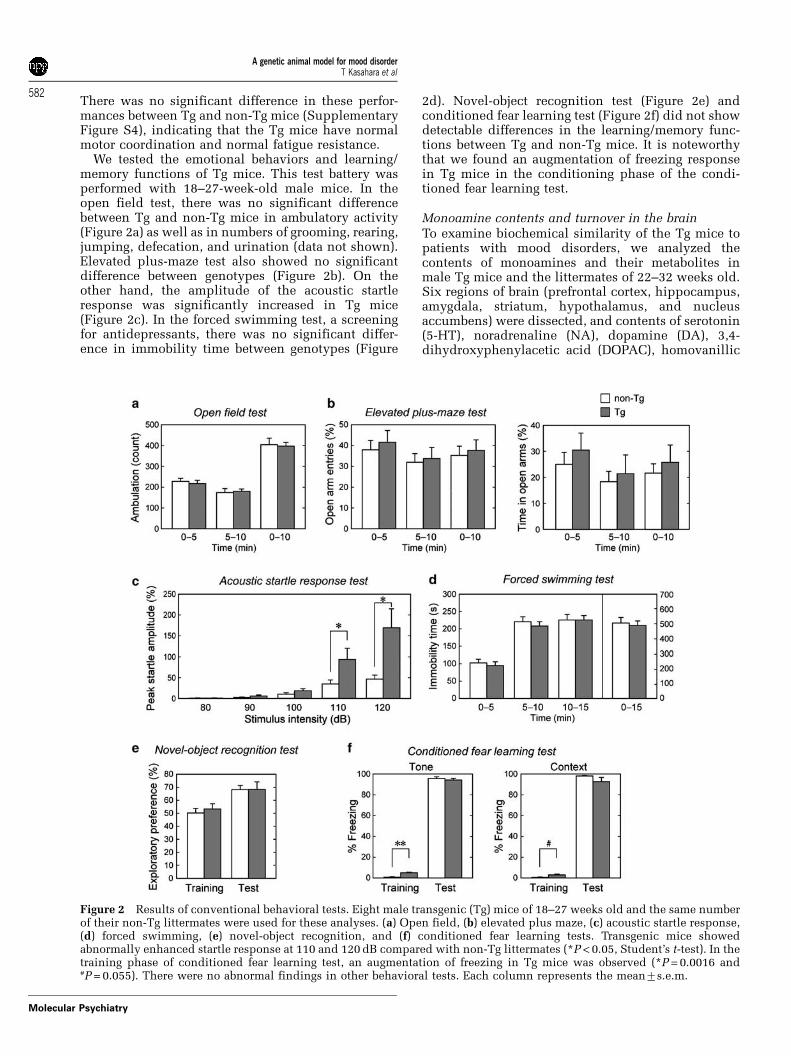
We tested the emotional behaviors and learning/memory functions of Tg mice. This test battery wasperformed with 18–27-week-old male mice. In theopen field test, there was no significant differencebetween Tg and non-Tg mice in ambulatory activity(Figure 2a) as well as in numbers of grooming, rearing,jumping, defecation, and urination (data not shown).Elevated plus-maze test also showed no significantdifference between genotypes (Figure 2b). On theother hand, the amplitude of the acoustic startleresponse was significantly increased in Tg mice(Figure 2c). In the forced swimming test, a screeningfor antidepressants, there was no significant differ-ence in immobility time between genotypes (Figure
2d). Novel-object recognition test (Figure 2e) andconditioned fear learning test (Figure 2f) did not showdetectable differences in the learning/memory func-tions between Tg and non-Tg mice. It is noteworthythat we found an augmentation of freezing responsein Tg mice in the conditioning phase of the condi-tioned fear learning test.
Monoamine contents and turnover in the brainTo examine biochemical similarity of the Tg mice topatients with mood disorders, we analyzed thecontents of monoamines and their metabolites inmale Tg mice and the littermates of 22–32 weeks old.Six regions of brain (prefrontal cortex, hippocampus,amygdala, striatum, hypothalamus, and nucleusaccumbens) were dissected, and contents of serotonin(5-HT), noradrenaline (NA), dopamine (DA), 3,4-dihydroxyphenylacetic acid (DOPAC), homovanillic
Figure 2 Results of conventional behavioral tests. Eight male transgenic (Tg) mice of 18–27 weeks old and the same numberof their non-Tg littermates were used for these analyses. (a) Open field, (b) elevated plus maze, (c) acoustic startle response,(d) forced swimming, (e) novel-object recognition, and (f) conditioned fear learning tests. Transgenic mice showedabnormally enhanced startle response at 110 and 120 dB compared with non-Tg littermates (*P < 0.05, Student’s t-test). In thetraining phase of conditioned fear learning test, an augmentation of freezing in Tg mice was observed (*P = 0.0016 and#P = 0.055). There were no abnormal findings in other behavioral tests. Each column represents the mean7s.e.m.
A genetic animal model for mood disorderT Kasahara et al
582
Molecular Psychiatry
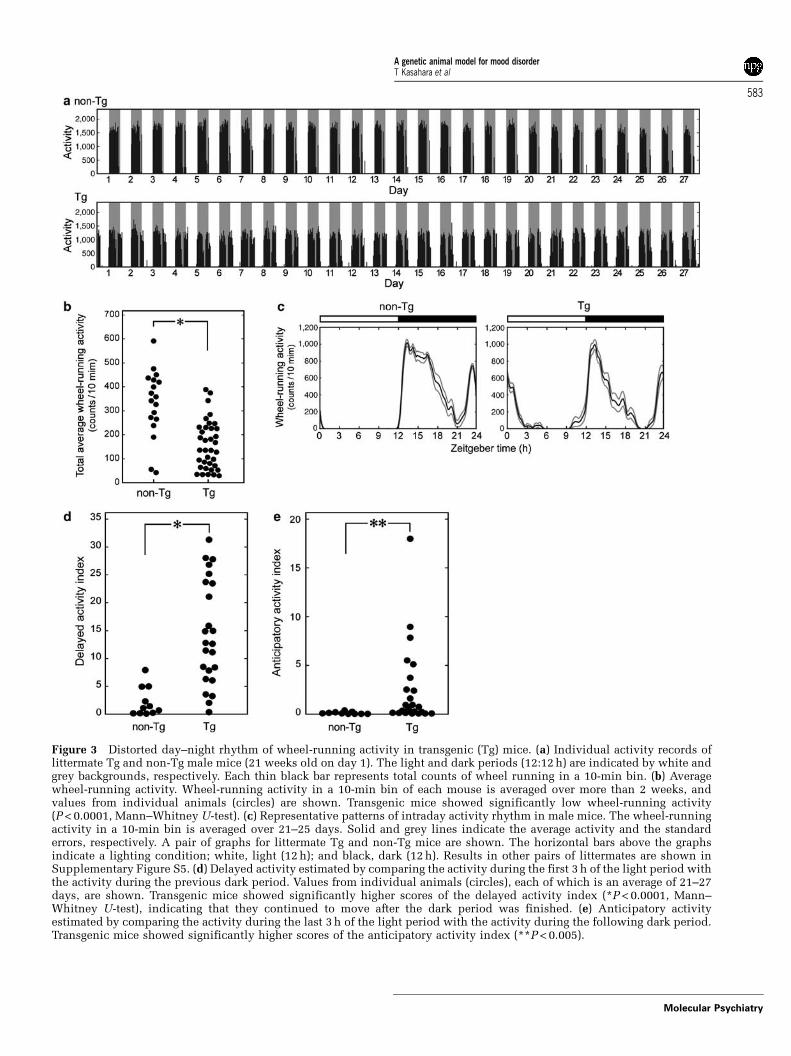
Figure 3 Distorted day–night rhythm of wheel-running activity in transgenic (Tg) mice. (a) Individual activity records oflittermate Tg and non-Tg male mice (21 weeks old on day 1). The light and dark periods (12:12 h) are indicated by white andgrey backgrounds, respectively. Each thin black bar represents total counts of wheel running in a 10-min bin. (b) Averagewheel-running activity. Wheel-running activity in a 10-min bin of each mouse is averaged over more than 2 weeks, andvalues from individual animals (circles) are shown. Transgenic mice showed significantly low wheel-running activity(P < 0.0001, Mann–Whitney U-test). (c) Representative patterns of intraday activity rhythm in male mice. The wheel-runningactivity in a 10-min bin is averaged over 21–25 days. Solid and grey lines indicate the average activity and the standarderrors, respectively. A pair of graphs for littermate Tg and non-Tg mice are shown. The horizontal bars above the graphsindicate a lighting condition; white, light (12 h); and black, dark (12 h). Results in other pairs of littermates are shown inSupplementary Figure S5. (d) Delayed activity estimated by comparing the activity during the first 3 h of the light period withthe activity during the previous dark period. Values from individual animals (circles), each of which is an average of 21–27days, are shown. Transgenic mice showed significantly higher scores of the delayed activity index (*P < 0.0001, Mann–Whitney U-test), indicating that they continued to move after the dark period was finished. (e) Anticipatory activityestimated by comparing the activity during the last 3 h of the light period with the activity during the following dark period.Transgenic mice showed significantly higher scores of the anticipatory activity index (**P < 0.005).
A genetic animal model for mood disorderT Kasahara et al
583
Molecular Psychiatry

acid (HVA), and 5-hydroxyindoleacetic acid (HIAA)were measured (Table 2). Level of 5-HT was signifi-cantly decreased in the amygdala (67%) and hippo-campus (86%) of Tg mice compared with non-Tglittermates. Serotonin turnover, assessed by the ratioof 5-HIAA to 5-HT (5-HIAA/5-HT), was significantlyincreased in both the regions. Decreased level of NAwas also found. DA was increased in the hippocam-pus of Tg mice, whereas decreased in the amygdala.DA turnover, assessed by DOPAC/DA or HVA/DA,was increased in the amygdala and decreased in thehippocampus.
Long-term recording of wheel-running activity
Male Tg mice and their non-Tg littermates weremaintained on a 12-h light/12-h dark (LD) cycle, andtheir wheel-running activities were recorded for morethan 1 month. While no apparent periodic change inwheel-running activity was observed up to 2 months’recording (Figure 3a), total wheel-running activity wassignificantly smaller in Tg mice compared with theirlittermates (P < 0.0001) (Figure 3b). Moreover, wefound that the Tg mice exhibited quite a distinctpattern of within-a-day activity. Tg mice showedcontinued activity after the light was on and untimelyactivity before the light off, in contrast to non-Tg mice,which had clear day–night variation (diurnal rhythmi-city) (Figure 3c and Supplementary Figure S5). Toanalyze the phenomena quantitatively, we defined‘delayed activity index’ and ‘anticipatory activityindex’. These are the rates of the activity level in thefirst and last 3 h of the light period, respectively, to thatin the successive 12-h dark period. Transgenic miceshowed significantly higher scores of both delayed andanticipatory activity indices (P < 0.0001 and P < 0.005,respectively) (Figure 3d and e). To test whether thiswas caused by impairment of the circadian clockmachinery or not, we recorded the wheel-runningactivity under the constant dark condition. Therewas no significant difference in free-runningperiod (Tg, 23.8270.14 h (mean7s.d.); and non-Tg,23.8270.10 h), and Tg mice never exhibited arrhyth-mic activity over 1 month in constant darkness (seeSupplementary Figure S7).
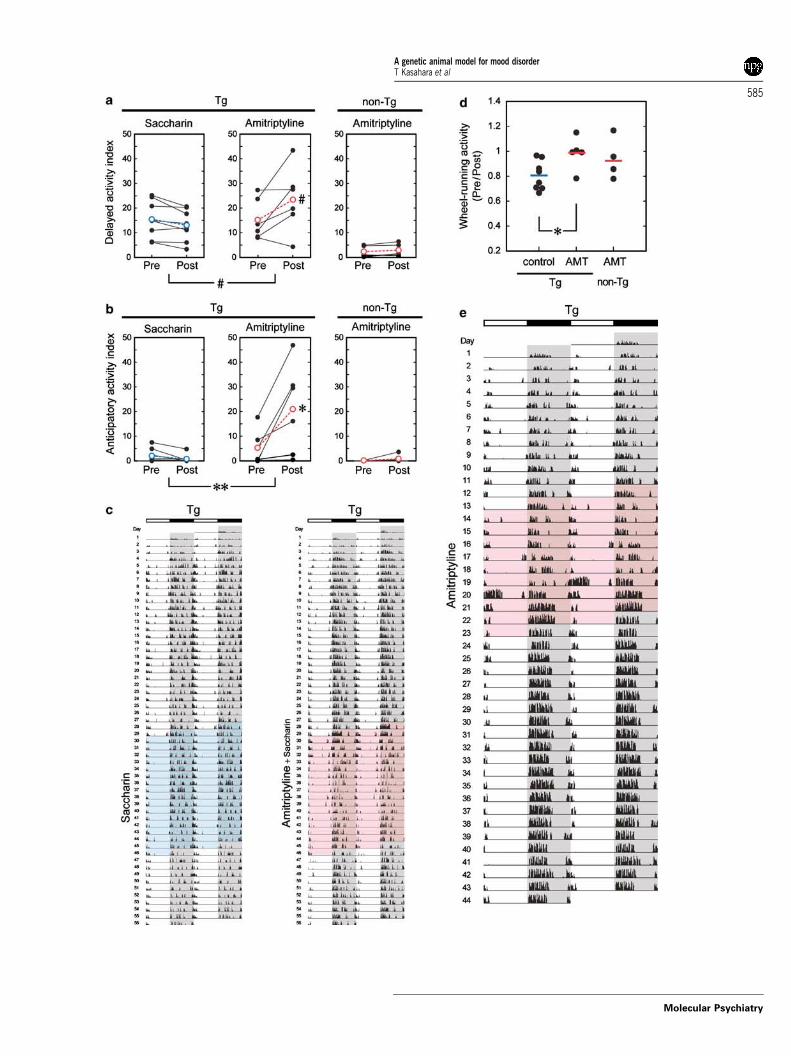
Tricyclic antidepressant-induced activity change intransgenic miceWhile tricyclic antidepressants are effective for majordepression, it is liable to cause antidepressant-induced mania in bipolar disorder.38 To test thebehavioral consequence of tricyclic antidepressantin the Tg mice, we orally administered amitriptyline(AMT). During the course of preliminary experiments,we found that addition of AMT into drinking water(0.02%) reduced the water intake and sometimesdisturbed physical health in mice. Supplementationof saccharin to AMT-containing water reportedlyimproves water intake.39 Hence, we performed twoexperiments; one was comparison between distilledwater with and without AMT, and the other wascomparison between saccharin (2%)-containing waterwith and without AMT. In the former experiments,AMT in drinking water was administered for 7 or 10days to minimize the effects on physical healthcaused by dehydration. In the latter experiment,saccharine-containing water with or without AMTwas administered for 17 days.
In the experiment using addition of saccharin, Tgmice showed significant worsening of both delayedand anticipatory activity indices by AMT treatment(Figure 4a–c). AMT did not affect non-Tg mice. Twoof eight Tg mice and one of five non-Tg mice couldnot survive the experiments of AMT in drinking waterwithout saccharin possibly due to dehydration. As aresult of the high incidence of death and disturbedgeneral health, a statistical analysis was not appliedto this experiment. Among the six surviving Tgmice, two mice administered with AMT for 10 daysshowed antidepressant-induced mania-like behavior-al change. Both mice exhibited prominent wheel-running activity for several hours in the light periodon the 4th or 7th day of AMT treatment (Figure 4e,day 20). After this, one mouse became markedlyhyperactive than before, and this hyperactive statelasted at least 3 weeks (Figure 4e). This manic switch-like phenomenon was not seen in non-Tg mice. In theexperiment using addition of saccharin, AMT treat-ment significantly increased wheel-running activitylevel after the termination of the treatment comparedwith saccharin (P < 0.02) (Figure 4d).
Figure 4 Effect of tricyclic antidepressant treatment on transgenic (Tg) mice. The tricyclic antidepressant AMT withsaccharin was administered for 17 days to Tg and non-Tg male mice (26–45 weeks old). (a–c) Delayed (a) and anticipatory (b)activity indices were estimated on the basis of the activity levels before (Pre) and during (Post) the treatment. Values fromindividual animals are indicated by closed circles connected with solid lines, and average values are indicated by coloredopen circles (red or blue) connected with dashed lines. Anticipatory activity index of Tg mice was significantly increased byAMT treatment (*P < 0.01, paired t-test), and this was also shown by the comparison of a post-to-pre ratio between the AMT-treated and control groups (**P < 0.01, Mann–Whitney U-test). Delayed activity index of Tg mice tended to be increased byAMT treatment (xP < 0.1). Double-plotted activity records of these mice are shown in (c). (d) Effect of AMT treatment onwheel-running activity. Values from individual animals (circles) as well as group average values (horizontal bars) are shown.Compared with saccharin, AMT treatment significantly increased the wheel-running activity of Tg mice (*P < 0.02). (e) Adouble-plotted activity record of a Tg mouse treated with AMT alone for 10 days. The animal (22 weeks old on day 1) showedmanic switch-like behavior on day 20 (the sixth day of the treatment) and exhibited higher activity from the day until the endof recording.
A genetic animal model for mood disorderT Kasahara et al
584
Molecular Psychiatry
A genetic animal model for mood disorderT Kasahara et al
585
Molecular Psychiatry

Estrous cycle-associated fluctuation in wheel-runningactivity of female transgenic miceWe also measured long-term wheel-running activityin female Tg mice. As shown in Figure 5a, cyclicactivity change with a period of 4–5 days wasobserved in most of the Tg mice, but hardly in non-Tg mice (Supplementary Figure S6). The statisticallysignificant periodicity of activity, calculated byLomb–Scargle periodogram,37 was more frequentlyseen in Tg mice (9–45 weeks old) compared with non-Tg (24 of 26 Tg mice tested vs 2 of 9 non-Tg mice;P < 0.0002, Fisher’s exact probability test). This cyclicactivity change with a period of 4–5 days in the Tgmice was maintained in the constant dark condition(Supplementary Figure S7). Since the observedperiod length was similar to that of the estrous cycleof mice and this periodicity in Tg mice disappearedafter ovarectomy (data not shown), we concluded thatthe fluctuation with a period of 4–5 days wasassociated with the estrous cycle. Transgenic miceof 9–40 weeks old showed this periodicity, which wasmost prominent at 30–40 weeks after birth, and thefluctuation almost disappeared at the age of 60 weeks(Figure 5b). Estrous cycle of female C57BL/6 micebecomes irregular around 40–56 weeks after birth andceases at 72–80 weeks.40 In the Tg mice, activity washigher in the proestrus and lower in the other stages,estrus, metestrus, and diestrus (Figure 5c). Thedelayed activity increased during the estrus, metes-trus, and diestrus (Figure 5c, arrows), when wheel-running activity was reduced. Similarly to the case ofmale mice (Figure 3b), average wheel-running activitywas significantly smaller in female Tg mice than non-Tg mice (P < 0.00005) (Figure 5d).
Some female Tg mice (approximately 5%) exhibitedmarked variability in the wheel-running activityrhythm with a longer time frame. Two case reportsare presented in Supplementary Figure S8.
Lithium attenuates the cyclic activity change of femaletransgenic miceLithium is the first choice treatment for both bipolardepression (depressive state of bipolar disorder) andmania,41 and is also used for treatment resistant majordepression as augmentation therapy.42 After the base-line measurement of wheel-running activity for 4
weeks, a diet containing lithium carbonate (0.24%)was given to the female Tg mice (23–34 weeks old atthe beginning of the recording) for additional 4 weeks.Periodic activity fluctuation gradually diminishedafter lithium treatment (Figure 6a). During 1–3 weeksafter lithium administration, none of seven Tg micetreated with lithium had statistically significant(P < 0.05) periodicity of 4–6 days (96–144 h), whilefive of six control Tg mice given a normal chow hadsignificant periodicity (P < 0.005, Fisher’s exact prob-ability test) (Supplementary Figure S9). Day-to-dayvariation in the wheel-running activity (see Materialsand Methods) was found to be decreased significantlyin the Tg mice treated with lithium compared withthose receiving a control diet (P = 0.046) (Figure 6b).Improvement of the delayed activity index tended tobe better in the Tg mice treated with lithium thanthose receiving a normal control diet (Figure 6c). Thechange in wheel-running activity before and after thetreatment did not differ between lithium-containingand control diets (Figure 6d). The palliative effect oflithium on the cyclic activity change was consistentlyobserved in two independent experiments.
Discussion
In this study, we developed mutant POLG Tg micewith neuron-specific accumulation of mtDNA defectsand analyzed the behavioral characteristics of themice. We would like to propose that the geneticallyengineered mice fulfill all of the following threecriteria for the validity as an animal model of mooddisorder.
Construct validityWe generated the mutant POLG Tg mouse based onthe several lines of evidence; mood disorder is acharacteristic symptom of CPEO in some pedigrees(Table 1), and patients with bipolar disorder havealtered brain energy metabolism23,24 and deletedmtDNA in the brain22 as observed similarly in CPEOpatients. In the Tg mice, deletions and mutations ofmtDNA were produced in the forebrain as expected(Figure 1c, d and Supplementary Figure S1), indicat-ing that the Tg mice closely mimic the CNS involve-ment of CPEO patients and bipolar patients with
Figure 5 Periodic activity change associated with estrous cycle in female transgenic (Tg) mice. (a) A representative wheel-running activity record of a female Tg mouse (27 weeks old on day 1). The light and dark periods (12:12 h) are indicated bywhite and grey backgrounds, respectively. This mouse showed higher activity on days 3, 8, 13, 18, 23, 28, 33, 38, and 43;thus, a clear 5-day pattern of wheel-running activity was seen. (b) The periodic activity change of female Tg mice of variousages. The counts of wheel running per day are totaled and plotted in red (Tg) or blue (non-Tg). Ages of the littermate mice areindicated on each panel. Double-plotted activity records of these mice are shown in Supplementary Figure S6. (c) Individualpatterns of the estrous cycle-dependent day–night activity rhythm. The wheel-running activity levels of the 30-week-oldlittermate mice shown in (b) are averaged over 6 estrous cycles. The estrous stages were estimated by vaginal smear test. Thelight and dark periods are indicated by white and grey backgrounds, respectively. Arrows indicate remarkable delayedactivity of the Tg mouse. (d) Wheel-running activity in a 10-min bin of each mouse is averaged over more than 2 weeks, andvalues from individual animals (circles) are shown. The Tg mice showed significantly lower wheel-running activity(*P < 0.00005; Mann–Whitney U-test). Transgenic mice with very low activities were more frequently observed in males(Figure 3b) than females.
A genetic animal model for mood disorderT Kasahara et al
586
Molecular Psychiatry

suspected mitochondrial dysfunction. Recently, wefound rare missense mutations of POLG causingmtDNA defects in a few patients with bipolar disorder
(unpublished data). Therefore, the strategy of devel-oping the mutant POLG Tg mice is most likely to beadequate to satisfy the construct validity. We suppose
A genetic animal model for mood disorderT Kasahara et al
587
Molecular Psychiatry

Figure 6 Effects of lithium on the abnormal pattern in wheel-running activity of female transgenic (Tg) mice. (a) Individualtime course of total wheel-running activity per day. Lithium was given in diet (0.24%) as a carbonate salt (Li2CO3) from day27 until the end of the recording. Plasma lithium concentration was determined after the recording and is shown on eachgraph. (b) Improvement of day-to-day variation in wheel-running activity by lithium treatment. Day-to-day variation (F) wasestimated on the basis of the activity levels before (Fpre) and during (Fpost) the treatment (days 10–26 and 34–50, respectively).Values from individual animals (circles) as well as group average values (horizontal bars) are shown. Lithium dietsignificantly lowered the day-to-day variation of Tg mice compared with a control diet (*P < 0.05, Mann–Whitney U-test). (c)Improvement of delayed activity seen in Tg mice by lithium treatment. Delayed activity index was estimated on the basis ofthe activity levels before (Pre) and during (Post) the treatment. Values from individual animals are indicated by closed circlesconnected with solid lines, and average values are indicated by open circles connected with dashed lines. Delayed activityindex was significantly decreased by lithium treatment (*P < 0.05, paired t-test), and this was supported by the comparison ofa post-to-pre ratio between the lithium-treated and control groups (xP < 0.1, Mann–Whitney U-test). (d) No obvious effect oflithium on the wheel-running activity of Tg mice. Wheel-running activity levels before (Pre) and during (Post) the treatment(days 10–26 and 34–50, respectively) are averaged, and the ratios from individual animals (circles) as well as group averagevalues (horizontal bars) are shown.
A genetic animal model for mood disorderT Kasahara et al
588
Molecular Psychiatry

that the mitochondrial dysfunction hypothesis canexplain the pathophysiology of at least some portionof patients with bipolar disorder.
Face validityBy analyzing wheel-running activity for more thanone month, we revealed that these Tg mice haddistinctive behavioral abnormalities. One of the mostprominent phenotypes of Tg mice is reduced wheel-running activity (Figures 3b and 5d). Wheel runningis a voluntary behavior and self-reinforcing forrodents.43,44 According to the results of the conven-tional behavioral tests (Figure 2 and SupplementaryFigure S4), the reduced wheel-running activity isunlikely to be attributable to any abnormalities insensorimotor systems, motor functions, or fatigueresistance. Lack of detection of mtDNA deletions inthe skeletal muscles and heart also support this.Therefore, the Tg mice are likely to have reducedmotivation for the voluntary activity. The Tg micealso showed altered intra-day activity rhythm, whichwas characterized by prolonged activity durationsuch as delayed and anticipatory activities (Figure3c–e and Supplementary Figure S5). Many lines ofclinical evidence point out that mood disorder isaccompanied by abnormality in circadian rhythm ordaily day–night variation. For instance, depressivemood in the case of humans regularly worsens in themorning, and characteristic sleep disturbances in-cluding early morning awakening are observed. Itmight be supposed that the Tg mice with extensivedelayed and anticipatory activities have mood dis-order-like symptoms, though this should be inter-preted with caution because mice are nocturnalanimals but humans are not. Importantly, prolongedactivity duration was exhibited in the period withlower activity levels (Figure 5c). This apparently
paradoxical pattern, that is, longer duration ofactivity accompanied by lower intensity of activity,corresponds to the activity pattern in human patientswith depressive episode.45 Mood disturbance isthought to be caused by alteration of monoaminergicneurotransmission in brain.3,46 The ‘monoaminehypothesis’ was mainly based on the action mechan-isms of antidepressants and antimanic agents, andthis has gradually been confirmed by clinical andpostmortem brain studies.47–49 In the brain of Tg mice,we found altered level and/or turnover of mono-amines, 5-HT, DA, and NA (Table 2). Chronictreatment with a tricyclic antidepressant-inducedmanic switch-like behavior in some Tg mice andworsened the distorted day–night rhythm (Figure 4).Increased activity of the treated Tg mice after thetermination of the treatment suggested that theinfluence of the drug was long-lasting as observedin patients with bipolar disorder, manic component ofwhich is worsened by tricyclic antidepressants.38
Moreover, female Tg mice showed estrous cycle-associated fluctuation in wheel-running activity(Figure 5a–c). Robustness of the fluctuation was age-dependent; it was most prominent around 30–40weeks after birth and disappeared over 60 weeks old.This probably reflected the influence of both accu-mulation level of mtDNA defects (SupplementaryFigure S1) and intensity of the estrous cycle. Theestrous cycle-associated fluctuation may be impli-cated as a reduced ability to control their moodagainst the endocrinological perturbation and resem-ble the mood changes across the menstrual cycleobserved in more than half of reproductive agedwomen with bipolar disorder.50,51 Therefore, theabove-mentioned phenotypes of Tg mice with neu-ron-specific mtDNA defects are most relevant torecurrent major depression or bipolar depression.
Table 1 CPEO families comorbid with mood disorders
Gene Mutation Psychaiatricmanifestations
Other affected members’manifestations
References
ANT1 L98P Bipolar disorder All of four CPEO memberscomorbid with bipolar disorder
13
ANT1 A90D Schizoaffectivedisorder
Other two affected siblings hadno mental disorders
14
Twinkle Duplication of the codingsequence (352–364)
Severe retardeddepression
Some CPEO members comorbidwith depression
15
POLG A467TþL304R (compoundheterozygote)
Depression All of four CPEO memberscomorbid with depression
16
POLG H932YþG1051R (compoundheterozygote)
Depression Many members with depressionor bipolar disorder (Theinheritance pattern is unclear.)
17
POLG Y955C Recurrentdepression
No other CPEO members withmood disorders
18
POLG A1105T Recurrentdepression
No other CPEO members withmood disorders
18
POLGþTwinkle POLG, G848S; Twinkle, R334Q(intergenic compoundheterozygote)
Depression Details not reported 19
A genetic animal model for mood disorderT Kasahara et al
589
Molecular Psychiatry

Predictive validityCurrently, three mood stabilizers, lithium, valproate,and carbamazepine, are established as effectiveprophylactic treatment for bipolar disorder. Lithium,the first-choice drug for bipolar patients, improvedthe periodic activity change associated with theestrous cycle in female Tg mice and also the distortedday–night rhythm (Figure 6), suggesting the predic-tive validity of the Tg mice. Because the lithiumtreatment did not decrease the level of wheel-runningactivity (Figure 6d), the effect of lithium on thebehavioral abnormalities of Tg mice cannot beexplained by a nonspecific sedative action. As for
the effect of lithium treatment on women with bipolardisorder, lithium mitigated effectively premenstrualtension syndrome52 and had a prophylactic effect onpremenstrual symptom changes in women withlithium-responsive bipolar disorder.53 Viewed in thislight, the therapeutic effect of lithium on the cyclicactivity change of Tg mice would confirm thepredictive validity as well as the face validity.
The responsiveness of Tg mice to a tricyclicantidepressant and lithium suggests that the beha-vioral phenotype of Tg mice are more similar tobipolar disorder rather than to major depression. MaleTg mice, however, did not show cyclic activity change
Table 2 Monoamine changes in the brain
(a) Monoamine contents in the brain (ng/g wet weight; mean7s.e.m.) upper, non-Tg; bottom, Tg
NA DA DOPAC HVA 5-HT 5-HIAA
Prefrontal cortex 17.3970.18 2.4670.54 2.0570.17 4.6770.21 12.6470.46 9.4770.6816.3070.32* 2.5770.35 1.9570.14 4.2770.22 11.7070.15x 9.2370.35
Hippocampus 34.8471.26 1.6370.13 0.9970.00 3.0870.23 27.8271.46 34.1172.7528.4670.86** 3.1470.60* 1.4970.42 3.8970.25* 24.3970.78* 39.9572.53
Amygdala 13.0570.94 9.5670.77 5.7370.88 5.1870.51 14.9470.13 12.9070.7911.7570.40 7.0970.45* 6.4870.60 5.2970.41 10.0170.46** 15.2770.75*
Striatum 6.1370.81 105.1974.23 49.6473.89 27.2571.52 8.1370.44 5.1770.326.7070.43 99.1374.71 46.3972.74 27.9371.61 9.0870.36 7.3370.80*
Hypothalamus 23.6873.20 4.8870.62 4.4970.55 9.7971.31 10.3071.80 24.3472.1120.0672.11 3.9670.38 4.4570.62 8.9271.41 6.9371.14 24.1072.12
Nucleus accumbens 4.4970.24 69.4077.13 40.0774.30 38.08713.74 7.7970.29 7.6970.664.5970.20 73.5072.83 38.1772.78 36.41715.28 8.0270.18 8.8270.56
(b) Monoamine turnover in the brain (mean7s.e.m.) upper, non-Tg; bottom, Tg
DOPAC/DA HVA/DA (DOPACþHVA)/DA 5-HIAA/5-HT
Prefrontal cortex 0.9570.09 2.2970.27 3.2370.34 0.7770.080.8170.07 1.8570.23 2.6670.29 0.7970.03
Hippocampus 0.6170.03 1.9770.21 2.5970.22 1.2570.120.4570.04** 1.5070.23 1.9570.23x 1.6970.13*
Amygdala 0.5970.07 0.5470.03 1.1470.08 0.9470.110.9170.07** 0.7570.05** 1.6670.10** 1.5570.10**
Striatum 0.4770.03 0.2770.02 0.7470.04 0.6570.050.4870.04 0.2870.02 0.7670.05 0.8270.10
Hypothalamus 0.9370.03 2.0470.19 2.9670.21 2.7770.461.1270.13 2.2170.21 3.3370.28 4.1970.67
Nucleus accumbens 0.6170.09 0.5070.14 1.1170.17 1.0170.110.5270.04 0.4770.19 1.0070.18 1.1070.06
Abbreviations: DA, dopamine; DOPAC, 3,4-dihydroxyphenylacetic acid; 5-HIAA, 5-hydroxy-indoleacetic acid; HVA,homovanillic acid; 5-HT, serotonin; NA, noradrenaline.**P < 0.01;*P < 0.05; xP < 0.1 (Student’s t-test).
A genetic animal model for mood disorderT Kasahara et al
590
Molecular Psychiatry

(Figure 3a). Prevalence of bipolar disorder is notdifferent between men and women, although itssevere phenotype, rapid cycling, is more frequent inwomen.1 The POLG mutation presented in the Tgmice alone seems insufficient to cause biphasic mooddisturbance. However, behavioral characteristics ofthe following cases of Tg mice appeared to beequivalent to the clinical phenotype of bipolardisorder: a male mouse (case 1) showing antidepres-sant-induced manic switch-like behavior (Figure 4e)and female mice (cases 2 and 3) showing dysregulatedlong-term activity patterns (Supplementary FigureS8). In case 1, environmental insults such asantidepressant treatment and physical stress causedby dehydration, together with the genetic defect,might have caused this phenotype. In cases 2 and 3,the strange behavioral pattern started without anyconceivable environmental insult. It would be thetheme of future studies to identify the physiological,developmental, or environmental factors that caninduce these prominent behavioral changes resem-bling manic and/or depressive episodes. Addition-ally, it would be worthwhile to discuss theseanecdotal cases from the point of view of interindi-vidual variability. Although such striking behavioralchanges were rare, a large interindividual variabilityin the wheel-running activity was observed in the Tgmice in every experiment (e.g., Figure 3d, e andSupplementary Figure S5). The proofreading-defi-cient POLG stochastically introduces a deletion or apoint mutation in a mtDNA molecule in the neuronswhere the mutant POLG is expressed. Consequently,this leads interindividual variations in amount, types(Supplementary Figure S2), and cellular/histologicallocation of accumulated mtDNA defects.
Among the phenotypes of Tg mice, enhanced startleresponse (Figure 2c) and increased freezing in theconditioning phase of the fear-learning test (Figure 2f)were prominent but apparently unrelated to mooddisorders. Indeed, three papers reported normalstartle reflex in euthymic patients with bipolardisorder.54–56 On the other hand, enhanced startleresponse is reported in panic disorder or otheranxiety disorders.57 It is recently reported that morethan half of patients with bipolar disorder comorbidwith anxiety disorders such as panic disorder, andbipolar disorder with panic disorder may be agenetically distinctive phenotype.58 It is intriguingto examine the possible relationship between mito-chondrial dysfunction and comorbidity of panicdisorder in bipolar disorder.
Several genetic and biochemical evidence indicatethat mutations of POLG induce mtDNA defectsincluding point mutations and multiple deletions(for human genetics, see references described below;for mouse genetics, Zhang et al.29, Trifunovic et al.30,Kujoth et al.31, and this study; for biochemicalstudies, Graziewicz et al.59 and Spelbrink et al.60).However, the relationship between the presence ofmtDNA defects and the occurrence of specific clinicalfeatures of mitochondrial diseases still remains
largely mysterious. In human patients carrying muta-tions in the POLG gene and consequent mtDNAdefects, many associated phenotypes in addition toCPEO have been proposed; Parkinson’s disease,61
premature menopause,61 ataxia,62,63 sensorimotorpolyneuropathy,64 deafness,17 diabetes mellitus,64
and mood disorders.13,17,63 Furthermore, mutantPOLG knock-in mice showed cardiomyopathy, alope-cia, osteoporosis, anaemia, reduced fertility, etc.30,31
Thus, mtDNA defects and ensuing mitochondrialdysfunction enigmatically cause many kinds ofphenotypes in various organs, suggesting that muta-tion in POLG is not a specific risk factor for mooddisorder.
In order to understand the link between mitochon-drial dysfunction and mood disturbance, we focusour attention on the role of mitochondria in Ca2þ
regulation. Mitochondria are known to activelyabsorb and release Ca2þ to control intracellular Ca2þ
levels.65 Although it is difficult to investigate whethermitochondrial Ca2þ handling is impaired in theneurons of patients, altered Ca2þ signalings havebeen observed in the peripheral blood cells66,67 andrecently reported in olfactory neurons obtained frombipolar patients.68 These altogether raise a possibilitythat the mitochondrial dysfunction may affect theCa2þ regulation and finally lead to mood disturbance.This possibility now becomes to be explored by usingthe mutant POLG Tg mice, which have a potential tofulfill the principal validities required for a modelanimal of mood disorder.
Acknowledgments
We thank Dr Mark Mayford (The Scripps ResearchInstitute) for the CaMKIIa promoter constructs(pNN265 and pMM403). We are grateful to staffs inDivisions of Animal Experiments and CommonInstrumentations (Research Resources Center,Brain Science Institute [BSI], RIKEN) for technicalassistance and members in our laboratory foruseful discussions. This work was supported by theGrants for Laboratory for Molecular Dynamics ofMental Disorders, RIKEN BSI, Grant-in-Aid from theJapanese Ministry of Health and Labor, and Grants-in-Aid from the Japanese Ministry of Education, Culture,Sports, Science and Technology. T Kasahara issupported by a special postdoctoral researcher fellow-ship (RIKEN).
Accession Numbers and Electronic-DatabaseInformationThe DDBJ/EMBL/GenBank accession numbers of thesequences discussed in this paper are the following:mouse POLG cDNA, AB121698; and C57BL/6J mousemtDNA AY172335.The Mendelian Inheritance in Man (http://www.ncbi.nlm.nih.gov/omim/) entry numbers ofCPEO are 157640 (caused by mutation in the POLGgene), 609283 (caused by mutation in the ANT1 gene),and 609286 (caused by mutation in the Twinkle gene).
A genetic animal model for mood disorderT Kasahara et al
591
Molecular Psychiatry

References
1 American Psychiatric Association. Diagnostic and StatisticalManual of Mental Disorders, Fourth Edition. Text Revision(DSM-IV-TR), 2000.
2 Merikangas KR, Low NC. The epidemiology of mood disorders.Curr Psychiatry Rep 2004; 6: 411–421.
3 Goodwin FK, Jamison KR. Manic-Depressive Illness. OxfordUniversity Press: New York, 1990.
4 Kato T, Kato N. Mitochondrial dysfunction in bipolar disorder.Bipolar Disord 2000; 2: 180–190.
5 Kato T, Takahashi S, Shioiri T, Inubushi T. Alterations in brainphosphorous metabolism in bipolar disorder detected by in vivo31P and 7Li magnetic resonance spectroscopy. J Affect Disord 1993;27: 53–59.
6 Kato T, Kunugi H, Nanko S, Kato N. Mitochondrial DNApolymorphisms in bipolar disorder. J Affect Disord 2001; 62:151–164.
7 Munakata K, Tanaka M, Mori K, Washizuka S, Yoneda M, Tajima Oet al. Mitochondrial DNA 3644T-C mutation associated withbipolar disorder. Genomics 2004; 84: 1041–1050.
8 Munakata K, Iwamoto K, Bundo M, Kato T. Mitochondrial DNA3243A > G mutation and increased expression of LARS2 gene inthe brains of patients with bipolar disorder and schizophrenia.Biol Psychiatry 2005; 57: 525–532.
9 Washizuka S, Iwamoto K, Kazuno A, Kakiuchi C, Mori K,Kametani M et al. Association of mitochondrial complex I subunitgene NDUFV2 at 18p11 with bipolar disorder in Japanese and theNIMH pedigrees. Biol Psychiatry 2004; 56: 483–489.
10 Konradi C, Eaton M, MacDonald ML, Walsh J, Benes FM, HeckersS et al. Molecular evidence for mitochondrial dysfunction inbipolar disorder. Arch Gen Psychiatry 2004; 61: 300–308.
11 Iwamoto K, Bundo M, Kato T. Altered expression of mitochondria-related genes in postmortem brains of patients with bipolardisorder or schizophrenia, as revealed by large-scale DNAmicroarray analysis. Hum Mol Genet 2005; 14: 241–253.
12 Krishnan KR. Psychiatric and medical comorbidities of bipolardisorder. Psychosom Med 2005; 67: 1–8.
13 Siciliano G, Tessa A, Petrini S, Mancuso M, Bruno C, Grieco GS etal. Autosomal dominant external ophthalmoplegia and bipolaraffective disorder associated with a mutation in the ANT1 gene.Neuromuscul Disord 2003; 13: 162–165.
14 Deschauer M, Hudson G, Muller T, Taylor RW, Chinnery PF, ZierzS et al. A novel ANT1 gene mutation with probable germlinemosaicism in autosomal dominant progressive external ophthal-moplegia. Neuromuscul Disord 2005; 15: 311–315.
15 Spelbrink JN, Li FY, Tiranti V, Nikali K, Yuan Q-P, Tariq Met al. Human mitochondrial DNA deletions associatedwith mutations in the gene encoding Twinkle, a phage T7 gene4-like protein localized in mitochondria. Nat Genet 2001; 28:223–231.
16 Van Goethem G, Dermaut B, Lofgren A, Martin JJ, Van Broeckho-ven C. Mutation of POLG is associated with progressive externalophthalmoplegia characterized by mtDNA deletions. Nat Genet2001; 28: 211–212.
17 Mancuso M, Filosto M, Bellan M, Liguori R, Montagna P, BaruzziA et al. POLG mutations causing ophthalmoplegia, sensorimotorpolyneuropathy, ataxia, and deafness. Neurology 2004; 62: 316–318.
18 Luoma P, Melberg A, Rinne JO, Kaukonen JA, Nupponen NN,Chalmers RM et al. Parkinsonism, premature menopause, andmitochondrial DNA polymerase g mutations: clinical and mole-cular genetic study. Lancet 2004; 364: 875–882.
19 Van Goethem G, Lofgren A, Dermaut B, Ceuterick C, Martin J-J,Van Broeckhoven C et al. Digenic progressive external ophthal-moplegia in a sporadic patient: Recessive mutations in POLG andC10orf2/Twinkle. Hum Mutat 2003; 22: 175–176.
20 Suomalainen A, Majander A, Haltia M, Somer H, Lonnqvist J,Savontaus ML et al. Multiple deletions of mitochondrial DNA inseveral tissues of a patient with severe retarded depression andfamilial progressive external ophthalmoplegia. J Clin Invest 1992;90: 61–66.
21 Van Goethem G, Luoma P, Rantamaki M, Al Memar A, Kaakkola S,Hackman P et al. POLG mutations in neurodegenerative disorders
with ataxia but no muscle involvement. Neurology 2004; 63: 1251–1257.
22 Kato T, Stine OC, McMahon FJ, Crowe RR. Increased levels of amitochondrial DNA deletion in the brain of patients with bipolardisorder. Biol Psychiatry 1997; 42: 871–875.
23 Kato T, Takahashi S, Shioiri T, Murashita J, Hamakawa H,Inubushi T et al. Reduction of brain phosphocreatine in bipolarII disorder detected by phosphorus-31 magnetic resonancespectroscopy. J Affect Disord 1994; 31: 125–133.
24 Murashita J, Kato T, Shioiri T, Inubushi T, Kato N. Altered brainenergy metabolism in lithium-resistant bipolar disorder detectedby photic stimulated 31P-MR spectroscopy. Psychol Med 2000; 30:107–115.
25 Barbiroli B, Montagna P, Martinelli P, Lodi R, Iotti S, Cortelli P etal. Defective brain energy metabolism shown by in vivo 31P MRspectroscopy in 28 patients with mitochondrial cytopathies. JCereb Blood Flow Metab 1993; 13: 469–474.
26 Rango M, Bozzali M, Prelle A, Scarlato G, Bresolin N. Brainactivation in normal subjects and in patients affected bymitochondrial disease without clinical central nervous systeminvolvement: a phosphorus magnetic resonance spectroscopystudy. J Cereb Blood Flow Metab 2001; 21: 85–91.
27 Dager SR, Friedman SD, Parow A, Demopulos C, Stoll AL, Lyoo IKet al. Brain metabolic alterations in medication-free patients withbipolar disorder. Arch Gen Psychiatry 2004; 61: 450–458.
28 Stork C, Renshaw PF. Mitochondrial dysfunction in bipolardisorder: evidence from magnetic resonance spectroscopy re-search. Mol Psychiatry 2005; 10: 900–919.
29 Zhang D, Mott JL, Chang SW, Denniger G, Feng Z, Zassenhaus HPet al. Construction of transgenic mice with tissue-specificacceleration of mitochondrial DNA mutagenesis. Genomics 2000;69: 151–161.
30 Trifunovic A, Wredenberg A, Falkenberg M, Spelbrink JN, RovioAT, Bruder CE et al. Premature ageing in mice expressing defectivemitochondrial DNA polymerase. Nature 2004; 429: 417–423.
31 Kujoth GC, Hiona A, Pugh TD, Someya S, Panzer K, WohlgemuthSE et al. Mitochondrial DNA mutations, oxidative stress, andapoptosis in mammalian aging. Science 2005; 309: 481–484.
32 Mayford M, Baranes D, Podsypanina K, Kandel ER. The 30-untranslated region of CaMKIIa is a cis-acting signal for thelocalization and translation of mRNA in dendrites. Proc Natl AcadSci USA 1996; 93: 13250–13255.
33 World Health Organization. ICD 10: International StatisticalClassification of Diseases and Related Health Problems (10version). Geneva, Switzerland, 1992.
34 Einat H, Manji HK, Belmaker RH. New approaches to modelingbipolar disorder. Psychopharmacol Bull 2003; 37: 47–63.
35 Machado-Vieira R, Kapczinski F, Soares JC. Perspectives for thedevelopment of animal models of bipolar disorder. Prog Neurop-sychopharmacol Biol Psychiatry 2004; 28: 209–224.
36 Miyamoto Y, Yamada K, Noda Y, Mori H, Mishina M, Nabeshima Tet al. Lower sensitivity to stress and altered monoaminergicneuronal function in mice lacking the NMDA receptor e4 subunit. JNeurosci 2002; 22: 2335–2342.
37 Ruf T. The Lomb-Scargle periodogram in biological rhythm:analysis of incomplete and unequally spaced time-series. BiolRhythm Res 1999; 30: 178–201.
38 Goldberg JF, Truman CJ. Antidepressant-induced mania: an over-view of current controversies. Bipolar Disord 2003; 5: 407–420.
39 Storlien LH, Higson FM, Gleeson RM, Smythe GA, Atrens DM.Effects of chronic lithium, amitriptyline and mianserin onglucoregulation, corticosterone and energy balance in the rat.Pharmacol Biochem Behav 1985; 22: 119–125.
40 Nelson JF, Felicio LS, Randall PK, Sims C, Finch CE. Alongitudinal study of estrous cyclicity in aging C57BL/6J mice: ICycle frequency, length and vaginal cytology. Biol Reprod 1982;27: 327–339.
41 Carney SM, Goodwin GM. Lithium – a continuing story in thetreatment of bipolar disorder. Acta Psychiatr Scand 2005;111(Suppl 426): 7–12.
42 Bschor T, Lewitzka U, Sasse J, Adli M, Koberle U, Bauer M et al.Lithium augmentation in treatment-resistant depression: clinicalevidence, serotonergic and endocrine mechanisms. Pharmacop-sychiatry 2003; 36(Suppl 3): S230–S234.
A genetic animal model for mood disorderT Kasahara et al
592
Molecular Psychiatry

43 Belke TW. Running and responding reinforced by the opportunityto run: effect of reinforcer duration. J Exp Anal Behav 1997; 67:337–351.
44 Sherwin CM. Voluntary wheel running: a review and novelinterpretation. Anim Behav 1998; 56: 11–27.
45 Daimon K, Yamada N, Tsujimoto T, Takahashi S. Circadian rhythmabnormalities of deep body temperature in depressive disorders. JAffect Disord 1992; 26: 191–198.
46 Hirschfeld RM. History and evolution of the monoamine hypoth-esis of depression. J Clin Psychiatry 2000; 61(Suppl 6): 4–6.
47 Charney DS. Monoamine dysfunction and the pathophysiologyand treatment of depression. J Clin Psychiatry 1998; 59(Suppl 14):11–14.
48 Young LT, Warsh JJ, Kish SJ, Shannak K, Hornykeiwicz O. Reducedbrain 5-HT and elevated NE turnover and metabolites in bipolaraffective disorder. Biol Psychiatry 1994; 35: 121–127.
49 Sobczak S, Honig A, van Duinen MA, Riedel WJ. Serotonergicdysregulation in bipolar disorders: a literature review of seroto-nergic challenge studies. Bipolar Disord 2002; 4: 347–356.
50 Blehar MC, DePaulo Jr JR, Gershon ES, Reich T, Simpson SG,Nurnberger Jr JI et al. Women with bipolar disorder: findings fromthe NIMH Genetics Initiative sample. Psychopharmacol Bull 1998;34: 239–243.
51 Rasgon N, Bauer M, Grof P, Gyulai L, Elman S, Glenn T et al. Sex-specific self-reported mood changes by patients with bipolardisorder. J Psychiatr Res 2005; 39: 77–83.
52 Steiner M, Haskett RF, Osmun JN, Carroll BJ. Treatment ofpremenstrual tension with lithium carbonate. A pilot study. ActaPsychiatr Scand 1980; 61: 96–102.
53 Karadag F, Akdeniz F, Erten E, Pirildar S, Yucel B, Polat A et al.Menstrually related symptom changes in women with treatment-responsive bipolar disorder. Bipolar Disord 2004; 6: 253–259.
54 Perry W, Minassian A, Feifel D, Braff DL. Sensorimotor gatingdeficits in bipolar disorder patients with acute psychotic mania.Biol Psychiatry 2001; 50: 418–424.
55 Rich BA, Vinton D, Grillon C, Bhangoo RK, Leibenluft E. Aninvestigation of prepulse inhibition in pediatric bipolar disorder.Bipolar Disord 2005; 7: 198–203.
56 Barrett SL, Kelly C, Watson DR, Bell R, King DJ. Normal levels ofprepulse inhibition in the euthymic phase of bipolar disorder.Psychol Med 2005; 35: 1737–1746.
57 Ludewig S, Geyer MA, Ramseier M, Vollenweider FX, RechsteinerE, Cattapan-Ludewig K et al. Information-processing deficits andcognitive dysfunction in panic disorder. J Psychiatry Neurosci2005; 30: 37–43.
58 Simon NM, Otto MW, Wisniewski SR, Fossey M, Sagduyu K,Frank E et al. Anxiety disorder comorbidity in bipolar disorderpatients: data from the first 500 participants in the SystematicTreatment Enhancement Program for Bipolar Disorder (STEP-BD).Am J Psychiatry 2004; 161: 2222–2229.
59 Graziewicz MA, Longley MJ, Bienstock RJ, Zeviani M, CopelandWC. Structure-function defects of human mitochondrial DNApolymerase in autosomal dominant progressive external ophthal-moplegia. Nat Struct Mol Biol 2004; 11: 770–776.
60 Spelbrink JN, Toivonen JM, Hakkaart GA, Kurkela JM, Cooper HM,Lehtinen SK et al. In vivo functional analysis of the humanmitochondrial DNA polymerase POLG expressed in culturedhuman cells. J Biol Chem 2000; 275: 24818–24828.
61 Luoma P, Melberg A, Rinne JO, Kaukonen JA, Nupponen NN,Chalmers RM et al. Parkinsonism, premature menopause, andmitochondrial DNA polymerase g mutations: clinical and mole-cular genetic study. Lancet 2004; 364: 875–882.
62 Van Goethem G, Luoma P, Rantamaki M, Al Memar A, Kaakkola S,Hackman P et al. POLG mutations in neurodegenerative dis-orders with ataxia but no muscle involvement. Neurology 2004;63: 1251–1257.
63 Hakonen AH, Heiskanen S, Juvonen V, Lappalainen I, Luoma PT,Rantamaki M et al. Mitochondrial DNA polymerase W748Smutation: a common cause of autosomal recessive ataxiawith ancient European origin. Am J Hum Genet 2005; 77:430–441.
64 Di Fonzo A, Bordoni A, Crimi M, Sara G, Del Bo R, Bresolin Net al. POLG mutations in sporadic mitochondrial disorders withmultiple mtDNA deletions. Hum Mutat 2003; 22: 498–499.
65 Pozzan T, Magalhaes P, Rizzuto R. The comeback of mitochondriato calcium signalling. Cell Calcium 2000; 28: 279–283.
66 Soares JC, Mallinger AG. Intracellular phosphatidylinositol path-way abnormalities in bipolar disorder patients. PsychopharmacolBull 1997; 33: 685–691.
67 Yamawaki S, Kagaya A, Okamoto Y, Shimizu M, Nishida A,Uchitoni Y. Enhanced calcium response to serotonin in plateletsfrom patients with affective disorders. J Psychiatry Neurosci 1996;21: 321–324.
68 Hahn C-G, Gomez G, Restrepo D, Friedman E, Josiassen R,Pribitkin EA et al. Aberrant intracellular calcium signaling inolfactory neurons from patients with bipolar disorder. Am JPsychiatry 2005; 162: 616–618.
69 Kasamatsu H, Robberson DL, Vinograd J. A novel closed-circularmitochondrial DNA with properties of a replicating intermediate.Proc Natl Acad Sci USA 1971; 68: 2252–2257.
Supplementary Information accompanies the paper on the Molecular Psychiatry website (http://www.nature.com/mp)
A genetic animal model for mood disorderT Kasahara et al
593
Molecular Psychiatry