
Electromagnetic compatibility and interference metrology - US ...
Upload
independentCategory
view
2download
0
Global Metrology Services Market 2012 – 2018
Transparency Market Research 1
Metrology Services Market: Global Industry Analysis, Size, Share,
Growth, Trends and Forecast, 2012 – 2018
SAMPLE
SAMPLE P
AGE

Global Metrology Services Market 2012 – 2018
Transparency Market Research 2
Table of Content
Chapter 1 Preface .............................................................................. 10
1.1 Report description ....................................................................................................... 10
1.2 Research scope ............................................................................................................ 12
1.3 Research methodology ................................................................................................ 13
Chapter 2 Executive Summary ......................................................... 15
2.1 Global metrology services market, size and Y–o–Y growth, 2012 – 2018 (USD million) ........................................................................................................................ 15
2.2 Global metrology services market snapshot ................................................................. 17
Chapter 3 Global Metrology Services Market Overview ................ 18
3.1 Market definition ......................................................................................................... 18
3.2 Market trends and future outlook, 2012 – 2018 ........................................................... 18
3.3 Factor analysis ............................................................................................................. 20
3.3.1 Market drivers .................................................................................................... 20
3.3.1.1 Rising adoption of CAD/CAM and international quality standards ....................................................... 20
3.3.1.2 Shortage of skilled precision machine operators ............. 20
3.3.1.3 Lack of applicability of existing measuring equipments .............................................................. 20
3.3.1.4 Demand to capture large volumes of 3-D data for modeling and analysis ................................................ 21
3.3.1.5 Growing pressure on global infrastructure and resources ................................................................. 21
3.3.2 Restraints ........................................................................................................... 22
3.3.2.1 Lack of a universal system that can be applied across different sectors .............................................. 22
3.3.2.2 High risk of changes in regional market growth trend and potential ............................................................ 22
3.3.3 Opportunities ..................................................................................................... 23
3.3.3.1 Growing outsourcing trend for dimensional inspection in medical sector ........................................ 23
3.3.3.2 Market development in emerging economies ................. 23
3.4 Value chain analysis ..................................................................................................... 24
3.5 Global metrology services market attractiveness ......................................................... 27
SAMPLE P
AGE

Global Metrology Services Market 2012 – 2018
Transparency Market Research 3
3.5.1 Global metrology services market attractiveness, by product, 2011 .................... 27
3.5.2 Global metrology services market attractiveness, by geography, 2011 ................ 28
3.5.3 Global metrology services market attractiveness, by end-use sector, 2011 .......... 29
3.6 Porter’s five force analysis ........................................................................................... 30
3.6.1 Bargaining power of suppliers ............................................................................. 30
3.6.2 Bargaining power of buyers ................................................................................ 31
3.6.3 Threat from new entrants ................................................................................... 31
3.6.4 Threat from substitutes ...................................................................................... 32
3.6.5 Degree of competition ........................................................................................ 32
Chapter 4 Global Metrology Services Market, by Products ........... 33
4.1 Introduction................................................................................................................. 33
4.1.1 Comparative analysis of global metrology services market, by products, 2012 & 2018 (value %) ........................................................................................ 33
4.2 Coordinate measuring machines (CMM) services ......................................................... 34
4.2.1 Global CMM services market, size and forecast, 2011 – 2018 (USD million) ......... 34
4.2.2 Gantry machines services ................................................................................... 36
4.2.2.1 Global gantry machines services market, size and forecast, 2011 – 2018 (USD million) ............................ 36
4.2.3 Bridge machines services .................................................................................... 37
4.2.3.1 Global bridge machines services market, size and forecast, 2011 – 2018 (USD million) ............................ 37
4.2.4 Articulated arm machines services ...................................................................... 38
4.2.4.1 Global articulated arm machines services market, size and forecast, 2011 – 2018 (USD million) ................ 38
4.2.5 Horizontal arm machines services ....................................................................... 39
4.2.5.1 Global horizontal arm machines services market, size and forecast, 2011 – 2018 (USD million) ................ 39
4.3 Optical digitizers and scanners services ........................................................................ 40
4.3.1 Global Optical Digitizers and Scanners services market, size and forecast, 2011 – 2018 (USD million) ................................................................................... 41
4.3.2 Three dimensional (3D) laser scanners services ................................................... 42
4.3.2.1 Global three dimensional (3D) laser scanners services market, size and forecast, 2011 – 2018 (USD million) ............................................................ 42
4.3.3 White light scanners services .............................................................................. 43
4.3.3.1 Global white light scanners services market, size and forecast, 2011 – 2018 (USD million) ...................... 43
SAMPLE P
AGE
Global Metrology Services Market 2012 – 2018
Transparency Market Research 4
4.3.4 Laser trackers services ........................................................................................ 44
4.3.4.1 Global laser trackers services market, size and forecast, 2011 – 2018 (USD million) ............................ 44
Chapter 5 Global Metrology Services Market, by End-user Applications...................................................................... 45
5.1 Introduction................................................................................................................. 45
5.1.1 Comparative analysis of global metrology services market, by applications, 2012 & 2018 (value %) .................................................................... 46
5.2 Metrology services market in automotive applications ................................................ 47
5.2.1 Global metrology services market in automotive applications, 2011 – 2018 (USD million) ...................................................................................................... 47
5.3 Metrology services market in aerospace applications .................................................. 48
5.3.1 Global metrology services market in aerospace applications, 2011 – 2018 (USD million) ...................................................................................................... 48
5.4 Metrology services market in industrial applications ................................................... 49
5.4.1 Global metrology services market in industrial applications, 2011 – 2018 (USD million) ...................................................................................................... 49
5.5 Metrology services market in power generation applications ...................................... 50
5.5.1 Global metrology services market in power generation applications, 2011 – 2018 (USD million) ........................................................................................... 50
5.6 Metrology services market in other applications .......................................................... 51
5.6.1 Global metrology services market in other applications, 2011 – 2018 (USD million) ............................................................................................................... 51
Chapter 6 Global Metrology Services Market, by Geography ....... 52
6.1 Introduction................................................................................................................. 52
6.1.1 Comparative analysis of global metrology services market, by geography, 2012 & 2018 (value %) ........................................................................................ 53
6.2 North America metrology services market ................................................................... 54
6.2.1 North America metrology services market, size and forecast, 2011 – 2018 (USD million) ...................................................................................................... 54
6.3 Europe metrology services market ............................................................................... 55
6.3.1 Europe metrology services market, size and forecast, 2011 – 2018 (USD million) ............................................................................................................... 55
6.4 Asia-Pacific metrology services market ........................................................................ 56
6.4.1 Asia-Pacific metrology services market, size and forecast, 2011 – 2018 (USD million) ...................................................................................................... 56
SAMPLE P
AGE

Global Metrology Services Market 2012 – 2018
Transparency Market Research 5
6.5 Rest of the world (RoW) metrology services market .................................................... 57
6.5.1 Rest of the world (RoW) metrology services market, size and forecast, 2011 – 2018 (USD million) ................................................................................... 57
Chapter 7 Key Competitors Analysis ............................................... 58
7.1 Market share of major players, 2012 ............................................................................ 58
7.1.1 Global metrology services market share by major players, 2012 (value %) .......... 58
7.2 Competitive strategies adopted by major players ........................................................ 59
Chapter 8 Company Profiles ............................................................. 60
8.1 Hexagon AB ................................................................................................................. 60
8.1.1 Company overview ............................................................................................. 60
8.1.2 Financial overview .............................................................................................. 60
8.1.3 Business strategies ............................................................................................. 61
8.1.4 Recent developments ......................................................................................... 62
8.2 Optical Metrological Services ....................................................................................... 63
8.2.1 Company overview ............................................................................................. 63
8.2.2 Financial overview .............................................................................................. 63
8.2.3 Business strategy ................................................................................................ 63
8.2.4 Recent developments ......................................................................................... 64
8.3 Danish Micro Engineering A/S ...................................................................................... 65
8.3.1 Company overview ............................................................................................. 65
8.3.2 Financial overview .............................................................................................. 65
8.3.3 Business strategy ................................................................................................ 65
8.3.4 Recent development ........................................................................................... 65
8.4 FARO Technologies, Inc. ............................................................................................... 66
8.4.1 Company overview ............................................................................................. 66
8.4.2 Financial overview .............................................................................................. 66
8.4.3 Business strategy ................................................................................................ 67
8.4.4 Recent development ........................................................................................... 67
8.5 Optical Gaging Products, Inc ........................................................................................ 68
8.5.1 Company overview ............................................................................................. 68
8.5.2 Financial overview .............................................................................................. 68
8.5.3 Business strategy ................................................................................................ 68
8.5.4 Recent developments ......................................................................................... 69
8.6 Renishaw Plc. ............................................................................................................... 70
SAMPLE P
AGE

Global Metrology Services Market 2012 – 2018
Transparency Market Research 6
8.6.1 Company overview ............................................................................................. 70
8.6.2 Financial overview .............................................................................................. 70
8.6.3 Business strategy ................................................................................................ 71
8.6.4 Recent development ........................................................................................... 71
8.7 Nikon Metrology Inc. ................................................................................................... 72
8.7.1 Company overview ............................................................................................. 72
8.7.2 Financial overview .............................................................................................. 72
8.7.3 Business strategy ................................................................................................ 73
8.7.4 Recent development ........................................................................................... 73
8.8 Carl Zeiss Corporation .................................................................................................. 74
8.8.1 Company overview ............................................................................................. 74
8.8.2 Financial overview .............................................................................................. 74
8.8.3 Business strategy ................................................................................................ 75
8.8.4 Recent developments ......................................................................................... 75
8.9 Trescal SA .................................................................................................................... 76
8.9.1 Company overview ............................................................................................. 76
8.9.2 Financial overview .............................................................................................. 77
8.9.3 Business strategy ................................................................................................ 77
8.9.4 Recent developments ......................................................................................... 77
SAMPLE P
AGE
Global Metrology Services Market 2012 – 2018
Transparency Market Research 7
List of Figures FIG. 1 Global metrology services market, size and Y–o–Y growth, 2011 – 2018 (USD
million) 15FIG. 2 Global metrology services market: Value chain analysis 24FIG. 3 Global metrology services market attractiveness, by product, 2011 27FIG. 4 Global metrology services market attractiveness, by geography, 2011 28FIG. 5 Global metrology services market attractiveness, by end-use sector, 2011 29FIG. 6 Global metrology services market: Porter’s five forces analysis 30FIG. 7 Global metrology services market share, by products, 2012 & 2018 (value %) 33FIG. 8 Global Coordinate Measuring Machines services market, size and forecast, 2011 –
2018 (USD million) 35FIG. 9 Global gantry machines services market, size and forecast, 2011 – 2018 (USD
million) 36FIG. 10 Global bridge machines services market, size and forecast, 2011 – 2018 (USD
million) 37FIG. 11 Global articulated arm machines services market, size and forecast, 2011 – 2018
(USD million) 38FIG. 12 Global horizontal arm machines services market, size and forecast, 2011 – 2018
(USD million) 39FIG. 13 Global Optical Digitizers and Scanners services market, size and forecast, 2011 –
2018 (USD million) 41FIG. 14 Global three dimensional (3D) laser scanners services market, size and forecast,
2011 – 2018 (USD million) 42FIG. 15 Global white light scanners services market, size and forecast, 2011 – 2018 (USD
million) 43FIG. 16 Global laser trackers services market, size and forecast, 2011 – 2018 (USD
million) 44FIG. 17 Global metrology services market, by applications, 2012 & 2018 (value %) 46FIG. 18 Global metrology services market in automotive applications, 2011 – 2018 (USD
million) 47FIG. 19 Global metrology services market in aerospace applications, 2011 – 2018 (USD
million) 48FIG. 20 Global metrology services market in industrial applications, 2011 – 2018 (USD
million) 49FIG. 21 Global metrology services market in power generation applications, 2011 – 2018
(USD million) 50FIG. 22 Global metrology services market in other applications, 2011 – 2018 (USD million) 51FIG. 23 Global metrology services market, by geography, 2012 & 2018 (value %) 53FIG. 24 North America metrology services market, size and forecast, 2011 – 2018 (USD
million) 54FIG. 25 Europe metrology services market, size and forecast, 2011 – 2018 (USD million) 55
SAMPLE P
AGE

Global Metrology Services Market 2012 – 2018
Transparency Market Research 8
FIG. 26 Asia-Pacific metrology services market, size and forecast, 2011 – 2018 (USD million) 56
FIG. 27 Rest of the world (RoW) metrology services market, size and forecast, 2011 – 2018 (USD million) 57
FIG. 28 Global metrology services market revenue share by major players, 2012 (value %) 58FIG. 29 Hexagon AB annual revenues, 2010 – 2012 (USD million) 61FIG. 30 FARO Technologies, Inc annual revenues, 2010 – 2012 (USD million) 66FIG. 31 Renishaw PLC. annual revenues, 2010 – 2012 (USD million) 70FIG. 32 Nikon Corporation annual revenues, 2010 – 2012 (USD million) 73FIG. 33 Carl Zeiss Corporation annual revenues, 2010 – 2012 (USD million) 75
SAMPLE P
AGE

Global Metrology Services Market 2012 – 2018
Transparency Market Research 9
List of Tables
TABLE 1 Global metrology services market snapshot, 2012 & 2018 17TABLE 2 Global metrology services market, by products, 2011 – 2018 (USD million) 33TABLE 3 Global CMM services market, by products, 2011 – 2018 (USD million) 34TABLE 4 Global ODS services market, by products, 2011 – 2018 (USD million) 40TABLE 5 Global metrology services market, by end-user applications, 2011 – 2018 (USD
million) 45TABLE 6 Global metrology services market, by geography, 2011 – 2018 (USD million) 52TABLE 7 Regional GDP (PPP) growth, 2008 – 2011 (%) 57
SAMPLE P
AGE

Global Metrology Services Market 2012 – 2018
Transparency Market Research 10
Chapter 1 Preface
1.1 Report description
The research report on global metrology services market provides detailed analysis of global
market for the period 2012 to 2018 and helps in understanding the driving forces and prevailing
trends in the market. The report segments market based on its major product segments,
applications, and major geographical regions. The report provides market size and forecast for
market segments and explains the impact of various factors on the global metrology market.
Metrology is the science of measurement which deals with measurement of any parameter and
includes both theoretical and experimental aspects of measurements determined at any level of
uncertainty. Metrology enables an end user to measure any object, with respected to different
parameters, as well as it facilitates in identifying production errors
The market under consideration is divided into sub-segments based on various parameters, so
as to enable stakeholders across the supply chain take advantage of strategic analyses
included in the report. Various sub segments which are identified and analyzed are:
Market segments by product type
Coordinate Measuring Machines (CMM)
o Gantry machines
o Bridge machines
o Articulated arm machines
o Horizontal arm machines
Optical Digitizers and Scanners (ODS)
o 3D laser scanners
o White light scanners
o Laser trackers
SAMPLE P
AGE

Global Metrology Services Market 2012 – 2018
Transparency Market Research 11
Market segments by applications
Automotive
Aerospace
Industrial
Power generation
Others (medical and electronics)
Market segments by geography
North America
Europe
Asia-Pacific
Rest of the world (Latin America, Middle East and Africa)
Apart from the above cross sectional analysis of the global metrology services market, the
report also includes competitive profiling of key industry participants, their market positioning,
business strategies adopted by them, and various recent developments. Porter‘s five forces
analysis further highlights competitive scenarios across different levels of supply chain. In all,
the report provides a strategic analysis of the global metrology services market, with estimates
for each of the segments mentioned above, in terms of revenue (USD million), across six years
of forecast period, 2012 – 2018, considering 2011 as the base year.
SAMPLE P
AGE

Global Metrology Services Market 2012 – 2018
Transparency Market Research 12
1.2 Research scope
This section identifies and defines various constraints and binding parameters, which were
observed while providing the market estimates and the analysis. The metrology services market
here refers to the services such as outsourcing, calibration services, and installation services
among others provided for all the product segments. The different applications covered under
this research study are defined as follows:
Automotive – The segment includes all the participants involved in the automotive
supply chain including the OEMs and the component manufacturers
Aerospace – The segment includes metrology services offered to civil aerospace,
military, and defense applications
Industrial – The segment includes metrology services offered to all industrial
manufacturing applications, metal fabrication work, and processing industries
Power generation – The segment includes the analysis of metrology services provided
in thermal power plants, nuclear plants, and wind mills, and other renewable power
generation sources
Others – The segment includes metrology services provided in electronics, medical,
heritage preservation, and animation applications among others
SAMPLE P
AGE
Global Metrology Services Market 2012 – 2018
Transparency Market Research 13
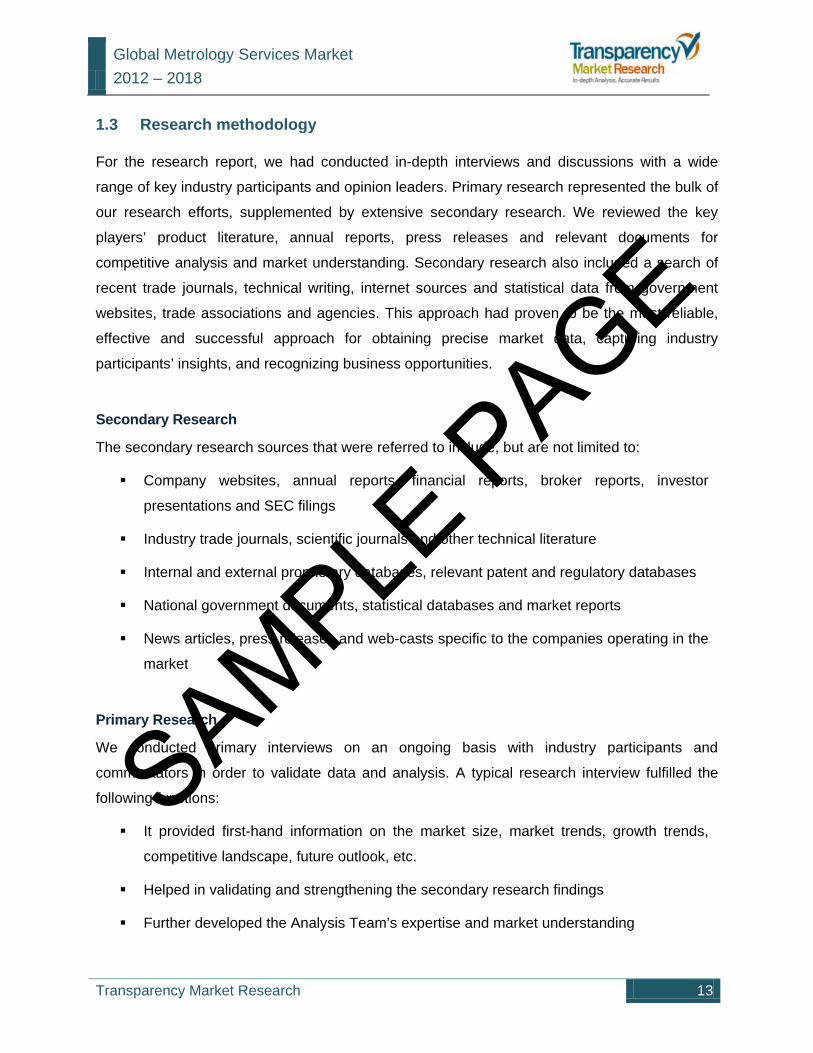
1.3 Research methodology
For the research report, we had conducted in-depth interviews and discussions with a wide
range of key industry participants and opinion leaders. Primary research represented the bulk of
our research efforts, supplemented by extensive secondary research. We reviewed the key
players’ product literature, annual reports, press releases and relevant documents for
competitive analysis and market understanding. Secondary research also included a search of
recent trade journals, technical writing, internet sources and statistical data from government
websites, trade associations and agencies. This approach had proven to be the most reliable,
effective and successful approach for obtaining precise market data, capturing industry
participants’ insights, and recognizing business opportunities.
Secondary Research
The secondary research sources that were referred to include, but are not limited to:
Company websites, annual reports, financial reports, broker reports, investor
presentations and SEC filings
Industry trade journals, scientific journals and other technical literature
Internal and external proprietary databases, relevant patent and regulatory databases
National government documents, statistical databases and market reports
News articles, press releases and web-casts specific to the companies operating in the
market
Primary Research
We conducted primary interviews on an ongoing basis with industry participants and
commentators in order to validate data and analysis. A typical research interview fulfilled the
following functions:
It provided first-hand information on the market size, market trends, growth trends,
competitive landscape, future outlook, etc.
Helped in validating and strengthening the secondary research findings
Further developed the Analysis Team’s expertise and market understanding
SAMPLE P
AGE

Global Metrology Services Market 2012 – 2018
Transparency Market Research 14
Primary research involved E-mail interactions, telephonic interviews as well as face-to-
face interviews for each market, category, segment and sub-segment across
geographies
The participants who typically took part in such a process include, but are not limited to:
Industry participants: CEOs, VPs, marketing/product managers, market intelligence
managers and national sales managers
Purchasing managers, technical personnel, distributors and resellers
Outside experts: Investment bankers, valuation experts, research analysts specializing
in specific markets
Key opinion leaders specializing in different areas corresponding to different industry
verticals
Models
Where no hard data was available, we used data modeling and estimate in order to produce
comprehensive data sets. A rigorous methodology was adopted in which the available hard data
was cross referenced with the following data types to produce estimates:
Demographic data: Population split by segment
Macro-economic Indicators: GDP, inflation rate, etc.
Industry Indicators: Expenditure, technology stage & infrastructure, sector growth and
facilities
Data was then cross checked by the expert panel
SAMPLE P
AGE

Global Metrology Services Market 2012 – 2018
Transparency Market Research 15
Chapter 2 Executive Summary
The global metrology services market is driven by recovery of industrial verticals from the
economic downturn. It is going through paradigm shift and new trends are observed across
different industry verticals including automotive sector, defense, and aerospace, worldwide. The
market was valued at USD xxx million in 2012, recording a growth of xx% from that in 2011. It is
further forecast to exceed USD xxx million by 2018 at a CAGR of xx% from 2012 to 2018.
2.1 Global metrology services market, size and Y–o–Y growth, 2012 – 2018 (USD million)
FIG. 1 Global metrology services market, size and Y–o–Y growth, 2011 – 2018 (USD million)
Source: Company annual reports, Industrial journals, Technical publications, TMR analysis *Y-o-Y: Year-
on-Year
Post economic slowdown in 2009, there has been substantial shift in global economic growth
patterns. The focus shifted from American and European markets to Asia-Pacific markets, but
also new verticals such as automobile industry, aerospace and power generation have emerged
as key segments. Technological developments too are influencing the growth, and new product
development has become a significant strategy for many industrial players. There are many new
and small players entering the market making the environment competitive. High installation and
420.
9
6.5%
0.0%
2.0%
4.0%
6.0%
8.0%
10.0%
12.0%
0
100
200
300
400
500
600
700
800
2011 2012 2013 2014 2015 2016 2017 2018
Revenue (USD Million) YoY Growth (%)
SAMPLE P
AGE

Global Metrology Services Market 2012 – 2018
Transparency Market Research 16
operations cost of metrology products is pushing up the demand for metrology services, with
small and medium sized business being key buyers.
Optical Digitizers and Scanners (ODS) provides better measurement of difficult geometries with
touch probe accuracy. As a result of continuous technological developments taking place in the
industry, Optical Digitizers and Scanners (ODS) services are growing at a higher rate as
compared to Co-ordinate measuring machines services. Among different ODS services; the
demand for 3D laser scanners is highest due to high preciseness and better accurate results
offered. Laser tracker metrology services market accounted for xx% of ODS market in 2012 and
was the largest service segment. Laser tracker services market is forecast to exceed USD xx
million by 2018 at a CAGR of xx% from 2012 to 2018. CMM services market is seeing a gradual
decline in market share due to fast growth of ODS segments. Factors such as growing demand
for accurate and 3 Dimensional measurements are key causes for the decline. Moreover
inability to measure big/huge components yet again pushes buyers to opt for ODS services.
By end use sector, industrial and automotive sector are the leading revenue contributors and
collectively accounted xx% of the global metrology services market size in 2012. Growth in
industrial output and need to optimize production process is driving the market growth. Asia-
Pacific region owing to its strong customer base is expected to surpass Europe as biggest
regional market by 2018. Due to emerging opportunities and fragmented nature of market,
players are focusing on new product development and mergers and acquisitions as growth
strategies.
Companies such as Hexagon, Carl Zeiss, FARO Technologies, and Trescal are among the
global leaders and technology pioneers in the market. One such trend has been witnessed
when Trescal acquired Dynamic Technology Inc. The move not only helped Trescal to enter U.S
market, but also expand its product and services offerings. The snapshot below highlights key
trends of the global metrology services market.
SAMPLE P
AGE
Global Metrology Services Market 2012 – 2018
Transparency Market Research 17
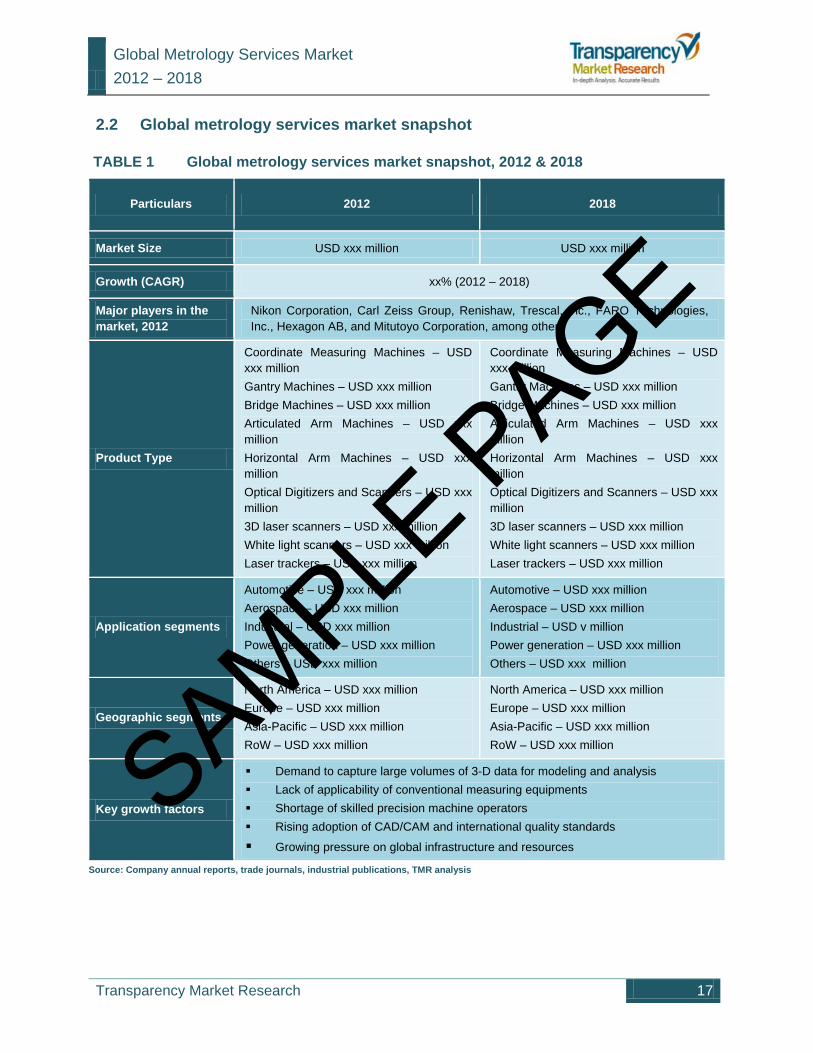
2.2 Global metrology services market snapshot
TABLE 1 Global metrology services market snapshot, 2012 & 2018
Particulars 2012 2018
Market Size USD xxx million USD xxx million
Growth (CAGR) xx% (2012 – 2018)
Major players in the market, 2012
Nikon Corporation, Carl Zeiss Group, Renishaw, Trescal, Inc., FARO Technologies, Inc., Hexagon AB, and Mitutoyo Corporation, among others
Product Type
Coordinate Measuring Machines – USD xxx million Gantry Machines – USD xxx million Bridge Machines – USD xxx million Articulated Arm Machines – USD xxx million Horizontal Arm Machines – USD xxx million Optical Digitizers and Scanners – USD xxx million 3D laser scanners – USD xxx million White light scanners – USD xxx million Laser trackers – USD xxx million
Coordinate Measuring Machines – USD xxx million Gantry Machines – USD xxx million Bridge Machines – USD xxx million Articulated Arm Machines – USD xxx million Horizontal Arm Machines – USD xxx million Optical Digitizers and Scanners – USD xxx million 3D laser scanners – USD xxx million White light scanners – USD xxx million Laser trackers – USD xxx million
Application segments
Automotive – USD xxx million Aerospace – USD xxx million Industrial – USD xxx million Power generation – USD xxx million Others – USD xxx million
Automotive – USD xxx million Aerospace – USD xxx million Industrial – USD v million Power generation – USD xxx million Others – USD xxx million
Geographic segments
North America – USD xxx million Europe – USD xxx million Asia-Pacific – USD xxx million RoW – USD xxx million
North America – USD xxx million Europe – USD xxx million Asia-Pacific – USD xxx million RoW – USD xxx million
Key growth factors
Demand to capture large volumes of 3-D data for modeling and analysis Lack of applicability of conventional measuring equipments Shortage of skilled precision machine operators Rising adoption of CAD/CAM and international quality standards
Growing pressure on global infrastructure and resources Source: Company annual reports, trade journals, industrial publications, TMR analysis
SAMPLE P
AGE

Global Metrology Services Market 2012 – 2018
Transparency Market Research 18
Chapter 3 Global Metrology Services Market Overview
3.1 Market definition
Metrology is defined as measurement of objects. This field of science has found increased
applications across different industry verticals and is witnessing dynamic shifts in growth trends.
It helps manufacturers to increase their efficiency by optimizing productivity without significantly
affecting the resource requirements. Different metrology products can be used independently or
as integrated systems for functions such as measurement (3D), quality control or inspection,
reverse engineering, product quality optimization, or to minimize need of reworks, and reduce
scrap/waste generation during the manufacturing process. However, considering the high cost
of such precision equipments, it becomes financially challenging for manufacturers to be able to
keep their inventory at par with technological developments resulting in new product introduction
in the market. This has given rise to service sector, wherein third party vendors are outsourced
the instrumentation and measurement section. The metrology services market is broadly
categorized into product segments as: Coordinate Measuring Machines (CMM) and Optical
Digitizers and Scanners (ODS). The global market for metrology services was valued at USD
xxx million in 2011 and is forecast to grow by xx% during the six years of forecast period 2012 –
2018.
3.2 Market trends and future outlook, 2012 – 2018
Global metrology services market is driven by recovery of different industry verticals such as
automotive sector, electronics industry, and power generation among others from the economic
downturn. The focus of growth shifted from North America and European markets to Asian
markets, along with the emergence of new verticals such as Medical and Academic, as key
segments. The rapidly booming automotive industry in Asia-Pacific is one of the major
contributors to the growth of metrology services market in the region. Technological
developments, too, are influencing the growth patterns, and new product development has
become a significant strategy for many industrial players. The entry of new players in recent
years has made metrology market fragmented in nature. Despite the entry of large number of
small players making the environment competitive, there are very few players dominating global
markets. Key trends observed in metrology market are as follows:
SAMPLE P
AGE

Global Metrology Services Market 2012 – 2018
Transparency Market Research 20
3.3 Factor analysis
Growth across different metrology services market segments and sub-segments is influenced
by different macro and micro-economic factors, which are discussed below under appropriate
categories, namely: drivers, restraints and opportunities.
3.3.1 Market drivers
Drivers are factors which directly or indirectly contribute to market growth. These factors
determine market potential and near future growth prospects. Key drivers are discussed below:
3 .3 .1 .1 R is ing adopt ion o f CAD/C AM and i n te rna t iona l qua l i t y s tandards
Manufacturers are increasingly adopting Computer Aided Design and Computer Aided
Manufacturing (CAD/CAM) based processes to the manufacturing cycle for perceived benefits
such as cost reduction, shorter production cycle, reduced defects, and overall operational
efficiency. Manufacturers are also adopting internationally accepted quality standards such as
QS-9000, ISO-9001, Six Sigma, so as to meet requirements of global clients. This calls for more
stringent regulations and quality processes to be brought in place, which can be achieved by
use of metrology products. However, owing to higher operations cost and initial investment,
manufacturers tend to rely on metrology service providers. These service providers offer
services such as calibration, quality control and so on. This is driving the demand for metrology
services.
3 .3 .1 .2 Shor tage o f sk i l l ed p rec is ion mach ine opera to rs
Operating a metrology product efficiently requires skilled workforce. The availability of skilled
machine operators is limited. The user has to invest in hiring a skilled machine operator thus
adding to the operation cost. Outsourcing such operations to third party vendors is an
economical alternative. This is thus driving the demand for metrology services in the market.
3 .3 .1 .3 Lack o f app l i cab i l i t y o f ex i s t ing measur ing equ ipments
Conventional measuring equipments are not able to address concerns such as throughput,
accuracy, and efficiency. The situation becomes even more adverse for large components such
as automobile parts, factory retrofits, construction equipments, aircraft parts, and other such
SAMPLE P
AGE
Global Metrology Services Market 2012 – 2018
Transparency Market Research 24
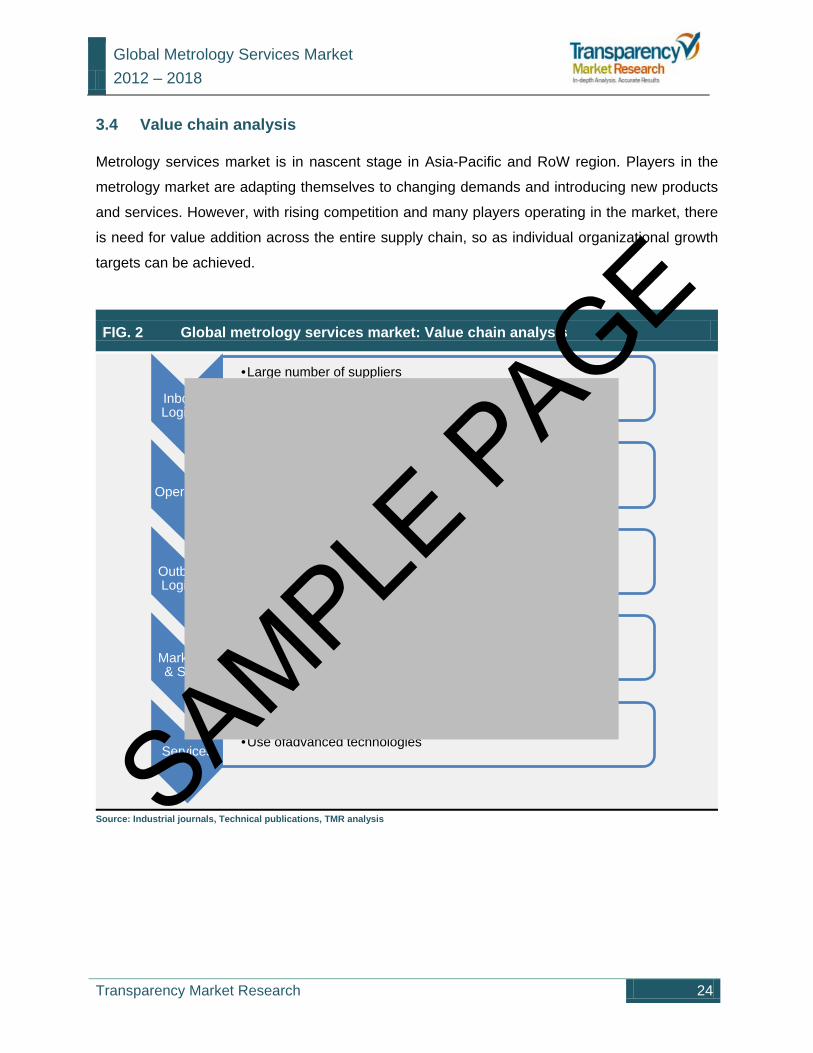
3.4 Value chain analysis
Metrology services market is in nascent stage in Asia-Pacific and RoW region. Players in the
metrology market are adapting themselves to changing demands and introducing new products
and services. However, with rising competition and many players operating in the market, there
is need for value addition across the entire supply chain, so as individual organizational growth
targets can be achieved.
FIG. 2 Global metrology services market: Value chain analysis
Source: Industrial journals, Technical publications, TMR analysis
Inbound Logistics
•Large number of suppliers•Quaity is a major challenge•lack of comprehensive solution providers
Operations
•Need for integrated solutions•Cost effective solutions in demand
Outbound Logistics
•Real time services•Demand for precise, accurate, and reliable solutions
Marketing & Sales
•Requirement of strong distribution network
Services
•Demand for custom solutions•Use ofadvanced technologies
SAMPLE P
AGE

Global Metrology Services Market 2012 – 2018
Transparency Market Research 27
3.5 Global metrology services market attractiveness
Analysis of metrology services market based on different parameters, such as product type,
geography and end-use sector, reveals that automotive sector especially in Asia-Pacific region
has high growth potential, with ODS segment being the most attractive market.
3.5.1 Global metrology services market attractiveness, by product, 2011
Among different ODS products and services, White light scanners and laser trackers are in high
demand due to their high precision and accuracy. Thus, laser scanners and articulated arm
machines are most attractive markets among all product types. However, among CMM products
and services, articulated arm machines and bridge machines are still in demand and have high
growth potential.
FIG. 3 Global metrology services market attractiveness, by product, 2011
Source: Industrial journals, Technical publications, TMR analysis Note: Bubble size represents market size
in 2011
Mar
ket G
row
th (%
)
Market Attractiveness
Gantry Machines Bridge Machines Articulated Arm Machines Horizontal Arm Machines3D laser scannners White light scanners Laser trackers
Low Medium High
Laser trackers is most attractive market due to its high accuracy and efficiency
SAMPLE P
AGE
Global Metrology Services Market 2012 – 2018
Transparency Market Research 30
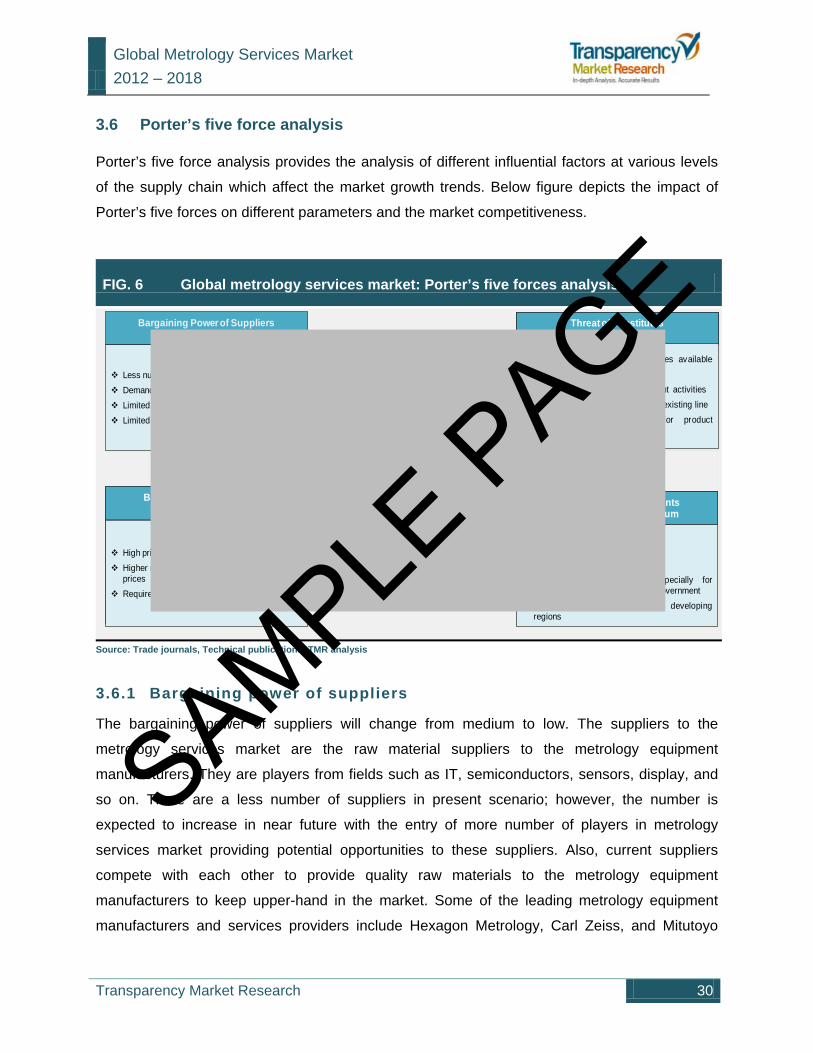
3.6 Porter’s five force analysis
Porter’s five force analysis provides the analysis of different influential factors at various levels
of the supply chain which affect the market growth trends. Below figure depicts the impact of
Porter’s five forces on different parameters and the market competitiveness.
FIG. 6 Global metrology services market: Porter’s five forces analysis
Source: Trade journals, Technical publications, TMR analysis
3.6.1 Bargaining power of suppliers
The bargaining power of suppliers will change from medium to low. The suppliers to the
metrology services market are the raw material suppliers to the metrology equipment
manufacturers. They are players from fields such as IT, semiconductors, sensors, display, and
so on. There are a less number of suppliers in present scenario; however, the number is
expected to increase in near future with the entry of more number of players in metrology
services market providing potential opportunities to these suppliers. Also, current suppliers
compete with each other to provide quality raw materials to the metrology equipment
manufacturers to keep upper-hand in the market. Some of the leading metrology equipment
manufacturers and services providers include Hexagon Metrology, Carl Zeiss, and Mitutoyo
Changing consumer demands Stringent quality standards High skilled labor for installation and usage Limited price range Increasing industrial usage in developing
regions
Degree of CompetitionLow Medium
Threat of substitutesMedium High
Threat of New EntrantsHigh Medium
Bargaining Power of BuyersMedium Medium
Bargaining Power of SuppliersMedium Low
Less number of suppliers Demand for quality raw materials Limited technology Limited price range
High quality assurance High skilled labor High installation price Stringent quality products (especially for
medical devices), as defined by government Increasing industrial usage in developing
regions
No compatible external substitutes availablecurrently
Ongoing research and development activities Threat from improved products in existing line Risk of customers opting for product
installation
High price for ODS products Higher number of distributors quoting varing
prices Required high skilled labor for usage
SAMPLE P
AGE

Global Metrology Services Market 2012 – 2018
Transparency Market Research 33
Chapter 4 Global Metrology Services Market, by Products
4.1 Introduction
Global metrology services market is segmented in two major product segments as Coordinate
Measuring Machines and Optical Digitizers and Scanners. ODS is the largest product segment
that accounted for around xx% market share in 2012 and is expected to increase its share by
2018, growing at a CAGR of xx% during the forecast period. 3D laser scanners is the largest
product segment in ODS market. CMM is expected to lose a share of xx% by 2018 as
compared to 2012 (xx%).
TABLE 2 Global metrology services market, by products, 2011 – 2018 (USD million)
Product Type 2011 2012 2013 2014 2015 2016 2017 2018 CAGR (%)
2012 - 2018
CMM 176.8 xxx xxx xxx xxx xxx xxx xxx xxx
ODS 244.1 xxx xxx xxx xxx xxx xxx xxx xxx
Global 420.9 xxx xxx xxx xxx xxx xxx xxx xxx
Source: Company annual reports, trade journals, industrial publications, TMR analysis
4.1.1 Comparative analysis of global metrology services market, by products, 2012 & 2018 (value %)
FIG. 7 Global metrology services market share, by products, 2012 & 2018 (value %)
Source: Company annual reports, trade journals, industrial publications, TMR analysis
2012
Coordinated Measuring Machines
Optical Digitizers and Scanners
2018
Coordinated Measuring Machines
Optical Digitizers and Scanners
SAMPLE P
AGE

Global Metrology Services Market 2012 – 2018
Transparency Market Research 37
4.2.3 Bridge machines services
The bridge machine is a type of Coordinate Measuring Machine that has a horizontal frame
supported by two vertical columns. The machine arm is vertically suspended to measure the
work piece. The bridge type CMM is the largest segment and accounts for around xx% share of
the total CMM market. The growing demand from automotive, aerospace, and defence
industries will gradually increase the share and demand for bridge type CMM in upcoming
years.
4 .2 .3 .1 G loba l b r idge mach ines se rv ices marke t , s i z e and fo recas t , 2011 – 2018 (USD mi l l ion )
The global bridge machines market in 2011 was valued at USD xxx million in 2011 and USD xxx
million in 2012. It is further expected to grow at a CAGR of xx% during the forecast period from
2012 to 2018 and reach the market size of USD xxx million by 2018.
FIG. 10 Global bridge machines services market, size and forecast, 2011 – 2018 (USD million)
Source: Company annual reports, trade journals, industrial publications, TMR analysis
61.9
2011 2012 2013 2014 2015 2016 2017 2018SAMPLE P
AGE
Global Metrology Services Market 2012 – 2018
Transparency Market Research 45
Chapter 5 Global Metrology Services Market, by End-user Applications
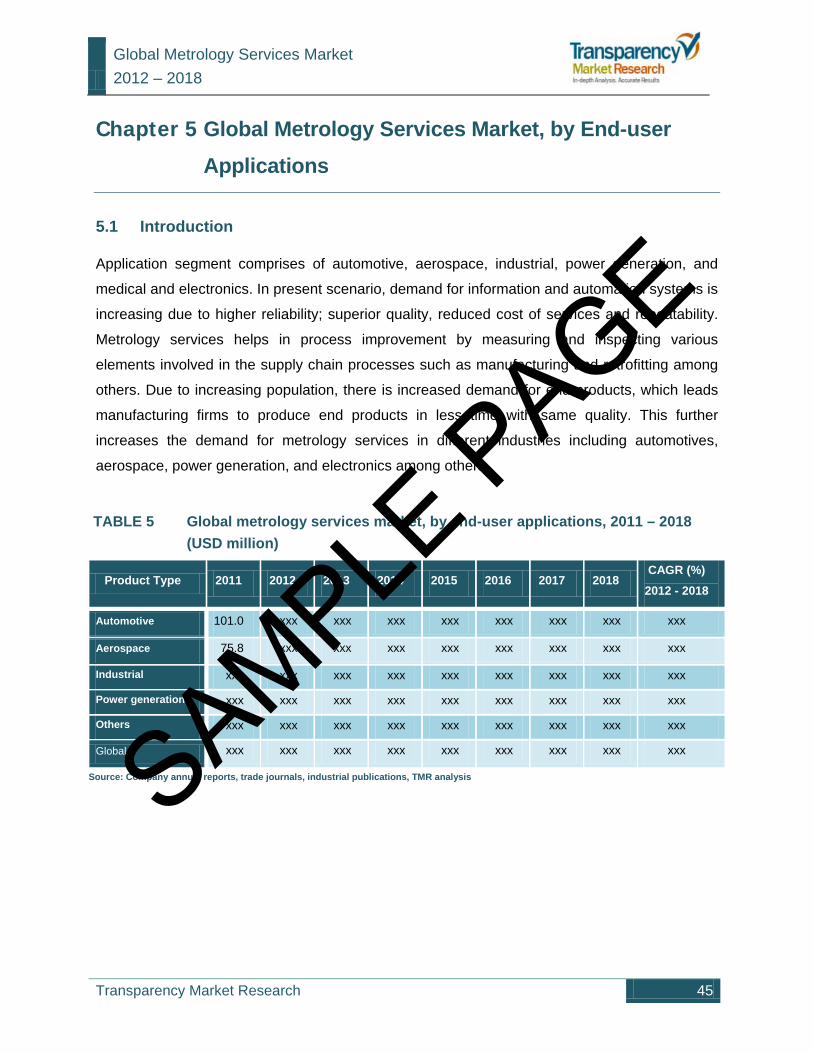
5.1 Introduction
Application segment comprises of automotive, aerospace, industrial, power generation, and
medical and electronics. In present scenario, demand for information and automation systems is
increasing due to higher reliability; superior quality, reduced cost of services and repeatability.
Metrology services helps in process improvement by measuring and inspecting various
elements involved in the supply chain processes such as manufacturing and retrofitting among
others. Due to increasing population, there is increased demand for end products, which leads
manufacturing firms to produce end products in less time with same quality. This further
increases the demand for metrology services in different industries including automotives,
aerospace, power generation, and electronics among others.
TABLE 5 Global metrology services market, by end-user applications, 2011 – 2018 (USD million)
Product Type 2011 2012 2013 2014 2015 2016 2017 2018 CAGR (%)
2012 - 2018
Automotive 101.0 xxx xxx xxx xxx xxx xxx xxx xxx
Aerospace 75.8 xxx xxx xxx xxx xxx xxx xxx xxx
Industrial xxx xxx xxx xxx xxx xxx xxx xxx xxx Power generation xxx xxx xxx xxx xxx xxx xxx xxx xxx Others xxx xxx xxx xxx xxx xxx xxx xxx xxx
Global xxx xxx xxx xxx xxx xxx xxx xxx xxx
Source: Company annual reports, trade journals, industrial publications, TMR analysis
SAMPLE P
AGE

Global Metrology Services Market 2012 – 2018
Transparency Market Research 49
5.4 Metrology services market in industrial applications
Metrology services find significant applications in different process industries for measurement
of different machines and end products size such as packaging, cutting, and molding etc, used
or manufactured in various industries. Use of metrology equipments for the measurement helps
in improving the efficiency and accuracy of the machine and provides better operational control.
5.4.1 Global metrology services market in industrial applications, 2011 – 2018 (USD million)
Industrial segment has largest end use market for metrology services and accounted for xx% of
the entire Metrology services market in 2012. The global market for metrology services in
industrial segment was valued USD xxx million and witnessed a growth of xx% to reach USD
xxx million in 2012. It is further expected to increase to USD xxx million by 2018, growing at a
CAGR of xx% from 2012 to 2018.
FIG. 20 Global metrology services market in industrial applications, 2011 – 2018 (USD million)
Source: Company annual reports, trade journals, industrial publications, TMR analysis
117.
8
2011 2012 2013 2014 2015 2016 2017 2018SAMPLE P
AGE
Global Metrology Services Market 2012 – 2018
Transparency Market Research 52
Chapter 6 Global Metrology Services Market, by Geography
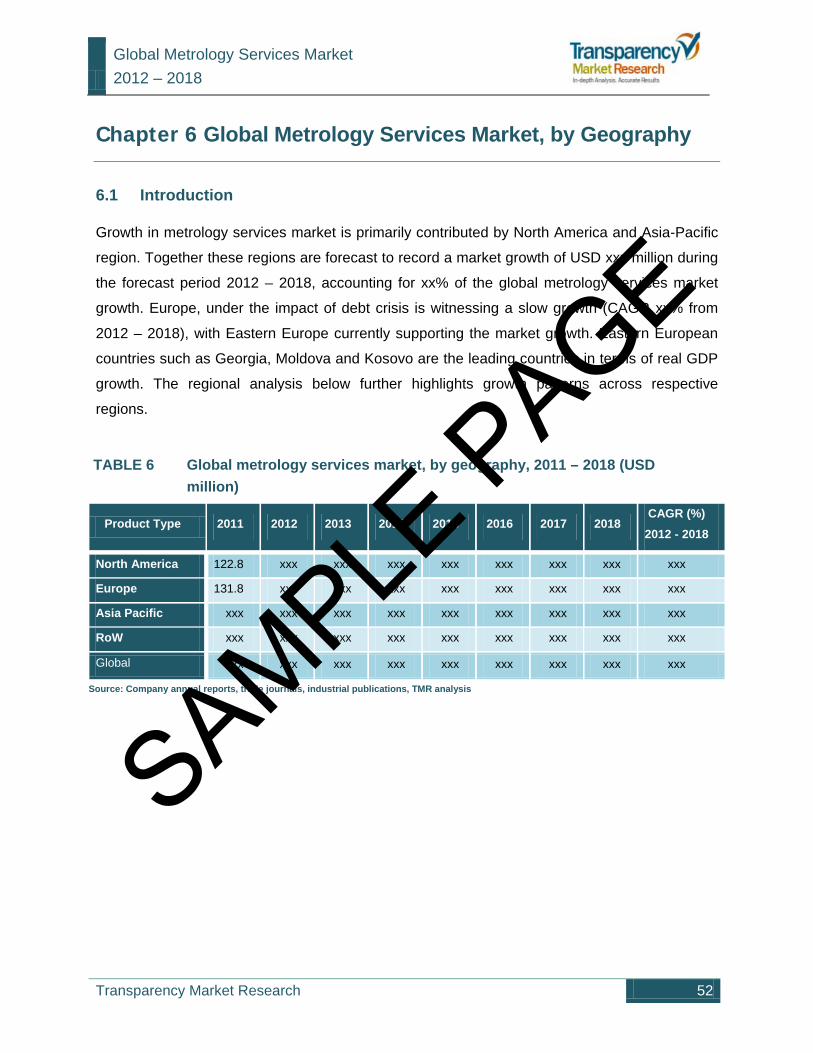
6.1 Introduction
Growth in metrology services market is primarily contributed by North America and Asia-Pacific
region. Together these regions are forecast to record a market growth of USD xxx million during
the forecast period 2012 – 2018, accounting for xx% of the global metrology services market
growth. Europe, under the impact of debt crisis is witnessing a slow growth (CAGR xx% from
2012 – 2018), with Eastern Europe currently supporting the market growth. Eastern European
countries such as Georgia, Moldova and Kosovo are the leading countries in terms of real GDP
growth. The regional analysis below further highlights growth patterns across respective
regions.
TABLE 6 Global metrology services market, by geography, 2011 – 2018 (USD million)
Product Type 2011 2012 2013 2014 2015 2016 2017 2018 CAGR (%)
2012 - 2018
North America 122.8 xxx xxx xxx xxx xxx xxx xxx xxx
Europe 131.8 xxx xxx xxx xxx xxx xxx xxx xxx
Asia Pacific xxx xxx xxx xxx xxx xxx xxx xxx xxx
RoW xxx xxx xxx xxx xxx xxx xxx xxx xxx
Global xxx xxx xxx xxx xxx xxx xxx xxx xxx
Source: Company annual reports, trade journals, industrial publications, TMR analysis
SAMPLE P
AGE
Global Metrology Services Market 2012 – 2018
Transparency Market Research 58
Chapter 7 Key Competitors Analysis
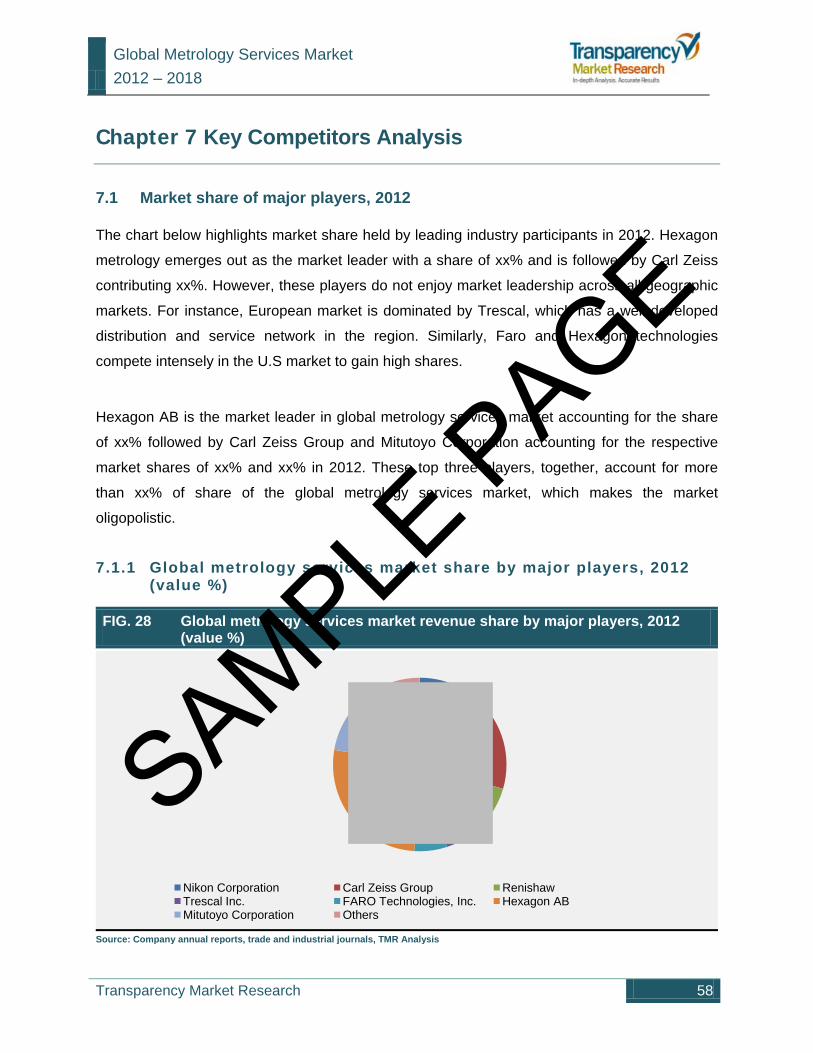
7.1 Market share of major players, 2012
The chart below highlights market share held by leading industry participants in 2012. Hexagon
metrology emerges out as the market leader with a share of xx% and is followed by Carl Zeiss
contributing xx%. However, these players do not enjoy market leadership across all geographic
markets. For instance, European market is dominated by Trescal, which has a well developed
distribution and service network in the region. Similarly, Faro and Hexagon technologies
compete intensely in the U.S market to gain high shares.
Hexagon AB is the market leader in global metrology services market accounting for the share
of xx% followed by Carl Zeiss Group and Mitutoyo Corporation accounting for the respective
market shares of xx% and xx% in 2012. These top three players, together, account for more
than xx% of share of the global metrology services market, which makes the market
oligopolistic.
7.1.1 Global metrology services market share by major players, 2012 (value %)
FIG. 28 Global metrology services market revenue share by major players, 2012 (value %)
Source: Company annual reports, trade and industrial journals, TMR Analysis
Nikon Corporation Carl Zeiss Group RenishawTrescal Inc. FARO Technologies, Inc. Hexagon ABMitutoyo Corporation Others
SAMPLE P
AGE
Global Metrology Services Market 2012 – 2018
Transparency Market Research 60
Chapter 8 Company Profiles
8.1 Hexagon AB
Hexagon AB (Publ)
P.O. Box 3692
(Street address: Lilla Bantorget 15)
SE-103 59 Stockholm
Sweden
Telephone: +46 8 601 26 20
Fax: +46 8 601 26 21
Website: www.hexagon.com/en/Metrology.htm
8.1.1 Company overview
Hexagon Metrology is a part of the Hexagon AB and is headquartered in UK. The company
offers diverse range of products and services for metrological applications in sectors like
aerospace, automotive, medical and energy. The company markets its products under the
brands like Brown & Sharpe, DEA, CogniTens, Leica Geosystems, PC-DMIS, Leitz, Sheffield,
ROMER and TESA. The company group had around 13,203 employees while the company had
around 4,357 employees by the end of 2012.
8.1.2 Financial overview
The company Hexagon group reported annual revenue of USD xxx million in 2012. The
metrology business of the company accounted for xx% of the revenue generated in 2012.
Geographically, company had Western Europe as its highest earning market, with a revenue
share of xx% followed by North America with a share of xx%.
SAMPLE P
AGE

Global Metrology Services Market 2012 – 2018
Transparency Market Research 61
FIG. 29 Hexagon AB annual revenues, 2010 – 2012 (USD million)
Source: Company’s annual report 2011 and 2012, Company website
8.1.3 Business strategies
The company is focused on strengthening its brand as well as brand architecture system across
the globe. The company’s brand strategy is in line with its growth strategy that enhances its
profitability and long term sustainability. Research and development is another avenue of
interest for the company and as such company invests heavily in its R&D facilities. In 2012, the
company invested around USD xxx million in its R&D activities. With its robust R&D facilities,
the company aims to renew its product portfolio every 18 months. For expanding its business
operations, the company has adopted aggressive acquisition strategy. Hexagon acquired Mahr
Multisensor GmbH, a leading vision metrology company in 2009 to expand its product offerings
in vision multisensor technology and offer wide range of measuring systems for all industrial
applications.
In last decade, the company implemented as many as 80 acquisitions. The company has
concentrated its efforts in developing competitive cost structure to sustain its market leading
position.
1,98
6.0
2010 2011 2012
SAMPLE P
AGE

Global Metrology Services Market 2012 – 2018
Transparency Market Research 62
8.1.4 Recent developments
In May 2013, the company announced the renewal of its Innovation Partnership
contract with Red Bull Technologies to consolidate the co-operation between the two
In May 2013, the company announced the launch of its new TESA TLC-TWIN
transceiver designed to enhance performance and offer features to measure with an
ease
In May 2013, the company announced the launch of its new portable gear
measurement solutions. This measurement solution is coupled with QUINDOS
measurement software to measure complex parts examined on complex metrology
devices
In April 2013, the company announced extension of its basic range of multi sensor
portfolio by introducing three new Optiv Classic models of multi-sensors
SAMPLE P
AGE
Global Metrology Services Market 2012 – 2018
Transparency Market Research 78
Disclaimer
In response to request/orders received, Transparency Market Research (TMR) provides
strategic business/market analysis services to a select group of customers that are limited to
publications containing valuable market information. The publication is solely for our customers’
internal use. It is acknowledged by our customer, by placing the order that no part of this
strategic business/market analysis service is for general publication or disclosure to third party.
TMR doesn’t make any warranty for the accuracy of the data as these are primarily based on
interviews and therefore, liable for fluctuation. Also, TMR doesn’t take responsibility for incorrect
information supplied by manufacturers or users.
Any resale, lending, disclosure or reproduction of this publication can only be made with prior
written permission from TMR.
Transmission and/or reproduction of this document by any means or in any form (includes
photocopying, mechanical, electronic, recording or otherwise) are prohibited without the
permission of TMR.
For information regarding permissions, contact:
Tel: 1-518-618-1030
Email: [email protected] SAMPLE P
AGE
Copyright © 2022 FDOKUMEN