Potential Occurrence of MTBE and BTEX in Groundwater Resources of Amman-Zarqa Basin, Jordan
Upload
khangminh22Category
view
1download
0
Methyl tert-Butyl Ether (MTBE) in the Aquatic Environment
in Germany
Dissertation
zur Erlangung des Doktorgrades
der Naturwissenschaften
vorgelegt beim Fachbereich Geowissenschaften
der Johann Wolfgang Goethe-Universität Frankfurt am Main
von
Dipl.-Geol. Christine Achten
geb. Eichler
aus Buchholz in der Nordheide
Frankfurt am Main 2001
II
Contents
Danksagung............................................................................................................................... V
Kurzfassung (Short Summary) .................................................................................................VI
Zusammenfassung (Summary) ............................................................................................. ..1
Introduction ............................................................................................................................11
1 Use, History, Political and Legal Aspects of Methyl tert-Butyl Ether (MTBE)........14
1.1 Use, History and Political Aspects ...................................................................................14
1.1.1 United States of America (U.S.) ............................................................................14
1.1.2 European Union (EU) ............................................................................................18
1.1.3 Germany.................................................................................................................21
1.2 Legal Aspects ...................................................................................................................24
1.2.1 United States of America (U.S.) ............................................................................27
1.2.2 European Union (EU) ............................................................................................27
1.2.3 Germany.................................................................................................................28
2 Synthesis, Properties of MTBE and its Behavior in the Environment ......................29 2.1 Synthesis...........................................................................................................................29
2.2 Physico-Chemical Properties............................................................................................30
2.3 Degradation.......................................................................................................................34
2.3.1 Water and Soil........................................................................................................34
2.3.2 Air ..........................................................................................................................36
2.4 Toxicity.............................................................................................................................37
2.5 Emission Pathways into the Aquatic Environment ..........................................................39
2.6 Behavior in the Environment............................................................................................41
2.7 Comparison to Other Oxygenates ....................................................................................42
3 Analytical Methods.........................................................................................................47 3.1 Method for Determination of MTBE in Gasoline by Gas Chromatography (GC)...........47
3.1.1 Abstract ..................................................................................................................47
3.1.2 Introduction............................................................................................................47
3.1.3 Experimental Section .............................................................................................48
3.1.3.1 Materials and Methods ....................................................................................48
3.1.3.2 Instrumental .....................................................................................................48
3.1.4 Results and Discussion...........................................................................................50
3.1.5 Conclusion .............................................................................................................53
3.2 Determination of MTBE in Surface Water by Use of Direct Solid-Phase
Microextraction/ Gas Chromatography-Mass Spectrometry (SPME/ GC-MS)...............55
3.2.1 Abstract............................................................................................................55
3.2.2 Introduction .....................................................................................................55
3.2.3 Experimental Section.......................................................................................56
3.2.3.1 Materials and Methods..............................................................................56
3.2.3.2 GC/ MS .....................................................................................................56
3.2.4 Results and Discussion ....................................................................................58
3.3 Improvement of the Method: SPME in Headspace (HS-SPME) .....................................63
III
3.3.1 Abstract ..................................................................................................................63
3.3.2 Introduction............................................................................................................63
3.3.3 Experimental Section .............................................................................................65
3.3.3.1 Materials and Methods ....................................................................................65
3.3.3.2 HS-SPME/ GC-MS .........................................................................................66
3.3.3.3 Starting Conditions..........................................................................................67
3.3.4 Results and Discussion...........................................................................................67
3.3.4.1 Method Development ......................................................................................67
3.3.4.1.1 Location of the Fiber and Sample Volume ...............................................67
3.3.4.1.2 Extraction Time and Time of the Total Analytical Cycle.........................68
3.3.4.1.3 Sample Temperature .................................................................................68
3.3.4.1.4 Sodium Chloride Concentration................................................................71
3.3.4.2 Method Validation...........................................................................................71
3.3.4.2.1 Blanks........................................................................................................71
3.3.4.2.2 Calibration and Linearity ..........................................................................71
3.3.4.2.3 Accuracy and Precision.............................................................................73
3.3.4.2.4 Field Study ................................................................................................75
3.3.5 Conclusions............................................................................................................76 4 MTBE Concentrations in Environmental Water Samples in Germany ...................77 4.1 MTBE in Urban and Rural Precipitation..........................................................................77
4.1.1 Abstract ..................................................................................................................77
4.1.2 Introduction............................................................................................................77
4.1.3 Sampling ................................................................................................................79
4.1.4 Results and Discussion...........................................................................................80
4.1.4.1 Precipitation.....................................................................................................80
4.1.4.2 Comparison of the MTBE Concentrations in Precipitation to Other Data......86
4.1.4.3 Urban Runoff...................................................................................................88
4.1.5 Conclusions............................................................................................................89
4.2 MTBE in River and Waste Water ....................................................................................89
4.2.1 Abstract ..................................................................................................................89
4.2.2 Introduction............................................................................................................90
4.2.3 Waste Water Processing at Sewage Plants Frankfurt/ M-Niederrad and
Sindlingen ..............................................................................................................93
4.2.4 Sampling ................................................................................................................94
4.2.5 Results....................................................................................................................94
4.2.5.1 MTBE in German River Water .......................................................................94
4.2.5.2 MTBE in Domestic and Industrial Waste Water...........................................102
4.2.6 Discussion ............................................................................................................103
4.2.7 Conclusions..........................................................................................................110
4.3 MTBE in Bank-Filtered Water and Drinking Water Produced by Riverbank
Filtration .........................................................................................................................111
4.3.1 Abstract ................................................................................................................111
4.3.2 Introduction..........................................................................................................112
4.3.2.1 Site Locations ................................................................................................116
4.3.2.1.1 Water Utility 1 at the Lower Rhine River...............................................116
4.3.2.1.2 Drinking Water Purification Processing at Water Utility 1 ....................118
4.3.2.1.3 Eddersheim at the Lower Main River in the Vicinity of Frankfurt/ M...119
4.3.3 Sampling ..............................................................................................................120
4.3.4 Results.................................................................................................................. 120
IV
4.3.4.1 MTBE in Bank Filtration Water and in Water from Water Utility 1 at the
Lower Rhine River ........................................................................................120
4.3.4.2 MTBE in Bank Filtration Water at the Main River.......................................122
4.3.5 Discussion ............................................................................................................123
4.3.6 Conclusions..........................................................................................................129
5 Compartment Modeling of MTBE in the Generic Environment and Estimations of the Aquatic MTBE Input in Germany Using the Equilibrium Criterion (EQC) Model ..........................................................................130 5.1 Abstract...........................................................................................................................130
5.2 Introduction ....................................................................................................................131
5.3 Batch Experiment ........................................................................................................... 132
5.4 The EQC Model .............................................................................................................132
5.5 Model Design for MTBE................................................................................................134
5.5.1 Physico-Chemical Data........................................................................................134
5.5.2 Emission Rates and Degradation Half-Life Times ..............................................135
5.6 Results ............................................................................................................................135
5.6.1 MTBE Degradation in Water from Main River...................................................135
5.6.2 Modeling of MTBE in the Generic Environment by the EQC Model.................138
5.6.2.1 Level I Calculations.......................................................................................138
5.6.2.2 Level II Calculations .....................................................................................139
5.6.2.3 Level III Calculations in the Generic Environment.......................................139
5.6.3 Estimations of the MTBE Amount Emitted into Surface Water and the
Average Surface Water Concentration in Germany in 1999/ 2000 .....................139
5.6.3.1 Amount of MTBE Emitted into German Surface Water...............................139
5.6.3.2 Average Surface Water Concentration in Germany......................................142
5.6.4 Level III Simulations of MTBE Using the Estimated German Emission
Scenario................................................................................................................143
5.7 Discussion.......................................................................................................................145
5.7.1 General Aspects of the Behavior of MTBE in the Environment........................145
5.7.2 MTBE Concentrations Calculated by the Level III EQC Model with German
Emission Scenario in Comparison to Measured Data (1999/ 2000)...................146
5.8 Conclusions ....................................................................................................................147
6 Conclusions and Future Implications .........................................................................148 7 References .....................................................................................................................151 Contents of Figures and Tables ..............................................................................................174
Contents of Figures.........................................................................................................174
Contents of Tables ..........................................................................................................179
Key Words..............................................................................................................................181
Abbreviations .........................................................................................................................182
Publications ............................................................................................................................184
MTBE Web-Sites ...................................................................................................................186
Appendix Measured Environmental Methyl tert-Butyl Ether (MTBE) Concentrations (ng/L)
Publications
V
Publications
Achten, C.; Püttmann, W., Method for Determination of Methyl tert-Butyl Ether in
Gasoline by Gas Chromatography J. Chrom. A 2001, 910, 377-383.
(modified after chapter 3.1)
Achten, C., Püttmann, W., Determination of Methyl tert-Butyl Ether in Surface Water
by Use of Solid-Phase Microextraction Environ. Sci. Technol. 2000, 34, 1359-1364.
(modified after chapter 3.2)
Achten, C.; Kolb, A.; Püttmann, W., Sensitive Method for Determination of Methyl
tert-Butyl Ether (MTBE) in Water by Use of Headspace-SPME/ GC-MS Fresenius J. Anal. Chem., 2001, 371 (4), 519-525.
(modified after chapter 3.3)
Achten, C.; Kolb, A.; Püttmann, W., Methyl tert-Butyl Ether (MTBE) in Urban and
Rural Precipitation in Germany Atmos. Environ. 2001, 35/36, 6337-6345.
(modified after chapter 4.1)
Achten, C.; Kolb, A.; Seel, P.; Gihr, R.; Püttmann, W., Methyl tert-Butyl Ether
(MTBE) in River and Waste Water in Germany Environ. Sci. Technol. 2002, 36,
3652-3661.
(modified after chapter 4.2)
Achten, C.; Kolb, A.; Püttmann, W., Occurence of Methyl tert-Butyl Ether (MTBE) in
Riverbank Filtered Water and Drinking Water Produced by Riverbank Filtration
(Part II) Environ. Sci. Technol. 2002, 36, 3662-3670.
(modified after chapter 4.3)
Achten, C.; Püttmann, W., Klasmeier, J., Compartment Modeling of MTBE in the
generic environment and estimations of the aquatic MTBE input in Germany using
the EQC model J. Environ. Monit. 2002, 4, 747-753.
(modified after chapter 5)
Achten, C.; Püttmann, W., Empfindliche Messmethode für Methyl-tertiär-butylether
(MTBE) in Wasser Umwelt Technologie Aktuell 2001, 1, 22-25.
Achten, C.; Kolb, A.; Püttmann, W., Methyl-tertiär-butylether (MTBE) in der aquatischen Umwelt Speech at the Umweltchemisches Seminar of the J.W. Goethe-
Universität Frankfurt/ M: Frankfurt/ M, Germany, 2001
Achten, C.; Kolb, A.; Püttmann, W., Empfindliche Messmethode für Methyl-tertiär-butylether (MTBE) in Wasser mittels Headspace-SPME/ GC-MS Speech at the
International Symposium on Instrumentalized Analytical Chemistry and Computer
Technology (INCOM) Conference: Düsseldorf, Germany, Mar. 27, 2001.
Publications
V
Achten, C.; Kolb, A.; Püttmann, W., River Water as a Sink for Atmospheric Methyl tert-butyl ether (MTBE) Speech at the Conference on Oxygenated Organics in the
Atmosphere – Sources, Sinks and Atmospheric Impact, Gesellschaft Deutscher
Chemiker (GDCH)-Arbeitskreis Atmosphärenchemie der Fachgruppe
Umweltchemie und Ökotoxikologie: Como, Italia, Oct. 7, 2001.
Püttmann, W.; Achten, C.; Kolb, A., MTBE: Ein Segen für die Luft, ein Fluch für das Wasser Geowissenschaften in Frankfurt, Kleine Senckenberg-Reihe 43, A. Junge
(Hrsg.), E. Schweizerbart’sche Verlagsbuchhandlung (Nägele u. Obermiller),
Stuttgart, 29-40.
Publications from Newspapers Directly Related to the Results of This Study
Püttmann, W.; Achten, C. Saubere Luft, verschmutztes Wasser, Uni-News der J.W.
Goethe-Universität Frankfurt/ M, 16.08.1999
Anonymous Benzin-Zusatz Gift für das Grundwasser, Hanauer Anzeiger, 18.08.1999
Anonymous Benzin-Zusatz belastet die Umwelt, Wiesbadener Kurier, 18.08.1999
Mrasek, V. Probleme für den Öko-Kraftstoff, Süddeutsche Zeitung, 24.08.1999
Anonymous Saubere Luft, verschmutztes Wasser, Uni-Report der J.W. Goethe-
Universität Frankfurt/ M, 08/ 1999
Mrasek, V. Die Luft wird reiner-auf Kosten des Wassers, Berliner Zeitung, 08.09.1999
Anonymous “Wunderwaffe“ gegen Smog belastet das Grundwasser, Salzburger
Nachrichten, 19.09.1999 Müller-Jung, J. Bessere Luft, schlechteres Wasser?, Frankfurter Allgemeine Zeitung,
28.09.1999
Müller, W.E. Riskanter Benzinzusatz, Frankfurter Rundschau, 23.10.1999 Wegener, E. Wenn die „Wunderwaffe“ gegen Smog selbst zur Last wird, Frankfurter
Rundschau, 25.10.1999 Anonymous Diskussion um MTBE, CHEManager, 12/ 1999
Mrasek, V. MTBE in Deutschland kein Problem?, Frankfurter Rundschau, 22.01.2000 Püttmann, W.; Achten, C.; Kolb, A. MTBE: Ein Segen für die Luft, ein Fluch für das
Wasser, Sonderheft Geowissenschaften, in press
VII
Danksagung
Die vorliegende Dissertation wurde am Institut für Mineralogie, Abteilung Umweltanalytik,
der J.W. Goethe-Universität Frankfurt am Main durchgeführt. Eine finanzielle Unterstützung
erfolgte vom Main-Kinzig-Kreis, Hessen.
Mein besonderer Dank gilt Herrn Prof. Dr. W. Püttmann für die Vergabe des Themas, für die
sehr hilfreiche Diskussionsbereitschaft zu jeder Zeit und für die zahlreichen Anregungen, die
entscheidend zum Gelingen dieser Arbeit beitrugen. Gedankt sei für die kritische Durchsicht
des gesamten Manuskripts. Sehr herzlich danken möchte ich ihm weiterhin für seine Toleranz
und organisatorische Unterstützung, die die Fertigstellung dieser Arbeit einer jungen Mutter
ermöglicht hat.
Ferner gilt mein Dank Herrn Prof. Dr. H. F. Schöler, Institut für Umwelt-Geochemie der
Universität Heidelberg und Herrn Dr. R. Schleyer, Institut für Wasser-, Boden- und
Lufthygiene des Umweltbundesamtes für die Übernahme der Korreferate. Herrn Dr. R.
Schleyer und Frau Riedel danke ich sehr für die hilfreiche Unterstützung zu Beginn der
Arbeit.
Herrn Dr. P. Seel, Frau R. Gihr und Herrn F.-G. Van der Loo, Hessisches Landesamt für
Umwelt und Geologie (zahlreiche Oberflächenwasserproben und industrielle Abläufe), Frau
E. Jreisat und Herrn A. Allendorf, Mainova AG, Frankfurt/ M (Uferfiltrat) und Frau Dr. S.
Schmid, Dezernat für Umwelt, Energie und Brandschutz der Stadt Frankfurt am Main
(Abwasser) gilt mein herzlicher Dank für die Unterstützung dieser Arbeit,
Probenbereitstellungen und für zahlreiche Informationen und Diskussionen.
Für die Bereitstellung von Uferfiltrat, Rohwasser, Trinkwasser und Arbeitsmaterial sowie die
Diskussionsbereitschaft und die Durchsicht des entsprechenden Manuskriptteils möchte ich
mich auch bei den Mitarbeitern einer Stadt am Rhein besonders bedanken.
Mein Dank geht weiterhin an Herrn Dr. H. Werner, Umweltbundesamt, Herrn H.-J. Abraham,
Umweltsenator Berlin, Herrn Dr. H. Bingemer, Institut für Meteorlogie der Universität
Frankfurt am Main, Wolfgang Eichler, Ruth Ortmüller, Christina Köhler, Brigitta Hüttemann,
Jürgen Roder, Ute Achten und Lotte Burkhardt für die Bereitstellung von Niederschlags-
proben.
Herzlich gedankt sei allen Mitarbeitern des Instituts für Mineralogie, Abteilung Umwelt-
analytik, für die Unterstützung, besonders jedoch Herrn Dipl.-Chem. Axel Kolb für die
tatkräftige Hilfe in der Analytik und für fachliche Unterstützung.
Herrn Prof. Dr. M. Matthies und Herrn Dr. J. Klasmeier, Institut für Umweltsystemforschung
der Universität Osnabrück, gilt mein herzlicher Dank für die fachliche Unterstützung bei der
EQC-Modellierung und für die Durchsicht des entsprechenden Manuskriptteils und die
produktive Kritik.
Für die Hilfe bei Abschätzungen von emittierten und transportierten MTBE-Mengen möchte
ich mich bei Herrn Dr. G. Rippen, Arcadis Consult, sehr bedanken.
Mein Dank gilt nicht zuletzt meinem Sohn Jan Erik für viele geduldige Stunden und
schließlich meinem Mann, Jens Achten, der mir in organisatorischer, fachlicher und
moralischer Hinsicht zur Seite stand.
Publications
1
Kurzfassung (Short Summary)
Der Einsatz des Kraftstoffadditivs Methyl tert-butylether (MTBE) hat in den USA (1999:
9,3 Millionen t) zu erheblichen Kontaminationen von Grundwasser durch unterirdische
Tankleckagen geführt. Da dies zur Schließung von Trinkwasserversorgungsbrunnen führte,
wurde MTBE in einigen Bundesstaaten verboten. Darüber hinaus wird das Oxygenat in der
Atmosphäre und der aquatischen Umwelt besonders in besiedelten Gebieten häufig
nachgewiesen. Auch in Deutschland wird das Oxygenat eingesetzt, jedoch in geringerem
Umfang.
Das Ziel der vorliegenden Arbeit war die Klärung der Frage, in welchem Ausmaß MTBE in
Deutschland eingesetzt wird, und ob der Einsatz des Oxygenats in der Umwelt zu
nachweisbaren Konzentrationen geführt hat. Es sollte eine empfindliche Messmethode
entwickelt werden, um Oberflächenwasser in Deutschland zu analysieren. Die Ergebnisse
sollten dazu dienen, einen Überblick über die MTBE-Situation in Deutschland zu erhalten
und Emissionsquellen zu ermitteln.
Bedingt durch einen hohen Dampfdruck (330 hPa bei 25 °C) und einen niedrigen Siedepunkt
(55 °C) evaporiert MTBE leicht aus Kraftstoffen in die Umwelt. Die hohe Wasserlöslichkeit
(42 g/L bei 20 °C) des Ethers führt zu einem bevorzugten Verbleib in der wässrigen Phase.
Bedingt durch die schlechte Abbaubarkeit und die geringe Retardierung im Untergrund, stellt
MTBE eine persistente Verbindung im Wasser dar. Zur Toxizität von MTBE liegen
widersprüchliche Angaben vor, so daß eine abschließende Bewertung zur Zeit nicht erfolgen
sollte.
Mittels einer eigens hierfür entwickelten Messmethode basierend auf Gaschromatographie
(GC) mit Flammenionisationsdetektion und nur einer Kapillarsäule wurden 1999/ 2000
Vergaserkraftstoffe aus dem Frankfurter Raum auf ihren MTBE-Gehalt analysiert. Die
Konzentrationen schwankten von 0,3 – 0,6 Gew.-% im Normal Benzin, von 0,3 – 4,2 Gew.-%
im Superkraftstoff, von 6,8 – 12,2 Gew.-% im Superplus und von 10,4 – 13,6 Gew.-% im
„Optimax“-Kraftstoff. Aus den Messwerten wurde ein MTBE-Verbrauch von ca. 500.000 t in
deutschen Kraftstoffen für 1999 berechnet. Dieser Wert entspricht der in anderen Arbeiten
geschätzten Menge.
Für die MTBE-Analyse von Oberflächenwasser wurde eine empfindliche Messmethode durch
die Kombination von Solid-Phase Microextraction und Gaschromatographie/
Massenspektrometrie (SPME/ GC-MS) entwickelt. Die Nachweisgrenze liegt bei 10 ng/L und
die relative Standardabweichung bei 11 %. Die beschriebene Methode lieferte in einem
Publications
2
kürzlich durchgeführten Ringversuch hervorragende Ergebnisse und ist auch für
höherkonzentrierte Wässer geeignet, wenn diese vorher verdünnt werden.
Im Zeitraum von 1998 – 2001 wurden 616 Proben aus Niederschlag, Flüssen, Bächen,
kommunalem und industriellem Abwasser, Trinkwasser, Uferfiltrat und Oberflächenabfluß
mit der SPME/ GC-MS - Methode analysiert. Die Ergebnisse der Niederschlagsmessungen
zeigen, daß MTBE im Winter in Städten, im Gegensatz zu ländlichen Gebieten, in geringen
Konzentrationen (bis 85 ng/L) nachweisbar ist. Schneeproben zeigen höchste Gehalte. Die
MTBE-Konzentrationen in deutschen Fließgewässern, städtischem Oberflächenabfluß und
kommunalem Abwasser schwanken unabhängig von der Jahreszeit von <10 – 2357 ng/L und
liegen im Niedermain, Niederrhein, städtischem Oberflächenabfluß und kommunalem
Abwasser in Frankfurt/ M bei ca. 100 – 250 ng/L. Sonstige Flüsse und Bäche weisen häufig
Konzentrationen von ca. 50 ng/L auf. Erhöhte Konzentrationen treten in urbanen Gebieten
auf. Die MTBE-Gehalte in Flüssen zeigen steigende Tendenz. Die Hauptemissionsquellen für
diffuse Einträge stellen Abgase und Leckagen von Fahrzeugen und Tankstellen dar. In
industriellem Abwasser wurden Stoßkonzentrationen von MTBE bis ca. 30 µg/L
nachgewiesen.
Durch den Reinigungsprozess der Uferfiltration wird MTBE aus Flußwasser nicht vollständig
eliminiert. Auch nach der Aufbereitung treten Spuren des Kraftstoffzusatzes im Trinkwasser
auf, liegen jedoch um den Faktor 100 – 1000 unter der Trinkwasserrichtline der USA
(13 µg/L). Diese Ergebnisse stellen einen Beitrag zur Vorsorge dar, da MTBE neben
chlorierten Kohlenwasserstoffen die häufigste leichtflüchtige Chemikalie in der aquatischen
Umwelt darstellt.
Mit Hilfe der durchgeführten Kompartiment-Modellierung (Equilibrium Criterion Model)
wurde die Emission von MTBE direkt in die wässrige Phase als sehr wichtigen Faktor für die
MTBE-Konzentration im Wasser ermittelt. Diese Emission wird für Deutschland im Bereich
von etwa 50 t/a geschätzt. Zusätzliche, bisher unbekannte industrielle Einträge sind
wahrscheinlich.
Ab dem Jahr 2005 ist aufgrund gesetzlicher Regulierungen mit derVerdopplung der MTBE-
Gehalte im Kraftstoff zu rechnen. Bis dahin wird in Europa eine Entscheidung für MTBE
oder für alternative Additive, wie Ethanol oder Ethyl tert-butylether (ETBE) anstehen.
Zusammenfassung (Summary)
3
Zusammenfassung (Summary)
Die Aufgabe der vorliegenden Arbeit war die Klärung der Frage, in welchem Ausmaß das
Kraftstoffadditiv Methyl tertiär-butylether (MTBE) in Deutschland eingesetzt wird, und ob
die Verwendung des Oxygenats in der Umwelt zu nachweisbaren Konzentrationen geführt
hat. Es sollte eine empfindliche Messmethode entwickelt werden, um Oberflächenwasser in
Deutschland zu analysieren. Die Ergebnisse sollten dazu dienen, einen Überblick über die
MTBE-Situation in Deutschland zu erhalten und Emissionsquellen zu ermitteln.
Oxygenate sind Substanzen, die organisch gebundenen Sauerstoff enthalten (meist Alkohole
und Ether) und Vergaserkraftstoffen zugesetzt werden, um deren Verbrennungsverhalten zu
verbessern bzw. die Oktanzahl der Kraftstoffe zu erhöhen. MTBE stellt mit Produktions-
mengen von 9,3 Millionen t (1999) in den USA, 3,3 Millionen t (1999) in den Ländern der
Europäischen Union (EU) und 500.000 t (1999) in Deutschland, gefolgt von Ethanol (4,4
Millionen t in den USA), den wichtigsten Vertreter dar [EIA, 1999; MEF, 2001; PAHLKE ET
AL, 2000]. Es ersetzt sowohl Bleitetraethyl, das nach Einführung der Katalysatoren den
Vergaserkraftstoffen entzogen wurde, als auch aromatische Kohlenwasserstoffe (darunter das
karzinogene Benzol), die mit für die Bildung von Smog verantwortlich sind. Von geringer
Bedeutung sind bisher die Oxygenate Ethyl tertiär-butylether (ETBE), tertiär-Amyl-
methylether (TAME), Di-isopropylether (DIPE) und Methanol. In den USA wird MTBE seit
Ende der 70er Jahre und in Deutschland seit 1985 als Oxygenat verwendet. Zu einem
verstärkten Einsatz kam es 1992 in den Vereinigten Staaten durch das Inkrafttreten des
Luftreinhaltungsgesetzes "Clean Air Act Amendments". Es schreibt die Verwendung von
"Oxyfuel" mit 2,7 Gew.-% organisch gebundenem Sauerstoff (enspricht 15 Vol-% MTBE
oder 7 Vol-% Ethanol) in Regionen vor, in denen die zulässige CO-Konzentration in der Luft
überschritten wird (häufig im Winter). In den Ländern der Europäischen Union wird MTBE
(in Frankreich überwiegend ETBE und in Finnland auch TAME) in erster Linie zur
Regulierung der Research Oktanzahl (ROZ) hochwertiger Kraftstoffe verwendet und
gesetzlich lediglich ein maximaler MTBE-Gehalt von 15 Vol.-% im Kraftstoff zugelassen.
Im Rahmen dieser Arbeit wurde eine Messmethode für die Analyse von MTBE in
Kraftstoffen basierend auf Gaschromatographie (GC) mit Flammenionisationsdetektion
(FID) entwickelt. Analysierte Proben aus dem Frankfurter Raum (1999/ 2000) lieferten
MTBE-Gehalte von 0,3 – 0,6 Gew.-% in Normal Benzin (ROZ = 93), 0,3 – 4,2 Gew.-% in

Zusammenfassung (Summary)
4
Super-Kraftstoff (ROZ = 96), 6,8 – 12,2 Gew.-% in Superplus und 10,4 – 13,6 Gew.-% in
dem ausschließlich von der Firma Shell vertriebenen "Optimax" [ACHTEN AND PÜTTMANN,
2001A]. Zu berücksichtigen ist, dass der Superplus-Anteil an allen deutschen Kraftstoffen
heute weniger als 5 % beträgt.
Erstmals hat MTBE 1996 für große Verunsicherung in der Bevölkerung gesorgt, als aufgrund
unterirdischer Tankleckagen in Santa Monica (Kalifornien) MTBE-haltiger Kraftstoff das
Grundwasser kontaminierte (bis 600 µg/L MTBE) und damit die Hälfte der städtischen
Trinkwasser-Versorgungsbrunnen unbrauchbar machte [HAPPEL ET AL., 1998]. Nachdem
weitere Schadensfälle bekannt wurden, kam es zum Verbot des Oxygenats in kalifornischem
Kraftstoff ab 2003 und weitere U.S. Staaten folgten der Entscheidung bis schließlich der US-
Senat das Verbot der Verwendung von MTBE ab 2005 vorgeschlug. In Deutschland wird ein
akutes Risiko für die Umwelt aufgrund der – im Vergleich zu Kalifornien – niedrigeren
MTBE-Gehalte im Kraftstoff und höherer Sicherheitsstandards bei den Tankanlagen vom
Umweltamt ausgeschlossen [PAHLKE ET AL., 2000].
Die Herstellung von MTBE erfolgt durch die Addition von Methanol an Isobutylen in
Anwesenheit eines sauren Katalysators. In der EU stellen die Niederlande den
Hauptproduzenten mit 900.000 t/a (1997) dar [DEWITT COMPANY, 1998 AND 1999]. In
Deutschland werden etwa 300.000 t bei Degussa Hüls in Marl und Miro in Karlsruhe und
244.000 t an sechs weiteren Standorten produziert [PAHLKE ET AL., 2000]. Der Einsatz als
Kraftstoffzusatz erfolgt zu einem Anteil von 98,5 % und nur zu 1,5 % im industriellen und
medizinischen Bereich [MEF, 2001].
MTBE ist mit einem niedrigen Siedepunkt von 55 °C und einem hohen Dampfdruck von
330 hPa (bei 25 °C) in die Gruppe der leichtflüchtigen Kohlenwasserstoffe (VOCs)
einzuordnen. Es weist eine außergewöhnlich gute Wasserlöslichkeit von 42 g/L (bei 20 °C)
bis 83 g/L (bei 0 °C) auf. MTBE adsorbiert praktisch weder an Sedimentpartikeln noch an
organischem Material und ist im Wasser und Boden nur schlecht abbaubar, besonders unter
anaeroben Bedingungen. Das Hauptabbauprodukt im Wasser ist tertiär-Butylalkohol (TBA)
und in der Luft tertiär-Butylformiat (TBF), das schnell zu TBA hydrolysiert. Die
Halbwertszeit in der Atmosphäre beträgt 3 - 6 d [SMITH ET AL., 1991] und umfaßt einen
Europa-weiten Transport [SCHOLZ, 2001]. MTBE verdampft sehr schnell pur und aus MTBE-
haltigem Kraftstoff, jedoch nur sehr langsam aus Wasser (besonders bei niedrigen
Zusammenfassung (Summary)
5
Temperaturen). Im Vergleich dazu evaporiert Benzol langsamer, wird im Untergrund
retardiert und schneller abgebaut. Im Gegensatz zu Benzol sind zur Sanierung von
kontaminiertem Wasser konventionelle Strippverfahren ungeeignet [EFFENBERGER ET AL.,
2001].
Zur Toxizität von MTBE liegen widersprüchliche Angaben vor, so daß eine abschließende
Bewertung zur Zeit nicht erfolgen sollte [MEHLMANN, 2001]. Einerseits ist die akute Toxizität
als gering einzustufen, andererseits wurde bei hohen Konzentrationen karzinogene Wirkungen
beobachtet. Es sind keine Langzeituntersuchungen bei niedrigen Konzentrationen bekannt.
Die EPA stufte MTBE als „möglicherweise krebserregend für den Menschen“ ein [EPA,
2001], während die Weltgesundheitsorganisation von keiner akuten Gesundheitsgefährdung
ausgeht [WHO, 1998]. Die Trinkwasserrichtlinie der U.S. amerikanischen Umweltbehörde
(EPA) schreibt einen Grenzwert von 13 µg/L für MTBE vor. Dieser Wert basiert in erster
Linie auf dem Bereich der Geruchs- und Geschmacksschwelle (etwa 20 – 40 µg/L) von
MTBE in Wasser und weniger auf gesundheitlichen Aspekten. In Deutschland wird der Ether
in die Wassergefährdungsklasse 1 (gering wassergefährdend) eingestuft [KLOEPFER, 1999].
Der Eintrag von hohen MTBE-Konzentrationen (mg/L-Bereich) in die aquatische Umwelt
kann durch Tankleckagen im Untergrund hervorgerufen werden und zu signifikanten
Grundwasserkontaminationen führen [HAPPEL ET AL., 1998] (Grundwasser wurde in dieser
Arbeit nicht untersucht). Weitere Eintragspfade stellen industrielle und kommunale Abwässer
dar, für die es in Deutschland derzeit keine Richtlinien bezüglich MTBE gibt. Durch den
hohen Dampfdruck bedingt, kann das Additiv beim Transport und Umfüllen von MTBE-
haltigen Kraftstoffen oder aus deren Abgasen in die Atmosphäre und durch den Niederschlag
in die Oberflächengewässer gelangen. Diese diffusen Einträge führen im oberflächennahen
Grundwasser unter U.S. amerikanischen Verhältnissen maximal zu 1 µg/L [BAEHR ET AL.,
1999] und sind noch wenig erforscht. Zur Situation von MTBE in der aquatischen Umwelt in
Deutschland konnten bisher aufgrund mangelnder Analysendaten keine gesicherten Aussagen
gemacht werden.
Die Analytik von MTBE in Wasser erfolgt durch GC oder Gaschromatographie/
Massenspektrometrie (GC/ MS) in Kombination mit unterschiedlichen Extraktionstechniken,
wie Purge-and-Trap (P&T), Headspace-Analyse (HS) oder Solid-Phase Microextraction
(SPME). Da Peaküberlagerungen (häufig mit 2-Methylpentan) bei der Verwendung eines FID
Zusammenfassung (Summary)
6
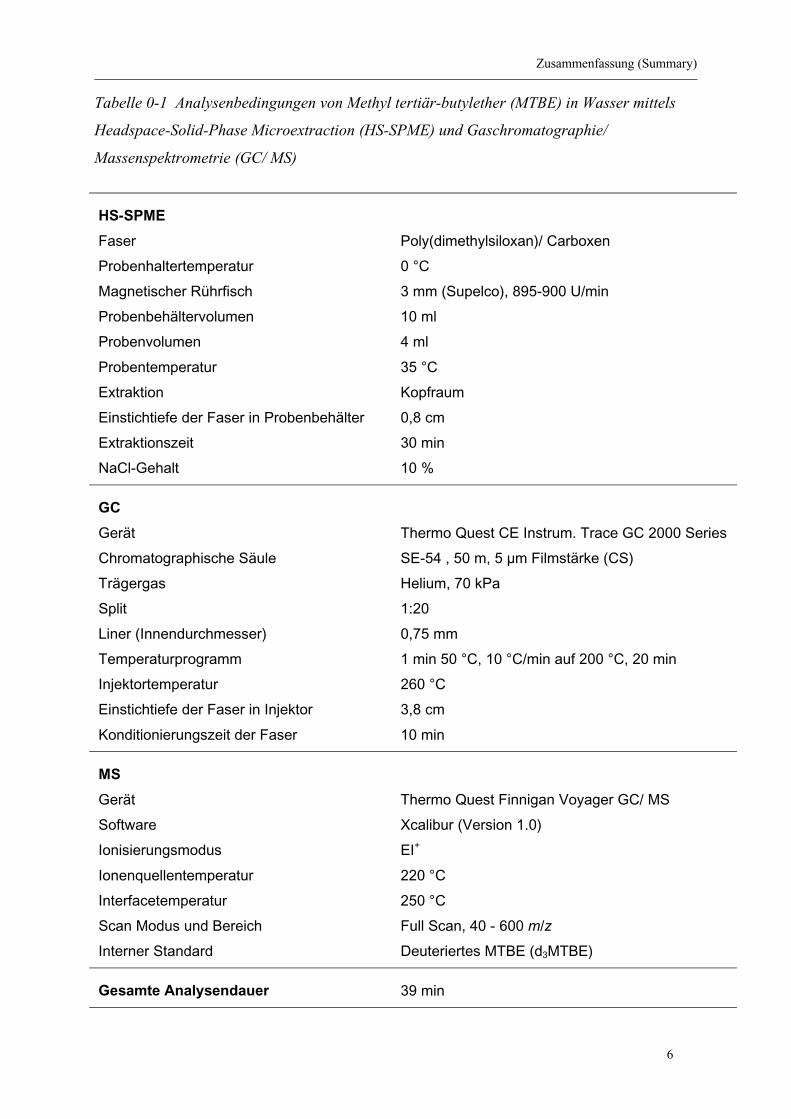
Tabelle 0-1 Analysenbedingungen von Methyl tertiär-butylether (MTBE) in Wasser mittels
Headspace-Solid-Phase Microextraction (HS-SPME) und Gaschromatographie/
Massenspektrometrie (GC/ MS)
HS-SPME
Faser
Probenhaltertemperatur
Magnetischer Rührfisch
Probenbehältervolumen
Probenvolumen
Probentemperatur
Extraktion
Einstichtiefe der Faser in Probenbehälter
Extraktionszeit
NaCl-Gehalt
Poly(dimethylsiloxan)/ Carboxen
0 °C
3 mm (Supelco), 895-900 U/min
10 ml
4 ml
35 °C
Kopfraum
0,8 cm
30 min
10 %
GC
Gerät
Chromatographische Säule
Trägergas
Split
Liner (Innendurchmesser)
Temperaturprogramm
Injektortemperatur
Einstichtiefe der Faser in Injektor
Konditionierungszeit der Faser
Thermo Quest CE Instrum. Trace GC 2000 Series
SE-54 , 50 m, 5 µm Filmstärke (CS)
Helium, 70 kPa
1:20
0,75 mm
1 min 50 °C, 10 °C/min auf 200 °C, 20 min
260 °C
3,8 cm
10 min
MS
Gerät
Software
Ionisierungsmodus
Ionenquellentemperatur
Interfacetemperatur
Scan Modus und Bereich
Interner Standard
Thermo Quest Finnigan Voyager GC/ MS
Xcalibur (Version 1.0)
EI+
220 °C
250 °C
Full Scan, 40 - 600 m/z
Deuteriertes MTBE (d3MTBE)
Gesamte Analysendauer
39 min
Zusammenfassung (Summary)
7
nicht auszuschließen sind, sollte ein Massenspektrometer als Detektor bevorzugt werden.
Übliche Methoden lieferten Nachweisgrenzen bis 60 ng/L, die für Nachweise von MTBE in
deutschen Oberflächenwässern zu hoch sind bzw. waren. Die Vor- und Nachteile der
unterschiedlichen Extraktionstechniken und Injektionsverfahren wurden kürzlich von
SCHMIDT ET AL. [2001] detailliert diskutiert.
In dieser Arbeit wurde eine empfindliche Messmethode für MTBE in Wasser mit einer
Nachweisgrenze von 10 ng/L durch die Kombination von SPME und GC/ MS entwickelt
[ACHTEN UND PÜTTMANN, 2000]. Die Analysenbedingungen sind in Tabelle 0-1 dargestellt.
SPME erfolgt mit einer Faser aus 75 µm Poly(dimethylsiloxan)/ Carboxen und einem auf
0 °C gekühlten manuellen Probehalter zunächst direkt im Wasser. In einem zweiten Schritt
wurde die Methode verbessert und die Extraktion im Kopfraum durchgeführt (HS-SPME)
[ACHTEN ET AL., 2001B]. Dadurch wird die Gefahr von Matrixeffekten reduziert, die Stabilität
des MS verbessert und die Haltbarkeit der Faser erhöht. Die Faser wird 30 Min. im Kopfraum
über 4 mL einer kontinuierlich gerührten Wasserprobe (bei 10 Gew.-% Salzgehalt und bei
35 °C) in einem 10 mL-Probengefäß positioniert. Anschließend erfolgt die Desorption von
MTBE und anderen VOCs von der Faser im Injektor des GC/ MS bei 260 °C für 10 Minuten.
Deuteriertes MTBE dient als interner Standard. Linearitäten von R² >0,9991 im
Kalibrierungsbereich von 20 – 5000 ng/L und R² >0,9916 bei 20 – 100 ng/L werden,
inklusive Blindwerte, gemessen. Die relative Standardabweichung von 10 % für
Langzeitmessungen (100 ng/L), 11 % für Kurzzeitmessungen (20 ng/L) und Wiederfindungs-
raten von 83 –118 % bei 100 ng/L werden erreicht. Die beschriebene Methode hat in einem
kürzlich durchgeführten Ringversuch hervorragende Ergebnisse geliefert [SCHUHMACHER
UND FÜHRER, 2001].
Mit der beschriebenen Methode wurden von Dezember 1998 bis März 2001 eine Anzahl von
616 Proben aus Niederschlag, Flüssen, Bächen, Abwasser, Trinkwasser, Uferfiltrat und
Oberflächenabfluß auf ihren MTBE-Gehalt analysiert. In Tabelle 0-2 sind die Ergebnisse der
MTBE-Messungen in der aquatischen Umwelt zusammengefaßt.
Die Ergebnisse von 119 untersuchten Niederschlagsproben 17 städtischer und ländlicher
Lokationen in Deutschland zeigen MTBE-Gehalte ausschließlich in den Wintermonaten mit
maximal 85 ng/L [ACHTEN ET AL., 2001A]. Dies ist auf den atmosphärischen Abbau in der
wärmeren Jahreszeit zurückzuführen. MTBE-Emissionen von Kraftfahrzeugen stellen eine
wichtige diffuse Quelle dar, da in Städten das Oxygenat im Niederschlag öfter (86 %, n = 78),
als in ländlichen Regionen (18 %, n = 42) nachweisbar ist. In Frankfurt/ M lagen von
Zusammenfassung (Summary)
8
September 2000 bis März 2001 49 % (n = 17) der Messwerte im Bereich von 30 – 85 ng/L.
Der Vergleich der MTBE-Konzentrationen mit Lufttemperaturen zeigt messbare Gehalte
überwiegend bei niedrigen Temperaturen (unter 10 –15 °C), wie aus den physikalisch-
chemischen Eigenchaften von MTBE zu erwarten ist. Durchschnittlich wurde bei einer
Temperaturabnahme von 5 °C auf 2 °C ein Anstieg der MTBE-Konzentrationen von 23 auf
33 ng/L der nachweisbaren Gehalte ermittelt. Das bekannte Phänomen, dass Schnee aufgrund
seiner erhöhten Oberfläche und Verweilzeit in der Atmosphäre gasförmige organische
Bestandteile besser aufnimmt als Regen [WANIA ET AL., 1998] konnte für MTBE bestätigt
werden. Erhöhte Konzentrationen des Ethers wurden außerdem im ersten Niederschlag nach
längeren Trockenperioden gemessen (wash-out-effect).
In den letzten drei Jahren wurden 355 Proben aus Fließgewässern unterschiedlicher Größe in
Deutschland auf MTBE analysiert. Die Konzentrationen schwanken von <10 – 2357 ng/L,
liegen meist (32 %) jedoch im Bereich von 50 – 200 ng/L [ACHTEN ET AL., 2002B]. Die
höchsten durchschnittlichen MTBE-Gehalte werden im Rhein von Karlsruhe bis Wesel (etwa
250 ng/L), Niedermain (etwa 150 ng/L), in der Weser und in städtischen Bächen (etwa
100 ng/L) erreicht. Gewässer wie der Rhein oberhalb von Karlsruhe, Obermain, Elbe, Neckar,
Kanäle und ländliche Bäche sind durch Konzentrationen <100 ng/L gekennzeichnet und in
der Donau und der Oder konnte kein MTBE nachgewiesen werden. Städtische Bäche ohne
signifikanten industriellen Einfluß weisen typischerweise Gehalte von etwa 50 ng/L auf. Sie
werden zu einem geringen Anteil (20 %) durch MTBE aus dem Niederschlag selbst und
größtenteils durch Kontakt mit Kraftfahrzeugen, Straßenbelägen, Vegetation, u.a. während
eines Niederschlagsereignisses hervorgerufen. Die durchschnittliche MTBE-Konzentration
von 12 städtischen Oberflächenwasserproben (urban runoff) liegt im Bereich von
100 – 200 ng/L, jedoch liegt der tatsächliche Mittelwert vermutlich höher. Sie ist vergleichbar
mit denen im Niederrhein, Niedermain und städtischen Bächen. Daraus resultiert, dass
zusätzliche Einträge erforderlich sind, um die gemessenen Gehalte in den Flüssen zu erklären,
da städtischer Oberflächenabfluß in die Flüsse gelangt und dort stark verdünnt wird. Die
Ergebnisse zeigen erhöhte MTBE-Konzentrationen in städtischen Gebieten, die neben
erhöhtem Fahrzeugaufkommen auch durch industriellen Einfluß hervorgerufen werden.
Potentielle Eintragsquellen sind Abwässer aus kommunalen und industriellen Kläranlagen,
Verluste beim Kraftstofftransport und Leckagen an Tankanlagen in Flußnähe. Analysiertes
Abwasser aus kommunalen Kläranlagen (67 Proben) im Frankfurter Raum ergibt ein
vergleichsweise niedrigen mittleren MTBE-Gehalt von etwa 150 ng/L in Abläufen.
Zusammenfassung (Summary)
9
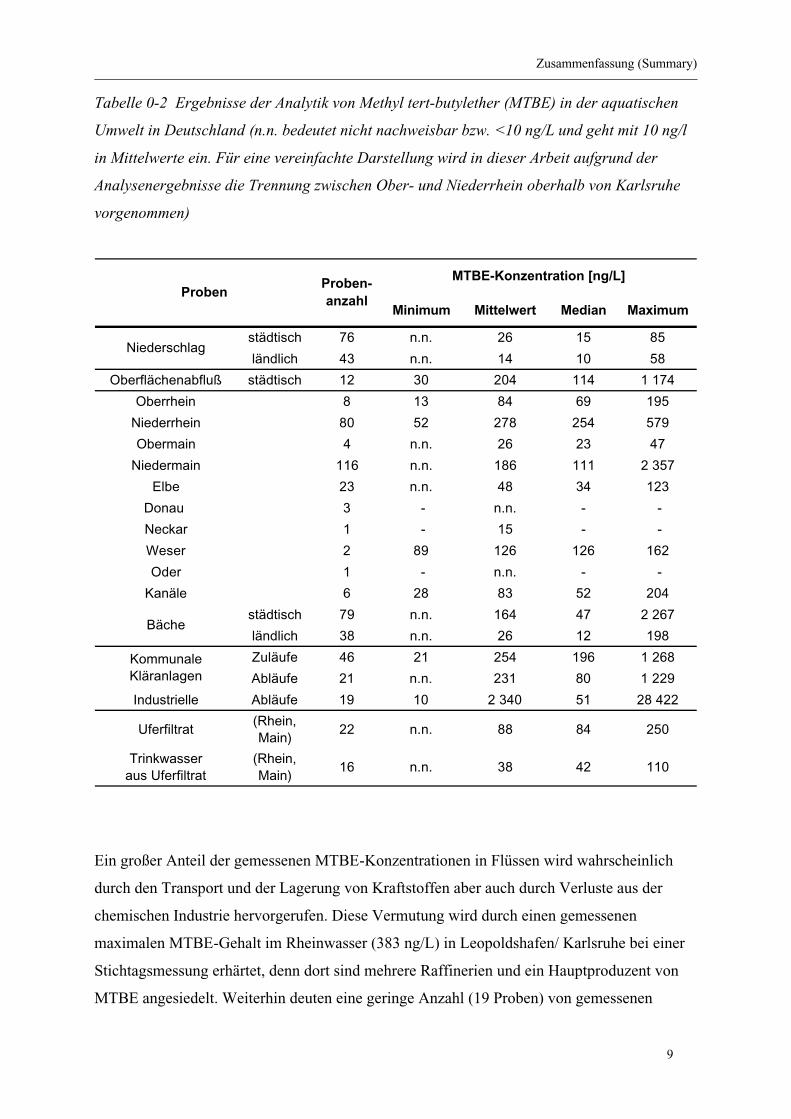
Tabelle 0-2 Ergebnisse der Analytik von Methyl tert-butylether (MTBE) in der aquatischen
Umwelt in Deutschland (n.n. bedeutet nicht nachweisbar bzw. <10 ng/L und geht mit 10 ng/l
in Mittelwerte ein. Für eine vereinfachte Darstellung wird in dieser Arbeit aufgrund der
Analysenergebnisse die Trennung zwischen Ober- und Niederrhein oberhalb von Karlsruhe
vorgenommen)
Minimum Mittelwert Median Maximum
städtisch 76 n.n. 26 15 85
ländlich 43 n.n. 14 10 58
Oberflächenabfluß städtisch 12 30 204 114 1 174
Oberrhein 8 13 84 69 195
Niederrhein 80 52 278 254 579
Obermain 4 n.n. 26 23 47
Niedermain 116 n.n. 186 111 2 357
Elbe 23 n.n. 48 34 123
Donau 3 - n.n. - -
Neckar 1 - 15 - -
Weser 2 89 126 126 162
Oder 1 - n.n. - -
Kanäle 6 28 83 52 204
städtisch 79 n.n. 164 47 2 267
ländlich 38 n.n. 26 12 198
Zuläufe 46 21 254 196 1 268
Abläufe 21 n.n. 231 80 1 229
Industrielle Abläufe 19 10 2 340 51 28 422
Uferfiltrat(Rhein, Main)
22 n.n. 88 84 250
Trinkwasser aus Uferfiltrat
(Rhein, Main)
16 n.n. 38 42 110
Bäche
Kommunale Kläranlagen
ProbenProben-anzahl
Niederschlag
MTBE-Konzentration [ng/L]
Ein großer Anteil der gemessenen MTBE-Konzentrationen in Flüssen wird wahrscheinlich
durch den Transport und der Lagerung von Kraftstoffen aber auch durch Verluste aus der
chemischen Industrie hervorgerufen. Diese Vermutung wird durch einen gemessenen
maximalen MTBE-Gehalt im Rheinwasser (383 ng/L) in Leopoldshafen/ Karlsruhe bei einer
Stichtagsmessung erhärtet, denn dort sind mehrere Raffinerien und ein Hauptproduzent von
MTBE angesiedelt. Weiterhin deuten eine geringe Anzahl (19 Proben) von gemessenen
Zusammenfassung (Summary)
10
industriellen Abläufen der chemischen Industrie im Frankfurter Raum auf die wichtige
Bedeutung dieser Einträge hin. Neben einem mittleren MTBE-Gehalt bei 90 % der Proben
von etwa 100 ng/L ergeben 2 Analysen Konzentrationen von 15 – 30 µg/L. Die große Varianz
der gemessenen Konzentrationen im Main bei Frankfurt unabhängig vom Jahresrhythmus (im
Gegensatz zum Verhalten im Niederschlag) sind dadurch erklärbar. Die Messwerte der
Fließgewässer zeigen eine Tendenz zu steigenden MTBE-Konzentrationen von 1999 – 2001.
Aus den Ergebnissen läßt sich folgern, daß MTBE größtenteils über kommunale Kläranlagen
und industrielle Abwässer in die Fließgewässer eingetragen wird und nur zu einem geringen
Anteil durch MTBE-haltigen Niederschlag. Dies erklärt auch die niedrigsten Gehalte in der
Donau und der Oder, da der Abwassereintrag dort deutlich geringer ist, als in den Flüssen
Rhein oder Main.
Weitere MTBE-Messungen von Oberflächenwasser wurden kürzlich von BRAUCH ET AL.
[2000A] (125 Proben) und EFFENBERGER ET AL. [2001] (17 Proben) durchgeführt. Sie
bestätigen grundsätzlich die Ergebnisse dieser Arbeit.
Die Nachweise von MTBE in Oberflächenwasser in Kombination mit der bekannten
persistenten Eigenschaft von MTBE in Wasser führten zu der Fragestellung, ob im
Trinkwasser, das aus Uferfiltrat gewonnen wird, MTBE nachweisbar ist. Die Analysen von
Niederrhein- und Niedermainuferfiltrat (22 Proben) ergeben einen mittleren Gehalt von etwa
80 ng/L MTBE. Dies zeigt, dass das Oxygenat auch bei sehr niedrigen Konzentrationen im
Flusswasser durch den Reinigungsprozess der Uferfiltration nicht vollständig eliminiert wird,
vergleichbar mit den Schadstoffen Ethylendiamin-tetraessigsäure (EDTA) oder
adsorbierbaren organischen Halogenen (AOX). In beiden Regionen zeigte aufbereitetes
Trinkwasser (16 Proben) einen mittleren Gehalt von etwa 40 ng/L (<10 – 110 ng/L). Die
gemessenen MTBE-Gehalte stellen Spurenkonzentrationen dar und bleiben um den Faktor
100 - 1000 unter der Trinkwasserrichtlinie in den USA von 13 µg/L. Sie stellen einen Beitrag
zur Vorsorge dar, da MTBE neben den chlorierten Kohlenwasserstoffen die häufigste
Chemikalie in der aquatischen Umwelt darstellt [CLAWGES ET AL., 2000] und auch dann noch
viele Jahre nachweisbar sein wird, wenn es nicht mehr eingesetzt wird.
Die Untersuchung des Verhaltens von MTBE in der Umwelt mit dem Kompartiment-
Modell EQC [MACKAY, 2001] hat eine Massenverteilung von 87 % in der Luft und 13 % im
Wasser bei 10 °C im Gleichgewicht ergeben. Um den Abbau von MTBE in
Oberflächenwasser abzuschätzen, wurde ein Batch-Versuch mit Wasser aus dem Main bei

Zusammenfassung (Summary)
11
Frankfurt/ M durchgeführt und ergab Halbwertszeiten von ca. 80 – 120 d (bei 18 °C) und
etwa eineinhalb Jahren (bei 4 °C).
Aquatische MTBE-Konzentrationen zeigen eine hohe Sensitivität bezüglich direkter
Emissionen ins Wasser. Sie ergeben sich fast ausschließlich (98,5 %) daraus. Dagegen setzen
sich atmosphärische MTBE Konzentrationen aus einem evaporierten Anteil aus dem Wasser
und aus direkten Emissionen in die Luft zusammen.
Für 1999/ 2000 werden die aquatische Emission in Deutschland von etwa 50 t/a und die
mittlere Oberflächenwasserkonzentration von 50 ng/L MTBE geschätzt. Daraus ergeben sich
deutsche Jahresmittelkonzentrationen des Ethers von 19 ng/L im Wasser und 167 ng/³ in der
Luft unter den Randbedingungen des Modells (u.a. 10 % Wasseroberfläche). Die Gehalte
zeigen eine deutliche Temperaturabhängigkeit mit erhöhten Werten bei niedrigen
Temperaturen (25 – 50 %). Es bleibt unklar, ob die unterschiedlichen resultierenden MTBE-
Konzentrationen im Wasser für Deutschland durch Überschätzung des Mittelwertes aus
Analysendaten, durch unzutreffende Annahmen des Modells für Deutschland (u.a. 2,2 %
Wasseroberfläche) und/ oder durch Unterschätzung der Einträge begründet sind. Letzteres ist
wahrscheinlich. Mögliche zusätzliche Emissionen stellen Verluste durch Kraftstofftransport
auf Flüssen oder Kraftstofflagerung in der Nähe von Fließgewässern dar und zusätzliche
Analysen sind notwendig.
MTBE wird wahrscheinlich für einige Dekaden in der Umwelt verbleiben. 15 Jahre nach
Einführung des Ethers als Kraftstoffadditiv ist es in städtischem Niederschlag im Winter und
in Oberflächenwasser unabhängig von der Jahreszeit nachweisbar. Die Hauptemissions-
quellen für diffuse Einträge stellen Abgase und Leckagen von Fahrzeugen sowie Tankstellen
dar. Das Oxygenat stellt mit den leichtflüchtigen chlorierten Kohlenwasserstoffen (LCKW)
die am häufigsten nachgewiesene organische Verbindung in Fließgewässern dar. Die MTBE-
Konzentrationen in städtischen Bächen ohne industriellen Einfluß, Oberflächenabfluß und
städtischer Luft sind in Deutschland etwa 6 - 7-fach niedriger als in den U.S. Staaten wie New
Jersey und zeigen eine steigende Tendenz. Der Nachweis von MTBE-Spuren in Trinkwasser,
das aus Uferfiltrat hervorgeht, ist zwar heute nicht besorgniserregend, jedoch ist aufgrund des
vorgeschriebenen Maximalgehaltes der aromatischen Kohlenwasserstoffe im Kraftstoff von
35 % (w/w) ab dem Jahr 2005 eine Verdopplung der MTBE-Gehalte zu erwarten.
Alternative Oxygenate wie ETBE, das in Frankreich eingesetzt wird, evaporiert zu einem
geringeren Teil und hat dadurch einen umweltrelevanten Vorteil gegenüber MTBE, jedoch
zeigt es vergleichbar schlechte Abbaubarkeit und wurde ebenfalls bereits im Trinkwasser
Zusammenfassung (Summary)
12
nachgewiesen [LA VOIE DU NORD, 1999]. Ethanol dagegen, die vermutlich zukünftige
Alternative in den USA, ist eine mikrobiell sehr leicht abbaubare Verbindung. Dies führt
jedoch dazu, dass die karzinogene Kraftstoffkomponente Benzol in Grundwasserschadens-
fällen durch Ethanol-haltigen Kraftstoff schlechter abgebaut wird. Darüber hinaus sind hohe
Investitionen für den Vertrieb dieses Kraftstoffs nötig, da die hygroskopische Eigenschaft von
Ethanol zu Entmischungen führt und aus diesem Grund separate Lagerung von Kraftstoff und
Ethanol bis zur Auslieferung an die Tankstellen erfordert. Der Ersatz von MTBE durch
Ethanol birgt politische und wirtschaftliche Konflikte, da MTBE ein Produkt der
Petrochemischen Industrie und Ethanol aus der Vergärung von Pflanzenmaterial (Bioalkohol)
von der Agrarindustrie hergestellt wird.
Die wichtigste Schlussfolgerung aus dem MTBE-Konflikt und seinen Vorgängern
Bleitetraethyl und Benzol ist, dass eine Chemikalie nicht als Bestandteil eines Produkts zum
Einsatz kommen sollte, das vom Mensch in der Umwelt fein verteilt und verbreitet wird, ohne
vorher alle umweltrelevanten Aspekte detailliert zu untersuchen und zu bewerten. Bis zum
Jahr 2005 wird in Europa eine Entscheidung für einen der drei Wege anstehen.
Introduction
13
Introduction
Since SQUILLACE ET AL. and DELZER ET AL. first comprehensively reported about the
occurrence of the gasoline additive methyl tertiary-butyl ether (MTBE) in groundwater and
urban runoff in the United States of America (U.S.) in 1996, the fuel additive has
internationally become subject of discussion.
MTBE is the most important compound from the group of oxygenates that replace tetraethyl
lead and aromatic hydrocarbons. Oxygenates are organic molecules, mostly ethers or
alcohols, that are added to gasoline for the increase in organically bond oxygen which leads to
cleaner burning of the gasoline and an increase in the research octane numbers (RON) and
motor octane numbers (MON). Octane numbers indicate the resistance of gasoline towards
self-ignition. The RON of gasoline components or gasoline is measured at low speed, less
load and during acceleration whereas the MON is determined at high speed and higher load.
The use of MTBE leads to a reduction of emissions which has contributed to significant smog
reduction in areas of high traffic density such as Los Angeles, U.S.. Emissions of CO (16 -
23 %) and hydrocarbons (18 %) decrease if oxygenated gasoline is burnt in the engine,
compared to gasoline without the addition of oxygenates. However, emissions of aldehydes
(e.g. formaldehyde) increase and the NOX emissions are not significantly influenced by the
addition of oxygenates to gasoline [SCHIFTER ET AL., 2001].
Unfortunately, MTBE is characterized by an unfavorable combination of properties for the
environmental impact. Its high vapor pressure and low boiling point lead to easy evaporation
from oxygenated fuel into the atmosphere. If reformulated gasoline contacts water, the high
water solubility, poor biodegradability and essentially no adsorption ability to particles of
MTBE lead to significant and persistent concentrations of the ether in the aquatic
environment. This is even more of a concern, as it has low odor and taste thresholds and its
toxicity should not finally be evaluated.
At produced amounts of 9.3 mio t/a in the U.S., 3.3 mio t/a in the European Community and
0.5 t/a in Germany in 1999, MTBE belongs to the group of organic chemicals with highest
production rates. In some regions of the U.S. up to 15 % (w/w) of MTBE is used in gasoline

Introduction
14
following the implemented law for air quality "Clean Air Act Amendments" in 1992. The
average concentration in gasoline in Europe and Germany is in the range of 1 – 2 % (w/w).
In areas where oxygenated gasoline is used, the combination of its properties and high used
amounts are the reason for the fact that it is one of the most often detected compounds in the
environment [CLAWGES ET AL., 2000]. Amounts in the µg/L - mg/L range of the oxygenate
have been detected in groundwater that is in some cases used for the drinking water
production (e.g. in Santa Monica, California, where half of the drinking water wells had to be
closed due to MTBE contamination [HAPPEL ET AL., 1998]). Point-sources such as oxygenated
gasoline leaking from underground storage tanks (LUSTs) are mostly responsible for these
high concentrations. However, groundwater was not investigated in this study and is subject
of a current study at the Institute [KOLB, 2001]. Another pathway of the MTBE transport into
the aquatic environment is represented by non-point source emissions that are related to all
patterns of oxygenated gasoline use and transport. DELZER ET AL., [1996] first reported of
measured MTBE concentrations in the ng/L - µg/L range in overland runoff in the U.S.
indicating the existence of non-point source emissions. To date, the extent of affected water
resources used for the drinking water production is being investigated in the U.S. [CLAWGES
ET AL., 2001].
Due to the heavy drinking water contamination, some states of the U.S. (e.g. California)
stopped the use of the ether as an oxygenate with the early years of this millenium and the
government recommended to phase-out or significantly reduce its nationwide use as soon as
possible. Alternatives like ethanol are discussed. In Europe, only little is known about MTBE
concentrations in the environment [MEF, 2001] and the first conclusion from the final draft
version of the risk assessment for the European Comission was the call for more information
regarding emissions into surface water to be able to characterize risks to the aquatic
ecosystem. In Germany, the Umweltbundesamt declared that the use of MTBE in the country
does not represent an acute risk for the environment [PAHLKE ET AL., 2000]. This decision was
not based on measured MTBE concentrations in the environment.
Common analytical methods using purge-and-trap or direct aqueous injection were reported
not to detect less 50 ng/L of MTBE in aqueous samples [RAESE ET AL., 1995; ROSE ET AL.,
1998; CHURCH ET AL., 1997]. These methods could not be applied for the analysis of MTBE
in surface waters in Germany due to its low concentration (particularly at the beginning of
this study in 1998).
Introduction
15
In 1998, MTBE was an unknown contaminant in Germany and only very little information
about produced and used amounts were available. MTBE concentrations measured in the
German environment were not published.
The first objective of this study was to investigate, if MTBE is of any environmental concern
in Germany. By use of common analytical methods, the oxygenate was detected in water from
the Main river but could not be quantified due its low concentration. Therefore, the advanced
aim was the development of a more sensitive analytical method than reported. In a third step,
the more sensitive method could be used for the analysis of various environmental water
samples to give an overview of the impact of the MTBE use on the aquatic environment in
Germany. The final objective was the investigation of emission sources, pathways and the
evaluation of the MTBE situation in Germany.
1 Use, History, Political and Legal Aspects of MTBE
16
1 USE, HISTORY, POLITICAL AND LEGAL ASPECTS OF METHYL
TERT-BUTYL ETHER (MTBE)
1.1 Use, History and Political Aspects of MTBE
1.1.1 United States of America (U.S.)
Since the first automobiles were constructed, petroleum refiners have worked on improved
combustion efficiency, usually by the addition of octane-enhancing fuel additives. Industrial
ethanol, traditionally manufactured by the fermentation of plant material was used originally.
However, it was taxed for some time in exactly the same manner as beverage alcohol and the
moral taint associated with whiskey production extented to industrial ethanol [JACOBS ET AL.,
2001]. At that time, industrial ethanol was added small amounts of a poisonous substance in
order to prevent its consumption. Tetraethyl lead became the favorite substitute of choice for
refiners. It took up less space in the gas tank and did not suffer, as ethanol did, from an
association with an external moral issue – until the 1970s, when its negative environmental
effects became widely recognized and denounced. It also damaged the catalysts of
automobiles. Finally, in 1979, alkyl lead additives were banned [POWERS ET AL., 2001].
Again, another solution to overcome the problem of knocking-effects in the engine had to be
found and methyl-tert butyl ether (MTBE) seemed to be the key compound in the late 1970‘s.
The MTBE use as additive shows several advantages like its high motor octane number of
102, significant reduction in emissions of carbon monoxide (CO) and hydrocarbons, easy and
cheap production at the refinery from by-products and easy blending characteristics with
gasoline (it can be transferred through existing pipelines). In addition, it is not beverable and
atoms of heavy metals are not included in the molecular structure. The positive effects of the
MTBE use for CO and ozone reductions in urban air were the reason for the implementation
of the "Clean Air Act Amendments" in 1992. The standards prescribe the addition of at least
2 % (w/w) of organically bond oxygen to the fuel, which is about 10 % (w/w) of MTBE in
winter, if CO emissions regionally exceed national standards. For the reduction of CO
emissions, MTBE was selected by some gasoline producers for the production of „oxygenated
fuel“ (oxyfuel, 2.7 % (w/w) of oxygen) that allow the more complete combustion of gasoline
hydrocarbons. For reduced ozone formation, MTBE has been used to produce „reformulated
gasoline“ (RFG, 2.0 % (w/w) of oxygen), which is low in the potent human carcinogen
benzene and other aromatic compounds. The use of RFG lowers emissions of unburned
1 Use, History, Political and Legal Aspects of MTBE
17
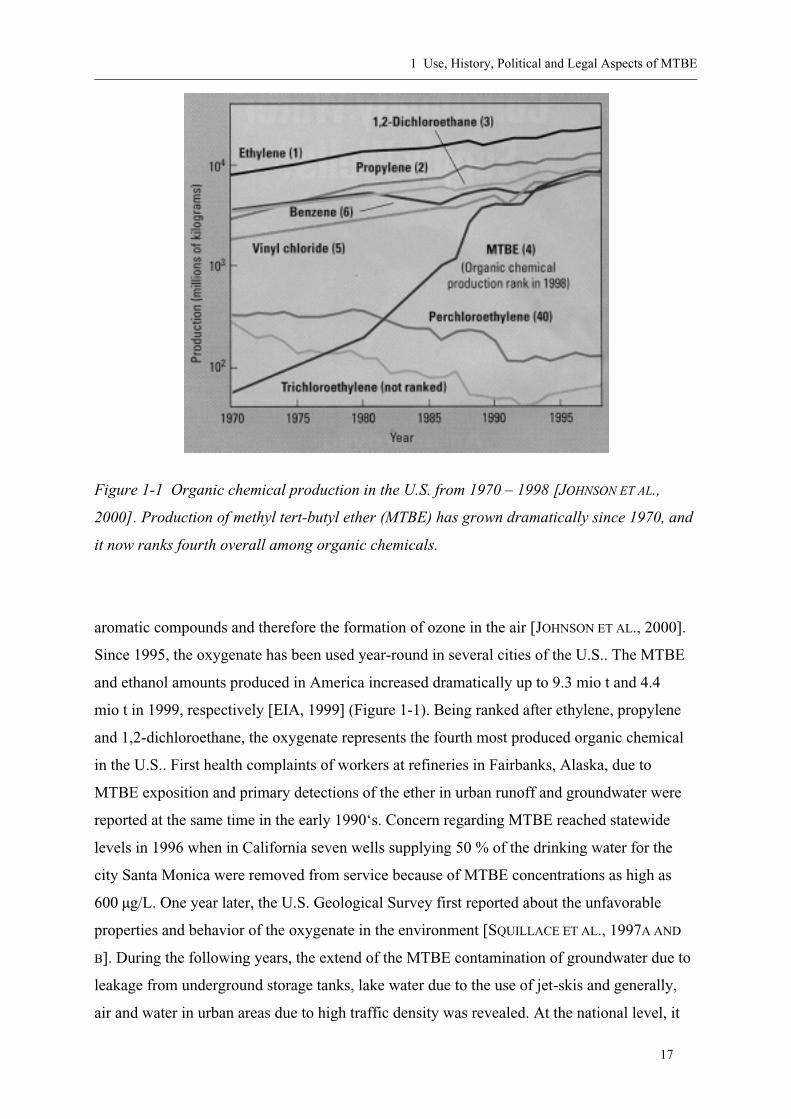
Figure 1-1 Organic chemical production in the U.S. from 1970 – 1998 [JOHNSON ET AL.,
2000]. Production of methyl tert-butyl ether (MTBE) has grown dramatically since 1970, and
it now ranks fourth overall among organic chemicals.
aromatic compounds and therefore the formation of ozone in the air [JOHNSON ET AL., 2000].
Since 1995, the oxygenate has been used year-round in several cities of the U.S.. The MTBE
and ethanol amounts produced in America increased dramatically up to 9.3 mio t and 4.4
mio t in 1999, respectively [EIA, 1999] (Figure 1-1). Being ranked after ethylene, propylene
and 1,2-dichloroethane, the oxygenate represents the fourth most produced organic chemical
in the U.S.. First health complaints of workers at refineries in Fairbanks, Alaska, due to
MTBE exposition and primary detections of the ether in urban runoff and groundwater were
reported at the same time in the early 1990‘s. Concern regarding MTBE reached statewide
levels in 1996 when in California seven wells supplying 50 % of the drinking water for the
city Santa Monica were removed from service because of MTBE concentrations as high as
600 µg/L. One year later, the U.S. Geological Survey first reported about the unfavorable
properties and behavior of the oxygenate in the environment [SQUILLACE ET AL., 1997A AND
B]. During the following years, the extend of the MTBE contamination of groundwater due to
leakage from underground storage tanks, lake water due to the use of jet-skis and generally,
air and water in urban areas due to high traffic density was revealed. At the national level, it
1 Use, History, Political and Legal Aspects of MTBE
18
was stated that between 5 and 10 % of communitiy drinking water supplies in high MTBE use
areas show at least detectable concentrations of the oxygenate, and about 1 % of those
systems are characterized by levels of this compound that are above 20 µg/L [BLUE RIBBON
PANEL, 1999], where the odor and taste of MTBE is perceived by most people. To date, the
extent of affected groundwater and surface water used for the drinking water production is
being investigated in the U.S. [CLAWGES ET AL., 2001].
Some states reacted towards the alarming data presented. In 1999, the governor of California
announced the prohibition of any MTBE concentrations in Californian gasoline from 2003 on.
However, this prohibition may be delayed by one or two years [EFOA, 2001]. The state of
Maine rejected the "Clean Air Act Amendments" and the Blue Ribbon Panel, a committee of
the government, recommended a substantial reduction of MTBE nationwide [BLUE RIBBON
PANEL, 1999]. In March 2000, the U.S. Environmental Protection Agency (EPA) issued a
regulatory announcement stating its consideration of a limit or ban on the use of MTBE as
fuel additive. In October, the U.S. Senate environmental and public works committee
recommended a ban of MTBE beginning in 2005 which could have serious impact on
gasoline prices and would damage the economy of the oil industry in the U.S. [MARXSEN,
2001].
The oxygenate ethyl tert-butyl ether (ETBE) is used to smaller amounts in the U.S. [KATZEN
ET AL., 1997]. Ethanol, again, has been proposed as the possible substitute of choice in the
future. It is already widely used in some U.S. states at concentrations of approximately
6 - 10 %, in Canada and in Brazil. Ethanol made by fermentation of corn has become an
increasingly important fuel additive in the U.S. over the past decade. It can be produced from
the conversion of sugars, starches or cellulosics by advanced combinations of acid and
enzyme technology. Farm state lawmakers push the MTBE ban [ANONYMOUS, 2001A]
because agricultural producers would significantly benefit from these plans and the
production of renewable biomass fuels would also be promoted. The use of ethanol as
substitute would lead to sharp hikes in gasoline prices. Even in the Midwest Cornbelt, ethanol
owes to the fuel’s subsidized status, otherwise it could not compete with other, petroleum-
based fuel additives [MARXSEN, 2001].
A detailed summary of the economic aspects of the ethanol market is published by RASK
[1998]. A consultant of the DeWitt Company, an MTBE producer, does not believe that total
conversion from MTBE to ethanol is a realistic possibility by the end of 2002 and the
schedule will have to be relaxed. Conversion to ethanol calls for investments of up to

1 Use, History, Political and Legal Aspects of MTBE
19
$ 2 - 10 billions and feasibility studies of most MTBE producers resulted in pilot plants
running on iso-octane. Producers say, that replacing MTBE with iso-octane is possible within
a reasonable timeframe [ANONYMOUS, 2001C; MARXSEN, 2001]. The most readily available
alternative, MMT (methylcyclopentadienyl manganese tricarbonyl), is currently not widely
accepted. Recently, dimerized isobutene has been proposed as further alternative to MTBE
produced from isobutene [KOLAH ET AL., 2001].
Most MTBE in the world is used in the U.S. (Figure 1-2) where it was introduced earlier
compared to other contries. The total world-wide production capacity in 1994 was 20.6 mio t
[ECOTOC, 1997]. In Asia, an increase in the MTBE use from 2.3 mio t in 1999 to 5.1 mio t
in 2010 is assumed [OFA, 1999]. In Mexico, high amounts of MTBE are used (5 – 7.5 %
(v/v)) [SCHIFTER ET AL., 2001] besides the oxygenates tert-amyl methyl ether (TAME) and
next-TAME (C4-C7 tertiary alkyl methly ethers) at a capacity of 1.2 mio t/a (2001).
U.S.61%
Asia 12%
Eastern Europe 3%
Middle East 4%
South America 4%
Canada & Mexico 4%
Western Europe 12%
Demand 1999 = 26.65 * 109 Liters
Figure 1-2 Worldwide demand of methyl tert-butyl ether (MTBE) (DeWitt Company)
[THAYER, 2000].
1 Use, History, Political and Legal Aspects of MTBE
20
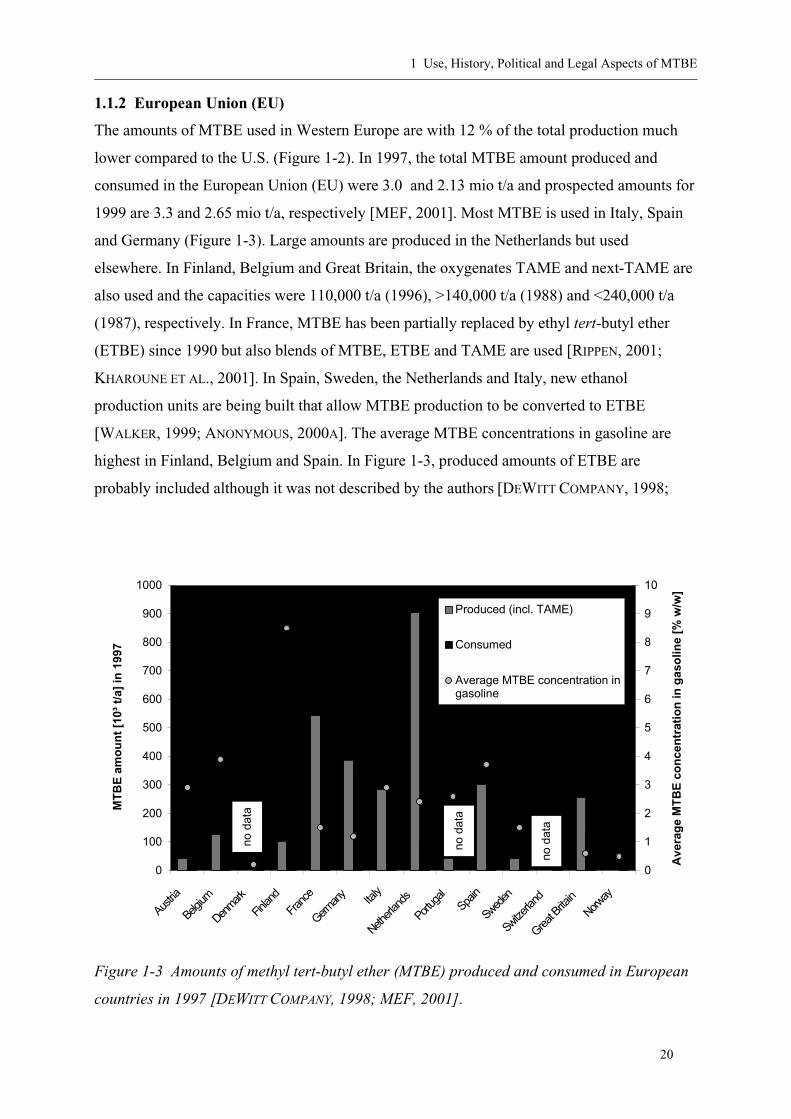
1.1.2 European Union (EU)
The amounts of MTBE used in Western Europe are with 12 % of the total production much
lower compared to the U.S. (Figure 1-2). In 1997, the total MTBE amount produced and
consumed in the European Union (EU) were 3.0 and 2.13 mio t/a and prospected amounts for
1999 are 3.3 and 2.65 mio t/a, respectively [MEF, 2001]. Most MTBE is used in Italy, Spain
and Germany (Figure 1-3). Large amounts are produced in the Netherlands but used
elsewhere. In Finland, Belgium and Great Britain, the oxygenates TAME and next-TAME are
also used and the capacities were 110,000 t/a (1996), >140,000 t/a (1988) and <240,000 t/a
(1987), respectively. In France, MTBE has been partially replaced by ethyl tert-butyl ether
(ETBE) since 1990 but also blends of MTBE, ETBE and TAME are used [RIPPEN, 2001;
KHAROUNE ET AL., 2001]. In Spain, Sweden, the Netherlands and Italy, new ethanol
production units are being built that allow MTBE production to be converted to ETBE
[WALKER, 1999; ANONYMOUS, 2000A]. The average MTBE concentrations in gasoline are
highest in Finland, Belgium and Spain. In Figure 1-3, produced amounts of ETBE are
probably included although it was not described by the authors [DEWITT COMPANY, 1998;
0
100
200
300
400
500
600
700
800
900
1000
Austria
Belgiu
m
Denmark
Finlan
d
Franc
e
German
y Italy
Netherl
ands
Portu
gal
Spain
Swed
en
Switze
rland
Great B
ritain
Norway
MT
BE
am
ou
nt
[10³
t/a
] in
199
7
0
1
2
3
4
5
6
7
8
9
10
Ave
rag
e M
TB
E c
on
cen
trat
ion
in g
aso
line
[% w
/w]
Produced (incl. TAME)
Consumed
Average MTBE concentration ingasoline
(MTBE only)
no d
ata
no d
ata
no d
ata
Figure 1-3 Amounts of methyl tert-butyl ether (MTBE) produced and consumed in European
countries in 1997 [DEWITT COMPANY, 1998; MEF, 2001].
1 Use, History, Political and Legal Aspects of MTBE
21
Oth
ers
Por
tuga
l
Net
herla
nds
Fin
land
Gre
at B
ritai
n
Fra
nce
Italy
Spa
in
Ger
man
y
0
100
200
300
400
500
600
700
Est
imat
ed E
uro
pea
n M
TB
EC
on
sum
pti
on
[10
³ t/
a]
20001999
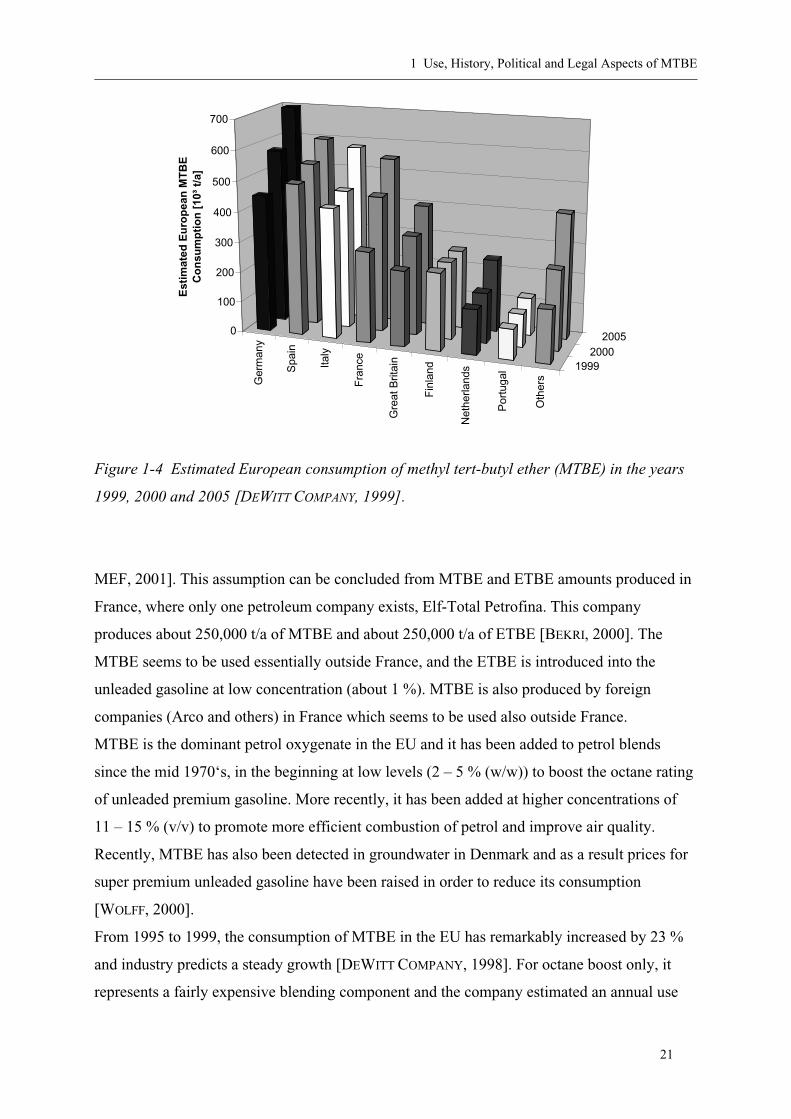
2005
Figure 1-4 Estimated European consumption of methyl tert-butyl ether (MTBE) in the years
1999, 2000 and 2005 [DEWITT COMPANY, 1999].
MEF, 2001]. This assumption can be concluded from MTBE and ETBE amounts produced in
France, where only one petroleum company exists, Elf-Total Petrofina. This company
produces about 250,000 t/a of MTBE and about 250,000 t/a of ETBE [BEKRI, 2000]. The
MTBE seems to be used essentially outside France, and the ETBE is introduced into the
unleaded gasoline at low concentration (about 1 %). MTBE is also produced by foreign
companies (Arco and others) in France which seems to be used also outside France.
MTBE is the dominant petrol oxygenate in the EU and it has been added to petrol blends
since the mid 1970‘s, in the beginning at low levels (2 – 5 % (w/w)) to boost the octane rating
of unleaded premium gasoline. More recently, it has been added at higher concentrations of
11 – 15 % (v/v) to promote more efficient combustion of petrol and improve air quality.
Recently, MTBE has also been detected in groundwater in Denmark and as a result prices for
super premium unleaded gasoline have been raised in order to reduce its consumption
[WOLFF, 2000].
From 1995 to 1999, the consumption of MTBE in the EU has remarkably increased by 23 %
and industry predicts a steady growth [DEWITT COMPANY, 1998]. For octane boost only, it
represents a fairly expensive blending component and the company estimated an annual use
1 Use, History, Political and Legal Aspects of MTBE
22
of about 4 mio t/a, among other blending substances, until the end of the year 2005. They
believe that MTBE will play the major role in the necessary reduction of aromatics. An
additional increase in MTBE amounts consumed due to new legislation from 2005 on remains
difficult to estimate. However, it is assumed that until 2005 average European MTBE
concentrations in gasoline will presumably be in the range of 1 – 4 % (v/v) [LITTLE, 2001]
and about 4 mio t/a will be consumed until 2005 [MEF, 2001]. DEWITT COMPANY [1999]
estimated an increase in the MTBE consumption by 48 % in Europe from 1999 to 2005.
Approximately 1.5 % of the MTBE amout consumed is used as a chemical to produce high
purity isobutylene, as a solvent in the pharmaceutical industry and as a therapeutic agent for
in vivo dissolution of cholesterol gallstones in humans [WHO, 1998].
In Europe, problems arising from an increased MTBE use in the future are evaluated
differently. Generally, lower environmental MTBE concentrations compared to California are
expected, because it is worth keeping tanks in good condition when the cost/ litre is around
seven times higher than in the U.S.. If a tank leaks in Europe, it leaks products for which tax
has already been paid. In the U.S., the fuels are taxed when being delivered to the petroleum
stations. Other arguments were the existence of double-sided tanks in Germany, the more
central organization of the water supply in Europe compared to the U.S. and that detections of
oxygenates at traceable levels in groundwater has been a very isolated problem in Europe so
far [WALKER, 1999]. The chairman of the European Association of Oxygenated Fuel
Producers (H. Rovers) recently claimed that the way the MTBE issue is handled in the U.S. is
mainly a result of strong political lobbying against MTBE and bad science. He does not
believe that the U.S. has made a proper evaluation of the problem, and he trusts that such
error will not be replicated in Europe. Although the toxicity, particularly MTBE’s long-term
carcinogenic activity is not yet fully understood, he compares MTBE to tea or talcum powder
as all substances fall into the same category of toxicity [ROVERS, 2000]. Furthermore, he
concluded that, in future, the need for gasoline and with it, the need for MTBE will decline.
However, currently and in the near future, the MTBE demand is rising and will very likely
even stronger increase [DEWITT COMPANY, 1998 AND 1999]. The view on the subject of the
oil company Shell significantly differs from the former opinion. The MTBE problem is not
simply evaluated and the company believes that a constructive dialogue is required between
the key parties in order to determine the best way forward. The aim should be to ensure full
understanding of the complexities of the issue and to seek practical solutions which balance

1 Use, History, Political and Legal Aspects of MTBE
23
off possible risks, benefits and costs. Different solutions can result including that society
might accept the groundwater risk or ubiquitously occurring MTBE concentrations
associcated with the use of MTBE given that there are no health issues [ANONYMOUS, 2000C].
Detections of oxygenates in the environment were reported from Finland (TAME and
MTBE), in tap water (ETBE) from France [LA VOIE DU NORD, 1999], in lake and
groundwater in Denmark (MTBE), in urban/ rural air and Zürichsee from Switzerland
[BUWAL, 1999; SCHMIDT, 2000], in groundwater from Austria, Netherlands, Sweden and
Great Britain [EAUK, 2001; MEF, 2001].
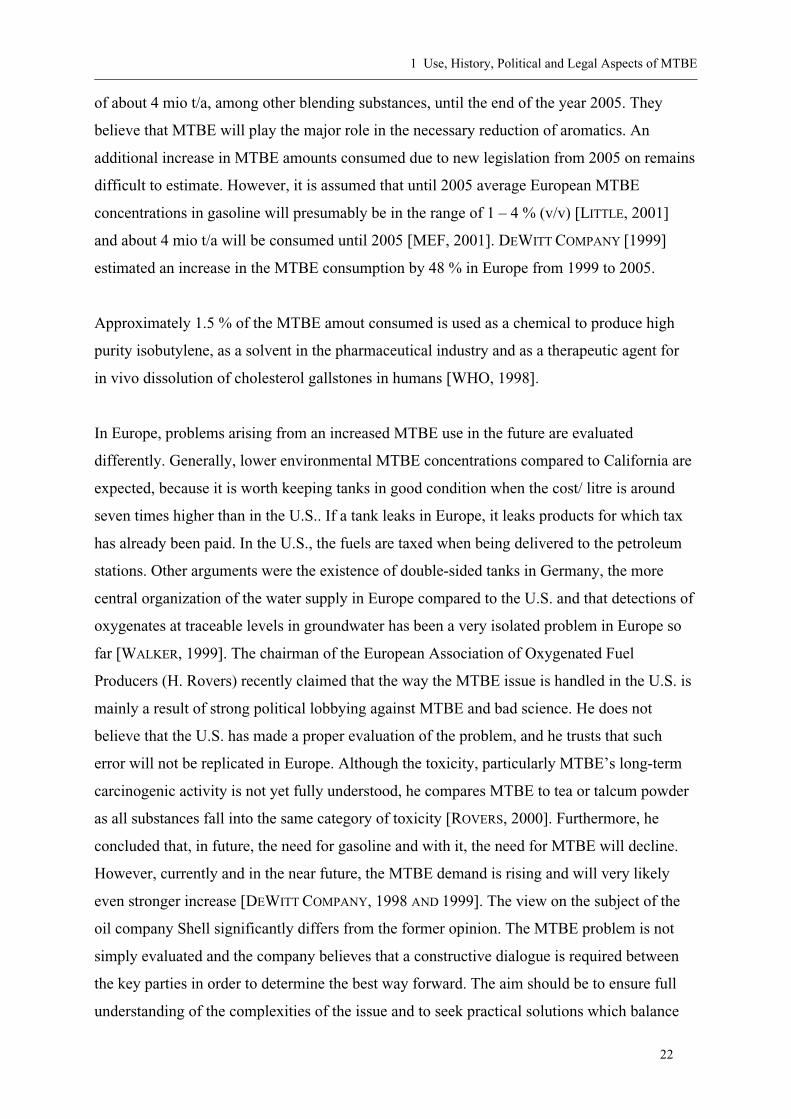
1.1.3 Germany
In Germany, the use of the gasoline additive tetraethyl lead increased until 1972 and since
then, it was partly substituted by increased concentrations of aromatic hydrocarbons, mainly
benzene, toluene, ethylbenzene, xylenes, (BTEX) and trimethylbenzenes. The use of
tetraethyl lead as gasoline additive damaged the catalysts of vehicles and resulted in
measurable environmental concentrations of the compound. Since 1999, leaded gasoline was
not sold anymore (Figure 1-5). But soon, the carcinogenic effect of benzene was not further
acceptable for public health. Since the mid 1980‘s, MTBE has been added to gasoline in
Germany as an octane booster. The average MTBE content in super premium unleaded
gasoline of 7.7 % was reported from an investigation of gasoline in 1998 [BREUM, 1998]. In
1999, super premium unleaded gasoline, regular unleaded gasoline and the new „Optimax“
gasoline showed average MTBE contents of 9.8, 0.4 and 11.9 % (w/w), respectively. The
values for Euro super unleaded gasoline varied from 0.4 to 4.2 % (w/w) [ACHTEN AND
PÜTTMANN, 2001A]. Super premium unleaded gasoline (RON = 99) shows highest average
MTBE concentrations but it is consumed to significantly lower amounts than Euro super
unleaded (RON = 96) which is characterized by lower concentrations of MTBE (Figure 1-5).
Both form the main part of the consumed amount of the ether. The use of regular unleaded
gasoline (RON = 93) has slowly decreased since 1991. Instead, since 1990, the use of Euro
super unleaded has increased significantly up to about 18,000*106 t in 1999/ 2000. The
average MTBE concentration in German gasoline is 1.2 – 1.71 % (w/w) [PAHLKE ET AL.,
2000; MEF, 2001; SCHOLZ, 2001]. Different authors estimated the total MTBE use in
Germany. PAHLKE ET AL. [2000] estimated the MTBE production capacities of German
refineries and chemical industry to be
1 Use, History, Political and Legal Aspects of MTBE
24
0
5
10
15
20
1 2 3 4 5 6 7 8 9 10 11 12 13 14
Euro Super Unleaded
Regular Unleaded
Super Premium Unleaded
Super Leaded
Gas
olin
e [1
06 t]
1988 1990 1992 1994 1996 1998 2000
0.3 - 4.2 % (w/w) MTBE
0.4 % (w/w) MTBE
9.8 % (w/w) MTBE
Figure 1-5 Development of the gasoline consumption of regular unleaded, Euro super
unleaded, super premium unleaded and super leaded in Germany [STATISTISCHES BUNDESAMT,
2001] and average content of methyl tert-butyl ether (MTBE) in 1999 [ACHTEN AND
PÜTTMANN, 2001A].
Table 1-1 Estimated production capacities of methyl tert-butyl ether (MTBE) [kt/a] of
German refineries and chemical industry [PAHLKE ET AL., 2000].
.
MTBE Capacity [kt/a] Refineries 1995 1999 DEA/ Heide 12 12 DEA/ Wesseling 60 63 PCK/ Schwedt 80 84 Mider/ Leuna 50 50 Bayernoil/ Ingolstadt 22 35 MIRO/ Karlsruhe 120 150 Mobil Oil/ Wörth/ R 42 0 No data from: Shell/ Hamburg; Shell/ Godorf; BETA/ Wilhelmshafen; HOLBORN/ Hamburg; Wintershall/ Lingen; RuhrOel/ Gelsenkirchen; Esso/ Ingolstadt and OMV/ Burghausen
Chemical Industry Degussa Hüls, Marl 150 150 Total 536 544
.
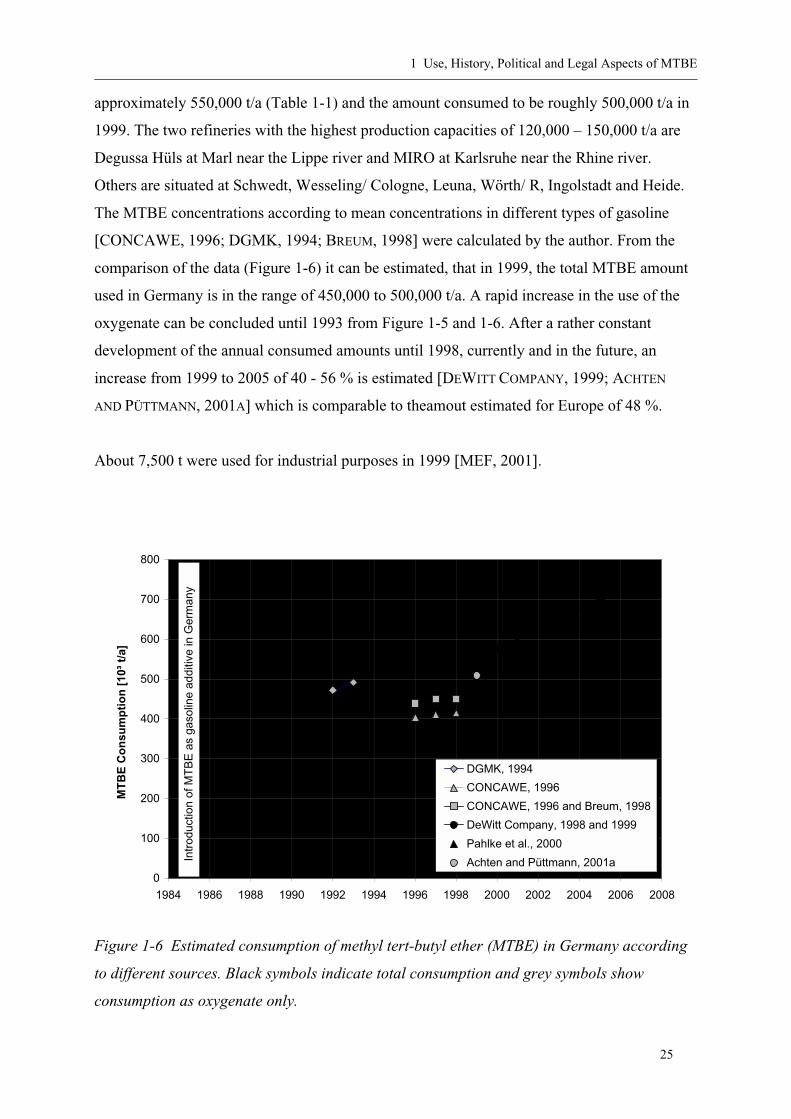
1 Use, History, Political and Legal Aspects of MTBE
25
approximately 550,000 t/a (Table 1-1) and the amount consumed to be roughly 500,000 t/a in
1999. The two refineries with the highest production capacities of 120,000 – 150,000 t/a are
Degussa Hüls at Marl near the Lippe river and MIRO at Karlsruhe near the Rhine river.
Others are situated at Schwedt, Wesseling/ Cologne, Leuna, Wörth/ R, Ingolstadt and Heide.
The MTBE concentrations according to mean concentrations in different types of gasoline
[CONCAWE, 1996; DGMK, 1994; BREUM, 1998] were calculated by the author. From the
comparison of the data (Figure 1-6) it can be estimated, that in 1999, the total MTBE amount
used in Germany is in the range of 450,000 to 500,000 t/a. A rapid increase in the use of the
oxygenate can be concluded until 1993 from Figure 1-5 and 1-6. After a rather constant
development of the annual consumed amounts until 1998, currently and in the future, an
increase from 1999 to 2005 of 40 - 56 % is estimated [DEWITT COMPANY, 1999; ACHTEN
AND PÜTTMANN, 2001A] which is comparable to theamout estimated for Europe of 48 %.
About 7,500 t were used for industrial purposes in 1999 [MEF, 2001].
0
100
200
300
400
500
600
700
800
1984 1986 1988 1990 1992 1994 1996 1998 2000 2002 2004 2006 2008
MT
BE
Co
nsu
mp
tio
n [
10³
t/a]
.
DGMK, 1994
CONCAWE, 1996
CONCAWE, 1996 and Breum, 1998
DeWitt Company, 1998 and 1999
Pahlke et al., 2000
Achten and Püttmann, 2001aIntr
oduc
tion
of M
TB
E a
s ga
solin
e ad
ditiv
e in
Ger
man
y .
Figure 1-6 Estimated consumption of methyl tert-butyl ether (MTBE) in Germany according
to different sources. Black symbols indicate total consumption and grey symbols show
consumption as oxygenate only.

1 Use, History, Political and Legal Aspects of MTBE
26
First analytical data of the oxygenate in the German environment were reported for surface
water and precipitation in 1999 [ACHTEN AND PÜTTMANN, 2000 AND 2001B; BRAUCH ET AL.,
2000A, PAHLKE ET AL., 2000; ACHTEN ET AL., 2001A, 2002A AND B], followed by observations
in groundwater [Kolb, 2000; BRAUCH ET AL., 2000A; KLINGER ET AL., 2000; SCHIEDEK ET AL.,
2000, BLW, 2000; EFFENBERGER ET AL., 2001, LUBW, 2001].
In Germany, authorities only recently began to evaluate the MTBE situation in the country
[PAHLKE ET AL., 2000; PAHLKE, 2000] and decided not to implement a drinking water and
surface water standard because MTBE concentrations in Germany are believed to be
generally low. Other reasons for the decision were the presence of significantly lower MTBE
concentrations in german gasoline compared to some U.S. states, decreasing MTBE emissions
from automobiles and handling of MTBE by improved technology, such as use of double-
sided tanks at gasoline stations from 1992 to 1998 due to an implemented directive. Very
small fuel stations that sold less than 100,000 t/a were not covered by the directive, but they
represent only a very small part of the overall gasoline pool. At the beginning of 1998, the
remediation of 70 % of all petroleum stations was completed, covering more than 95 % of the
stations that sell more than 5 mio t/a of gasoline [DEWITT COMPANY, 1999]. Additionally, the
conclusion of the WORLD HEALTH ORGANIZATION in 1998 [WHO, 1998] that acute health
risks for the public from the use of MTBE are unlikely and the reduction of emissions like
benzene, CO and hydrocarbons were used as arguments for the use of MTBE. The
Umweltbundesamt estimated a reduction of MTBE emissions in Germany from
approximately 6000 t/a in 1992 to about 2200 t/a in 1999. However, monitoring of the
oxygenate particularly at sites contaminated with gasoline has been intensified by the
Umweltbundesamt [PAHLKE ET AL., 2000] because concentrations are generally higher at
these sites.
The German government concluded that from the German MTBE use in gasoline, no acute
health risks are known and are probably not expected in the future [PAHLKE ET AL., 2000].
1.2 Legal aspects
1.2.1 United States of America (U.S.)
The regulations on American exhaust emissions from vehicles were already described in
chapter 1.1.1. In December 1997, the U.S. EPA’s Office of Water issued a drinking water
advisory for MTBE. It recommends a limit of 20 – 40 µg/L for drinking water as the range

1 Use, History, Political and Legal Aspects of MTBE
27
that is sufficiently low enough to prevent human health risks and ensure no unpleasant odor or
taste of the water. The EPA has not yet established a maximum contaminant level for MTBE
in water and it is expected in 2006. More recently, the public health goal of 13 µg/L in
drinking water based on cancer studies in rats and mice was proposed.[OEHHA, 1999].
Table 1-2 Aqueous cleanup levels for methyl tert-butyl ether (MTBE) in different U.S. States
[Jacobs et al., 2001].
.
U.S. Cleanup Levels for Methyl tert-Butyl Ether (04/01/00)
10 µg/L New York 13 µg/L primary (health effects)/ California
5 µg/L secondary (taste and odor) 18 µg/L Lousiana 20 µg/L Alabama, Hawaii, Kansas, Oklahoma, Pennsylvania,
Washington 20 µg/L/ 40 µg/L Oregon 20 µg/L/ 200 µg/L Nevada 20 µg/L drinking water/ site specific Maryland 30 µg/L Montana 35 µg/L Arizona, Maine 40 µg/L Minnesota, Ohio, South Carolina, Vermont 40 µg/L groundwater quality standard/ Rhode Island 20 µg/L preventative action level 40 µg/L projected Michigan 45 µg/L projected Indiana 50 µg/L residential/ 500 µg/L industrial Florida 55 µg/L Mississippi 60 µg/L Wisconsin 70 µg/L New Hampshire, New Jersey 70 µg/L projected Illinois 70 µg/L groundwater drinking supply/ Massachusetts 50 mg/L groundwater source for
vapor emissions to buildings 100 µg/L Connecticut, New Mexico 180 µg/L Delaware 200 µg/L, proposed at 70 µg/L North Carolina 200 µg/L Wyoming 200 µg/L action level Utah 40 – 400 µg/L depending on use Missouri site specific Arkansas, Colorado, Idaho,
Virginia waiting for EPA cleanup levels in 2006 Alaska, Georgia, Iowa, Kentucky, Nebraska, North and South Dakota,
Tennessee, Texas, West Virginia .

1 Use, History, Political and Legal Aspects of MTBE
28
Clean-up levels for MTBE in water, mostly groundwater, differ from state to state (Table 1-2)
and vary from 10 µg/L (New York) to 400 µg/L (Missouri). In California, a standard of
13 µg/L was implemented on the basis of health effects whereas a secondary standard of
5 µg/L ensures that the odor and taste of the ether in drinking water is not perceived. In the
states of Oregon, Nevada, Maryland, Rhode Island, Florida and Massachusetts also two
standards of different levels and in Arkansas, Colorado, Idaho and Virginia Site specific
levels are used. In Missouri, the standard is depending on use and a group of 10 states is
waiting for a standard proposed by the EPA in 2006.
In 1997, the EPA recommended a reference concentration for the air of 0.5 mg/m³ (Estimation
of the daily concentration inhaled that does not represent any risks –except carcinogenic ones-
to sensitive humans life-long) [TESSERAUX AND KOSS, 1999] which was revised to 3 mg/m³
after additional data on the effects on chronic exposures in late 1992 [DAVIS AND FARLAND,
2001]. At work (8 h mean), a standard of 144 mg/m³ was recommended by the AMERICAN
CONFERENCE OF GOVERNMENTAL INDUSTRIAL HYGIENISTS [ACGIH, 2001]. As it can be
expected, the ban of MTBE proposed by the EPA has been criticized by the Oxygenated Fuel
Association. Its director claimed the initiative a political move that will have disastrous
effects on the environment and gasoline prices. If the EPA continued its course, it was
inviting a legal challenge [ANONYMOUS, 2000B]. Recently, California Court has rejected a
lawsuit against the MTBE ban by the producers of the oxygenate [ANONYMOUS, 2001B]. A
resident in Florida has filed the first MTBE class action lawsuit hitting Exxon Mobil which is
copied by people from other states [MARXSEN, 2001]. Anyway, the oil companies are already
accused for conspiracy concerning the existing situation. They are accused to have purposely
deceived public and government about the dangers of MTBE towards groundwater for profit
reasons [BOLOGNA, 2000]. However, the oil companies reject the responsibility for the
disaster and in turn make the government responsible because leakages of underground
storage tanks were not controlled effectively by the state. Anyway, it is believed that most of
the MTBE now showing up in California wells originally came from leaking underground
storage tanks (LUSTs) long since either shut down or upgraded to prevent further leaking. In
effect, it is stated that the California MTBE ban remedies a problem that has already been
solved [MARXSEN, 2001]. MARXSEN also made the point that, clearly, it was only after MTBE
was first reported to be a groundwater threat (in 1980) that it effectively mandated as a
gasoline additive. Although the "Clean Air Act Amendments" do not call for MTBE as the
oxygenate of choice, it was well known that it represented the compound commonly used.
Recent progress towards banning it comes more from evolving political processes than from

1 Use, History, Political and Legal Aspects of MTBE
29
new scientific discoveries [MARXSEN, 2001]. He concluded that the current effort to ban
MTBE underscores how overzealous and wrong-headed enforcement of U.S. environmental
regulations continues to damage the country’s economy. Aspects of law concerning the
MTBE dilemma and particularly underground storage tank regulations are summarized by
[FAULK AND GRAY, 1999].
1.2.2 European Union (EU)
Until 1971, passenger car exhaust emissions were uncontrolled and in the following years,
gradual control actions have been implemented. In 1991, as a consequence of the changes in
legislation, the implementation of the Directive 91/441/EEC („EURO I“) standards, it was
necessary for all new petrol cars to be equipped with closed-loop three way catalyst and with
carbon canisters for evaporative emission control. These technologies first entered widespread
use in the EU from 1993 on. Emissions from gasoline distribution were regulated by the
Directive 94/63/EC in 1994. The requirements of the directive limit the annual total loss of
petrol during filling of storage tanks to 0.05 – 0.1 kg/t losses each from petrol in delivery
depots, losses during filling and emptying of mobile tanks in delivery depots and during
filling of the storage tanks at gas stations. During unloading from tank truck to station tank,
vaporized petrol is collected and several stations are equipped with inlets that are attached to
the petrol pistol for the reduction of emissions. Other directives (e.g. „EURO II) are aimed at
the reduction of common exhaust emissions. Directive 98/70/EC („EURO III“) regulates
maximum content of MTBE as „ethers containing 5 or more carbon atoms per molecule“ to
15 % (v/v). From 2000 on, new petrol quality standards were implemented that limited
volatility and concentrations of several compounds of gasoline: Reid vapor pressure in
summer (60 kPa), sulphur content (150 mg/kg), olefins (18 % (v/v)), aromatics (42 % (v/v))
and benzene (1 % (v/v)). Until 2005, the total concentration of aromatics will be restricted to
35 % (v/v) and the one of sulfur to 50 mg/kg. Lower octane numbers resulting from the
reduction of aromatics will probably be compensated by higher MTBE concentrations in
order to provide the quality of the gasoline. Recently, this has been evaluated as being
acceptable for groundwater in the EU because the European Commission is not of the opinion
that MTBE contaminations in groundwater is widespread across the Community [EC, 2001].
Toluene, the xylenes and trimethyl benzenes represent some of the major components of
gasoline which indicates that the MTBE increase in gasoline in the future will probably be
significant.
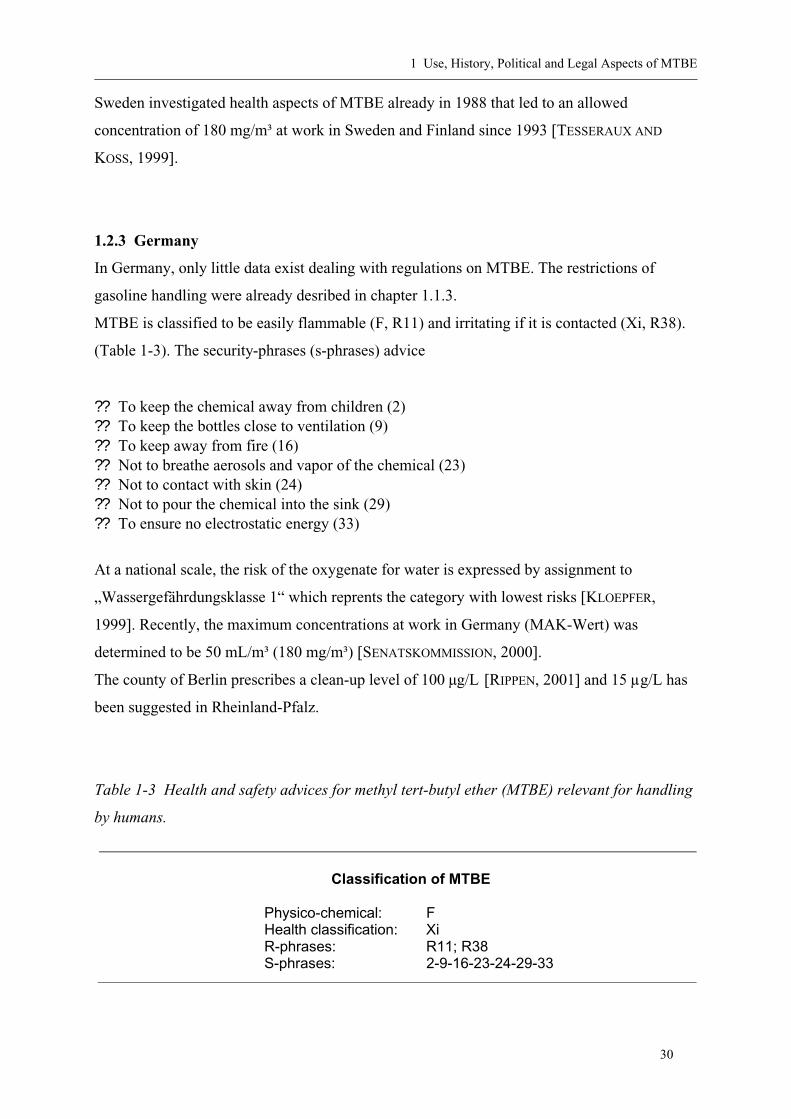
1 Use, History, Political and Legal Aspects of MTBE
30
Sweden investigated health aspects of MTBE already in 1988 that led to an allowed
concentration of 180 mg/m³ at work in Sweden and Finland since 1993 [TESSERAUX AND
KOSS, 1999].
1.2.3 Germany
In Germany, only little data exist dealing with regulations on MTBE. The restrictions of
gasoline handling were already desribed in chapter 1.1.3.
MTBE is classified to be easily flammable (F, R11) and irritating if it is contacted (Xi, R38).
(Table 1-3). The security-phrases (s-phrases) advice
?? To keep the chemical away from children (2)
?? To keep the bottles close to ventilation (9)
?? To keep away from fire (16)
?? Not to breathe aerosols and vapor of the chemical (23)
?? Not to contact with skin (24)
?? Not to pour the chemical into the sink (29)
?? To ensure no electrostatic energy (33)
At a national scale, the risk of the oxygenate for water is expressed by assignment to
„Wassergefährdungsklasse 1“ which reprents the category with lowest risks [KLOEPFER,
1999]. Recently, the maximum concentrations at work in Germany (MAK-Wert) was
determined to be 50 mL/m³ (180 mg/m³) [SENATSKOMMISSION, 2000].
The county of Berlin prescribes a clean-up level of 100 µg/L [RIPPEN, 2001] and 15 µg/L has
been suggested in Rheinland-Pfalz.
Table 1-3 Health and safety advices for methyl tert-butyl ether (MTBE) relevant for handling
by humans.
.
Classification of MTBE
Physico-chemical: F Health classification: Xi R-phrases: R11; R38 S-phrases: 2-9-16-23-24-29-33
.
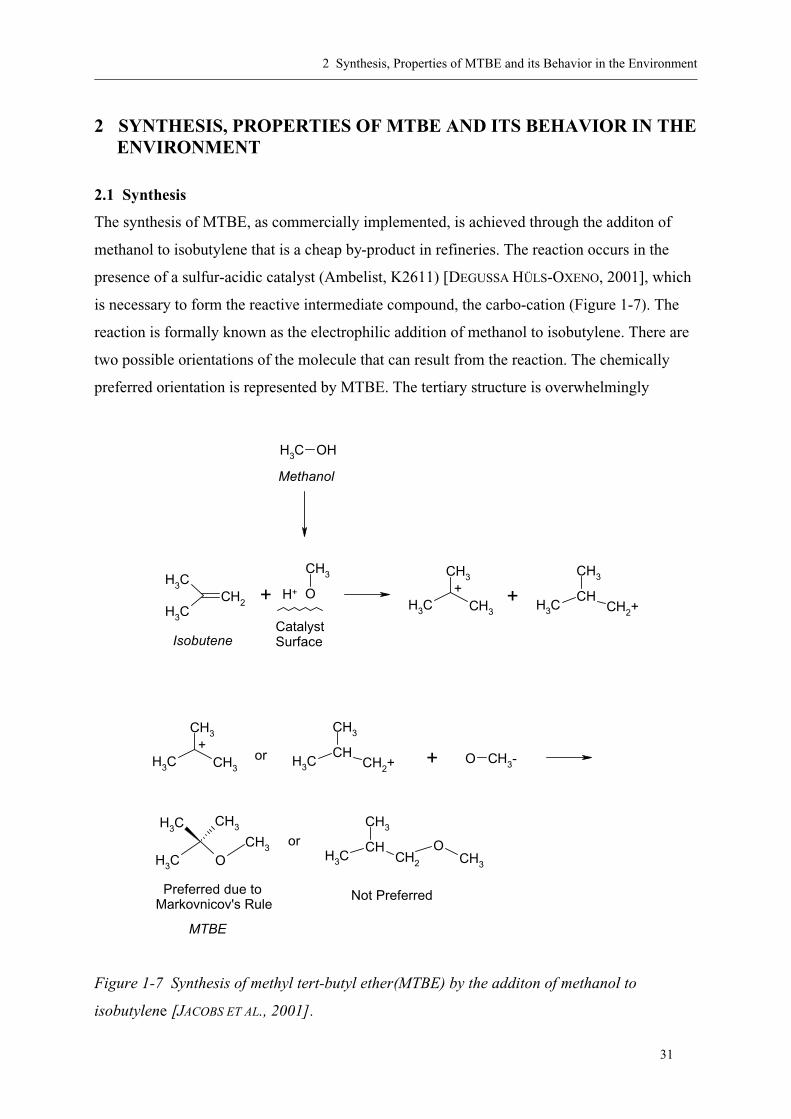
2 Synthesis, Properties of MTBE and its Behavior in the Environment
31
2 SYNTHESIS, PROPERTIES OF MTBE AND ITS BEHAVIOR IN THE
ENVIRONMENT
2.1 Synthesis
The synthesis of MTBE, as commercially implemented, is achieved through the additon of
methanol to isobutylene that is a cheap by-product in refineries. The reaction occurs in the
presence of a sulfur-acidic catalyst (Ambelist, K2611) [DEGUSSA HÜLS-OXENO, 2001], which
is necessary to form the reactive intermediate compound, the carbo-cation (Figure 1-7). The
reaction is formally known as the electrophilic addition of methanol to isobutylene. There are
two possible orientations of the molecule that can result from the reaction. The chemically
preferred orientation is represented by MTBE. The tertiary structure is overwhelmingly
OCH3
CH3
CH3CH3
CH3
CH2
CH3+ O
CH3
H+
CH3
CH3
CH3
+ + CH3
CH
CH3
CH2+
CatalystSurface
+
or
CH3
CH3
CH3
+CH3
CH
CH3
CH2+or
CH3
CH
CH3
CH2
OCH3
Preferred due toMarkovnicov's Rule
Isobutene
CH3 OH
Methanol
MTBE
Not Preferred
O CH3-
Figure 1-7 Synthesis of methyl tert-butyl ether(MTBE) by the additon of methanol to
isobutylene [JACOBS ET AL., 2001].

2 Synthesis, Properties of MTBE and its Behavior in the Environment
32
preferred in the reaction pathway due to the stability to the tertiary carbocation.The preference
of hydrocarbons to orient in the tertiary structure as a result of the formation of the most
stable carbo-cation is known as Markovnikov’s rule. It is the tendency of the inner structure
of the hydrocarbons to conform the most stable orientation that produces the tertiary carbon
structure. MTBE can also be prepared from methanol and tert-butyl alcohol.
2.2 Physico-Chemical Properties
Methyl tert-butyl ether or 2-methoxy 2-methyl propane (MTBE, CAS-No. 1634-04-4,
EINECS-No. 216-653-1) is a chemically stable and colourless volatile liquid with an
antiseptic odor. It is a polar molecule (the most polar constituent of gasoline) but compared to
other ethers, it represents a relatively non-polar compound. Therefore, it is very water-soluble
and soluble in most organic solvents. MTBE is flammable and combustible. It is characterized
by a high research octane number (RON) of 117 and motor octane number (MON) of 102.
OCH3
CH3
CH3CH3
Figure 2-1 Structural formula of methyl tert-butyl ether (MTBE, C5H12O).
Unlike many ethers, MTBE does not tend to form peroxides during storage [MEF, 2001]. A
molecular weight of 88.15 u of MTBE results from its structural formula that is shown in
Figure 2-1. The structure is responsible for the resistance of the molecule to biodegradation
and chemical oxidation. The presence of the oxygen atom in the molecule, as an ether linkage,
provides a site for hydrogen bonding between water and MTBE. The energy of this bond is
not high but is higher than the observed amounts for other molecules of environmental
significance (e.g. chlorinated solvents). The amount of energy required to break this bond
helps explain why the compound is difficult to air strip during remediation processing and
separate from the aqueous solution. Impurities (<1.5 – 0.1 %) of methanol, 2-methylpropan-2-
ol, 2,4,4-trimetylpentene, C4-olefins, aromatics, C4-6 parafins, 2,4,4-trimethylpent-1-ene,
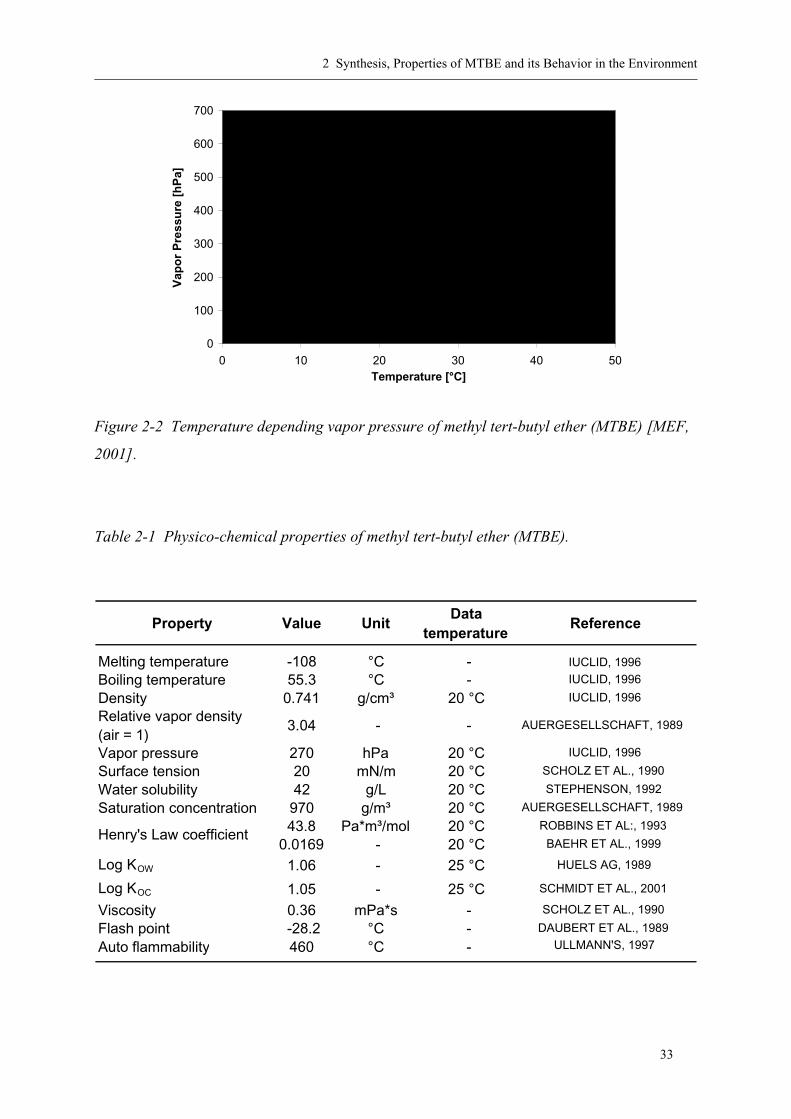
2 Synthesis, Properties of MTBE and its Behavior in the Environment
33
0
100
200
300
400
500
600
700
0 10 20 30 40 50Temperature [°C]
Vap
or
Pre
ssu
re [
hP
a]
Figure 2-2 Temperature depending vapor pressure of methyl tert-butyl ether (MTBE) [MEF,
2001].
Table 2-1 Physico-chemical properties of methyl tert-butyl ether (MTBE).
Property Value UnitData
temperatureReference
Melting temperature -108 °C - IUCLID, 1996
Boiling temperature 55.3 °C - IUCLID, 1996
Density 0.741 g/cm³ 20 °C IUCLID, 1996
Relative vapor density(air = 1)
3.04 - - AUERGESELLSCHAFT, 1989
Vapor pressure 270 hPa 20 °C IUCLID, 1996
Surface tension 20 mN/m 20 °C SCHOLZ ET AL., 1990
Water solubility 42 g/L 20 °C STEPHENSON, 1992
Saturation concentration 970 g/m³ 20 °C AUERGESELLSCHAFT, 1989
43.8 Pa*m³/mol 20 °C ROBBINS ET AL:, 1993
0.0169 - 20 °C BAEHR ET AL., 1999
Log KOW 1.06 - 25 °C HUELS AG, 1989
Log KOC 1.05 - 25 °C SCHMIDT ET AL., 2001
Viscosity 0.36 mPa*s - SCHOLZ ET AL., 1990
Flash point -28.2 °C - DAUBERT ET AL., 1989
Auto flammability 460 °C - ULLMANN'S, 1997
Henry's Law coefficient
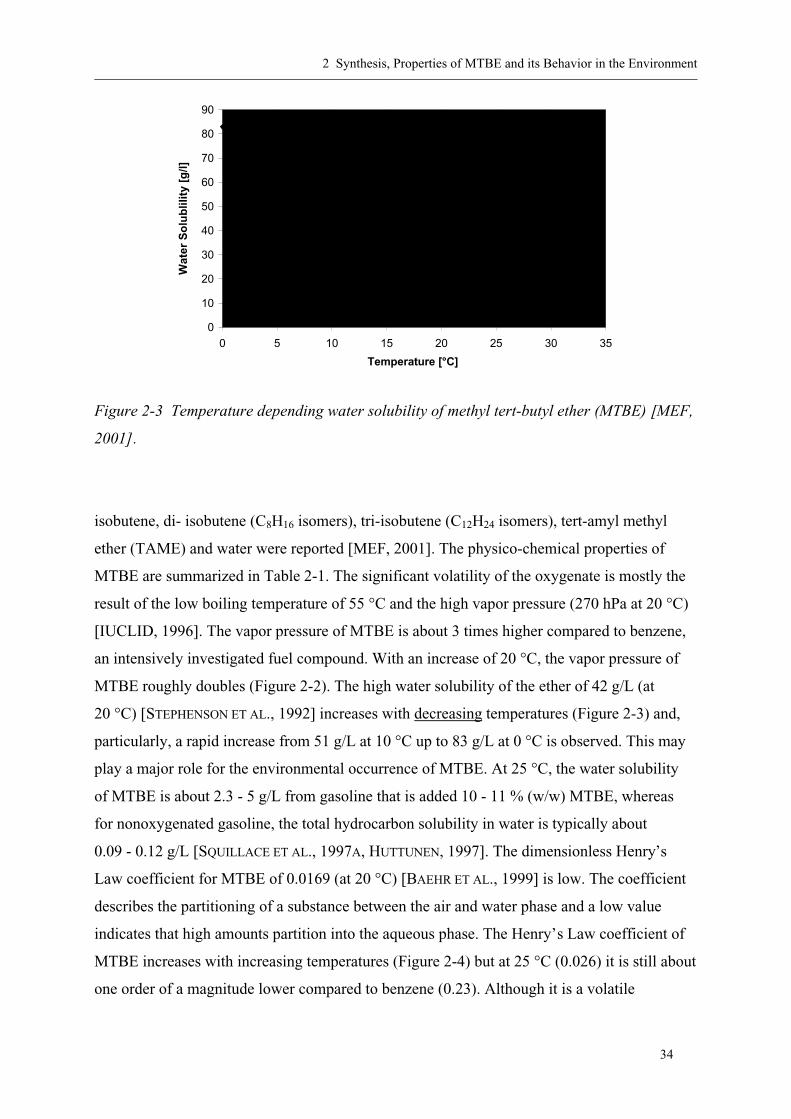
2 Synthesis, Properties of MTBE and its Behavior in the Environment
34
0
10
20
30
40
50
60
70
80
90
0 5 10 15 20 25 30 35
Temperature [°C]
Wat
er S
olu
blil
ity
[g/l]
Figure 2-3 Temperature depending water solubility of methyl tert-butyl ether (MTBE) [MEF,
2001].
isobutene, di- isobutene (C8H16 isomers), tri-isobutene (C12H24 isomers), tert-amyl methyl
ether (TAME) and water were reported [MEF, 2001]. The physico-chemical properties of
MTBE are summarized in Table 2-1. The significant volatility of the oxygenate is mostly the
result of the low boiling temperature of 55 °C and the high vapor pressure (270 hPa at 20 °C)
[IUCLID, 1996]. The vapor pressure of MTBE is about 3 times higher compared to benzene,
an intensively investigated fuel compound. With an increase of 20 °C, the vapor pressure of
MTBE roughly doubles (Figure 2-2). The high water solubility of the ether of 42 g/L (at
20 °C) [STEPHENSON ET AL., 1992] increases with decreasing temperatures (Figure 2-3) and,
particularly, a rapid increase from 51 g/L at 10 °C up to 83 g/L at 0 °C is observed. This may
play a major role for the environmental occurrence of MTBE. At 25 °C, the water solubility
of MTBE is about 2.3 - 5 g/L from gasoline that is added 10 - 11 % (w/w) MTBE, whereas
for nonoxygenated gasoline, the total hydrocarbon solubility in water is typically about
0.09 - 0.12 g/L [SQUILLACE ET AL., 1997A, HUTTUNEN, 1997]. The dimensionless Henry’s
Law coefficient for MTBE of 0.0169 (at 20 °C) [BAEHR ET AL., 1999] is low. The coefficient
describes the partitioning of a substance between the air and water phase and a low value
indicates that high amounts partition into the aqueous phase. The Henry’s Law coefficient of
MTBE increases with increasing temperatures (Figure 2-4) but at 25 °C (0.026) it is still about
one order of a magnitude lower compared to benzene (0.23). Although it is a volatile
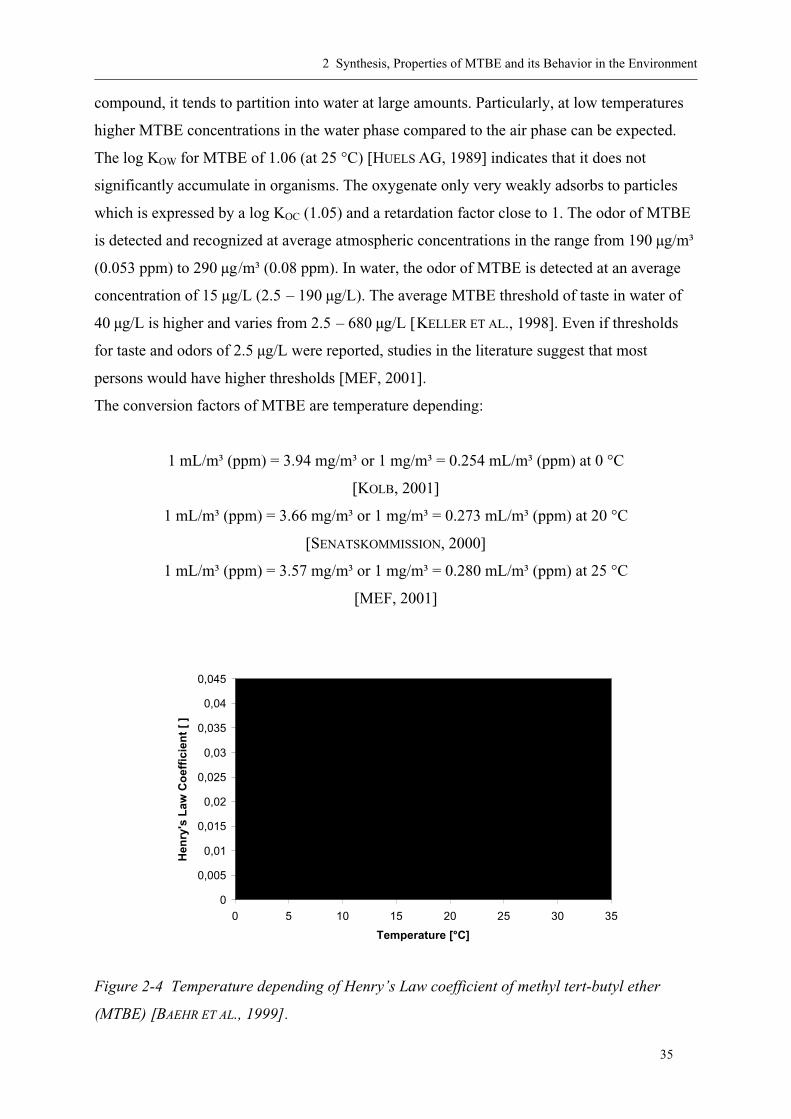
2 Synthesis, Properties of MTBE and its Behavior in the Environment
35
compound, it tends to partition into water at large amounts. Particularly, at low temperatures
higher MTBE concentrations in the water phase compared to the air phase can be expected.
The log KOW for MTBE of 1.06 (at 25 °C) [HUELS AG, 1989] indicates that it does not
significantly accumulate in organisms. The oxygenate only very weakly adsorbs to particles
which is expressed by a log KOC (1.05) and a retardation factor close to 1. The odor of MTBE
is detected and recognized at average atmospheric concentrations in the range from 190 µg/m³
(0.053 ppm) to 290 µg/m³ (0.08 ppm). In water, the odor of MTBE is detected at an average
concentration of 15 µg/L (2.5 – 190 µg/L). The average MTBE threshold of taste in water of
40 µg/L is higher and varies from 2.5 – 680 µg/L [KELLER ET AL., 1998]. Even if thresholds
for taste and odors of 2.5 µg/L were reported, studies in the literature suggest that most
persons would have higher thresholds [MEF, 2001].
The conversion factors of MTBE are temperature depending:
1 mL/m³ (ppm) = 3.94 mg/m³ or 1 mg/m³ = 0.254 mL/m³ (ppm) at 0 °C
[KOLB, 2001]
1 mL/m³ (ppm) = 3.66 mg/m³ or 1 mg/m³ = 0.273 mL/m³ (ppm) at 20 °C
[SENATSKOMMISSION, 2000]
1 mL/m³ (ppm) = 3.57 mg/m³ or 1 mg/m³ = 0.280 mL/m³ (ppm) at 25 °C
[MEF, 2001]
0
0,005
0,01
0,015
0,02
0,025
0,03
0,035
0,04
0,045
0 5 10 15 20 25 30 35
Temperature [°C]
Hen
ry's
Law
Co
effi
cien
t [
]
Figure 2-4 Temperature depending of Henry’s Law coefficient of methyl tert-butyl ether
(MTBE) [BAEHR ET AL., 1999].
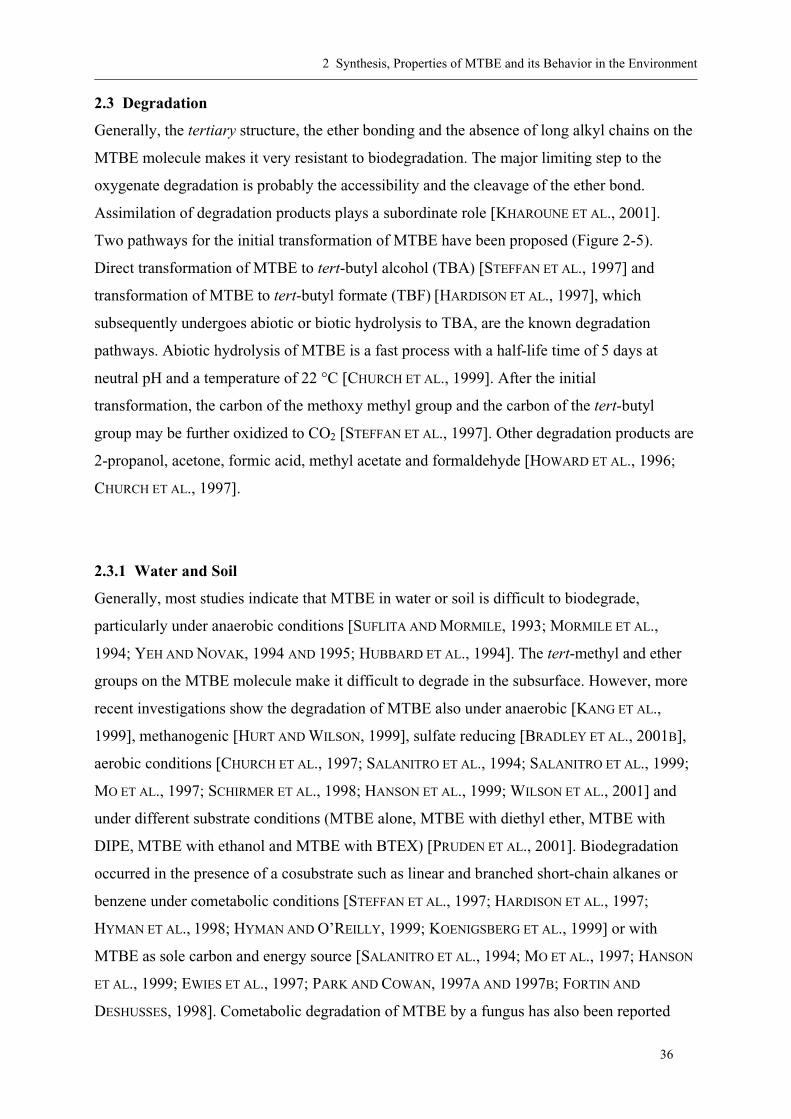
2 Synthesis, Properties of MTBE and its Behavior in the Environment
36
2.3 Degradation
Generally, the tertiary structure, the ether bonding and the absence of long alkyl chains on the
MTBE molecule makes it very resistant to biodegradation. The major limiting step to the
oxygenate degradation is probably the accessibility and the cleavage of the ether bond.
Assimilation of degradation products plays a subordinate role [KHAROUNE ET AL., 2001].
Two pathways for the initial transformation of MTBE have been proposed (Figure 2-5).
Direct transformation of MTBE to tert-butyl alcohol (TBA) [STEFFAN ET AL., 1997] and
transformation of MTBE to tert-butyl formate (TBF) [HARDISON ET AL., 1997], which
subsequently undergoes abiotic or biotic hydrolysis to TBA, are the known degradation
pathways. Abiotic hydrolysis of MTBE is a fast process with a half-life time of 5 days at
neutral pH and a temperature of 22 °C [CHURCH ET AL., 1999]. After the initial
transformation, the carbon of the methoxy methyl group and the carbon of the tert-butyl
group may be further oxidized to CO2 [STEFFAN ET AL., 1997]. Other degradation products are
2-propanol, acetone, formic acid, methyl acetate and formaldehyde [HOWARD ET AL., 1996;
CHURCH ET AL., 1997].
2.3.1 Water and Soil
Generally, most studies indicate that MTBE in water or soil is difficult to biodegrade,
particularly under anaerobic conditions [SUFLITA AND MORMILE, 1993; MORMILE ET AL.,
1994; YEH AND NOVAK, 1994 AND 1995; HUBBARD ET AL., 1994]. The tert-methyl and ether
groups on the MTBE molecule make it difficult to degrade in the subsurface. However, more
recent investigations show the degradation of MTBE also under anaerobic [KANG ET AL.,
1999], methanogenic [HURT AND WILSON, 1999], sulfate reducing [BRADLEY ET AL., 2001B],
aerobic conditions [CHURCH ET AL., 1997; SALANITRO ET AL., 1994; SALANITRO ET AL., 1999;
MO ET AL., 1997; SCHIRMER ET AL., 1998; HANSON ET AL., 1999; WILSON ET AL., 2001] and
under different substrate conditions (MTBE alone, MTBE with diethyl ether, MTBE with
DIPE, MTBE with ethanol and MTBE with BTEX) [PRUDEN ET AL., 2001]. Biodegradation
occurred in the presence of a cosubstrate such as linear and branched short-chain alkanes or
benzene under cometabolic conditions [STEFFAN ET AL., 1997; HARDISON ET AL., 1997;
HYMAN ET AL., 1998; HYMAN AND O’REILLY, 1999; KOENIGSBERG ET AL., 1999] or with
MTBE as sole carbon and energy source [SALANITRO ET AL., 1994; MO ET AL., 1997; HANSON
ET AL., 1999; EWIES ET AL., 1997; PARK AND COWAN, 1997A AND 1997B; FORTIN AND
DESHUSSES, 1998]. Cometabolic degradation of MTBE by a fungus has also been reported
2 Synthesis, Properties of MTBE and its Behavior in the Environment
37
OCH3
CH3
CH3CH3
HCHOOCH3
CH3CH3
H
O
HCOOH
OH
CH3
CH3CH3
MTBE
TBF
TBA
Figure 2-5 Proposed pathways for initial transformation of methyl-tert butyl ether (MTBE) to
tert-butyl formate (TBF) and tert-butyl alcohol (TBA) [HUNKELER ET AL., 2001].
[HARDISON ET AL., 1997]. It is concluded that the presence of more easily biodegradable
organics may inhibit MTBE biodegradation. Also, the cellular yield of microorganisms
utilizing MTBE as sole organic carbon source can be expected to be very low, either because
MTBE serves as a poor carbon and energy source, or because some of its metabolic
intermediates can inhibit cellular growth [STOCKING ET AL., 1999]. Regardless of the specific
aerobic mechanism, the presence of oxygen enhanced the biodegradation of MTBE
[KOENIGSBERG ET AL., 1999; PARK AND COWAN, 1997B; YANG ET AL., 1998]. For significant
MTBE degradation, oxygen levels need to exceed some threshold, apparently, above 2 mg/L.
[STOCKING ET AL., 1999]. Recent laboratory studies have indicated that MTBE can be rapidly
mineralized to CO2 under oxic conditions by microorganisms indigenous to surfacewater bed
sediments regardless of prior redox condition [BRADLEY ET AL., 1999] or previous MTBE
exposure [BRADLEY ET AL., 2001A]. FINNERAN AND LOVLEY [2001] observed anaerobic
degradation of MTBE in laboratory incubations of sediments from a petroleum-contaminated
aquifer and in aquatic sediments. The addition of humic substances stimulated the degradation
of MTBE in aquifer sediments in which Fe(III) was available as an electron acceptor. While
biodegradation of MTBE has often been observed in laboratory experiments, there is less

2 Synthesis, Properties of MTBE and its Behavior in the Environment
38
evidence for it at field sites [BORDEN ET AL., 1997; SCHIRMER AND BARKER, 1998; BRADLEY
ET AL., 1999; WILSON ET AL., 2000 AND 2002; LANDMEYER ET AL., 2001]. Different results
have been reported for the degradation of TBA [SCHIRMER, 1999]. Hydrolysis and photolysis
of MTBE in water will not be important removal processes [MEF, 2001]. MTBE is expected
to have high mobility in soil and leaching with water is the predominant abiotic fate process
in the subsurface. Recently, substrate interactions in BTEX and MTBE mixtures by an
MTBE-degrading isolate was investigated [DEEB ET AL., 2001]. The observed severe
inhibition of MTBE degradation by ethyl benzene and the xylenes and partial inhibition by
benzene and toluene in the study suggest that the biodegradation of MTBE in subsurface
environments would most likely be delayed until MTBE has migrated beyond the BTEX
plume.
To the knowledge of the author, the degradation of MTBE during a riverbank passage and in
surface water has not yet been investigated. In field studies, TBA and TBF have not yet been
exactly identified as degradation products of MTBE.
2.3.2 Air
The reaction of MTBE in the atmosphere occurs essentially with OH-radicals only [TUAZON
ET AL., 1991]. Reactions with radicals like .O3 and NO3
. are slow compared to the degradation
rates achieved with OH-radicals [HOWARD, 1990; ATKINSON AND CARTER, 1984;
WALLINGTON ET AL., 1986 AND 1987]. Photolysis of MTBE in the air can be neglected
[CALVERT AND PITTS, 1966]. In the presence of NOX in the atmosphere, the formation of TBF
from MTBE was proposed by SMITH ET AL. [1991] by the following reactions:
(CH3)3C – O – CH3 + .OH ! (CH3)3C – O – (C
.)H2 + H2O
MTBE
(CH3)3C – O – (C .)H2 + O2 (+ NO) ! (CH3)3C – O – CH2 – O
. (+ NO2)
(CH3)3C – O – CH2 – O . + O2 ! (CH3)3C – O – CHO + HO2
.
TBF
2 Synthesis, Properties of MTBE and its Behavior in the Environment
39
About 60 % of the OH-radical attack was observed at the methoxy group (O-CH3) leading to
the formation of TBA [JAPAR ET AL., 1990].
The degradation half-life time of MTBE is 3 - 6 days depending on environmental conditions
(predominantly OH-radical concentration) [COX ET AL., 1982; TUAZON ET AL., 1991; SMITH
ET AL., 1991; JAPAR ET AL., 1990, WALLINGTON ET AL., 1988]. A mean half-life time of 5.65 d
was estimated by the MEF [2001] using a degradation constant of 2.84*10-12
cm/ molecule s-1
and it was concluded that atmospheric MTBE can be transported over long distances, e.g.
thoughout Europe [SCHOLZ, 2001]. Atmospheric TBA is degraded at a rate constant (reaction
with OH-radicals) of 7.37*10-13
cm/ molecule s-1
[SMITH ET AL., 1991].
Degradation products include tert-butyl formate (62 %), formaldehyde (40 %), methyl acetate
(17 %), acetone (down to 2 %) and minor amounts of tert-butyl alcohol and acetaldehyde.
Recently, the degradation of MTBE vapors by cometabolism with pentane has been observed
[DUPASQUIER ET AL., 2002].
MTBE degradation in water and air is summarized by STOCKING ET AL., [1999], SCHIRMER,
1999, MEF [2001], and PRINCE [2000]. Remediation techniques suitable for the MTBE
removal are discussed by STOCKING ET AL. [1999], DERNBACH [2000] and JACOBS ET AL.
[2001].
2.4 Toxicity
Since the beginning of the MTBE use as oxygenate in gasoline in the United States, acute
health system complains, such as headaches, nausea, dizziness, and breathing difficulties have
been reported nationwide in the U.S. [JACOBS ET AL, 2001] . The toxicity of MTBE has not
yet been finally evaluated. So far, the U.S. EPA [SQUILLACE ET AL., 1997A], the WORLD
HEALTH ORGANIZATION [WHO, 1998], the EUROPEAN CENTRE FOR ECOTOXICITY AND
TOXICITY OF CHEMICALS (ECOTOC) [EFOA, 2002] and the MINISTRY OF THE ENVIRONMENT
FINNLAND [MEF, 2001] concluded that it appears unlikely that MTBE alone induces acute
health effects in the general population under common exposure conditions. However, the
EPA has classified MTBE as a possible human carcinogen [EPA, 2001].
Long-term exposure and toxicological effects with other pollutants present in the environment
are unknown. Since the initial metabolic step of MTBE releases formaldehyde and tert-butyl
alcohol (TBA), both of which are of toxicological interest, the relevant toxicokinetic features
of the two metabolites need to be addressed as well.
2 Synthesis, Properties of MTBE and its Behavior in the Environment
40
Calculated and tested bioconcentration factors of MTBE vary from 1.4 – 2.7 which indicate
low potential for bioconcentration [MEF, 2001]. MTBE exhibits low acute toxicity via oral,
dermal and inhalation in humans and test animals. The case data from gall bladder removal
patients show that the principal effects of MTBE are on central nervous system, including
sedation, nausea and vomiting. The LD50 in rats varies from 2900 – 4800 mg/kg [MASTRI ET
AL., 1969]; and the average is 4,000 mg/kg [MEF, 2001] for oral acute toxicity. The dermal
LD50 is over 10,000 mg/kg and by inhalation, an LC50 from 79 – 139 mg/L [MASTRI ET AL.,
1969; ARCO, 1980] with an average of approximately 100 mg/L [MEF, 2001] has been
determined. MTBE can be considered a skin irritant but at low air concentrations, studies in
human volunteers have shown no signs of eye irritation. The results from the study in mouse
or the experience in human volunteers do not give reason to classify MTBE as respiratory
irritant. Based on the available information, MTBE cannot be considered a mutagen. MTBE
produces tumours in mice and rats at doses > 11,000 mg/m³ [BIRD ET AL., 1997; MEF, 2001]
after inhalation exposure. Tumours have been reported in rats at oral doses > 250 mg/kg
[BELPOGGI ET AL., 1995]. There is no evidence of a direct genotoxic mode of action. There are
indications of carcinogenicity in two species.The tumours appear mostly at very high doses,
and MTBE is not genotoxic in vitro or in vivo. On the other hand, the human relevance of the
tumors observed cannot be neglected. MTBE does not cause significant toxicity to repro-
duction in rats. Based on the available data, MTBE is not considered to be toxic to foetal
development [MEF, 2001]. For the determination of the maximum MTBE concentration
allowed for workers in Germany, the cancerogenity and mutagenity of MTBE were assigned
to the categories 3 B and group C, respectively [SENATSKOMMISSION, 2000]. These categories
imply that more research is needed for a final evaluation. The Health Authorities of the city of
Hamburg, Germany, concluded that relations between MTBE use and the occurrence of
cancer have not been observed and it has been used for medical purposes for approximately
20 years [TESSERAUX AND KOSS, 1999].
It does not appear that the concentrations of MTBE in ambient water are toxic to aquatic
organisms except during spills. Although there are no data on the terrestrial toxicity of
MTBE, this appears not to be of concern since concentrations in ambient air are low and its
half-life time is relatively short [WHO, 1998]. The SCIENTIFIC COMMITTEE ON TOXICITY,
ECOTOXICITY AND THE ENVIRONMENT OF THE EUROPEAN COMMISSION [CSTEE, 2001]
concluded that, in spite of its relatively low toxicity, MTBE is a chemical of concern due to
its high production volume and relatively high persistence. MEHLMANN [2000 and 2001] drew
attention to the possible misclassification of MTBE concerning its carcinogenic activity. In
2 Synthesis, Properties of MTBE and its Behavior in the Environment
41
1998, at a U.S. meeting of the NATIONAL TOXICOLOGY PROGRAM’S (NTP) BOARD OF
SCIENTIFIC COUNSELORS, data were presented showing that exposure of MTBE caused
carcinogenic effects in mice. Despite this evidence, the NTP Board defeated a motion to list
MTBE as „reasonably anticipated to be a human carcinogen“ by a vote of 6 to 5. Good public
health policy dictates that the Board conducts another review of MTBE with proper
consideration of the criteria that have been established for listing agents as carcinogens. A
detailed summary of the toxicity of MTBE and TBA is given as part of the risk assessment of
MTBE performed by the MINISTRY OF THE ENVIRONMENT FINLAND [MEF, 2001]. They
concluded that as far as human health is concerned, risks for consumers are not expected and
risk reduction measure already being applied are considered sufficient.
A recent study indicate that ambient MTBE concentrations documented in U.S. surface waters
to date do not constitute a risk to aquatic organisms [MANCINI ET AL., 2002]
Toxicological data of other oxygenates like ethyl tert-butyl ether (ETBE), tert-amyl methyl
ether (TAME) and di-isopropyl ether (DIPE) are insufficient.
2.5 Emission Pathways into the Aquatic Environment
Detectable MTBE concentrations in the aquatic environment can result from different
emission pathways (Figure 2-4). There are point and non-point sources of the oxygenate
affecting surface- and groundwater quality. Point source emissions like spills of MTBE into
soil evaporate into air and solve into precipitation or can be transported without significant
retardation into groundwater. As most MTBE is used as oxygenate, the main contributors of
MTBE releases into the subsurface environment of soil and groundwater are leakage from
underground storage tanks (LUSTs), pipelines, and spills at refueling facilities. High MTBE
concentrations up to the mg/L range can be emitted from these point-source emissions into
groundwater. They are not subject of this study and more information about MTBE in
groundwater is summarized elsewhere [PAHLKE ET AL., 2000; SCHOLZ, 2001; BRAUCH ET AL.,
2000A; MEF, 2001]. The gasoline component has also been detected in heating oil and diesel
fuel up to 60 mg/L [ROBBINS ET AL., 1999; CUMMINS ET AL., 2001]. The occurrence of MTBE
in the atmosphere is primarily a result of evaporative emissions and incomplete combustion
(e.g. from highways, gasoline stations, parking garages, refineries, or chemical industry)
[SQUILLACE ET AL., 1997A]. It is generally removed from the atmosphere by chemical
degradation or by transfer into the aquatic environment via precipiation. Particularly in urban
areas, precipitation falls onto roads or sealed areas close to vehicle traffic (e.g. ditches) where

2 Synthesis, Properties of MTBE and its Behavior in the Environment .
42
Ground water contam ination with MTBE and hydrocarbons (HC)
Spills and leaking s torage tanks
MTBE-Em issions fromindustry, filling s tationsand vehicles
Precipitation
Overland runoff
HCHC MTBE MTBE MTBE
Johann W olf gang Goethe-Univ ersityF rankf urt 1999
HC
Figure 2-4 Emission pathways of methyl tert-butyl ether (MTBE) into the environment.
2 Synthesis, Properties of MTBE and its Behavior in the Environment .
43
it is enriched in MTBE due to vehicle emissions (e.g. incomplete combustion, leakage from
engines). Urban runoff is collected by culverts, concrete pipes, lined ditches or channels and
is transported to sewage plants where it is mixed by industrial effluents containing MTBE.
After the reduction of aqueous MTBE concentrations in the sewage plants mainly due to
evaporation (43.1 %) [MEF, 2001], it is released (56.8 %) [MEF, 2001] into river water.
Finally, direct emissions into river and lake water from motor water craft (e.g. jet skis, two-
stroke engines) [REUTER ET AL., 1998; GABELE AND PYLE, 2000], spills from ships
transporting and refuelling oxygenated gasoline and effluents from chemical industry also
contribute to the MTBE load in surface water. Groundwater contaminated with MTBE
dewatering into rivers represents an additional emission source but it has not yet been
investigated. The oxygenate is frequently detected in the aquatic environment because large
amounts of water can be contaminated: 1 mL of oxygenated gasoline containing 10 % of
MTBE mixed with 4000 L of water will yield 20 µg/L of MTBE in water [SQUILLACE ET AL,
1997].
2.6 Behavior in the Environment
MTBE tends to partition strongly from the gas phase into the water phase if contaminated air
is brought into contact with uncontaminated water. Hence, atmospheric emissions of the ether
partition into atmospheric water, including precipitation. However, washout of gas-phase
MTBE by precipitation would not, by itself, greatly alter the gas-phase concentration of the
compound in air; 2.5 cm of precipitation will remove less than 0.5 % of the MTBE in the air
(at 20 °C) [ZOGORSKI ET AL., 1997] The partitioning of MTBE to precipitation is nevertheless
strong enough to allow for up to 3 µg/L or more inputs of the ether to surface and
groundwater (at 10 % MTBE use in gasoline) [SQUILLACE ET AL., 1996]. The low value for
the dimensionless Henry’s Law constant indicates that once MTBE is solved into water, it
tends to stay in the aqueous phase and is difficult to remove by aeration. Even at very small
oxygenated gasoline spills into the subsurface (e.g. from gasoline containing 10 % of MTBE
in the tank of a single overturned automobile) [JOHNSON ET AL., 2000], MTBE plumes in
groundwater can reach kilometers of lenghts in comparison to benzene plume lengths of tens
to hundreds of meters. High water solubility, practically no adsorption to subsurface solids
and very poor degradability of MTBE are responsible for this behavior. In rivers, travel
distances of MTBE for half-life times range from 0.8 km for shallow and fast moving streams
to more than 900 km for deep and slow moving rivers [PANKOW ET AL., 1996]. In deep and

2 Synthesis, Properties of MTBE and its Behavior in the Environment .
44
slow moving flows, MTBE volatilizes at rates similar to those for the BTEX compounds. In
shallow and fast moving flows, it volatilizes at rates that are significantly lower than those for
BTEX. MTBE does not concentrate in water or air but under non-equilibrium conditions, as
mostly occur in the natural environment, it will move between air and water, leading to
increasing or decreasing concentrations of the oxygenate in the compartments until
equilibrium is established. The behavior and fate of MTBE in the environment is summarized
by SQUILLACE ET AL. [1997A].
2.7 Comparison to Other Oxygenates
From the compounds that are classified into the group of oxygenates, MTBE is most
important. However, there are few others and some of them are used in other countries. The
second most-used fuel oxygenate is ethanol. The commercial use of the others including ethyl
tert-butyl ether (ETBE), tert-amyl methyl ether (TAME), methanol and di-isopropyl ether
OCH2
CH3CH3
CH3CH3
Tert-amyl methyl ether (TAME)
Ethyl tert-butyl ether (ETBE)
CHO
CHCH3
CH3
CH3
CH3
Di-isopropyl ether (DIPE)
CH3
CH2
OH
Ethanol
CH3 OH
Methanol
OCH3
CH2
CH3CH3CH3
Figure 2-5 Stuctures of the oxygenates ethyl tert-butyl ether (ETBE), tert-amyl methyl ether
(TAME), di-isopropyl ether (DIPE), ethanol and methanol.
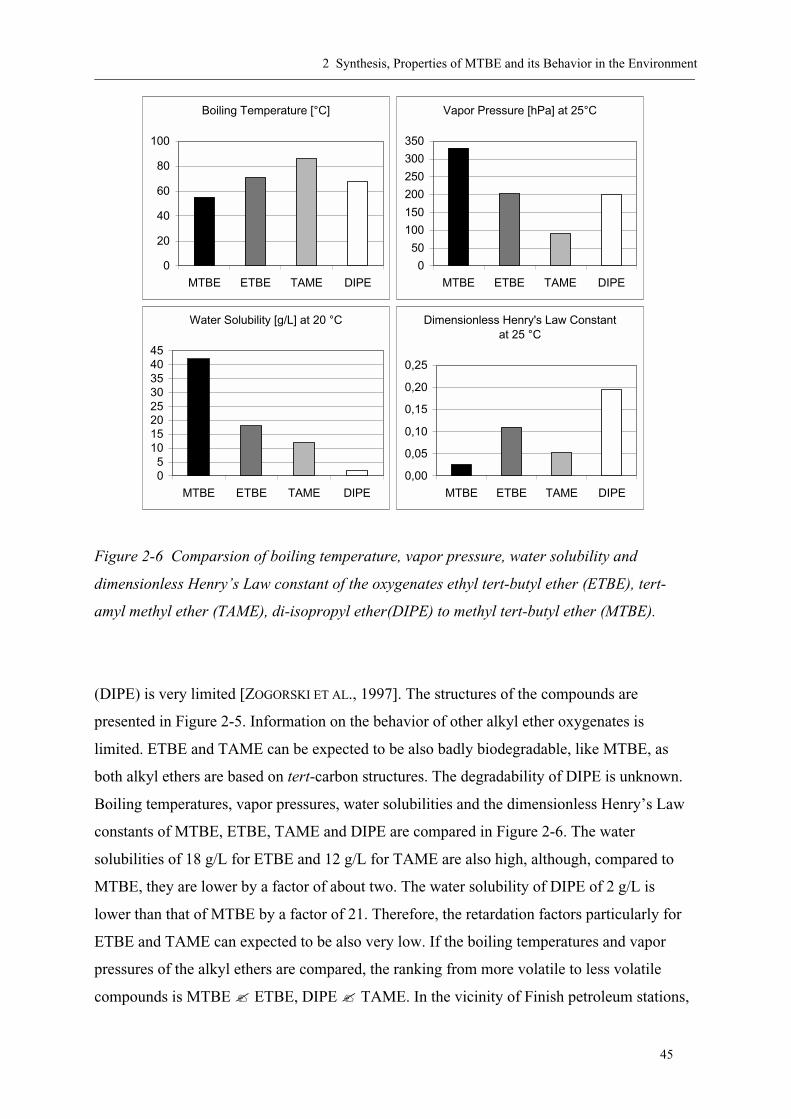
2 Synthesis, Properties of MTBE and its Behavior in the Environment .
45
Boiling Temperature [°C]
0
20
40
60
80
100
MTBE ETBE TAME DIPE
Water Solubility [g/L] at 20 °C
05
1015202530354045
MTBE ETBE TAME DIPE
Vapor Pressure [hPa] at 25°C
0
50
100
150
200
250
300
350
MTBE ETBE TAME DIPE
Dimensionless Henry's Law Constantat 25 °C
0,00
0,05
0,10
0,15
0,20
0,25
MTBE ETBE TAME DIPE
Figure 2-6 Comparsion of boiling temperature, vapor pressure, water solubility and
dimensionless Henry’s Law constant of the oxygenates ethyl tert-butyl ether (ETBE), tert-
amyl methyl ether (TAME), di-isopropyl ether(DIPE) to methyl tert-butyl ether (MTBE).
(DIPE) is very limited [ZOGORSKI ET AL., 1997]. The structures of the compounds are
presented in Figure 2-5. Information on the behavior of other alkyl ether oxygenates is
limited. ETBE and TAME can be expected to be also badly biodegradable, like MTBE, as
both alkyl ethers are based on tert-carbon structures. The degradability of DIPE is unknown.
Boiling temperatures, vapor pressures, water solubilities and the dimensionless Henry’s Law
constants of MTBE, ETBE, TAME and DIPE are compared in Figure 2-6. The water
solubilities of 18 g/L for ETBE and 12 g/L for TAME are also high, although, compared to
MTBE, they are lower by a factor of about two. The water solubility of DIPE of 2 g/L is
lower than that of MTBE by a factor of 21. Therefore, the retardation factors particularly for
ETBE and TAME can expected to be also very low. If the boiling temperatures and vapor
pressures of the alkyl ethers are compared, the ranking from more volatile to less volatile
compounds is MTBE ! ETBE, DIPE ! TAME. In the vicinity of Finish petroleum stations,
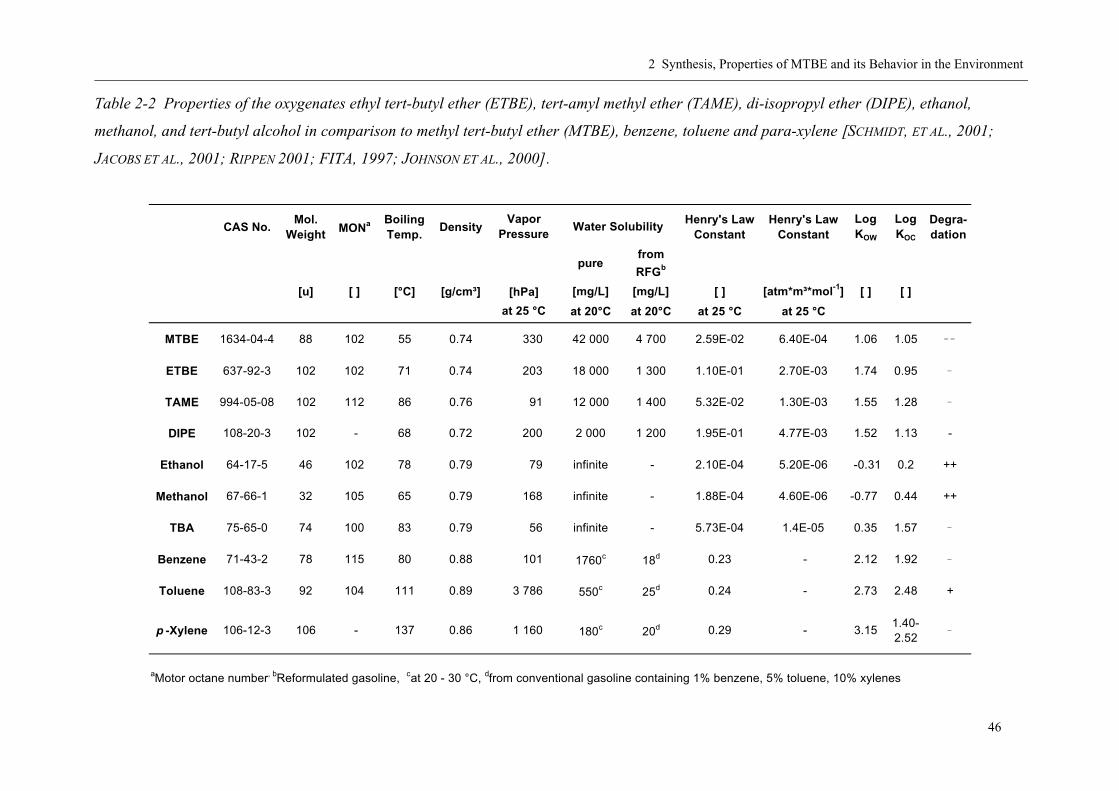
2 Synthesis, Properties of MTBE and its Behavior in the Environment.
46
Table 2-2 Properties of the oxygenates ethyl tert-butyl ether (ETBE), tert-amyl methyl ether (TAME), di-isopropyl ether (DIPE), ethanol,
methanol, and tert-butyl alcohol in comparison to methyl tert-butyl ether (MTBE), benzene, toluene and para-xylene [SCHMIDT, ET AL., 2001;
JACOBS ET AL., 2001; RIPPEN 2001; FITA, 1997; JOHNSON ET AL., 2000].
CAS No.Mol.
Weight MONa Boiling Temp.
DensityHenry's Law
ConstantHenry's Law
ConstantLog KOW
Log KOC
Degra-dation
from
RFGb
[u] [ ] [°C] [g/cm³] [mg/L] [mg/L] [ ] [atm*m³*mol-1] [ ] [ ]
at 20°C at 20°C at 25 °C at 25 °C
MTBE 1634-04-4 88 102 55 0.74 330 42 000 4 700 2.59E-02 6.40E-04 1.06 1.05 _ _
ETBE 637-92-3 102 102 71 0.74 203 18 000 1 300 1.10E-01 2.70E-03 1.74 0.95 _
TAME 994-05-08 102 112 86 0.76 91 12 000 1 400 5.32E-02 1.30E-03 1.55 1.28 _
DIPE 108-20-3 102 - 68 0.72 200 2 000 1 200 1.95E-01 4.77E-03 1.52 1.13 -
Ethanol 64-17-5 46 102 78 0.79 79 infinite - 2.10E-04 5.20E-06 -0.31 0.2 ++
Methanol 67-66-1 32 105 65 0.79 168 infinite - 1.88E-04 4.60E-06 -0.77 0.44 ++
TBA 75-65-0 74 100 83 0.79 56 infinite - 5.73E-04 1.4E-05 0.35 1.57 _
Benzene 71-43-2 78 115 80 0.88 101 1760c 18d 0.23 - 2.12 1.92 _
Toluene 108-83-3 92 104 111 0.89 3 786 550c 25d 0.24 - 2.73 2.48 +
p -Xylene 106-12-3 106 - 137 0.86 1 160 180c 20d 0.29 - 3.151.40-2.52
_
Vapor Pressure
[hPa]
aMotor octane number, bReformulated gasoline, cat 20 - 30 °C, dfrom conventional gasoline containing 1% benzene, 5% toluene, 10% xylenes
at 25 °C
Water Solubility
pure
2 Synthesis, Properties of MTBE and its Behavior in the Environment
47
TAME (8.5 % in gasoline) concentrations in the air were reported to be lower by a factor of
about 1.5 – 2 compared to atmospheric MTBE (2.7 % in gasoline) concentrations
[VAINIOTALO ET AL., 1999]. Generally, TAME is characterized by volatilization possibly less
than MTBE at a factor of about five, leading to lower environmental TAME concentrations.
From the boiling temperatures and vapor pressures of ETBE and DIPE it could be concluded
that both volatilize less than MTBE at a factor of may be 2.5. The dimensionsless Henry’s
Law constants of the alkyl ethers show a ranking of the preferred partitioning into water
(compared to air) of MTBE ! TAME ! ETBE ! DIPE. From the comparison of the ethers,
it can be concluded that MTBE shows the most unfavorable properties for the environment al
impact compared to the others. However, if all alkyl ether were used at the same amounts in
gasoline, the environmental concentrations of ETBE, TAME and DIPE were lower compared
to MTBE, but not significantly. The expected half-life times of the alkyl ethers in air are
similar to MTBE [ZOGORSKI ET AL., 1997]. The properties of the oxygenates are shown in
Table 2-2.
Ethanol is the favorite oxygenate that will probably substitute MTBE in the future, at least in
the U.S.. Unfortunately, the hygroscopic nature of ethanol-blended gasoline prevents its
preparation at the refineries and distribution by pipelines. Distribution terminal receive
gasoline and ethanol separately and both are mixed when they are pumped into a tanker truck
for the delivery. Ethanol is, somewhat, comparable to MTBE. It is very good water and
gasoline soluble, has a very low tendency to adsorb to mineral surfaces or volatilize from the
aqueous phase. The main difference between both organics is ethanol’s high degree of
biodegradabilty under aerobic and anaerobic conditions. However, it can create a cosolvent
effect, and the biodegradation of the „microbial candy“ can deplete the groundwater of
nutrients and electron acceptors necessary for the degradation of other gasoline components
that are less attractive to microorganisms like the carcinogenic benzene. Downstream of
spills, the cosolvent effect of ethanol could lead to very high concentrations of the alcohol in
groundwater and a much more significant - possibly an order of a magnitude- increase in
concentrations of benzene, toluene, ethylbenzene and xylenes (BTEX). The impact of ethanol
on more hydrophobic gasoline components is not known at this time. Ethanol is well
degraded both, under aerobic and unaerobic conditions without any known toxic degradation
by-products, although it seems difficult to ensure this for degradation products of other
mechanisms induced by the presence of the alcohol. As the degradation requires a high
oxygen demand, ethanol is likely to be degraded mainly und anaerobic conditions [POWERS ET
2 Synthesis, Properties of MTBE and its Behavior in the Environment
48
AL., 2001]. The results of various modelings of spills of ethanol blended gasoline indicate that
benzene will cover longest travel distances in a plume. Gasoline with ethanol also raised some
air quality concerns because incomplete combustion of the alcohol produces acetaldehyde, a
hazardous air pollutant [HOGUE, 2000]. An amount of only 2 % (w/w) of ethanol in gasoline
compared to fuel containing 5 % (v/v) of MTBE can increase acetaldehyde concentrations in
the emissions by 80 – 100 %, part of which undergoes photochemical reactions in the
atmosphere to make peroxyacetyl nitrate (PAN). On the other hand, decreases of 16 % in CO
and 28 % in formaldehyde emissions also resulted from the ethanol use compared to the
MTBE use [SCHIFTER ET AL., 2001].
An increased use of tert-butyl alcohol as oxygenate is not favorable as it is a known human
carcinogen [CIRVELLO ET AL., 1995].
The relative trends favor ethanol and not MTBE when considering risks associated with
oxygenated gasoline spills. The use of ethanol seems to lead to less problems but more
research is needed.
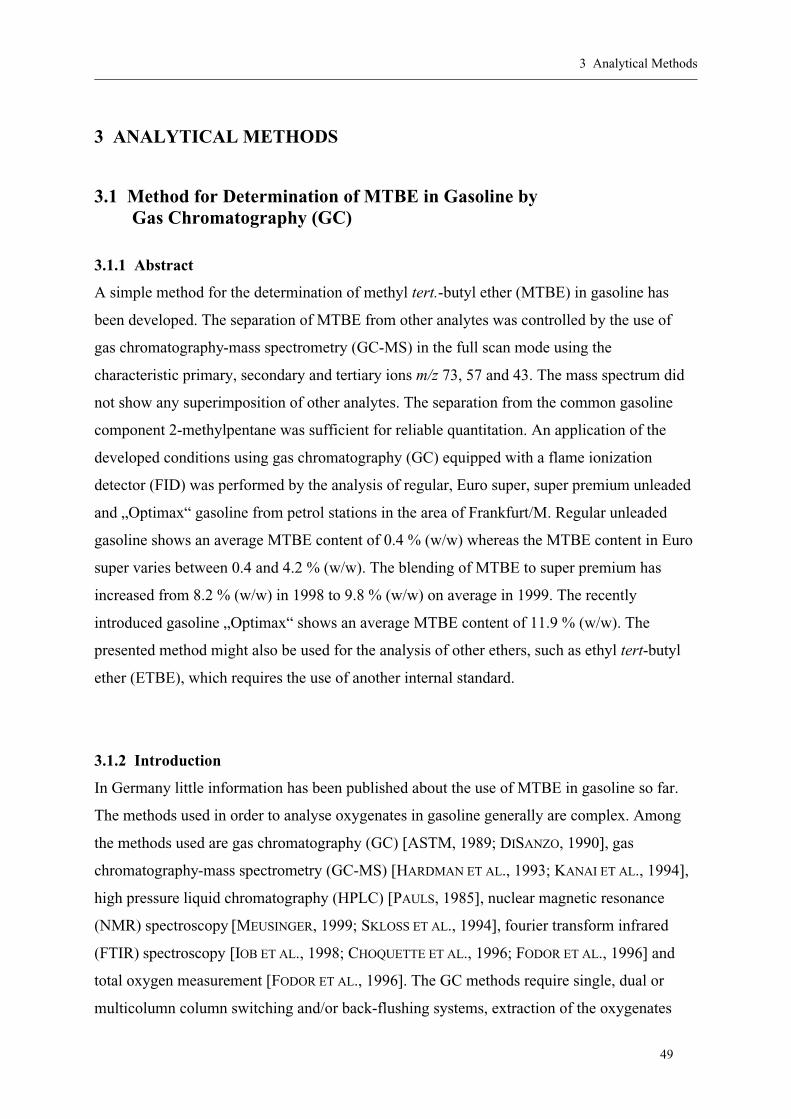
3 Analytical Methods
49
3 ANALYTICAL METHODS
3.1 Method for Determination of MTBE in Gasoline by Gas Chromatography (GC)
3.1.1 Abstract
A simple method for the determination of methyl tert.-butyl ether (MTBE) in gasoline has
been developed. The separation of MTBE from other analytes was controlled by the use of
gas chromatography-mass spectrometry (GC-MS) in the full scan mode using the
characteristic primary, secondary and tertiary ions m/z 73, 57 and 43. The mass spectrum did
not show any superimposition of other analytes. The separation from the common gasoline
component 2-methylpentane was sufficient for reliable quantitation. An application of the
developed conditions using gas chromatography (GC) equipped with a flame ionization
detector (FID) was performed by the analysis of regular, Euro super, super premium unleaded
and „Optimax“ gasoline from petrol stations in the area of Frankfurt/M. Regular unleaded
gasoline shows an average MTBE content of 0.4 % (w/w) whereas the MTBE content in Euro
super varies between 0.4 and 4.2 % (w/w). The blending of MTBE to super premium has
increased from 8.2 % (w/w) in 1998 to 9.8 % (w/w) on average in 1999. The recently
introduced gasoline „Optimax“ shows an average MTBE content of 11.9 % (w/w). The
presented method might also be used for the analysis of other ethers, such as ethyl tert-butyl
ether (ETBE), which requires the use of another internal standard.
3.1.2 Introduction
In Germany little information has been published about the use of MTBE in gasoline so far.
The methods used in order to analyse oxygenates in gasoline generally are complex. Among
the methods used are gas chromatography (GC) [ASTM, 1989; DISANZO, 1990], gas
chromatography-mass spectrometry (GC-MS) [HARDMAN ET AL., 1993; KANAI ET AL., 1994],
high pressure liquid chromatography (HPLC) [PAULS, 1985], nuclear magnetic resonance
(NMR) spectroscopy [MEUSINGER, 1999; SKLOSS ET AL., 1994], fourier transform infrared
(FTIR) spectroscopy [IOB ET AL., 1998; CHOQUETTE ET AL., 1996; FODOR ET AL., 1996] and
total oxygen measurement [FODOR ET AL., 1996]. The GC methods require single, dual or
multicolumn column switching and/or back-flushing systems, extraction of the oxygenates
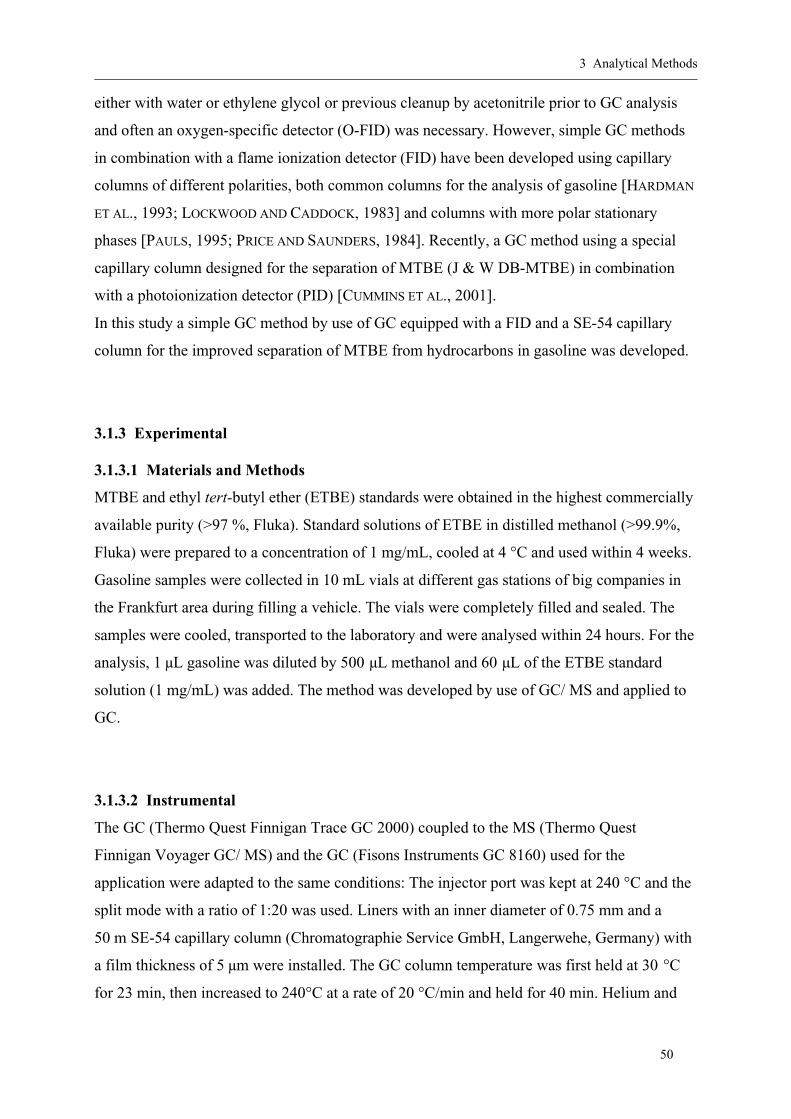
3 Analytical Methods
50
either with water or ethylene glycol or previous cleanup by acetonitrile prior to GC analysis
and often an oxygen-specific detector (O-FID) was necessary. However, simple GC methods
in combination with a flame ionization detector (FID) have been developed using capillary
columns of different polarities, both common columns for the analysis of gasoline [HARDMAN
ET AL., 1993; LOCKWOOD AND CADDOCK, 1983] and columns with more polar stationary
phases [PAULS, 1995; PRICE AND SAUNDERS, 1984]. Recently, a GC method using a special
capillary column designed for the separation of MTBE (J & W DB-MTBE) in combination
with a photoionization detector (PID) [CUMMINS ET AL., 2001].
In this study a simple GC method by use of GC equipped with a FID and a SE-54 capillary
column for the improved separation of MTBE from hydrocarbons in gasoline was developed.
3.1.3 Experimental 3.1.3.1 Materials and Methods
MTBE and ethyl tert-butyl ether (ETBE) standards were obtained in the highest commercially
available purity (>97 %, Fluka). Standard solutions of ETBE in distilled methanol (>99.9%,
Fluka) were prepared to a concentration of 1 mg/mL, cooled at 4 °C and used within 4 weeks.
Gasoline samples were collected in 10 mL vials at different gas stations of big companies in
the Frankfurt area during filling a vehicle. The vials were completely filled and sealed. The
samples were cooled, transported to the laboratory and were analysed within 24 hours. For the
analysis, 1 µL gasoline was diluted by 500 µL methanol and 60 µL of the ETBE standard
solution (1 mg/mL) was added. The method was developed by use of GC/ MS and applied to
GC.
3.1.3.2 Instrumental
The GC (Thermo Quest Finnigan Trace GC 2000) coupled to the MS (Thermo Quest
Finnigan Voyager GC/ MS) and the GC (Fisons Instruments GC 8160) used for the
application were adapted to the same conditions: The injector port was kept at 240 °C and the
split mode with a ratio of 1:20 was used. Liners with an inner diameter of 0.75 mm and a
50 m SE-54 capillary column (Chromatographie Service GmbH, Langerwehe, Germany) with
a film thickness of 5 µm were installed. The GC column temperature was first held at 30 °C
for 23 min, then increased to 240°C at a rate of 20 °C/min and held for 40 min. Helium and
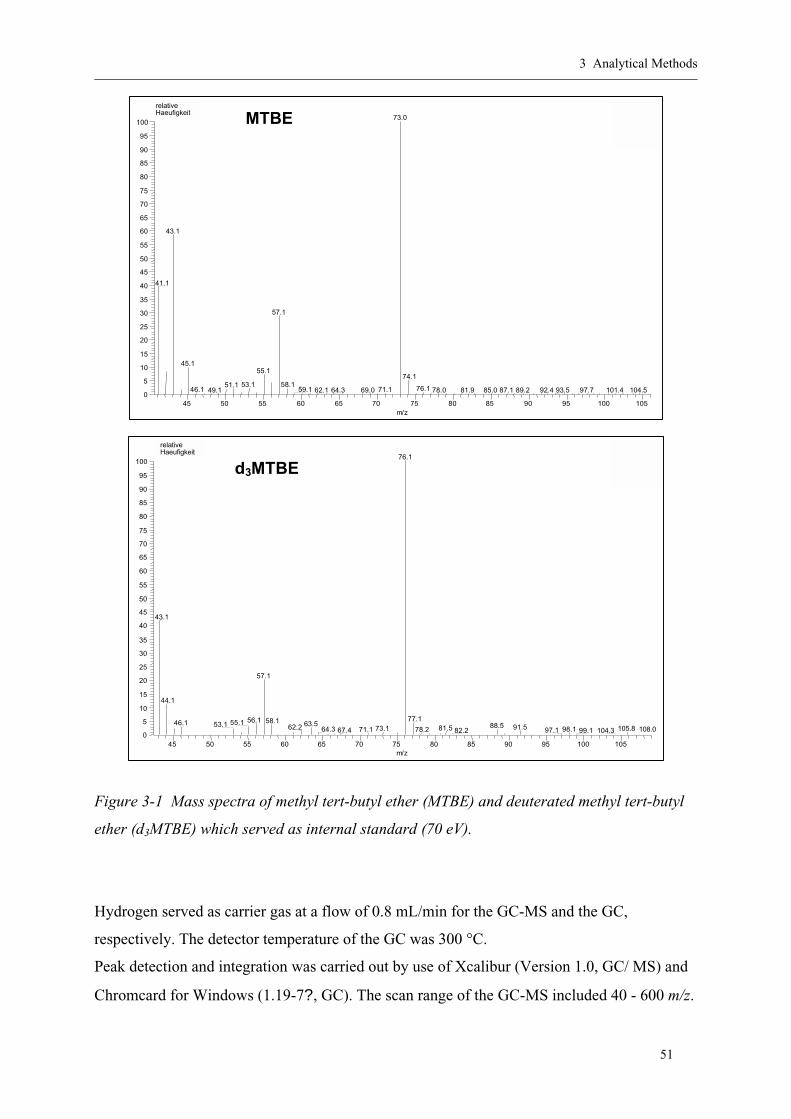
3 Analytical Methods
51
45 50 55 60 65 70 75 80 85 90 95 100 105m/z
0
5
10
15
20
25
30
35
40
45
50
55
60
65
70
75
80
85
90
95
10073.0
43.1
41.1
57.1
45.155.1
74.153.1 58.151.1 76.159.146.1 71.149.1 85.062.1 69.0 89.278.0 92.464.3 101.481.9 93.5 104.597.787.1
relativeHaeufigkeit MTBE
45 50 55 60 65 70 75 80 85 90 95 100 105m/z
0
5
10
15
20
25
30
35
40
45
50
55
60
65
70
75
80
85
90
95
10076.1
43.1
57.1
44.1
77.156.1 58.155.146.1 63.553.1 88.562.2 91.581.573.1 105.864.3 98.1 108.078.271.1 97.167.4 82.2 104.399.1
relativeHaeufigkeit
d3MTBE
Figure 3-1 Mass spectra of methyl tert-butyl ether (MTBE) and deuterated methyl tert-butyl
ether (d3MTBE) which served as internal standard (70 eV).
Hydrogen served as carrier gas at a flow of 0.8 mL/min for the GC-MS and the GC,
respectively. The detector temperature of the GC was 300 °C.
Peak detection and integration was carried out by use of Xcalibur (Version 1.0, GC/ MS) and
Chromcard for Windows (1.19-7?, GC). The scan range of the GC-MS included 40 - 600 m/z.
3 Analytical Methods
52
The mass spectrometer was tuned to optimize signals from 40 - 125 m/z. MTBE standards
were used in order to determine the characteristic ions and the retention times used for
identification of MTBE in the gasoline samples. Mass chromatography of m/z 73, m/z 57 and
m/z 43 in full scan mode was used for qualifying MTBE. Mass spectra of MTBE and
d3MTBE are shown in Figure 3-1. The MTBE signals could be checked with respect to
superimposition by other compounds, especially by 2-methyl pentane, since the analyses were
carried out in the full scan mode. ETBE served as internal standard for quantitation of
gasoline samples analysed by the GC.
3.1.4 Results and Discussion
The GC method was developed by choosing an appropriate capillary column, liner and
internal standard for the analysis from the literature. The carrier gas flow, split ratio and oven
temperature program were adjusted in order to provide an optimal separation of MTBE from
other analytes. It is known that particularly 2-methyl pentane, which is a common compound
in gasoline tends to superimposition with MTBE. By use of a GC equipped with an O-FID
detector system the alkanes are not detected and a clean MTBE peak can be quantified.
However, in the present case a GC method for the analysis of MTBE in combination with the
very common and versatile FID detector is described. Complex back-flushing and column
switching systems are not required.
Amongst the common capillary columns used for the analysis of gasoline [HARDMAN ET AL.,
1993; LOCKWOOD AND CADDOCK, 1983] a SE-54 (94% methyl silicone gum, 5% phenyl and
1% vinyl) was preferred to a 100% dimethyl silicone gum stationary phase because MTBE
tends to superimposition with 2,3-dimethyl butane by use of the latter. The retention window
between 2- and 3-methyl pentane was chosen for the elution of MTBE due to the absence of
superimposition with other hydrocarbons from gasoline. The method was established using
GC/ MS in the full scan mode. The identification and quality of the separation of MTBE was
controlled by use of its primary, secondary and tertiary ions m/z 73, 57 and 43, respectively.
The separation of MTBE from 2-methylpentane is not reached completely but to an
acceptable extent. Reasonably good separation was also reached by HARDMAN ET AL. [1993]
using helium as carrier gas and a low starting temperature of the GC oven (25 °C). In the
present study improvement of the analytical conditions was achieved by the use of hydrogen
instead of helium and an increase of the oven starting temperature to 30 °C. Additionally the
column length could be shortened from 60 m [HARDMAN ET AL., 1993] to 50 m. For the
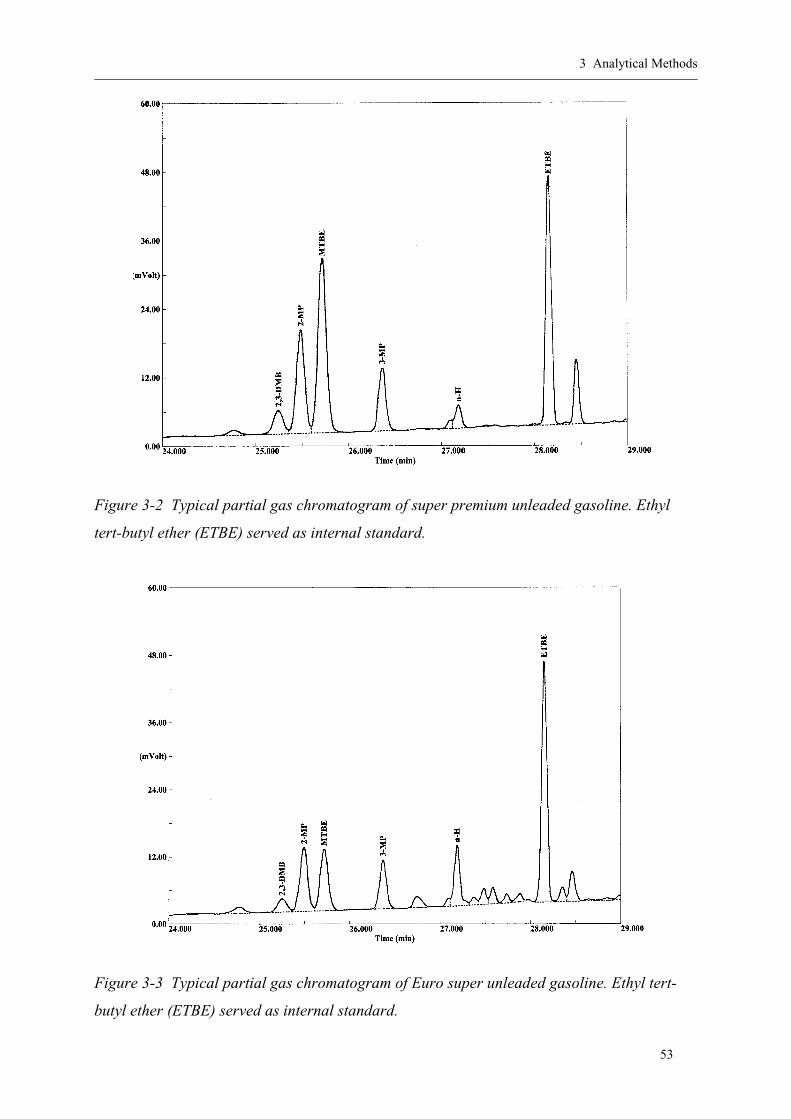
3 Analytical Methods
53
Figure 3-2 Typical partial gas chromatogram of super premium unleaded gasoline. Ethyl
tert-butyl ether (ETBE) served as internal standard.
Figure 3-3 Typical partial gas chromatogram of Euro super unleaded gasoline. Ethyl tert-
butyl ether (ETBE) served as internal standard.
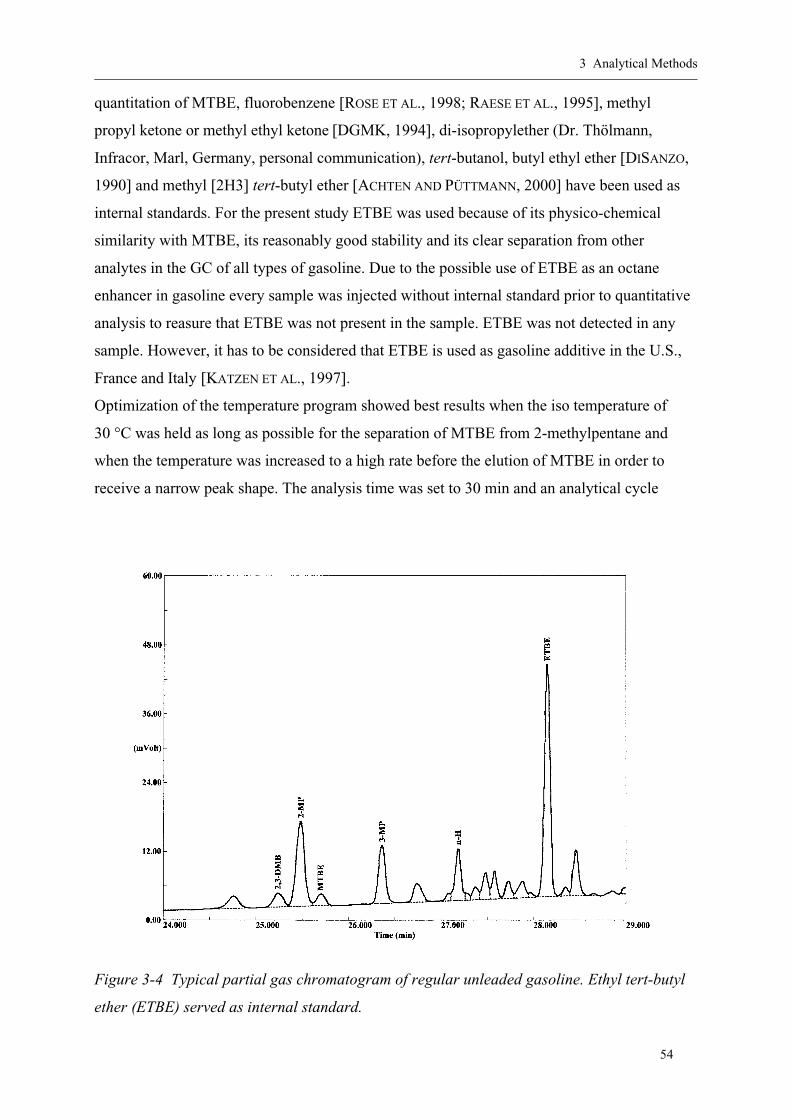
3 Analytical Methods
54
quantitation of MTBE, fluorobenzene [ROSE ET AL., 1998; RAESE ET AL., 1995], methyl
propyl ketone or methyl ethyl ketone [DGMK, 1994], di-isopropylether (Dr. Thölmann,
Infracor, Marl, Germany, personal communication), tert-butanol, butyl ethyl ether [DISANZO,
1990] and methyl [2H3] tert-butyl ether [ACHTEN AND PÜTTMANN, 2000] have been used as
internal standards. For the present study ETBE was used because of its physico-chemical
similarity with MTBE, its reasonably good stability and its clear separation from other
analytes in the GC of all types of gasoline. Due to the possible use of ETBE as an octane
enhancer in gasoline every sample was injected without internal standard prior to quantitative
analysis to reasure that ETBE was not present in the sample. ETBE was not detected in any
sample. However, it has to be considered that ETBE is used as gasoline additive in the U.S.,
France and Italy [KATZEN ET AL., 1997].
Optimization of the temperature program showed best results when the iso temperature of
30 °C was held as long as possible for the separation of MTBE from 2-methylpentane and
when the temperature was increased to a high rate before the elution of MTBE in order to
receive a narrow peak shape. The analysis time was set to 30 min and an analytical cycle
Figure 3-4 Typical partial gas chromatogram of regular unleaded gasoline. Ethyl tert-butyl
ether (ETBE) served as internal standard.
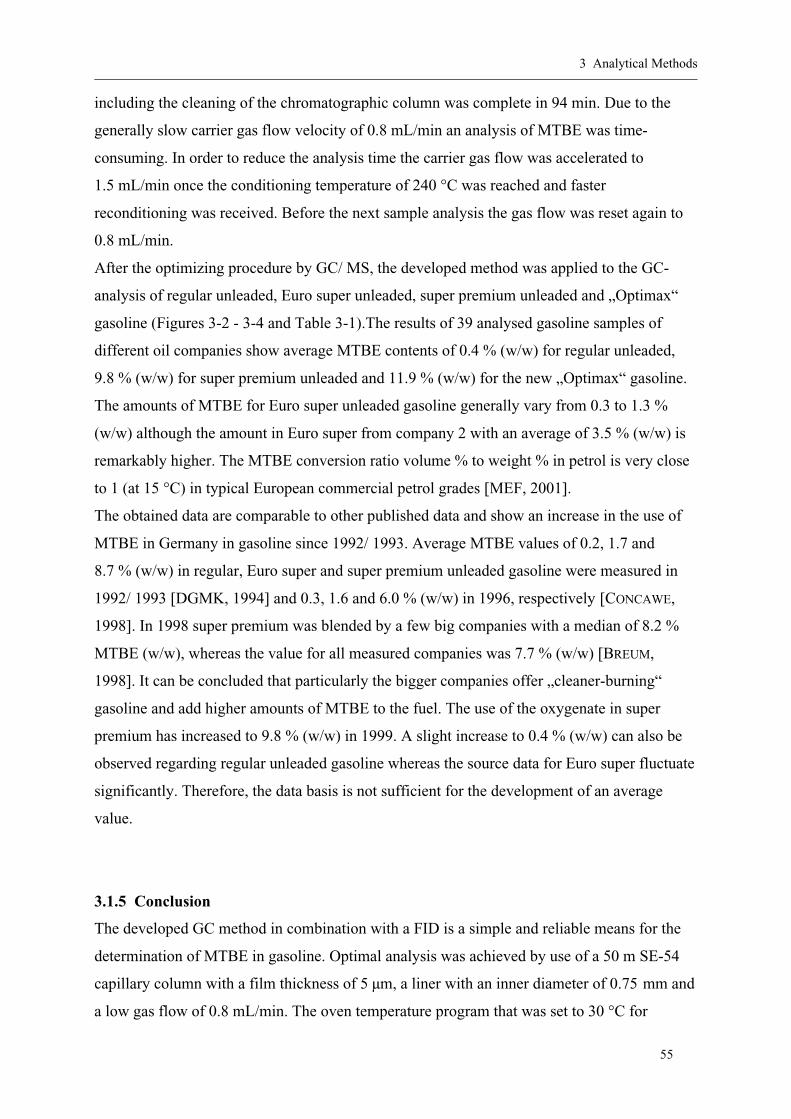
3 Analytical Methods
55
including the cleaning of the chromatographic column was complete in 94 min. Due to the
generally slow carrier gas flow velocity of 0.8 mL/min an analysis of MTBE was time-
consuming. In order to reduce the analysis time the carrier gas flow was accelerated to
1.5 mL/min once the conditioning temperature of 240 °C was reached and faster
reconditioning was received. Before the next sample analysis the gas flow was reset again to
0.8 mL/min.
After the optimizing procedure by GC/ MS, the developed method was applied to the GC-
analysis of regular unleaded, Euro super unleaded, super premium unleaded and „Optimax“
gasoline (Figures 3-2 - 3-4 and Table 3-1).The results of 39 analysed gasoline samples of
different oil companies show average MTBE contents of 0.4 % (w/w) for regular unleaded,
9.8 % (w/w) for super premium unleaded and 11.9 % (w/w) for the new „Optimax“ gasoline.
The amounts of MTBE for Euro super unleaded gasoline generally vary from 0.3 to 1.3 %
(w/w) although the amount in Euro super from company 2 with an average of 3.5 % (w/w) is
remarkably higher. The MTBE conversion ratio volume % to weight % in petrol is very close
to 1 (at 15 °C) in typical European commercial petrol grades [MEF, 2001].
The obtained data are comparable to other published data and show an increase in the use of
MTBE in Germany in gasoline since 1992/ 1993. Average MTBE values of 0.2, 1.7 and
8.7 % (w/w) in regular, Euro super and super premium unleaded gasoline were measured in
1992/ 1993 [DGMK, 1994] and 0.3, 1.6 and 6.0 % (w/w) in 1996, respectively [CONCAWE,
1998]. In 1998 super premium was blended by a few big companies with a median of 8.2 %
MTBE (w/w), whereas the value for all measured companies was 7.7 % (w/w) [BREUM,
1998]. It can be concluded that particularly the bigger companies offer „cleaner-burning“
gasoline and add higher amounts of MTBE to the fuel. The use of the oxygenate in super
premium has increased to 9.8 % (w/w) in 1999. A slight increase to 0.4 % (w/w) can also be
observed regarding regular unleaded gasoline whereas the source data for Euro super fluctuate
significantly. Therefore, the data basis is not sufficient for the development of an average
value.
3.1.5 Conclusion
The developed GC method in combination with a FID is a simple and reliable means for the
determination of MTBE in gasoline. Optimal analysis was achieved by use of a 50 m SE-54
capillary column with a film thickness of 5 µm, a liner with an inner diameter of 0.75 mm and
a low gas flow of 0.8 mL/min. The oven temperature program that was set to 30 °C for
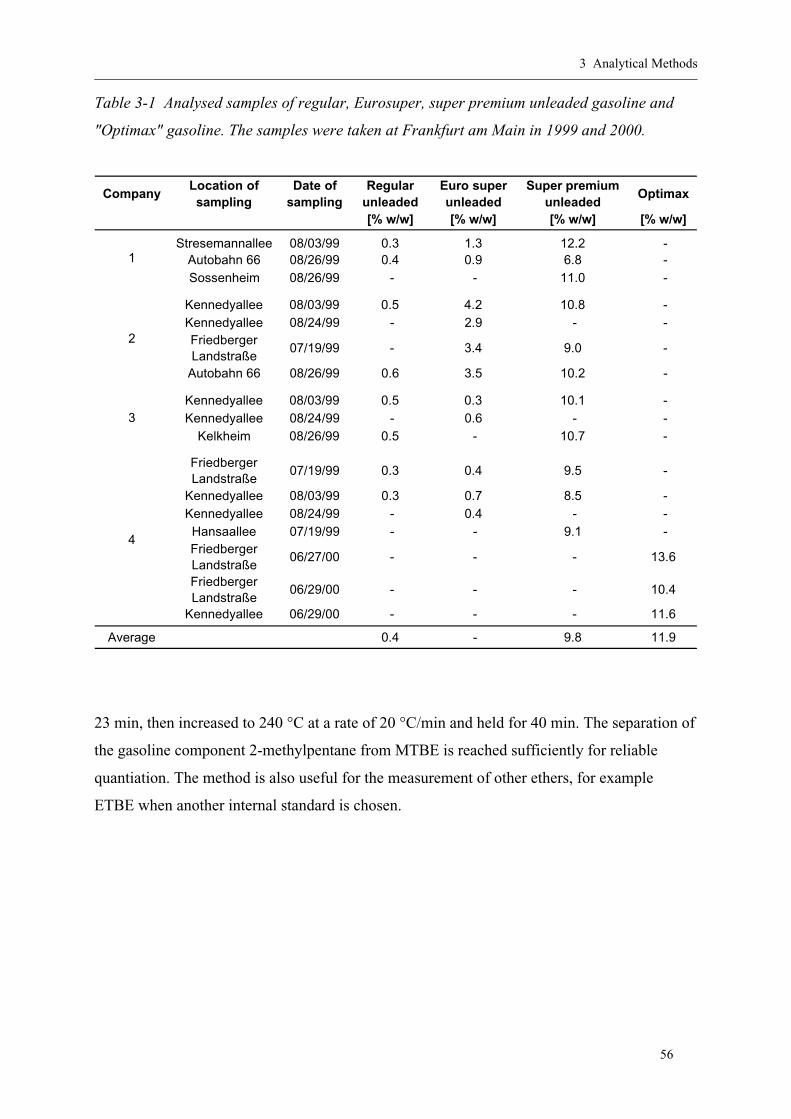
3 Analytical Methods
56
Table 3-1 Analysed samples of regular, Eurosuper, super premium unleaded gasoline and
"Optimax" gasoline. The samples were taken at Frankfurt am Main in 1999 and 2000.
CompanyLocation of sampling
Date of sampling
Regular unleaded
Euro super unleaded
Super premium unleaded
Optimax
[% w/w] [% w/w] [% w/w] [% w/w]
Stresemannallee 08/03/99 0.3 1.3 12.2 -Autobahn 66 08/26/99 0.4 0.9 6.8 -Sossenheim 08/26/99 - - 11.0 -
Kennedyallee 08/03/99 0.5 4.2 10.8 -Kennedyallee 08/24/99 - 2.9 - -Friedberger Landstraße
07/19/99 - 3.4 9.0 -
Autobahn 66 08/26/99 0.6 3.5 10.2 -
Kennedyallee 08/03/99 0.5 0.3 10.1 -Kennedyallee 08/24/99 - 0.6 - -
Kelkheim 08/26/99 0.5 - 10.7 -
Friedberger Landstraße
07/19/99 0.3 0.4 9.5 -
Kennedyallee 08/03/99 0.3 0.7 8.5 -Kennedyallee 08/24/99 - 0.4 - -Hansaallee 07/19/99 - - 9.1 -Friedberger Landstraße
06/27/00 - - - 13.6
Friedberger Landstraße
06/29/00 - - - 10.4
Kennedyallee 06/29/00 - - - 11.6
Average 0.4 - 9.8 11.9
4
1
3
2
23 min, then increased to 240 °C at a rate of 20 °C/min and held for 40 min. The separation of
the gasoline component 2-methylpentane from MTBE is reached sufficiently for reliable
quantiation. The method is also useful for the measurement of other ethers, for example
ETBE when another internal standard is chosen.
3 Analytical Methods
57
3.2 Determination of MTBE in Surface Water by Use of Direct Solid-Phase
Microextraction (SPME)/ Gas Chromatography - Mass Spectrometry (GC/ MS)
3.2.1 Abstract
A new method based on solid-phase microextraction (SPME) has been developed for the
determination of methyl tert-butyl ether (MTBE) in surface water at sub-ppb concentrations.
The combination of SPME and GC/ MS can be applied for the detection of MTBE at low
concentrations if limiting factors are optimized. Best results were obtained with a cooled
(5 °C) 75 µm poly(dimethylsiloxane)/ Carboxen (PDMS/ Carboxen) fiber at a sample
temperature of 18 - 19 °C and a sodium chloride concentration of 10 %. 60 min extraction
time showed the best compromise between time-consuming and effective extraction in a
1.5 mL vial filled with the water sample. The detection limit under the conditions of a defined
signal to noise ratio of 10:1 is 10 ng/L and the relative standard deviation for replicate
injections was 8 % (n = 10).
3.2.2 Introduction
The detection of the gasoline oxygenate methyl tert-butyl ether (MTBE) in the aquatic and
atmospheric environment has led to concern about its environmental fate due to the large
amounts that are now being produced in the United States. In Germany the use of MTBE as a
fuel additive also significantly increased since 1985. MTBE concentrations emitted from non-
point sources were detected in the United States in urban air [ZOGORSKI ET AL., 1998; POORE
ET AL., 1997; GROSJEAN ET AL., 1998], stormwater [DELZER ET AL., 1996; LOPES AND
BENDER, 1998], streams [ZOGORSKI ET AL., 1998; REISER AND O’BRIEN, 1998], lakes that are
significantly loaded with recreational watercraft [BOUGHTON AND LICO, 1997; REUTER ET AL.,
1998; BAEHR AND ZAPECZA, 1998] and shallow urban groundwater [SQUILLACE ET AL., 1995,
1996, 1997A,B AND 1999; DALY AND LINDSEY, 1996; STACKELBERG ET AL., 1997;
LANDMEYER ET AL., 1996].
Common analytical methods using purge-and-trap or direct aqueous injection (DAI) were
reported not to detect less than 60 ng/L (reporting level 200 ng/L), 83 ng/L and 50 ng/L of
MTBE respectively [RAESE ET AL., 1995; ROSE ET AL., 1998; CHURCH ET AL. 1997]. These
methods could not be applied for the analysis of MTBE in surface waters in Germany due to
its currently low concentration. A DAI method by ZWANK ET AL. [2002] is in preparation. A
3 Analytical Methods
58
detailed summary of the methods used for MTBE analysis in water is given by SCHMIDT ET
AL. [2001]. The present study describes the development of a method for analysis of MTBE in
water samples at a lower detection limit. The method is based on solid-phase microextraction
(SPME) [NILSSON ET AL., 1998; THOMAS ET AL., 1996; CZERWINSKI ET AL., 1996; HEGLUND
AND TILOTTA, 1996] in combination with gas chromatography coupled to mass spectrometry
(GC/ MS).
3.2.3 Experimental Section
3.2.3.1 Materials and Methods
Standards were made from 10,000 µg/L stock solutions containing MTBE or isotopically
labeled MTBE (MTBd3E). Each compound was obtained in the highest commercially
available purity (>97 %, Fluka). The standard solutions were cooled at 4 °C and used within
4 weeks. SPME was performed with a SPME manual sampling holder equipped with a 75 µm
poly(dimethylsiloxane)/ Carboxen (PDMS/ Carboxen) fiber, a 65 µm poly(dimethyl-
siloxane)/ divinylbenzene (PDMS/ DVB) fiber or a 65 µm Carbowax/ divinylbenzene (CW/
DVB) fiber from Supelco (Figure 3-5). The sample temperature during extraction in the liquid
varied from 5 - 30 °C and ice was used for cooling (5 °C) of the manual holder. Sodium
chloride (>99.5 %, Merck), sodium hydroxide (99 %, Merck) and hydrochloric acid (30 %,
Merck) served to optimize the SPME conditions. The stirring of the sample during extraction
evoked by a magnetic stirring-bar (3 mm, Supelco) was performed at a velocity of
895 - 900 rev/min. The volumes of the sample vials varied from 1.5, 4, 10 to 250 mL. The
immersion depth of the fibers in the water phase during extraction was 1 cm. The extraction
time varied from 5 - 300 min. The pH was measured by a Universal Meter Multiline P4
(Wissenschaftlich-Technische Werkstätten). Water samples were collected using standard
water sampling techniques for volatile organic compounds (VOCs) [KOTERBA ET AL., 1995],
except that the samples were not preserved by acidification.
3.2.3.2 GC/ MS
Thermal desorption of the extracted compounds was effected by inserting the SPME fiber into
the GC injector port (3.8 cm) kept at 240 °C. The fiber remainded in the injector after
desorption for subsequent reconditioning of 30 min. Throughout the study, no MTBE residues

3 Analytical Methods
59
Fiber Sheath(pierces septum ofvial and GC injector)
Cooling(cylinder filledwith ice)
Barrel
Plunger
Fiber AttachmentRod
SPME Fiber
MagneticStirring Bar
Temperature Control
Sample Vial
Magnetic Stirring Unit, Heater and Temperature Control
Figure 3-5 Schematic model of solid-phase microextraction (SPME) with cooling of the
manual sampling holder.
were found left on the SPME fiber after each reconditioning. The split mode with a ratio of
1:20 and a 0.75 mm (inner diameter) liner were used. The GC column temperature was first
held at 35 °C for 1 min, then increased to 100 °C at a rate of 10 °C/min before further
increased to 240 °C at a rate of 50 °C/min and held for 40 min. Separation of the analytes was
performed by gas chromatography (Fisons Instruments GC 8060) using a 50 m SE-54
capillary column (CS) with a film thickness of 5 µm. Helium served as carrier gas at a
pressure of 70 kPa.
Peak detection and identification were carried out using a mass spectrometer (Fisons
Instruments MD 800), and integration of peak areas were carried out using Masslab software
(Windows, Version 1.3). The scan range included 50 - 600 m/z. The mass spectrometer was

3 Analytical Methods
60
tuned to optimize signals from 50 - 125 m/z. Mass chromatography of m/z 73 in full scan
mode was used for the quantitation of MTBE. The detection limit was defined by a 10:1
signal to noise ratio.
Previously, MTBE has been quantified by the ion m/z 73 and qualified by the secondary and
tertiary ions m/z 57 and 43 and fluorobenzene has been used as internal standard [ROSE ET
AL., 1998] For the present study, MTBd3E at a concentration of 10 µg/L was used as internal
standard because of its close physico-chemical similarity with MTBE. GC/ MS-analysis of
pure MTBd3E revealed m/z 76 as the appropriate qualifying and quantitation ion and m/z 57
as the secondary ion. The fragment m/z 73 was detected as a trace only and could be
neglected. On the other hand MTBE did not show any ions m/z 76. This allows the use of the
ion m/z 76 of MTBd3E for qualifying and quantifying MTBE. The tertiary ion m/z 43 could
not be measured because the scan range was 50 - 600 m/z. The MTBE signals could be
checked with respect to superimposition by other compounds since the analyses were carried
out in the full scan mode. In each case the 73 m/z ion was only composed of MTBE. In a
sample containing both MTBE and MTBd3E, the retention times differed by 0.035 min only.
3.2.4 Results and Discussion
The analysis of MTBE in water is usually carried out by purge-and-trap according to U.S.
EPA method 524.2 or comparable methods with a detection limit of 60 ng/L and a reporting
level of 200 ng/L [RAESE ET AL., 1995]. Recently, a long-term method detection level
(LT-MDL) of 83 ng/L for small amounts of MTBE using purge-and-trap has been reported
[ROSE ET AL., 1998]. Another approach of improving analytical sensitivity is the use of direct
aqueous injection. For MTBE, detection limits of 50 ng/L by use of single-ion detection
(selected ion monitoring, 73 m/z), of 100 ng/L using multiple ion-detection (selected ion
monitoring, 73, 57, 43 m/z) and of 10 µg/L analysed by full scan of all atomic masses (full
scan mode, 41 - 150 m/z) could be achieved [CHURCH ET AL., 1997]. However, the amounts of
MTBE in surface water in Germany to date are significantly lower than in the United States
due to less consumption of the oxygenate as a fuel additive. In order to monitor the current
amounts of MTBE in rain and surface waters in Germany, a new method with lower detection
levels had to be developed and is described here. The method applied here is based on solid-
phase microextraction (SPME) combined with gas chromatography/ mass spectrometry (GC/
MS).

3 Analytical Methods
61
In the first step of method development, distilled water spiked with a concentration of 10 µg/L
MTBE was used. As starting conditions, SPME of 4 mL water in a 4 mL vial for 30 min at
18 - 19 °C sample temperature were chosen. First, the affinity for MTBE of three different
solid-phases was tested by the use of a 65 µm fiber of CW/ DVB, a 65 µm PDMS/ DVB fiber
both for polar analytes with low and high molecular mass respectively and a 75 µm PDMS/
Carboxen fiber for trace-level volatiles. The 75 µm PDMS/ Carboxen fiber revealed the best
recovery rate of 5.6 %, the PDMS/ DVB fiber absorbed 2.6 % MTBE, whereas the CW/ DVB
fiber could only extract 0.2 % of MTBE from the water sample. This is in agreement with the
expected results because sensitivity increases as the volume of coating increases [ZHANG ET
AL., 1996]. The PDMS/ Carboxen fiber was used for further optimizing experiments only.
In a second step, the influence of temperature on the extraction yield was investigated. It is
known that sample temperature and fiber temperature have an important impact on the
amount of analyte extracted according to the following equation [ZHANG ET AL., 1996]:
Kfs is the fiber/ sample partition coefficient, Vf and Vs are the volumes of the fiber and the
sample respectively and C0 is the starting concentration of the analyte. N is the amount of
analyte absorbed on the fiber. Generally, an increase in the temperature difference between
fiber and water sample leads to an increase in Kfs values and thus in an increase in sensitivity
[ZHANG ET AL., 1996]. Under starting conditions, the extraction yields of MTBE were
measured at 5, 11, 14, 18-19, 22, 25 and 30 °C sample temperature with and without
additional cooling of the fiber to 5 °C. The results have shown highest extraction yields at
18 - 19 °C sample temperature and simultaneous cooling of the fiber to 5 °C (Figure 3-6).
About 20 times more MTBE could be extracted at the optimal temperature in comparison to
extraction at 5 °C sample temperature. A constant increase of the extraction yield with
increasing temperature up to the maximum could be observed, followed by a rapid decrease at
higher values. At the temperature range of the highest extraction yield, cooling of the fiber to
5 °C resulted in an increase of MTBE recovery by about 24 %.
Another factor influencing the fiber/ sample partition coefficient is the ionic strength of the
sample. The addition of salt to the aqueous samples can either reduce or increase the recovery
of analytes. Consequently, the effect of adding salt to a sample should be evaluated for the
Kfs Vf C0 Vs
n =
Kfs Vf + Vs

3 Analytical Methods
62
0
200
400
600
800
1000
1200
1400
1600
5 10 15 20 25 30 35 Sample Temperature [°C]
Are
a [1
000]
With cooling of the fiber(5 °C)
Without cooling of thefiber
Figure 3-6 Influence of sample temperture on extraction yield with and without cooling of the
fiber (distilled water sample with a concentration of 10 µg/L methyl tert-butyl ether (MTBE)).
0
2000
4000
6000
8000
10000
12000
0 5 10 15 20 25 30Concentration of Sodium Chloride [%]
Are
a [1
000]
Figure 3-7 Influence of sodium chloride on extraction yield (distilled water sample with a
concentration of 10 µg/L methyl tert-butyl ether (MTBE)).
analytes of interest [ZHANG ET AL., 1996; SUPELCO, 1996]. To study the effect of salt on the
MTBE recovery rate, water samples containing different concentrations of sodium chloride
have been analysed (Figure 3-7). Results have shown that at concentrations of 4 % and 8 %
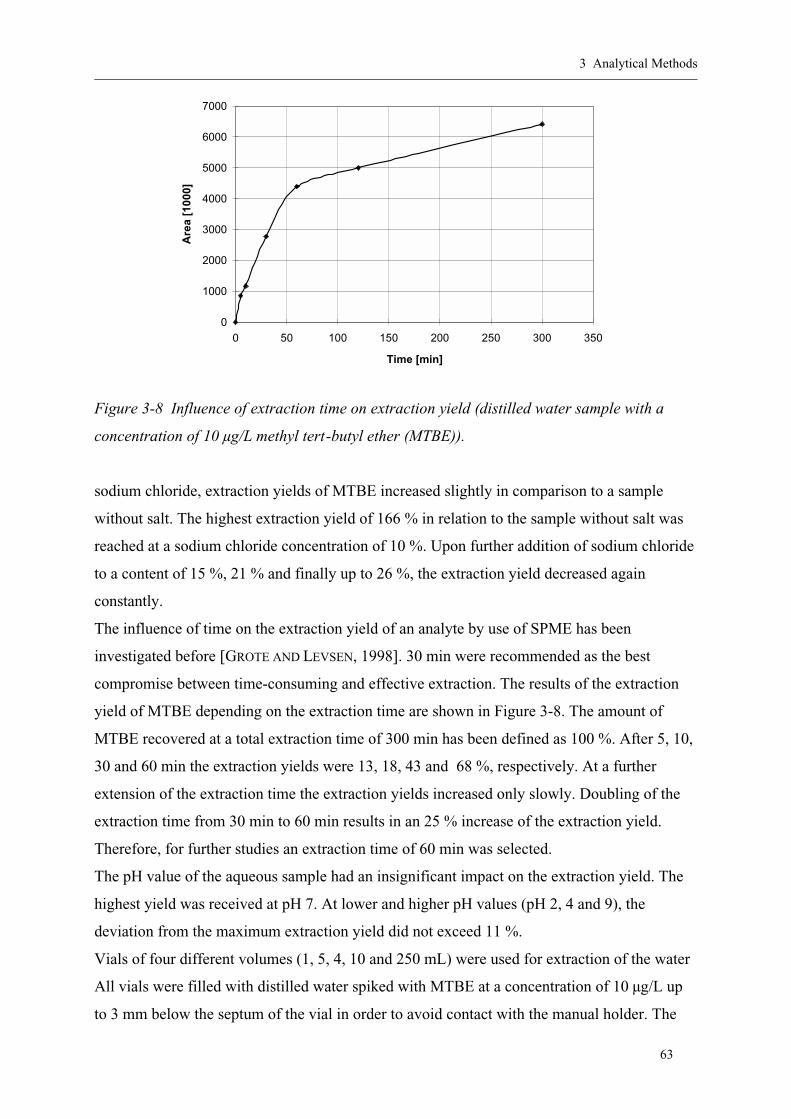
3 Analytical Methods
63
0
1000
2000
3000
4000
5000
6000
7000
0 50 100 150 200 250 300 350
Time [min]
Are
a [1
000]
Figure 3-8 Influence of extraction time on extraction yield (distilled water sample with a
concentration of 10 µg/L methyl tert-butyl ether (MTBE)).
sodium chloride, extraction yields of MTBE increased slightly in comparison to a sample
without salt. The highest extraction yield of 166 % in relation to the sample without salt was
reached at a sodium chloride concentration of 10 %. Upon further addition of sodium chloride
to a content of 15 %, 21 % and finally up to 26 %, the extraction yield decreased again
constantly.
The influence of time on the extraction yield of an analyte by use of SPME has been
investigated before [GROTE AND LEVSEN, 1998]. 30 min were recommended as the best
compromise between time-consuming and effective extraction. The results of the extraction
yield of MTBE depending on the extraction time are shown in Figure 3-8. The amount of
MTBE recovered at a total extraction time of 300 min has been defined as 100 %. After 5, 10,
30 and 60 min the extraction yields were 13, 18, 43 and 68 %, respectively. At a further
extension of the extraction time the extraction yields increased only slowly. Doubling of the
extraction time from 30 min to 60 min results in an 25 % increase of the extraction yield.
Therefore, for further studies an extraction time of 60 min was selected.
The pH value of the aqueous sample had an insignificant impact on the extraction yield. The
highest yield was received at pH 7. At lower and higher pH values (pH 2, 4 and 9), the
deviation from the maximum extraction yield did not exceed 11 %.
Vials of four different volumes (1, 5, 4, 10 and 250 mL) were used for extraction of the water
All vials were filled with distilled water spiked with MTBE at a concentration of 10 µg/L up
to 3 mm below the septum of the vial in order to avoid contact with the manual holder. The

3 Analytical Methods
64
0
500
1000
1500
2000
2500
3000
3500
4000
4500
5000
1 10 100 1000Volume [mL]
Are
a [1
000]
Figure 3-9 Influence of sample volume on extraction yield (distilled water sample with a
concentration of 10 µg/L methyl tert-butyl ether (MTBE)).
highest amounts of MTBE were recovered at the lowest sample volume of 1.5 mL. A
decreasing recovery of MTBE was observed with increasing sample volumes (Figure 3-9). A
further reduction of the sample volume is limited by the size of the stirring-bar.
After optimizing the analytical conditions using the PDMS/ Carboxen fiber only, the recovery
rates of the three different fibers were measured again by use of these conditions. Results
have shown that the PDMS/ Carboxen fiber still provides the highest recovery rate (8.0 %) in
comparison to the PDMS/ DVB (4.1 %) and CW/ DVB fiber (0.3 %). Optimal results were
achieved by extraction of 1.5 mL water sample volume in a 1.5 mL vial for 60 min at
18 - 19 °C sample temperature and cooling of the fiber to 5 °C. Sodium chloride was added at
a concentration of 10 % and the pH was not adjusted to a specific value. Integration of peaks
for MTBE using distilled water spiked with MTBE at a concentration of 10 µg/L gave a
relative standard deviation for replicate injections of 8 % (n = 10). The detection limit under
the conditions of a defined signal to noise ratio of 10:1 was 10 ng/L by use of distilled water
spiked with MTBE or river water.
3 Analytical Methods
65
3.3 Improvement of the Method: SPME in Headspace
3.3.1 Abstract
A simple and rapid method for the determination of methyl tert-butyl ether (MTBE) in water
by headspace-solid-phase microextration (headspace-SPME) at sub-ng/L concentrations is
described [ACHTEN ET AL., 2001B]. Using a cooled SPME fiber coated with 75 µm
poly(dimethylsiloxane)/ Carboxen and heating the sample to 35 °C about 4 times more MTBE
is extracted compared to SPME extraction with the fiber placed into the water sample. Stable
analytical conditions with a detection limit of 10 ng/L are achieved. By use of a sample
volume of 4 mL in a 10 mL vial, a sodium chloride content of 10% (w/w) and an extraction
time of 30 min the total time of an analytical cycle was optimized to 39 min. Precise linearity
of R² >0.9991 and R² >0.9916 in the calibration range from 20 - 5000 ng/L and 20 - 100 ng/L
both in addition to blanks, respectively, and relative standard deviations of 10% (100 ng/L,
long-term) and 11% (20 ng/L, short-term) are presented. The recovery is well within accepted
limits of 83 - 118% at a concentration of 100 ng/L and even close to it at trace-levels of
20 ng/L (96 - 125%). The presented data at a concentration of 100 ng/L are tested by
statistical methods and show results for the T test at the 95 % confidence level. Due to the
large concentration range the method is well suited for the monitoring of MTBE in the aquatic
environment.
3.3.2 Introduction
With increasing numbers, MTBE concentrations are detected in the atmospheric and aquatic
environment on the American continent and in Europe [ZOGORSKI ET AL., 1998; GAFFNEY ET
AL., 1999; KLINGER ET AL., 2000; ACHTEN AND PÜTTMANN, 2000; ACHTEN ET AL., 2001A,
2002A AND B]. The introduction of MTBE into the subsurface by point sources (eg. leaking
underground storage tanks) can represent a risk for groundwater not only due to the low odor
and taste threshold of 20 µg/L but also because the toxicity of the ether is not yet clearly
understood. The closure of drinking water wells due to contamination with MTBE has been
described [HAPPEL ET AL., 1998]. In Germany, super premium unleaded gasoline, regular
unleaded gasoline and the new „Optimax“ gasoline showed average MTBE contents of 9.8,
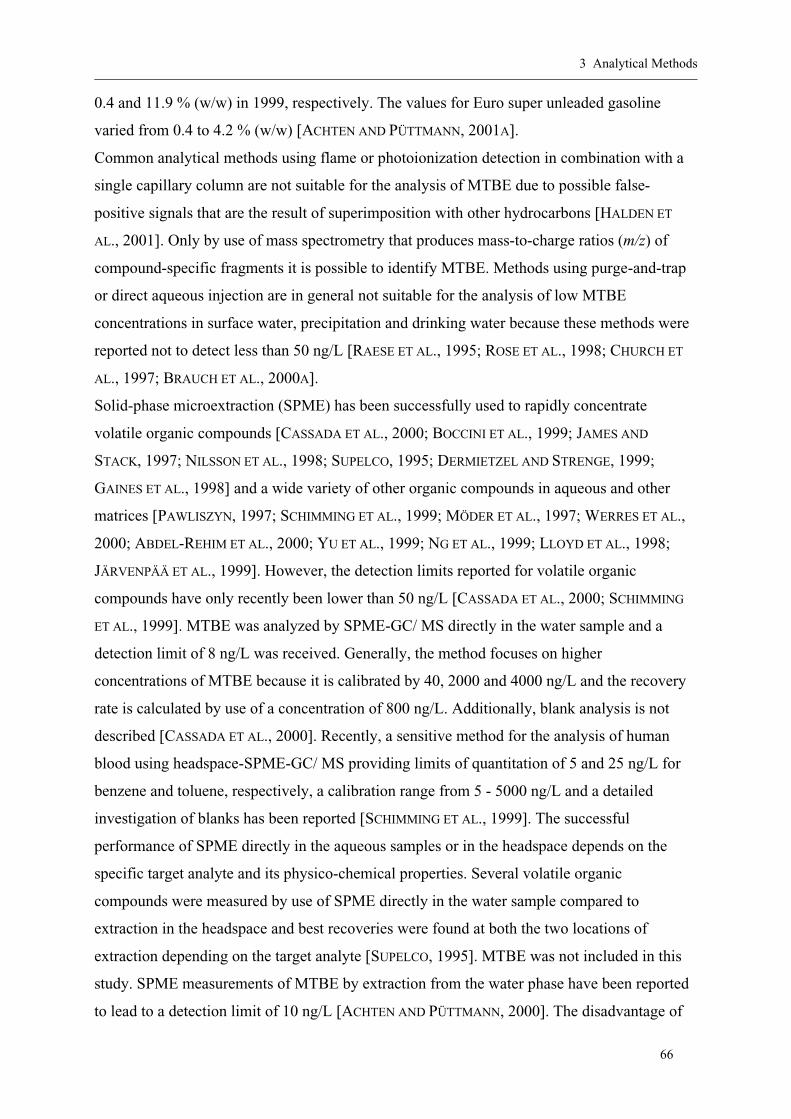
3 Analytical Methods
66
0.4 and 11.9 % (w/w) in 1999, respectively. The values for Euro super unleaded gasoline
varied from 0.4 to 4.2 % (w/w) [ACHTEN AND PÜTTMANN, 2001A].
Common analytical methods using flame or photoionization detection in combination with a
single capillary column are not suitable for the analysis of MTBE due to possible false-
positive signals that are the result of superimposition with other hydrocarbons [HALDEN ET
AL., 2001]. Only by use of mass spectrometry that produces mass-to-charge ratios (m/z) of
compound-specific fragments it is possible to identify MTBE. Methods using purge-and-trap
or direct aqueous injection are in general not suitable for the analysis of low MTBE
concentrations in surface water, precipitation and drinking water because these methods were
reported not to detect less than 50 ng/L [RAESE ET AL., 1995; ROSE ET AL., 1998; CHURCH ET
AL., 1997; BRAUCH ET AL., 2000A].
Solid-phase microextraction (SPME) has been successfully used to rapidly concentrate
volatile organic compounds [CASSADA ET AL., 2000; BOCCINI ET AL., 1999; JAMES AND
STACK, 1997; NILSSON ET AL., 1998; SUPELCO, 1995; DERMIETZEL AND STRENGE, 1999;
GAINES ET AL., 1998] and a wide variety of other organic compounds in aqueous and other
matrices [PAWLISZYN, 1997; SCHIMMING ET AL., 1999; MÖDER ET AL., 1997; WERRES ET AL.,
2000; ABDEL-REHIM ET AL., 2000; YU ET AL., 1999; NG ET AL., 1999; LLOYD ET AL., 1998;
JÄRVENPÄÄ ET AL., 1999]. However, the detection limits reported for volatile organic
compounds have only recently been lower than 50 ng/L [CASSADA ET AL., 2000; SCHIMMING
ET AL., 1999]. MTBE was analyzed by SPME-GC/ MS directly in the water sample and a
detection limit of 8 ng/L was received. Generally, the method focuses on higher
concentrations of MTBE because it is calibrated by 40, 2000 and 4000 ng/L and the recovery
rate is calculated by use of a concentration of 800 ng/L. Additionally, blank analysis is not
described [CASSADA ET AL., 2000]. Recently, a sensitive method for the analysis of human
blood using headspace-SPME-GC/ MS providing limits of quantitation of 5 and 25 ng/L for
benzene and toluene, respectively, a calibration range from 5 - 5000 ng/L and a detailed
investigation of blanks has been reported [SCHIMMING ET AL., 1999]. The successful
performance of SPME directly in the aqueous samples or in the headspace depends on the
specific target analyte and its physico-chemical properties. Several volatile organic
compounds were measured by use of SPME directly in the water sample compared to
extraction in the headspace and best recoveries were found at both the two locations of
extraction depending on the target analyte [SUPELCO, 1995]. MTBE was not included in this
study. SPME measurements of MTBE by extraction from the water phase have been reported
to lead to a detection limit of 10 ng/L [ACHTEN AND PÜTTMANN, 2000]. The disadvantage of

3 Analytical Methods
67
this method is the rapid pollution of the ion source due to the introduction of abundant low
volatile organic matter and of water.
The present study describes the development of a stable and sensitive method for analysis of
MTBE in water samples by headspace-SPME/ GC-MS and represents an improvement of the
existing method [ACHTEN AND PÜTTMANN, 2000]. Detailed data concerning calibration,
linearity, blanks, accuracy and precision are presented. Due to the independence of the matrix
from the aqueous samples, the method can also be applied to wastewater.
3.3.3 Experimental Section
3.3.3.1 Materials and Methods
Calibration Standards of MTBE at concentations of 20, 100 and 5000 ng/L and isotopically
labeled MTBE (d3MTBE) at a concentration of 10 µg/L were prepared from 2000 µg/mL
stock solutions (Fluka) and from pure d3MTBE (>99%, Fluka), respectively. Each compound
was obtained in the highest commercially available purity. The first dilution steps were
performed by use of methanol whereas further preparation of the standard solutions was
carried out using distilled, subsequently boiled and for the preparation of the standard
solutions cooled water (1 °C). In order to minimize volatilization of the ethers during
preparation of the standards it was necessary to push the plunger of the syringes very slowly
at several intervals of about 5 mm into the water in order to allow the chemicals to dissolve.
When the plunger was pushed continuously without stops unacceptable calibration curves
were received. The standard solutions were cooled at 4 °C and used within 4 weeks. For the
optimization process of this method MTBE solutions at a concentration of 100 ng/L were
used. Additionally, standards at a concentration of 20 ng/L were used for the investigation of
precision and accuracy. 40 µL of the d3MTBE standard solution which served as internal
standard was added to the spiked water samples for MTBE quantitation.
Water samples were collected in 100 mL sample vials (brown glass) using standard water
sampling techniques for volatile organic compounds [KOTERBA ET AL., 1995]. The analyzed
samples were collected in the years 1999 to 2001. Precipitation was collected by use of a
rainwater collector (Eigenbrodt) with a lid that opened for precipitation only. It was placed on
the top of a building in order to eliminate other inputs. All samples were analyzed within 4
weeks after collection.

3 Analytical Methods
68
3.3.3.2 HS-SPME/ GC-MS
SPME was performed by a SPME manual sampling holder equipped with a 75 µm
poly(dimethylsiloxane)/ Carboxen (PDMS/ Carboxen) fiber from Supelco. The manual
sampling holder was cooled to 0°C by use of a cryostat (Haake, Berlin) during extraction.
Sodium chloride (>99.5 %, Merck) was used in the highest purity commercially available.
The stirring of the sample during extraction by a magnetic stirring-bar (3 mm, Supelco) was
performed at a velocity of 895 - 900 rev/min. The sample temperature was controlled by
heating the magnetic stirring unit. Vials of 10 mL were used in combination with septa
(Dichtring Sil/ PTFE blau-transparent 3,0 mm, Loch 11 mm, Chromatographie Zubehör Trott,
Kriftel) that were made of two different thicknesses in order to seal at the outer ring and be
easily pierced by the SPME sampling holder in the inner part.
The immersion depth of the fiber into the headspace above the aqueous sample during
extraction was 0.8 cm. Due to the location of the fiber into the headspace and thereby no
direct contact to the matrix of the water samples the fiber was significantly more often
reusable (about 1000 times) than by locating the fiber into the liquid.
Thermal desorption of the extracted compounds from the SPME fiber was effected by
inserting it into the GC injector port (3.8 cm) kept at 260 °C. The fiber remainded in the
injector for 10 min. Note that due to numerous injections of the SPME sampling holder the
septum of the injector port needed to be sealed by use of a closed needle, when the sampling
holder was absent. The split mode with a ratio of 1:20 and a 0.75 mm (inner diameter) liner
were used. The GC column temperature was first held at 50 °C for 1 min, then increased to
200 °C at a rate of 10 °C/min and held for 20 min at final temperature. Separation of the
analytes was performed by gas chromatography (Thermo Quest CE Instruments Trace GC
2000 Series) using a 50 m SE-54 capillary column (CS) with a film thickness of 5 µm.
Helium served as carrier gas at a pressure of 70 kPa.
Peak identification and quantitation were carried out using a mass spectrometer (Thermo
Quest Finnigan Voyager GC/ MS) using the software Xcalibur (Version 1.0). Scanning of the
fragments was performed in full scan mode with a scan range of 40 - 600 m/z. The mass
spectrometer was tuned to optimize signals from 40 - 125 m/z. Mass chromatography of
m/z 73 and m/z 76 in full scan mode was used for the quantitation of MTBE by the internal
standard d3MTBE, respectively. This was possible because the mass spectrum of MTBE
shows no fragments m/z 76 and the spectrum of d3MTBE only consists of neglectable traces
of the fragment m/z 73. The detection limit was defined by a 10:1 signal to noise ratio.
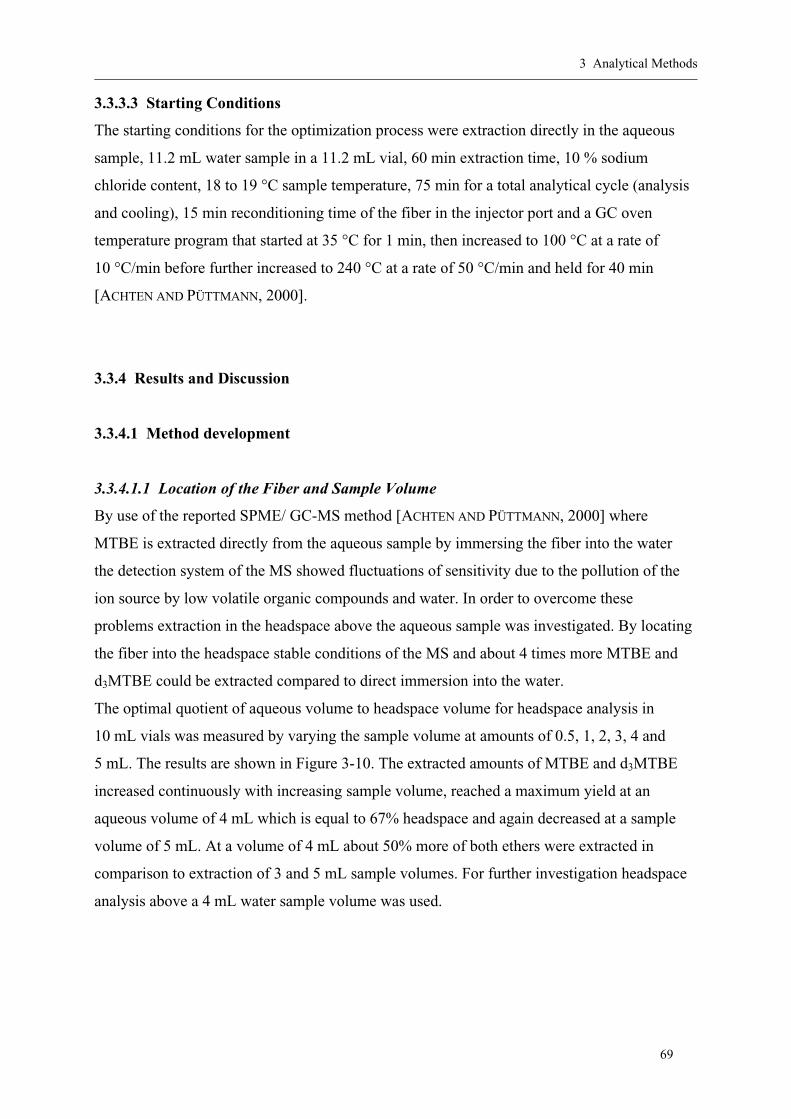
3 Analytical Methods
69
3.3.3.3 Starting Conditions
The starting conditions for the optimization process were extraction directly in the aqueous
sample, 11.2 mL water sample in a 11.2 mL vial, 60 min extraction time, 10 % sodium
chloride content, 18 to 19 °C sample temperature, 75 min for a total analytical cycle (analysis
and cooling), 15 min reconditioning time of the fiber in the injector port and a GC oven
temperature program that started at 35 °C for 1 min, then increased to 100 °C at a rate of
10 °C/min before further increased to 240 °C at a rate of 50 °C/min and held for 40 min
[ACHTEN AND PÜTTMANN, 2000].
3.3.4 Results and Discussion
3.3.4.1 Method development
3.3.4.1.1 Location of the Fiber and Sample Volume
By use of the reported SPME/ GC-MS method [ACHTEN AND PÜTTMANN, 2000] where
MTBE is extracted directly from the aqueous sample by immersing the fiber into the water
the detection system of the MS showed fluctuations of sensitivity due to the pollution of the
ion source by low volatile organic compounds and water. In order to overcome these
problems extraction in the headspace above the aqueous sample was investigated. By locating
the fiber into the headspace stable conditions of the MS and about 4 times more MTBE and
d3MTBE could be extracted compared to direct immersion into the water.
The optimal quotient of aqueous volume to headspace volume for headspace analysis in
10 mL vials was measured by varying the sample volume at amounts of 0.5, 1, 2, 3, 4 and
5 mL. The results are shown in Figure 3-10. The extracted amounts of MTBE and d3MTBE
increased continuously with increasing sample volume, reached a maximum yield at an
aqueous volume of 4 mL which is equal to 67% headspace and again decreased at a sample
volume of 5 mL. At a volume of 4 mL about 50% more of both ethers were extracted in
comparison to extraction of 3 and 5 mL sample volumes. For further investigation headspace
analysis above a 4 mL water sample volume was used.

3 Analytical Methods
70
3.3.4.1.2 Extraction Time and Time of the Total Analytical Cycle
Most of the total time for an analytical cycle is used for the extraction time in combination
with the GC oven temperature program and the reconditioning time of the fiber. When MTBE
is analyzed by direct SPME extration in the water sample, 60 min are necessary in order to
achieve a detection limit of 10 ng/L [ACHTEN AND PÜTTMANN, 2000]. Locating the fiber into
the headspace provided faster equilibrium between the two phases. Extraction times of 15, 25,
30, 35, 45 and 60 min were investigated and the results are shown in Figure 3-11. The
extraction yield was constantly low (about 57 %) until 25 min, followed by a rapid increase at
30 min of about 30 % and a slower at 35 min of about 13%. Further extension of the
extraction time did not increase the amount of MTBE and d3MTBE significantly but at 45 and
60 min the fluctuations of the peak areas increased leading to higher standard deviations.
An extraction time of 30 min represents a good compromise between a good extraction yield
and an acceptable exposure time.
For the oven conditions a starting temperature of 50 °C for 1 min was used. Then the
temperature was increased to 200 °C at a rate of 10 °C and held for 20 min. The separation of
the ethers from other compounds did not change significantly, nor did the peak shape but the
GC oven needed less time for cooling to 50 °C in comparison to 35 °C used previously
[ACHTEN AND PÜTTMANN, 2000]. The reduced maximum temperature from 240 to 200 °C and
conditioning time of the GC oven from 40 to 20 min provided the same cleaning effect of the
whole system. Moreover, the desorption and reconditioning time of the fiber was reduced
from 15 to 10 min. After a desorption time of 10 min no memory effects were observed even
with samples with high analyte concentrations. The described improvements led to a reduced
time of the total analytical cycle (extraction, analysis and cooling) from 75 [ACHTEN AND
PÜTTMANN, 2000] to 39 min.
3.3.4.1.3 Sample Temperature
The temperature of the sample influences the volatilization of the ethers into the headspace.
By use of direct SPME extraction from water best results were obtained at a sample
temperature of 18 to 19 °C [ACHTEN AND PÜTTMANN, 2000]. At this temperature low
extraction yields were received by use of headspace-SPME. Measurements at 15, 20, 25 and
30 °C showed increasing amounts of extracted ethers to a maximum at 35 °C where 47 %
more was extracted in comparison to 15 °C (Figure 3-12). At 40 °C the average value was
significantly lower and the standard deviation increased.
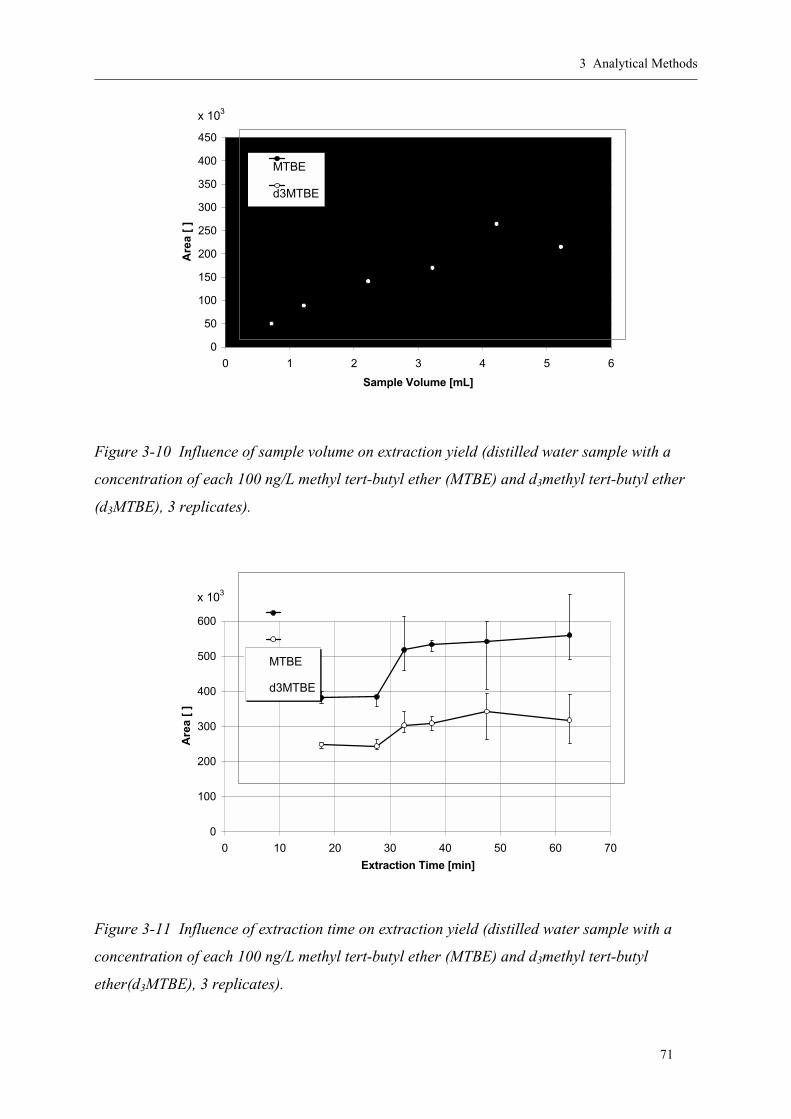
3 Analytical Methods
71
0
50
100
150
200
250
300
350
400
450
0 1 2 3 4 5 6
Sample Volume [mL]
Are
a [
]
MTBE
d3MTBE
x 103
Figure 3-10 Influence of sample volume on extraction yield (distilled water sample with a
concentration of each 100 ng/L methyl tert-butyl ether (MTBE) and d3methyl tert-butyl ether
(d3MTBE), 3 replicates).
0
100
200
300
400
500
600
0 10 20 30 40 50 60 70
Extraction Time [min]
Are
a [
]
MTBE
d3MTBE
x 103
Figure 3-11 Influence of extraction time on extraction yield (distilled water sample with a
concentration of each 100 ng/L methyl tert-butyl ether (MTBE) and d3methyl tert-butyl
ether(d3MTBE), 3 replicates).

3 Analytical Methods
72
0
100
200
300
400
500
600
10 15 20 25 30 35 40 45
Temperature [°C]
Are
a [
]
MTBE
d3MTBE
x 10³
Figure 3-12 Influence of sample temperature on extraction yield (distilled water sample with
a concentration of each 100 ng/L methyl tert-butyl ether (MTBE) and d3methyl tert-butyl
ether (d3MTBE), 3 replicates).
0
50
100
150
200
250
300
350
400
0 5 10 15 20 25 30
Sodium Chloride [% w/w]
Are
a [
]
MTBE
d3MTBE
x 103
Figure 3-13 Influence of sodium chloride on extraction yield (distilled water sample with a
concentration of each 100 ng/L methyl tert-butyl ether (MTBE) and d3methyl tert-butyl ether
(d3MTBE), 3 replicates).

3 Analytical Methods
73
3.3.4.1.4 Sodium Chloride Concentration
To study the effect of salt on the MTBE recovery rate, water samples containing different
concentrations of sodium chloride have been analyzed (Figure 3-13). Results have shown that
at concentrations of 0,4 and 8 % (w/w) sodium chloride, extraction yields of MTBE are about
25 % (w/w) lower than at 10 % (w/w) sodium chloride. Upon further addition of sodium
chloride to a content of 15 and 21 % (w/w) the extraction yields fluctuated to a large extent
before decreasing at addition of 26 % (w/w) salt. 10 % (w/w) were chosen to provide best
results. At the same concentration best results were obtained at direct SPME extraction from
water although the kinetic mechanisms are totally different [ACHTEN AND PÜTTMANN, 2000].
3.3.4.2 Method Validation
3.3.4.2.1 Blanks
As described by SCHIMMING ET AL. [1999] for benzene and toluene at trace-level
concentrations, MTBE can also not be eliminated completely from the analytical system.
Step-by-step investigations of the source of contamination revealed the GC-MS system as the
contamination source. Even several hours of heating the injection system, the oven and the
ion source did not remove traces of MTBE completely (Figure 3-14). This was possible only
after the installation of a new capillary column and liner and similarly cleaning of the ion
source (Figure 3-15). The remaining blanks correspond to a MTBE concentration of about
45 ng/L at the four-point-calibration (blank, 20, 100, 5000 ng/L) and of about 15 ng/L at the
three-point-calibration at a lower level (blank, 20, 100 ng/L). Fortunately, these blank values
are very constant (relative standard deviation (RSD = 9 %) as long as samples of extremely
high concentrations (in the µg/L - mg/L range, eg. groundwater near leaking underground
storage tanks) are excluded or diluted. SCHIMMING ET AL. [1999] reported blank
concentrations for benzene and toluene of 30 and 15 ng/L, respectively with a RSD <6 %.
3.3.4.2.2 Calibration and Linearity
Calibration samples of different concentration ranges from 20 to 5000 ng/L (including blanks)
were measured in order to investigate linearity (Table 3-2). Very precise linearity of
R² = 0.9991 to1.0000 over 3 orders of a magnitude were received at the four-point-
calibrations (blank, 20, 100 and 5000 ng/L). For measurements in the range of 20 to 100 ng/L
(including blanks) three-point-calibrations (blank, 20 and 100 ng/L) were used in order to
3 Analytical Methods
74
RT: 4. 88 - 6.68
4.9 5.0 5.1 5.2 5.3 5.4 5.5 5.6 5.7 5.8 5.9 6.0 6.1 6.2 6.3 6.4 6.5 6.6 Time (min)
0
10
20 30
40
50
60
70
80
90
100
0 10
20 30
40
50
60
70 80
90
100
RT: 5.93MA: 66639
RT: 5.90 MA: 346984
NL:2.38E4
m/z=72.5-73.5MS MTBE 1403
NL:8.84E4
m/z=75.5-76.5MS MTBE 1403
d3MTBE
MTBE
Figure 3-14 Mass chromatogram of m/z 73 (methyl tert-butyl ether (MTBE), blank, top) and
m/z 76 (d3methyl tert-butyl ether (d3MTBE), 100 ng/L, bottom) between sample analysis.
reduce MTBE contamination by injection of higher concentrated standards into the GC-MS
system. The calibration curves showed good linearity with coefficients of R² = 0.9916 to
1.0000.
CASSADA ET AL. [2000] reported linearity in the range of 40 - 4000 ng/L with coefficients of
R² higher than 0.98 by use of direct SPME extraction of MTBE from water. By use of the
same type of SPME fiber (Carboxen/ PDMS) as used in this study a correlation coefficient of
R² = 0.999 at low concentrations for benzene and toluene extracted by headspace-SPME was
published for a calibration range of 25 - 5000 ng/L [SCHIMMING ET AL., 1999]. A second
calibration curve ranging from 5 - 250 ng/L was set for trace-level concentrations, but no
correlation coefficient was published.
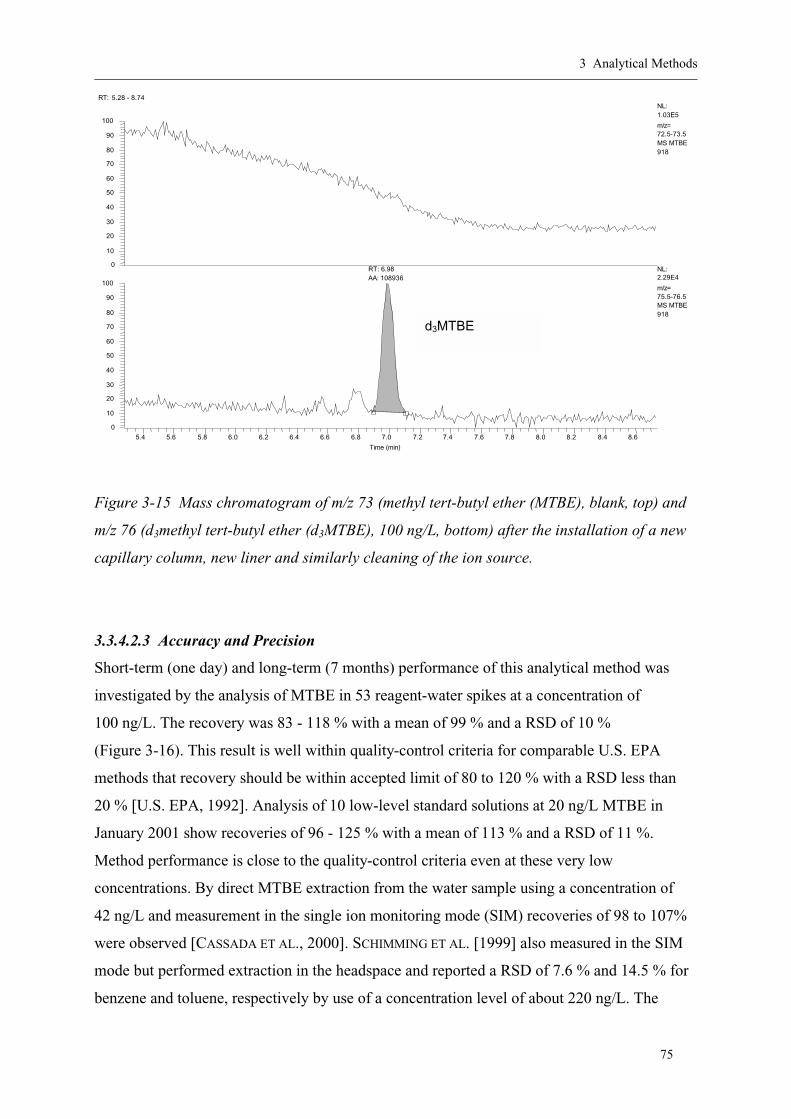
3 Analytical Methods
75
RT: 5.28 - 8.74
5.4 5.6 5.8 6.0 6.2 6.4 6.6 6.8 7.0 7.2 7.4 7.6 7.8 8.0 8.2 8.4 8.6 Time (min)
0
10
20 30
40
50
60
70
80
90
100
0 10
20
30
40
50
60
70 80
90
100
RT: 6.98AA: 108936
NL: 1.03E5
m/z= 72.5-73.5 MS MTBE918
NL: 2.29E4
m/z= 75.5-76.5 MS MTBE918
d3MTBE
Figure 3-15 Mass chromatogram of m/z 73 (methyl tert-butyl ether (MTBE), blank, top) and
m/z 76 (d3methyl tert-butyl ether (d3MTBE), 100 ng/L, bottom) after the installation of a new
capillary column, new liner and similarly cleaning of the ion source.
3.3.4.2.3 Accuracy and Precision
Short-term (one day) and long-term (7 months) performance of this analytical method was
investigated by the analysis of MTBE in 53 reagent-water spikes at a concentration of
100 ng/L. The recovery was 83 - 118 % with a mean of 99 % and a RSD of 10 %
(Figure 3-16). This result is well within quality-control criteria for comparable U.S. EPA
methods that recovery should be within accepted limit of 80 to 120 % with a RSD less than
20 % [U.S. EPA, 1992]. Analysis of 10 low-level standard solutions at 20 ng/L MTBE in
January 2001 show recoveries of 96 - 125 % with a mean of 113 % and a RSD of 11 %.
Method performance is close to the quality-control criteria even at these very low
concentrations. By direct MTBE extraction from the water sample using a concentration of
42 ng/L and measurement in the single ion monitoring mode (SIM) recoveries of 98 to 107%
were observed [CASSADA ET AL., 2000]. SCHIMMING ET AL. [1999] also measured in the SIM
mode but performed extraction in the headspace and reported a RSD of 7.6 % and 14.5 % for
benzene and toluene, respectively by use of a concentration level of about 220 ng/L. The
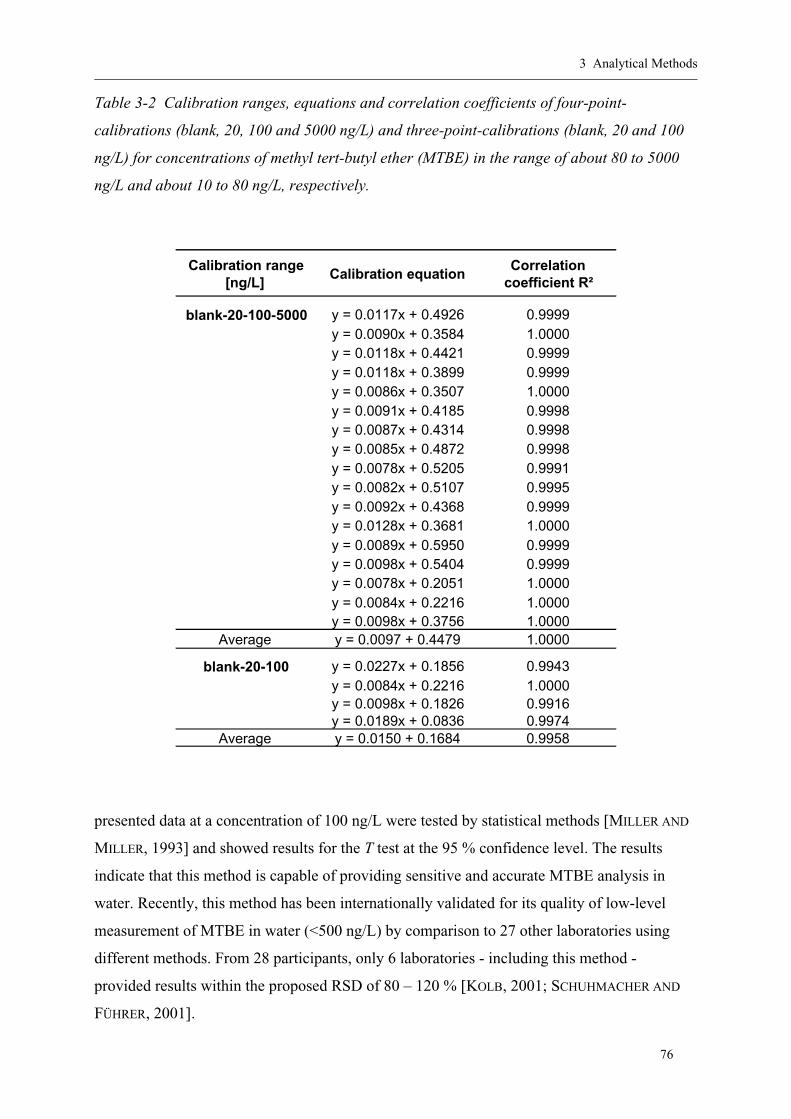
3 Analytical Methods
76
Table 3-2 Calibration ranges, equations and correlation coefficients of four-point-
calibrations (blank, 20, 100 and 5000 ng/L) and three-point-calibrations (blank, 20 and 100
ng/L) for concentrations of methyl tert-butyl ether (MTBE) in the range of about 80 to 5000
ng/L and about 10 to 80 ng/L, respectively.
Calibration range[ng/L]
Calibration equationCorrelation
coefficient R²
blank-20-100-5000 y = 0.0117x + 0.4926 0.9999y = 0.0090x + 0.3584 1.0000y = 0.0118x + 0.4421 0.9999y = 0.0118x + 0.3899 0.9999y = 0.0086x + 0.3507 1.0000y = 0.0091x + 0.4185 0.9998y = 0.0087x + 0.4314 0.9998y = 0.0085x + 0.4872 0.9998y = 0.0078x + 0.5205 0.9991y = 0.0082x + 0.5107 0.9995y = 0.0092x + 0.4368 0.9999y = 0.0128x + 0.3681 1.0000y = 0.0089x + 0.5950 0.9999y = 0.0098x + 0.5404 0.9999y = 0.0078x + 0.2051 1.0000y = 0.0084x + 0.2216 1.0000y = 0.0098x + 0.3756 1.0000
Average y = 0.0097 + 0.4479 1.0000
blank-20-100 y = 0.0227x + 0.1856 0.9943y = 0.0084x + 0.2216 1.0000y = 0.0098x + 0.1826 0.9916y = 0.0189x + 0.0836 0.9974
Average y = 0.0150 + 0.1684 0.9958
presented data at a concentration of 100 ng/L were tested by statistical methods [MILLER AND
MILLER, 1993] and showed results for the T test at the 95 % confidence level. The results
indicate that this method is capable of providing sensitive and accurate MTBE analysis in
water. Recently, this method has been internationally validated for its quality of low-level
measurement of MTBE in water (<500 ng/L) by comparison to 27 other laboratories using
different methods. From 28 participants, only 6 laboratories - including this method -
provided results within the proposed RSD of 80 – 120 % [KOLB, 2001; SCHUHMACHER AND
FÜHRER, 2001].

3 Analytical Methods
77
0
20
40
60
80
100
120
07/02/00 08/01/00 09/01/00 10/01/00 11/01/00 12/01/00 01/01/01 01/31/01
Rec
ove
ry [
%]
100 ng/L: 99 MEAN PERCENT RECOVERY 10 PERCENT RELATIVE STANDARD DEVIATION98 MEDIAN PERCENT RECOVERY 53 N (NUMBER OF SAMPLES)
20 ng/L: 113 MEAN PERCENT RECOVERY 11 PERCENT RELATIVE STANDARD DEVIATION115 MEDIAN PERCENT RECOVERY 10 N (NUMBER OF SAMPLES)
Figure 3-16 Percent recovery of methyl tert-butyl ether (MTBE) from distilled water spikes at
100 ng/L (long-term measurement) and 20 ng/L (short-term measurement).
It is noteworthy that several volatile organic compounds other than MTBE are also detected
by the method. The measurement of characteristic gasoline constituents like benzene, toluene,
ethylbenzene and xylenes (BTEX) by use of the described method is currently being
investigated [KOLB, 2001].
3.3.4.2.4 Field Study
In the years 1999 to 2001 different aqueous samples including river water, precipitation,
urban runoff, wastewater, industrial wastewater, drinking water and groundwater were
analyzed. The field data demonstrate that even lowest concentrations of MTBE in
precipitation and drinking water (10 - 50 ng/L) can be determined by the SPME method
reported here. The linear range of the method is sufficiently large to also monitor higher
concentrations in river water, urban runoff and wastewater. Groundwater samples and
industrial wastewater at higher concentrations of MTBE and possibly additional aromatic
compounds like BTEX have to be diluted before analysis (1:100). By use of liquid or
headspace SPME extraction for analysis of MTBE matrix effects occur if high concentrations

3 Analytical Methods
78
(mg/L) of BTEX and trimentylbenzenes are present and significantly lower sensitivity of the
method was reported [BLACK AND FINE, 2001].
3.3.5 Conclusions
A method for the determination of MTBE in water is reported which is based on solid-phase
microextraction [ACHTEN ET AL., 2001B]. By sampling in the headspace of the water about 4
times more MTBE was extracted compared to locating the fiber directly into the water
sample. Additionally, rapid pollution of the ion source by water and less volatile organic
matter in the water could be avoided. The fiber could be reused about 1000 times which is
significantly more than compared to use of the fiber in the water. Using a
poly(dimethylsiloxane)/ Carboxen fiber for extraction fixed to a cooled manual sampling
holder in combination with a heated sample, limits of quantitation with a detection limit of
10 ng/L are achieved which allow the determination of MTBE in precipitation, drinking
water, river water, urban runoff, wastewater, industrial wastewater and groundwater.
Reliable and simple MTBE measurements at trace-levels in water samples become
increasingly important as the use of the oxygenate has led to detectable amounts in the aquatic
environment and even in the drinking water system. The method reported here is well suited
for the monitoring of MTBE.
4 MTBE Concentrations in Environmental Water Samples in Germany
79
4 MTBE CONCENTRATIONS IN ENVIRONMENTAL WATER
SAMPLES IN GERMANY
4.1 MTBE in Urban and Rural Precipitation
4.1.1 Abstract
The use of the oxygenate methyl tert-butyl ether (MTBE) in gasoline has led to detectable
concentrations in urban and rural air up to 160 ppbV. Results from MTBE measurements in
precipitation have not been reported so far. In the present study, 120 samples of precipitation
collected at 17 sampling locations all over Germany have been analyzed for their MTBE
content. In precipitation samples, MTBE was detected in wintertimes only with a maximum
concentration of 85 ng/L. Measurement at Frankfurt/M city from 9/6/00 - 3/12/01 provided
for 49 % of the data concentrations in the range of 30 - 85 ng/L (n = 17). Sampling in winter
2000/ 2001 at several german cities and rural locations showed that MTBE is more often
detectable in urban (86 %, n = 78) than in rural (18 %, n = 42) precipitation. By comparing
the results with corresponding temperatures and amounts of precipitation, it can be concluded
that the detection of MTBE in urban precipitation is observed at ambient temperatures lower
than about 10 - 15 °C. Moreover, the first precipitation after a dry period accumulates more
MTBE than precipitation during or at the end of a wet period (wash-out effect). Highest
concentrations occured in snow samples. Corresponding mean air equilibrium concentrations
of 0.04 ppbV (urban samples) and 0.01 ppbV (rural samples) are calculated. This is about one
order of a magnitude lower than year round and summertime measurements in the U.S. and in
Switzerland. Urban runoff (n = 12) and corresponding precipitation sampling indicates that
urban runoff might be composed of about 20 % MTBE that is already transported by air and
precipitation whereas about 80 % may be attributed to direct uptake of vehicle emissions and
leakage near the road during precipitation.
4.1.2 Introduction
MTBE has been detected in the atmospheric and aquatic environment on the American
continent and in Europe with increasing numbers [ZOGORSKI ET AL., 1998; GAFFNEY ET AL.,
1999; KLINGER ET AL., 2000; JOHNSON ET AL., 2000; BRAUCH ET AL., 2000A; ACHTEN AND
PÜTTMANN, 2000 AND 2001B; ACHTEN ET AL., 2001A, 2002A AND B]. The introduction of
MTBE into the subsurface by point sources (e.g. leaking underground storage tanks) can
4 MTBE Concentrations in Environmental Water Samples in Germany
80
represent a risk for groundwater not only due to the low odor and taste threshold of 20 µg/L
but also because the toxicity of the ether is not yet clearly understood. The closure of drinking
water wells due to contamination with MTBE has been described [HAPPEL ET AL., 1998].
Only a few results of analyzed atmospheric MTBE concentrations have been reported so far.
Measurement of MTBE concentrations in the air of mega cities showed amounts of
0.2 – 17 ppbV (mean = 6.6 ppbV, n = 44), 40 - 160 ppbV (n = 16) and 1.28 ppbV (n = 1) in
Porto Alegre/ Brazil [GROSJEAN ET AL., 1998], Mexico City/ Mexico [GAFFNEY ET AL., 1999]
and Kairo/ Egypt [DOSKEY ET AL., 1999], respectively. In Brazil gasoline is described to be
oxygenated by 15 % (w/w) MTBE, in Mexico [BRAVO AND TORRES, 2000] and Egypt only by
5 and 3 – 10 % (w/w), respectively [DOSKEY ET AL., 1999]. Emissions released from motor
vehicle traffic [FRASER ET AL., 1998; POULOPOULOS AND PHILIPPOPOULOS 2000,
KIRCHSTETTER ET AL., 1996] and volatilization at gasoline stations during refueling [GAFFNEY
ET AL., 1999; VAINIOTALO ET AL., 1998 AND 1999, VAYGHANI AND WEISEL, 1999] are thought
to be the main sources. Near gasoline stations, peak MTBE concentrations of up to 14,000
ppbV based on short-term measurements were detected in the atmosphere. However, mean
values at pump islands are in the range of tens to hundreds ppbV (Table 4-1). Only recently,
average atmospheric MTBE concentrations were investigated for a combination of urban and
rural sampling sites and thereby represent the MTBE situation in larger areas rather than only
at urban sites. Mean measured atmospheric MTBE concentrations of 0.25 ppbV (median)
[BAEHR ET AL., 1999], 0.82 ppbV [BENDER ET AL., 2000] and 0.66 ppbV [BUWAL, 1999]
sampled in New Jersey/ U.S., California/ U.S. and Switzerland were calculated to correspond
to aqueous concentrations of 90 (median), 350 and 373 ng/L, respectively. The Henry’s Law
coefficient calculation published by BAEHR ET AL. [1999] was also used for calculations in
this study (Figure 2-4). It has been shown that atmospheric MTBE might be responsible for
low concentrations in surface and groundwater [PANKOW ET AL., 1997; BAEHR ET AL., 1999
AND 2001; BENDER ET AL., 2000]. In the Glassboro Comprehensive Urban Study/ New Jersey,
MTBE is measured in precipitation [ZOGORSKI ET AL., 1998] but to our knowledge data have
not yet been published. In the present study, MTBE concentrations in precipitation in
Germany are presented. To our knowledge this is the first publication of MTBE
measurements in precipitation apart from the analysis of MTBE in stormwater [DELZER ET
AL., 1996; LOPES AND BENDER, 1998].

4 MTBE Concentrations in Environmental Water Samples in Germany
81
Table 4-1 Atmospheric methyl tert-butyl ether (MTBE) concentrations (ppbV) at gasoline
stations.
Number of samples
Minimum Mean MaximumSampling location
MTBE concentration in gasoline in the
investigated area
Reference
[ppbV] [ppbV] [ppbV] [% w/w]
32 0.14 2.6 33
four main compass points on the service
station perimeter
16 67 207 368 pump island
167 901breathing zone during refueling
8 63 pump island
46 < 6.3 300 1300in vehicle cabin during refueling
36 < 5 29 170 pump island
11VAINIOTALO ET
AL:, 1998
15VAYGHANI AND WEISEL, 1999
VAINIOTALO ET AL:, 1999
< 5.5 13 934 5
4.1.3 Sampling
An amount of 42 precipitation samples were collected at Frankfurt/M city from 1998 to 2001
by use of a rainwater collector (Eigenbrodt) with a lid that opened for precipitation only. It
was placed on the top of a building (without emissions from fuel burning) in order to
eliminate other input. All samples collected in this study represent spot samples. Rainwater or
melted snow was analyzed for MTBE from December 1998 to the end of August 2000
monthly. Spot samples in winter 1999/ 2000 were collected once per month at the moment
when the ambient temperature decreased significantly and/ or the first precipitation fell after a
longer dry period. Since September 2000, samples were collected after every precipitation
event.
78 rural rain water samples at Schmücke, Neuglobsow, Waldhof, Brotjacklriegel, Zingst,
Deuselbach, Schauinsland and Westerland in winter 2000/ 2001 were collected at the
monitoring stations by the Umweltbundesamt. Samples from the Taunus-Observatorium
(Feldberg) were collected by the Meteorologisches Institut of the University Frankfurt/ M.
The Laboratory of the Berliner Umweltsenator provided precipitation samples from Berlin.
4 MTBE Concentrations in Environmental Water Samples in Germany
82
Further urban water samples from Köln, Stuttgart, Hamburg and Berlin and rural precipitation
at Altenholz-Klausdorf and Rade were collected in the winter 2000/ 2001 by use of a rain
water collector that was placed on the top of a building or on the ground far away from any
traffic. From 09/06/00 - 12/19/00 a few (n = 12) urban runoff samples were collected by
dipping the sample bottles into ditches on the border of a high traffic road which is situated
500 m from the precipitation sampling at Frankfurt/M. Urban runoff and corresponding
precipitation samples were taken at the same day. All samples were stored in 100 mL sample
bottles (brown glass) that were acidified before by concentrated hydrochloric acid (33 %).
The bottles were completely filled with no headspace left and cooled to 4 °C. Analysis was
performed within 3 weeks after collection. The bottles were heated to 110 °C for 5 hours
before use.
4.1.4 Results and Discussion
4.1.4.1 Precipitation
The long-term precipitation measurement at Frankfurt/M city from 1998 to 2001 showed
detectable MTBE concentrations in wintertimes only (Figure 4-1). In winter 1998/ 1999 and
1999/ 2000 with longer sampling intervals only a few samples indicated MTBE
concentrations up to 70 ng/L in rain or snow. Detailed sampling in winter 2000/ 2001 wth
shorter intervals confirmed the former data, with MTBE values up to 85 ng/L. Strong
fluctuations of the MTBE concentrations are probably the result of the high sampling
frequency because samples were taken daily if enough precipitation for the analysis could be
collected (e.g. even after heavy rain that had probably washed out a lot of MTBE from the
atmosphere). From 9/6/00 - 3/12/01 the median (mean) concentration was 24 ng/L (32 ng/L,
not detected – 85 ng/L, n = 35) and 49 % of the data showed a median (mean) concentration
of 44 ng/L (53 ng/L,
30 – 85 ng/L, n = 17). Analysis data that were below the detection limit of 10 ng/L were
included in the calculations by 10 ng/L throughout the study. The results are compared to
daily ambient temperatures and amounts of precipitation (Figures 4-2 and 4-3). Mean values
of daily temperatures and precipitation data were produced in the same intervals as the
precipitation samples were collected. Thereby, a data point of the MTBE concentration with
corresponding temperature and precipitation values represents a mean value of the interval
from the date of the point to the former data point.
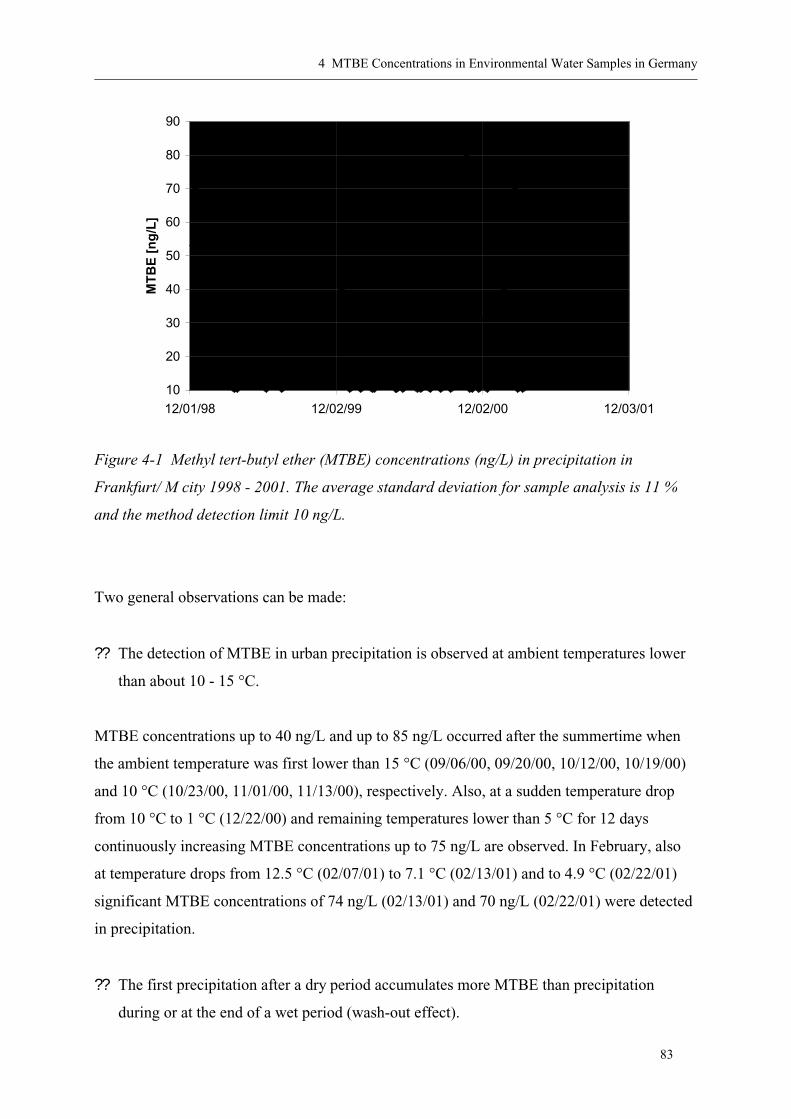
4 MTBE Concentrations in Environmental Water Samples in Germany
83
10
20
30
40
50
60
70
80
90
12/01/98 12/02/99 12/02/00 12/03/01
MT
BE
[n
g/L
]
Figure 4-1 Methyl tert-butyl ether (MTBE) concentrations (ng/L) in precipitation in
Frankfurt/ M city 1998 - 2001. The average standard deviation for sample analysis is 11 %
and the method detection limit 10 ng/L.
Two general observations can be made:
?? The detection of MTBE in urban precipitation is observed at ambient temperatures lower
than about 10 - 15 °C.
MTBE concentrations up to 40 ng/L and up to 85 ng/L occurred after the summertime when
the ambient temperature was first lower than 15 °C (09/06/00, 09/20/00, 10/12/00, 10/19/00)
and 10 °C (10/23/00, 11/01/00, 11/13/00), respectively. Also, at a sudden temperature drop
from 10 °C to 1 °C (12/22/00) and remaining temperatures lower than 5 °C for 12 days
continuously increasing MTBE concentrations up to 75 ng/L are observed. In February, also
at temperature drops from 12.5 °C (02/07/01) to 7.1 °C (02/13/01) and to 4.9 °C (02/22/01)
significant MTBE concentrations of 74 ng/L (02/13/01) and 70 ng/L (02/22/01) were detected
in precipitation.
?? The first precipitation after a dry period accumulates more MTBE than precipitation
during or at the end of a wet period (wash-out effect).
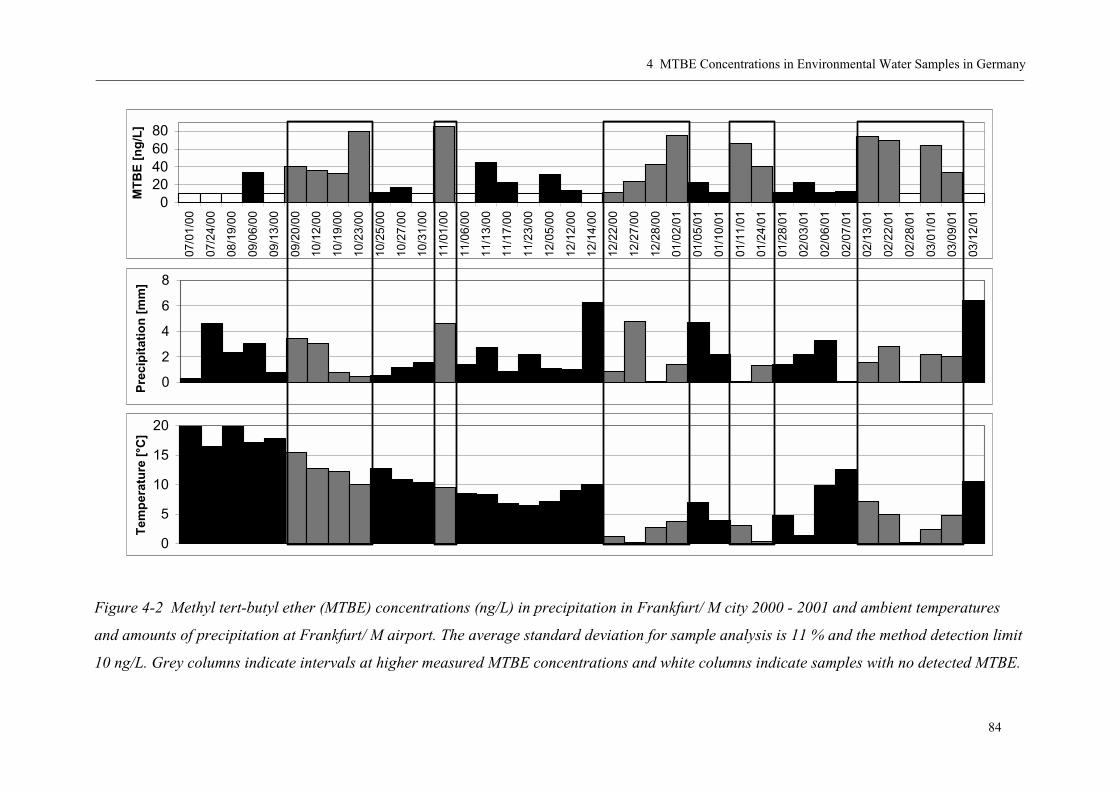
4 MTBE Concentrations in Environmental Water Samples in Germany
84
0
5
10
15
20
Tem
per
atu
re [
°C].
0
2
4
6
8
Pre
cip
itat
ion
[m
m].
020406080
07/0
1/00
07/2
4/00
08/1
9/00
09/0
6/00
09/1
3/00
09/2
0/00
10/1
2/00
10/1
9/00
10/2
3/00
10/2
5/00
10/2
7/00
10/3
1/00
11/0
1/00
11/0
6/00
11/1
3/00
11/1
7/00
11/2
3/00
12/0
5/00
12/1
2/00
12/1
4/00
12/2
2/00
12/2
7/00
12/2
8/00
01/0
2/01
01/0
5/01
01/1
0/01
01/1
1/01
01/2
4/01
01/2
8/01
02/0
3/01
02/0
6/01
02/0
7/01
02/1
3/01
02/2
2/01
02/2
8/01
03/0
1/01
03/0
9/01
03/1
2/01
MT
BE
[n
g/L
]
Figure 4-2 Methyl tert-butyl ether (MTBE) concentrations (ng/L) in precipitation in Frankfurt/ M city 2000 - 2001 and ambient temperatures
and amounts of precipitation at Frankfurt/ M airport. The average standard deviation for sample analysis is 11 % and the method detection limit
10 ng/L. Grey columns indicate intervals at higher measured MTBE concentrations and white columns indicate samples with no detected MTBE.

4 MTBE Concentrations in Environmental Water Samples in Germany
85
y = -1,157x + 37,635R2 = 0,1151
10
20
30
40
50
60
70
80
90
100
-5 0 5 10 15 20 25 30
Temperature [°C]
MT
BE
[n
g/L
]
Figure 4-3 Methyl tert-butyl ether (MTBE) concentrations (ng/L) in measured in
precipitation in urban areas versus corresponding ambient temperature (°C) from 1998 –
2001 in Germany. Samples that include more than 6 mm precipitation (n = 5) were neglected.
Triangles indicate first precipitation samples in autumn after summertime. The average
standard deviation for sample analysis is 11 % and the method detection limit 10 ng/L.
The last October week (10/25/00 - 10/31/00) was a dry period (3.5 mm precipitation) that
corresponds to practically no detectable MTBE (mean 13 ng/L) which was followed by heavy
rain (4.6 mm precipitation) that corresponds to 85 ng/L on the 1st of November. Heavy rain at
12/14/00 might be responsible for a concentration below the detection limit at 12/22/00
although the described temperature drop occurred. Also, at a precipitation amount of more
than 6 mm and an ambient temperature of about 10 °C (12/14/00, 03/12/01) MTBE is not
detected probably due to significant dissolution. The results might indicate a relation of the
MTBE concentration to the interaction of the precipitation amount and the ambient
temperature.
In the winter months November 2000, December 2000, January 2001 and February 2001, the
comparison of MTBE in urban and rural precipitation was investigated. The results and the
corresponding ambient temperatures are shown in Figure 4-4. The cities Bonn, Köln,
Hamburg, Stuttgart, Berlin and Frankfurt/ M represent urban areas and sampling locations at
Westerland, Zingst, Neuglobsow, Waldhof, Schmücke, Deuselbach, Schauinsland,

4 MTBE Concentrations in Environmental Water Samples in Germany
86
0
10
20
30
40
50
60
70B
onn
Köl
n
Ham
burg
Stu
ttgar
t
Ber
lin
Fra
nkfu
rt/M
ain
Wes
terla
nd/
Syl
t
Zin
gst
Neu
glob
sow
Wal
dhof
Sch
müc
ke
Deu
selb
ach
Sch
auin
slan
d
Bro
tjack
lrieg
el
Fel
dber
g/T
aunu
s
Rad
e
Alte
nhol
z-K
laus
dorf
MT
BE
[n
g/L
]
November December
January February
*
*
*
*
* *
*
MDL:
-6
-4
-2
0
2
4
6
8
10
Tem
per
atu
re [
°C].
..
Figure 4-4 Methyl tert-butyl ether (MTBE) concentrations (ng/L) in rural and urban precipitation in Germany in winter 2000/ 2001. Data for
Frankfurt/ M and Berlin represent median values. The average standard deviation for sample analysis is 11 % and the method detection limit
(MDL) 10 ng/L. Asterics indicate snow samples.

4 MTBE Concentrations in Environmental Water Samples in Germany
87
Brotjacklriegel, Rade and Altenholz-Klausdorf are remote or rural areas. MTBE is more often
detectable in urban (86 %, n = 78) than in rural precipitation (18 %, n = 42). It has to be taken
into account that each data point represents one arbitrary collected spot sample per month and
the corresponding temperatures are median monthly values. More than one spot sample per
month were collected at Frankfurt/ M (n = 24) and at Berlin (n = 8) only. From the
comparison of the Frankfurt/ M and the Berlin data with the data from the other cities it can
be concluded that monthly spot sampling provides a too low amount of numbers for an
acceptable statistical result because the concentrations fluctuate significantly from one
precipitation event to the next one (Figure 4-1). From November/ December 2000 to January/
February 2001 the mean ambient temperature at the investigated locations decreased from
5 °C to 2 °C and simultaneously the average MTBE concentration at all sample locations
increased from 15 to 22 ng/L. In this sample set, detection of MTBE was observed at ambient
temperatures lower than 8 °C.
The highest MTBE concentrations were detected in snow samples. It is known that snow fall
has the potential to significantly collect air pollutants from the atmosphere by washing out the
aerosol and sorbing the vapor [WANIA ET AL., 1998; VISKARI ET AL., 1997]. Even at rural
locations MTBE was detected in snow samples. Amounts of more than 50 ng/L MTBE in
January/ February 2001 at Neuglobsow and Altenholz-Klausdorf may result from the vicinity
of the cities Berlin and Kiel.
It is important to notice that in contrast to most parts of the U.S. MTBE is used in Germany at
different concentrations in regular, Euro super, super premium unleaded and "Optimax"
gasoline. Due to the predominant use of MTBE as an octane enhancer, about the same
concentrations are used the year round in Germany whereas in the U.S. the MTBE contents
are often increased in the wintertime. The MTBE content in gasoline during wintertime might
even be slightly lower due to increased use of butane which is less expensive [PAHLKE ET AL.,
2000]. Detectable MTBE concentrations in precipitation in Germany in the wintertime but not
in the summertime show that observed higher aqueous detection frequencies in the U.S. in the
wintertime [DELZER ET AL., 1996; REISER AND O‘ BRIEN, 1998] are not only the result of the
increased use of MTBE but also of its persistent behavior in the atmosphere at low ambient
temperatures. In New Jersey, where about 11 % ofMTBE is used the year round,summer and
winter concentrations of MTBE have medians of 60 ng/L and 420 ng/L, respectively [BAEHR
ET AL., 2001].
4 MTBE Concentrations in Environmental Water Samples in Germany
88
4.1.4.2 Comparison of the MTBE Concentrations in Precipitation to Other Data
The MTBE data in precipitation received in this study are calculated to corresponding air
equilibrium concentrations (Table 4-2), following the procedure used by BAEHR ET AL. [1999
AND 2001] and BENDER ET AL. [2000]. In this study, measured mean (median) MTBE
concentrations in precipitation of 14 ng/L (not detected) in rural areas and 30 ng/L (23 ng/L)
in urban areas correspond to mean (median) calculated air concentrations of 0.01 ppbV (not
detected) in rural areas and 0.04 ppbV (0.02 ppbV) in urban areas. If the data are compared to
other concentrations in Table 4-2, it has to be noticed that the samples in this study were taken
at lower ambient temperatures compared to the others. If the precipitation concentrations of
this study were calculated using ambient temperatures measured in the studies of BAEHR ET
AL. [1999] and BENDER ET AL. [2000], the calculated air concentrations would be 2-5 times
higher. MTBE concentrations in the air were observed in the range of about 0.1 - 0.5 ppbV
(rather rural areas) and about 0.5 - 2 ppbV (rather urban areas). Corresponding calculated
water equilibrium concentrations of about 40 – 250 ng/L (rather rural areas) and about
250 – 1700 ng/L (rather urban areas) are reported. Mean MTBE concentrations measured in
rural (0.28 ppbV) and urban air (1.04 ppbV) in Switzerland [BUWAL, 1999] were in the same
order and were calculated to corresponding water equilibrium concentrations of 159 ng/L
(rural) and 587 ng/L (urban) by the author of this study using published temperature and
atmospheric pressure. MTBE air concentrations measured in mega cities in warm climate
were also in the same range in Kairo/ Egypt (1.28 ppbV) but showed significantly higher
concentrations in Porto Alegre/ Brazil (0.2 – 17 ppbV) and Mexico City/ Mexico (40 –
160 ppbV). However, these data (and also the Swiss data) were received by GC with flame
ionization detection measurement that generally can produce false-positive results [HALDEN
ET AL., 2001]. Comparing the data of this study to the measurements in New Jersey/ U.S.,
California/ U.S. and Switzerland, MTBE concentrations in Germany are about one order of a
magnitude lower. The difference may not simply be explained by significant variations of
MTBE emissions between the three countries because measured mean air concentrations of
0.82 ppbV in the U.S. and 0.66 ppbV in Switzerland for urban and rural areas do not differ
significantly although the use of MTBE in gasoline in the New Jersey (11 %) is about 5 times
higher than in Switzerland (2 - 3 %) [MRASEK, 2000] and Germany (1.35 – 1.71 %) [SCHOLZ,
2001; PAHLKE ET AL., 2000]. Assuming that the different use in the countries is the main
reason for varying MTBE concentrations, another possibility to explain the high atmospheric
concentrations in Switzerland may be false-positive MTBE concentration measurements. It
seems unclear to what extent local urban air with a higher MTBE concentration is mixed by
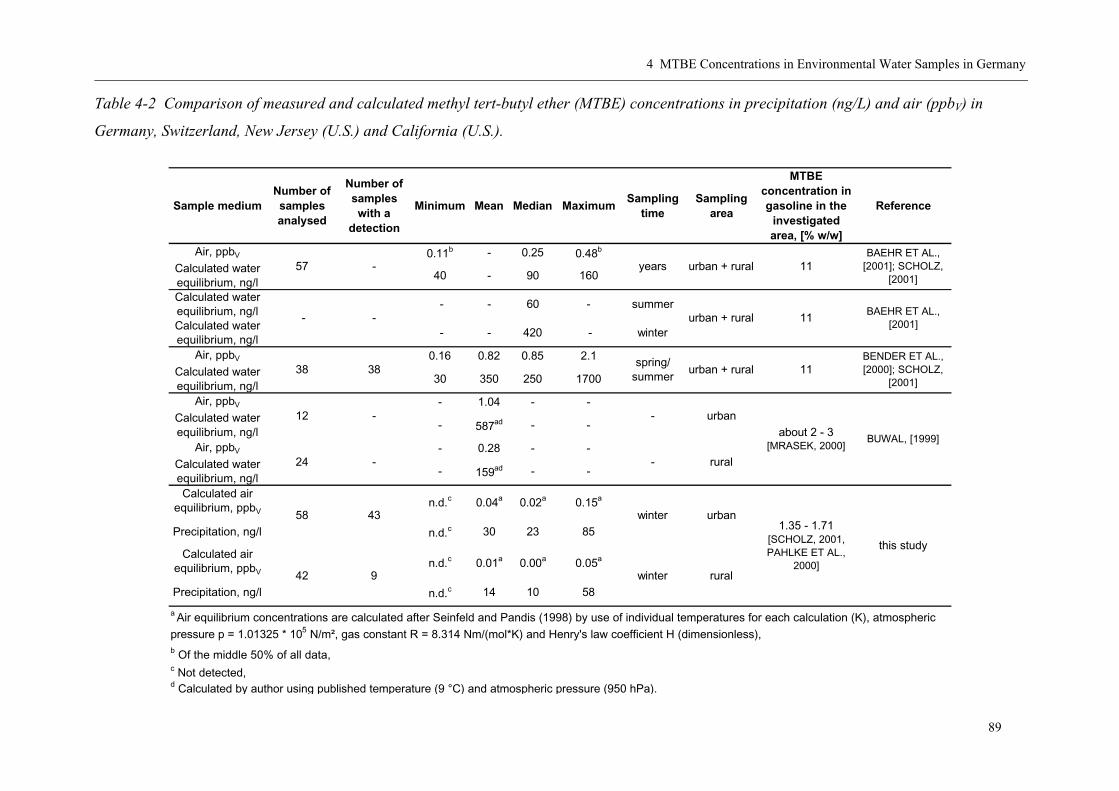
4 MTBE Concentrations in Environmental Water Samples in Germany
89
Table 4-2 Comparison of measured and calculated methyl tert-butyl ether (MTBE) concentrations in precipitation (ng/L) and air (ppbV) in
Germany, Switzerland, New Jersey (U.S.) and California (U.S.).
Sample mediumNumber of samples analysed
Number of samples with a
detection
Minimum Mean Median MaximumSampling
timeSampling
area
MTBE concentration in gasoline in the
investigated area, [% w/w]
Reference
Air, ppbV 0.11b - 0.25 0.48b
Calculated water equilibrium, ng/l
40 - 90 160
Calculated water equilibrium, ng/l
- - 60 - summer
Calculated water equilibrium, ng/l
- - 420 - winter
Air, ppbV 0.16 0.82 0.85 2.1Calculated water equilibrium, ng/l
30 350 250 1700
Air, ppbV - 1.04 - -Calculated water equilibrium, ng/l
- 587ad - -
Air, ppbV - 0.28 - -Calculated water equilibrium, ng/l
- 159ad - -
Calculated air equilibrium, ppbV
n.d.c 0.04a 0.02a 0.15a
Precipitation, ng/l n.d.c 30 23 85
Calculated air equilibrium, ppbV
n.d.c 0.01a 0.00a 0.05a
Precipitation, ng/l n.d.c 14 10 58
b Of the middle 50% of all data, c Not detected, d Calculated by author using published temperature (9 °C) and atmospheric pressure (950 hPa).
BAEHR ET AL., [2001]
- urban + rural 11
38spring/
summerurban + rural
24 -
12 --
-
57 11
BENDER ET AL., [2000]; SCHOLZ,
[2001]11
BAEHR ET AL., [2001]; SCHOLZ,
[2001]years urban + rural
38
-
-
winter
BUWAL, [1999]
urban
rural
about 2 - 3 [MRASEK, 2000]
urban
a Air equilibrium concentrations are calculated after Seinfeld and Pandis (1998) by use of individual temperatures for each calculation (K), atmospheric pressure p = 1.01325 * 105 N/m², gas constant R = 8.314 Nm/(mol*K) and Henry's law coefficient H (dimensionless),
1.35 - 1.71 [SCHOLZ, 2001, PAHLKE ET AL.,
2000]
this study
43
9 winter42 rural
58
4 MTBE Concentrations in Environmental Water Samples in Germany
90
other air of the upper atmosphere or from remote areas with a lower MTBE content. If for
example the studies are compared by assuming a mean MTBE content of 3 % for the U.S.
[SCHOLZ, 2001] measured MTBE air concentrations in the U.S. and Switzerland would be
comparable. Generally, atmospheric MTBE can be transported for long distances, e.g.
throughout Europe [SCHOLZ, 2001] regarding the half-life time of 5.5 days in the atmosphere
[RIPPEN, 1994; BENNETT AND KERR, 1990]. This may be even more important in the
wintertime, when less hydroxyl radicals are produced. Detectable MTBE concentrations in
rural snow samples can thereby be explained. Neglecting all calculations and possibly
differing origin of MTBE in air and precipitation, low measured concentrations in
precipitation and higher amounts in the air may represent the degradation process in the
atmosphere or the photochemical degradation of MTBE in the gas phase and the chemical
degradation in the water phase. The wash-out effect will also contribute to different MTBE
concentrations in the air and precipitation.
Different urban sampling methods (e.g. distance to road traffic) might also be a reason for
varying measured atmospheric MTBE concentrations. Urban air sampling frequently occurred
next to a road only a few meters or centimeters above the ground whereas precipitation
sampling occurred on the roof of the Institut für Mineralogie –Umweltanalytik at
Frankfurt/ M city about 10 m above and 200 m away from direct road traffic.
4.1.4.3 Urban Runoff
Urban runoff samples (n = 12) that were collected on a road 500 m away from precipitation
sampling at Frankfurt/ M at the same time showed a wide concentration range from
30 – 1174 ng/L with a median (mean) concentration of 114 ng/L (204 ng/L). Due to the low
sample amount, only rough estimations can be made. By comparing MTBE in urban runoff to
MTBE in precipitation in the wintertime in Germany, the results indicate that about 20 % of
the MTBE in urban runoff may already be transported by precipitation down to a vertical
hight of about 10 m above the ground whereas about 80 % may be attributed to direct uptake
of vehicle emissions and gasoline on the road. In the U.S. the mean and median water
equilibrium concentrations of 90 - 420 ng/L (calculated from air measurement by BENDER ET
AL., 2000; BAEHR ET AL., 1999 AND 2001) represent about 5 – 30 % of the mean stormwater
concentration of 1500 ng/L (200 – 8700 ng/L, n = 592), [LOPES AND BENDER, 1998; DELZER
ET AL., 1996].
4 MTBE Concentrations in Environmental Water Samples in Germany
91
4.1.5 Conclusions
The results of this study show the presence of MTBE in urban and rural precipitation in
Germany in wintertimes. In urban precipitation, MTBE is observed at ambient temperatures
lower than about 10 - 15 °C whereas highest concentrations are detected in snow samples.
Wash-out mechanisms known from other organic compounds are observed. Due to the year
round use of MTBE in Germany a persistent behavior in the atmosphere in wintertimes that
leads to detectable concentrations in precipitation can be concluded. MTBE concentrations in
Germany in the wintertime are about one order of a magnitude lower than year round and
summertime measurements in the U.S. and in Switzerland. Possibilities to explain the
difference include a wide variety of assumptions. It cannot be clarified whether the different
use of the ether in gasoline in the countries, analytical uncertainty, atmospheric degradation
processes or a combination of all are responsible. More research is needed in this field. The
comparison of MTBE concentrations in precipitation and urban runoff have shown that
about 20 % of the MTBE detected in urban runoff is already transported in the atmosphere
before precipitation whereas about 80 % may be attributed to direct uptake of vehicle
emissions and gasoline on road.
4.2 MTBE in River and Waste Water
4.2.1 Abstract
An overview of methyl tert-butyl ether (MTBE) concentrations in German river water
(315 samples) and waste water (82 samples) is given. In the agglomerated area of Frankfurt/
M, several samples of surface water, waste water and industrial effluents were analyzed for its
MTBE content from 1999 to 2001. MTBE was analyzed by a combination of headspace-
solid-phase microextraction and gas chromatography/ mass spectrometry (HS-SPME/ GC-
MS). Rhine and Main water concentrations of MTBE in the lower parts of the rivers were
approximately 250 ng/l and 200 ng/L, respectively. The concentrations increased from the
upper parts of the rivers to its mouths. Water from the Elbe, Neckar and Weser rivers showed
lower MTBE concentrations and the ether was not detected in the Danube river. Generally,
higher MTBE concentrations were detected at urban agglomerations compared to rural areas.
Small urban creeks without significant industrial input showed MTBE concentrations of
approximately 50 ng/L and it was hardly detectable in small rural creeks. Higher MTBE
4 MTBE Concentrations in Environmental Water Samples in Germany
92
concentrations in river water were correlated with increased concentrations of the oxygenate
measured in precipitation. The analyzed river water samples showed a tendency towards
increasing concentrations from 1999 to 2001. Most MTBE concentrations in river water fell
in the range of 50 – 200 ng/L (32 %), 10 – 50 ng/L (28 %) and 200 – 1000 ng/L (26 %).
MTBE concentrations in German surface water and air are 2 – 17 times lower compared to
Californian data. Waste water samples from influents of two sewage plants showed MTBE
concentrations of approximately 100 – 300 ng/L and a loading of 2 – 37 kg/a was calculated.
Industrially influenced samples of river water or public waste water and industrial effluents
showed MTBE concentrations up to 2267 ng/L and 28 µg/L, respectively. This input has not
been considered before because only 1.5 % of the produced amount of MTBE in Germany is
used for industrial processes but it should not be neglected because MTBE is very persistent
in water.
4.2.2 Introduction
In the last years, the intensive use of the oxygenate methyl tert-butyl ether (MTBE) has led to
major concern about its distribution in the aquatic environment and its occurrence in drinking
water resources in the U.S. [CLAWGES ET AL., 2001]. In Germany, authorities only recently
began to evaluate the MTBE situation in the country [PAHLKE ET AL., 2000] and decided not
to implement a drinking water and surface water standard because MTBE concentrations in
Germany are believed to be generally low. Other reasons for the decision were the presence of
significantly lower MTBE concentrations in german gasoline compared to some U.S. states,
decreasing MTBE emissions from automobiles and handling of MTBE by improved
technology, such as use of double-sided tanks at gasoline stations from 1992 to 1998.
Additionally, the WORLD HEALTH ORGANIZATION‘s conclusion in 1998 that acute health risks
for the public are unlikely [WHO, 1998] was used as an argument. The Umweltbundesamt
estimated a reduction of MTBE emissions in Germany from approximately 6000 t/a in 1992
to approximately 2200 t/a in 1999. However, monitoring of the oxygenate particularly at sites
contaminated with gasoline has been intensified by the Umweltbundesamt [PAHLKE ET AL.,
2000] because concentrations are generally higher at these sites.
An elevation in MTBE emissions due to increasing concentrations in gasoline since 1992/
1993 and a greater number of registered cars in the country from 1994 (39 mio) to 2001 (44
mio) [STATISTISCHES BUNDESAMT, 2001] can be expected. It seems unclear if the effect of
reduced MTBE emissions from automobiles and improved handling of gasoline dominates,

4 MTBE Concentrations in Environmental Water Samples in Germany
93
compensates for or secondarily influences the effect of the increasing use of the oxygenate. In
2005, a new guideline will be introduced by the European Union limiting the amount of
aromatic compounds in gasoline to 35% (v/v). It is not yet clear however how the required
octane values will then be reached.
MTBE is emitted by different sources into the aquatic environment. Due to its solubility and
persistence in water, it is diluted by large amounts of surface and ground water and can be
transported over long distances [PANKOW ET AL., 1996] without needing to be adsorbed to
particles. Leakage from underground storage tanks (LUST’s) at high concentrations into
groundwater represents the most important pathway in terms of its introduction to the
environment [WEAVER ET AL., 1996; BORDEN ET AL., 1997; BUXTON ET AL., 1997; DALY AND
LINDSEY, 1997; GRADY, 1998; LANDMEYER ET AL., 1998;, ZOGORSKI ET AL., 1998; MACE ET
AL., 1998; SCHIRMER AND BARKER, 1998; LINCE ET AL., 1998 AND 2001; MORAN ET AL.,
1999; HATTEN AND BLACKBURN, 1999; HAPPEL ET AL., 1999, JOHNSON ET AL., 2000; KOLB
2000; EFFENBERGER ET AL., 2001]. Recreational watercraft is another known emission source
that causes MTBE contamination in the upper water zones of lakes in the summertime when
its use is highest [BAEHR AND ZAPECZA, 1998; BOUGHTON AND LICO, 1998; REUTER ET AL.,
1998; BROWN ET AL., 2001]. Studies of two-stroke engines showed that up to 30 % of
unburnded fuel is discharged into the environment [ARB, 1999]. Industrial effluents represent
another point source for MTBE in river water. In Southern California, highest MTBE
concentrations (up to 1878 µg/L) were observed in effluents from refineries [BROWN ET AL.,
2001]. However, discharges from public sewage plants accounted for 78 % of the daily mass
emission of MTBE. For Santa Monica, a load of 78 t/a of MTBE from all industrial effluents
was calculated. Its presence in effluents has in fact been reported by the chemical industry. In
Germany, for example, one chemical company reported emitting a total of 1.9 t of MTBE into
the Rhine river in 1998 [BASF, 1999].
The occurrence of MTBE in the hydrological cycle and its impact as a non-point source
contaminant has been investigated in several studies [DELZER ET AL., 1996; PANKOW ET AL.,
1997; LOPES AND BENDER, 1998; REISER AND O’BRIEN, 1998, BRAUCH ET AL., 2000A,
EFFENBERGER ET AL., 2001, BENDER ET AL., 2000; BAEHR ET AL., 1999 AND 2001; ACHTEN
AND PÜTTMANN, 2000; ACHTEN ET AL., 2001A AND 2002B, CLAWGES ET AL., 2000]. The
detection of MTBE in urban runoff [DELZER ET AL., 1996; LOPES AND BENDER, 1998] first
indicated that parts of the oxygenate added to gasoline and used by automobiles is transported
from the gaseous phase from exhausts into the aqueous phase during precipitation events.
MTBE measurement in air samples taken in a tunnel in Los Angeles showed that 155 mg of
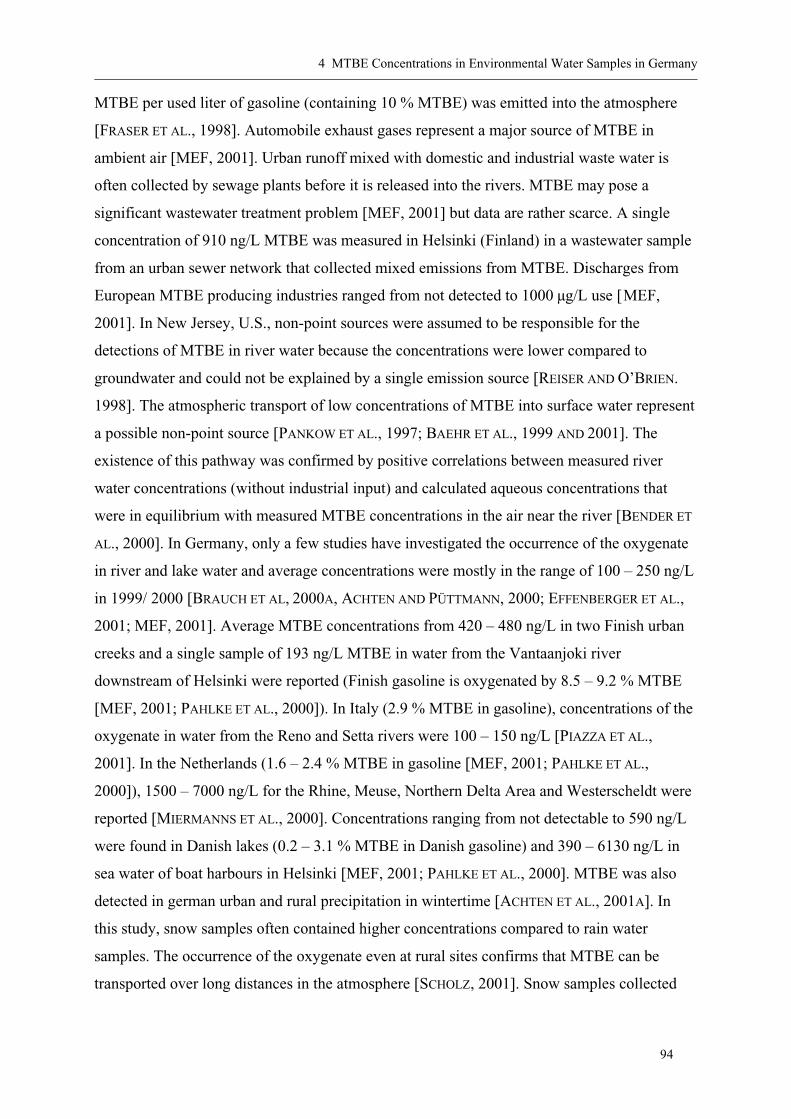
4 MTBE Concentrations in Environmental Water Samples in Germany
94
MTBE per used liter of gasoline (containing 10 % MTBE) was emitted into the atmosphere
[FRASER ET AL., 1998]. Automobile exhaust gases represent a major source of MTBE in
ambient air [MEF, 2001]. Urban runoff mixed with domestic and industrial waste water is
often collected by sewage plants before it is released into the rivers. MTBE may pose a
significant wastewater treatment problem [MEF, 2001] but data are rather scarce. A single
concentration of 910 ng/L MTBE was measured in Helsinki (Finland) in a wastewater sample
from an urban sewer network that collected mixed emissions from MTBE. Discharges from
European MTBE producing industries ranged from not detected to 1000 µg/L use [MEF,
2001]. In New Jersey, U.S., non-point sources were assumed to be responsible for the
detections of MTBE in river water because the concentrations were lower compared to
groundwater and could not be explained by a single emission source [REISER AND O’BRIEN.
1998]. The atmospheric transport of low concentrations of MTBE into surface water represent
a possible non-point source [PANKOW ET AL., 1997; BAEHR ET AL., 1999 AND 2001]. The
existence of this pathway was confirmed by positive correlations between measured river
water concentrations (without industrial input) and calculated aqueous concentrations that
were in equilibrium with measured MTBE concentrations in the air near the river [BENDER ET
AL., 2000]. In Germany, only a few studies have investigated the occurrence of the oxygenate
in river and lake water and average concentrations were mostly in the range of 100 – 250 ng/L
in 1999/ 2000 [BRAUCH ET AL, 2000A, ACHTEN AND PÜTTMANN, 2000; EFFENBERGER ET AL.,
2001; MEF, 2001]. Average MTBE concentrations from 420 – 480 ng/L in two Finish urban
creeks and a single sample of 193 ng/L MTBE in water from the Vantaanjoki river
downstream of Helsinki were reported (Finish gasoline is oxygenated by 8.5 – 9.2 % MTBE
[MEF, 2001; PAHLKE ET AL., 2000]). In Italy (2.9 % MTBE in gasoline), concentrations of the
oxygenate in water from the Reno and Setta rivers were 100 – 150 ng/L [PIAZZA ET AL.,
2001]. In the Netherlands (1.6 – 2.4 % MTBE in gasoline [MEF, 2001; PAHLKE ET AL.,
2000]), 1500 – 7000 ng/L for the Rhine, Meuse, Northern Delta Area and Westerscheldt were
reported [MIERMANNS ET AL., 2000]. Concentrations ranging from not detectable to 590 ng/L
were found in Danish lakes (0.2 – 3.1 % MTBE in Danish gasoline) and 390 – 6130 ng/L in
sea water of boat harbours in Helsinki [MEF, 2001; PAHLKE ET AL., 2000]. MTBE was also
detected in german urban and rural precipitation in wintertime [ACHTEN ET AL., 2001A]. In
this study, snow samples often contained higher concentrations compared to rain water
samples. The occurrence of the oxygenate even at rural sites confirms that MTBE can be
transported over long distances in the atmosphere [SCHOLZ, 2001]. Snow samples collected

4 MTBE Concentrations in Environmental Water Samples in Germany
95
from heaps near a busy road showed high MTBE concentrations of 720 – 7030 ng/L in Italy
[PIAZZA ET AL., 2001].
In the U.S., the impact of MTBE concentrations in groundwater and surface water on drinking
water quality is subject of many environmental studies. In Germany, extensive data of MTBE
concentrations in the aquatic and atmospheric environment are not available. The lack of data
is responsible for different evaluations of the environmental and human health impacts of
MTBE in Germany [SCHOLZ, 2001; PAHLKE ET AL., 2000]. The primary objective of this
study is to give an overview of MTBE concentrations in German surface waters. Secondary
objectives are to identify emission sources of different source strengths and to recognize a
possible trend in the development of the MTBE concentrations over time. In this study,
MTBE concentrations in water samples of rivers and rural creeks in Germany, and rivers,
urban creeks (with and without industrial input), domestic and industrial waste water in the
agglomerated area of Frankfurt/ M were observed. To our knowledge, this is the first report
on a detailed distribution of aquatic MTBE in an agglomerated area in Germany.
4.2.3 Waste Water Processing at Sewage Plants Frankfurt/ M-Niederrad and
Sindlingen
Specifically, waste water samples were collected from two sewage plants (Frankfurt/ M-
Niederrad and Sindlingen) in wintertime 2000/ 2001. Sampling and analyses are detailled in
the following sections. The processing of waste water at the sewage plants Frankfurt/ M-
Niederrad and Sindlingen are similar and include three clarification and two biological steps.
Raw water is pumped through rakes and coarse solid material is separated mechanically from
the water. The water is then transported into a sand trap where the first sedimentation process
occurs. In the first clarification basin (pre-clarification), sludge partitions from water and
present organisms can degrade pollutants. The pre-clarification is followed by the first
biological step. In this basin, air is bubbled into the water that stimulates particularly
heterotrophic bacteria. During the aerobic process, most pollutants are eliminated due to
biological activity and volatilization. During the second (intermediate) clarification process,
sedimented sludge is pumped partially into the basin of the first biological step for improved
biological activity in the basin. During the second biological step, microbial activity is
stimulated by introduced sludge from the following third (post) clairfication step and the
addition of air. After the post clarification process and a mean residence time in the sewage
plant of about 12 h, the water is pumped into river water.
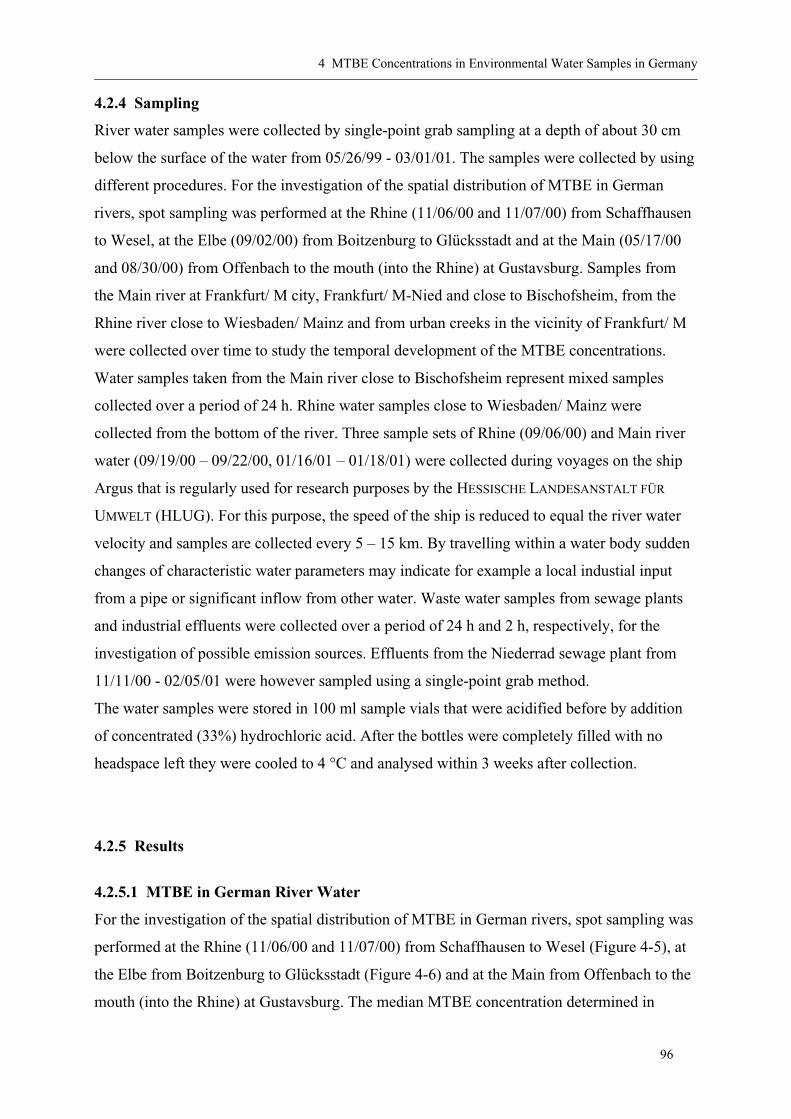
4 MTBE Concentrations in Environmental Water Samples in Germany
96
4.2.4 Sampling
River water samples were collected by single-point grab sampling at a depth of about 30 cm
below the surface of the water from 05/26/99 - 03/01/01. The samples were collected by using
different procedures. For the investigation of the spatial distribution of MTBE in German
rivers, spot sampling was performed at the Rhine (11/06/00 and 11/07/00) from Schaffhausen
to Wesel, at the Elbe (09/02/00) from Boitzenburg to Glücksstadt and at the Main (05/17/00
and 08/30/00) from Offenbach to the mouth (into the Rhine) at Gustavsburg. Samples from
the Main river at Frankfurt/ M city, Frankfurt/ M-Nied and close to Bischofsheim, from the
Rhine river close to Wiesbaden/ Mainz and from urban creeks in the vicinity of Frankfurt/ M
were collected over time to study the temporal development of the MTBE concentrations.
Water samples taken from the Main river close to Bischofsheim represent mixed samples
collected over a period of 24 h. Rhine water samples close to Wiesbaden/ Mainz were
collected from the bottom of the river. Three sample sets of Rhine (09/06/00) and Main river
water (09/19/00 – 09/22/00, 01/16/01 – 01/18/01) were collected during voyages on the ship
Argus that is regularly used for research purposes by the HESSISCHE LANDESANSTALT FÜR
UMWELT (HLUG). For this purpose, the speed of the ship is reduced to equal the river water
velocity and samples are collected every 5 – 15 km. By travelling within a water body sudden
changes of characteristic water parameters may indicate for example a local industial input
from a pipe or significant inflow from other water. Waste water samples from sewage plants
and industrial effluents were collected over a period of 24 h and 2 h, respectively, for the
investigation of possible emission sources. Effluents from the Niederrad sewage plant from
11/11/00 - 02/05/01 were however sampled using a single-point grab method.
The water samples were stored in 100 ml sample vials that were acidified before by addition
of concentrated (33%) hydrochloric acid. After the bottles were completely filled with no
headspace left they were cooled to 4 °C and analysed within 3 weeks after collection.
4.2.5 Results
4.2.5.1 MTBE in German River Water
For the investigation of the spatial distribution of MTBE in German rivers, spot sampling was
performed at the Rhine (11/06/00 and 11/07/00) from Schaffhausen to Wesel (Figure 4-5), at
the Elbe from Boitzenburg to Glücksstadt (Figure 4-6) and at the Main from Offenbach to the
mouth (into the Rhine) at Gustavsburg. The median MTBE concentration determined in
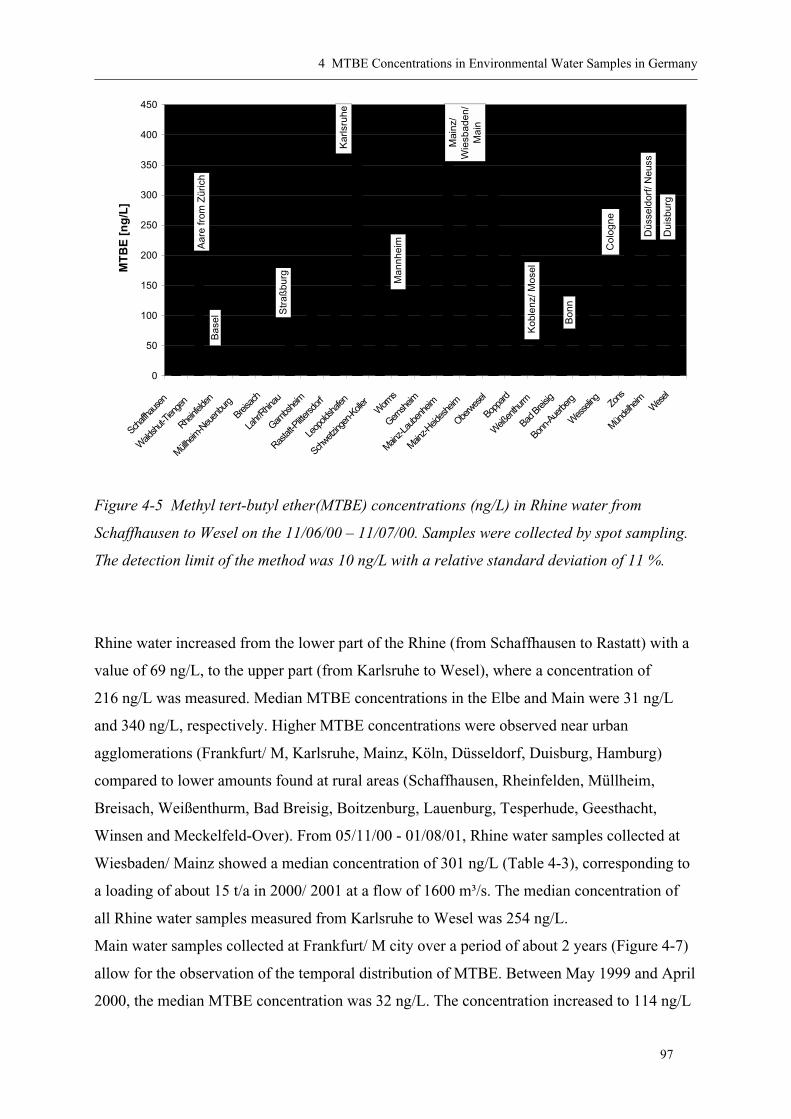
4 MTBE Concentrations in Environmental Water Samples in Germany
97
0
50
100
150
200
250
300
350
400
450
Schaff
haus
en
Wald
shut-
Tieng
en
Rheinf
elden
Müllheim
-Neu
enbu
rgBrei
sach
Lahr/
Rhinau
Gambs
heim
Rastat
t-Plitte
rsdorf
Leop
oldsh
afen
Schwetz
ingen
-Kolle
rW
orms
Gernsh
eim
Mainz-L
aube
nheim
Mainz-H
eides
heim
Oberw
esel
Boppa
rd
Weiß
enthu
rm
Bad B
reisig
Bonn-A
uerbe
rg
Wes
seling Zo
ns
Münde
lheim
Wes
el
Bas
el
Str
aßbu
rg
Kar
lsru
he
Man
nhei
m
Mai
nz/
Wie
sbad
en/
Mai
n
Kob
lenz
/ Mos
el
Bon
n
Col
ogne
Düs
seld
orf/
Neu
ss
Dui
sbur
g
MT
BE
[n
g/L
]
Aar
e fr
om Z
üric
h
Flow direction
Figure 4-5 Methyl tert-butyl ether(MTBE) concentrations (ng/L) in Rhine water from
Schaffhausen to Wesel on the 11/06/00 – 11/07/00. Samples were collected by spot sampling.
The detection limit of the method was 10 ng/L with a relative standard deviation of 11 %.
Rhine water increased from the lower part of the Rhine (from Schaffhausen to Rastatt) with a
value of 69 ng/L, to the upper part (from Karlsruhe to Wesel), where a concentration of
216 ng/L was measured. Median MTBE concentrations in the Elbe and Main were 31 ng/L
and 340 ng/L, respectively. Higher MTBE concentrations were observed near urban
agglomerations (Frankfurt/ M, Karlsruhe, Mainz, Köln, Düsseldorf, Duisburg, Hamburg)
compared to lower amounts found at rural areas (Schaffhausen, Rheinfelden, Müllheim,
Breisach, Weißenthurm, Bad Breisig, Boitzenburg, Lauenburg, Tesperhude, Geesthacht,
Winsen and Meckelfeld-Over). From 05/11/00 - 01/08/01, Rhine water samples collected at
Wiesbaden/ Mainz showed a median concentration of 301 ng/L (Table 4-3), corresponding to
a loading of about 15 t/a in 2000/ 2001 at a flow of 1600 m³/s. The median concentration of
all Rhine water samples measured from Karlsruhe to Wesel was 254 ng/L.
Main water samples collected at Frankfurt/ M city over a period of about 2 years (Figure 4-7)
allow for the observation of the temporal distribution of MTBE. Between May 1999 and April
2000, the median MTBE concentration was 32 ng/L. The concentration increased to 114 ng/L
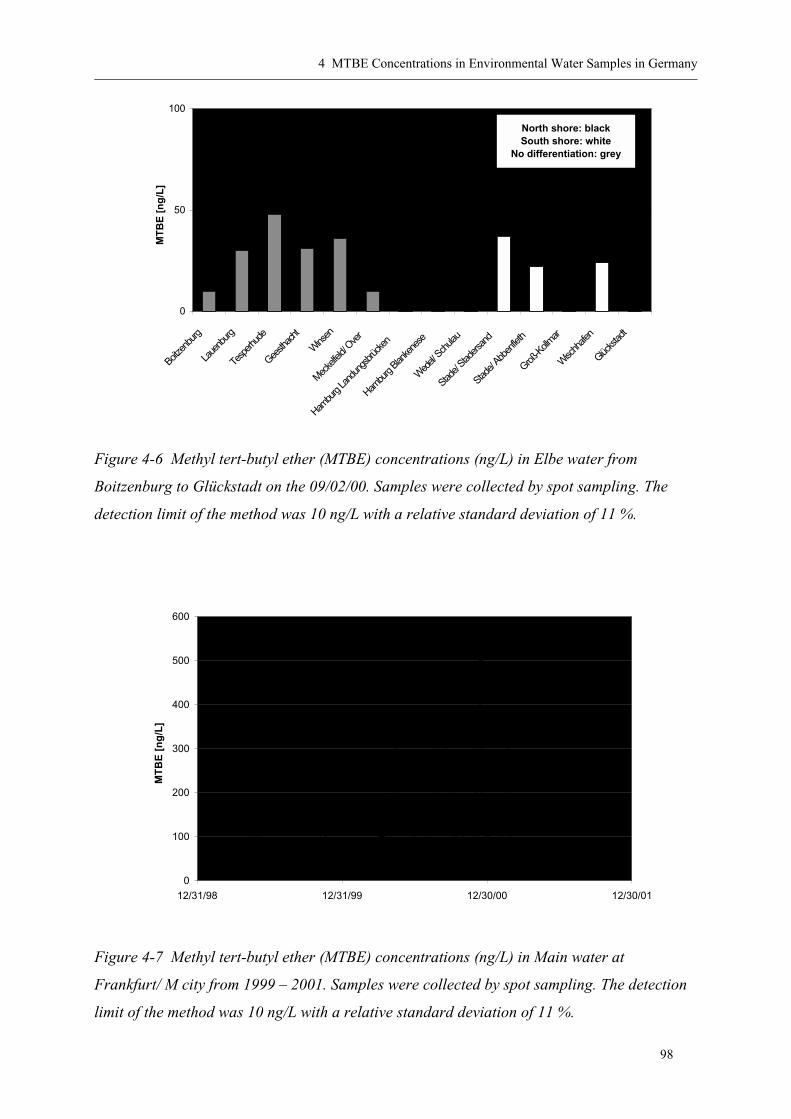
4 MTBE Concentrations in Environmental Water Samples in Germany
98
0
50
100
Boitze
nburg
Laue
nburg
Tesp
erhud
e
Geesth
acht
Winsen
Mecke
lfeld/
Ove
r
Hambu
rg La
ndun
gsbrü
cken
Hambu
rg Bla
nken
ese
Wed
el/ Sch
ulau
Stade/
Staders
and
Stade/
Abben
fleth
Groß-K
ollmar
Wischh
afen
Glücks
tadt
North shore: blackSouth shore: white
No differentiation: greyM
TB
E [
ng
/L]
Flow direction
Figure 4-6 Methyl tert-butyl ether (MTBE) concentrations (ng/L) in Elbe water from
Boitzenburg to Glückstadt on the 09/02/00. Samples were collected by spot sampling. The
detection limit of the method was 10 ng/L with a relative standard deviation of 11 %.
0
100
200
300
400
500
600
12/31/98 12/31/99 12/30/00 12/30/01
MT
BE
[n
g/L
] .
Figure 4-7 Methyl tert-butyl ether (MTBE) concentrations (ng/L) in Main water at
Frankfurt/ M city from 1999 – 2001. Samples were collected by spot sampling. The detection
limit of the method was 10 ng/L with a relative standard deviation of 11 %.
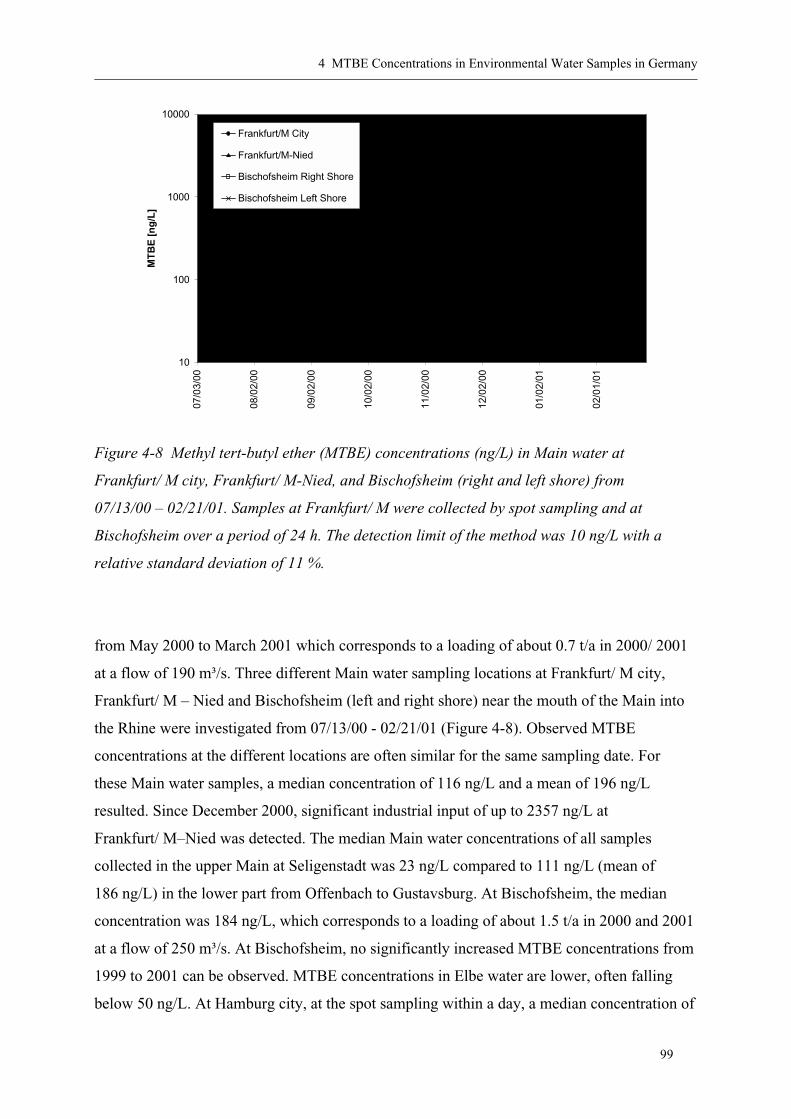
4 MTBE Concentrations in Environmental Water Samples in Germany
99
10
100
1000
10000
07/0
3/00
08/0
2/00
09/0
2/00
10/0
2/00
11/0
2/00
12/0
2/00
01/0
2/01
02/0
1/01
MT
BE
[n
g/L
]
Frankfurt/M City
Frankfurt/M-Nied
Bischofsheim Right Shore
Bischofsheim Left Shore
Figure 4-8 Methyl tert-butyl ether (MTBE) concentrations (ng/L) in Main water at
Frankfurt/ M city, Frankfurt/ M-Nied, and Bischofsheim (right and left shore) from
07/13/00 – 02/21/01. Samples at Frankfurt/ M were collected by spot sampling and at
Bischofsheim over a period of 24 h. The detection limit of the method was 10 ng/L with a
relative standard deviation of 11 %.
from May 2000 to March 2001 which corresponds to a loading of about 0.7 t/a in 2000/ 2001
at a flow of 190 m³/s. Three different Main water sampling locations at Frankfurt/ M city,
Frankfurt/ M – Nied and Bischofsheim (left and right shore) near the mouth of the Main into
the Rhine were investigated from 07/13/00 - 02/21/01 (Figure 4-8). Observed MTBE
concentrations at the different locations are often similar for the same sampling date. For
these Main water samples, a median concentration of 116 ng/L and a mean of 196 ng/L
resulted. Since December 2000, significant industrial input of up to 2357 ng/L at
Frankfurt/ M–Nied was detected. The median Main water concentrations of all samples
collected in the upper Main at Seligenstadt was 23 ng/L compared to 111 ng/L (mean of
186 ng/L) in the lower part from Offenbach to Gustavsburg. At Bischofsheim, the median
concentration was 184 ng/L, which corresponds to a loading of about 1.5 t/a in 2000 and 2001
at a flow of 250 m³/s. At Bischofsheim, no significantly increased MTBE concentrations from
1999 to 2001 can be observed. MTBE concentrations in Elbe water are lower, often falling
below 50 ng/L. At Hamburg city, at the spot sampling within a day, a median concentration of

4 MTBE Concentrations in Environmental Water Samples in Germany
100
10
100
1000
10000
07/0
1/00
08/0
1/00
09/0
1/00
10/0
2/00
11/0
2/00
12/0
3/00
01/0
3/01
02/0
3/01
Nidda/ Nied
Kinzig/ Hanau
Schwarzbach/ Trebur
Landgraben/ Trebur
Main (Mean)
MT
BE
[n
g/L
]
10/2
3/00
Figure 4-9 Methyl tert-butyl ether (MTBE) concentrations (ng/L) in water from small urban
creeks and from the Main river (mean) from 12/07/00 – 02/21/01. Samples were collected by
spot sampling. The detection limit of the method was 10 ng/L with a relative standard
deviation of 11 %.
82 ng/L was observed. From 04/22/99 - 02/14/01 the median concentration at Hamburg city
was 59 ng/L. MTBE is not detected in any water sample of the Danube river in the South of
Germany, but in Weser water in the North of the country, in the range of 126 – 162 ng/L.
From 07/12/00 - 02/21/01, MTBE was also detected in small creeks in the vicinity of
Frankfurt/ M (Figure 4-9). Median concentrations in water from the Schwarzbach of
155 ng/L, Landgraben of 1183 ng/L, Nidda of 25 ng/L and Kinzig of 32 ng/L are calculated.
For comparison, the mean Main water concentration is shown. The annual MTBE loading in
2000/ 2001 for the Nidda at Nied and Kinzig at Hanau were about 150 kg/a each at flows of
10 – 11 m³/s. In all rivers, exceptionally high concentrations were observed on 10/23/00. The
temporal distribution of the MTBE concentrations in the different creeks sometimes correlate.
Good correlation is observed by comparing of the Nidda and Kinzig rivers that are mainly
free of industial input. In Lahn water, the MTBE concentrations show a median concentration
of 43 ng/L which increase from the source to the mouth (Figure 4-10). However, no

4 MTBE Concentrations in Environmental Water Samples in Germany
101
0
50
100
150
200
250
300
350
400
06/0
1/00
07/0
2/00
08/0
2/00
09/0
2/00
10/0
3/00
11/0
3/00
MT
BE
[ng
/L]
Coelbe Lahnau Oberbiel Limburg-Staffel
Figure 4-10 Methyl tert-butyl ether (MTBE) concentrations (ng/L) in water from Lahn creek
12/07/00 – 02/21/01. Samples were collected by spot sampling. The detection limit of the
method was 10 ng/L with a relative standard deviation of 11 %.
maximum value is observed at the 10/23/00 and from August to November 2000 the
concentrations do not increase as observed for other river water. Water samples from channels
and nearby rivers were investigated at four locations. In Germany, channels are often located
near natural rivers, and due to higher ship’s traffic and lower river water velocities caused by
locks, it had been assumed that water from channels would have higher MTBE concentrations
compared to near river water. MTBE concentrations in water samples of the Mittellandkanal
(204 ng/L) and the Weser (162 ng/L) at Bremen, of the Elbe-Lübeck-Kanal (55 ng/L) and the
Elbe (30 ng/l) at Lauenburg and of the Grand Canal D’Alsace (127 ng/L) and the Rhine
(13 ng/L) at Müllheim confirm this assumption. 736 ng/L was measured in Lippe water
compared to 28 ng/L in water from the Wesel-Datteln-Kanal at Wesel (11/06/00). The results
of the analysis of 38 small creek water samples in Germany show only low concentrations
with a median of 12 ng/L.
Detection frequencies of all measured samples are shown in Figure 4-11. The highest
numbers of MTBE concentrations in all river water samples (n = 315) were detected in the
ranges from 50 – 200 ng/L (32 %), 10 – 50 ng/L (28 %) and 200 – 1000 ng/L (26 %). In Main
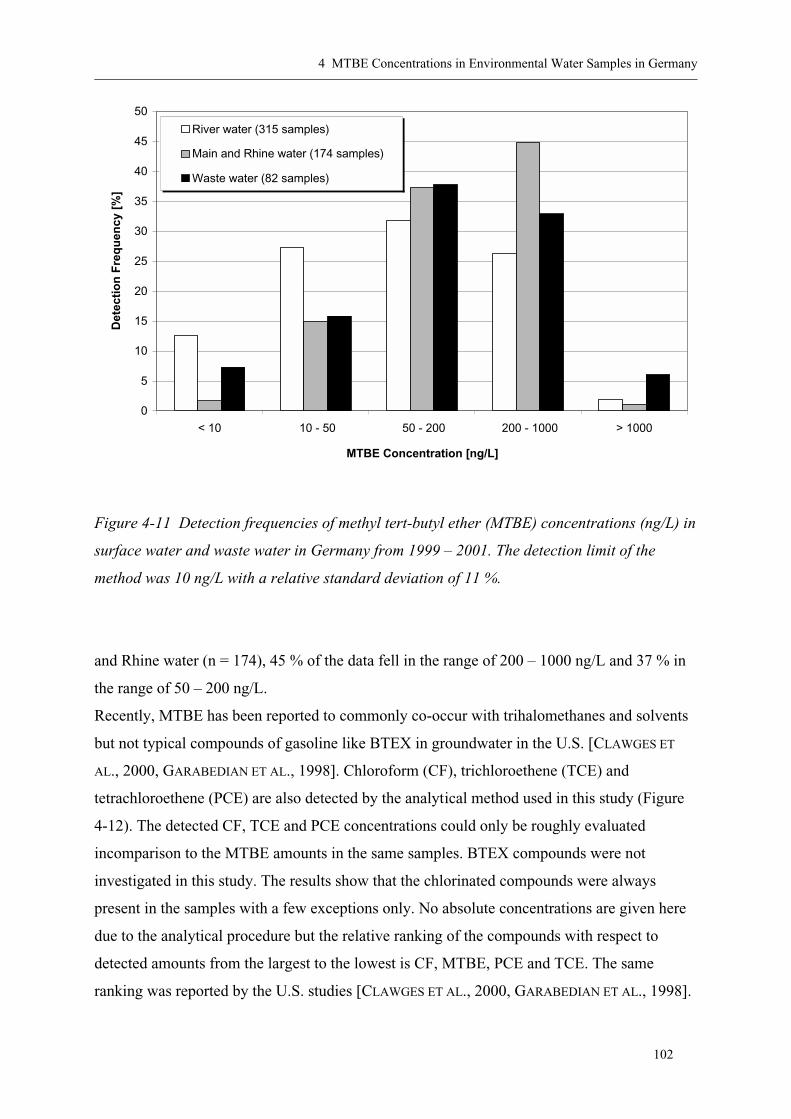
4 MTBE Concentrations in Environmental Water Samples in Germany
102
0
5
10
15
20
25
30
35
40
45
50
< 10 10 - 50 50 - 200 200 - 1000 > 1000
MTBE Concentration [ng/L]
Det
ecti
on
Fre
qu
ency
[%
]River water (315 samples)
Main and Rhine water (174 samples)
Waste water (82 samples)
Figure 4-11 Detection frequencies of methyl tert-butyl ether (MTBE) concentrations (ng/L) in
surface water and waste water in Germany from 1999 – 2001. The detection limit of the
method was 10 ng/L with a relative standard deviation of 11 %.
and Rhine water (n = 174), 45 % of the data fell in the range of 200 – 1000 ng/L and 37 % in
the range of 50 – 200 ng/L.
Recently, MTBE has been reported to commonly co-occur with trihalomethanes and solvents
but not typical compounds of gasoline like BTEX in groundwater in the U.S. [CLAWGES ET
AL., 2000, GARABEDIAN ET AL., 1998]. Chloroform (CF), trichloroethene (TCE) and
tetrachloroethene (PCE) are also detected by the analytical method used in this study (Figure
4-12). The detected CF, TCE and PCE concentrations could only be roughly evaluated
incomparison to the MTBE amounts in the same samples. BTEX compounds were not
investigated in this study. The results show that the chlorinated compounds were always
present in the samples with a few exceptions only. No absolute concentrations are given here
due to the analytical procedure but the relative ranking of the compounds with respect to
detected amounts from the largest to the lowest is CF, MTBE, PCE and TCE. The same
ranking was reported by the U.S. studies [CLAWGES ET AL., 2000, GARABEDIAN ET AL., 1998].

4 MTBE Concentrations in Environmental Water Samples in Germany
103
E:\Mtbe 1279 01/22/01 02:01:22 Main Frankfurt 20.1.01
RT: 5.24 - 13.67
5.5 6.0 6.5 7.0 7.5 8.0 8.5 9.0 9.5 10.0 10.5 11.0 11.5 12.0 12.5 13.0 13.5
Time (min)
0
50
100
0
50
100
0
50
100RelativeAbundance
0
50
100
d3MTBE
Chloroform
Trichloroethene
Tetrachloroethene
NL:1.49E5
m/z=75.5-76.5MS MTBE1279
NL:7.11E4
m/z=82.5-83.5MS MTBE1279
NL:1.59E4
m/z=94.5-95.5MS MTBE1279
NL:6.09E4
m/z=165.5-166.5MS MTBE1279
Figure 4-12 Mass chromatography of trichloromethane (chloroform, CF), trichloroethene (TCE), tetrachloroethene (PCE) and internal
standard d3MTBE in water from the Main river at Frankfurt/ M by use of the described method .
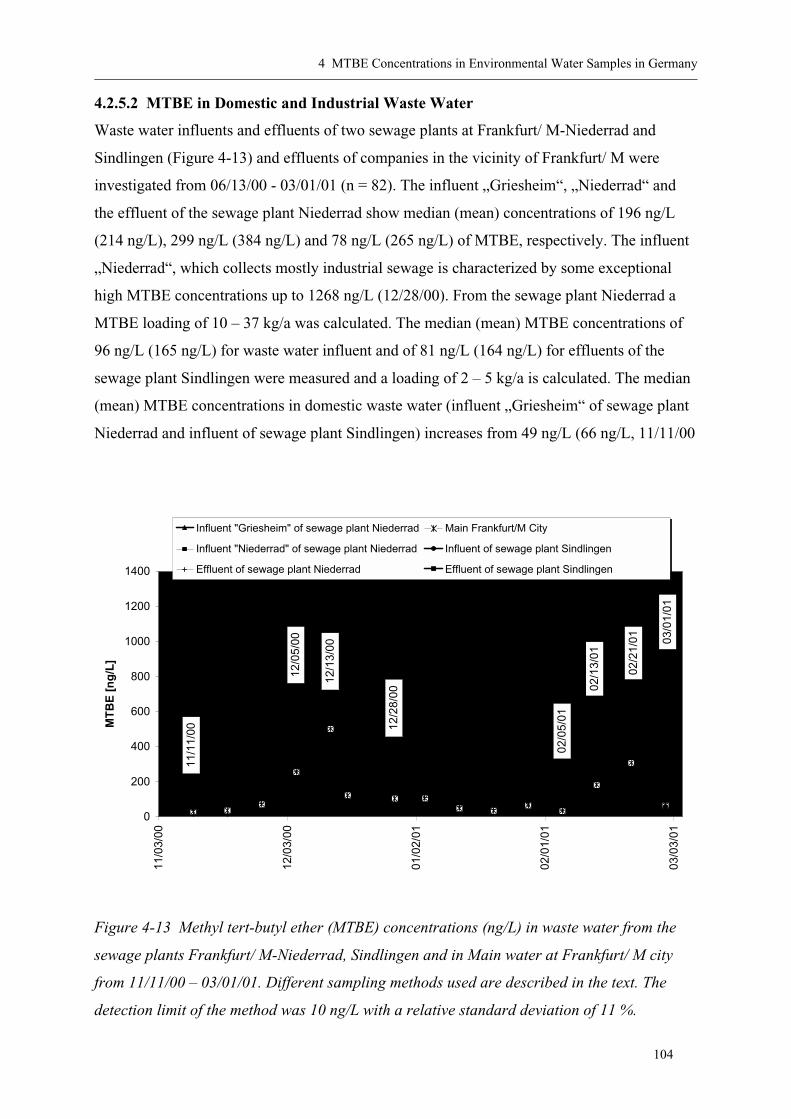
4 MTBE Concentrations in Environmental Water Samples in Germany
104
4.2.5.2 MTBE in Domestic and Industrial Waste Water
Waste water influents and effluents of two sewage plants at Frankfurt/ M-Niederrad and
Sindlingen (Figure 4-13) and effluents of companies in the vicinity of Frankfurt/ M were
investigated from 06/13/00 - 03/01/01 (n = 82). The influent „Griesheim“, „Niederrad“ and
the effluent of the sewage plant Niederrad show median (mean) concentrations of 196 ng/L
(214 ng/L), 299 ng/L (384 ng/L) and 78 ng/L (265 ng/L) of MTBE, respectively. The influent
„Niederrad“, which collects mostly industrial sewage is characterized by some exceptional
high MTBE concentrations up to 1268 ng/L (12/28/00). From the sewage plant Niederrad a
MTBE loading of 10 – 37 kg/a was calculated. The median (mean) MTBE concentrations of
96 ng/L (165 ng/L) for waste water influent and of 81 ng/L (164 ng/L) for effluents of the
sewage plant Sindlingen were measured and a loading of 2 – 5 kg/a is calculated. The median
(mean) MTBE concentrations in domestic waste water (influent „Griesheim“ of sewage plant
Niederrad and influent of sewage plant Sindlingen) increases from 49 ng/L (66 ng/L, 11/11/00
0
200
400
600
800
1000
1200
1400
11/0
3/00
12/0
3/00
01/0
2/01
02/0
1/01
03/0
3/01
MT
BE
[n
g/L
]
Influent "Griesheim" of sewage plant Niederrad Main Frankfurt/M City
Influent "Niederrad" of sewage plant Niederrad Influent of sewage plant Sindlingen
Effluent of sewage plant Niederrad Effluent of sewage plant Sindlingen
11/1
1/00
12/0
5/00
12/1
3/00
12/2
8/00
02/0
5/01
02/1
3/01
02/2
1/01 03
/01/
01
Figure 4-13 Methyl tert-butyl ether (MTBE) concentrations (ng/L) in waste water from the
sewage plants Frankfurt/ M-Niederrad, Sindlingen and in Main water at Frankfurt/ M city
from 11/11/00 – 03/01/01. Different sampling methods used are described in the text. The
detection limit of the method was 10 ng/L with a relative standard deviation of 11 %.
4 MTBE Concentrations in Environmental Water Samples in Germany
105
– 12/28/00) to 275 ng/L (272 ng/L, 12/28/00 – 03/01/01). From the limited corresponding
data, an elemination rate cannot be calculated. The results of 19 industrial effluent samples of
companies in the Frankfurt/ M area show two exceptional high inputs of 12,4 µg/L and
28,4 µg/L, whereas concentrations in other samples were generally low (median of 45 ng/L
and mean of 82 ng/L). Detection frequencies for all waste water samples (n = 82) were 38 %,
33 % and 6 %, falling in the concentration ranges of 50 – 200 ng/L, 200 – 1000 ng/L and
higher than 1000 ng/L, respectively (Figure 4-11).
4.2.6 Discussion
All river water samples of this study and other MTBE data of river water in Germany are
summarized in Table 4-3. The sample locations are shown in Figure 4-14.
The observation that higher MTBE concentrations occur in river water near urban
agglomerations compared to rural sites was also reported in U.S. studies [REISER AND
O’BRIEN, 1998; BROWN ET AL., 2001]. In 1999/ 2000, lower concentrations of 160 ng/L (n =
1) [ACHTEN AND PÜTTMANN, 2000] and 220 ng/L (n = 7) [BRAUCH ET AL., 2000A] were
reported for the samples taken at Wiesbaden/ Mainz, compared to the measured
concentrations in this study. The resulting MTBE loading in Rhine water at Wiesbaden/
Mainz in 1999 would have been about 3 t/a. In comparison, 1.9 t were released into the Rhine
in 1998 by a single company at Ludwigshafen [BASF, 1999]. Mean MTBE concentrations in
Rhine water from Mannheim to Duisburg of 233 ng/L and from Vogelgrün to Karlsruhe of
115 ng/L (08/01/99 – 05/01/00) were reported [BRAUCH ET AL., 2000A]. The concentrations
are comparable to the results of this study. MTBE concentrations for the upper (Schaffhausen
- Karlsruhe) and lower part of Rhine (Karlsruhe - Wesel) are in the range of 70 – 120 ng/L
and 230 – 300 ng/L, respectively. Lower concentrations in the upper Rhine from the
Bodensee to Karlsruhe/ Mannheim and increasing amounts in the lower part have been found
for other Rhine water pollutants and are summarized by the Baseler Modell [SONTHEIMER,
1991]. MTBE concentrations for Main water measured in this study are comparable to the
reported mean concentration of 200 ng/L at Bischofsheim (08/01/99 – 05/01/00) [BRAUCH ET
AL., 2000A]. MTBE concentrations in water for the upper (Würzburg - Hanau) and lower
parts of the Main (Hanau - Bischofsheim) were determined to fall in the range of 20 –50 ng/L
and 85 –210 ng/L, respectively. From the Elbe river, low MTBE concentrations were reported
for samples taken close to Hamburg (not detected and 13 ng/L) and Dresden (123 ng/L in
1999 [ACHTEN AND PÜTTMANN, 2000] and 141 ng/L in 2000 [EFFENBERGER ET AL., 2001]).

4 MTBE Concentrations in Environmental Water Samples in Germany
106
Table 4-3 Summary of methyl tert-butyl ether (MTBE) concentrations (ng/L) in German river water.
Minimum Mean Median Maximum
Schaffhausen - Rastatt 11/06/00 - 11/07/00 8 13 84 69 195 this studyVogelgrün - Karlsruhe 08/01/99 - 05/01/00 8 70 115 - 160 BRAUCH ET AL., 2000
Karlsruhe - Wesel 05/11/00 - 01/08/01 52 52 257 254 579 this studyMannheim - Duisburg 08/01/99 - 05/01/00 52 100 233 - 990 BRAUCH ET AL., 2000
Wiesbaden/ Mainz + Nierstein 03/21/99 2 136 148 142 160 ACHTEN AND PÜTTMANN, 2000Mainz 08/01/99 - 05/01/00 7 120 220 - 400 BRAUCH ET AL., 2000
Wiesbaden/ Mainz 05/11/00 - 01/08/01 28 107 298 301 579 this studyMain, upper Seligenstadt 05/29/00 - 01/11/01 4 n.d. 26 23 47 this study
Offenbach - Gustavsburg 05/13/00 - 03/01/01 116 n.d. 186 111 2357 this study01/14/99 + 04/21/99 2 n.d. 12 12 13 ACHTEN AND PÜTTMANN, 200005/26/99 - 04/28/00 14 n.d. 42 32 116 this study05/13/00 - 03/01/01 24 21 161 114 502 this study08/01/99 - 05/01/00 36 60 200 - 540 BRAUCH ET AL., 200007/13/00 - 02/21/01 32 27 205 184 547 this study
Boitzenburg - Glücksstadt 09/02/00 15 n.d. 40 31 87 this studyHamburg 04/22/99 - 02/14/01 9 n.d. 61 59 155 this study
- 08/01/99 - 05/01/00 2 450 470 465 480 BRAUCH ET AL., 2000Dresden 03/28/99 1 - 123 - - ACHTEN AND PÜTTMANN, 2000
Rathen, Gaudernitz/ Dresden 03/15/00 2 83 141 141 199 EFFENBERGER ET AL., 2001Deggendorf - Regensburg 10/07/00 3 - n.d. - - this study
Ulm 08/01/99 - 05/01/00 4 - n.d. - - BRAUCH ET AL., 2000Mannheim - Deizisau 08/01/99 - 05/01/00 16 50 163 - 1200 BRAUCH ET AL., 2000
Neckarhausen 09/06/00 1 - 15 - - this studyWeser Bremen + Hemeln 09/02/00 + 09/28/00 2 89 126 126 162 this studyOder Frankfurt/ O 03/10/99 1 - n.d. - - ACHTEN AND PÜTTMANN, 2000
Schwarzbach Trebur near Frankfurt/ M 12/07/00 - 02/21/01 17 38 252 155 1024Kinzig Hanau near Frankfurt/ M 12/07/00 - 02/21/01 17 n.d. 94 32 1099Nidda Frankfurt/M - Nied 12/07/00 - 02/21/01 17 n.d. 34 25 87
12/07/00 - 11/29/00 36 n.d. 121 35 109901/10/01 - 02/21/01 15 33 141 47 1024
Landgraben Trebur near Frankfurt/ M 12/07/00 - 02/21/01 4 50 1171 1183 2267Lahn Coelbe - Limburg 12/07/00 - 02/21/01 22 n.d. 82 43 293
Small creeks 06/13/00 - 11/29/00 38 n.d. 26 12 198Channels 06/13/00 - 11/29/00 6 28 83 52 204
Rhine, upper
Frankfurt/ M
Number ofsamples
River Location Sampling Date
Rhine, lower
Main, lower
Schwarzbach,Kinzig and Nidda
Vicinity of Frankfurt/ M
Bischofsheim
Elbe
Donau
Neckar
this study
Germany this study
MTBE concentration [ng/L]Reference

4 MTBE Concentrations in Environmental Water Samples in Germany
107
Figure 4-14 Methyl tert-butyl ether (MTBE) concentrations (ng/L) in surface water in
Germany. Triangles, Squares and circles indicate results from EFFENBERGER ET AL. [2001],
BRAUCH ET AL., [2000A] and this study, respectively.
Not Detected
10- 50 ng/L
50-200 ng/L
>200 ng/L
Hamburg
Berlin
Bremen
DresdenLeipzig
Düsseldorf
Hannover
Kiel
Göttingen
Münster
Köln
Wesel
Frankfurt/M
Bonn
Wiesbaden/
Mainz
Stuttgart
Freiburg
Karlsruhe
Ludwigshafen
Würzburg
Basel
München
Nürnberg
Ulm
Regensburg
Heidelberg
Duisburg
Koblenz
MTBE Concentrations[ng/L] in River Water
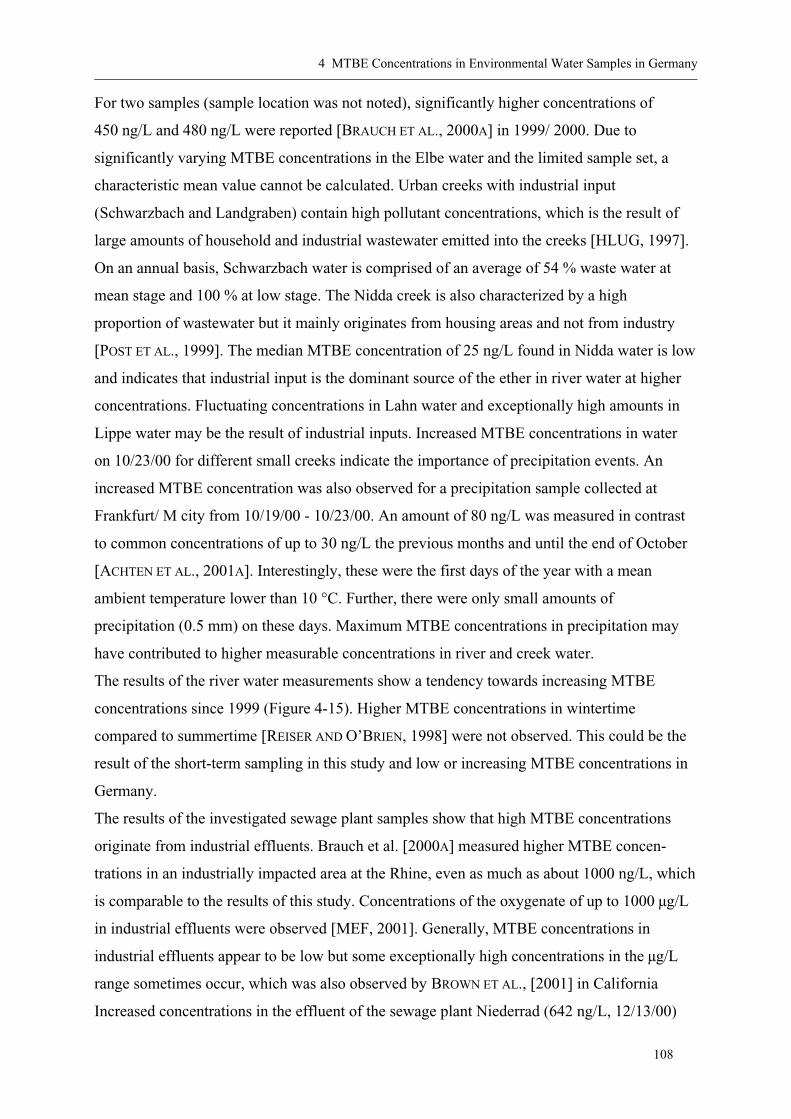
4 MTBE Concentrations in Environmental Water Samples in Germany
108
For two samples (sample location was not noted), significantly higher concentrations of
450 ng/L and 480 ng/L were reported [BRAUCH ET AL., 2000A] in 1999/ 2000. Due to
significantly varying MTBE concentrations in the Elbe water and the limited sample set, a
characteristic mean value cannot be calculated. Urban creeks with industrial input
(Schwarzbach and Landgraben) contain high pollutant concentrations, which is the result of
large amounts of household and industrial wastewater emitted into the creeks [HLUG, 1997].
On an annual basis, Schwarzbach water is comprised of an average of 54 % waste water at
mean stage and 100 % at low stage. The Nidda creek is also characterized by a high
proportion of wastewater but it mainly originates from housing areas and not from industry
[POST ET AL., 1999]. The median MTBE concentration of 25 ng/L found in Nidda water is low
and indicates that industrial input is the dominant source of the ether in river water at higher
concentrations. Fluctuating concentrations in Lahn water and exceptionally high amounts in
Lippe water may be the result of industrial inputs. Increased MTBE concentrations in water
on 10/23/00 for different small creeks indicate the importance of precipitation events. An
increased MTBE concentration was also observed for a precipitation sample collected at
Frankfurt/ M city from 10/19/00 - 10/23/00. An amount of 80 ng/L was measured in contrast
to common concentrations of up to 30 ng/L the previous months and until the end of October
[ACHTEN ET AL., 2001A]. Interestingly, these were the first days of the year with a mean
ambient temperature lower than 10 °C. Further, there were only small amounts of
precipitation (0.5 mm) on these days. Maximum MTBE concentrations in precipitation may
have contributed to higher measurable concentrations in river and creek water.
The results of the river water measurements show a tendency towards increasing MTBE
concentrations since 1999 (Figure 4-15). Higher MTBE concentrations in wintertime
compared to summertime [REISER AND O’BRIEN, 1998] were not observed. This could be the
result of the short-term sampling in this study and low or increasing MTBE concentrations in
Germany.
The results of the investigated sewage plant samples show that high MTBE concentrations
originate from industrial effluents. Brauch et al. [2000A] measured higher MTBE concen-
trations in an industrially impacted area at the Rhine, even as much as about 1000 ng/L, which
is comparable to the results of this study. Concentrations of the oxygenate of up to 1000 µg/L
in industrial effluents were observed [MEF, 2001]. Generally, MTBE concentrations in
industrial effluents appear to be low but some exceptionally high concentrations in the µg/L
range sometimes occur, which was also observed by BROWN ET AL., [2001] in California
Increased concentrations in the effluent of the sewage plant Niederrad (642 ng/L, 12/13/00)
4 MTBE Concentrations in Environmental Water Samples in Germany
109
0
50
100
150
200
250
300
350
400
450
500
1999 1999/ 2000 2000/ 2001 2001
MT
BE
[n
g/L
]
Rhine (Wiesbaden/ Mainz), Median
Main (Frankfurt/ M city), Median
Main (Bischofsheim), Mean
Main (Bischofsheim), Median
Schwarzbach (Trebur), Median
Kinzig (Hanau), Median
Nidda (Nied), Median
Lahn (Oberbiel), Median
1
7
28
36
332
214
125
121212
555
24
Figure 4-15 Methyl tert-butyl ether (MTBE) concentrations (ng/L) in water from the Rhine
and Main rivers and small urban creeks from 1999 – 2001. Numbers indicate sample
amounts. Published Rhine water concentrations in 1999/ 2000 [BRAUCH ET AL., 2000A] were
used for the calculation of the mean value. The detection limit of the method was 10 ng/L with
a relative standard deviation of 11 %.
one week after an increased amount in Main water (502 ng/L, 12/05/00) was measured may
be a coincidence because this situation occurred only once. This is supported by the fact that
sewage water needs only about 12 h to pass through the plant. Increased MTBE
concentrations in water from the plant were observed on 02/21/01, correlating with higher
MTBE amounts in precipitation [ACHTEN ET AL., 2001A]. Higher MTBE concentrations at
Frankfurt/ M city in precipitation were detected from 02/07/01 – 02/13/01 (74 ng/L) and from
02/13/01 – 02/22/01 (70 ng/L) compared to common concentrations up to 30 ng/L. This
increase was restricted to the Frankfurt/ M area. It is not clear if the MTBE increase in
domestic waste water from late 2000 to early 2001 were the result of low temperatures in
wintertime or of generally increasing concentrations, a trend which could have been
overlooked as no samples were analyzed in summertime. Similar MTBE concentrations in the

4 MTBE Concentrations in Environmental Water Samples in Germany
110
Main river and effluent water from the sewage plant Niederrad from 11/11/00 to 02/05/01
were observed (at each sampling date both spot samples were collected within a 15 min
interval). It can be concluded that a steady state of MTBE input into water versus output by
transport and volatilization from river water may be responsible for this observation.
Elimination rates of the oxygenate in sewage plants were calculated and percentages of
43.1 %, 56.8 %, 0.1 % and 0 % for amounts evaporated, released (dissolved) into water,
adsorbed to sludge and degradated were reported, respectively [MEF, 2001].
The MTBE concentrations in Germany are compared to data from California because the
oxygenate has been analyzed frequently in this state and California has a size comparable to
Germany (Table 4-4). MTBE concentrations in urban air in the Frankfurt/ M area were
measured in 1997 and were roughly in the range from 0.3 – 0.8 ppbV [RIEDEL, 2001]. A rural
atmospheric MTBE concentration of very roughly 0.1 µg/m³ is estimated by use of an average
concentration of 20 ng/L of MTBE in German precipitation.
The amounts measured in Germany might be expected to be lower by a factor of
appoximately 6 - 7 because the theoretical annual MTBE loading is about 6 times lower
compared to California. This is supported by the measured MTBE amounts in small urban
creeks without industrial input (factor 4 - 9) and possibly by the MTBE content in urban
runoff, if the limited sample amount (n = 12) in Germany is considered. The comparison of
MTBE concentrations in river water in California (or New Jersey) and Germany are difficult.
Average river water concentrations of 420 ng/L of MTBE in New Jersey [REISER AND
O’BRIEN, 1998] and 1400 - 11,530 ng/L in California [Brown et al., 2001] are lower by a
factor of 3 - 64 compared to the amounts measured in Germany and Italy (2.9 % of MTBE in
gasoline) [PIAZZA ET AL., 2001] of 150 – 200 ng/L. The MTBE concentrations in effluents can
also hardly be compared because of the fluctuation of the amounts measured. In urban air, a
factor of 3 - 17 is observed between the Californian and German amounts of the oxygenate. It
is noteworthy that measured atmospheric MTBE concentrations in the city of Frankfurt/ M
are again about one order of a magnitude higher than measured MTBE concentrations in
precipitation in the city as decribed earlier [ACHTEN ET AL., 2001A]. Low measured
concentrations in precipitation and higher amounts in the air may represent the degradation
process in the atmosphere or the photochemical degradation of MTBE in the gas phase and
the chemical degradation in the water phase.

4 MTBE Concentrations in Environmental Water Samples in Germany
111
Table 4-4 Comparison of methyl tert-butyl ether (MTBE) data in Germany and California.
GermanyEstimated
FactorCalifornia References Germany References California
MTBE Use [mio t] 0.5 7 3.52 PAHLKE ET AL., 2000 HAPPEL ET AL., 1998
Mean concentration in gasoline
[%] 1.2 - 1.7 7 - 9 11 PAHLKE ET AL., 2000; MEF, 2001
HAPPEL ET AL., 1998
Area [km²] 357 028 1.1 411 012 - -
Theoretical MTBE load [t/km²/a] 1.4 6 8.6 - -
Small urban creeks without industrial input
[ng/l] 35/ 70 4 - 9 300/ 400 this study BENDER ET AL., 2000
Urban runoff [ng/l] 100/ 200 8 - 14 1400 - 1500/ -- this studyDELZER ET AL., 1996; LOPES AND BENDER, 1998; BAY AND BROWN,
2000; BROWN ET AL., 2001
Urban creeks with industrial input
[ng/l] 160/ 1200 - - this study -
Rivers [ng/l] 150/ 1803
9 - 64420/ --
1400/ 11,530this study REISER AND O'BRIEN, 1998 (NJ);
BROWN ET AL., 2001
Domestic wastewater [ng/l] 80/ 250 15 - 48 --/ 3800 (max. 64,000) this study BROWN ET AL., 2001
Industrial effluents [ng/l] (max. 30,000) - (max. 1,878,000) this study BROWN ET AL., 2001
Rural air [ppbV] --/ 0.03 (estimated) 3 - 17 --/ 0.1 - 0.5 this study BENDER ET AL., 2000
BENDER ET AL., 2000
90 - 420/ -- (calculated) 25/ 35 (calculated)
1 - 14 BAEHR ET AL., 1999 and 2001 (NJ), BENDER ET AL., 2000
--/ 0.5 - 2
not detected - 23/ 14 - 30
Environmental MTBE Concentrations (Median/ Mean)
--/ 0.03 - 0.8 3 - 17 RIEDEL, 1998
Precipitation in wintertime [ng/l] ACHTEN ET AL., 2001A
Urban air [ppbV]
4 MTBE Concentrations in Environmental Water Samples in Germany
112
4.2.7 Conclusions
It can be concluded that varying amounts of MTBE are transported from different sources into
river water. Peak concentrations up to about 30 µg/L were measured in industrial waste water
effluents. These effluents can be regarded as point-sources and are rapidly diluted in the river
water system. This input has not been considered before because only 1.5 % of the produced
amount of MTBE in Germany is used for industrial processes. However, this amount should
not be neglected because MTBE has unfavorable physico-chemical properties that are
responsible for its persistent behavior over long distances in water. Further investigations of
direct emission sources into water should be subject of future study. Urban runoff and
domestic waste water can be ranked as the second largest source for MTBE in rivers yielding
concentrations in the range of 50 – .500 ng/L. The major source of MTBE in urban runoff is
thought to originate from vehicle exhaust washed out during precipitation events. The third
input of MTBE to river water originates from precipitation enriched by MTBE in amounts of
up to 85 ng/L in urban areas in wintertime. MTBE emissions from recreational boating are not
the main emission source for the amounts observed in water from the Main and Rhine river.
The results from the analysis of river water samples indicate a tendency towards increasing
MTBE concentrations since 1999.
From 2005 on, the European and German MTBE use can be expected to have doubled. In
1999, the German MTBE amounts used and measured in small urban creeks without
industrial input, urban runoff and urban air might be roughly 6 - 7 times lower compared to
California and would still be about 2 - 3 times lower from 2005 on.
An increase in European MTBE consumption of about 63 % can be expected to occur
between 1999 and 2010.
4 MTBE Concentrations in Environmental Water Samples in Germany
113
4.3 MTBE in Bank-Filtered Water and Drinking Water Produced by Riverbank Filtration
4.3.1 Abstract
Bank filtration of river or lake water represents an efficient and natural purification process
used for the drinking water production in many countries and at an amount of about 15 % in
Germany. From experiences over decades particularly at the river Rhine and Elbe, it is known
that the occurrence of persistent pollutants in river water can represent a problem for the
quality of drinking water produced by bank filtration. The common detection of the gasoline
additive methyl tert-butyl ether (MTBE) in drinking water and the announced phase-out of
the oxygenate in the U.S. show that MTBE can contaminate large water amounts due to its
phycico-chemical properties. The MTBE situation in the U.S. differs from Europe and
significantly lower concentrations in the German environment can be expected. Average
MTBE concentrations of 200 –250 ng/L in the Lower Main and Lower Rhine river in 2000/
2001 were reported.
At two sites at the Lower Rhine and Lower Main rivers MTBE concentrations in bank filtered
water (n = 22), recovering well water, raw water and drinking water produced by a water
utility at the Lower Rhine site (n = 30) and tap water at Frankfurt/ M city (n = 13) are
analyzed from 1999 – 2001. Sample analysis is performed by a combination of headspace-
solid-phase microextraction (HS-SPME) and gas chromatography/ mass spectrometry
(GC/ MS) with a detection limit of 10 ng/L and a relative standard deviation of 11 %. At the
Lower Rhine site, up to 80 m from the river, an average MTBE concentration of 88 ng/L in
riverbank filtered water, recovering well water and raw water (n = 7) and of 43 -110 ng/L in
drinking water (n = 3) result. At the Lower Main site up to 400 m from the river MTBE
concentrations from 52 - 250 ng/L (n = 7) were measured. Tap water samples at Frankfurt/ M
(mean of 35 ng/L, maximum of 71 ng/L) were in the same range as MTBE amounts in
drinking water at the Lower Rhine site. Measured MTBE amounts eliminated by bank
filtration at the Lower Rhine site are comparable to other contaminants. The results of this
study show that concentrations measured in river water and drinking water are approximately
2 - 3 orders of magnitude lower than the U.S. drinking water standard of 13 µg/L, represent
trace-level concentrations and are not of major concern nowadays. However, the unfavorable
combination of the occurrence of non-point MTBE emissions and the persistent behavior of
the ether in water even at low concentrations should not be neglected in future discussion. The

4 MTBE Concentrations in Environmental Water Samples in Germany
114
reported MTBE concentrations are relevant for precautionary aspects. MTBE concentrations
in german river water show a tendency towards increasing concentrations since 1999 and in
the future possible higher concentrations could represent a risk for the quality of drinking
water that is being produced by water utility using bank filtered river water.
4.3.2 Introduction
In many countries of the world, river water represents an important source of drinking water
and simoultaneously, the same rivers are used for sewage disposal. This multifunctional use
of rivers can lead to serious concern about the drinking water quality. In favorable
hydrogeological formations a low-cost process for significantly improving the quality of
surface source waters is provided by bank filtration. Surface water is infiltrated into the bank
or bottom sediments of a river or lake and is filtered comparable to a slow sand-filter from
shallow wells at tens to hundreds meters distance from the bank by pumping of groundwater.
Naturally occuring physico-chemical and biological transformations in the bank filtered water
during the underground passage are used as a basic step in the purification process that is
necessary to meet drinking water quality.
In Europe, for more than a hundred years [SONTHEIMER, 1991], bank filtration of surface
water has been used for the drinking water production at the Rhine river [SONTHEIMER, 1991;
HOPMANN ET AL., 1993; SCHUBERT, 2000; JÜLICH AND SCHUBERT, 2000; KUEHN AND
MUELLER, 2000], Elbe [JÜLICH AND SCHUBERT, 2000; NEITZEL ET AL., 1998; EPPINGER ET
AL., 1999; PAUL ET AL., 2001] and more recently at the Danube [JÜLICH AND SCHUBERT,
2000], Ruhr [JÜLICH AND SCHUBERT, 2000; SCHÖTTLER AND SCHULTE-EBBERT, 1995], Main
[STADT FRANKFURT/ M], Iller [JÜLICH AND SCHUBERT, 2000], Maas [HOPMANN ET AL., 1993;
JÜLICH AND SCHUBERT, 2000], Ebro [REEMTSMA, 1996], Llobregat [MARTIN-ALONSO ET AL.,
1997], Drava, Lake Tegel, Lake Constance, Zürichsee and Ijsselmeer [JÜLICH AND SCHUBERT,
2000]. In the U.S., bank filtered water is used from the Ohio, Santa Ana [JÜLICH AND
SCHUBERT, 2000], Great Miami [DEBREWER ET AL., 2000], Lower Susquehanna [DALY AND
LINDSEY, 1997], Platte [DORMEDY ET AL., 1999], Killbuck rivers [BREEN ET AL., 1995], also
in Egypt from the Nile [DEKOV ET AL., 1997] and in India from the Sabarmati river
[GURUNDHADA ET AL., 1999]. About 15 - 16 % of the drinking water used is produced by
bank filtration and artificial infiltration in Germany [JÜLICH AND SCHUBERT, 2000; KUEHN
AND MUELLER, 2000, BDGW, 1999] and most of this part is produced by water utility at the
Rhine and Elbe. The dramatic increase in pollution of river water at the Rhine in the 70‘s

4 MTBE Concentrations in Environmental Water Samples in Germany
115
resulted in various studies about the removal of anthropogenic organic and inorganic
compounds [FRIMMEL, 1996] like adsorbable organic halogens (AOX), polycyclic aromatic
hydrocarbons (PAHs), pesticides, surfactants, aromatic sulfonates, aliphatic and aromatic
amines, complexing agents, BTEX, phenols, adsorbable organic sulphur (AOS),
pharmaceutical residues, endocrine disrupting chemicals, organic iodine compounds,
byproducts of the vitamin C production, particles, bacteria, viruses, parasites, micropollutants,
ammonia, heavy metals and others [SCHUBERT, 2000; JÜLICH AND SCHUBERT, 2000; NEITZEL
ET AL., 1998; EPPINGER ET AL., 1999; PAUL ET AL., 2001; SCHÖTTLER AND SCHULTE-EBBERT,
1995; DORMEDY ET AL., 1999; SCHWARZENBACH ET AL., 1983; DVWK, 1993; GUDERITZ ET
AL., 1993; HABERER AND KNEPPER, 1993; ABKE ET AL., 1995; HÖTZL AND REICHERT, 1996;
HEBERER AND STAN, 1997; GRISCHEK ET AL., 1998; LANGE ET AL., 1998; JÜTTNER, 1999;
POST ET AL., 1999; BRAUCH ET AL., 2000B]. It has been proven that microorganisms and
aquifer sediments from the riverbank naturally purify the infiltrating riverwater of suspended
solids, parasites, bacteria, viruses and easily degradable pollutants [SONTHEIMER, 1991;
SCHUBERT, 2000]. Additionally, the underground passage acts as a barrier particularly against
shock loads resulting from emergency situations as chemical spills or defects in industrial
wastewater plants [SONTHEIMER, 1991]. However, some compounds (eg.
ethylenedinitrilotetraacetic acid (EDTA), some aromatic sulfonates, the pharmaceutical
carbamazepine) are persistent during bank filtration and, hence regularly occur in raw water
of the water utility [JÜLICH AND SCHUBERT, 2000; BRAUCH ET AL., 2000B]. Since 1995, the
behavior of pollutants during the riverbank passage at the study location „Böckinger Wiesen“
near Heilbronn at the river Neckar has been thoroughly investigated [SCHÖTTLER AND
SCHULTE-EBBERT, 1995; HÖTZL AND REICHERT, 1996; JÜTTNER, 1999]. Concentration
profiles of some selected compounds at the „Böckinger Wiesen“ site up to 50 m from the
river are presented in Figure 4-16. At a distance of 50 m, under suboxic conditions, AOS, the
complexing agent EDTA and AOX were less degraded compared to toluene, anionic
surfactants, atrazine and fragrance compounds. Generally, sufficient degradability of the latter
compounds (atrazine is well degradable under anoxic conditions only) and rather persistent
behavior of the former group is also frequently noted in literature [DVWK, 1993; RIPPEN,
2000]. Different waterworks at the Rhine river investigated the elimination of persistent and
common pollutants like EDTA, AOX and AOS in raw water of the water utility compared to
corresponding river water concentrations [SONTHEIMER, 1991; BRAUCH ET AL., 2000B].
During the last decades, water quality has been improved by the reduction of the amount of

4 MTBE Concentrations in Environmental Water Samples in Germany
116
0
10
20
30
40
50
60
70
80
90
100
0 10 20 30 40 50
Distance from the River Neckar [m]
Co
mp
ou
nd
Co
nce
ntr
atio
n [
%]
Ethylenedinitrilotetra- acetate (EDTA)
Adsorbable OrganicHalogenatedHydrocarbons (AOX)
Adsorbable OrganicSulphuricCompounds (AOS)
Anionic Surfactants
Toluene
FragranceCompounds
Atrazine
Clay Lense
Figure 4-16 Pollutant concentrations (%) in Neckar river water and during the riverbank
passage of 50 m from the river at the "Böckinger Wiesen" site near Heilbronn [HÖTZL AND
REICHERT, 1996].
chemicals released into river water [KUEHN AND MUELLER, 2000; BRAUCH ET AL., 1999], and
by substitution of toxic and persistent by less toxic and biodegradable substances. Improving
the technology in sewage purification plants and incineration have also contributed to
improved river water quality. A significant increase in the water quality of the river Elbe was
a consequence of reduced influx of industrial effluents into the river, following german
reunification [JÜLICH AND SCHUBERT, 2000].
Eventhough decreasing concentrations of many pollutants in river water have been recorded,
the recent occurrence of the oxygenate methyl tert-butyl ether (MTBE) in aquatic
environments [REISER AND O’BRIEN, 1998; ZOGORSKI ET AL., 1998; ACHTEN AND PÜTTMANN,
2000; EFFENBERGER ET AL., 2001; BRAUCH ET AL., 2000B] has caused concern in the U.S. and
in Germany about the possible national extent of contamination [CLAWGES ET AL., 2001;
PAHLKE ET AL., 2000]. Since 1985, MTBE has been added to german gasoline as an octane
enhancer and to reduce emissions. With increasing frequency of detection the occurrence of
MTBE is observed in the atmospheric and aquatic environment not only on the American
continent [REISER AND O’BRIEN, 1998; ZOGORSKI ET AL., 1998; GAFFNEY ET AL., 1999;
4 MTBE Concentrations in Environmental Water Samples in Germany
117
CLAWGES ET AL., 2001; BENDER ET AL., 2000] but also in Europe [ACHTEN AND PÜTTMANN,
2000 AND 2001B; ACHTEN ET AL., 2001A AND 2002B; EFFENBERGER ET AL., 2001; BRAUCH ET
AL., 2000B; PAHLKE ET AL., 2000; VAINIOTALO ET AL., 1998; SCHIEDEK ET AL., 2000;
ZAMBELLAS ET AL., 2000; POULOPOULOS AND PHILIPPOLOULOS, 2000; MRASEK, 2000; PIAZZA
ET AL., 2001]. In 1999, the U.S. EPA adopted a drinking water standard of 13 µg/L for MTBE
[PIAZZA ET AL., 2001]. Undoubtedly, most amounts of MTBE from oxygenated gasoline reach
water by leakage from underground storage tanks (LUSTs) into groundwater. However,
another possible pathway for the occurrence of lower MTBE concentrations in drinking water
is represented by non-point MTBE input into river water used for the drinking water
production by riverbank filtration. The fuel additive in river water is detected in the range of
ng/L - µg/L [REISER AND O’BRIEN, 1998; ZOGORSKI ET AL., 1998; ACHTEN AND PÜTTMANN,
2000; ACHTEN ET AL. 2002B; BRAUCH ET AL., 2000A; PIAZZA ET AL., 2001]. In Germany
average MTBE concentrations of about 250 ng/L in Rhine water and about 200 ng/L in Main
water in 1999/ 2001 [BRAUCH ET AL., 2000A; ACHTEN ET AL., 2002B] might lead to detectable
concentrations of MTBE in water from streambed wells. The oxygenate occurred in river
water mostly in agglomerated areas due to urban runoff, MTBE containing precipitation (in
wintertime only) and industrial effluents [ACHTEN ET AL., 2002b]. It is notable that non-point
source emissions (e.g. vehicle emissions) are not limited to specific sites and hence cannot
easily be remediated within a short time. Additionally, river water quality in Germany has
significantly increased due to legislation that focuses on „reduction at the source principle“
and „polluter pays principle“ [JÜLICH AND SCHUBERT, 2000]. The former principle fails for
diffuse source contaminants as it has been demonstrated for nutrients and pesticides, therefore
the „precautionary principle“ is of outstanding importance for the drinking water supply with
respect to dangerous substances which may come from diffuse sources [JÜLICH AND
SCHUBERT, 2000].
In groundwater from the Lower Susquehanna River Basin, MTBE was detected in 16 from
118 well water samples at a concentration range of 110 – 510 ng/L [DALY AND LINDSEY,
1997] and in the Connecticut, Housatonic and Thames River Basins a maximum concentration
of 5.8 µg/L MTBE in water from urban streambed wells was reported [GRADY, 1998].
Unfortunately, it is not clear if LUSTs were at least partially responsible for the described
detected amounts of the ether. In Germany, MTBE was detected in 5 raw water samples
produced from bank filtration at the Lower Rhine in the range of 50 – 100 ng/L in 1999/ 2000
[BRAUCH ET AL., 2000A]. Recently, MTBE has been detected in tap water
(80 – 400 ng/L) from different ground water sources in Italy [PIAZZA ET AL., 2001].
4 MTBE Concentrations in Environmental Water Samples in Germany
118
In the future, the recalcitrance of the widely used additive in river water could represent a
problem for waterworks that produce drinking water from riverbank filtration if river water
concentrations will increase. The aim of this study was to investigate the relevance of this
pathway at two study sites. To our knowledge this is the first study that investigates the
behavior of MTBE during the riverbank passage and the impact on treated drinking water
produced by bank filtration.
4.3.2.1 Site Locations
4.3.2.1.1 Water Utility 1 at the Lower Rhine River
The drinking water supply for many cities in the Lower Rhine embayment/ Germany is
provided by waterworks situated at the river Rhine. At the investigated site a gallery of
recovering wells is situated at a distance of about 50 m, parallel to the Rhine for the drinking
water production. The aquifer consists of pleistocenic gravel and sand of the Rhine lower and
middle terraces that show a thickness of about 20 m. It is characterized by a field velocity of
5 – 10 m/d, a coefficient of permeability of about 1.6 * 10-3
m/s and a porosity of 20 %. Three
multilevel groundwater wells, at distances of about 20 m (well A), 40 m (well B) and 80 m
(well C) from the Rhine bank, have been used for several bank filtration quality investigations
(Figure 4-17). The same wells (A, B and C at three different depths) were sampled in this
study to compare data obtained with existing data. Generally, the water in wells A and B
originates from bank filtration. In well C, mostly groundwater inflow from land is found
although at high Rhine water levels bank filtration water infiltrates also into well C, leading to
a mixture of the two different water types. Due to a colmated and plastered bottom of the
Rhine near the bank, river water infiltration mainly occurs at a distance of about 80 – 250 m
from the bank by filtration into the river bottom. A residence time of about 15 – 70 d is
needed by water infiltrating from the Rhine bottom to reach the monitoring and recovering
wells. At the water utility about 75 % of bank filtration water is mixed with approximately
25 % groundwater from natural groundwater recharge. The hydrochemical situation of the
aquifer is aerobic and characterized by oxygen reducing conditions. Significant biological
acitvity is observed in the bank sediments and it has been proven that transformation of
pollutants by microorganisms is most effective in the first decimeters of the river sediment
[NEITZEL ET AL., 1998]. Contamination of the investigated bank filtered water by LUST’s
could be excluded.

4 MTBE Concentrations in Environmental Water Samples in Germany
119
Figure 4-17 Hydrogeological cross section through the Rhine river and bank at the Lower Rhine site (water utility 1). Bank filtration water
pathways and flow direction are indicated by dotted lines with arrows. Methyl tert-butyl ether (MTBE) concentrations (ng/L) in water of three
monitoring wells up to about 80 m from the bank at three different depths (black) are shown. Samples were collected on 02/13/01. The MTBE
concentration of Rhine water at the site represents a mean value (n = 3). The location of a recovering well near the monitoring wells is shown
(ruled).
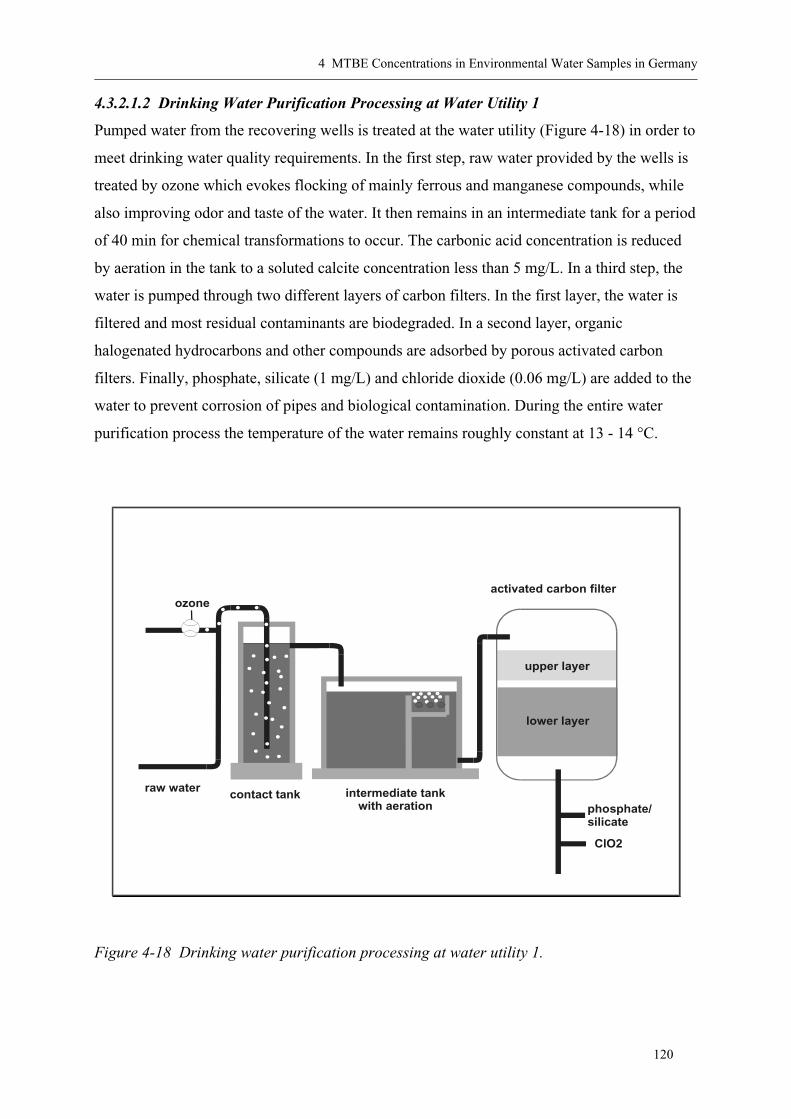
4 MTBE Concentrations in Environmental Water Samples in Germany
120
4.3.2.1.2 Drinking Water Purification Processing at Water Utility 1
Pumped water from the recovering wells is treated at the water utility (Figure 4-18) in order to
meet drinking water quality requirements. In the first step, raw water provided by the wells is
treated by ozone which evokes flocking of mainly ferrous and manganese compounds, while
also improving odor and taste of the water. It then remains in an intermediate tank for a period
of 40 min for chemical transformations to occur. The carbonic acid concentration is reduced
by aeration in the tank to a soluted calcite concentration less than 5 mg/L. In a third step, the
water is pumped through two different layers of carbon filters. In the first layer, the water is
filtered and most residual contaminants are biodegraded. In a second layer, organic
halogenated hydrocarbons and other compounds are adsorbed by porous activated carbon
filters. Finally, phosphate, silicate (1 mg/L) and chloride dioxide (0.06 mg/L) are added to the
water to prevent corrosion of pipes and biological contamination. During the entire water
purification process the temperature of the water remains roughly constant at 13 - 14 °C.
ozone
raw water contact tank
upper layer
lower layer
intermediate tankwith aeration
activated carbon filter
phosphate/silicate
ClO2
Figure 4-18 Drinking water purification processing at water utility 1.
4 MTBE Concentrations in Environmental Water Samples in Germany
121
4.3.2.1.2 Eddersheim at the Lower Main River in the Vicinity of Frankfurt/ M
Bank filtration water of the river Main is used for the drinking water production at several
sites in the vicinity of Frankfurt/ M. The study location at Eddersheim has been used for
several water quality investigations [ABKE ET AL., 1995; POST ET AL., 1999]. Water from four
monitoring wells at distances of 60 m (well 1123), 400 m (well 1184), 1050 m (well 1128)
and 1150 m (well 1132) from the Main was investigated in this study. The gallery of
recovering wells for the nearby water utility Hattersheim is mostly situated approximately
1300 m parallel to the Main, with a few recovering wells situated as close as about 200 m
from the Main. Groundwater in wells 1123 and 1184, situated near the Main, mostly
originates from bank filtration, although to a small amount inflow of groundwater from the
land occurs at 400 m [POST ET AL., 1999]. It is noted that all four investigated wells are not
situated in a line within the same flow direction near the river as is the case at the Lower
Rhine site. Nowadays, groundwater in wells at distances of more than 1000 m from the Main
originates from land only. In the past however, water from bank filtration was transported into
the aquifer from the river towards the water utility Hattersheim due to significantly higher
pumpages. The aquifer consists of about 10 – 15 m pleistocenic and about 65 – 70 m
pliocenic gravel and sand (containing some confined clay lenses), with characteristic
coefficients of permeability of about 2 * 10-4
– 2*10-3
m/s and 3 – 5*10-4
m/s, respectively.
Groundwater between the Main and the well 1184 at 400 m distance is characterized by a
field velocitiy of 0.7 – 1.3 m/d with resulting residence times of 45 – 85 d for well 1123 and
310 – 570 d for well 1184. The hydrochemical situation in the aquifer, up to well 1184, is
characterized by iron (up to 3.6 mg/L) and manganese (up to 5.2 mg/L) reduction. Median
Main water concentrations from 1995 - 1999 show that the oxygen (11 mg/L) and nitrate
concentrations (23 mg/L) in the Main water are reduced during the passage from the Main to
well 1123 (1.3 mg/L oxygen and <0.5 mg/L nitrate at –90 mV redox potential ) and do not
change significantly until well 1184 (2.4 mg/L oxygen and <0.5 mg/L nitrate at –25 mV
redox potential ). Therefore, biological activity under oxygen, nitrate, iron and manganese
reducing conditions during the riverbank passage can be expected. At a distance of more than
1000 m from the riverbank, oxygen concentrations (about 10 mg/L) and nitrate concentrations
(about 60 mg/L), fall within the normal range for agriculturally used land. Contamination of
the investigated bank filtered water by LUST’s or leakage from sewage pipes cannot be
excluded because the wells are situated in a housing and industrialized area.
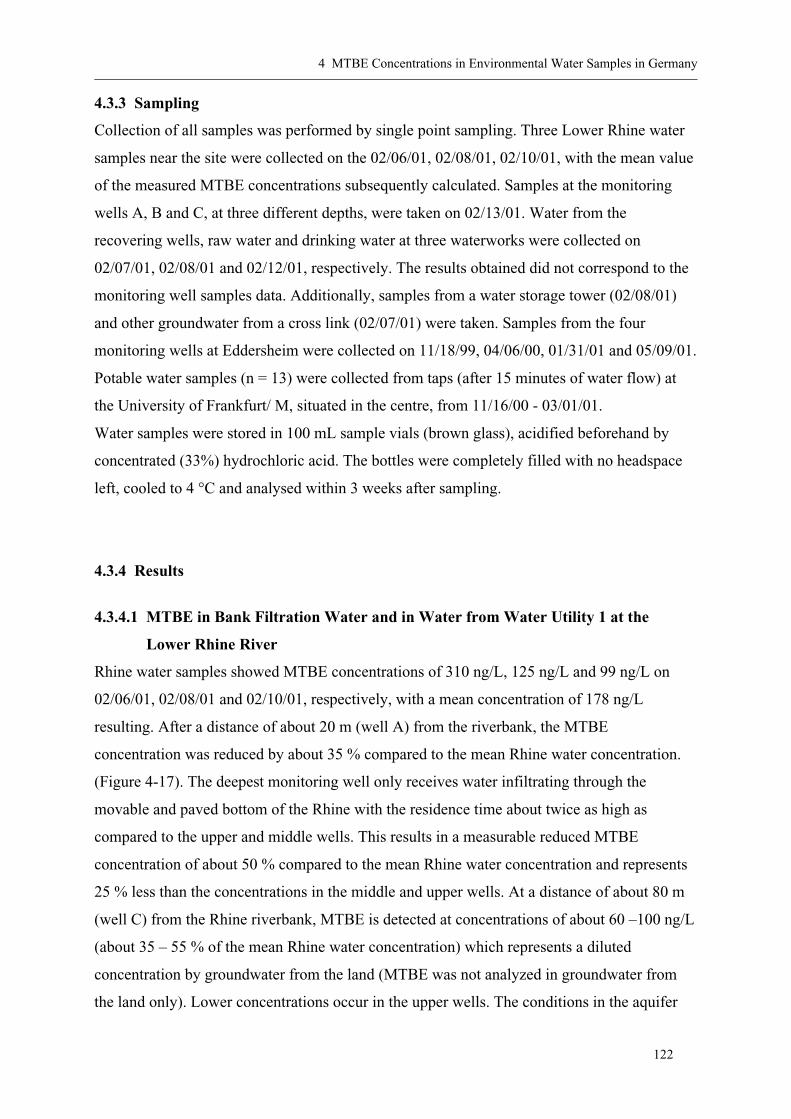
4 MTBE Concentrations in Environmental Water Samples in Germany
122
4.3.3 Sampling
Collection of all samples was performed by single point sampling. Three Lower Rhine water
samples near the site were collected on the 02/06/01, 02/08/01, 02/10/01, with the mean value
of the measured MTBE concentrations subsequently calculated. Samples at the monitoring
wells A, B and C, at three different depths, were taken on 02/13/01. Water from the
recovering wells, raw water and drinking water at three waterworks were collected on
02/07/01, 02/08/01 and 02/12/01, respectively. The results obtained did not correspond to the
monitoring well samples data. Additionally, samples from a water storage tower (02/08/01)
and other groundwater from a cross link (02/07/01) were taken. Samples from the four
monitoring wells at Eddersheim were collected on 11/18/99, 04/06/00, 01/31/01 and 05/09/01.
Potable water samples (n = 13) were collected from taps (after 15 minutes of water flow) at
the University of Frankfurt/ M, situated in the centre, from 11/16/00 - 03/01/01.
Water samples were stored in 100 mL sample vials (brown glass), acidified beforehand by
concentrated (33%) hydrochloric acid. The bottles were completely filled with no headspace
left, cooled to 4 °C and analysed within 3 weeks after sampling.
4.3.4 Results
4.3.4.1 MTBE in Bank Filtration Water and in Water from Water Utility 1 at the
Lower Rhine River
Rhine water samples showed MTBE concentrations of 310 ng/L, 125 ng/L and 99 ng/L on
02/06/01, 02/08/01 and 02/10/01, respectively, with a mean concentration of 178 ng/L
resulting. After a distance of about 20 m (well A) from the riverbank, the MTBE
concentration was reduced by about 35 % compared to the mean Rhine water concentration.
(Figure 4-17). The deepest monitoring well only receives water infiltrating through the
movable and paved bottom of the Rhine with the residence time about twice as high as
compared to the upper and middle wells. This results in a measurable reduced MTBE
concentration of about 50 % compared to the mean Rhine water concentration and represents
25 % less than the concentrations in the middle and upper wells. At a distance of about 80 m
(well C) from the Rhine riverbank, MTBE is detected at concentrations of about 60 –100 ng/L
(about 35 – 55 % of the mean Rhine water concentration) which represents a diluted
concentration by groundwater from the land (MTBE was not analyzed in groundwater from
the land only). Lower concentrations occur in the upper wells. The conditions in the aquifer

4 MTBE Concentrations in Environmental Water Samples in Germany
123
during the sampling were period oxic (5 - 9 mg/L oxygen, except lowest monitoring well C
with 0.3 mg/L).
About a week before, sampled water at the water utility 1 from two recovering wells and raw
water showed MTBE concentrations in the range of 100 – 120 ng/L (Figure 4-19). The mean
concentration of 101 ng/L in the monitoring wells near a recovering well (middle and deep
monitoring wells B and C) a week later was in a comparable range. In recovering well water
and raw water at two waterworks close to waterworks 1 (2 and 3), the MTBE contents were
slightly lower with values of 60 – 90 ng/L. Also a lower MTBE concentration of 43 ng/L was
detected in drinking water at water utility 1 due to the purification processing. At water utility
2 the concentrations of 62 ng/L and 110 ng/L were in the range of recovering well and raw
water data. The persistent behavior of MTBE is further documented by measurable
concentrations in water of a watertower (42 ng/L). MTBE was not detected in the sample of
other groundwater transported to the water utility 1 by a cross link.
0
20
40
60
80
100
120
140
160
180
200
1 2 3
Waterworks of a City at the Lower Rhine River
MT
BE
[n
g/L
]
Rhine Water atWaterworksRecovering WellWater
Raw Water
Drinking Water
Figure 4-19 Methyl tert-butyl ether (MTBE) concentrations (ng/L) in recovering well water,
raw water, drinking water and Rhine water (mean) at three waterworks belonging to water
utility 1 in the Lower Rhine embayment.
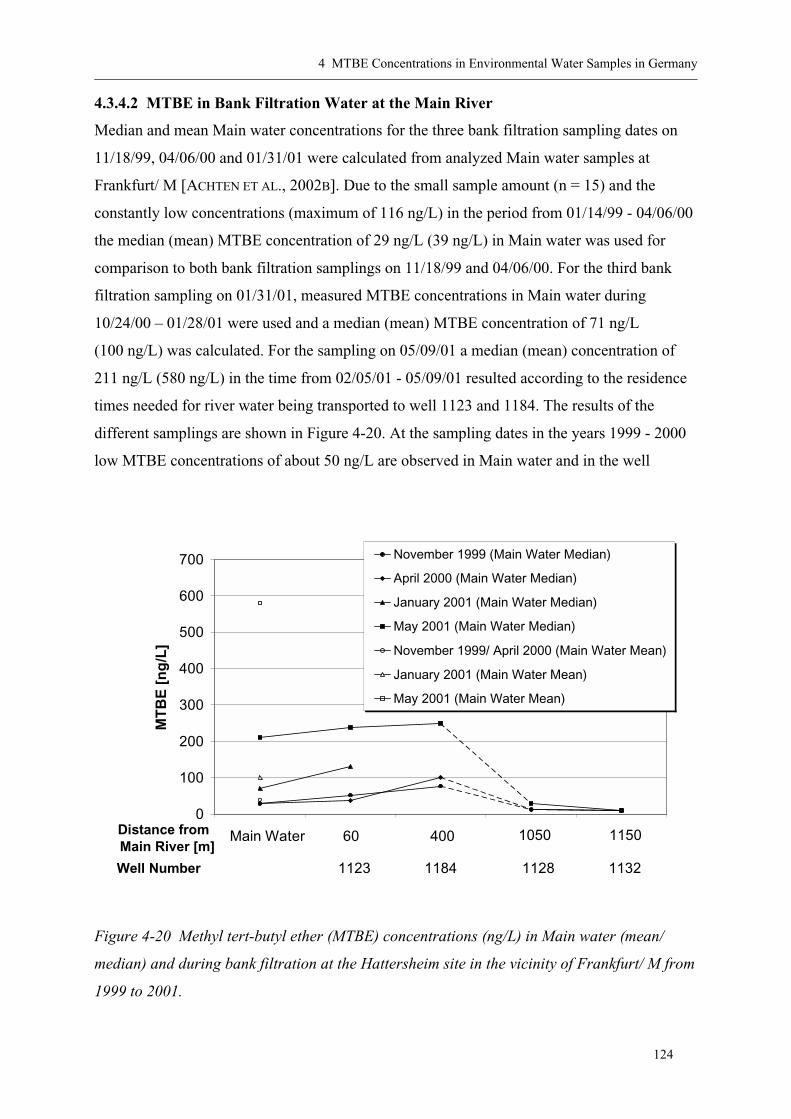
4 MTBE Concentrations in Environmental Water Samples in Germany
124
4.3.4.2 MTBE in Bank Filtration Water at the Main River
Median and mean Main water concentrations for the three bank filtration sampling dates on
11/18/99, 04/06/00 and 01/31/01 were calculated from analyzed Main water samples at
Frankfurt/ M [ACHTEN ET AL., 2002B]. Due to the small sample amount (n = 15) and the
constantly low concentrations (maximum of 116 ng/L) in the period from 01/14/99 - 04/06/00
the median (mean) MTBE concentration of 29 ng/L (39 ng/L) in Main water was used for
comparison to both bank filtration samplings on 11/18/99 and 04/06/00. For the third bank
filtration sampling on 01/31/01, measured MTBE concentrations in Main water during
10/24/00 – 01/28/01 were used and a median (mean) MTBE concentration of 71 ng/L
(100 ng/L) was calculated. For the sampling on 05/09/01 a median (mean) concentration of
211 ng/L (580 ng/L) in the time from 02/05/01 - 05/09/01 resulted according to the residence
times needed for river water being transported to well 1123 and 1184. The results of the
different samplings are shown in Figure 4-20. At the sampling dates in the years 1999 - 2000
low MTBE concentrations of about 50 ng/L are observed in Main water and in the well
0
100
200
300
400
500
600
700
Distance from Main River [m]
MT
BE
[n
g/L
]
November 1999 (Main Water Median)
April 2000 (Main Water Median)
January 2001 (Main Water Median)
May 2001 (Main Water Median)
November 1999/ April 2000 (Main Water Mean)
January 2001 (Main Water Mean)
May 2001 (Main Water Mean)
Main Water 60 400 1050 1150
Well Number 1123 1184 1128 1132
Figure 4-20 Methyl tert-butyl ether (MTBE) concentrations (ng/L) in Main water (mean/
median) and during bank filtration at the Hattersheim site in the vicinity of Frankfurt/ M from
1999 to 2001.
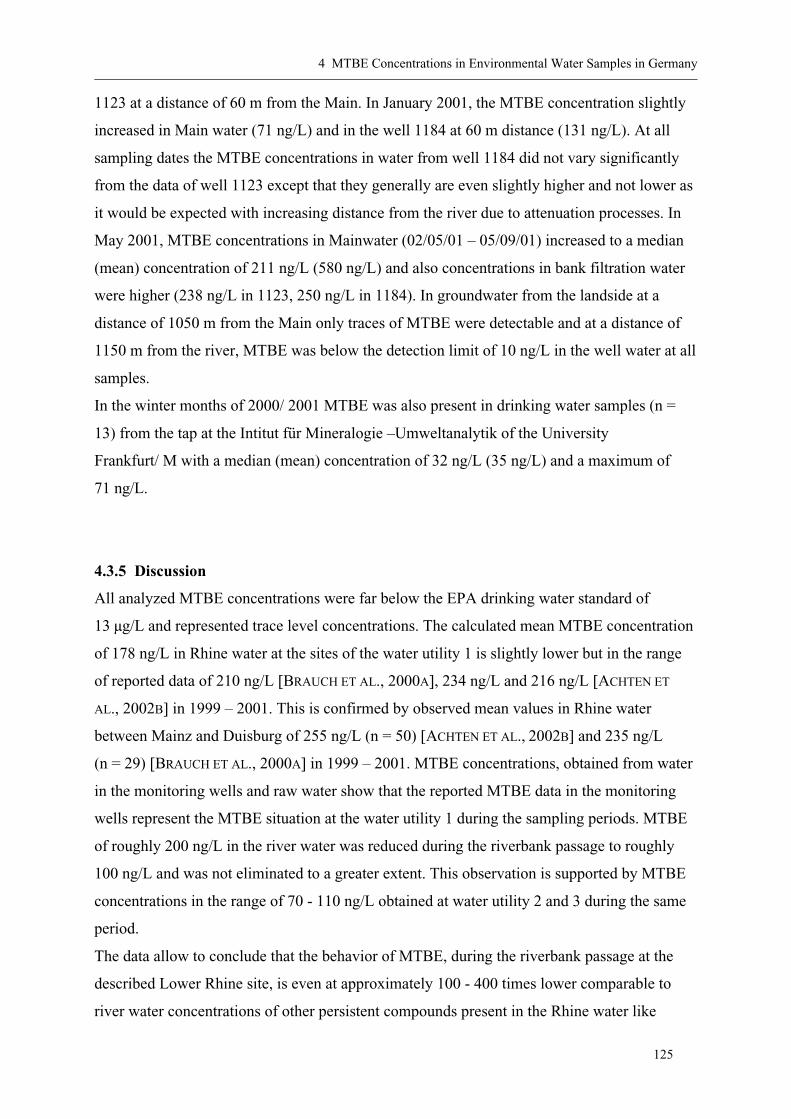
4 MTBE Concentrations in Environmental Water Samples in Germany
125
1123 at a distance of 60 m from the Main. In January 2001, the MTBE concentration slightly
increased in Main water (71 ng/L) and in the well 1184 at 60 m distance (131 ng/L). At all
sampling dates the MTBE concentrations in water from well 1184 did not vary significantly
from the data of well 1123 except that they generally are even slightly higher and not lower as
it would be expected with increasing distance from the river due to attenuation processes. In
May 2001, MTBE concentrations in Mainwater (02/05/01 – 05/09/01) increased to a median
(mean) concentration of 211 ng/L (580 ng/L) and also concentrations in bank filtration water
were higher (238 ng/L in 1123, 250 ng/L in 1184). In groundwater from the landside at a
distance of 1050 m from the Main only traces of MTBE were detectable and at a distance of
1150 m from the river, MTBE was below the detection limit of 10 ng/L in the well water at all
samples.
In the winter months of 2000/ 2001 MTBE was also present in drinking water samples (n =
13) from the tap at the Intitut für Mineralogie –Umweltanalytik of the University
Frankfurt/ M with a median (mean) concentration of 32 ng/L (35 ng/L) and a maximum of
71 ng/L.
4.3.5 Discussion
All analyzed MTBE concentrations were far below the EPA drinking water standard of
13 µg/L and represented trace level concentrations. The calculated mean MTBE concentration
of 178 ng/L in Rhine water at the sites of the water utility 1 is slightly lower but in the range
of reported data of 210 ng/L [BRAUCH ET AL., 2000A], 234 ng/L and 216 ng/L [ACHTEN ET
AL., 2002B] in 1999 – 2001. This is confirmed by observed mean values in Rhine water
between Mainz and Duisburg of 255 ng/L (n = 50) [ACHTEN ET AL., 2002B] and 235 ng/L
(n = 29) [BRAUCH ET AL., 2000A] in 1999 – 2001. MTBE concentrations, obtained from water
in the monitoring wells and raw water show that the reported MTBE data in the monitoring
wells represent the MTBE situation at the water utility 1 during the sampling periods. MTBE
of roughly 200 ng/L in the river water was reduced during the riverbank passage to roughly
100 ng/L and was not eliminated to a greater extent. This observation is supported by MTBE
concentrations in the range of 70 - 110 ng/L obtained at water utility 2 and 3 during the same
period.
The data allow to conclude that the behavior of MTBE, during the riverbank passage at the
described Lower Rhine site, is even at approximately 100 - 400 times lower comparable to
river water concentrations of other persistent compounds present in the Rhine water like
4 MTBE Concentrations in Environmental Water Samples in Germany
126
EDTA [JÜLICH AND SCHUBERT, 2000], adsorbable organic halogenated hydrocarbons (AOX)
or AOS (Figure 4-21). It is important to note that the AOX concentrations have decreased
significantly since 1988 [JÜLICH AND SCHUBERT, 2000]. In this study however, the AOX
Rhine20 m(A)40 m
(B)80 m(C)
uppe
r (3
)
mid
dle
(2)
low
er (
1)
0
20
40
60
80
100
[%]
MTBE [%] 2001
100% = 0.18 µg/l
Rhine20 m(A)40 m
(B)80 m(C)
uppe
r (3
)
mid
dle
(2)
low
er (
1)
0102030405060708090100
[%]
AOX [%] 1988/89
100% = 43 µg/l
Rhine20 m(A)40 m
(B)80 m(C)
uppe
r (3
)
mid
dle
(2)
low
er (
1)
0102030405060708090100
[%]
EDTA [%] 1990
100% = 21 µg/l
Rhine20 m(A)40 m
(B)80 m(C)
uppe
r (3
)
mid
dle
(2)
low
er (
1)
0
20
40
60
80
100
[%]
AOS [%] 1990
100% = 95 µg/l
Figure 4-21 Methyl tert-butyl ether (MTBE) concentrations (µg/L) during the riverbank
passage at water utility 1 in the Lower Rhine embayment in relative comparison (%) to
concentrations of adsorbable organic halogenated hydrocarbons (AOX),
ethylenedinitrilotetraacetic acid (EDTA) and adsorbable organic sulphur (AOS)
[SONTHEIMER, 1991]. Note that MTBE concentrations in Rhine water are at least two orders
of a magnitude lower than other pollutant concentrations.
4 MTBE Concentrations in Environmental Water Samples in Germany
127
concentration profiles measured in 1988 are only used to compare the behavior of the
different compounds. In future discussion of data from the water utility 1 at the Lower Rhine
only wells situated closest to the riverbank (up to 20 m) are considered, as microbial activity
is highest in the first centimeters of the bank and with increasing distance from the river the
influence of other diluting groundwater also increases. During the first 20 m of bank filtration
at water utility 1 EDTA, AOX, AOS and MTBE were eliminated by approximately
20 – 30 %, 35 – 55 %, 20 – 55 % [SONTHEIMER, 1991] and 25 – 50 %, respectively, due to
natural attenuation processes under aerobic conditions. Lower concentrations in the lowest
well A were often observed, presumably resulting from degradation and adsorption processes,
as the residence time was higher than that of the upper and middle wells, volatilization
processes can be excluded and a 100 % origin of river filtration water a few meters below the
river bottom can be assumed. As MTBE is poorly adsorbed, the degradation of the ether
under oxygen reducing conditions [BRADLEY ET AL., 2001A], is likely. During several
sampling times, EDTA, which has been widely reported as being poorly degradable [JÜLICH
AND SCHUBERT, 2000; RIPPEN, 2000], was persistent even in the lowest well A [SONTHEIMER,
1991], whereas AOX and AOS were present in lower concentrations which is indicative of
some degradation/ adsorption abilities that were reported in previous studies [GRISCHEK ET
AL., 1998; BRAUCH ET AL., 2000B]. During further transport through the underground network
at water utility 1, low MTBE elimination is observed, occuring mainly in the upper wells,
probably due to volatilization or dilution by other groundwater. Eighty metres from the bank,
104 ng/L of MTBE were still detectable in the deepest monitoring well C (Figure 4-17) and it
remains unclear if it originates from riverwater or from groundwater from the land.
Much effort has been spent to understand the behavior of pollutants during the riverbank
passage up to hundreds of meters from the river [SONTHEIMER, 1991; SCHÖTTLER AND
SCHULTE-EBBERT, 1995; DVWK, 1993; HÖTZL AND REICHERT, 1996]. Extensive
investigations at different locations revealed that simple dilution with other groundwater that
does not originate from bank filtration and different hydrogeological/ hydrochemical settings
(eg. aquifer material, field velocity, residence times, chemical conditions) were the most
important factors which made comparison of different study locations difficult. Different
studies conducted at the Rhine (Wittlaer, Cologne and Mündelheim) and the Neckar
(„Böckinger Wiesen“/ Heilbronn) which investigated the behavior of organic pollutants
during bank filtration with similar hydrogeological settings to the situation at water utility 1
were chosen for comparison and are summarized in Table 4-5. For comparison also only the

4 MTBE Concentrations in Environmental Water Samples in Germany
128
Table 4-5 Hydrogeological and hydrogeochemical data of the groundwater at waterworks 1 and comparable study locations at Duisburg-
Mündelheim, Düsseldorf-Wittlaer, Cologne-Rheinkassel and at the study location "Böckinger Wiesen"/ Heilbronn.
River Location GeologyCoefficient of permeability
Field velocity
Distance of recovering wells from the bank
Residence Time
Amount of bankfiltration water
in raw waterOxygen Conditions Reference
[m/s] [m/d] [m] [d] [%] [mg/L]
Lower Rhine
Waterworks 1 20 m Lower and
Middle Rhine terrace 1.6 x 10⁻³ 5 - 10 60 15 - 70 75 (60 - 80) < 9
oxic, O2 and NO3
reduction, no Fe and Mn reduction
this study
Lower Rhine
Waterworks Duisburg-Mündelheim
7 m Lower and Middle Rhine terrace
1 x 10⁻³ -
5 x 10⁻² - 30 - 50 - oxic?SONTHEIMER,
1991
Lower Rhine
Waterworks Düsseldorf-Wittlaer
15 m Lower and Middle Rhine terrace
2 x 10⁻³ -
1 x 10⁻² 2 - 10 170 15 - 90 60 (50 - 60) 4 - 10
oxic, O2 and NO3
reduction, no Fe and Mn reduction
SONTHEIMER, 1991; BRAUCH ET AL., 2000;
DENEKE, 1997
Lower Rhine
Waterworks Cologne-Rheinkassel
20 - 25 m Lower Rhine terrace
- - 160 -50 (30 - 50)
(30 % young, 20 % old)
- oxic?SONTHEIMER,
1991
NeckarBöckinger Wiesen/
Heilbronn
3 - 5 m Valley gravel, at 10 - 30 m from the
bank: clay lense
8 x 10⁻³ -
1 x 10⁻² 2 - 3study
distance: 150
40 - 800 - 40 m: 80
40 - 150 m: 30 - 80< 3
0 - 70 m: suboxic, Fe- and Mn reduction, 70 - 150 m: oxic, O2 and NO3
Reduction
SCHÖTTLER AND SCHULTE-EBBERT, 1995;
HÖTZL AND REICHERT, 1996; JÜTTNER, 1999
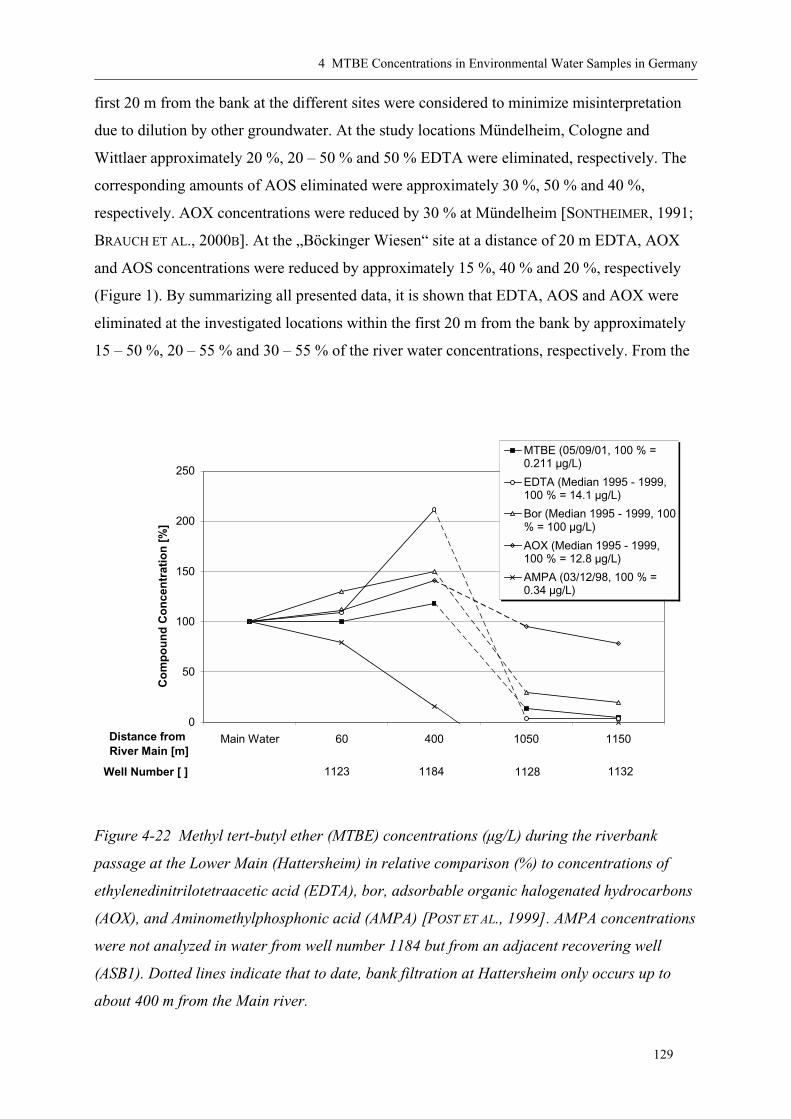
4 MTBE Concentrations in Environmental Water Samples in Germany
129
first 20 m from the bank at the different sites were considered to minimize misinterpretation
due to dilution by other groundwater. At the study locations Mündelheim, Cologne and
Wittlaer approximately 20 %, 20 – 50 % and 50 % EDTA were eliminated, respectively. The
corresponding amounts of AOS eliminated were approximately 30 %, 50 % and 40 %,
respectively. AOX concentrations were reduced by 30 % at Mündelheim [SONTHEIMER, 1991;
BRAUCH ET AL., 2000B]. At the „Böckinger Wiesen“ site at a distance of 20 m EDTA, AOX
and AOS concentrations were reduced by approximately 15 %, 40 % and 20 %, respectively
(Figure 1). By summarizing all presented data, it is shown that EDTA, AOS and AOX were
eliminated at the investigated locations within the first 20 m from the bank by approximately
15 – 50 %, 20 – 55 % and 30 – 55 % of the river water concentrations, respectively. From the
0
50
100
150
200
250
Main Water 60 400 1050 1150Distance from River Main [m]
Co
mp
ou
nd
Co
nce
ntr
atio
n [
%]
.
MTBE (05/09/01, 100 % =0.211 µg/L)
EDTA (Median 1995 - 1999,100 % = 14.1 µg/L)
Bor (Median 1995 - 1999, 100% = 100 µg/L)
AOX (Median 1995 - 1999,100 % = 12.8 µg/L)
AMPA (03/12/98, 100 % =0.34 µg/L)
Well Number [ ] 1123 1184 1128 1132
Figure 4-22 Methyl tert-butyl ether (MTBE) concentrations (µg/L) during the riverbank
passage at the Lower Main (Hattersheim) in relative comparison (%) to concentrations of
ethylenedinitrilotetraacetic acid (EDTA), bor, adsorbable organic halogenated hydrocarbons
(AOX), and Aminomethylphosphonic acid (AMPA) [POST ET AL., 1999]. AMPA concentrations
were not analyzed in water from well number 1184 but from an adjacent recovering well
(ASB1). Dotted lines indicate that to date, bank filtration at Hattersheim only occurs up to
about 400 m from the Main river.

4 MTBE Concentrations in Environmental Water Samples in Germany
130
limited sample set of this study it can be concluded that MTBE (roughly 25 – 50%
elimination of river water concentrations after 20 m) is eliminated to higher amounts than
EDTA and in a comparable range or to lower amounts than the AOX and AOS compounds.
The MTBE concentrations in recovering well water and raw water at water utility 1
(60 – 120 ng/L) are comparable to published data of 50 – 100 ng/L [BRAUCH ET AL., 2000A].
An elemination rate for MTBE in raw water cannot be calculated as a result of low sample
numbers, low concentrations, and the fact that the sampling time of the river water and raw
water did not correspond. The amounts of EDTA, AOX and AOS eliminated by bank
filtration during transport from Rhine water towards raw water at water utility 1 are 40 %,
were 60 – 80 % in 1988 and are 50 – 80 %, respectively [BRAUCH ET AL., 2000B]. From the
reported data a decrease in EDTA, AOX and AOS concentrations of roughly 20 % during
transport from well A towards raw water due to dilution by groundwater from the land,
volatilization or aerobic degradation may be assumed. An eliminated MTBE amount in the
range of 45 – 70 % during transport from Rhine water towards raw water of water utility 1
would result if this loss of roughly 20 % during transport from well A towards raw water at
the water utility 1 was also assumed for MTBE and added to the amount of about 35 %
MTBE loss measured during transport from Rhine water towards well A.
In bank filtration water at the Main river MTBE concentrations were also detected in the trace
level range. No conclusions about MTBE attenuation during the riverbank passage can be
made as the concentrations were not decreasing but even slightly increasing. Higher MTBE
concentrations were measured with increasing distance from the river. Also slightly
increasing concentrations of other contaminants were measured. Concentrations of EDTA,
bor, and AOX were analyzed in water from the same wells (Figure 4-22). The well known
persistent behavior of EDTA and AOX were confirmed at the Hattersheim site. Bor,
originating from sewage, is also poorly degradable [RIPPEN, 2000]. Aminomethylphosphonic
acid (AMPA) concentrations were not analyzed in water from well number 1184 but from an
adjacent recovering well (ASB1). Significant AMPA reduction was observed up to about
400 m from the Main bank [POST ET AL., 1999]. From the analyzed pollutant concentrations at
Hattersheim it can be concluded that MTBE is as persistent as other poorly attenuable
compounds present in Main water. The slightly increasing concentrations cannot be the result
of decreasing pollutant concentrations in Main water, adsorption effects to aquifer materials,
fluctuating Main water levels, additional input of contaminants into the groundwater or
different sampling techniques and remain unclear. The significantly differing median
(211 ng/L) and mean (580 ng/L) MTBE concentrations in Main water in May 2001 are the

4 MTBE Concentrations in Environmental Water Samples in Germany
131
result of some exceptional high MTBE concentrations from industrial effluents. The mean
concentration should not be used for comparison because it is not representative of MTBE
concentrations in river water. Anyhow, shock concentrations can be neglected if bank
filtration water is considered as described above.
4.3.6 Conclusions
Traces of MTBE were detected in the drinking water supply at the Lower Rhine site and at
Frankfurt/ M in similar concentrations roughly in the range of 50 ng/L. In these regions bank
filtration of river water is used for the drinking water production that shows MTBE
concentrations roughly in the range of 200 – 250 ng/L [ACHTEN ET AL., 2002B]. The research
conducted revealed that traces of the oxygenate were still detectable in riverbank filtered
water although MTBE concentrations in water from the Rhine and Main rivers were already
in the ng/L range. Neither riverbank filtration nor drinking water processing were able to
eliminate MTBE concentrations to a greater extent. The occurrence of point emissions and
particularly of non-point emissions of MTBE leading to detectable river water concentrations
of the oxygenate should be further monitored in the future as it is a very persistent compound
in water, even at low concentrations. Recently, MTBE has been evaluated as „a compound of
relevance for waterworks“ [BRAUCH ET AL., 2000A]. Nowadays the presence of MTBE in
river water are not of major concern in Germany but concentrations measured in river water
show a tendency towards increasing concentrations since 1998 [ACHTEN ET AL., 2002B].
MTBE concentrations measured in drinking water produced from river bankfiltration at the
Rhine and Main are often in the range of 50 – 100 ng/L and are approximately
2 - 3 orders of a magnitude lower than the U.S. drinking water standard of 13 µg/L or the
odor/ taste threshold of 20 µg/L. However, the results of this study should be evaluated in
terms of precautionary aspects as the occurrence of MTBE in environmental waters has
already caused major and unexpected concern in some U.S. states. As a result, Northern
European countries like Denmark are planning to increase prices for super premium gasoline.
If the amount of MTBE used in German gasoline increases significantly as proposed by
DEWITT COMPANY [DEWITT COMPANY, 1998 AND 1999] to meet gasoline requirements of
reduced aromatic compounds, environmental concentrations of the oxygenate will soon be
close to the same order as measured in California or New Jersey. The persistent behavior of
MTBE will lead to measurable environmental amounts for years, even if its use is reduced
soon.
5 Compartment Modeling of MTBE and Estimations of the Aquatic Input in Germany
132
5 COMPARTMENT MODELING OF MTBE IN THE GENERIC ENVIRONMENT AND ESTIMATIONS OF THE AQUATIC MTBE INPUT IN GERMANY USING THE EQC MODEL
5.1 Abstract
The behavior of methyl tert-butyl ether (MTBE) in the two most relevant compartments water
and air in the generic environment and in a simulated German environment is investigated
using the equilibrium criterion (EQC) model. Due to lack of literature data, the half-life time
of MTBE in river water is estimated to about 80 – 120 d (105 d) at 18 °C and roughly 1.5 y
(533 d) at 4 °C from a batch experiment. The EQC model considers four compartments, air,
surface water, soil and sediment in an environment of typically 100,000 km² with about 10 %
of the area covered with water. The user can progress through the tiered sequence of
Level I - III with increasing complexity which reveal more information about the fate of the
considered chemical. The equilibrium mass distribution of MTBE calculated with the Level I
model shows that 87 % partition into air and 13 % into surface water at 10 °C. The results of
the Level II calculations indicate that 50 % of MTBE in the air is transported from the system
and 38 % is degraded at 10 C. The total persistence time of 3 d is little lower than that
calculated for alkylbenzene sulfonates. The MTBE input into water is significantly more
sensitive to the "mode of entry" than input into air. The MTBE concentration in surface water
is almost exclusively the result of direct emission into water, whereas the atmosphere can
additionally be loaded by volatilization from water. For the estimation of the aquatic MTBE
emission and average MTBE concentration in surface water in Germany, 20 – 80 kg/a
(50 kg/a) and 50 ng/L are very roughly assumed, respectively. Under the conditions of the
model (e.g. 10 % water surface), neither measured MTBE concentrations of the oxygenate in
waste water and industrial effluents nor estimated loss of industrial used MTBE in Germany
explain the estimated surface water concentration. For the year-round scenario at 10 °C,
MTBE concentrations of 19 ng/L (surface water) and 167 ng/m³ (Air) result. The amount of
19 ng/L is too low compared to the estimated average of 50 ng/L. The water surface in
Germany of 2.2 % instead of 10 % as used by the model will at least partially contribute to
slightly higher concentrations. However, it still remains unclear, if the assumptions of the
model, the lack of analyses from industrial effluents or both are responsible for the difference.
Additional aquatic emission sources could result from further industrial effluents, gasoline
transport on and storage near rivers.The comparison of winter and summer scenarios shows
5 Compartment Modeling of MTBE and Estimations of the Aquatic Input in Germany
133
that in summer, atmospheric (25 %) and aqueous (50 %) concentrations are lower than in
winter due to higher degradation rates.
5.2 Introduction
The use of the oxygenate methyl tert-butyl ether (MTBE) has led to significant groundwater
contamination in the U.S.. Major concern is about drinking water quality due to leakage from
underground storage tanks (LUSTs) of oxygenated gasoline because MTBE concentrations in
the mg/L range were reported for such locations [HAPPEL ET AL., 1998; BRUCE AND
MCMAHON 1997; EFFENBERGER ET AL., 2001]. Since the 70s – 80s, MTBE has spread all over
the aquatic and atmospheric environment and concentrations in the ng/L range were reported
for countries that use it as octane enhancer and/ or smog reducer [DELZER ET AL, 1996; REISER
AND O’BRIEN, 1998; BENDER ET AL., 2000; BAEHR ET AL, 2001; ACHTEN AND PÜTTMANN,
2000; ACHTEN ET AL., 2001A, 2002A AND B]. Vehicle engines running with oxygenated fuel
seem to represent the main sources of these widely spread low-level concentrations [FRASER
ET AL., 1998; ACHTEN ET AL., 2002B].
Although many physico-chemical properties of MTBE are well known and are subject of
current research [BIERWAGEN ET AL., 2001], little information has been published so far about
the behavior and distribution of MTBE between the different compartments air, water, soil
and sediment [PAHLKE ET AL., 2000; MEF, 2001; SQUILLACE ET AL., 1995]. Under
equilibrium conditions, a partitioning of MTBE of 94 % into air, 6 % into surface water,
0.054 – 0.07 % into soil and 0.001 – 0.08 % into sediment has been reported [PAHLKE ET AL.,
2000; MEF, 2001]. The steady-state mass balance calculated with another model by
Environment Canada for Southern Ontario showed a MTBE distribution of 56 % in air and
42 % in surface water [SQUILLACE ET AL., 1995]. Continental MTBE concentrations for
Europe in the atmosphere and in surface water calculated with the model EUSES were
220 ng/m³ and 100 ng/L, respectively [MEF, 2001].
For the evaluation of the MTBE situation in Germany, the amount of MTBE released into the
environment, the partitioning between the different compartments and the degradation are
important. In this study, the environmental fate of MTBE is estimated and evaluated by use of
the equilibrium criterion model (EQC, Level I - Level III). In the first step, the general
distribution behavior of MTBE is considered (Level I). In the second step, concentrations in
the most important compartments atmosphere and surface water are estimated for scenarios
with varying temperatures resembling year-round, summer and winter conditions. By use of
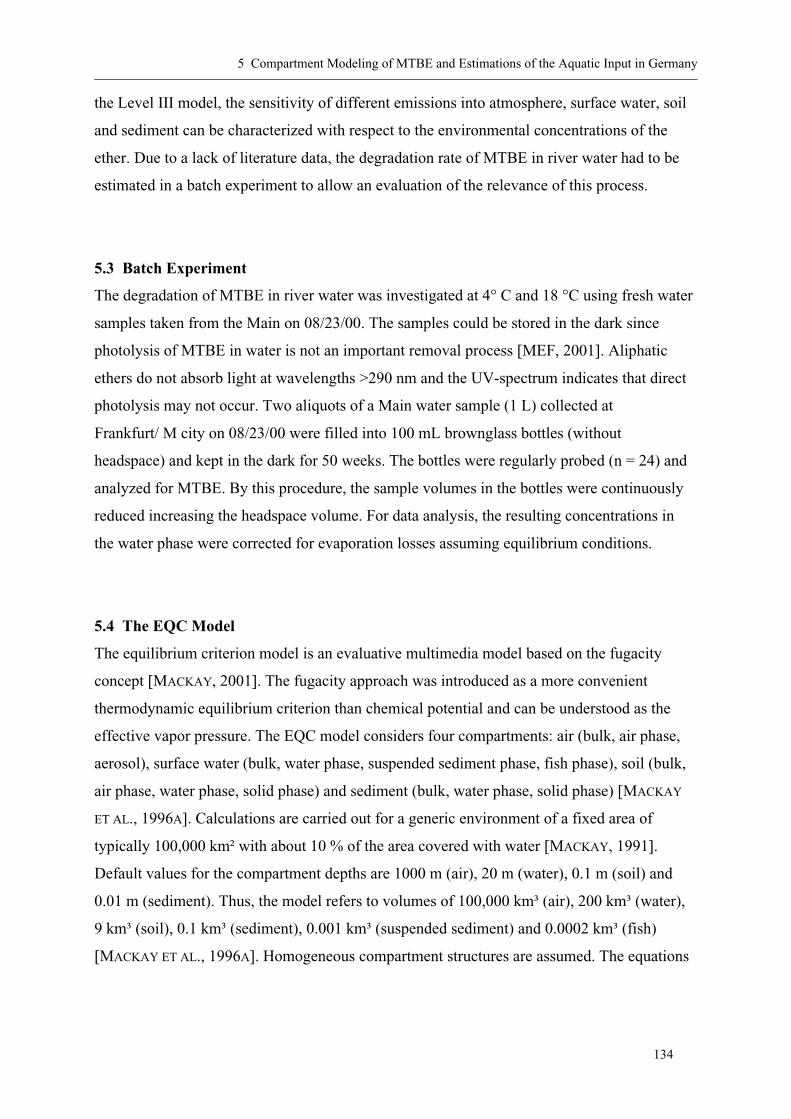
5 Compartment Modeling of MTBE and Estimations of the Aquatic Input in Germany
134
the Level III model, the sensitivity of different emissions into atmosphere, surface water, soil
and sediment can be characterized with respect to the environmental concentrations of the
ether. Due to a lack of literature data, the degradation rate of MTBE in river water had to be
estimated in a batch experiment to allow an evaluation of the relevance of this process.
5.3 Batch Experiment
The degradation of MTBE in river water was investigated at 4° C and 18 °C using fresh water
samples taken from the Main on 08/23/00. The samples could be stored in the dark since
photolysis of MTBE in water is not an important removal process [MEF, 2001]. Aliphatic
ethers do not absorb light at wavelengths >290 nm and the UV-spectrum indicates that direct
photolysis may not occur. Two aliquots of a Main water sample (1 L) collected at
Frankfurt/ M city on 08/23/00 were filled into 100 mL brownglass bottles (without
headspace) and kept in the dark for 50 weeks. The bottles were regularly probed (n = 24) and
analyzed for MTBE. By this procedure, the sample volumes in the bottles were continuously
reduced increasing the headspace volume. For data analysis, the resulting concentrations in
the water phase were corrected for evaporation losses assuming equilibrium conditions.
5.4 The EQC Model
The equilibrium criterion model is an evaluative multimedia model based on the fugacity
concept [MACKAY, 2001]. The fugacity approach was introduced as a more convenient
thermodynamic equilibrium criterion than chemical potential and can be understood as the
effective vapor pressure. The EQC model considers four compartments: air (bulk, air phase,
aerosol), surface water (bulk, water phase, suspended sediment phase, fish phase), soil (bulk,
air phase, water phase, solid phase) and sediment (bulk, water phase, solid phase) [MACKAY
ET AL., 1996A]. Calculations are carried out for a generic environment of a fixed area of
typically 100,000 km² with about 10 % of the area covered with water [MACKAY, 1991].
Default values for the compartment depths are 1000 m (air), 20 m (water), 0.1 m (soil) and
0.01 m (sediment). Thus, the model refers to volumes of 100,000 km³ (air), 200 km³ (water),
9 km³ (soil), 0.1 km³ (sediment), 0.001 km³ (suspended sediment) and 0.0002 km³ (fish)
[MACKAY ET AL., 1996A]. Homogeneous compartment structures are assumed. The equations

5 Compartment Modeling of MTBE and Estimations of the Aquatic Input in Germany
135
Figure 5-1 Illustration of the equilibrium and steady state conditions characterizing
a) Level I, b) Level II c), Level III and d, e) Level IV using the example of oxygen
concentrations partitioning into water and air. Equilibrium implies that the oxygen
concentrations in air and water achieve a ratio or partition coefficient of 20. Steady state
implies unchanging with time, even if flow occurs and regardless of whether equilibrium
applies or not [MACKAY, 2001].
used to describe partitioning, transport, and transformation processes as well as the input
parameters and their default values used by the model are described elsewhere [MACKAY ET
AL., 1996A AND B, MACKAY ET AL., 1995]. The EQC model allows the user to progress
through the tiered sequence of Level I, II and III (and possibly IV) models, which have
increasing complexity and data requirements, and progressively reveal more information
about the environmental fate of the considered chemical. General distribution of a chemical
into the compartments air, water, soil and sediment is described by the static equilibrium

5 Compartment Modeling of MTBE and Estimations of the Aquatic Input in Germany
136
Level I model (a) (Figure 5-1). Degradation and transport processes are additionally
considered by the steady-state and equilibrium Level II model (b). Here, a constant emission
of the pollutant is assumed which is instantaneously partitioned into all compartments
according to the equilibrium assumption. In Level III calculations (c, steady-state and non-
equilibrium), compartment specific emissions can be defined and the exchange rates between
the different compartments are now taken into account due to the non-equilibrium
assumption. Different concentrations over time (d and e, unsteady state) are not considered in
this study.
According to the properties of the considered chemical, the compound has to be assigned to
one of three defined categories [MACKAY ET AL. 1996A]. The properties of type 1 chemicals
allow the distribution in all compartments which is observed for most organic compounds
(e.g. chlorobenzene, hexachlorobenzene, polychlorobiphenyls, etc.). Type 2 chemicals are not
measurable in the air but possibly in all other compartments (e.g. cations, anions and
involatile organic compounds). Substances not to be found in the water compartment but
possibly in all other phases belong to the type 3 category (very hydrophobic compounds, e.g.
long-chain hydrocarbons, silicones and polymers).
5.5 Model Design for MTBE
5.5.1 Physico-Chemical Data
MTBE has to be considered as a type I chemical possibly occurring in all phases. Its
molecular weight is 88.15 g/mol, and the melting point is –108.6°C [MEF, 2001]. For the
modeling, log KOW, water solubility and vapor pressure are the most important physico-
chemical properties. The influence of the log KOW on the results was checked with the Level I
model. Simulation results using a log KOW of 0.94 were compared to a second scenario with a
slightly higher log KOW of 1.06 [MEF, 2001] showing a relative small relevance of this
parameter. In all other scenarios 0.94 was used as log KOW.
Water solubility and vapor pressure were varied according to the temperature chosen for the
respective scenario as there were year-round (10 °C), summer (20 °C) and winter scenarios
(4 °C) performed. Additionally, the half-life times in air and water were adapted to represent
annual mean, summer or winter conditions, respectively. The data used for the calculations
are summarized in Table 5-1. All environmental parameters not explicitly mentioned were

5 Compartment Modeling of MTBE and Estimations of the Aquatic Input in Germany
137
Table 5-1 Water solubility, vapor pressure, half-life times in air [MEF, 2001] and in water of
methyl tert-butyl ether (MTBE) at 4, 10 and 20°C used in modeling for year-round, summer
and winter scenarios.
Scenario TemperatureWater
SolubilityVapor
PressureHalf-life time
AirHalf-life time
Water
[°C] [g/l] [hPa] [d] [d]
Winter 4 70 ca. 150 7 no degradation
Year-round 10 51 ca. 185 5 ca. 315
Summer 20 42 268 3 ca. 105
used as set by default in the model. Effects of hydrology, meteorology, proportion of the
media, composition of water or soil and temporal changes are not included.
5.5.2 Emission Rates and Degradation Half-Life Times
For Level I considerations, a fixed emission of 100 t into the system was assumed. For Level
II calculations, the emission rate was fixed to 1000 kg/h and half-life times of MTBE in the
atmosphere ranging from 3 d (summer scenario) to 6 d (winter scenario) [WALLINGTON ET
AL., 1988; SMITH ET AL., 1991] were used. Degradation half-life times in the aqueous phase
have been estimated in the batch experiment ranging from no degradation (4°C, winter) to
105 d (20 °C, summer).
For Level III calculations, a total emission rate of 2285 t/a MTBE into German air [PAHLKE
ET AL., 2000] was used. The emission rate into surface water in Germany was roughly
estimated to be in the range of 20 - 80 t/a and a mean value of 50 t/a was used.
5.6 Results
5.6.1 MTBE Degradation in Water from Main River
The persistence of MTBE in a Main water sample was investigated at two different
temperatures (4 °C and 18 °C). The MTBE concentration at the sampling day was about
220 ng/L. The results of the batch experiments are presented in Figure 5-2. The eliminating

5 Compartment Modeling of MTBE and Estimations of the Aquatic Input in Germany
138
factors include volatilization and biotic degradation. Abiotic degradation is not an important
removal process, since MTBE is resistent to hydrolysis within environmentally relevant pH
scale [MEF, 2001]. However, under acidic conditions ( pH <2), MTBE is sensitive to
hydrolysis which could be relevant for contaminated groundwater [O’REILLY, ET AL., 2001].
The UV-spectrum indicates that photolysis may not occur in water, as aliphatic ethers do not
absorb light at wavelengths >290 nm [MEF, 2001]. Biotic degradation is assumed to be
mainly responsible for the observed MTBE loss during the batch experiment. After a lag-
phase, significant decrease in MTBE concentrations occurred during 43 – 107 d (18 °C) and
in the interval of 69 – 107 d (4 °C) after the start of the experiment. After 107 d, amounts of
53 % (18° C) and 23 % (4° C) were eliminated. During the following weeks, MTBE was
0
50
100
150
200
250
0 50 100 150 200 250 300 350
Days
MT
BE
[n
g/L
]
4 °C, Measured (with volatilization)
18 °C, Measured (with volatilization)
4 °C, Calculated (without volatilization)
18 °C, Calculated (without volatilization)
Figure 5-2 Methyl tert-butyl ether (MTBE) concentrations (ng/L) in a Main water (08/23/00)
sample observed within a time interval of 350 d at 4 °C and at 18 °C. Volatilized amounts
during the experiment were calculated under the conditions of equilibrium and tieredly
changing volumina of the gasphase and aqueous phase. They were substracted from
measured MTBE concentrations (black symbols). The reduction of the resulting MTBE
concentrations over time is probably assigned to biodegradation. Data points with larger
symbols were used for the calculation of half-life times.
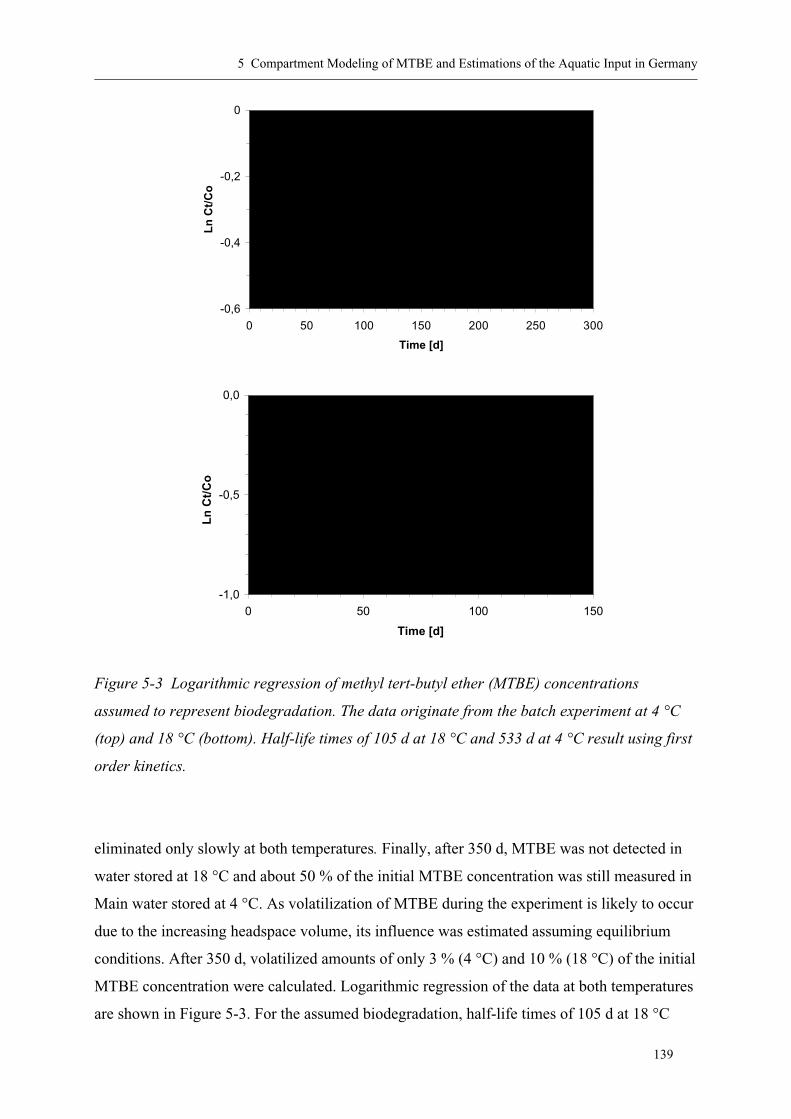
5 Compartment Modeling of MTBE and Estimations of the Aquatic Input in Germany
139
y = -0,0013x - 0,1097R2 = 0,9349
-0,6
-0,4
-0,2
0
0 50 100 150 200 250 300
Time [d]
Ln
Ct/
Co
4 °C (biodegradation?)
y = -0,0066x - 0,0536R2 = 0,9273
-1,0
-0,5
0,0
0 50 100 150
Time [d]
Ln
Ct/
Co
.
18 °C (biodegradation?)
Figure 5-3 Logarithmic regression of methyl tert-butyl ether (MTBE) concentrations
assumed to represent biodegradation. The data originate from the batch experiment at 4 °C
(top) and 18 °C (bottom). Half-life times of 105 d at 18 °C and 533 d at 4 °C result using first
order kinetics.
eliminated only slowly at both temperatures. Finally, after 350 d, MTBE was not detected in
water stored at 18 °C and about 50 % of the initial MTBE concentration was still measured in
Main water stored at 4 °C. As volatilization of MTBE during the experiment is likely to occur
due to the increasing headspace volume, its influence was estimated assuming equilibrium
conditions. After 350 d, volatilized amounts of only 3 % (4 °C) and 10 % (18 °C) of the initial
MTBE concentration were calculated. Logarithmic regression of the data at both temperatures
are shown in Figure 5-3. For the assumed biodegradation, half-life times of 105 d at 18 °C
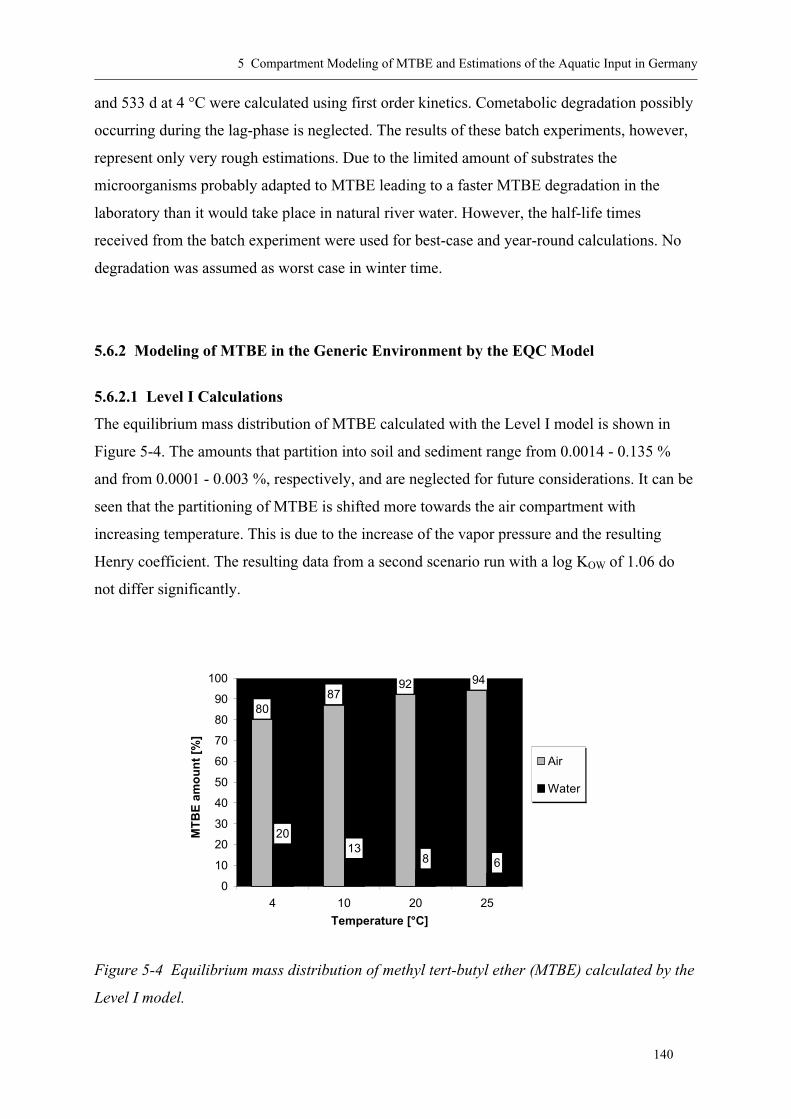
5 Compartment Modeling of MTBE and Estimations of the Aquatic Input in Germany
140
and 533 d at 4 °C were calculated using first order kinetics. Cometabolic degradation possibly
occurring during the lag-phase is neglected. The results of these batch experiments, however,
represent only very rough estimations. Due to the limited amount of substrates the
microorganisms probably adapted to MTBE leading to a faster MTBE degradation in the
laboratory than it would take place in natural river water. However, the half-life times
received from the batch experiment were used for best-case and year-round calculations. No
degradation was assumed as worst case in winter time.
5.6.2 Modeling of MTBE in the Generic Environment by the EQC Model
5.6.2.1 Level I Calculations
The equilibrium mass distribution of MTBE calculated with the Level I model is shown in
Figure 5-4. The amounts that partition into soil and sediment range from 0.0014 - 0.135 %
and from 0.0001 - 0.003 %, respectively, and are neglected for future considerations. It can be
seen that the partitioning of MTBE is shifted more towards the air compartment with
increasing temperature. This is due to the increase of the vapor pressure and the resulting
Henry coefficient. The resulting data from a second scenario run with a log KOW of 1.06 do
not differ significantly.
8087
2013
8 6
92 94
0
10
20
30
40
50
60
70
80
90
100
4 10 20 25
Temperature [°C]
MT
BE
am
ou
nt
[%]
.
Air
Water
Figure 5-4 Equilibrium mass distribution of methyl tert-butyl ether (MTBE) calculated by the
Level I model.
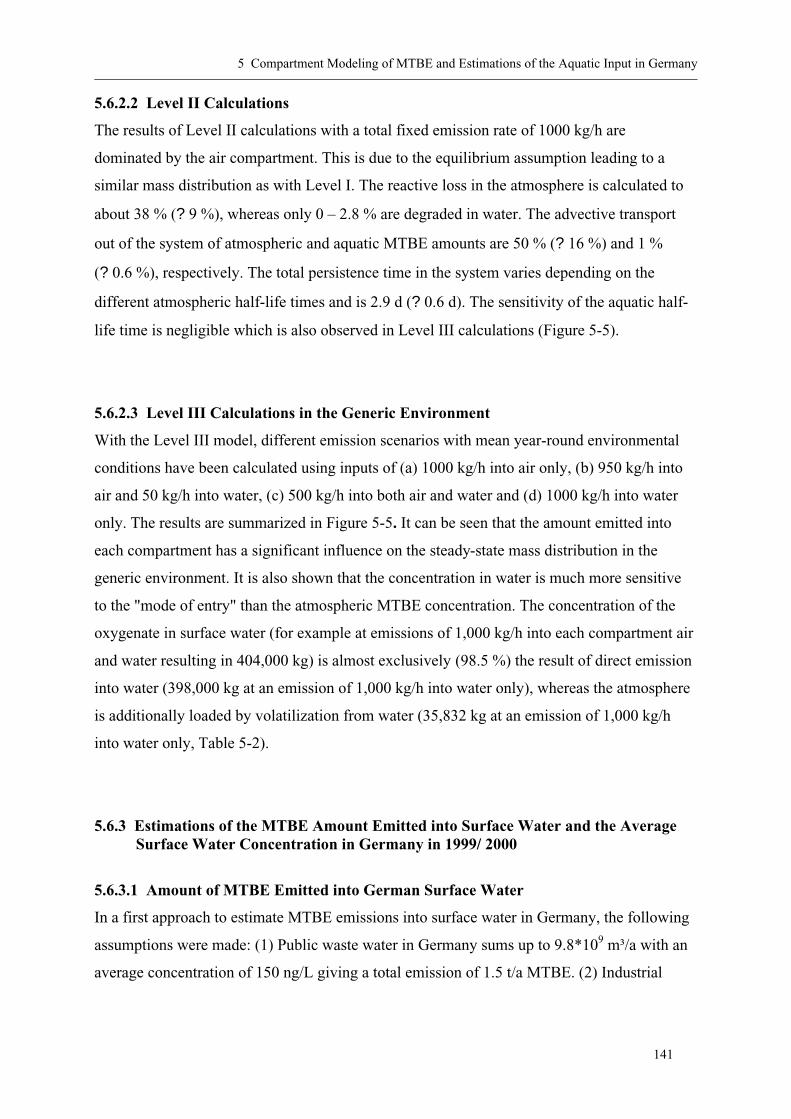
5 Compartment Modeling of MTBE and Estimations of the Aquatic Input in Germany
141
5.6.2.2 Level II Calculations
The results of Level II calculations with a total fixed emission rate of 1000 kg/h are
dominated by the air compartment. This is due to the equilibrium assumption leading to a
similar mass distribution as with Level I. The reactive loss in the atmosphere is calculated to
about 38 % (? 9 %), whereas only 0 – 2.8 % are degraded in water. The advective transport
out of the system of atmospheric and aquatic MTBE amounts are 50 % (? 16 %) and 1 %
(? 0.6 %), respectively. The total persistence time in the system varies depending on the
different atmospheric half-life times and is 2.9 d (? 0.6 d). The sensitivity of the aquatic half-
life time is negligible which is also observed in Level III calculations (Figure 5-5).
5.6.2.3 Level III Calculations in the Generic Environment
With the Level III model, different emission scenarios with mean year-round environmental
conditions have been calculated using inputs of (a) 1000 kg/h into air only, (b) 950 kg/h into
air and 50 kg/h into water, (c) 500 kg/h into both air and water and (d) 1000 kg/h into water
only. The results are summarized in Figure 5-5. It can be seen that the amount emitted into
each compartment has a significant influence on the steady-state mass distribution in the
generic environment. It is also shown that the concentration in water is much more sensitive
to the "mode of entry" than the atmospheric MTBE concentration. The concentration of the
oxygenate in surface water (for example at emissions of 1,000 kg/h into each compartment air
and water resulting in 404,000 kg) is almost exclusively (98.5 %) the result of direct emission
into water (398,000 kg at an emission of 1,000 kg/h into water only), whereas the atmosphere
is additionally loaded by volatilization from water (35,832 kg at an emission of 1,000 kg/h
into water only, Table 5-2).
5.6.3 Estimations of the MTBE Amount Emitted into Surface Water and the Average Surface Water Concentration in Germany in 1999/ 2000
5.6.3.1 Amount of MTBE Emitted into German Surface Water
In a first approach to estimate MTBE emissions into surface water in Germany, the following
assumptions were made: (1) Public waste water in Germany sums up to 9.8*109 m³/a with an
average concentration of 150 ng/L giving a total emission of 1.5 t/a MTBE. (2) Industrial
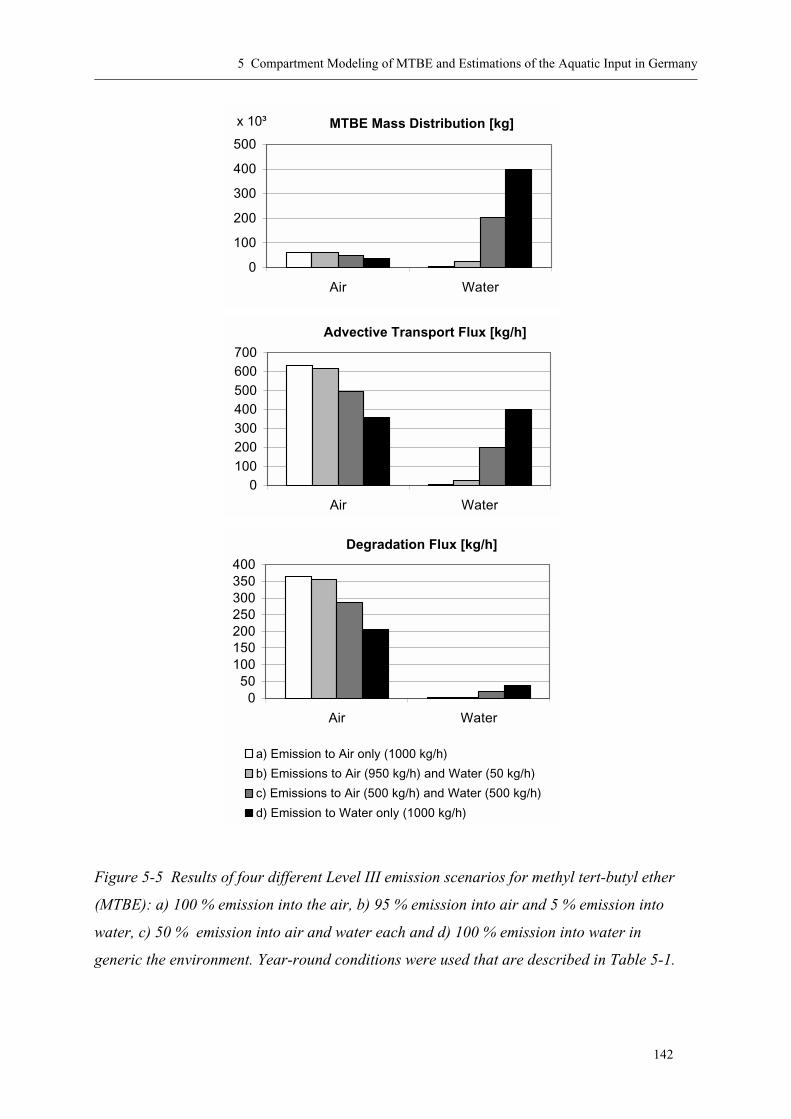
5 Compartment Modeling of MTBE and Estimations of the Aquatic Input in Germany
142
MTBE Mass Distribution [kg]
0
100
200
300
400
500
Air Water
x 10³
Advective Transport Flux [kg/h]
0100200300400500600700
Air Water
Degradation Flux [kg/h]
050
100150200250300350400
Air Water
a) Emission to Air only (1000 kg/h)
b) Emissions to Air (950 kg/h) and Water (50 kg/h)
c) Emissions to Air (500 kg/h) and Water (500 kg/h)
d) Emission to Water only (1000 kg/h)
Figure 5-5 Results of four different Level III emission scenarios for methyl tert-butyl ether
(MTBE): a) 100 % emission into the air, b) 95 % emission into air and 5 % emission into
water, c) 50 % emission into air and water each and d) 100 % emission into water in
generic the environment. Year-round conditions were used that are described in Table 5-1.
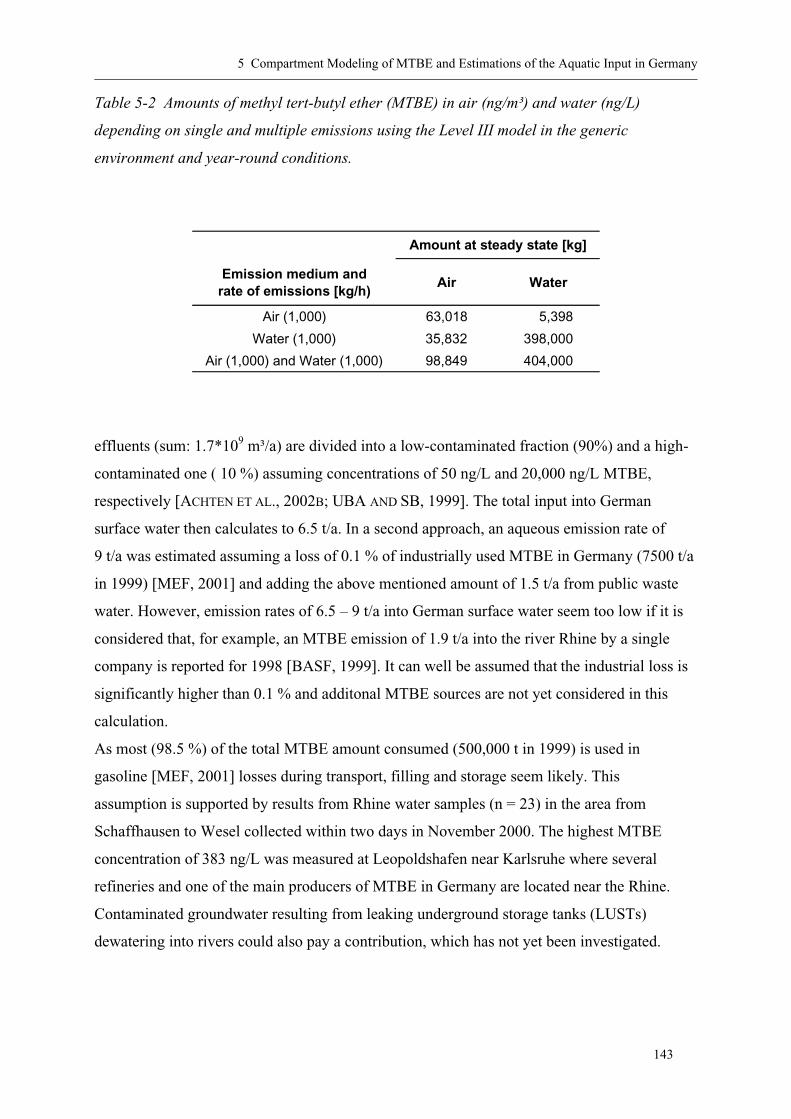
5 Compartment Modeling of MTBE and Estimations of the Aquatic Input in Germany
143
Table 5-2 Amounts of methyl tert-butyl ether (MTBE) in air (ng/m³) and water (ng/L)
depending on single and multiple emissions using the Level III model in the generic
environment and year-round conditions.
Emission medium and rate of emissions [kg/h)
Air Water
Air (1,000) 63,018 . 5,398
Water (1,000) 35,832 398,000
Air (1,000) and Water (1,000) 98,849 404,000
Amount at steady state [kg]
effluents (sum: 1.7*109 m³/a) are divided into a low-contaminated fraction (90%) and a high-
contaminated one ( 10 %) assuming concentrations of 50 ng/L and 20,000 ng/L MTBE,
respectively [ACHTEN ET AL., 2002B; UBA AND SB, 1999]. The total input into German
surface water then calculates to 6.5 t/a. In a second approach, an aqueous emission rate of
9 t/a was estimated assuming a loss of 0.1 % of industrially used MTBE in Germany (7500 t/a
in 1999) [MEF, 2001] and adding the above mentioned amount of 1.5 t/a from public waste
water. However, emission rates of 6.5 – 9 t/a into German surface water seem too low if it is
considered that, for example, an MTBE emission of 1.9 t/a into the river Rhine by a single
company is reported for 1998 [BASF, 1999]. It can well be assumed that the industrial loss is
significantly higher than 0.1 % and additonal MTBE sources are not yet considered in this
calculation.
As most (98.5 %) of the total MTBE amount consumed (500,000 t in 1999) is used in
gasoline [MEF, 2001] losses during transport, filling and storage seem likely. This
assumption is supported by results from Rhine water samples (n = 23) in the area from
Schaffhausen to Wesel collected within two days in November 2000. The highest MTBE
concentration of 383 ng/L was measured at Leopoldshafen near Karlsruhe where several
refineries and one of the main producers of MTBE in Germany are located near the Rhine.
Contaminated groundwater resulting from leaking underground storage tanks (LUSTs)
dewatering into rivers could also pay a contribution, which has not yet been investigated.

5 Compartment Modeling of MTBE and Estimations of the Aquatic Input in Germany
144
In a final approach, based on the considerations made above, an estimated loss of 0.01 % of
the total amount consumed in Germany was used to estimate a surface water emission rate of
50 t/a in 1999, which was then used in the EQC model calculations.
5.6.3.2 Average Surface Water Concentration in Germany
MTBE concentrations in German surface water vary from not detected (<10 ng/L) to more
than 2000 ng/L [ACHTEN ET AL., 2002B; BRAUCH ET AL., 2000A; EFFENBERGER ET AL., 2001].
Rivers used by ship traffic and urban creeks with industrial influence often show
concentrations in the range of 100 – 300 ng/L, whereas generally lower concentrations (about
10 – 50 ng/L) are detected in rural creeks (Table 5-3) [ACHTEN ET AL., 2002B]. From the data,
Table 5-3 Average concentrations of methyl tert-butyl ether (MTBE) in German surface
water. The detection limit is 10 ng/L and it was used for calculations of average
concentrations if MTBE was not detected. On the basis of the results of the analyses, the
upper and lower Rhine was separated at Karlsruhe for simplification. [ACHTEN ET AL., 2002B,
BRAUCH ET AL., 2000A, EFFENBERGER ET AL., 2001]
Surface water Average MTBE concentration [ng/L]
Upper Rhine 90
Lower Rhine 250 - 300
Upper Main 25
Lower Main 150 - 200
Elbenot calculated
(analyzed samples range from 30 - 470 ng/L)
Neckar 160
Weser 130
Danube not detected
Small riversnot calculated
(analyzed samples range from not detected - 200 ng/L)
Rural creeks 20
Urban creeks 50 - 250
Channels 80
Sewage plant effluents 100 - 250
Industrial effluents 70, with some exceptional high concentrations up to 30 000
Urban runoff 100-200
German surface water(roughly estimated)
50
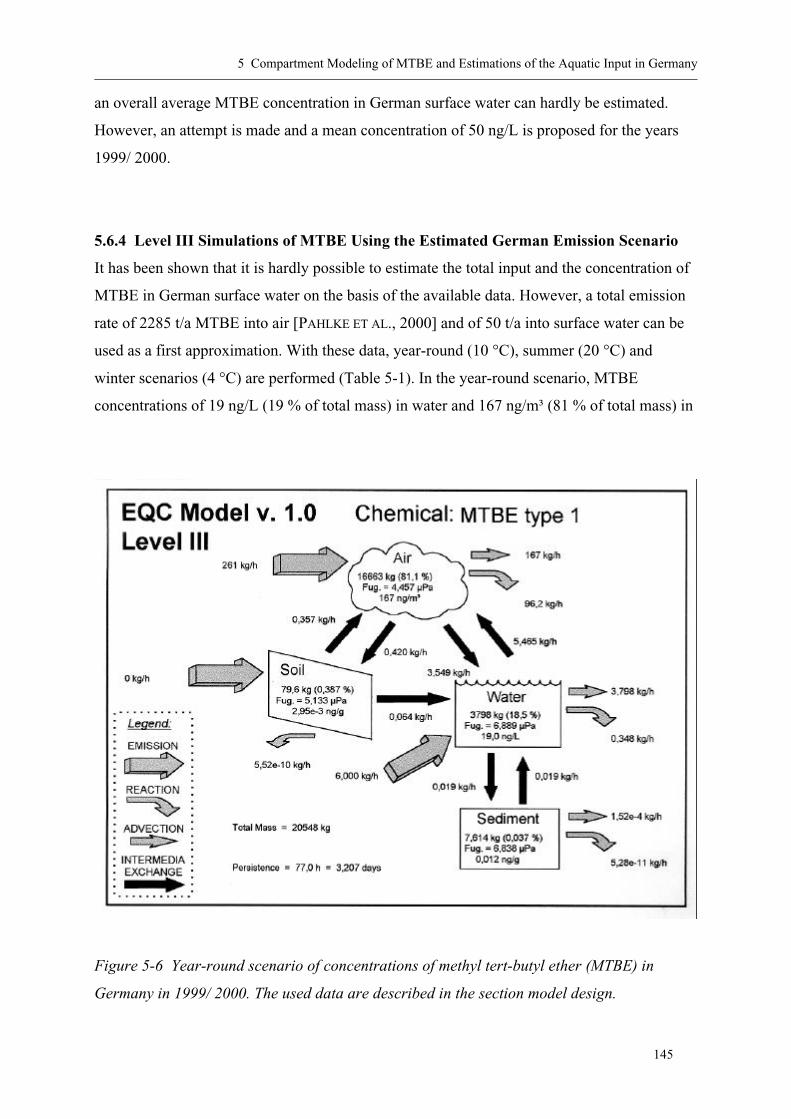
5 Compartment Modeling of MTBE and Estimations of the Aquatic Input in Germany
145
an overall average MTBE concentration in German surface water can hardly be estimated.
However, an attempt is made and a mean concentration of 50 ng/L is proposed for the years
1999/ 2000.
5.6.4 Level III Simulations of MTBE Using the Estimated German Emission Scenario
It has been shown that it is hardly possible to estimate the total input and the concentration of
MTBE in German surface water on the basis of the available data. However, a total emission
rate of 2285 t/a MTBE into air [PAHLKE ET AL., 2000] and of 50 t/a into surface water can be
used as a first approximation. With these data, year-round (10 °C), summer (20 °C) and
winter scenarios (4 °C) are performed (Table 5-1). In the year-round scenario, MTBE
concentrations of 19 ng/L (19 % of total mass) in water and 167 ng/m³ (81 % of total mass) in
Figure 5-6 Year-round scenario of concentrations of methyl tert-butyl ether (MTBE) in
Germany in 1999/ 2000. The used data are described in the section model design.
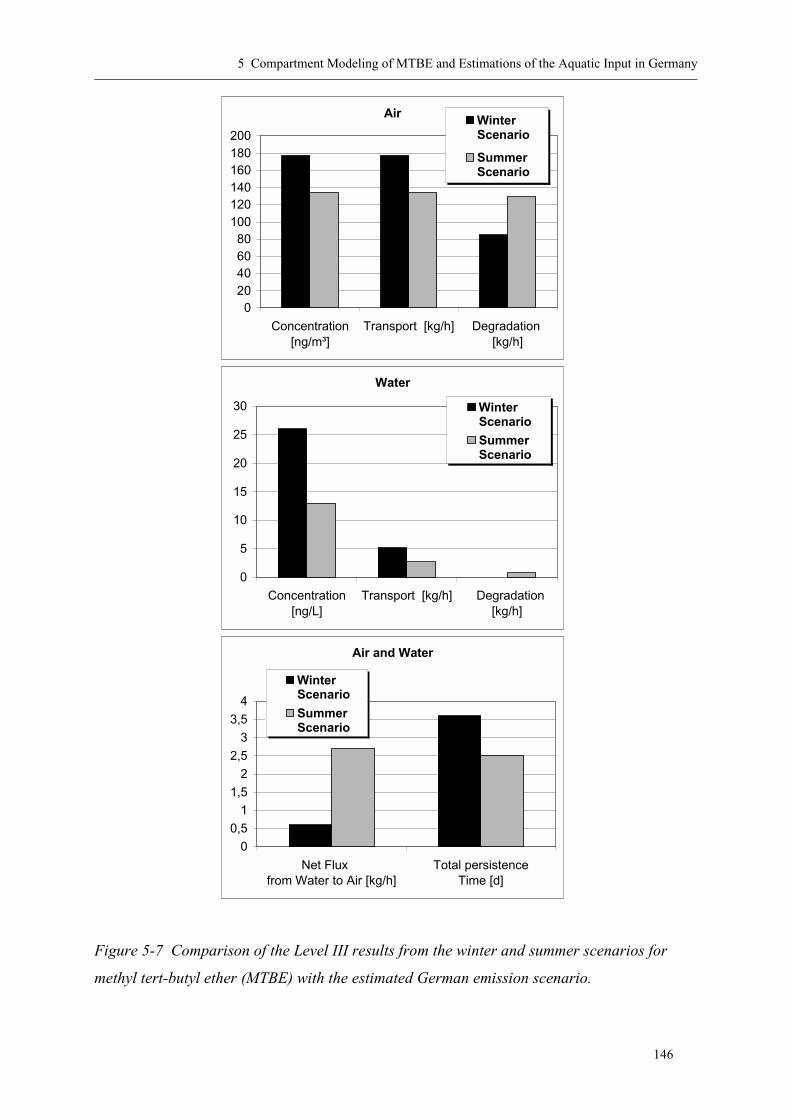
5 Compartment Modeling of MTBE and Estimations of the Aquatic Input in Germany
146
Air
020406080
100120140160180200
Concentration[ng/m³]
Transport [kg/h] Degradation [kg/h]
WinterScenario
SummerScenario
Water
0
5
10
15
20
25
30
Concentration[ng/L]
Transport [kg/h] Degradation [kg/h]
WinterScenario
SummerScenario
Air and Water
00,5
11,5
22,5
33,5
4
Net Flux from Water to Air [kg/h]
Total persistence Time [d]
WinterScenario
SummerScenario
Figure 5-7 Comparison of the Level III results from the winter and summer scenarios for
methyl tert-butyl ether (MTBE) with the estimated German emission scenario.
5 Compartment Modeling of MTBE and Estimations of the Aquatic Input in Germany
147
air result (Figure 5-6). The compartments soil and sediment can be neglected. The
degradation flux in the atmosphere is calculated to 96 kg/h, whereas only 0.4 kg/h are
degraded in water. The advective transport of MTBE out of the system is 167 kg/h for the
atmosphere and 3.8 kg/h for water. In both compartments, calculated MTBE loss by advective
transport is significantly higher than by degradation. The net flux between the two
compartments of 2 kg/h from water to air is comparably low. The calculations are repeated
assuming different temperatures simulating winter and summer time. The results are
summarized in Figure 5-7. In summertime, the calculated steady-state MTBE concentration in
water is only half of the value for wintertime. This is due to the changes in water solubility
and vapor pressure as well as the different half-life times. The varying MTBE partitioning and
degradation behavior is responsible for the difference at about the same amounts. In the
atmosphere, the concentration in summer is only about 25 % lower than in wintertime which
is the result of higher OH- radical concentrations compared to winter. MTBE degradation in
the atmosphere almost equals transport out of the system in summer, whereas in winter the
degradation flux is only half of the advective flux. In the water compartment, transport is
dominating degradation by far in winter and even with the 50 % reduction calculated for
summer transport is still about three times higher than degradation. The net MTBE flux
between the compartments water and air is low and varies from 0.6 kg/h (winter) to 2.7 kg/h
(summer). The total persistence time of MTBE in the system shows a relatively small
variation ranging from 2.5 d (summer) to 3.6 d (winter).
5.7 Discussion
5.7.1 General Aspects of the Behavior of MTBE in the Environment
MTBE is expected to be fairly persistent in Main water as half-life times of about 80 – 120 d
(105 d) at 18 °C and roughly 1.5 y (533 d) at 4 °C have been calculated from the batch
experiment. This is supported by the above-mentioned domination of transport over
degradation in the water compartment. The volatilization should also be low considering
calculated half-life times of 4 – 8 d from Rhine and Main water and of 1 – 3 d from creeks in
wintertime using the data published by PANKOW ET AL. [1996] for MTBE volatilization from
river water. The equilibrium mass distribution of MTBE calculated with the Level I model of
94 % in air and 6 % in water at 25 °C are the same as calculated elsewhere [PAHLKE ET AL,
2000; MEF, 2001]. However, for environmental considerations, the average annual
5 Compartment Modeling of MTBE and Estimations of the Aquatic Input in Germany
148
temperature should be taken into account and partitioning of 87 % in air and 13 % in surface
water at 10 °C seems more representative. The results of the Level II calculations show that
atmospheric MTBE transport could be an important mechanism as only 38% of the
atmospheric MTBE are calculated to be degraded within the system, whereas 50% leave the
system by advection. This is also supported by the detection of MTBE in the atmosphere of
some U.S. states with no known MTBE usage [CLAWGES ET AL., 2000]. However, in
Germany, the oxygenate was not detected in precipitation in remote areas in wintertime,
whereas it was often detectable in urban air [ACHTEN ET AL., 2001A]. The general total
persistence time of 2.9 d for MTBE is little lower but comparable to the value of 4 d
calculated for linear alkylbenzene sulfonates (LAS) with the Level II model [MACKAY ET AL.,
1996B]. From considerations of MTBE in the generic Level III environment, it can be
concluded that water concentration is significantly more sensitive to the "mode of entry" than
air concentration. This effect is mainly the result of the high water solubility and low aqueous
degradation properties of the oxygenate. The calculated contribution of 98.5 % of MTBE in
the water compartment originating from direct emission into water emphazises the
significance for the investigation of sources emitting the oxygenate directly into river water.
On the other hand, MTBE concentrations in air are affected by both, direct emission and
volatilization from water.
5.7.2 MTBE Concentrations Calculated by the Level III EQC Model with German Emission Scenario in Comparison to Measured Data (1999/ 2000)
Under the assumptions of atmospheric (2285 t/a) and aqueous emission rates (50 t/a), the
average MTBE concentration in German surface water in 1999/ 2000 of approximately
50 ng/L is more than twice as high as the mean surface water concentration of 19 ng/L
calculated by the EQC model in the year-round scenario. This difference could be explained
by some fixed model parameters which are not adequate for the German situation. The fixed
amounts of 10 % of the area covered with water, a water volume of 200 km³ and a water
depth of 20 m do not represent the situation in Germany. Here, the amount of 2.2% area
[STATISTISCHES BUNDESAMT, 2001] covered with water and an estimated water depth of
1.35 m may be more realistic resulting in higher MTBE concentrations than calculated by the
model. Another reason for the difference could be an overestimated average MTBE
concentration in German water. Finally, only a low sample amount of industrial effluents with
some exceptional high MTBE concentrations were analyzed and additional unknown

5 Compartment Modeling of MTBE and Estimations of the Aquatic Input in Germany
149
industrial input cannot be taken into account due to the lack of analytical data. In Europe,
where the MTBE use (2,646,000 t/a) was about 5 times higher compared to Germany
(500,000 t/a) in 1999, the calculated continental MTBE concentration in water of 100 ng/L
[MEF, 2001] would be higher by factors of 2 or 5.
Data of atmospheric MTBE analyses in Germany have not been published. The calculated
average concentration of the oxygenate in European air of 220 ng/m³ is higher by a factor of
1.3 compared to the result of this study for German air of 167 ng/m³.
MTBE is hardly degradable in water and for winter- and year-round scenarios, the assumption
of slow degradation or no degradation does not have a significant influence on the resulting
environmental concentrations.
The results of the comparison of the winter and summer scenarios show that the behavior of
MTBE varies significantly. In summer, atmospheric (25 %) and aqueous (50 %)
concentrations are lower than in winter which is the result of higher degradation rates (and
lower water solubility). As a consequence, in winter, more MTBE remains undegraded and is
transported. Volatilization of MTBE from water is the dominating pathway between the two
compartments throughout the year.
5.8 Conclusion
The results show that a part of emitted MTBE into the environment partitions into the aquatic
compartment, which should not be neglected. Additionally, a significant temperature
dependence of environmental MTBE concentrations with higher amounts in winter were
observed.
One of the most sensitive parameters in modeling the environmental fate of organic
compounds is the emission of the substance into the various compartments. Direct MTBE
emission into water, for example, has proved to be a very sensitive parameter for MTBE
concentration in surface water. Estimations on the basis of available production volumes and
use patterns together with measured MTBE concentrations in waste water and industrial
effluents cannot fully explain the mean surface water concentrations calculated from single
measurements in Germany.
Additional industrial effluents, losses from gasoline distribution or storage tanks, emissions
from tank ships and shallow urban groundwater contaminated with MTBE dewatering into
near rivers could represent additional possible emission sources. More research is needed to
detect such sources that in many cases might be point-source emissions.
6 Conclusions and Future Implications
150
6 CONCLUSIONS AND FUTURE IMPLICATIONS
By use of the presented methods, MTBE can be analyzed in gasoline by GC/ FID with a
single capillary column and in water at low levels using HS-SPME/ GC-MS. The second
method allows to measure aqueous concentrations of MTBE in river water and precipitation
at levels as low as 10 – 50 ng/L. These values often occur in German environmental samples
and can be detected with a relative standard deviation of 10 - 11 %. The method is also suited
for the measurement of other oxygenates and VOCs in water. Aqueous samples with
concentrations of MTBE and BTEX in the µg/L - mg/L range, as often occur at contaminated
sites, have to be diluted before analysis and matrix effects need to be considered.
MTBE will probably persist in the environment for several decades to come. Today, MTBE
represents besides chlorinated hydrocarbons like chloroform, trichloroethene and
tetrachloroethene the quantitatively dominating organic compounds in river waters. In the
U.S., air quality has improved at the cost of drinking water contamination and of ubiquitously
dispersed MTBE concentrations at low levels nationwide. As a consequence, high financial
expenditure for research and remediation techniques are necessary. In Germany and
elsewhere in Europe, MTBE has also been detected in the atmospheric and aquatic
environment although it is generally used at lower amounts compared to some states of the
U.S.. MTBE concentrations in the Main and Rhine rivers were lower by about a factor of two
compared to streams e.g. in New Jersey. In 1999/ 2000, effluents of chemical industry
represent significant point-source emissions for German river water. Due to the unfavorable
physico-chemical properties, direct MTBE emissions into water is a very sensitive parameter
compared to other emission pathways and only small amounts released result in measurable
concentrations over long distances because it is very persistent in water. All emission sources
linked with the production, transport and use of oxygenated gasoline are responsible for lower
but well dispersed concentrations of the oxygenate in the aquatic environment, that are mostly
collected by surface runoff. For Germany, a total emitted MTBE amount of roughly 50 t/a
into the aquatic environment and a mean surface water concentration of 50 ng/L are estimated
for 1999/ 2000. Under the assumptions of atmospheric and aqueous emission rates of 2285 t/a
and 50 t/a, respectively, a calculated mean MTBE concentration in German water of 19 ng/L
(at 10 °C) results using the EQC model. The difference of the estimated average MTBE
6 Conclusions and Future Implications
151
concentration of 50 ng/L and the calculated amount of 19 ng/L in German water remains
unclear. However, the fixed amount of 10 % water surface in the model is at least partially
responsible because the water surface in Germany is only 2.2 % leading to higher
concentrations. The occurrence of industrial MTBE emissions that can show concentrations as
high as 30 µg/L, are mostly unknown. After 15 years since the introduction of the oxygenate
in Germany, the compound can be detected in urban precipitation in wintertimes and in
surface waters with a tendency towards increasing concentrations. This distribution is
generally not desirable and is also of concern as MTBE is detected at low levels in drinking
water produced from riverbank filtration. The amounts represent trace-level concentrations
and to nowadays knowledge are not of health concern as they remain 2 – 3 orders of a
magnitude below the drinking water standard of the U.S. of 13 µg/L but they are important for
precautionary aspects. Due to limited data, the toxicity of the oxygenate should not be finally
evaluated.
The MTBE use and concentrations in the environment are increasing and will probably be
even higher in the future. As a result from the directive limiting aromatic hydrocarbons in
gasoline to 35 % (w/w) from 2005 on, in the future increased amounts of oxygenates will be
needed to guarantee the required octane numbers. If only MTBE is used for this purpose, in
Europe, a doubling of the used amout can be expected from 2005 on which would be still by a
factor of 2 -3 below the Californian situation except for large rivers where a comparable
situation in Germany and California would be reached soon.
Other oxygenates like ETBE, which is used in France can be expected to evaporate less than
MTBE due to its higher boiling temperature and lower vapor pressure but the other
environmental aspects are comparable to MTBE.
In the U.S., ethanol will probably substitute MTBE, because it is well degradable in the
environment. However, its use shows two significant disadvantages: First, the hygroscopic
property of ethanol, that leads to the need of separated storage from gasoline until the delivery
to gasoline stations and second, the resulting lower degradation ablility of the gasoline
component benzene in groundwater if contaminated by gasoline containing ethanol.
The solutions to air quality problems caused by vehicle emissions should include
considerations of other effects on the environment and not simply replacing MTBE with
another oxygenate. Life-cycle analysis should be a key element for policy makers [BLUE
RIBBON PANEL, 1999; CHANG AND LAST, 1998]. In the case of MTBE versus ethanol, for
6 Conclusions and Future Implications
152
example, the relevance of toxicological aspects of the ether (including the formation of TBF,
TBA and formaldehyde) and the reduction of CO and hydrocarbon emissions due to the use
of MTBE should be compared to the impact of formed amounts of acetaldehyde and possibly
PAN from the use of ethanol. Long-term economic aspects cannot be excluded from these
considerations. Is it, for example, worth effecting large investigations for the substitution of
MTBE by ethanol if technologies with less environmental impact other than commonly used
in vehicles emerge?
More research in cleaner-burning engines and cleaner-burning fuels with fewer impurities is
needed. Moreover, after the environmental disastrous stories of gasoline additives (tetraethyl
lead ! aromatics ! MTBE ! ?) new engine technologies, not depending on the burning of
fuel may be the choice of future mobility. The chairman of the EUROPEAN ASSOCIATION OF
OXYGENATED FUEL PRODUCERS, H. ROVERS, noted that more research is needed in the new
lean burn engine technology, modern diesel engines and fuel cell technology [ROVERS, 2000].
Chemical cocktails of MTBE, antibiotics and endocrinic compounds are released by sewage
plants or accidents into river water and nowadays, its concentrations and pathways can be
determined by analytical methods. However, the evaluation of effects remains difficult. The
increasing number of allergic reactions of humans may be linked to the increasing number of
anthropogenic compounds ubiquitiously present in the environment at low concentrations.
Recently, the Umweltbundesamt presented the OSPAR-Strategy, which is the result of the
decisions of 16 countries to stop the input of dangerous chemicals into the North Atlantic Sea
until 2020 [EAWAG, 2001].
However, the most important conclusion drawn from the MTBE story and its predecessors is,
that never again, a chemical should be blindly added to a product widely used and dispersed
by humans without assessing the future risks for the environment. Even if the toxic effects of
MTBE seem low, it is not desirable to have detectable concentrations of a gasoline additive in
the compartments that we live on, drinking water, precipitation, river water and air.
7 References
153
7 REFERENCES
Abdel-Rehim M.; Bielenstein M.; Arvidsson T., Evaluation of Solid-Phase
Microextraction in Combination with Gas Chromatography (SPME-GC) as a Tool
for Quantitative Bioanalysis J. Microcolumn Separations 2000, 12, 308-315
Abke, W.; Korpien, H.; Post, B., Main und Nidda: Saisonal hohe Belastung durch den
Pestizid-Wirkstoff Isoproturon 52. Jahresbericht der Arbeitsgemeinschaft der Rhein-Wasserwerke e.V. (ARW): Köln, 1995, 45-55.
ACGIH, American Conference of Governmental Industrial Hygienists Threshold Limit Values, Biological Indices ACGIH: Cicinnati, OH, USA, 2001.
Achten, C., Püttmann, W., Determination of Methyl tert-Butyl Ether in Surface Water
by Use of Solid-Phase Microextraction Environ. Sci. and Technol. 2000, 34,
1359-1364.
Achten, C.; Kolb, A.; Püttmann, W., Methyl tert-Butyl Ether (MTBE) in Urban and
Rural Precipitation in Germany Atmos. Environ. 2001a, 35/36, 6337-6345.
Achten, C.; Kolb, A.; Püttmann, W., Sensitive Method for Determination of Methyl
tert-Butyl Ether (MTBE) in Water by Use of Headspace-SPME/ GC-MS
Fresenius J. Anal. Chem., 2001b, 371 (4), 519-525.
Achten, C.; Püttmann, W., Method for Determination of Methyl tert-Butyl Ether in
Gasoline by Gas Chromatography J. Chrom. A 2001a, 910, 377-383.
Achten, C.; Püttmann, W., Empfindliche Messmethode für Methyl-tertiär-butylether
(MTBE) in Wasser Umwelt Technologie Aktuell 2001b, 1, 22-25.
Achten, C.; Kolb, A.; Püttmann, W., Occurence of Methyl tert-Butyl Ether (MTBE) in
Riverbank Filtered Water and Drinking Water Produced by Riverbank Filtration
(Part II) Environ. Sci. Technol. 2002a, 36, 3662-3670.
Achten, C.; Kolb, A.; Seel, P.; Gihr, R.; Püttmann, W., Methyl tert-Butyl Ether
(MTBE) in River and Waste Water in Germany Environ. Sci. Technol. 2002b, 36,
3652-3661.
Anonymous, Lawmakers Push MTBE Ban Chem. Week 2001a, Feb. 28, 40.
Anonymous, California Court Rejects Suit Against MTBE Ban Chem. Week 2001b, Sept. 12, 5.
Anonymous, Denmark to Act Against MTBE Leakage Problem ECN 2000a, 72
(1896), 50.
Anonymous, Germany Investigates MTBE ECN 2000b, 72 (1902), 8-9.
7 References
154
Anonymous L’eau Rendue Imporpre à la Consommation, La Voie du Nord,
09.07.1999.
Anonymous, MTBE-How Should Europe Respond? Petrol. Rev. 2000c, Feb, 37-38.
Anonymous, MTBE‘ Future in Doubt Performence Chemicals Europe 2000d, 15 (1), 9.
Anonymous, Phase-Out Plans May Yet Change ECN 2001c, 74 (1946), 5.
ARB New Regulations for Gasoline Marine Engines Fact sheet prepared by California
EPA Air Resources Board, Sacramento, CA, 1999.
ARCO Methyl Tertiary Butyl Ether: Acute Toxicological Studies, ARCO Chemical
Company: Glenolden, Pennsylvania, 1980.
ASTM, American Society for Testing Materials, Annual Book of ASTM Standards,
Method D4815: Philadelphia, 1989.
Atkinson, R.; Carter, W.P., Kinetics and Mechanisms of the Gas-Phase Reaction of
Ozone with Organic Compounds under Atmospheric Conditions, Chem. Rev.
1984, 84, 437-470.
Auergesellschaft GmbH (Hrsg.): Auer-Technikum, 12. Ausgabe, Berlin, 1989.
Baehr, A.L.; Charles, E.G.; Baker, R.J., Methyl tert-Butyl Ether Degradation in the
Unsaturated Zone and the Relation Between MTBE in the Atmosphere and
Shallow Groundwater Wat. Res. Res. 2001, 37, 223-233.
Baehr, A.L.; Stackelberg, P.E.; Baker, R.J., Evaluation of the Atmosphere as a Source
of Volatile Organic Compounds in Shallow Groundwater Wat. Res. Res. 1999, 35,
127-136.
Baehr, A.L.; Zapecza, O.S.Methyl tert-butyl ether (MTBE) and other volatile organic compounds in lakes in Byram township, Sussex County, New Jersey, Summer 1998, Water-Resources Investigations Report 98-4264, U.S. Geological Survey:
Denver 1998.
BASF, Jahresbericht 1998, Ludwigshafen, 1999.
Bay, S.M.; Brown, J.S. Assessment of MTBE Discharge Impacts on California Marine Water Quality Report prepared for California State Water Resources Control
Board. Southern California Coastal Water Research Project, Westminster, CA,
2000.
BDGW, Bundesverband der Deutschen Gas- und Wasserwirtschaft, Unser Trinkwasser in Hessen; Bundesverband der Deutschen Gas- und Wasserwirtschaft
e.V.: Wiesbaden, 1999.
7 References
155
Bekri, M., Dipartement Ginie Chimique, Universiti de technologie de Compihgne,
France, 2001, personal communication
Belpoggi, F.; Soffritti, M.; Maltoni, C. Methyl-tertiary-Bytyl Ether (MTBE) - A
Gasoline Additive Causes Testicular and Lymphohaematopoietic Cancers in Rats
Toxicol. Ind. Health 1995, 11, 119-49.
Bender, D.A.; Zogorski, J.S.; Luo, W.; Pankow, J.F.; Majewski, M.S.; Baker, R.J.;
Atmosphere-water interaction of chloroform, toluene, and MTBE in small perennial urban streams; Proc. of the Air and Waste Management Assoc.
Conference and Exposition, 93rd
, Salt Lake City, Utah, June 18-22, Sewickley,
Pennsylvania, 2000.
Bennett, P.J.; Kerr, A. Kinetics of the Reactions of Hydroxyl Radicals with Aliphatic
Ethers Studied under Simulated Atmospheric Conditions. Temperature
Dependences of the Rate Coefficients J. Atmos. Chem. 1990, 10, 29-38.
Bierwagen, B.G.; Keller, A.A., Measurement of Henry’s Law Constant For Methyl
tert-Butyl Ether Using Solid-Phase Microextraction Environ. Toxicol. Chem. 2001, 20, 1625-1629.
Bird, M.G.; Burleigh-Flayer, H.D.; Chun, J.S.; Douglas, J.F.; Kneiss, J.J.; Andrews,
L.S. Oncogenicity Studies of Inhaled Methyl tertiary-Butyl Ether (MTBE) in CD-
1 Mice and F-344 Rats J. Appl. Toxicol. 1997, 17 Suppl 1, 45-55.
Black, L.; Fine, D., High Levels of Monoaromatic Compounds Limit the Use of Solid-
Phase Microextraction of Methyl tert-Butyl Ether and tert-Butyl Alcohol Environ. Sci. Technol. 2001, 35, 3190-3192.
Blue Ribbon Panel on Oxygenates in Gasoline. Achieving Clean Air and Clean Water: The Report of the Blue Ribbon Panel on Oxygenates in Gasoline; EPA 420-R-99-
021; U.S. Government Printing Office: Washington, DC, 1999.
BLW, Bayerisches Landesamt für Wassserwirtschaft, Benzinzusatz MTBE - eine neue Gefahr für unsere Gewässer?: München, 2000,
http://www.bayern.de/lfw/frameset.htm?Hauptframe=/lfw/aktuelles/presse/20122
000_mtbe.htm
Bocchini P.; Andalo C.; Bonfiglioli D.; Galletti G.C., Solid-Phase Microextraction
Gas Chromatography/ Mass Spectrometric Analysis of Volatile Organic
Compounds in Water Rapid Commun Mass Spectrom 1999, 13, 2133-2139.
Bologna, M., Leading Petroleum Companies Named In Ground Water Contamination
Class Action Toxics Law Reporter 2000, 17, 411-412.
Borden, R.C.; Daniel, R.A.; LeBrun IV, L.E., Intrinsic Biodegradation of MTBE and
BTEX in a Gasoline-Contaminated Aquifer Water Res. Res. 1997, 33, 1105-1115.
7 References
156
Boughton, C.J.; Lico, M.S. Volatile organic compounds in Lake Tahoe, Nevada and California, July-September; Fact Sheet FS-055-98; U.S. Geological Survey:
Denver, 1998.
Bradley, P.M.; Chapelle, F.H.; Landmeyer, J.E., Effect of Redox Conditions on MTBE
Biodegradation in Surface Water Sediments Environ. Sci. Technol. 2001b, 35,
4643-4647.
Bradley, P.M.; Landmeyer, J.E.; Chapelle, F.H., Aerobic Mineralization of MTBE and
tert-Butyl Alcohol by Stream-Bed Sediment Microorganisms Environ. Sci. Technol. 1999, 33, 1877-1879.
Bradley, P.M.; Landmeyer, J.E.; Chapelle, F.H, Widespread Potential for Microbial
MTBE Degradation in Surface-Water Sediments. Appl. Environ. Microbiol. 2001a, 35, 658-662.
Brauch, H.-J.; Fleig, B.; Hambsch, W.; Kühn, W.; Lindner, K., Der Rhein im Jahr
1999 56. Jahresbericht der Arbeitsgemeinschaft Rhein-Wasserwerke e.V. (ARW): Köln, 1999, 13-47.
Brauch, H.-J.; Klinger, J.; Sacher, F.; Stieler, C. Untersuchungen zur Bedeutung von Methyl-tertiär-butlyether (MTBE) für die Trinkwasseraufbereitung aus Grundwasser; Abschlussbericht zum DVGW-Forschungsvorhaben W 08/99,
Deutscher Verein des Gas- und Wasserfaches e.V. Technologiezentrum Wasser:
Karlsruhe, 2000a.
Brauch, H.-J.; Sacher, F.; Denecke, E.; Tacke, T., Wirksamkeit der Uferfiltration für
die Entfernung von polaren organischen Spurenstoffen Gas-Wasserfach (gwf) Wasser Abwasser 2000b, 141, 226-234.
Bravo, H.A.; Torres, R.J., The Usefulness of Air Quality Monitoring and Air Quality
Impact Studies Before the Introduction of Reformulated Gasolines in Developing
Countries. Mexico City, A Real Case Study Atmos. Environ. 2000, 34, 499-506.
Breen, K.J.; Kontis, A.L.; Rowe, G.L.; Haefner, R.J. Simulated Ground-Water Flow and Sources of Water in Killbuck Creek Valley near Wooster, Wayne County, Ohio; Water-Resources Investigations Report 94-4131, U.S. Geological Survey:
Denver, 1995.
Breum, R., Raffiniertes Gemisch Öko-TEST-Magazin 1998, 4, 64-68.
Brown, J.S.; Bay, S.M.; Greenstein, D.J.; Ray, W.R. Concentrations of Methyl tert-Butyl Ether (MTBE) in Inputs and Receiving Waters of Southern California
Marine Poll. Bull. 2001, 42, 957-966.
Bruce, B.W.; McMahon, P.B. Shallow Ground-Water Quality Beneath a major Urban
Center: Denver, Colorado, USA J. Hydrol. 1996, 186, 129-152.
Bundesamt für Wirtschaft, Amtliche Mineralöldaten für die Bundesrepublik Deutschland, Eschborn / Ts, 2001, http://www.bawi.de

7 References
157
BUWAL, Bundesamt für Umwelt, Wald und Landschaft der Schweiz, 1999.
http://www.buwal.ch/Luft/d/ -> Immissionen ->Immissionsmesswerte Schweiz ->
Datenblätter für VOC.
Buxton, H.T.; Landmeyer, J.E.; Baehr, A.L.; Church, C.D.; Tratnyek, P.G.,
Interdisciplinary Investigation of Subsurface Contaminant Transport and Fate at Point-Source Releases of Gasoline Containing MTBE Proc. Petroleum
Hydrocarbon Conference, Houston, 1997.
Calvert, J.; Pitts, J.R. Photochemistry, Wiley: New York, NY.
Cassada, D.A.; Zhan, Y.; Snow, D.D.; Spalding, R.F., Trace Analysis of Ethanol,
MTBE, and Related Oxygenate Compounds in Water Using Solid-Phase
Microextraction and Gas Chromatography/ Mass Spectrometry Anal Chem 2000,
72, 4654-4658.
Chang, D.P.; Last, J.A., Clean Air, Dirty Water? The MTBE Story J. Environ. Enging.
1998, 124, 910-912.
Choquette, S.J.; Chesler, S.N.; Duewer, D.L.; Wang, S.; O’Haver, T.C. Identification
and Quantitation of Oxygenates in Gasoline Ampules Using Fourier Transform
Near-Infrared and Fourier Transform Raman Spectroscopy Anal. Chem. 1996, 68, 3525.
Church, C.D.; Isabelle, L.M.; Pankow, J.F.; Rose, D.L.; Tratnyek, P.G., Method for
Determination of Methyl tert-Butyl Ether and Its Degradation Products in Water
Environ. Sci. Technol. 1997, 31, 3723-3726.
Church, C.D.; Isabelle, L.M.; Pankow, J.F.; Tratnyek, P.G., Hydrolysis of tert-Butyl
Formate: Kinetics, Products, and Implications for the Environmental Impact of
Methyl tert-Butyl Ether Environ. Tox. Chem. 1999, 18, 2789-2796.
Cirvello, J.D.; Radovsky, A.; Heath, J.E.; Farnell, D.R.; Lindamood, C. Toxicity and
Carcinogenicity of t-Butyl Alcohol in Rats and Mice Following Chronic Exposure
in Drinking Water. Toxicol. Ind. Health 1995, 11, 151-165.
Clawges, R.; Rowe, B.; Zogorski, J. National Survey of MTBE and Other VOCs in Community Drinking-Water Sources; 2001,
http://wwwsd.cr.usgs.gov/nawqua/vocns/
Clawges, R.; Zogorski, J.; Bender, D. Key MTBE findings based on National Water-Quality Monitoring; 2000, http://wwwsd.cr.usgs.gov/nawqua/vocns/
CONCAWE, A Survey of European Gasoline Qualities – summer 1996, Automotive
Emissions Management Group, Brussels, October 1998
Cox, R.A.; Goldstone, A. Atmospheric Reactivity of Oxygenated Motor Fuel Additives,
Commission of European Communities, Brussels, 1982.

7 References
158
CSTEE, Scientic Committee on Toxicity, Ecotoxicity and the Environment of the
European Commission (CSTEE) Opinion on the Results of the Risk Assessment of Methyl tertiary-Butyl Ether (MTBE), carried out in the framework of Council
Regulation (EEC) 793/93 on the evaluation and control of the risks of existing
substances, expressed at the 23rd
CSTEE plenary meeting: Brussels, Apr. 24,
2001.
Cummins, T.M.; Robbins, G.A.; Henebry, B.J.; Goad, R.; Gilbert, E.J.; Miller, M.E.;
Stuart, J.D., A Water Extraction, Static Headspace Sampling, Gas
Chromatographic Method to Determine MTBE in Heating Oil and Diesel Fuel
Environ. Sci. Technol. 2001, 35, 1202-1208.
Czerwinski, J., Zygmunt, B.; Namiesnik, J. Head-Space Solid-Phase Microextraction
for the GC-MS Analysis of Terpenoids in Herb Based Formulations Fresenius Environ. Bull. 1996, 5, 55-60.
Daly, M.H.; Lindsey, B.D. Occurrence and concentrations of volatile organic compounds in shallow ground water in the Lower Susquehanna River basin, Pennsylvania and Maryland; Water-Resources Investigations Report 96-4141;
U.S. Geological Survey: Denver, 1997.
Daubert, T.E., Danner, R.P. Physical and thermodynamic properties of pure chemicals: Data compilation: American Institute of Chemical Engineers, 1989.
Davis, J.M.; Farland, W.H., The Paradoxes of MTBE Toxicol. Sci. 2001, 61, 211-217.
Debrewer, L.M .; Rowe, G.L.; Reutter, D.C.; Moore, R.C.; Hambrook, J.A.; Baker,
N.T. Environmental Setting and Effects on Water Quality in the Great and Little Miami River Basins, Ohio and Indiana; Water-Resources Investigations Report
99-4201, U.S. Geological Survey: Denver, 2000.
Deeb, R.A.; Hu, H.-Y.; Hanson, J.R.; Scow, K.M.; Alvarez-Cohen, L., Substrate
Interactions in BTEX and MTBE Mixtures by an MTBE-Degrading Isolate
Environ. Sci. Technol. 2001, 35, 312-317.
Degussa Hüls-Oxeno, Marl, 2001, personal communication
Dekov, V.M.; Komy, Z.; Araújo, F.; van Put, A.; van Grieken, R., Chemical
Composition of Sediments, Suspended Matter, River Water and Ground Water of
the Nile (Aswan-Sohag Traverse) Sci. Total Environ. 1997, 201, 195-210.
Delzer, G.C.; Zogorski, J.S.; Lopes, T.J.; Bosshart, R.L. Occurrence of the Gasoline Oxygenate MTBE and BTEX Compounds in Urban Stormwater in the United States;Water-Resources Investigations Report 96-4145; U.S. Geological Survey:
Denver, 1996.
Deneke, E. Z., Auswertung langzeitlicher Messreihen zur aeroben Abbauleistung der
Uferpassage einer Wassergewinnungsanlage am Niederrhein Wasser-Abwasser-Forschung 1997, 25, 311-318.

7 References
159
Dermietzel, J., Strenge, G., Determination of VOC Contamination in Borehole
Sediments by Headspace-SPME-GC Analysis Fresenius J. Anal. Chem. 1999,
364, 645-647.
Dernbach, L.S., The Complicated Challenge of MTBE Cleanups Environ. Sci. Technol. 2000, 34, 516A.
Deutscher Wetterdienst, Witterungsreport, Offenbach, 1999.
DeWitt and Company, MTBE and Oxygenates 1998 Annual.: Houston, TX, 1998.
DeWitt and Company, MTBE-a Wordwide Outlook, Oxygenated Fuel Association
(OFA), 1999, http://www.ofa.net/doc/intl/doc/worldox/Ofadecember.htm
DGMK, Deutsche Wissenschaftliche Gesellschaft für Erdöl, Erdgas und Kohle e.V.,
Zusammensetzung von Ottokraftstoffen aus deutschen Raffinerien,
Forschungsbericht 502, Hamburg, Dez. 1994.
DiSanzo, F.P.; J. Chromatogr. Sci. 1990, 28, 73.
Dormedy, D.F.; Roddguez-Fuentes, R.; Carr, J.D. National Meeting- American Chemical Society Division of Environmental Chemistry 1999, 39, 55.
Doskey, P.V.; Fukui, Y.; Sultan, M., Source Profiles for Nonmethane Organic
Compounds in the Atmosphere of Cairo, Egypt J. AWMA 1999, 49, 814-822.
Dupasquier, D.; Revah, S.; Auria, R., Biofiltration of Methyl tert-Butyl Ether Vapors
by Cometabolism with Pentane: Modeling and Experimental Approach Environ. Sci. Technol. 2002, 36, 247-253.
DVWK, Deutscher Verband für Wasserwirtschaft und Kulturbau e.V.
Pflanzenschutzmittel im Uferfiltrat des Rheins; DVWK Materialien 3/ 1993,
Wirtschafts- und Verlagsgesellschaft Gas und Wasser mbH (WVGW): Bonn,
1993.
EAUK, Environment Agency of the United Kingdom, The Fuel Additive MTBE- a Groundwater Protection Issue?, National Groundwater and Contaminated Land
Centre, 2001,
http://www.environment-agency.gov.uk//gwcl/Downloads/PDF/mtbe.pdf
EAWAG, Medienmitteilung, Infotag der EAWAG 2001, 19.09.2001
EC, Commission of the European Communities, Proposal for a Directive of the European Parliament and of the Council on the Quality of Petrol and Diesel Fuels and Amending Directive 98/70/EC, Brussels, Belgium, 2001.
ECOTOC, European Centre for Ecotoxicology and Toxicology Methyl tert-butyl ether (MTBE). Health Risk characterisation. CAS no 1634-04-4 (EINECS no.216.653.1): ECOTOC Brussels, Belgium, 1997.

7 References
160
EFOA, European Fuel Oxygenates Association, 2002, http://www.efoa.org/fr/mtbe_environment/risk_assessment.htm
EIA, Energy Information Administration Monthly Oxygenate Telephone Report, Form EIA-819M, EIA: Washington, D.C., 1999.
Effenberger, M.; Weiss, H.; Popp, P; Schirmer, M., Untersuchungen zum
Benzininhaltstoff Methyl-tertiär-butylether (MTBE) in Grund- und
Oberflächenwasser in Deutschland Grundwasser 2001, 2, 51-60.
EPA, Environmental Protection Agency of the United States of America Methyl-tertiary-butylether (MTBE), http://www.epa.gov/mtbe/faq.htm#concerns, 2001.
Eppinger, P.; Boernick, H.; Worch, E., Description and Identification of Aromatic
Amines in Water from the River Elbe and an Assessment of their Importance for
Drinking Water Quality Vom Wasser 1999, 92, 225–242.
Ewies, J.N.; Chang, D.P.; Schroeder, E.D.; Scow, K.M.; Morton, R.L.; Caballero, R.C.
Meeting the challenge of MTBE biodegradation 90th
Annual Meeting and
Exhibition of the Air and Waste Mangagement Association: Toronto, 1997.
Faulk, R.O.; Gray, J.S., MTBE: Can the Controversy be Contained? Toxics Law Reporter 1999, 21, 603-620.
Finneran, K.T.; Lovley, D.R.; Anaerobic Degradation of Methyl tert-Butyl Ether
(MTBE) and tert-Butyl Alcohol (TBA) Environ. Sci. Technol. 2001, 35, 1785–
1790.
FITA, Fraunhofer Institut für Toxikologie und Aerosolforschung Auswirkungen der sauerstoffhaltigen Verbindungen Methyl-tert.-butlyether MTBE und Ethyl-tert.-butylether ETBE auf die Kraftstoffqualität und das Emissionsverhalten von Verbrennungsmotoren, FKZ: 96NR090-S, Literaturstudie: FITA, Hannover,
1997.
Fodor, G.E.; Kohl, K.B.; Mason, R.L., Analysis of Gasoline by FT-IR Spectroscopy
Anal.Chem. 1996, 68, 23.
Fortin, N.Y.; Deshusses, M.A. Gas phase biotreatment of MTBE Proc. 1998 USC-
TRG Conference on Biofiltration: Los Angeles, CA, 1998.
Fraser, M.P.; Cass, G.R.; Simoneit, B.R., Gas-Phase and Particle-Phase Organic
Compounds Emitted from Motor Vehicle Traffic in a Los Angeles Roadway
Tunnel Environ. Sci. Technol. 1998, 32, 2051-2060.
Frimmel, F.H. Current Research Contributing to the Quality of Raw and Drinking
Water Das Gas- und Wasserfach (GWF) Wasser Special 1996, 137, 102-109.
Gabele, P.A.; Pyle, S.M., Emissions from Two Outboard Engines Operating on
Reformulated Gasoline Containing MTBE Environ. Sci. Technol. 2000, 34, 368-
372.
7 References
161
Gaffney, J.S.; Marley, N.A.; Cunningham, M.M.; Doskey, P.V., Measurements of
Peroxyacyl Nitrates (PANs) in Mexico City: Implications for Megacity Air
Quality Impacts on Regional Scales Atmos. Environ. 1999, 33, 5003-5012.
Gaines, R.B.; Ledford E.B.; Stuart, J.D., Analysis of Water Samples for Trace Levels
of Oxygenate and Aromatic Compounds Using Headspace Solid-Phase
Microextraction and Comprehensive Two-Dimensional Gas Chromatography J. Microcolumn Separations 1998, 10, 597-604.
Garabedian, S.P.; Coles, J.F.; Grady, J,S.; Trench, E.C.T.; Zimmerman, M.J. Water Quality in the Connecticut, Housatonic, and Thames River Basins, Connecticut, Massachusetts, New Hampshire, New York, and Vermont, 1992-95 Circular 1155,
U.S. Geological Survey: Denver, 1998, http://water.usgs.gov/lookup/get?circ1155
Grady, S.J. Volatile organic compounds in groundwater in the Connecticut, Housatonic, and Thames river basins, 1993 – 1995; National Water-Quality
Assessment Fact Sheet 029-97, U.S. Geological Survey: Denver, 1998.
Grischek, T.; Neitzel, P.; Walther, W.; Nestler, W. Fate of Organic Sulfur Compounds
During Infiltration of Elbe River Water- The Group Parameters AOS and OIS as
Evaluation Criteria Vom Wasser 1998, 91, 257-273.
Grosjean, E.; Grosjean, D.; Gunawardena, R.; Rasmussen, R.A., Ambient
Concentrations of Ethanol and Methyl tert-Butyl Ether in Porto Alegre, Brazil,
March 1996-April 1997 Environ. Sci. Technol. 1998, 32, 736-742.
Grote, C.; Levsen, K. Vollautomatisches SPME-GC Analysensystem zum on-site Monitoring organischer Wasserinhaltsstoffe, Fraunhofer Institut für Toxikologie
und Aerosolforschung, Hannover, 1998.
Guderitz, T.; Schmidt, W.; Brauch, H-J., Die organische Belastung der oberen Elbe
vor dem Hintergrund der Trinkwassergewinnung aus Uferfiltrat Vom Wasser 1993, 81, 315-326.
Gurundhada, Rao, V.V.; Gupta, S.K. Intern. Assoc. Hydrol. Sci. Publication 1999,
259, 73–82.
Haberer, K.; Knepper, T.P., Verhalten polarer organischer Stoffe bei der
Trinkwassergewinnung aus Rheinwasser Gas-Wasserfach (gwf) Wasser Abwasser 1993, 134, 526-532.
Halden, R.U.; Happel, A.M.; Schoen, S.R., Evaluation of Standard Methods for the
Analysis of Methyl tert-Butyl Ether and Related Oxygenates in Gasoline-
Contaminated Groundwater Environ Sci Technol 2001, 35, 1469-1474.
Hanson, J.R.; Ackerman, C.E.; Scow, K.M. Biodegradation of Methyl tert-Butyl Ether
by a Bacterial Pure Culture Appl. Environ. Microbiol. 1999, 65, 4788-4792.
7 References
162
Happel, A.M.; Beckenbach, E.H.; Halden, R.U. An evaluation of MTBE impacts to California groundwater resources, Report submitted to the California State Water
Resources Control Board, Department of Energy and Western States Petroleum
Association: June 11, 1998.
Happel, A.M.; Dooher, B.; Beckenbach, E.H., Methyl Tertiary Butyl Ether (MTBE) Impacts to California Groundwater; UCRL-MI-133696; Environmental
Protection Department, Environmental Restoration Division, Lawrence
Livermore National Laboratory, University of California: Livermore, CA, 1999.
Hardison, L.K, Curry, S.S., Ciuffetti, L.M.; Hyman, M.R. Metabolism of Diethyl
Ether and Cometabolism of Methyl tert-Butyl Ether by a Filamentous Fungus, a
Graphium sp. Appl. Environ. Microbiol. 1997, 63, 3059-3067.
Hardman, J.S.; Hill, M.A.; Mills, G.A., Chromatographic and Spectroscopic Analysis
of MTBE and TAME Octane Improvers in Gasolines Fuel 1993, 72, 1563.
Hatten, G.; Blackburn, G., Findings of Kansas MTBE Investigation. ASTSWMO
MTBE Workgroup Newsletter 1999, 2 (1),
www.astswmo.org/Publications/summaries.htm
Heberer, T. Stan, H.J., Determination of Clofibric Acid and N-(Phenylsulfonyl)-
Sarcosine in Sewage, River and Drinking Water Intern. J. Envrion. Anal. Chem.
1997, 67, 113–124.
Heglund, D.L.; Tilotta, D.C., Determination of Volatile Organic Compounds in Water
by Solid-Phase Microextraction and Infrared Spectroscopy Environ. Sci. Technol. 1996, 30, 1212-1219.
HLUG, Hessisches Landesamt für Umwelt und Geologie, Hessischer Gewässergütebericht 1997, Hessisches Ministerium für Umwelt, Energie, Jugend,
Familie und Gesundheit: Wiesbaden, 1998,
http://www.hlug.de/medien/wasser/gewaesserguete/home_n/home.htm
Hogue, C., Study Urged for Environmental Effects of MTBE Substitutes C&EN, 2000,
June 26, 30-31.
Hong, S.; Duttweiler, D.M.; Lemley, A.T., Analysis of Methyl tert-Butyl Ether and its
Degradation Products by Direct Aqueous Injection onto Gas Chromatography
with Mass Spectrometry or Flame Ionization Detection Systems J. Chrom. A
1999, 857, 205-216.
Hopmann, R.; Janssen, H.M.; Puijker, L.M., The Influence of the Use and the
Production of Pesticides on Surface, Bank-Filtered and Drinking Water Quality in
the Netherlands Water Supply 1993, 11, 73-88.
Hötzl, H.; Reichert, B. Schadstofftransport und Schadstoffabbau bei der Uferfiltration am Beispiel des Untersuchungsgebietes „Böckinger Wiesen“ im Neckartal bei Heilbronn; Schadstoffe im Grundwasser Band 4, Deutsche
Forschungsgemeinschaft, VCH Verlagsgesellschaft: Weinheim, 1996.
7 References
163
Howard, C.J., Russell, A.; Atkinson, R.; Calvert, J., Air quality benefits of the winter oxyfuel program Office of Science and Technology Policy: Washington D.C.,
1996, 91 p.
Howard, P.H. Handbook of Environmental Fate and Exposure Data for Organic
Chemicals. In Solvents 2. eds. Michalenco, E.M., Meulan, W.M., Basu, B.K.,
Beauman, J.A., Sage, G.W., Jarvis, W.F.; Gray, A.D. pp. 577: Lewis Publisher,
1990.
Hubbard, C.E., Barker, J.F.; O’Hannesin, S.F.; Vandergrient, M.; Gilham, R.W.
Transport and fate of dissolved methanol, methyl-tertiary-butyl-ether, and monoaromatic hydrocarbons in a shallow sand aquifer; American Petroleum
Institute, Health and Environmental Sciences Department: Washington, DC,
1994; p 226.
Huels AG, Verteilungskoeffizient n-Oktanol-Wasser (Pow-Wert) für "Altstoffe", 1989.
Hunkeler, D.; Butler, B.; Aravena, R.; Barker, J.F., Monitoring Biodegradation of
Methyl tert-Butyl Ether (MTBE) Using Compound-Specific Carbon Isotope
Analysis Environ. Sci. Technol. 2001, 35, 676–681.
Hurt, K.L.; Wilson, J.T., Anaerobic Biodegradation of MTBE in a Contaminated
Aquifer The Fifth International Symposium- In Situ and On-Site Bioremediation,
San Diego, CA, April 19-22, 1999, A1 Bioremediation of MTBE.
Huttunen, H. Determination of the water-solubility of gasolines containing ethers:
NESTE Oil Refining, 1997.
Hyman, M.; Kwon, P.; Williamson, K.; O’Reilly, K. Cometabolism of MTBE by
Alkane-Utilizing Microorganisms Proc. First Int. Conf. on Remediation of Chlorinated and Recalcitrant Compounds, Monterey, CA, May 18-21, 1998, C1-
3, 321-326, Richmond.
Hyman, M.; O’Reilly, K., Physiological and Enzymatic Features of MTBE-Degrading
Bacteria The Fifth International Symposium- In Situ and On-Site Bioremediation,
San Diego, CA, April 19-22, 1999, A1 Bioremediation of MTBE.
Iob, A; Buenafe, R.; Abbas, N.M., Determination of Oxygenates in Gasoline by FTIR
Fuel 1998, 77, 1861.
IUCLID, International Uniform Chemical Information: European Chemicals Bureau,
1996.
Jacobs, J.; Guertin, J.; Herron, C. MTBE: Effects on Soil and Groundwater Resource
Lewis Publishers: Boca Raton, 2001.
James, K.J.; Stack, M.A., Rapid Determination of Volatile Organic Compounds in
Environmentally Hazardous Wastewaters Using Solid-Phase Microextraction
Fresenius J. Anal. Chem. 1997, 358, 833-837.

7 References
164
Japar, S.M.; Wallington, T.J.; Richert, J.F.; Ball, J.C., The Atmospheric Chemistry of
Oxygenated Fuel Additives: t-Butyl Alcohol, Dimethyl Ether, and Methyl t-Butyl
Ether Int. J. Chem. Kinetics, 1990, 22, 1257-1269.
Järvenpää, E.P.; Zhang, Z.; Huopalahti, R.; King, J.W., Determination of Fresh Onion
(Allium cepa L.) Volatiles by Solid-Phase Microextraction Combined with Gas
Chromatography-Mass Spectrometry Z. Lebensm. Unters. Forsch. A 1999, 207,
39-43.
Johnson, R.; Pankow, J.; Bender, D.; Price, C.; Zogorski, J., MTBE – To What Extent
Will Past Releases Contaminate Community Water Supply Wells? Environ. Sci. Technol. 2000, 34 (9), 210A-217A.
Jüttner, F., Efficacy of Bank Filtration for the Removal of Fragrance Compounds and
Aromatic Hydrocarbons Wat. Sci, Tech. 1999, 40, 123-128.
Kanai, H.; Inouye, V.; Goo, R.; Chow, R.; Yazawa, L.; Maka, J., GC/ MS Analysis of
MTBE, ETBE, and TAME in Gasolines Anal. Chem. 1994, 66, 924.
Kang, J.J., Harrison, P.B., Pisarik, M.F.; Frankenberger, W.T., Enhanced MTBE
Biodegradation Treatability Study Under Aerobic and Anaerobic Conditions, In Situ and On-Site Bioremediation, A1 Bioremediation of MTBE, The Fifth
International Symposium April 19-22, 1999, San Diego, California.
Katzen, R., Madson, P.W. and Monceaux, D.A., Biomass-Derived Ethanol and ETBE
in Motor Fuels, Proc. Ann. Meet. Am. Inst. Chem. Eng.: Beaudry, November
1997, paper 244j,
http//www1.che.ufl.edu/meeting/1997/annual/session/j/index.html.
Keller, A.; Froines, J.; Koshland, C.; Reuter, J.; Suffet, I.; Last, J. Health and Environmental Assessment of MTBE, Report to the governor and legislature of the
State of California: University of California; 1998.
Kharoune, M.; Pauss, A.; Lebault, J.M., Aerobic Biodegradation of an Oxygenates
Mixture: ETBE, MTBE and TAME in an Upflow Fixed-Bed Reactor Wat. Res.
2001, 35, 1665-1674.
Kirchstetter, T.W.; Singer, B.C.; Harley, R.A.; Kendall, G.R.; Chan, W., Impact of
Oxygenated Gasoline use on California Light-Duty Vehicle Emissions Environ. Sci. Technol. 1996, 30, 661-670.
Klinger, J.; Sacher, F.; Brauch, H.J., MTBE As Groundwater Pollutant –The Situation
in Germany Proc. of the Europ. Geophys. Soc. 25th General Assembly,
Hydrology and chemical processes: Nice, April 2000,
http//134.76.234.216/ScientificProgramme/hsa6.04.oral.htm
Koenigsberg, S.; Sandefur, C.; Mahaffey, W., Deshusses, M.; Fortin, N. The Role of
Peroxygens in the Bioremediation of MTBE In Situ-Bioremediation of Petroleum Hydrocarbon and Other Organic Compounds; Battelle Press: Columbus, OH,
1999.

7 References
165
Kloepfer, M. Umweltschutz- Textsammlung des Umweltrechts der Bundesrepublik
Deutschland, München, 1999.
Kolah, A.K., Zhiwen, Q.; Mahajani, S.M., Dimerized Isobutene: An Alternative to
MTBE Chemical Innovation 2001, March, 15-21.
Kolb, A. Dissertation, Institut für Mineralogie –Umweltanalytik-, J.W. Goethe-
Universität Frankfurt/M, current study
Kolb, A. GC/ MS-Analytik von Methyl-tertiär-Butylether in Oberflächenwasser und Grundwasser, Diplomarbeit J.W. Goethe-Universität Frankfurt/ M, Frankfurt/ M,
2000.
Koterba, M.T., Wilde, S.D., Lapham, W.W. Ground-Water Data Collection Protocols and Procedures for the National Water-Quality Assessment Program: Collection and Documentation of Water-Quality Samples and Related Data; Open File
Report 95-33;U.S Geological Survey: Denver, 1995.
Kuehn, W.; Mueller, U., Riverbank Filtration – An Overview J. Am. Wat. Works Assoc. 2000, 92, 60-69.
Landmeyer, J.E.; Chapelle, F.H.; Bradley, P.M. Assessment of Intrinsic Bioremediation of Gasoline Contamination in the Shallow Aquifer, Laurel Bay Exchange, Marine Corps Air Station, Beaufort, South Carolina; Water-Resources
Investigations Report 96-4026; U.S. Geological Survey: Denver, 1996.
Landmeyer, J.E.; Chapelle, F.H.; Bradley, P.M.; Pankow, J.F.; Church, C.D.;
Tratnyek, P.G., Fate of MTBE Relative to Benzene in a Gasoline-Contaminated
Aquifer (1993-98) GWMR 1998, Fall, 93-102.
Landmeyer, J.E.; Chapelle, F.H.; Herlong, H.; Bradley, P.M., Methyl tert-Butyl Ether
Biodegradation by Indigenous Aquifer Microorganisms Under Natural and
Artificial Oxic Conditions Environ. Sci. Technol. 2001, 35, 1118-1126.
Lange, F.T.; Redin, C.; Brauch, H.J.; Eberle, S.H., Auftreten aromatischer Sulfonate in
Industrieabwasser, Flußwasser, Uferfiltrat und in der Trinkwasseraufbereitung
Vom Wasser 1998, 90, 121–134.
Lince, D.P.; Wilson, L.R.; Carlson, G.A., Methyl tert-Butyl Ether (MTBE)
Contamination in Private Wells Near Gasoline Stations in Upstate New York
Bull. Environ. Contam. Toxicol. 1998, 61, 484-488.
Lince, D.P.; Wilson, L.R.; Carlson, G.A.; Bucciferro, A., Effects of Gasoline
Formulation on Methyl tert-Butyl Ether (MTBE) Contamination in Private Wells
Near Gasoline Stations Environ. Sci. Technol. 2001, 35, 1050-1053.
Little, A.D. MTBE and the Requirements for Underground Storage Tank Construction and Operation in Member States, Final Report to European Commission,
Reference No. 73488, March 2001,
http://europa.eu.int/comm/environment/air/mtbe.pdf

7 References
166
Lloyd, S.W.; Lea, J.M.; Zimba, P.V., Rapid Analysis of Geosmin and 2-
Methylisoborneol in Water Using Solid-Phase Microextraction Procedures Wat Res 1998, 32, 2140-2146.
Lockwood, A.F.; Caddock, B.D., A Single-Column Gas Chromatographic Method for
the Analysis of Gasolines Containing Oxygenated Compounds Chromatographia
1983, 17, 65.
Lopes, T.J.; Bender, D.A., Nonpoint Sources of Volatile Organic Compounds in
Urban Areas-Relative Importance of Land Surfaces and Air Environ. Poll. 1998,
101, 221-230.
LUBW, Landesamt für Umwelt Baden-Württemberg, 2001,
www.lfu.baden-württemberg.de/lfu/abt4/gwue/ergebnisse.pdf,.
Mace, R.E., Choi, W.J., The Size and Behavior of MTBE Plumes in Texas Proc. Nat. Groundwater Assoc. Conf. on Petroleum Hydrocarbons and Organic Chemicals in Ground Water, Houston, TX, 1998.
Mackay, D.; Guardo, A.D.; Paterson, S.; G.; Cowan, C.E., Evaluating the
Environmental Fate of a Variety of Types of Chemicals Using the EQC Model
Environ. Toxicol. Chem., 1996, 15, 1627-1637.
Mackay, D.; Guardo, A.D.; Paterson, S.; Kicsi, G.; Cowan C.E., Assessing the Fate of
New and Existing Chemicals: A Five-Stage Process Environ. Toxicol. Chem.,
1995, 15, 1618-1626.
Mackay, D.; Guardo, A.D.; Paterson, S.; Kicsi, G.; Cowan, C.E.; Kane, D.M.,
Assessment of Chemical Fate in the Environment Using Evaluative, Regional and
Local-Scale Models: Illustrative Application to Chlorobenzene and Linear
Alkylbenzene Sulfonates Environ. Toxicol. Chem., 1996, 15, 1638-1648.
Mackay D., Multimedia Environmental Models -The Fugacity Approach, 2nd
edition,
Lewis Publishers, Boca Raton, 2001.
Mackay, D.; Paterson, S.; Shiu, W.Y., Generic Models for Evaluating the Regional
Fate of Chemicals Chemosphere 1992, 24, 695-717.
Mancini, E.R.; Steen, A.; Rausina, G.A.; Wong, D.C.; Arnold, W.R.; Gostomski, F.E.;
Davis, T.; Hockett, J.R.; Stubblefield, W.A.; Drottar, K.R.; Springer, T.A.; Errico,
P. MTBE Ambient Water Quality Criteria Development: A Public/Private
Partnership Environ. Sci. Technol. 2002, 36, 125-129.
Martin-Alonso, J.; Lloret, R.; Rovira, S.; Garcia-Mendi, C.; Romero, J.; Ventura, F.,
Occurence of Organochlorine Compounds in the Raw Water of the Llobregat
River (Spain) Toxicol. Environ. Chem. 1997, 60, 47-56.
Marxsen, C.S., MTBE-Latest Victim of US Environmental Overregulation? Oil and Gas Journal 2001, Feb. 26, 20-26.
7 References
167
Mastri, C., Keplinger, M.L.; Fancher, O.E. Acute Toxicity Studies on X-801-25, Industrial Bio-test Laboratories, Inc. (IBT): 1969.
MEF, Ministry of the Environment Finland Risk Assessment of Methyl tertiary-Butyl Ether (MTBE), EINECS N° 216-653-1, carried out in the framework of European
Council Regulation (EEC) 793/93 on the evaluation and control of the risks of
existing substances; MEF: Helsinki, Final Draft 06/ 2001, received from J. Malm
Mehlmann, M.A., Methyl-Tertiary-Butyl-Ether (MTBE) Misclassified Am. J. Ind. Med. 2001, 39, 505-508.
Mehlmann, M.A., Mischlassification of Carcinogenic Methyl Tertiary Butyl Ether
(MTBE) by the National Toxicology Program Board: Smokescreen In, Science
Out? Arch. Environ. Health 2000, 55, 73-74.
Meusinger, R., Qualitative and Quantitative Determination of Oxygenates in Gasolines
Using 1H Nuclear Magnetic Resonance Spectroscopy Anal. Chim. Acta 1999,
391, 277.
Miermans, C.J.; van der Velde, L.E.; Frintrop, P.C., Analysis of Volatile Organic
Compunds, Using the Purge-and-Trap Injector Coupled to a Gas Chromatograph/
Ion Trap Mass Spectrometer: Review of the Results in Dutch Surface Water of
the Rhine, Moise, Nothern Delta Area and Westerscheldt, Over the Period 1992-
1197 Chemosphere 2000, 40, 39-48.
Miller, J.C.; Miller, J.N. Statistics for analytical chemistry, third edition; Ellis
Horwood Ltd: Chichester, England, 1993.
Miller, M.E., Stuart, J.D., Measurement of Aqueous Henry’s Law Constants for
Oxygenates and Aromatics Found in Gasolines by the Static Headspace Method
Anal. Chem. 2000, 72, 622-625.
Mo, K., Lora, C.O., Wanken, A.E., Jwanmardian, M., Yang, X.; Kulpa, C.F.,
Biodegradation of Methyl tert-Butyl Ether by Pure Bacterial Cultures Appl. Microbiol. Biotechnol. 1997 47, 69-72.
Möder, M.; Schrader, S.; Franck, U.; Popp, P., Determination of Phenolic Compounds
in Waste Water by Solid-Phase Microextraction Fresenius J. Anal. Chem. 1997, 357, 326-332.
Moran, M.J.; Zogorski, J.S.; Squillace, P.J., MTBE in Ground Water of the United
States- Occurrence, Potential Sources, and Long-Range Transport Proc. Am. Wat. Works Assoc.Wat. Resources Conf., 1999.
Mormile, M.R.; Shi, L.; Suflita, J.M., Anaerobic Biodegradation of Gasoline
Oxygenates: Extrapolation of Information to Multiple Sites and Redox Conditions
Environ. Sci. Technol. 1994, 28, 1727-1732.
Mrasek, V. Unerwünschte Nebenwirkung: Ein Segen für die Luft, aber auch ein Fluch für das Wasser. Die Schweiz prüft die Gefährlichkeit des Benzinzusatzes MTBE;
Züricher Sonntagszeitung 01/30/ 2000, 83.
7 References
168
Neitzel, P.; Abel, A.; Grischek, T.; Nestler, W.; Walther, W., Behavior of Aromatic
Sulfonic Acids During Bank Infiltration and Under Laboratory Conditions Vom Wasser 1998, 90, 245-271.
Ng, W.F.; Teo, M.J.; Lakso, H.A., Determination of Organophosphorous Pesticides in
Soil by Headspace Solid-Phase Microextraction Fresenius J. Anal. Chem. 1999,
363, 673-679.
Nilsson, T.; Montanarella, L.; Baglio, D.; Tilio, R.; Bidoglio, G.; Facchetti, S., Analysis of Volatile Organic Compounds in Environmental Water Samples and
Soil Gas By Solid-Phase Microextraction Intern. J. Environ. Anal. Chem. 1998,
69, 217-226.
OEHHA, Office of Environmental Health Hazard Assessment, Public Health Goal for Methyl tertiary-Butyl Ether (MTBE) in Drinking Water, OEHHA, 1999.
O’Reilly, K.T.; Moir, M.E.; Taylor, C.D.; Smith, C.A.; Hyman, M.R. Hydrolysis of
tert-Butyl Methyl Ether (MTBE) in Dilute Aqueous Acid Environ. Sci. Technol. 2001, 35, 3954-3961.
Pahlke, G. Kein Umweltrisiko durch MTBE, Umweltbundesamt: Berlin, 2000,
http://www.umweltbundesamt.de/wasser/themen/mtbe.htm
Pahlke, G.; Leonhardt, H.; Tappe, M., Mögliche Umweltbelastungen durch die
Nutzung von MTBE (Methyl-tertiär-Butylether) als Kraftstoffzusatz in
Deutschland und Westeuropa Erdöl Erdgas Kohle 2000, 10, 498–504.
Pankow, J.F.; Rathbun, R.E.; Zogorski, J.S., Calculated Volatilization Rates of Fuel
Oxygenate Compounds and Other Gasoline-Related Compounds From Rivers and
Streams Chemosphere 1996, 33, 921-937.
Pankow, J.F.; Thomson, N.R.; Johnson, R.L.; Baehr, A.L.; Zogorski, J.S, The Urban
Atmosphere As a Non-Point Source for the Transport of MTBE and Other
Volatile Organic Compounds (VOCs) to Shallow Groundwater Environ. Sci. Technol. 1997, 31, 2821-2828.
Park, K.; Cowan, R.M. Biodegradation of Gasoline Oxygenates In-situ and on-site bioremediation, Volume I, Battelle Press: Columbus, OH, 1997a.
Park, K.; Cowan, R.M. Effects of Oxygen and Temperature on the Biodegradation of
MTBE Proc. 213th Am. Chem. Soc. Nat. Meet.: San Francisco, CA, 1997b,
Preprints of extended abstracts 37(I) 421-423.
Paul, S.; Börnick, H.; Worch, E., Untersuchungen zur Wasserwerksrelevanz
aliphatischer Amine bei der Trinkwassergewinnung aus Elbeuferfiltrat Teil 1:
Mikrobiologische Abbaubarkeit Vom Wasser 2001, 96, 29–42.
Pauls, R.E. Chromatographic Characterization of Gasolines Advances in Chromatography 1995, 35, 259.
7 References
169
Pauls, R.E., Determination of High Octane Components - Mehtyl t-Butyl Ether,
Benzene, Toluene, and Ethanol in Gasoline by Liquid Chromatography J. Chromatogr. Sci. 1985, 23, 437.
Pawliszyn, J. Solid-Phase Microextraction, Theory and Practice; Wiley-VCH: New
York, 1997.
Piazza, F.; Barbieri, A.; Violante, F.S.; Roda, A., A Rapid and Sensitive Method for
Methyl tert-Butyl Ether Analysis in Water Samples by Use of Chemosphere
2001, 44, 539-544.
Poore, M.; Chang, B; Niyati, F.; Madden, S. Sampling and Analysis of t-Methyl Butyl
Ether in Ambient Air at Selected Locations in California Nat. Meet. Am. Chem. Soc., Div. Environ. Chem. 1997, 37, 407.
Post, B.; Korpien, H; Allendorf, A.; Lange, F.T.; Landrieux, T., Untersuchungen zum
Vorkommen von Glyphosat und AMPA in Main und Nidda und ihr Verhalten in
der Wasseraufbereitung 56. Jahresbericht der Arbeitsgemeinschaft Rhein-Wasserwerke e.V. (ARW): Köln, 1999, 135-155.
Poulopoulos, S.; Philippopoulos, C., Influence of MTBE Additon into Gasoline on
Automotive Exhaust Emissions Atmos. Environ. 2000, 34, 4781-4786.
Powers, S.E.; Rice, D.; Brendan, D.; Alvarez, P.J., Will Ethanol-Blended Gasoline
Affect Groundwater Quality? Environ. Sci. Technol. 2001, 35, 24A-30A.
Price, J.A.; Saunders, K.J., Determination of Airborne Methyl tert-Butyl Ether in
Gasoline Atmospheres Analyst 1984, 109, 829.
Prince, R.C., Biodegradation of Methyl tertiary-Butyl Ether (MTBE) and Other Fuel
Oxygenates Crit. Rev. Microbiol. 2000, 26, 163-178.
Proc. Intern. Riverbank Filtration Conf.; Jülich, W.; Schubert. J., Eds.; Internationale
Arbeitsgemeinschaft der Wasserwerke im Rheineinzugsgebiet (IAWR):
Düsseldorf, 2000, 309 p.
Pruden, A.; Suidan, M.T.; Venosa, A.D.; Wilson, G.J., Biodegradation of Methyl tert-Butyl Ether Under Various Substrate Conditions Environ. Sci. Technol. 2001, 35, 4235-4241.
Raese, J.W., Sandstrom, M.W.; Rose, D.L. U.S. Geological Survey Laboratory Method for MTBE and Other Fuel Additives: U.S. Geological Survey Fact Sheet
FS-219-95, 4p. U.S. Geological Survey, Denver, 1995.
Rask, K.N., Clean Air and Renewable Fuels: The Market for Fuel Ethanol in the US
from 1984 to 1993 Energy Economics 1998, 20, 325-345.
Reemtsma, T., Methods of Analysis of Polar Aromatic Sulfonates from Aquatic
Environments J. Chrom. A 1996, 733, 473-489.

7 References
170
Reiser, R.G.; O’Brien, A.K. Occurrence and seasonal variability of volatile organic compounds in seven New Jersey streams, Water-Resources Investigations Report
98-4074, U.S. Geological Survey: Denver, 1998.
Reuter, J.E.; Allen, B.C., Richards, R.C.; Pankow, J.F.; Goldman, C.R.; Scholl, R.L.;
Seyfried, J.S., Concentrations, Sources, and Fate of the Gasoline Oxygenate
Methyl tert-Butyl Ether (MTBE) in a Multiple-Use Lake Environ. Sci. Technol. 1998, 32, 3666-3672.
Riedel, Institut für Wasser-, Boden-, und Lufthygiene, Umweltbundesamt, Langen,
2001, personal communication
Rippen, G. Handbuch Umwelt-Chemikalien: Stoffdaten, Prüfverfahren, Vorschriften;
Ecomed: Landsberg/ Lech, 1994, 3. Aktualisierung 2001.
Robbins, G.A.; Henebry, B.J.; Schmitt, B.M.; Bartolomeo, F.B.; Green, A.; Zack, P.,
Evidence for MTBE in Heating Oil GWMR, 1999, Spring, 65-69.
Robbins, G.A., Wang, S.; Stuart, J.D., Using the Static Headspace Method to
Determine Henry's Law Constants. Anal. Chem., 1993, 65, 3113-3118.
Rose, D.L., Brooke, F.C., Abney, S.R.; Raese, J.W. Laboratory Method for Analysis of Small Concentrations of Methyl tert-Butyl Ether and Other Ether Gasoline Oxygenates in Water: U.S. Geological Survey Fact Sheet 086-98, 6p. Denver,
1998.
Rovers, H. Speech at the Europ. Geophys. Soc. XXV General Assembly, Nice, France,
Apr. 25-29, 2000. Salanitro, J.P., Diaz, L.A., Williams, M.P., Wisniewski, H.W., Isolation of a Bacterial
Culture That Degrades Methyl t-Butyl Ether Appl. Environ. Microbiol. 1994, 60,
2593-2596.
Salanitro, J.P., Spinnler, G.E., Neaville, C.C., Maner, P.M., Stearns, S.M.; Johnson,
P.C., Demonstration of the Enhanced MTBE Bioremediation (EMB) In Situ
Process In Situ and On-Site Bioremediation, A1 Bioremediation of MTBE, The
Fifth International Symposium April 19-22, 1999, San Diego, California.
Schiedek, T.; Heckwolf, M.; Ebhardt, G., Fuel Related Contaminants in the
Groundwater of the City of Darmstadt, Germany Proc. Europ. Geophys. Soc. 25th General Assembly, Hydrology and chemical processes: Nice, 2000.
http//134.76.234.216/ScientificProgramme/hsa6.04.oral.htm
Schifter, I.; Vera, M.; Diaz, L.; Guzman, E.; Ramos, F.; Lopez-Salinas, E.,
Environmental Implications on the Oxygenation of Gasoline with Ethanol in the
Metropolitan Area of Mexico City Environ. Sci. Technol. 2001, 35, 1893 – 1901.
Schimming, E.; Levsen, K.; Köhme, C.; Schürmann, W., Biomonitoring of Benzene
and Toluene in Human Blood by Headspace-Solid-Phase Microextraction
Fresenius J. Anal. Chem. 1999, 363, 88-91.
7 References
171
Schirmer, M.; Barker, J.F., A Study of Long-Term MTBE Attenuation in the Borden
Aquifer, Ontario, Canada GWMR 1998, Spring, 113-122.
Schirmer, M.; Barker, J.F.; Butler, B.J.; Church, C.D.; Schirmer, K., Natural
attenuation of MTBE at the Borden field site First Int. Conf. on Remediation of Chlorinated and Recalcitrant Compounds, Monterey, CA, May 18-21, 1998, C1-
3, 327-331, Richmond.
Schirmer, M., MTBE im Grundwasser Grundwasser 1999, 4, 95-102.
Schmidt, T.; Duong, H.-A.; Berg, M.; Haderlein, S.B., Analysis of Fuel Oxygenates in
the Environment Analyst, 2001, 126, 405-413.
Schmidt, T., EAWAG, 2000, personal communication
Scholz, B., Butzert, H., Neumeister, J.; Nierlich, F. Ullmann's Encyclopedia of Industrial Chemistry, 1990.
Scholz, W. Risikobewertung der Kraftstoffkomponente Methyl-tertiär-Butylether (MTBE); Referat 33- Luftqualität, Lärm, Verkehr, Ministeriums für Umwelt und
Verkehr Baden-Württemberg: Karlsruhe, 2001.
Schöttler, U., Schulte-Ebbert, U. Verhalten von Schadstoffen im Untergrund bei der Infiltration von Oberflächenwasser am Beispiel des Untersuchungsgebietes „Insel Hengsen“ im Ruhrtal bei Schwerte; Schadstoffe im Grundwasser Band 3,
Deutsche Forschungsgemeinschaft, VCH Verlagsgesellschaft: Weinheim, 1995.
Schubert, J., Entfernung von Schwebstoffen und Mikroorganismen sowie
Verminderung der Mutagenität bei der Uferfiltration Gas-Wasserfach (gwf) Wasser Abwasser 2000, 141, 218-225.
Schuhmacher, R.; Führer, M. Kontrollprobensystem zur Wasseranalytik Methyl-tert-Butylether, Auswertung der 1. Serie, Endbericht, IFA Test Systems, IFA
Analytikzentrum: Tulln, Austria, 2001.
Schwarzenbach, R.P.; Giger, W.; Hoehn, E.; Schneider, J.K., Behavior of Organic
Compounds During Infiltration of River Water to Groundwater. Field Studies Environ. Sci. Technol. 1983, 17, 472-479.
Seinfeld, J.H.; Pandis, S.N.; Atmospheric chemistry and physics. John Wiley and Sons,
Inc.: New York, 1998.
Senatskommission Methyl-tert-butylether-Einstufung der Senatskommission zur Prüfung gesundheitsschädlicher Arbeitsstoffe, MAK: Germany, 2000, 30. Lief.
Skloss, T.W.; Kim, A.J.; Haw, J.F. Anal. Chem. 1994, 66, 536.
Smith, D.F.; Kleindienst, T.E.; Hudgens, E.E.; McIver, C.D.; Bufalini, J.J. The
Photooxidation of Methyl Tertiary Butyl Ether, Int. J. Chem. Kinetics, 1991, 23, 907-924.
7 References
172
Sontheimer, H. Trinkwasser aus dem Rhein? Academia Verlag: Sankt Augustin, 1991,
1. Auflage.
Squillace, P.J.; Moran, M.J.; Lapham, W.W.; Price, C.V.; Clawges, R.M.; Zogorski,
J.S., Volatile Organic Compounds in Untreated Ambient Groundwater of the
United States, 1985-1995 Environ. Sci. Technol. 1999
Squillace, P.J.; Pankow, J.F.; Korte, N.E.; Zogorski, J.S., Environmental Behavior and Fate of Methyl tert-Butyl Ether (MTBE) Fact-Sheet FS-203-96; U.S. Geological
Survey: Denver, 1997a.
Squillace, P.J.; Pankow, J.F.; Korte, N.E.; Zogorski, J.S., Review of the
Environmental Behavior and Fate of Methyl tert-Butyl Ether Environ. Toxicol. Chem. 1997b, 16, 1836-1844.
Squillace, P.J.; Pope, D.A.; Price, C.V. Occurence of the Gasoline Addititve MTBE in Shallow Ground Water in Urban and Agricultural Areas; Fact-Sheet FS-114-95;
U.S. Geological Survey: Denver, 1995.
Squillace, P.J.; Zogorski, J.S.; Wilber, W.G.; Price, C.V., Preliminary Assessment of
the Occurence and Possible Sources of MTBE in Groundwater in the United
States, 1993-1994 Environ. Sci. Technol. 1996, 30, 1721-1730.
Stackelberg, P.E.; Hopple, J.A.; Kauffman, L.J. Occurrence of nitrate, pesticides, and volatile organic compounds in the Kirkwood-Cohansey aquifer system, southern New Jersey; Water-Resources Investigations Report 97-4241; U.S. Geological
Survey: Denver, 1997.
Stadt Frankfurt/ M, Umweltbericht Nr. 3 -Wasser und Gewässerschutz; Stadt
Frankfurt/ M Dezernat für Umwelt, Energie und Brandschutz: Frankfurt/ M, year unknown.
Statistisches Bundesamt Deutschland: Wiesbaden, 2001, personal communication
Steffan, R.J, McClay, K., Vainberg, S., Condee, C.W.; Zhang, D., Biodegradation of
the Gasoline Oxygenates Methyl tert-Butyl Ether, Ethyl tert-Butyl Ether, and tert-Amyl Methyl Ether by Propane-Oxidizing Bacteria Appl. Environ. Microbiol. 1997, 63, 4216-4222.
Stephenson, R.M., Mutual Solubilities: Water Ketones, Water Ethers and Water
Gasoline Alcohols. J Chem Eng Data, 1992, 37, 80-95.
Stocking, A.; Koenigsberg, S.; Kavanaugh, M., Remediation and Treatment of MTBE
Environ. Protect. 1999, 10, 36-41.
Suflita, J.M; Mormile, M.R., Anaerobic Biodegradation of Known and Potential
Gasoline Oxygenates in the Terrestrial Subsurface Environ. Sci. Technol. 1993,
27, 976-978.
7 References
173
Supelco, Optimizing SPME: Parameters to Control to Ensure Consistent Results-
Application Note 95, 1996, https://www.sigma-aldrich.com
Supelco, Solid-Phase Microextraction of Volatile Compounds in US EPA Method
524.2, Application Note 11, 1995, https://www.sigma-
aldrich.com/sp.acrobat/394011.pdf
Tesseraux, I.; Koss, G., Toxikologie von Methyl-tertiär-Butylether (MTBE) als
Bestandteil des Otto-Motoren-Kraftstoffs Bundesgesundheitsbl-Gesundheitsforsch-Gesundheitsschutz 1999, 42, 332-343.
Thayer, A., Methanol Woes As MTBE Goes C&EN 2000, April 17, 25.
Thomas, S.P., Ranjan, R., Webster, G.R.B.; Sarna, L.P. Protocol for the Analysis of
High Concentrations of Benzene, Toluene, Ethylbenzene, and Xylene-Isomers in
Water Using Automated Solid-Phase Microextraction –GC/FID Environ. Sci. Technol. 1996, 30, 1521-1526.
Tuazon, E.C.; Carter, W.P.; Aschmann, S.M.; Atkinson, R., Products of the Gas-Phase
Reaction of Methyl tert-Butyl Ether With the OH Radical in the Presence of NOx
Int. J. Chem. Kinetics, 1991, 23, 1003-1015.
UBA Umweltbundesamt and SB, Statistisches Bundesamt, Umweltdaten Deutschland 1998; Umweltbundesamt and Statistisches Bundesamt: Berlin, 1999.
Ullmann's, Ullmann's Encyclopedia of Industrial Chemistry: Wiley-VCH: 1997.
US EPA, Environmental Protection Agency Measurement of purgeable organic compounds in water by capillary-column gas chromatography/ mass spectrometry, method 524.2, revision 4.0, Environmental Monitoring Systems
Laboratory: Cincinnati, Ohio, Aug. 1992, 50p.
Vainiotalo, S.; Peltonen, Y.; Pfäffli, P., MTBE Concentrations in Ambient Air in the
Vicinity of Service Stations Atmos. Environ. 1998, 32, 3503-3509.
Vainiotalo, S.; Peltonen, Y.; Ruonakangas, A.; Pfäffli, P., Customer Exposure to
MTBE, TAME, C6 Alkyl Methyl Ethers, and Benzene During Gasoline Refueling
Environ. Health Perspec. 1999, 107, 133-140.
Vayghani, S.A.; Weisel, C. J., The MTBE Air Concentrations in the Cabin of
Automobiles while Fueling Exposure Anal. Environ. Epidem. 1999, 9, 261-267.
Viskari, E.L.; Rekilä, R.; Roy, S.; Lehto, O.; Ruuskanen, J.; Kärenlampi, L., Airborne
Pollutants along a Roadside: Assessment Using Snow Analysis and Moss Bags
Environ. Poll. 1997, 97, 153-160.
Walker, M., Will Europe Pick MTBE? ECN 1999, 70 (1860), 23.
7 References
174
Wallington, T.J.; Atkinson, R.; Winer, A.M.; Pitts, J.R., Absolute Rate Constants for
the Gas-Phase Reactions of the NO3 Radical with CH3SH, CH3SCH3, CH3SSCH3,
H2S, SO2 and CH3OCH3 over the Temperature Range 280-350 K, J. Phys. Chem.
1986, 90, 5393-5396.
Wallington, T.J.; Atkinson, R.; Winer, A.M.; Pitts, J.R., A Study of the Reaction NO3
+ NO2 + M ! N2O5 + M (M = N2, O2) Intern. J. Chem. Kinetics 1987, 19, 243-
249.
Wallington, T.J.; Dagaut, P.; Liu, R.; Kurylo, M.J. Gas-phase reactions on hydroxyl
radicals with the fuel additives methyl tert-butyl ether and tert-bytyl alcohol over
the temperature range 240-440 oK. Environ. Sci. Technol. 1988, 22, 842-844.
Wania, F.; Hoff, J.T.; Jia, C.Q.; Mackay, D., The effects of Snow and Ice on the
Environmental Behavior of Hydrophobic Organic Chemicals Environ. Poll. 1998,
102, 25-41.
Weaver, J.W.; Haas, J.E.; Wilson, J.T., Analyis of the Gasoline Spill at East
Patchoque, New York Proc. Am. Soc. Civ. Eng. Conf. on Non-aqueous Phase Liquids in the Subsurface Environment: Assessment and Remediation,
Washington, 1996.
Werres, F.; Stien, J.; Balsaa, P.; Schneider, A.; Winterhalter, P.; Overath H.,
Automatisierte Bestimmung polarer Arzneimittelrückstände in Wässern mittels
Festphasenmikroextraktion (SPME) und Derivatisierung Vom Wasser 2000, 94,
135-147.
WHO, World Health Organization, Environmental Health Criteria 206 -Methyl tertiary-Butyl Ether, International Program on Chemical Safety; WHO: Geneva,
1998
Wilson, G.J.; Richter, A.P.; Suidan, M.T.; Venosa, A.D., Aerobic Biodegradation of
Gasoline Oxygenates MTBE and TBA Wat. Sci Technol. 2001, 43, 277-284.
Wilson, J.T.; Soo Cho, J.; Wilson, B.H.; Vardy, J.A. Natural attenuation of MTBE in the subsurface under methanogenic conditions; U.S.Envrionmental Protection
Agency, Office of Research and Development: Washington, DC, 2000; p 49.
Wilson, R.D.; Mackay, D.M.; Scow, K.M., In Situ MTBE Biodegradation Supported
by Diffusive Oxygen Release Environ. Sci. Technol. 2002, 36, 190-199.
Wolff, R. Beelzebub und Teufel im Benzin, TAZ, 01.08.2000.
Yang, X.; Tsao, D.; Javanmardian, M.; Glasser, H.A. Development of cost-effective MTBE in-situ treatment technologies ATV Vintermode om
Grundvandsforurening: Vingstedcenter, Denmark, 1998.
Yeh, C.K.; Novak, J.T., Anaerobic Biodegradation of Gasoline Oxygenates in Soils
Water Environ. Res. 1994, 66, 744-752.
7 References
175
Yeh, C.K.; Novak, J.T., The Effect of Hydrogen Peroxide on the Degradation of
Methyl and Ethyl tert-Butyl Ether in Soils Water Environ. Res. 1995, 67, 828-
834.
Yu, X.; Yuan, H.; Gorecki, T.; Pawliszyn, J., Determination of Lead in Blood and
Urine by SPME/ GC Anal. Chem. 1999, 71, 2998-3002.
Zambellas, L.; Dottridge, J.; Hardisty, P.; Hart, A., Occurrences of Fuel Oxygenates in
Groundwaters of England and Wales Proc. Europ. Geophys. Soc. 25th General Assembly, Hydrology and chemical processes: Nice, 2000.
http//134.76.234.216/ScientificProgramme/hsa6.04.oral.htm
Zhang, Z., Yang, M.J. & Pawliszyn, J., Solid-Phase Microextraction Anal. Chem. 1996, 68, 844A-853A.
Zogorski, J.S. and others, Fuel Oxygenates and Water Quality, in Interagency Assessment of Oxygenated Fuels Office of Science and Technology Policy:
Washington D.C., 1997, chap. 2, 80 p.
Zogorski, J.S.; Delzer, G.C.; Bender, D.A.; Squillace, P.J.; Lopes, T.J.; Baehr, A.L.;
Stackelberg, P.E.; Landmeyer, J.E.; Boughton, C.J.; Lico, M.S.; Pankow, J.F.;
Johnson, R.L.; Thomson, N.R., MTBE: Summary of Findings and Research by
the U.S. Geological Survey Proc. Annu. Conf.-Am. Water Works Assoc. 1998,
287-309. ERRATA: http://wwwsd.cr.usgs.gov/nawqua/pubs/proc/errata-
awwa.html, 08.10.99.
Zwank, L.; Berg, M.; Haderlein, S.B.; Schmidt, T.C. 2002, in preparation
Contents of Figures and Tables
176
Contents of Figures and Tables Figures Figure 1-1 Organic chemical production in the U.S. from 1970 – 1998 [JOHNSON ET
AL., 2000]. Production of methyl tert- butyl ether (MTBE) has grown dramatically since 1970, and it now ranks fourth overall among organic chemicals.
Figure 1-2 Worldwide demand of methyl tert-butyl ether (MTBE) (DeWitt Company)
[THAYER, 2000]. Figure 1-3 Amounts of methyl tert-butyl ether (MTBE) produced and consumed in
European countries in 1997 [DEWITT COMPANY, 1998; MEF, 2001]. Figure 1-4 Estimated European consumption of methyl tert-butyl ether (MTBE) in the
years 1999, 2000 and 2005 [DEWITT COMPANY, 1999]. Figure 1-5 Development of the gasoline consumption of regular unleaded, Euro super
unleaded, super premium unleaded and super leaded in Germany [STATISTISCHES BUNDESAMT, 2001] and average content of methyl tert-butyl ether (MTBE) in 1999 [ACHTEN AND PÜTTMANN, 2001A].
Figure 1-6 Estimated consumption of methyl tert-butyl ether (MTBE) in Germany
according to different sources. Black symbols indicate total consumption and grey symbols show consumption as oxygenate only.
Figure 1-7 Synthesis of methyl tert-butyl ether (MTBE) by the additon of methanol to
isobutylene [JACOBS ET AL., 2001]. Figure 2-1 Structural formula of methyl tert-butyl ether (MTBE, C5H12O). Figure 2-2 Temperature depending vapor pressure of methyl tert-butyl ether (MTBE)
[MEF, 2001]. Figure 2-3 Temperature depending water solubility of methyl tert-butyl ether (MTBE)
[MEF, 2001]. Figure 2-4 Temperature depending of Henry’s Law coefficient of methyl tert-butyl
ether (MTBE) [BAEHR ET AL., 1999]. Figure 2-5 Proposed pathways for initial transformation of methyl-tert butyl ether
(MTBE) to tert-butyl formate (TBF) and tert-butyl alcohol (TBA) [HUNKELER
ET AL., 2001]. Figure 2-4 Emission pathways of methyl tert-butyl ether (MTBE) into the
environment.
Contents of Figures and Tables
177
Figure 2-5 Stuctures of the oxygenates ethyl tert-butyl ether (ETBE), tert-amyl methyl ether (TAME), di-isopropyl ether (DIPE), ethanol and methanol.
Figure 2-6 Comparsion of boiling temperature, vapor pressure, water solubility and
dimensionless Henry’s Law constant of the oxygenates ethyl tert-butyl ether (ETBE), tert-amyl methyl ether (TAME), di-isopropyl ether (DIPE) to methyl tert-butyl ether (MTBE).
Figure 3-1 Mass spectra of methyl tert-butyl ether (MTBE) and deuterated methyl
tert-butyl ether (d3MTBE) which served as internal standard (70 eV). Figure 3-2 Typical partial gas chromatogram of super premium unleaded gasoline.
Ethyl tert-butyl ether (ETBE) served as internal standard. Figure 3-3 Typical partial gas chromatogram of Euro super unleaded gasoline. Ethyl
tert-butyl ether (ETBE) served as internal standard. Figure 3-4 Typical partial gas chromatogram of regular unleaded gasoline. Ethyl
tert-butyl ether (ETBE) served as internal standard. Figure 3-5 Schematic model of solid-phase microextration (SPME) with cooling of
the manual sampling holder. Figure 3-6 Influence of sample temperture on extraction yield with and without
cooling of the fiber (distilled water sample with a concentration of 10 µg/L methyl tert-butyl ether (MTBE)).
Figure 3-7 Influence of sodium chloride on extraction yield (distilled water sample
with a concentration of 10 µg/L methyl tert-butyl ether (MTBE)). Figure 3-8 Influence of extraction time on extraction yield (distilled water sample
with a concentration of 10 µg/L methyl tert-butyl ether (MTBE)). Figure 3-9 Influence of sample volume on extraction yield (distilled water sample
with a concentration of 10 µg/L methyl tert-butyl ether (MTBE)). Figure 3-10 Influence of sample volume on extraction yield (distilled water sample
with a concentration of each 100 ng/L methyl tert-butyl ether(MTBE) and d3methyl tert-butyl ether (d3MTBE), 3 replicates).
Figure 3-11 Influence of extraction time on extraction yield (distilled water sample
with a concentration of each 100 ng/L methyl tert-butyl ether(MTBE) and d3methyl tert-butyl ether (d3MTBE), 3 replicates).
Figure 3-12 Influence of sample temperature on extraction yield (distilled water
sample with a concentration of each 100 ng/L methyl tert-butyl ether(MTBE) and d3methyl tert-butyl ether (d3MTBE), 3 replicates).
Contents of Figures and Tables
178
Figure 3-13 Influence of sodium chloride on extraction yield (distilled water sample with a concentration of each 100 ng/L methyl tert-butyl ether(MTBE) and d3methyl tert-butyl ether (d3MTBE), 3 replicates).
Figure 3-14 Mass chromatogram of m/z 73 (methyl tert-butyl ether (MTBE), blank,
top) and m/z 76 (d3methyl tert-butyl ether (d3MTBE), 100 ng/L, bottom) between sample analysis.
Figure 3-15 Mass chromatogram of m/z 73 (methyl tert-butyl ether (MTBE), blank,
top) and m/z 76 (d3methyl tert-butyl ether (d3MTBE), 100 ng/L, bottom) after the installation of a new capillary column, new liner and similarly cleaning of the ion source.
Figure 3-16 Percent recovery of methyl tert-butyl ether (MTBE) from distilled water
spikes at 100 ng/L (long-term measurement) and 20 ng/L (short-term measurement).
Figure 4-1 Methyl tert-butyl ether (MTBE) concentrations (ng/L) in precipitation in
Frankfurt/ M city 1998-2001. The average standard deviation for sample analysis is 11 % and the method detection limit 10 ng/L.
Figure 4-2 Methyl tert-butyl ether (MTBE) concentrations (ng/L) in precipitation in
Frankfurt/ M city 2000-2001 and ambient temperatures and amounts of precipitation at Frankfurt/ M airport. The average standard deviation for sample analysis is 11 % and the method detection limit 10 ng/L. Grey columns indicate intervals at higher measured MTBE concentrations and white columns indicate samples with no detected MTBE.
Figure 4-3 Methyl tert-butyl ether (MTBE) concentrations (ng/L) in measured in
precipitation in urban areas versus corresponding ambient temperature (°C) from 1998 – 2001 in Germany. Samples that include more than 6 mm precipitation (n = 5) were neglected. Triangles indicate first precipitation samples in autumn after summertime. The average standard deviation for sample analysis is 11 % and the method detection limit 10 ng/L.
Figure 4-4 Methyl tert-butyl ether (MTBE) concentrations (ng/L) in rural and urban
precipitation in Germany in winter 2000/ 2001. Data for Frankfurt/ M and Berlin represent median values. The average standard deviation for sample analysis is 11 % and the method detection limit (MDL) 10 ng/L. Asterics indicate snow samples.
Figure 4-5 Methyl tert-butyl ether (MTBE) concentrations (ng/L) in Rhine water from
Schaffhausen to Wesel on the 11/06/00 – 11/07/00. Samples were collected by spot sampling. The detection limit of the method was 10 ng/L with a relative standard deviation of 11 %.
Figure 4-6 Methyl tert-butyl ether (MTBE) concentrations (ng/L) in Elbe water from
Boitzenburg to Glückstadt on the 09/02/00. Samples were collected by spot sampling. The detection limit of the method was 10 ng/L with a relative standard deviation of 11 %.
Contents of Figures and Tables
179
Figure 4-7 Methyl tert-butyl ether (MTBE) concentrations (ng/L) in Main water at Frankfurt/ M city from 1999 – 2001. Samples were collected by spot sampling. The detection limit of the method was 10 ng/L with a relative standard deviation of 11 %.
Figure 4-8 Methyl tert-butyl ether (MTBE) concentrations (ng/L) in Main water at
Frankfurt/ M city, Frankfurt/ M-Nied, and Bischofsheim (right and left shore) from 07/13/00 – 02/21/01. Samples at Frankfurt/ M were collected by spot sampling and at Bischofsheim over a period of 24 h. The detection limit of the method was 10 ng/L with a relative standard deviation of 11 %.
Figure 4-9 Methyl tert-butyl ether (MTBE) concentrations (ng/L) in water from small
urban creeks and from the river Main (mean) from 12/07/00 – 02/21/01. Samples were collected by spot sampling. The detection limit of the method was 10 ng/L with a relative standard deviation of 11 %.
Figure 4-10 Methyl tert-butyl ether (MTBE) concentrations (ng/L) in water from Lahn
creek 12/07/00 – 02/21/01. Samples were collected by spot sampling. The detection limit of the method was 10 ng/L with a relative standard deviation of 11 %.
Figure 4-11 Detection frequencies (%) of methyl tert-butyl ether (MTBE)
concentrations in surface water and waste water in Germany from 1999 – 2001. The detection limit of the method was 10 ng/L with a relative standard deviation of 11 %.
Figure 4-12 Mass chromatography of trichloromethane (chloroform, CF),
trichloroethene (TCE), tetrachloroethene (PCE) and internal standard d3MTBE in water from the Main river at Frankfurt/ M by use of the described method .
Figure 4-13 Methyl tert-butyl ether (MTBE) concentrations (ng/L) in waste water
from the sewage plants Frankfurt/ M-Niederrad, Sindlingen and in Main water at Frankfurt/ M city from 11/11/00 – 03/01/01. Different sampling methods used are described in the text. The detection limit of the method was 10 ng/L with a relative standard deviation of 11 %.
Figure 4-14 Methyl tert-butyl ether (MTBE) concentrations (ng/L) in surface water in
Germany. Triangles, Squares and circles indicate results from EFFENBERGER
ET AL. [2001], BRAUCH ET AL., [2000A] and this study, respectively. Figure 4-15 Methyl tert-butyl ether (MTBE) concentrations (ng/L) in water from the
Rhine and Main rivers and small urban creeks from 1999 – 2001. Numbers indicate sample amounts. Published Rhine water concentrations in 1999/ 2000 [BRAUCH ET AL., 2000A] were used for the calculation of the mean value. The detection limit of the method was 10 ng/L with a relative standard deviation of 11 %.
Contents of Figures and Tables
180
Figure 4-16 Pollutant concentrations (%) in river Neckar water and during the riverbank passage of 50 m from the river at the ‚Böckinger Wiesen‘ site near Heilbronn [HÖTZL AND REICHERT, 1996].
Figure 4-17 Hydrogeological cross section through the river Rhine and bank at the
Lower Rhine site (water utility 1). Bank filtration water pathways and flow direction are indicated by dotted lines with arrows. Methyl tert-butyl ether concentrations (ng/L) in water of three monitoring wells up to about 80 m from the bank at three different depths (black) are shown. Samples were collected on the 02/13/01. The MTBE concentration of Rhine water at the site represents a mean value (n = 3). The location of a recovering well near the monitoring wells is shown (ruled).
Figure 4-18 Drinking water purification processing at the water utility 1. Figure 4-19 Methyl tert-butyl ether (MTBE) concentrations (ng/L) in recovering well
water, raw water, drinking water and Rhine water (mean) at three waterworks belonging to water utility 1 in the Lower Rhine embayment.
Figure 4-20 Methyl tert-butyl ether (MTBE) concentrations (ng/L) in Main water
(mean/ median) and during bank filtration at the Hattersheim site in the vicinity of Frankfurt/ M from 1999 to 2001.
Figure 4-21 Methyl tert-butyl ether (MTBE) concentrations (µg/L) during the
riverbank passage at water utility 1 in the Lower Rhine embayment in relative comparison (%) to concentrations of adsorbable organic halogenated hydrocarbons (AOX), ethylenedinitrilotetraacetic acid (EDTA) and adsorbable organic sulphur (AOS) [SONTHEIMER, 1991]. Note that MTBE concentrations in Rhine water are at least two orders of magnitude lower than other pollutant concentrations.
Figure 4-22 Methyl tert-butyl ether (MTBE) concentrations (µg/L) during the
riverbank passage at the Lower Main (Hattersheim) in relative comparison (%) to concentrations of ethylenedinitrilotetraacetic acid (EDTA), bor, adsorbable organic halogenated hydrocarbons (AOX), and Aminomethylphosphonic acid (AMPA) [POST ET AL., 1999]. AMPA concentrations were not analyzed in water from well number 1184 but from an adjacent recovering well (ASB1). Dotted lines indicate that to date, bank filtration at Hattersheim only occurs up to about 400 m from the river Main.
Figure 5-1 Illustration of the equilibrium and steady state conditions characterizing
a) Level I, b) Level II, c), Level III and d,e) Level IV using the example of oxygen concentrations partitioning into water and air. Equilibrium implies that the oxygen concentrations in air and water achieve a ratio or partition coefficient of 20. Steady state implies unchanging with time, even if flow occurs and regardless of whether equilibrium applies or not [MACKAY, 2001].
Figure 5-2 Methyl tert-butyl ether (MTBE) concentrations (ng/L) in a Main water
(08/23/00) sample observed within a time interval of 350 d at 4 °C and at 18 °C. Volatilized amounts during the experiment were calculated under the
Contents of Figures and Tables
181
conditions of equilibrium and tieredly changing volumina of the gasphase and aqueous phase. They were substracted from measured MTBE concentrations (black symbols). The reduction of the resulting MTBE concentrations over time is probably assigned to biodegradation. Data points with larger symbols were used for the calculation of half-life times.
Figure 5-3 Logarithmic regression of methyl tert-butyl ether (MTBE) concentrations
assumed to represent biodegradation. The data originate from the batch experiment at 4 °C (top) and 18 °C (bottom). Half-life times of 105 d at 18 °C and 533 d at 4 °C result using first order kinetics.
Figure 5-4 Equilibrium mass distribution of methyl tert-butyl ether (MTBE)
calculated by the Level I model. Figure 5-5 Results of four different Level III emission scenarios for methyl tert-butyl
ether (MTBE): a) 100 % emission into the air, b) 95 % emission into air and 5 % emission into water, c) 50 % emission into air and water each and d) 100 % emission into water in generic the environment. Year-round conditions were used that are described in Table 5-1.
Figure 5-6 Year-round scenario of concentrations of methyl tert-butyl ether (MTBE)
in Germany in 1999/ 2000. The used data are decribed in the section model design.
Figure 5-7 Comparison of the results from the winter and summer scenarios of the
simulated concentrations and emissions of methyl tert-butyl ether (MTBE) in Germany using the Level III model.
Tables Tabelle 0-1 Analysenbedingungen von Methyl tertiär-butylether (MTBE) in Wasser
mittels Headspace-Solid-Phase Microextraction (HS-SPME) und Gaschromatographie/ Massenspektrometrie (GC/MS)
Tabelle 0-2 Ergebnisse der Analytik von Methyl tertiär-butylether (MTBE) in der
aquatischen Umwelt in Deutschland (n.n. bedeutet nicht nachweisbar bzw. <10 ng/L und geht mit 10 ng/L in Mittelwerte ein)
Table 1-1 Estimated production capacities of methyl tert-butyl ether (MTBE) [kt/a] of
German refineries and chemical industry [PAHLKE ET AL., 2000]. Table 1-2 Aqueous cleanup levels for methyl tert-butyl ether (MTBE) in different
States of America [Jacobs et al., 2001]. Table 1-3 Health and safety advices for methyl tert-butyl ether (MTBE) relevant for
handling by humans. Table 2-1 Physico-chemical properties of methyl tert-butyl ether (MTBE).
Contents of Figures and Tables
182
Table 2-2 Properties of the oxygenates ethyl tert-butyl ether (ETBE), tert-amyl methyl ether (TAME), di-isopropyl ether (DIPE), ethanol, methanol, and tert-butyl alcohol (TBA) in comparison to methyl tert-butyl ether (MTBE), benzene, toluene and para-xylene [SCHMIDT, ET AL., 2001; JACOBS ET AL., 2001; RIPPEN
2001; FITA, 1997; JOHNSON ET AL., 2000]. Table 3-1 Analysed samples of regular, Euro super, super premium unleaded gasoline
and "Optimax" gasoline. The samples were taken at Frankfurt am Main in 1999 and 2000.
Table 3-2 Calibration ranges, equations and correlation coefficients of four-point-
calibrations (blank, 20, 100 and 5000 ng/L) and three-point-calibrations (blank, 20 and 100 ng/L) for concentrations of methyl tert-butyl ether (MTBE) in the range of about 80 to 5000 ng/L and about 10 to 80 ng/L, respectively.
Table 4-1 Atmospheric methyl tert-butyl ether (MTBE) concentrations at gasoline
stations. Table 4-2 Comparison of measured and calculated methyl tert-butyl ether (MTBE)
concentrations in precipitation (ng/L) and air (ppbV) in Germany, Switzerland, New Jersey (U.S.) and California (U.S.).
Table 4-3 Summary of methyl tert-butyl ether (MTBE) concentrations (ng/L) in
German river water. Table 4-4 Comparison of methyl tert-butyl ether (MTBE) data in Germany and
California. Table 4-5 Hydrogeological and hydrogeochemical data of the groundwater at
waterworks 1 and comparable study locations at Duisburg-Mündelheim, Düsseldorf-Wittlaer, Cologne-Rheinkassel and at the study location Böckinger Wiesen/ Heilbronn.
Table 5-1 Water solubility, vapor pressure, half-life times in air [MEF, 2001] and in
water of methyl tert-butyl ether (MTBE) at 7.5, 14 and 20°C used in modeling for year-round, summer and winter scenarios.
Table 5-2 Amounts of methyl tert-butyl ether (MTBE) in air (ng/m³) and water (ng/L)
depending on single and multiple emissions using the Level III model in the generic environment and year-round conditions.
Table 5-3 Average concentrations of methyl tert-butyl ether (MTBE) in German
surface water. The detection limit is 10 ng/L and it was used for calculations of average concentrations if MTBE was not detected. On the basis of the results of the analyses, the upper and lower Rhine was separated at Karlsruhe for simplification. [ACHTEN ET AL., 2002B, BRAUCH ET AL., 2000A, EFFENBERGER ET
AL., 2001]
Key Words
183
Key Words
English
MTBE, OXYGENATE, ADDITIVE, REFORMULATED GASOLINE, FUEL, SPME,
D3MTBE, VOCS, GC, GC/ MS, PRECIPITATION, RAIN, SNOW, URBAN RUNOFF,
SURFACE WATER, RIVER WATER, RHINE, MAIN, WASTE WATER, SEWAGE,
INDUSTRIAL EFFLUENTS, EQC, COMPARTMENT, PARTITIONING, GERMANY
German
MTBE, OXYGENAT, ADDITIV, VERGASERKRAFTSTOFF, REFORMULIERTES
BENZIN, SPME, D3MTBE, LEICHTFLÜCHTIG, GC, GC/ MS, NIEDERSCHLAG,
REGEN, SCHNEE, URBAN RUNOFF, OBERFLÄCHENWASSER,
OBERFLÄCHENGEWÄSSER, FLUSS WASSER, RHEIN, MAIN, ABWASSER,
KLÄRANLAGE, INDUSTRIE, EQC, KOMPARTIMENT, DEUTSCHLAND
Abbreviations
184
Abbreviations
AOS Adsorbable organic sulphur
AOX Adsorbable organic halogens
BTEX Benzene, toluene, ethylbenzene and xylenes
CW/ DVB Carbowax/ divinylbenzene
d3MTBE Deuterated methyl tert-butyl ether
DAI Direct aqueous injection
DIPE Di-isopropyl ether
EDTA Ethylenedinitrilotetraacetic acid
ETBE Ethyl tertiary-butyl ether
EURO II Directive 94/12/EC
EURO III Directive 98/70/EC
EURO I Directive 91/441/EEC
FID Flame ionization detector
FTIR Fourier transform infrared spectroscopy
GC Gas chromatography
GC/ MS Gas chromatography/ mass spectrometry
HPLC High Pressure Liquid Chromatography
HS-SPME Headspace-Solid-Phase Microextraction
LT-MDL Long-term method detection level
LUSTs Leakage underground storage tanks
MS Mass spectrometry
MTBE Methyl tertiary-butyl ether
next-TAME C4-C7 Tertiary alkyl methly ethers
NMR Nuclear magnetic resonance spectroscopy
n.n. nicht nachweisbar, not detected (<10 ng/L)
NTP National Toxicology Program
O-FID Oxygen-specific detector
P&T Purge-and-trap extraction
PAHs Polycyclic aromatic hydrocarbons
PAN Peroxyacetyl nitrate

Abbreviations
185
PDMS/ Carboxen Poly(dimethylsiloxane)/ Carboxen
PDMS/ DVB Poly(dimethylsiloxane)/ divinylbenzene
PID Photoionization detector
SIM Single ion monitoring mode
SPME Solid-Phase Microextraction
TAME Tertiary-amyl methyl ether
TBA Tertiary butyl alcohol
TBF Tertiary butyl formate
VOCs Volatile organic compounds
TCE Trichloroethene
PCE Tetrachloroethene
CF Trichloromethane, chloroform
MON Motor octane number
RON Research octane number
EQC Equilibrium criterion
CO Carbon monoxide
CO2 Carbon dioxide
NOx Nitrogen oxides
MAK Maximale Arbeitsplatzkonzentration
Log KOW Logarithmic octanol/ water coefficient
Log KOC Logarithmic water/ organic carbon coefficient
RSD Relative standard deviation
RFG Reformulated gasoline (2.0 % w/w of oxygen)
Oxyfuel Oxygenated fuel (2.7 % w/w of oxygen)
LD50 Concentration where 50 % of the participants died (lethal) in the test

MTBE Web Sites
186
MTBE Web Sites
http://calepa.ca.gov/programs/mtbe
http://geotracker.llnl.gov/
http://ofa.net
http://trg.ucdavis.edu/clients/trg/research/mtbe.html
http://tsrtp.ucdavis.edu/mtbe
http://umweltbundesamt.de
http://water.wr.usgs.gov/mtbe/
http://www.acwanet.com/legislation/regulatory/mtbe2.html
http://www.api.org/ehs/apibib.htm
http://www.api.org/ehs/mtbelink.htm
http://www.api.org/ehs/othrmtbe.htm
http://www.efoa.org
http://www.epa.gov/oms/consumer/fuels/oxypanel/blueribb.htm
http://www.epa.gov/oms/regs/fuels/oxy-area.pdf
http://www.epa.gov/opptintr/chemfact/s-mtbe.txt
http://www.epa.gov/OST/Tools/dwstds.html
http://www.epa.gov/otaq/consumer/fuels/oxypanel/blueribb.htm
http://www.epa.gov/swerust1/mtbe/index.htm
http://www.epa.gov/swerust1/mtbe/mtbemap.htm
http://www.erdllnl.gov/mtbe
http://www.nfesc.navy.mil
http://www.scvwd.dst.ca.us/wtrqual/ustmtbe.htm
http://www.swrcb.ca.gov/baydelta/mtbe_finaldraft.doc
http://www.umweltbundesamt.de/wasser/themen/mtbe.htm
http://wwwsd.cr.usgs.gov/nawqua/vocns/mtbe/bib/
http://wwwsd.cr.usgs.gov/nawqua/vocns/mtbe/bib/key.html
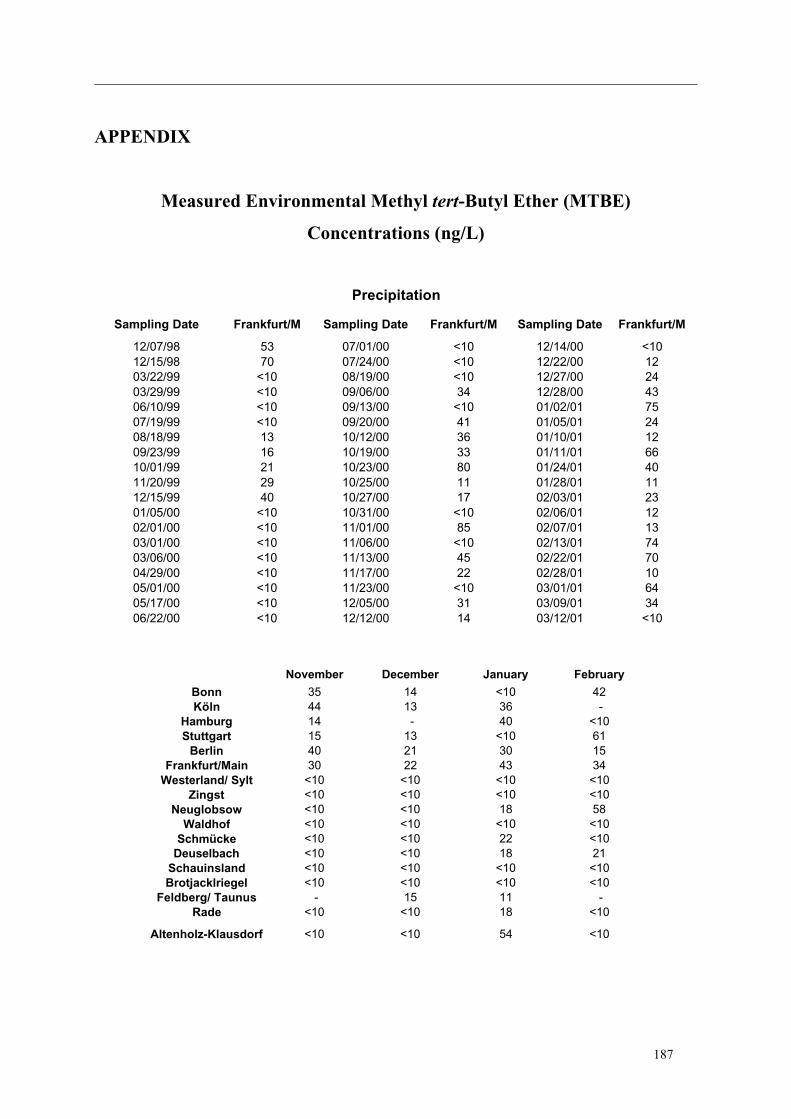
187
APPENDIX
Measured Environmental Methyl tert-Butyl Ether (MTBE)
Concentrations (ng/L)
Sampling Date Frankfurt/M Sampling Date Frankfurt/M Sampling Date Frankfurt/M
12/07/98 53 07/01/00 <10 12/14/00 <1012/15/98 70 07/24/00 <10 12/22/00 1203/22/99 <10 08/19/00 <10 12/27/00 2403/29/99 <10 09/06/00 34 12/28/00 4306/10/99 <10 09/13/00 <10 01/02/01 7507/19/99 <10 09/20/00 41 01/05/01 2408/18/99 13 10/12/00 36 01/10/01 1209/23/99 16 10/19/00 33 01/11/01 6610/01/99 21 10/23/00 80 01/24/01 4011/20/99 29 10/25/00 11 01/28/01 1112/15/99 40 10/27/00 17 02/03/01 2301/05/00 <10 10/31/00 <10 02/06/01 1202/01/00 <10 11/01/00 85 02/07/01 1303/01/00 <10 11/06/00 <10 02/13/01 7403/06/00 <10 11/13/00 45 02/22/01 7004/29/00 <10 11/17/00 22 02/28/01 1005/01/00 <10 11/23/00 <10 03/01/01 6405/17/00 <10 12/05/00 31 03/09/01 3406/22/00 <10 12/12/00 14 03/12/01 <10
Precipitation
November December January February
Bonn 35 14 <10 42Köln 44 13 36 -
Hamburg 14 - 40 <10Stuttgart 15 13 <10 61
Berlin 40 21 30 15Frankfurt/Main 30 22 43 34
Westerland/ Sylt <10 <10 <10 <10Zingst <10 <10 <10 <10
Neuglobsow <10 <10 18 58Waldhof <10 <10 <10 <10
Schmücke <10 <10 22 <10Deuselbach <10 <10 18 21
Schauinsland <10 <10 <10 <10Brotjacklriegel <10 <10 <10 <10
Feldberg/ Taunus - 15 11 -Rade <10 <10 18 <10
Altenholz-Klausdorf <10 <10 54 <10
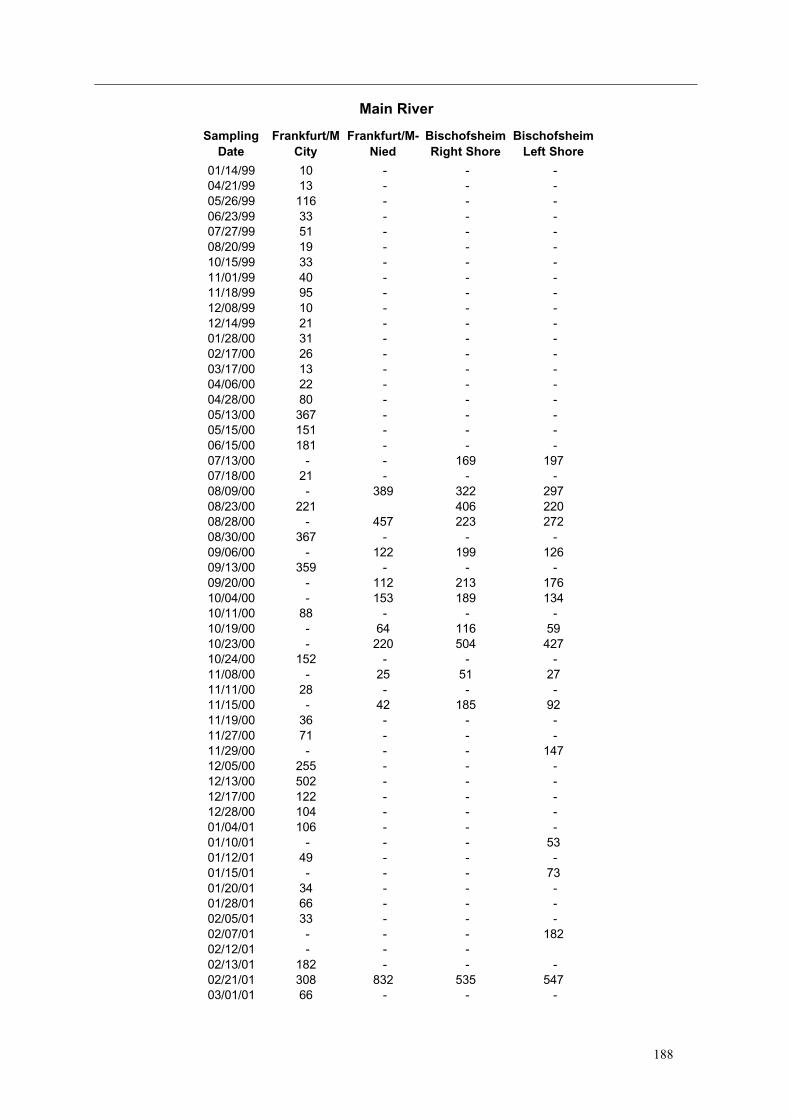
188
Sampling Date
Frankfurt/M City
Frankfurt/M-Nied
Bischofsheim Right Shore
Bischofsheim Left Shore
01/14/99 10 - - -04/21/99 13 - - -05/26/99 116 - - -06/23/99 33 - - -07/27/99 51 - - -08/20/99 19 - - -10/15/99 33 - - -11/01/99 40 - - -11/18/99 95 - - -12/08/99 10 - - -12/14/99 21 - - -01/28/00 31 - - -02/17/00 26 - - -03/17/00 13 - - -04/06/00 22 - - -04/28/00 80 - - -05/13/00 367 - - -05/15/00 151 - - -06/15/00 181 - - -07/13/00 - - 169 19707/18/00 21 - - -08/09/00 - 389 322 29708/23/00 221 406 22008/28/00 - 457 223 27208/30/00 367 - - -09/06/00 - 122 199 12609/13/00 359 - - -09/20/00 - 112 213 17610/04/00 - 153 189 13410/11/00 88 - - -10/19/00 - 64 116 5910/23/00 - 220 504 42710/24/00 152 - - -11/08/00 - 25 51 2711/11/00 28 - - -11/15/00 - 42 185 9211/19/00 36 - - -11/27/00 71 - - -11/29/00 - - - 14712/05/00 255 - - -12/13/00 502 - - -12/17/00 122 - - -12/28/00 104 - - -01/04/01 106 - - -01/10/01 - - - 5301/12/01 49 - - -01/15/01 - - - 7301/20/01 34 - - -01/28/01 66 - - -02/05/01 33 - - -02/07/01 - - - 18202/12/01 - - -02/13/01 182 - - -02/21/01 308 832 535 54703/01/01 66 - - -
Main River
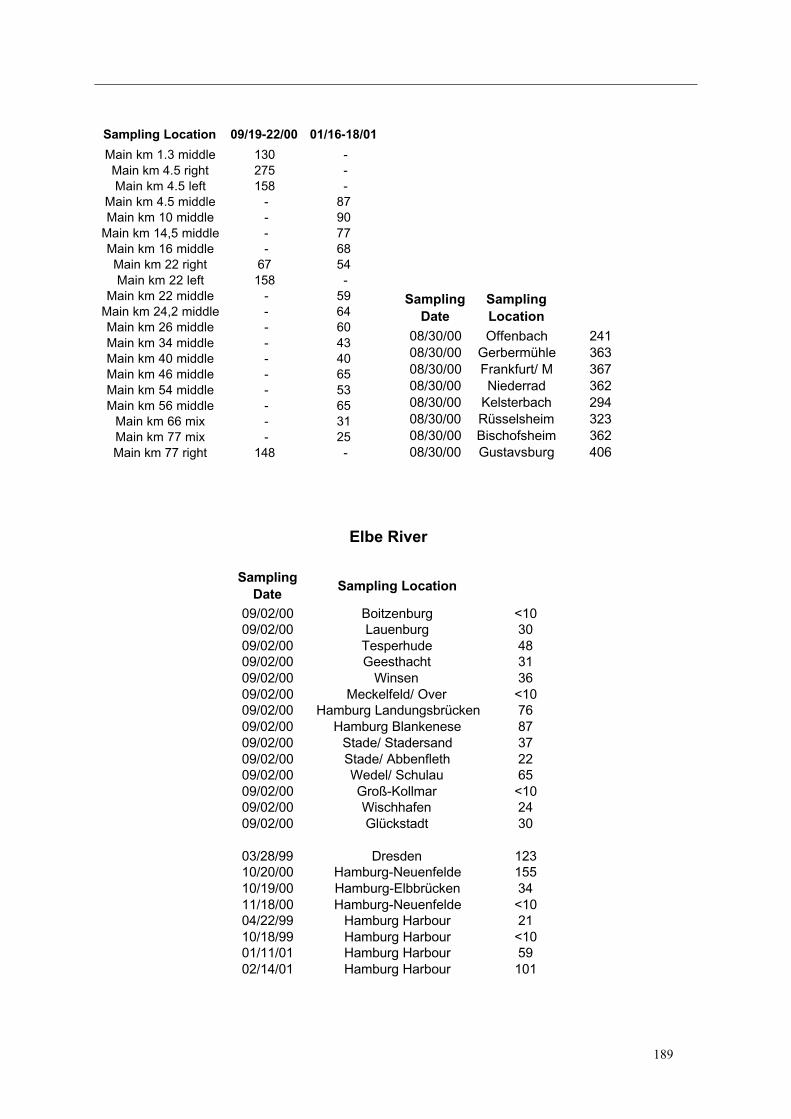
189
Sampling Location 09/19-22/00 01/16-18/01
Main km 1.3 middle 130 -Main km 4.5 right 275 -Main km 4.5 left 158 -
Main km 4.5 middle - 87Main km 10 middle - 90
Main km 14,5 middle - 77Main km 16 middle - 68Main km 22 right 67 54Main km 22 left 158 -
Main km 22 middle - 59Main km 24,2 middle - 64Main km 26 middle - 60Main km 34 middle - 43Main km 40 middle - 40Main km 46 middle - 65Main km 54 middle - 53Main km 56 middle - 65
Main km 66 mix - 31Main km 77 mix - 25Main km 77 right 148 -
Sampling Date
Sampling Location
08/30/00 Offenbach 24108/30/00 Gerbermühle 36308/30/00 Frankfurt/ M 36708/30/00 Niederrad 36208/30/00 Kelsterbach 29408/30/00 Rüsselsheim 32308/30/00 Bischofsheim 36208/30/00 Gustavsburg 406
Elbe River
SamplingDate
Sampling Location
09/02/00 Boitzenburg <1009/02/00 Lauenburg 3009/02/00 Tesperhude 4809/02/00 Geesthacht 3109/02/00 Winsen 3609/02/00 Meckelfeld/ Over <1009/02/00 Hamburg Landungsbrücken 7609/02/00 Hamburg Blankenese 8709/02/00 Stade/ Stadersand 3709/02/00 Stade/ Abbenfleth 2209/02/00 Wedel/ Schulau 6509/02/00 Groß-Kollmar <1009/02/00 Wischhafen 2409/02/00 Glückstadt 30
03/28/99 Dresden 12310/20/00 Hamburg-Neuenfelde 15510/19/00 Hamburg-Elbbrücken 3411/18/00 Hamburg-Neuenfelde <1004/22/99 Hamburg Harbour 2110/18/99 Hamburg Harbour <1001/11/01 Hamburg Harbour 5902/14/01 Hamburg Harbour 101
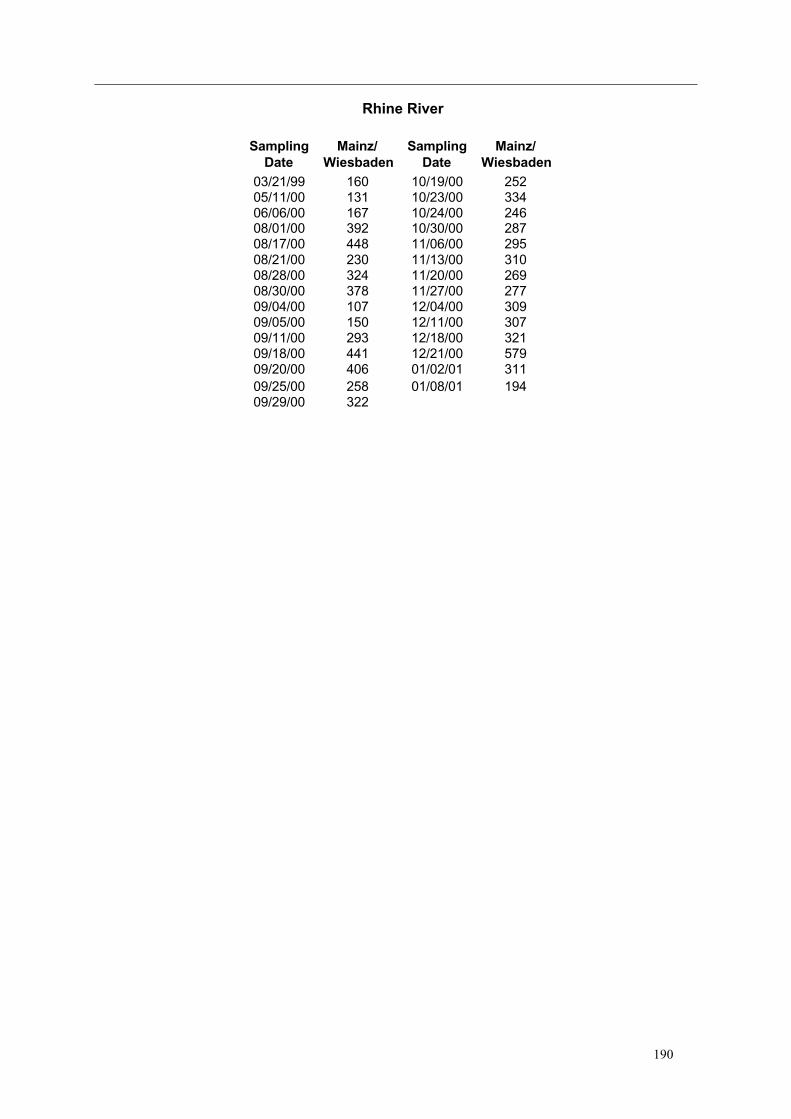
190
SamplingDate
Mainz/Wiesbaden
SamplingDate
Mainz/Wiesbaden
03/21/99 160 10/19/00 25205/11/00 131 10/23/00 33406/06/00 167 10/24/00 24608/01/00 392 10/30/00 28708/17/00 448 11/06/00 29508/21/00 230 11/13/00 31008/28/00 324 11/20/00 26908/30/00 378 11/27/00 27709/04/00 107 12/04/00 30909/05/00 150 12/11/00 30709/11/00 293 12/18/00 32109/18/00 441 12/21/00 57909/20/00 406 01/02/01 31109/25/00 258 01/08/01 19409/29/00 322
Rhine River

191
Sampling Date
Sampling Location
11/07/00 Schaffhausen 2311/07/00 Waldshut-Tiengen 19511/07/00 Rheinfelden 4611/07/00 Müllheim-Neuenburg 1311/07/00 Breisach 2111/07/00 Lahr/Rhinau 9211/07/00 Gambsheim 14211/07/00 Rastatt-Plittersdorf 13811/07/00 Leopoldshafen 38311/07/00 Schwetzingen-Koller 18711/07/00 Worms 13711/07/00 Gernsheim 20311/06/00 Mainz-Laubenheim 35011/06/00 Mainz-Heidesheim 33911/06/00 Oberwesel 30711/06/00 Boppard 23611/06/00 Weißenthurm 5211/06/00 Bad Breisig 6911/06/00 Bonn-Auerberg 11911/06/00 Wesseling 19111/06/00 Zons 23411/06/00 Mündelheim 21611/06/00 Wesel 218
Sampling Date
Sampling Location
03/21/99 Nierstein 13609/03/00 Cologne 22711/08/00 Harbour Gernsheim 16306/13/00 Geinsheim 25608/17/00 Geinsheim 18709/20/00 Rhine/ km 425 middle 12309/20/00 Rhine/ km 450 left 39409/20/00 Rhine/ km 456 right 9010/26/00 Rhine/ km 480 24609/20/00 Rhine/ km 527 middle 13409/20/00 Rhine/ km 543 middle 122
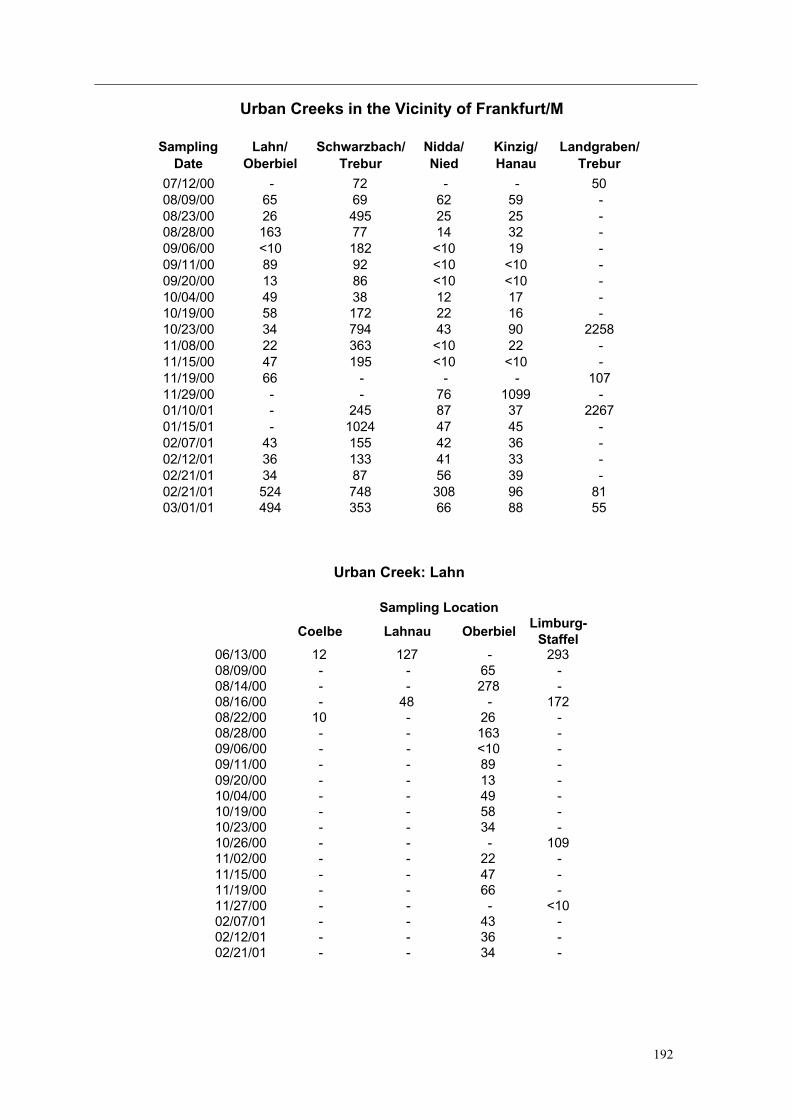
192
Urban Creeks in the Vicinity of Frankfurt/M
SamplingDate
Lahn/Oberbiel
Schwarzbach/Trebur
Nidda/Nied
Kinzig/Hanau
Landgraben/Trebur
07/12/00 - 72 - - 5008/09/00 65 69 62 59 -08/23/00 26 495 25 25 -08/28/00 163 77 14 32 -09/06/00 <10 182 <10 19 -09/11/00 89 92 <10 <10 -09/20/00 13 86 <10 <10 -10/04/00 49 38 12 17 -10/19/00 58 172 22 16 -10/23/00 34 794 43 90 225811/08/00 22 363 <10 22 -11/15/00 47 195 <10 <10 -11/19/00 66 - - - 10711/29/00 - - 76 1099 -01/10/01 - 245 87 37 226701/15/01 - 1024 47 45 -02/07/01 43 155 42 36 -02/12/01 36 133 41 33 -02/21/01 34 87 56 39 -02/21/01 524 748 308 96 8103/01/01 494 353 66 88 55
Urban Creek: Lahn
Coelbe Lahnau OberbielLimburg-
Staffel06/13/00 12 127 - 29308/09/00 - - 65 -08/14/00 - - 278 -08/16/00 - 48 - 17208/22/00 10 - 26 -08/28/00 - - 163 -09/06/00 - - <10 -09/11/00 - - 89 -09/20/00 - - 13 -10/04/00 - - 49 -10/19/00 - - 58 -10/23/00 - - 34 -10/26/00 - - - 10911/02/00 - - 22 -11/15/00 - - 47 -11/19/00 - - 66 -11/27/00 - - - <1002/07/01 - - 43 -02/12/01 - - 36 -02/21/01 - - 34 -
Sampling Location
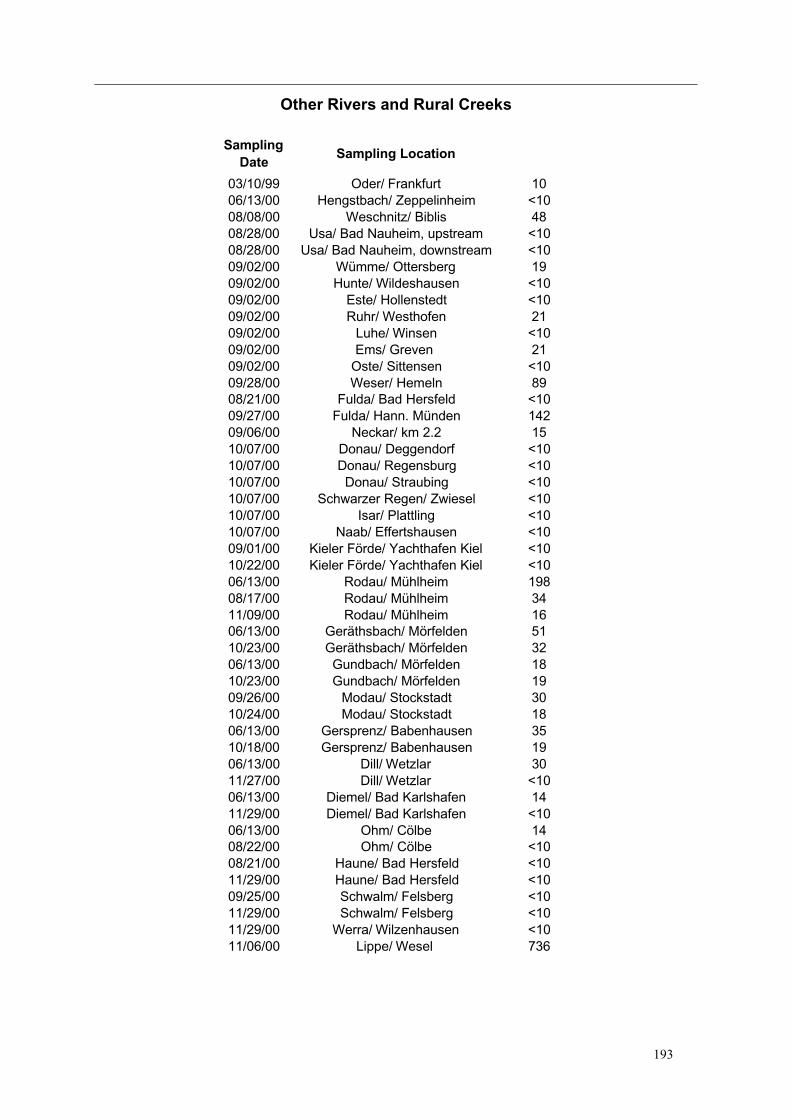
193
Other Rivers and Rural Creeks
SamplingDate
Sampling Location
03/10/99 Oder/ Frankfurt 1006/13/00 Hengstbach/ Zeppelinheim <1008/08/00 Weschnitz/ Biblis 4808/28/00 Usa/ Bad Nauheim, upstream <1008/28/00 Usa/ Bad Nauheim, downstream <1009/02/00 Wümme/ Ottersberg 1909/02/00 Hunte/ Wildeshausen <1009/02/00 Este/ Hollenstedt <1009/02/00 Ruhr/ Westhofen 2109/02/00 Luhe/ Winsen <1009/02/00 Ems/ Greven 2109/02/00 Oste/ Sittensen <1009/28/00 Weser/ Hemeln 8908/21/00 Fulda/ Bad Hersfeld <1009/27/00 Fulda/ Hann. Münden 14209/06/00 Neckar/ km 2.2 1510/07/00 Donau/ Deggendorf <1010/07/00 Donau/ Regensburg <1010/07/00 Donau/ Straubing <1010/07/00 Schwarzer Regen/ Zwiesel <1010/07/00 Isar/ Plattling <1010/07/00 Naab/ Effertshausen <1009/01/00 Kieler Förde/ Yachthafen Kiel <1010/22/00 Kieler Förde/ Yachthafen Kiel <1006/13/00 Rodau/ Mühlheim 19808/17/00 Rodau/ Mühlheim 3411/09/00 Rodau/ Mühlheim 1606/13/00 Geräthsbach/ Mörfelden 5110/23/00 Geräthsbach/ Mörfelden 3206/13/00 Gundbach/ Mörfelden 1810/23/00 Gundbach/ Mörfelden 1909/26/00 Modau/ Stockstadt 3010/24/00 Modau/ Stockstadt 1806/13/00 Gersprenz/ Babenhausen 3510/18/00 Gersprenz/ Babenhausen 1906/13/00 Dill/ Wetzlar 3011/27/00 Dill/ Wetzlar <1006/13/00 Diemel/ Bad Karlshafen 1411/29/00 Diemel/ Bad Karlshafen <1006/13/00 Ohm/ Cölbe 1408/22/00 Ohm/ Cölbe <1008/21/00 Haune/ Bad Hersfeld <1011/29/00 Haune/ Bad Hersfeld <1009/25/00 Schwalm/ Felsberg <1011/29/00 Schwalm/ Felsberg <1011/29/00 Werra/ Wilzenhausen <1011/06/00 Lippe/ Wesel 736
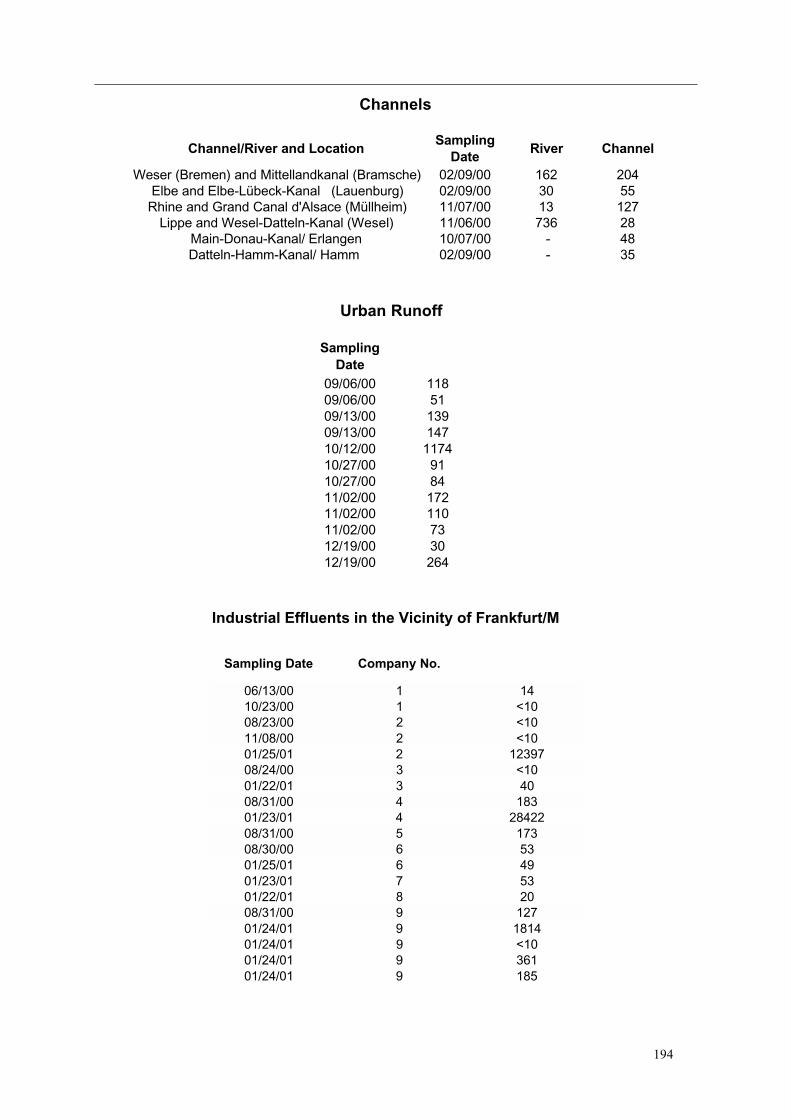
194
Channels
Channel/River and LocationSampling
DateRiver Channel
Weser (Bremen) and Mittellandkanal (Bramsche) 02/09/00 162 204Elbe and Elbe-Lübeck-Kanal (Lauenburg) 02/09/00 30 55
Rhine and Grand Canal d'Alsace (Müllheim) 11/07/00 13 127Lippe and Wesel-Datteln-Kanal (Wesel) 11/06/00 736 28
Main-Donau-Kanal/ Erlangen 10/07/00 - 48Datteln-Hamm-Kanal/ Hamm 02/09/00 - 35
Urban Runoff
SamplingDate
09/06/00 11809/06/00 5109/13/00 13909/13/00 14710/12/00 117410/27/00 9110/27/00 8411/02/00 17211/02/00 11011/02/00 7312/19/00 3012/19/00 264
Industrial Effluents in the Vicinity of Frankfurt/M
Sampling Date Company No.
06/13/00 1 1410/23/00 1 <1008/23/00 2 <1011/08/00 2 <1001/25/01 2 1239708/24/00 3 <1001/22/01 3 4008/31/00 4 18301/23/01 4 2842208/31/00 5 17308/30/00 6 5301/25/01 6 4901/23/01 7 5301/22/01 8 2008/31/00 9 12701/24/01 9 181401/24/01 9 <1001/24/01 9 36101/24/01 9 185
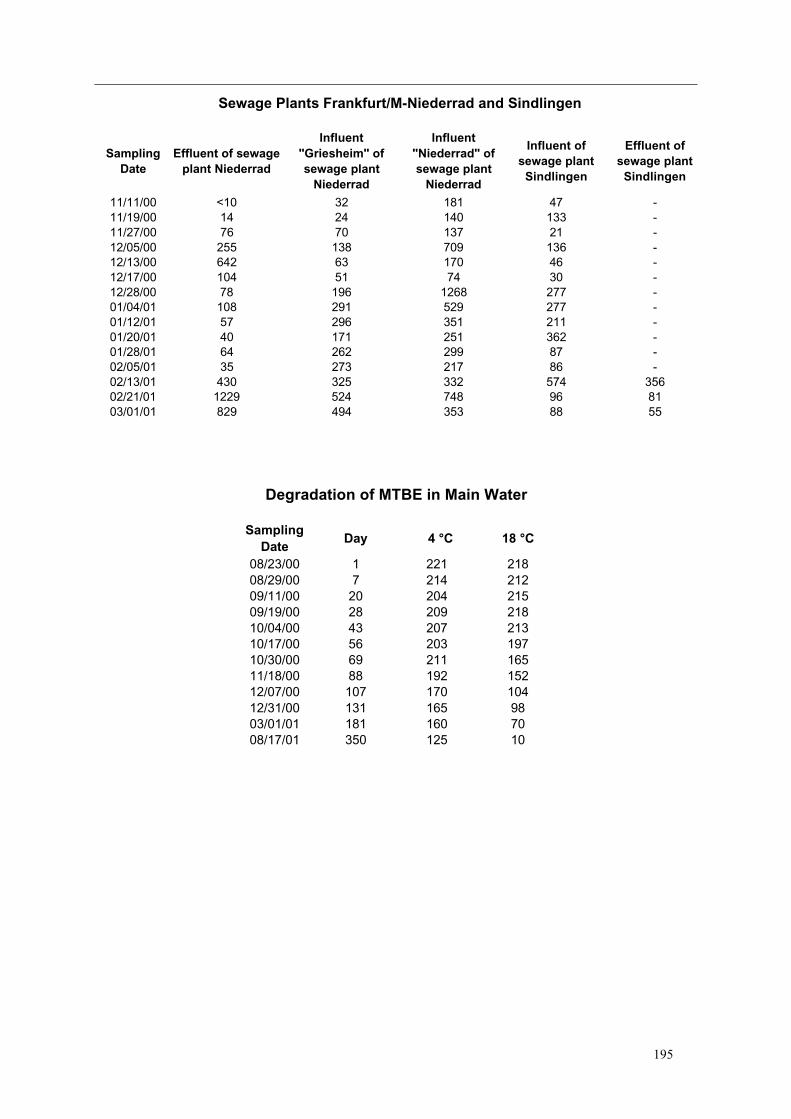
195
Sampling Date
Effluent of sewageplant Niederrad
Influent "Griesheim" of sewage plant
Niederrad
Influent "Niederrad" of sewage plant
Niederrad
Influent of sewage plant
Sindlingen
Effluent of sewage plant
Sindlingen
11/11/00 <10 32 181 47 -11/19/00 14 24 140 133 -11/27/00 76 70 137 21 -12/05/00 255 138 709 136 -12/13/00 642 63 170 46 -12/17/00 104 51 74 30 -12/28/00 78 196 1268 277 -01/04/01 108 291 529 277 -01/12/01 57 296 351 211 -01/20/01 40 171 251 362 -01/28/01 64 262 299 87 -02/05/01 35 273 217 86 -02/13/01 430 325 332 574 35602/21/01 1229 524 748 96 8103/01/01 829 494 353 88 55
Sewage Plants Frankfurt/M-Niederrad and Sindlingen
Sampling Date
Day 4 °C 18 °C
08/23/00 1 221 21808/29/00 7 214 21209/11/00 20 204 21509/19/00 28 209 21810/04/00 43 207 21310/17/00 56 203 19710/30/00 69 211 16511/18/00 88 192 15212/07/00 107 170 10412/31/00 131 165 9803/01/01 181 160 7008/17/01 350 125 10
Degradation of MTBE in Main Water
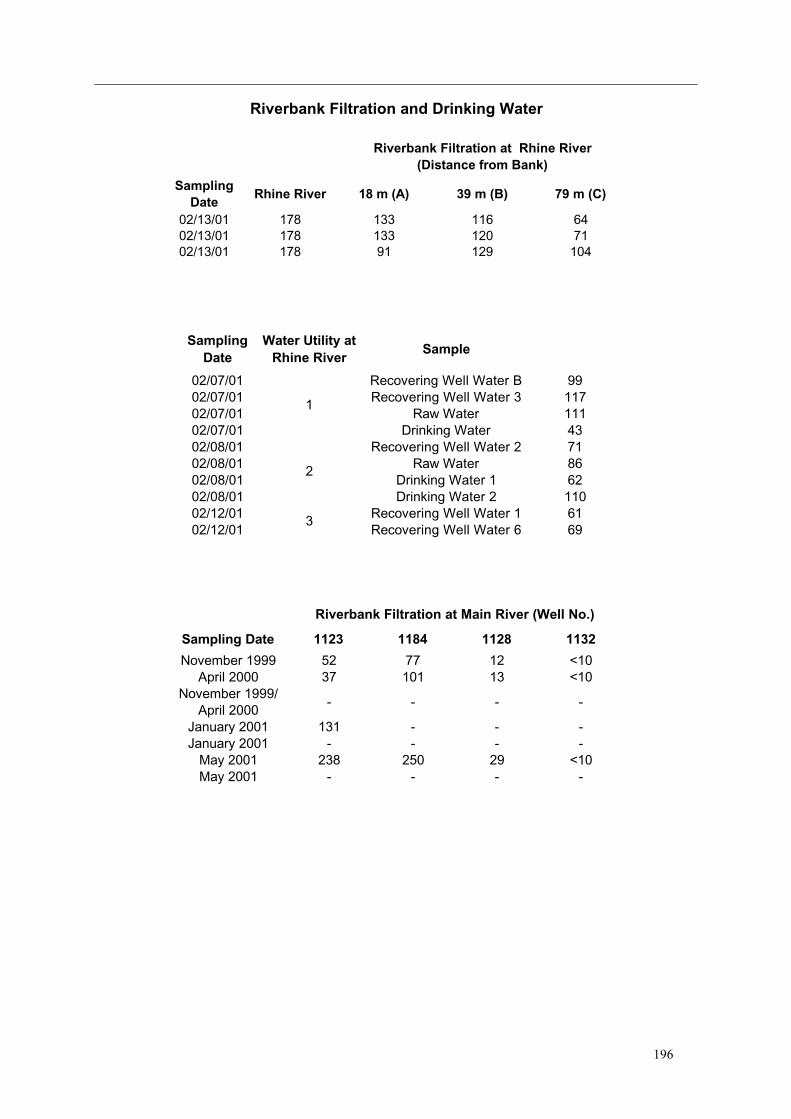
196
Sampling Date
Rhine River 18 m (A) 39 m (B) 79 m (C)
02/13/01 178 133 116 6402/13/01 178 133 120 7102/13/01 178 91 129 104
Riverbank Filtration and Drinking Water
Riverbank Filtration at Rhine River (Distance from Bank)
Sampling Date
Water Utility atRhine River
Sample
02/07/01 Recovering Well Water B 9902/07/01 Recovering Well Water 3 11702/07/01 Raw Water 11102/07/01 Drinking Water 4302/08/01 Recovering Well Water 2 7102/08/01 Raw Water 8602/08/01 Drinking Water 1 6202/08/01 Drinking Water 2 11002/12/01 Recovering Well Water 1 6102/12/01 Recovering Well Water 6 69
1
2
3
Sampling Date 1123 1184 1128 1132
November 1999 52 77 12 <10April 2000 37 101 13 <10
November 1999/ April 2000
- - - -
January 2001 131 - - -January 2001 - - - -
May 2001 238 250 29 <10May 2001 - - - -
Riverbank Filtration at Main River (Well No.)

Name Christine Achten, geb. Eichler
Geburtsdatum 17.12.69
Geburtsort Buchholz in der Nordheide
Familienstand verheiratet, ein Kind
:
Schulausbildung 1989 Abitur am Gymnasium Neu Wulmstorf/ Hamburg:
Hochschulausbildung 10/90 - 02/93 Grundstudium, Universität Bonn
04/93 - 03/95 Hauptstudium, RWTH Aachenfreiwillige Studienarbeit:PAK - Belastungsmuster in Flußsedimenten undihre Transportwege zur Ermittlung derEmissionsquellen - Beispiel Aachener Raum –Prof. Dr. W. Püttmann
03/95 - 05/97 Diplom, RWTH AachenPrüfungsfächer Ingenieurgeologie und PetrologieDiplomarbeit:Wechselwirkungen zwischen LCKW-Abbau undHydrochemie im Grundwasserabstromausgewählter Altstandorte in DüsseldorfProf. Dr. W. Püttmann
seit 05/1997 Promotion am Institut für Mineralogie- Umweltanalytik -, Universität Frankfurt am MainPromotionsthema:Methyl tert-butyl ether (MTBE) in the aquaticenvironment in GermanyProf. Dr. W. Püttmann und Prof. Dr. H. F. Schöler
:
Berufsweg 07/91 - 09/91 Steinfeld & Partner Umwelttechnik, Hamburg03/93 - 08/93 Landschafts-, Archäologie- und
Naturdenkmalpflege, Aldenhoven01/94 - 12/94 Lehrstuhl für Geologie, Geochemie und
Lagerstätten des Erdöls und der Kohle, RWTHAachen
01/95 - 01/96 Hydrogeologisches Ingenieurbüro Olzem,Aachen
07/96 Analytisches Labor Aachen (ALA)03/96 - 04/97 Geologisches Ingenieurbüro GEOBIT, Aachen05/97 - 03/02 Institut für Mineralogie -Umweltanalytik-,
Universität Frankfurt am Main01/99 - 12/00 ARCADIS Consult GmbH, Darmstadtab 03/02 Altenbockum und Partner, Geologen, Aachen
Lebenslauf
Copyright © 2022 FDOKUMEN


![Ethene/norbornene copolymerization by [Me 2 Si(3- tert BuCp)(N tert Bu)]TiCl 2 /MAO-catalyst](https://static.fdokumen.com/doc/165x107/6312231a48b4e11f7d08cd0e/ethenenorbornene-copolymerization-by-me-2-si3-tert-bucpn-tert-buticl-2-mao-catalyst.jpg)

![Lower Rim Substituted p-tert -Butyl-Calix[4]arene. Part 15. Pb(II)-Ion-Selective Electrodes Based on p-tert -Butyl-calix[4]arene Thioamides](https://static.fdokumen.com/doc/165x107/6342a72ff9c0d1681b0ad302/lower-rim-substituted-p-tert-butyl-calix4arene-part-15-pbii-ion-selective.jpg)


![Structural characterization and reactivity of Cu(II) complex of p- tert-butyl-calix[4]arene bearing two imine pendants at lower rim](https://static.fdokumen.com/doc/165x107/631fe67f962ed4ca8e03e9b8/structural-characterization-and-reactivity-of-cuii-complex-of-p-tert-butyl-calix4arene.jpg)