Methodology proposal for budgeting process on
51
Methodology proposal for budgeting process on manufacturing and logistics organisation Paulo António Gromicho Serol Master in Applied Management Supervisor: Professor Doctor Ana Isabel Dias Lopes, Assistant Professor, ISCTE December 2021
-
Upload
khangminh22 -
Category
Documents
-
view
0 -
download
0
Transcript of Methodology proposal for budgeting process on
Methodology proposal for budgeting process on manufacturing and logistics organisation
Paulo António Gromicho Serol
Master in Applied Management
Supervisor: Professor Doctor Ana Isabel Dias Lopes, Assistant Professor, ISCTE
December 2021

Methodology proposal for budgeting process on manufacturing and logistics organisation
Paulo António Gromicho Serol
Master in Applied Management
Supervisor: Professor Doctor Ana Isabel Dias Lopes, Assistant Professor, ISCTE
December 2021

Acknowledgements I would like to thank the people that made the completion of this thesis possible: To all the teachers on this master and specially to the advisor Dr Ana Isabel Lopes that was always supportive even with my special schedules. To all my course colleagues from which I’ve learnt a lot during our virtual meetings and some in-person gatherings. To Darren Jenkins for his support on this process. To my sister who was an inspiration of achievement. To my parents, who always supported me on their own way. To my partner Andreia and children Maria Joana e Joao Pedro for being patient with my absence and continuous support.


i
Summary
Baseado numa análise da literatura mais relevante sobre o tema, nas soluções propostas por
académicos ou nas implementadas por outras organizações, nos diferentes modelos de planeamento
para melhor entender o processo de orçamentação, as dificuldades mais comuns e as soluções
apresentadas pelos diferentes agentes. Dessa forma, este estudo explora os modelos “better
budgeting” e “beyond budgeting”, assim como as ferramentas propostas por estes, nomeadamente,
“Activity Based Busgeting”, “Zero-based budgeting”, “Rolling Budgeting” e “External Benchmarking”.
Tendo trabalhado na organização por mais de 5 anos em funções de gestão de departamento e tendo
um conhecimento profundo do processo de orçamentação utilizado, o foco deste trabalho ficou no
entendimento das dificuldades do processo de orçamentação, os métodos e ferramentas
comprovados, verificar como estes se encaixam na organização e propô-los como solução.
Várias das dificuldades e problemas referenciados na literatura foram identificados no processo da
organização e, seguindo o entendimento dos autores em como ultrapassá-los, foram propostas acções
através de alterações comportamentais seguindo os princípios identificados nos métodos ou pelo uso
das ferramentas disponíveis nos métodos mencionados.
Based on an analysis of the most relevant literature on the topic, and on the solutions proposed by
academics or the ones other organisations are implementing, different planning models to better
understand the budgeting process, the common difficulties encountered, and the solutions proposed
by different agents. As such, this study explores the better budgeting and the beyond budgeting
models, as well as the tools these models propose, namely, Activity Based Budgeting, Zero-based
budgeting, Rolling Budgeting and External Benchmarking.
Having worked on the organisation for more than five years as manager and having a deep knowledge
of the used budgeting process the focus was on understanding the difficulties on the budgeting
process, the existing proved methods, and tools, and see how they fit on the organisation to propose
them as solution.
Several of the difficulties and problems mentioned on the literature were identified on the
organization’s process and following the author’s view on how to overcome them, actions were
proposed though the change of behaviours following the method’s principles or by using the tools
available on the mentioned methods.
Keywords: budget, kpi, performance, production, juice, methodology, better budgeting, beyond
budgeting, ABB, Activity based Budgeting, Rolling Forecasts,
JEL Classification: L66, M10, M41

ii
Contents
Summary i
Contents ii
Introduction 1
1. Literature review 2
2 Methodology 16
3 Data Presentation and Analysis 17
4 Proposed actions 25
Conclusion 27
Bibliography 28
Annex I – Supporting Tables 30
Annex II - Survey 35
Annex III – Survey evaluation matrix 39
Annex IV – Current budgeting data structure 40
Annex V - Budgeting stakeholders 42
Annex VI – Reward scheme data structure 45

1
Introduction
The present study has the objective to analyse the budgeting process of an organisation, which acts
on the juice manufacturing and logistics markets, evaluate the potential difficulties or gaps on the
process and propose actions to improve it.
A Budget is a financial plan for a specified period of time expressed in quantitative terms.
To understand the budgeting process, which are the common difficulties and the solutions proposed
by academics or the ones other organisations are implementing, through the available literature,
different planning models were analysed.
The main planning methods are better budgeting and beyond budgeting, where the first advocates the
improvement of the traditional budgeting process through the use of new methods such as Activity
Based Budgeting, Zero-based budgeting, Rolling Budgeting, the second has a more disruptive view of
the planning process and proposes a different leadership type by following 12 main principles, the
abolishment of fixed measures and periods and the use of tools to guide the organisation on the path
to achieve the relative targets such as External Benchmarking and Balanced Score Cards.
The organisation’s budgeting process was described through interviews and analysis of the
spreadsheets used on the process and the preparedness of the organisation to change the process was
obtained through a survey.
Having identified some potential difficulties through the process organisation and system’s limitation,
a plan of actions was proposed which includes a better understanding of the cost structure, better
communication and engaging of the organization’s managers on the process and system’s
improvements to improve the accuracy of the data and facilitate both the data availability and process
control.

2
1. Literature review
This literature review will evaluate relevant studies on budgeting with the goal to propose a budgeting
process for the target group of companies.
There are currently two major trends which will be considered, Better Budgeting and Beyond
Budgeting where on the prior, budgeting is considered still a valid process if new tools and techniques
are applied (CIMA, 2004) whether on the latter, it is advised to abandon budgeting (Hope and Fraser,
2003).
In this chapter there will be a definition of budgeting, how it started, the criticism around the process
and how the new trends propose to solve the problems encountered.
Some of the different academic approaches on the budgeting process will be analysed.
1.1 Budgeting Definition and History
The budgeting process was developed in the early 20th century by companies such as Du Pont de
Nemours, General Motors in USA, Siemens in Germany, Saint Gobain and Electricite de France in
France (Berland, 2000; Chandler,1998). Defined as "a commonsense standard used as a guide in the
control of expenses" (Pendlebury, 1942), it was considered a success management concept during the
first half of the 20th century.
Since the start of its use, it was considered a powerful tool, meaning much more than a planning and
control system (Curry, 1941), since it must mirror the strategic goals of the organization and be defined
in quantifiable and measurable values in order to ease the prioritization and coordination of complex
competing decisions and transform into operational actions to achieve such goals (CIMA, 2006).
Additionally, it also became a tool to motivate the employees when its objectives are achieved or
surpassed.
CIMA’s Official Terminology of Management Accounting defines a budget as: “a quantitative
statement for a defined period, which may include planned revenues, assets, liabilities and cash flows.
A budget provides a focus for the organisation, aids the coordination of activities, and facilitates
control. it provides an overall framework of control without which it would be impossible to manage.
A budget can provide a road map detailing where the business is, where it wants to go and how it can
get there” (CIMA, 2004, p.4).

3
1.2 Traditional budgeting criticism
In 2001 the Cranfield University and Accenture’s Finance and Performance Management Service
performed a worldwide review on the planning and budgeting process in which they focused on 15
companies in the USA and Europe which had went through adjustments on their budgeting process
and, in addition, they reviewed over 100 academic and practitioner books on the subject. From this
review, they compiled a list of the main criticism to traditional budgeting, that can be summarized in
the following topics.
• Budgets are time-consuming and costly to put together.
Many authors mention that the budgeting is a highly time-consuming process, in some cases
evaluating the time consumption in between 20% to 30% of the working time of an employee who is
directly involved on the process, whilst in other cases relating the consumed time with the
organization's complexity and revenue (Hope and Fraser, 2003; Cokins, 2008). Parmeter (2003)
estimates an investment of 2500 person hours per US$100M of revenue. In any case it is widely
considered that this process cost is too high and that no significant added value comes from it (Neely,
Bourne and Adams, 2003; Hansen, 2011; Libby and Murray, 2010); Gary, 2003; Jensen 2003; Player,
2009; Radu, 2011; Parmeter, 2003; Centage/IOMA, 2007).
• Budgets constrain responsiveness and flexibility and are often a barrier to change.
“Budgets can stifle the entrepreneurial, risk-taking culture that, ultimately, can be responsible for
value creation” (CIMA / ICAEW, 2004). Traditional budgets set the boundaries in which an organization
should work and the possibilities to adjust these boundaries are very limited to none.
• Budgets are rarely strategically focused and are often contradictory.
Studies were performed to understand the link between the budgets and the company strategy. One
of the most important was the study conducted by Parmeter (2003), in which 90% of the surveyed
CFO’s answered often that the link between the budgets and the company strategy does not exist.
Hope and Fraser (2003) also performed a similar study and found that 66% of surveyed employees
considered their budgets to have more influence on politics than on the company’s strategy. The
situation, however, seems to be improving as there is a study from Centage/ IOMA in 2007 having 75%
of the participants to link their budget to the organization's strategy.
• Budgets add little value, especially given the time required to prepare them.
Considering all the identified problems on budgeting and its cost, some relevant value should come
out of it, other than financial control.

4
• Budgets concentrate on cost reduction and not on value creation.
Budgets are perceived as decisions over scarce resources taken by who has more power on the
organization (Jensen, 2003; Cokim, 2008). Additionally, the incentives are to outperform the budget
instead of accurately work along its directives therefore being a barrier to improvement and success
(Holly and Fraser, 2003; Libby and Murray 2007, Coulman and Law, 2003), there's the risk of, due to
budgetary limits, not following important strategic projects.
• Budgets strengthen vertical command and control.
It allows the strengthen of vertical command and control where top management use the budget to
exercise power over subordinates passing pressure to meet budget targets limiting the two-way
communication (Hanninen, 2013; Goode and Malik, 2011). In 2007, the Centage/IOMA performed a
study that shows some improvement as around 40% of surveyed companies already use a bottom-up
approach for budgeting.
• Budgets do not reflect the emerging network structures that organisations are adopting.
With the current tendency towards decentralization the traditional budgeting limit the action of
managers and their ability to make use of partnerships, alliances, and customer input to improve the
company’s performance (Neely, 2001; Wienhold, 2015)
• Budgets encourage ‘gaming’ and perverse behaviours.
In 2003 a published paper entitled “Paying people to lie”, from M.C.Jensen , includes several examples
on how budgetary targets are met through actions that not only don't add value but in some cases
can actually be harmful to the organisation, such as backdating transactions, having non disclosed
agreements with business partners (Jensen, 2003). Also related with this dysfunctional behaviour,
there is the budgetary gaming, widely studied by several academics (e.g., Collingwood, 2001; Fisher,
Maines, Peffer and Sprinkle, 2002; Locke and Latham, 2002). A very high increase on productivity is
estimated in case these behaviours can be eliminated (Wienhold, 2015).
• Budgets are developed and updated too infrequently, usually annually.
Budgets are not frequently adjusted, if they are at all, to the changing economic environment, neither
includes what-if scenarios (Hanninen, 2013; Hope and Fraser, 2003; Libby and Murray, 2010;
Vaznoniene and Stončiuviene, 2012; Wienhold, 2015). This lack of dynamic on the budgeting process
allows the forecasted numbers to become useless if there are significative changes on the economic
environment
• Budgets are based on unsupported assumptions and guesswork.
Budgets are frequently based on forecasts which come from non-elaborate processes that do not
include a recurrent validation of its assumptions (S. Player, 2009; Wienhold, 2015)
5
• Budgets reinforce departmental barriers rather than encourage knowledge sharing.
The creation of isolated compartments within companies is a subject commonly addressed as one of
the problems that arise from budgeting, creating obstacles for cooperation and even causing conflicts
within the companies on the pursuit of achieving their targets (Parmeter, 2003; Radu, 2011; Wienhold
2015)
• Budgets make people feel undervalued.
People may feel undervalued being the main reasons on the targets set at too high-performance level
or too much information is required without considering if that information is useful or not, which can
be perceived by the employee that his input has low quality or is work does not add value (Radu, 2011;
Wienhold, 2015).
Due to all this criticism two alternative concepts were developed: Better Budgeting, following the lines
of budgeting but looking to enhance the process and respond to the critics, and Beyond Budgeting,
more disruptive which defends the abolition of budgets and budgeting. These two alternative concepts
are explained in the next two subsections.
1.3 Better Budgeting
The Better Budgeting concept proposes a more agile budgeting process, with a focus on the
competitors and on the organization’s strategy, where the employees should be included as
participants engaging them on the target definition, which will positively affect the way they perceive
and execute the budget.
Responsibilities on the budgeting definition and execution should be clearly assigned across the
organization to lower-level managers improving the accuracy of information (Carlson and Palaveev,
2004; Cokins, 2008; Radu 2011).
On the Cranfield University and Accenture’s Finance and Performance Management Service review
mentioned on chapter 1.1, and based on CIMA (2014) some principles were identified on the budgeting
processes of the leading companies, namely:
• Have an external focus
What defines how well the company performed is how it compares with competitors not how it
compares with an outdated budget. Additionally, the incentives are linked to external targets to
eliminate some of the gaming that tamper with budget achievements.

6
• Are explicitly focused on strategy
The competitive advantage in the marketplace is key to achieve financial performance, even more
important than financial management. The analysed leading companies additionally use strategy-
related scorecards to keep track of how the company performs on non-financial targets.
• Invest on IT systems which generate a common set of numbers throughout the company
The usage of these systems allows a single view across the company and avoids the waste of time on
multiple data consolidations.
• Use explicit forecasting models, separate from their financial management systems
Use of systems to generate accurate dynamic forecasts based on clear assumptions which can be easily
updated when the need is triggered by environmental data change.
• Put their efforts into managing future results, not explaining past performance
Focus on generating accurate forecasts that enable decisions to take actions, many of them non-
financial, to limit the potential variances, which highlights the limitation of traditional budgeting.
• Have a high degree of trust on the managers
Even than all the previous mentioned elements are present, the researchers point out that real change
will be unachievable without a high degree of trust.
On the same survey, five principal approaches and techniques were identified (see Table I, Annex).
• The first two techniques on the table – activity-based budgeting and zero-based budgeting - are
considered to help improving the focus and accuracy of budget outputs, but they require even
more work than the traditional budgets, so the authors advice to use them on a one-off basis
instead of on a regular basis.
• The next two – value-based management and profit planning – are referred to be more theoretical
techniques and not so much used by organizations so there’s not enough information to evaluate
its impact on the budgeting process.
• The fifth technique – rolling budgets and forecasts – is consider having the most potential as a
better regular budgeting approach as per the author many companies have successfully
implemented such system.
According to the authors, none of the techniques provide a complete solution and at best they
overcome specific problems on the traditional budgeting processes.

7
From these five techniques I will include below a more detailed description on the most implemented
processes.
1.3.1 Activity Based Budgeting
The activity-based budgeting (ABB) was developed by Coopers and Lybrand Delloite. They’ve
combined some proven management practices with the more recent activity-based cost (ABC). ABB
aims for recurrent performance and cost improvement and can be applied in all industries and
functions. ABB strengthens the link between planning and budgeting, allowing the planning to be
detailed enough to be used as base to individual activities objectives within the business. A matrix with
resources and major functions is usually created to relate the costs to the functions, where each
resource must be justified in terms of supporting the activities and functions (Wilhelmi and Kleiner,
1995)
The most important benefits of ABB are the following (Wilhelmi and Kleiner, 1995):
• Report accurate costs which allows to identify the profit origin
• Identify the activities cost which allows to find more efficient or alternative ways to perform them
• Identify the future need for resources so that they can be acquired more efficiently
• The cost can be linked to the service level
• Internal activities can be evaluated on the relation between cost and value added to the
organisation
• Enables benchmarking of costs and trend analysis
• Enables the operational control on the daily activities
It is important to keep in mind that the analysis doesn’t have to be precise, and the goal is not to
calculate accurately the activity costs but to create a tool to support informed decisions.
As such, examples of cost drivers for the manufacturing companies are: number of material
movements, number of parts, number of suppliers, number of purchase orders, number of batches,
number of engineering changes, and number of part numbers” (Wilhelmi and Kleiner, 1995, p.6).
The most important Outputs from ABB are the following (Cooper and Slagmulder, 2000):
• Products – selling prices (typically average selling prices)
• Customers – revenue they generate through their orders
• Distribution Channels – business that is transacted through them

8
The nonlinear proportional relation between the outputs and the resources makes it necessary to
review the impact of any change of the expected outputs on the required resources to generate them.
However, as mentioned by Hanninen (2013) and Pietrzak (2014), researchers doubt that the
complexity of the process is manageable for smaller enterprises. According to Cokins (2008) and
Pietrzak (2014), the in-depth organisational knowledge necessary to link activities to outputs is hard
to obtain even for larger companies.
1.3.2 Zero Base budgeting
The “zero-based budgeting” was first used by Peter A. Phyrr in 1970 in the Harvard Business Review.
The principle that rules ZBB is the manager’s statement of what he believes can be achieved if certain
resources are made available to him. A high commitment and creativity are required to elaborate such
plans.
Winning the assignment of such resources will commit the manager to the results he stated he could
achieve.
ZBB works well where traditional budgeting cannot, when fixed and variable costs can be clearly
defined, thus it doesn’t work well on manufacturing budgeting. The logic behind ZBB is to create
decision packages, something like projects, that go through the multiple company levels bottom-up
and are sorted by each level of management according to the level of priority they assign to it, knowing
the priority the level below assigned to it.
The benefit of ZBB is that it doesn’t require the decision maker to know the details of each decision
package costs, he just needs to know that decision package 1 is better than decision package 2
considering its cost/benefit relationship.
On another hand it requires a huge amount of documentation and the accounting systems to be able
to capture the data in a way that allows to monitor performance (Wilhelmi and Kleiner, 1995).
1.3.3 Rolling Budgets and Forecasts
Due to the constant changes on the business environment the usage of rolling forecast will serve as a
compass pointing to the current financial path. The rolling budgeting estimates the financial outcome
on current forecasts using current assumptions but differently from the traditional budgeting it allows

9
the target to be adjusted on periodic reviews. It maintains the estimate into twelve to eighteen
months in the future but is constantly reviewed using the most up to date information (Morlidge and
Player 2010)
Bogsnes (2009), as cited by Zeller and Metzger (2013), based his work on the BBRT (Beyond Budgeting
Round Table) and Hope and Fraser’s publications demonstrating that the rolling forecast is a key tool
for the management. He compiled some principles that should guide the rolling budgeting process
which are listed below, divided into two types of principles:
Leadership Principles
• Customer - Focus everyone on improving customer outcomes, not on hierarchical relationships.
• Organization - Organize as a network of lean, accountable teams, not around centralized functions.
• Responsibility - Enable everyone to act and think like a leader, not merely follow the plan.
• Autonomy - Give teams the freedom and capability to act; do not micro-manage them.
• Values - Govern through a few clear values, goals, and boundaries, not detailed rules and budgets.
Transparency - Promote open information for self-management; do not restrict it hierarchically.
Process Principles
• Goals - Set relative goals for continuous improvement; do not negotiate fixed performance
contracts.
• Rewards - Reward shared success based on relative performance, not on meeting fixed targets.
• Planning - Make planning a continuous and inclusive process, not a top-down annual event.
On this process, an initial budget should work as a base to start the company and guide during the first
steps.
As soon as the business starts to actually work, relative targets must be set and the leadership should
be based on the market dynamics (Morlidge and Player, 2010)
Zeller and Metzger (2013) provided additional guidelines to support the implementation of rolling
forecasts, namely:
• Do not over-specify the accuracy of the forecasted values. Rather than spending too much time
and resources marginally improving reliability, reasonable estimates should be used.
• Avoid excessive detail in the metrics. A few key variables should that allow management to take
corrective action be chosen.

10
• Do not assume growth or positive results. Rolling forecasts should attempt to measure reality, not
projected goals. Taking last year’s numbers and increasing them by a certain percentage is not an
application of a rolling forecast.
• Make sure that the rolling forecast process is an ongoing integrated activity, not a once-a-year
event. It is appropriate, indeed recommended to use more than one time horizon for different
metrics.
• The metrics developed should be actionable, i.e. they should point management in the direction
of improving performance
An example of what can be a rolling forecast metrics and time frame can be found on Table II (see
Annex).
In 2004, ICAEW and CIMA held an event to discuss the budgeting with presentations and discussion
around better budgeting and beyond budgeting. From the debate, the overall conclusion was that
budgeting is still a valid practice through the use of new tools and techniques. The budgeting process
was described as more important than the numbers set as targets. The discussion of the targets
requires a high level of inter-functional co-ordination, as referred by one of the participants, budgeting
is about “looking into boxes you rarely open”. Those new tools and techniques proposed by CIMA
(2004) are listed and described in the next lines.
• Forecasting
It is considered by some as more important than the budgeting as the assumptions on which the
budgeting is based on, changes too frequently that the forecasts are essential to keep the budgets
valid. Additionally, the use of forecasting allows a more forward-looking and better linked strategic
planning. The frequency the forecasts must be done depend on the environment in which the
organization operates being more frequent on fast pacing environments.
• Non-financial performance measures
Even considering the importance of the non-financial, the link to the financial targets and strategy is
hard to achieve, leading the strategic decisions to be based more on intuition than facts. These non-
financial measures should be scrutinised before their acceptance as a cause-and-effect between the
four quadrants of the scorecards – financial, operational, customer and learning.
• Technology
Technology is the base of the budgeting and forecasting evolution on the most recent years as it has
changed the way data is collected, stored, and analysed. It can shorten a process that would take
months to a few days making its result more up to date and accurate to the current variables. The
11
usage of a unique set of data can help the alignment between the multiple views such as budgets,
financial plans, operational plans, and strategic objectives as well as eliminating the ‘silo’ mentality
where the usage of off-line spreadsheets ends up disconnected from reality.
Technology adds a risk though. It can generate a huge amount of data than can result into a
reinforcement of the top-down management of even micro-management, it is necessary to keep the
process simple and agile.
• Culture and Incentives
Considered to be the biggest influence on how companies operate and the most important factor in
their success, it is almost impossible to prescribe a method to achieve the right environment. For the
success of the current decentralised management, it is required to support a culture of trust and
empowerment which can at same time hold accountable without dropping to the blaming and mistrust
behaviour. That culture can only be achieved if there’s commitment from the top and with a great help
from reward structures which lead to high motivated employees. To avoid budgeting to become a way
of negotiating pay, or to have dysfunctional behaviours due to the link between budget and incentives,
some companies deliberately use different targets on the incentive’s schemes.
On a publication from PWC “Best practice in the budget and planning process”, in 2017, a
comprehensive list (Table III, Annex) of key characteristics of best practice processes and systems is
provided, keeping the alignment with the document from (CIMA 2004) but adding some more practical
details to the budgeting process.
1.4 Beyond Budgeting
The Beyond Budgeting Roundtable (BBRT) research consortium which aggregates profit and non-profit
organisations and academics, has worked since 1998 on developing an alternative to the budgeting
process.
From the research on multiple companies which had fully or partially abandoned their budget, they
have developed a generic model with 12 principles which should be implemented on the “ideal”
beyond budgeting organization. The first six principles aim to create a flexible organisation structure
where the authority is devolved to employees. On the other six there are some guidance for the
dynamic management processes to cope with the new organization structure (Hope and Fraser, 2003;
de Waal et al., 2004) as follows:

12
Creating a flexible organizational structure:
• A self-governance framework
Reorganisation of company’s structure into smaller and self-managing units where hierarchy is only
used when decisions affect all profit centers.
• Empowered managers
Build a framework where local managers have the ability to make fast decisions within the defined
limits following the organisation values.
• Accountability for dynamic outcomes
Definition of relational competitive targets instead of pre-defined targets. The desirable results are set
dynamically and are adjusted recurrently instead of static ones established at the beginning of the year
as that discourage achieving more than established targets.
• Network organisation
Each of the units work independently focused on the customer needs allowing them to adapt to any
changes of unexpected opportunities or threats.
• Market coordination
Central support units work to the operative units ad if they were customers and if the cost or service
level provided is not adequate, the operative units can contract their support externally.
• Supportive leadership
People are leaded and coached by senior managers to achieve the dynamic goals. The managers of
self-managing units are permitted to decide no matter if mistakes happen without being punished for
it. Coordination between units is achieved by the senior managers while coaching.
Designing an adaptive management process:
• Relative targets
The strategic goals are related with the market and competitors and are continuously updated being
the comparison terms to the unit’s performance, not the internal budget.
• Continuous strategy-setting
The bottom-up strategy process is continuous and is updated whenever there are signs of change
• Anticipatory systems
Forecasts are prepared frequently for both financial and non-financial success drivers, being the base
for decision making supported by senior managers. These forecasts don’t affect the reward scheme so
the information can be objectively prepared.
• Resources on demand

13
Investment plans are prepared based on the current information with the allocation of resources when
and where they are needed most. There’s no link to prior year’s resource allocation.
• Fast, distributed information
On time information is available across the organization through indicators which allows the steering
of the self-managing units, and comparison between them or to external benchmarks.
• Relative team rewards
The team spirit is achieved with the reward systems where not only the unit’s performance is
considered but also the whole organization. The targets are relative to competitors and the markets.
(Waal, 2005)
Also, on CIMA report in 2004 a list of these principles was provided (Table VI, Annex)
1.4.1 Balanced Scorecard
The Balanced Scorecard serves to the managers as the instruments on a plane serve to the pilot, they
provide information on how the multiple components are, their direction and destiny. There is no
advice on how many, or which instruments should be used. Each company must analyse which
information they need to understand the environment they’re doing business at and how to monitor
their key departments or processes (see example on table V, Annex).
There are some difficulties on translating strategy into processes and choosing which indicators and
which is the cause-and-effect relationship but when that is achieved, it will engage the employees as
it connects their activities to the company’s strategy, allowing them to evaluate their contribution to
the group. The measures on BSC should include both the outcome and the processes are key to achieve
it and it should serve as a communication and learning system.
There are four perspectives to BSC (financial, customer, internal business process, and learning and
growth) which are subdivided in several paths, namely:
• Financial
o Rapid Growth – usually when a company starts, the main goal is to grow sales
o Sustain – when a business achieves some maturity, main goal is to improve gross margin,
operating income and return on capital employed
o Harvest – when there’s a short time in the economic life of business, the main goal is to
have immediate and certain cash backs

14
• Customer
o Market Share – Shows how well a company is developing on a desired market. The sales
might be growing but the market share might be decreasing, meaning that the competitors
are working better and gaining market.
o Account Share – shows how much of a customer’s business the company is getting. Similar
to market share but oversees each customer’s market. Usually, this exercise is done for
specific key customers and allows the analysis of the customer’s loyalty and satisfaction.
o Customer Profitability – It allows to understand if the business the customer is creating is
profitable and avoid going from a customer focused company to a customer obsessed
company. The effort to gain new customers can make a customer to be unprofitable for
some time but if that pattern persists actions need to be taken.
o Customer Acquisition – measure the rate of new business or customers using absolute or
relative terms, can also be used to measure the customer’s loyalty when business is
growing even if new customers are not following the same path.
o Customer Satisfaction – measures the customer’s satisfaction with the product/ service
provided, on recent studies it was found that only when the customer rate the experience
as “completely” or “extremely” satisfied it is likely he will keep some level of loyalty and
buying behaviour
o Customer Retention – an important way to maintain or grow market share
• Internal Business Process
Identifies the internal processes the company must be great at for the business to satisfy their
customers and their shareholders
• Learning and Growth
Identifies what the company needs to build internally to achieve long-term growth and improvement.
It is unlikely that with current technology and capabilities the business will stay competitive on a long-
term basis.
o People
▪ Employee satisfaction and retention
▪ Employee training
▪ Employee skills
o Systems
▪ Real time and accurate information on customers and internal processes
o Organizational procedures
▪ Alignment of the employee incentives with company’s success drivers
▪ Measures improvement in key internal processes

15
1.4.2 External Benchmarking
“Benchmarking is the process of identifying, understanding, and adapting outstanding practices from
organizations anywhere in the world to help your organization improve its performance” (CMA
Magazine, 1994, p. 23). The process, even defined as game-changing, an incentive to innovation with
profit and performance improvements, is described as very hard to achieve due to the difficulty on
getting significative data, for being exhausting and time-consuming and even very expensive. Due to
all these difficulties, some companies founded the American Productivity & Quality Centre (APQC)
which should serve as a repository and gateway to benchmarking information. Currently many services
alike can be found online which could help to reduce the difficulties on implementing a benchmarking
process.
To summarize the literature review section, it is important to point that the traditional budgeting
process is clearly not to be used, as all literature suggests that there are too many difficulties and
problems with it. Both Better Budgeting and Beyond Budgeting, as advocated by some prior authors
aforementioned, seem to have found the solution, but at same time neither of them have a recipe that
would fit all businesses, and, on both cases, it is proposed that each company evaluates their
organisation, their structure, their internal and environmental complexity.
As a matter of fact, both models are not that far apart on the cost control, bottom-up budgeting
process or setting up targets. Where they differ the most, is on the absolute targets against relational
targets and on the timeframe to achieve those targets, where in first case it is the duration of the
budget and on the later there’s no deadline if the path is on the right direction.
I will therefore, in the next section of this Project, to keep an open mind when analysing the company’s
budgeting process and propose the best principles or tools to solve any difficulty or problem identified.

16
2 Methodology
With the objective to improve the organisation’s budgeting process, firstly there was the need to
identify how the budgeting process works, how other companies are translating their strategy into
planning and control, how they engage their managers on pursuing a common goal and, what do the
academics think and write on the subject.
The use of generalization, critical analysis, and conclusion formulation methods to the multiple authors
views and conclusions was the way found to create a theoretical base to perform the next stages of
the process.
During the literature review a survey (Annex II) together with a review matrix (Annex III) was found on
the publication entitled “insight from practice. Is your organisation ready for beyond budgeting?” by
Waal, Andre, published on “Measuring Business Excellence”, in 2005, which pretends to evaluate the
organisation’s preparedness for the most disruptive of the analysed methods.
It was then considered to be an interesting tool to evaluate if the organization is ready for such a big
step and even if it wasn’t how happy are the managers with the current process and how willing are
they to improve it.
Following the literature revision, the current organisation’s budgeting process was described, through
own knowledge acquired during the over five years working on the organisation, Interview with key
intervenient on the process to understand his view on the future of the process, as well as through the
analysis of the main budgeting tables (Annex IV) used to collect and calculate the budgets.
The potential problems or difficulties on the budgeting process, as described on the literature, were
identified.
Having the potential problems or difficulties identified on the organisation’s process, and based on the
literature review, a proposal of measures to overcome the difficulties was proposed either by following
some of the principles identified on the planning methods or through the use of the tools those
methods suggest.

17
3 Data Presentation and Analysis
3.1 Presentation of the company and the problem
The organisation, as described on their website, “A fully integrated juice group with our own global
assets in sourcing, production and supply chain management complemented by the knowledge and
expertise of our accomplished sales businesses” has two factories, one based in Brazil and the other in
Ghana, one logistics company and a trading company.
It is currently undergoing some enhancements on the budgeting process as the current one is highly
empirical and centralised, so for the analysis the planned enhancements will be considered as done so
to extend the validity of this study.
The budgeting process at the organisation is based on spreadsheets that are kept on a cloud
environment which all the shareholders (Annex V) should have access to (not happening currently).
Additionally, the file circulates by e-mail.
The raw data come from other spreadsheets with manual data input where it regards the forecasts
and production planning and exported from the ERP where it regards the actuals. The data is then
compiled on the final file containing multiple links to the other spreadsheets, where some of them are
not available to all shareholders to look at the breakdown, as shown on Figure I.
Figure I – Data sources and consolidation schema

18
The budgeting process is strongly focused on the sales forecasts (Figure II and Annex IV), which is based
on running contracts and the additional contracts that the sales team expects to achieve, some already
under negotiation. The running contracts can have multiple durations and the majority, if not all of
them, don’t include a schedule of the deliveries, only including total quantity of product and contract
duration.
Figure II – Organization’s structure and current budgeting participants
To calculate the monthly budgets, it requires to have in consideration the fruit purchasing forecast
based on the usual fruit season, which may be affected by the environmental conditions, the
production, storage, and logistics capacity, as well as the expected delivery schedule.
The charts of accounts have been standardised across most of the companies and a mapping is
required to consolidate one of them. The cost methodology is also following the same logic on all the
companies, facilitating the consolidation process.
The process, that consists of gathering the data from the different departments, consolidating into a
final spreadsheet (Annex IV) and, then discussing the numbers line by line with only some of the
stakeholders (Annex V), takes around 4 weeks to complete and there’s no pre-scheduled revision,
being the responsibility of the stakeholders to trigger any update when they consider that there are
significative changes on the assumptions.
There is a theoretical breakdown of the different product costs on a spreadsheet and the report with
the actual cost is under development on the ERP but, as it is, will require manual consolidation of the
information.

19
A reward system is being implemented (Annex VI) using the metrics based on financial targets, such as
total sales, sales of top products, margin, overhead costs, EBITDA, and some operational targets such
as quality assurance, factory certifications, projects and internal processes implementation and
individual KPI’s (not included yet on table XII, Annex VI, but they were mentioned on the
communication).
There are some improvements already identified by the organisation but no action plan yet.
- Collection of data in a more structured way
- Formalisation of the review process with respective parties
- Development of a timetable that runs the various streams in parallel (sales, production costing,
overhead costing) to arrive at the end point where these can be brough together
- Once defined the budget should be available on the ERP where the variance report should
become available
3.2 Survey
The survey, included on the “insight from practice. Is your organisation ready for beyond budgeting?”
by Andre A. de Waal, published on “Measuring Business Excellence”, in 2005, had a complete set of
questions (Annex II) and evaluation matrix (Annex III) named “The beyond-budgeting entry scan
(BBES)” developed by de Waal et al. (2004) as in the forementioned publication.
The survey aims to evaluate the need and preparedness of the organisation to follow the beyond-
budgeting principles. As the beyond budgeting is the most disruptive of the analysed methods it was
considered that it could be used to also evaluate the preparedness to implement the better budgeting,
much closer to the traditional budgeting system, if on the results of the survey the need for changes
and will to change would be identified.
The original survey is organised in 14 different groups of questions where the groups have 1 to 3
different questions. The survey was adapted to meet the organisation’s structure and dimension and
therefore the last question (“Authority to adapt the budgeting process”) was disregarded as the survey
would be taken on the whole group, thus the authority existed.
On the literature review there were two other obstacles identified, the internal and environmental
turbulency (Jurgen and Stefan, 2005), so questions (13 and 14) to evaluate these obstacles were added
to the survey.

20
The remaining questions identification remained as per the original survey.
The survey was sent to 18 employees that included top to lower managers, no age, academic
qualifications, or any other grouping was considered relevant to the survey as no reference to any kind
of grouping was found on the literature, on the contrary, on the literature there can be found many
references to the importance of the bottom-up process (Hope and Fraser, 2003; de Waal et al., 2004).
The authors qualify each of the potential answers in a green, orange, and red colour that, as the traffic
lights, indicates if it is free to move, must move with careful or cannot move.
Out of the 18 participants, 15 surveys were received, which have been compiled on the table VII below,
where on each of the columns Green, Yellow and Red are the number of answers each colour obtained
and having the cells been coloured with a gradience representing the weight of each colour on the
total of answers. The colour gradience was considered the best option to analyse the results as even
if in a lower record, an obstacle is an obstacle and considering the majority as final result would hide
potential obstacles.
The result column was coloured with the colour which achieved the majority of the answers, and if
there was no answer with the majority, then the two colours with higher number of answers was
presented.
(Note: as mentioned before, the groups differ on the number of questions so the total of answers of
the three columns will be 15, 30 or 45 depending on the number of questions on the group. The
gradience of grey was applied differently on the different groups so that the shades/proportions would
be respected)
Table VII – detailed survey results
Result
A. How satisfied are you with the current budgeting process? 6 9 1
B. Is the organisation prepared to change the budgeting process? 4 12 0
1a. To what extent is your organisation currently decentralised? 1 13 2
1b. Is it possible to implement (further) decentralisation? 8 6 2
1c. Are the people in the organisation prepared to carry out the decentralisation 5 8 3 2a. To what extent do managers on lower organisational levels have the freedom to take decisions autonomously? 2 13 1
2b. Is it possible to enlarge managers authority to act? 10 6 0
2c. Is senior management in the organisation prepare to delegate authority? 6 10 0

21
3a. To what extent are the targets in your organisation dynamic (i.e. they can be adjusted up or down, depending on the circumstances)? 4 11 1
3b. Is it possible to introduce dynamic targets? 12 4 0
3c. Are the people in the organisations prepared to introduce dynamic targets? 7 8 1
4a. To what extent is your organisation currently focussed on customers? 12 4 0
4b. Is it possible to implement a customer-focused structure? 12 4 0 4c. Are the people in the organisation prepared to implement a customer-focused structure? 11 5 0 6a. To what extend can the prevailing management style in your organisation be described as coaching? 2 10 4
6b. Is it possible to develop a coaching management style? 11 5 0
6c. Are the people in the organisation prepared to do so? 7 8 1 7a. To what extent are targets in your organisation set relative to the competition? 0 11 5
7b. Is it possible to implement relative target setting? 5 10 1
7c. Are people in the organisation prepared to do so? 6 9 1 8a. To what extent is the strategy-setting process in your organisation continuous and bottom-up? 2 6 8
8b. Is it possible to make the strategy-setting process continuous and bottom-up? 8 8 0
8c. Are the people in the organisation prepared to do so?2 6 8 2 9a. To what extent does your organisation use rolling forecasts that look six quarters ahead? 4 6 6
9b. Is it possible to implement rolling forecasts that look six quarters ahead? 6 10 0
9c. Are the people in the organisation prepared to do so?3 9 7 0
10a. How are the resources allocated in your organisation? 9 1 6 10b. Is it possible to implement a more flexible allocation process, based on good-quality business plans? 11 4 1 10c. Are the people in the organisation prepared to make the allocation process more flexible? 13 3 0 11a. To what extent does your organisation currently has an efficient and effective management information supply process, including a set of financial and non-financial indicators? 3 12 1
11b. Is it possible to improve the management information supply process? 14 2 0
11c. Are the people in the organization prepared to do so? 10 6 0 12a. To what extent does your organisation use a reward structure based on a combination of individual and group results? 3 2 11
12b. Is it possible to implement a structure based on individual and group results? 12 4 0

22
12c. Are the people in the organisation prepared to do so? 9 7 0 . To what extent is the organisation complex?
4 8 4
Ex. Multiple levels of management and/or departments which cause communication difficulties
. To what extent the business is turbulent? 1 11 4
Additionally, the survey the authors presented included a final analysis of the answers by question
group to simplify the reading and understanding of the survey result, and the same logic was used on
this study (Table VIII).
The results presentation follows the same logic as the table above.
Table VIII – Survey results summary
Result
Preparedness to adapt the budgeting process 15 21 1
1. Self-governance framework 14 27 7
2. Empowered managers 18 29 1
3. Accountability for dynamic outcomes 23 23 2
4. Network organisation 35 13 0
6. Supportive leadership 20 23 5
7. Relative targets 11 30 7
8. Continuous strategy-setting 16 22 10
9. Anticipatory systems 19 23 6
10. Resources on demand 33 8 7
11. Fast, distributed information 27 20 1
12. Relative team rewards 24 13 11
13. Organization complexity 4 8 4
14. Business turbulency 1 11 4
Based on Table VIII, the survey revealed that the organization is not ready to follow a disruptive
budgeting process change, but on other hand there are no subjects where the opposition or misbelieve
is high enough to block changes from happening.
The highest results on the red column (which represent obstacles), that anyhow never represent the
majority of the answers, are on the “relative team rewards” and on “continuous strategy-setting”. The
reward system does not exist at all and that may have induced the mistrust of the participants on

23
considering this as an option but during the preparation of this study there was communication
informing that it will be implemented in the short term.
It does not include any relative targets though but as any process that is starting, there will be room
for adjustments.
The highest results on the green column (which represents no obstacles), with more than 50% of the
answers are on the “network organisation”, “resources on demand” and “Fast, distributed
information” showing a good perspective on the implementation of these principles in the company.
The highest results on the Orange column (which represents some obstacles or disbelief), with more
than 50% of the answers, are “preparedness to adapt the budgeting process”, “Business turbulency”,
“Relative targets”, “empowered managers” and “self-governance framework”, which indicates that
there’s no will to change or that the participants do not consider that the company is ready to follow
those principles. The principles can be applied with caution and a high support.
All the remaining principles obtained shared results between Orange and Green with no clear result.
It is however a sign that those principles can be followed with some attention to the potential
obstacles. Figure III shows and summarizes how the current process compares with the earlier
literature presented. The colours are intuitively and follow the methodology explained in the previous
paragraphs.
Figure III – Comparison of the results obtained with literature
24
3.3 Analysis of the potential difficulties on the budgeting process
This study being done from within the company and with more than 5 years on the organisation, there
was no focus on gathering information regarding the company and budgeting process as it would
happen if an unknown company was the target of the study, therefore only one interview was done
as an informal conversation with the key responsible for the budgeting process and an exchange of
informal e-mails to detail some of the subjects discussed, the rest of the knowledge was acquired
during the years of work experience at the organisation.
The budgeting process on the organization does not require too much preparation time neither it
represents a high cost, as it takes around 4 weeks to complete and does not involve dedicated full-
time resources to complete. There is no information on the time spent controlling the budget though.
However, the process does not include all the managers and departments such as Human Resources
(HR), Systems and Finance, which is only represented by the CFO and, from the interview and process
analysis there’s no reference to strategic discussions.
The overhead costs such as support areas like HR, finance, systems are forecasted using the traditional
methods basing the forecasts on previous years costs and have no discussion with the involved
managers.
Local managers have very limited ability to make decisions as most of the resources are assigned on
demand through direct contact with the top managers, enforcing the vertical control.
Due to the way the resources are allocated and the limitation on decision making, the risk of gaming
is very limited and there’s no impact on the inter-departmental relationships.
With the forecasts based on individual unsupported assumptions, there’s a high risk on the inaccuracy
of the budgeting process.
It was already identified by the organisation that the budgeting process data should become more
automatised with controls during the preparation process, allowing parallel work, and its availability
on the ERP system to ease the information distribution and control.
25
4 Proposed actions
Until the moment of the delivery of this Project for academic purposes, the implementation process was not executed, and the next steps in the organization would be as follows:
Schedule meetings to discuss the strategy, targets, and the actions necessary to achieve them so that
they become clear to the managers. From this discussion external relative targets could be identified
for both the organization and the reward scheme, facilitating the generation of a balanced Score Card
that would guide the decision makers.
These relative targets could be, as described on the literature review, market share, customer share,
on time delivery service levels or production yields, depending on the possible/available
benchmarking.
To feed the balanced score card, it would be necessary to also identify the required forecasts and
develop methods to obtain accurate information.
Quarterly meetings should be scheduled to discuss the variations, analyse the updated forecasts/
targets, how the actions decided on the previous meeting are being implemented and if the results
are as expected and decide the necessary corrective actions.
On the overhead costs / support departments the identification of expense groups with the separation
of fixed recurrent costs and project related costs together with a one-off use zero-based budgeting
would help to evaluate the cost/value relationship of the different expense groups and would enable
to identify potential improvements through investment, change of processes or discard the activities
where the relation between cost/value added are not justifiable.
After this initial exercise, the rolling budgets could be used on the fixed recurring costs whilst the zero-
based budgeting could continue to be used on the project related costs.
As identified by the organisation, the ERP should be updated to facilitate the budget preparation,
allowing the different departments to work in parallel. But beyond that, a forecast matrix like the one
shown on table II (Annex) should be prepared and the ERP should receive these regular inputs and
trigger alerts if the assumptions which the last budget review was based on have significant changes.
The budgeting information, the latest forecasts and the actuals should be always available for
consultation.

26
Additionally, the ERP system should support what-if scenarios, and compare them with the actuals to
improve the organisation’s forecasting and decision-making.
At the moment of the dissertation’s delivery, the Figure IV was drawn with a representation of the
proposed actions, it’s interaction with the ERP system and an update on the actions implementation,
to be presented to the top management team of the company. The strategy has now been defined but
the measures to evaluate if the organisation is following the correct path haven’t been defined yet.
Forecasts are also under development fully integrated on the ERP system. The actions highlighted in
dark yellow are now part of the organization’s plan for next year and the ones highlighted in light
yellow have been mentioned on discussions but are not explicitly mentioned on the current plan.
Figure IV – Proposed actions and its implementation status.

27
Conclusion
The present study has the objective to analyse the budgeting process of an organisation, which acts
on the juice manufacturing and supply chain markets, evaluate the potential difficulties or gaps on the
process and propose actions to improve it.
A Budget is a financial plan for a specified period of time expressed in quantitative terms.
To understand the budgeting process, which are the common difficulties and the solutions proposed
by academics or the ones other organisations are implementing, through the available literature,
different planning models were analysed.
The main planning methods are better budgeting and beyond budgeting, where the first advocates the
improvement of the traditional budgeting process through the use of new methods such as Activity
Based Budgeting, Zero-based budgeting, Rolling Budgeting, the second has a more disruptive view of
the planning process and proposes a different leadership type by following 12 main principles, the
abolishment of fixed measures and periods and the use of tools to guide the organisation on the path
to achieve the relative targets such as External Benchmarking and Balanced Score Cards.
The organisation’s budgeting process was described through interviews and analysis of the
spreadsheets used on the process. The preparedness of the organisation to change the process was
obtained through a survey.
Having identified some potential difficulties through the process organisation and system’s limitation,
a plan of actions was proposed which includes a better understanding of the cost structure, better
communication and engaging of the organization’s managers on the process and system’s
improvements to improve the accuracy of the data and facilitate both the data availability and process
control.
The main obstacles to follow the proposed actions would be the necessary change of behaviour and
work methodology, the resources needed to gain more insight on the cost structure and the time
frame to accomplish results that with few resources can take too long and the momentum can start to
fade away.

28
Bibliography
CIMA (2004) A report on the Better Budgeting forum from CIMA and ICAEW, https://www.cimaglobal.com/Documents/ImportedDocuments/betterbudgeting_techrpt_2004.pdf Cooper, Robin & Slagmulder, Regine (2000). Activity-based budgeting--part 1. Strategic Finance 82(3), 85-86. https://www.proquest.com/scholarly-journals/activity-based-budgeting-part-1/docview/229768502/se-2?accountid=38384 Cooper, Robin & Slagmulder, Regine (2000). Activity-based budgeting--part 2. Strategic Finance 82(4), 26-28. https://www.proquest.com/scholarly-journals/activity-based-budgeting-part-2/docview/229738906/se-2?accountid=38384 Curry, Oscar H (1958). BudgetingThe Art of Planning and Cooperation. National Association of Accountants 40(1). https://www.proquest.com/trade-journals/budgetingthe-art-planning-cooperation/docview/198841968/se-2?accountid=38384 de Waal, André A. (2005). Is your organisation ready for beyond budgeting? Measuring Business Excellence 9(2), 56-67, http://dx.doi.org/10.1108/13683040510602885 Hope, Jeremy & Fraser, Robin (2000). Beyond budgeting. Strategic Finance 82(4), 30-35. https://www.proquest.com/scholarly-journals/beyond-budgeting/docview/229739011/se-2?accountid=38384 Kaplan, Robert S. & Norton, David P (1996), Linking the balanced scorecard to strategy, California Management Review 39(1), 53-79. https://www.proquest.com/scholarly-journals/linking-balanced-scorecard-strategy/docview/216142220/se-2?accountid=38384 Marcus Wienhold (2015), Better Budgeting methods – a comparative effect analysis on traditional budgeting problems. https://repositorio.ucp.pt/bitstream/10400.14/18798/1/Master_Thesis_Marcus_Wienhold_final.pdf [02/09/2021] Neely, A., Bourne, M., & Adams, C. (2003). Better budgeting or beyond budgeting? Measuring Business Excellence, 7(3), 22-28. http://dx.doi.org/10.1108/13683040310496471 Ottenhouse, David (1994). Making benchmarking faster, cheaper, and easier. The Management Accounting Magazine, 68(1), 23-26. https://www.proquest.com/trade-journals/making-benchmarking-faster-cheaper-easier/docview/197743248/se-2?accountid=38384 Robert Lanzkron (2017). Best practice in the budget and planning process , best_practice_in_the_budget_and_planning_process.pdf (pwc.com) [24/08/2021] Weber, Jürgen & Linder, Stefan (2005). Budgeting, better budgeting, or beyond budgeting, Cost Management, 19(2), 20-28, https://www.proquest.com/magazines/budgeting-better-beyond/docview/209700379/se-2?accountid=38384 Wilhelmi, Michael & Kleiner, Brian H . (1995). New Developments In Budgeting. Management Research News 18 (3/4/5), 78-87. http://dx.doi.org/10.1108/eb028408

29
Zeller, Thomas L. & Metzger, Lawrence M. (2013). Good Bye Traditional Budgeting, Hello Rolling Forecast: Has The Time Come? American Journal of Business Education (Online), 6(3), 299-310. http://dx.doi.org/10.19030/ajbe.v6i3.7810

30
Annex I – Supporting Tables
Table I
Activity Based Budgeting
• Similar to ABC (activity-based cost) and ABM (Activity based management)
• Involves planning and controlling along the lines of value-adding activities and processes
• Resource and capital allocation decisions are consistent with ABM analysis, which involves
structuring the organisation’s activities and business processes so that they better meet
customers and external needs
Zero Based Budgeting
• Expenditures must be re-justified during each budgeting cycle, rather than basing budgets on
previous years and periods
• Avoids building on the inefficiencies and inaccuracies of previous history
• Value of this approach depends on stability of operating environment
Value Based Management
• Formal and systematic approach for managing the creation of shareholder value over time
• All expenditure plans evaluated as project appraisals and assessed in terms of the shareholder
value they will create
• Helps to link strategy and shareholder value to planning and budgeting
Profit Planning
• ‘profit wheel’ method for planning future financial cash flows of profit centres
• Assesses whether an organization or unit generates sufficient cash, creates economic value and
attracts sufficient financial resources for investment
• Ensures consideration of an organization’s short and long-term prospects when preparing its
financial plans
Rolling Budgets and Forecasts
• Solves problems associated with infrequent budgeting and hence result in more accurate
forecasts
• More responsive to changing circumstances, but requires permanent resources to administer
• Also overcomes problems linked to budgeting to a fixed point in time – i.e., the year-end and
the often-dubious practices that such cut-offs encourage
Adapted from Neely, Bourne, & Adams, 2003, p.24.

31
Table II
Economic
Relevance
Variability Speed of
Response
Update
Frequency
Forecast
Horizon
Revenues High High High Daily Quarter
Labour Costs High Low Medium Monthly Six Months
Raw Material costs High Medium High Every two Weeks Quarter
Energy Costs Medium Low Low Monthly Six Months
Maintenance Spending Medium Medium Medium Monthly Six Months
Machinery Renting/
Ownership Costs
Medium Low Low Quarterly Year
Other Operating Costs Medium Medium Medium Every Two Weeks Quarter
Adapted from the example on Zeller and Metzger, 2013, p.306.
Table III
Key characteristics of best practice processes:
● Control the number of budget iterations developed
● Reduce the number of budget line items
● Flexibility modelling of scenarios based on differing business assumptions
● Standardize budgeting methods with the rest of the company and what senior management is
expecting to see
● The link to strategy needs to be clear and clearly linked
● Base budgets on business drivers
● Align incentives and rewards to strategic objectives
● Link the annual planning process to rolling forecasts and management reporting
● Active engagement of the business in the budget process
○ Done by them and not to them, Controlled process, and communication
● People are key
○ The right team –finance and business
○ Analytical capabilities
○ Big picture and the detail
(“Best practice in the budget and planning process”, PWC (June 2017) p.7)

32
Key characteristics of best practice systems:
● One system and one method of input and analysis
● One language: common assumptions, input, terminology –making it as easy as possible
● Single charts of accounts and consistent costing methodology
● Ensure it is readable and usable in the ERP –to understand, measure and reforecast
● Single system not requiring constant tailoring – ‘interfaces’ are waste by their very nature
Adapted from PWC, 2017, p.10.
Table IV
Balanced Score Card structure example
Perspective Measure
Financial ROCE (Return on Capital Employed)
Customer Customer Loyalty
Internal Processes On time delivery
Process Quality Process Cycle Time
Learning and Growth Employee Skills
Adapted from the example on Kaplan and Norton, 1996, p.66.

33
Table V
Strategic Objectives Strategic Measures
Lag indicators Lead indicators
Financial • Improve Returns
• Broaden Revenue
Mix
• ROI (return on
investment)
• Revenue Mix
• Revenue Growth
Customer • Increase customer
satisfaction
• Customer retention • Customer satisfied
survey
Internal • Understand our
customers
• Create innovative
products
• Cross-sell products
• Share of segment
• Revenue from new
products
• Cross-sell Ratio
• Product
development cycle
Learning • Build strategic
information
• Develop strategic
skills
• Focus resources
• Employee
effectiveness
• Revenue per employee
• Employee satisfaction
• Strategic information
availability
• Strategic job
coverage
• Personal Goals
alignment
Adapted from the example on Kaplan and Norton, 1996, p.72

34
Table VI
Beyond budgeting – principles for adaptive performance management
Process principles
• Goals - Set aspirational goals aimed at continuous improvement, not fixed annual targets.
• Rewards Reward shared success based on relative performance, not on meeting fixed annual
targets.
• Planning Make planning a continuous and inclusive process, not an annual event.
• Controls Base controls on relative key performance indicators (KPIs) and performance trends,
not variances against a plan.
• Resources Make resources available as needed, not through annual budget allocations.
• Coordination Coordinate cross-company interactions dynamically, not through annual
planning cycles.
Leadership principles
• Customer Focus everyone on improving customer outcomes, not on meeting internal targets.
• Accountability Create a network of teams accountable for results, not centralised hierarchies.
• Performance Champion success as winning in the marketplace, not on meeting internal
targets.
• Freedom to act Give teams the freedom and capability to act, don’t merely require adherence
to plan.
• Governance Base governance on clear values and boundaries, not detailed rules and budgets.
• Information Promote open and shared information, don’t restrict it to those who ‘need to
know’.
Adapted from CIMA, 2004, p.9.
35
Annex II - Survey
Welcome to the budgeting survey.
This survey is part of a paper regarding the potential budgeting process improvement. It intends to
gather information on how the budgeting intervenient see the current process, their ability to accept
changes on the mentioned process as well as evaluate their perception on the company and business
complexity and turbulence.
The survey results will be statistically treated, and anonymity is guaranteed.
The completion of the survey will take approximately 6-15 minutes.
Thank you for your cooperation.
# Question Possible answers
(Green) (Orange) (Red)
A How satisfied are you with the current
budgeting process?
Dissatisfied Reasonably
satisfied
Satisfied
B Is the organisation prepared to change the
budgeting process?
Fully
prepared
To a certain
degree
Not at all
1a To what extent is your organisation currently
decentralised?
(Almost)
completely
To a certain
degree
Not at all
1b Is it possible to implement (further)
decentralisation?
Yes To a certain
degree
No
1c Are the people in the organisation prepared to
carry out the decentralisation
Yes To a certain
degree
No
2a To what extent do managers on lower
organisational levels have the freedom to take
decisions autonomously?
Large degree
of freedom
Limited
freedom
Little to
no
freedom
2b Is it possible to enlarge managers authority to
act?
Yes To a certain
degree
No
2c Is senior management in the organisation prepare
to delegate authority?
Yes To a certain
degree
No
3a To what extent are the targets in your
organisation dynamic (i.e. they can be adjusted
up or down, depending on the circumstances)?
All targets
are dynamic
Some
targets are
dynamic
All
targets
are pre-

36
set and
fixed
3b Is it possible to introduce dynamic targets? Yes Limited No
3c Are the people in the organisations prepared to
introduce dynamic targets?
Yes To a certain
degree
No
4a To what extent is your organisation currently
focussed on customers?
Strongly Partly Hardly
4b Is it possible to implement a customer-focused
structure?
Yes To a certain
degree
No
4c Are the people in the organisation prepared to
implement a customer-focused structure?
Yes To a certain
degree
No
6a To what extend can the prevailing management
style in your organisation be described as
coaching?
Strongly Partly Hardly
6b Is it possible to develop a coaching management
style?
Yes To a certain
degree
No
6c Are the people in the organisation prepared to do
so?
Yes To a certain
degree
No
7a To what extent are targets in your organisation
set relative to the competition?
All targets
are relative
Some
targets are
relative
None of
the
targets
are
relative
7b Is it possible to implement relative target setting? Yes To a certain
degree
No
7c Are people in the organisation prepared to do so? Yes To a certain
degree
No
8a To what extent is the strategy-setting process in
your organisation continuous and bottom-up?
Flexible,
bottom-up
Yearly,
Bottom-up
OR Flexible,
top-down
Yearly,
top-
down
8b Is it possible to make the strategy-setting process
continuous and bottom-up?
Yes To a certain
degree
No
37
8c Are the people in the organisation prepared to do
so?2
Yes To a certain
degree
No
9a To what extent does your organisation use rolling
forecasts that look six quarters ahead?
Completely Limited Not at all
9b Is it possible to implement rolling forecasts that
look six quarters ahead?
Yes To a certain
degree
No
9c Are the people in the organisation prepared to do
so?3
Yes To a certain
degree
No
10a How are the resources allocated in your
organisation?
At the time
and place
where
needed
On the basis
of
previously
made
investment
plans
On the
basis of
the
budget
10b Is it possible to implement a more flexible
allocation process, based on good-quality
business plans?
Yes To a certain
degree
No
10c Are the people in the organisation prepared to
make the allocation process more flexible?
Yes Limited No
11a To what extent does your organisation currently
has an efficient and effective management
information supply process, including a set of
financial and non-financial indicators?
Completely Limited Not at all
11b Is it possible to improve the management
information supply process?
Yes To a certain
degree
No
11c Are the people in the organization prepared to do
so?
Yes To a certain
degree
No
12a To what extent does your organisation use a
reward structure based on a combination of
individual and group results?
For the
entire
organisation
For some of
the
managemen
t levels
Not at all
12b Is it possible to implement a structure based on
individual and group results?
Yes To a certain
degree
No

38
12c Are the people in the organisation prepared to do
so?
Yes To a certain
degree
No
13 To what extent is the organisation complex?
Ex. multiple levels of management and/or
departments which cause communication
difficulties
Low to no
complexity
A certain
degree of
complexity
Highly
complex
14 To what extent the business is turbulent?
Ex. Raw material price and availability fluctuation;
Final product demand and price fluctuation
throughout the budget period
Low to no
turbulency
A certain
degree of
turbulency
Highly
turbulen
t
Adapted from de Waal, André A., 2005.

39
Annex III – Survey evaluation matrix
Beyond-budgeting Survey evaluation matrix
1. Need for beyond budgeting (Opening questions A + B)
Green The implementation of beyond budgeting should be seriously considered
Orange The test result shows that the need or preparedness for changing the budgeting process
is moderate. The lack of need or preparedness of the organisation to change should be
a point of special attention during the implementation of the beyond-budgeting
principles
Red Implementing beyond budgeting is strongly advised against. The test result shows that
there is no need or preparedness to change the budgeting process. Not until the need
and preparedness to change has increased, should you consider implementing the
beyond-budgeting model.
2. Status of the organisation (principle questions 1-12) The colours for the scores ate given for each
principle
Green There are hardly any to no obstacles to the implementation of this beyond-budgeting
principle
Orange Some obstacles can be expected during the implementation of this beyond-budgeting
principle. Several elements will require special attention.
Red Many obstacles can be expected during the implementation of this beyond-budgeting
principle. Many elements need to be changed substantially.
Questions 13 and 14 were added to the original survey to understand internal and environmental
complexity.
Adapted from Waal, Andre, 2005 p.62.

40
Annex IV – Current budgeting data structure The tables below are the main budgeting tables Sales Target
Fru
it V
olu
me
Exp
ecte
d Y
ield
Pro
du
ctio
n V
olu
me
Bo
ugh
t in
Vo
lum
e
Sto
ck V
olu
me
An
nu
al E
xpec
ted
Vo
l
An
nu
al E
xpec
ted
Pri
ce
An
nu
al R
even
ue
Co
st o
f P
rod
uct
ion
Un
it M
argi
n
An
nu
al M
argi
n
% M
argi
n A
nn
ual
Factory A # # # # # # # # # #
Fruit # # # # # # # # # #
Product # # # # # # # # # # #
Factory B # # # # # # # # # #
Fruit # # # # # # # # # #
Product # # # # # # # # # # #
Cashflow Summary
REVENUE CASHFLOW (USD)
Company A
Fruit
Company B
Fruit
Grand Total
PRODUCTION CASHFLOW (USD)
Company A
Fruit
Company B
Fruit
Grand Total
NET CASHFLOW
Purchased Volumes
OVERHEAD COSTS
Company A
Company B
NET EBITDA Cashflow

41
PRODUCTION BASED CASHFLOW
Company A
Revenue
Production Costs
Overhead Costs
Total Company A EBTIDA Cashflow
Company B
Revenue
Production Costs
Overhead Costs
Total company B EBTIDA Cashflow
TOTAL PRODUCTION CASHFLOW
Supporting Departments Overhead Costs
NET EBITDA Cashflow

42
Annex V - Budgeting stakeholders
On the tables below (table IX to XI) it is represented the contribution of each company, department
and manager on the budgeting process.
Table IX - Companies
Abbreviation Description
BRF Juice Factory in Brasil
GHF Juice Factory in Ghana
NLT Juice Trader in The Netherlands
NLS Logistics and Supply Chain in The
Netherlands
UKH Head Office in UK
Table X - Department managers
Company Abbreviati
on
Description
UKH COO Chief Operations Officer
UKH CFO Chief Financial Officer
NLT TSM Sales Manager
NLT TOM Operations Manager
NLS LSC Logistics and Supply Chain Manager
BRF PGM Production General Manager
BRF BPM Brasil Production Manager
BRF BFP Brasil Fruit Purchasing
GHF GPM Ghana Production Manager
GHF GFP Ghana Fruit Purchasing
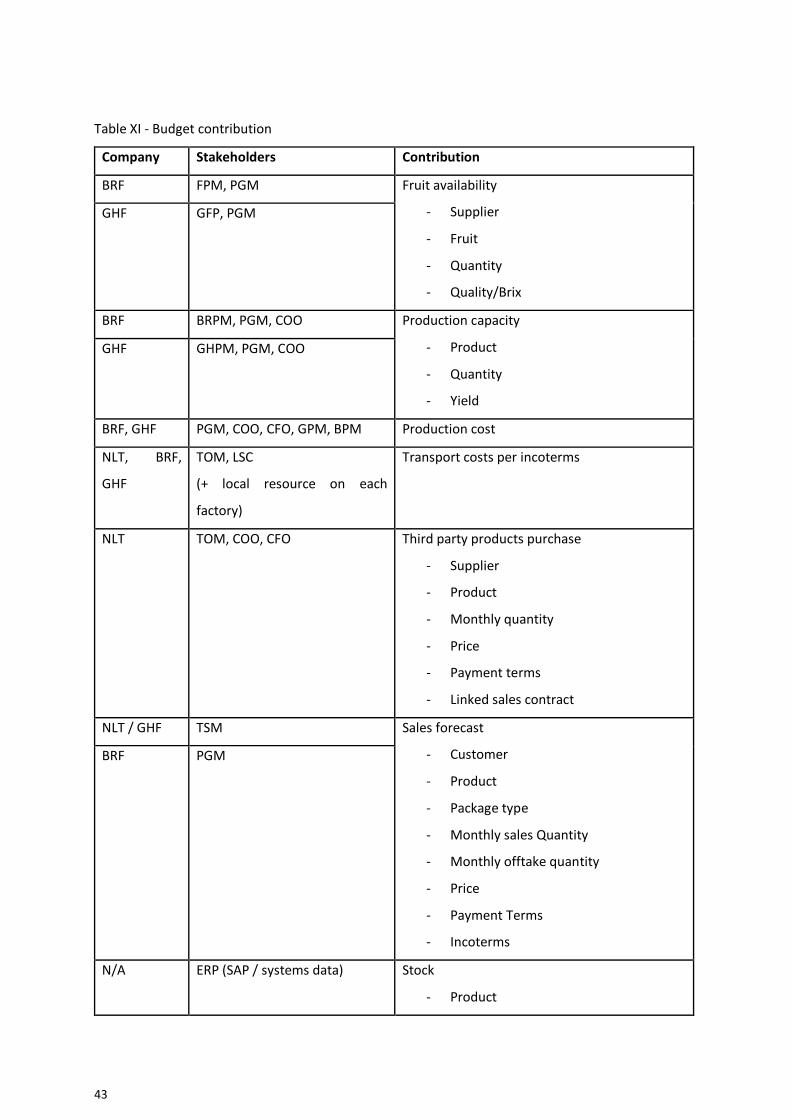
43
Table XI - Budget contribution
Company Stakeholders Contribution
BRF FPM, PGM Fruit availability
- Supplier
- Fruit
- Quantity
- Quality/Brix
GHF GFP, PGM
BRF BRPM, PGM, COO Production capacity
- Product
- Quantity
- Yield
GHF GHPM, PGM, COO
BRF, GHF PGM, COO, CFO, GPM, BPM Production cost
NLT, BRF,
GHF
TOM, LSC
(+ local resource on each
factory)
Transport costs per incoterms
NLT TOM, COO, CFO Third party products purchase
- Supplier
- Product
- Monthly quantity
- Price
- Payment terms
- Linked sales contract
NLT / GHF TSM Sales forecast
- Customer
- Product
- Package type
- Monthly sales Quantity
- Monthly offtake quantity
- Price
- Payment Terms
- Incoterms
BRF PGM
N/A ERP (SAP / systems data) Stock
- Product

44
- Current stock quantity
- Current stock allocation
- Current available product
ALL CFO, COO Overhead costs
- Monthly overhead costs per company
COO, CFO, TSM, TLM, PGM The final discussion where each budget line

45
Annex VI – Reward scheme data structure
Table XII – reward scheme data structure
Metric Comment
Sales $'m Sales as per Sales Plan
Margin Full year as per management accounts
Business Mix
Fruit A Full Year As per Group Sales Target
Fruit B Full Year As per Group Sales Target
Expenses
Staff Costs Staff cash cost per Management Accounts $'m
Remaining Operating Costs As per Management Accounts
EBITDA Full year EBITDA - $m
Quality Assurance
Quality Issues with Products
Quality Issues on products - customer complaints/credit
notes due to quality
Certification Successful implementation of certification
Projects, People and Sustainability
Project 1 Completion of the project
Project 2 Completion of the project