Methodology for effective operation of road management equipment
8
Methodology for effective operation of road management equipment Choong Heon Yang a,n , Amelia C. Regan b a Korea Institute of ConstructionTechnology, Ilsanseo-Gu, Goyang 411-712, South Korea b Department of Computer Science, University of California, Irvine, CA 92697, USA article info Keywords: Analytical hierarchy process Day-to-day road management operations Normalization Sensitivity analysis abstract This paper presents a methodology for effective operation of road management equipment. The primary goal of this research is to aid public agencies with day-to-day road management within limited financial resources. In order to demonstrate the value of this approach, we present a case study using data collected for 18 regional offices of the South Korean Ministry of Land, Transport and Maritime Affairs. Road agencies want to know whether they currently have sufficient equipment to handle work demands, but this is difficult to predict. Thus, a methodology was developed to employ historical data on road management equipment, and two evaluation indicators were identified. Using our method, equipment can be classified into four groups: (1) frequently used and important, (2) relatively less used and important, (3) barely used and low importance, and (4) frequently used and low importance. In our case study we show that these can be used by regional offices to determine either to lend or borrow among offices or to consider purchase for both long and short term use. While our study focuses on a specific case study, the overall methodology can easily be applied by similar decision makers in other countries. & 2013 Elsevier Ltd. All rights reserved. 1. Introduction Equipment for road management can be used for a wide variety of tasks and is typically assigned to a regular schedule of activities. Each piece of equipment has its own expected lifetime, but actual useful life varies based on the frequency of use and working conditions. This paper presents a methodology for effective operation of road management equipment. The main purpose of this research is to aid efficient road equipment management by public agencies who must work within a given budget. In order to demonstrate the value of this approach, a case study using data collected for 18 regional offices of the South Korean Ministry of Land, Transport and Maritime Affairs was examined. The types of equipment of interest in this case study are presented in Table 1. In the beginning of the 1960s, countrywide highway construc- tion in South Korea was given the first priority in transport planning. Through the end of the 1980s investment in national highway construction had increased markedly. As of March 2010, the total length of the national highways was approximately 13,812 km, and the national expressways had a total length of 3859 km (MLTM, 2010). Summing across all road classifications including special metropolitan city roads, metropolitan city roads, provincial roads, and city and county roads, the total length of South Korea's transportation network includes nearly 88,000 km. However, the road supply rate, which is based on the length per population, still remains in the lower ranks among OECD (the Organization for Economic Cooperation and Development) mem- bers. In addition, because of recent economic and political condi- tions, investment in road construction during the last five years has been insufficient to meet the growing demand for travel. However, during the same period investment in the repair and maintenance of the national highways has increased significantly. This increase is the result of a wide variety of factors including an aging infrastructure and the high expectations of drivers with respect to the roadway level of service (LOS). For example, an increase in civil complaints about road surface conditions, espe- cially during the winter season, led to changes in the way snow is typically removed in South Korea. Even though, from a road agency standpoint, solid deicing materials are considered reason- able, both with respect to cost and performance, the use of these materials is no longer allowed at roadway sections with relatively high travel speeds. Because drivers believe that solid deicers make the LOS worse, they complained to the road authorities. As an alternative, the use of liquid deicers was strongly encouraged to prevent road freezing from ice and snow cover. Regional offices of the Ministry of Land, Transport and Maritime Affairs in South Korea record operational histories and monitor the current condition of road management equipment. Road agencies want to know whether they currently have suffi- cient equipment to handle their expected workload, but they find it hard to predict based on available historical data. Our study considers 18 regional offices which are collectively charged with Contents lists available at ScienceDirect journal homepage: www.elsevier.com/locate/tranpol Transport Policy 0967-070X/$ - see front matter & 2013 Elsevier Ltd. All rights reserved. http://dx.doi.org/10.1016/j.tranpol.2013.09.008 n Corresponding author. Tel.: þ82 01120260772. E-mail address: [email protected] (C.H. Yang). Transport Policy 30 (2013) 199–206
-
Upload
independent -
Category
Documents
-
view
5 -
download
0
Transcript of Methodology for effective operation of road management equipment
Methodology for effective operation of road management equipment
Choong Heon Yang a,n, Amelia C. Regan b
a Korea Institute of Construction Technology, Ilsanseo-Gu, Goyang 411-712, South Koreab Department of Computer Science, University of California, Irvine, CA 92697, USA
a r t i c l e i n f o
Keywords:Analytical hierarchy processDay-to-day road management operationsNormalizationSensitivity analysis
a b s t r a c t
This paper presents a methodology for effective operation of road management equipment. The primarygoal of this research is to aid public agencies with day-to-day road management within limited financialresources. In order to demonstrate the value of this approach, we present a case study using datacollected for 18 regional offices of the South Korean Ministry of Land, Transport and Maritime Affairs.Road agencies want to know whether they currently have sufficient equipment to handle work demands,but this is difficult to predict. Thus, a methodology was developed to employ historical data on roadmanagement equipment, and two evaluation indicators were identified. Using our method, equipmentcan be classified into four groups: (1) frequently used and important, (2) relatively less used andimportant, (3) barely used and low importance, and (4) frequently used and low importance. In our casestudy we show that these can be used by regional offices to determine either to lend or borrow amongoffices or to consider purchase for both long and short term use. While our study focuses on a specificcase study, the overall methodology can easily be applied by similar decision makers in other countries.
& 2013 Elsevier Ltd. All rights reserved.
1. Introduction
Equipment for road management can be used for a wide varietyof tasks and is typically assigned to a regular schedule of activities.Each piece of equipment has its own expected lifetime, but actualuseful life varies based on the frequency of use and workingconditions. This paper presents a methodology for effectiveoperation of road management equipment. The main purpose ofthis research is to aid efficient road equipment management bypublic agencies who must work within a given budget. In order todemonstrate the value of this approach, a case study using datacollected for 18 regional offices of the South Korean Ministry ofLand, Transport and Maritime Affairs was examined. The types ofequipment of interest in this case study are presented in Table 1.
In the beginning of the 1960s, countrywide highway construc-tion in South Korea was given the first priority in transportplanning. Through the end of the 1980s investment in nationalhighway construction had increased markedly. As of March 2010,the total length of the national highways was approximately13,812 km, and the national expressways had a total length of3859 km (MLTM, 2010). Summing across all road classificationsincluding special metropolitan city roads, metropolitan city roads,provincial roads, and city and county roads, the total length ofSouth Korea's transportation network includes nearly 88,000 km.
However, the road supply rate, which is based on the length perpopulation, still remains in the lower ranks among OECD (theOrganization for Economic Cooperation and Development) mem-bers. In addition, because of recent economic and political condi-tions, investment in road construction during the last five yearshas been insufficient to meet the growing demand for travel.However, during the same period investment in the repair andmaintenance of the national highways has increased significantly.This increase is the result of a wide variety of factors including anaging infrastructure and the high expectations of drivers withrespect to the roadway level of service (LOS). For example, anincrease in civil complaints about road surface conditions, espe-cially during the winter season, led to changes in the way snow istypically removed in South Korea. Even though, from a roadagency standpoint, solid deicing materials are considered reason-able, both with respect to cost and performance, the use of thesematerials is no longer allowed at roadway sections with relativelyhigh travel speeds. Because drivers believe that solid deicers makethe LOS worse, they complained to the road authorities. As analternative, the use of liquid deicers was strongly encouraged toprevent road freezing from ice and snow cover.
Regional offices of the Ministry of Land, Transport andMaritime Affairs in South Korea record operational histories andmonitor the current condition of road management equipment.Road agencies want to know whether they currently have suffi-cient equipment to handle their expected workload, but theyfind it hard to predict based on available historical data. Our studyconsiders 18 regional offices which are collectively charged with
Contents lists available at ScienceDirect
journal homepage: www.elsevier.com/locate/tranpol
Transport Policy
0967-070X/$ - see front matter & 2013 Elsevier Ltd. All rights reserved.http://dx.doi.org/10.1016/j.tranpol.2013.09.008
n Corresponding author. Tel.: þ82 01120260772.E-mail address: [email protected] (C.H. Yang).
Transport Policy 30 (2013) 199–206
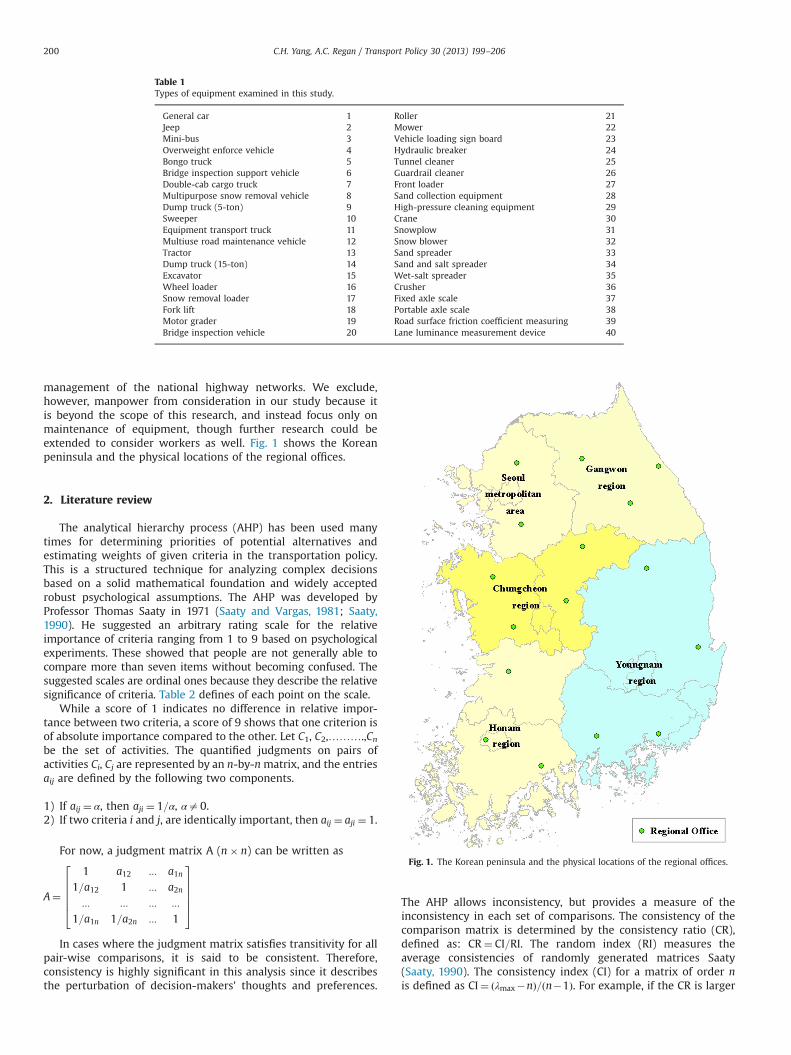
management of the national highway networks. We exclude,however, manpower from consideration in our study because itis beyond the scope of this research, and instead focus only onmaintenance of equipment, though further research could beextended to consider workers as well. Fig. 1 shows the Koreanpeninsula and the physical locations of the regional offices.
2. Literature review
The analytical hierarchy process (AHP) has been used manytimes for determining priorities of potential alternatives andestimating weights of given criteria in the transportation policy.This is a structured technique for analyzing complex decisionsbased on a solid mathematical foundation and widely acceptedrobust psychological assumptions. The AHP was developed byProfessor Thomas Saaty in 1971 (Saaty and Vargas, 1981; Saaty,1990). He suggested an arbitrary rating scale for the relativeimportance of criteria ranging from 1 to 9 based on psychologicalexperiments. These showed that people are not generally able tocompare more than seven items without becoming confused. Thesuggested scales are ordinal ones because they describe the relativesignificance of criteria. Table 2 defines of each point on the scale.
While a score of 1 indicates no difference in relative impor-tance between two criteria, a score of 9 shows that one criterion isof absolute importance compared to the other. Let C1, C2,……….,Cnbe the set of activities. The quantified judgments on pairs ofactivities Ci, Cj are represented by an n-by-nmatrix, and the entriesaij are defined by the following two components.
1) If aij ¼ α, then aji ¼ 1=α, αa0.2) If two criteria i and j, are identically important, then aij ¼ aji ¼ 1.
For now, a judgment matrix A (n� n) can be written as
A¼
1 a12 ::: a1n1=a12 1 ::: a2n::: ::: ::: :::
1=a1n 1=a2n ::: 1
266664
377775
In cases where the judgment matrix satisfies transitivity for allpair-wise comparisons, it is said to be consistent. Therefore,consistency is highly significant in this analysis since it describesthe perturbation of decision-makers' thoughts and preferences.
The AHP allows inconsistency, but provides a measure of theinconsistency in each set of comparisons. The consistency of thecomparison matrix is determined by the consistency ratio (CR),defined as: CR¼ CI=RI. The random index (RI) measures theaverage consistencies of randomly generated matrices Saaty(Saaty, 1990). The consistency index (CI) for a matrix of order nis defined as CI¼ ðλmax�nÞ=ðn�1Þ. For example, if the CR is larger
Table 1Types of equipment examined in this study.
General car 1 Roller 21Jeep 2 Mower 22Mini-bus 3 Vehicle loading sign board 23Overweight enforce vehicle 4 Hydraulic breaker 24Bongo truck 5 Tunnel cleaner 25Bridge inspection support vehicle 6 Guardrail cleaner 26Double-cab cargo truck 7 Front loader 27Multipurpose snow removal vehicle 8 Sand collection equipment 28Dump truck (5-ton) 9 High-pressure cleaning equipment 29Sweeper 10 Crane 30Equipment transport truck 11 Snowplow 31Multiuse road maintenance vehicle 12 Snow blower 32Tractor 13 Sand spreader 33Dump truck (15-ton) 14 Sand and salt spreader 34Excavator 15 Wet-salt spreader 35Wheel loader 16 Crusher 36Snow removal loader 17 Fixed axle scale 37Fork lift 18 Portable axle scale 38Motor grader 19 Road surface friction coefficient measuring 39Bridge inspection vehicle 20 Lane luminance measurement device 40
Fig. 1. The Korean peninsula and the physical locations of the regional offices.
C.H. Yang, A.C. Regan / Transport Policy 30 (2013) 199–206200
than 0.1, the comparison matrix is considered to have a highdegree of randomness. In that case, judgments may not be reliableand the matrix should be reconstructed. Otherwise, it can beconcluded that the generated matrices are consistent. For theassessment of consistency of the pair-wise comparison matrix, it iscustomary to use the matrix's eignvalues and its correspondingeigenvectors. A pair-wise comparison matrix of dimension n may haveas many as n eigenvalues, each with a corresponding set of eigenvec-tors. The largest eigenvalue is of particular interest, because it is moststable with respect to small perturbations in judgment. Thus,
Aw¼ λmaxw
where,
A A pair-wise comparison matrixW The eigenvector corresponding to the largest eigenvalueλmax The largest eigenvalue
In the study of Holguin-Veras (Holguin-Veras, 1995), the authorperformed a comparative examination of multi-criteria decisionanalysis methods by applying both the AHP and the multi-attribute value method. This was a case study involving theevaluation of the roadway system in the Dominican Republic.Three different alternatives such as climbing lanes, new two-laneroads, and new four-lane roads were considered for the project.The objective was to compare two models based on their theore-tical validity, practicality, and ability to reflect the decision-makerspreferences. Although he came to the conclusion that the decision-makers would not completely accept the results of either model,he felt that the results were favorable because of the insightsgained from the procedure. Kim and Vince conducted researchinvolving the prioritization of major highway capital investments(Kim and Vince, 2000). Generally, transportation agencies ordecision-makers examine and prioritize numerous transportationprojects at one time. To support this decision-making process, theauthors provided a model using AHP that can be used to prioritizea list of transportation projects. They point out that their earlierprioritization approach which was used by the Indiana Depart-ment of Transportation in the U.S. has several deficiencies, but thatthe proposed AHP method, based on a series of sensitivityanalyses, appeared to be sound. The AHP method improves theability to analyze multiple and conflicting priorities and allowsdecision-makers to integrate qualitative and quantitative aspectssimultaneously (Kirkwood, 1996; Bhushan and Rai, 2004; Sohn,2008; Tanadtang et al., 2005; Yang and Regan (2013)).
3. Methodology
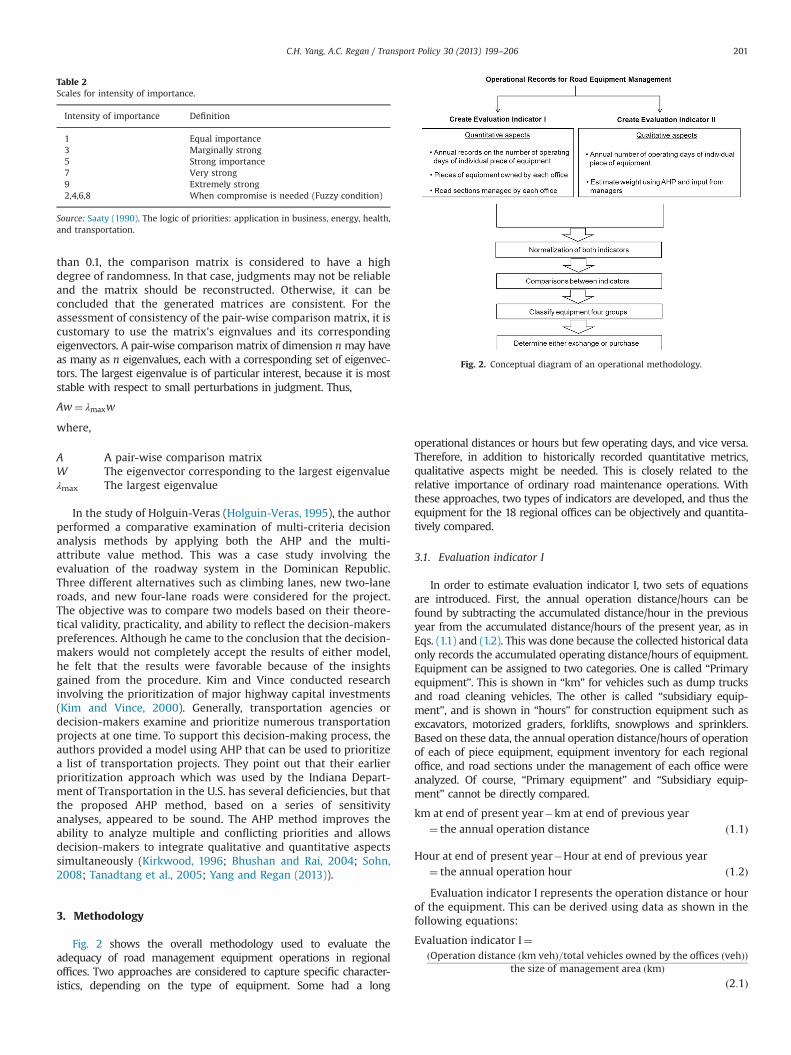
Fig. 2 shows the overall methodology used to evaluate theadequacy of road management equipment operations in regionaloffices. Two approaches are considered to capture specific character-istics, depending on the type of equipment. Some had a long
operational distances or hours but few operating days, and vice versa.Therefore, in addition to historically recorded quantitative metrics,qualitative aspects might be needed. This is closely related to therelative importance of ordinary road maintenance operations. Withthese approaches, two types of indicators are developed, and thus theequipment for the 18 regional offices can be objectively and quantita-tively compared.
3.1. Evaluation indicator I
In order to estimate evaluation indicator I, two sets of equationsare introduced. First, the annual operation distance/hours can befound by subtracting the accumulated distance/hour in the previousyear from the accumulated distance/hours of the present year, as inEqs. (1.1) and (1.2). This was done because the collected historical dataonly records the accumulated operating distance/hours of equipment.Equipment can be assigned to two categories. One is called “Primaryequipment”. This is shown in “km” for vehicles such as dump trucksand road cleaning vehicles. The other is called “subsidiary equip-ment”, and is shown in “hours” for construction equipment such asexcavators, motorized graders, forklifts, snowplows and sprinklers.Based on these data, the annual operation distance/hours of operationof each of piece equipment, equipment inventory for each regionaloffice, and road sections under the management of each office wereanalyzed. Of course, “Primary equipment” and “Subsidiary equip-ment” cannot be directly compared.
km at end of present year�km at end of previous year¼ the annual operation distance ð1:1Þ
Hour at end of present year�Hour at end of previous year¼ the annual operation hour ð1:2ÞEvaluation indicator I represents the operation distance or hour
of the equipment. This can be derived using data as shown in thefollowing equations:
Evaluation indicator I¼ðOperation distance ðkm vehÞ=total vehicles owned by the offices ðvehÞÞ
the size of management area ðkmÞð2:1Þ
Table 2Scales for intensity of importance.
Intensity of importance Definition
1 Equal importance3 Marginally strong5 Strong importance7 Very strong9 Extremely strong2,4,6,8 When compromise is needed (Fuzzy condition)
Source: Saaty (1990). The logic of priorities: application in business, energy, health,and transportation.
Fig. 2. Conceptual diagram of an operational methodology.
C.H. Yang, A.C. Regan / Transport Policy 30 (2013) 199–206 201
Evaluation indicator I¼ðOperation hours ðveh hrÞ=vehicles owned by the officesðvehÞÞ
the total annual operation hours ðhrÞð2:2Þ
3.2. Evaluation indicator II
Unlike the annual operating distance, the number of operatingdays is recorded as “days”. The AHP is used for this analysis, andthus weights based on the different types of work are estimated.These estimated weights are quantified based on the officemanager's perception of the significance of management tasksthat are considered very meaningful. Following this, the operationratio is calculated based on the annual number of operating daysfor each type of equipment as shown in the following equation:
Operation ratio¼the number of operating days for each type of equipmenttotal number of operating days of a certain euipment
ð3Þ
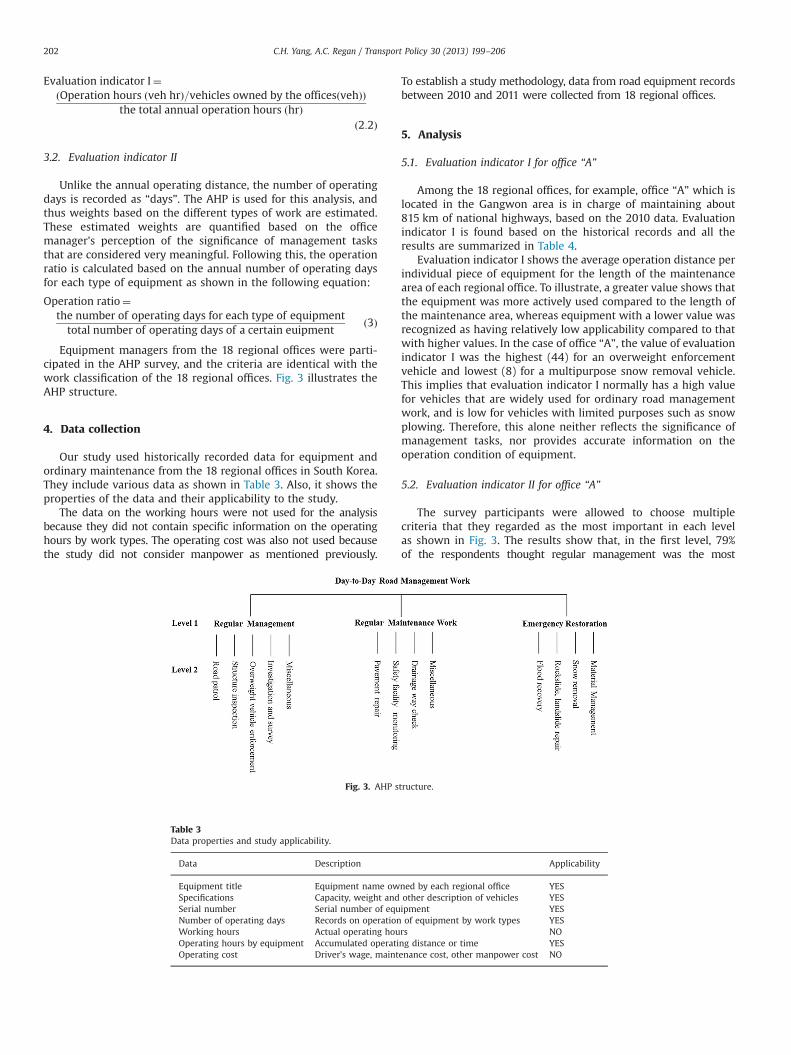
Equipment managers from the 18 regional offices were parti-cipated in the AHP survey, and the criteria are identical with thework classification of the 18 regional offices. Fig. 3 illustrates theAHP structure.
4. Data collection
Our study used historically recorded data for equipment andordinary maintenance from the 18 regional offices in South Korea.They include various data as shown in Table 3. Also, it shows theproperties of the data and their applicability to the study.
The data on the working hours were not used for the analysisbecause they did not contain specific information on the operatinghours by work types. The operating cost was also not used becausethe study did not consider manpower as mentioned previously.
To establish a study methodology, data from road equipment recordsbetween 2010 and 2011 were collected from 18 regional offices.
5. Analysis
5.1. Evaluation indicator I for office “A”
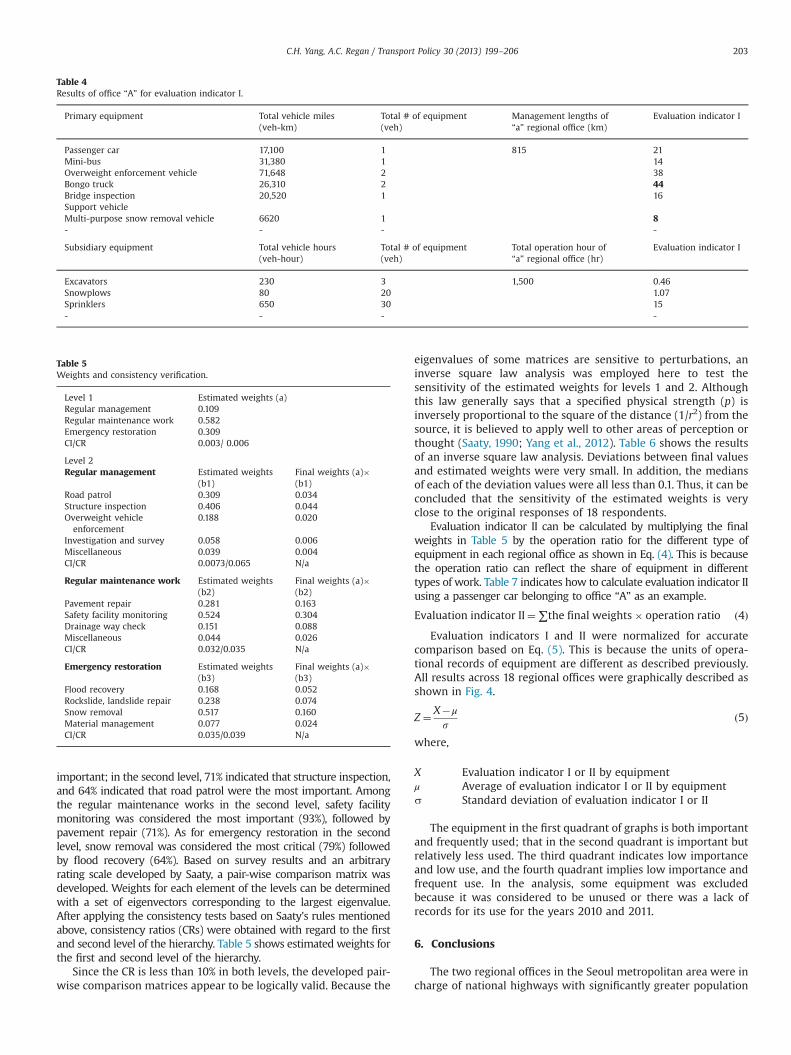
Among the 18 regional offices, for example, office “A” which islocated in the Gangwon area is in charge of maintaining about815 km of national highways, based on the 2010 data. Evaluationindicator I is found based on the historical records and all theresults are summarized in Table 4.
Evaluation indicator I shows the average operation distance perindividual piece of equipment for the length of the maintenancearea of each regional office. To illustrate, a greater value shows thatthe equipment was more actively used compared to the length ofthe maintenance area, whereas equipment with a lower value wasrecognized as having relatively low applicability compared to thatwith higher values. In the case of office “A”, the value of evaluationindicator I was the highest (44) for an overweight enforcementvehicle and lowest (8) for a multipurpose snow removal vehicle.This implies that evaluation indicator I normally has a high valuefor vehicles that are widely used for ordinary road managementwork, and is low for vehicles with limited purposes such as snowplowing. Therefore, this alone neither reflects the significance ofmanagement tasks, nor provides accurate information on theoperation condition of equipment.
5.2. Evaluation indicator II for office “A”
The survey participants were allowed to choose multiplecriteria that they regarded as the most important in each levelas shown in Fig. 3. The results show that, in the first level, 79%of the respondents thought regular management was the most
Fig. 3. AHP structure.
Table 3Data properties and study applicability.
Data Description Applicability
Equipment title Equipment name owned by each regional office YESSpecifications Capacity, weight and other description of vehicles YESSerial number Serial number of equipment YESNumber of operating days Records on operation of equipment by work types YESWorking hours Actual operating hours NOOperating hours by equipment Accumulated operating distance or time YESOperating cost Driver's wage, maintenance cost, other manpower cost NO
C.H. Yang, A.C. Regan / Transport Policy 30 (2013) 199–206202
important; in the second level, 71% indicated that structure inspection,and 64% indicated that road patrol were the most important. Amongthe regular maintenance works in the second level, safety facilitymonitoring was considered the most important (93%), followed bypavement repair (71%). As for emergency restoration in the secondlevel, snow removal was considered the most critical (79%) followedby flood recovery (64%). Based on survey results and an arbitraryrating scale developed by Saaty, a pair-wise comparison matrix wasdeveloped. Weights for each element of the levels can be determinedwith a set of eigenvectors corresponding to the largest eigenvalue.After applying the consistency tests based on Saaty's rules mentionedabove, consistency ratios (CRs) were obtained with regard to the firstand second level of the hierarchy. Table 5 shows estimated weights forthe first and second level of the hierarchy.
Since the CR is less than 10% in both levels, the developed pair-wise comparison matrices appear to be logically valid. Because the
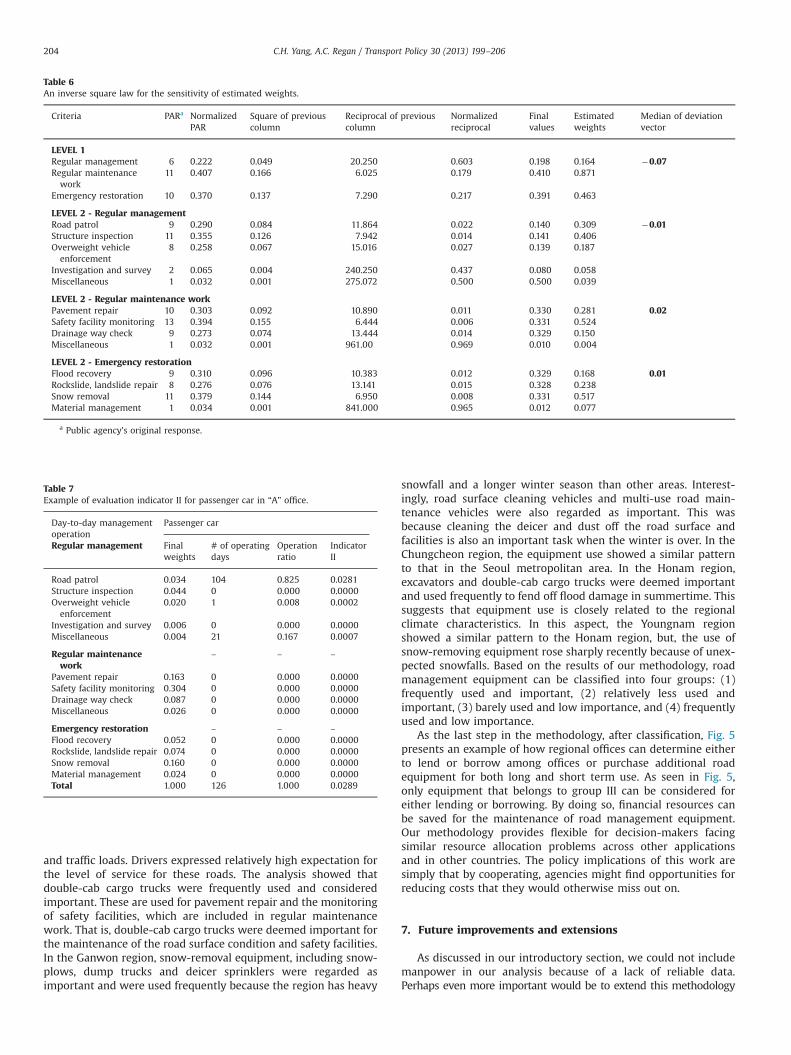
eigenvalues of some matrices are sensitive to perturbations, aninverse square law analysis was employed here to test thesensitivity of the estimated weights for levels 1 and 2. Althoughthis law generally says that a specified physical strength (p) isinversely proportional to the square of the distance (1/r2) from thesource, it is believed to apply well to other areas of perception orthought (Saaty, 1990; Yang et al., 2012). Table 6 shows the resultsof an inverse square law analysis. Deviations between final valuesand estimated weights were very small. In addition, the mediansof each of the deviation values were all less than 0.1. Thus, it can beconcluded that the sensitivity of the estimated weights is veryclose to the original responses of 18 respondents.
Evaluation indicator II can be calculated by multiplying the finalweights in Table 5 by the operation ratio for the different type ofequipment in each regional office as shown in Eq. (4). This is becausethe operation ratio can reflect the share of equipment in differenttypes of work. Table 7 indicates how to calculate evaluation indicator IIusing a passenger car belonging to office “A” as an example.
Evaluation indicator II¼∑the final weights� operation ratio ð4ÞEvaluation indicators I and II were normalized for accurate
comparison based on Eq. (5). This is because the units of opera-tional records of equipment are different as described previously.All results across 18 regional offices were graphically described asshown in Fig. 4.
Z ¼ X�μ
sð5Þ
where,
X Evaluation indicator I or II by equipmentμ Average of evaluation indicator I or II by equipments Standard deviation of evaluation indicator I or II
The equipment in the first quadrant of graphs is both importantand frequently used; that in the second quadrant is important butrelatively less used. The third quadrant indicates low importanceand low use, and the fourth quadrant implies low importance andfrequent use. In the analysis, some equipment was excludedbecause it was considered to be unused or there was a lack ofrecords for its use for the years 2010 and 2011.
6. Conclusions
The two regional offices in the Seoul metropolitan area were incharge of national highways with significantly greater population
Table 4Results of office “A” for evaluation indicator I.
Primary equipment Total vehicle miles(veh-km)
Total # of equipment(veh)
Management lengths of“a” regional office (km)
Evaluation indicator I
Passenger car 17,100 1 815 21Mini-bus 31,380 1 14Overweight enforcement vehicle 71,648 2 38Bongo truck 26,310 2 44Bridge inspection 20,520 1 16Support vehicleMulti-purpose snow removal vehicle 6620 1 8- - - -
Subsidiary equipment Total vehicle hours(veh-hour)
Total # of equipment(veh)
Total operation hour of“a” regional office (hr)
Evaluation indicator I
Excavators 230 3 1,500 0.46Snowplows 80 20 1.07Sprinklers 650 30 15- - - -
Table 5Weights and consistency verification.
Level 1 Estimated weights (a)Regular management 0.109Regular maintenance work 0.582Emergency restoration 0.309CI/CR 0.003/ 0.006
Level 2Regular management Estimated weights
(b1)Final weights (a)�(b1)
Road patrol 0.309 0.034Structure inspection 0.406 0.044Overweight vehicleenforcement
0.188 0.020
Investigation and survey 0.058 0.006Miscellaneous 0.039 0.004CI/CR 0.0073/0.065 N/a
Regular maintenance work Estimated weights(b2)
Final weights (a)�(b2)
Pavement repair 0.281 0.163Safety facility monitoring 0.524 0.304Drainage way check 0.151 0.088Miscellaneous 0.044 0.026CI/CR 0.032/0.035 N/a
Emergency restoration Estimated weights(b3)
Final weights (a)�(b3)
Flood recovery 0.168 0.052Rockslide, landslide repair 0.238 0.074Snow removal 0.517 0.160Material management 0.077 0.024CI/CR 0.035/0.039 N/a
C.H. Yang, A.C. Regan / Transport Policy 30 (2013) 199–206 203
and traffic loads. Drivers expressed relatively high expectation forthe level of service for these roads. The analysis showed thatdouble-cab cargo trucks were frequently used and consideredimportant. These are used for pavement repair and the monitoringof safety facilities, which are included in regular maintenancework. That is, double-cab cargo trucks were deemed important forthe maintenance of the road surface condition and safety facilities.In the Ganwon region, snow-removal equipment, including snow-plows, dump trucks and deicer sprinklers were regarded asimportant and were used frequently because the region has heavy
snowfall and a longer winter season than other areas. Interest-ingly, road surface cleaning vehicles and multi-use road main-tenance vehicles were also regarded as important. This wasbecause cleaning the deicer and dust off the road surface andfacilities is also an important task when the winter is over. In theChungcheon region, the equipment use showed a similar patternto that in the Seoul metropolitan area. In the Honam region,excavators and double-cab cargo trucks were deemed importantand used frequently to fend off flood damage in summertime. Thissuggests that equipment use is closely related to the regionalclimate characteristics. In this aspect, the Youngnam regionshowed a similar pattern to the Honam region, but, the use ofsnow-removing equipment rose sharply recently because of unex-pected snowfalls. Based on the results of our methodology, roadmanagement equipment can be classified into four groups: (1)frequently used and important, (2) relatively less used andimportant, (3) barely used and low importance, and (4) frequentlyused and low importance.
As the last step in the methodology, after classification, Fig. 5presents an example of how regional offices can determine eitherto lend or borrow among offices or purchase additional roadequipment for both long and short term use. As seen in Fig. 5,only equipment that belongs to group III can be considered foreither lending or borrowing. By doing so, financial resources canbe saved for the maintenance of road management equipment.Our methodology provides flexible for decision-makers facingsimilar resource allocation problems across other applicationsand in other countries. The policy implications of this work aresimply that by cooperating, agencies might find opportunities forreducing costs that they would otherwise miss out on.
7. Future improvements and extensions
As discussed in our introductory section, we could not includemanpower in our analysis because of a lack of reliable data.Perhaps even more important would be to extend this methodology
Table 6An inverse square law for the sensitivity of estimated weights.
Criteria PARa NormalizedPAR
Square of previouscolumn
Reciprocal of previouscolumn
Normalizedreciprocal
Finalvalues
Estimatedweights
Median of deviationvector
LEVEL 1Regular management 6 0.222 0.049 20.250 0.603 0.198 0.164 �0.07Regular maintenancework
11 0.407 0.166 6.025 0.179 0.410 0.871
Emergency restoration 10 0.370 0.137 7.290 0.217 0.391 0.463
LEVEL 2 - Regular managementRoad patrol 9 0.290 0.084 11.864 0.022 0.140 0.309 �0.01Structure inspection 11 0.355 0.126 7.942 0.014 0.141 0.406Overweight vehicleenforcement
8 0.258 0.067 15.016 0.027 0.139 0.187
Investigation and survey 2 0.065 0.004 240.250 0.437 0.080 0.058Miscellaneous 1 0.032 0.001 275.072 0.500 0.500 0.039
LEVEL 2 - Regular maintenance workPavement repair 10 0.303 0.092 10.890 0.011 0.330 0.281 0.02Safety facility monitoring 13 0.394 0.155 6.444 0.006 0.331 0.524Drainage way check 9 0.273 0.074 13.444 0.014 0.329 0.150Miscellaneous 1 0.032 0.001 961.00 0.969 0.010 0.004
LEVEL 2 - Emergency restorationFlood recovery 9 0.310 0.096 10.383 0.012 0.329 0.168 0.01Rockslide, landslide repair 8 0.276 0.076 13.141 0.015 0.328 0.238Snow removal 11 0.379 0.144 6.950 0.008 0.331 0.517Material management 1 0.034 0.001 841.000 0.965 0.012 0.077
a Public agency's original response.
Table 7Example of evaluation indicator II for passenger car in “A” office.
Day-to-day managementoperation
Passenger car
Regular management Finalweights
# of operatingdays
Operationratio
IndicatorII
Road patrol 0.034 104 0.825 0.0281Structure inspection 0.044 0 0.000 0.0000Overweight vehicleenforcement
0.020 1 0.008 0.0002
Investigation and survey 0.006 0 0.000 0.0000Miscellaneous 0.004 21 0.167 0.0007
Regular maintenancework
– – –
Pavement repair 0.163 0 0.000 0.0000Safety facility monitoring 0.304 0 0.000 0.0000Drainage way check 0.087 0 0.000 0.0000Miscellaneous 0.026 0 0.000 0.0000
Emergency restoration – – –
Flood recovery 0.052 0 0.000 0.0000Rockslide, landslide repair 0.074 0 0.000 0.0000Snow removal 0.160 0 0.000 0.0000Material management 0.024 0 0.000 0.0000Total 1.000 126 1.000 0.0289
C.H. Yang, A.C. Regan / Transport Policy 30 (2013) 199–206204
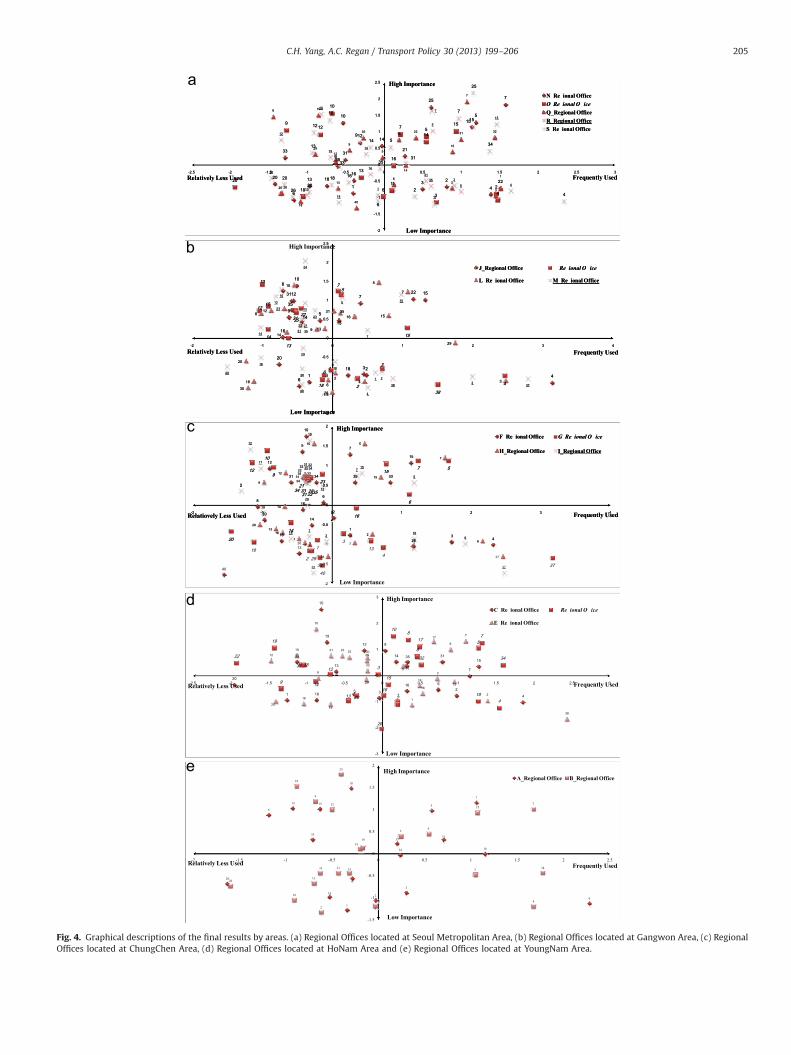
Fig. 4. Graphical descriptions of the final results by areas. (a) Regional Offices located at Seoul Metropolitan Area, (b) Regional Offices located at Gangwon Area, (c) RegionalOffices located at ChungChen Area, (d) Regional Offices located at HoNam Area and (e) Regional Offices located at YoungNam Area.
C.H. Yang, A.C. Regan / Transport Policy 30 (2013) 199–206 205

to provide an estimate of the cost savings possible form sharing under-used equipment and possible by delaying purchases of equipment asthe result of this analysis. We are working with appropriate govern-ment agencies to see if such data could be obtained in the future,though it is not available in a useful capacity at this time. Finally, weshould point out that the fact that there is no way to distinguish inthe database between miles (or hours) accumulated during shortand long trips, lending decisions must be carefully examined byoperations managers so that indispensable equipment is notmistaken for that which could be easily lent out. Agencies wishingto adopt this or related tools for future use could work to changereporting requirements so that the tools would be even moreuseful in the future.
References
Bhushan, N., Rai, K., 2004. Strategic Decision Making: Applying the AnalyticalHierarchy Process. Springer, Berlin.
Holguin-Veras, J., 1995. Comparative assessment of AHP and MAV in highwayplanning: case study. Journal of Transportation Engineering 121 (2), 191–200.
Kim, K., Vince, B., 2000. Application of an analytical hierarchy process at the IndianaDepartment of Transportation for prioritizing major highway capital invest-ments. In: Proceedings of the 7th TRB Conference on the Application ofTransportation Planning Methods, vol. 9, pp. 266–278.
Kirkwood, C.W., 1996. Strategic Decision Making: Multiobjective Decision Analysiswith Spreadsheets. Brooks/ Cole Cengage learning. Duxbury Press, PacificGrove.
Saaty, T., Vargas, L., 1981. The Logic of Priorities: Application in Business, Energy,Health, and Transportation. Springer-Verlag, New York.
Saaty, T., 1990. Multicriteria Decision MakingThe Analytical Hierarchy Process—Planning, Priority Setting, Resource Allocation, vol. 1. University of Pittsburgh,Pittsburgh.
Sohn, K., 2008. A systematic decision criterion for the elimination of uselessoverpasses. Transportation Research Part A 42 (8), 1043–1055.
Tanadtang, P., Park, D., Hanaoka, S., 2005. Incorporating uncertain and incompletesubjective judgments into the evaluation procedure of transportation demandmanagement alternatives. Transportation 32 (6), 603–626.
MLTM, 2010. Yearbook of Road Statistics in South Korea.Yang, C., Regan, A., 2013. A Multi-Criteria Decision Support Methodology
for Implementing Truck Operation Strategies. Transportation 40 (3), 2013,713–728.
Group IFrequently used & importance
Division
Consider purchase
Group IIRelatively less used & important
Group IIIBarely used & low importance
Group IVFrequently used and low importance
Office “A” Office “B”
Mini-Bus, Bongo Truck, Bridge Inspectition Vehicle, Double-Cap
Cargo Truck, Snow Removal Loader
General Car, Dump Truck (5-ton),Dump Truck (15-ton), Tractor
Multi-purpose Snow Removal Vehicle,
Jeep, Overweight enforce truck
Fork Lift, Motor Grader, Excavator,Roller, Mower
Mini-Bus, General Car,Overweight enforce truck, Mower
Dump Truck , Motor Grader, Jeep
Tractor, Multi-purpose Snow Removal Vehicle, Double-Cap Cargo
Truck, Roller
Bongo Truck, Bridge Inspection Vehicle
Encourageexchange
Fig. 5. A simple example applying the methodology.
C.H. Yang, A.C. Regan / Transport Policy 30 (2013) 199–206206