Methodological issues in forestry mitigation projects: a case study of Kolar district
43
eScholarship provides open access, scholarly publishing services to the University of California and delivers a dynamic research platform to scholars worldwide. Lawrence Berkeley National Laboratory Peer Reviewed Title: Methodological Issues In Forestry Mitigation Projects: A Case Study Of Kolar District Author: Ravindranath, N.H. Murthy, I.K. Sudha, P. Ramprasad, V. Nagendra, M.D.V. Sahana, C.A. Srivathsa, K.G. Khan, H. Publication Date: 04-28-2008 Publication Info: Lawrence Berkeley National Laboratory Permalink: http://escholarship.org/uc/item/1925g3t5 Keywords: mitigation project baseline carbon stock change leakage transaction cost biodiversity Abstract: There is a need to assess climate change mitigation opportunities in forest sector in India in the context of methodological issues such as additionality, permanence, leakage, measurement and baseline development in formulating forestry mitigation projects. A case study of forestry mitigation project in semi-arid community grazing lands and farmlands in Kolar district of Karnataka, was undertaken with regard to baseline and project scenariodevelopment, estimation of carbon stock change in the project, leakage estimation and assessment of cost-effectiveness of mitigation projects. Further, the transaction costs to develop project, and environmental and socio-economic impact of mitigation project was assessed.The study shows the feasibility of establishing baselines and project C-stock changes. Since the area has low or insignificant biomass, leakage is not an issue. The overall mitigation potential in Kolar for a total area of 14,000 ha under various mitigation options is 278,380 tC at a rate of 20 tC/ha for the period 2005-2035, which is approximately 0.67 tC/ha/yr inclusive of harvest regimes under short rotation and long rotation mitigation options. The transaction cost for baseline establishment is less than a rupee/tC and for project scenario development is about Rs. 1.5-3.75/tC. The project enhances biodiversity and the socio-economic impact is also significant.
-
Upload
msuabaroda -
Category
Documents
-
view
0 -
download
0
Transcript of Methodological issues in forestry mitigation projects: a case study of Kolar district

eScholarship provides open access, scholarly publishingservices to the University of California and delivers a dynamicresearch platform to scholars worldwide.
Lawrence Berkeley National Laboratory
Peer Reviewed
Title:Methodological Issues In Forestry Mitigation Projects: A Case Study Of Kolar District
Author:Ravindranath, N.H.Murthy, I.K.Sudha, P.Ramprasad, V.Nagendra, M.D.V.Sahana, C.A.Srivathsa, K.G.Khan, H.
Publication Date:04-28-2008
Publication Info:Lawrence Berkeley National Laboratory
Permalink:http://escholarship.org/uc/item/1925g3t5
Keywords:mitigation project baseline carbon stock change leakage transaction cost biodiversity
Abstract:There is a need to assess climate change mitigation opportunities in forest sector in India in thecontext of methodological issues such as additionality, permanence, leakage, measurement andbaseline development in formulating forestry mitigation projects. A case study of forestry mitigationproject in semi-arid community grazing lands and farmlands in Kolar district of Karnataka, wasundertaken with regard to baseline and project scenariodevelopment, estimation of carbon stockchange in the project, leakage estimation and assessment of cost-effectiveness of mitigationprojects. Further, the transaction costs to develop project, and environmental and socio-economicimpact of mitigation project was assessed.The study shows the feasibility of establishing baselinesand project C-stock changes. Since the area has low or insignificant biomass, leakage is not anissue. The overall mitigation potential in Kolar for a total area of 14,000 ha under various mitigationoptions is 278,380 tC at a rate of 20 tC/ha for the period 2005-2035, which is approximately 0.67tC/ha/yr inclusive of harvest regimes under short rotation and long rotation mitigation options.The transaction cost for baseline establishment is less than a rupee/tC and for project scenariodevelopment is about Rs. 1.5-3.75/tC. The project enhances biodiversity and the socio-economicimpact is also significant.

LBNL-61459
Methodological Issues In Forestry Mitigation Projects
A Case Study Of Kolar District
Ravindranath N H*., Murthy I. K., Sudha, P., Ramprasad V., Nagendra, M.D.V., Sahana, C.A., Srivathsa,
K.G. And Khan, H.
Centre for Sustainable Technologies & Centre for Ecological Sciences
Indian Institute of Science, Bangalore
*Corresponding author: Phone: 91- 80 - 2360 1455 (D) - CES: 91 - 80 - 2334 1838, 91-80-293 3016 - CST: Fax; 91-
80- 2360 1428, 91- 80 - 2360 0683: Email: [email protected]
Abstract. There is a need to assess climate change mitigation opportunities in forest sector in India in the context of
methodological issues such as additionality, permanence, leakage, measurement and baseline development in
formulating forestry mitigation projects. A case study of forestry mitigation project in semi-arid community grazing
lands and farmlands in Kolar district of Karnataka, was undertaken with regard to baseline and project scenario
development, estimation of carbon stock change in the project, leakage estimation and assessment of cost-effectiveness
of mitigation projects. Further, the transaction costs to develop project, and environmental and socio-economic impact
of mitigation project was assessed.
The study shows the feasibility of establishing baselines and project C-stock changes. Since the area has low
or insignificant biomass, leakage is not an issue. The overall mitigation potential in Kolar for a total area of 14,000 ha
under various mitigation options is 278,380 tC at a rate of 20 tC/ha for the period 2005-2035, which is approximately
0.67 tC/ha/yr inclusive of harvest regimes under short rotation and long rotation mitigation options. The transaction
cost for baseline establishment is less than a rupee/tC and for project scenario development is about Rs. 1.5-3.75/tC.
The project enhances biodiversity and the socio-economic impact is also significant.
Keywords. mitigation project, baseline, carbon stock change, leakage, transaction cost, biodiversity
1. Introduction
The forest sector is unique, in that it contributes significantly to global CO2 emissions and also
provides significant opportunities to not only reduce the current or projected emissions but also to
remove CO2 accumulated from past emissions in the atmosphere, and sequester it in soil,
vegetation and wood products. In the global effort to stabilize CO2 concentration in the

atmosphere, forest sector is expected to play a critical role. Several attempts have been made to
estimate the mitigation potential in developing countries and the potential is shown to be large
(Sathaye and Ravindranath, 1998). An earlier study for India by Ravindranath and Somashekar
(1995) showed the mitigation potential to be in the range of 23 to 175 MtC annually. According
to another study by Ravindranath et al. (2001), under the sustainable forestry scenario, an
additional carbon stock of 237 MtC could be sequestered and in the commercial forestry scenario,
after meeting the incremental biomass demands, an additional carbon stock of 78 MtC would be
sequestered over a 12-year period.
• Develop case study of a forestry mitigation project
• Develop baseline for community forestry and farm forestry projects
• Estimate mitigation potential and cost-effectiveness using PROCOMAP model
• Assess contentious issues such as additionality, leakage and permanence for community and farm forestry
projects
• Estimate the transaction cost of developing a baseline and developing a project case study
• Assess the socio-economic and environmental impacts of community forestry and farm forestry project
activities.
2. The Study Area
The Kolar district is located in southern plains of Karnataka, India. It lies between 770 21' to 780
35' East longitude and 120 46' to 130 58' North latitude. The district extends over an area of 7,794
sq. km and has a total population of 3.52 million, with forests accounting for about 9% of the
total geographic area. The area under wastelands (or degraded lands) in the district is almost as
much as the area under forests and is about 63,000 ha. Rainfed area and crops dominate the
agricultural sector in the district. The forest type of the district according to Champion and Seth
(1935) is southern tropical dry deciduous and thorn scrub. The dominant species include
Anogeissus latifolia, Terminalia tomentosa, Chloroxylon swietinia, etc. Bagepalli and
Gauribidanur administrative block or forest range were selected for the study.

2.1. Past And Current Land Use Pattern
Bagepalli forest range with a geographic area of 90,009 ha and 7,498 ha under wastelands was
selected for exploring the potential for community forestry. (Table 1). Gauribidanur range with a
geographic area of 86,727 ha was selected for exploring the potential for farm forestry option. In
Bagepalli and Gauribidanur, the area under wasteland and forests has remained constant and the
net sown area has decreased over the period 1988-89 to 2001-02 (Table 1).
TABLE 1:
Current and past land use pattern (in ha) in Bagepalli and Gauribidanur forest range for the period
1988-89 to 2001-02.
PLACE TABLE 1 HERE
2.2 Afforestation And Reforestation Rates – Past And Projected
It is necessary to take into consideration the past, current and projected rates of A&R for
projecting the “business as usual” or baseline scenario. The feasible area available and the
technical potential for community forestry project activities in Bagepalli range was estimated
based on secondary data, from Forest Department records and working plans regarding the past,
current and likely future land use and afforestation rates in the region. The rate of afforestation
was about 480 ha/year during the period 1995-2003 (Table 2). It is proposed that about 400 ha per
year will be afforested during the next decade. Thus by 2012, about 5000 ha of degraded
forestland can still be available for afforestation.
The technical potential for implementing farm forestry activities in Gauribidanur is
similarly estimated considering past rates of farm forestry activities. The area afforested on farms
in the past 10 years was estimated through household survey using questionnaire method. Further,
Forest Department records were consulted to estimate the seedlings distributed for farm forestry
on private farms and community grazing land, which was converted to area (at 11 seedlings/ha),
based on field studies.
TABLE 2:

Rate of afforestation – past and projected on degraded forestland (ha) in Bagepalli.
PLACE TABLE 2 HERE
The average area brought under farm forestry per annum in the district over the period
1998 to 2003 is about 3400 ha. However, over 25,000 ha is yet to be covered and available for
farm forestry in the region (Table 3). Further, the interest of the farmers in the region in
promoting farm forestry is evident from the large area brought under farm forestry.
TABLE 3:
Farm forestry in Gauribidanur.
PLACE TABLE 3 HERE
The total area considered for community forestry option in Bagepalli is 8,625 ha
(degraded forest + community grazing land) and for the farm forestry option, the area considered
is 5,380 ha of agricultural land.
3. Baseline Scenario Development
Under the Climate Convention, “the baseline for project activity is the scenario that reasonably
represents anthropogenic emissions by sources of GHGs and removal by sinks that would occur
in the absence of the proposed project activity”. The first step in determining a project’s
additional GHG benefits (additionality) is development of a ‘without- project’ baseline scenario
against which changes in carbon stocks occurring in a project area over different time periods say
5, 10 and 20 years can be compared.
The following steps were adopted to project the baseline carbon stocks in the land
categories proposed for project.
• Define land use systems and their tenurial status
• Define the project boundary and prepare a map
• Select carbon pools and define methods for measurement
• Develop sampling design and strategy for biomass and soil carbon estimation
• Lay plots in different land use systems and measure identified parameters

• Analyze data for aboveground biomass (AGB) carbon stock, below ground biomass and
soil carbon
• Assess past and current A&R rates Project future land use and estimate potential area for
the project activities
• Estimate carbon stocks using area and per ha carbon stock data, for the project area.
3.1 Project Area And Legal Status
Community grazing land under the control of Forest Department and degraded forestlands under
the jurisdiction of revenue department were considered for A&R under community forestry
option. Communities access these land categories for grazing and fuelwood requirements. The
cropland considered for farm forestry belongs to farmers under private ownership.
3.2 Project Boundary
The project boundary needs to encompass all anthropogenic emissions by sources of GHGs and
removals by sinks under the control of the project participants that are significant and reasonably
attributable to the project activity. The project area consists of geographic domain with more than
one discrete area of land, within which GHG emissions or removals and other attributes of a
project are to be estimated and monitored.
In the case of community forestry, the discrete blocks of degraded lands (community
grazing lands) in cluster of villages in Bagepalli block can be considered as the project boundary.
Boundary for farm forestry is a cluster of farms (for plantation) in Gauribidanur.
3.3 Carbon Pools To Be Monitored
Reporting of changes in the stocks of five C-pools; Aboveground Biomass (AGB), Below Ground
Biomass (BGB), litter, dead wood and Soil Organic Carbon (SOC) is desirable. For the present
study, AGB, BGB, SOC and woody litter pools were selected for estimating carbon stock
changes, since dead wood doesn’t exist.
3.4 Sampling Strategy For Baseline

Aboveground biomass: This dominant carbon pool is estimated through the most commonly
used plot method. Quadrats were laid and all trees >1.5 m in height or >5 cm DBH (Diameter at
Breast Height) were enumerated. In each tree plot, smaller plots were demarcated to enumerate
shrubs and regenerating seedlings and record the species name, height and DBH (130 cm above
ground) of each tree or sapling or shrub.
The selection of 4 replicates of 50 x 50 m plots for sampling and measurement under
baseline is based on stratified random sampling procedure, avoiding bias. Sampling on farmlands
involved enumeration of all trees on individual farms i.e., whole farms. Sampling strategy for
farm forestry involved randomly selected 10 farms, out of which 5 were small (< 2ha) and 5 were
large (>2 ha).
The field data was compiled and basal area estimated using DBH and height data.
Species-specific or generic volume equations from FSI reports (1996) were used to convert DBH
and height into volume (m3/ha). The biomass estimate was obtained by using the density values
of wood and the carbon value by using 0.45 of biomass as carbon content.
Below ground biomass: A default conversion factor of 0.26 of aboveground biomass
was used to calculate the below ground biomass (IPCC, 2003).
Woody litter: The plots laid for shrub enumeration were used for estimating standing
woody litter. All the woody litter was collected from these quadrats and fresh weight as well as
dry weight estimated on per ha basis.
Soil carbon: To estimate soil organic carbon, soil samples at a depth of 0-30 cm was
collected. Bulk density and soil organic carbon content was estimated in the laboratory using the
Walkley Black method. Soil samples from tree plots in scrub, blanks and crop fields representing
baseline scenario were collected. A composite soil sample from multiple soil samples was
prepared for different land categories.

4. Project Scenario Development
The project scenario represents the changes in carbon stock due to project implementation. In the
following sections, the approach adopted for selecting the project activities, features of the
activities and the area proposed for the activities is described.
4.1 Approach For Developing Project Activities
Multiple approaches were used to identify the set of project activities including species to be
planted and total area to be dedicated under the project activity.
Community forestry option: A reconnaissance survey of sample villages was done to
ground truth the area defined and to estimate the actual area available for A&R activities to the
secondary source of information obtained from revenue and forest department records. A
Participatory Rural Appraisal was conducted in 10 sample villages of Bagepalli range to explore
the interest of communities and the extent of land they wanted to dedicate for A&R, given that
they are dependent on these land categories for fuelwood and grazing purposes. The communities
were asked for their choice of species and the proportion of land to be dedicated for each of the
species. Thus, a list and proportion of species to be promoted under community forestry and
phasing of the activities was prepared.
Farm forestry option: Secondary data was obtained from revenue department regarding
the land holding of different farmers within the villages chosen for sampling in Gauribidanur.
They were further classified as large and small farmers based on their land holding. A sample of
10 whole farms was surveyed for estimating the potential for farm forestry. The farmers were
interviewed using a questionnaire to elucidate their interest in farm forestry, the species choice,
and the extent of land they were inclined to plant either as block or on bunds1.
4.2 Technical Potential Versus Socio-Economic Potential Area For Afforestation And
Reforestation Activity

Technical potential area available for forestry mitigation activities is the total area recorded as
available for A&R in the official records of forest and revenue department. In reality all the
technical potential land area may not be available for A&R due to several reasons;
• encroachment by individuals or conversion to infrastructure
• requirement for future settlement or infrastructure or other developmental activities
• conversion to agriculture in future
• requirement for grazing; current or future
• highly degraded (rocky or marshy)
Thus, socio-economic potential is the estimate of actual or feasible land area available for A&R
activities obtained based on measurement of actual area, based on field visit, measurement of
actual current area and consultation with stakeholders (local community, local government and
the relevant land departments). The technical and socio-economic potential estimate for the 10
villages is given in Table 4.
TABLE 4:
Socio-economic land potential for afforestation for community forestry in Bagepalli.
PLACE TABLE 4 HERE
The socio-economic potential ranged from 18.2 to 100% with an average of 45.7% of the
technical potential, as available for A&R activities. The activities proposed for implementation
under the project scenario for the different land categories along with species to be promoted are
given in Table 5. The community has opted for short rotation, long rotation, fruit and timber-
oriented species. The area that the communities are ready to dedicate for community forestry in
Bagepalli range is about 8,636 ha (3,524 ha of community grazing land and 5,112 ha of degraded
forestland), which is less than 50% of the total land category (Table 5).
TABLE 5:

Land category and area proposed for different project activities and phasing under community
forestry and farm forestry projects.
PLACE TABLE 5 HERE
The total crop area of Gauribidanur is about 40,000 ha, of which communities have
proposed to dedicate less than 5% of the area for block planting and about 10% of the area for
bund planting under farm forestry option (Table 5). The proposed activities for bund planting
include long rotation trees of economic value such as teak (60%) and fruit trees (40%). This
indicates that farmers are keen on getting regular as well as sustained economic benefits over
several decades. In the same way, under block plantation activity too, the area proposed for
raising of orchards is three-fourth of the land dedicated while about 10% and 15% of the land is
for long rotation and short rotation crops, respectively (Table 5).
4.3 Approach For Carbon Stock Projections Under Project Scenario
Carbon pools: Selection of carbon pools and the field methods adopted for estimating the
different carbon pools is similar to that adopted for the development of a baseline scenario (refer
to Section 3).
Source of data for carbon stocks and growth rates: There is limited literature on
biomass growth rates of different species as well as carbon stocks under different land use
systems. The forest inventory reports and working plans of the Forest Department have no data
on soil carbon and growth rates for many species. Data on aboveground biomass stock of
plantation species is available to a limited extent in these reports. Therefore, in this study, field
measurements of aboveground biomass, woody litter and soil carbon were made for the selected
activities proposed in this project or block, in the same forest range for established plantations
and agro-forestry systems with identical precipitation, soil and silvicultural management
practices.

To estimate the potential rates of carbon uptake and changes in soil carbon for the
selected project activities, the following approach was adopted.
Select sites where the identified project activities (such as eucalyptus plantation, fruit
orchards of mango, tamarind, etc.) have already been planted under different programmes in the
same forest range (or administrative block) and which are of different age (such as 5, 10 and 20
years) groups
Laying plots (quadrats) for measuring trees to estimate height, DBH, density, etc. and for
soil sampling
Estimating rate of growth of AGB and soil carbon using methods described in section 3.
The vegetation sampling is same as that conducted for baseline scenario. The procedure
adopted for estimating aboveground biomass, woody litter and soil carbon was similar to that
adopted for the baseline scenario.
5. Carbon Stock Projections Under Project Scenario
The PRO-COMAP model, a microsoft excel based spreadsheet, was used to analyze the
mitigation potential as well as cost-effectiveness of mitigation activities.
5.1 Estimation Of Stocks Of Different Carbon Pools
The model estimates the change is C-stock annually under the baseline and mitigation scenario.
Adopting the C-stock change method to estimate the C-pool increment, mathematically, the
change in carbon stocks attributable to a project (∆Cnet) at any given time can be expressed as:
Where, ∆Cproject and ∆Cbaseline are the measured changes in carbon stocks at periodic
monitoring time over the period i, associated with the project and the respective baseline
case.
∆Cnet = [(∆Cproject – ∆Cbaseline)∑=
n
i 1time 1 +(∆Cproject – ∆Cbaseline)time 2 +……. (∆Cproject – ∆Cbaseline)time n]
5.2 Input Data For Analysis

Input data based on field measurements for the PROCOMAP model is given in Table 6.
TABLE 6:
Input data based on field studies for PRO-COMAP model to assess the mitigation potential.
PLACE TABLE 6 HERE
5.3 Carbon Stock Change Under Project Scenario
Carbon stock change per ha: The carbon stock change per ha for the various project activities
under baseline and mitigation scenario for a period of 30 years at every 5 years interval is given
in Table 7. The carbon increment under baseline for the community forestry project is 0.0045
tC/ha/yr, and nearly absent under farm forestry as there was negligible accumulation of woody
biomass on the fallow lands. The mitigation potential per ha for the 30-year period (2005-2035)
for various mitigation options ranges from 3.81 tC to 47.42 tC (Table 7).
TABLE 7:
Carbon stock change under baseline and mitigation scenario (excluding harvested wood products)
and the carbon increment per ha for various project activities for 2005-35 (tC/ha).
PLACE TABLE 7 HERE
Carbon stock change for project area: Overall the mitigation potential for community
forestry from an area of 8,625 ha is 196,630 tC and for farm forestry with an area of 5,381 ha is
81,750 tC (Figure 1). Thus, the overall mitigation potential in Kolar for a total area of 14,000 ha
under various mitigation options is 278,380 tC (Figure 1) at a rate of 20 tC/ha for the period
2005-2035, which is approximately 0.67 tC/ha/yr, which is inclusive of the harvest regimes under
short rotation and long rotation mitigation options.
Insert Figure 1
Figure 1. Total incremental carbon pool (‘000 tC) for the project area in Kolar

5.4 Uncertainty Estimates Of C-Stock Change
Methodology for estimating carbon benefits: Project level estimates of carbon stock changes are
easier to quantify and monitor compared to say national forest inventories because of clearly
defined project activities and boundaries, stratification of the project area and the choice of the
carbon pools to be measured. Techniques and methods of sampling design and measuring carbon
pools are available which are based on commonly accepted principles of forest inventory, soil
chemistry and ecological surveys (Hamburg, 2000). Standard ecological methods have been used
to estimate the various carbon pools, which have been well established and implemented
worldwide in forest inventory, with minimal uncertainty.
Establishment of Baseline: The area and location for the proposed forestry activities is
unlikely to change. The past land use records have shown minimum land conversion to other
land uses. Hence the baseline area estimation and projection is fairly accurate with minimal
uncertainty. Data on area availability for mitigation activities has also been verified through field
visits and stakeholder consultation in the study area.
The estimate of aboveground biomass is based on field ecological measurements, which
in the community grazing lands is very low (0.3 tC/ha) and is unlikely to change due to low tree
density. Since time series data on AGB growth rates are unavailable and the field data is based
on cross-section studies, an assumption of 0.01 tC/ha is considered as the mean annual increment
in aboveground biomass, which is the annual extraction of fuelwood from the area. The
uncertainty associated is likely to be insignificant due to the low tree density and aboveground
biomass.
Measurement of Carbon Pools: Uncertainty is assessed using standard deviation for the
mean carbon pools based on field measurements. Stratification of the project area into more or
less homogeneous units, based on vegetation type, soil type, land-use history, or topography, can
increase the precision of the carbon measurements, without increasing the cost unduly because it

lowers the variance of measurements thus requiring fewer plots to be monitored within acceptable
levels of precision.
The standard deviation is generally low for AGB growth rate and soil organic carbon
stock (Table 8). However standard deviation for rate of soil carbon uptake is high for fruit
orchard and low for Eucalyptus and Tectona grandis + mango. Thus uncertainty is generally low
for estimates of carbon pools.
TABLE 8:
Uncertainty associated with the measured carbon pools.
PLACE TABLE 8 HERE
6. Estimates Of Cost-Effectiveness Of Project Activities
The cost of carbon mitigation is going to be a critical factor in selecting mitigation activities, as
the focus will be on low cost mitigation opportunities at least initially. The importance of the
forestry sector has been emphasized by several studies, which have shown that LULUCF sector
mitigation activities are cost-effective and have the potential to provide large socio-economic
benefits (Brown et al., 1996; Sathaye and Ravindranath, 1998). The PROCOMAP model, based
on discount cash-flow technique, was used to estimate the cost-effectiveness (Rs/tC) and benefit-
cost ratio.
6.1 Cost-Effectiveness Estimates
Estimation of cost or cost-effectiveness of mitigation activities is critical, but could be complex,
depending on the method used, components of costs and revenue included and the discount rate
used. The various components selected for determining cost-effectiveness are given in footnotes
to Table 9.
TABLE 9:
Cost-effectiveness of mitigation options for the period 2005-2035 at 8% discount rate.
PLACE TABLE 9 HERE

Investment cost is considered for the first three years, with the assumption that the
community/farmer will meet the annual or operating cost of later rotations. Investors, donors or
banks are likely to be interested in funding or lending only the investment cost may be guided by
these values. The present value of investment cost, extended over the first 3 years, varies from Rs.
4,125/ha for bund plantation to Rs. 63,716 per ha for long rotation at a discount rate of 8% (Table
9). The present value of initial cost/tC also varied from Rs. 615 for bund plantation to Rs. 2,270
for long rotation (Table 9).
Very often, funding only investment cost may not sustain a project and it becomes
essential to consider annual or operating or maintenance costs as well. The lifecycle cost per ton
of carbon varied from Rs. 2013 for short rotation to Rs. 4888 for fruit orchard at 8% discount
rate. The lifecycle cost per ton of carbon abated varied from Rs. 2,800 for long rotation to Rs.
3,423 for bund plantation at 8% discount rate. The high value per ton of carbon abated for bund
plantation is due to the fact that the number of trees per ha is limited and hence the carbon abated
is less.
The Net Present Value of Benefits, which the policy makers and the local community are
interested, is positive for all the mitigation options except long rotation at 8% (Table 9). The
Internal Rate of Return is very high (30%) for mango fruit orchard even though the life-cycle cost
is also highest. It is the least (4%) for long rotation under farm forestry followed by short rotation
option (10%) under community forestry (Table 9). The benefit-cost ratio is greater than one for
all mitigation options for the period 2005-2035. The mango orchards bear fruits from the fourth
year and there is continuous flow of benefits for a period of 50 years. The yearly fluctuations in
mango yield have also been taken into account in the model.
Investment required for the project: The investment for the various mitigation options
at a discount rate of 8% is given in Table 10. The total investment for the six different mitigation
options is Rs. 306 million for a total area of 14,000/ha. The average investment per ha for the

project is about Rs. 21,860. The yearly investment spanned over 5 years ranges from Rs.96
million during the first year to Rs. 48 million during the fourth and fifth years (Table 10).
TABLE 10:
Investment for the project at 8% discount rate.
PLACE TABLE 10 HERE
The highest investment is required for the fruit orchard, as the area opted by the
community is large and the investment per ha is higher compared to other mitigation options. The
investment for bund plantation is the least though the area is large, as the tree density per ha is
very low.
6.2 Alternative Carbon Price Scenarios
Afforestation and reforestation activities are examples of cost-effective means to stabilize GHG
concentration. Credits that result from these projects for removing carbon from the atmosphere
can be traded on a global market. The estimated price of a ton of carbon from a forest project
could range from US$ 3 to US$ 57. The carbon price is still evolving.
In this study, financial benefit from sequestered carbon was estimated at different carbon
prices – US$ 5 and 10. For each of the mitigation activity, the NPV with and without carbon
prices is given in Table 11. At the lowest carbon price of US $5, at 8% discount rate, the
incremental benefit per tC ranges from Rs. 127 for bund farm forestry to Rs. 945 for fruit orchard
under community forestry for the period 2005-2035 (Table 11). The long rotation forestry option,
even with carbon pricing at US$ 20 is not beneficial. At a rate of US $ 21/tC, at 6% discount rate
it is a positive proposition. At 8% and 10% discount rates, the carbon price has to be US$ 35 and
47 per tC respectively for a positive NPV.
TABLE 11:
Net present value of benefits per tC with and without carbon pricing for various mitigation
options.
PLACE TABLE 11 HERE

At 8% discount rate, the financial benefit from carbon credits for the project period 2005-
2035 at US$5 and 10 is Rs. 193 million and Rs. 222 million respectively (Table 12). At a carbon
price of US$ 5, the carbon price covers 63% of the investment cost and at US$ 10, it accounts for
72% of investment cost respectively.
TABLE 12:
Financial benefit from carbon price (Rs million) for the period 2005-2035 from the project area
(14,000 ha).
PLACE TABLE 12 HERE
7. Leakage Estimation
Leakage is “the net change of anthropogenic emissions by sources of GHGs and removal by
sinks, which occurs outside the project boundary, and which is measurable and attributable to the
project activity”. Leakage is failure to capture greenhouse gas changes outside the accounting
system that result from project activities within the project boundary. Forestry projects are often
assumed to lead to leakage, due to shift in extraction or land use change. In this study, an attempt
was made to estimate leakage in both community forestry as well as farm forestry projects.
The leakage estimation was based on PRA exercise as well as household survey where
the quantity of fuelwood and poles/small timber currently extracted from community grazing
land, degraded forestland and farmlands proposed for the project were quantified.
Leakage is estimated to be equal to the current rates of extraction of fuelwood/small
timber under baseline from the land proposed for the project. Thus, under community forestry
project, extending over an area of about 8500 ha, the annual extraction or loss of biomass is
insignificant at about 10 kg/ha/year. This accounts to about 0.025% of the total mean annual
carbon stock change during project implementation (Table 13). Under farm forestry, there is
insignificant extraction of biomass from the bund and block plantations in Gauribidanur.
TABLE 13:
Leakage estimates for community and farm forestry options.

PLACE TABLE 13 HERE
The leakage is absent or insignificant since the aboveground biomass recorded on the
proposed lands for project activities in the baseline condition is quite low and therefore biomass
extraction is low too. There is ample evidence to show that forestry projects, taken up on lands
similar to the one proposed for this project have not led to leakage.
It is also essential to understand market leakage. Projects focused on local community
needs may lead to positive leakage mainly because they aim to minimize the drivers and scale of
potential leakage (Schwarze1 et al., 2002). The proposed reforestation/afforestation projects will
be virtually free of market-leakage risk. As the project generates products that are substitutes for
others that come exclusively from natural forest sources (e.g. firewood for local use), this should
tend to produce positive market-based leakage by creating a new supply of locally available
resources (Schwarze1 et al., 2002).
Leakage mitigation measures: There are several options to minimize or avoid or mitigate
leakage. Involvement of stakeholders and creation of long-term stake ensures no unplanned
extraction or shifting of extraction occurs. Further, integration of biomass demands, particularly
fuelwood will also avoid leakage. Creating buffer stocks and accounting rules such as using a
discount factor are other options.
8. Transaction Cost Estimates
Transaction costs include; cost of planning, organizing, implementation, monitoring, verification
and certification of a project. Transaction cost also refers to the time, effort, and resources needed
to search out, initiate, negotiate, and complete a deal (Lile, Powell, and Toman 1998).
Transaction cost will play an important role in determining the viability of forestry projects and
the goal should be to minimize the transaction cost such that financial benefits to local
stakeholders is maximized and forestry projects are made attractive to all the stakeholders,
including investors.

Forestry projects have unique features such as; development of baselines, demonstrating
environmental additionality, consultation and involvement of different stakeholders, intensive
monitoring and verification, and a long negotiation process. In this study, the cost involved in
baseline scenario development as well as for preparation of the project proposal has been
estimated.
TABLE 14:
Transaction cost (in Rs.) estimates for baseline scenario developed Community
Forestry.
PLACE TABLE 14 HERE
i) Baseline scenario development: The cost involved in baseline scenario development,
that includes cost incurred for conducting field ecological studies, PRA exercises to generate
information on land availability, compiling secondary information on area available,
afforestation/reforestation rates of community as well as farm forestry projects, future plans etc.,
data entry, compilation and analysis, laboratory analysis of soil samples and other costs have been
estimated. As can be seen from Table 14, the total cost of developing a baseline for community
forestry is about 1.5 times more than that incurred for developing a baseline for farm forestry
option. About 50% of the total cost incurred in developing a baseline for community forestry
project is due to intensive sampling required for biomass and soil carbon studies and
consultations with community members on various aspects of project development and
implementation.
Conversely for farm forestry projects, consultation is with only the concerned farmer and
also the biomass and soil carbon studies that need to be conducted are fairly simple as compared
to community forestry option. However, the number of soil samples that are collected and
analyzed for farm forestry option is more, to capture the wide variation in organic carbon content
of cropland soils.

ii) Preparation of project proposal: This involves cost incurred in estimating and
projecting the carbon stocks under the project scenario (Table 15). At project development phase
also, the cost involved in ecological and PRA exercises is higher for community forestry option
as compared to farm forestry. A household survey is conducted for the community forestry option
to estimate fuelwood and other products that are extracted from the area proposed for the project,
so as to enable estimation of leakage.
TABLE 15:
Transaction cost estimates for project proposal prepared.PLACE TABLE 15 HERE
The total cost of developing a project proposal, for farm forestry and community forestry
projects is Rs. 250,000 and Rs. 285,000, respectively (Table 15). The cost per t of carbon is
estimated to be Rs. 1.50 for community forestry and Rs. 3.75 for farm forestry option, which is
less than 2% of carbon price (at US$ 5/tC).
9. Environmental And Socioeconomic Impact Assessment
9.1 Environmental Impact Assessment
There are potential synergies and tradeoffs between climate change mitigation activities (projects
and policies) and the conservation and sustainable development objectives. Afforestation and
reforestation activities can have negative impacts on biodiversity, if taken up in forest ecosystems
rich in biodiversity. Conversely, if biodiversity is being promoted on land that is degraded, it will
have a positive impact on biodiversity. It is therefore important to assess the environmental or
ecological impacts of a project, particularly on biodiversity. Biodiversity was assessed using
standard ecological methods and indices. The Shannon Wiener Diversity Index (H’) was used for
assessing biodiversity under baseline and project scenario.
An estimate of biodiversity under baseline as well as project scenarios both for
community as well as farm forestry projects indicates that there is an improvement in biodiversity
over the baseline in the project scenario (Table 16), as multi-species forestry is promoted, which
is the choice of community.

TABLE 16:
Diversity estimates of baseline and project scenarios for community and farm forestry.
PLACE TABLE 16 HERE
9.2. Socio-Economic Impacts
All forestry sector activities are labour-intensive and create rural employment in establishing,
protecting and maintaining forests or plantations and also provide diverse biomass products. The
proposed project has multiple components, including promotion of long-rotation and short-
rotation species and fruit orchards on a large-scale. Further, these species with varied gestation
periods and end-uses would provide not only economic returns periodically but also in a sustained
manner, as fruit orchards yield over many decades. Further, the various silvicultural operations
and other plantation related activities especially on community lands would provide employment
to the communities involved in project implementation apart from employment at the time of
initiation of the project when various activities such as land preparation, pitting, nursery raising,
transportation of seedlings and actual planting occur.
10. Conclusions And Implications For Methodological Issues
Climate mitigation through forest sector has been a contentious issue and has attracted a lot of
attention of researchers as well as negotiators. This is because of the several methodological,
technical, social and political issues, relevant to sink activities aimed to stabilize GHG
concentration in the atmosphere.
The uncertainty of estimates of carbon emissions is presumed to be high in the LUCF
sector, due to problems of definitions, biophysical variations that lead to varied estimates,
limitations of methods or availability of multitude of methods to choose from, limitations of data
and accounting issues involved. Here we discuss how these contentious issues have been
addressed in this study with particular reference to methodological issues in forestry mitigation
projects.

Carbon inventory techniques: The ideal approach is to measure all the C-pools.
However, resource and time limitation will dictate selection of two or three dominant C-pools,
considering the pools most likely to be impacted. The Marrakech Accord has also suggested
reporting of changes in the stocks of five C-pools; AGB, BGB, litter, dead wood and SOC. The
Revised IPCC 1996 Guideline focused on aboveground biomass, soil carbon and woody litter
pools (IPCC, 1996). Standard and reliable field ecological methods were used for making
estimates of carbon pools for aboveground biomass, soil organic carbon and woody litter. Default
value for belowground biomass was used, as the cost involved in monitoring this carbon pool is
high.
Database on growth rate of C-pools: There are serious limitations with respect to
availability of data on growth rates of different carbon pools for different forestry activities.
Growth rates are available only for certain commercially or economically important forestry
species and similar data for non-commercial forest and horticultural plantation species, naturally
regenerating forests and agro-forestry species are lacking. Further, there is no database available
for below ground biomass and woody litter. Thus, there is an urgent need to develop biomass
estimation equations for the various species commonly opted by communities and farmers.
Developing default values for different species across different ecological zones along with rate
of change of soil carbon density under different situations – forests, plantation, natural
regeneration and agro-forestry situations is an urgent requirement to enable cost-effective and
successful development of forestry mitigation projects.
Baseline development: The past land-use or change is used to project future land use
changes. Establishing baseline scenario requires knowledge of historical series of conventional
practices in the project area, the local socio-economic situation, economic trends that may affect
the carbon benefits of a project, and other policy relevant parameters (IPCC, 2000). Determining
the land-use/land-cover change is critical to accurately estimating carbon benefits. Sound
methods are necessary in order to state within a level of confidence, how well land-use/land-

cover change is predicted. In Kolar, updated revenue records were not available to analyse the
current land use. In many of the villages, the revenue records did not tally with ground reality, as
the data was not updated. Participatory rural appraisal was found to provide reliable information
with regard to past and current land use/land use change. Field visits give precise information
with regard to land availability for mitigation options. Cross-sectional field studies yield reliable
information during baseline development and the cost of such studies is not very high.
According to the Milan Accord, three options to a baseline methodology for a project
activity has been suggested which are “(a) the natural emissions and removals that would
otherwise occur; or (b) the net greenhouse gas removals by sinks due to use of the land that
represents an economically attractive course of action, taking into account barriers to investment
or other barriers or (c) the most likely prospective land use at the time the project starts, which
may include for example, agriculture (pasture or crops), natural regeneration, forestry.” For the
current study, option c has been chosen, where the current land use i.e. community-grazing lands
for community forestry and farmlands for farm forestry is assumed to maintain status quo.
Additionality: Additionality is not an issue for development of forestry mitigation project
in Kolar as there are records available for understanding trends in A&R. Further, plan documents
are available for projecting future rates of afforestation/reforestation activities. Further, as evident
from the records, surplus land is available for taking up additional activities in addition to the
ones already proposed. The biomass estimated on the baseline land categories is also low and
therefore any mitigation project activity would lead to additional carbon sequestration.
Leakage: Leakage is not an issue for forestry projects in the semi-arid zone, especially
when wastelands, with no or insignificant biomass are being considered as potential land
categories for project implementation. This is also the case in Kolar wherein the lands proposed
for the project are community-grazing lands and degraded forestlands with low or insignificant
biomass. Further, the current dependence of communities or individual farmers on lands proposed

for project implementation can be estimated through household survey or PRA, so as to
incorporate the same in project design.
Permanence: The designing of the project when performed in consultation with
communities or stakeholders, will not pose the problem of permanence. This is because, the
initial consultation process will ensure that community choice of species as well as area is
implemented and communities are also aware of the project. Further, agro-forestry trees, fruit
orchards etc. are not harvested traditionally. Temporary carbon credits can also address the issue
of permanence.
Biodiversity: A potential conflict exists between biodiversity conservation and fuelwood
demand and demand for economically important timber species. However, consultation process
with different stakeholders before the initiation of the project ensures that multi-species
plantations are promoted to cater to the different requirements of the participating communities.
On the bunds of farms where agro-forestry option is proposed, the baseline biodiversity is high
and therefore project activities will further enhance the biodiversity. A multi-component project
ensures biodiversity conservation.
Cost-effectiveness: The methods for estimating cost-effectiveness are well established
and PROCOMAP provides estimates of various indicators. Incorporating carbon price into
calculation of profitability is also feasible. Revenue from carbon is likely to improve the financial
viability of projects.
Transaction cost: The transaction cost of preparing a baseline Project Design Document
(PDD), consultations and other related activities is low. In this study the cost of post-PDD
activities is not included, which could be higher than the cost of developing PDD.
Model limitations: In estimating the C-stock change, the limitations of PRO-COMAP
model are:
• Below ground biomass, litter and dead wood not included under baseline.
• Non linear growth rates of biomass and soil C not considered

• Silvicultural interventions or intermediate harvest not incorporated, which is especially
relevant for long rotation trees such as teak, which have direct relevance to the C stock
changes in aboveground biomass.
Notes
1 earthen embankment constructed to retain water or for separating one farm from the other.
Acknowledgements
This work was supported by the U.S. Environmental Protection Agency, Office of Atmospheric
Programs through the U.S. Department of Energy under Contract No. DE-AC02-05CH11231.
Disclaimer: The views and opinions of the authors herein do not necessarily state or reflect those
of the United States Government or the Environmental Protection Agency. We thank Jayant
Sathaye and Ken Andrasko for their contribution at various stages of development of this study.
We also thank Neeta Hooda, Mohit Gera and all other scientists of ICFRE for their suggestions.
We thank the Karnataka Forest Department, particularly Swaminath M.H., Rangaswamy, Nagaraj
and several Range Forest Officers of Kolar. This project was conducted under a collaborative
programme of USEPA-Ministry of Environment and Forests.
References
Brown S, Sathaye J, et al (1996) Mitigation of carbon emissions to the atmosphere by forest management,
Commonwealth Forestry Review, 75(1):80-91
Champion HG, Seth SK (1935) Forest types of India. Forest Research Institute, Dehra Dun.
FSI (1996) Volume equations for forests of India, Nepal and Bhutan. Forest Survey of India, Ministry of Environment
and Forests, Government of India, 1996.
Hamburg SP (2000) Simple rules for measuring changes in ecosystem carbon in forestry-offset projects. Mitigation and
Adaptation Strategies for Climate Change
IPCC (1996) Revised 1996 IPCC Guidelines for national greenhouse gas inventories: reference manual. Section on
land use change and forestry sector, Cambridge University Press, Cambridge, UK
IPCC (2003) IPCC good practice guidance for LULUCF sector. Intergovernmental Panel on Climate Change.
Cambridge University Press, Cambridge, UK

Lile R, Powell M, et al. (1998) implementing the clean development Mechanism: lessons form the U.S. private sector
participation in activities implemented jointly. Discussion Paper 99-08, Resources for the Future, Washington
DC
Ravindranath NH, Sudha P, et al (2001) Forestry for Sustainable biomass production and carbon sequestration in India.
Mitigation and Adaptation Strategies for Global Change, 6:233-256
Ravindranath NH, Somashekar BS(1995) Potential and economics of forestry options for carbon sequestration in India.
Biomass and Bioenergy, 8:323-36
Sathaye J, Ravindranath NH (1998) Climate change mitigation in the energy and forestry sectors of developing
countries. Annual Review of Energy and Environment, 23:387- 437
Schwarze1 R, Niles JO, et al (2002) Understanding and managing leakage in forest-based greenhouse-gas-mitigation
projects. Phil. Trans. R. Soc. Lond. http://www.ghgprotocol.org/docs/carbon-leak.pdf

Table 1: Current and past land use pattern (in ha) in Bagepalli and Gauribidanur forest range for the period 1988-89 to
2001-02
Land category 88-89 94-95 97-98 99-00 00-01 01-02 Bagepalli
Total geographic area 90009 90009 90009 90009 90009 90009Net sown area 37529 31462 33675 30733 30971 32531Irrigated area 5918 5040 5178 2967 2697 6814Rainfed area 31611 26422 28497 27766 28274 25717Forest area 18458 18458 18458 18458 18458 18458Wasteland 7498 7498 7498 7498 7498 7498
Gauribidanur Total geographic area 86727 86727 86727 86727 86727 86727Net sown area 47015 42079 42714 45999 43927 40378Irrigated area 13823 17287 14192 11697 11697 11418Rainfed area 33192 24792 28522 34302 32230 28960Forest area 4332 4332 4332 4332 4332 4332Wasteland 7375 7375 7375 7375 7375 7375
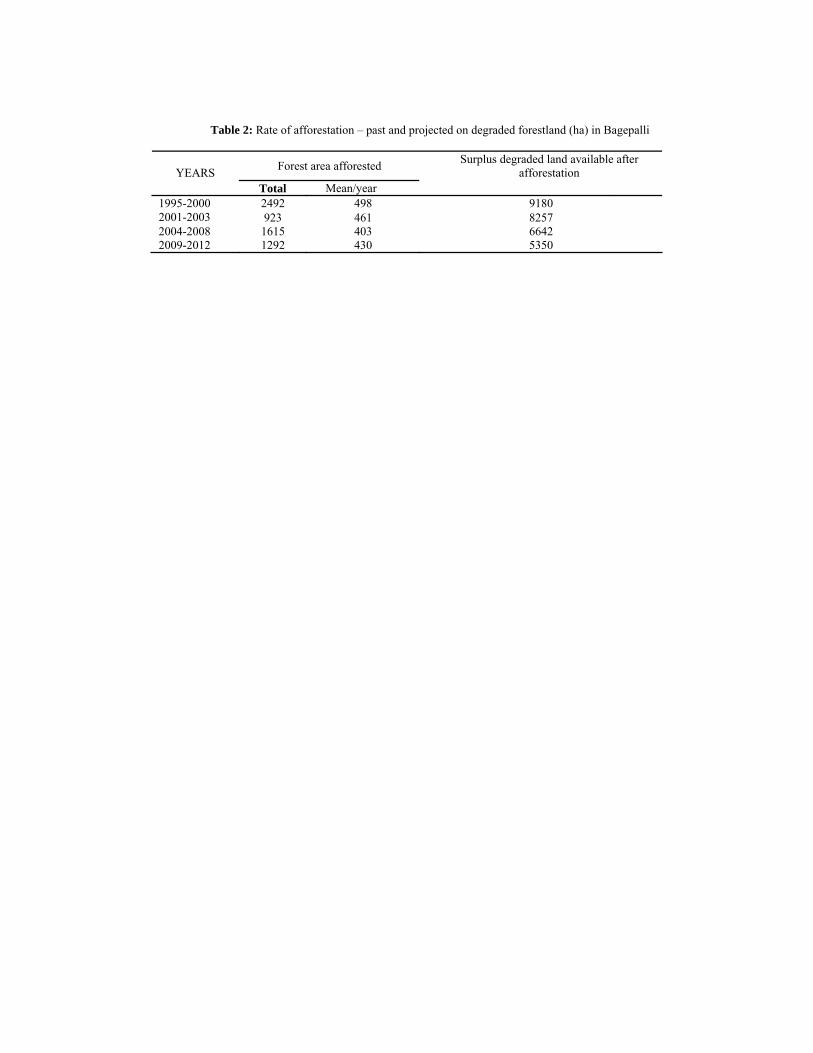
Table 2: Rate of afforestation – past and projected on degraded forestland (ha) in Bagepalli
Forest area afforested Surplus degraded land available after afforestation YEARS
Total Mean/year 1995-2000 2492 498 9180 2001-2003 923 461 8257 2004-2008 1615 403 6642 2009-2012 1292 430 5350

Table 3: Farm forestry in Gauribidanur
YEARS Area brought under farm forestry (ha)
Surplus land available after afforestation (ha)
1998-1999 1592 37771 1999-2000 3133 34638 2000-2001 3690 30948 2001-2002 2959 27989

Table 4: Socio-economic land potential for afforestation for community forestry in Bagepalli
Village Technical potential
(ha) Socio-economic
potential area (ha) % of socio-economic to
technical potential
Guraldina 120 60 50.0
Mallepalli 250 125 50.0
Babenayakanapalli 41.2 41 100.0
Vasanthapura 850 425 50.0
Pichallavarapalli 240 120 50.0
Singappagarapalli 39.2 16 40.8
Govinapalli 40 40 100.0
Boyinavarapalli 330 60 18.2
Devikunte 80 20 25.0
Gollapalli 40 20 50.0
Total 2030.4 927 45.7

Table 5: Land category and area proposed for different project activities and phasing under community forestry and farm forestry projects
Option Land category proposed Total potential area (ha)
Area proposed (ha) Project activities
Area (ha) dedicated for each option
Plantation Phasing (yrs)
Species opted by the community
Short rotation 2500 (29%) 5 Eucalyptus spp., Acacia spp.
Com
mu
nity
fo
rest
ry Community grazing
land & Degraded forestland
15755a 8636bFruit orchard 6125 (71%) 5
Mangifera indica, Syzygium cuminii, Tamarindus indica, Azadirachta indica, Ficus spp.
Cropland bund planting 39363 3960 Long rotation + Fruit orchard
3960 (60% orchard & 40%
teak) 3
Tectona grandis, Grevillea robusta, Pterocarpus spp. Mangifera indica, Tamarindus indica, Azadirachta spp., Achras sapota, Artocarpus spp.
Short rotation 228 (16%) 1 Eucalyptus spp.
Long rotation 128 (9%) 1 Tectona grandis, Grevillea robusta, Terminalia spp., Dalbergia spp. Fa
rm fo
rest
ry
Cropland block planting 1420
Fruit orchard 1065 (75%) 3
Mangifera indica, Tamarindus indica, Achras sapota, Artocarpus, Neem, Guava,Syzygium
a includes 7498 ha of community grazing land and 8257 ha of degraded forestland b includes 3524 ha of community grazing land and 5112 ha of degraded forestland, based on community decision c number in parenthesis indicates the percent area allocated for different options

Table 6: Input data based on field studies for PRO-COMAP model
to assess the mitigation potential
Activity Aboveground biomass growth
rate (t/ha/yr)
Below ground biomass
(t/ha/yr)*
Soil organic carbon uptake (tC/ha/yr)**
Rotation period (years)
Life of harvested product
(years)***
Litter decomposition
t/ha/yr
COMMUNITY FORESTRY Short Rotation 4.00 1.04 0.51 8 5 0.22 Fruit orchard 1.41 0.36 0.40 - - 0.25
FARM FORESTRY (Block Planting) Short Rotation 5.35 1.39 0.94 6 5 0.22 Long Rotation < 20 years > 20 years
5.0 2.5
1.3
0.36
25
25 -
Fruit orchard 2.5 0.65 0.58 - - 0.25 FARM FORESTRY (Bund Planting)
Long rotation+fruit orchard 0.3 0.07 0.46 30 25 -
*below ground biomass is considered as 26% of the aboveground biomass based on Good Practice Guidance for LUCF sector (IPCC, 2003) **accumulation period is considered as 7 years after planting. ***life of harvested product for short rotation (Eucalyptus) is pulp for paper-making and for long rotation (Teak) is sawn wood for furniture-making

Table 7: Carbon stock change under baseline and mitigation scenario (excluding harvested wood products) and the
carbon increment per ha for various project activities for 2005-35 (tC/ha)
OPTIONS 2005 2010 2015 2020 2025 2030 2035 COMMUNITY FORESTRY
SHORT ROTATION Baseline 37.62 37.64 37.66 37.68 37.71 37.73 37.75 Mitigation 39.03 53.16 50.35 58.56 53.55 48.95 56.88 Incremental 1.41 15.52 12.69 20.88 15.85 11.22 19.13
FRUIT ORCHARD Baseline 37.62 37.64 37.66 37.68 37.71 37.73 37.75 Mitigation 38.24 44.51 49.03 52.95 57.22 61.14 65.06 Incremental 0.63 6.88 11.37 15.27 19.52 23.41 27.31
FARM FORESTRY Short Rotation (Block)
Baseline 36.27 36.27 36.27 36.27 36.27 36.27 36.27 Mitigation 38.28 58.37 57.60 55.10 52.91 50.42 47.92 Incremental 2.01 22.10 21.33 18.83 16.64 14.15 11.65
Long Rotation (Block) Baseline 36.27 36.27 36.27 36.27 36.27 36.27 36.27 Mitigation 37.87 53.84 68.56 82.73 96.20 46.50 64.33 Incremental 1.60 17.57 32.29 46.46 59.93 10.23 28.06
Fruit Orchard (Block) Baseline 36.27 36.27 36.27 36.27 36.27 36.27 36.27 Mitigation 37.29 47.53 55.39 62.38 69.72 76.70 83.69 Incremental 1.02 11.26 19.12 26.11 33.45 40.43 47.42
Fruit Orchard + Teak (Bund) Baseline 31.01 31.01 31.01 31.01 31.01 31.01 31.01 Mitigation 31.33 34.48 36.02 36.87 37.72 38.57 34.82 Incremental 0.32 3.47 5.01 5.86 6.71 7.56 3.81
Carbon stock change for project area: Overall the mitigation potential for community forestry from an area of 8,625 ha is 196,630 tC and for farm forestry with an area of 5,381 ha is 81,750 tC (Figure 1). Thus, the overall mitigation potential in Kolar for a total area of 14,000 ha under various mitigation options is 278,380 tC (Figure 1) at a rate of 20 tC/ha for the period 2005-2035, which is approximately 0.67 tC/ha/yr, which is inclusive of the harvest regimes under short rotation and long rotation mitigation options.
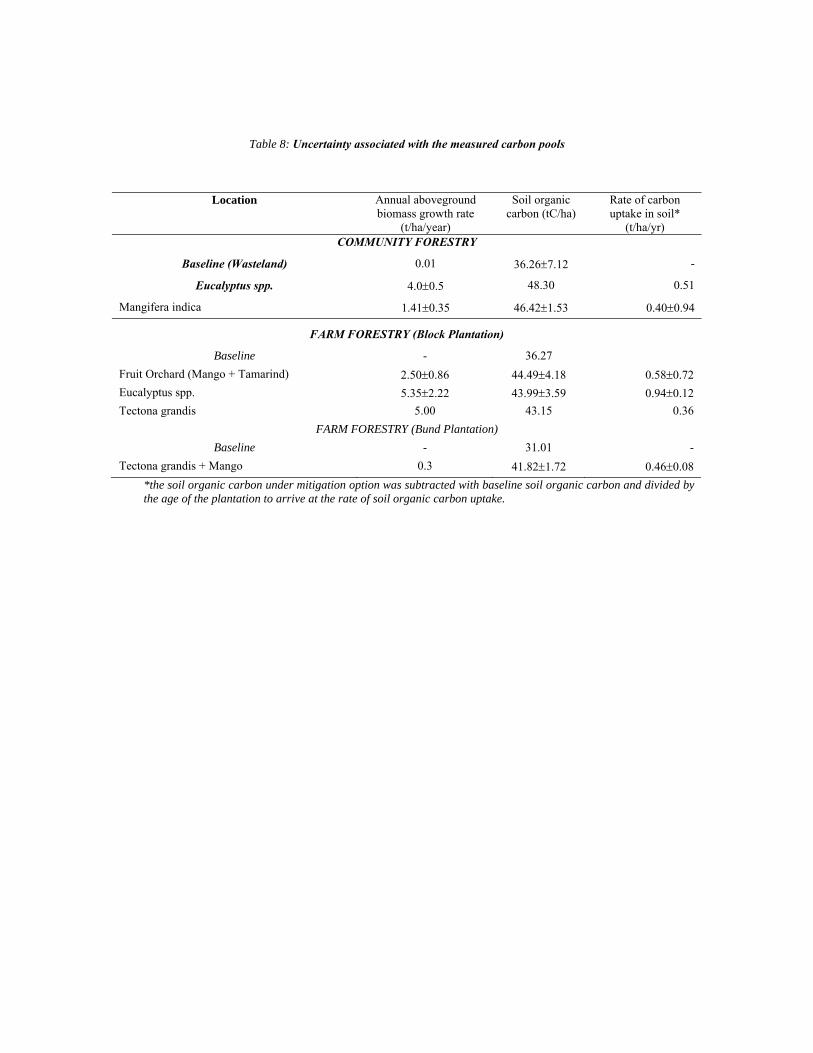
Table 8: Uncertainty associated with the measured carbon pools
Location Annual aboveground biomass growth rate
(t/ha/year)
Soil organic carbon (tC/ha)
Rate of carbon uptake in soil*
(t/ha/yr) COMMUNITY FORESTRY
Baseline (Wasteland) 0.01 36.26±7.12 -
Eucalyptus spp. 4.0±0.5 48.30 0.51
Mangifera indica 1.41±0.35 46.42±1.53 0.40±0.94
FARM FORESTRY (Block Plantation)
Baseline - 36.27 Fruit Orchard (Mango + Tamarind) 2.50±0.86 44.49±4.18 0.58±0.72 Eucalyptus spp. 5.35±2.22 43.99±3.59 0.94±0.12 Tectona grandis 5.00 43.15 0.36
FARM FORESTRY (Bund Plantation) Baseline - 31.01 -
Tectona grandis + Mango 0.3 41.82±1.72 0.46±0.08 *the soil organic carbon under mitigation option was subtracted with baseline soil organic carbon and divided by the age of the plantation to arrive at the rate of soil organic carbon uptake.

Table 9: Cost-effectiveness of mitigation options for the period 2005-2035 at 8% discount rate
Option Present value of initial cost
Life cycle cost
Net present value of benefits
Internal rate of return
Benefit cost ratio
Rs/ha Rs/tC Rs/tC Rs/ha Rs/tC Rs/ha Short Rotation (CF) 22661 1456 2013 31325 225 3505 9.72% 1.58Fruit Orchard (CF) 30578 1187 4888 125885 8153 209953 29.65% 3.99Short Rotation (FF) 22661 1945 4087 47620 2150 25044 16.60% 2.01Fruit Orchard (FF) 30578 665 2973 136599 5073 233113 29.92% 4.06Long Rotation (FF) 63716 2271 2800 78558 -1402 -39326 3.99% 2.87Fruit Orchard + Long Rotation (FF-Bund) 4125 615 3423 22956 1973 13233 29.46% 1.79• Initial costs include establishment cost for land preparation, nursery, planting, fencing, etc; • operation and maintenance cost includes watering, protection etc; harvest and transport cost for activities
involving harvesting; silvicultural cost pertaining to costs incurred for weeding, pruning, non-commercial thinning, marking for commercial thinning;
• recurring costs for administration, monitoring, management, etc; monitoring cost for monitoring biomass growth, soil carbon content, quantity of timber harvested, flow of benefits, etc. for baseline and mitigation scenario.
• Benefits include measurable and monetized benefits, such as timber – sawn logs, chip logs, pulp logs, poles, fuelwood, etc., and Non Timber Forest Products - fruits, seeds, etc.
• CF: Community Forestry; FF: Farm Forestry; 1US$ = Rs.45 (during 2005)

Table 10: Investment for the project at 8% discount rate
Option and area proposed (ha) Present value of initial cost (Rs/ha)
PV of investment cost needed
(million Rs.)
Annual investment** (million Rs.)
COMMUNITY FORESTRY Short Rotation (2500 ha) 22661 56.65 11.33 (5) Fruit Orchard (6125 ha) 30578 187.29 37.46 (5)
FARM FORESTRY (Block Planting) Short Rotation (228 ha) 22661 5.17 1.72 (3) Long Rotation (128 ha) 63716 8.16 8.16 (1) Fruit Orchard (1065 ha) 30578 32.57 32.57 (1)
FARM FORESTRY (BUND PLANTING) Long Rotation + Fruit orchard (3960 ha) 4125 16.34 5.45 (3)
Total for community and farm forestry (14006 ha) 21860* 306.17
Year 1: 96.69 Year 2: 55.96 Year 3:
55.96 Year 4: 48.78 Year 5: 48.78
*average investment/ha for all options **number in parenthesis is the number of phasing years for the mitigation option

Table 11: Net present value of benefits per tC with and without carbon pricing
for various mitigation options
Discount Rate 6% 8% 10% Short Rotation (Community Forestry)
Without carbon price 586 225 -31 With carbon pricing @US$5 746 370 100 With carbon pricing @US$10 906 515 232
Fruit Orchard (community forestry) Without carbon price 12148 8153 5541 With carbon pricing @US$5 12251 9098 7238 With carbon pricing @US$10 12353 9186 7316
Short Rotation (Farm Forestry)
Without carbon price 3232 2150 1377 With carbon pricing @US$5 3498 2409 1627 With carbon pricing @US$10 3769 2671 1878
Long Rotation (Farm Forestry) Without carbon price -885 -1402 -1700 With carbon pricing @US$5 -669 -1203 -1521 With carbon pricing @US$10 -451 -1005 -1340
Hurdle Rate 938 (US$21) 1623
(US$35) 2170
(US$47) Fruit Orchard (Farm Forestry) Without carbon price 7470 5073 3491 With carbon pricing @US$5 7575 5759 4725 With carbon pricing @US$10 7679 5850 4804 Fruit Orchard + Long Rotation (Farm Forestry-Bund) Without carbon price 2748 1973 1435 With carbon pricing @US$5 2893 2100 1547 With carbon pricing @US$10 3038 2227 1659

Table 12: Financial benefit from carbon price (Rs million) for the
period 2005-2035 from the project area (14,000 ha)
Discount rate 6% 8% 10% With carbon pricing @US$5 32.94 193.04 337.44 With carbon pricing @US$10 65.70 221.80 363.03

Table 13: Leakage estimates for community and farm forestry options
Option Total project area (ha)
Annual extraction or loss kg/ha
Total leakage/year (t)
% of total mean annual carbon stock change
Community forestry 8625 10 86.25 0.025% Farm forestry 5380 - - -

Table 14: Transaction cost (in Rs.) estimates for baseline scenario developed
Field Work Laboratory work Secondary data Analysis Total cost Cost/tC
Ecological PRA
Community Forestry
36000 2700 10500 600 27000 76800 0.45 Farm Forestry
2700 300 18300 300 27000 48600 0.65

Table 15: Transaction cost estimates for project proposal prepared Activity Community forestry Farm forestry
Ecological 33,000 24,000 PRA 7,500 3,000 Laboratory work 99,000 165,000 HH survey 16,000 Land survey-farmer 5,500 3,000 Consultation process, analysis and proposal preparation 90,000 90,000 Total for project (Rs.) 251,000 285,000 Cost /t of carbon (Rs.) 1.50 3.75
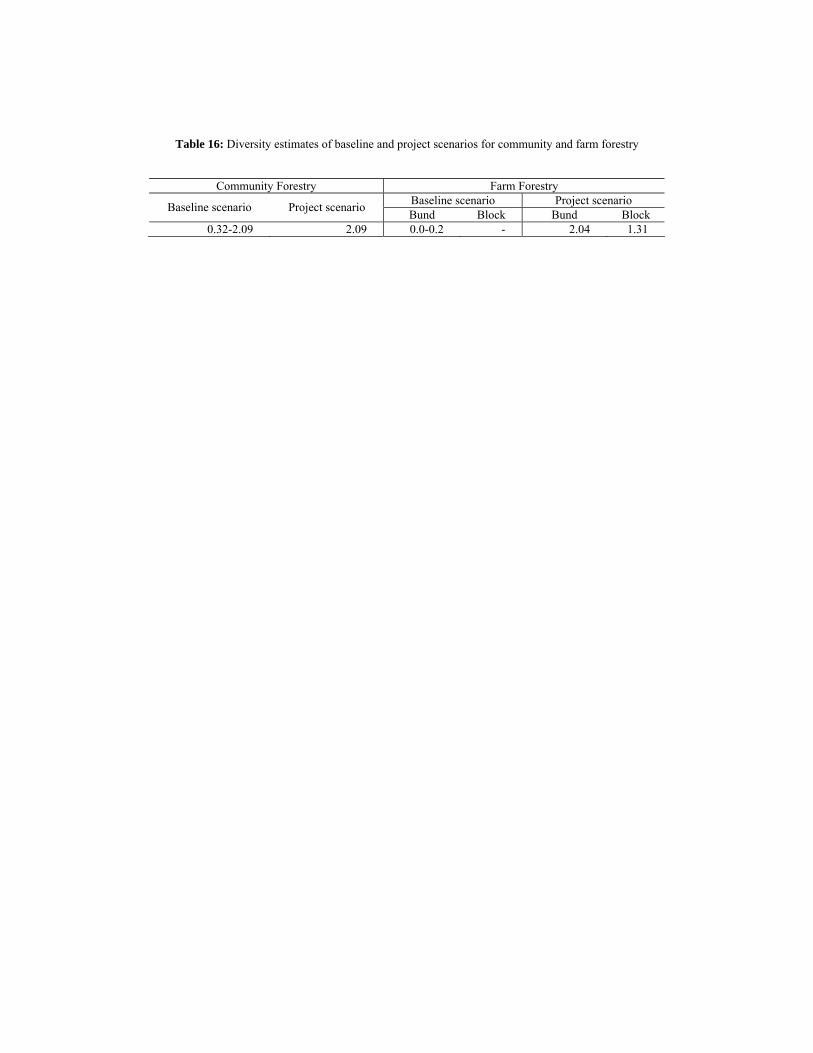
Table 16: Diversity estimates of baseline and project scenarios for community and farm forestry
Community Forestry Farm Forestry
Baseline scenario Project scenario Baseline scenario Project scenario Bund Block Bund Block 0.32-2.09 2.09 0.0-0.2 - 2.04 1.31

Figure 1: Total incremental carbon pool (‘000 tC) for the project area in Kolar