Methodological challenges in assessing the environmental status of a marine ecosystem: case study of...
10
Methodological Challenges in Assessing the Environmental Status of a Marine Ecosystem: Case Study of the Baltic Sea Henn Ojaveer 1 * . , Margit Eero 2. 1 Estonian Marine Institute, University of Tartu, Pa ¨rnu, Estonia, 2 National Institute of Aquatic Resources, Technical University of Denmark, Charlottenlund, Denmark Abstract Assessments of the environmental status of marine ecosystems are increasingly needed to inform management decisions and regulate human pressures to meet the objectives of environmental policies. This paper addresses some generic methodological challenges and related uncertainties involved in marine ecosystem assessment, using the central Baltic Sea as a case study. The objectives of good environmental status of the Baltic Sea are largely focusing on biodiversity, eutrophication and hazardous substances. In this paper, we conduct comparative evaluations of the status of these three segments, by applying different methodological approaches. Our analyses indicate that the assessment results are sensitive to a selection of indicators for ecological quality objectives that are affected by a broad spectrum of human activities and natural processes (biodiversity), less so for objectives that are influenced by a relatively narrow array of drivers (eutrophications, hazardous substances). The choice of indicator aggregation rule appeared to be of essential importance for assessment results for all three segments, whereas the hierarchical structure of indicators had only a minor influence. Trend-based assessment was shown to be a useful supplement to reference-based evaluation, being independent of the problems related to defining reference values and indicator aggregation methodologies. Results of this study will help in setting priorities for future efforts to improve environmental assessments in the Baltic Sea and elsewhere, and to ensure the transparency of the assessment procedure. Citation: Ojaveer H, Eero M (2011) Methodological Challenges in Assessing the Environmental Status of a Marine Ecosystem: Case Study of the Baltic Sea. PLoS ONE 6(4): e19231. doi:10.1371/journal.pone.0019231 Editor: Howard Browman, Institute of Marine Research, Norway Received December 10, 2010; Accepted March 23, 2011; Published April 29, 2011 Copyright: ß 2011 Ojaveer, Eero. This is an open-access article distributed under the terms of the Creative Commons Attribution License, which permits unrestricted use, distribution, and reproduction in any medium, provided the original author and source are credited. Funding: The study was supported by EU FP6 and FP7 research projects IMAGE (044227), MEECE (212085) and VECTORS (266445), Estonian Ministry of Education and Research (SF0180005s10), and Danish Network for Fisheries and Aquaculture Research (FISHNET). The funders had no role in study design, data collection and analysis, decision to publish, or preparation of the manuscript. Competing Interests: The authors have declared that no competing interests exist. * E-mail: [email protected] . These authors contributed equally to this work. Introduction An ecosystem approach to management (EAM) of the marine environment with the primary goal to achieve sustainable use of its goods and services is included in several policy documents at global and regional levels (e.g., [1,2]). Such an approach to management requires, among other things, integrated ecosystem assessments to inform management decisions and regulate human pressures [3,4,5]. Indicators are generally accepted as tools for evaluating the status of marine environments in relation to management targets or thresholds [2,6]. Despite the crucial role of indicators in helping to safeguard and manage environmental values, indicator-based ecosystem assessments entail challenges. A large part of related research has dealt with the characteristics of a good indicator [7,8,9]. Deriving appropriate thresholds is usually even more challenging than developing the indicators themselves [5,10]. Substantially less research has focused on the sensitivity of the assessment results to the choice of indicators and the assessment methodologies applied, and on related uncertainties in overall evaluation of environmental status of an ecosystem. In the Baltic Sea, recent policy-oriented actions toward regional application of an ecosystem approach to management of marine ecosystems are among the strongest in Europe. The Baltic Marine Environment Protection Commission (Helsinki Commission, HELCOM) has adopted the Baltic Sea Action Plan (BSAP) to help the Baltic Sea achieve ‘‘good environmental status by 2021’’ [11]. The four strategic goals defined in BSAP are ‘‘Baltic Sea unaffected by eutrophication,’’ ‘‘Baltic Sea with life undisturbed by hazardous substances,’’ and ‘‘Maritime activities carried out in an environmentally friendly way,’’ all of which should lead to a ‘‘Favourable conservation status of biodiversity.’’ Recent thematic assessments of two of the BSAP strategic goals (biodiversity and eutrophication) [12,13] provide systematic overviews both on the available datasets and on the dynamics of various ecosystem components related to these sectorial topics. Initial holistic assessment of the ecosystem health of the Baltic Sea [14] has evaluated progress of the implementation of BSAP, though the assessment is considered preliminary and requires further improvement both in methodology and in a knowledge base [14]. Further, the methodologies used in these assessments are neither entirely unified nor fully transparent. In addition to the activities led by HELCOM, integrated ecosystem assessments in several sub-areas of the Baltic Sea have recently been carried out by ICES [15]. These analyses have used more sophisticated and unified methodology, however, have mainly focused on identifying and characterizing the ecological PLoS ONE | www.plosone.org 1 April 2011 | Volume 6 | Issue 4 | e19231
-
Upload
independent -
Category
Documents
-
view
1 -
download
0
Transcript of Methodological challenges in assessing the environmental status of a marine ecosystem: case study of...
Methodological Challenges in Assessing theEnvironmental Status of a Marine Ecosystem: Case Studyof the Baltic SeaHenn Ojaveer1*., Margit Eero2.
1 Estonian Marine Institute, University of Tartu, Parnu, Estonia, 2 National Institute of Aquatic Resources, Technical University of Denmark, Charlottenlund, Denmark
Abstract
Assessments of the environmental status of marine ecosystems are increasingly needed to inform management decisionsand regulate human pressures to meet the objectives of environmental policies. This paper addresses some genericmethodological challenges and related uncertainties involved in marine ecosystem assessment, using the central Baltic Seaas a case study. The objectives of good environmental status of the Baltic Sea are largely focusing on biodiversity,eutrophication and hazardous substances. In this paper, we conduct comparative evaluations of the status of these threesegments, by applying different methodological approaches. Our analyses indicate that the assessment results are sensitiveto a selection of indicators for ecological quality objectives that are affected by a broad spectrum of human activities andnatural processes (biodiversity), less so for objectives that are influenced by a relatively narrow array of drivers(eutrophications, hazardous substances). The choice of indicator aggregation rule appeared to be of essential importancefor assessment results for all three segments, whereas the hierarchical structure of indicators had only a minor influence.Trend-based assessment was shown to be a useful supplement to reference-based evaluation, being independent of theproblems related to defining reference values and indicator aggregation methodologies. Results of this study will help insetting priorities for future efforts to improve environmental assessments in the Baltic Sea and elsewhere, and to ensure thetransparency of the assessment procedure.
Citation: Ojaveer H, Eero M (2011) Methodological Challenges in Assessing the Environmental Status of a Marine Ecosystem: Case Study of the Baltic Sea. PLoSONE 6(4): e19231. doi:10.1371/journal.pone.0019231
Editor: Howard Browman, Institute of Marine Research, Norway
Received December 10, 2010; Accepted March 23, 2011; Published April 29, 2011
Copyright: � 2011 Ojaveer, Eero. This is an open-access article distributed under the terms of the Creative Commons Attribution License, which permitsunrestricted use, distribution, and reproduction in any medium, provided the original author and source are credited.
Funding: The study was supported by EU FP6 and FP7 research projects IMAGE (044227), MEECE (212085) and VECTORS (266445), Estonian Ministry of Educationand Research (SF0180005s10), and Danish Network for Fisheries and Aquaculture Research (FISHNET). The funders had no role in study design, data collection andanalysis, decision to publish, or preparation of the manuscript.
Competing Interests: The authors have declared that no competing interests exist.
* E-mail: [email protected]
. These authors contributed equally to this work.
Introduction
An ecosystem approach to management (EAM) of the marine
environment with the primary goal to achieve sustainable use of its
goods and services is included in several policy documents at
global and regional levels (e.g., [1,2]). Such an approach to
management requires, among other things, integrated ecosystem
assessments to inform management decisions and regulate human
pressures [3,4,5]. Indicators are generally accepted as tools for
evaluating the status of marine environments in relation to
management targets or thresholds [2,6]. Despite the crucial role of
indicators in helping to safeguard and manage environmental
values, indicator-based ecosystem assessments entail challenges. A
large part of related research has dealt with the characteristics of a
good indicator [7,8,9]. Deriving appropriate thresholds is usually
even more challenging than developing the indicators themselves
[5,10]. Substantially less research has focused on the sensitivity of
the assessment results to the choice of indicators and the
assessment methodologies applied, and on related uncertainties
in overall evaluation of environmental status of an ecosystem.
In the Baltic Sea, recent policy-oriented actions toward regional
application of an ecosystem approach to management of marine
ecosystems are among the strongest in Europe. The Baltic Marine
Environment Protection Commission (Helsinki Commission,
HELCOM) has adopted the Baltic Sea Action Plan (BSAP) to
help the Baltic Sea achieve ‘‘good environmental status by 2021’’
[11]. The four strategic goals defined in BSAP are ‘‘Baltic Sea
unaffected by eutrophication,’’ ‘‘Baltic Sea with life undisturbed by
hazardous substances,’’ and ‘‘Maritime activities carried out in an
environmentally friendly way,’’ all of which should lead to a
‘‘Favourable conservation status of biodiversity.’’
Recent thematic assessments of two of the BSAP strategic goals
(biodiversity and eutrophication) [12,13] provide systematic
overviews both on the available datasets and on the dynamics of
various ecosystem components related to these sectorial topics.
Initial holistic assessment of the ecosystem health of the Baltic Sea
[14] has evaluated progress of the implementation of BSAP,
though the assessment is considered preliminary and requires
further improvement both in methodology and in a knowledge
base [14]. Further, the methodologies used in these assessments
are neither entirely unified nor fully transparent.
In addition to the activities led by HELCOM, integrated
ecosystem assessments in several sub-areas of the Baltic Sea have
recently been carried out by ICES [15]. These analyses have used
more sophisticated and unified methodology, however, have
mainly focused on identifying and characterizing the ecological
PLoS ONE | www.plosone.org 1 April 2011 | Volume 6 | Issue 4 | e19231

regime shifts (e.g., [16,17]), with only limited direct implications
for the policy and governance regarding the BSAP [18].
In addition to the datasets used in these systematic assessments,
large amount of monitoring data is regularly gathered by
HELCOM, and published in the form of Indicator Fact Sheets.
This knowledge base, containing ecosystem information from
hydrography to the upper trophic levels, has never been analysed
in a systematic way, nor has the performance of these indicators
been evaluated in relation to the agreed goals of BSAP. Further,
reference levels for indicators corresponding to thesepolicy goals,
are largely not defined as yet. Thus, indicator-based ecosystem
assessment (and management) of the Baltic Sea is facing a number
of future challenges.
In this paper, we use the central Baltic Sea as a case study to
investigate some criticial methodological aspects involved in a
holistic ecosystem assessment. Based on the best available scientific
knowledge, we first define thresholds for all available indicators.
We then conduct ecosystem assessments by the three major BSAP
strategic goals (biodiversity, eutrophiction and hazardous sub-
stances), applying different methodological approaches. We
particularly focus on i) the sensitivity of assessment results to
different indicator aggregation rules, and ii) the trend analyses as
an alternative or supplement to an evaluation in relation to
indicator thresholds. Our aim is to identify which conclusions
concerning the status of the three BSAP segments are robust to the
selection of indicators and assessment methodologies, and where
the methodological choices are critical for the outcome of the
assessment. Our analyses can, thus, help establish priorities for
future efforts to improve assessment of environmental status and
can help to enhance the transparency of the assessment procedure
in the Baltic Sea and elsewhere.
Materials and Methods
General description of the study areaThe Baltic Sea is epicontinental and semienclosed sea with total
volume of about 226103 km3 and the mean depth of 60 m. It is
situated in the transition area of Atlantic marine and Eurasian
continental climate systems. The Baltic Sea is characterized by a
strong southwest-northeast salinity gradient (with saline water
inflow from southwest) and north-south temperature gradient. It is
composed of three macroregions – the Transition Area, Large
Gulfs and the Baltic Proper [19], the latter being the focus area of
this paper.
The Baltic Sea was formed after the last glaciation with the
contemporary ‘‘ecological age’’ of about 8,000 years. Large
catchment area with about 85 million inhabitants and long water
residence time (25–35 years) [20] make the Baltic Sea especially
vulnerable to a variety of human activities. The most important
human activities influencing the environmental status of the Baltic
Sea are pollution, maritime shipping, fisheries, nutrient input [21],
and recently also increasing energy production and pipelines.
Objectives and indicatorsThis paper focuses on three overarching strategic goals of the
HELCOM BSAP, i.e., biodiversity, eutrophication and hazardous
substances, and the specific agreed ecological objectives related to
each goal [11]. As a first step, we compiled all available datasets
that could be used as indicators of the status of the central Baltic
Sea in relation to these objectives. We used in totoal 110 state
indicators, 30 of which were related to biodiversity, 25 to
eutrophication and 55 to hazardous substances. These data were
supplemented by 32 indicators of human pressures. For the
purpose of this paper, no prior selection of indicators was made,
but all available relevant datasets for which thresholds (see below)
could be defined, were included in the analyses.
Detailed descriptions of each indicator, time period of coverage,
and data sources are provided in Tables S1, S2, S3, S4 and Text
S1.
Indicator thresholdsFor each state indicator time series, we defined two of the three
thresholds, that is, a value representing reference (target),
acceptable, or bad conditions. The defined values with detailed
justifications are provided in Table S2 and Text S1. The basic
criteria used for defining indicator thresholds are described below.
‘‘Reference’’ conditions were defined as:
i) The level which can be considered natural. This was based
either on long-term data extending back to historical time-
periods when human impact was low or on the information
from other areas where particular issue is not of major
concern.
ii) The level, which corresponds to a condition where recovery
of an organism group from a long-lasting and severe human
pressure has taken place.
iii) Desirable level, where this is straightforward to define (e.g.,
no presence of organic pollutants that naturally do not
occur in the marine environment or indicator levels that
correspond to normal reproduction of marine organisms).
iv) Observed conditions if these have been more positive than
the levels, which have been defined as acceptable in some
EU or national regulation.
‘‘Acceptable’’ conditions were defined:
i) The level set by EU or national regulations (e.g., concentra-
tion of residual contaminants in fish).
ii) Expert-opinion based deviation from the reference condi-
tions.
iii) The level below which the situation is considered to become
critical (e.g., requires extra management action, critical for
reproduction of marine organisms etc.).
Thresholds corresponding to ‘‘bad’’ conditions were defined:
i) The most negative situation observed during the available
time-series, after which conditions have improved.
ii) The level corresponding to a reproduction failure of some
marine organisms.
Indicator transformationUsing the defined thresholds, the individual indicator time series
were transformed to common units on a scale from 21 to 1, which
is a standard procedure in knowledge-based systems [22]. For
every indicator, the transformation returns a value of 21 at a
threshold that corresponds to ‘‘bad’’ conditions (X21) and a value
of 1 at a threshold that corresponds to ‘‘reference’’ conditions (X1).
The threshold corresponding to ‘‘acceptable’’ conditions (X0)
returns a transformation value of zero. The transformed
equivalents for original values between the thresholds were
calculated assuming a linear relationship. For indicators for which
thresholds for X0 and X1 were defined, the linear relationship was
subsequently extended to obtain negative transformed values; the
value corresponding to 21 thus became the same distance from X0
as the distance of X1 from X0, determined by the defined
thresholds. Similarly, when thresholds for X21 and X0 where
Environmental Status of the Baltic Sea
PLoS ONE | www.plosone.org 2 April 2011 | Volume 6 | Issue 4 | e19231

defined, the linear relationship was extended to identify X1. When
thresholds corresponding to X21 and X1 were defined, the whole
range of intermediate values between 21 and 1 were derived
directly from the linear relationship between the original and
transformed values. The values outside the range of 21 to 1 in the
transformed scale were set to 21 or 1, respectively, before
aggregation of indicators.
Potential nonlinear relationships between the indicator values
and the corresponding status of an ecosystem could be expected.
However, the shape of these functions is seldom known and would
likely be indicator-specific. In a holistic ecosystem assessment,
involving a large number of indicators, consistent treatment of all
indicators may be preferred. Linear approximation for transform-
ing values between the thresholds is commonly used (e.g., [22])
and this approach was also adopted here.
To visualize long-term changes in the status of different
components of the ecosystem, the transformed continuous scale
(from 21 to 1) was converted into a five-point scale, each of the
resulting five categories representing an interval on a continuous
scale.
Indicator aggregationA holistic ecosystem assessment requires integration of infor-
mation from a large number of individual indicators into an
overall evaluation of the state of the ecosystem. Different
methodologies can be applied for aggregating indicators, which
vary, amongst others, in the way the outliers influence the
aggregate value. The choice of indicator aggregation methodology
can therefore be essentially important to the overall outcome of the
assessment. In this paper, we have applied six different aggregation
procedures of transformed indicators to evaluate the state of the
ecosystem. Each aggregation procedure resulted in a single value
related to each objective and further to each overarching goal.
The aggregation rules applied were:
i) Hierarchical mean (see Tables S3 for the structure of
aggregation), where at each step of aggregation, the
transformed indicator values were averaged.
ii) Hierarchical median (at each step of aggregation, the
median of transformed indicator values was applied).
iii) Hierarchical fuzzy AND (at each step of aggregation, the
fuzzy AND rule [22] was applied; see also below).
iv-vi) Similar to (i–iii), but applying flat, i.e. non-hieracrhical
aggregation instead of hierarchical one, for mean, median
and fuzzy AND rules. Flat aggregation implies that all
indicators related to a particular objective were aggregated
at the same level, without prior groupings.
The fuzzy AND [22] is calculated as
AND(a)~
MIN(a)z½AVERAGE(a){MIN(a)�:½(MIN(a)z1)=2�,
where
MIN (a) is the minimum value of input variables
and
AVERAGE (a) is the average value of input variables.
Fuzzy AND is a conservative way of aggregation and gives an
aggregate close to the most negative value in an indicator suite.
Analyses of trendsWe analyzed trends in individual indicator time series to obtain
information on the current situation of the ecosystem, independent
of the challenges (such as definition of reference levels and
aggregation of indicators) related to the assessment described
above. Trends were estimated from linear regression using the i)
five and ii) ten most recent data points in an indicator time series.
The significant slope (p,0.1) was used as a criterion for identifying
either a positive or a negative trend.
Changes in human pressuresFor pressure indicators, we did not attempt to define thresholds
corresponding to target or acceptable levels, due to lack of relevant
scientific basis. Instead, we show temporal developments in
selected human pressures, both as trends in recent years and as
longer term developments. Recent trends were estimated from
linear regression, using the five most recent data points in a time-
series. Long-term changes in pressures were shown relative to the
highest level observed in the available time series. Some pressures
presented in this paper are aggregates of several indicators (Tables
S1 and S4).
Results
Current state of the ecosystem applying differentindicator aggregation rules
The assessment of current environmental status based on
average values of indicators suggests that, of the three BSAP
strategic goals, the goal related to hazardous substances is
currently being met at an acceptable level, as all affiliated
objectives received positive scores in the evaluation (Figure 1). In
contrast, all ecological quality objectives related to eutrophication
received negative scores (Figure 1). Similarily, the overall status of
biodiversity was evaluated as negative, with habitats and
communities scored in poor condition, whereas some objectives
(populations) received slightly positive values (Figure 1).
For eutrophication and hazardous substances, the assessment
results based on medians were very similar to these applying the
average values of indicators. However, substantial differences were
evident between average and median based assessments for
biodiversity. The assessment based on medians resulted in most
negative overall score, similar to the asssement applying the
conservative fuzzy AND rule. This is due to only a few indicator
datasets being available for habitats and communities (Table S3)
with most of them showing strongly negative values (Figure 2).
Application of the conservative fuzzy AND rule resulted in the
most negative scores in the assessment scale for most of the
objectives by all three overarching strategic goals of BSAP (Figure
1). This assessment result is due to a fact that for nearly all of the
ecological quality objectives, the current status of at least one
affiliated indicator was strongly negative. The strong negativity of
these indicators drove the outcome of an assessment when
applying the conservative aggregation rule and resulted in an
evaluation score close to the most negative value in an indicator
suite.
The level of hierarchy applied in the aggregation of indicators
appeared not to have a substantial influence on the outcome of the
assessment. The results from non-hierarchical aggregation were
generally similar to hierarchical assessment, regardless of the
aggregation rule applied (i.e., average, median or fuzzy AND).
However, some differences were apparent. For objectives where
positive indicator scores dominated over negative ones, application
of flat aggregation method resulted in a more positive evaluation
compared to the hierarchical one. This is most evident for
objectives related to hazardous substances (Figure 1,2). However,
the opposite is apparent for biodiversity, where the dominant
negative indicator values resulted in slightly more negative overall
Environmental Status of the Baltic Sea
PLoS ONE | www.plosone.org 3 April 2011 | Volume 6 | Issue 4 | e19231

evaluation when applyingflat aggregation method, compared to
hierarchical aggregation.
Long-term changes in state and pressuresLong-term performance (since the 1970s) of the state of different
components of the ecosystem and environment was presented for
the assessment applying hierarchical average for aggregating
indicators. Long-term developments supported, in general, the
basic conclusions drawn for the current situation. The state of
eutrophication has become considerably worse since at least the
early 1970s, and only marginal improvement in a few state
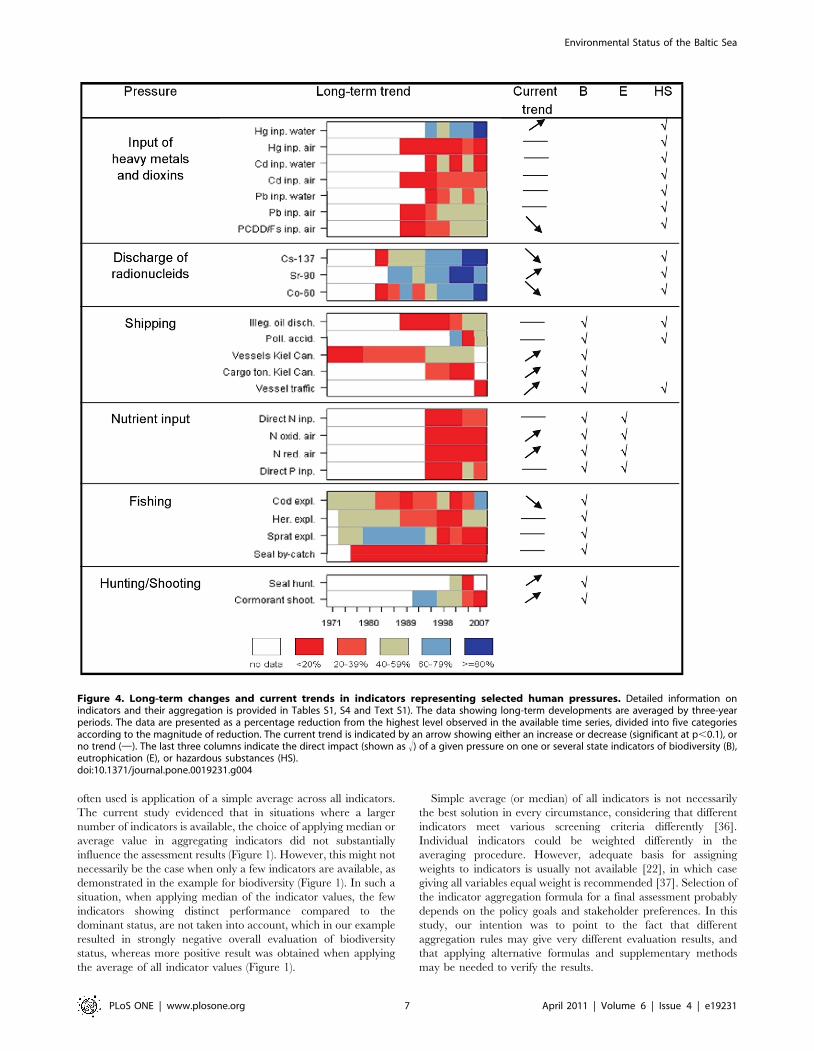
indicators has been observed in recent years (Figure 3). Despite a
substantial reduction in riverine and direct point source inputs of
nutrients since the 1990s (Figure 4), the overall status of
eutrophication does not indicate a corresponding improvement.
In contrast, evaluations of most of the indicators describing the
status of hazardous substances have become more positive, despite
unfavorable developments in residuals of some brominated and
fluorinated compounds in biota (Figure 3). Positive developments
are also apparent in several human pressures influencing the status
of hazardous substances in the Baltic Sea (Figure 4).
Long-term dynamics of indicators within the biodiversity
segment were more variable and changes in the overall
biodiversity status were therefore less conclusive. Like the large
variability observed in the current status of different biodiversity
components (Figure 2), distinct and sometimes opposite dynamics
were also apparent (Figure 3). Some indicators displayed a
consistently negative status over the decades studied (e.g., ringed
seals); populations of several seabirds and also grey seal, which
have suffered under heavy human impacts, have recovered with
an increase in several times in abundance, but several fish
populations exhibited variable and species-specific patterns.
Pressures that influence biodiversity were also variable. These
pressures include different dynamics and levels of exploitation of
fish populations, still high nutrient loads, and increased intensity of
maritime transport as well as reduced input of toxic pollution and
general progress in nature protection.
Short-term trends in state and pressuresThe analyses of short-term trends (over 5- and 10-year periods)
in state indicator time series suggest that among the three strategic
goals, eutrophication is of greatest concern. Of the indicators
related to eutrophication, a larger proportion (about 35%) exhibits
a significant negative trend during the past 10 years, whereas 25%
show a significant positive development (Figure 5B). During the
recent 5-year period, majority of the indicators related to
eutrophication did not show any significant trends; while the few
significant trends identified were largely negative (Figure 5A). In
Figure 1. Current status of the central Baltic Sea ecosystem by overarching strategic goals and ecological objectives [11]. Thenegative values (marked in red) represent below acceptable or neutral status (zero-level) and positive values (marked in blue) represent the statusabove neutral. The different values on panels A and B are calculated based on (i) average of respective indicators (filled circles), (ii) median values ofindicators (triangles), and (iii) applying the fuzzy AND rule for indicator aggregation (crosses). Panel A: indicators are aggregated hierarchically; panelB: flat (i.e., non-hierarchical) aggregation is applied.doi:10.1371/journal.pone.0019231.g001
Environmental Status of the Baltic Sea
PLoS ONE | www.plosone.org 4 April 2011 | Volume 6 | Issue 4 | e19231

contrast, positive trends clearly dominated amongst indicators
related to hazardous substances. Similarly to eutrophication, more
significant trends in hazardous substances were apparent at a
longer (10-year) time scale compared to a 5-year period. Within
the biodiversity component, positive trends dominated over
negative ones; however, only less than 25% of indicators showed
significant trends. This pattern was similar both for the 5- and 10 -
year period. However, it should be noted, that several datasets
related to biodiversity were short (Figure 3), and trends could
therefore not be estimated.
Recent developments in human pressures confirm the worrying
signals related to the poor status of eutrophication. Atmospheric
inputs have increased in recent years, whereas the inputs of nutrients
from point sources have remained relatively unchanged, indicating
no significant reduction in nutrient loads in recent times (Figure 4).
Recent developments in pressures of human activity related to
hazardous substances and biodiversity were less conclusive. The
pressures currently increasing in the Baltic Sea include intensified
shipping activities and increased inputs of some pollutants (e.g.,
waterborne input of mercury). In addition, removal of marine
organisms at upper trophic levels, such as hunting of grey seals (which
was banned for some decades and recently restarted) and shooting of
cormorants, is currently increasing, although it is probably still not at
a level that affects the status of these populations (Figure 4).
Discussion
GeneralDepending on the spatial/sectoral scales, data availability, and
management objectives, several assessment approaches and
frameworks related to an ecosystem approach to management of
marine environments have been developed in recent years (e.g.,
[5,22,23,24]). However, most of the related studies focus on the
outcomes of evaluations and corresponding management actions,
whereas less attention has been paid to the evaluation procedure
itself and the methodological challenges associated with it. The
process of assessing the environmental status of an ecosystem can
be divided roughly into three steps: (i) gathering data and selecting
indicators of a sufficiently broad array of components related to
given objectives; (ii) defining targets or reference values for
indicators; (iii) assessing the overall status by combining informa-
tion from different indicators. In the following sections we discuss
some of the challenges associated with each of these steps, how we
have approached these challenges, and which general conclusions
could be drawn concerning the importance of these issues for the
outcome of an assessment.
Indicator selectionThe central position of indicators at the interface between
science and policy points to the importance of their careful
selection for management purposes [8]. In practice, identifying
appropriate datasets that meet the criteria of an efficient
environmental indicator [25] is challenging because of issues such
as lack of consistent indicator-evaluation frameworks and
institutional commitments for regular data collection [26].
Consequently, a sound management strategy could be to employ
a range of indicators to reduce uncertainty resulting from drawing
conclusions based on a single indicator [27,28,29]. In this paper,
we have followed the latter approach, using all available datasets
related to the agreed ecological objectives as indicators, given that
sufficient knowledge was available to define reference levels.
Our results show that state indicators related to eutrophica-
tion and hazardous substances performed relatively homoge-
nously (Figure 2). This suggests that for these segments of the
ecosystem that are influenced by a relatively narrow array of
drivers and specific kinds of human activities (e.g., eutrophica-
tion and hazardous substances), indicator selection and avail-
ability are not crucial, as performance of most of the indicators
is similar. The situation is different for biodiversity, which is
influenced by a variety of human activities both on land and at
sea, as well as by climate change, ecological interactions, and
conservation measures [30]. Biodiversity status is consequently
associated with a broader spectrum of indicators, which may
show heterogenous performance as evidenced in the data for the
Baltic Sea (Figures 2, 3). For biodiversity, the selection of
indicators is therefore crucial because the inclusion or exclusion
of certain indicator series might lead to a different evaluation of
the overall status.
Adding to the essential complexity of evaluation and manage-
ment of biodiversity [31], there is a shortage of indicators for some
ecological objectives related to biodiversity in the central Baltic
Sea (Table S1). There is also a shortage of indicator time series
related to human pressures affecting all the three studied segments
of environmental status of the central Baltic Sea. This shortage is a
general problem also encountered elsewhere (e.g. [32]). Due to
greater variability of trends, incomplete coverage of pressures
should be considered most problematic for biodiversity and less so
for hazardous substances and eutrophication (Figure 4).
Figure 2. Current states of individual indicators related to agiven ecological objective and overarching strategic goal. Thecurrent states are shown as a proportional distribution among fivecategories (obtained by dividing the scale from 21 to 1 into fiveintervals differentiated by colors).doi:10.1371/journal.pone.0019231.g002
Environmental Status of the Baltic Sea
PLoS ONE | www.plosone.org 5 April 2011 | Volume 6 | Issue 4 | e19231

Indicator reference levels and aggregationIn a regulatory context, it is necessary to relate indicators to
targets or thresholds that determine the necessity of management
actions [7,10]. However, defining these thresholds and reference
states that represent ‘‘good environmental status’’ is one of the
greatest challenges to practical implementation of an ecosystem
approach to management of marine environments [33]. A ‘‘good’’
status can have many interpretations depending on, for example,
public understanding and involvement and different human values
[33,34].
We have tried, where possible, to base our reference levels on
scientific criteria and to use the available information from time
periods when relevant human pressures were low. Nevertheless,
we recognize that several of the thresholds used in this study
could also be defined differently. Further, some thresholds might
change in future, for example due to climate change, which can
potentially result in ecological regime shifts [17], where certain
reference levels may become unrealistic to achieve. Uncertainty
about reference conditions for management is generally consid-
ered one of the greatest weaknesses in existing evaluations of the
status of subcomponents of the Baltic ecosystem (e.g., [35]), and
future debate in this area should be expected. The reference
values we have used in this study could contribute to future work
in this area.
An important aspect in reference-based assessment appears to
be selection of an indicator aggregation formula. Our analyses
showed that the assessment results can be highly sensitive to
aggregation rules. The way the indicators are hierarchically
arranged influences the assessment results as well, however, these
effects were considerably less important than those related to
application of different aggregation rules. As shown in our study,
application of the widely used ‘‘one out – all out’’ principle (similar
to fuzzy AND rule) could easily result in a fully negative overall
evaluation for all objectives (Figure 1). The assessment based on
this methodology is certainly very conservative from the
management perspective and probably ensures a full implemen-
tation of precautionary principles. However, a drawback of this
approach is that a few strongly negative indicator values could
shadow the potentially generally positive state of a given ecological
objective. This would make any progress towards improving the
environmental status invisible, as long as at least one indicator is
showing poor performance. An alternative method that is very
Figure 3. Long-term changes in the state of selected aggregate indicators of the central Baltic Sea. The results are obtained throughhierarchical averaging of indicators (see Material and Methods for details) representing the ecological objectives related to biodiversity,eutrophication, and hazardous substances (see Tables S1, S2, S3 and Text S1 for details). The data are averaged by three-year periods and thetransformed values (in the scale from 21 to 1) are grouped into five categories shown by colors.doi:10.1371/journal.pone.0019231.g003
Environmental Status of the Baltic Sea
PLoS ONE | www.plosone.org 6 April 2011 | Volume 6 | Issue 4 | e19231
often used is application of a simple average across all indicators.
The current study evidenced that in situations where a larger
number of indicators is available, the choice of applying median or
average value in aggregating indicators did not substantially
influence the assessment results (Figure 1). However, this might not
necessarily be the case when only a few indicators are available, as
demonstrated in the example for biodiversity (Figure 1). In such a
situation, when applying median of the indicator values, the few
indicators showing distinct performance compared to the
dominant status, are not taken into account, which in our example
resulted in strongly negative overall evaluation of biodiversity
status, whereas more positive result was obtained when applying
the average of all indicator values (Figure 1).
Simple average (or median) of all indicators is not necessarily
the best solution in every circumstance, considering that different
indicators meet various screening criteria differently [36].
Individual indicators could be weighted differently in the
averaging procedure. However, adequate basis for assigning
weights to indicators is usually not available [22], in which case
giving all variables equal weight is recommended [37]. Selection of
the indicator aggregation formula for a final assessment probably
depends on the policy goals and stakeholder preferences. In this
study, our intention was to point to the fact that different
aggregation rules may give very different evaluation results, and
that applying alternative formulas and supplementary methods
may be needed to verify the results.
Figure 4. Long-term changes and current trends in indicators representing selected human pressures. Detailed information onindicators and their aggregation is provided in Tables S1, S4 and Text S1). The data showing long-term developments are averaged by three-yearperiods. The data are presented as a percentage reduction from the highest level observed in the available time series, divided into five categoriesaccording to the magnitude of reduction. The current trend is indicated by an arrow showing either an increase or decrease (significant at p,0.1), orno trend (—). The last three columns indicate the direct impact (shown as !) of a given pressure on one or several state indicators of biodiversity (B),eutrophication (E), or hazardous substances (HS).doi:10.1371/journal.pone.0019231.g004
Environmental Status of the Baltic Sea
PLoS ONE | www.plosone.org 7 April 2011 | Volume 6 | Issue 4 | e19231

Trend-based assessmentWhen sufficient knowledge is lacking to establish quantitative
reference levels, and indicator aggregation is posing challenges, a
possible alternative approach is trend-based assessment [38].
Under certain conditions, knowledge of the direction of trends in
the indicators can be sufficient to support the management
decision-making process [39]. In our example, the trend-based
assessment results (Figure 5) confirmed conclusions drawn from
the reference-based assessments, which applied average or median
values in the indicator aggregation process (Figure 1), i.e., poor
status of eutrophication, more positive signs for hazardous
substances and variable developments within biodiversity. An
advantage of a trend-based approach is that it provides a purely
observation-based perspective in the performance of indicators, as
it is not influenced by potentially subjective or policy-driven
definitions of reference values, as well as choices of indicator
aggregation methods. Therefore, trend-based analyses would be a
good supplement to verify the results of a reference-based
assessment.
An important prerequisite, which may often limit conducting
trend-based assessments, is the availability of indicator datasets
extending for several years back in time. In difference, the current
status in relation to indicator thresholds can be evaluated based on
data from a few recent years only. However, longer time-series are
valuable, also in a refrence-based assessment (Figure 3), for an
adequate evaluation of current situation. Further, information on
long-term developments could provide an invaluable basis for
defining reference conditions (e.g., [40]). Establishing time-series
of indicator measurements should therefore be prioritized.
In the analyses investigating short-term trends, a critical aspect
to be considered is the length of the time period included in the
analysis, which may be important for interpretation of the results.
Ecological and environmental datasets are often noisy (e.g., [13]).
Thus, indicator trends over a relatively short period of time would
seldom be significant. Further, significant developments may be
undetectable also on relatively longer time-scales whenindicator
values are influenced by ecological processes, which are slow to
respond to changes in corresponding pressures (i.e., eutrophica-
tion, Figure 5). For example, despite of a large reductions in
nutrient inputs to the Baltic Sea since the 1990s (Figure 4), there
has been only marginal, if any, measurable improvement in
observed nutrient concentrations. Moreover, the status of other
eutrophication indicators has generally worsened since then. In
contrast, substantially reduced inputs of radionuclides and some
toxic compounds and a ban on use of some others (e.g., DDT)
have already resulted in significant improvements in the health of
structural components of animal populations and communities.
Further, abundances of marine animal populations may change
rapidly, e.g. the biomass of eastern Baltic cod has more than
tripled during recent few years [41]. Thus, indicators influenced
by different pressures may respond to changes in these pressures
with different time-lags. This is important to take into account for
setting a time line for trend-analyses as some recent developments
may not appear significant at longer time-scales, whereas gradual
changes in some other variables may not be visible at short time
scales.
Conclusions and future challengesOut of the three BSAP overarching strategic goals, potentially
the largest uncertainty is involved in evaluation of the status of
biodiversity, mainly because of the variable performance of related
indicators. Consequently, evaluation of the status of biodiversity
Figure 5. Significant trends in individual state of indicators in the central Baltic Sea. The trends are shown over the last five (panel A) andten (panel B) years as a proportional distribution between positive, negative, or no trend (shown by colors). No data refers to indicators for which datafor less than five or ten years were available.doi:10.1371/journal.pone.0019231.g005
Environmental Status of the Baltic Sea
PLoS ONE | www.plosone.org 8 April 2011 | Volume 6 | Issue 4 | e19231
appears to be essentially dependent on the availability and
selection of indicator time-series. Therefore, more emphasis
should be given in the near future to biodiversity assessments.
This work could include analysis of the major trophic levels (i.e.,
plankton, benthos, fish, birds, and mammals) and different habitats
separately, followed by development of formulas for an aggregate
biodiversity estimate.
The status of eutrophication of the central Baltic Sea was
evaluated to be poor, regardless of indicator selection and
assessment methodology. The status of hazardous substances
appears to be the best among the three strategic goals defined by
BSAP. These conclusions are generally in line with the HELCOM
initial holistic assessment [14]. Though, it should be noted that a
strongly negative status of hazardous substances could be
obtained, when applying most conservative indicator aggregation
rules. Concerning all segments of environmental status, the
assessment results are sensitive to reference level settings and to
indicator aggregation rules. Trend-based assessment is therefore
recommended as a useful supplement to reference-based evalua-
tion.
Much of the indicator development so far has concentrated on
the ecosystem state, while establishing links between state and
pressure largely remains a future challenge (e.g., [14,32,42]).
There is a general need to improve our basic understanding of
links between changes in external human drivers and the structure
and functioning of ecosystems. This would, amongst others, allow
setting realistic deadlines, when an improvement in the environ-
mental status may be expected, after a particular pressure has been
reduced. Such research should be given priority in further
development of indicator-based assessment and management of
the Baltic Sea. In addition, in those sectors where unacceptable
situations or undesired developments continue to occur, establish-
ing new and more ambitious management targets might be
needed.
Most advances in the work of developing indicators for an
ecosystem approach to management of the marine environment
have been related to ecological indicators, and less information is
available for socioeconomic and governance aspects. Increasing
demand for indicators in the two latter categories [43,44] also calls
for future emphasis on these categories for the Baltic Sea. The
available tools, such as the approach we have used in this study,
would allow for coherent integration of the entire spectrum of
indicators related to an ecosystem approach to management of
marine environments [22], which would then allow for a holistic
evaluation of the progress in implementing the EAM in the Baltic
Sea.
Supporting Information
Table S1 Description of indicators. Description of state and
pressure indicators with their acronyms as used in the paper, the
time period for which the indicator data were included in the
paper and data sources. For cited references, see Text S1.
(DOC)
Table S2 Indicator thresholds. Threshold values corresponding
to reference, acceptable or bad status for each state indicator
(shown by their acronyms; see Table S1 for description of
indicators), and rationale for the defined thresholds. For cited
references see Text S1.
(DOC)
Table S3 Structure for aggregating state indicators. Hierarchical
structure for aggregating state indicators (shown by their
acronyms; see Table S1 for indicator descriptions) into Objectives
and Goals via up to three intermediate steps (Steps 1–3).
(DOC)
Table S4 Structure for aggregating pressure indicators. Hierar-
chical structure for aggregating pressure indicators (shown by their
acronyms; see Table S1 for indicator descriptions) by sources of
pressure via an intermediate step (Step 1), where relevant.
(DOC)
Text S1 List of references cited in Tables S1, S2, S3, S4.
(DOC)
Acknowledgments
We are grateful to Maria Laamanen, Teija-Liisa Lehtinen, and Minna
Pyhala from HELCOM Secretariat for their assisstance in identifying data
sources and establishing contacts with relevant experts. Provision of data
and advice by Anders Bignert, Christoph Herrmann, Bjorn Helander,
Jakob Carstensen, Jerzi Bartnicki, Pekka Kotilainen, Stephan Gollasch,
and Ott Roots is gratefully acknowledged. We are also thankful for the
editorial assistance of Michele DuRand, Dale Langford and Bhavani
Narayanaswamy.
Author Contributions
Analyzed the data: ME HO. Contributed reagents/materials/analysis
tools: HO ME. Wrote the paper: HO ME.
References
1. WSSD (2002) United Nations Report on the World Summit on Sustainable
Development. Johannesburg, South Africa, 26 August–4 September 2002. 173 p.
2. Commission of the European Communities (CEC) (2008) Directive 2008/56/EC of
the European Parliament and the Council of 17 June 2008 establishing a framework
for community action in the field of marine environmental policy (Marine Strategy
Framework Directive). Official Journal of the European Union 164: 19–40.
3. Munoz-Erickson TA, Aguilar-Gonzalez B, Sisk TD (2007) Linking ecosystem
health indicators and collaborative management: A systematic framework to
evaluate ecological and social outcomes. Ecology and Society 12(2): 6. Available:
http://www.ecologyandsociety.org/vol12/iss2/art6/. Accessed 2010 Mar 01.
4. Kenny AJ, Skjoldal HR, Engelhard GH, Kershaw PJ, Reid, JB (2009) An
integrated approach for assessing the relative significance of human pressures
and environmental forcing on the status of Large Marine Ecosystems. Progress
in Oceanography 81: 132–148.
5. Levin PS, Fogarty MJ, Murawski SA, Fluharty D (2009) Integrated Ecosystem
Assessments: Developing the Scientific Basis for Ecosystem-Based Management
of the Ocean. PLoS Biology 7: 23–8.
6. USCOP (2004) An ocean blueprint for the 21st century. Final report,
Washington, DC: U.S. Commission on Ocean Policy. 522 p.
7. Fisher WS (2001) Indicators for human and ecological risk assessment: A US
EPA perspective. Human and Ecological Risk Assessment 7: 961–970.
8. Rice JC, Rochet M-J (2005) A framework for selecting a suite of indicators for
fisheries management. ICES Journal of Marine Sciences 62: 516–527.
9. Piet GJ, Jansen HM, Rochet M-J (2008) Evaluating potential indicators for an
ecosystem approach to fishery management in European waters. ICES Journal
of Marine Sciences 65: 1449–1455.
10. Rees HL, Hyland JL, Hylland K, Mercer Clarke CSL, Roff JC, et al. (2008)
Environmental indicators: Utility in meeting regulatory needs. An overview.
ICES Journal of Marine Sciences 65: 1381–1386.
11. HELCOM (2007) Baltic Sea Action Plan. Helsinki: HELCOM. 102 p.
12. HELCOM (2009) Biodiversity in the Baltic Sea – An integrated thematic
assessment on biodiversity and nature conservation in the Baltic Sea. Balt Sea
Environ Proc No 116B. Helsinki: HELCOM. 188 p.
13. HELCOM (2009) Eutrophication in the Baltic Sea – An integrated thematic
assessment of the effects of nutrient enrichment and eutrophication in the Baltic
Sea region. Balt Sea Environ Proc No 115B. Helsinki: HELCOM. 148 p.
14. HELCOM (2010) Ecosystem Health of the Baltic Sea 2003–2007: HELCOM
Initial Holistic Assessment. Baltic Sea Environmental Proceedings 122. Helsinki:
HELCOM. 64 p.
15. Bergstrom L, Diekmann R, Flinkman J, Gardmark A, Kornilovs G (2010)
Integrated ecosystem assessments of seven Baltic Sea areas covering the last three
decades. ICES Cooperative Research Report No 302. Copenhagen: ICES. 90 p.
Environmental Status of the Baltic Sea
PLoS ONE | www.plosone.org 9 April 2011 | Volume 6 | Issue 4 | e19231
16. Osterblom H, Hansson S, Larsson U, Hjerne O, Wulff F, et al. (2007) Human-
induced trophic cascades and ecological regime shifts in the Baltic Sea.Ecosystems 10: 877–889.
17. Mollmann C, Diekmann R, Muller-Karulis B, Kornilovs G, Plikshs M, et al.
(2009) Reorganization of a large marine ecosystem due to atmospheric andanthropogenic pressure: a discontinuous regime shift in the Central Baltic Sea.
Global Change Biology 15: 1377–1393.18. Osterblom H, Gardmark A, Bergstrom L, Muller-Karulis B, Folke C, et al.
(2010) Making the ecosystem approach operational – can regime shifts in
ecological-and governance systems facilitate the transition? Marine Policy 34:1290–1299.
19. Ojaveer E, Kalejs M (2008) On ecosystem-based regions in the Baltic Sea.Journal of Marine Systems 74: 672–685.
20. Lass H-U, Matthaus W (2008) General oceanography of the Baltic Sea. In:Feistel R, Nausch G, Wasmund N, eds. State and evolution of the Baltic Sea
1952-2005. Hoboken, N.J.: John Wiley & Sons, Inc. pp 5–44.
21. Costello MJ, Coll M, Danovaro R, Halpin P, Ojaveer H, et al. (2010) A Censusof Marine Biodiversity Knowledge, Resources, and Future Challenges. PLoS
ONE 5(8): e12110. doi:10.1371/journal.pone.0012110.22. Paterson B, Jarre A, Moloney CL, Fairweather TP, van der Lingen CD, et al.
(2007) A fuzzy-logic tool for multi-criteria decision making in fisheries: The case
of the South African pelagic fishery. Marine and Freshwater Research 58:1056–1068.
23. Johnson D (2008) Environmental indicators: Their utility in meeting the OSPARConvention’s regulatory needs. ICES Journal of Marine Sciences 65:
1387–1391.24. Nobre AM (2009) An Ecological and Economic Assessment Methodology for
Coastal Ecosystem Management. Environtal Management 44: 185–204.
25. OSPAR (2009) EcoQO Handbook. Handbook of the application of EcologicalQuality Objectives in the North Sea. Publication No. 307/2009. ISBN 978-1-
905859-46-7, London: OSPAR. 65 p.26. Cisin-Sain B (2007) Johannesburg Five Years on: Marine Policy and the World
Summit on Sustainable Development – How well are we doing? RGS-IBG
Conference People and the Sea. Greenwich: UK National Maritime Museum.27. Cairns J, McCormick PV, Niederlehner BR (1993) A proposed framework for
developing indicators of ecosystem health. Hydrobiology 263: 1–44.28. Fulton EA, Smith AD, Punt AE (2005) Which ecological indicators can robustly
detect effects of fishing? ICES Journal of Marine Sciences 62: 540–551.29. Link J (2005) Translating ecosystem indicators into decision criteria. ICES
Journal of Marine Sciences 62: 569–576.
30. Commission of the European Communities (CEC) (2006) Green Paper –towards a future maritime policy for the union: A European vision for the oceans
and seas, 7 June 2006, COM (2006) 275 final volume II – annex. 49 p.
31. Queffelec B, Cummins V, Bailly D (2009) Integrated management of marine
biodiversity in Europe: Perspectives from ICZM and the evolving EU Maritime
Policy framework. Marine Policy 33: 871–7.
32. Rogers SI, Greenaway B (2005) A UK perspective on the development of
marine ecosystem indicators. Marine Pollution Bulletin 50: 9–19.
33. Mee LD, Jefferson RL, Laffoley D d’A, Elliot M (2008) How good is good?
Human values and Europe’s proposed Marine Strategy Directive. Marine
Pollution Bulletin 56: 187–204.
34. Shields DJ, Solar SV, Martin WE (2002) The role of values and objectives in
communicating indicators of sustainability. Ecological Indicators 2: 149–160.
35. Andersen JH, Murray C, Kaartokallio H, Axe P, Molvaer J (2010) A simple
method for confidence rating of eutrophication status classifications. Marine
Pollution Bulletin; doi:10.1016/j.marpolbul.2010.03.020.
36. Shin Y-J, Shannon LJ, Bundy A, Coll M, Aydin K, et al. (2010) Using indicators
for evaluating, comparing, and communicating the ecological status of exploited
marine ecosystems. 2. Setting the scene. ICES Journal of Marine Sciences 67:
692–716.
37. Miller BJ, Saunders MC (2002) NetWeaver Reference Manual: a compendium
of NetWeaver and NetWeaver related terms, concepts and functions. Penn State
University and The Heron Group LLC. 126 p.
38. Rochet M-J, Trenkel VM, Bellail R, Coppin F, Le Pape O, et al. (2005)
Combining indicator trends to assess ongoing changes in exploited fish
communities: Diagnostic of communities off the coasts of France. ICES Journal
of Marine Sciences 62: 1647–1664.
39. Jennings S, Dulvy NK (2005) Reference points and reference directions for size-
based indicators of community structure. ICES Journal of Marine Sciences 62:
397–404.
40. Pinnegar JK, Engelhard GH (2008) The ‘shifting baseline’ phenomenon: A
global perspective. Reviews in Fish Biology and Fisheries 18: 1–16.
41. Cardinale M, Svedang H (2011) The beauty of simplicity in science: Baltic cod
stock improves rapidly in a ‘cod hostile’ ecosystem state. Marine Ecology
Progress Series 425: 297–301.
42. Piet GJ, van Overzee HMJ, Pastoors MA (2010) The necessity for response
indicators in fisheries management. ICES Journal of Marine Sciences 67:
559–566.
43. Bowen RE, Riley C (2003) Socio-economic indicators and integrated coastal
management. Ocean and Coastal Management 46: 299–312.
44. UNESCO (2006) A Handbook for Measuring the Progress and Outcomes of
Integrated Coastal and Ocean Management. Intergovernmental Oceanographic
Commission, Manuals and Guides 46. 217 p.
Environmental Status of the Baltic Sea
PLoS ONE | www.plosone.org 10 April 2011 | Volume 6 | Issue 4 | e19231