
Metallic Nanohole Arrays on Fluoropolymer Substrates as Small Label-Free Real-Time Bioprobes
11
Metallic Nanohole Arrays on Fluoropolymer Substrates as Small Label-Free Real-Time Bioprobes Jiun-Chan Yang †,‡ , Jin Ji † , James M. Hogle *,†,‡ , and Dale N. Larson *,†,‡,§ †Department of Biochemistry and Molecular Pharmacology, Harvard Medical School, 240 Longwood Avenue, Boston, Massachusetts 02115 USA ‡Harvard Center for Microfluidic and Plasmonic Systems 33 Oxford Street Cambridge, Massachusetts 02138 USA §The Charles Stark Draper Laboratory, 555 Technology Square, Cambridge, Massachusetts 02139 USA Abstract We describe a nanoplasmonic probing platform that exploits small-dimension (≤ 20 μm 2 ) ordered arrays of subwavelength holes for multiplexed, high spatial resolution, and real-time analysis on biorecognition events. Nanohole arrays are perforated on a super smooth gold surface (roughness RMS < 2.7 Å) attached on a fluoropolymer (FEP) substrate fabricated by a replica technique. The smooth surface of gold provides a superb environment for fabricating nanometer features and uniform immobilization of biomolecules. The refractive index matching between FEP and biological solutions contributes to ∼ 20% improvement on the sensing performance. Spectral studies on a series of small-dimension nanohole arrays from 1 μm 2 to 20 μm 2 indicate that the plasmonic sensing sensitivity improves as the gold-solution contact area increases. Our results also demonstrate that nanohole arrays with dimension as small as 1 μm 2 can be used to effectively detect biomolecular binding events and analyze the binding kinetics. The future scientific opportunities opened by this nanohole platform include highly multiplexed analysis of ligand interactions with membrane proteins on high quality supported lipid bilayers. Nanoplasmonic sensing is an emerging technique that utilizes the interaction of light with surface plasmons — collective oscillations of free electrons in the conduction band —in metallic nanostructures to transduce chemical bindings to signal for remote optical readout. With receptive biological macromolecules immobilized on nanostructured metal surfaces, whose length scale is close to the wavelength of light, the binding of target biomolecules leads to an increase of the local refractive index, which is then transduced into the change of spectral features observed at the far-field. The greatest attraction of nanoplasmonic sensing is it does not require extrinsic fluorescent or radioactive labeling (i.e. “label-free”), which would potentially change the binding properties of biomolecules and cause other significant problems like background binding and autofluorescence. 1 The small sensing volume resulting from short electromagnetic field decay length leads to high sensitivity for detection biomolecular binding events in local environments. Significant improvement in nanofabrication and nanomaterials synthesis in the past decade has allowed a variety of nanostructures to be utilized as nanoplasmonic sensors. A wide range of nanostructure shapes such as triangles, cubes, rods, and rings 2, 3 have been reported to exhibit high sensitivity based on localized surface plasmon resonance (LSPR) or coupled plasmonic resonance. The discovery of extraordinary light transmission through metallic subwavelength- * Address correspondence to [email protected] and [email protected] NIH Public Access Author Manuscript Nano Lett. Author manuscript; available in PMC 2009 September 1. Published in final edited form as: Nano Lett. 2008 September ; 8(9): 2718–2724. doi:10.1021/nl801043t. NIH-PA Author Manuscript NIH-PA Author Manuscript NIH-PA Author Manuscript
-
Upload
hms-harvard -
Category
Documents
-
view
0 -
download
0
Transcript of Metallic Nanohole Arrays on Fluoropolymer Substrates as Small Label-Free Real-Time Bioprobes
Metallic Nanohole Arrays on Fluoropolymer Substrates as SmallLabel-Free Real-Time Bioprobes
Jiun-Chan Yang†,‡, Jin Ji†, James M. Hogle*,†,‡, and Dale N. Larson*,†,‡,§
†Department of Biochemistry and Molecular Pharmacology, Harvard Medical School, 240 LongwoodAvenue, Boston, Massachusetts 02115 USA
‡Harvard Center for Microfluidic and Plasmonic Systems 33 Oxford Street Cambridge, Massachusetts 02138USA
§The Charles Stark Draper Laboratory, 555 Technology Square, Cambridge, Massachusetts 02139 USA
AbstractWe describe a nanoplasmonic probing platform that exploits small-dimension (≤ 20 μm2) orderedarrays of subwavelength holes for multiplexed, high spatial resolution, and real-time analysis onbiorecognition events. Nanohole arrays are perforated on a super smooth gold surface (roughnessRMS < 2.7 Å) attached on a fluoropolymer (FEP) substrate fabricated by a replica technique. Thesmooth surface of gold provides a superb environment for fabricating nanometer features and uniformimmobilization of biomolecules. The refractive index matching between FEP and biologicalsolutions contributes to ∼ 20% improvement on the sensing performance. Spectral studies on a seriesof small-dimension nanohole arrays from 1 μm2 to 20 μm2 indicate that the plasmonic sensingsensitivity improves as the gold-solution contact area increases. Our results also demonstrate thatnanohole arrays with dimension as small as 1 μm2 can be used to effectively detect biomolecularbinding events and analyze the binding kinetics. The future scientific opportunities opened by thisnanohole platform include highly multiplexed analysis of ligand interactions with membrane proteinson high quality supported lipid bilayers.
Nanoplasmonic sensing is an emerging technique that utilizes the interaction of light withsurface plasmons — collective oscillations of free electrons in the conduction band —inmetallic nanostructures to transduce chemical bindings to signal for remote optical readout.With receptive biological macromolecules immobilized on nanostructured metal surfaces,whose length scale is close to the wavelength of light, the binding of target biomolecules leadsto an increase of the local refractive index, which is then transduced into the change of spectralfeatures observed at the far-field. The greatest attraction of nanoplasmonic sensing is it doesnot require extrinsic fluorescent or radioactive labeling (i.e. “label-free”), which wouldpotentially change the binding properties of biomolecules and cause other significant problemslike background binding and autofluorescence.1 The small sensing volume resulting from shortelectromagnetic field decay length leads to high sensitivity for detection biomolecular bindingevents in local environments.
Significant improvement in nanofabrication and nanomaterials synthesis in the past decade hasallowed a variety of nanostructures to be utilized as nanoplasmonic sensors. A wide range ofnanostructure shapes such as triangles, cubes, rods, and rings 2, 3 have been reported to exhibithigh sensitivity based on localized surface plasmon resonance (LSPR) or coupled plasmonicresonance. The discovery of extraordinary light transmission through metallic subwavelength-
*Address correspondence to [email protected] and [email protected]
NIH Public AccessAuthor ManuscriptNano Lett. Author manuscript; available in PMC 2009 September 1.
Published in final edited form as:Nano Lett. 2008 September ; 8(9): 2718–2724. doi:10.1021/nl801043t.
NIH
-PA Author Manuscript
NIH
-PA Author Manuscript
NIH
-PA Author Manuscript

hole arrays,4 with an efficiency that is orders of magnitude greater than that predicted by classicoptical theory, has created another exciting opportunity for nanoplasmonic sensing. Surfaceplasmon polaritons (SPPs) are generally proposed to explain this phenomenon observed onperiodically arrayed nanoholes, although some works have claimed that other mechanisms likediffraction and LSPR also play important roles.5-7 Several studies exploiting periodicallyarrayed nanoholes fabricated by focused ion beam (FIB),8-12 ebeam lithography,13 and softlithography14, 15 have demonstrated their excellent sensitivity when used as label-freechemical sensing devices. Label-free plasmonic sensing is traditionally performed on prisms(Kretschmann geometry) or grating couplers, on which biomolecules are immobilized on acontinuous metal film and the angular distribution or the reflected intensity is measured.16Those real-time techniques have been successful in performing binding affinity analysis ofproteins or small molecules, and commercial instruments are available.1 Compared withconventional coupling techniques, the nanohole geometry has a much smaller probing area andcan be fabricated in high spatial density. The optical transmission configuration enablesmultiplexed detection and offers better opportunities to develop low-cost devices withintegrated microfluidics for rapid bioanalytical measurements.
Nanohole plasmonic sensing devices that have been reported to have excellent detection limitsare mostly based on wavelength interrogation with relatively low sampling rates on infinite orquasi-infinite nanohole arrays. High spatial density multiplexed real-time measurements aredifficult to achieve in those designs. For screening binding affinity of thousands of protein inparallel, small-dimension array nanoholes are of more interest because they offer high packingdensity of sensing elements, and can be integrated with compact microfluidic devices thatrequire less analyte volume. Small-dimension nanohole arrays have been reported to exhibitstrikingly different transmission features from infinite arrays15 because the contribution fromthe edge becomes significant.17 Their refractive-index sensing properties have not beenextensively studied.
Another key point in developing a nanohole sensing system is the interface between thenanostructure surface and the chemical or biological systems. For lipid-membrane-mediatedreactions, especially those associated with membrane proteins or membrane fusion processes,a smooth surface is greatly desired to help building a high-quality single lipid-bilayer thatincorporates protein receptors and improving experimental reproducibility.18, 19Visualization of chemisorbed proteins and molecules can also be achieved by using scanningprobe techniques (AFM / STM) on atomically-smooth surfaces.19, 20 On the other hand, fromthe view of nanofabrication, smoother surface will be beneficial on improving the quality offabricated features, especially when they are in nanometer sizes.
Here, we present a nanoplasmonic sensing platform which exploits small-dimension orderedarrays of nanoholes (≤ 4.5 μm × 4.5 μm) for multiplexed (30 arrays in a 48 μm × 58 μm area)and real-time (time resolution ≤ 1s) analysis on biorecognition events. The measuring platformwas built on a conventional inverted microscope with regular bright-field optics. Intensityinterrogation was performed instead of commonly used wavelength interrogation to achievemultiplex and real-time sensing capability. Nanohole arrays were perforated on super smoothgold surfaces fabricated by replica techniques. We chose fluorinated ethylene propylenecopolymer (FEP) as the replica substrate because it is chemically inert, thermoplastic,transparent in the visible region, and has a refractive index (1.341 at λ = 590 nm) close tobiological solutions. It has been reported that when the refractive indices on both sides of thegold film match, the intensity of extraordinary transmission through nanoholes would bestrongly enhanced because of the overlap of transmission maxima from two interfaces and thehigher lifetime of a coupled state from strong coupling of SP modes on each side of the nanoholearrays.21-23
Yang et al. Page 2
Nano Lett. Author manuscript; available in PMC 2009 September 1.
NIH
-PA Author Manuscript
NIH
-PA Author Manuscript
NIH
-PA Author Manuscript
Meanwhile, although the change in local dielectric environments normally causes more shiftof the spectral features in the near-infrared and infrared range than in the visible range 10,14, we used visible light as the sensing wavelength to prevent potential near-infrared adsorptionof water and many biological species. Moreover, shorter excitation wavelengths generatesurface plasmon wave with shorter propagation lengths in the X-Y plane, leading to higherpossible packing density and hence higher throughput on multiplexed biosensing.
The substrate for nanoholes was prepared by the template-stripped-gold (TSG) method18,19 to obtain a super smooth surface for biomolecule immobilization. FEP was used to replaceepoxy resins used in the regular TSG method (see supporting information). The resulting TSGsubstrate has a 220 nm-thick gold film on FEP with the smooth surface facing up (Fig. 1a).The surface roughness is ∼ 1.2 nm (peak to peak, RMS = 2.7 Å, see supporting info). 220 nm-thickness was used to effectively block the direct transmitted light. For comparison, a regulargold substrate was prepared by thermally depositing 8 nm chromium and 220 nm gold on acleaned glass slide. FEI DB235 focused ion beam system with 30 kV acceleration voltage and10 pA ion current was applied to mill nanoholes arrays on the gold film. Ion imagemagnification was calibrated before each milling. After immobilizing biomolecules, a PDMSblock with a microfluidic channel (volume ∼ 3 μL) was mounted on the nanohole film. Asyringe pump was used to deliver solutions through this channel at a 30 μL/min flow rate.
Transmission spectra and real-time sensing responses were collected using an invertedmicroscope with bright-field accessories (Nikon eclipse TE300, Fig 1b). For multiplexedspectral acquisition, a multispectral illumination source and an intensity imaging CCD wereused instead of a polychromatic spectrometer.24 Non-polarized white light from a 75W Xenonlamp was passed through a double monochromator (Jobin-Yvon SPEX 1680B) and a condenserlens. Divergence of light (5° ∼ 39°) can be adjusted using the diaphragm on the condenserlens. The light coming out from the nanohole arrays was collected with a 20x objective (NA= 0.5) and then focused on an uncooled CCD (QImage, Intensified Retiga). The spectra werecorrected by the lamp transmission profile through the glass substrate. The bandpass of themonochromator was set to 1 nm for acquiring transmission spectra. An image processingprogram was created to extract intensity value of individual nanohole arrays from CCD images(see supporting info).
A serial of nanohole patterns with different nanohole diameters (d), periodicity (P, hole-to-hole distance), and numbers was fabricated on TSG substrates. Fig 1c is the CCD image of oneof the nanohole array patterns we studied. This pattern contains thirty 9×9 nanohole arraysspaced by 11 μm. Since calculated SPP propagation length on gold along the X-Y direction isless than 3 μm for excitation wavelengths shorter than 630 nm,16 11 μm spacing ensuressufficient separation between individual arrays to avoid interference, while allowing amaximum number of nanohole arrays in the CCD field of view. The hole diameter was changedfrom 130 nm to 180 nm, and the D value (hole periodicity/diameter) was varied from 1.67 to3.00. Fig 1d and 1e show SEM micrographs of the top view and cross section of a nanoholearray. A protruded ring of gold ca. 160 nm in height was found underneath the hole. It is mainlydue to Ga ion bombardment on soft FEP since this phenomenon was not observed on normalgold substrates. We also found that it was relatively easier to fabricate high-quality nanoholes(Fig. 1d insert) on TGS substrate by FIB than on fresh thermally deposited gold surface (surfaceroughness ∼10 nm).
The optical setup and design of nanohole arrays allow collecting transmission spectra of allthirty small nanohole arrays simultaneously. This feature enables fast screening of smallnanohole array patterns in term of sensing sensitivity in different wavelengths. The black curvein Fig. 2a represents a typical transmission spectrum of one of the nanohole arrays (d = 180nm, D = 2.33, TSG substrates) in Fig 1c when flowing DI water and the red curve represents
Yang et al. Page 3
Nano Lett. Author manuscript; available in PMC 2009 September 1.
NIH
-PA Author Manuscript
NIH
-PA Author Manuscript
NIH
-PA Author Manuscript
the spectrum upon switching flowing media from DI water (RI = 1.3331) to 21% NaCl (RI =1.3702). Bulk plasmon resonance peak around λ = 510 nm was found in almost all spectra anddid not shift upon the change of flowing media. The wavelength shift sensitivity is 323 nm/RIU for λ ∼ 600 nm. The blue curve in Fig. 2b represents the differential intensity (ΔT/T inpercentage) between two spectra in Fig 2a. Two maxima (562 nm and 618 nm) and one minima(588 nm) are found in the visible range. These wavelengths (denoted as S-wavelengths in thefollowing context) will be useful for single-wavelength sensing by intensity interrogation. Wecompared the spectra collected with different collimation conditions. Larger light divergence(39°) normally excites a wider distribution of wavevectors and leads to lower sensitivity thansmaller light divergence (5°). However, the signal to noise ratio (S/N) with 5°divergence ismuch worse than 39°divergence because of lower photon flux. We hence used 39°divergence(NA = 0.34) for the rest of experiment.
From analyzing the transmission spectral features from a series of nanohole arrays, we firstdiscover that the hole diameters only slightly affect the transmission maxima and theperiodicity is the dominant factor. Larger diameters lead to higher transmission. For the sameperiodicity, the transmission intensity from a d = 180 nm array (9×9, P = 360) is around 7 timesthat of a d = 130 nm array at the resonance peak. This observation is consistent with previousreports using large nanohole arrays and collimated / polarized light sources.4, 25-27 Fig. 2cshows the relation between S-wavelengths (plotted if higher than 5% intensity change) andhole periodicity from thirty different small nanohole arrays in Fig. 1c from TSG and regulargold substrates. Maxima and minima of differential intensity form four different linear relations(Lines 1∼4) in the visible region. Two different nanohole substrates (glass and FEP) are of thesame linear relations of maxima and minima of differential intensity, although different peakpositions in transmission spectra due to the different interfaces between gold and substrates.This observation confirms that the refractive-index sensing occurs exclusively on the gold-solution interface. For periodicity < 450 nm, differential intensity maxima mostly appear atshorter wavelengths than minima; for periodicity > 450 nm, the few minima and maxima atthe right-bottom corner of Fig. 2c indicate another set of trends extending to the large-periodicity region. No maxima or minima of differential intensity were found on the left-handside of Line (1) in the visible region. Each line in Fig. 2c represents a red-shift edge oftransmission peaks. For a small refractive index change (e.g. 0.0371 in this figure), in mostspectra we collected, only the shift of a single edge of transmission peaks was observed. A fulltheoretical analysis of the nature of transmission features is beyond the scope of this article.Nevertheless, Fig 2c is helpful in determining nanohole periodicity when using amonochromatic excitation source that has better intensity and stability than white light sources.
The magnitude of intensity change of Lines (1) and (2) was plotted in Fig 2d in the bubble plotformat. A strong trend can be observed that shorter periodicity mostly leads to weaker intensitychange for both lines, that is, poorer sensing performance. For the same diameter, a long-periodicity array always has more intensity change than the short-periodicity one. In average,Line (2) has slightly better sensing performance than Line (1), especially for P < 400 nm. Lines(3) and (4) have the same trend as Lines (1) and (2) (data not shown for clarity). Theextraordinary transmission from nanohole arrays on TSG substrates is typically more intensethan on normal gold substrates by 10 ∼ 20 % and the intensity change (sensing performance)is in average also about 20 % better.
The fact that longer periodicity leads to higher sensitivity implies that a larger nanohole array(for the same nanohole number) is a better sensor. This suggests the interaction area betweengold and flowing solutions substantially affects the sensor sensitivity. Meanwhile, we alsoinvestigated the effect of the number of nanoholes on sensitivity. In Figs. 3a and 3b, the numberof nanohole arrays was changed from 9 (3×3) to 196 (14×14) on TSG substrates. Thetransmission intensity was proportional to the number of nanoholes (Fig 3a). The FWHM (Full
Yang et al. Page 4
Nano Lett. Author manuscript; available in PMC 2009 September 1.
NIH
-PA Author Manuscript
NIH
-PA Author Manuscript
NIH
-PA Author Manuscript
Width at Half Maximum) was found to be smaller when increasing the number of nanoholes,which is consistent with a previous report.5 For intensity interrogation used in this work, smallFWHM (sharper resonance peaks) will be preferable for obtaining higher sensing sensitivity.According to this result, we suggest that when comparing the sensitivity of different nanoholesensing systems based on intensity interrogation or wavelength interrogation, the size ofnanohole arrays should be taken into consideration.
For real-time sensing measurement, the monochromator was set to the wavelength around theS-wavelengths of target nanohole arrays in Fig. 2c. The bandpass was increased to 4 nm toimprove the S/N ratio. More than 30 real-time sensing signals could be collectedsimultaneously. Figs. 3c and 3d show the real-time response from a 9×9 and a 3×3 array (withdifferent d and P). When the refractive index varied from 1.3331 and 1.3702, both arraysexhibited linear relation between intensity changes and the refractive index (Inserts in Figs 3cand 3d). For the 9×9 array, the highest intensity change was observed as a 37.5% increase forΔn = 0.0371 (DI water to 21% NaCl) at λ = 590 nm; for the best 3×3 array, it was only 7.5%at best. Less intense transmission from the 3×3 array also leads to a low S/N ratio. Hence, weobserve an inevitable trade-off between the sensitivity and size of the nanohole arrays.Nevertheless, 1010 %/RIU sensitivity for the 9×9 array is fairly close to the regular gratingcoupler-based SPR sensors operated in the intensity interrogation mode,16 with the sensor sizeof nanohole arrays is only 1/2000 of that used in commercial instruments (typical spot size ∼200 μm in diameter).
Although the TSG surface offers better opportunity for more uniform immobilization ofbiomolecules, it also has a smaller surface area than the regular gold for immobilization (3%less, estimated by AFM). In order to demonstrate the capability of detecting biorecognitionevents, Glutathione S-Transferase (GST) and anti-GST antibody binding, a high affinityinteraction that has been extensively used in Western blots and dot blots to detect GST-fusionproteins, was selected in this work (Fig. 4b). We immobilized GST and used anti-GST as thetarget molecule since anti-GST is a bigger protein (MW ∼ 150kD) that will induce more changein the local dielectric environment. The TSG surface was first functionalized with a thiolterminated with a primary amine. The GST proteins were then immobilized onto the goldsurface with a cross-linker that covalently attached to the amino terminus of GST and thiol(see supporting info. for details). Different concentrations of anti-GST antibodies prepared inPBS 7.4 buffer were introduced to the flow cell through a sample injector. After the bindingevent, 10 mM glycine (pH 2.2) was used to dissociate GST and anti-GST complex to regeneratethe surface. In these experiments we functionalized all the nanohole arrays on the samesubstrate to demonstrate the sensing capability. For a practical multiplexed sensing,commercial AFM-based nano-spotters28 may be used to functionalize individual arrays withdifferent biomolecules.
Fig. 4a shows that the transmission intensity from a nanohole array immobilized with GSTchanged significantly after 615 nM anti-GST was introduced. Subsequent stripping with 10mM glycin (pH 2.2) successfully removed anti-GST from the gold surface and the signalbaseline came back to the previous level. The reaction was fully reversible for at least ten times.In Fig. 4c, three different concentrations of anti-GST were injected in a random order. Redcurves represent the best fit of the binding responses to a simple bimolecular reaction model(A+B ↔ AB)29 using BIAevaluation (GE Health). The dissociation affinity constant (KD) ofthis specific assay was determined by commercially available BIACORE 3000 (GE Health)as 2.97 nM, which is typical for a high affinity binding. Although immobilized GST could bindwith more than one anti-GST and the bimolecular model may not be the best model to describethis reaction pathway, the calculated association constant (ka) from nanohole arrays was2.1×104 M-1S-1, fairly close to 3.7×10⁴ M-1S-1 determined by BIACORE 3000 withdissociation and association constants fit separately. The dissociation constant (1.1×10⁻⁴ S-1,
Yang et al. Page 5
Nano Lett. Author manuscript; available in PMC 2009 September 1.
NIH
-PA Author Manuscript
NIH
-PA Author Manuscript
NIH
-PA Author Manuscript
determined by BIACORE 3000) was too small to be accurately verified in this nanohole systembecause of the high affinity of this assay and the baseline drift. For smaller nanohole arrays(Fig. 4d and 4e), although the S/N ratio was not as good as the 9×9 array, similar associationconstants (2.1×10⁴ M-1S-1 for 5×5 and 2.6×10⁴ M-1S-1 for 3×3) still can be determined by thefitting software. The detection limit (2σ) is around 10 nM for the 9×9 array. It should bementioned that the measuring setup was designed to acquire multiple transmission spectra sohighly intense and stable laser sources were not used. Low detection limits, though also highlydesirable, are not the highest priority in this work.
Although TSG substrates show better sensing performance than the regular thermallyevaporated gold substrates, the transmission enhancement and performance improvement arefar less than we expected from literature.21, 23 The possible reasons are that the refractiveindex of FEP still not exactly matches the biological solutions and there might be a smallamount of air trapped between gold and FEP during the template-stripping process. Theimprovement of the TSG process with FEP is in progress. The protruded gold ring in the FEPlayer caused by ion bombardment might have also played an important role. The sharp edgecould contribute to some localized surface plasmon characters,9 which have been proven tomarkedly affect the transmission intensity.
In summary, we present a plasmonic sensing platform that exploits small-dimension orderedarrays of nanoholes perforated on a super smooth gold surface that adhered on fluoropolymersubstrate. It is capable of performing multiplexed and real-time binding affinity analysis onbiorecognition events. The spectral study on 1 μm2 ∼ 20 μm2 nanohole arrays indicates thathigher gold-solution contact area results in higher plasmonic sensing sensitivity. There is aninevitable trade-off between the sensitivity and the size of the periodically arrayed nanoholes.Nevertheless, our result demonstrated that nanohole arrays with dimension as small as 1μm2 could be used to detect biomolecular binding events effectively and analyze the bindingkinetics. TSG on FEP substrates provides a smooth environment for higher-qualitynanofabrication and more uniform immobilization. The refractive index matching betweenFEP and water solutions contributes to ∼20% improvement on the sensing performance. Thisnanohole approach presents a sophisticate platform to studies ranging from highly multiplexedprotein binding screening, to viral fusion and transmembrane protein analysis that require ahigh-quality supported lipid membrane.
Supplementary MaterialRefer to Web version on PubMed Central for supplementary material.
AcknowledgementFunding for this work was providing by DARPA/MTO N/MEMS S&T Fundamentals Program and two NIH grants,5R01HG003828-04 and 5R21EB004333-02. We thank Garland O’Connell for his instrumentation support and helpfuldiscussion, Dane Stebbings and John Slusarz for making optical accessories. This work was performed in part at theCenter for Nanoscale Systems (CNS), a member of the National Nanotechnology Infrastructure Network (NNIN),which is supported by the National Science Foundation under NSF award no. ECS-0335765. CNS is part of the Facultyof Arts and Sciences at Harvard University.
References(1). Cooper MA. Nat. Rev. Drug Discovery 2002;1:515–528.(2). Willets KA, Van Duyne RP. Annu. Rev. Phys. Chem 2007;58:267–297. [PubMed: 17067281](3). Stewart ME, Anderton CR, Thompson LB, Maria J, Gray SK, Rogers JA, Nuzzo RG. Chem. Rev
2008;108:494–521. [PubMed: 18229956](4). Ebbesen TW, Lezec HJ, Ghaemi HF, Thio T, Wolff PA. Nature 1998;391:667–669.
Yang et al. Page 6
Nano Lett. Author manuscript; available in PMC 2009 September 1.
NIH
-PA Author Manuscript
NIH
-PA Author Manuscript
NIH
-PA Author Manuscript

(5). Lezec HJ, Thio T. Opt. Express 2004;12:3629–3651.(6). Cao Q, Lalanne P. Phys. Rev. Lett 2002;88(7). van der Molen KL, Koerkamp Klein K. J. Enoch S, Segerink FB, van Hulst NF, Kuipers L. Phys.
Rev. B 2005;72(8). De Leebeeck A, Kumar LKS, de Lange V, Sinton D, Gordon R, Brolo AG. Anal. Chem
2007;79:4094–4100. [PubMed: 17447728](9). Lesuffleur A, Im H, Lindquist NC, Oh SH. Appl. Phys. Lett 2007;90(10). Tetz KA, Pang L, Fainman Y. Opt. Lett 2006;31:1528–1530. [PubMed: 16642161](11). Brolo AG, Gordon R, Leathem B, Kavanagh KL. Langmuir 2004;20:4813–4815. [PubMed:
15984236](12). Stark PRH, Halleck AE, Larson DN. Methods 2005;37:37–47. [PubMed: 16199175](13). Ji J, O’Connell JG, Carter DJD, Larson DN. Anal. Chem 2008;80:2491–2498. [PubMed: 18307360](14). Stewart ME, Mack NH, Malyarchuk V, Soares J, Lee TW, Gray SK, Nuzzo RG, Rogers JA. Proc.
Nat. Acad. Sci. U.S.A 2006;103:17143–17148.(15). Henzie J, Lee MH, Odom TW. Nat. Nanotechnol 2007;2:549–554. [PubMed: 18654366](16). Homola J, Yee SS, Gauglitz G. Sens. Actuators, B 1999;54:3–15.(17). Genet C, Ebbesen TW. Nature 2007;445:39–46. [PubMed: 17203054](18). Naumann R, Schiller SM, Giess F, Grohe B, Hartman KB, Karcher I, Koper I, Lubben J, Vasilev
K, Knoll W. Langmuir 2003;19:5435–5443.(19). Jeuken LJC, Connell SD, Henderson PJF, Gennis RB, Evans SD, Bushby RJ. J. Am. Chem. Soc
2006;128:1711–1716. [PubMed: 16448146](20). Jeuken LJC, Connell SD, Nurnabi M, O’Reilly J, Henderson PJF, Evans SD, Bushby RJ. Langmuir
2005;21:1481–1488. [PubMed: 15697298](21). Dintinger J, Degiron A, Ebbesen TW. MRS Bull 2005;30:381–384.(22). Martin-Moreno L, Garcia-Vidal FJ, Lezec HJ, Pellerin KM, Thio T, Pendry JB, Ebbesen TW. Phys.
Rev. Lett 2001;86:1114–1117. [PubMed: 11178023](23). Krishnan A, Thio T, Kima TJ, Lezec HJ, Ebbesen TW, Wolff PA, Pendry J, Martin-Moreno L,
Garcia-Vidal F. J. Opt. Commun 2001;200:1–7.(24). Liu GL, Doll JC, Lee LP. Opt. Express 2005;13:8520–8525.(25). van der Molen KL, Segerink FB, van Hulst NF, Kuipers L. Appl. Phys. Lett 2004;85:4316–4318.(26). Wang GP, Yi YX, Wang B. J. Phys.: Condens. Matter 2003;15:8147–8156.(27). Thio T, Ghaemi HF, Lezec HJ, Wolff PA, Ebbesen TW. J. Opt. Soc. Am. B: Opt. Phys
1999;16:1743–1748.(28). Bioforce Nanosciences. www.bioforcenano.comwww.bioforcenano.com(29). Quinn JG, O’Kennedy R. Anal. Biochem 2001;290:36–46. [PubMed: 11180935]
Yang et al. Page 7
Nano Lett. Author manuscript; available in PMC 2009 September 1.
NIH
-PA Author Manuscript
NIH
-PA Author Manuscript
NIH
-PA Author Manuscript
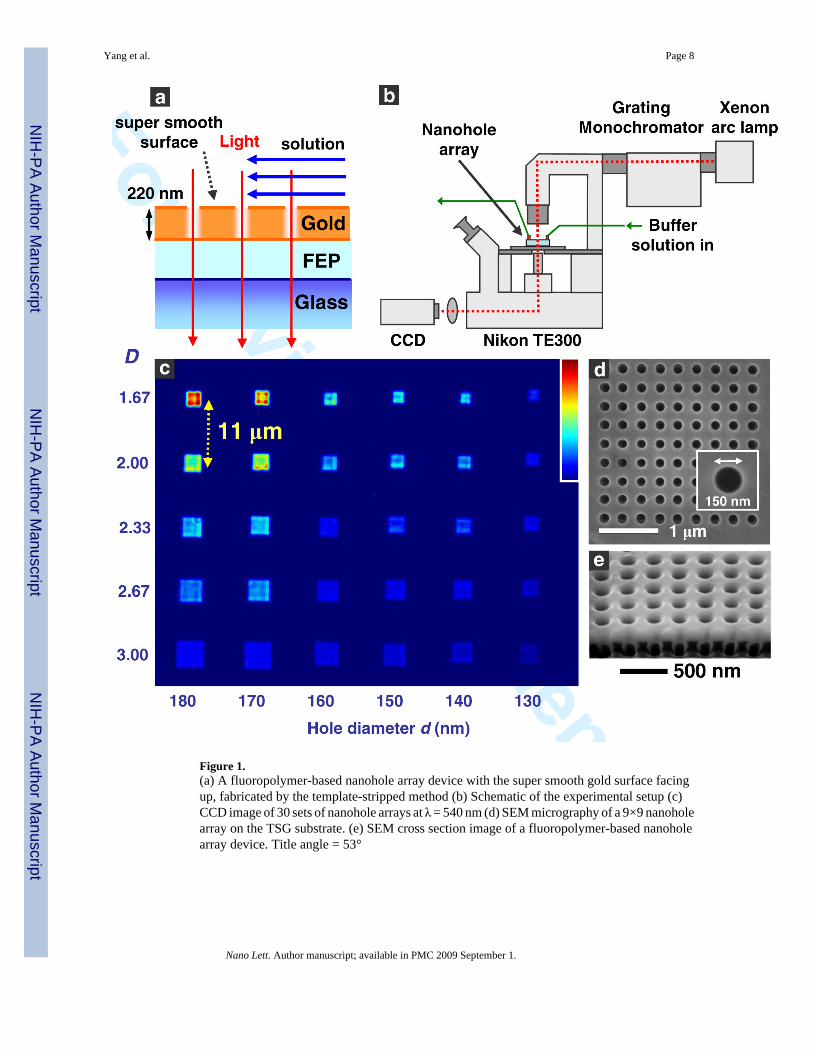
Figure 1.(a) A fluoropolymer-based nanohole array device with the super smooth gold surface facingup, fabricated by the template-stripped method (b) Schematic of the experimental setup (c)CCD image of 30 sets of nanohole arrays at λ = 540 nm (d) SEM micrography of a 9×9 nanoholearray on the TSG substrate. (e) SEM cross section image of a fluoropolymer-based nanoholearray device. Title angle = 53°
Yang et al. Page 8
Nano Lett. Author manuscript; available in PMC 2009 September 1.
NIH
-PA Author Manuscript
NIH
-PA Author Manuscript
NIH
-PA Author Manuscript
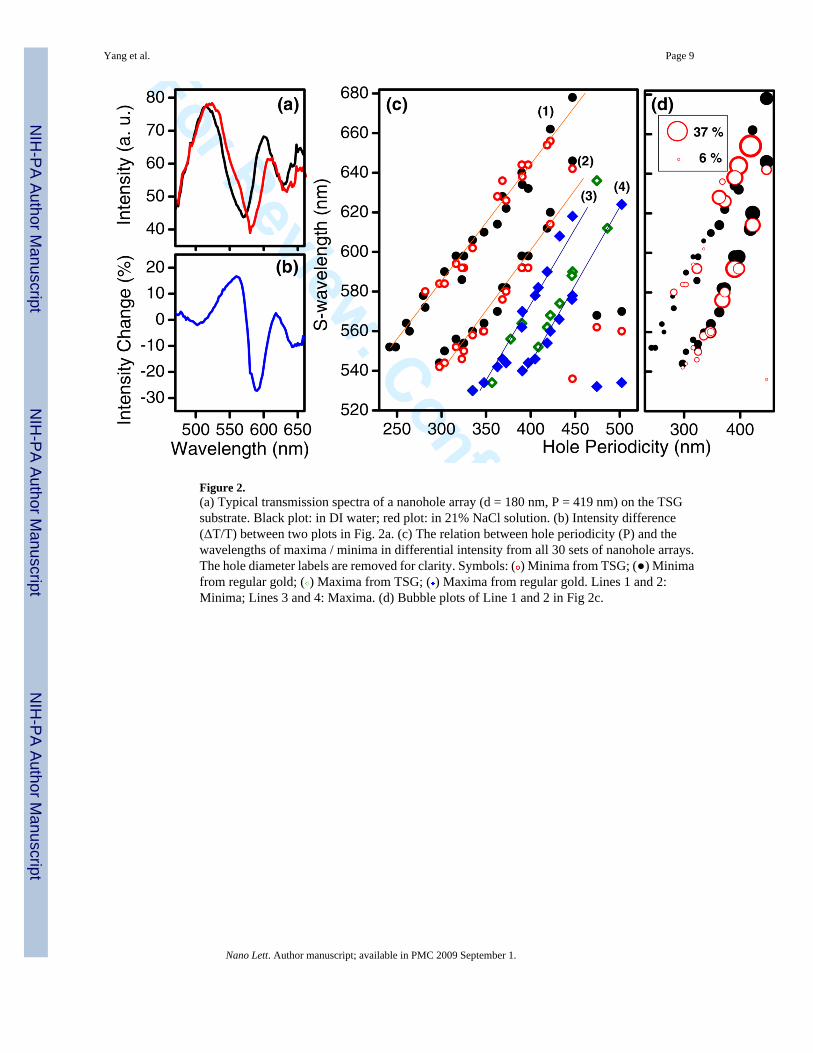
Figure 2.(a) Typical transmission spectra of a nanohole array (d = 180 nm, P = 419 nm) on the TSGsubstrate. Black plot: in DI water; red plot: in 21% NaCl solution. (b) Intensity difference(ΔT/T) between two plots in Fig. 2a. (c) The relation between hole periodicity (P) and thewavelengths of maxima / minima in differential intensity from all 30 sets of nanohole arrays.The hole diameter labels are removed for clarity. Symbols: ( ) Minima from TSG; (●) Minimafrom regular gold; ( ) Maxima from TSG; ( ) Maxima from regular gold. Lines 1 and 2:Minima; Lines 3 and 4: Maxima. (d) Bubble plots of Line 1 and 2 in Fig 2c.
Yang et al. Page 9
Nano Lett. Author manuscript; available in PMC 2009 September 1.
NIH
-PA Author Manuscript
NIH
-PA Author Manuscript
NIH
-PA Author Manuscript
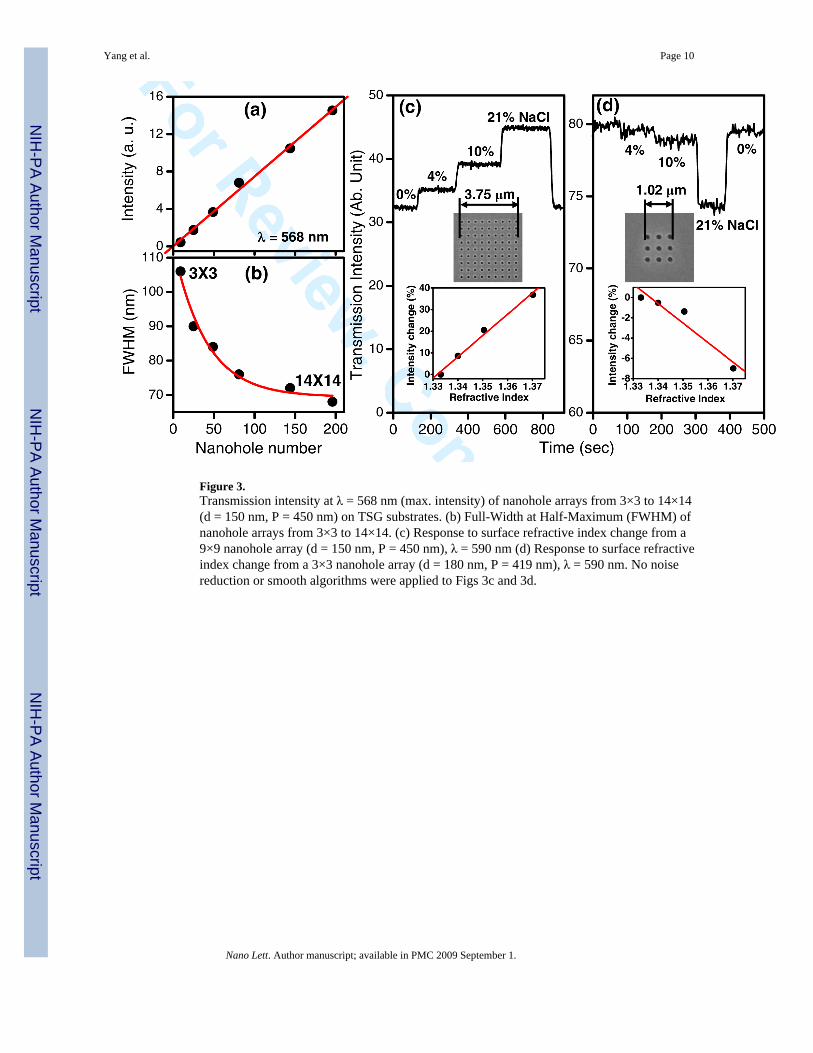
Figure 3.Transmission intensity at λ = 568 nm (max. intensity) of nanohole arrays from 3×3 to 14×14(d = 150 nm, P = 450 nm) on TSG substrates. (b) Full-Width at Half-Maximum (FWHM) ofnanohole arrays from 3×3 to 14×14. (c) Response to surface refractive index change from a9×9 nanohole array (d = 150 nm, P = 450 nm), λ = 590 nm (d) Response to surface refractiveindex change from a 3×3 nanohole array (d = 180 nm, P = 419 nm), λ = 590 nm. No noisereduction or smooth algorithms were applied to Figs 3c and 3d.
Yang et al. Page 10
Nano Lett. Author manuscript; available in PMC 2009 September 1.
NIH
-PA Author Manuscript
NIH
-PA Author Manuscript
NIH
-PA Author Manuscript
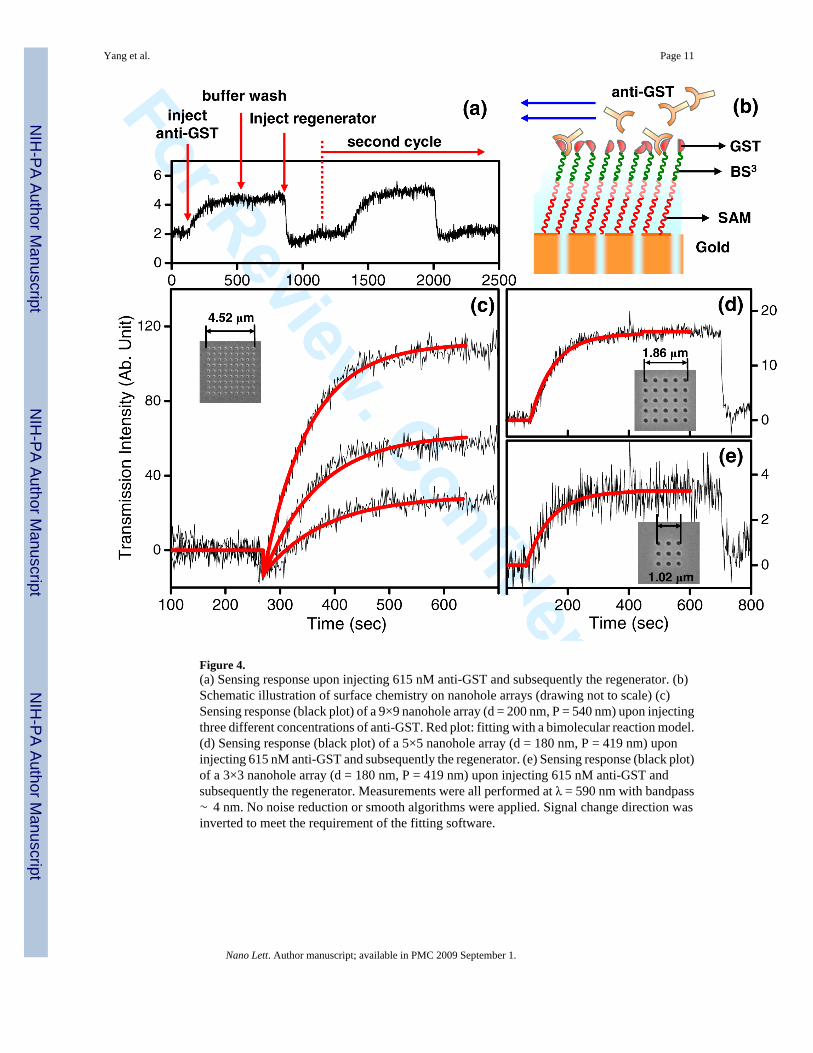
Figure 4.(a) Sensing response upon injecting 615 nM anti-GST and subsequently the regenerator. (b)Schematic illustration of surface chemistry on nanohole arrays (drawing not to scale) (c)Sensing response (black plot) of a 9×9 nanohole array (d = 200 nm, P = 540 nm) upon injectingthree different concentrations of anti-GST. Red plot: fitting with a bimolecular reaction model.(d) Sensing response (black plot) of a 5×5 nanohole array (d = 180 nm, P = 419 nm) uponinjecting 615 nM anti-GST and subsequently the regenerator. (e) Sensing response (black plot)of a 3×3 nanohole array (d = 180 nm, P = 419 nm) upon injecting 615 nM anti-GST andsubsequently the regenerator. Measurements were all performed at λ = 590 nm with bandpass∼ 4 nm. No noise reduction or smooth algorithms were applied. Signal change direction wasinverted to meet the requirement of the fitting software.
Yang et al. Page 11
Nano Lett. Author manuscript; available in PMC 2009 September 1.
NIH
-PA Author Manuscript
NIH
-PA Author Manuscript
NIH
-PA Author Manuscript