Meta-Analysis as a Tool to Identify Candidate Genes Involved ...
26
Forests 2022, 13, 159. https://doi.org/10.3390/f13020159 www.mdpi.com/journal/forests Article Meta‐Analysis as a Tool to Identify Candidate Genes Involved in the Fagus sylvatica L. Abiotic Stress Response Cesare Garosi 1 , Roberta Ferrante 1 , Cristina Vettori 1,2, * and Donatella Paffetti 1 1 Dipartimento di Scienze e Tecnologie Agrarie, Alimentari, Ambientali e Forestali (DAGRI), Università degli Studi di Firenze, Via Maragliano 77, 50144 Firenze, Italy; [email protected] (C.G.); [email protected] (R.F.); [email protected] (D.P.) 2 Istituto di Bioscienze e Biorisorse (IBBR), Consiglio Nazionale delle Ricerche (CNR), Via Madonna del Piano 10, 50019 Florence, Italy * Correspondence: [email protected]; Tel.: +39‐055‐5225728 Abstract: In this study, we aimed to evaluate whether candidate genes for abiotic stresses in Fagus sylvatica L. are also candidate genes for herbaceous plants, with the purpose of better defining the abiotic stress response model of F. sylvatica. Therefore, a meta‐analysis was performed on published papers related to abiotic stress. Firstly, we carried out a systematic review regarding the activity of 24 candidate genes selected for F. sylvatica under abiotic stress reported in 503 articles. After choosing the inclusion criteria, 73 articles out of 503, regarding 12 candidate genes, were included in this analysis. We performed an exploratory meta‐analysis based on the random‐effect model and the combined ef‐ fect‐size approach (Cohen’s d). The results obtained through Forest and Funnel plots indicate that the candidate genes for F. sylvatica are considered to be candidate genes in other herbaceous species. These results allowed us to set up models of plants’ response to abiotic stresses implementing the stress mod‐ els in forest species. The results of this study will serve to bridge knowledge gaps regarding the path‐ ways of response to abiotic stresses in trees based on the meta‐analysis. The study approach used could be extended to observe larger gene databases and different species. Keywords: meta‐analysis; candidate gene; abiotic stress; Fagus sylvatica L.; abiotic stress model 1. Introduction Plants, during their life cycle, are exposed to continuous chemical–physical and bio‐ logical changes in their habitat or in an environment altered by humans. These changes are often unfavourable or stressful for growth and development. Therefore, plants have evolved various dynamic molecular reprogramming events to rapidly perceive changes and adapt accordingly [1–3]. In recent decades, significant progress has been achieved in understanding the physiological, cellular, and molecular mechanisms important for plant adaptation to certain climatic conditions [1–5]. Using molecular biology approaches, many abiotic stress‐inducible genes have been identified, and their functions have been characterised in plants [6,7]. This has permitted finding evidence of adaptive loci at the DNA level using the candidate gene approach [8]. The development of Next‐Generation Sequencing technologies has allowed the sequencing of thousands of genotypes that will give a significant advancement in the identification of genes important to adaptation [6,8– 14]. This large amount of available data has improved all omics disciplines with respect to the study of regulatory pathways and gene expression and their correlation to abiotic stress. Despite the variety of available data and rich resources, it is important to note that the diversity of experimental designs and types of analyses can be a limiting factor for comparing these genomic data and the development of stress models. Due to the variabil‐ ity present in the methods applied to induce stress in the sampled tissues and the bioin‐ formatics tool used for data generation and analysis, this large amount of information has Citation: Garosi, C.; Ferrante, R.; Vettori, C.; Paffetti, D. Meta‐Analysis as a Tool to Identify Candidate Genes Involved in the Fagus sylvatica L. Abiotic Stress Response. Forests 2022, 13, 159. https://doi.org/10.3390/f13020159 Academic Editor: Giovanbattista De Dato Received: 19 December 2021 Accepted: 17 January 2022 Published: 20 January 2022 Publisher’s Note: MDPI stays neu‐ tral with regard to jurisdictional claims in published maps and institu‐ tional affiliations. Copyright: © 2022 by the authors. Li‐ censee MDPI, Basel, Switzerland. This article is an open access article distributed under the terms and con‐ ditions of the Creative Commons At‐ tribution (CC BY) license (https://cre‐ ativecommons.org/licenses/by/4.0/).
-
Upload
khangminh22 -
Category
Documents
-
view
4 -
download
0
Transcript of Meta-Analysis as a Tool to Identify Candidate Genes Involved ...

Forests 2022, 13, 159. https://doi.org/10.3390/f13020159 www.mdpi.com/journal/forests
Article
Meta‐Analysis as a Tool to Identify Candidate Genes Involved
in the Fagus sylvatica L. Abiotic Stress Response
Cesare Garosi 1, Roberta Ferrante 1, Cristina Vettori 1,2,* and Donatella Paffetti 1
1 Dipartimento di Scienze e Tecnologie Agrarie, Alimentari, Ambientali e Forestali (DAGRI),
Università degli Studi di Firenze, Via Maragliano 77, 50144 Firenze, Italy; [email protected] (C.G.);
[email protected] (R.F.); [email protected] (D.P.) 2 Istituto di Bioscienze e Biorisorse (IBBR), Consiglio Nazionale delle Ricerche (CNR),
Via Madonna del Piano 10, 50019 Florence, Italy
* Correspondence: [email protected]; Tel.: +39‐055‐5225728
Abstract: In this study, we aimed to evaluate whether candidate genes for abiotic stresses in Fagus
sylvatica L. are also candidate genes for herbaceous plants, with the purpose of better defining the
abiotic stress response model of F. sylvatica. Therefore, a meta‐analysis was performed on published
papers related to abiotic stress. Firstly, we carried out a systematic review regarding the activity of 24
candidate genes selected for F. sylvatica under abiotic stress reported in 503 articles. After choosing the
inclusion criteria, 73 articles out of 503, regarding 12 candidate genes, were included in this analysis.
We performed an exploratory meta‐analysis based on the random‐effect model and the combined ef‐
fect‐size approach (Cohen’s d). The results obtained through Forest and Funnel plots indicate that the
candidate genes for F. sylvatica are considered to be candidate genes in other herbaceous species. These
results allowed us to set up models of plants’ response to abiotic stresses implementing the stress mod‐
els in forest species. The results of this study will serve to bridge knowledge gaps regarding the path‐
ways of response to abiotic stresses in trees based on the meta‐analysis. The study approach used could
be extended to observe larger gene databases and different species.
Keywords: meta‐analysis; candidate gene; abiotic stress; Fagus sylvatica L.; abiotic stress model
1. Introduction
Plants, during their life cycle, are exposed to continuous chemical–physical and bio‐
logical changes in their habitat or in an environment altered by humans. These changes
are often unfavourable or stressful for growth and development. Therefore, plants have
evolved various dynamic molecular reprogramming events to rapidly perceive changes
and adapt accordingly [1–3]. In recent decades, significant progress has been achieved in
understanding the physiological, cellular, and molecular mechanisms important for plant
adaptation to certain climatic conditions [1–5]. Using molecular biology approaches,
many abiotic stress‐inducible genes have been identified, and their functions have been
characterised in plants [6,7]. This has permitted finding evidence of adaptive loci at the
DNA level using the candidate gene approach [8]. The development of Next‐Generation
Sequencing technologies has allowed the sequencing of thousands of genotypes that will
give a significant advancement in the identification of genes important to adaptation [6,8–
14]. This large amount of available data has improved all omics disciplines with respect
to the study of regulatory pathways and gene expression and their correlation to abiotic
stress. Despite the variety of available data and rich resources, it is important to note that
the diversity of experimental designs and types of analyses can be a limiting factor for
comparing these genomic data and the development of stress models. Due to the variabil‐
ity present in the methods applied to induce stress in the sampled tissues and the bioin‐
formatics tool used for data generation and analysis, this large amount of information has
Citation: Garosi, C.; Ferrante, R.;
Vettori, C.; Paffetti, D.
Meta‐Analysis as a Tool to Identify
Candidate Genes Involved in the
Fagus sylvatica L. Abiotic Stress
Response. Forests 2022, 13, 159.
https://doi.org/10.3390/f13020159
Academic Editor: Giovanbattista De
Dato
Received: 19 December 2021
Accepted: 17 January 2022
Published: 20 January 2022
Publisher’s Note: MDPI stays neu‐
tral with regard to jurisdictional
claims in published maps and institu‐
tional affiliations.
Copyright: © 2022 by the authors. Li‐
censee MDPI, Basel, Switzerland.
This article is an open access article
distributed under the terms and con‐
ditions of the Creative Commons At‐
tribution (CC BY) license (https://cre‐
ativecommons.org/licenses/by/4.0/).

Forests 2022, 13, 159 2 of 26
given rise to a new source of heterogeneity [11–13]. Ambiguous information from distinct
resources may result in methodological artefacts derived from observational data. In ad‐
dition, the heterogeneity of results present among different plant species demonstrates
that efforts are necessary to transfer the assessment of gene roles from reference models
to other species [14]. The challenge is to find ways to combine these resources to build
reliable datasets of information that are easily manageable and testable. Systemic ap‐
proaches could bring many advantages and pave the way toward comprehensive model‐
ling. To obtain a comprehensive view of plant responses to environmental stresses, it will
be important to integrate omics data with systemic biology data and to develop computa‐
tional models [11,14,15]. In their review, Cramer et al. [14] explored the perspectives of
systemic approaches in determining molecular responses to abiotic stresses. In the post‐
genomic era, comprehensive analyses using systemic or omics approaches have increased
our understanding of the complex molecular regulatory networks associated with stress
adaptation and tolerance. Although many of the functions of individual parts are un‐
known, their function can sometimes be inferred through association with other known
parts, providing a better understanding of the biological system as a whole [14]. New
models can be formed from the large amount of data collected and can lead to new hy‐
potheses generated by these [15]. The most used models to describe signalling or meta‐
bolic pathways are based on theoretical models [15–17]. These models are based on the
laws of physics and use differential or algebraic equations to represent biological pro‐
cesses. Therefore, these models cannot represent dynamic processes such as gene regula‐
tion. Over the years, alternative methods based on computational models have emerged,
and statistical and systemic models are the dominant models in stress‐response studies
[18,19]. Due to the potential for hypothesis testing, prediction, and uncertainty quantifi‐
cation, statistical models have proven to be very useful in these studies. However, their
main limitation is that they fail to incorporate the diversity present in gene expression
data acquired under different conditions and experimental conditions [15]. Models based
on mixed types overcome these limitations by setting fixed‐ and random‐effects terms.
These models are useful for combining omics data from highly variable studies, and meta‐
analysis is one of the main types of analysis that allows this combination. Meta‐analysis
is a statistical procedure for analysing data combined from several studies and can be an
important source of concise and updated information. This type of analysis has been
widely used to observe candidate genes for abiotic stress response [20–24]. The meta‐anal‐
ysis approach makes it possible to overcome the lack of characterising candidate gene
datasets or differentially expressed genes, mainly caused by the heterogeneity of single
studies. In their review, Tseng et al. [25] identify four principal meta‐analysis approaches:
combined p‐value, combined effect size, combined ranks, and directly merging raw data
[25]. The objective of this work is to provide further insight into the abiotic stress response
and to increase the accuracy of response models. For this, we conducted a statistical anal‐
ysis on some candidate gene data and related stress. We used an exploratory meta‐analy‐
sis approach as a tool for the evaluation of a dataset of candidate genes regarding the
abiotic stress response in Fagus sylvatica L. More specifically, we conducted a systematic
quantitative review, through the method of combined effect size (ES), of a wide range of
studies to increase the knowledge on the roles of candidate genes included in the initial
dataset, through the acquisition of information present in the literature. The aim of this
work is to improve existing models that describe the response to environmental stimuli
of forest species, characterised by long life cycles. To achieve this goal, we first performed
a systematic review to obtain a large database of articles concerning the study of candidate
genes involved in responding to different abiotic stresses in herbaceous plants. Subse‐
quently, we conducted an exploratory meta‐analysis that provided a quantitative sum‐
mary of the results.

Forests 2022, 13, 159 3 of 26
2. Materials and Methods
The experimental design followed to perform the meta‐analysis is shown in Figure
1. The details of each step are reported in successive paragraphs.
Figure 1. Flowchart of steps followed to perform systematic review and meta‐analysis.
2.1. Candidate Genes Database
The first step was to search for and collect the scientific articles concerning the ex‐
pression, sequencing, and annotation of specific genes in response to environmental stim‐
uli in F. sylvatica, and to place them into a single dataset (Table S1). A database of 24 se‐
lected genes involved in response to abiotic stresses (drought, salt, cold and heat stress)
in F. sylvatica was implemented.
2.2. Systematic Review
This step is particularly important as it allows us to decide which article can be con‐
sidered as following the inclusion criteria (decision on inclusion criteria) and obtain the
final papers’ database (included papers database) to be used for the successive meta‐anal‐
ysis.
As a first step, we collected information regarding enzymes encoded by the F. syl‐
vatica selected genes. In particular, we searched information on: (i) enzyme name, (ii) tran‐
script name referred to Arabidopsis thaliana genome annotation TAIR, (iii) family, (iv) sub‐
family, (v) molecular function, (vi) biological process, (vii) cellular component, and (viii)
protein class. Such information was collected through a search on major databases (KEGG,
Panther, UniProt, TAIR) and collected into a table (Table S2). Successively, we conducted
a systematic review regarding each gene present in the initial dataset following the guide‐
lines proposed by the PRISMA protocol [26]. This procedure provides a standardised
framework for meta‐analysis and systematic reviews, thus allowing the reliability and
replicability of the results obtained. The PRISMA protocol is based on identifying articles
through exhaustive bibliographical research, screening of collected articles through exclu‐
sion of duplicates, title–abstract screening, evaluation of articles for eligibility, and the
inclusion of studies of interest in quantitative synthesis (meta‐analysis) [26,27].
We searched the available literature for each selected gene through the major data‐
bases (Scopus, Research Gate, and Spring Link) and search engines (PubMed and Google
Scholar) using the following search terms: “gene ID” + “plant *” + “candidate gene *” +
“abiotic stress” + “response *” + “SNPs”. The terms have been used both together and in
combination of two or three terms (such as ‘Gene ID’ + ‘abiotic stress’ or ‘Gene ID’ + ‘abi‐
otic stress’ + ‘response’, etc.).

Forests 2022, 13, 159 4 of 26
Based on the guidance of Nakagawa et al. [28], to overcome data independence, pub‐
lication bias, and outlier issues, we limited our search to English peer‐reviewed papers
and excluded reviews (which could have led to duplicate information from some papers).
After initial screening, we determined the inclusion criteria necessary to collect usable
data: compare control to treated; quantitative PCR articles with the presence of compara‐
ble gene expression data (|log2 fold change| ≥ 0.00012); provide the mean, a measure of
dispersion (Standard Error—SE or Standard Deviation—SD), and sample size, or provide
the original data to calculate mean and SD. Moreover, the minimum number of four arti‐
cles available for each abiotic stress was considered necessary for meta‐analysis. In the
case of sub‐group analysis, we needed at least four articles for each gene for each stress.
Because some articles presented more than one case study, we considered those reporting
results from different treatments, species, or both as independent cases to avoid cases of
pseudo‐replication.
Effect Size Calculation
After applying the inclusion criteria, the effect size was calculated. Effect size is a way
of quantifying the size of the difference between two groups. It is particularly valuable for
quantifying the effectiveness of a particular treatment relative to a control. By emphasiz‐
ing the most important aspect of a treatment rather than its statistical significance, effect
size promotes a more scientific approach to knowledge accumulation. Based on some
other studies [29–32], we used Cohen’s d as the effect size. Cohen’s d describes the stand‐
ardised mean difference in an effect and is useful to compare effects across studies when
the dependent variables are measured differently. It is defined as the mean difference be‐
tween two groups, divided by the standard deviation of both groups. Conventionally, in
meta‐analysis, the two groups are considered the experimental and control groups. Cohen
[33] is given by Equation (1):
𝑑𝐹𝐶 𝐹𝐶
𝑛 1 𝑆𝐷 𝑛 1 𝑆𝐷𝑛 𝑛
(1)
where:
𝐹𝐶 = log2 fold change of treated plants;
𝐹𝐶 = log2 fold change of control plants;
nt = number of treated plants;
nc = number of control plants;
SDt = standard deviation of treated plants;
SDc = standard deviation of control plants.
The numerator is the difference between the log2 fold change of the two groups of
observations. The denominator is the pooled SD. The pooled estimate represents the mean
value of the standard deviations of the treatment and the control groups. The articles col‐
lected during the systematic review were characterised by the presence of continuous out‐
comes. The main problem detected during the calculation of the effect size was the pres‐
ence of incomplete articles of SD or other measures of dispersion. As this lack of infor‐
mation was present in most of the articles collected, we followed the lists multiple solu‐
tions of varying nature method reported by Weir et al. [30] to impute dispersion measures
from incomplete reports. Among the listed solutions, we observed and applied the prog‐
nostic method, also described by the article by Ma et al. [29]. Therefore, the calculation of
effect sizes can be divided into two steps: (i) calculation of assigned SE and the assigned
SD through prognostic method, and (ii) calculation of SDpooled and then Cohen’s d. To ap‐
ply the prognostic method for SD imputation, we collected data from the study by Van
Zhong et al. [34]. From this article, 27 SE values were selected. Through application of the
prognostic method, it was possible to impute SD and calculate Cohen’s d (Equation (1)).
Forests 2022, 13, 159 5 of 26
2.3. Meta‐Analysis: Random Effect Model, Forest and Funnel Plot
After conducting the systematic review of the collected papers and calculating the
effect size, we performed the data analysis using the “Included papers database” (Table
S4) and conducting an exploratory meta‐analysis. For this analysis, we chose to follow the
combined effect size approach [25], which assumes that standardised effect sizes can be
combined across studies. According to Tseng et al. [25], the two most used models in this
category are the fixed effects model (FEM) and the random effects model (REM). We de‐
cided to use REM given that: (i) the data analysed were continuous results and the REM
is the most effective; (ii) data vary over time, the use of this model is recommended; and
(iii) the REM is used when heterogeneous data characterised by a large variability of ex‐
perimental conditions must be compared, without committing methodological errors. The
analyses were conducted with the JASP 0.14.1 Meta‐Analysis module [35]. JASP software
supports a wide range of techniques commonly used for meta‐analysis. These include
fixed and random effects analysis, fixed and mixed effects meta‐regression, Forest and
Funnel plots, tests for funnel plot asymmetry, and more. The engine behind this power of
analysis is the metafor R package [36]. JASP is user‐friendly and freely available
(https://jasp‐stats.org/, last accessed on 18 January 2022) [35].
2.4. Interactive Analyses of Stress Meta‐Analyses Data
To better understand the results obtained from the meta‐analysis and the information
present in the bibliography, we investigated the presence of possible relationships be‐
tween the observed genes and the studied stresses. To do so, we illustrate simple set rela‐
tionships between abiotic stresses, using the genes relevant to those stresses as common‐
alities. We then visualised such data through a Venn diagram, obtained using the R
Venndiagram package [37]. The Venn diagram compares lists of genes from a set of exper‐
iments and identifies the genes shared between the experiments or unique to an experi‐
ment in relation to a stress.
3. Results
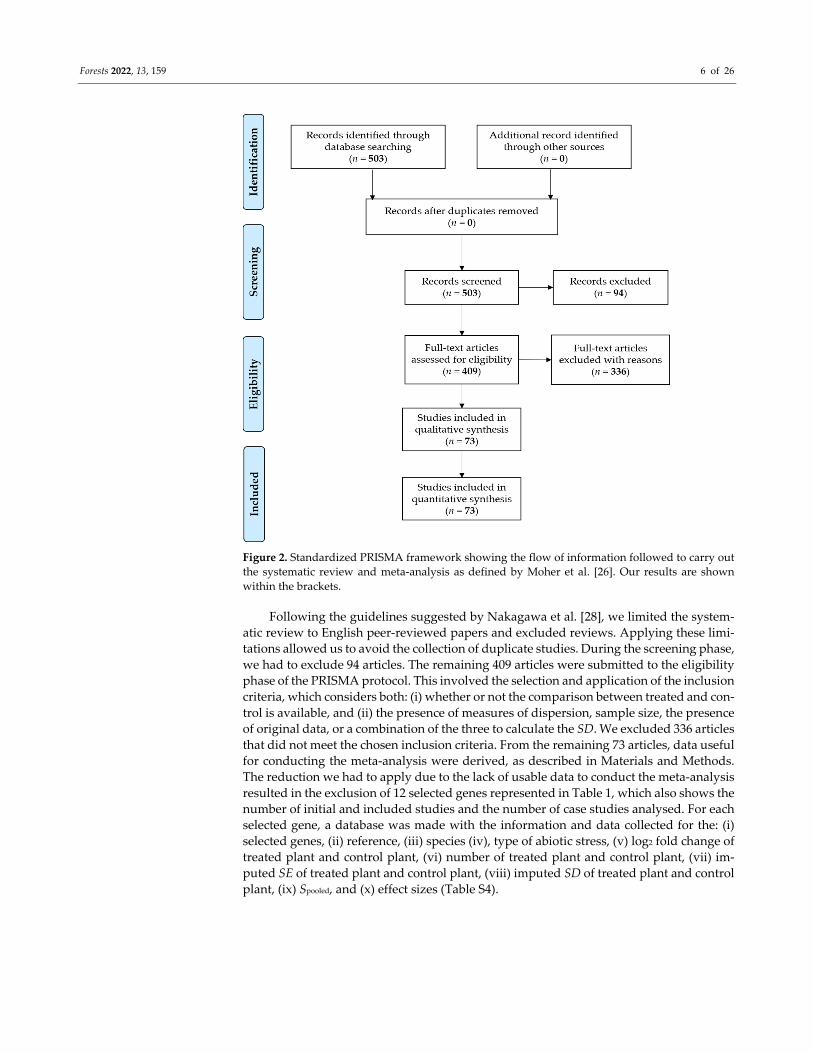
3.1. Candidate Gene Dataset, Systematic Review and Inclusion Criteria
From the bibliographic review carried out to collect information regarding genes in‐
volved in response to abiotic stress in Fagus sylvatica L., we obtained information regard‐
ing 24 selected genes (Table S1). Based on the results obtained, we carried out a systematic
review as previously described. We collected a total of 503 articles related to the expres‐
sion study of 24 selected genes in other species (Table S3). We applied the PRISMA pro‐
tocol parameters for screening the collected articles, and Figure 2 shows the complete
workflow of study selection and screening of eligible datasets.
Forests 2022, 13, 159 6 of 26
Figure 2. Standardized PRISMA framework showing the flow of information followed to carry out
the systematic review and meta‐analysis as defined by Moher et al. [26]. Our results are shown
within the brackets.
Following the guidelines suggested by Nakagawa et al. [28], we limited the system‐
atic review to English peer‐reviewed papers and excluded reviews. Applying these limi‐
tations allowed us to avoid the collection of duplicate studies. During the screening phase,
we had to exclude 94 articles. The remaining 409 articles were submitted to the eligibility
phase of the PRISMA protocol. This involved the selection and application of the inclusion
criteria, which considers both: (i) whether or not the comparison between treated and con‐
trol is available, and (ii) the presence of measures of dispersion, sample size, the presence
of original data, or a combination of the three to calculate the SD. We excluded 336 articles
that did not meet the chosen inclusion criteria. From the remaining 73 articles, data useful
for conducting the meta‐analysis were derived, as described in Materials and Methods.
The reduction we had to apply due to the lack of usable data to conduct the meta‐analysis
resulted in the exclusion of 12 selected genes represented in Table 1, which also shows the
number of initial and included studies and the number of case studies analysed. For each
selected gene, a database was made with the information and data collected for the: (i)
selected genes, (ii) reference, (iii) species (iv), type of abiotic stress, (v) log2 fold change of
treated plant and control plant, (vi) number of treated plant and control plant, (vii) im‐
puted SE of treated plant and control plant, (viii) imputed SD of treated plant and control
plant, (ix) Spooled, and (x) effect sizes (Table S4).

Forests 2022, 13, 159 7 of 26
Table 1. Summary of the 12 selected genes for which the number of articles included in the meta‐
analysis is reported. For each gene, the initial articles, included articles, and case studies are re‐
ported. Study cases represent selected cases within the same article that differ in exposure time,
treatment, plant species, and type of stress.
Candidate Genes NO. of Ini‐
tial Articles
NO. of In‐
cluded Articles
NO. of
Study
Cases
Β‐ketoacyl‐coA synthase 21 5 8
Caffeic acid o‐methyltransferase 37 7 9
Cytosolic class I small heat shock protein 46 10 22
Formate dehydrogenase 20 4 6
Glyceraldehyde‐3‐phosphate dehydrogenase 41 5 24
Heat shock protein 70 24 10 16
S‐adenosylmethionine decarboxylase 27 8 12
Light harvesting complex II protein 30 6 15
S‐adenosylmethionine synthase 42 6 36
Xyloglucan endotransglusylase hydrolase
protein 23 64 4 7
Adenylate kinase 19 4 8
ADP‐glucose pyrophosphorylase large sub‐
unit 38 4 8
3.2. Meta‐Analysis Results
We performed the meta‐analysis through the software JASP, which allowed us to
obtain the cumulative effect size values for each selected gene. These values, including
95% confidence intervals, are reported in Table 2, and the graphical representation is
shown through Forest and Funnel plots (Figure S1). Through observation of the I2 index
(Table 2), we observed that for Caffeic acid o‐methyltransferase, Cytosolic class I small heat
shock protein, Formate dehydrogenase, Glyceraldehyde‐3‐phosphate dehydrogenase, Heat shock
protein 70, Light harvesting complex II protein, S‐adenosylmethionine synthase, and Xyloglucan
endotransglusylase hydrolase protein 23 genes, the heterogeneity was high because I2 is
greater than 75% [33]. To investigate what caused the heterogeneity, we decided to carry
out subgroup analysis to assess whether, by conducting a meta‐analysis by single stress
(drought, heat, cold, salinity), the heterogeneity decreased. As shown in Table 3, we per‐
formed subgroup analyses by subdividing the analysed studies according to the type of
stress observed. We could carry out this type of analysis only for Cytosolic class I small heat
shock protein, S‐adenosylmethionine synthase, and Heat shock protein 70 genes because the
number of articles available for each abiotic stress was sufficient (at least four articles for
each gene for each stress).

Forests 2022, 13, 159 8 of 26
Table 2. Summary of results obtained through applying the random‐effects model (REM). For each
candidate gene observed, we report: the name of the gene, the species studied, the stress studied,
the cumulative effect size values, the 95% confidence interval values, and the I2 index. The I2 index
quantifies the degree of heterogeneity in analysis and measures the extent of true heterogeneity by
dividing the difference between Q (chi‐square statistic) and its degrees of freedom (k − 1) by Q, and
multiplying the result by 100.
Candidate Genes Species Stress REM (Cumulative
Effect SIZE)
95% Confi‐
dence Inter‐
val
I2
(Cumula‐
tive Index
in %)
Β‐ketoacyl‐coA synthase
Arachis hypogaea L. Drought
0.88 (−0.56, 2.33) 0.000
Arabidopsis thaliana L. Drought
Gossypium hirsutum L. Salt
Hippophae rhamnoides
L. Cold/Freeze
Zea mays L. Submergent
Caffeic acid o‐methyltrans‐
ferase
Phyllanthus urinaria L. Drought
4.31 (−2.60, 11.21) 98.936
Zea mays L. Drought
Tamarix hispida Willd. Salt
Salix matsudana Koitz. Salt
Medicago truncatula
Gaertn.
Heavy metal
(Al)
Allium cepa L. Heavy metal
(Pb)
Cytosolic class I small heat
shock protein
Pennisetum glaucum R.
Br. Drought/Salt
2.54 (1.56, 3.52) 99.873
Arabidopsis thaliana L. Drought/Cold
Agrostis stolonifera L. Drought/Salt
Juglans regia L. Salt/Cold
Sedum lineare L. Salt
Oryza sativa L. Drought/Salt
Camelia sinensis
Kuntze Cold
Formate dehydrogenase
Hordeum vulgare L. Drought
1.72 (−0.83, 4.26) 88.187
Trifolium pratense L. Cold
Glycine max Merr. Heavy metal
(Al)
Vigna umbellata Thunb. Heavy metal
(Al)
Glyceraldehyde‐3‐phosphate
dehydrogenase
Arabidopsis thaliana L. Heavy metal
(Cd)
2.47 (1.23, 3.72) 91.334 Triticum aestivum L.
Drought/Cold/
Salt
Oryza sativa L. Salt/Heat
Heat shock protein 70
Zea mays L. Heat
3.74 (1.69, 5.79) 97.688
Triticum aestivum L. Drought/Heat
Glycine max Merr. Heat
Nicotiana tabacum L. Heat/Cold
Chrysanthemum spp. Heat
Arabidopsis thaliana L. Cold

Forests 2022, 13, 159 9 of 26
S‐adenosylmethionine de‐
carboxylase
Oryza sativa L. Drought/Salt
1.91 (1.01, 2.80) 67.026
Sugar beet monosomic Salt
Zea mays L. Salt
Brassica napus L. Waterlogging
Eremochloa ophiuroides
Hack. Cold
Arachis hypogaea L. Salt
Light harvesting complex II
protein
Solanum lycopersicum
L. Drought/Cold
−4.79 (−8.18, 1.39) 99.202
Vitis vinifera L. Drought
Hordeum vulgare L. Drought
Populus simonii Car‐
rière Heat
Sedum alfredii L. Heavy metal
(Cd, Zn)
Panax ginseng
C.A.Mey. Salt/Chilling
S‐adenosylmethionine syn‐
thase
Suaeda maritima Du‐
mort. Salt
45.10 (−40.06,
130.127) 99.998
Oryza sativa L. Salt
Cucumis sativus L. Salt
Lycopersicon esculentum
L. Salt
Solanum lycopersicum
L.
Drought/Heat/
Cold/salt
Cajanus cajan L. Drought/Cold
Panax ginseng
C.A.Mey. Cold/Salt
Xyloglucan endo‐
transglusylase hydrolase
protein 23
Zea mays L. Heat
3.18 (1.38, 4.98) 89.734
Vigna umbellata Thunb. Heavy metal
(Al)
Populus euphratica
Oliv.
Heavy metal
(Cd)
Arabidospsis thaliana L. Heavy metal
(Br)
Glycine max Merr. Iron deficiency
Benincasa hispida
Thunb. Drought
Adenylate kinase
Oxytenanthera Abys‐
sinica A.Rich. Drought
0.32 (−0.56, 1.67) 0.000 Solanum lycopersicum
L. Drought
Helianthus annuus L. Drought
Zea mais L. Salt
ADP‐glucose pyrophos‐
phorylase large subunit
Oxytenanthera Abys‐
sinica A.Rich. Drought
0.84 (−0.42, 2.11) 20.691 Solanum lycopersicum
L. Drought
Oryza sativa Salt

Forests 2022, 13, 159 10 of 26
After subgrouping, the heterogeneity not caused by chance of the observations for S‐
adenosylmethionine synthase does not seem to decrease. The heterogeneity could be derived
from the variability of the experimental conditions under which the studied plant species
are subjected to the stresses. However, a decrease in heterogeneity can be detected for
only those studies involving the observation of cold stress response, an indicator that the
experimental conditions were similar. We observed similar results for Heat shock protein
70, where only the subgroup related to heat stresses appears to decrease in heterogeneity.
Subgrouping for Cytosolic class I small heat‐shock protein resulted in decreased heterogene‐
ity values for all observed stresses.
Table 3. Summary of heterogeneity indexes for only those genes to which subgrouping could be
applied. For each candidate gene, we report: the name of the gene, I2 cumulative, the stress studied
for subgroup, the cumulative effect size values for each subgroup, the 95% confidence interval val‐
ues for each subgroup, and I2 for each subgroup. The I2 index represents the degrees of variability:
it quantifies the degree of heterogeneity in analysis and measures the extent of true heterogeneity
by dividing the difference between Q (chi‐square statistic) and its degrees of freedom (k − 1) by Q
and multiplying the result by 100.
Candidate Genes I2 (Cumulative) Subgroups REM (for Each
Subgroup)
95% Confidence
Interval (for Each
Subgroup in %)
I2 (for Each SUB‐
GROUP in %)
Cytosolic class I small
heat shock protein 99.873
Salt 1.81 (0.53, 3.09) 65.885
Cold 0.83 (−0.59, 2.26) 67.125
Drought 1.94 (0.80, 3.07) 63.164
Heat shock protein 70 97.632
Heat 0.72 (0.31, 3.55) 31.33
Cold 1.94 (−1.43, 5.31) 95.142
Drought 8.32 (5.36, 11.27) 94.358
S‐adenosylmethionine
synthase 99.721
Salt −0.64 (−3.15, 1.86) 96.505
Cold 1.05 (−0.54, 2.65) 68.209
The main result of the meta‐analysis is represented by a graph, called a forest plot,
which depicts the extension of the effect size for each study case and the cumulative effect
size obtained with the random effects model (REM). Figures 3 and 4 show the forest plots
for the subgroup analysis of Cytosolic class I small heat shock protein and S‐adenosylmethio‐
nine decarboxylase.

Forests 2022, 13, 159 11 of 26
Figure 3. Forest plots of cytosolic class I small heat‐shock protein. Subgroup analysis was conducted for
(a) salt stress, (b) cold stress, and (c) drought stress. The presence of a repeated article in succession
within the figure represent the presence of multiple case studies reported in the same paper and
which differ in time exposure, treatment, plant species, and type of stress. The references within the
figure are part of the reference list reported in the Table S4.
Observing the cumulative effect size values, shown in Table 3 and Figure 3, it can be
inferred that the expression of the gene encoding for cytosolic class I small heat‐shock protein
is positively regulated in response to salinity, cold, and drought stress. The large hetero‐
geneity of studies for the response to cold stress confers a lower statistical potential, ob‐
servable by the model confidence interval intersecting zero (Table 3, Figure 3).
Figure 4 displays the forest plots of the subgroup analysis for the gene encoding for
S‐adenosylmethionine synthase. Observing the cumulative effect size reported in Figure 4
and Table 3, it is possible to observe that the expression of the gene encoding for S‐adeno‐
sylmethionine synthase is positively regulated during the response to cold stress and nega‐
tively regulated during the response to salinity stress. Again, the heterogeneity of the
studies confers greater uncertainty. The confidence interval, in both cases, intersects 0.
Thus, although a subgroup analysis can be performed, the heterogeneity of these studies
still confers a degree of uncertainty. The situation is somewhat different for analyses per‐
formed in the absence of subgroup division of study cases. The variance of the studies in
this type of analysis is higher than in subgroups. Despite this, it was possible to observe

Forests 2022, 13, 159 12 of 26
values of the cumulative effect size of the REM having a confidence interval that does not
intersect the 0. In Figure 5, forest plots with the relative effect size of some genes analysed
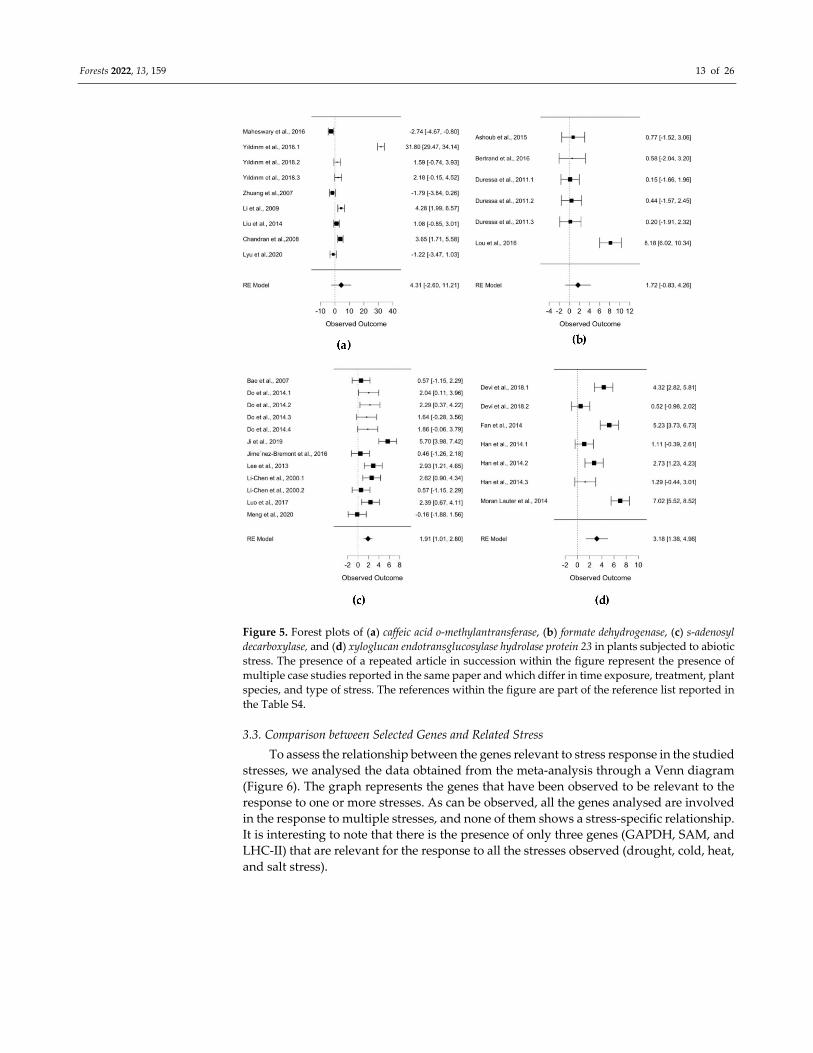
without the subdivision into subgroups are reported. It can be seen that the genes encod‐
ing for S‐adenosyl decarboxylase and xyloglucan endotransglucosylase hydrolase protein 23 ex‐
hibit positive expression regulation during the response to abiotic stresses.
Figure 4. Forest plots S‐adenosylmethionine synthase. Subgroup analysis was conducted for (a) salt
stress and (b) cold stress. The presence of a repeated article in succession within the figure represent
the presence of multiple case studies reported in the same paper and which differ in time exposure,
treatment, plant species, and type of stress. The references within the figure are part of the reference
list reported in the Table S4.
Forests 2022, 13, 159 13 of 26
Figure 5. Forest plots of (a) caffeic acid o‐methylantransferase, (b) formate dehydrogenase, (c) s‐adenosyl
decarboxylase, and (d) xyloglucan endotransglucosylase hydrolase protein 23 in plants subjected to abiotic
stress. The presence of a repeated article in succession within the figure represent the presence of
multiple case studies reported in the same paper and which differ in time exposure, treatment, plant
species, and type of stress. The references within the figure are part of the reference list reported in
the Table S4.
3.3. Comparison between Selected Genes and Related Stress
To assess the relationship between the genes relevant to stress response in the studied
stresses, we analysed the data obtained from the meta‐analysis through a Venn diagram
(Figure 6). The graph represents the genes that have been observed to be relevant to the
response to one or more stresses. As can be observed, all the genes analysed are involved
in the response to multiple stresses, and none of them shows a stress‐specific relationship.
It is interesting to note that there is the presence of only three genes (GAPDH, SAM, and
LHC‐II) that are relevant for the response to all the stresses observed (drought, cold, heat,
and salt stress).

Forests 2022, 13, 159 14 of 26
Figure 6. Venn diagram regarding stresses and candidate genes whose expression is regulated in
response to these stresses. The results were generated using Venndiagram R package [37]. The data
present within and at the intersections of the sets represent the ID of the observed genes. The sets
represent the type of stress studied.
4. Discussion
The information collected and analysed by an exploratory meta‐analysis based on
the random‐effect model and the combined effect‐size approach (Cohen’s d) allowed us
to identify and select 12 genes responding to abiotic stresses in F. sylvatica. As can be seen
from our overall synthesis of the collected studies revealed heterogeneity between studies
(Table 2, Figures S1, 3 and 4), for Heat shock protein 70 (Figure S1), cytosolic class I small heat‐
shock protein (Figure 3), and S‐adenosylmethionine synthase (Figure 4), it was possible to con‐
duct an analysis in subgroups, limited only to case studies concerning a specific stress
(Table 3). This type of analysis, in some cases, has led to a reduction in the heterogeneity
present originally (Table 3, Figures 3, 4, and S1). We hypothesised that this heterogeneity
might also be due to different conditions and the time of exposure to which plants are
subjected to abiotic stress. Thus, we speculated that the heterogeneity depends on meth‐
odological differences between studies included in the meta‐analysis. Despite this great
heterogeneity, it was possible to observe the cumulative effect of the various case studies
for the 12 genes analysed (Table 2). This effect, obtained through the application of the
REM, allowed us to observe the expression of genes in response to stresses.
The results obtained allowed us to set up models of plants’ responses to abiotic
stresses implementing the stress models in forest species reported below. As there is no
specific information on a metabolic pathway in forest species, we considered herbaceous
species to acquire more specific information of the selected genes to check if they are in‐
volved in abiotic stresses Using our results, we have developed a specific model for each
abiotic stress (heat, cold, drought, and salt). We have followed the general scheme sug‐
gested by Harfousche et al. [3] as this is one of the most comprehensive for illustrating the
main generic response pathways to abiotic stresses.
4.1. Heat Stress Model
Sudden increases in temperature trigger the stress response in many different organ‐
isms, such as bacteria, fungi, and plants. In plants, it has been observed that initial expo‐
sure from medium to high heat stress provides resistance against a subsequent lethal dose.

Forests 2022, 13, 159 15 of 26
This phenomenon is called acquired tolerance [38,39]. The heat stress response is charac‐
terised by an elevated synthesis of a specific set of heat shock proteins (Hsps) associated
with the development of thermotolerance [40–42]. Among the genes involved in the heat
stress response, we observed the gene encoding for Hsp70 to be positively regulated by
heat stress (Table 2). In eukaryotes, including plants, many different members of the
Hsp70 family have been observed. From the information obtained from the systematic
review, we observed that members of the Hsp70 family exhibit functions attributed to
heat and cold stress and seed maturation and germination (Figure S1, Table 2). Together,
these data suggest that plant Hsp70 proteins interact with diverse substrates and take part
in a plethora of cellular processes in Glycine max L. and Zea mays L [43–45]. Additionally,
concerning the heat stress response, we observed the regulation of the gene encoding for
cytosolic small heat shock protein (sHsps) (Figure 3). This gene appears to be over‐expressed
in response to this stress. Based on the information obtained from the systematic review,
we observed that sHsps are a group of proteins whose production is ubiquitous in the cell
in response to heat stress. In fact, these proteins are the most dominant proteins produced
in response to such stress [38]. These proteins exhibit typical chaperone‐like activity; in
fact, they bind to unfolding intermediates to protect them from irreversible aggregation
and maintain them in a competent refolding state. Expression patterns and chaperone‐
like function of sHsps suggest that their production correlates with the thermotolerance
status acquired by cells following mild heat stress in Nicotiana tabacum L. [46]. One of the
genes that we have observed to be regulated in response to heat stress is the gene encoding
for ADP‐glucose pyrophosphorylase large subunit (AGP‐ase) (Figure S1). In contrast to what
has been reported for the previous two genes, the expression of AGP‐ase seems to be neg‐
atively regulated by heat stress conditions. Indeed, from the information obtained as a
result of the systematic review, we observed that AGP‐ase activity is decreased, inhibited,
or both in response to heat stress (Figure S1, Table S4) in accordance with what was re‐
ported by Shayanfar et al. [46] in Triticum aestivum L. and Mangelsen [47] in Hordeum vul‐
gare L. Kaur et al. [48] reported that AGP‐ase activity is directly correlated with starch
biosynthesis in Triticum aestivum L. The decrease in AGP‐ase activity during heat stress
appears to be directly related to the redirection of carbon flux away from starch biosyn‐
thesis pathways. Inhibition of this gene appears to be directly related to the decrease in 3‐
phosphoglycerate caused by increased respiration. Another gene that we observed to be
down‐regulated in response to this stress is the gene encoding for Light harvesting complex
II protein (LHC‐II). As can be seen from Table 2, the cumulative effect size for this gene is
negative (−4.79). Based on the information obtained from the systematic review, we ob‐
served how heat stress conditions could directly affect the structure of this protein (Table
S3). Accordingly, Song et al. [49] and Shakeel et al. [50] have also observed a down‐regu‐
lation of LHC‐II in response to elevated temperatures in Populus simonii Carrière and Agave
americana L. An interesting finding reported by Vayghan et al. [51] concerns the phosphor‐
ylation status of the gene in response to elevated temperatures. This epigenetic pattern is
usually linked with increased gene expression. Indeed, in the study by Vayghan et al. [51],
the gene encoding for LHC‐II was found to be up‐regulated in Lepidium sativum L. Figure
7 shows the model of response to heat stress considering the results obtained from the
meta‐analysis of our study.

Forests 2022, 13, 159 16 of 26
Figure 7. Hypothetical model of heat stress responses. AHAK1, Histidine kinase 1 [52]; HPT/AHP2
Histidine‐containing phosphotransfer ABF [52]; CNGC6, Cyclic nucleotide gated Ca2+ channel 6 [53–56]; MID1, Ca2+‐permeable mechanosensitive channels mid1‐complementing activity 1 [57];
phyB, Photosensory receptor B [56,58]; TMS10, TMS10L, Thermo‐sensitive genic male sterile 10
[5,56,59]; CaM3, Calmodulin 3 [56,60]; CBK3, CaM‐binding protein kinase 3 [56,60]; CRLK1, Cal‐
cium/Calmodulin‐regulated receptor like cytoplasmic kinases 1 [5,56,61]; CRLK2, Calcium/Calmod‐
ulin‐regulated receptor like cytoplasmic kinases 2 [5,61]; DREB2A, DRE‐binding protein 2A [62];
HSFs, Heat stress transcription factor [62]; WRKY39, WRKY transcription factor 39 [2,62]; bZIP17,
Basic doamin/leucine zipper17 Transcription factor [2,62]; bZIP28, Basic doamin/leucine zipper28
Transcription factor [2,62]; bZIP60, Basic doamin/leucine zipper60 Transcription factor [2,62].
4.2. Cold Stress Model
Low temperature is one of the major abiotic stresses limiting the growth and devel‐
opment of many plant species and affecting their geographic distribution. Arabidopsis tha‐
liana L. can increase freezing tolerance in response to low temperatures through extensive
gene expression reprogramming events that result in appropriate metabolic–structural al‐
terations [63,64]. The result of these reprogramming events is the increased levels of hun‐
dreds of metabolites with protective and signalling effects [64]. Through the analysis of
the results of the systematic review, we observed the behaviour of some key genes (Cyto-solic class I small heat-shock protein, Light‐harvesting complex II protein, S‐adenosylmethionine
synthase, S‐adenosyl‐l‐homocysteine hydrolase) for the response to these environmental con‐
ditions (Table 2, Figure 8). These include the previously mentioned genes encoding for
Hsps (Figure 3) and sHsps (Figure S1). Hsps are commonly associated with response to
high temperatures, but evidence indicates that they can also respond to low temperatures
in Arabidopsis thaliana [65,66]. Renaut et al. [67] observed that two Hsp70‐like proteins
were up‐regulated in response to cold stress in Prunus persica L. As already observed for
heat stress, the role of Hsps is to prevent the aggregation of denatured proteins, facilitat‐
ing their refolding under cold stress conditions [63]. Among the genes found to be regu‐
lated in response to multiple stresses, we observed the gene encoding for Light‐harvesting
complex II protein (LHC‐II). From the observation of the results obtained from the system‐
atic review, in fact, the expression of the LHC‐II gene appears to be induced by cold stress
(Table 2). In some studies on tomatoes and tobacco, the up‐regulation of this gene in re‐
sponse to low‐temperature stress has been observed [68–70]. Up‐regulation of LHC‐II al‐
lows a reduction in ROS content, acting as an antioxidant. This effect protects the biolog‐
ical membrane system and protects photosystem‐II from photoinhibition. After the appli‐
cation of the systematic review and meta‐analysis, we observed cold‐stress‐induced reg‐
ulation of two interesting genes coding for S‐adenosylmethionine synthase (SAMS) and S‐
adenosyl‐l‐homocysteine hydrolase (SAHH) (Figure S1). S‐adenosyl methionine is an important
protein that serves as a universal donor of methyl groups. Being the keystone of one of
the most important epigenetic patterns, this protein is fundamental during the growth

Forests 2022, 13, 159 17 of 26
and development phases of plants. SAM has, in fact, a fundamental role in the methyla‐
tion of DNA, RNA, and polyamine and biotin biosynthesis [71,72]. Scientific evidence has
shown that SAM can interact in the regulatory pathway of environmental stimuli re‐
sponse through epigenetic modifications and hormonal control in plant cells, as demon‐
strated in Oryza sativa L. and Arabidopsis thaliana L. [73]. SAM is synthesised through the
action of the enzyme S‐adenosylmethionine synthetase (SAMS) that catalyses this synthesis
from ATP and l‐methionine. From the observation of our results, SAM seems to be up‐
regulated during cold stress (Table 2, Table S4). Studies of Guo et al. [74], Mahatma et al.
[75], and Heidari et al. [76] demonstrated that in plants such as Medicago sativa L. [74],
Cajanus cajan L. [75], and Solanum lycopersicum L. [76], a gene encoding for SAMS was up‐
regulated in response to cold stress. Induction of SAMS during stress increases SAMS lev‐
els as positive effects of ethylene and polyamine biosynthesis [71]. Because it appears to
correlate with hormone synthesis, induction of SAMS activity may elevate ethylene levels.
Ethylene might be involved in cell wall thickening [73]. According to Poulton et al. [77],
the availability of the SAM enzyme is a key prerequisite for methylation. However, these
methylation reactions have by‐products that can inhibit methyltransferase activity [78,79].
One of these by‐products is S‐adenosyl‐l‐homocysteine (SAH). This protein can compete
with SAM for the same binding site. Therefore, during developmental stages and during
the stress response, this protein must be efficiently removed. To ensure the proper methyl‐
transferase activity of SAM, SAH is rapidly hydrolysed by another key enzyme during
the stress response, namely S‐adenosyl‐l‐homocysteine hydrolase (SAHH), which catalyses
the hydrolysis of SAH into l‐homocysteine and adenosine (Ado) [79]. In fact, the results of
the systematic review and meta‐analysis showed that in Arabidopsis thaliana plants sub‐
jected to cold stress, there is over‐regulation of SAHH (Figure S1), in accordance with
Puyaubert et al. [80]. The results obtained in our study permitted us to depict the model
of response to heat stress reported in Figure 8.
Figure 8. Hypothetical model of cold stress responses. AHAK1, Histidine kinase 1 [52]; HPT/AHP2
Histi‐dine‐containing phosphotransfer ABF [52]; CNGC6, Cyclic nucleotide gated Ca2+ channel 6
[53–56]; MID1, Ca2+‐permeable mechanosensitive channels mid1‐complementing activity 1 [57];
COLD1, Chilling tolerance divergenece 1 [56,81]; RGA1, G‐protein alpha subunit 1 [56,81]; CIPK7,
CBL‐interacting protein kinase 7 [56–60]; CRLK1, Calcium/Calmodulin‐regulated receptor like cy‐
toplasmic kinases 1 [5,56,61]; CRLK2, Calcium/Calmodulin‐regulated receptor like cytoplasmic ki‐
nases 2 [5,56,61]; ICE1, Induced CBP expression 1 [82]; CBF3, C‐repeat‐binding factor 3
[82];DREB1A, DRE‐binding protein 1A [62]; ERF, Ethylene‐responsive transcription factor [82]; AP2,
APETALA2/ethylene response factor [82]; RAP2.1, CBF‐regulation transcription factor 2.1 [82];
RAP2.6, CBF‐regulation transcription factor 2.6 [82]; STZ/ZAT10, C2H2‐type zinc finger transcrip‐
tion factor [82]; CCA1, MYB‐type transcription factor [82]; LHY, MYB‐type transcription factor [82].

Forests 2022, 13, 159 18 of 26
4.3. Drought Stress Model
Drought stress is a major factor that can often lead to plant mortality. This stress is
strictly correlated to the water deficit, for which the major effect is the interruption of wa‐
ter flows along the xylem, causing cavitation. This results in embolisms that disturb the
normal conduction of water, causing alterations in plant growth [3]. Moreover, in long‐
lived perennial tree species, the water balance in the tissues is crucial for growth, survival,
and reproductive ability and influences the species’ distribution along the environment
gradient [83,84]. Stress‐mitigation mechanisms aim to improve water‐use efficiency by
balancing uptake and leakage. As shown in Figure 6, all 12 candidate genes are involved
in plant responses to drought stress. Among the observed genes, there are some that are
quite remarkable: caffeic acid 3‐O‐methyltransferase (COMT) and xyloglucan endotransgluco‐
sylase/hydrolases 23 (XTHs). From our study, we found that drought stress leads to in‐
creased cell wall lignification through the increased abundance of COMT, as found by
Vincent et al. [84] in Zea mays L. Another gene that seems to be involved in the drought
stress response is xyloglucan endotransglucosylase/hydrolases (XTHs). In effect, based on the
information obtained through the systematic review, we observed that XTHs are posi‐
tively regulated by drought stress in plants such as Benincasa hispida Thunb. [85], Zea mays
L. [86], and Solanum lycopersicum L. [87]. XTHs play a key role in modifying cell wall struc‐
ture and elasticity by cleaving and reforming the bonds between xyloglucan chains [88].
Plants organs development is based on cell division in the meristematic zones followed
by a tremendous expansion of novel cells in a complex turgor‐driven process. Therefore,
any reduction in cell turgor, caused by osmotic stress, also reduces the mechanical power
of the cell to expand the polysaccharide network [89]. Figure 9 shows the model of re‐
sponse to drought stress detailed with the results obtained from the meta‐analyses of our
study.
Figure 9. Hypothetical model of drought stress responses. BAM1, Leucine‐rich repeat receptor‐like
serine/threonine‐protein kinase 1 [5,90]; BAM2, Leucine‐rich repeat receptor‐like serine/threonine‐
protein kinase 1 [5,90]; ECA1, ER‐localized type 2A Ca2+‐ATPase [5,91]; CLE25, Small peptide Clav‐
ata3/endosperm domain‐binding region‐related 25 [5,90]; PBS2, mitogen‐activated protein kinase
PBS2 [5]; HOG1, Mitogen‐activated protein kinase HOG2 [5]; pKC, protein kinase C [5,92]; CDPK,
calcium‐dependent protein kinase [5]; NFYA5, Nuclear factor Y A5 [93]; ABRE, ABA‐responsive
element [92,93]; DRE/CRT, Dehydration‐responsive element‐binding protein [91,92]; ABFs, ABRE‐
Binding factor [92,93]; DPBFs, D3 protein binding factor [93]; AP2/EREBP, APETALA2/Ethylene‐
responsive element binding protein [92,93]; bZIP, Basic domomain/leucine zipper17 Transcription
factor [92,93]; MYB96, MYB transcription factor 96 [92,93]; NAM‐ATF1, NAC‐transcription factor 1
[92,93]; NAM‐ATF2, NAC‐transcription factor 2 [92,93]; DRIP1, DREB2A‐interacting protein 1 [93];
DRIP2, DREB2A‐interacting protein 2 [93].

Forests 2022, 13, 159 19 of 26
4.4. Salt Stress Model
The salinity of the soil, often caused by NaCl, has a negative impact on the growth
and development of plants [3]. This stress is represented by ion imbalance and hyperos‐
motic stress, leading to disorganisation of the cell membrane, ion toxicity, and oxidative
damage [3]. In addition, salt stress causes oxidative stress due to the generation of reactive
oxygen species (ROS) [94]. Regarding this kind of stress, through systematic reviews, we
found interesting aspects concerning the behaviour of glyceraldheyde 3‐phosphate dehydro‐
genase (GAPDH), S‐adenosylmethionine synthase (SAMS), and S‐adenosyl‐l‐homocisteine hy‐
drolase (SAHH) genes (Table 2, Figure 10). GAPDH is involved in glycolysis, the photo‐
synthetic reductive pentose phosphate pathway, and in signal‐transduction processes re‐
lated to the perception/signalling of abiotic stresses. Therefore, to date, this enzyme is de‐
fined as a moonlighting protein [95]. It is possible that the enzyme contributes to increas‐
ing salt tolerance in plants maintaining higher recycling rates of ADP and NADP+ to de‐
crease ROS production, helping to maintain photosynthetic efficiency and plant develop‐
ment [96]. We observed from our results (Table S4) that GADPH expression was positively
influenced by salt stress in Thellungiella halophila, Medicago sativa, Arabidopsis thaliana, and
rice [97–99]. Furthermore, glyceraldheyde 3‐phosphate dehydrogenase participated in the pol‐
yamines (PAs)‐mediated salt stress responses of Arabidopsis thaliana roots [98]. Another
interesting finding that we observed concerns the activity of two key genes, S‐adenosylme‐
thionine synthase (SAM) and S‐adenosyl‐l‐homocysteine (SAHH). SAM, from our results (Ta‐
ble S4), appears to be up‐regulated under salt stress in Lycopersicon esculentum. From the
information obtained through systematic reviews (Table S3), it emerged that there is an
association between lignin deposition in vascular plant tissues and up‐regulation of the
gene encoding for SAMS during salt stress [100]. In addition, in response to salinity stress,
vascular plants activate mechanisms to increase root cell wall synthesis and modification
[101] (Table S3). These mechanisms involve a strong methyltransferase activity that re‐
quires elevated SAM synthesis. As observed for cold stress, methyltransferase activity ap‐
pears to be crucial to the stress response. The dynamic process involves three foundational
enzymes: SAM, SAMS, and SAHH. As already observed for cold stress [80], upregulation
of the gene encoding for SAHH was also observed for salt stress in Spinacia oleracea L.
[102]. Figure 10 shows the model of response to salt stress implemented with the results
of our study.
Figure 10. Hypothetical model of salt stress responses. AHAK1, Histidine kinase 1 [52]; HPT/AHP2
Histidine‐containing phosphotransfer ABF [52]; OSCA1.1, Hyperosmolality‐gated Ca2+ permeable
channel 1.1 [5,103]; OSCA1.2, Hyperosmolality‐gated Ca2+ permeable channel 1.2 [5,102]; OSCA3.1,
Hyperosmolality‐gated Ca2+ permeable channel 3.1 [5,102]; AHA2, inhibition of the plasma mem‐
brane H+‐ATPase 2 [52,104]; RALFs, Rapid alkalinization factors [5,105]; IPUT1, Inositol phosphor‐
ylceramide glucuronosyltransferase [5,106]; GIPC, Sphingolipid glycosyl insitol phosphorylcer‐
amide [5,106]; LLG1, co‐receptor LORELEI‐like GPI‐anchored protein 1 [5,107,108]; LRX3, Leucine‐

Forests 2022, 13, 159 20 of 26
rich extension 3 [5,107,108]; LRX4, Leucine‐rich extension 4 [5,107,108]; LRX5, Leucine‐rich exten‐
sion 5 [5,107,108]; SIP, RALF22 ligand via Site 1 Protease [5,109]; MYB, MYB‐type transcription fac‐
tor [110]; TCP, TCP‐type transcription factor [110]; Class III HD‐ZIP, Class III HD‐ZIP transcription
factor [110]; CBF‐B/NF‐YA, CCAAT‐binding transcription factor [110]; SCR, Scarecrow transcrip‐
tion factor [111]; PLT, Plethora transcription factor [111]; BHLH, basic helix–loop–helix transcription
factor [111]; GRF2, GRF2 Growth regulating transcription factor [112]; KN3, KN3 Homeobox tran‐
scription factor [62]; CAMTAs, CaM‐Binding transcription factor [113]; GTLs, GT‐element‐binding
proteins transcription factor [113]; NIG1, basic helix‐loop‐helix‐type [114].
4.5. Comparison of Genes and Related Stress
The Venn diagram showed no presence of stress‐specific genes (Figure 6). Neverthe‐
less, some types of stress responses are systemic and potentially confer tolerance to mul‐
tiple types of stress [115,116]. This confirms what was found in other multiple stresses
studies carried out in Arabidopsis thaliana L. and Oryza sativa L. [117,118], showing that the
plant response represents the result of complex interactions rather than a simple merging
of responses to individual stresses. Moreover, Sewelam et al. [116] suggested that genes
that are induced under multiple stress conditions represent possible better candidates for
holding stress‐tolerance patterns than select genes that are only expressed under individ‐
ual stresses. Genes associated with these systemic responses may provide interesting in‐
formation about the molecular networks underlying stress resistance [117–119]. It is pos‐
sible to assume that these systemic response mechanisms are conserved among different
plant species. Our results showed that regardless of the species subjected to abiotic
stresses, the 12 genes analysed are involved in response to abiotic stress (Table S4). In fact,
LHC‐II was involved in plants such as tobacco and tomato in response to cold stress and
SAM was involved in Medicago sativa L. [74], Cajanus cajan L. [75], and Solanum lycopersi‐
cum L. [76] (Table S3).
5. Conclusions
In this study, we were able to deepen the knowledge reported in some theoretical
models for the response to abiotic stresses showing the usefulness of the meta‐analysis
approach. In fact, large‐scale theoretical models, based on mathematical methods, are very
useful to understand the physical and biophysical laws at the basis of stress response met‐
abolic pathways [15,25], but cannot clearly represent the dynamic mechanisms that regu‐
late gene expression in response to one or more stress conditions. These theoretical models
present some knowledge gaps due to the lack of representation of transcription factors or,
indeed, candidate genes.
The approach we used for the identification and representation of Β‐ketoacyl‐coA syn‐
thase, Caffeic acid o‐methyltransferase, Cytosolic class I small heat shock protein, Formate dehy‐
drogenase, Glyceraldehyde‐3‐phosphate dehydrogenase, Heat shock protein 70, S‐adenosylmethio‐
nine decarboxylase, Light harvesting complex II protein, S‐adenosylmethionine synthase, Xyloglu‐
can endotransglusylase hydrolase protein 23, Adenylate kinase, and ADP‐glucose pyrophosphory‐
lase large subunit genes (Table 1, Figures 7–10) for stress‐responsive metabolic pathways,
proved to be very useful and effective in collecting and analysing information to better
understand their role in the response to abiotic stresses. The future direction of this type
of analysis should certainly be to analyse entire databases of genes involved in abiotic
stress responses in other trees to deepen the knowledge of molecular and physiological
responses in relation to different environmental stimuli. Future research should lead to
the development of theoretical–statistical models, where information is obtained with
mathematical, physical, statistical, and biophysical models.
Supplementary Materials: The following are available online at www.mdpi.com/arti‐
cle/10.3390/f13020159/s1, Table S1: List of selected candidate genes for abiotic stress response in
Fagus sylvatica L., Table S2: List of enzymes encoded by selected genes, Table S3: Systematic review
bibliography, Table S4: Database for meta‐analysis, Figure S1: Forest and Funnel plot.

Forests 2022, 13, 159 21 of 26
Author Contributions: Co‐First/Equal authorship: C.G. and R.F.; Conceptualization, C.G., R.F., C.V.
and D.P.; methodology, C.G. and R.F.; formal analysis, C.G. and R.F.; resources, D.P.; data curation,
C.G., R.F., C.V., and D.P.; writing—original draft preparation, C.G. and R.F.; writing—review and
editing, C.V. and D.P.; supervision, D.P.; project administration, C.V.; funding acquisition, D.P. and
C.V. All authors have read and agreed to the published version of the manuscript.
Funding: This research was funded by LIFE PROGRAMME OF EUROPEAN UNION, grant num‐
ber LIFE18ENV/IT/000124 LIFE SySTEMiC.
Institutional Review Board Statement: Not applicable.
Informed Consent Statement: Not applicable.
Data Availability Statement: The data presented in this study are openly available in the supple‐
mentary MS Access database included with this submission: Table S3.
Acknowledgments: We would like to thank Catia Boggi (CNR‐IBBR, Italy) for technical support.
We thank the anonymous reviewers for their revision and for helpful comments on the manuscript.
Conflicts of Interest: The authors declare no conflict of interest.
References
1. Zhu, J.‐K. Abiotic Stress Signaling and Responses in Plants. Cell 2016, 167, 313–324. https://doi.org/10.1016/j.cell.2016.08.029.
2. Ahuja, I.; de Vos, R.C.H.; Bones, A.M.; Hall, R.D. Plant Molecular Stress Responses Face Climate Change. Trends Plant Sci.
2010, 15, 664–674. https://doi.org/10.1016/j.tplants.2010.08.002.
3. Harfouche, A.; Meilan, R.; Altman, A. Molecular and Physiological Responses to Abiotic Stress in Forest Trees and Their Rele‐
vance to Tree Improvement. Tree Physiol. 2014, 34, 1181–1198. https://doi.org/10.1093/treephys/tpu012.
4. Estravis‐Barcala, M.; Mattera, M.G.; Soliani, C.; Bellora, N.; Opgenoorth, L.; Heer, K.; Arana, M.V. Molecular Bases of Re‐
sponses to Abiotic Stress in Trees. J. Exp. Bot. 2020, 71, 3765–3779. https://doi.org/10.1093/jxb/erz532.
5. Gong, Z.; Xiong, L.; Shi, H.; Yang, S.; Herrera‐Estrella, L.R.; Xu, G.; Chao, D.‐Y.; Li, J.; Wang, P.‐Y.; Qin, F.; et al. Plant Abiotic
Stress Response and Nutrient Use Efficiency. Sci. China Life Sci. 2020, 63, 635–674. https://doi.org/10.1007/s11427‐020‐1683‐x.
6. Ambrosino, L.; Colantuono, C.; Diretto, G.; Fiore, A.; Chiusano, M.L. Bioinformatics Resources for Plant Abiotic Stress Re‐
sponses: State of the Art and Opportunities in the Fast Evolving‐Omics Era. Plants 2020, 9, 591.
https://doi.org/10.3390/plants9050591.
7. Hirayama, T.; Shinozaki, K. Research on Plant Abiotic Stress Responses in the Post‐Genome Era: Past, Present and Future.
Plant J. 2010, 61, 1041–1052. https://doi.org/10.1111/j.1365‐313X.2010.04124.x.
8. Balkenhol, N.; Cushman, S.; Storfer, A.; Waits, L. Landscape Genetics: Concepts, Methods, Applications; Wiley‐Blackwell: Chiches‐
ter, UK, 2015; pp. 1–288; ISBN: 978‐1‐118‐52529‐6.
9. Kersey, P.J. Plant Genome Sequences: Past, Present, Future. Curr. Opin. Plant Biol. 2019, 48, 1–8.
https://doi.org/10.1016/j.pbi.2018.11.001.
10. Isabel, N.; Holliday, J.A.; Aitken, S.N. Forest Genomics: Advancing Climate Adaptation, Forest Health, Productivity, and
Conservation. Evol. Appl. 2020, 13, 3–10. https://doi.org/10.1111/eva.12902.
11. Neale, D.B.; Langley, C.H.; Salzberg, S.L.; Wegrzyn, J.L. Open Access to Tree Genomes: The Path to a Better Forest. Genome
Biol. 2013, 14, 120. https://doi.org/10.1186/gb‐2013‐14‐6‐120.
12. Fady, B.; Aravanopoulos, F.; Benavides, R.; González‐Martínez, S.; Grivet, D.; Lascoux, M.; Lindner, M.; Rellstab, C.; Val‐
ladares, F.; Vinceti, B. Genetics to the Rescue: Managing Forests Sustainably in a Changing World. Tree Genet. Genomes 2020,
16, 80. https://doi.org/10.1007/s11295‐020‐01474‐8.
13. Baxter, I. We Aren’t Good at Picking Candidate Genes, and It’s Slowing Us down. Curr. Opin. Plant Biol. 2020, 54, 57–60.
https://doi.org/10.1016/j.pbi.2020.01.006.
14. Cramer, G.R.; Urano, K.; Delrot, S.; Pezzotti, M.; Shinozaki, K. Effects of Abiotic Stress on Plants: A Systems Biology Perspec‐
tive. BMC Plant Biol. 2011, 11, 163. https://doi.org/10.1186/1471‐2229‐11‐163.
15. Tong, H.; Madison, I.; Long, T.A.; Williams, C.M. Computational Solutions for Modeling and Controlling Plant Response to
Abiotic Stresses: A Review with Focus on Iron Deficiency. Curr. Opin. Plant Biol. 2020, 57, 8–15.
https://doi.org/10.1016/j.pbi.2020.05.006.
16. Kaur, G.; Asthir, B. Proline: A Key Player in Plant Abiotic Stress Tolerance. Biol. Plant. 2015, 59, 609–619.
https://doi.org/10.1007/s10535‐015‐0549‐3.
17. Puglielli, G.; Hutchings, M.J.; Laanisto, L. The Triangular Space of Abiotic Stress Tolerance in Woody Species: A Unified
Trade‐off Model. New Phytol. 2021, 229, 1354–1362. https://doi.org/10.1111/nph.16952.
18. Asefpour Vakilian, K. Machine Learning Improves Our Knowledge about miRNA Functions towards Plant Abiotic Stresses.
Sci. Rep. 2020, 10, 3041. https://doi.org/10.1038/s41598‐020‐59981‐6.
19. De la Fuente, A. (Ed.); Gene Network Inference; Springer: Berlin/Heidelberg, Germany, 2013; ISBN 978‐3‐642‐45160‐7.

Forests 2022, 13, 159 22 of 26
20. Zhang, H.; Uddin, M.S.; Zou, C.; Xie, C.; Xu, Y.; Li, W.‐X. Meta‐Analysis and Candidate Gene Mining of Low‐Phosphorus
Tolerance in Maize: Meta‐Analysis of Low‐Phosphorus Tolerance in Maize. J. Integr. Plant Biol. 2014, 56, 262–270.
https://doi.org/10.1111/jipb.12168.
21. Mirdar Mansuri, R.; Shobbar, Z.‐S.; Babaeian Jelodar, N.; Ghaffari, M.; Mohammadi, S.M.; Daryani, P. Salt Tolerance Involved
Candidate Genes in Rice: An Integrative Meta‐Analysis Approach. BMC Plant Biol. 2020, 20, 452.
https://doi.org/10.1186/s12870‐020‐02679‐8.
22. Yin, Z.; Qi, H.; Chen, Q.; Zhang, Z.; Jiang, H.; Zhu, R.; Hu, Z.; Wu, X.; Li, C.; Zhang, Y.; et al. Soybean Plant Height QTL Map‐
ping and Meta‐Analysis for Mining Candidate Genes. Plant Breed. 2017, 136, 688–698. https://doi.org/10.1111/pbr.12500.
23. Zhang, L.; Zhang, Z.; Zhang, X.; Yao, Y.; Wang, R.; Duan, B.; Fan, S. Comprehensive Meta‐Analysis and Co‐Expression Net‐
work Analysis Identify Candidate Genes for Salt Stress Response in Arabidopsis. Plant Biosyst. 2019, 153, 367–377.
https://doi.org/10.1080/11263504.2018.1492989.
24. Pinheiro, C.; Chaves, M.M. Photosynthesis and Drought: Can We Make Metabolic Connections from Available Data? J. Exp.
Bot. 2011, 62, 869–882. https://doi.org/10.1093/jxb/erq340.
25. Tseng, G.C.; Ghosh, D.; Feingold, E. Comprehensive Literature Review and Statistical Considerations for Microarray Meta‐
Analysis. Nucleic Acids Res. 2012, 40, 3785–3799. https://doi.org/10.1093/nar/gkr1265.
26. Moher, D.; Liberati, A.; Tetzlaff, J.; Altman, D.G.; the PRISMA Group. Reprint—Preferred Reporting Items for Systematic Re‐
views and Meta‐Analyses: The PRISMA Statement. Phys. Ther. 2009, 89, 873–880. https://doi.org/10.1093/ptj/89.9.873.
27. Evans, K.O.; Larsen‐Gray, A.; Miller, D.; Loehle, C. Systematic Review of Bird Response to Privately‐Owned, Managed Pine
Stands in the Southeastern U.S. Forests 2021, 12, 442. https://doi.org/10.3390/f12040442.
28. Nakagawa, S.; Noble, D.W.A.; Senior, A.M.; Lagisz, M. Meta‐Evaluation of Meta‐Analysis: Ten Appraisal Questions for Biolo‐
gists. BMC Biol. 2017, 15, 18. https://doi.org/10.1186/s12915‐017‐0357‐7.
29. Ma, J.; Liu, W.; Hunter, A.; Zhang, W. Performing Meta‐Analysis with Incomplete Statistical Information in Clinical Trials.
BMC Med. Res. Methodol. 2008, 8, 56. https://doi.org/10.1186/1471‐2288‐8‐56.
30. Weir, C.J.; Butcher, I.; Assi, V.; Lewis, S.C.; Murray, G.D.; Langhorne, P.; Brady, M.C. Dealing with Missing Standard Devia‐
tion and Mean Values in Meta‐Analysis of Continuous Outcomes: A Systematic Review. BMC Med. Res. Methodol. 2018, 18, 25.
https://doi.org/10.1186/s12874‐018‐0483‐0.
31. Lakens, D. Calculating and Reporting Effect Sizes to Facilitate Cumulative Science: A Practical Primer for t‐Tests and ANO‐
VAs. Front. Psychol. 2013, 4, 863. https://doi.org/10.3389/fpsyg.2013.00863.
32. Thalheimer, W.; Cook, S. How to Calculate Effect Sizes from Published Research Articles: A Simplified Methodology. 2002.
Available online: https://paulogentil.com/pdf/How%20to%20calculate%20effect%20sizes%20from%20published%20re‐
search%20‐%20a%20simplified%20methodology.pdf (accessed on 18 January 2022).
33. Cohen, J. Statistical Power Analysis for the Behavioral Sciences, 2nd ed.; L. Erlbaum Associates: Hillsdale, NJ, USA, 1988; ISBN
978‐0‐8058‐0283‐2; https://doi.org/10.4324/9780203771587.
34. Zhong, G.V.; Burns, J.K. Profiling Ethylene‐Regulated Gene Expression in Arabidopsis Thaliana by Microarray Analysis. Plant
Mol. Biol. 2003, 53, 117–131. https://doi.org/10.1023/b:plan.0000009270.81977.ef.
35. Grasman, R. Meta‐Analysis in JASP. 2017. Web publication/site, JASP. Available online: https://jasp‐stats.org/2017/11/15/meta‐
analysis‐jasp/ (accessed on 18 January 2022).
36. Viechtbauer, W. Conducting Meta‐Analyses in R with the metafor Package. J. Stat. Soft. 2010, 36, 1–48.
https://doi.org/10.18637/jss.v036.i03.
37. Chen, H.; Boutros, P.C. VennDiagram: A Package for the Generation of Highly‐Customizable Venn and Euler Diagrams in R.
BMC Bioinf. 2011, 12, 1–7. https://doi.org/10.1186/1471‐2105‐12‐35.
38. Krishna, P. Plant Responses to Heat Stress. In Plant Responses to Abiotic Stress; Hirt, H., Shinozaki, K., Eds.; Topics in Current
Genetics; Springer: Berlin/Heidelberg, Germany, 2003; Volume 4, pp. 73–101; ISBN 978‐3‐540‐20037‐6.
https://doi.org/10.1007/978‐3‐540‐39402‐0_4.
39. Xu, L.; Gao, J.; Guo, L.; Yu, H. Heat Shock Protein 70 (HmHsp70) from Hypsizygus marmoreus Confers Thermotolerance to
Tobacco. AMB Express 2020, 10, 12. https://doi.org/10.1186/s13568‐020‐0947‐6.
40. Aghaie, P.; Tafreshi, S.A.H. Central Role of 70‐KDa Heat Shock Protein in Adaptation of Plants to Drought Stress. Cell Stress
Chaperones 2020, 25, 1071–1081. https://doi.org/10.1007/s12192‐020‐01144‐7.
41. Cho, E.K.; Choi, Y.J. A Nuclear‐Localized HSP70 Confers Thermoprotective Activity and Drought‐Stress Tolerance on Plants.
Biotechnol. Lett. 2009, 31, 597–606. https://doi.org/10.1007/s10529‐008‐9880‐5.
42. Li, H.; Liu, S.; Yi, C.; Wang, F.; Zhou, J.; Xia, X.; Shi, K.; Zhou, Y.; Yu, J. Hydrogen Peroxide Mediates Abscisic Acid‐induced
HSP 70 Accumulation and Heat Tolerance in Grafted Cucumber Plants. Plant Cell Environ. 2014, 37, 2768–2780.
https://doi.org/10.1111/pce.12360.
43. Mohammadi, P.P.; Moieni, A.; Hiraga, S.; Komatsu, S. Organ‐Specific Proteomic Analysis of Drought‐Stressed Soybean Seed‐
lings. J. Proteom. 2012, 75, 1906–1923. https://doi.org/10.1016/j.jprot.2011.12.041.
44. Kumar, M.; Kesawat, M.S.; Ali, A.; Lee, S.‐C.; Gill, S.S.; Kim, H.U. Integration of Abscisic Acid Signaling with Other Signaling
Pathways in Plant Stress Responses and Development. Plants 2019, 8, 592. https://doi.org/10.3390/plants8120592.
45. Hu, X.; Liu, R.; Li, Y.; Wang, W.; Tai, F.; Xue, R.; Li, C. Heat Shock Protein 70 Regulates the Abscisic Acid‐Induced Antioxi‐
dant Response of Maize to Combined Drought and Heat Stress. Plant Growth Regul. 2010, 60, 225–235.
https://doi.org/10.1007/s10725‐009‐9436‐2.

Forests 2022, 13, 159 23 of 26
46. Shayanfar, A.; Afshari, R.T.; Alizadeh, H. Proteome Analysis of Wheat Embryo (Triticum aestivum) Sensu Stricto Germination
under Osmotic Stress. Plant Omics 2015, 8, 372–380. https://doi.org/10.13140/RG.2.1.3467.3365.
47. Mangelsen, E.; Kilian, J.; Harter, K.; Jansson, C.; Wanke, D.; Sundberg, E. Transcriptome Analysis of High‐Temperature Stress
in Developing Barley Caryopses: Early Stress Responses and Effects on Storage Compound Biosynthesis. Mol. Plant 2011, 4,
97–115. https://doi.org/10.1093/mp/ssq058.
48. Kaur, V.; Madaan, S.; Behl, R.K. ADP‐Glucose Pyrophosphorylase Activity in Relation to Yield Potential of Wheat: Response
to Independent and Combined High Temperature and Drought Stress. Cereal Res. Commun. 2017, 45, 181–191.
https://doi.org/10.1556/0806.45.2017.003.
49. Song, Y.; Chen, Q.; Ci, D.; Shao, X.; Zhang, D. Effects of High Temperature on Photosynthesis and Related Gene Expression in
Poplar. BMC Plant Biol. 2014, 14, 111. https://doi.org/10.1186/1471‐2229‐14‐111.
50. Shakeel, S.N.; Aman, S.; Haq, N.U.; Heckathorn, S.A.; Luthe, D. Proteomic and Transcriptomic Analyses of Agave Americana
in Response to Heat Stress. Plant Mol. Biol. Rep. 2013, 31, 840–851. https://doi.org/10.1007/s11105‐013‐0555‐6.
51. Sattari Vayghan, H.; Tavalaei, S.; Grillon, A.; Meyer, L.; Ballabani, G.; Glauser, G.; Longoni, P. Growth Temperature Influence
on Lipids and Photosynthesis in Lepidium sativum. Front. Plant Sci. 2020, 11, 745. https://doi.org/10.3389/fpls.2020.00745.
52. Nongpiur, R.C.; Singla‐Pareek, S.L.; Pareek, A. The quest for osmosensors in plants. J. Exp. Bot. 2020, 71, 595–607.
https://doi.org/10.1093/jxb/erz263.
53. Ward, J.; Kim, K.; Harvell, C. Temperature Affects Coral Disease Resistance and Pathogen Growth. Mar. Ecol. Prog. Ser. 2007,
329, 115–121. https://doi.org/10.3354/meps329115.
54. Knight, H.; Trewavas, A.J.; Knight, M.R. Cold calcium signaling in Arabidopsis involves two cellular pools and a change in
calcium signature after acclimation. Plant Cell 1996, 8, 489–503. https://doi.org/10.1105/tpc.8.3.489.
55. Zhu, X.; Feng, W.; Chang, J.; Tan, Y.‐W.; Li, J.; Chen, M.; Sun, Y.; Li, F. Temperature‐feedback upconversion nanocomposite
for accurate photothermal therapy at facile temperature. Nat. Commun. 2016, 7, 10437. https://doi.org/10.1038/ncomms10437.
56. Ding, Y.; Shi, Y.; Yang, S. Molecular Regulation of Plant Responses to Environmental Temperatures. Mol. Plant 2020, 13, 544–
564. https://doi.org/10.1016/j.molp.2020.02.004.
57. Yuan, Q.; Li, G.; Yao, F.; Cheng, S.; Wang, Y.; Ma, R.; Mi, S.; Gu, M.; Wang, K.; Li, J.; et al. Simultaneously achieved tempera‐
ture‐insensitive high energy density and efficiency in domain engineered BaTiO3‐Bi(Mg0.5Zr0.5)O3 lead‐free relaxor ferroe‐
lectrics. Nano Energy 2018, 52, 203–210. https://doi.org/10.1016/j.nanoen.2018.07.055.
58. Hayes, S.; Schachtschabel, J.; Mishkind, M.; Munnik, T.; Arisz, S.A. Hot topic: Thermosensing in plants. Plant Cell Environ.
2021, 44, 2018–2033. https://doi.org/10.1111/pce.13979.
59. Yu, Y.; Jia, T.; Chen, X. The ‘how’ and ‘where’ of plant microRNAs. New Phytol. 2017, 216, 1002–1017, doi:10.1111/nph.14834.
60. Liu, X.; Yang, P.; Yang, W. Enzyme‐inhibitor‐like tuning of Ca2+ channel connectivity with calmodulin. Nature 2010, 463, 968–
972. https://doi.org/10.1038/nature08766.
61. Liu, J.; Shi, Y.; Yang, S. Insights into the regulation of C‐repeat binding factors in plant cold signaling. J. Integr. Plant Biol. 2018,
60, 780–795. https://doi.org/10.1111/jipb.12657.
62. Mittler, R.; Finka, A.; Goloubinoff, P. How do plants feel the heat? Trends Biochem. Sci. 2012, 37, 118–125.
https://doi.org/10.1016/j.tibs.2011.11.007.
63. Yuan, P.; Yang, T.; Poovaiah, B.W. Calcium Signaling‐Mediated Plant Response to Cold Stress. IJMS 2018, 19, 3896.
https://doi.org/10.3390/ijms19123896.
64. Chinnusamy, V. Molecular Genetic Perspectives on Cross‐Talk and Specificity in Abiotic Stress Signaling in Plants. J. Exp. Bot.
2003, 55, 225–236. https://doi.org/10.1093/jxb/erh005.
65. Rizhsky, L.; Liang, H.; Mittler, R. The Combined Effect of Drought Stress and Heat Shock on Gene Expression in Tobacco.
Plant Physiol. 2002, 130, 1143–1151. https://doi.org/10.1104/pp.006858.
66. Bae, M.S.; Cho, E.J.; Choi, E.‐Y.; Park, O.K. Analysis of the Arabidopsis Nuclear Proteome and Its Response to Cold Stress: The
Arabidopsis Nuclear Proteome and Cold Stress. Plant J. 2003, 36, 652–663. https://doi.org/10.1046/j.1365‐313X.2003.01907.x.
67. Renaut, J.; Hausman, J.‐F.; Bassett, C.; Artlip, T.; Cauchie, H.‐M.; Witters, E.; Wisniewski, M. Quantitative Proteomic Analysis
of Short Photoperiod and Low‐Temperature Responses in Bark Tissues of Peach (Prunus Persica L. Batsch). Tree Genet. Ge‐
nomes 2008, 4, 589–600. https://doi.org/10.1007/s11295‐008‐0134‐4.
68. Ge, W.; Cui, J.; Shao, Y.; Bian, X.; Jia, Y.; Zhang, K. Temperature Change Shortens Maturation Time in Lilium with Evidence
for Molecular Mechanisms. Mol. Breed. 2018, 38, 145. https://doi.org/10.1007/s11032‐018‐0904‐0.
69. Calzadilla, P.I.; Vilas, J.M.; Escaray, F.J.; Unrein, F.; Carrasco, P.; Ruiz, O.A. The Increase of Photosynthetic Carbon Assimila‐
tion as a Mechanism of Adaptation to Low Temperature in Lotus japonicus. Sci. Rep. 2019, 9, 863.
https://doi.org/10.1038/s41598‐018‐37165‐7.
70. Deng, Y.‐S.; Kong, F.‐Y.; Zhou, B.; Zhang, S.; Yue, M.‐M.; Meng, Q.‐W. Heterology Expression of the Tomato LeLhcb2 Gene
Confers Elevated Tolerance to Chilling Stress in Transgenic Tobacco. Plant Phys. Biochem. 2014, 80, 318–327.
https://doi.org/10.1016/j.plaphy.2014.04.017.
71. Roeder, S.; Dreschler, K.; Wirtz, M.; Cristescu, S.M.; van Harren, F.J.M.; Hell, R.; Piechulla, B. SAM Levels, Gene Expression of
SAM Synthetase, Methionine Synthase and ACC Oxidase, and Ethylene Emission from N. suaveolens Flowers. Plant Mol. Biol.
2009, 70, 535–546. https://doi.org/10.1007/s11103‐009‐9490‐1.

Forests 2022, 13, 159 24 of 26
72. Gong, B.; Li, X.; VandenLangenberg, K.M.; Wen, D.; Sun, S.; Wei, M.; Li, Y.; Yang, F.; Shi, Q.; Wang, X. Overexpression of S‐
Adenosyl‐ L ‐Methionine Synthetase Increased Tomato Tolerance to Alkali Stress through Polyamine Metabolism. Plant Bio‐
technol. J. 2014, 12, 694–708. https://doi.org/10.1111/pbi.12173.
73. Sauter, M.; Moffatt, B.; Saechao, M.C.; Hell, R.; Wirtz, M. Methionine Salvage and S‐Adenosylmethionine: Essential Links be‐
tween Sulfur, Ethylene and Polyamine Biosynthesis. Biochem. J. 2013, 451, 145–154. https://doi.org/10.1042/BJ20121744.
74. Guo, X.; Liu, D.; Chong, K. Cold Signaling in Plants: Insights into Mechanisms and Regulation. J. Int. Plant Biol. 2018, 60, 745–
756. https://doi.org/10.1111/jipb.12706.
75. Mahatma, M.K.; Radadiya, N.; Parekh, V.B.; Dobariya, B.; Mahatma, L. Abiotic Stresses Alter Expression of S‐Adenosylmethi‐
onine Synthetase Gene, Polyamines and Antioxidant Activity in Pigeon Pea (Cajanus cajan L.). Legume Res. 2016, 39, 905–913.
https://doi.org/10.18805/lr.v39i6.6640.
76. Heidari, P.; Mazloomi, F.; Nussbaumer, T.; Barcaccia, G. Insights into the SAM Synthetase Gene Family and Its Roles in To‐
mato Seedlings under Abiotic Stresses and Hormone Treatments. Plants 2020, 9, 586. https://doi.org/10.3390/plants9050586.
77. Poulton, J.E.; Butt, V.S. Purification and properties of S‐adenosyl‐l‐methionine: Caffeic acid o‐methyltransferase from leaves of
spinach Beet (Beta vulgaris L.). Biochim. Biophys. Acta‐Enzymol. 1975, 403, 301–314. https://doi.org/10.1016/0005‐2744(75)90060‐1.
78. Cantoni, G.L.; Scarano, E. The formation of S‐adenosylhomocysteine in enzymatic transmethylation reactions. J. Am. Chem.
Soc. 1954, 76, 4744–4744. https://doi.org/10.1021/ja01647a081.
79. Alegre, S.; Pascual, J.; Trotta, A.; Angeleri, M.; Rahikainen, M.; Brosche, M.; Moffatt, B.; Kangasjärvi, S. Evolutionary Conser‐
vation and Post‐Translational Control of S‐Adenosyl‐L‐Homocysteine Hydrolase in Land Plants. PLoS ONE 2020, 15,
e0227466. https://doi.org/10.1371/journal.pone.0227466.
80. Puyaubert, J.; Fares, A.; Rézé, N.; Peltier, J.‐B.; Baudouin, E. Identification of Endogenously S‐Nitrosylated Proteins in Ara‐
bidopsis Plantlets: Effect of Cold Stress on Cysteine Nitrosylation Level. Plant Sci. 2014, 215–216, 150–156.
https://doi.org/10.1016/j.plantsci.2013.10.014.
81. Yun Ma, Y.; Dai, X.; Xu, Y.; Luo, W.; Zheng, X.; Zeng, D.; Pan, Y.; Lin, X.; Liu, H.; Zhang, D.; et al. COLD1 Confers Chilling
Tolerance in Rice. Cell 2015, 160, 1209–1221. https://doi.org/10.1016/j.cell.2015.01.046.
82. Miura, K.; Furumoto, T. Cold Signaling and Cold Response in Plants. Int. J. Mol. Sci. 2013, 14, 5312–5337.
https://doi.org/10.3390/ijms14035312.
83. Jenkins, M.F.; White, E.P.; Hurlbert, A.H. The Proportion of Core Species in a Community Varies with Spatial Scale and Envi‐
ronmental Heterogeneity. PeerJ 2018, 6, e6019. https://doi.org/10.7717/peerj.6019.
84. Vincent, D.; Lapierre, C.; Pollet, B.; Cornic, G.; Negroni, L.; Zivy, M. Water Deficits Affect Caffeate O ‐Methyltransferase, Lig‐
nification, and Related Enzymes in Maize Leaves. A Proteomic Investigation. Plant Physiol. 2005, 137, 949–960.
https://doi.org/10.1104/pp.104.050815.
85. Wang, M.; He, X.; Jiang, B.; Liu, W.; Lin, Y.; Xie, D.; Liang, Z.; Chen, L.; Peng, Q. Transcriptome Analysis in Different Chieh‐
qua Cultivars Provides New Insights into Drought‐Stress Response. Plant Biotechnol. Rep. 2019, 13, 663–675.
https://doi.org/10.1007/s11816‐019‐00564‐x.
86. Devi, M.J.; Reddy, V.R. Effect of Temperature under Different Evaporative Demand Conditions on Maize Leaf Expansion.
Environ. Exp. Bot. 2018, 155, 509–517. https://doi.org/10.1016/j.envexpbot.2018.07.024.
87. Choi, J.Y.; Seo, Y.S.; Kim, S.J.; Kim, W.T.; Shin, J.S. Constitutive Expression of CaXTH3, a Hot Pepper Xyloglucan Endo‐
transglucosylase/Hydrolase, Enhanced Tolerance to Salt and Drought Stresses without Phenotypic Defects in Tomato Plants
(Solanum lycopersicum Cv. Dotaerang). Plant Cell Rep. 2011, 30, 867–877. https://doi.org/10.1007/s00299‐010‐0989‐3.
88. Yang, W.‐J.; Du, Y.‐T.; Zhou, Y.‐B.; Chen, J.; Xu, Z.‐S.; Ma, Y.‐Z.; Chen, M.; Min, D.‐H. Overexpression of TaCOMT Improves
Melatonin Production and Enhances Drought Tolerance in Transgenic Arabidopsis. IJMS 2019, 20, 652.
https://doi.org/10.3390/ijms20030652.
89. Tenhaken, R. Cell Wall Remodeling under Abiotic Stress. Front. Plant Sci. 2015, 5, 771. https://doi.org/10.3389/fpls.2014.00771.
90. Takahashi, F.; Kuromori, T.; Sato, H.; Shinozaki, K. Regulatory Gene Networks in Drought Stress Responses and Resistance in
Plants. In Survival Strategies in Extreme Cold and Desiccation; Advances in Experimental Medicine and Biology; Iwaya‐Inoue,
M., Sakurai, M., Uemura, M., Eds.; Springer: Singapore, 2018; Volume 1081. https://doi.org/10.1007/978‐981‐13‐1244‐1_11.
91. Farooq, M.; Wahid, A.; Kobayashi, N.; Fujita, D.; Basra, S.M.A. Plant Drought Stress: Effects, Mechanisms and Management.
In Sustainable Agriculture; Lichtfouse, E., Navarrete, M., Debaeke, P., Véronique, S., Alberola, C., Eds.; Springer: Dordrecht,
The Netherlands, 2009; https://doi.org/10.1007/978‐90‐481‐2666‐8_12.
92. Baldoni, E.; Frugis, G.;Martinelli, F.; Benny, J.; Paffetti, D.;Buti, M. A ComparativeTranscriptomic Meta‐Analysis Revealed
Conserved Key Genes and Regulatory Networks Involved in Drought Tolerance in Cereal Crops. Int. J. Mol. Sci. 2021, 22,
13062. https://doi.org/10.3390/ijms222313062.
93. Fang, Y.; Xie, F.; Xiong, L. Conserved miR164‐targeted NAC genes negatively regulate drought resistance in rice. J. Exp. Bot.
2014, 65, 2119–2135. https://doi.org/10.1093/jxb/eru072.
94. Isayenkov, S.V.; Maathuis, F.J.M. Plant Salinity Stress: Many Unanswered Questions Remain. Front. Plant Sci. 2019, 10, 80.
https://doi.org/10.3389/fpls.2019.00080.
95. Zhang, L.; Xu, Z.; Ji, H.; Zhou, Y.; Yang, S. TaWRKY40 Transcription Factor Positively Regulate the Expression of TaGAPC1 to
Enhance Drought Tolerance. BMC Genom. 2019, 20, 795. https://doi.org/10.1186/s12864‐019‐6178‐z.

Forests 2022, 13, 159 25 of 26
96. Chang, L.; Guo, A.; Jin, X.; Yang, Q.; Wang, D.; Sun, Y.; Huang, Q.; Wang, L.; Peng, C.; Wang, X. The Beta Subunit of Glycer‐
aldehyde 3‐Phosphate Dehydrogenase Is an Important Factor for Maintaining Photosynthesis and Plant Development under
Salt Stress—Based on an Integrative Analysis of the Structural, Physiological and Proteomic Changes in Chloroplasts in Thel‐
lungiella halophila. Plant Sci. 2015, 236, 223–238. https://doi.org/10.1016/j.plantsci.2015.04.010.
97. Xiong, J.; Sun, Y.; Yang, Q.; Tian, H.; Zhang, H.; Liu, Y.; Chen, M. Proteomic Analysis of Early Salt Stress Responsive Proteins
in Alfalfa Roots and Shoots. Proteome Sci. 2017, 15, 19. https://doi.org/10.1186/s12953‐017‐0127‐z.
98. McLoughlin, F.; Arisz, S.A.; Dekker, H.L.; Kramer, G.; de Koster, C.G.; Haring, M.A.; Munnik, T.; Testerink, C. Identification
of Novel Candidate Phosphatidic Acid‐Binding Proteins Involved in the Salt‐Stress Response of Arabidopsis thaliana Roots.
Biochem. J. 2013, 450, 573–581. https://doi.org/10.1042/BJ20121639.
99. Zhang, X.‐H.; Rao, X.‐L.; Shi, H.‐T.; Li, R.‐J.; Lu, Y.‐T. Overexpression of a Cytosolic Glyceraldehyde‐3‐Phosphate Dehydro‐
genase Gene OsGAPC3 Confers Salt Tolerance in Rice. Plant Cell Tissue Organ. Cult. 2011, 107, 278–285.
https://doi.org/10.1007/s11240‐011‐9950‐6.
100. Sanchez‐Aguayo, I.; Rodriguez‐Galen, J.M.; Garcia, R.; Torreblanca, J.; Pardo, J.M. Salt Stress Enhances Xylem Development
and Expression of S‐Adenosyl‐l‐Methionine Synthase in Lignifying Tissues of Tomato Plants. Planta 2004, 220, 278–285.
https://doi.org/10.1007/s00425‐004‐1350‐2.
101. Espartero, J.; Pintor‐Toro, J.A.; Pardo, J.M. Differential Accumulation of S‐Adenosylmethionine Synthetase Transcripts in Re‐
sponse to Salt Stress. Plant Mol. Biol. 1994, 25, 217–227. https://doi.org/10.1007/BF00023239.
102. Weretilnyk, E.A.; Alexander, K.J.; Drebenstedt, M.; Snider, J.D.; Summers, P.S.; Moffatt, B.A. Maintaining Methylation Activi‐
ties during Salt Stress. The Involvement of Adenosine Kinase. Plant Physiol. 2001, 125, 856–865.
https://doi.org/10.1104/pp.125.2.856.
103. Li, Y.; Yuan, F.; Wen, Z.; Li, Y.; Wang, F.; Zhu, T.; Zhuo, W.; Jin, X.; Wang, Y.; Zhao, H.; et al. Genome‐wide survey and ex‐
pression analysis of the OSCA gene family in rice. BMC Plant Biol. 2015,15, 261. https://doi.org/10.1186/s12870‐015‐0653‐8.
104. Falhof, J.; Torbøl Pedersen, J.; Thoe Fuglsang, A.; Palmgren, M. Plasma Membrane H+‐ATPase Regulation in the Center of
Plant Physiology. Mol. Plant 2016, 9, 323–337. https://doi.org/10.1016/j.molp.2015.11.002.
105. Sharma, A.; Hussain, A.; Bong‐Gyu, M.; Imran, Q.; Falak, N.; Lee, S.; Kim, J.; Hong, J.; Loake, G.; Ali, A.; et al. Comprehensive
analysis of plant rapid alkalization factor (RALF) genes. Plant Physiol. Biochem. 2016, 106, 82–90.
https://doi.org/10.1016/j.plaphy.2016.03.037.
106. Jiang, M.; Liu, Y.; Liu, Y.; Tan, Y.; Huang, J.; Shu, Q. Mutation of Inositol 1,3,4‐trisphosphate 5/6‐kinase6 Impairs Plant Growth
and Phytic Acid Synthesis in Rice. Plants 2019, 8, 114. https://doi.org/10.3390/plants8050114.
107. Feng, W.; Kita, D.; Peaucelle, A.; Cartwright, H.N.; Doan, V.; Duan, Q.; Liu, M.; Maman, J.; Steinhorst, L.; Schmitz‐Thom, I.; et
al. The FERONIA Receptor Kinase Maintains Cell‐Wall Integrity during Salt Stress through Ca2+ Signaling. Curr. Biol. 2018, 28,
5, 666–675. https://doi.org/10.1016/j.cub.2018.01.023.
108. Zhou, Y.; Tang, N.; Huang, L.; Zhao, Y.; Tang, X.; Wang, K. Effects of Salt Stress on Plant Growth, Antioxidant Capacity, Glan‐
dular Trichome Density, and Volatile Exudates of Schizonepeta tenuifolia Briq. Int. J. Mol. Sci. 2018, 19, 252.
https://doi.org/10.3390/ijms19010252.
109. Rahman, M.A.; Thomson, M.J.; Shah‐E‐Alam, M.; de Ocampo, M.; Egdane, J.; Ismail, A.M. Exploring novel genetic sources of
salinity tolerance in rice through molecular and physiological characterization, Ann. Bot. 2016, 117, 1083–1097.
https://doi.org/10.1093/aob/mcw030.
110. Kim, J.; Kim, H.Y. Functional analysis of a calcium‐binding transcription factor involved in plant salt stress signaling, FEBS
Lett. 2006, 580, 5251–5256, doi: /10.1016/j.febslet.2006.08.050.
111. Qiu, Z.; Guo, J.; Zhu, A.; Zhang, L.; Zhang, M. Exogenous jasmonic acid can enhance tolerance of wheat seedlings to salt
stress. Ecotoxicol. Environ. Saf. 2014, 104, 202–208. https://doi.org/10.1016/j.ecoenv.2014.03.014.
112. Srivastava, A.K.; Rai, A.N.; Patade, V.Y.; Suprasanna, P. Calcium Signaling and Its Significance in Alleviating Salt Stress in
Plants. In Salt Stress in Plants; Ahmad, P., Azooz, M.M., Prasad, M.N.V., Eds.; Springer: New York, NY, USA, 2013;
https://doi.org/10.1007/978‐1‐4614‐6108‐1_9.
113. Tawab, F.; Munir, I.; Nasim, Z.; Khan, M.S.; Tawab, S.; Nasim, A.; Iqbal, A.; Ahmad, M.A.; Ali, W.; Munir, R.; et al. Identifica‐
tion and Characterization of a Novel Multi‐Stress Responsive Gene in Arabidopsis. PLoS ONE 2020, 15, e0244030.
https://doi.org/10.1371/journal.pone.0244030.
114. Zhou, B.; Zhang, L.; Ullah, A.; Jin, X.; Yang, X.; Zhang, X. Identification of Multiple Stress Responsive Genes by Sequencing a
Normalized CDNA Library from Sea‐Land Cotton (Gossypium Barbadense L.). PLoS ONE 2016, 11, e0152927.
https://doi.org/10.1371/journal.pone.0152927.
115. Haak, D.C.; Fukao, T.; Grene, R.; Hua, Z.; Ivanov, R.; Perrella, G.; Li, S. Multilevel Regulation of Abiotic Stress Responses in
Plants. Front. Plant Sci. 2017, 8, 1564. https://doi.org/10.3389/fpls.2017.01564.
116. Sewelam, N.; Oshima, Y.; Mitsuda, N.; Ohme‐Takagi, M. A Step towards Understanding Plant Responses to Multiple Envi‐
ronmental Stresses: A Genome‐Wide Study: Plant Responses to Multiple Abiotic Stresses. Plant Cell Environ. 2014, 37, 2024–
2035. https://doi.org/10.1111/pce.12274.
117. Noctor, G.; Mhamdi, A.; Foyer, C.H. The Roles of Reactive Oxygen Metabolism in Drought: Not So Cut and Dried. Plant Phys‐
iol. 2014, 164, 1636–1648. https://doi.org/10.1104/pp.113.233478.

Forests 2022, 13, 159 26 of 26
118. Mittler, R. Oxidative Stress, Antioxidants and Stress Tolerance. Trends Plant Sci. 2002, 7, 405–410.
https://doi.org/10.1016/S1360‐1385(02)02312‐9.
119. White, C.R.; Frangos, J.A. The Shear Stress of It All: The Cell Membrane and Mechanochemical Transduction. Philos. Trans. R.
Soc. B 2007, 362, 1459–1467. https://doi.org/10.1098/rstb.2007.2128.