MET MANAGEMENT REVIEW
80
An initiative of the MET Schools of Management Toll free: 1800 22 0234 | www.met.edu MMS | eMBA | PGDM MET MBA THE UNIVERSE OF GLOBAL PROGRAMMES e-BUSINESS | MARKETING | FINANCE | OPERATIONS | HUMAN RESOURCES | SYSTEMS DIGITAL BUSINESS | BANKING, FINANCIAL SERVICES & INSURANCE | INSURANCE (The CII, UK) GLOBAL FINANCE - ACCA (UK) | GLOBAL BUSINESS (International Alliances) | Corporate Social Responsibility July 2018 Vol. 5 No. 1 ISSN No. 2394-4013 MET MANAGEMENT REVIEW
-
Upload
khangminh22 -
Category
Documents
-
view
1 -
download
0
Transcript of MET MANAGEMENT REVIEW

An initiative of the MET Schools of ManagementToll free: 1800 22 0234 | www.met.edu
MMS | eMBA | PGDM
MET MBATHE UNIVERSE OF
GLOBAL PROGRAMMES
e-BUSINESS | MARKETING | FINANCE | OPERATIONS | HUMAN RESOURCES | SYSTEMS DIGITAL BUSINESS | BANKING, FINANCIAL SERVICES & INSURANCE | INSURANCE (The CII, UK)
GLOBAL FINANCE - ACCA (UK) | GLOBAL BUSINESS (International Alliances) | Corporate Social Responsibility
July 2018Vol. 5 No. 1 ISSN No. 2394-4013
MET MANAGEMENT REVIEW

Knowledge can neither be stolen by a thief,nor snatched by a king.
It is indivisible unlike ancestral property,it never burdens the bearer,
it multiplies manifold when offered to others.Knowledge is the supreme form of wealth.
OUR FAITH
OUR VISION
To shape professionals, to conquer the present and the future challenges to the socio economic fabric of our society, by institutionalising search,
development, research and dissemination of relevant knowledge through structured learning systems.
OUR MISSION
To evolve, develop and deliver dynamic learning systems to equip professionals with conscience and commitment to excellence and courage to face business challenges.

Contents
Chief Patron
Patrons
Editorial Board
Shri. Chhagan BhujbalHon. Founder Chairman - MET
Shri. Pankaj BhujbalHon. Trustee - METShri. Samir BhujbalHon. Trustee - MET
Dr. Vijay PageDirector General, MET IOMDr. Nirmala JoshiResearch Head, MET IOMProf. Sana KhanResearch Associate, MET IOM
Disclaimer: The editorial board has taken utmost care to provide quality editorial articles in this journal. However, the Journal is not responsible for the representation of facts, adaptations of material, interviews with persons and personal views of the authors contained in their articles.
MET Institute of Management Bhujbal Knowledge Centre
Bandra Reclamation, Bandra (W), Mumbai 400 050.Tel: (+91 22) 39554280/232/358/286
Toll free: 1800 22 0234 | email: [email protected] Telefax: (+91 22) 2644 0082| www.met.edu
MET MANAGEMENT REVIEW
Vol. 5 July 2018 ISSN No. 2394-4013Internet of Things Adding a 'Tech-Edge' to Human Resource Management....................................................................5Binal Chitroda, Dr. Farida Virani
Impact of Sales Force Automation on Sales Force Performance........................................................................7
Kumar Chandnani
The Haats and Mela Route for Rural Distribution..................13
Prof. Anand J. Mayee
Strategic Management in the Globalised World..................18
Prof. Rajiv Gupte, Prof. Anant Amdekar
Prescription Substitution by Branded Generics: A Pilot Study of Live Prescriptions in Mumbai Suburbs.................................21
Mr. Hari Kumar Iyer, Dr. Nilesh Berad
Employee and Employee Engagement................................31
Binal R. Chitroda, Prof. Arun Patil
Affordable Housing and Indian Reality Sector......................46
Mr. Sudhir Gururaj Kulkarni, Dr. Ms. Vibha Bhilawadikar, Dr. Nirmala. S. Joshi
An Analytical Study of Changes in Consumer Shopping Behaviour Strategies With Special Reference to Organized Retail Sector in Nashik City"...................................................50
Dr. Yogesh Gaikwad, Dr. Nilesh Berad
Literature Review on “Management of Non-Performing Assets (NPA) in Banks and Financial Institutions”Bharat. D. Dhongade
............................63
1
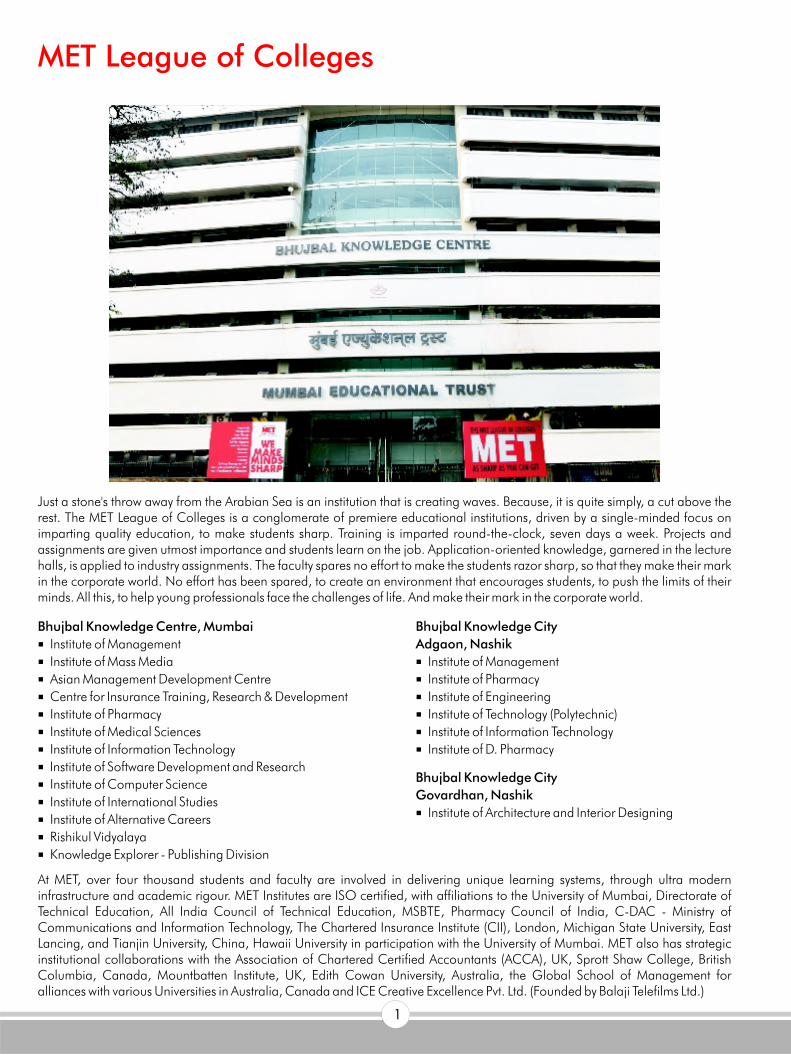
MET League of Colleges
Just a stone's throw away from the Arabian Sea is an institution that is creating waves. Because, it is quite simply, a cut above the rest. The MET League of Colleges is a conglomerate of premiere educational institutions, driven by a single-minded focus on imparting quality education, to make students sharp. Training is imparted round-the-clock, seven days a week. Projects and assignments are given utmost importance and students learn on the job. Application-oriented knowledge, garnered in the lecture halls, is applied to industry assignments. The faculty spares no effort to make the students razor sharp, so that they make their mark in the corporate world. No effort has been spared, to create an environment that encourages students, to push the limits of their minds. All this, to help young professionals face the challenges of life. And make their mark in the corporate world.
At MET, over four thousand students and faculty are involved in delivering unique learning systems, through ultra modern infrastructure and academic rigour. MET Institutes are ISO certified, with affiliations to the University of Mumbai, Directorate of Technical Education, All India Council of Technical Education, MSBTE, Pharmacy Council of India, C-DAC - Ministry of Communications and Information Technology, The Chartered Insurance Institute (CII), London, Michigan State University, East Lancing, and Tianjin University, China, Hawaii University in participation with the University of Mumbai. MET also has strategic institutional collaborations with the Association of Chartered Certified Accountants (ACCA), UK, Sprott Shaw College, British Columbia, Canada, Mountbatten Institute, UK, Edith Cowan University, Australia, the Global School of Management for alliances with various Universities in Australia, Canada and ICE Creative Excellence Pvt. Ltd. (Founded by Balaji Telefilms Ltd.)
Bhujbal Knowledge Centre, Mumbai
� Institute of Management
� Institute of Mass Media
� Asian Management Development Centre
� Centre for Insurance Training, Research & Development
� Institute of Pharmacy
� Institute of Medical Sciences
� Institute of Information Technology
� Institute of Software Development and Research
� Institute of Computer Science
� Institute of International Studies
� Institute of Alternative Careers
� Rishikul Vidyalaya
� Knowledge Explorer - Publishing Division
Bhujbal Knowledge City
Govardhan, Nashik
� Institute of Architecture and Interior Designing
Bhujbal Knowledge City
Adgaon, Nashik
� Institute of Management
� Institute of Pharmacy
� Institute of Engineering
� Institute of Technology (Polytechnic)
� Institute of Information Technology
� Institute of D. Pharmacy

Chhagan BhujbalHon. Founder Chairman, Mumbai Educational Trust
From the Chairman’s Desk
2
As we complete the seventh decade of our Independence and celebrate the sixty seventh year of our Republic, we hold our head high with pride for achieving the unique distinction of being the largest democracy in the world. There are many other achievements to our credit - the fifth largest economic power, the second largest user of mobile phones, as well as the largest number of youth engaged in educational pursuits, to name a few. Besides setting up hundreds of universities and thousands of institutions of higher learning, we are gradually approaching the superpower status in academic pursuits as well. Indian academia is occupying a place of honour in universities abroad, as we uphold the sobriquet of a 'Learning Society'.
The credit for achieving this milestone seemingly appears to be delicately balanced between the state and private sector institutions. Education being a subject in the Concurrent List of the Indian Constitution; both the state and central government have been dynamically engaged in building a credible and inclusive value chain. We had to achieve this transformation of a generation from information � knowledge wisdom through the tools shaping literacy � proficiency � excellence skills, while institutionalizing the learning-teaching pedagogy. We have achieved this through a vibrant public policy shaped by an open dialogue between the regulators and the stakeholders of education, both working tirelessly for the benefit of society.
However, the challenge of skilling five hundred million Indians in the next decade is a daunting task. It is rightly said that tomorrow's challenges cannot be met with yesterday's tools. We have to work tirelessly for liberating the educational institutions from the shackles of statutes and habit, while upholding the meritocracy and equal opportunity norms to deliver excellence for global competency building. With the advent of Internet of Things (IOT), digital technologies and Artificial Intelligence (AI), it is imperative that we need to work towards building and sustaining world class institutions, offering state-of-the-art STEM (Science, Technology, Engineering & Mathematics) and Management inputs with the Indian value system. This is only possible through liberalising and unshackling credible institutions of learning.
Thus empowered, one can hope to shape the youth with the right attitude and innovation to reach the commanding heights in the global arena.
Chhagan BhujbalHon. Founder ChairmanMumbai Educational Trust
�
Empowering Institutions for a Learning Society
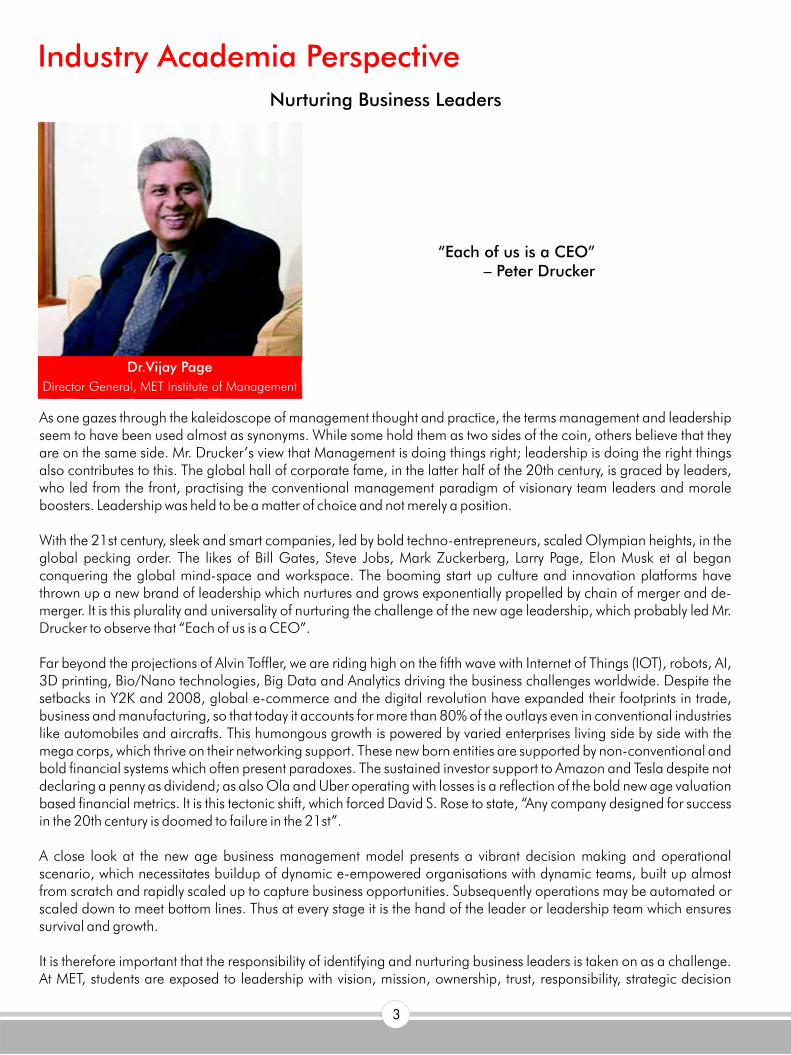
Industry Academia Perspective
Dr.Vijay Page
Director General, MET Institute of Management
“Each of us is a CEO” – Peter Drucker
Nurturing Business Leaders
As one gazes through the kaleidoscope of management thought and practice, the terms management and leadership seem to have been used almost as synonyms. While some hold them as two sides of the coin, others believe that they are on the same side. Mr. Drucker’s view that Management is doing things right; leadership is doing the right things also contributes to this. The global hall of corporate fame, in the latter half of the 20th century, is graced by leaders, who led from the front, practising the conventional management paradigm of visionary team leaders and morale boosters. Leadership was held to be a matter of choice and not merely a position.
With the 21st century, sleek and smart companies, led by bold techno-entrepreneurs, scaled Olympian heights, in the global pecking order. The likes of Bill Gates, Steve Jobs, Mark Zuckerberg, Larry Page, Elon Musk et al began conquering the global mind-space and workspace. The booming start up culture and innovation platforms have thrown up a new brand of leadership which nurtures and grows exponentially propelled by chain of merger and de-merger. It is this plurality and universality of nurturing the challenge of the new age leadership, which probably led Mr. Drucker to observe that “Each of us is a CEO”.
Far beyond the projections of Alvin Toffler, we are riding high on the fifth wave with Internet of Things (IOT), robots, AI, 3D printing, Bio/Nano technologies, Big Data and Analytics driving the business challenges worldwide. Despite the setbacks in Y2K and 2008, global e-commerce and the digital revolution have expanded their footprints in trade, business and manufacturing, so that today it accounts for more than 80% of the outlays even in conventional industries like automobiles and aircrafts. This humongous growth is powered by varied enterprises living side by side with the mega corps, which thrive on their networking support. These new born entities are supported by non-conventional and bold financial systems which often present paradoxes. The sustained investor support to Amazon and Tesla despite not declaring a penny as dividend; as also Ola and Uber operating with losses is a reflection of the bold new age valuation based financial metrics. It is this tectonic shift, which forced David S. Rose to state, “Any company designed for success in the 20th century is doomed to failure in the 21st”.
A close look at the new age business management model presents a vibrant decision making and operational scenario, which necessitates buildup of dynamic e-empowered organisations with dynamic teams, built up almost from scratch and rapidly scaled up to capture business opportunities. Subsequently operations may be automated or scaled down to meet bottom lines. Thus at every stage it is the hand of the leader or leadership team which ensures survival and growth.
It is therefore important that the responsibility of identifying and nurturing business leaders is taken on as a challenge. At MET, students are exposed to leadership with vision, mission, ownership, trust, responsibility, strategic decision
3

4
making, team building, scenario building, management games and experiential learning. Academic inputs are supplemented with lab, field trips, industrial visits, boot camps, internships and live projects. Special courses in Entrepreneurial Digital Technology, IOT as well as Life skills are delivered to sharpen the techno savvy approach and work life balance. Students also participate in national level programmes like Swacch Bharat, Start Up India, Make In India etc. and work for CSR related projects to develop sensitivity for the under privileged strata of the society, as we are members of UNAOC/UNECOSOC, who wish to develop a social conscience to shape students for building an inclusive society.
All stakeholders of management education have realised that building business leaders has assumed top priority, since the ever expanding glocal business arena is looking for that unique combination which seizes an opportunity and takes it to commercial success. Mercifully the lethal combinations of drones and AI have not yet produced a CEO who can as the Bard said, “Take arms against a sea of troubles. And by opposing end them”. We are blessed to empower this generation to be GAME CHANGERS in the VUCA world.
We shape young management professionals to take their rightful place in the glocal business arena.
Prof. (Dr.) Vijay PageDirector General
MET Institute of Management

5
Internet of Things Adding a 'Tech-Edge'to Human Resource Management
“The Internet of Things is a Game Changer for an over-all business ecosystem transformation” - Jeorg Grafe, Senior Market Analyst, IBM
Human Resource Management (HRM) is a department that has a glorious space in every kind of organization. This department looks after every requisite of their clients, who are essentially, the employees. HR is, of the people, by the people, for the people – in any organization. HR has evolved beyond ‘hiring and firing’ into a strategic business partner and has rightfully gained its place on the Board. Like all departments, HR too has been impacted by technological changes. Internet of Things (IoT) touted as the game changer in the domain of HR. The term Internet of Things (IoT) simply mean the interconnection via the Internet of computing devices embedded in everyday objects, enabling them to send and receive data. This article attempts to discuss how IoT will affect the domain of HRM.
Recruitment, as they say, is the bread-and-butter of HR Management. With the use of IoT, the organizations can get information and predict the requirements and trends of employee behaviour towards a particular job, and hence they can look for candidates in a more refined way. For instance, whenever an employee makes an ID on any job-portal, they ask for a link to one or more of their social media sites, which in majority of the cases is LinkedIn, followed by Twitter, Facebook and the likes. Through these inter-linking’s of the employee(s) or potential employee(s) internet presence, the organization can get more and more access to the pool of candidates to fit the job profile.
Internet of Things can provide immense data to the organizations, in terms of their employee behaviours too. Hence, they can use this data to formulate a strategy based on the quality of employees that they have. The organizations will also have access to ‘market standards’ which will help them to benchmark their own set of performance expectations and in return, the compensations and benefits for the same. Taking an example of ‘Great Place to Work’, this organization conducts yearly national rankings of organizations based on their set parameters of employees, work culture, benefits, career development plans and others. Once this data is out, other organizations, industry sectors can refer to match up or compete in order to step up their employer image.
Using IoT, the organizations can develop specific applications / softwares to use, from which the employees as well as the employers can access data. If we take the example of Uber, the reviews that the customer has to share about the ride and the driver, with or without specific comments is an extremely fruitful way to find loop-holes in their services and upgrade them. Similarly, if organizations have such a platform, where there can be attendance tracking, exchange of ideas, constant feedbacks, performance trackers, and employee engagement, it will benefit the employees and the employers as well.
Organizations will now face another wave of technology that will have a big impact on the way to work. The HR Department is in a unique position to prepare the workforce for this new way of working and to utilize the big data generated by IoT. The technological edge added to Human Resource Development is a very efficient ‘driving factor’ in terms of work productivity. Data stored, collected and interpreted through blazing speed and the cost incurred is based on a ‘one-time-investment’ concept. Hence, time and money, the most crucial factors of an organization’s success can be managed effectively by implementing IoT in HR.
The safety that the software has from external or internal malfunctions is an important quality that must be used while integrating IoT with HR. The employee data can be kept private and confidential with the use of stringent filters in the software. For example: The yearly compensation data or the monthly incentives data can be kept safe and private with the use of these IoT tools. IoT combined with the functions of HR, opens doors to automation and access to a huge amount of data. Automation leads to uniformity in tasks, quality of service and control of day-to-day tasks without human intervention.

6
But, while we are having an understanding about the advantages of HR and IoT as a unit, there are certain factors that will make this combination a difficult one. Firstly, the immense advancement in technology will be resisted by employees of the organization. Currently, Indian companies have a work culture where-in employee belong to multiple generations. The kind of training required to use such an advanced technology is also a dreary task. Apart from this, the concept of IoT integrated systems is a complex one. If there is a slight glitch or error of any sort in any hardware or software, it may lead to disastrous results. Implementing an IoT based HR System will adversely impact the jobs in the HR vertical itself, since ‘machines’ will now be carrying out various ‘human’ resources projects with precision and quality.
It is up-to a particular organizational leader to implement IoT into HR with a deep understanding of the level of implementation required in combining these parameters, since people, technology and change management, will always be the only three factors that ‘make or break’ an organization.
References • Madhuri Singh – HR Business Partner – Heuristics Informatics Pvt. Ltd. (LinkedIn Posts) • Quantifying Employees – Article by Fox Business• Internet of Things – Article by Progressive HRM
Authored by Mentored byBinal Chitroda Dr. Farida Virani MMS – HR Specialization, MET MET, Mumbai
CALL FOR PAPERDear Authors, MET Management Review (MMR) Research Journal (ISSN no. 2394-4013) is highly-selective, peer-reviewed, interdisciplinary journal focusing on conceptual and practical applications in the field of:
MMR always seeks to publish a balanced mix of high quality theoretical research articles, case studies, book reviews, strategies, scenario analysis, surveys as well as pedagogical and curricular issues. MMR would act as a platform for supporting emerging technologies through its publication.
The main objective of MMR is to facilitate the research scholars through faster publication services. MMR seeks high quality articles worldwide and publication is biannually (ISSN: 2394-4013). For paper submission / further clarification: [email protected] Author guideline click: http://www.met.edu/Institutes/iom/MET%20Management%20Review.asp Chief Editor: Dr. Vijay Page Editor: Dr. Nirmala Joshi

7
Impact of Sales Force Automation onSales Force Performance
AbstractUnderstanding how technology investments create business value in B2B sales is a research priority in today's technology-intensive world. Drawing on an extensive experience and literature review, this research paper suggests that sales technology can support both: externally focused tasks towards managing customer relationships and internal administrative tasks. Today with India being the largest sourcing destination for information technology (FY 17 $155-billion vibrant growth of 12 %) adoption of sales automation and its impact on these company and sales person is vital. This paper will focus on Sales Force Automation (SFA) and its increasing importance. It will explore the purpose of SFA, and its impact on sales performance: in the business-to-business IT services sector in India, to understand the potential benefits and the problems related to adoption of an SFA system.
KeywordsSales force automation, Sales force performance.
IntroductionIndia is the world's largest sourcing destination for the information technology (IT) industry, accounting for approximately 67 per cent of the US$ 124-130 billion market. The industry employs about 10 million workforces.
Research ObjectivesOur research objective is to understand how SFA technology relates to sales force performance. Specifically, how sales people use SFA to accomplish their daily tasks, not only if they are using SFA or not, it has a direct impact on their performance. We believe that sales force have different motivations when using SFA technology and different antecedent factors drive certain SFA-use behaviour which applies to our following 3 objectives.

8
1. To conceptualize an SFA-use construct which will enable to better incorporate the particular SFA-use behaviour of a sales ? 2. Does the way SFA is used by sales force impact their performance?3. Establish antecedents of SFA-adoption to see how they drive SFA-use in a certain behavioural direction.
Table 1: Academic definitions of sales force automation
As Avlonitis and Panagopoulos (2005) argued, “the terms SFA and CRM are used interchangeably in the academic literature. Substantially, CRM is a business strategy constituted by processes and technologies which improve the customer relationships, while the SFA only offers technological tools to support the sales force...thus recognizing that CRM is a wider (but related) concept of SFA”. In this vein, CRM and SFA are similar tools, but of a different nature. SFA configures itself as an operative instrument oriented towards the sales force, while CRM represents a strategic orientation which drives the business decisions and can be applied to the whole organisation (Mercolini, 2013). Actually, CRM is rather a business strategy and philosophy, integrating customer focus, relationships with customers and team-based consultative selling into a coherent organizational strategy (Brown, 1999; Swift, 2001). CRM encompasses different functions such as marketing and service, production and logistics in addition to sales. Whereas much of the extant literature on SFA technology has focused narrowly on personal selling, CRM clearly speaks to the management of organizational processes (Leigh & Marshall, 2001).
The literature has developed a rich understanding of SFA technology and its use in the workplace. Both organizational and individual drivers of SFA adoption have been widely tested so far and it has been made clear that the performance impacts of SFA technology must be the focus of future research.
Table 2: Benefits deriving from SFA system utilization
force
SFA represents the use of computer hardware and software products to collect, assimilate, analyses and distribute information with the aim of increasing sales force productivity
(Morgan&Inks, 2001)
SFA consists of centralized databases which allow remote access from laptops or mobile devices through the use of special software products to enable the salesperson to access immediately all the information useful for performing the sales process
(Parthasarathy and Sohi, 1997)
SFA systems utilize computerized hardware, software, and telecommunications technology to capture, access, analyses, and exchange high quality information in order to improve sales force productivity and effectiveness
(Jayachandran, Sharma, Kaufman and Raman, 2005)
SFA concerns the application of technology to the sales function (Pullig, Maxham and Hair, 2002)
SFA supports the sales process by increasing the speed and quality of information flows among the vendor, the customer and the organisation.
(Speier and Venkatesh, 2002)
One primary goal of any organisation is to increase profits, so it is a natural starting point to consider the effects of SFA on the bottom line. It is important to consider the gross increase in revenue and profits per year as well as increases in revenue per sales force. However, despite the intangible value that SFA adds to the organisation, often it is difficult to gauge its actual effect on revenues.
Increased Revenue
The costs of implementing SFA systems are significant and a great deal is being spent on these systems. This, however, is offset by reductions in the cost of selling by the sales force (Donaldson & Wright, 2004).
Reduced Costs
The most important benefit of having a sales force is its ability to sell and create value by building strong relationships with customers. Thus, mobility is extremely important to the sales force. Today more than ever the sales force needs to be in touch with clients, rather than at an office gathering data. SFA has allowed the sales force to become increasingly mobile. Most CRM companies are moving quickly to establish wireless components for sales through web phones and handhelds or wireless access to various SFA web portals (Greenberg, 2001).
Increased Sales Force Mobility

9
System-to-value chain
(source: Doll and Torkzadeh 1991)Research ModelOur conceptual model (see figure below) draws on the ‘System-to-Value Chain’ and the ‘DeLone and McLean IS Success Model’ and allows us to assess hypotheses. Integrating upstream and downstream perspectives into a single model represents a major strength.
The attractiveness of SFA stems from the numerous benefits that it offers. One of the most important benefits is its ability to deliver superior customer value through information sharing across sales, marketing and customer service personnel (Morgan & Inks, 2001). Since multiple departments have an interest in viewing the status of a customer account of opportunity, SFA is a good solution. The fact that SFA systems allow different departments and individuals within one organisation to constantly access the customer information they need is extremely significant (Reinartz, Krafft & Hoyer, 2004).
Increased Availability of Customer Information
One of the most important roles of sales force managers is to monitor the progress of their sales force. SFA is a tool that allows managers to better monitor the activity of their sales force by reporting on its activities. By reporting information they have collected from customers, sales force provide managers with a better understanding of their own activity (Moutot&Bascoul, 2008). The overall analytical ability of sales managers increases with use of SFA data. With this increase in ability comes the power to monitor the progress of sales representatives more closely, in turn allowing the manager to help improve individual sales representative performance.
Improved Tracking by Management
Sales forecasting is defined as the process of estimating what the business’s sales are going to be in the future (Kerin, Hartley &Rudelius, 2009). It is one of the most important and challenging tasks for any organisation and is an integral part of business management.
Sales Forecasting

10
H1a: Using SFA-technology as a customer relationship tool will have a direct and positive impact on sales force performance. • SFA can be a very helpful tool to understand customer needs and sales opportunities by getting customer 360
degree view. •Better planning helps sales force allocate his time across clients optimally and ensure that every client receives the
necessary sales force attention. • During a sales interaction, the effective use of information improves the sales force ability to anticipate & respond
to buyer concerns and objections
H1b: Using SFA-technology as an internal coordination tool will have a positive impact on sales person performance. • SFA can ease a sales force administrative burden and facilitate better functioning internal processes of a sales force. • SFA can support team-selling by coordinating and synchronizing team activities. Effective team-selling enabled by
technology should in return increase sales. • SFA also helps sales force improve their technical knowledge with respect to their products and their ability to
compare and analyse their product's standing against competitive products • S FA itself, make it possible to participate at online training sessions at one’s own convenience and at almost no cost.
H1c: The effect of using SFA-technology as an internal coordination tool on sales force performance will be mediated by the customer relationship dimension.
By reducing the amount of ‘downtime’ in a sales person's workday and optimizing call schedules; SFA helps sales force fit more sales calls into a given period
Antecedents of SFA-Use DimensionsA sales force motivation to act in a certain way is determined by the interplay between management, organizational, social, personal and environmental factors. In this part we embrace an upstream perspective and link a number of well-known antecedents to our SFA-use dimensions.
The Technology Acceptance Model (TAM) has emerged from literature as a powerful and parsimonious way to explain IT users’ intention and behaviour regarding IT usage (Davis 1989). TAM identifies two central beliefs, perceived usefulness and perceived ease of use, as the primary predictors of user’s attitude or overall affect toward IT usage.H2a: Perceived usefulness will have a positive impact on the customer relationship and internal coordination dimensions of SFA-usage.Perceived usefulness is the extent to which a person believes that using a system will enhance her performance, andperceived ease of use is the extent to which a person believes that using the system will be relatively free of effort. Thecore idea of the TAM is that a person’s attitude toward using a technology is jointly determined by perceived usefulnes and perceived ease of use.

11
H2b: Perceived ease of use will have a positive impact on the customer relationship and internal coordination dimensions of SFA-usage.Sales people are among the most technophobic employee groups. They will assess the amount of effort necessary toutilize an SFA tool and will likely develop positive attitudes toward those tools where the performance benefits are notoutweighed by the required effort
H2c: Perceived ease of use will have a positive impact on perceived usefulnessTAM posits that perceived ease-of-use has an additional instrumental impact on a sales force attitude toward using a technology through its link to perceived usefulness. To the extent that increased ease of use contributes to improved performance, perceived ease of use will have a direct effect on perceived usefulness.
H3a: Supervisor support will have a positive impact on perceived usefulness.
H3b: Supervisor support will have a positive impact on perceived ease-of use.Supervisor support is critical as the implementation of IT innovations often requires substantial material resources to support end-users during implementation and continued use of the system.
Managers may emphasize the benefits in terms of usefulness, minimize the drawbacks in terms of ease of use and use their personal influence to push technology adoption
H3c: Facilitating conditions will have a positive impact on perceived usefulness
H3d: Facilitating conditions will have a positive impact on perceived ease of useWe define facilitating conditions as the extent to which a sales force believes that he or she has been provided with the resources and the external support to use SFA technology. Investing in facilitating conditions such as tutorials, help lines, training sessions and technical maintenance signals the importance an organization places on SFA technology and reassure sales people that using sales technology is beneficial.
H3e: Computer self-efficacy will have a positive impact on perceived ease of use.Self-efficacy can be defined as “an individual’s perceptions of his/her ability to use computer (software) in the accomplishment of a task.
H3f: Team-use will have a positive impact on perceived ease of use.Greater the number of sales force who are experts in using the system, easier it is for a sales force to ask other users for help with the commands and other functions of the system.
H3g: Team-use will have a positive impact on perceived usefulnessIncreased connectivity between team members through information technology improve group coordination, minimize time between exchanges, and reduce the risk for communication errors
H3h: Team-use will have a direct positive impact on internal coordination dimension of SFA-usageFurthermore, when internal-coordination activities are managed through the SFA system, the opportunity cost for not using the SFA increases. This may make sales force feel obliged to use SFA to facilitate team-selling activities regardless of the extent to which they find technology useful or easy-to-use.
H3i: Supervisor SFA-control will have a positive impact on the customer relationship and internal coordination dimensions of SFA-usage.In many studies supervisor feedback, behaviour and control orientations have been shown to direct the attitudes, learning and behaviour of sales force. Sales managers evaluate sales force not only on outputs, but also on methods, their selling processes and even organizational norms and culture. Supervisor-SFA-control as the extent to which a supervisor: (1) Specifies the activities he or she expects sales force to perform using the SFA system,(2) Monitors to see whether they are performing those activities,

12
(3) Informs them if they are meeting his or her expectations
Control VariablesThe control variables in our research model are as follows:(1) Length of time a sales representative had been with the company(2) Length of time a sales representative had been working in his or her territory(3) Total sales experience (4) Age(5) Gender
Concluding RemarksSFA systems should be considered as part of a wider framework consisting of strategy, processes and organization with the aim to improve customer relationships.
Sales force typically will use only a fraction of the available SFA functionality and they differ significantly in their choice of SFA functionality to adopt. The difference between external oriented selling activities and internal oriented administrative tasks is significant. Former group represents relatively abstract tasks whereas latter stands for well defined, easy to automate processes. It is arguably unproblematic to document the outcomes of administrative tasks-explicit knowledge. In contrast, customer oriented tasks often result in tacit knowledge, which is very difficult to capture digitally.
Sales force are concerned most with the benefits offered by new technology. Perceived usefulness of SFA technology drives a certain SFA-use behaviour among sales force. Perceived ease-of-use relates strongly to perceived usefulness. Sales manager plays an important role in convincing sales force for the value of technology, just as in any aspect of the selling job. Sales force, who work in teams where SFA technology is valued and well relied on, tend to report higher levels of perceived usefulness for the system. Facilitating conditions provided by the organization such as training and user support and the confidence of a sales force with computers in general together determine the sales force perception of usability of the system (perceived ease-of-use).
Using SFA as a cost-cutting efficiency tool is also instrumental, but it does not have a direct impact on the performance of the sales force. Increased efficiency improves performance only when sales force use their time gains for relationship-building tasks.
In sum, SFA technology can mean different things and serve many purposes at the same time. Management should set clear objectives before investing into SFA systems. To materialize the real potential of SFA in a relationship selling context, however, a focus on improving sales force effectiveness is the key.
We hope that this research paper stimulates further research to deepen our understanding of the drivers and performance outcome of SFA-technology use. Shedding more light on the question of how technology investments translate into business value in B2B sales in an IT industry for an enterprise represents a promising and challenging research opportunity.
Bibliography• IT & ITeS Industry in India http://www.nasscom.in/interviews/global-mega-trends-reshaping-technology-landscape • Global Mega Trends Reshaping The Technology Landscape https://www.ibef.org/industry/information-technology-india.aspx
Authored byKumar Chandnani

13
The Haats and Mela Route for Rural Distribution
Abstract The past decade and even prior to that, has seen more and more companies rushing to capture the rural markets. This mad rush is due to a number of reasons like saturation of urban markets, growing potential of rural markets, increased income and educational levels of rural consumers, easy in rural communication due to the deep penetration of satellite television, internet and mobiles, increased aspirations of rural folks etc. Research has shown that rural markets have outpaced the growth of urban markets and will continue to do so in the years to come. In future going rural will no longer remain an option for big companies which aspire for a strong market growth. After all more than 65% of the country’s population resides in the rural areas in approximately 6, 35,000 villages. Among the 4Ps of marketing mix, “the place” seems to be the most complex with reference to rural marketing, as the rural markets are not only large and scattered but a large percentage of villages have a population of less than 2000. Many villages are not accessible during rainy season. Very few states in the country like Pubjab, Kerala and Goa have excellent road connectivity in rural areas.
In spite of all the revolution in shopping i.e. online shopping, advent of Malls and super markets, the weekly bazaars (haats) and Mela’s still continue to be popular with the village folk. This paper based on secondary data attempt to compare the pros and cons of using the haats and melas for making products available to rural consumers.
KeywordsRural area, Haats, Mela’s, Consumer Durables, FMCGs.
IntroductionCompanies like HUL, P & G, Nirma, Colgate, ITC etc. had long proven that rural markets are difficult but not impossible. Most of these companies generated huge revenues from rural areas. Innovative techniques like Self -Help Groups, e-Choupal were used by HUL and ITC respectively. These companies are financially strong and they looked at rural markets as long term investments. Various surveys have indicated that 80% of the products sold in rural areas were local, regional or national brands. This only goes on to prove that brands which are popular in urban markets will automatically have a huge demand in rural markets. Availability is the key to success. But making the product available is the toughest challenge. The incomes and aspirations have gradually gone up, so price is no longer the main reason that keeps the product beyond the reach of the rural consumer. Awareness has increased due to increased educational levels, more rural to urban migration and penetration of satellite television and mobile network. So rural folks are now well informed about brands and new products. Many companies have already modified their products to suit the needs of rural consumers, e.g. Godrej Chotukool, Tata water purifiers and many other companies have modified the products in order to make them all the more appealing to rural consumers. The big question that marketers now face is the distribution. Rural haats and Melas to some extent help in answering this question. The large number of rural haats and the hugely attended melas if used in an ideal way could help solve the problem associated with distribution, the main issue faced by the business houses in reaching out to villagers. Rural area refers to country side that is sparsely populated and are distinct from thickly populated urban areas.
Definition of rural area: There are many definitions for the term rural area.• The census of India defines rural as any habitation with a population density of 400 per sq. km, where at least 75 per
cent population is engaged in agriculture and where there exists no municipality or board. (Kashyap)• Planning Commission of India defined rural market as towns up to 15,000 populations are considered as rural
market.• According to marketers an underdeveloped area which is sparsely populated and lacks amenities like good schools,
roads hospitals electrification and where agriculture is the main source of income. These places are generally influenced by the nearby town or city.
• A place which is not a city or a town is a rural area.• A remote area far away from the urban cities.

What is rural marketing?Rural marketing is defined as the flow of goods and services from urban area to rural area, from rural area to urban area and also includes the flow of goods and services from rural area to rural area.
What is distribution?The movement of goods and services through a distribution channel right up to the final customer, consumer or user.
A holistic view of rural markets will show that rural markets offer huge potential, but there are many challenges which marketers will face like high distribution cost (almost 25% of villages with population of less than 500 have no access to a shop), seasonal demand, many languages and dialects, lack of all-weather roads, low per capital income, low literacy levels etc. Many companies are trying innovative ideas to generate sales from rural markets. Most of the companies, generally tap the feeder towns with assistance from dealers/ wholesalers/ retailers, who in turn work towards making the products available to nearby villages. These middle-men are extremely demanding as they are well aware of the company being completely dependent on them. They demand long term credits, promotions and advertising for the products, distribution at required location etc. Increasing competition in rural areas generally forces the company to give in to the demands of the retailers. On many occasions benefits of promotions are not passed on to consumers by the middlemen, and the sales representatives of the company turn a blind eye as they do not want to antagonise the middlemen. Thus distribution proves to be an aspect where the companies generally end up making compromises.
Overview of rural haats and melasDistribution through rural haats and melas seems to be a bright option as the dependence on the middlemen will be greatly reduced. Haats and melas offer the perfect settings for transactions between buyers and sellers. Many companies make theirs goods available at haats and melas but these haats and melas generally are not looked up to with much significance. It is considered to be just one of the additional techniques of distributing the goods. If companies plan and execute innovative marketing strategies for haats and melas, it would result in huge sales. This distribution would be of immense help to companies who are new to rural markets and are focused at generating sales from the hinterland. According to Pradeep Kashyap, Director, MART, who has conducted many studies on rural haats concluded that rural haats have immense potential, which the corporates are now waking up to.
Rural HaatsHaats are considered to be the oldest form of retail outlets for purchases and trade. The existence of haats can be traced back to era of Chandragupta Maurya. Transactions during that period used to be in the form of barter system. A haat is an open air market, where goods are generally display on a carpet or sheet on the road side. Haats are held on a weekly basis (say on a specific day of the week). They are held at a specific location and people from the nearby villages visit haats for their weekly shopping. Each haat caters to the needs of minimum 8 to 10 villages around it. Almost all villagers make shopping trips to weekly Haats. The most important aspect of a village haat is that almost all utility products needed are available at the haat. Items like vegetables, fruits, clothing, FMCG goods, handicrafts etc. are commonly found and purchased in weekly haats. These weekly haats generally lack the basic infrastructure like a shade, counters, billing machines etc. The weekly bazaars start early in the morning and ends by lunch time. In some places it could start late noon and will be over after before sunset. The selling overheads in a haats are very negligible.
Local and national brands are available in haats. Around 43,000 haats are held in rural India. Rural haats account for` 50,000 crore sales annually. Villages generally have less disposable income, hence the price of the products have to be kept less. The price of the products in the weekly haats are generally low as there is no money spent in shop rent, shop interiors, salesman salary etc. (Kashyap P. , 2011)
Sellers at haats are typically mobile. They sell in a particular geographical region one day and move to another region the next day. The participation fees in haats are very low and hence affordable even to small time traders. Baring a few states like Harayana, western Rajasthan and North Eastern States, haats are held in almost all the other states of the country.
14

15
MelasMelas are held on specific occasions, especially during festive seasons and includes food, entertainment, shopping etc. Melas are held less frequently as compared to haats. The average duration of melas could be anywhere from 1 day to a couple of weeks. A large fair could well have over 500 stalls. Participation fees in melas are much higher as compared to haats. The crowd strength at fairs increases gradually with each passing day. Similar to haats both branded and unbranded products are sold at melas. In melas people tend to try out new things. Visits to melas is considered to be a joy outing. Melas generally have a specific theme and they are organised continuously for a number of days and is attended by thousands of people. The number of visitors to melas is comparatively very large as compared to haats. Timings of melas are of longer duration as compared to haats, they run late into the night. Unlike haats, the stalls in melas have the basic infrastructure and amenities. Melas are generally organised after the harvest season, keeping in mind that people have enough money for spending. According to Indian Market Research Bureau 8000 melas are held every year. Almost 80% of the melas are commercial melas and the remaining are cultural melas. A majority of the melas are held during October- November and January-April. This coincides with the Kharif and Rabi harvest, when the farmer’s purchasing power is high. The visitors to melas are estimated nearly up to 100 million. The Pushkar mela in India is visited by around 10 million rural consumers. (Chetan Bajaj, 2017)
Distribution through haats and melasThe numbers of retail outlets in rural areas are very less as compared to its vast population. Most of these retail outlets are very small and lack the basic infrastructure required and are generally a side business for most of the retailers. These retailers demand credit facilities from the companies whose product they display, as they have to provide credit to most of their customers who visit on a regular basis for their daily needs. Dealing with retailers can be very tough as consumers in rural areas are more shop loyal than brand loyal. The company cannot afford to annoy the retailers.
Haats and Melas offer one of the best alternatives for distribution and promotion of goods and services to companies who desire to make their goods available in rural areas. Haats and melas may have different names in different regions but have a striking resemblance in the nature of products sold, if the haats and melas are held in regions where the culture is quite similar.
Advantages of distribution through Haats and Melas• Distribution network is already in place.• All transactions are in cash. No credit system exists.• Big opportunity to promote your brand as there are large gatherings.• Caters to all villages located nearby.• Stock left unsold is used at the next haat.• Rural consumers well informed about the haats and melas.• People generally visit Melas along with family members.• There is a positive government approach towards the haats and melas as many farmers also display their produce in
weekly haats.•Melas offer huge entertainment opportunities and hence would be repeatedly visited by rural folks during the
stipulated time period.• May encourage a retailer to stock your product if he sees that a huge demand for the same among the consumers.• Melas can be used to sell high priced consumer durables. Visitors come there with the intention to buy.• Sometimes it’s a question of pride among rural folks on how many times they have visited a particular mela and how
much they have spent.• School going children of illiterate parents greatly influence buying decisions. As melas are a family outing, these
children could greatly influence buying decisions.• Melas are visited with extended members of the family and neighbours which results in more spending and buying.• Sources of entertainment are limited in rural areas and hence melas are always eagerly awaited by village folks.• Word of mouth has a huge impact in rural areas. So if a product is purchased and authenticated, many others would
visit for purchase of the same.• Big melas held in particular locations are looked upon with pride by local population of the region.• Weekly purchases are planned keeping in mind the week-day of the haat.• Weekly haats could be used to sell surplus agriculture produce.

16
• Haats and melas can be looked up to as re-distribution arrangements for villages which are very less populated and lack retail outlets.
• Haats and melas are well attended and do not require any advertising or publicity. People are well aware on which day of the week a haats are held and melas are repeated year after year according to the Hindu calendar.
Disadvantage of distribution through Haats and Melas• Many spurious brands are sold in haats and melas. They look very similar to the original brands.• Weather may at the last moment spoil the whole effort.• Stiff competition as alternate brands available at the same location.• Many shops and huge crowds may result in the potential consumer missing out on your product.• The local population in the village may sometime make things difficult for traders, who are outsiders.• Haats are generally once in a week and melas are for a few days once in a year. Due to this product cannot be made
available whenever the customer needs it.• The customer may need to travel some distance to visit haats and melas. The return journey with all the purchases
becomes all the more tedious.• Haats are generally used to sell items which are low cost.• If same are products are available at same price with local retailers, people would generally buy it from them. As
rural consumers share a strong relationship with local retailers and also get credit facilities from him.• Products may not be sold at fixed price in haats and melas.• Buyers many times are sceptical about the authenticity of the products sold in haats and melas.• Durables which require guarantee/warrantee, service, face difficulty in sales at melas, as consumers would rather
buy them at fixed shop locations.• May invite presence of anti-social elements. • Natural calamities and droughts may have a major impact on the business of haats and especially meals.
Observations and Suggestions:• Sellers come to haats and melas' with the intention of selling their stock (even if discounting the price is required, they
do not intend to carry back their stock and bear transportation cost), on the other hand buyer visits haats and mela's with money in their pockets and have strong inclination to buy. Thus haats and mela's are a place where committed buyer and seller meet.
• The advantages of distribution through haats and melas far outweigh the difficulties associated with it.• Haats are visited for purchases of utility products (generally) FMCG, while melas are visited with aim of having fun
and to purchase items like clothing, imitation jeweller, consumer durables etc. • Sales in weekly haats may be low if melas are organised in that region during the same time, as people prefer visiting
meals as compared to haats.• Haats and Melas can be used for testing new products in the rural markets and response can be noted.• Companies need to keep a track of where main weekly bazaars and melas are held in different regions.• Tie-up with local residents/traders for displaying goods in haats and melas.• Collaborate with non-competing companies to distribute products in rural haats and melas.• More support from the government is needed for providing basic infrastructure facilities for haats.• Displaying new goods and services will attract more crowds to rural haats instead of sticking to only the basic
necessary goods and services.• Haats and Melas offer huge opportunity not only for sale of goods and services but also promotions and for
advertising.• Bargaining at haats and melas is a common practice. • People have leisure time during visits to haats and especially melas. It offers the right opportunity to carry out product
demonstration.• The population in rural areas is scattered and haats and melas offer the ideal settings where high number of villagers
would gather. • Local village youth can be trained in product promotions and demonstrations. They would carry it out more
effectively as they are familiar with local dialect and culture.• Haats and melas are visited not only by the individual consumer but also by retailers from small nearby villages; to
buy stock for their retail outlets and hence bulk purchases may happen.

17
• The number of non-agro products that are sold in haats is growing very rapidly.• Haats and melas can also be used to sell defective goods with minor defects at throw away prices, as rural consumer
would not mind the minor defect if the price is very less.• Melas could be used for collecting useful information about potential customers, who could be contacted in future, if
they did not purchase the product now. This database could also be used in generating references.• It gives the perfect opportunity for free sampling and consumer feedback.• Haats and melas which have high turnover need to be catered to on a priority basis, small haats and melas could be
targeted at latter stage.• Loose commodities, as well as packaged goods are sold at haats and sometimes even melas.• All convenience goods required for daily use available at one place is the main utility of haats.
Bibliography• Rural Marketing- Pradeep Kashyap (2012)- Pearson• Introduction to Rural Marketing- Chetan Bajaj, Nandini Bajaj, Veena Shenoy New Age International (P) Limited Publishers.• Rural Marketing-Text and Cases—C.S.G. Krishnamacharyulu, Lalitha Ramakrishna. • Introduction to Rural Marketing-R. Krishnamoorthy-Himalay Publishing House.• TAPPING INDIAN RURAL MARKET - RURAL DISTRIBUTION STRATEGY Deepa Ingavale Department of Commerce
& Management, Shivaji University, Kolhapur.- Global J. of Arts & Mgmt., 2011: 1 (4)•CAPTURING RURAL MARKET WITH CUSTOMIZATION OF MARKETING MIX- Ms. Himani Joshi Dr. R. K. Srivastava-
Asian Journal of Technology & Management Research Vol. 01 – Issue: 02)• Customization of marketing mix for rural markets-Dr. Narendra Nath Menon, Suresh K• Rural Communications * Dr. B. H. SURESH - ** SATHYANARAYANA S
Authored byProf. Anand J. Mayee
MET, Mumbai
CALL FOR PAPERDear Authors, MET Management Review (MMR) Research Journal (ISSN no. 2394-4013) is highly-selective, peer-reviewed, interdisciplinary journal focusing on conceptual and practical applications in the field of:
MMR always seeks to publish a balanced mix of high quality theoretical research articles, case studies, book reviews, strategies, scenario analysis, surveys as well as pedagogical and curricular issues. MMR would act as a platform for supporting emerging technologies through its publication.
The main objective of MMR is to facilitate the research scholars through faster publication services. MMR seeks high quality articles worldwide and publication is biannually (ISSN: 2394-4013). For paper submission / further clarification: [email protected] Author guideline click: http://www.met.edu/Institutes/iom/MET%20Management%20Review.asp Chief Editor: Dr. Vijay Page Editor: Dr. Nirmala Joshi

18
Strategic Management in the Globalised World
“We cannot march through 21st century with the system of 19th century. Today, countries are independent and interconnected” – opines Prime Minister Modi (August 2016). This interconnectivity is causing complexity as never before.
Globalisation is associated with conflicting notions like economic, politico-cultural systems across the Globe as a major force of human development and prosperity to ecological exploitation & conflicts (Nibojsa Makicennovic, 2008). In this complex, interconnected world, we are already witnessing “Lorenz Effect” in most spheres of life.
Sectoral approaches rely upon actor’s behaviour including resource – based models, and politico economic outcomes (Kurth 1979, Rogowski, 1989) (Gourevitch 1986) (Gilmore 1997). Their approaches explain technological changes in Globalised world in sectoral variation, without referring to institutionalizing innovations. According to Freaman & Perez, “Technology has wide spread consequences... in that, the diffusion is accompanied by structural crisis of adjustment” Charles Perrow & Oliver Willums have studied “degree of coupling” in the elements of technological system and the other in the “Complexity of causal interactions among production stages”.
The authors here wish to look at impact of Globalization of technology from Evolutionary perspective as a multi-disciplinary approach. 1. Why do we still maintain QWERTY sequence on our keyboard? 2. Why do we build superior smartphones and still find Samsung and Apple dominating the market? 3. Why do Snapdeal, Amazon, Flipkart achieve 60% CAGR consistently and yet downsize? 4. How do Ola and Uber give traditional fleet owners a run for their money? 5. Why did China buy Holcim Srilanka at twice its valuation? 6. Why Nokia – once leader in Mobile market – become extinct in short time span? 7. How suddenly ‘Payment Banks’ concept becomes buzzword?
These are a few questions we wish to address in this paper. As such, the business practices at any juncture drew heavily upon the societal needs, which are in turn affected by technological and scientific developments during that phase.
At the outset let’s take a look at the advent of industrialisation: 1776 – Adam Smith wrote: “Wealth of Nations” - U. S. Declaration of independence - James Watt developed Steam engine
Strategic Management in its true sense got fillip, during manufacturing of Model – T by Ford, with assembly line operations. This was the time when each factor of management was independent and men & machine were interchangeable - a mindless system (1908). It was thought that, resources were abundant and cost reduction was the only way to success.
During resource scarcity due to First World War (1914-1918) optimisation techniques got developed and operation research – the first phase of systems approach started with Convoy theory. This truly found its use in management since after Second World War (1939) and was later popularised by Ford Wizkids like Robert McNamana.
By end of World War II, people got fed up with “car of any colour, as long as it is black”, and Alfred Sloan (1930-40). Started General Motor’s divisionalised and integrated organisational structure. By 1970, CPU were invented, computers were developed and popularised. The need for management was control & integration of various divisions of organisation. In 1970, Bruce Henderson developed B.C.G. Matrix, where Head office was the brain and rest of the S.B.U.s were part of the organisation. Truly, a biological mode was developed.

19
This was the age of competition and integration. With the power of computing it was possible to Predict - And – Prepare. All the techniques focussed on forecasting and planning accordingly. By 1982, Porters model came. Proter’s Generic Strategy said, you could either have Reach or Richness or get stuck in the middle.
Later, integrated circuit was developed and personal computers become popular. This gave rise to ERP/SAP, to keep the organisation integrated and control the resource flow within organisation as an integrated system.
By 1990 – 95, personal computers became household name. In 1990, P.C.’s become popular in west and in late 90’s, in the developing world. By 1995, internet had grown 100 times. Berlin wall fell, USSR dis- integrated, Globalisation started. The world became smaller, flatter. In this, tremendously interconnected world, anything happening at any part of the Globe, would have profound impact, at any other part. A true Lorenz effect could be seen. Extreme sensitivity to initial condition could be noticed. Linear models useful for “Predict and Prepare”, gave rise to nonlinear models, and hence in build unpredictability. The system would now have emergent behaviour. This complexity now necessitated Bottoms up strategic models. - Porter said “Reach or Richness or stuck in the middle, Amazon and Flipkart allow both Reach and Richness. - Path dependence requires URN based models; hence random movement models like Markov chain become
outdated. - As Predict and Prepare became difficulty Formula based models have to give way to Agent based models.
During industrialisation & globalisation phase – ‘Trade Blocs emerged – NAFTA, EU – more based on geographical proximity. But 2010 saw divergence from north – north to north – south alliance. In 1990, C. K. Prahalad gave, “Core competence.” In 1994, wrote competing from future.” In 2005, Blue ocean strategy came, incorporating a lot of elements of path dependence, still largely ignoring the impact of social media. 1996-97, classmates.com in us. Started this boom with 57 mm registered accounts by 2002, social media hit its stride with Friendster. By 2004 Facebook was launched, and the rest is history.
Facebook today has 1.7 Tr. accounts, WhatsApp has 1.2 Tr., WeChat 806 Bn. What it mean in, social groups as independent entities are all powerful agents, which can take their own decisions.
What it means is that power is redistributed and fragmented. Business models need redesigning. This requires synthetic, rather than analytical approach to address wicked problem.
The days are not far, where to sustain, there will be: 1. More and more network organisations 2. Decision making will be Agent based, without Central control 3. Core Competence will be path dependent with Tacit knowledge 4. Research agendas would be Agent based simulation with cellular Automata
Shift of Paradigm Mindless SystemMachine Mode
Un-minded SystemBiological Mode
Multi-mindedSystem Ecological
AnalyticalIndependent
Variables
Inter-changeabilityof Parts and Labour
(Model – T)
Inter-changeabilityof Parts and Labour
(Model – T)
Diversity andGrow(BCG )
Systems ApproachInterdependent
Variables
OptimisationTechniques ( O.R)
Flexibility andControl Cybernetics
(ERP/SAP)Redesign

20
This decade, may witness dramatic changes in management theories and the way of doing business with help of • Cloud Computing • Big Data analytics• Green technologies
Surge in technologies – lead to change in Social norms and practices – thereby leading to change in business management practices – to satisfy consumer needs (emergence of e-Commerce, Malls, Shadi.com etc.)
As for consumers – convenience, time saving etc. have become important factors – and hence inevitable role of technology in business.
References• Modelski George, Devezas Tessaleno and Thompson William R.(2008), Globalization as evolutionary process –
Modeling global change, Rethinking globalizations, edited by Berry Gills, University of Newcastle, UK • Thayer Bradley A., (2004), Darwin and International Relations, The University Press of Kentucky • Edited by Thompson William R.,(2001), Evolutionary interpretation of World Politics, Routledge, Great Britain • Boschma Ron, (2009), Evolutionary Economic geography and its implications for regional innovation policy, Article,
Lund University, • Bigelow David, (Nov.25, 2003), An Analysis of the Richardson Arms Race Model• Qin ZHU, (2007), Process Innovation, Cost Leadership and Market Power – Analysis based on Electronic Information Industry•Frenken Koen, (2006), A fitness landscape approach to technological complexity, modularity and vertical
disintegration, Elsevier B.V.• Bisilkas Marios, (2006) Adaption on Rugged Landscapes: Competitive Strategies in the Presence of a Common Objective• Akio Tokuda,(2004), The logic of Strategic Alliances, Ritsumeikan International Affairs Vol.2, Ritsumeikan University • Bathelt Harald and Gliickler Johannes, (2003), Towards a relational economic geography, Oxford University Press
Authored byProf. Rajiv Gupte
Prof. Anant AmdekarMET, Mumbai

21
Prescription Substitution by Branded Generics:A Pilot Study of Live Prescriptions in Mumbai Suburbs
AbstractThis article is aimed at understanding the retail chemists prescription substitution practices using similar alternatives (branded generics) along with the demographics of the purchasers accepting such substitutions. Currently, almost all medicines in India are sold under a brand (trade) name and medicines are called as branded medicines or branded-generic. In real sense, Indian market does not have branded medicines (a name commonly given to an innovator product) because till January 2005 product patent was not applicable in India. In India, many pharmaceutical companies manufacture two types of products for the same molecule, i.e. the branded product which they advertise and push through doctors and branded-generic which they expect retailers to push in the market. The so-called branded medicines in India are manufactured and promoted by multinationals or by reputed Indian manufacturers. Branded-generics, on the other hand, are not promoted or advertised by the manufacturer. This category closely resembles formulations referred to as 'generics' worldwide. Patients' and doctors' perception for all branded-generics irrespective of company is the same.
In India, generic substitution is legally not allowed so patients' awareness about generics is limited and doctors and patients do not want pharmacist to change the trade name written by doctor. Hence, consumer awareness for the generics, variety of trade names available in the market, and price variation is very limited. Hence, there is need to conduct a study that can document the prescription substitution of the branded products by their branded-generic versions manufactured in India.
KeywordsPrescription substitution, Branded generics, Therapeutic and Sub-therapeutic groups
1. IntroductionPharmaceutical marketing in India is quite a challenge due to highly fragmented nature of the market, with over 60,000 brands battling for a share in the prescription market valued at Rs. 64,500 Crores growing at 16% (AIOCD AWACS May 2012).
Most of the players in the market are small-to-medium enterprises, and 250-300 companies in the organized sector control over 70% of the Indian pharmaceutical market. All of the players are fighting out intensively and extensively in the doctors’ chambers to get prescriptions for their brands at a huge cost deploying often desperate practices. On an average, a pharma company spends roughly 10-12 percent of its sales revenues on promotional campaigns.
The hard fought and won brand prescription when elicited from the doctors chambers can be easily lost to a multiple of factors prevailing in the market particularly at the retail level. This loss or leakages of brand prescription can be substantial for both, large brands as well as for the fledgling brands.
Chemists often substitute branded generics for branded drugs prescribed by doctors if approved by both, the prescribers and patients. Only, the substituted product must be therapeutically equivalent to the original product. Any differences in terms of preservatives used between the branded generic and original product has no clinical disadvantage for the patients. Many a time, patients to whom brands are prescribed are unaware that their prescribed brand has more economical alternatives. Considering the trade incentives doled out by pharmaceutical companies, the chemists are motivated to push or substitute the prescriptions coming to their counters. Various factors influence the substitutions at the chemists’ counters.
Presently, we know little about the prescription substitution practices that is happening at the chemist’s level with branded generics, and the profile of patients who are willing to accept such substitutions with the branded generics. This pilot study tries to find out the brand name requests and substitution that is happening across therapeutic class and

sub-therapeutic class, and the demographics of purchasers accepting these substitutions.
2. Rationale of the Study“Prescription substitution by branded generics: a pilot study of live prescriptions in Mumbai suburbs” is important and helpful because of the following reasons;a) To understand the therapeutic and sub-therapeutic group-wise brand prescription requests given by doctors.b) To know the extent of prescription substitution carried out by the retail chemistsc) To understand the profile of purchasers with whom prescription substitution happensd) The study is also helpful to find the actors involved in influencing the prescription substitution e) This study would help to provide an overview to companies to take necessary proactive measures to reduce or
minimize their brand substitution
3. Objectives of the StudyFollowing are the objectives of the study;a) To understand the prevalence of prescription substitution happening at the retail chemist levelb) To identify therapeutic and sub-therapeutic group-wise prescription substitution c) To know the type of prescription substitution happening at the retail leveld) To find out the demographic profile of purchasers with whom prescription substitution was effected
4. Research Methodology4.1 Data CollectionThe data was collected through following sources;
Primary DataThe primary data was collected by first identifying an area in the suburbs of Mumbai, and then, a convenience sampling was done to identify two chemists. This was followed by selecting six Consulting Physicians (CP). The physicians selected were on the basis of convenience sampling, whose prescriptions were predominantly dispensed by the identified two chemists.
To collect the required primary data following tools/techniques of data collection was used. • Live prescriptions of the six selected doctors • Questionnaire for the purchaser of medicines • Interaction with purchasers and field visits
The prescriptions of the CPs were obtained from the patients after the purchase of the medicines has been affected. The actual prescription given to the patients by the doctors were compared with the medicines purchased by the patients for analysing the level of substitution done by the chemists.
A total of 120 new prescriptions generated by the six CPs which were dispensed by the two chemists were analysed over two consecutive days. Repeat purchase of medicines through earlier prescription was excluded from this study. A demographic profiling of the purchaser (need not be the patient) of the medicine was also carried out.
The confidentiality of the involved stake holders viz; doctors, purchaser and retail chemists were strictly maintained.
4.2 Secondary DataSecondary data are essential for structuring and planning the research approach. The secondary data for this research has been collected from; • Research papers published on the subject • Industry and research journals and publications • Magazines, Newspapers and internet
4.3 Data ProcessingThe data collected was systematically processed, classified and tabulated. After tabulation, analysis and interpretation
22
23
was done by using Excel. For the purpose of analysis, interpretation and to summarize the findings, methods and techniques like percentage and graphical charts were used.
4.4 Scope of the studyThe scope of this pilot study is restricted to one specific area in Mumbai suburbs. This live prescription study was made by the researcher for just two consecutive days only. Therefore, the scope of the study is restricted to the said two days only and in the concerned area only. Thus results, inferences and conclusions are related and suitable for that area only, and may or may not be applicable to other areas of Mumbai or any other part of the state or country.
4.5 Limitations of the studyThe pilot study has been done for just two consecutive days involving live prescriptions from small sample size of six Consulting Physicians (CP) and two chemists catering to those prescriptions (some prescriptions of the CPs may not have got captured by the identified chemists). Also, the number of live prescriptions analysed by the researcher is limited to 120. Whatever data collected during the two days was utilised for the study. If there is some variation in the data, then the result and conclusions may not be the same.
All the conclusions are drawn on the basis of the prescriptions given by the CPs and the information provided by the purchasers of the medicines. There may be a possibility of deficiencies in the data collected. However, best efforts have been put to conduct correct and reliable data from the purchasers.
5. Review of Literature• V. Tandon, B. M. Gupta, V. Khajuria in their Research Letter titled “Therapeutic substitution: A hidden irrationality”
published in Indian J Pharmacol June 2004 Vol 36 Issue 3;175-180: indicates drug substitution is done quite often by the pharmacist. This prospective study was carried out for evaluating the patient prescriptions showing drug substitution, generic substitution and therapeutic substitution. The drug prescription substitution was seen across various therapeutic groups. The study reveals drug substitution to be quite prevalent in the society.
• D B Anantha Narayana, Kusum Devi, Asha A N, Nimisha Jain, Uday Bhosale, T Naveen Babu in a Feature Article titled “Report of an all India Quantitative study of Consumer perceptions, availability, role, services provided, medicines and expectations of pharmacists in India.” Published in Pharma Times; have studied in general the extent of brand substitution by chemists by informing the patients, not informing the patients, not substituting at all, and also the reasons for such substitutions.
• Chee Ping Chong, Mohamed Azmi Hassali, Mohd. Baidi Bahari, Asrul Akmal Shafie, in an Original Article titled “Generic medicine substitution practices among community pharmacists: A nationwide study from Malaysia” published in J. Public Health; studied the generic medicine substitution practices among Malaysian community pharmacists. It was found there exist a very high prevalence of generic substitution for the brand name medicine requests. Pharmacists seldom consulted physicians when substituting generics for brand name medicines and the high substitution rate of medicines were seen for both acute and chronic diseases. Both, physicians and patients highly accepted the substitution recommendation and this contributed to significant reduction in patient’s medicines expenditure.
• Reeta Heikkilä, Pekka Mäntyselkä and Riitta Ahonen, in a Research Article titled “Price, familiarity, and availability determine the choice of drug - a population-based survey five years after generic substitution was introduced in Finland” published in BMC Clinical Pharmacology; found that Price, availability, and familiarity were the three most important factors that influenced the choice of medicines. For people who had refused Generic Substitution” (GS), the familiarity of the medicine was the most important factor. For the subjects who had allowed GS and for those who had both refused and allowed GS, price was the most important factor.
• Susana Narciso, in her research paper “Retailing Policies for Generic Medicines’ published in International Journal of Health Care Finance and Economics; agrees that there is general disagreement about the way generic medicines should be commercialized. She discusses two policies. In the first policy scenario, pharmacies are allowed to substitute generic medicines for branded ones, while in the second, substitution is forbidden. However, the policy

24
choice belongs to the government, which prefers to allow for substitution more often than patients would like.
• Gill, Liz; Helkkula, Anu; Cobelli, Nicola; White, Lesley in their paper titled “How do customers and pharmacists experience generic substitution?” published in International Journal of Pharmaceutical and Healthcare Marketing; The paper explores the generic substitution experience of customers and pharmacists in a pharmacy practice setting. The findings show that customers, with poor awareness of generic prescription medicine when offered as a substitute, were likely to become confused and suspicious. Pharmacists related how they felt challenged by having to facilitate generic substitution by educating unaware customers. They also experienced frustration due to the mistrust and annoyance their customers displayed.
6. ResultsDemographics of the purchasers of medicines (Table: 3)At the end of the two day study, responses were obtained from 120 live prescriptions. A total of 2 chemists and 6 Consulting Physicians (CP) were tracked in this study. Two third (75%) of the purchase was made by female. The age group of purchaser of medicine ranged from 16 years to 73 years, with maximum from the 40 to 50 years age group (42/35%) followed by 30 to 40 years group (27/22.5%) and the least purchaser group was from the over 60 years group (3/2.5%).
As regards to the educational background of the purchasers, majority (89/74.2%) were graduates and only 12/10% had attended school. The rest 19/15.8% were post graduates.
Income wise, over 54% (65) of the purchasers were having a monthly income of above forty thousand, 31% (37) with income above twenty thousand and only 6% (7) belonged to an income of less than ten thousand per month.
52.5% (63) of the purchasers were not employed and comprised of either house wives or daily wagers and 6.6% (8) were retired people.
Predominantly, the purchase was made by relatives or others (97/81%) and direct purchase of medicines by the patient himself/herself was only 19% (23).
Overall distribution of prescription prescribed and prescription substituted (Table: 1)120 actual prescriptions with a total of 513 requests for brand name were recorded. Out of the 120 prescriptions surveyed, brand substitution (one or more items substituted) was seen in 63 (52.5%) prescriptions. The surveyed prescriptions revealed brand substitutions by dispensing chemists for 158 brands items (30.8%) out of a total of 513 originally prescribed brands. The maximum number of brand items seen in a single prescription was 8 and the minimum prescribed items was 3.
Brand name requests-Therapeutic class-wise (Table: 2)As a therapeutic class, the maximum brand name requests (out of N=513) were for Musculoskeletal/Fever (136/26.5%) followed by; Antibiotics for systemic use (116/22.6%), GI Tract (68/13.3%), Respiratory system (67/13.1%) and Nutritional Supplements (58/11.3%). The least brand name request was observed in the therapeutic class of Cardiovascular (16/3.1%) and Anti diabetics (12/2.3%) respectively.

25
Brand name requests-Sub-therapeutic class-wise (Table: 2)As a sub-therapeutic class, the maximum brand name requests (out of N=513) were for PPI and Multi-vitamins/Multi-minerals equally at 7.6% (39), Cough & Cold preparations, NSAIDs/Combinations and Penicillin Group/Combination equally at 7% (36). The least request was observed for ACE inhibitors/Combinations 0.2% (1), Other Cardiovasculars 0.2% (1), Beta blockers/Combinations 0.4% (2), DPP4 Inhibitors 0.4% (2) and Insulins 0.4% (2).
Branded generic substitution-Therapeutic class-wise (Table: 2)As a therapeutic class, the highest branded generic substitution was seen in Musculoskeletal/Fever 39 (24.7%) followed by; Antibiotics for systemic use 36 (22.8%), Nutritional supplements 27 (17.1%) and Respiratory system 23 (14.6%). Antidiabetics 1 (0.6%), Cardiovascular 2 (1.3%) and Dermatologicals 8 (5.1%) are the therapeutic class that are least substituted by branded generics.
Branded generic substitution-Therapeutic class-wise
Branded generic substitution-Sub-therapeutic class-wise (Table: 2)In the sub-therapeutic class, the highest branded generic substitution was seen in Paracetamol/Combinations 24 (15.2%) followed by; Multi-vitamins/Multi-minerals 17 (10.8%), Cough & Cold Preparations 15 (9.5%) and Penicillin group/Combination 14 (8.9%).
Branded generic substitution rate-Therapeutic class-wise (Table: 2)The highest rate of substitution was seen in Nutritional supplements (46.6%) followed by Dermatologicals (34.8%), Respiratory system (34.3) and Antibiotics for systemic use (31.0%). The lowest rate of substitution was observed in Antidiabetics (8.3%) and Cardiovasculars (12.5%).
Branded generic substitution rate-Sub-therapeutic class-wise (Table: 2)The rate of substitution was maximum seen in Protein preparations (60%) followed by Antacids, Topical Corticosteroids/Combinations and Haematinics/Combinations each at (50%). The minimum rate of substitution is in the class of DPP4 Inhibitors (2.5%), Macrolides (3.8%), Inhalants (16.7%) and Muscle relaxants (16.7%).
Type of prescription substitution (Table: 4) Total number of brand items substituted in the prescriptions is 158. The prescription substitution was categorised in to three types, namely, Prescription substituted by patients, Prescriptions substituted by chemists and Prescription substituted due to non-availability of the prescribed brand.Prescription substituted by Patients was 61 (38.6%), by Chemists 71 (44.9%) and substitution due to Non-availability was 26 (16.5%).
Type of prescription substitution

26
The maximum number of prescriptions substituted by patients was observed in the therapeutic class of Antibiotics (14/8.9%) followed by Respiratory (13/8.2%) and Nutritional Supplements (12/7.6%).
Prescription substitution by chemists was seen highest in the therapeutic class of Musculoskeletal (24/15.2%) followed by Antibiotics (18/11.4%) and Nutritional Supplements (10/6.3%).
Prescription due to non-availability was maximum in Musculoskeletal/Fever (6/3.8%) followed by Nutritional Supplements (5/3.2%) and Antibiotics (4/2.5%).
Demographic profile of purchasers and prescription substitution effected (Table: 3) Out of a total of 120 purchasers, 1/3rd was male and 2/3rd was female. Prescription substitution was effected with 40% of male purchasers (12/30) and 56.7% of female purchasers (51/90).
Prescription substitution observed in the age group less than 20 years was the least at 37.5% (3/8) followed by 52.4% (22/42) belonging to the age group 21 to 40 years and the maximum substitution of 54.3% (38/70) was seen in the over 40 years age group.
Highest level of prescription substitution of 58.3% (7/12) was seen in people with educational background of attending only up to school level followed by graduates at 55% (49/89) and the substitution was the least in post graduates at 36.8% (7/9).
As regards to prescription substitution happening on account of income level, it was seen maximum 71.4% (5/7) with purchasers who has an income below Rs. 10,000 per month followed by 60.4% (29/48) in the slab of Rs. 10,000 to Rs. 40,000 and the lest substitution 44.6% (29/65) was seen with purchasers who had an income of over Rs. 40,000 per month.
Table: 1 Distribution of prescription prescribed and prescription substituted
Table: 2 Therapeutic and sub-therapeutic group-wise brand name prescribed and substitution effected
Total number of prescriptions captured
Total number of prescriptions in which substitutions occurred
Total number of brand name requests
Total number of substitutions occurred
Max number of brands prescribed in a single prescription
Min number of brands prescribed in a single prescription
120 (100%)
63 (52.5%)
513 (100%)
158 (30.8%)
8
3
N=513Brand NamePrescribedNo. of cases (%)
N=158SubstitutionNo. of cases (%) /Substitution Rate (%)
Antibiotics for systemic useCephalosporin’s/Combinations
Quinolones/CombinationsMacrolidesPenicillin group/Combinations
116 (22.6)32 (6.2)
36 (22.8) / (31.0)13 (8.2) / (40.6)
19 (3.7)29 (5.7)36 (7.0)
5 (3.2) / (26.3)4 (2.5) / (13.8)14 (8.9) / (38.9)

27
Table: 3 Demographics of the person who purchased the medicines from the chemist with the prescription given by the doctor/Prescription substitution effected
67 (13.1)36 (7.0)6 (1.2)18 (3.5)7 (1.4)
23 (14.6) / (34.3)15 (9.5) / (41.7)1 (0.6) / (16.7)5 (3.2) / (27.8)2 (1.3) / (28.6)
Respiratory systemCough & Cold preparationsInhalantsAntihistaminesOthers
68 (13.3)39 (7.6)14 (2.7)15 (2.9)
19 (12.0) / (28.0)9 (5.7) / (23.1)7 (4.4) / (50.0)3 (1.9) / (20.0)
GI tract PPIsAntacidsAntinauseants
136 (26.5)36 (7.0)18 (3.5)82 (16.0)
39 (24.7) / (28.7)12 (7.6) / (33.3)3 (1.9) / (16.7)24 (15.2) / (29.3)
Musculoskeletal/FeverNSAIDs/CombinationsMuscle relaxantsParacetamol/Combinations
23 (4.5)8 (1.6)9 (1.8)6 (1.2)
8 (5.1) / (34.8)2 (1.3) / (25.0)3 (1.9) / (33.3)3 (1.9) / (50.0)
DermatologicalsTopical anti-infectives/CombinationsAntifungalsTopical corticosteroids/Combinations
58 (11.3)39 (7.6)5 (1.0)14 (2.7)
27 (17.1) / (46.6)17 (10.8) / (43.6)3 (1.9) / (60.0)7 (4.4) / (50.0)
Nutritional supplementsMulti vitamins-Multi mineralsProtein preparationsHaematinics/Tonics
12 (2.3)2 (0.4)8 (1.6)2 (0.4)
1 (0.6) / (8.3)-1 (0.6) / (12.5)-
AntidiabeticsInsulinsOHAsDPP4 Inhibitors
16 (3.1)2 (0.4)1 (0.2)3 (0.6)4 (0.8)
2 (1.3) / (12.5)-1 (0.6) / (100.0)--
CardivascularsBeta blockers/CombinationsACE inhibitors/CombinationsCCB/CombinationsARB/Combinations
5 (1.0)1 (0.2)
1 (0.6) / (20.0)-
Lipid lowering agentsOthers
17 (3.3) 3 (1.0) / (17.6)All others
30/1290/51
Income (per month)< 10,00010,000 – 20,00020,000 – 30,00030,000 – 40,00040,000 – 50,000> 50,000
GenderMaleFemale
7/511/816/821/1335/1530/14

28
Table: 4 Type of prescription substitution at the chemist level
8/315/827/1442/2325/143/1
OccupationEmployedUnemployed(Housewife/Daily wages)Retired
Age Group (Years)< 2021 – 3031 – 4041 – 5051 – 60> 60
49/2863/34
8/1
12/789/4919/7
PurchaserPatientRelative
EducationAttended schoolGraduatePost graduate
23/1497/49
N=158Generic SubstitutionNo. of cases (%)
36 (100)14 (38.9)18 (50.0)4 (11.1)
Antibiotics for systemic useSubstitution asked by patientSubstitution done by chemistSubstitution due to non-availability
23 (100)13 ((56.5)8 (34.8)2 (8.7)
Respiratory systemSubstitution asked by patientSubstitution done by chemistSubstitution due to non-availability
19 (100)9 (47.4)8 (42.1)2 (10.5)
GI tract Substitution asked by patientSubstitution done by chemistSubstitution due to non-availability
39 (100)9 (23.1)24 (61.5)6 (15.4)
Musculoskeletal/FeverSubstitution asked by patientSubstitution done by chemistSubstitution due to non-availability
8 (100)2 (25.0)3 (37.5)3 (37.5)
DermatologicalsSubstitution asked by patientSubstitution done by chemistSubstitution due to non-availability
27 (100)12 (44.5)10 (37.0)5 (18.5)
Nutritional supplementsSubstitution asked by patientSubstitution done by chemistSubstitution due to non-availability
1 (100)--1 (100.0)
AntidiabeticsSubstitution asked by patientSubstitution done by chemistSubstitution due to non-availability

29
7. DiscussionDrug substitution by chemists is quite rampant in India and few studies have been carried out on this aspect in the past. When prescription is written for branded product, the chemist must dispense that product only, unless they persuade the doctor to change the prescription. In such situations the chemists can substitute branded generic product for the brand prescribed by the doctor.
Substitution by branded generics is helpful to the patients to reduce their overall therapy cost while treating both acute and chronic ailments. However, such substitution can be potentially harmful when practised without the consent of the doctor and patients.
For pharma companies who spend considerable amount of money to promote their brand, such practices can erode their brand sales and thus, affect profitability. This pilot study has revealed that prescriptions are substituted by both the chemists and the patients. Substitution of prescribed brands by chemists may be due to non-availability of the brands in the chemists’ counters. This can be countered by pharma companies by efficiently managing the distribution channel.
Prescription substitutions can also happen if the chemists are commercially inclined to push more profitable branded generics. Pharma companies can meet this challenge either through bonus offers for the brands or alternatively by introducing low-price fighter brands. Substitution by patients on grounds of cost of therapy is also gaining, and this practice is seen cross all demographics. Owing to low penetration of medical insurance, the cost of medicines is not only pinching the low income but also the purchasers with higher income as observed in this study.
Pharma companies has to keep in mind this emerging trend in the population and should take necessary measures to provide value added services to the end-users (patients) to desensitise the premium price charged for their brands.
Interestingly, despite lack of pharmacy regulation in India, the prescription substitution with branded generics is considerably low compared to developed countries which have adopted generic substitution policy where the substitution rate is over 90%. One possible reason could be to counter the high cost of brands under patents. Also, major cost of medicines in developed country is reimbursed through medical insurance.
However, the findings of this pilot study points to brand substitution in one out of every two prescriptions i.e. 52.5% (one or more brands substituted) and total number of brand substitutions by the chemists was 158 items out of a total of 513 originally prescribed brands. These figures are considerably high and should be of concern to the pharma companies promoting their brands. In the absence of medical insurance coupled with rising cost of medicines, the prescription substitution rate is likely to gain momentum in the future.
Further, chemists substitute brands without informing the physicians. It is interesting to note that 38.6% of the substitutions were asked for by the patients against 44.9% substitutions done by the chemists on their own and substitution due to Non-availability was (16.5%). This shows both; chemists and patients are actively involved in prescription substitutions. Substitution was observed cross all therapeutic groups and sub-therapeutic groups and cross the demographics of the purchasers such as gender, age group, income and education without any exceptions.
From the chemists and patients point of view, there could be various reasons for prescription substitution. This study did not establish all possible reasons for the substitution except non-availability of the brand. The sample size of doctors,
2 (100)1 (50.0)-1 (50.0)
CardiovascularSubstitution asked by patientSubstitution done by chemistSubstitution due to non-availability
3 (100)1 (33.3)-2 (66.7)
All othersSubstitution asked by patientSubstitution done by chemistSubstitution due to non-availability

30
chemists and number of live prescriptions studied were very few and therefore cannot be projected to the population. Also, the spread of samples selected was very limited.
8. ConclusionPrevalence of prescription substitution is fairly high at the retail level and involved most of the therapeutic and sub-therapeutic groups.
Purchasers belonging to both higher income and lower income engaged in prescription substitution. Also, prescription substitution was observed in all age groups of purchasers and in both genders. People who are educated and not so educated also did prescription substitution. Most of the purchasers of medicines were females and most of the actual buyers were relatives of the patients.
Both, the identified chemists and randomly selected patients, actively practised generic substitution for prescribed brands. Patients too solicited for brand substitution possibly to reduce the burden of therapy cost.
Substitution due to non-availability was less compared to substitution done by chemists and patients. However, neither the chemists nor the patients took consent from the prescribers before substitution of brands. The chemists are benefitted by generic substitution and consider substitution by branded generics is an acceptable practice. The patients too, possibly, wanted substitution to significantly reduce their cost of medicines.
9. References1. V. Tandon, B. M. Gupta, V. Khajuria in their Research Letter titled “Therapeutic substitution: A hidden irrationality”
published in Indian J Pharmacol June 2004 Vol 36 Issue 3;175-180. 2. D B Anantha Narayana, Kusum Devi, Asha A N, Nimisha Jain, Uday Bhosale, T Naveen Babu in a Feature Article
titled “Report of an all India Quantitative study of Consumer perceptions, availability, role, services provided, medicines and expectations of pharmacists in India.” Published in Pharma Times - Vol. 43 - No. 08 - August 2011.
3. Chee Ping Chong, Mohamed Azmi Hassali, Mohd. Baidi Bahari, Asrul Akmal Shafie, in an Original Article titled “Generic medicine substitution practices among community pharmacists: A nationwide study from Malaysia” published in J. Public Health; 2011(19): 81-90.
4. Reeta Heikkilä, Pekka Mäntyselkä and Riitta Ahonen, in a Research Article titled “Price, familiarity, and availability determine the choice of drug - a population-based survey five years after generic substitution was introduced in Finland” published in BMC Clinical Pharmacology 2011, 11:20.
5. Susana Narciso, in her research paper “Retailing Policies for Generic Medicines’ published in International Journal of Health Care Finance and Economics, 5, 165–190, 2005.
6. Gill, Liz; Helkkula, Anu; Cobelli, Nicola; White, Lesley in their paper titled “How do customers and pharmacists experience generic substitution?” published in International Journal of Pharmaceutical and Healthcare Marketing : 4. 4 (2010): 375-395.
7. Hess J and Litalien S. Battle for the market: branded drug companies’ secret weapons generic drug makers must know. J Gen Med 2005; 3(1): 20–29.
8. McGavock H. Generic substitution: issues relating to the Australian experience. Pharmaco epidemiol Drug Saf 2001;10(6): 555–556.
Authored byHari Kumar Iyer,
SVKM’s NMIMS, School of Business
Dr. Nilesh Berad, MET, Nashik

31
Employee and Employee Engagement
Human Resource Management (HRM), in a broader perspective, is handling the employees as an essential part of the organization’s capital. It revolves around strategically analysing the job profiles and creating an environment that motivates the employees to increase their productivity and loyalty to the organization. The Human Resources field evolved first in 18th century Europe from a simple idea by Robert Owen and Charles Babbage during the industrial revolution. These men knew that people were crucial to the success of an organization. They expressed that the well-being of employees led to perfect work. Without healthy workers, the organization would not survive. HR later emerged as a specific field in the early 20th century, influenced by Frederick Winslow Taylor. Taylor explored what he termed "scientific management" (others later referred to "Taylorism"), striving to improve economic efficiency in manufacturing jobs. He eventually zeroed in on one of the principal inputs into the manufacturing process – labour – sparking inquiry into workforce productivity.
According to Dave Ulrich, the functions of HR are: Aligning HR and Business strategy, Re-engineering Organization Processes, Listening and Responding to Employees, and Managing Transformation and Change. Over the years, HRM has evolved way more than merely being the department that handles ‘hiring and firing’; it has now become an important aspect to be considered when an organization is having a vision of growing and empowering.
The size of the HR Department, naturally, depends on the number of employees and the size of the organization, the standard benchmark being, 1 HR Manager per 100 Employees. Typically, the HR Department of organizations has the following verticals, and the functions are highly inter-linked when compared wholly:
Hu
ma
n R
eso
urc
e D
ep
art
me
nt
Talent Acquisition
Job Analysts & Manpower Planning
Performance Management
Learning, Training and Development
Employee Engagement
Compliance, Policy and Industrial Relations

32
Current trends in HRMGlobalization and Technological Advancements are the two things that have affected the business lines in a significant way. While business lines are affected, so are the people, i.e. the employees and hence the department that takes care of all employee related aspects i.e. Human Resources. These advancements are also one of the reasons why HR as a ‘department’ has grown to become a crucial part of an organization. There has been a major shift in practices related to the HRD of organizations, listed as follows:• Globalization: With the ease of access to neighbouring and far-off countries, political and economic reforms, every
country has attracted numerous foreign organizations and also set up their bases in other countries. Mass-scale development plans, mergers and acquisition deals have been implemented that have given rise to enormous possibilities in the management of people.
• Diversity Management: Businesses today are no longer a single country / parent country affair. They have grown in every way and so has the diversity of people. Diversity in terms of cross-culture jobs, changing male-female ratios, generations working together in an organization, diversity of every kind has to be handled in an effective way to ensure smooth running of the business processes.
• Technology: The advancements in technology have been rather swift. It has been a boon to the organizations, but the bane to the pool of candidates, since more and more tasks can be automated.
• Increased Employee Involvement: The times have changed and there is an increasing awareness among the top level managers of the fact that people are the most important aspect of any organization, followed by processes and profits. Hence, there has been a sharp rise in Employee Involvement, and Employee Enhancement practices since the last 4-5 decades.
• On Contractual Basis: These are common words that are tagged along while any job requirement is posted these days. This tactic is simply an outcome of contingent workforce plan which means that the employees are hired on contract basis of 6 months to 2 years, and not as ‘full-time’ employees of the organization. This practice was implemented mainly to downsize the number of employees from the compensation procedures of the organization and also to have a vivid workforce in definite time periods.
• Virtual Organizations: In a virtual organization, the employees are geographically apart from each other, but with the use of technological communication tools, they work as a team to drive the business ahead. This is another aspect where the HRD has to work diligently to develop compliance rules and employee relations for the virtual teams.
• Work-Life Balance: An important aspect of having ‘happy’ employees is to set up a work-culture that promotes work-life balance, i.e. equal time for work and family / leisure. It is necessary that the employee is as fit mentally as he / she is physically to be motivated by self to align their achievements in line with the organization’s vision and mission.
Employee Engagement“There was a great deal of talk of the sequence of the 3 P’s – People, Products and Profits – It was decided that People should absolutely come first.”- Donald Petersen (Over 40 years with Ford and its CEO from 1985-1990)
Employee Engagement, in simple words, is an approach practised by organizations to instill a motivating work-culture so that the employees are committed to the organization’s goals and values, with an enhanced sense of their own well-being.
Employee Engagement is based on two-way commitment i.e. between the employee and the employer. It is an approach that increases the chances of business success, contributing to organisational and individual performance, productivity and well-being which can be measured and nurtured.
While discussing Employee Engagement, Gallup’s Employee Engagement Model, a theory that till date captures the essence of the importance of employee engagement assumes importance:

In the pie-chart above, 27% Employees are highly engaged and aligned to the processes of the organization, naturally, they are better at their productivity and are the ‘safe-bets’ of an organization. Followed by the 27% Employees who are highly disengaged, these are the employees who are difficult to get in-line with the culture of the organization and hence, their productivity levels are unreliable. But, Gallup suggests that the most threatening (potentially risky) of the lot of the employees are the 46% of those who are neither engaged nor disengaged. These employees need to be involved in such a way that slowly and steadily they incline towards the ‘Highly / Actively Engaged’ Group.
This theory succinctly explains the concept of ‘Employee Engagement’ which is all about, holding on to good employees and making a culture that makes good employees better.
Current trends of Employee EngagementThe trends in Employee Engagement have changed over the years, from being a non-existent part of the HRD to being a crucial one; employee engagement is growing and will grow slowly and steadily. The following are the trends and tactics used as a part of an organization’s Employee Engagement Practices:
33
EMPLOYEE
ENGAGEMENT
1) Performance
Progress
Frequent
Feedbacks
Reviews
2) Motivation
Sense of Purpose
Extrinsic
Intrinsic
3) Culture
Alignment
Team
Dept.
Cross-
Functional
Transparency
With Core
Mission,
Vision &
Values
4) Work-Life
Balance Flexibility
Job
SecurityTimings
Leave Policies
5) Benefits
Perks
Monetary
Work-
Space
Resource
Allocation
Health
BenefitsFamily
Benefit
Plans
Trips /
Vacations
Vouchers
6) Corporate-
Social
Responsibility
7) Performance
Improvement
Plans
In
Accordance
with L&D
Dept. and
PMS Dept.

34
The above mind-map shows a detailed overview of the best employee engagement practices in the industry. Every organization uses all of these methods and tools or a combination of these, and improvises on it constantly based on the feedback they receive.
Purpose of ProjectEmployee Engagement is a rising vertical of Human Resource Management as a tool to bridge the gap between the employee attrition and talent availability. Employee Engagement essentially helps in retaining the existing employees and to ‘brand’ the organization’s people practices in such a way that there are more and more employees willing to work for the organization.
The purpose of this project is to understand the impact of employee engagement activities on the employees of organizations in the 6 largest and growing industry sectors, namely: • Consumer Durables • Financial Services • Telecommunications • Education • Hospitality • Media
The extent to which these employee engagement activities affect the employees can help in drawing inferences about the various activities that could be improvised upon where-as the suggestions could help in adding of certain activities, to view the impact of employee engagement through the perspective of the employees since they are the primary beneficiaries of these activities.
This Employee Engagement Analysis will also throw light on verticals related to it, such as attrition analysis, competitive industry practices, employee satisfaction levels, employer branding impact and the extent of attracting a talent pool.
The target group of employees were not only from the 6 sectors listed above but also those of varying managerial levels, of various departments in an organization so that there is a more refined look at employee engagement perspectives of employees from all backgrounds, i.e., it includes a diverse look-out on employee engagement practices and their respective impact.
Through the survey that was independently carried out, and the analysis done, this study will add immense amount of varied industry specific knowledge and enhance skill-sets related to the employee engagement vertical of HRM.
Research MethodologyThe Research Methodology for “Evaluation of Employee Engagement as a determining factor to develop the Corporate Human Capital” employed was as follows:
1. Population = Employees of 6 Industry Sectors • Consumer Durables • Financial Services • Telecommunications • Education • Hospitality • Media & Entertainment2. Sample Frame = 11 Employees from each of the above sectors (of various managerial levels)3. Sample Size = 664. Method of Collecting Data = Questionnaire5. Analysis of Data Obtained6. Inferences

35
Note: * Questionnaire and the justification of asking specific questions to the respondents on next page.
** The name of the respondent employee’s organization is kept confidential since they agreed to take the survey only if the organization they belonged to was not published on any platform. However, the respondents have provided the information about the sector and their designations in the organization that they are working in.
Questionnaire 1. Since how long have you been associated with your current organization?
2. How many times have you been promoted in your tenure with the current organization?
3. On a scale of 1 – 10, how ‘Happy and Contended’ are you with your current job?
4. On a scale of 1 – 10, rate the ‘Work-Life Balance’ of your current job?
5. From the following 7 options, give each aspect of ‘Employee Engagement’ a rank from 1 to 7 (1 being the highest, 7 being the lowest) to the option that gives you the maximum ‘motivation’ to work better:
a. Career Growth Aspects b. Work-Life Balance c. Salary and Benefits d. Work-Culture e. Employee Bonding, Transparency f . Flexible Policies g. Infrastructural Amenities
< 1 Yr. 1 – 3 Yrs. 3 – 5 Yrs. 5 – 7 Yrs. 7 – 9 Yrs. 10 + Yrs.
The reason this question was asked was to get a direct insight into the number of years the employee has spent in an organization which gives us an initial understanding about how well the employee is retained in the organization
1 2 3 4 5 or more
When an employee is promoted, the data about how many times he / she is promoted can be linked to the succession or career planning roles that the employer is taking and to measure the employees growth
The employees happiness and contentment value have a direct co-relation with the ways in which the employer has developed the work-culture so that the employees feel welcome to work even after months/years of service
Work-Life Balance has been a major aspect of various researches about the over-all employee well-being, hence when the employee will gives it a score between 1-10, we can get a direct understanding about the measures taken by the employer to realise the importance of work-life balance for its employees’ well-being in the long-run

36
6. Do you feel ‘valued’ at work?
7. How frequently do you receive recognition from your supervisor / boss (apart from official rewards and recognitions)?
8. Were you given any leadership roles which also included employees who were senior to you?
9. What kind of measures does your organization take in order to 'improve' an employee's performance? (Tick all that apply)
The above seven options capture an over-all view of the outcomes of various employee engagement activities that the employer administers – when the employees are asked to rank the options, we can get a clear insight as to how the employees ‘perceive’ these activities as measures for their over-all betterment and for retaining the existing pool of talent as well attracting new potential candidates to create a productive work culture (which is one of the biggest motives of employee engagement and performance management activities)
Frequently Occasionally Rarely
Receiving recognition is one of the biggest motivators for being more efficient at work and it also implies the fact that the employee is recognized and valued for his/her contribution to the organization with a positive outlook towards the career growth that the employee has the potential to accomplish
Being valued at work is directly related to the ‘trust’ that the employer has put into the employee to be able to contribute well to the organization. When the employee feels valued and respected at work, he/she will be more motivated to achieve the tasks he/she has been assigned
Yes No
Yes No
Giving leadership roles to the employee for certain projects that include the employees who are senior to him/her in position gives us an understanding about the level of ‘transparency’ and ‘equity’ that all the employees are entitled to in an organization, and it also implies the amount employee empowering activities the organization carries out
Change in Projects /Responsibilities
Performance ImprovementPlans
Training for added skills
Motivate You and SetAchievable Expectations
Two-Way Feedback / Reviews Collaborative / Team-basedProblem Solving
Improving the employees’ performance through various activities as stated above, we can get a clear insight as to how the employers are taking up the responsibility of improving under-performers and also improving the performers to become better at their KRAs and KPIs that need to be achieved
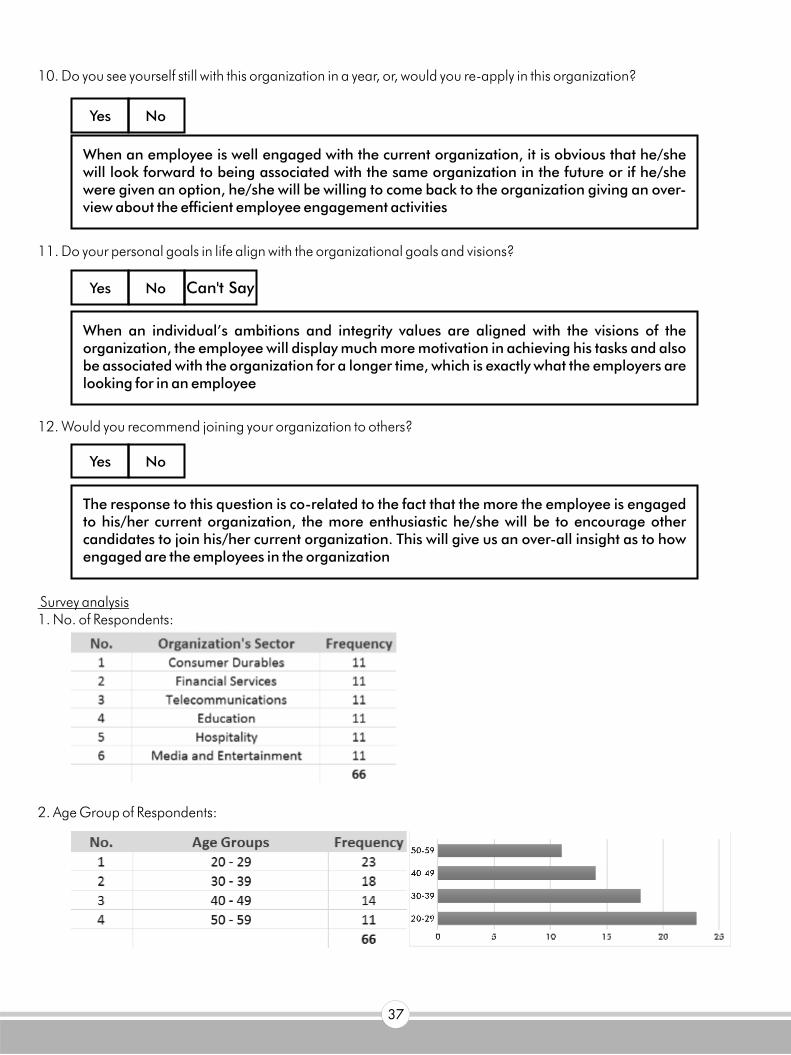
37
10. Do you see yourself still with this organization in a year, or, would you re-apply in this organization?
11. Do your personal goals in life align with the organizational goals and visions?
12. Would you recommend joining your organization to others?
Survey analysis1. No. of Respondents:
2. Age Group of Respondents:
When an employee is well engaged with the current organization, it is obvious that he/she will look forward to being associated with the same organization in the future or if he/she were given an option, he/she will be willing to come back to the organization giving an over-view about the efficient employee engagement activities
Yes No
Yes No Can't Say
When an individual’s ambitions and integrity values are aligned with the visions of the organization, the employee will display much more motivation in achieving his tasks and also be associated with the organization for a longer time, which is exactly what the employers are looking for in an employee
Yes No
The response to this question is co-related to the fact that the more the employee is engaged to his/her current organization, the more enthusiastic he/she will be to encourage other candidates to join his/her current organization. This will give us an over-all insight as to how engaged are the employees in the organization

3. Designations/Departments of the Respondents:
4. Tenure in the Organization:
• From the chart above, maximum respondents have been with one organization for a tenure of < 1 year to 3 years• This may be in case of entry level employees as well as experienced employees who have just switched their
organizations
5. No. of times promoted in the tenure with the organization:
• From the chart above, maximum of the respondents have been promoted once in their tenure with the organization, followed by twice and so on• The data above can be co-related with the tenure, since the number of employees being in an organization for < 1
Year – 3 Years is 46; hence they will be promoted at least once in their respective organization• This gives an insight about the fact that every organization has considerable employee development plans in place
so that every employee rises in his/her career
6. Scores from 1-10 on being ‘Happy & Contended’with the Organization:
38

39
• The parameter chosen above is completely based on ‘human emotion’ – basically how the employees feel about their organization, which is directly related to the measures taken by the employer towards employee well-being
• The measurement of being happy and contended also tells us about how the employees feel about their job role and the responsibilities. If they were not satisfied with the same, they would definitely be unhappy and detached.
• Percentages: o More than 50% (57% to be precise) of the respondents have rated their happiness and contentment quotient from
7 – 9 points out of 10 o 33% employees have given a score of 4 – 6 points out of 10 on their happiness and contentment quotient o 6% in the range from 1 – 3 out of 10 about being happy and contended o Only 3% have rated their organization a full 10/10 in terms of this parameter
7. Scores from 1-10 on the ‘Work-Life Balance’ of the Organization:
• The scores that the employees give to the Work-Life Balance that they have in the organization gives insight into the degree to which the employer / organization is employee-friendly, whether they have policies in-line with the betterment of work conditions for the employees or not
• The employers should conduct surveys on the employees work-life balance repetitively to ensure a productive work environment along with more employee retention, all of which is beneficial to the employer
• Maximum of the respondents, i.e. 30/66 are satisfied with the work-life balance, followed by those who feel the work-life balance is average i.e. 26/66
• An insight into the employees work-life balance perception gives an idea about the efficiency with which the employer has allotted job roles and job descriptions so that there is equity and equality in the work provided – too many responsibilities to one employee as against lesser responsibilities to another employee, both having same designation
The parameters below give a detailed insight about how the employees perceive the various employee engagement activities and their respective ranking based on importance that the parameters have:
8. Ranking of Employee Engagement Activities by the Employees: The following is a list of the employee engagement activities that the organization implements. The respondents were asked to rank these activities / policies from 1 to 7 (1 being the highest) on the basis that they feel is the most important activity of employee engagement which motivates them to stay in the organization and most importantly, work to their fullest potential
a. Career Growth and Future Aspects: b. Work-Life Balance:

40
c. Salary and Benefits: d. Work-Culture:
e. Employee Bonding-Transparency: f. Flexibility Policies:
g. Infrastructural Amenities:
The frequencies of ranks are now plotted in a collated graph which will give an over-all insight about the rankings of the employee engagement activities that motivate an employee:

41
• In Majority of respondents have ranked the following parameters from 1-7:
• The rankings above show that more than salary and benefits, the employees are inclined towards having a balanced work-life, healthy work culture and future prospects of growth
9. Being Valued at Work:
• Being valued at work means the employee’s contribution is being rightly put to effective use and it adds to the over-all productivity of the organization as a whole
• The significance of this parameter leads to having efficient cross-functional teams so that each and every department is related and in-line with the organizational goals
10. Receiving Recognition at Work:
• Recognition, apart from the usual rewards and recognition, is a very effective motivational tool for the employees to understand their potential and also to self-improve themselves in their potential talents
• Recognition from their peers/colleagues or seniors and even super-seniors has a positive boost on the employee and eventually motivates others also to work to those performance standards
11. Given leadership roles with seniors also in the team:
• Leadership roles empower the employees and such projects enable them to take on more responsibilities, through which the senior managers can recognize the succession plans for the respective employee, which is a very important

42
aspect to keep in mind when the organization has learning and development as well as performance management policies in place
• Giving an employee certain leadership roles which has seniors also working under or along with the employees, is a very effective tool to inculcate transparency and added creativity to the organization
• About 53% of the employees are given such leadership roles, which may be when the employee has spent about 3 – 5 years or more with the organization, as against 47% of the employees getting leadership roles but not with a senior working under or along-side the employee
12. Measures for Improving Employee Performance:
• The data above is given individual frequency since every organization has one or more than one ways to improve an employee’s performance
• Most of the organizations have set guidelines for specific under-performers through the PIP i.e. Performance Improvement Plans. Few of the employees are given team-based tasks rather than individual tasks, and most importantly, there are policies for employee training and development that are set every year based on the employee performance appraisal
• Improving employee performance as against laying them off, is financially beneficial to the organization since the cost of hiring new employees and exiting the employees is saved in the process
13. Willingness of the employee(s) to continue working after 1 Year or reapply in the same organization:
• When the employees are willing to continue in the organization for a year, the employers will get insights into two main things: how effectively the employee is ‘engaged’ or ‘attached’ to the organization, and the attrition rate for the coming year so that manpower can be planned accordingly
• 44 out of 66 employees, i.e. 67% of the employees who took the survey are engaged with their current employer and 33% are disengaged. Now the employer has to further segregate the 33% employees into those employees who have potential to ‘add’ to the organization and those who don’t, so that employee development plans can be initiated on those lines
14. Employees’ Personal Goals aligned with Organization’s Goals & Visions:
• When the employees’ personal career goals are aligned with / parallel to the organizational goals, there is more sense of responsibility towards the employer, added productivity, performing more efficiently even with added responsibilities and above all, the employees are retained in the organization for a longer duration as against those who aren’t aligned with the organization
• The extent to which the employees are aligned or the number of employees who are aligned with the organization is a direct indicator of the fact that the employee engagement policies are having a positive impact on the employees with a bigger picture in mind of retaining employees as well as nurturing leaders for tomorrow

15. Will the employee recommend his/ her current organization to others?
Inferences
43
No.EmployeeEngagement Activity
Inference(s)
1. Promoting Employees• When an employee has a tenure of 0 – 3 Years, he/she willat least be promoted once in that tenure, followed by morepromotions based on performance• The promotion activity gives an insight about the fact that the organization is taking measures for employee development and succession planning so that the employees are aware of their growth opportunities
• When the employees are in a mentally happy state, they will look forward to coming to work every day and take more responsibilities to finish tasks in time• If the employees are contented with the work they do, they will ensure that they are self-motivated to perform to their fullest potential to the tasks assigned
Happiness andContentment Quotient
2.
• Having a work-life balance and policies that are employee friendly gives them positive reaffirmation that the employer is looking after them effectively in return of the service that they provide • Work-life balance along with ‘office-perks’ make them more inclined to the organization and work more effectively in the long-run
Work-Life Balance3.
• When the organization has an effective succession plan for the employee and the employee is involved in these decisions, he/she will stay with the organization for a longer duration• If the employee has faith that there are immense growth opportunities, he/she will work more productively to prove themselves and make the most of the development and succession plans that the organization has set
Career Growth/Future Aspects
4.
• Though this aspect is a part of Employee Compensation & Benefits and Performance Management, it is a very crucial aspect of employee engagement also, since money is one of the biggest motivators for employee productivity• Employees have ranked Salary and Benefits lower then Career Growth Aspects and Work-Life Balance, which means that employees of the 21st Century are no longer just inclined to money, but are looking for something more from the employers for their over-all development
Salary and Benefits5.

44
ConclusionEmployee Engagement is essentially about how the employer is making the organization more and more employee-friendly. It begins with the premise that the senior / top management should inculcate in the organization’s values: ‘Employees come first’. An ‘engaged employee’ is defined as one who is fully absorbed by and enthusiastic about his / her work and so takes positive action to further the organization's reputation and interests.
From the survey, its analysis and respective inferences depicted above, it is clear that employee engagement has become a crucial activity of utmost importance since attracting, developing and retaining the employees ensures that
• Having a positive, performance-driven, team-building and growth inculcating work-culture has immense impact on the extent to which employees are engaged with the organization• It is directly co-related to retainment of employees since they naturally look forward to giving more of their potential to the organization
Work-Culture6.
• This aspect is more inclined towards an employee and his supervisor’s behaviour as against employee-employee behaviour, i.e. the more the openness in communication among the employees, more the ease of work• The employees will not be uncomfortable with sharing their ideas, reviews in front of all other employees. Though this may seem like a minute aspect but inculcating the idea of ‘open-door policy’ has immense impact on having a performance driven culture
Employee Bonding/Transparency
7.
• As experts have always maintained, even a small appreciation towards the employee’s work can drive the employee to either become better at his/her work or be consistent with his/her performance • Being valued and being recognized positively re-enforces the employee’s belief that he/she is ‘counted’ in the organization and is doing his/her bit to take the organization forward
Being Valued at Work andReceiving Recognition
8.
• Giving an employee tasks and responsibilities which involve leading and developing a team will make him/her more responsible and ready for further promotions• When employees are developed in such a way, it reduces the employers liability of hiring leader positions from outside which is often costly for them
Leadership Roles Given9.
• This aspect would be covered under the learning and development policies of the organization, but making the employees aware of the fact that the employer is taking measures to enhance the performance of an employee, and even underperforming employees will make them more inclined to the organization and there will be reduction in the employee-turnover rate as well
Enhancing EmployeePerformance
10.
• The perks and the facilities which are inclined towards employee well-being might seem like a small aspect but in the end has a lot of impact on the engagement levels of an employee• If the employee is provided with amenities which ‘ease’ his/her performance, he/she can perform more productively in the set time which itself is beneficial to the organization
Flexibility Policies andInfrastructural Amenities
11.

the employees work to their fullest potential which is further beneficial to the organizations’ productivity in terms of growth as well as revenue generation, apart from long-term sustainability.
In today’s Corporate World, of the 21st Century, money has lost the race into being #1 in employee motivation methods. It is topped by the career growth aspects in the work-culture or work-life balance that the organization has to offer to the employees, then followed by compensation and benefits, in the employee engagement activities taken into consideration for this analytical study.
The most impactful drivers of employee engagement are: • Employee’s perception of the importance of the job and his/her value in the organization as well as the alignment of
personal goals of an employee with the over-all vision and goals of the organization • Transparency between the employee-employee, employee-supervisor for free and effective communication and
also setting the performance expectations in better manner so that the employee is motivated to perform on those lines• Career advancement opportunities, succession planning and promotion plans along with a clear and equal set of
roles and responsibilities given to the employees holding similar designation(s) • The type of bonding and relationships among all the employees and the work-life balance that the organization has inculcated• Work-culture includes the quality of the values incorporated and acceptable behavioural aspects of the organization
If all the employee engagement activities aligned well, then the employee will look forward to being associated with the organization even after a year/years, re-apply in the same organization and also recommend working in his/her organization to others.
All the activities of Human Resource Management are directly or indirectly, in some or the other way, co-related to employee engagement and hence, having an idea of the degree of how engaged are the employees will have immense impact on the organization.
Bibliography• Gallup’s Surveys on Employees and Employers• ‘What engages the employees the most?’ – Ivey Business Journal• Employee Engagement Articles – Harvard Business Review• Meaning of Employee Engagement – Industrial Psychology aspects • Employee Engagement in Theory and Practice – Routledge• Other articles and books from MET’s Institute of Management’s Library
Authored by Mentored byBinal Chitroda Prof. Arun Patil MET, MMS – HR Specialization MET, MUMBAI
45

46
Affordable Housing and Indian Realty Sector
AbstractThe concept of affordable housing is now going to lead from the front. In fact this is a sunshine industry for the next ten years giving stabilisation to Indian economy. After a wait of several years, the government has finally awarded infrastructural status to this largely-neglected affordable housing sector, which is encouraging for developers. Infrastructure status will ensure easier access to institutional credit and help in reducing developers’ cost of borrowing for affordable projects. There will be technological investments in CRM technology but it also needs investments in human talent through a role of relationship marketing is the belief of this research team. And this goes beyond the needs of just CRM technology. Further the Union Budget 2017-18 was also announced with the theme of Transform, Energise and Clean India (TEC), but this can be a reality in the affordable housing segment only with planning for structured rural growth, and urbanisation is an important thought that the authors will like to convey to the readers which in turn point towards conducting engaging conversations across stakeholders which this relationship marketing role can easily implement.
In order to make this a reality, the sector needs few relationship marketing skills sets that will galvanise this domain by contributing to the seamless operations between developers, financial institutions, policy makers and the market. The common thread that runs through these stakeholders would be professionalism and a strong belief in the concept of affordable housing and nation building.
KeywordsRelationship Marketing, Affordable housing, Urbanisation, Finance, home economics and reasons for home purchase.
Background“The Indian Realty Sector has seen the below major developments in the recent past.1. Government Initiatives in affordable housing: The mandate is housing for all by 2022 and creation of 100 smart
cities in India.2. Infusion of Private equity: There are a lot of foreign investors who are showing interest in the Indian reality sector and
additionally it is also observed that the private sector builders are looking at this sector with greater interest.3. Emergence of the Real Estate (Regulation and Development) Act, 2016: This is focused on registration and
tribunals. But in the process the endeavour is to bring in transparency so that the market is benefitted.4. Emergence of REIT – Real estate Investment Trust: This too is an initiative to build transparency in information about
projects that the builder has taken up.
The above factors will be contributing to the expansion of scope and opportunity for the real estate players and are also contributing to an organized approach for conducting business in this sector”.
It is also felt that adherence to law and corporate ethics will be the order of the day and customer centricity and project execution efficiencies will only be improving in the sector. These observations are mentioned in the paper Trends in Indian Realty Sector: A CRM Framework for a Real Estate Entities in the Changing Environment written by Ramprakash Kona Deputy Vice President, Lodha Group, Mumbai, Maharashtra, India, S. S. Prasada Rao Professor, Dean and Director, HBS, GITAM University, Telangana, India, Dr. U. Devi Prasad Associate Professor, HBS, GITAM University, Telangana, India ISSN 2278 – 0211 (Online).
Housing, Rural growth and Urbanisation reveal a nation’s economic growth and social wellbeing. India’s urban population is steadily growing at an average 2.1% every year since 2015. It is likely to reach 60 crore by 2031 (up from 37.7 crore today). But the growth in housing has been unable to keep pace. Currently, the housing shortage in India is close to 1.9 crore units. The economically weaker sections (EWSs) and lower-income groups (LIGs) account for 96% of the urban shortage when it comes to housing and living solutions

47
(Source:https://economictimes.indiatimes.com/wealth/real-estate/why-is-everyone-talking-about-affordable-housing/articleshow/57768759.cms).
The rural economies are also moving from only farm dependent incomes to non-farm incomes leading to a growth in rural consumer’s aspirations. It is here that the concept of affordable housing started playing a sensitive role in Indian economy.
The Government of India has recognised this need and has decided to actively fill the gap in urban and rural housing. Large-scale housing projects that are affordable are therefore sure to get help from government. To that effect the government has announced an ambitious project that seeks to provide ‘Housing for All by 2020’. There were many initiatives in the past around this idea but this time round the government has actively taken many structural initiatives to make this a reality. For example:• It facilitated a 4% interest rate rebate on housing loans of up to Rs 9 lakh. The rebate stands at 3% on loans up to Rs
12 lakh.• Developers will also get a year’s time to pay tax on notional rental income on completed but unsold units.• The tenure for long-term capital gains for affordable housing has come down too. The new tenure is two years, as
against the earlier three.• Besides, the government granted infrastructural status to affordable housing. (Source:https://economictimes.indiatimes.com/wealth/real-estate/why-is-everyone-talking-about-affordable-housing/articleshow/57768759.cms).
The spate of these initiatives has given the boost to developers and the segment has become interesting and attractive. This segment had been languishing on account of luxury and premium housing for the last few years and there was a lot of negativity around this segment. But these initiatives and a severe blow from demonetisation to the reality sector and the premium housing segment has led to generating interest in affordable housing segment as it was observed that these projects offered stable new source of revenue streams. It has also boosted the confidence and goodwill of real estate developers because they can now participate in the economy by creating stable human communities by providing housing solutions. Many private players therefore are now undertaking affordable projects with a lot of pride and sense of fairness.
This is a move away and complete departure from the year 2009 (post the global economic crisis). Back then, developers had no choice but to turn to cheaper housing because financial crisis had confronted a lot of sectors. The reasons then were a severe liquidity crunch and muted demand. The aftermath of the crisis although led to the emergence of the concept of ‘affordable housing’ it did not take the leading position in driving the economy since affordable housing projects had their own set of challenges such as ambiguous rules, EMI DEFAULT, etc. The challenges also included the lack of land and high construction costs making the house economics very challenging. There was also an unfavourable tax environment then. But the recent focus of government on affordable housing is moving these bottlenecks and paving a way for this segment to flourish at least for next decade.
Further the availability of cheap finance is also driving demand as well. The home loan market in India consists of 76 lenders. These include state-run banks, private banks, and housing finance companies (HFCs)(Source:https://economictimes.indiatimes.com/wealth/real-estate/why-is-everyone-talking-about-affordable-housing/articleshow/57768759.cms).
All these are trying to woo the customers across strata of the society. The Indian consumer himself is very conscious about home purchase on ownership. On this backdrop the role of relationship marketer is envisaged.
Relationship MarketingThese contemplations made above and the survey initiated by the researcher team in the Mumbai market points towards the role of relationship marketing to drive the success story in the realm of affordable housing segment. This role of relationship marketing is in the developers side, making inroads with engaging conversations with other important organisations such as government, utilities providers and especially with the financial institutions whether it

is banks or micro finance organizations because these are the organizations that will structure and facilitate the economics of home purchase. The role of relationship marketer is developed on the foundation of primary research data.
The Survey set- up:The survey was set up in Mumbai since this city is also in the list of top hundred smart cities. The objective was to find out aspirations of the market beyond size, price and affordability of the house purchase which gets broadly defined by income levels. The quantitative survey was set up 2016.
1009 intending home purchasers were met in this research. Out of these 1009 respondents, 245 respondents i.e. 24% own a home and are now intending to buy a new home mostly for own living purpose, so they are second time purchasers of homes in Mumbai.
The Findings:Here a comparison of reasons/triggers of purchase is presented as the first pointer towards this role of relationship marketing. The top five reasons of these 245 respondents: who have bought the house and again wish to buy new home and all the 1009 respondents who wish to buy new/own house are similar:
The above mentioned reasons are ranked in the order of the priority giving the importance of the parameters in their lives when buying a home. Most of the parameters have dropped in its importance or are at par barring “Availability of social amenities such as schools, hospitals” where the intensity of prioritisation has gone up significantly by 19 points clearly highlighting the role of education and medical care in the lives of home purchasers making home purchase a living solution and not just a random purchase. This reality calls for a development of a holistic solution that has not just homes, but also has schools, hospitals, playgrounds etc. which brings in the role of setting up engaging conversations with school authorities, hospitals, municipal council members etc. to help develop the properties on the land parcel.
Further when these 245 respondents were asked about the method of financing their first home purchase following financing structure emerged:
But in case of new purchase of homes clearly the intention of 100% of home buyers is to look at mortgage giving way to the role of financial institution. This too is indicative of this new role of Relationship Marketing on the developer’s side given the fact that affordable housing solutions need to be structured and customised for selling to every unique buyer by understanding his true motivations to purchase a new home.
48
Total
Total
Figs in %
Base
245
1009
Fits into my budget as per my income
65
57
Good investment Option for my money
54
47
Proximity to my work place
45
48
Most affordable option with respect to price
34
37
Availability of social amenities such as schools, hospitals
27
46
Total
Figs in %
BASE
245
100% own funds
16
Some own funds and some relatives 31
Some own funds and about 20% loan from financial institution
21 Some own funds and about 20-50% loan from financial institution
21
Som 80% loan from financial institutione own funds and about 50-
10
Don’t Know /Can’t Say
2

Thus role for financial institution is clearly seen as nobody is ready to invest own funds into this buy decision.
To make the situation further complex it is observed that the market has many new entrants who are crowding the financial space, but HFCs are dominating it in Indian financial markets especially in this segment of housing. They continue to score over their traditional banking counterparts. “HFCs are focussing on middle-class and aspiring lower-middle-class borrowers. They lend to people with an annual income that ranges from Rs 2 lakh to Rs 10 lakh. Leading HFCs are now offering tailor-made affordable housing schemes at 8.5–9%. Borrowers can get a higher loan-to-value (LTV) ratio as well. They can avail up to 85% for housing units that are ready or nearing completion”. (Source:https://economictimes.indiatimes.com/wealth/real-estate/why-is-everyone-talking-about-affordable-housing/articleshow/57768759.cms).
So there is an ecosystem that is getting built and a role of relationship manager can be only more apt at this juncture because market also is looking at dealing with loan financing, looking at living solutions more in their quest of owning their dream homes.
To Conclude:The role of relationship manager who takes care of customer, business and compliance with regulatory and authoritative bodies and works for the benefit of the customer is vital since there are many conflicting interests and despite policy frameworks there is a possibility of only vested interests and not customer interests are benefitted. References:1.http://economictimes.indiatimes.com/articleshow/57768759.cms?utm_source=contentofinterest&utm_medium
=text&utm_campaign=cppst2.Trends in Indian Realty Sector: A CRM Framework for a Real Estate Entities in the Changing Environment
written by Ramprakash Kona Deputy Vice President, Lodha Group, Mumbai, Maharashtra, India, S. S. Prasada Rao Professor, Dean and Director, HBS, GITAM University, Telangana, India, Dr. U. Devi Prasad Associate Professor, HBS, GITAM University, Telangana, India ISSN 2278 – 0211 (Online)
Authored byMr. Sudhir Gururaj Kulkarni
Dr. Ms. Vibha Bhilawadikar The Pearl Collection Foundation
Dr. Nirmala S. Joshi MET, Mumbai
49
Total
Figs in %
BASE 1009
Nationalised banks
28 Scheduled/cooperative banks
16
Private Indian banks like HDFC, ICICI
27
MNC banks like Citi, Standard chartered
13
NBFC like Tata housing, HDFC, DHFL etc
13
Your own employer
2
Private money lender
0
No, would be using my own funds
0

50
“An Analytical Study of Changes in ConsumerShopping Behaviour Strategies with Special Reference
to Organized Retail Sector in Nashik City”
AbstractRetailing plays a vital role in the world economy. Indian retailing industry has seen outstanding changes. The retail sector in India, which is dominated by small and unorganized entrepreneurs consisting of standalone stores, boutiques and kirana stores are drastically changing its face. In Nashik city, great changes have taken place in organized retail sector in 2001-2010. Today retailing is a fun-filled experience for the whole family. Once the Nashik city was in the dominance of unorganized retailing conventional kirana stores (grocery stores), roadside mini departmental stores at the panwala shop, the roadside self-service restaurant; the organized retailing sector has now emerged in a crucial way. This study is undertaken with view to analyse the changes in consumer shopping behaviour with special reference to organized retail sector. It also studies the changes in organized retail sector. It attempts to know different motivating factors affecting the buying decision in organized retail shops. The study tries to find out limitations in organized retail outlet.
KeywordsChanges in consumer shopping behaviour, Changes in organized retail sector.
1. IntroductionRetailing acquires an important role in the world economy. Indian retailing industry has seen outstanding changes. The retail sector in India, which is dominated by small and unorganized entrepreneurs consisting of standalone stores, boutiques and kirana stores, are drastically changing its face. There has been significant expansion in organized retailing business in recent years. Many big industrial houses have entered in organized retail sector with very strong-minded future growth plans. There has been a huge development of new retail formats such as malls, hypermarkets, supermarkets and lifestyle stores. Change is only constant in the retail world; survival in organized retail will depend on the ability to adapt the change. These new retail formats are rising at a rapid speed in India; there remains a need among Indian businesses to understand the changing behaviour of consumers towards shopping in these organized retail outlets.
In Nashik city great change has taken place in organized retail sector in 2001-2010. Today retailing is a fun-filled experience for the whole family. Where the Nashik city was in the dominance of unorganized retailing conventional kirana stores (grocery stores), roadside mini departmental stores at the panwala shop, the roadside self-service restaurant; the organized retailing sector has now emerged in a crucial way. The Nashik market space is being engaged by shopping malls, chain stores, departmental stores, shopping centres, food courts, fast food outlet. The shopping behaviour, lifestyle of Nashik customer, in particular, has been changing noticeably, which can be viewed as paradigm shift. The significant change has taken place in consumer shopping behaviour in Nashik city.
The exact understanding of consumer need to help the retailer make product that likes to be successful in the market. Consumer understanding or an understanding of changing consumer shopping behaviour is initial point of strategy formation. It is not only important to understand what consumer knows about a product? But also what they do not know? Therefore all main players in retailing are focusing to understand changing consumer shopping behaviour and develop strategy for tapping consumer. The firm needs to study consumers to see how its product is perceived, if there is good match, therefore all main players in retailing are focusing on understanding changing consumer shopping behaviour and develop strategy for tapping consumer.
2. Rationale of the study“An Analytical Study of changes in Consumer Shopping Behaviour with special reference to Organized Retail Sector in Nashik City” is important because of the following reasons:- 1 To understand retail business and practices followed in India. 2 To understand the changing trends in retail industry. 3 To study the changes taken place in consumer shopping behaviour such as:

51
• The psychology of consumers, how do they feel, and how do they select between different alternatives; • The behaviour of consumers while shopping and impact on purchase decisions; • How consumers’ motivation and decision strategies differ at various modern retail formats? • How and when marketers can adapt and improve their marketing campaigns and marketing strategies more
effectively to reach the consumer. 4 To know the impact of changing trends in consumer shopping behaviour and marketing strategies. 5 This study would help to provide guidelines and some groundwork for the new ventures before entering in Nashik,
as many new major players interested to enter in Nashik city. 6 This Study is also helpful to find lacunae in organized retail sector and also to provide remedial measures to
overcome the lacunae in organized retail sector.
3. Objectives of the Study Following are the objectives of the study:a) To identify the consumer shopping behaviour with respect to organized retail sector and to know the changes in
consumer shopping behaviour.b) To know the different motivating factors affecting the buying decision in organized retail sector.c) To study the changes in organized retail sector.d) To find out the limitations of organized retail sector.e) To suggest remedial measures to overcome the limitations of organized retail sector.
4. Hypotheses of the StudyFollowing hypotheses are constructed for the study:a) Purchasing pattern of consumer and impulse buying behaviour are interrelated to each other in organized retail sector. b) Motivating factors for actual buying and various discount schemes are Interdependent in organized retail sector. c) Emergence of organized retail sector and changes in consumer shopping behaviour is interdependent on each other.d) Different schemes offered by the organized retail outlets influence consumer shopping behaviour.
5. Research Methodology5.1. Data Collection: The data has been collected through following sources –
Primary Data The primary data has been collected with the application of simple random sampling method. In addition to the above techniques of data collection, field visits were done to know the actual changes in consumer shopping behaviour and changes in organized retail sector and their problems etc.
To collect the required primary data following tools/ techniques of data collection have been used.• Sampling• Questionnaires• Interviews and Field visits
• SamplingFor the study samples are selected from Nashik city. Following are the samples for the study:Consumers who are buying from organized retail format (Shopping Mall, Hypermarket, Departmental Stores, Specialty Stores, Franchisee, Company showroom, Multi-brand showroom, Supermarket, Mom and Pop Store) in Nashik city.
Employees working at organized Retailing format
Sampling Technique: The samples were selected with the Random sampling method.
Sample Size:Research first carried out pilot survey and observed; average footfall of organized retail shop at weekend and
52
considered 1% of that average footfall as consumer sample size. For the employee same method has been carried out considered 1% organized retail sector employee as employee sample sized. (Pilot survey enclosed to annexure).
Total Consumer Sample Size = 856Total employee sample size = 150• Questionnaires: Primary data has been collected by using two different structured questionnaires. The first questionnaire consists the data from consumer who were buying from organized retail format that emphasized exploring consumer hopping behaviour. Changes in consumer shopping behaviour, individual factors affecting on consumer shopping behaviour like Cognitive thinking processes which include perception, attitudes, motives and consumer personal characteristics like demographics, lifestyles, personality traits are also considered in first questionnaire.
The second questionnaire has been applied to collect data from employee working at organized retail format to find changes in organized retail sector.
5.2 Secondary Data Secondary data are essential for most organizational research. The secondary data refers to the information gathered by someone other than the researcher. Such data can be internal or external and accessed through the internet, books, and annual reports.
Secondary Source:The secondary data has been collected from:1. Publications of the Govt. periodicals, publications of federal bodies/ associations, institutions. Reports of various
committees, Bureau of statistics etc. 2. Published data are also collected from Govt. Offices, Research Institutions and Financial institutions.3. Research papers published and unpublished on the subject were studied. 4. The Journals, Magazine and Newspapers were used.
5.3 Data ProcessingThe data thus collected is systematically coded, processed, tabulated, classified and analysed by using electronic processing methods. The data collected was initially coded. After data collection, tabulation was made; thereafter analysis and interpretation were attempted. For the purpose of analysis and interpretation the methods and techniques like Percentage, chi-square test, graphical presentation and charts were used.
5.4 Scope of the StudyThe scope of this research is restricted to the organized retail sector in Nashik City. The Study was made by the researcher for the period of the 2001-2010. Therefore scope of the study is restricted to this period and organized retail sector in the Nashik city only.
This research is restricted only to Nashik city. Thus results and conclusions are related and suitable for Nashik City only. They may or may not be applicable to other areas of the India or any part of the world. 5.4 Limitations of the StudyThe research has been done for the period from 2001-2010; therefore whatever data was available in this period was utilized for the study. If there is some variation in the data, then the result and conclusions may not be the same.
All the conclusions are drawn on the basis of the data and information given by the respondents of the organized retail sectors in Nashik city. But because of the secrecy 100% correct data was not given by them therefore data is inadequate and incomplete. There is a possibility of deficiencies in the conclusions. However researcher has tried at his level best to conduct correct and reliable data from the respondents.

53
6. Review of Literature 1. Dholakia (1999) in article on “Going shopping: key determinants of shopping behaviour and motivations”
published in International journal of retail and distribution management mentioned, the rationale for shopping is making physical visits to a shopping site . It is considered as a household task as well as a form of recreation, relaxation and entertainment along with buying goods.
2. Howard (2007) in his article on “New shopping centre’s: Is leisure the answer?” published in “International journal of retail and distribution management” believes shopping to be a leisure pursuit and with the rapid development of shopping centers, both retailers and developers are trying to make it more of a pleasure activity. Many studies done in an attempt to identify motives of shopping, the one by Tauber (1972) is a prime one. Tauber(1972) in his study on “Why do people shop?” published in “Journal of marketing” identified motives of shopping in a market based economy apart from the acquirement of products and services and classified them as role playing and social experience outside home (Howard, 2007).
3. Social reasons are important, as Lunt and Livingstone (1992) describe in Mass Consumption and Personal Identity, Open University Press, Buckingham that shopping as a spectacle in which the person who is shopping is both a spectator and a performer. However, most of these motives that have been mentioned in the table can be described as pleasure or leisure related.
4. Many studies that have followed Tauber’s (1972) study have made an attempt to generate some evidence from reality to confirm these motives. A lot of consumer behaviour researcher have investigated and found insights into the personal and situational experiences of shopping and its emotional and behavioural effects (Howard, 2007).
7. Conclusions and Recommendations7.1. Conclusions:I] The first hypothesis for this study is “Purchasing pattern of consumer and impulse buying behaviour are
interrelated to each other in organized retail sector.” For the testing of this hypothesis, the researcher has collected data from the consumers’ buying from organized retail
sector and the employees’ working at organized retail sector:1. The Researcher has tested the data at 5% significant level. Chi-square computed value for above data 11.11 is
greater than table value of 3.84 on 01 degree of freedom. Thus there is an association between purchasing pattern of consumer and impulse buying behaviour. Hypothesis is accepted.
2. Majority (42.06%) of the consumers purchasing is linked with 25% Plan and 75% impulse buying. Many consumers’ (20.56%) purchasing pattern is linked purely with impulse buying. Only 8.18% consumers buying patterns linked with plan buying. Hence, it has been concluded that maximum consumers (62.62%) have impulse buying behaviour.
3. Majority of the employees 20.67% and 36% (i.e. 56.67% in total) are “strongly agree” and “agree” respectively on the view that purchasing pattern of consumer in organized retail is more on impulse buying. Only 28.66% respondents are “disagree” with it.
Therefore it is concluded that “Purchasing pattern of consumer and Impulse buying behaviour are interrelated to each other in organized retail sector”. Hence Hypothesis is accepted.
II] The second hypothesis for this study is “Motivating factor for actual buying and various discount schemes are interdependent in organized retail sector”.
For the testing of this second hypothesis, the researcher has collected data from the consumers’ buying from organized retail sector and the employees’ working at organized retail sector:
1. The researcher has tested the data at 5% significant level. Chi-square computed value for above data 30.48 is greater than table value of 3.84 on 01 degree of freedom. Thus there is association between motivating factor for actual buying and various discount schemes. Hypothesis is accepted.
2. Majority of the consumers i.e. 34.70% and 23.13% are “strongly agree” and “agree” on the view discount schemes as a main motivation factor at organized retail. Very few consumers (i.e. 22.90%) are “disagree” and “strongly disagree” to discount schemes as a main motivation factor at organized retail.
3. Majority of the employees 26% and 41.33% (i.e. 67.33% in total) are “strongly agree” and “agree” on the view that various discount schemes at organize retail as main motivating factor for actual buying. Very few employees (i.e. 16%) are “disagree” and “strongly disagree” with the statement that various discount schemes at organize retail are
54
main motivating factor for actual buying.Therefore, it has been concluded that, “Motivating factor for actual buying and various discount schemes are interdependent in organized retail sector”. Hence the Hypothesis is accepted.
III] Third hypothesis for this study is “Emergence of organized retail sector and Changes in consumer shopping behaviour are interdependent on each other”.
For testing of this third hypothesis, the researcher has collected the data from the consumers’ buying from organized retail sector and the employees’ working at organized retail sector.
1. The Researcher has tested the above data at 5% significant level. Chi-square computed value for above data 13.29 is greater than table value of 3.84 on 01 degree of freedom. Thus there is association between emergence of organized retail sector and changes in consumer shopping behaviour. Hypothesis is accepted.
2. Majority of the employees 20.67% and 40.67% (i.e. respectively total 61.34%) are “strongly agree” and “agree” on the view that consumer shopping behaviour in Nashik has changed. Very few employees’ (i.e. 21.32%) are “disagree” and “strongly disagree” with the statement consumer shopping behaviour in Nashik has changed significantly.
3. Majority of the employees 42.67% and 24.67% (i.e. respectively total 67.34%) are “strongly agree” and “agree” with the view with emergence of organized retail sector there is change in the shopping behaviour of consumer. Very few respondents (i.e 18.68%) are “disagree” and “strongly disagree” to emergence of organized retail sector there is change in the shopping behaviour of consumer.
Therefore it has been concluded that, “Emergence of organized retail sector and Changes in consumer shopping behaviour are interdependent on each other”. Hence the, Hypothesis is accepted.
4. Changes in Consumer Shopping BehaviourAfter analysing the employees’ feedback, the researcher has identified that, significant changes have taken place in consumers’ life style in Nashik city. Those changes are: I. Traditional Outlook to Modern Outlook, ii. Shopping as a necessity to Shopping for pleasure, iii. Itemized Purchase to Bulk Purchase, iv. Prepared food to readymade food, v. Conservative spending to Liberal spending, vi. Increasing buying during Holidays and festival seasons.
5. Consumers agree with the view that “there are significant changes in post purchase action at organized retail shop”
Majority of the consumers are agreed with the statements (statements are related to changes in consumer shopping behaviour): “I have started shopping with my family” “I often check price between stores” “I buy more than what I plan at retail” “I have stopped visiting the old shop” “My purchasing pattern is more on impulse buying” “I feel significant changes have taken place in my lifestyle ad shopping behaviour”
It is found that, maximum consumers realized changes in their shopping behaviour. a. Many consumers have stopped visiting old shops. b. Many consumers have started shopping with their families. c. Many Consumers have interested shopping along with the entertainment in organized retail sector. Many
consumers have perceived shopping as fun full experience.
Maximum respondents agree that now a day’s our major part of shopping is based on impulse buying. It was based on planned buying previously. On the basis of foregoing study, it is concluded that “Significant changes have taken place in consumer life style in Nashik city”.

55
IV] The Fourth hypothesis for this study is “Different schemes offered by the organized retail shops influence consumer shopping behaviour”. For the testing of this fourth hypothesis the researcher has collected the data from the consumers’ buying from
organized retail sector and the employees’ working at organized retail sector:1. The researcher has tested the above data at 5% significant level. Chi-square computed value for above data 7.95 is
greater than table value of 3.84 on 01 degree of freedom. Hypothesis is accepted.2. It has been analysed that, majority of consumers i.e. 34.70% and 24.42% are “strongly agree” and “agree” with
the statement that different schemes offered by organized retail format influence for more shopping. Very few consumers are disagree and strongly disagree (i.e. 20.80%) with the statement different Schemes offered
by organized retail format influence for more shopping. 3. Majority of employees 14% and 37.33% (i.e. respectively in total 51.33%) are “strongly agree” and “agree” to
different Schemes offered by the organized retail shop influence consumer shopping behaviour. Very few employees (i.e. 34.66%) are “disagree” and “strongly disagree” with it. Therefore it has been concluded that the “Different schemes offered by the organized retail shops influence consumer shopping behaviour”.Hence the Hypothesis is accepted.
V] Consumer Shopping Behaviour1. It has been observed that 38.20% respondents are agreed with the view that “Main purpose to visit organized retail
shop is lifestyle”.
Majorly youth consumer group and working age group included in it. 30.02% respondents are agreed to that, the purchase of cloth also important purpose for visiting organized retail shop.
It has been concluded that new life style, clothing and purchase grocery are main purposes to visit organized retail shop. It is verified that there is an association between gender, age group, monthly income level and purpose of consumer
to visit organized retail shop.
Hence, it is concluded that purpose of consumer to visit organized retail shop is related with gender, age group, monthly income.
2. 33.76% respondents prefer organized retail shop due to good offers. 27.80% respondents prefer organized retail shop due to large variety, 10.51% respondents preferred organized retail shop because of pleasure shopping.
It is concluded that good offers, large variety, pleasure of shopping are main motives/reasons of consumers to visit organized retail shop. It has been analysed that there is an association between gender, age group, educational qualification, monthly income level and different motives/ reasons of consumers to visit organized retail shop.
It is concluded that “Motives/ reasons of consumers to visit organized retail shop is associated with gender, age
group, education qualification, monthly income”.
3. It is found that, majority of (30.14%) respondents appreciate family as main source of information, 29.44% respondents consider friends as source of information.
It has been concluded that, friends, families are the most important sources of information for consumers. It has been analysed that there is an association among gender, age group, educational qualification, monthly income level and source of information.
It has been concluded that the “Source of information is associated with gender, age group, educational qualification, monthly income”.
4. It has been observed that, 31.31% respondents appreciate “retail shop location and side” for the selection of organized retail sector, 28.97% respondents appreciate “retail shop image” for the selection of organized retail

56
sector, and 29.91% respondents prefer “retail shop atmosphere” for the selection of organized retail sector.
It has concluded that “retail shop location and side” is the most important factor for selection of organized retail shop. “Retail shop image and retail shop atmosphere” play very important role for the selection of retail shop.
5. The analysis shows that 32.01% respondents agree elders as major decision influencers in shopping at organized retail shop. 29.90% respondents consider friends as major decision influencers in shopping at organized retail shop.
Therefore it has been concluded that elders and friends are major decision influencers on shopping at organized retail shop.
6. It has been concluded that, consumers are satisfied and gaining good shopping experience in organized retail shop. There is no gap present between the expectation before shopping and actual shopping experience.
7. It has been analysed that, majority (26.87%) respondents spend Rs 2000 and above in a month at organized retail shop. 25.35% respondents spend Rs 1001-1500 in a month at organized retail shop.
It has been concluded that maximum consumers spending more than Rs 2000/- in a month. Maximum consumers have liberal spending nature with high buying capacity. Very few consumers (i.e. 11.21%) have conservative spending (Rs 0-500 in a month). It has been analysed that there is an association among age group, monthly income level with spending at organized retail shop.
It has been concluded that “Spending at organized retail shop is associated with gender, age group, educational qualification, monthly income”.
8. It has been observed that majority (30.22% and 22.66%) of respondents preferred debit card and credit card as modes of bill payment at organized retail shop.
It has been concluded that Debit cards and Credit cards (Plastic money) are the most famous modes of bill payment in mall culture. Coupons are least preferred options for bill payment at organized retail shop. It has been analysed that there is an association among age group, educational qualification, monthly income level and mode of bill payment at organized retail sector.
Hence it is concluded that “mode of bill payment at organized retail shop is associated with gender, age group, educational qualification, monthly income”.
9. The result shows, 53.50% respondents have membership card of organized retail shop and 46.50% respondents don’t have membership card of organized retail shop.
It is reflected that maximum consumers are loyal and regular buyers of organized retail shop. It has been analysed that there is an association among gender, age group, educational qualification, membership card. It has been concluded that “membership cards are associated with gender, age group, educational qualification, monthly income”.
VI] Changes in Organized Retail Sector1. 16% and 44% (i.e. 60%) employees are “strongly agree” and “agree” that there are significant changes in
organized retail sector in Nashik city. Very few respondents (24%) are “disagree” and “strongly disagree” that there are significant changes in organized retail sector in Nashik city. It is concluded that, there are significant Changes in organized retail sector in Nashik city.
2. 62% respondents appreciated creating private label is new changing trend in organized retail sector in Nashik city. 62.66% respondents appreciate various offers and discounts are new changing in trends organized retail sector in Nashik city. It has been concluded that creating private label, promoting various offers and discounts are major new trends in organized retail in Nashik city.

57
3. 90% employees at organized retail shop agree to, there is a significant change in sale volume due to different scheme offered by organized retail shop. Only 10% responses are negatively about it. But the respondents are not ready to tell exact amount of change (figure) observed in sale volume due to different schemes. It has been concluded that, there is a significant change in sale volume due to different scheme offered by organized retail shop.
4. 92% employees at organized retail shop agree that, there is a significant change in footfall due to different schemes offered by organized retail shop. Only 08% are negative about it. It has been concluded that, there is a significant change in footfall due to different scheme offered by organized retail shop.
5. Majority of employees’ 22% and 36.67% (i.e. 58.67%) are “strongly agree” and “agree” on the view that “Overall image of organized retail shop in Nashik city has changed”. Very few employees’(i.e. in total 26.66%) are “disagree” and “strongly disagree” that the overall image of organized retail shop in Nashik city is changed. It is concluded that, “Overall image of organized retail shop in Nashik city has changed.”
6. Majority of employees’ 28.68% and 31.33% (i.e. in total 59.99%) are “strongly agree” and “agree” that “Interior and exterior atmospheric factor of organized retail shop in Nashik has changed”. Very few employees’ (26.66%) are “disagree” and “strongly disagree” with “Interior and exterior atmospheric factor of organized retail shop in Nashik has changed”.
7. Major Changes in organized retail sector: • Change in Market Size: Retailing in India is emerging as one of the largest industry with total market size of USD
320 billion in 2006 and extended USD 421 billion in 2010 growing at healthy CAGR of 5% till date. • Change in organized retail market share 4% to 7.44% and projected to be 9 per cent of total retail market by 2015
and 20 per cent by 2020. In a span of last 10 years, organized retail has expanded in urban cities and makes an entry in semi-urban and rural areas. In 2007 organized retail market was 4 percent of the total retail, that is around Rs 67,310 crore and expanded to compound at 27 percent per annum, aggregating to Rs 1,75,103 crore (7.44 percent of the total retail) in 2010-11. Organized retail projected to be 9 per cent of total retail market by 2015 and 20 per cent by 2020
• Significant changes in retail format - Conventional Formats to Modern retail formats • Foreign Investment and Employment opportunity has increased in organized retail sector. • Change in reforms (2001-2012): UPA government has hung an ‘Open’ sign for foreign retailers. The cabinet has
approved for 51% FDI in multi-brand retail sector and 100% FDI in single brand. The policy will allow global retailers to set up shops in the country's $450 billion (Rs. 2,500 crore) retail sector, and is aimed at drawing more overseas investment and taming inflation.
Till 2011, Indian central government unused to FDI in multi brand retail, unfriendly foreign groups from any ownership in supermarkets, convenience stores or any retail outlets. Even single brand retail was restricted to 51 per cent ownership and a ritual process.
In Nov 2011, India's central government declared retail reforms for multi brand store and single brand stores. These market reforms covered the way for retail modernization and competition with multi brand retailers such as Wal-Mart, Carrefour and Tesco, as well single brand majors such as IKEA, Nike, and Apple. The announcement sparked activism, both in opposition and in support of the reforms.
VII] Limitations In Organized Retail Sector Maximum respondents don’t like to pay for parking. Many respondents want help from the sale persons during
buying process. Maximum respondents said premium prices for many products which are not affordable to them; such consumers want value format. Respondents want more discounts, offer which are affordable to middleclass families.
It has been concluded that pay parking, less involvement of sale person during buying process, premium price, credit facility, lack of relationships are limitations of organized retail shop.
In unorganized retail sector customer enjoyed personal relationship touch of retailer but in organized retail sector customers do not enjoy this personal relationship touch.

58
7.2 Recommendations:1. “Purchasing pattern of consumer and Impulse buying behaviour are interrelated to each other in
organized retail sector”. Thus retailer should develop special theme to encourage impulse buying behaviour. a. F or encouraging unplanned buying pattern means to encouraging impulse buying pattern; retailers should use
special occasions, use festival and develop themes. Theme should be based on visual merchandising. Retailers should develop theme on the bases of seasons or occasions e.g. New year, Christmas, Summer, Holi, Diwali etc. Events and festival like world cup/ Ganpati Utsav etc can also be used as a theme.
For e.g. Holi theme with colorful accessories, bowls/packets containing colors, pichkari etc. should be displayed. This can be used to encourage the unplanned buying pattern of consumers
b. Maximum consumers have impulse buying behaviour; it means a lot of scope for retailer to tap consumers pocket space. Retailers have to excite consumer for more buy by various discount scheme, offers and display.
2. “Motivating factor for actual buying and various discount schemes are interdependent in organized retail sector”. The retailers should develop various discount schemes to motivate consumers during actual buying.
a. The Researcher has observed that maximum respondents appreciate “Sabse Sasta Din” and “Maha Bachat” as most tempting schemes. These schemes are motivating factors for actual buying. Thus organized retailer should develop schemes base on Each Day Low Prize which is followed by many big retailers like Wal-Mart.
b. Good offers, large variety, pleasure of shopping, fun full experience are main motives/ reasons of consumers to visit organized retail shop. Organized retailer should always provide new offers with large variety of goods and services to make consumer satisfied. They should provide fun full experience, pleasure during shopping.
3. “Emergence of organized retail sector and Changes in consumer shopping behaviour are interdependent on each other”. The retailers should adopt many emerging trends in organized retail sector to retain consumers.
a. The researcher has analysed that significant changes have taken place in organized retail sector.
Creating private label, quick home or phone delivery, diversifying into sale of SIM and mobile, E-tailing, various offers and discount are major new emerging trends in organized retail sector. Thus retailer should adopt these emerging trends in organized retail sector.
b. Consumers are attracted towards modern retail format and it is the sign of changing consumer shopping behaviour. Shopping mall and CIRO are preferred shops by the consumers. Retailer should point out this change and try to retain consumers.
4. “Different schemes offered by the organized retail outlets influence consumer shopping behaviour”. The
retailers should influence consumer by developing various schemes e.g. special offer on festival, discount schemes, weekend offers and seasonal offers.
5. Consumer Shopping Behaviour1) Majority of consumers (Between 26-40) visit the shopping malls with their families. Retailer should make special
provision for this age group. Mostly these groups want everything under one roof which results in the saving in costs as well as in time.
At the same time 15-25 age group is most neglected age group for this untapped segment the retailer should make special arrangement in themes of entertainment, game zone, and restaurant. This age group has definitely got the purchasing power (in terms of pocket money). They are visiting the malls more for having fun and passing their time rather than making the purchases.
For the elder age group retailer should develop new format which will increase interest and buying habit of elder age group or which will concentrate on health care, fun, or elder clubs.
2) The Retailers should follow six ways to attract youth • College/school fashion show: College/school fashion shows in central mall. They arrange this fashion show at

59
Mall. Each youngster who participates brings along an average of six families and friends to mall to watch the fashion show.
• Campus Promotion: If the Mall is situated near a college. Arrange a table at colleges to introduce new students about Mall. Give store coupons and lucky draw prizes. The shopping habits begin due to this activity. Many schools and colleges will be pleased to offer the counter at orientation or during the first week of college and school to offer discounts and prizes to students.
• Day Contest: Day contests at shopping mall mainly included special events on Labour Day, Independence Day and Mother Day. Arrange contest for youngsters who have birth date around Independent day or Labour Day. Have the youngsters register at any of participating stores. The winner is the youngsters whose birth date closest to 12:01 a.m. on Independence Day! The lucky youngster wins clothing, from one of store. Convey the details to radio stations and newspapers about Day contest. It’s a grand public relations chance. Retailer can get a newspaper or radio station to sponsor the program.
• Back to college: Make a back to college shopping listing or register/catalogue that lists where students can find a range of back to college supplies. Distribute this list by the mail or drop it at college.
• Welcome Students: Arrange a welcome event for students. Give them a chance to use coupons, leaflets for shopping.
• Tie up with college as a sponsor for some event or youth festival.3) Maximum educated consumers buy from organized retail shop. Educated consumers, the elite class preferred to visit
organized retail shop. Retailer should consciously focus on this class about marketing communication, service. 4) Maximum consumers are from high buying capacity therefore retailer should focus to expand their basket size by
tempting them. 5) Shop preference or shop choices decision is based on consumers’ gender, age group, educational qualification
and monthly income. Thus retailers should analyzed demographic profile of target segment and develop retail format by considering gender, age group, educational qualification, monthly income of target segment.
6) Maximum consumers prefer weekends shopping and the first week of a month (After salary date) shopping. Footfalls in organized retail shop are high in weekends and first week of a month. Retailers should make required arrangement for these weekends in terms of manpower planning, availability of goods and services, special offers, discounts scheme for weekends. Housewives, young consumer groups frequently visit organize retail shop for shopping.
7) Purchase frequency of consumers is related to gender, age group, educational qualification, monthly income. Retailers shall make arrangement of goods and services for consumers who have maximum purchase frequency. For example housewives, young consumer group are frequently visit organize retail shop for shopping for that the retailers can make necessary provision to satisfy these consumer segment.
8) Life style, clothing and purchase grocery are main purposes to visit organized retail shop. The Retailer should give priority to this segment and provide variety, offers on it for attracting and retaining consumers.
Purpose of the consumer to visit organized retail shop changes as there is change in demographic profile of the consumer. Retailer should identify different purposed with respective to changes in demographic profile for serving different segment.
9) Friends and families are most important source of information for consumers. Organized retailers use these two as main sources for attracting consumers. Publicity, road shows, advertising in local media is important tools for influencing family and friend.
10) “Retail shop location and side” is the most important factor for the selection of organized retail shop. “Retail shop image and retail shop atmosphere” play very important role on selection of retail shop. For providing good shopping experience to consumer retailer should properly arrange location, image and atmospheric of shop.
11). Elders and friends have major influence on shopping at organized retail shop. In this case if the elders and friends are coming for shopping to assist consumer in buying process for that retailers should provide atmospheric, experience, display, offers to this third party to influence consumer for shopping. Retailer should excite third party i.e. elder and friends to influence consumer for buying.
12) Maximum consumers have liberal spending nature with high buying capacity. Maximum consumers are spending more than Rs 2000/- in month. Very few consumers have conservative spending (Rs 0-500 in month). This is change in shopping behaviour conservative spending to liberal spending. Retailer should excite consumer to buy more than what they plan. Try to expand the basket size of liberal consumer.
60
13) Debit cards and credit cards (Plastic money) are the most famous mode of bill payment in mall culture. Coupons are least preferred options for bill payment at organized retail shop. Retailer can tie up with many banks, debit card - credit cards by co-branding and provide the bonus point to consumers on bases of their shopping. Retailer should make necessary arrangement like swapping machine.
14) Membership card of organized retail shop is an indication of customers’ loyalty. For gaining shopping points membership card holder doing repetitive purchase. Retailer should penetrate maximum membership card to the consumers.
15) Shop selection is majorly depend upon promotions and offers, convenient parking, better services, and one stop shopping. Retailers should focus on it. Consumers always complain about parking space, paid parking for this issue retailer should refund parking fee on specific amount of buying.
16) Maximum customers are satisfied after shopping at organized retail shop. It is good for retailer that many consumers are satisfied. Some customers complain about offers, discount, price level, paid parking solve this by analyzing consumer feedback form.
17) There are significant changes in post purchase action after purchasing at organized retail shop. Retailer should be happy that maximum changes are positive for organized retail shop. Retailer should maintain consistency in this performance.
18) In Nashik majority of consumers are using offline shopping to enjoying pleasure of shopping and fun full entertainment at shopping mall. Retailer need to wait some time for virtual store and virtual shopping in Nashik City.
19) There is a need to provide seating arrangements in the shopping area because constant walking consumers feel exhausted, their children start crying for some seating place and because of this consumer think to leave the shopping mall and go back. This will certainly effect on losing the possible sales. It is verified fact that more the time consumer spends in the organized retail format more is the chance that they will buy.
20) Consumer wish to buy grocery once in a month, cosmetic items a monthly, vegetable and fruits daily, beverages and snacks on weekly and ready to eat food once in month. People prefer to buy products whenever they required so organized retail shop must put all the items in shelves every time.
21) Some people visit the organized retail format as free time activity so retail store should use strategy to make income from such people retail store should charge for vehicle parking. Place some items to boost impulse buying.
22) Due to rise of women in buying at organized retail format, retailer should keep items which can gain the attention of the women.
6. Changes in Organized Retail Sector Organized retailers situated at shopping malls have realized that they have to make whole shopping destination
for the consumers which has a mix of retail stores, entertainment places, eating joints which offers consumers the whole shopping experience. The promoters should take the consultancy from experts to make a fair tenant mix so that the consumers are able to get everything they want under one roof. It shall satisfied consumers intention of coming to the shopping mall. The retailers should make a unique image of the shopping malls by the process of segmentation and formation of specific shopping environment. For example, the brands for price sensitive consumers and the high end luxurious brands should not be put under one roof. This will assist them retain viewers belonging to different customer segments. Apart from this, the organized retailers can also encourage shopping malls as specific shopping destinations. For example, there would specialise malls like specific mall for bags, mall for furniture, and mall for Jewellery etc.
After analysing changes in consumer shopping behaviour and changes in organized retail sector, research suggested some innovative ways to attract consumers:
1) A Balloon can be fixed with the organized modern retail shop and the logo should be part at the entrance of the mall. The balloon can be of any dark color showing the logo of the brand. It will be noticeable from far away as well as will emphasize the logo.
2) Discos and clubs: Modern retail stores may have tie ups with discos and clubs for the consumers or provide some space for disco and clubs, Where consumers can stand to win gift vouchers and prizes from retailers.
3) Fashion shows: Modern organized retail can organizes fashion show every year Mr. and Ms. Nashik in their store and win attractive prizes.
4) Tourist Point: A tourist point should be developed in shopping mall, especially for tourists who want to visit famous

61
places in Nashik City. They can plan their trips with the help of shopping corner. Shopping Mall may provide them vehicle. They can enjoy their holidays along with shopping.
5) Health Centre/Gym Facility in shopping Mall: That would help to attract people every day at shopping mall.6) Mom Corner: Where Mom can keep her child for safety and protection and can do Shopping freely.7) Beauty Corner: Provide special tips and counselling about beauty. Retailer can sale some beauty product along
with beauty counselling.8) Game Zone and Personal Care.9) Set up Customer Advisory Boards to get suggestions from customer and give them a chance to voice their opinion
about modern retail format. • Strategy to offer discount on Taxi Services to its customers. On the bases of loyalty program. • Use some space for payment centre for telecom services, medical stores and health clinic banks, insurance.10) Turn mall parking into a profit generator: Retail organization makes parking lot into revenue generators with an
exclusive advertising system. Even parking space can use for vehicle servicing and earn profit on it. 11). Promotional ways and new offer Organized retail format can accept a variety of promotional ways like, • Widespread advertisement in newspapers frequently. • Advertisements should be prepared in famous English and different other state language. • Leaflets/advertising material can be circulated in face of colleges and school; it can be done during off season sales. • T.V. and Radio use for advertising purpose. • Emails and SMS can be sent to the consumers for intimating various schemes, offers. • Banners, Posters, Hording can be place on main areas so that it covers the population of city.
7. Remedial Measures to Overcome the Limitations of Organized Retail Sectora. Less involvement of sale person during buying process, pay parking, premium price, credit facility and lack of
relationship are limitations of organized retail shop. 1) It is recommended that retailers should give refund parking charges on specific amount of buying. For getting this
refund amount consumers will buy something from shopping mall and that footfall will actually convert into sale. 2) R etailer should increase service staff for assisting customers during buying process. There should be sufficient help desk
for helping customers. 3) In Nashik for middle class families premium prices are not affordable to customers. Retailer should develop a value format. 4) For credit facility - Retailer should tie up with banks by co-branding. Retailer should provide credit card facility to
customer. Retailer can focus on private label which will affordable to consumer. 5) In unorganized retail sector customers enjoy personal relationship touch of retailer. In organized retail sector customers
not have enjoyed personal relationship touch.
For this personal relationship organized retailer may use relationship management. Organized retailer can maintain all possible data base of consumer and will use this data based for greeting customer on special occasions.
Example SMS, greeting cards on birthday, this is one to make relationship with consumer and give them personal touch.b. Friendly behaviour of staff is necessary to satisfy consumer and this is one of the key factors on which these shopping
malls are scoring very high. When consumers enter into the shopping mall and even the security guard standing at the door wishes consumers good afternoon/evening which makes the consumers feels special.
08. Bibliography
1 Pancholi R. (2007) : “Growth off the Shelf”, Hindustan Times, New Delhi, July 22 2007.
2 Sinha P.K. & Banerjee :
A. (2004)
“Store Choice Behaviour in an Evolving Market”, International Journal of Retail
and Distribution Management, Vol.32 No. 10, pp 482-494.
3 Millan E.S. & Howard :
E. (2007)
Shopping for Pleasure? Shopping Experiences for Hungarian Consumers,
International Journal of Retail and Distribution Management, Vol. 35 No. 6, pp
474-487.

62
Websites1. www.indianretailforum.com2. www.indianretailsector.com3. http://www.nashikcitycentre.com/about_mall.php4. http://www.technopak.com5. http://www.ibef.org
Authored byDr.Yogesh Gaikwad,
MET, Nashik
Dr. Nilesh Berad,MET, Nashik
4 Swapana :
Pradhan(2007)
“Retailing Management”, Tata McGraw-Hill Publication Company Ltd, New Delhi,
2nd Edition.
5 ICRIER(2007) : "ICRIER Begins Survey of Indian Retail Sector." 19 March 2007.
6 Sathyaraj (2006) : “Definition of Unorganized Retailing”, April, 2006-04-01 in
http://retail-industry.blogspot.com.
7 McKinse Quarterly(2005)
: “Winning the Indian Consumer”, Special Edition.
8 Tata S. (2007) : “Spurring Super – Shopping”
http://www.tata.com/trent/articles/20030305_spurring_super_shopping.htm.
9 Sheejih A(2008) : “Organized Retail Market Boom & The Indian Society”, International Conference
on Marketing & Society,IIM-K.
10 A.J. Lumba(2007) : “The Art of Retailing”, Tata McGraw-Hill Publishing Company Limited,New Delhi.
11 Suja Nair(2008) : “Retailing Management”, Himalaya Publishing House, New Delhi,3rd Edition.
12 White Book(2006) : Marketing White book, 2006, Business World, pp.114-15.
13 NCAER(2005) : NCAER Research on Indian Consumers, The Great Indian Consumer, 2005.
14 AT Kearney(2006) : The Global Retail Development Index,( 2006) , AT Kearney.
15 Del I Hawkins(2007) : “Consumer Behaviour”, Tata McGraw-Hill Publishing Company Ltd,New Delhi, 9th Edition.
16 Chetan Bajaj(2005) : “Retailing Management”, Oxford University Press, New Delhi, 1st Edition.
17 Beri G.C.(2004) : “Marketing Research”, TATA McGraw-Hill Published Company, New Delhi,rd3 Edition.
18 Nargundkar :Rajendra(2008)
“Marketing Research”, TATA McGraw-Hill Published Company, New Delhi,rd3 Edition.

63
Literature Review on “Management of Non-PerformingAssets (NPA) in Banks and Financial Institutions”
IntroductionAccording to Aggarwal (1975) “Survey of related literature implies locating, reading and evaluating reports of research as well as reports of casual observation and opinion that are related to the individual’s planned research project” (p.108).
The search for related literature is one of the first steps in the research process. It is a valuable guide to dine the problem, recognizing its signification, suggesting promising data-gathering devices, appropriate study design and sources of data. Though review of literature is an exacting task, calling for a deep insight and clear perspective of the overall field, for any worthwhile study, the researcher needs an adequate familiarity with the work, which has already been done in area of his choice.
According of Best (1987), “A familiarity with the literature in any problem area helps a student to discover what is already known, what others have a attempted to find out, what methods of work have been promising or disappointing and what problems remain to be solved.”
The identification of a problem, development of a research design and determination of a size and scope of the problem all depend upon the study and intensity with which a researcher has examined the literature related to the work. Mouly George J.C. (1963) viewed, “The success of the researchers efforts will depend in no small measure on the extent to which he capitalizes on the advances-both empirical and theoretical made by previous researchers. He draws maximum benefit from the design and procedures of the previous researchers, matches his conclusions with the conclusions drawn earlier and tries to add from his side a line or two to the existing store of knowledge.
Importance of Review of Literature The review of a related material is a time consuming but fruitful phase of research program.The importance of related literature can be listed follows:1. The review of related literature helps to avoid duplication on one hand and it also suggests means of further study
on the other.2. It helps to link the present research to previous research. Moreover if forms a part of any piece of research.3. A review of the literature would develop the insight of the investigator. The information thus gained will save
researcher much time.4. The Importing of the review is quite obvious in delimiting the research problem and in defining it better.5. The review of the literature will give the scholars the insight he needs to convert his tentative research problem to a
specific and concise one.6. The review of literature can help the research worker in making him alert to research possibilities that have been
over looked.7. In the process of reviewing the literatures the scholar is interested in finding out research approaches to the topic
selected for study.8. It provides a comprehensive view of the topic and also of the relevance significance and practicability of the topics.9. It contributes to the general scholarship of the researcher.10. It enables the investigator to identify possible gaps in the research and to acquaint with facts, concepts and theirs
formulated by other investigators that can avoid some of the respective areas.
Literature Review on NPAs:Non-Performing Assets have negative impact on banking stability and growth. Its impact on erosion of profit and quality of asset was not seriously considered in Indian banking prior to 1991. There are many reasons cited for the alarming level of NPA in Indian banking sector. Asset quality management was not prime concern in Indian banking sector till 1991, but was mainly focused on performance objectives such as opening wide networks/branches,

64
development of rural areas, priority sector lending, higher employment generation, etc. The accounting treatment also failed to project the problem of NPA, as interest on loan accounts were accounted on accrual basis.
The accumulated level of NPA in post-liberalization period forced policy makers to reform banking sector. A Committee on Banking Sector Reforms known as Narasimham Committee was set up by RBI to study the problems faced by Indian banking sector and to suggest measures. The committee identified NPA as a major threat and recommended prudential measures for income recognition, asset classification and provisioning requirements. These measures embarked on transformation of the Indian banking sector into a viable, competitive and vibrant sector. The committee recommended measures to improve “operational flexibility” and “functional autonomy” so as to enhance “efficiency, productivity and profitability” (Chaudhary and Singh, 2012).
Though many published articles are available in the area of management of non-performing assets, which are either bank specific or banking sector specific, there are hardly any state of specific researches.
A synoptic review of the literature brings to the fore insights into the determinants of NPL across Countries. A review of relevant literature has been detailed here under: A considered view is that banks’ lending policy could have crucial influence on non-performing loans (Reddy, 2004). He critically examined various issues pertaining to terms of credit of Indian banks. In this context, it was viewed that ‘the element of power has no bearing on the illegal activity. A default is not entirely an irrational decision. Rather a defaulter takes into account probabilistic assessment of various costs and benefits of his decision’.
Mohan (2003) conceptualized ‘lazy banking’ while critically reflecting on banks’ investment portfolio and lending policy. The Indian viewpoint alluding to the concepts of ‘credit culture’ owing to Reddy (2004) and ‘lazy banking’ owing to Mohan (2003a) has an international perspective since several studies in the banking literature agree that banks’ lending policy is a major driver of non-performing loans. Furthermore, in the context of NPAs on account of priority sector lending, it was pointed out that the statistics may or may not confirm this. There may be only a marginal difference in the NPAs of banks’ lending to priority sector and the banks’ lending to private corporate sector. Against this background, the study suggests that given the deficiencies in these areas, it is imperative that banks need to be guided by fairness based on economic and financial decisions rather than system of conventions, if reform has to serve the meaningful purpose. Experience shows that policies of liberalization, deregulation and enabling environment of comfortable liquidity at a reasonable price do not automatically translate themselves into enhanced credit flow. Although public sector banks have recorded improvements in profitability, efficiency (in terms of intermediation costs) and asset quality yet, they continue to have higher interest rate spreads but at the same time earn lower rates of return, reflecting higher operating costs (Mohan, 2004).
Bhattacharya (2001) rightly points to the fact that in an increasing rate regime, quality borrowers would switch over to other avenues such as capital markets, internal accruals for their requirement of funds. Under such circumstances, banks would have no option but to dilute the quality of borrowers thereby increasing the probability of generation of NPAs.
In another study, Mohan (2003) observed that lending rates of banks have not come down as much as deposit rates and interest rates on Government bonds. While banks have reduced their prime lending rates (PLRs) to some extent and are also extending sub-PLR loans, effective lending rates continue to remain high. This development has adverse systemic implications, especially in a country like India where interest cost as a proportion of sales of corporate are much higher as compared to many emerging economies.
The problem of NPAs is related to many internal and external factors confronting the borrowers (Muniappan, 2002). The internal factors are diversion of funds for expansion/diversification/modernization, taking up new projects, helping/promoting associate concerns, time/ cost overruns during the project implementation stage, business failure, inefficient management, strained labour relations, inappropriate technology/technical problems, product obsolescence, etc., while external factors are recession, non-payment in other countries, inputs/power shortage, price escalation, accidents and natural calamities.

65
In the Indian context, Rajaraman and Vasishtha (2002) in an empirical study provided an evidence of significant bivariate relationship between an operating inefficiency indicator and the problem loans of public sector banks. In a similar manner, largely from lenders’ perspective, Das and Ghosh (2003) empirically examined non-performing loans of India’s public sector banks in terms of various indicators such as asset size, credit growth and macroeconomic condition, and operating efficiency indicators. Sergio (1996) in a study of non-performing loans in Italy found evidence that, an increase in the riskiness of loan assets is rooted in a bank’s lending policy adducing to relatively unselective and inadequate assessment of sectorial prospects. Interestingly, this study refuted that business cycle could be a primary reason for banks’ NPLs. The study emphasized that increase in bad debts as a consequence of recession alone is not empirically demonstrated. It was viewed that the bank-firm relationship will thus; prove effective not so much because it overcomes informational asymmetry but because it recoups certain canons of appraisal. In a study of loan losses of US banks, McGovern (1993) argued that ‘character’ has historically been a paramount factor of credit and a major determinant in the decision to lend money.
Banks have suffered loan losses through relaxed lending standards, unguaranteed credits, the influence of the 1980s culture, and the borrowers’ perceptions. It was suggested that bankers should make a fairly accurate personality-morale profile assessment of prospective and current borrowers and guarantors.
Besides considering personal interaction, the banker should:(i) try to draw some conclusions about staff morale and loyalty,(ii) Study the person’s personal credit report,(iii) Do trade-credit reference checking,(iv) Check references from present and former bankers, and(v) Determine how the borrower handles stress.
In addition, banks can minimize risks by securing the borrower’s guarantee, using Government guaranteed loan programs, and requiring conservative loan-to-value ratios. Bloem and Gorter (2001) suggested that a more or less predictable level of non-performing loans, though it may vary slightly from year to year, is caused by an inevitable number of ‘wrong economic decisions’ by individuals and plain bad luck (inclement weather, unexpected price changes for certain products, etc.). Under such circumstances, the holders of loans can make an allowance for a normal share of non-performance in the form of bad loan provisions, or they may spread the risk by taking out insurance. Enterprises may well be able to pass a large portion of these costs to customers in the form of higher prices. For instance, the interest margin applied by financial institutions will include a premium for the risk of non-performance on granted loans.
At this time, banks’ non-performing loans increase, profits decline and substantial losses to capital may become apparent. Eventually, the economy reaches a trough and turns towards a new expansionary phase, as a result the risk of future losses reaches a low point, even though banks may still appear relatively unhealthy at this stage in the cycle.
Gupta’s study (1983) on a sample of Indian companies financed by ICICI concludes that certain cash flows coverage ratios are better indicators of corporate sickness.
Classification of NPANPA may be classified into Gross NPA and Net NPA. Gross NPA is the total of substandard advances, doubtful assets and loss assets. Literature focused on post-liberalization period mainly focused on trends in movement of NPA, its major reasons, impact and effectiveness of various NPA management measures. Most of these studies utilized NPA ratios to derive conclusions on NPA in post-liberalization period.
Factors Responsible for NPAVarious reasons can be cited for an account becoming NPA. An asset turns to NPA when the borrower fails to repay the interest and/or principal on agreed terms. The causes for NPA are classified differently; into systematic and situational causes (Istrate et al 2007) into overhand component and incremental component (Poongavanam, S. 2000; Kumar, BS. 2005), into internal and external factors (Misra and Dhal. 2011; Muniappan. 2002), into random and non-random factors (Biswas and Deb, 2005) based on its effects (Islam, et al. 2005) and into bank-specific business and

66
institutional environment factors (Boudriga et al, 2009). The reasons classified into internal factors and external factors are more common in literatures.
With regard to the reasons for NPA, Reddy, PK (2002) opined that the problem of NPA is not mainly because of lack of strict prudential norms, but due to legal impediments, postponement of the problem by the banks to show higher returns and manipulation by the debtors using political influence. Reddy briefed that macro-factors that includes real effective exchange rate and growth in real GDP affect the level of NPAs. With regard to the bank specific variables, the authors found that banks which charges relatively higher real interest rates and have a penchant for taking on risk tends to experience greater non-performing loans. Gopalakrishnan, TV (2005) classified the causes for NPA into political, economic, social and technological. The author opined that neglect of proper credit appraisal, lack of follow-up and supervision, recessional pressures in economy, change in government policies, infrastructural bottlenecks, and diversion of funds etc. as the major cause for NPA.
Aggarwal and Mittal (2012) pointed out that the major reasons for NPA includes improper selection of borrowers activities, weak credit appraisal system, industrial problems, inefficient management, slackness in credit management and monitoring, lack of proper follow-up, recessions and natural calamities and other uncertainties.
Espinoza, R and Prasad, A (2010) emphasized that financial system shocks emanate from firm specific factors and from macroeconomic imbalances. Fainstein, G (2011) classified reasons for NPA into macroeconomic, banking sector and also microeconomic level variables. Further he says that various factors like political, economic, social and technological reasons are also responsible for NPA. The economic causes are further classified in internal and external causes. In a similar study on NPA, Collins, NJ and Wanjau, K (2011) explained a direct relationship between interest rate and NPA. The study noted that interest rate spread affect performing assets in banks as it increases the cost of loans charged on the borrowers, regulations on interest rates have far reaching effects on assets non-performance, for such regulations determine the interest rate spread in banks and also help mitigate moral hazards incidental to NPAs.
To mention some of the important reasons for NPA, as summarized in various literatures are below: 1. Wilful defaults, siphoning of funds, fraud, disputes, management disputes, mismanagement, misappropriation of funds etc. 2. Lack of proper pre-appraisal and follow up. 3. Improper selection of borrowers/activities. 4. Inadequate working capital leading to operational issues. Under financing/ untimely financing. 5. Delay in completing the project. 6. Non-compliance of terms and conditions. 7. Poor debt management by the borrower, leading to financial crisis. 8. In-ability of the corporate to raise capital through the issue of equity or other debt instrument from capital markets. 9. Business failures. 10. Failures to identify problems in advance. 11. Diversion of funds for expansion/ modernization/ setting up new projects/ helping or promoting sister concerns. 12. Deficiencies on the part of the banks viz. in credit appraisal, monitoring and follow-ups, delay in settlement of
payments/ subsidiaries by government bodies etc., 13. Time involved in the legal process and realization of securities.
Impact of NPA Batra, S (2003) mentioned that the most important business implication of the NPAs is that it leads to the credit risk management assuming priority over other aspects of bank’s functioning. The bank’s whole machinery would thus be pre-occupied with recovery procedures rather than concentrating on expanding business. RBI, through various circulars, stipulated guidelines to manage NPA. This view was supported by Yadav, MS (2011) and stated that higher NPA engage banking staff on recovery measures which includes filing suits to recover loan amount instead of devoting time for planning to mobilization of funds. Thus NPA affects the performance and profitability of banks. The most notable impact of NPA is change in banker’s attitude which may hinder credit expansion to productive purpose. Banks may incline towards more risk-free investments to avoid and reduce riskiness, which is not conducive for the growth of economy.

67
Sethi, J and Bhatia, N (2007), clarified on implications of NPA accounts that Banks cannot credit income to their profit and loss account to the debit of loan account unless recovery thereof takes place. Interest or other charges already debited but not recovered have to be provided for and provision on the amount of gross NPAs also to be made. All the loan accounts of the borrower would be treated as NPA, if one account is NPA. Many authors emphasized the straddling impact of NPA and stressed its impact on loan growth. A higher NPA force banks to invest in risk-free investments, thus directly affect the flow of funds for productive purpose.
Bloem et al (2001) remarked that issues relating to NPA affect all sectors (in particular if parallel issues with defaulting trade credit is also considered). The most serious impact, however, is on the financial institutions, which tend to own large portfolios, indirectly; the customers of these financial intermediaries are also implicated; deposit holders, shareholders and so forth. Add to this, NPA is not only affecting the banks and its intermediaries, it is having impact on the development of the nation as well. For a bank, NPA means unsettled loan, for which they have to incur financial losses. The cost for recovering NPA is as well considerable. There are banking failures on account of the mounting NPA since it is affecting the profitability and long run survival of the bank. In the seminal study on ‘credit policy’, systems, and culture’, Reddy (2004) raised various critical issues pertaining to credit delivery mechanism of the Indian banking sector. The study focused on the terms of credit such as interest rate charged to various productive activities and borrowers, the approach to risk management, and portfolio management in general. There are three pillars on which India’s credit system was based in the past; fixing of prices of credit or interest rate as well as quantum of credit linked with purpose; insisting on collateral; and prescribing the end-use of credit. Interest rate prescription and fixing quantum has, however, been significantly reduced in the recent period.
The study also highlighted the issues in security-based or collateralized lending, which need careful examination in the context of growing services sector. Given the fungibility of resources, multiple sources of flow of resources, as well as application of funds, the relevance and feasibility of end-use restrictions on credit need a critical review. The link between formal and informal sectors shows that significant divergence in lending terms between the two sectors still persists, despite the fact that the interest rate in informal markets is far higher than that of the formal sectors- the banking sector. The convergence between formal and informal sectors could be achieved by pushing the supply of credit in the formal sector following a supply leading approach to reduce the price or interest rate. Furthermore, in the context of NPAs on account of priority sector lending, it was pointed out that the statistics may or may not confirm this. There may be only a marginal difference in the NPAs of banks’ lending to priority sector and the banks’ lending to private corporate sector. Against this background, the study suggested that given the deficiencies in these areas, it is imperative that banks need to be guided by fairness based on economic and financial decisions rather than system of conventions, if reform has to serve the meaningful purpose. Experience shows that policies of liberalization, deregulation and enabling environment of comfortable liquidity at a reasonable price do not automatically translate themselves into enhanced credit flow.
Although public sector banks have recorded improvements in profitability, efficiency (in terms of intermediation costs) and asset quality in the 2000, they continue to have higher interest rate spreads but at the same time earn lower rates of return, reflecting higher operating costs (Mohan, 2004). Consequently, asset quality is weaker so that loan loss provisions continue to be higher. This suggests that, whereas, there is greater scope for enhancing the asset quality of banks, in general, public sector banks, in particular, need to reduce the operating costs further. The tenure of funds provided by banks either as loans or investments depends critically on the overall asset-liability position. An inherent difficulty in this regard is that since deposit liabilities of banks often tend to be of relatively shorter maturity, long term lending could induce the problem of asset-liability mismatches. The maturity profile of commercial bank deposits shows that less than one fifth is of a tenor of more than three years. On the asset side, nearly 40 per cent has already been invested in assets of over three year maturity. Banks also have some capacity to invest in longer term assets, but this capacity will remain highly limited until the fiscal deficit remains as high as it is and the Government demand for investment in long dated bonds remains high. Some enhancement of their capacity to invest in infrastructure, industry and agriculture in longer gestation projects can be achieved by allowing a limited recourse to longer term bond issues.
Karunakar, M et al (2008) explained that NPA results in deleterious impact on the return on assets. It happens in the following ways;a) The interest income of banks will fall and it is to be accounted only on receipt basis.
68
b) Banks profitability is affected adversely because of the provision of doubtful debts and consequent write off as bad debts. c) Return on Investment (ROI) is reduced. d) The capital adequacy ratio is disturbed as NPAS are entering into the calculation. e) The cost of capital will go up. f) The assets and liability mismatch will widen. g) The economic value additions by banks gets upset because it is equal to the net operating profit minus cost of
capital, and h) It limits recycling of the funds.
Management of NPARanjan and Dhal (2003) opined that horizon of maturity of credit, better credit culture, favourable macroeconomic and business conditions lead to lowering of NPAs. In its annual report (2010) RBI noted that “management of NPA by banks remains an area of concern, particularly, due to the likelihood of deterioration of the quality of restructured advances”. The NPA of banks is an important criterion to assess the financial health of banking sector. It reflects the asset quality, credit risk and efficiency in the allocation of resources to the productive sectors. Ahmed, JU (2010) noted that since the reform regime there has been various initiatives to contain growth of NPA to improve the asset quality of the banking sector. Commercial banks have envisaged the greatest renovation in their operation with the introduction of new concepts like income recognition, prudential accounting norms and capital adequacy ratio etc. which have placed them in new platform. The growing competition from internal and external constituents and sluggish growth in economy coupled with poor credit-deposit ratio, the large volume of NPAs in the balance sheet and lack of automation and professionalization in the operation have been affecting the banking situation in the country.
Murinde, V and Yaseen, H (2004) on management of NPA made it clear that the traditional approaches to bank regulation are not conducive for management of NPA. These approaches emphasized the view that the existence of capital adequacy regulation plays a crucial role in the long-term financing and solvency position of banks, especially in helping the banks to avoid bankruptcies and their negative externalities on the financial system. In general, capital or net worth serves as a buffer against losses and hence failure. Rather than accommodating measures to combat the NPA issues, the traditional measures tried to protect the interests of deposits through maintaining adequate capital in liquid form. This has affected the availability of funds for productive purpose, since banks were not able to lend it, rather forced to keep as reserves.
One of the central issues facing emerging markets and developing economies is strengthening the financial systems. This is because sound financial systems serve as an important channel for achieving economic growth through the mobilization of financial savings, putting them to productive use and transforming various risks. Borbora, RR (2007) emphasized that the essential components of sound NPA management are- i) quick identification of NPAs, ii) their containment at a minimum level and iii) ensuring minimum impact of NPAs on the financials.
Panta, R (2007) noted that all kinds of lending involves three stages where discretion needs to be exercised (a)Evaluation and assessment of the proposal (b) Timely monitoring and evaluation and (c) Proper assessment of exit decision and modality. (Reserve Bank of India Occasional Papers Vol. 24, No. 3, Winter 2003)
Non-Performing Loans and Terms of Credit of Public Sector Banks in India: An Empirical Assessment Rajiv Ranjan and Sarat Chandra Dhal
In an another study, Mohan (2003) observed that lending rates of banks have not come down as much as deposit rates and interest rates on Government bonds. While banks have reduced their prime lending rates (PLRs) to some extent and are also extending sub-PLR loans, effective lending rates continue to remain high. This development has adverse systemic implications, especially in a country like India where interest cost as a proportion of sales of corporates are much higher as compared to many emerging economies. The problem of NPAs is related to several internal and external factors confronting the borrowers (Muniappan, 2002). The internal factors are diversion of funds for expansion/diversification/ modernization, taking up new projects, helping/promoting associate concerns, time/cost overruns during the project implementation stage, business (product, marketing, etc.) failure, inefficient management, strained labour relations, inappropriate technology/technical problems, product obsolescence, etc., while external
69
factors are recession, non-payment in other countries, inputs/power shortage, price escalation, accidents and natural calamities.
Besides considering personal interaction, the banker should (i) try to draw some conclusions about staff morale and loyalty, (ii) study the person’s personal credit report, (iii) do trade-credit reference checking, (iv) check references from present and former bankers, and (v) determine how the borrower handles stress. In addition, banks can minimize risks by securing the borrower’s guarantee, using Government guaranteed loan programs, and requiring conservative loan-to-value ratios. Bloem and Gorter (2001) suggested that a more or less predictable level of non-performing loans, though it may vary slightly from year to year, is caused by an inevitable number of ‘wrong economic decisions’ by individuals and plain bad luck (inclement weather, unexpected price changes for certain products, etc.). Fuentes and Maquieira (1998) undertook an in-depth analysis of loan losses due to the composition of lending by type of contract, volume of lending, cost of credit and default rates in the Chilean credit market. Their empirical analysis examined different variables which may affect loan repayment: (a) limitations on the access to credit; (b) macroeconomic stability; (c) collection technology; (d) bankruptcy code; (e) information sharing; (f) the judicial system; (g) pre-screening techniques; and (h) major changes in financial market regulation. They concluded that a satisfactory performance of the Chilean credit market, in terms of loan repayments hinges on a good information sharing system, an advanced collection technology, macroeconomic performance and major changes in the financial market regulation. In another study of Chile, Fuentes and Maquieira (2003) analysed the effect of legal reforms and institutional changes on credit market development and the low level of unpaid debt in the Chilean banking sector. Using time series data on yearly basis (1960-1997), they concluded that both information sharing and deep financial market liberalization were positively related to the credit market development. They also reported less dependence of unpaid loans with respect to the business cycle compared to interest rate of the Chilean economy. Altman, Resti and Sironi (2001) analysed corporate bond recovery rate adducing to bond default rate, macroeconomic variables such as GDP and growth rate, amount of bonds outstanding, amount of default, return on default bonds, and stock return. It was suggested that default rate, amount of bonds, default bonds, and economic recession had negative effect, while the GDP growth rate, and stock return had positive effect on corporate recovery rate.
Lis, et.al.,(2000) used a simultaneous equation model in which they explained bank loan losses in Spain using a host of indicators, which included GDP growth rate, debt-equity ratios of firms, regulation regime, loan growth, bank branch growth rates, bank size (assets over total size), collateral loans, net interest margin, capital asset ratio (CAR) and market power of default companies. They found that GDP growth (contemporaneous, as well as one period lag term), bank size, and CAR, had negative effect while loan growth, collateral, net-interest margin, debt-equity, market power, regulation regime and lagged dependent variable had positive effect on problem loans. The effect of branch growth could vary with different lags.
Kent and D’Arcy (2000) while examining the relationship between cyclical lending behaviour of banks in Australia argued that, the potential for banks to experience substantial losses on their loan portfolios increases towards the peak of the expansionary phase of the cycle. However, towards the top of the cycle, banks appear to be relatively healthy - that is, non-performing loans are low and profits are high, reflecting the fact that even the riskiest of borrowers tend to benefit from buoyant economic conditions. While the risk inherent in banks’ lending portfolios peaks at the top of the cycle, this risk tends to be realized during the contractionary phase of the business cycle. At this time, banks’ non-performing loans increase, profits decline and substantial losses to capital may become apparent. Eventually, the economy reaches a trough and turns towards a new expansionary phase, as a result the risk of future losses reaches a low point, even though banks may still appear relatively unhealthy at this stage in the cycle.
Jimenez and Saurina (2003) used logit model for analysing the determinants of the probability of default (PD) of bank loans in terms of variables such as collateral, type of lender and bank-borrower relationship while controlling for the other explanatory variables such as size of loan, size of borrower, maturity structure of loans and currency composition of loans. Their empirical results suggested that collateralized loans had a higher PD, loans granted by savings banks were riskier and a close bank-borrower relationship had a positive effect on the willingness to take more risk. At the same time, size of bank loan had a negative effect on default while maturity term of loans, i.e., short-term loans of less than 1-year maturity had a significant positive effect on default. The brief review of the literature is used to formulate

70
theoretical analysis of non-performing loans undertaken in Section III. The following section highlights the underlying cross-section differences across banks in India using some stylized facts about banks non-performing assets, credit portfolio, and terms of credit, particularly, cost conditions.
To add few more views expressed on the research topic, number of researchers who have studied on the issue of NON- PERFORMING ASSET in banking industry opined as; Krishnamurthy, C.V.(2000) observed that the rising NON- PERFORMING ASSETS is serious diseases for the public sector banks .It shows that the gross NON-PERFORMING ASSETs of PUBLIC SECTOR BANKS are mounting very heavily. The NON-PERFORMING ASSET curses lie between a gross of Rs. 39,253 crores in 1992 -93 to Rs. 45, 463 crores in1997-98.
Munniappan (2002) studied the diseases of NON-PERFORMING ASSET into two factors. One is internal factor in respect of portfolio of funds for expansion, modernization and diversification, accept new projects etc. Second is external factor in respect of recession in economy, other countries suffered from non-performing assets assessment, input/power shortage, price up and downs uncertain natural calamities etc.
Das & Ghosh (2003) studied non-performing loans of Indian PUBLIC SECTOR BANKS on the basis of various indicators like as assets size, operating efficiency, and macroeconomics condition and credit growth.
Gupta, S and Kumar, S (2004) defined that redeeming features of banking sector reforms is the continuing downfall in gross and net NON-PERFORMING ASSET as a proportion of total assets for all bank groups. NON-PERFORMING ASSETS needs resolution otherwise it can break the backbone of entire economic system with financial system.
Banerjee and Dan, A. K (2006) analysed that NON-PERFORMING ASSETs are one of the most crucial problem which is faced by bank to require attention for improvement in the management of PSBs are increasing very speedily at present scenario due to following reason one is government has got to bail out banks with monetary fund provisions sporadically and ultimately taxpayers bear the value. Second is cash borrowed for investment, for not utilized properly, affects the creation of assets and therefore the growth of economy is vulnerable. The author has urged many strategic measures to manage Non playing assets of Public sector banks.
Jatna, Ranu (2009) states main cause of mounting NPAs in public sector banks is due to malfunctioning of the banks. Narasimham Committee identified the NON-PERFORMING ASSETs as one of the possible effects of malfunctioning of PUBLIC SECTOR BANKS.
Dong he (2002) in his study focuses on the nature of NON-PERFORMING ASSET in Indian banking system and define the important role of assets reconstruction companies in resolving NPAs.
Prof G.V.Bhavani Prasad and Veera D (2011) examined that the reason behind the falling revenues from traditional sources is 78% of the total NPAs accounted in PUBLIC SECTOR BANKS.
Dr. P. Hosmani & Hudagi Jugdish (2011) found that a slight improvement in the asset quality reflected by downsize in the NON-PERFORMING ASSET percentage. NPA is an improvement scale for assessing financial performance of Indian banks. The mounting value of NPAs will adversely affected to financial position in term of liquidity, profitability and economic of scale in operation. Bank has to take timely necessary steps against degradation of good performing assets.
Manish B Raval (2012) studies to understand the major composition of NON-PERFORMING ASSET in Indian Banks and compared the three compositions i.e. Priority sector, Non Priority sector and others sector of NPAs between Nationalized and SBI and its associates. The researcher stated that there is no significant difference between three compositions of NPAs to total NON-PERFORMING ASSETS in nationalized banks and SBI and its associates.
Dr. A. Dharmendran (2012) examine the position & growth of standard assets ,substandard assets, loss assets ,gross non-performing assets provision for non-performing assets & net non-performing assets with the help of percentage analysis method & compound growth rate for all the state Co-operative banks in India.

71
To conclude, the above reviewed views and opinions expressed by eminent economist’s financial analysts and scholars on the topic “Management of NPAs in Banks and Financial institutions “highlights the issues involved in it. They also suggested various measures to be taken to reduce NPAs and recovery procedures to be adopted with the help of legislations and DRT. The researcher is intended and interested to explore the intricacies of the problems relating to NPAs and expose the existing lacuna in recovery procedure. The research study which is divided into Six Chapters and findings will really strengthen the arms of Banks and Financial institutions.
References• Aggarwal J.C. Educational Research – and Introduction 1975, Vikas Publishing House Pvt.Ltd. New Delhi.• John W.Best and James V.Kahn, Research in Education, 1987, Prentice Hall of India Ltd. New Delhi.• Mouly George J. The Science of Research, 1990, Eurasia Publishing House Pvt. Ltd. New Delhi.• Aggarwal, S., & Mittal, P. (2012). Non-Performing Asset: Comparative Position of Public and Private Sector Banks in
India, International Journal of Business and Management Tomorrow, Vol.2 (1). • Ahmed, JU. (2010). An Empirical Estimation of Loan Recovery and Asset Quality of Commercial Banks, The NEHU
Journal, Vol.8(1) • Batra, S. (2003). Developing the Asian Markets for Non-Performing Assets; Developments in India, 3rd Forum on
Asian Insolvency Reform, Seoul, Korea • Biswas, PK., & Deb, AT. (2005). Determinants of NPAs in the Indian Public Sector Banks: A Critique of Policy Reforms,
[Online], URL: oii.igidr.ac.in:8080/dspace/bitstream/2275/131/1/biswasdeb.doc • Bloem, M., & Gorter, N. (2001). The treatment of Non Performing Loans in Macro Economic Statistics, IMF Working
Paper, WP/01/209. •Borbora. (2007). Management of Non-Performing Assets (NPAs) in the Urban Cooperative Banks (UCBs), Reserve
Bank of India, [Online], URL: http://www.cab.org.in/Lists/Knowledge%20Bank/Attachments/26/NPA%20MANAGEMENT.pdf • Boudriga, A., Taktak, NB., & Jellouli, S. (2009). Bank specific business and institutional environment determinants of
nonperforming loans: Evidence from MENA countries, ERF 16th Annual Conference on Shocks, Vulnerability and Therapy, November 2009.
• Chaudhary, S., & Singh, S. (2012). Impact of Reforms on the Asset Quality in Indian Banking, International Journal of Multidisciplinary Research Vol.2(1).13-31.
•Chijoriga, M.M. (2000). The Interrelationship Between Bank Failure and Political Interventions in Tanzania in the Pre-Liberalization Period, African Journal of Finance and Management, Vol.9(1), 14-30.
• Collins, NJ., & Wanjau, K. (2011). The Effects of Interest Rate Spread on the Level of Non-Performing Assets: A Case of Commercial Banks in Kenya, International Journal of Business and Public Management Vol. 1(1).
•Dash, MK., & Kabra, G. (2010). The Determinants of Non-Performing Assets in Indian Commercial Banks: an Econometric Study, Middle Eastern Finance and Economics, Issue 7 (2010).
•Espinoza, R., & Prasad, A. (2010). Non Performing Loans in the GCC Banking System and their Macro Economic Effects, IMF Working Paper series, WP/10/224.
•Fainstein, G. (2011). The Comparative Analysis of Credit Risk Determinants - In the Banking Sector of the Baltic States, Review of Economics & Finance, March 2011.
•Gopalakrishnan, T.V. (2005). Management of Non Performing Advances, 1st Revised Edition, Mumbai, Northern Book Centre publication,
•Heid, F., & Kruger, U. (2011). Do Capital buffers mitigate volatility of bank lending? A simulation study, Discussion Paper Series 2 Banking and Financial Studies N0 03/2011
• Islam. Shofiqul., M. Chandra, S., & Abdul, M. (2005). Non Performing Loans - Its causes, Consequences and Some Learning, MPRA Paper No. 7708
•Istrate, E., Gupta,D.D., & Weissburg, P (2007). Toward Developing a Structured Approach to the Diagnosis and Resolution of Nonperforming Loans: The Case of China and India, Review of Policy Research Volume 24, Issue 4, pages 345–365, July 2007
•Karunakar, M., Vasuki, K., & Saravanan, S. (2008). Are non - Performing Assets Gloomy or Greedy from Indian Perspective?, Research Journal of Social Sciences, 3: 4-12, 2008
• Kumar, B.S. (2005). Non-Performing Assets in Indian Banks, [Online], URL: http://www.indianmba.com/Faculty_Column/FC212/fc212.html
• Lending and Its Implications for Monetary Policy, OECD Economics Department Working Paper No. 107.

72
• Michael, JN., Vasanthi, G., & Selvaraju, R. (2006). Effect of Non-Performing Assets on Operational Efficiency of Central-Cooperative Banks, Indian Economic Panorama, Vol. 16(3). 33-39
• Misra, B.M., & Dhal, S. (2011). Pro-cyclical Management of Banks’ Non-Performing Loans by the Indian Public Sector Banks, [Online] : http://www.bis.org/repofficepubl/arpresearch201003.08.pdf
• Muniappan, G. (2002). The NPA Overhang, Magnitude, Solutions and Legal reforms, Reserve Bank of India • Murinde, V., & Yaseen, H. (2004). The Impact of Basle Accord Regulations on Bank Capital and Risk Behaviour: 3D
Evidence from the Middle East and North Africa (MENA) Region, 3rd International Conference of the Centre for Regulation and Competition (CRC) on “Pro-Poor Regulation & Competition: Issues, Policies and Practices”.
• O”Brien, P.F., & Browne, F. (1992). A “Credit Crunch”? The recent Slowdown in Bank Lending and Its Implications for Monetary Policy, OECD Economics Department Working Paper No. 107.
• Panta, R., (2007). Challenges in Banking: A Nepalese Diaspora, Socio-Economic Development Panorama, Vol. 1(2), 9 -22
• Reddy, P.K., (2002). A comparative study of Non Performing Assets in India in the Global context - similarities and dissimilarities, remedial measures [Online], URL:
http://unpan1.un.org/intradoc/groups/public/documents/apcity/unpan013132.pdf • Poongavanam. S. (2011). Non performing assets: Issues, Causes and remedial Solution, Asian Journal of
Management Research, Vol.2 (1). • Rajaraman, I., & Vasishtha, G. (2002). Non-Performing Loans of PSU Banks, Some Panel Results, Economic and
Political Weekly, Vol.37(5), 2-8. • Reserve Bank of India (2010), Trend and Progress of Banking in India • Sethi, J., & Bhatia, N. (2007). Elements of Banking and Insurance, 2nd Edition, Prentice Hall India Publications • Thiagarajan, S., Ayyappan, S., & Ramachandran, A. (2011). Credit Risk Determinants of Public and Private Sector
Banks in India, European Journal of Economics, Finance and Administrative Sciences, Issue 34. • Tracey, M., & Leon, H. (2011). The Impact of Non-performing Loans on Loan growth, IMF working Paper. • Yadav, M.S. (2011), Impact of Non Performing Assets on Profitability and Productivity of Public Sector Banks in India,
AFBE Journal, Vol.4, No. 1
Authored byBharat. D. Dhongade
B.Sc., LLB, MSW, CAIIB, PGDCL, LLM

eMBA Finance - ACCA (UK) Be an Expert International Accounting and
Business management Professional
MET provides you a unique career opportunity in Global Finance. MET and ACCA (Association of Chartered Certified Accountants) have collaborated to launch eMBA Finance – ACCA (UK) which is a two year campus based programme. It will offer a unique combination of learnings from core management verticals like Marketing, Finance and HR as well as in depth study of global accounting, auditing and complexities of international financial regulatory and operative systems.
eMBA Finance - ACCA (UK), will sharpen you as a global Accounting and Business professional, equipped to meet the challenges of the dynamic international financial sector. ACCA's wealth of Accounting (Finance), business knowledge and rich experience derived from its worldwide presence, coupled with MET's education experience of over two decades that meets international standards, will launch you in the global arena.
Presenting ACCA (UK)ACCA (UK) is the global body for professional accountants which offers business-relevant, first-choice qualifications, ability and ambition around the world to those who seek rewarding careers in accountancy, finance and management. Founded in 1904, ACCA has consistently held unique core values: opportunity, diversity, innovation, integrity and accountability.
The global reputation of ACCA is so strong that now ACCA has over 170,000 members and 436,000 students in 180 countries. They also work with over 8,500 approved employers and over 77 accountancy partnerships worldwide.
Get the International Edge with Global Emba Finance - ACCA (UK):�Increases your earning potential�Improves your career progression�Provides you international opportunities
At the end of two years with MET, you will be awarded: �eMBA qualification from MET�Diploma in Accounting and Business from ACCA�Advance Diploma in Accounting and Business from ACCA�B.Sc. in Applied Accounting from Oxford Brooks University �Professional qualification and membership from ACCA. (For more information contact - Dr. Nirmala Joshi at 022-39554280 or email : [email protected] )
MET, Mumbai & ACCA, UK
THE RIGHT COMBINATION TO UNLOCK YOUR GLOBAL CAREER
eMBA Finance - ACCA (UK)
73

MET provides a unique career opportunity in Global Business Management with work exposure in Canada. MET and Sprott Shaw College have collaborated to launch a new vertical eMBA– Global Business Management which is a four semester campus based programme. It will offer a unique combination of learnings from core management verticals like Marketing, Finance and HR as well as in depth study of business management practices in marketing, HR, supply chain, etc. with Global perspective.
eMBA-Global Business Management provides an internationally focused body of knowledge and skill for individuals interested in extending their business understanding beyond the domestic environment. It will sharpen students as a global Business professional, equipped to meet the challenges of the dynamic international trade.
The Dual Credential Program
The dual certification course form Sprott Shaw College and Conestoga college in Canada, with their business knowledge and rich experience derived from the worldwide presence, coupled with MET's education experience of over two decades that meets international standards, will launch you in the global arena. The program will allow students to be enrolled in both colleges simultaneously and receive a credential from both. This program will be recognize across Canada and internationally and equip students with industry-standard skills in fast growing sectors.
Presenting Sprott Shaw College
Sprott Shaw provides relevant skills that enable graduates to find meaningful jobs in high-growth industries. Founded in 1903, Sprott Shaw College is one of the largest colleges in British Columbia, Canada with 13 campuses in communities including Vancouver, Kelwna and Victoria. Sprott Shaw College has been a Better Business Bureau (BBB) Accredited Business since 1992. BBB has determined that Sprott Shaw College meets BBB accreditation standards, which include a commitment to make a good faith effort to resolve any consumer complaints. BBB assigns letter grades from A+ (highest) to F (lowest), Sprott Shaw has an A+ rating. Besides that it is accredited by Education Quality Assurance (EQA) and member of professional organizations such as PCTIA, AHLA, FITT, BCCIE, CLPNBC, ECE.
Sprott Shaw College has consistently held unique core values: opportunity, diversity, innovation, integrity and accountability. There are more than 5000 students currently studying in different campuses with approx. 800 international students from 40 different countries.
Conestoga College's Institute of Technology and Advanced Learning is a leader in polytechnic education and one of Ontario's fastest growing public college. Established in 1967, Conestoga serves approximately 12,000 full time students including 1200 international students from 60 countries, through campuses and training centres across southern Ontario.
Get The International Edge With eMBA Global Business Management
�Increases your earning potential
�Improves your career progression
�Provides you international opportunities
At the end of the course with MET, you will be awarded:
�eMBA qualification from MET
�Post Graduate Diploma in Global Business Management from Sprott Shaw College
�Post Graduate Diploma in Global Business Management from Conestoga College.
�3 Years Work Permit and other residential benefits in Canada
(For more information contact - Dr. Nirmala Joshi at 022-39554280 or email : [email protected] )
A Unique opportunity for career in eMBA Global Business Management
with Sprott Shaw College, Canada and at MET, Mumbai
74

75
is the key in your MBA
LEAD THE E-COMMERCE WAVE FOR GLOBAL SUCCESSThe most innovative and technically advanced PG level campus-based autonomous
programmes in digitally e-empowered Management and Business Administration (eMBA)
• Marketing • Finance • HR • Digital Business • Insurance - The CII, UK• BFSI (Banking, Financial Services & Insurance) • Finance - ACCA, UK
Futuristic eMBA
The MET Edge: International alliances with USA, UK, Australia, New Zealand, South Africa, Canada • Record placements/internships world over • Global alumni base • Experiential holistic learnings • Delivering latest e-commerce tools based on SMAC (Social Networks, Mobile Applications, Analytics & Cloud) • Ph.D. Centre
MOUs for global academic collaborations and international training with
THE CHARTERED
INSURANCE INSTITUTE
TH BEST INDIA’S
MARKETING COMMUNICATIONS
& ADVERTISING MANAGEMENT SCHOOLThe Edutainment Show 2015

ISO 9001:2008 certified, MET is an NGO in Special Consultative Status with United Nations (ECOSOC).
MET Institute of Management Bhujbal Knowledge Centre
Bandra Reclamation, Bandra (W), Mumbai 400 050.Tel: (+91 22) 39554280/232/358/286 | Telefax: (+91 22) 2644 0082
Toll free: 1800 22 0234 | email: [email protected] | www.met.edu