Mesoscale circulation systems and ozone concentrations during ESCOMPTE: a case study from IOP 2b
26
Mesoscale circulation systems and ozone concentrations during ESCOMPTE: a case study from IOP 2b N. Kalthoff a, * , C. Kottmeier a , J. Thqrauf a , U. Corsmeier a , F. SaZd b , E. Fre ´jafon c , P.E. Perros d a Institut fu ¨r Meteorologie und Klimaforschung, Forschungszentrum Karlsruhe/Universita ¨t Karlsruhe, Postfach 3640, 76021 Karlsruhe, Germany b Laboratoire d’Ae ´rologie, UPS/CNRS, UMR 5560 Toulouse, France c INERIS, Verneuil en Halatte, France d LISA, Universite ´ de Paris XII, UMR 7583, Cre ´teil, France Received 31 July 2003; received in revised form 30 November 2003; accepted 30 April 2004 Abstract The main objective of dExpe ´rience sur Site pour COntraindre les Mode `les de Pollution atmosphe ´rique et de Transport d’EmissionsT (ESCOMPTE) is to generate a relevant data set for testing and evaluating mesoscale chemistry-transport models (CTMs). During ESCOMPTE, measurements have been performed at numerous surface stations, by radars and lidars, and several aircraft in the planetary boundary layer. The data from these different sources have been merged to obtain a consistent description of the spatial distribution of wind, temperature, humidity, and ozone for the photosmog episode on June 25, 2001 (IOP 2b). On this day, moderate synoptic winds favour the evolution of different mesoscale circulation systems. During daytime, the sea breeze penetrates towards the north in the Rho ˆne valley. As the winds above the sea breeze layer come from the east, polluted air from the metropolitan area of Marseille leads to an increase of ozone at elevated layers above the convective boundary layer (CBL). At the mountainous station of Luberon about 55 km north of Marseille around noon, when the CBL top surpasses the height of the mountain summit, polluted air with ozone concentrations of about 120 ppbv arrived from southerly directions, thus indicating the passage of the city plume of Marseille. At Cadarache and Vinon in the Durance valley, about 60 km inland, the ozone maximum 0169-8095/$ - see front matter D 2004 Elsevier B.V. All rights reserved. doi:10.1016/j.atmosres.2004.04.006 * Corresponding author. Tel.: +49 7247 824230; fax: +49 7247 824377. E-mail address: [email protected] (N. Kalthoff). Atmospheric Research 74 (2005) 355 – 380 www.elsevier.com/locate/atmos
-
Upload
independent -
Category
Documents
-
view
1 -
download
0
Transcript of Mesoscale circulation systems and ozone concentrations during ESCOMPTE: a case study from IOP 2b
Atmospheric Research 74 (2005) 355–380
www.elsevier.com/locate/atmos
Mesoscale circulation systems and ozone
concentrations during ESCOMPTE: a case study
from IOP 2b
N. Kalthoff a,*, C. Kottmeiera, J. Thqrauf a, U. Corsmeiera, F. SaZdb,
E. Frejafonc, P.E. Perrosd
aInstitut fur Meteorologie und Klimaforschung, Forschungszentrum Karlsruhe/Universitat Karlsruhe,
Postfach 3640, 76021 Karlsruhe, GermanybLaboratoire d’Aerologie, UPS/CNRS, UMR 5560 Toulouse, France
cINERIS, Verneuil en Halatte, FrancedLISA, Universite de Paris XII, UMR 7583, Creteil, France
Received 31 July 2003; received in revised form 30 November 2003; accepted 30 April 2004
Abstract
The main objective of dExperience sur Site pour COntraindre les Modeles de Pollution
atmospherique et de Transport d’EmissionsT (ESCOMPTE) is to generate a relevant data set for
testing and evaluating mesoscale chemistry-transport models (CTMs). During ESCOMPTE,
measurements have been performed at numerous surface stations, by radars and lidars, and several
aircraft in the planetary boundary layer. The data from these different sources have been merged to
obtain a consistent description of the spatial distribution of wind, temperature, humidity, and ozone
for the photosmog episode on June 25, 2001 (IOP 2b).
On this day, moderate synoptic winds favour the evolution of different mesoscale circulation
systems. During daytime, the sea breeze penetrates towards the north in the Rhone valley. As the
winds above the sea breeze layer come from the east, polluted air from the metropolitan area of
Marseille leads to an increase of ozone at elevated layers above the convective boundary layer
(CBL). At the mountainous station of Luberon about 55 km north of Marseille around noon, when
the CBL top surpasses the height of the mountain summit, polluted air with ozone concentrations of
about 120 ppbv arrived from southerly directions, thus indicating the passage of the city plume of
Marseille. At Cadarache and Vinon in the Durance valley, about 60 km inland, the ozone maximum
0169-8095/$ -
doi:10.1016/j.
* Corresp
E-mail add
see front matter D 2004 Elsevier B.V. All rights reserved.
atmosres.2004.04.006
onding author. Tel.: +49 7247 824230; fax: +49 7247 824377.
ress: [email protected] (N. Kalthoff).
N. Kalthoff et al. / Atmospheric Research 74 (2005) 355–380356
at the surface and at flight level 920 m MSL appears between 14 and 15 UTC. At this time,
southwesterly valley winds prevail in the valley, while southerly winds occur above. This finding
highlights the height-dependent advection of ozone due to interacting mesoscale circulation systems.
These dynamical processes need to be represented adequately in CTMs to deliver a realistic
description of the ozone concentration fields.
D 2004 Elsevier B.V. All rights reserved.
Keywords: Summer smog; Ozone; Mesoscale circulation systems; ESCOMPTE; Marseille city plume
1. Introduction
Transport and dispersion of air pollutants are strongly influenced by meteorological
conditions. Over complex terrain, the meteorological conditions normally are a
combination of large-scale flow and orographically/thermally induced circulation systems,
such as land–sea breeze, slope winds, valley–mountain, and plain–plateau winds. These
latter mesoscale circulations are caused by non-homogeneous surface conditions and,
often, conditions for the evolution of more than one mesoscale circulation system exist at
one site. Hence, merging of the mesoscale circulation systems may contribute to long-
range transport of air masses (Kurita, 1990). In many cases, cities with large industrial
agglomerations are situated in coastal regions so that mesoscale circulation systems play
an important role for the ventilation of such areas and determine how far polluted air
propagates inland. The importance of mesoscale circulation systems to air pollutant
transport has already been emphasized by various investigations (Carroll and Baskett,
1979; Wakimoto and McElroy, 1986; Kurita et al., 1990; Klemm et al., 1998; Bischoff-
Gaug et al., 1998).
Airborne pollutants in transit do not only undergo diffusion, but also chemical
transformation and deposition. Therefore, highest concentrations of secondary pollutants
like ozone often do not appear in the vicinity of cities, but some tens of kilometres
downwind (Vogel et al., 1992; Imhoff et al., 1995; Corsmeier et al., 2002; Hammer et al.,
2002; Vautard et al., 2003). This means that both modelling of the mesoscale wind and
diffusion conditions as well as modelling of the chemical transformation are necessary for
a precise forecast of so-called summer smog episodes (Schaller et al., 2001). Up to now,
however, appropriate data sets for testing mesoscale chemistry-transport models (CTMs)
are scarce, especially over complex terrain (Cros et al., 2004), although some data sets
have been collected during recent experiments like MEDCAPHOT-TRACE (Ziomas,
1998), BERLIOZ (Becker et al., 2002; Corsmeier et al., 2002), PIPAPO (Neftel, 1999),
and ESQUIF (Menut et al., 2000), for Athens, Berlin, Milano and Paris, respectively, and
VOTALP (Wotawa and Kromp-Kolb, 2000) and MAP (Bougeault and Binder, 2002) for
the Alps.
The city of Marseille with 1.2 million inhabitants combines all features mentioned
above. As it is situated in the southeastern part of France on the Mediterranean coast with
mountains and valleys in the hinterland, sea breeze and mountain winds characterize the
meteorological conditions. High temperatures in summer and high emission rates of ozone
precursors favour the development of summer smog episodes. Therefore, the experiment
N. Kalthoff et al. / Atmospheric Research 74 (2005) 355–380 357
dExperience sur Site pour COntraindre les Modeles de Pollution atmospherique et de
Transport d’EmissionsT (ESCOMPTE) was performed in the area of Marseille in summer
2001, the main objective being to establish a detailed 4-D data set with air chemistry and
meteorological data for high pollution events (Cros et al., 2004).
This investigation focuses on one of the intensive operation periods, namely IOP 2b,
analysing the mesoscale circulation systems and the air pollutant distribution within the
planetary boundary layer (PBL) using surface, remote sensing, and airborne observation
data. The paper is structured as follows: In the next section, a site description is given,
including an overview of the synoptic conditions. In Section 3, mesoscale circulation
systems are investigated with respect to space and time, and in Section 4, the spatial ozone
distribution in conjunction with the meteorological situation is analysed.
2. Measurement area, available data, and synoptic conditions on IOP 2b
2.1. Measurement area and available data
During the ESCOMPTE experiment, a network of surface stations for meteorological
(S) and air chemistry measurements (O) was installed, which covers the metropolitan area
of Marseille, the industrialised bay area west of Marseille (Etang de Berre) as well as the
surrounding hillsides north of the city and the dominating valleys like the Rhone and
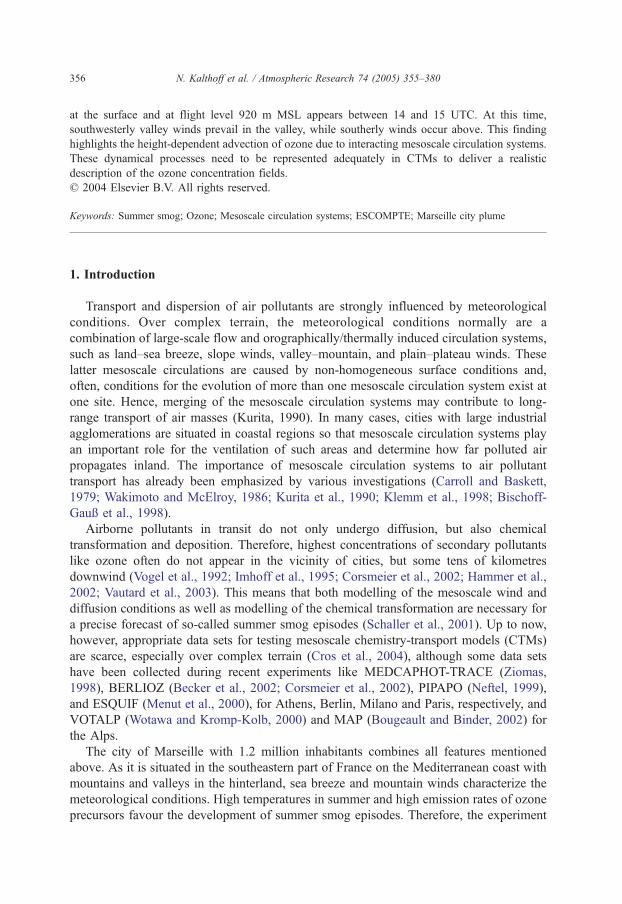
Durance valley. The positions of the different measuring systems are indicated in Fig. 1,
Fig. 1. Positions of the stations in the ESCOMPTE domain. The corresponding names of the stations are given in
Table 1. The grey scale indicates the height of orography.
N. Kalthoff et al. / Atmospheric Research 74 (2005) 355–380358
the names of the stations are summarized in Table 1. Ozone lidar (L) and sodar (SO)
additionally supplied continuous vertical profiles of ozone and wind, respectively.
Radiosondes measured profiles of the meteorological components in 3-h intervals during
the IOPs, e.g., in the Rhone (RS1) and Durance valleys (RS2). On IOP 2b (June 25, 2001),
two aircraft were in operation, the Fokker 27 (F-BYAO) of the dInstitut National de
Sciences de l’Univers’ (Chalon et al., 1998) and the Dornier 128 (D-IBUF) of the
dUniversit7t BraunschweigT (Corsmeier et al., 2001). Intercomparison flights between the
different aircraft were performed to achieve a high quality for the meteorological and air
chemistry measurements (Saıd et al., 2004). During IOP 2b the Fokker 27 flew at a mean
height of about 775 m MSL from 5:44 to 7:47 UTC and at a height of about 875 m MSL
between 11:00 and 12:05 UTC, while the Dornier 128 flew at a height of about 920 m
MSL from 14:09 to 15:34 UTC. The flight patterns of the Fokker 27 and Dornier 128 are
included in Figs. 11–13. A more detailed description of the whole experimental setup is
given by Cros et al. (2004).
Table 1
Sites and abbreviations of the surface stations in the ESCOMPTE domain
Measurements Abbreviation and site Abbreviation and site
Radiosonde RS1 St. Remy RS2 Vinon
Ozone lidar L1 Vallon Dol L2 Cadarache
Wind radar R1 Aix les Milles
Sodar SO1 Cadarache
Wind data S1 Tarascon S2 Arles
S3 Avignon S4 La Crau
S5 Istres S6 Port de Bouc
S7 Martigues S8 La Gatasse
S9 Bonnieux S10 Le Luberon
S11 La Barben S12 La Fare les Oliviers
S13 Marignane S14 Dupail
S15 Realtor S16 Vitrolles
S17 Gardanne S18 Vallon Dol
S19 Marseille S20 Penne sur Huveaune
S21 St. Michel S22 La Bastide
S23 Vinon S24 Vauvenargues
S25 Ste. Baume
Ozone data O1 Avignon O2 Avignon
O3 Le Pontet O4 St. Remy
O5 Fos sur Mer O6 Miramas
O7 Martigues O8 Berre l’Etang
O9 Rognac O10 Vitrolles
O11 Marignane O12 Pennes Mirabeau
O13 Luberon O14 Aix
O15 Aix O16 Bouc Bel Air
O17 Plan de Cuques O18 Marseilles
O19 St. Marguerite O20 Penne sur Huveaune
O21 Aubagne O22 Rousset
O23 Vinon
The positions of the stations are given in Fig. 1.
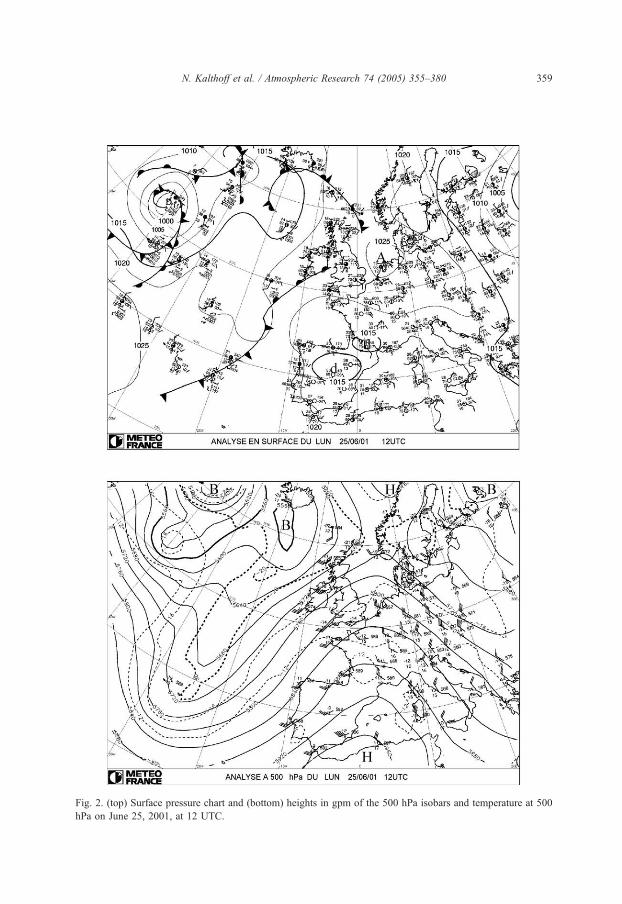
Fig. 2. (top) Surface pressure chart and (bottom) heights in gpm of the 500 hPa isobars and temperature at 500
hPa on June 25, 2001, at 12 UTC.
N. Kalthoff et al. / Atmospheric Research 74 (2005) 355–380 359
N. Kalthoff et al. / Atmospheric Research 74 (2005) 355–380360
2.2. Synoptic conditions
On IOP 2b, the surface pressure over Europe is characterized by a high pressure system
centred over the Netherlands (Fig. 2). Pressure gradients are low over the whole central
Europe. This weather situation is accompanied by cloudless skies, high temperatures, low
humidity, and weak synoptic winds. In the Durance valley (S23 in Fig. 1), the temperature
nearly reaches 40 8C. At 500 hPa, moderate westerly to northwesterly winds prevail over
southern France (Fig. 2). These conditions favour both the evolution of mesoscale
circulation systems and the evolution of a summer smog situation (Vogel et al., 1995;
Vogel et al., 2000).
3. PBL and surface wind field
3.1. Wind profiles in the PBL
Continuous radiosoundings were performed to determine the temporal evolution and
spatial distribution of the stable or nocturnal boundary layer (NBL) and the mixed or
convective boundary layer (CBL) in the investigation area, because the capping inversion
at the CBL-top can be regarded as upper limit for vertical exchange processes. However,
this is an assumption which is not always true over complex terrain, because processes like
mountain venting and advective venting can lead to an exchange of trace gases between
the PBL and the free troposphere (Kogmann et al., 1999).
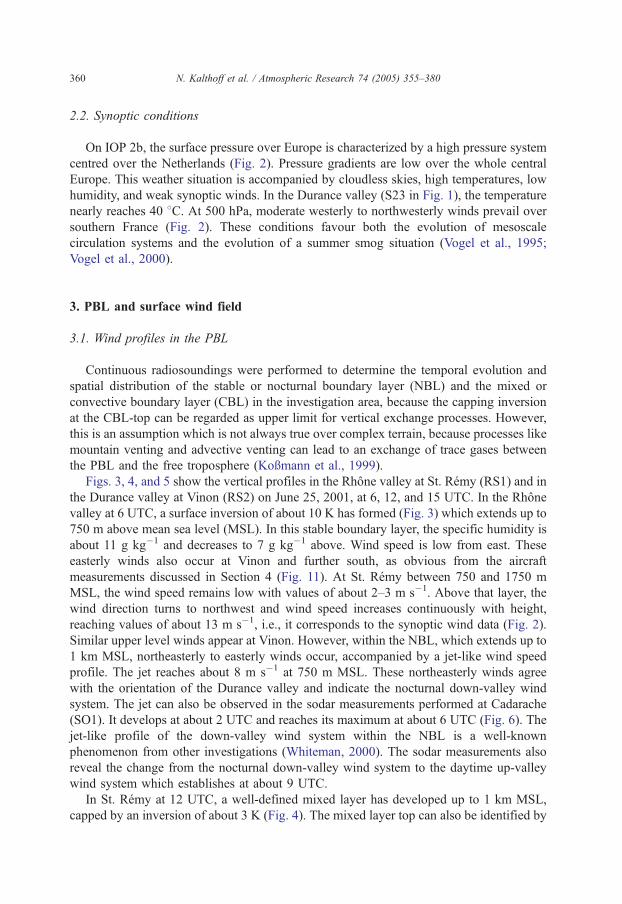
Figs. 3, 4, and 5 show the vertical profiles in the Rhone valley at St. Remy (RS1) and in
the Durance valley at Vinon (RS2) on June 25, 2001, at 6, 12, and 15 UTC. In the Rhone
valley at 6 UTC, a surface inversion of about 10 K has formed (Fig. 3) which extends up to
750 m above mean sea level (MSL). In this stable boundary layer, the specific humidity is
about 11 g kg�1 and decreases to 7 g kg�1 above. Wind speed is low from east. These
easterly winds also occur at Vinon and further south, as obvious from the aircraft
measurements discussed in Section 4 (Fig. 11). At St. Remy between 750 and 1750 m
MSL, the wind speed remains low with values of about 2–3 m s�1. Above that layer, the
wind direction turns to northwest and wind speed increases continuously with height,
reaching values of about 13 m s�1, i.e., it corresponds to the synoptic wind data (Fig. 2).
Similar upper level winds appear at Vinon. However, within the NBL, which extends up to
1 km MSL, northeasterly to easterly winds occur, accompanied by a jet-like wind speed
profile. The jet reaches about 8 m s�1 at 750 m MSL. These northeasterly winds agree
with the orientation of the Durance valley and indicate the nocturnal down-valley wind
system. The jet can also be observed in the sodar measurements performed at Cadarache
(SO1). It develops at about 2 UTC and reaches its maximum at about 6 UTC (Fig. 6). The
jet-like profile of the down-valley wind system within the NBL is a well-known
phenomenon from other investigations (Whiteman, 2000). The sodar measurements also
reveal the change from the nocturnal down-valley wind system to the daytime up-valley
wind system which establishes at about 9 UTC.
In St. Remy at 12 UTC, a well-defined mixed layer has developed up to 1 km MSL,
capped by an inversion of about 3 K (Fig. 4). The mixed layer top can also be identified by
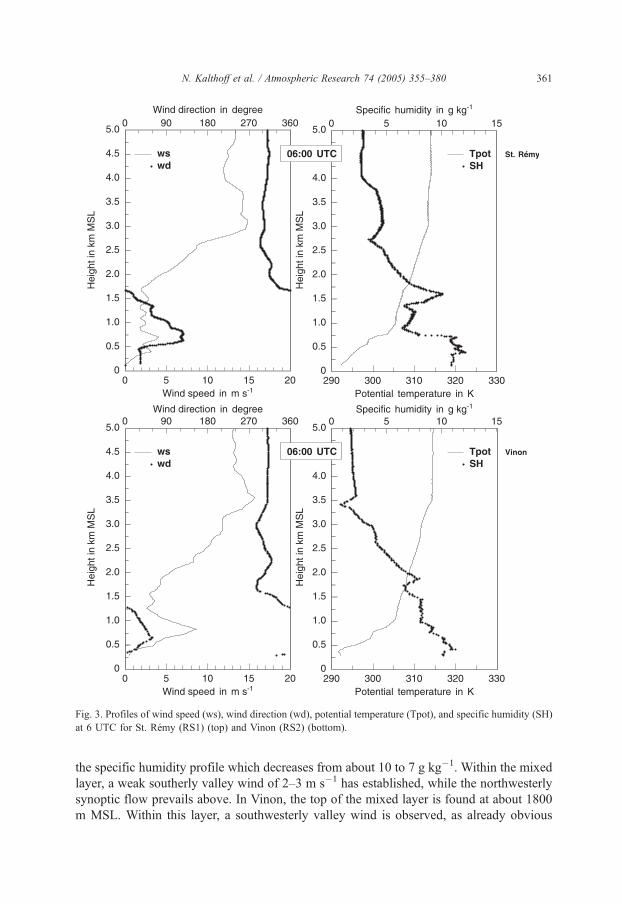
Fig. 3. Profiles of wind speed (ws), wind direction (wd), potential temperature (Tpot), and specific humidity (SH)
at 6 UTC for St. Remy (RS1) (top) and Vinon (RS2) (bottom).
N. Kalthoff et al. / Atmospheric Research 74 (2005) 355–380 361
the specific humidity profile which decreases from about 10 to 7 g kg�1. Within the mixed
layer, a weak southerly valley wind of 2–3 m s�1 has established, while the northwesterly
synoptic flow prevails above. In Vinon, the top of the mixed layer is found at about 1800
m MSL. Within this layer, a southwesterly valley wind is observed, as already obvious
Fig. 4. Same as Fig. 3, but for 12 UTC.
N. Kalthoff et al. / Atmospheric Research 74 (2005) 355–380362
from the sodar data (Fig. 6). A veering of the wind direction from southwesterly valley to
northwesterly synoptic winds appears at the top of the mixed layer. The different valley
wind regimes can also be detected from the Fokker 27 flight performed at 875 m MSL
from 11:00 and 12:05 UTC, although the different regimes seem less pronounced in the
aircraft data (Fig. 12).
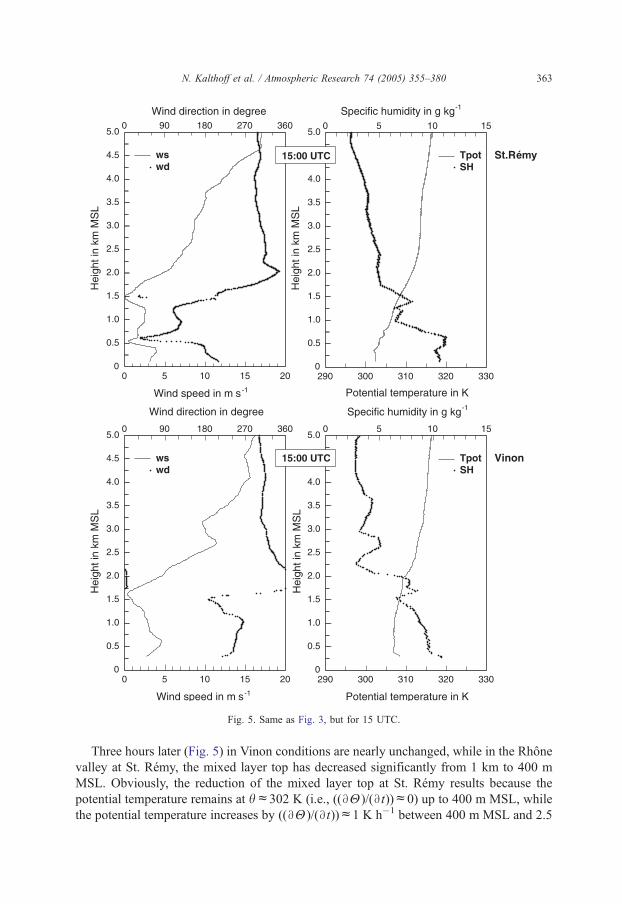
Fig. 5. Same as Fig. 3, but for 15 UTC.
N. Kalthoff et al. / Atmospheric Research 74 (2005) 355–380 363
Three hours later (Fig. 5) in Vinon conditions are nearly unchanged, while in the Rhone
valley at St. Remy, the mixed layer top has decreased significantly from 1 km to 400 m
MSL. Obviously, the reduction of the mixed layer top at St. Remy results because the
potential temperature remains at hc302 K (i.e., ((BH)/(Bt))c0) up to 400 m MSL, while
the potential temperature increases by ((BH)/(Bt))c1 K h�1 between 400 m MSL and 2.5
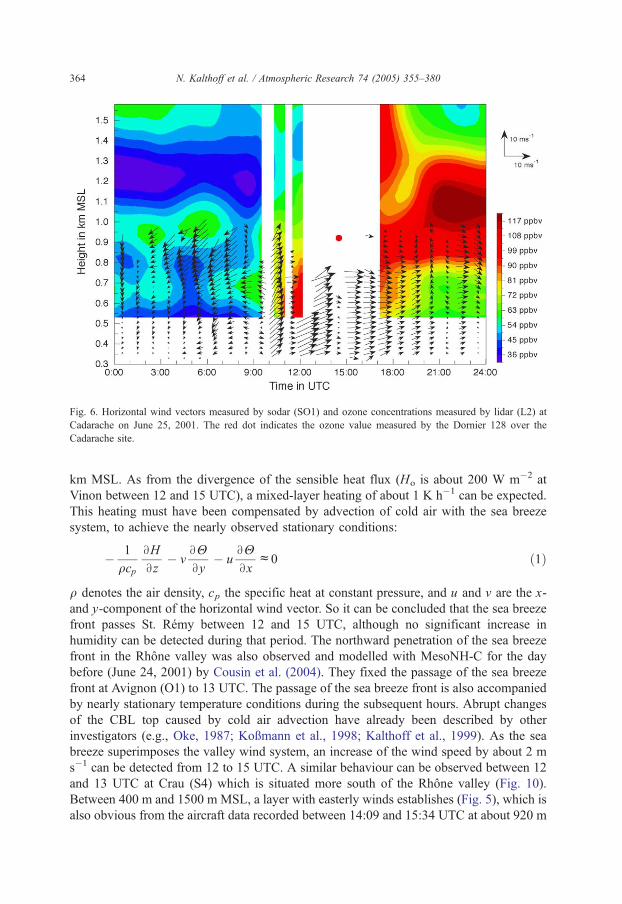
Fig. 6. Horizontal wind vectors measured by sodar (SO1) and ozone concentrations measured by lidar (L2) at
Cadarache on June 25, 2001. The red dot indicates the ozone value measured by the Dornier 128 over the
Cadarache site.
N. Kalthoff et al. / Atmospheric Research 74 (2005) 355–380364
km MSL. As from the divergence of the sensible heat flux (Ho is about 200 W m�2 at
Vinon between 12 and 15 UTC), a mixed-layer heating of about 1 K h�1 can be expected.
This heating must have been compensated by advection of cold air with the sea breeze
system, to achieve the nearly observed stationary conditions:
� 1
qcp
BH
Bz� v
BHBy
� uBHBx
c0 ð1Þ
q denotes the air density, cp the specific heat at constant pressure, and u and v are the x-
and y-component of the horizontal wind vector. So it can be concluded that the sea breeze
front passes St. Remy between 12 and 15 UTC, although no significant increase in
humidity can be detected during that period. The northward penetration of the sea breeze
front in the Rhone valley was also observed and modelled with MesoNH-C for the day
before (June 24, 2001) by Cousin et al. (2004). They fixed the passage of the sea breeze
front at Avignon (O1) to 13 UTC. The passage of the sea breeze front is also accompanied
by nearly stationary temperature conditions during the subsequent hours. Abrupt changes
of the CBL top caused by cold air advection have already been described by other
investigators (e.g., Oke, 1987; Kogmann et al., 1998; Kalthoff et al., 1999). As the sea
breeze superimposes the valley wind system, an increase of the wind speed by about 2 m
s�1 can be detected from 12 to 15 UTC. A similar behaviour can be observed between 12
and 13 UTC at Crau (S4) which is situated more south of the Rhone valley (Fig. 10).
Between 400 m and 1500 m MSL, a layer with easterly winds establishes (Fig. 5), which is
also obvious from the aircraft data recorded between 14:09 and 15:34 UTC at about 920 m

N. Kalthoff et al. / Atmospheric Research 74 (2005) 355–380 365
MSL (Fig. 13). These easterly winds are of relevance for the horizontal transport of ozone
as discussed in Section 4.
To sum up, it can be stated that the morning flight at about 775 m MSL was performed
in the transition zone between the top of the NBL and the residual layer, while the noon
flight at about 875 m MSL was performed within the mixed layer. The afternoon flight at
about 920 m MSL took place within the mixed layer in the eastern part of the domain, but
above the mixed layer in the Rhone valley.
3.2. The surface wind field
An overview of the surface wind field on IOP 2b is given by plotting the wind vectors
for time periods when the conditions are nearly stationary (Figs. 7–9). Additionally, the
diurnal cycles of wind speed and wind direction are shown for selected sites, i.e., on the
coast, in the Rhone valley, and in the Durance valley (Fig. 10).
At night (0–5 UTC), the surface wind field is dominated by local effects and, therefore,
reveals a very heterogeneous structure (Fig. 7), as typical for complex terrain (e.g., Melas
et al., 1998; Kogmann and Fiedler, 2000). At stations in the Rhone valley (S1, S2, S4),
down-valley winds have established, while in the city of Marseille (S18, S19) a land
breeze can be detected. At the lake Etang de Berre, a land breeze system has developed
with a southerly flow at Marignane (S13) and northerly flow at Istres (S5). At stations on
Fig. 7. Characteristic surface wind field on June 25, 2001, between 0 and 5 UTC. The grey scale indicates the
height of orography.
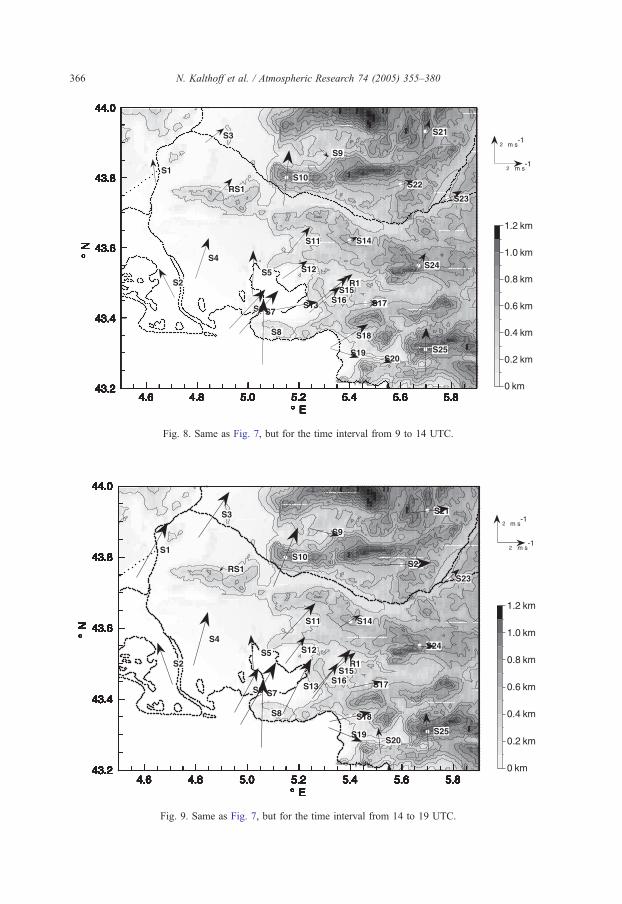
Fig. 8. Same as Fig. 7, but for the time interval from 9 to 14 UTC.
Fig. 9. Same as Fig. 7, but for the time interval from 14 to 19 UTC.
N. Kalthoff et al. / Atmospheric Research 74 (2005) 355–380366

Fig. 10. Time series of wind speed (solid line) and wind direction (dots) at different surface stations. The positions
of the stations are indicated in Fig. 1.
N. Kalthoff et al. / Atmospheric Research 74 (2005) 355–380 367
N. Kalthoff et al. / Atmospheric Research 74 (2005) 355–380368
slopes, drainage winds occur, which are directed to the valley ground (e.g., S10, S21,
S25). During the night, winds are generally low, i.e., b2 m s�1.
The change from nocturnal conditions to the daytime wind regime takes place between
5 and 8 UTC (Fig. 10). Between 9 and 14 UTC (Fig. 8), the surface wind field is
characterised by southerly up-valley winds in the Rhone valley (S3, S4), southwesterly
winds in the area of lake Etang de Berre and Marseille, while an up-valley wind system
has developed in the Durance valley (S23). Thus, the wind field during this period is more
homogeneous than during the night and local orographic structures are of minor relevance.
Additionally, wind speeds are much higher than during night.
In the afternoon (14–19 UTC), the general structure of the surface wind field (Fig. 9) is
similar to that of the hours around noon. However, the up-valley wind in the Rhone valley
has strengthened, as is also obvious from the diurnal cycle of the wind speed at Crau (S4)
in Fig. 10.
Summarizing the meteorological conditions on IOP 2b, it can be stated that
! During the night, the wind field is dominated by local conditions, resulting in drainage
flows on the slopes, down-valley winds, and a land breeze at lake Etang de Berre. The
surface wind speeds are low (b2 m s�1).
! The nocturnal down-valley wind system in the Durance valley has a vertical extension
of about 1 km. The wind profile reveals a jet-like structure with a maximum of 8 m s�1
just below the top of the NBL.
! The nocturnal surface wind regime has been replaced completely by the daytime
surface wind regime at about 9 UTC. At 12 UTC, the top of the well-mixed layer can
be found at 1 km MSL in the Rhone valley and at 1.8 km MSL in the Durance valley.
! Between 12 and 15 UTC, the temperature profile in the Rhone valley about 50 km
inland indicates the passage of the sea breeze front, resulting in a decrease of the mixed
layer capping inversion from 1 km MSL down to 400 m MSL. As the up-valley wind
and sea breeze wind superimpose in the Rhone valley, the wind speed increases in the
afternoon.
The impact of these different flow regimes on the ozone distribution shall be discussed
in the next section.
4. Spatial distribution and temporal evolution of ozone
4.1. Ozone distribution at the surface stations and on the flight legs
Ozone distribution is analysed by means of the surface stations (Fig. 1; Table 1) and
the aircraft measurements, i.e., the Fokker 27 flight in the morning (5:44–6:44 UTC at
about 775 m MSL) and the flight around noon (11:00–12:05 UTC at about 875 m MSL)
and the Dornier 128 flight in the afternoon (14:09–15:35 UTC at about 920 m MSL).
Original ozone and meteorological data were low-pass filtered with a cut-off length of
12.5 km. This cut-off length corresponds with the distance between two parallel flight
legs and allows a reasonable interpolation of the data, i.e., ozone structures in the
N. Kalthoff et al. / Atmospheric Research 74 (2005) 355–380 369
interpolated data field in both directions (parallel and perpendicular to the flight legs) are
of the same scale. The surface data in the subsequent diagrams were averaged over the
time period of the corresponding aircraft flights. Resulting ozone concentrations and
horizontal wind vectors on the different flight legs and the ozone concentrations at the
surface stations are given in Figs. 11–13. Fig. 14 presents diurnal cycles of ozone
concentration for selected sites. A complete overview for all stations is given by Thurauf
(2002).
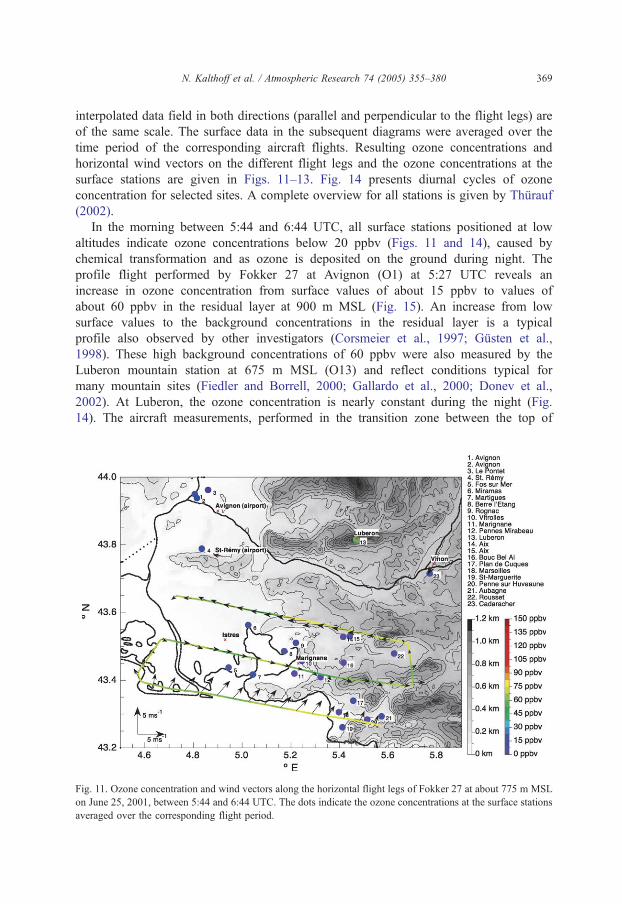
In the morning between 5:44 and 6:44 UTC, all surface stations positioned at low
altitudes indicate ozone concentrations below 20 ppbv (Figs. 11 and 14), caused by
chemical transformation and as ozone is deposited on the ground during night. The
profile flight performed by Fokker 27 at Avignon (O1) at 5:27 UTC reveals an
increase in ozone concentration from surface values of about 15 ppbv to values of
about 60 ppbv in the residual layer at 900 m MSL (Fig. 15). An increase from low
surface values to the background concentrations in the residual layer is a typical
profile also observed by other investigators (Corsmeier et al., 1997; Gusten et al.,
1998). These high background concentrations of 60 ppbv were also measured by the
Luberon mountain station at 675 m MSL (O13) and reflect conditions typical for
many mountain sites (Fiedler and Borrell, 2000; Gallardo et al., 2000; Donev et al.,
2002). At Luberon, the ozone concentration is nearly constant during the night (Fig.
14). The aircraft measurements, performed in the transition zone between the top of
Fig. 11. Ozone concentration and wind vectors along the horizontal flight legs of Fokker 27 at about 775 m MSL
on June 25, 2001, between 5:44 and 6:44 UTC. The dots indicate the ozone concentrations at the surface stations
averaged over the corresponding flight period.
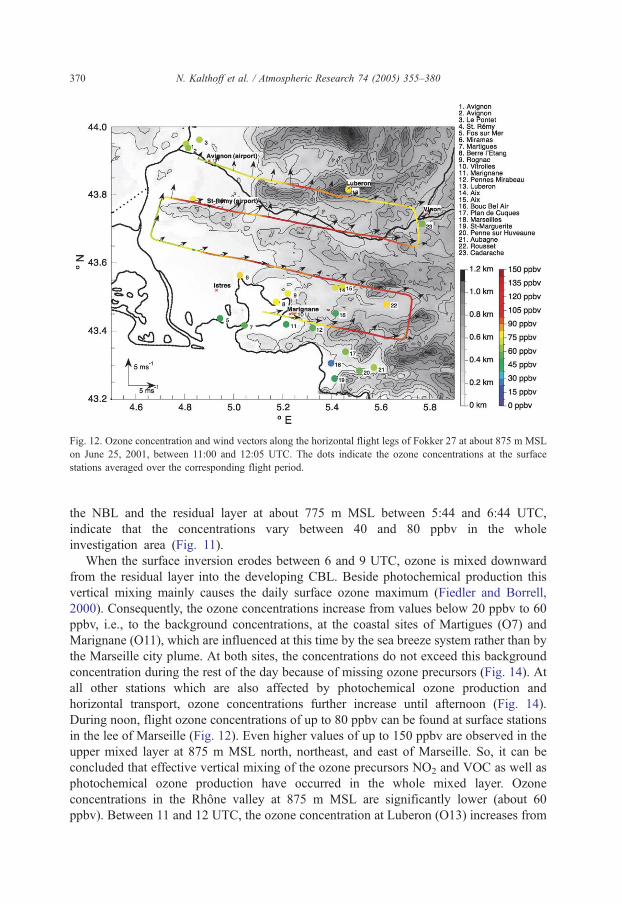
Fig. 12. Ozone concentration and wind vectors along the horizontal flight legs of Fokker 27 at about 875 m MSL
on June 25, 2001, between 11:00 and 12:05 UTC. The dots indicate the ozone concentrations at the surface
stations averaged over the corresponding flight period.
N. Kalthoff et al. / Atmospheric Research 74 (2005) 355–380370
the NBL and the residual layer at about 775 m MSL between 5:44 and 6:44 UTC,
indicate that the concentrations vary between 40 and 80 ppbv in the whole
investigation area (Fig. 11).
When the surface inversion erodes between 6 and 9 UTC, ozone is mixed downward
from the residual layer into the developing CBL. Beside photochemical production this
vertical mixing mainly causes the daily surface ozone maximum (Fiedler and Borrell,
2000). Consequently, the ozone concentrations increase from values below 20 ppbv to 60
ppbv, i.e., to the background concentrations, at the coastal sites of Martigues (O7) and
Marignane (O11), which are influenced at this time by the sea breeze system rather than by
the Marseille city plume. At both sites, the concentrations do not exceed this background
concentration during the rest of the day because of missing ozone precursors (Fig. 14). At
all other stations which are also affected by photochemical ozone production and
horizontal transport, ozone concentrations further increase until afternoon (Fig. 14).
During noon, flight ozone concentrations of up to 80 ppbv can be found at surface stations
in the lee of Marseille (Fig. 12). Even higher values of up to 150 ppbv are observed in the
upper mixed layer at 875 m MSL north, northeast, and east of Marseille. So, it can be
concluded that effective vertical mixing of the ozone precursors NO2 and VOC as well as
photochemical ozone production have occurred in the whole mixed layer. Ozone
concentrations in the Rhone valley at 875 m MSL are significantly lower (about 60
ppbv). Between 11 and 12 UTC, the ozone concentration at Luberon (O13) increases from
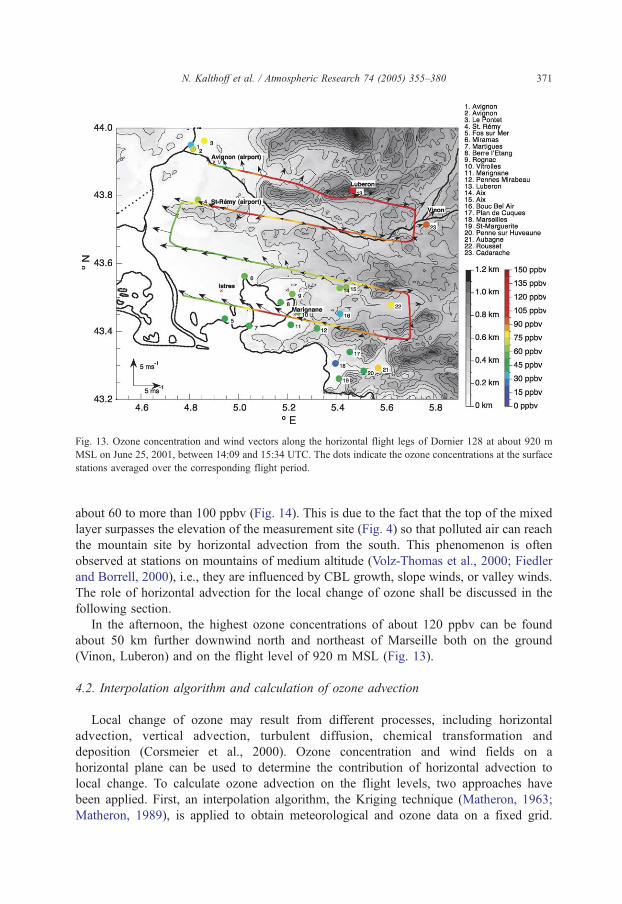
Fig. 13. Ozone concentration and wind vectors along the horizontal flight legs of Dornier 128 at about 920 m
MSL on June 25, 2001, between 14:09 and 15:34 UTC. The dots indicate the ozone concentrations at the surface
stations averaged over the corresponding flight period.
N. Kalthoff et al. / Atmospheric Research 74 (2005) 355–380 371
about 60 to more than 100 ppbv (Fig. 14). This is due to the fact that the top of the mixed
layer surpasses the elevation of the measurement site (Fig. 4) so that polluted air can reach
the mountain site by horizontal advection from the south. This phenomenon is often
observed at stations on mountains of medium altitude (Volz-Thomas et al., 2000; Fiedler
and Borrell, 2000), i.e., they are influenced by CBL growth, slope winds, or valley winds.
The role of horizontal advection for the local change of ozone shall be discussed in the
following section.
In the afternoon, the highest ozone concentrations of about 120 ppbv can be found
about 50 km further downwind north and northeast of Marseille both on the ground
(Vinon, Luberon) and on the flight level of 920 m MSL (Fig. 13).
4.2. Interpolation algorithm and calculation of ozone advection
Local change of ozone may result from different processes, including horizontal
advection, vertical advection, turbulent diffusion, chemical transformation and
deposition (Corsmeier et al., 2000). Ozone concentration and wind fields on a
horizontal plane can be used to determine the contribution of horizontal advection to
local change. To calculate ozone advection on the flight levels, two approaches have
been applied. First, an interpolation algorithm, the Kriging technique (Matheron, 1963;
Matheron, 1989), is applied to obtain meteorological and ozone data on a fixed grid.
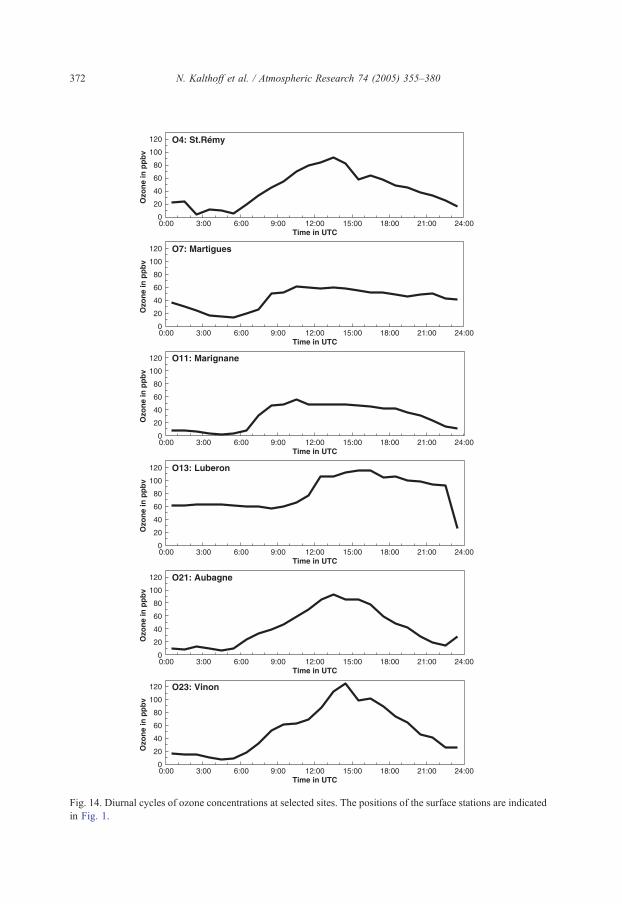
Fig. 14. Diurnal cycles of ozone concentrations at selected sites. The positions of the surface stations are indicated
in Fig. 1.
N. Kalthoff et al. / Atmospheric Research 74 (2005) 355–380372

Fig. 15. Profiles of wind speed (ws), wind direction (wd), potential temperature (Tpot), and Ozone (O3) at 5:27
UTC of Fokker 27 from the profile flight at Avignon (O1).
Fig. 16. Horizontal advection of ozone (coloured scale), horizontal wind vectors, and isolines of ozone
concentrations (white, grey and black isolines, see upper scale) on June 25, 2001, from 5:44 to 6:44 at about 775
m MSL.
N. Kalthoff et al. / Atmospheric Research 74 (2005) 355–380 373
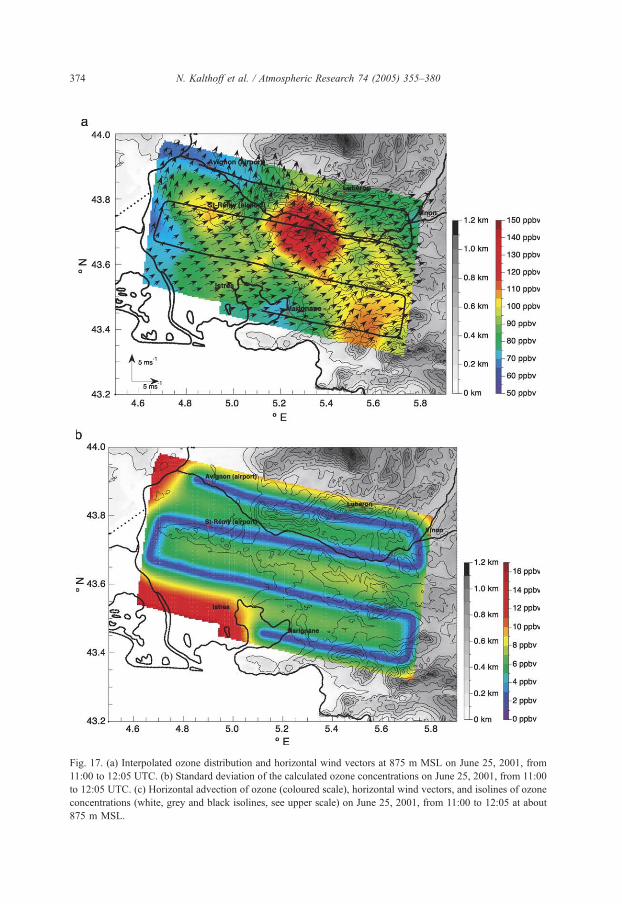
Fig. 17. (a) Interpolated ozone distribution and horizontal wind vectors at 875 m MSL on June 25, 2001, from
11:00 to 12:05 UTC. (b) Standard deviation of the calculated ozone concentrations on June 25, 2001, from 11:00
to 12:05 UTC. (c) Horizontal advection of ozone (coloured scale), horizontal wind vectors, and isolines of ozone
concentrations (white, grey and black isolines, see upper scale) on June 25, 2001, from 11:00 to 12:05 at about
875 m MSL.
N. Kalthoff et al. / Atmospheric Research 74 (2005) 355–380374
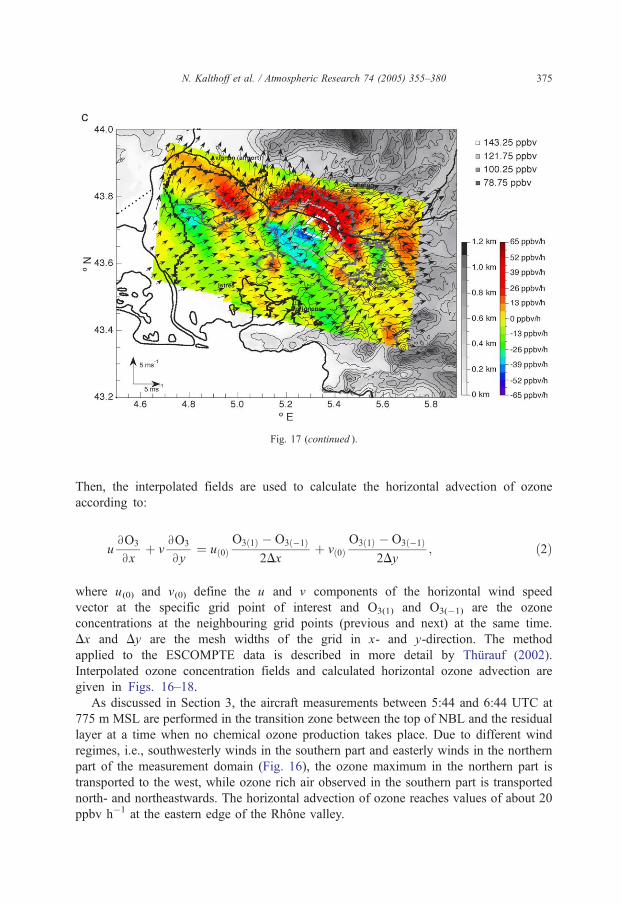
Fig. 17 (continued ).
N. Kalthoff et al. / Atmospheric Research 74 (2005) 355–380 375
Then, the interpolated fields are used to calculate the horizontal advection of ozone
according to:
uBO3
Bxþ v
BO3
By¼ u 0ð Þ
O3 1ð Þ � O3 �1ð Þ2Dx
þ v 0ð ÞO3 1ð Þ � O3 �1ð Þ
2Dy; ð2Þ
where u(0) and v(0) define the u and v components of the horizontal wind speed
vector at the specific grid point of interest and O3(1) and O3(�1) are the ozone
concentrations at the neighbouring grid points (previous and next) at the same time.
Dx and Dy are the mesh widths of the grid in x- and y-direction. The method
applied to the ESCOMPTE data is described in more detail by Thurauf (2002).
Interpolated ozone concentration fields and calculated horizontal ozone advection are
given in Figs. 16–18.
As discussed in Section 3, the aircraft measurements between 5:44 and 6:44 UTC at
775 m MSL are performed in the transition zone between the top of NBL and the residual
layer at a time when no chemical ozone production takes place. Due to different wind
regimes, i.e., southwesterly winds in the southern part and easterly winds in the northern
part of the measurement domain (Fig. 16), the ozone maximum in the northern part is
transported to the west, while ozone rich air observed in the southern part is transported
north- and northeastwards. The horizontal advection of ozone reaches values of about 20
ppbv h�1 at the eastern edge of the Rhone valley.

Fig. 18. Horizontal advection of ozone (coloured scale), horizontal wind vectors, and isolines of ozone
concentrations (white, grey and black isolines, see upper scale) on June 25, 2001, from 14:09 and 15:34 UTC at
920 m MSL.
N. Kalthoff et al. / Atmospheric Research 74 (2005) 355–380376
Between 11:00 and 12:05 UTC, a primary ozone maximum can be detected southwest
of Luberon and a secondary one northeast of Marseille (Fig. 17a). The standard deviation
of the calculated ozone concentration field (Fig. 17b), which is the square root of the Krige
variance, yields information on the estimated error of this interpolated ozone distribution
pattern (Thurauf, 2002). Values range from about 2 ppbv close to the flight legs to about 7
ppbv between two neighbouring flight legs. As a result of the ozone and wind field, the
strongest horizontal advection of ozone appears south of Luberon (Fig. 17c). Hence, the
strong increase of ozone at Luberon (Fig. 14) at noon can be attributed to horizontal
advection of ozone within the mixed layer.
The pattern of horizontal advection of ozone between 14:09 and 15:34 UTC indicates
an increase west of the Etang de Berre (Fig. 18). Furthermore, easterly winds in the
Rhone valley above the sea breeze layer result in a transport of ozone-rich air towards
the west. This kind of hand-over of polluted air from the PBL of mountainous areas to
layers above the PBL in valleys has already been observed by Kogmann et al. (1999)
and represents an effective process of transferring polluted air from the PBL to the free
troposphere.
To determine the contribution of horizontal advection to the local change of ozone, lidar
measurements at Vallon Dol/Marseille (L1) and Cadarache (L2) in the Durance valley
were used to calculate the local change of ozone during the corresponding flight period
and on the corresponding flight level (Table 2). The local change of ozone at Vallon Dol
indicates a slight decrease of ozone during the whole day (0 to �2 ppbv h�1), while at
Table 2
Calculated local change of ozone (from lidar data) and horizontal advection of ozone (from aircraft data) at the
flight level for Vallon Dol (L1) and Cadarache (L2)
Time in UTC ((BOP3)/(Bt)),
ppbv h�1
vYdqO3P;
ppbv h�1
Vallon Dol (L1) 5:44–6:44 �1 +3
11:00–12:05 �2 �20
14:09–15:34 F0 +5
Cadarache (L2) 5:44–6:44 +3 –
11:00–12:05 +2 +10
14:09–15:34 +5 �5
N. Kalthoff et al. / Atmospheric Research 74 (2005) 355–380 377
Cadarache, the ozone concentrations increase by a rate between 3 and 5 ppbv h�1. The
horizontal advection of ozone, as derived from Figs. 16, 17c, and 18, reveals that only
during the flight from 11:00 to 12:05 UTC, the increase at Cadarache and the decrease at
Vallon Dol coincide with appropriate values of horizontal advection of ozone. So it must
be concluded that during the morning and afternoon flights other processes and local
effects are dominant, which cannot be estimated from measured data.
5. Conclusions
The aim of the present investigation was to analyse the mesoscale circulation systems in
the ESCOMPTE domain together with the temporal evolution and spatial distribution of
the ozone concentrations on IOP 2b.
IOP 2b was characterised by a high pressure system with light to moderate
synoptic winds, which are ideal prerequisites for the evolution of a summer smog
situation and mesoscale circulation systems. Under nocturnal stable stratification, a
heterogeneous wind field develops mainly under the effect of local orography. During
daytime, when unstable stratification has established, different mesoscale circulation
systems superimpose. In the Rhone valley, the sea breeze penetrates towards the
north, resulting in a decrease of the mixed layer height from 1 km MSL at noon
down to 400 m MSL in the afternoon. As the winds above the sea breeze layer come
from the east, polluted air from the metropolitan area of Marseille leads to an
increase of ozone at elevated layers above the CBL in the eastern part of the Rhone
valley.
At the mountainous station of Luberon at 675 m MSL about 55 km north of Marseille,
background ozone concentrations of 60 ppbv were observed during the night. Between 11
and 12 UTC, when the CBL top surpassed the height of the mountain summit, polluted air
with ozone concentrations of about 120 ppbv arrived from southerly directions, thus
indicating the passage of the city plume of Marseille. At Cadarache and Vinon in the
Durance valley, about 60 km inland, the ozone maximum at the surface and at flight level
920 m MSL appears between 14 and 15 UTC. At this time, southwesterly valley wind
exists in the valley, while more southerly winds occur above. Hence, in the lower layers
N. Kalthoff et al. / Atmospheric Research 74 (2005) 355–380378
polluted air moves along the valley, while in the upper layers, the polluted air crosses the
southern sidewalls of the Durance valley and propagates northwards. This finding
highlights the height-dependent advection of ozone due to interacting mesoscale
circulation systems. These dynamical processes need to be represented adequately in
CTMs to result in a realistic forecast.
The ozone concentrations close to the coast increase weakly due to downward mixing
during the morning hours but do not exceed the background concentration of 60 ppbv
measured in the residual layer during the night. This is consistent with the surface wind
measurements, showing onshore winds and advection of less polluted air from the sea
throughout the day.
Generally, the dense setup of ground-based stations, remote sensing instruments, and
three aircraft flights on June 25, 2001, during IOP 2b of ESCOMPTE offer favourable
conditions to analyse the mesoscale meteorological flow pattern in relation to the spatial
distribution of pollutants and their transformation products. Nevertheless, this study also
shows the limits of an analysis based purely on measurement data. Flow conditions over
complex terrain in conjunction with spatially irregular emissions can hardly be sampled
at sufficient spatial and temporal resolution. Model output compared with such data need
to account for the limited representativeness of observations.
References
Becker, A., Scherer, B., Memmesheimer, M., Geig, H., 2002. Studying the city plume of Berlin on 20 July 1998
with three different modelling approaches. J. Atmos. Chem. 42, 41–70.
Bischoff-Gaug, I., Kalthoff, N., Fiedler, F., 1998. The impact of secondary flow systems on air pollution in the
area of Sao Paulo. J. Appl. Meteorol. 37, 269–287.
Bougeault, P., Binder, P., 2002. The Mesoscale Alpine programme. WMO Bull. 51, 14–17.
Carroll, J.J., Baskett, R.L., 1979. Dependence of air quality in a remote location on local and mesoscale
transports: a case study. J. Appl. Meteorol. 18, 474–486.
Chalon, J.-P., Andre, M., Brenguier, J.-L., Druilhet, A., Gayet, J.-F., Flamant, P.H., Guillemet, B., Hauser, D.,
Kerr, Y., Pelon, J., Ravaut, M., Tanre, D., 1998. Les avions francais de recherche atmospherique et de
teledetection. Meteorologie 22, 14–44.
Corsmeier, U., Kalthoff, N., Kolle, O., Kotzian, M., Fiedler, F., 1997. Ozone concentration jump in the stable
nocturnal boundary layer during a LLJ-event. Atmos. Environ. 31, 1977–1989.
Corsmeier, U., Hankers, R., Wieser, A., 2001. Airborne turbulence measurements in the lower troposphere
onboard the research aircraft Dornier 128-6, D-IBUF. Meteorol. Z. 10, 315–329.
Corsmeier, U., Kalthoff, N., Vogel, B., Hammer, M.-U., Fiedler, F., Kottmeier, C., Volz-Thomas, A., Konrad, S.,
Glaser, K., Neininger, B., Lehning, M., Jaeschke, W., Memmesheimer, M., Rappenglqck, B., Jakobi, G.,2002. Ozone and PAN formation inside and outside of the Berlin plume—process analysis and numerical
process simulation. J. Atmos. Chem. 42, 289–321.
Cousin, F., Tulet, P., Rosset, R., 2004. Interaction between local and regional pollution during Escompte 2001:
impact on surface ozone concentrations (IOP2a and 2b). Atmos. Res. 74, 117–137 (same issue).
Cros, B., Durand, P., Cachier, H., Drobinski, Ph., Frejafon, E., Kottmeier, C., Perros, P.E., Peuch, V.-H., Ponche,
J.-L., Robin, D., SaRd, F., Toupance, G., Wortham, H., 2004. The ESCOMPTE program: an overview. Atmos.
Res. 69, 241–279.
Donev, E., Zeller, K., Avramov, A., 2002. Preliminary background ozone concentrations in the mountain and
coastal areas of Bulgaria. Environ. Pollut. 117, 281–286.
Fiedler, F., Borrell, P., 2000. TRACT. Transport of air pollutants over complex terrain. In: Laren, S., Fiedler, F.,
Borrell, P. (Eds.), Exchange and Transport of Air Pollutants Over Complex Terrain and the Sea. Springer
Verlag, Berlin. 357 pp.
N. Kalthoff et al. / Atmospheric Research 74 (2005) 355–380 379
Gallardo, L., Carrasco, J., Olivares, G., 2000. Analysis of ozone measurements at Cerro Tololo (708W, 308S, 2200m.a.s.l.) in Chile. Tellus, Ser. B Chem. Phys. Meteorol. 52, 50–59.
Gqsten, H., Heinrich, G., Sprung, D., 1998. Nocturnal depletion of ozone in the upper Rhine valley. Atmos.
Environ. 32, 1195–1202.
Hammer, M.-U., Vogel, B., Vogel, H., 2002. Findings on H2O2/HNO3 as an indicator for ozone sensitivity in
Baden-Wqrttemberg, Berlin-Brandenburg and the Po valley based on numerical simulations. J. Geophys. Res.
107, 8190.
Imhoff, R.E., Valente, R., Meagher, J.F., Luria, M., 1995. The production of O3 in an urban plume: airborne
sampling of the Atlanta urban plume. Atmos. Environ. 29, 2349–2358.
Kalthoff, N., Horlacher, V., Corsmeier, U., Volz-Thomas, A., Kolahgar, B., Geig, H., Mfllmann-Coers, M.,
Knaps, A., 1999. The influence of valley winds on transport and dispersion of airborne pollutants in the
Freiburg–Schauinsland area. J. Geophys. Res. 105 (D1), 1585–1597.
Klemm, O., Ziomas, I.C., Balis, D., Suppan, P., Slemr, J., Romero, R., Vyras, L.G., 1998. A summer air-pollution
study in Athens, Greece. Atmos. Environ. 32, 2071–2087.
Kogmann, M., Vfgtlin, R., Corsmeier, U., Vogel, B., Fiedler, F., Binder, H.-J., Kalthoff, N., Beyrich, F., 1998.
Aspects of the convective boundary layer structure over complex terrain. Atmos. Environ. 32, 1323–1348.
Kogmann, M., Corsmeier, U., DeWekker, S.F.J., Fiedler, F., Vfgtlin, R., Kalthoff, N., Gqsten, H., Neininger, B.,1999. Observations of handover processes between the atmospheric boundary layer and the free troposphere
over mountainous terrain. Contrib. Atmos. Phys. 72, 329–350.
Kogmann, M., Fiedler, F., 2000. Diurnal momentum budget analysis of thermally induced slope winds. Meteorol.
Atmos. Phys. 75, 195–215.
Kurita, H., Ueda, H., Mitsumoto, S., 1990. Combination of local wind systems under gradient wind conditions
and its contribution to the long-range transport of air pollutants. J. Appl. Meteorol. 29, 331–348.
Matheron, G., 1963. Principles of geostatistics. Econ. Geol. 58, 1246–1266.
Matheron, G., 1989. Estimating and Choosing. Springer Verlag, Berlin. 141 pp.
Melas, D., Ziomas, I., Klemm, O., Zerefos, C.S., 1998. Anatomy of the sea-breeze circulation in Athens area
under weak large-scale ambient winds. Atmos. Environ. 32, 2223–2237.
Menut, L., Vautard, R., Flamant, C., Abonnel, C., Beekmann, M., Chazette, P., Flamant, P.H., Gombert, D.,
Guedalia, D., Kley, D., Lefebvre, M.P., Lossec, B., Martin, D., Megie, G., Perros, P., Sicard, M., Toupance,
G., 2000. Measurements and modeling of atmospheric pollution over the Paris area: an overview of the
ESQUIF project. Ann. Geophys. 18, 1467–1481.
Neftel, A., 1999. Examples of the importance of trace gas measurements in the Milan ozone plume. Analusis 27,
325–327.
Oke, T.R., 1987. Boundary Layer Climates. Methuen, London. 435 pp.
SaZd, F., Corsmeier, U., Kalthoff, N., Kottmeier, C., Lothon, M., Wieser, A., Hofherr, T., Perros, P., 2004.
ESCOMPTE experiment: intercomparison of four aircraft dynamical, thermodynamical, radiative and
chemical measurements. Atmos. Res. 74, 217–252 (same issue).
Schaller, E., Schlqnzen, K.H., Ebel, A., 2001. Evaluierungsstrategien fqr Chemie-Transportmodelle. Promet 27,
17–30.
Thqrauf, J., 2002. Windsysteme und Spurenstoffausbreitung w7hrend ESCOMPTE. Diploma thesis. Institut fqrMeteorologie und Klimaforschung, Universit7t Karlsruhe/Forschungszentrum Karlsruhe, Karlsruhe.
Vautard, R., Menut, L., Beekmann, M., Chazette, P., Flamant, P.H., Gombert, D., Guedalia, D., Kley, D.,
Lefebvre, M.-P., Martin, D., Megie, G., Perros, P., Toupance, G., 2003. A synthesis of the air pollution over
the Paris region (ESQUIF) field campaign. J. Geophys. Res. 108 (D17), 8558.
Vogel, B., Vogel, H., Fiedler, F., 1992. Numerical simulation of the interaction of transport, diffusion, and
chemical reactions in an urban plume. NASA Conf. Publ. 3266, 97–100.
Vogel, B., Fiedler, F., Vogel, H., 1995. Influence of topography and biogenic volatile organic compounds
emission in the state of Baden-Wqrttemberg on ozone concentrations during episodes of high air temperatures.
J. Geophys. Res. 100, 22907–22928.
Vogel, H., Memmesheimer, M., Reimer, E., Winkler, P., Fiedler, F., 2000. Typischer zeitlicher Verlauf von
Photsmog-Episoden. Promet 26, 112–119.
Volz-Thomas, A., Geig, H., Kalthoff, N., 2000. Schauinsland ozone precursor experiment (SLOPE96): scientific
background and main results. J. Geophys. Res. 105 (D1), 1553–1561.

N. Kalthoff et al. / Atmospheric Research 74 (2005) 355–380380
Wakimoto, R.M., McElroy, J.L., 1986. Lidar observation of elevated pollution layers over Los Angeles. J. Clim.
Appl. Meteorol. 25, 1583–1599.
Wotawa, G., Kromp-Kolb, H., 2000. The research project VOTALP—general objectives and main results. Atmos.
Environ. 34, 1319–1322.
Whiteman, C.D., 2000. Mountain Meteorology. Oxford University Press, New York. 355 pp.
Ziomas, I.C., 1998. The Mediterranean campaign of photochemical tracers-transport and chemical evolution
(MEDCAPHOT-TRACE): an outline. Atmos. Environ. 32, 2045–2053.


![financial management 2b [bsr2b01, fnm02b2] last assessment ...](https://static.fdokumen.com/doc/165x107/631aa5b5c51d6b41aa04e9e3/financial-management-2b-bsr2b01-fnm02b2-last-assessment-.jpg)


![FINANCIAL MANAGEMENT 2B [BSR2B01, FNM02B2] LAST ...](https://static.fdokumen.com/doc/165x107/633c134708bfd70fe20afb65/financial-management-2b-bsr2b01-fnm02b2-last-.jpg)