
Mergers and Innovation: Evidence from a Panel of U.S. Firms
23
Full Terms & Conditions of access and use can be found at http://www.tandfonline.com/action/journalInformation?journalCode=gein20 Economics of Innovation and New Technology ISSN: 1043-8599 (Print) 1476-8364 (Online) Journal homepage: http://www.tandfonline.com/loi/gein20 Mergers and innovation: evidence from a panel of US firms Mahdiyeh Entezarkheir & Saeed Moshiri To cite this article: Mahdiyeh Entezarkheir & Saeed Moshiri (2018) Mergers and innovation: evidence from a panel of US firms, Economics of Innovation and New Technology, 27:2, 132-153, DOI: 10.1080/10438599.2017.1319094 To link to this article: https://doi.org/10.1080/10438599.2017.1319094 Published online: 26 Apr 2017. Submit your article to this journal Article views: 249 View related articles View Crossmark data Citing articles: 1 View citing articles
Transcript of Mergers and Innovation: Evidence from a Panel of U.S. Firms
Full Terms & Conditions of access and use can be found athttp://www.tandfonline.com/action/journalInformation?journalCode=gein20
Economics of Innovation and New Technology
ISSN: 1043-8599 (Print) 1476-8364 (Online) Journal homepage: http://www.tandfonline.com/loi/gein20
Mergers and innovation: evidence from a panel ofUS firms
Mahdiyeh Entezarkheir & Saeed Moshiri
To cite this article: Mahdiyeh Entezarkheir & Saeed Moshiri (2018) Mergers and innovation:evidence from a panel of US firms, Economics of Innovation and New Technology, 27:2, 132-153,DOI: 10.1080/10438599.2017.1319094
To link to this article: https://doi.org/10.1080/10438599.2017.1319094
Published online: 26 Apr 2017.
Submit your article to this journal
Article views: 249
View related articles
View Crossmark data
Citing articles: 1 View citing articles
Mergers and innovation: evidence from a panel of US firms*Mahdiyeh Entezarkheira and Saeed Moshirib
aDepartment of Economics, Huron University College, Western University, London, Canada; bDepartment ofEconomics, STM College, University of Saskatchewan, Saskatoon, Canada
ABSTRACTMergers lead to larger firms and a less competitive market structure, buttheir effects on innovation are not clear. Mergers may improveinnovation incentives by promoting economies of scope and scale, R&Dactivities, and increasing the ability to deal with uncertainties. However,mergers may also discourage innovation by reducing competition,increasing costs, and decreasing production and R&D efficiencies. In thisstudy, we investigate merger impacts on innovation using a panel dataconsisting of four different data sets on publicly traded USmanufacturing firms from 1980 to 2003. Our proxy for innovation isbased on citation-weighted patent stocks. In our estimation model, wecontrol for endogeneity using instrumental variables and factors such asmarket share, size, industry, and time. We find that mergers arepositively and significantly correlated with firms’ innovation. Ourfindings also indicate that merger effect on innovation is heterogeneousacross industries, increases with market share, and is greater in the longrun. Our findings are robust to alternative measures of innovation.
ARTICLE HISTORYReceived 27 June 2016Accepted 30 March 2017
KEYWORDSMerger; innovation;competition; patent; citation;intellectual property
JEL CLASSIFICATIONL12; L22; L40; L44; L60; O31;O34
1. Introduction
Anti-trust policies are primarily concerned with post-merger market concentration and higher prices.However, mergers may also lead to more innovations (Katz and Shelanski 2005).1 Since innovation is awell-recognized engine of growth and productivity (Aghion and Howitt 1992; Grossman andHelpman 1991), and its social returns are greater than private returns (Griliches 1992), missing outon merger-induced innovation opportunities could be socially costly. In other words, adopting amarket structure that creates greater innovation incentives may improve social welfare. Nevertheless,the theoretical and empirical literature on a better market structure for innovation is mixed.
For instance, on the theoretical side, Schumpeter (1934, 1942) and Gilbert and Newbery (1982)argue that less competition is better for innovation due to economies of scale and scope, improvedability in handling risks of large R&D investments, and a broader knowledge base. Mergers may alsocombine the R&D activities of merging parties to encourage innovation (Huck, Konrad, and Muller2000) and increase the ability to deal with the uncertainties associated with R&D investments.2
Aghion and Tirole (1994) also explain that mergers contribute positively to innovation through aselection mechanism in which firms with weaker research prospects acquire firms with better inno-vation prospects. In contrast, Arrow (1962) argues that more competition is better for innovation as itpromotes production efficiency and decreases costs. Rajan, Servaes, and Zingales (2000) also explainthat because mergers can increase the number of research divisions inside the merged entity, they
© 2017 Informa UK Limited, trading as Taylor & Francis Group
CONTACT Mahdiyeh Entezarkheir [email protected] Department of Economics, Huron University College, Western Uni-versity, 1349 Western Rd, London, ON, Canada N6G 1H3*We thank Mark Schankerman, participants at the 2015 IIOC, 2015 CEA, and 2015 EARIE meetings, and seminar participants atWestern University for their helpful comments.
ECONOMICS OF INNOVATION AND NEW TECHNOLOGY, 2018VOL. 27, NO. 2, 132–153https://doi.org/10.1080/10438599.2017.1319094
might have a negative impact on employees’ incentives to participate in innovation projects viewedas risky activities. On the empirical side, Pavcnik (2002), Czarnitzki and Kraft (2004), and Loecker (2011)all favour more competition as a driving factor of innovation, but Blundell, Griffith, and VanReenen(1999) and Riordan (1992) show that less competition is better for innovation.
In this study, we investigate empirically the impact of mergers on innovation using a large data seton US firms. Our measure of innovation is the citation-weighted patent stocks variable, which is usedby several studies in the literature (e.g. Aghion et al. 2005; Hall, Jaffe, and Trajtenberg 2005; Stahl2010). However, as part of our contribution, we build a panel of more than 5000 publicly tradedmerging and non-merging US firms in the manufacturing sector from 1980 to 2003. This data set con-tains more than 600 merging pairs of firms. A unique aspect of this data set is that it has informationnot only on merged entities in the post-merger period, similar to previous studies, but also on bothtarget and acquiring firms in the pre-merger period and the merging year.
We further contribute to the literature by examining the possible industry heterogeneity in theimpacts of mergers on innovation. The result of this examination can be useful for policy makingon mergers in different industries. The long time span of our data set also allows us to examinethe long-run and short-run impacts of mergers on innovation. This feature is important becausethe innovative activities associated with a merger take time to materialize. Since a merger can beendogenous due to simultaneity or measurement errors, we use the IV method to mitigate possiblebiases.
The rest of the paper is organized as follows. Section 2 provides an empirical framework includingtheoretical and empirical background, our hypotheses, econometrics model, and data. Section 3includes our estimation results, and Section 4 concludes the paper.
2. Empirical framework
2.1. Literature review and hypotheses
Innovation incentives depend upon many factors such as the level of protection offered by intellec-tual property rights, the dynamics of R&D, and entry barriers to production and R&D (Gilbert 2006).The theoretical literature also suggests a relationship between market structure and innovation, butthe specifics of the relationship are not clear.
The literature goes back at least to Adam Smith, who believed that competition is better for inno-vation, as firms in a competitive market are under constant pressure to lower costs, improve thequality of their products, or increase the scope of their production. In contrast, Schumpeter (1934,1942) argues that less competition in the market better promotes innovation due to economies ofscale and an ability to handle risks associated with large R&D investments.
The debate over the question of which market structure favours innovation has continued in morerecent literature. For instance, Arrow (1962) argues that more competition encourages innovation,because innovation raises the profit of a competitive firm from zero to a positive amount, whereasfor a monopolist it only replaces the profit of pre-innovation. Reinganum (1983, 1984, 1985) alsoargues that monopolists are not eager to win a patent race too quickly as new rents will displacetheir current rents while the entrant does not have this constraint. However, Gilbert and Newbery(1982) are more in line with Schumpeter, arguing that incumbent monopolists have more incentiveto innovate than entrants, because they want to protect their monopoly power more than entrants,who want to become, at best, a duopolist. Fundenberg and Tirole (1985) also support the Schumpe-terian view, arguing that highly competitive markets facilitate faster technology adoption, but in suchmarkets, rivals can copy the new technology reducing the benefits of innovation. Thus, firms in acompetitive market might be discouraged from innovating. Carrier (2008) explains that larger andless competitive firms might help increase the efficiency of innovative activities by avoiding knowl-edge duplication and redundancies. Battisti and Stoneman (2010, 748) argue that a firm’s incentive to
ECONOMICS OF INNOVATION AND NEW TECHNOLOGY 133
innovate diminishes in a competitive market as prices approach the marginal costs and profitsdecline.
A number of studies in the literature also study the role of mergers in innovation but their resultsare not conclusive. For instance, Aghion and Tirole (1994) show that having a specialized, indepen-dent research unit might be more efficient for the innovation of a firm than having the same researchunit within the firm. This is because, in the case of the independent research unit, researchers have astronger incentive for research because of their ownership of their innovation. The finding impliesthat, rather than adding an internal research unit, incumbent firms with inefficient innovation andweak prospects of future research might acquire targets with efficient innovation. As a result,mergers contribute positively to innovation through a selection mechanism through which firmswith a weaker research prospect acquire firms with a better innovation prospect. Rhodes-Kropfand Robinson (2008) also argue that mergers combine complementary assets under the control ofa single firm to create synergies. When merging parties with complementary knowledge and tech-nologies come under the control of a single firm, they may innovate more than when they do notmerge. This view is based on Grossman and Hart’s (1986) property rights theory of the firm, accordingto which combining complementary assets under common ownership reduces hold-up problemsand under-investment due to incomplete contracting. However, there are also theoretical studiesthat conclude a negative impact on innovation from mergers. For example, Rajan, Servaes, and Zin-gales (2000) argue that firms with many divisions are not successful at motivating their researchers toparticipate in risky projects as a result of information asymmetries and agency problems due to theirmultiple divisions. Mergers can also increase the number of divisions inside the merged entity andconsequently have a negative impact on employees’ incentives to participate in innovation projectsthat they view as risky activities.
The findings in the empirical literature on the better market structure for innovation are alsodiverse. For instance, Nickell (1996) demonstrates that productivity growth is positively correlatedwith competition. Blundell, Griffith, and VanReenen (1999) provide evidence for more innovationin less concentrated industries. Pavcnik (2002), Czarnitzki and Kraft (2004), and Loecker (2011),addressing the potential endogeneities in the impact of market structure on innovation, find thatcompetition promotes innovation. Bloom, Draca, and Van Reenen (2015) show that the higher com-petition caused by import increases patenting and IT intensity. However, Riordan (1992) supports theSchumpeterian view of lower innovation in response to higher competition. Some researchers try tomake a connection between the Schumpeterian framework and the growing empirical literature sup-porting the positive role of competition in innovation. For instance, Levin, Cohen, and Mowery (1985)and Aghion et al. (2005) find an inverted U-shaped relation between innovation and competition. Atlow levels of competition, innovation increases with competition, but at high levels, innovationdecreases. However, the most recent study of Correa and Ornaghi (2014) casts doubt on the invertedU-shaped relation and demonstrates a causal positive impact from competition on innovation.
On the merger–innovation relationship, Ahuja and Katila (2001) show that the effect of non-tech-nological mergers on patenting frequency of acquiring firms in the chemical industry is not signifi-cant. Capron (1999), using a survey of manufacturing firms in the United States and Europe, alsofinds an inconclusive effect from mergers on innovation. Measuring innovation with patents,Cloodt, Hagedoorn, and Van Kranenburg (2006) show that the innovation of high-technology acquir-ing firms decreases following a merger with a target that has a large knowledge base. The negativeimpact is also indicated in Stahl (2010), who employs patent and citation data to measure innovationand finds that firms increase their sequential innovation in the pre-merger period and reduce it in thepost-merger period. However, measuring innovation by the count of patents and their novelties,Sevilir and Tian (2012) find a positive effect from mergers on innovation.
A number of merger–innovation studies proxy innovation by R&D-based measures. For instance,Ravenscraft and Scherer (1987) and Hitt et al. (1991) find a negative impact from mergers on R&Dspending and R&D intensity of acquiring firms, respectively. Hitt et al. (1996) also look at theimpact on R&D investments and new product introduction as measures of internal innovation.
134 M. ENTEZARKHEIR AND S. MOSHIRI
They find that mergers decrease internal innovation. Szucs (2014) measures innovation by the R&Dintensity of acquiring firms and also finds a negative effect from mergers. However, Bertrand andZuniga (2006) do not find a significant impact from mergers on R&D investments at the industrylevel for OECD countries. Based on a review of literature, Schulz (2007) reports that, in sum,merger-induced changes of innovation are negative or negligible at an aggregate level. However,he argues that at the disaggregate level, mergers spread risks of R&D activities over a large groupof projects and strengthen research teams. These economies of scale result in more innovation.R&D-based measures used in these studies may not be good proxies for innovation, as R&D is notreported by many firms; it is an input rather than an output; and it is associated with uncertaintiesin outcome.
In light of the discussion above, our main objective in this paper is to provide new evidence on therelationship between market structure and innovation using a large data set on US firms. As mergersresult in larger and less competitive firms, our main hypothesis is
1: H0: Merger increases innovation.
The effect of mergers on innovation may vary with the market share, particularly as Blundell, Grif-fith, and VanReenen (1999) show that high market share firms are able to commercialize innovationmore effectively, which triggers more incentives for innovation. Thus, our second hypothesis is
2: H0: Merger effect on innovation increases with the market share.
Merger and innovation activities may vary across industries given their observed and unobservedheterogeneities. For instance, the prospect of the magnitude and the duration of the innovation rentin the pharmaceutical industry is different from that in the information and communication industryor the oil and mining industry. Cohen, Nelson, and Walsh (2000) argue that the intensity of compe-tition is not the same across industries and provide evidence for industry heterogeneity in innovativeactivities. Schulz (2007) ascribes the industry heterogeneity in innovation to the variation in techno-logical opportunities across sectors. According to Schulz (2007), sometimes discovery providesimprovement in a technological field related to that discovery, whose benefits accrue to industriesdifferently. We examine the heterogeneity in the merger–innovation nexus through our third hypoth-esis as follows:
3: H0: The impact of merger on innovation is heterogeneous across industries.
Our fourth hypothesis concerns the dynamic relationship between merger and innovation. Theimpact of a merger on innovation may not take place immediately after the merger, because firmsneed time to adjust to the new conditions. Kukuk and Stadler (2005) and Peters (2006) also arguethat past innovators are highly likely to innovate in future. As a result, we also test
4: H0: The impact of merger on innovation is larger in the long run than in the short run.
2.2. Econometrics model
The major challenge in the empirical studies of the merger–innovation nexus is to identify the poten-tial changes in innovation as a result of decisions to merge. The commonly used proxies of innovationin the literature are Solow residuals or total factor productivity (TFP), R&D expenditures, and patentcounts (Blundell, Griffith, and VanReenen 1999). TFP is measured from data on inputs and outputs,which make it prone to measurement errors and biases, when information on inputs and outputsis not readily available (Katayama, Lu, and Tybout 2009; Keller 2010, 804). Using R&D as a measureof innovation has limitations as well. R&D activities do not necessarily lead to desired outcomes,they are not reported by many firms, and they also are input rather than output (Keller 2010, 804).In contrast, patent counts record the output of innovative activities and the data are available fora longer time than for R&D. However, examining a better measure of innovation diffusion, Nelson
ECONOMICS OF INNOVATION AND NEW TECHNOLOGY 135
et al. (2014) note that some innovations are not patented. Additionally, many patents represent a verysmall innovation (Hall and Trajtenberg 2004). In more recent studies, such as Jaffe and Trajtenberg(2002) and Hall, Jaffe, and Trajtenberg (2005), these issues are partially addressed by employing a cita-tion-weighted patent stock measure for innovation that treats the value of each patent based on thenumber of its citations.
Using the rich data on patents and citations available in our sample, we also construct the citation-weighted patent stock measure based on a declining balance formula, CitationPatentt = (1−δ)CitationPatentt− 1 + flowCit, with the depreciation rate of δ = 15% (Hall, Jaffe, and Trajtenberg2005; Noel and Schankerman 2013).3 The variables CitationPatentt and flowCit stand for citationstock and citation counts at time t, respectively.4 Therefore, we take into account not only theoutput of the innovative activity but also the quality of the innovation via its citations. There aresome caveats in using this measure of innovation. For instance, firms might patent defensively (Ente-zarkheir 2016; Hall, Jaffe, and Trajtenberg 2005; Hall and Ziedonis 2001; Ziedonis 2004), which mightlead to patents on marginal innovations. Additionally, for competitive reasons some of the patentapplicants might not cite all the relevant prior innovations (Nelson et al. 2014). Finally, accordingto Corredoira and Banerjee (2015), using direct citations of a patent on an original invention doesnot necessarily capture the full effect of the patent, as direct citations do not include the citationsthat are received from future indirect inventions built upon the original patent. To address these con-cerns, we use alternative measures of innovation to check for robustness of our results to our measureof innovation. These measures are discussed in Section 3.
Our empirical analysis is based on the following regression equation, in which the citation-weighted patent stock is explained by mergers and a series of controlling variables
logCitationPatentit = b0 + b1DPostMergerit + b2 logMarketShareit + b3logEmployeeit
+ b4 log R DIntensityit + b5logTobin′sqit + b6horizontalit + b7VCit + ai+mt+ [it . (1)
The variable logCitationPatentit is the logarithm of the citation-weighted patent stock of firm i inyear t.5 To identify the impact of mergers on innovation, we follow the approach of Ashenfelter,Hosken, and Weinberg (2009) and measure mergers with an indicator variable (DPostMergerit) thatis equal to 1 in the post-merger period for merging firms and 0 otherwise. Our control variablesinclude market share (logMarketShareit), firm size (logEmployeeit), R&D intensity (logR&DIntensityit),capital market condition (logTobin’sqit), and types of mergers (horizontalit andVCit).
The market share is expected to increase innovation activities because the high market share firmsare able to commercialize more innovation within industries (Blundell, Griffith, and VanReenen 1999).Thus, we may have an upward bias on the coefficient of DPostMergerit if we do not control for marketshare. However, since innovation may also increase market share, the coefficient of DPostMergerit willbe subject to simultaneity bias. One way to address the problem is to include all the relevant obser-vable control variables in the model. Although we have used as many variables as are suggested inthe literature and have available data for, the list of control variables is by no means exhaustive,leading to a potential omitted-variable bias. Since the omitted variable and simultaneity biases arein the opposite direction, the inclusion of market share should, therefore, give us a lower boundfor the impact of merger on innovation.
The market share of firm i in year t is identified by the ratio of firm i’s sales in year t to total sales ofthe primary four-digit standard industry classification (SIC4) that firm i belongs to in year t. Thismethod of calculating market share follows Blundell, Griffith, and VanReenen (1999), who employsales in the primary SIC3; Giroud and Mueller (2010), who use sales in the primary SIC2 and SIC4;and Duso, Roller, and Seldeslachts (2014), who utilize sales in the primary SIC4. We would haveliked to build the market share variable at a more disaggregate level, but our data only provide infor-mation by SIC4. As Duso, Roller, and Seldeslachts (2014) note, using SIC4 classifications in definingmarket share may generate lower bound estimates, as the relevant anti-trust market might besmaller than the product markets defined by SIC4. Nevertheless, studies based on public firm data
136 M. ENTEZARKHEIR AND S. MOSHIRI
sets rely on SIC codes for grouping firms as this is available in data. In the case of a merger, to employthe pre-merger information of target firms, logMarketShareit is measured by the combined marketshare of the acquirer and the target in the pre-merger period and in the merging year and by themarket share of the merged entity in the post-merger period. This method facilitates the comparisonof the effect of the combined market share on innovation in the pre-merger period to the marketshare effect on innovation in the post-merger period. This method also takes into account thosefirms that experience multiple mergers in the same year or various years in estimations. In thepre-merger period and the merging year, if the four-digit SIC codes of the target and acquirer arethe same, we assume that they are in the same market, and the market demand is divided equallybetween them. We, therefore, employ the average of their market share for the variablelogMarketShareit. For the firms with different SIC codes, we assume that they are not in the samemarket but instead have their own market demands. Thus, we add these market shares to find thecombined share for logMarketShareit. For non-merging firms, logMarketShareit is the market shareof non-merging firm i in year t.6
The size of the firm is expected to have a positive effect on innovation, because larger firms arebetter at appropriating the benefits of their innovation, and size is a proxy for efficiency (Hannan andMcDowell 1984; Mansfield 1968; Saloner and Shepard 1995). This variable, proxied by the number ofemployees (logEmployeeit), is measured similarly to logMarketShareit in terms of combining employeenumbers of the acquiring and target companies. We also control for R&D intensity in merger decision,as Griliches and Pakes (1980) provide evidence that successful R&D leads to innovation, and Hall(2004), Karshenas and Stonemen (1995), and Cohen and Levinthal (1989) consider a role for R&Dintensity of firms in innovation. The variable logR&DIntensityit is defined by the ratio of the stock ofR&D (R&Dstockit) to tangible assets of firm i in year t (TAit). R&Dstockit is constructed based on thesame declining balance formula used for the dependent variable (Aghion, Van Reenen, and Zingales2013). Following Hall, Jaffe, and Trajtenberg (2005), the variable TAit is measured by the book value offirms based on their balance sheet. The book value of a firm is calculated as the sum of net plant andequipment, inventories, investments in unconsolidated subsidiaries, and intangibles and others. All ofthe components of TAit are adjusted for inflation.7
Market value is also considered as a driving force for innovation (Lerner 1994). Jovanovic andRousseau (2002) q theory of mergers also suggests that as Tobin’s q (ratio of market value to bookvalue) increases, merger activity will be higher. Moreover, according to Hall (2004), the financial con-dition of firms, which is under the influence of the market, may also play a role in their innovativeactivities by providing financial resources. Therefore, the coefficient of DPostMergerit may bebiased upward if Tobin’s q is not controlled for. The inclusion of Tobin’s q, however, may generatea simultaneity bias problem, because factors that increase a firm’s market value may also encourageinnovation. As Aghion, Van Reenen, and Zingales (2013) argue, to the extent that not all the controlvariables are included in the model, the opposite effects of the simultaneity and the omitted variablebiases will lead to a lower bound for the impact of merger on innovation. We measure Tobin’s q fromthe ratio of market value (M Vit) to the tangible assets (TAit, explained above) of firm i in year t. Themarket value of a firm is calculated as the sum of the current market value of common and preferredstocks, long-term debt adjusted for inflation, and short-term debts of the firm net of assets.
We also control for the type of mergers. Horizontal mergers, which replace competing firms with asingle firm, have a good potential to change market concentration or improve cost efficiencies(Pepall, Richards, and Norman 2011, 314), and consequently to influence innovation. Verticalmergers also combine production of complementary goods, improving efficiencies (Riordan 1992)and providing more resources for innovation. Conglomerate mergers, which combine firms withneither substitute nor complement products, are no exception to providing resources for innovation,as they may result in economies of scope and a decrease in transaction costs (Pepall, Richards, andNorman 2011, 344). We add two indicator variables horizontalit and V Cit to Equation (1) as a controlfor merger types. The variables take a value equal to 1 if mergers are horizontal or vertical, and zerootherwise. If the SIC codes of the target and acquirer in a pair of mergers are the same, we assume the
ECONOMICS OF INNOVATION AND NEW TECHNOLOGY 137
merger is horizontal. In the case that the SIC codes differ, mergers are either vertical or conglomeratebut our data do not provide identifying information on separating vertical mergers from conglomer-ate mergers.
There are two potential issues in the estimation of the model. First is the possible unobserved het-erogeneities among firms (Firm FE) that might arise from different firm performances that do notchange over time. Unobserved heterogeneities might be time-specific as well (Time FE). To controlfor the unobserved heterogeneities, the model is estimated by the fixed-effects (FE) methodwhich includes αi and mt as the firm and time fixed effects, respectively. We estimate Equation (1)with a within estimator for panel data. Another issue in empirical studies is the endogeneityproblem due to the reverse causality between merger and innovation activities (Schulz 2007). Katzand Shelanski (2005) argue that the relation between innovation and merger might run in the oppo-site direction and that innovation can influence market structure. In other words, firms might decideto merge to capture returns and knowledge spillovers from their research activities and reduce com-petition in innovation. As a result, mergers by innovative firms change the market structure; specifi-cally, mergers lead to larger and less competitive firms.8 Our strategy to tackle the possibleendogeneity is to use previous merger experiences of acquiring firms to isolate the exogenousimpact of mergers on innovation. According to Danzon, Epstein, and Nicholson (2007), merger inte-grations use resources and managerial efforts. Using previous merger experiences of acquiring firmsmight be relevant instruments, as such firms go through the transition of another merger much moreeasily as a result of their previous merger integration experiences. The previous merger experiencesof firms can therefore be correlated with firms’ current merger decision. However, the likelihood ofthe impact of an acquirer’s previous merger experiences, made several years earlier, on its currentinnovative activities, measured by the variable logCitationPatentit, should be small.
To measure previous merger experiences as instruments, we employ three indicator variables. Thefirst variable isMerger2to5it, which takes a value equal to 1 if the acquiring firm in a merger has experi-enced another merger(s) in the two to five years prior to the merging year. The second and thirdinstrumental variables are Merger3to5it and MergerMoreThan5it, which take a value equal to 1 if theacquiring firm in a merger experienced another merger(s) in the past three to five years and morethan five years prior to the merger, respectively.
One caveat for our instruments is that they might not be completely independent from inno-vation, because our measure of innovation includes a stock of citation and patents, which mightbe correlated with the past mergers. To remedy this potential problem, we follow the approach ofBlundell, Griffith, and VanReenen (1999) to control for a measure of historical innovation. Theyargue that firms’ entry level of innovation to the sample is uncorrelated with subsequent shocksto innovation, e.g. mergers. Therefore, the pre-sample information on the patenting propensity offirms can be used as a measure of historical innovation to mitigate the problem. As in Ziedonis(2004), we measure the historical innovation by the logarithm of the count of patents (lpresamppa-tent) in the pre-sample period.
2.3. Data
We construct a panel data set on publicly traded US manufacturing firms from 1980 to 2003 by com-bining four different data bases. Our first data source is the updated National Bureau of EconomicResearch (NBER) files, which contain information on all United States Patent and Trademark Officeutility patents granted from 1976 to 2006 (3,279,509 patents) and their received citations(23,667,977 citations).9 We use the information on patents and their citations for building the cita-tion-weighted patent stocks variable as a measure of innovation. The second data source weemploy is the Compustat North American Annual Industrial data set from Standard and Poors,which contains financial information on US publicly traded firms.10
The third data source, which contains information on the company identifiers, is used to link theupdated NBER patent and citation files by firm names to the Compustat firms.11 This file is needed
138 M. ENTEZARKHEIR AND S. MOSHIRI
because Compustat has a unique code for each publicly traded firm. However, firms can apply forpatents either under their own name or under their subsidiaries’ names, and patent and citationfiles do not specify a unique code for each patenting firm. The identifier file has the assigneenumber of each patenting firm in its patent documents, as well as its equivalent identifier in the Com-pustat data source. Our fourth data source is the Thompson Financial SDC Platinum merger data set,which tracks completed mergers.
We merge the patent file with the citation file to make use of citation information such as count ofcitations made in each patent document. We then drop withdrawn patents and include only thepatents of public firms granted from 1976 to 2006 to be able to match the results to the publicfirms in the Compustat data set.12 After these changes, the patent file has 1,355,677 observations.We use data on the manufacturing sector’s (SIC 2000–3999) firms in the Compustat data from1976 to 2006, which results in an unbalanced panel of 7174 firms with 161,633 observations. Thesample of publicly traded firms may not be fully representative of all firms in the manufacturingsector; however, our choice is restricted by the availability of data.
In the next stage, we merge the patent and citation information with the Compustat data employ-ing the identifier file. Then, we drop some of the missing values on financial information of firms,leaving us with the total number of observations equal to 77,909, which includes 6679 uniquefirms for the period 1976–2006. As a result of a gap between the application and grant date ofpatents, the data on patents and their citations are truncated. Patents with an application dateclose to the end of the sample might be granted out of the reach of the sample. Similarly patentsin the sample might receive further citations outside the sample period. We correct for these trunca-tions in building our measure of innovation or the citation-weighted patent stock (see appendix fordetailed correction procedures). We further limit the combined Compustat and patent files to 1976–2003 to avoid potential problems that might arise from truncations as well as the edge effectssuggested by Hall, Jaffe, and Trajtenberg (2005). Therefore, our sample is limited to where thedata are least problematic.
Themerger information from the SDC is from 1980 to the present. Considering our other employeddata sources, we use data on US manufacturing target and acquiring firms from 1980 to 2003 in theSDC. As a result, the SDC provides us with 1566 unique acquiring companies and 2075 uniquetarget companies. Then, to add the SDC merger information to the combined Compustat andpatent files, we hand-match each SDC acquiring and target firm’s name to the Compustat names.This leaves us with 1064 matches in acquiring companies and 1528 matches in target companies tothe company names in the combined Compustat and patent files. We add the merger SDC data tothe combined Compustat and patent files, using our hand-matched names of the acquiring companiesto the Compustat firm names. As a result, we have 877 pairs of mergers with 6741 observations. Notethat some of the acquiring firms experience several mergers during the sample period.13
The combined Compustat, patent, and SDC merger data set has observations for the acquiringfirms in the pre-merger periods and the merging year, the merged entity in the post-mergerperiod, and the target companies only at merging year. To incorporate the pre-merger informationof target firms, we employ our hand-matched SDC target names to the Compustat firms and locateeach target’s pre-merger information among Compustat firms. Then, we hand-match this informationto the combined Compustat and patent files for targets in the pre-merger period. This means that ineach pair of merging firms, we observe both target and acquiring companies in the pre-mergerperiod and the merging year. In the post-merger period, we observe merged entities. The resultingdata set is an unbalanced panel of 5327 manufacturing firms with 53,936 observations from 1980 to2003. Of these firms, 877 participate in merger activities. In the next step we exclude a group of firmswith missing observations on our measure of innovation (citation-weighted patent stocks). Firmswithout any patents or firms without any citations on their patents are the ones with missing obser-vations on our innovation measure. The missing values are identified when the citation and patentdata files are combined with the Compustat data. Nevertheless, firms that do not match with the cita-tion and patent files may or may not have patents and citations. In other words, we are not sure that
ECONOMICS OF INNOVATION AND NEW TECHNOLOGY 139
these missing values are actually zeros.14 As a robustness check, we also estimate our mainregressions in Section 2.2, while replacing the missing values of our innovation measure with1. The results are comparable to those in Section 3.
After eliminating the missing values of our innovation measure, the baseline sample or resultingdata set has 642 mergers, with 17,310 observations on merging and non-merging firms for the period1980–2003. Nevertheless, the exact number of observations depends on the regression modelemployed. To our knowledge, only Sevilir and Tian (2012) use data sources similar to ours buttheir data set does not include the pre-merger information on target companies and the non-merging firms. This lack prevents the authors from comparing innovation between merging andnon-merging firms while controlling for possible economic changes from the pre-merger to thepost-merger period (Mueller 1997) .
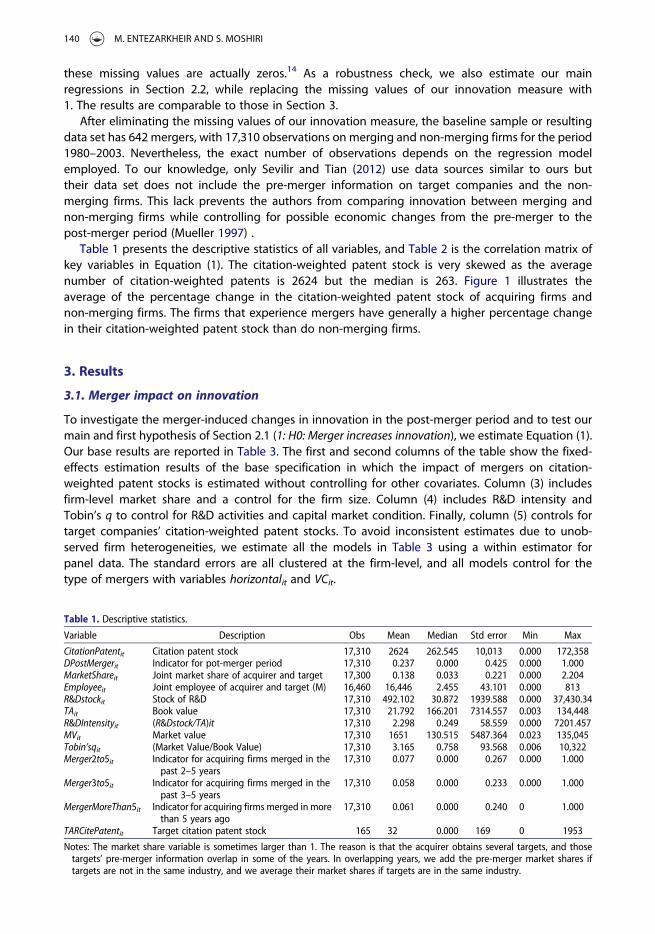
Table 1 presents the descriptive statistics of all variables, and Table 2 is the correlation matrix ofkey variables in Equation (1). The citation-weighted patent stock is very skewed as the averagenumber of citation-weighted patents is 2624 but the median is 263. Figure 1 illustrates theaverage of the percentage change in the citation-weighted patent stock of acquiring firms andnon-merging firms. The firms that experience mergers have generally a higher percentage changein their citation-weighted patent stock than do non-merging firms.
3. Results
3.1. Merger impact on innovation
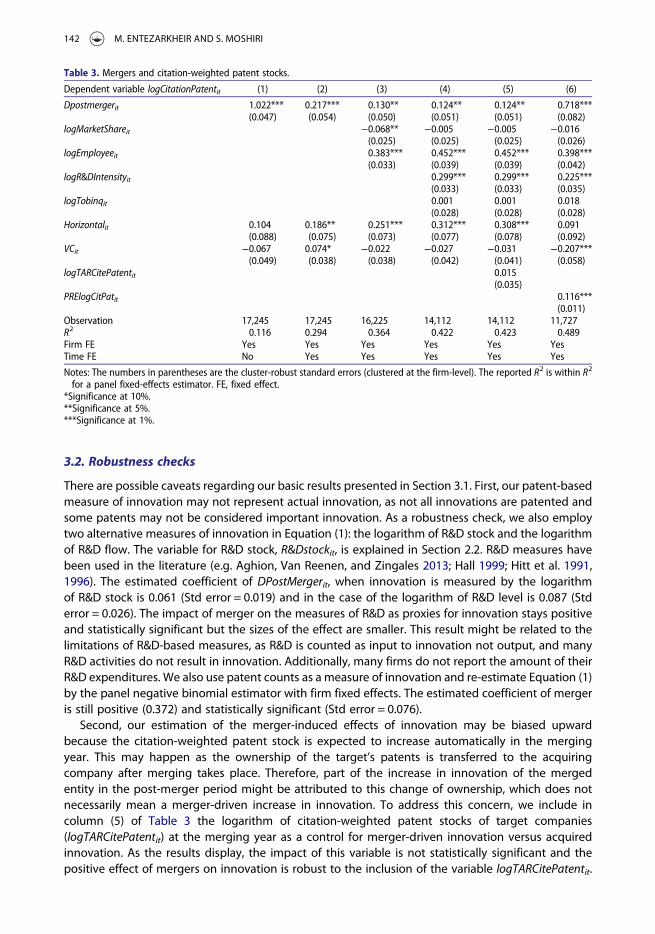
To investigate the merger-induced changes in innovation in the post-merger period and to test ourmain and first hypothesis of Section 2.1 (1: H0: Merger increases innovation), we estimate Equation (1).Our base results are reported in Table 3. The first and second columns of the table show the fixed-effects estimation results of the base specification in which the impact of mergers on citation-weighted patent stocks is estimated without controlling for other covariates. Column (3) includesfirm-level market share and a control for the firm size. Column (4) includes R&D intensity andTobin’s q to control for R&D activities and capital market condition. Finally, column (5) controls fortarget companies’ citation-weighted patent stocks. To avoid inconsistent estimates due to unob-served firm heterogeneities, we estimate all the models in Table 3 using a within estimator forpanel data. The standard errors are all clustered at the firm-level, and all models control for thetype of mergers with variables horizontalit and VCit.
Table 1. Descriptive statistics.
Variable Description Obs Mean Median Std error Min Max
CitationPatentit Citation patent stock 17,310 2624 262.545 10,013 0.000 172,358DPostMergerit Indicator for pot-merger period 17,310 0.237 0.000 0.425 0.000 1.000MarketShareit Joint market share of acquirer and target 17,300 0.138 0.033 0.221 0.000 2.204Employeeit Joint employee of acquirer and target (M) 16,460 16,446 2.455 43.101 0.000 813R&Dstockit Stock of R&D 17,310 492.102 30.872 1939.588 0.000 37,430.34TAit Book value 17,310 21.792 166.201 7314.557 0.003 134,448R&DIntensityit (R&Dstock/TA)it 17,310 2.298 0.249 58.559 0.000 7201.457MVit Market value 17,310 1651 130.515 5487.364 0.023 135,045Tobin’sqit (Market Value/Book Value) 17,310 3.165 0.758 93.568 0.006 10,322Merger2to5it Indicator for acquiring firms merged in the
past 2–5 years17,310 0.077 0.000 0.267 0.000 1.000
Merger3to5it Indicator for acquiring firms merged in thepast 3–5 years
17,310 0.058 0.000 0.233 0.000 1.000
MergerMoreThan5it Indicator for acquiring firms merged in morethan 5 years ago
17,310 0.061 0.000 0.240 0 1.000
TARCitePatentit Target citation patent stock 165 32 0.000 169 0 1953
Notes: The market share variable is sometimes larger than 1. The reason is that the acquirer obtains several targets, and thosetargets’ pre-merger information overlap in some of the years. In overlapping years, we add the pre-merger market shares iftargets are not in the same industry, and we average their market shares if targets are in the same industry.
140 M. ENTEZARKHEIR AND S. MOSHIRI

As the results show, the impact of merger on innovation, measured by logCitationPatentit, is posi-tive and statistically significant in all specifications presented in columns (1–4). Therefore, the datasupports our first hypothesis. This result indicates that on average the difference in the mean of inno-vation between merging and non-merging firms has increased following a merger (the base groupconsists of non-merging firms). One interpretation of this finding is that mergers, which lead to largerand less competitive firms, increase the economies of scale and the ability to absorb risks of R&Dinvestments. Thus, the Schumpeter (1934, 1942) view on the innovation-market structure relationshipis supported by our empirical results.
The positive and statistically significant coefficient of firm size, measured by the variablelogEmployeeit, in columns (3) and (4) indicates that larger firms innovate more. The impact ofmarket share (logMarketShareit), shown in column (4), is negative but very small and statistically insig-nificant. Column (4) further shows that firms with more R&D intensity have more innovation. The vari-able logTobin’sqit, which controls for capital market condition and the biases explained in Section 2.2,has a positive impact on innovative activities but the effect is not statistically significant. The esti-mated coefficient of DPostMergerit decreases only slightly from column (3) to column (4) of Table3, where we control for logTobin’sqit (0.130–0.124). Finally, the highly positive and statistically signifi-cant impact of horizontal mergers on innovation, which is robust to all specifications, implies thatmergers that take place in the same market trigger more innovation as they change market concen-tration or improve cost efficiencies (Pepall, Richards, and Norman 2011, 314).
Table 2. Correlation matrix.
CitationPatentit DPostMergerit MarketShareit Employeeit R&DIntensityit Tobin’sqitCitationPatentit 1.000DPostMergerit 0.154 1.000MarketShareit 0.234 0.212 1.000Employeeit 0.461 0.119 0.343 1.000R&DIntensityit −0.006 −0.017 −0.022 −0.0130 1.000Tobin’sqit −0.005 −0.010 −0.014 −0.009 0.518 1.000
Figure 1. Average of %Δ CitationPatent of merging and non-merging firms.
ECONOMICS OF INNOVATION AND NEW TECHNOLOGY 141
3.2. Robustness checks
There are possible caveats regarding our basic results presented in Section 3.1. First, our patent-basedmeasure of innovation may not represent actual innovation, as not all innovations are patented andsome patents may not be considered important innovation. As a robustness check, we also employtwo alternative measures of innovation in Equation (1): the logarithm of R&D stock and the logarithmof R&D flow. The variable for R&D stock, R&Dstockit, is explained in Section 2.2. R&D measures havebeen used in the literature (e.g. Aghion, Van Reenen, and Zingales 2013; Hall 1999; Hitt et al. 1991,1996). The estimated coefficient of DPostMergerit, when innovation is measured by the logarithmof R&D stock is 0.061 (Std error = 0.019) and in the case of the logarithm of R&D level is 0.087 (Stderror = 0.026). The impact of merger on the measures of R&D as proxies for innovation stays positiveand statistically significant but the sizes of the effect are smaller. This result might be related to thelimitations of R&D-based measures, as R&D is counted as input to innovation not output, and manyR&D activities do not result in innovation. Additionally, many firms do not report the amount of theirR&D expenditures. We also use patent counts as a measure of innovation and re-estimate Equation (1)by the panel negative binomial estimator with firm fixed effects. The estimated coefficient of mergeris still positive (0.372) and statistically significant (Std error = 0.076).
Second, our estimation of the merger-induced effects of innovation may be biased upwardbecause the citation-weighted patent stock is expected to increase automatically in the mergingyear. This may happen as the ownership of the target’s patents is transferred to the acquiringcompany after merging takes place. Therefore, part of the increase in innovation of the mergedentity in the post-merger period might be attributed to this change of ownership, which does notnecessarily mean a merger-driven increase in innovation. To address this concern, we include incolumn (5) of Table 3 the logarithm of citation-weighted patent stocks of target companies(logTARCitePatentit) at the merging year as a control for merger-driven innovation versus acquiredinnovation. As the results display, the impact of this variable is not statistically significant and thepositive effect of mergers on innovation is robust to the inclusion of the variable logTARCitePatentit.
Table 3. Mergers and citation-weighted patent stocks.
Dependent variable logCitationPatentit (1) (2) (3) (4) (5) (6)
Dpostmergerit 1.022***(0.047)
0.217***(0.054)
0.130**(0.050)
0.124**(0.051)
0.124**(0.051)
0.718***(0.082)
logMarketShareit −0.068**(0.025)
−0.005(0.025)
−0.005(0.025)
−0.016(0.026)
logEmployeeit 0.383***(0.033)
0.452***(0.039)
0.452***(0.039)
0.398***(0.042)
logR&DIntensityit 0.299***(0.033)
0.299***(0.033)
0.225***(0.035)
logTobinqit 0.001(0.028)
0.001(0.028)
0.018(0.028)
Horizontalit 0.104(0.088)
0.186**(0.075)
0.251***(0.073)
0.312***(0.077)
0.308***(0.078)
0.091(0.092)
VCit −0.067(0.049)
0.074*(0.038)
−0.022(0.038)
−0.027(0.042)
−0.031(0.041)
−0.207***(0.058)
logTARCitePatentit 0.015(0.035)
PRElogCitPatit 0.116***(0.011)
Observation 17,245 17,245 16,225 14,112 14,112 11,727R2 0.116 0.294 0.364 0.422 0.423 0.489Firm FE Yes Yes Yes Yes Yes YesTime FE No Yes Yes Yes Yes Yes
Notes: The numbers in parentheses are the cluster-robust standard errors (clustered at the firm-level). The reported R2 is within R2
for a panel fixed-effects estimator. FE, fixed effect.*Significance at 10%.**Significance at 5%.***Significance at 1%.
142 M. ENTEZARKHEIR AND S. MOSHIRI
As an alternative, we also look at the impact of merger on the change in the citation-weighted patentstock from the pre-merger period to the post-merger period. The results show that the impact ofmerger (DPostMergerit) stays positive and statistically significant (4.117, Std error = 1.239). Thisimplies that the citation-weighted patent stock of the merged entity is more than the sum of the cita-tion-weighted patent stocks of the target and acquirer in the pre-merger period.
Third, some firms may see merging as a solution to their poor research programmes and lack ofinnovative activities (Danzon, Epstein, and Nicholson 2007). Those mergers are not expected toincrease innovation and may even decrease it, at least in the short run. To avoid the association ofthis change in innovation to the merger process, we control for acquirers’ citation-weighted patentstock in the pre-merger period with the variable PRElogCitPatit. As the results in column (6) of Table3 show, the impact of this variable is positive and statistically significant, and the positive and statisti-cally significant merger-induced changes of innovation remain unchanged. Fourth, our original modelassumes thatmergers and innovation are contemporaneously correlated, whereas theremight be a lagbetween the time that merger occurs and innovation materializes. In order to capture the time lag, weestimate Equation (1) with one lag of the merger variable (DPostMergerit−1). The impact of merger oninnovation stays positive and statistically significant (0.118, Std error = 0.047).
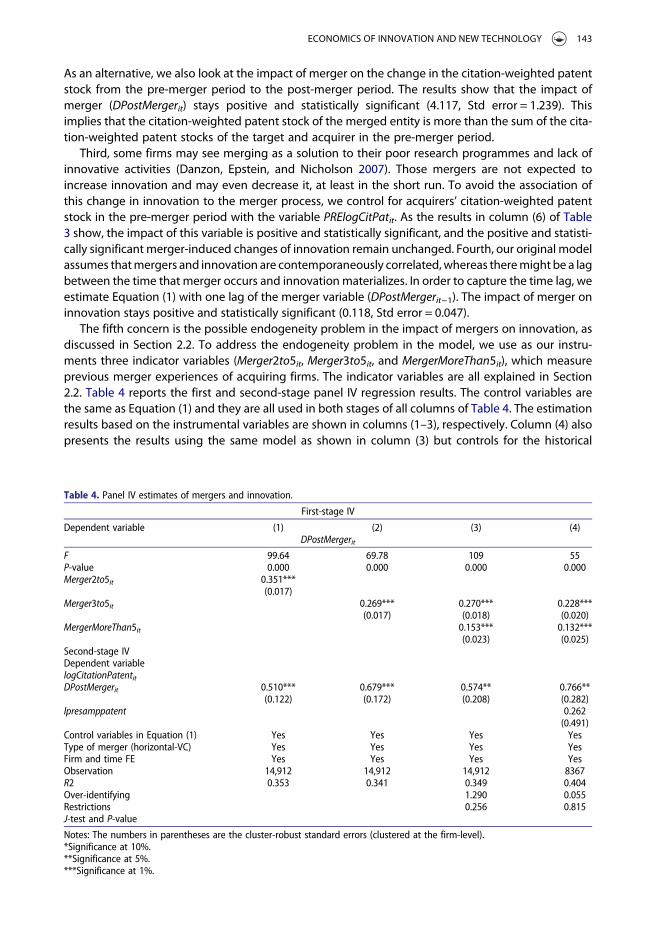
The fifth concern is the possible endogeneity problem in the impact of mergers on innovation, asdiscussed in Section 2.2. To address the endogeneity problem in the model, we use as our instru-ments three indicator variables (Merger2to5it, Merger3to5it, and MergerMoreThan5it), which measureprevious merger experiences of acquiring firms. The indicator variables are all explained in Section2.2. Table 4 reports the first and second-stage panel IV regression results. The control variables arethe same as Equation (1) and they are all used in both stages of all columns of Table 4. The estimationresults based on the instrumental variables are shown in columns (1–3), respectively. Column (4) alsopresents the results using the same model as shown in column (3) but controls for the historical
Table 4. Panel IV estimates of mergers and innovation.
First-stage IV
Dependent variable (1) (2) (3) (4)DPostMergerit
F 99.64 69.78 109 55P-value 0.000 0.000 0.000 0.000Merger2to5it 0.351***
(0.017)Merger3to5it 0.269***
(0.017)0.270***(0.018)
0.228***(0.020)
MergerMoreThan5it 0.153***(0.023)
0.132***(0.025)
Second-stage IVDependent variablelogCitationPatentitDPostMergerit 0.510***
(0.122)0.679***(0.172)
0.574**(0.208)
0.766**(0.282)
lpresamppatent 0.262(0.491)
Control variables in Equation (1) Yes Yes Yes YesType of merger (horizontal-VC) Yes Yes Yes YesFirm and time FE Yes Yes Yes YesObservation 14,912 14,912 14,912 8367R2 0.353 0.341 0.349 0.404Over-identifying 1.290 0.055Restrictions 0.256 0.815J-test and P-value
Notes: The numbers in parentheses are the cluster-robust standard errors (clustered at the firm-level).*Significance at 10%.**Significance at 5%.***Significance at 1%.
ECONOMICS OF INNOVATION AND NEW TECHNOLOGY 143
innovation measure lpresamppatent to check for the robustness of results to the possible correlationof past merger experiences to present innovation.
The coefficient estimates of all instruments in columns (1–4) of Table 4 are positive and statisticallysignificant at a 1% level of significance. This finding conforms to the idea that having previous mergerexperience facilitates more mergers, possibly because of improved managerial experience and lowercosts of integration (Danzon, Epstein, and Nicholson 2007). Furthermore, the first-stage F-statistics islarge enough to reject the null hypothesis that the estimated coefficients of the instruments are equalto zero across all columns. This result lessens concerns that the second-stage estimates might beunreliable. The test results for the over-identifying restrictions for the specifications in columns (3)and (4), generated by the J-test of Hansen (1982), indicate that the hypothesis of exogenous instru-ments could not be rejected in both columns. These results imply that the instruments in columns (3)and (4) can explain variations in merging decisions while remaining uncorrelated with error terms.The results obtained from the second-stage IV estimations are consistent with those reportedearlier. Specifically, the instrumented impacts of mergers on citation-weighed patents presented inTable 4 are all positive and statistically significant.
Time-varying differences among merging and non-merging firms in terms of their characteristicsand outcomes in the pre-merger period might be correlated with their merging decision and mightalso influence their outcomes in the post-merger period. For example, if there is a temporary firm-specific shock, such as a change in management, that influences merging firms’ outcomes positively,these firms might also perform better in the post-merger period. Therefore, merging firms should becompared with non-merging firms with similar characteristics to ensure that the comparison presentsan adequate reflection of non-merging outcomes for merging firms. To compare merging firms withnon-merging firms with similar pre-merge characteristics, we follow Bandick, Gorg, and Karpaty(2014), Szucs (2014), and Valentini (2012) and combine the difference-in-difference (DID) methodwith the propensity-score matching (PSM) method for our panel data. The reason for employingthis method is that, ideally, we would like to compare the innovation of merging firms to their inno-vation if they had not merged, but such information is not available. Thus, to build the missing coun-terfactual, we compare the innovation outcomes of merging firms to the innovation of non-mergingfirms as our control group. The matching technique allows us to build a sample of merging and non-merging firms with similar pre-merger characteristics. The DID aspect of this method eliminates theimpact of firm unobserved heterogeneities.
We first estimate the propensity score, while including logMarketShareit−1, logEmployeeit−1, log-R&DIntensityit−1, and logTobin’sqit−1 in a probit model, where the dependent variable is our treatmentvariable, DPostMergerit. The choice of explanatory variables in this model is based on the empiricalliterature on merger determinants (e.g. Huck, Konrad, and Muller 2000; Jovanovic and Rousseau2002; Komlenovic, Mamun, and Mishra 2011; Rhodes-Kropf and Viswanathan 2004). We use onelag of the explanatory variables, as each variable takes time to show impact on the decision tomerge. As in Bandick, Gorg, and Karpaty (2014), we also include controls for time and industry toensure that the matched control observations are assigned only from the same year and industryas each merging firm. The estimated coefficients of variables logMarketShareit−1, logEmployeeit−1,and logR&DIntensityit−1 are all positive and statistically significant in the probit model, but the coeffi-cient of logTobin’sqit−1 is negative and statistically significant. Then, we conduct the matching usingthe nearest-neighbour method and calculate the average treatment effect on treated (ATT). In thematching process, the average absolute bias before matching is 54.4% and after matching is4.5%.15 We also check for the balancing condition, according to which each explanatory variabledoes not differ significantly between merging and non-merging firms. We further examine thecommon support condition, under which the firms with the same characteristics have a positiveprobability of being in both the treatment and non-treatment groups.16 We use the difference ofthe averages of CitationPatentit in the pre-merger and the post-merger periods as our outcome vari-able, considering the panel nature of our data set. The ATT result using DID PSM is 0.057 (Std error =0.012), indicating that both the balancing and common support conditions are satisfied. This result
144 M. ENTEZARKHEIR AND S. MOSHIRI
translates into a significant positive post-merger impact on innovation. Merger increases the growthof innovation by about 6% in the post-merger period. Thus, we still find a positive and statisticallysignificant impact from mergers on innovation in comparison to the results in Table 3, althoughthe size of the impact is smaller here.
3.3. Heterogeneous merger impacts by market share and size
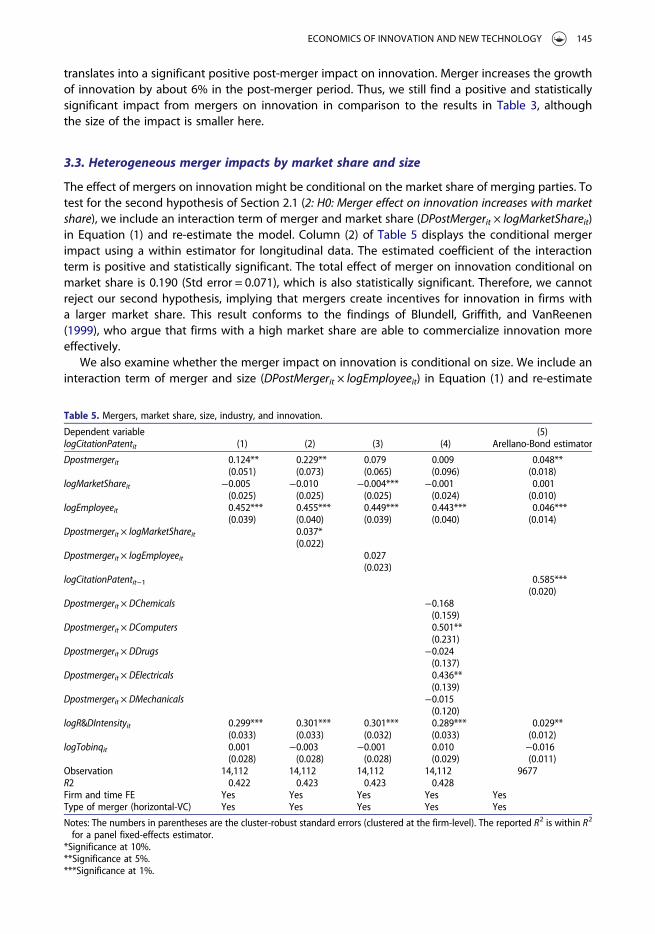
The effect of mergers on innovation might be conditional on the market share of merging parties. Totest for the second hypothesis of Section 2.1 (2: H0: Merger effect on innovation increases with marketshare), we include an interaction term of merger and market share (DPostMergerit × logMarketShareit)in Equation (1) and re-estimate the model. Column (2) of Table 5 displays the conditional mergerimpact using a within estimator for longitudinal data. The estimated coefficient of the interactionterm is positive and statistically significant. The total effect of merger on innovation conditional onmarket share is 0.190 (Std error = 0.071), which is also statistically significant. Therefore, we cannotreject our second hypothesis, implying that mergers create incentives for innovation in firms witha larger market share. This result conforms to the findings of Blundell, Griffith, and VanReenen(1999), who argue that firms with a high market share are able to commercialize innovation moreeffectively.
We also examine whether the merger impact on innovation is conditional on size. We include aninteraction term of merger and size (DPostMergerit × logEmployeeit) in Equation (1) and re-estimate
Table 5. Mergers, market share, size, industry, and innovation.
Dependent variablelogCitationPatentit (1) (2) (3) (4)
(5)Arellano-Bond estimator
Dpostmergerit 0.124**(0.051)
0.229**(0.073)
0.079(0.065)
0.009(0.096)
0.048**(0.018)
logMarketShareit −0.005(0.025)
−0.010(0.025)
−0.004***(0.025)
−0.001(0.024)
0.001(0.010)
logEmployeeit 0.452***(0.039)
0.455***(0.040)
0.449***(0.039)
0.443***(0.040)
0.046***(0.014)
Dpostmergerit × logMarketShareit 0.037*(0.022)
Dpostmergerit × logEmployeeit 0.027(0.023)
logCitationPatentit−1 0.585***(0.020)
Dpostmergerit × DChemicals −0.168(0.159)
Dpostmergerit × DComputers 0.501**(0.231)
Dpostmergerit × DDrugs −0.024(0.137)
Dpostmergerit × DElectricals 0.436**(0.139)
Dpostmergerit × DMechanicals −0.015(0.120)
logR&DIntensityit 0.299***(0.033)
0.301***(0.033)
0.301***(0.032)
0.289***(0.033)
0.029**(0.012)
logTobinqit 0.001(0.028)
−0.003(0.028)
−0.001(0.028)
0.010(0.029)
−0.016(0.011)
Observation 14,112 14,112 14,112 14,112 9677R2 0.422 0.423 0.423 0.428Firm and time FE Yes Yes Yes Yes YesType of merger (horizontal-VC) Yes Yes Yes Yes Yes
Notes: The numbers in parentheses are the cluster-robust standard errors (clustered at the firm-level). The reported R2 is within R2
for a panel fixed-effects estimator.*Significance at 10%.**Significance at 5%.***Significance at 1%.
ECONOMICS OF INNOVATION AND NEW TECHNOLOGY 145
the model. As column (3) of Table 5 shows, the coefficient of the interaction term is not statisticallysignificant. The total positive impact of mergers on innovation is also present for larger-size firms butis not statistically significant (total effect = 0.071, Std error = 0.063).
We check for the robustness of the positive and significant effect of mergers on innovationconditional on market share by alternative measures of innovation and different modelspecification. Specifically, we re-estimate the model presented in column (2) of Table 5 using the log-arithm of R&D stock and flow as alternative measures of innovation, we control for the citation-weighted patent stocks of target companies at the merging year and acquirers’ citation-weightedpatent stocks in the pre-merger period, and we capture the lag between the time that mergeroccurs and innovation materializes by including a lag of the merger variable. In all cases, our mainresult on market share remains unchanged, and the second hypothesis in Section 2.1 cannot berejected.
3.4. Heterogeneous merger impacts by industry
In addition to market share and size, the effect of mergers on innovation might also be conditional onthe acquiring firms’ industry. In order to explore industry heterogeneity and to test for the thirdhypothesis of Section 2.1 (3: H0: The impact of merger on innovation is heterogeneous across industries),we re-estimate the model, which includes interactive industry dummy variables in Equation (1). Theresults are reported in column (4) of Table 5.
As in to Hall and Vopel (1997) and Hall, Jaffe, and Trajtenberg (2005), we construct six industrycategories, Chemicals, Computers, Drugs, Electricals, Mechanicals, and OtherIndustries.17 The respectivenumber of firms and number of mergers in each of these industries in the sample are: Chemicals:firms = 174, mergers = 21; Computers: firms = 337, mergers = 28; Drugs: firms = 1089, mergers = 87;Electricals: firms = 1250, mergers = 99; and Mechanicals: firms = 866, mergers = 91.
The industry-specific merger effects are reported in column (4) of Table 5. The estimated coeffi-cients show the marginal impact of a merger on innovation in an industry compared to that inthe reference group (OtherIndustries). The total industry-specific impacts of mergers on innovationare as follows (with standard errors in brackets): Chemicals, −0.158 (0.134), Computers, 0.510(0.212), Drugs, −0.015 (0.100), Electricals, 0.446 (0.105), and Mechanicals, −0.006 (0.084). The findingsindicate the heterogeneous impact of mergers on innovation across industries and show thatmergers promote innovation in all industries but the effect is only statistically significant in Computersand Electricals. Therefore, the data do not lead us to reject our third hypothesis in Section 2.1. Thisresult might imply that anti-trust authorities should treat the merger applications of these industriesdifferently if innovation is a consideration in their merger application assessments. Using the indus-try-specific regression results above, we further conduct a joint hypothesis test of the equality of theimpact of mergers on innovation across industries. According to the F test result (F = 5.35), we rejectthe hypothesis of homogeneous impacts of mergers on innovation across industries in the post-merger period. The result that innovation is more important for merger decisions in the Computersindustry than in other industries may be explained by the fact that this industry is subject to signifi-cant network and spillover effects associated with the knowledge characteristics of the products(Moshiri and Simpson 2011).
As noted in Entezarkheir (2016), Hall, Jaffe, and Trajtenberg (2005), Ziedonis (2004), and Halland Ziedonis (2001), a number of the industries in the manufacturing sector patent defensively.Defensive patenting is mostly associated with obtaining patents to increase bargaining powerin patent disputes and does not necessarily lead to actual innovation. To check for the robustnessof our results in this section, we control for the impact of defensive patenting by including theindustry dummies of Hall and Vopel (1997) and Hall, Jaffe, and Trajtenberg (2005), explainedabove, in the model of column (4) of Table 3. The estimated coefficient of DPostMergerit is0.126 (Std error = 0.051), and the positive correlation of merger and innovation is similar tocolumn (4) of Table 3.
146 M. ENTEZARKHEIR AND S. MOSHIRI
3.5. Long-run and short-run effects of mergers on innovation
To test for the fourth hypothesis in Section 2.1 (4: H0: The impact of merger on innovation is larger inthe long run than in the short run), we capture the dynamic effect of mergers on innovation by includ-ing a lag of the dependent variable (logCitationPatentit−1) as an explanatory variable in Equation (1).This dynamic specification assumes that the adjustment to the new equilibrium position will occurpartially through time. We estimate the dynamic panel model using the panel Generalized Methodof Moment estimator (Arellano and Bond,1991), where the instruments are lags of the dependentvariable and are assumed to be weakly exogenous.
The results presented in column (5) of Table 5 show a statistically significant short-run effect frommergers on innovation equal to 0.048 (Std error = 0.018). The estimated long-run effect equals to0.115 (Std error = 0.044), which is much larger than the short-run effect (0.048, Std error = 0.018). Fol-lowing Moshiri and Duah (2016), assuming the steady-stat condition, the long-run effect is calculatedbased on (a1/(1− a2)), where α1 is the estimated short-run effect and α2 is the estimated coefficientof the lagged dependent variable.
The positive short-run and long-run effects support our fourth hypothesis in Section 2.1 and implythat the positive merger-induced changes in innovation persist in the post-merger periods, whichmakes a case for merger authorities to assign a greater weight to innovation considerations intheir merger approvals. Moreover, the smaller innovation effects of mergers in the short run com-pared to the long run supports the idea that merger impacts on innovation do not necessarilyappear shortly after the merger. This finding also conforms to the idea of Danzon, Epstein, and Nichol-son (2007) that some acquiring firms with poor future research prospects participate in mergers toimprove their research but this effect will only be materialized in the long run. As a robustnesscheck, we also re-estimate the model of column (5) of Table 5, measuring innovation with the logar-ithm of R&D stock. The long-run and short-run effects stay positive and statistically significant.
4. Conclusion
The possible impact of market structure on innovation that follows mergers has been a subject ofmuch academic research and an increasing concern for anti-trust policy. However, the literature isstill unclear about what market structure favours innovation. As mergers create larger firmsleading to less competitive markets, an investigation of the relationship between mergers and inno-vation can enhance our understanding of the dynamics of merger activities providing a betterground for a socially optimal anti-trust policy.
Our analysis is conducted using an unbalanced panel data set on more than 5000 publicly tradedmerging and non-merging US firms in the manufacturing sector from 1980 to 2003. A unique aspectof this combined data set is that, contrary to previous studies, it includes information on target com-panies in the pre-merger period for each of the merging pairs of firms in the data. In addition, thislongitudinal data set with more than 20 years of observations allows us to control for heterogeneityand trends and facilitates the examination of the long-run effects of mergers on innovation. Our mainmeasure of innovation is based on citation-weighted patent stocks, but the results are robust to thealternative measures based on R&D and patent counts.
The findings show that mergers increase innovation in acquiring firms, supporting the Schumpe-terian view of the impact of market structure on innovation. These results imply that a merger with atarget firm leads on average to economies of scale and scope as well as a broader knowledge basethat triggers innovation (Cloodt, Hagedoorn, and Van Kranenburg 2006). The finding of a positiveimpact of mergers on innovation remains unchanged when we instrument the merger variablewith previous merger experiences of acquiring firms.
We also find that mergers have greater positive impacts on innovation for firms with a largermarket share, probably because a larger market share provides more resources for innovation.Firms with a large number of employees also experience a large positive impact on their innovation
ECONOMICS OF INNOVATION AND NEW TECHNOLOGY 147
in the post-merger period, but this effect is not statistically significant. Our study provides evidence ofthe heterogeneous impact of mergers on innovation in terms of acquiring companies’ industry. It alsoshows that mergers have a stronger effect on innovation in the long run than in the short run.
In summary, this study offers some robust evidence of positive impacts of mergers on innovation.Our findings suggest that, although mergers can be costly because of higher prices followed by lesscompetition, they may be socially beneficial because of their positive impact on innovation.
Notes
1. For instance, Gilbert (2006) indicates that out of 109 mergers challenged by the US authorities between 2001 and2003, innovation was mentioned as the reason for the challenges in 41 cases.
2. Jost and Veldon (2008) point to the development of new drugs that require large R&D investment. They arguethat in the pharmaceutical industry, there are many mergers that combine R&D investments. The merger of Glax-oWellcome and SmithKline is an example.
3. In the declining balance formula used for building the citation-weighted patent stock measure, most researcherssettled on δ = 15% (Hall, Jafe, and Trajtenberg, 2000, 2005; Hall, Thoma, and Torrisi 2007). Hall and Mairesse (1995)apply alternative depreciation rates and conclude that changing the rate from 15% does not make a difference.
4. As in Noel and Schankerman (2013), we define the initial stock of citations as the initial sample values of citationcounts.
5. We use the logarithm of CitationPatentit because of the count nature of the data (Aghion, Van Reenen, and Zin-gales 2013) and the skewness in the distribution of patent counts (Sevilir and Tian 2012).
6. We also included in Equation (1) a measure of market concentration, which is built from the sum of squaredmarket shares in four-digit SIC codes, but the estimated coefficient of this variable was negative and statisticallyinsignificant. The inclusion of the variable in the model did not change the estimated coefficient of DPostMergerit.We, therefore, report the results without the market concentration variable.
7. Inflation adjustments are based on the Consumer Price Index (CPI) for urban US for 1992 (source: http://www.bls.gov).
8. As a measure of innovation, Blonigen and Taylor (2000) use R&D intensity and show that relatively low R&D firmshave a larger likelihood of participation in acquisition market in the US electronics and electrical equipmentsector. Bena and Li (2014) argue that synergies resulted from combining innovation of merging partiespromote merger likelihood. Nevertheless, as discussed before, R&D may not be a good measure of innovation.
9. The updated NBER patent and citation files are prepared by Bronwyn H. Hall, and they are available at: http://elsa.berkeley.edu/~bhhall/. The original files were from 1963 to 1999. For more detailed explanations on the data files,see Hall, Jaffe, and Trajtenberg (2001).
10. The publicly traded firms are those traded on the New York, American, and regional stock exchanges, as well asover the counter in NASDAQ.
11. The company identifier file is available at http://elsa.berkeley.edu/~bhhall.12. According to the USPTO’s website, withdrawn patents are those that are not issued (http://www.uspto.gov/
patents/process/search/withdrawn.jsp). Not that the citation data are not limited to public firms.13. The SDC data also provide information on mergers of private acquirers. Nevertheless, the balance sheet infor-
mation in other standard data sources, such as Compustat, is not available for private firms. Following Komleno-vic, Mamun, and Mishra (2011) and Moeller, Schlingeman, and Stulz (2004), we do not consider private firms in theSDC data set.
14. Hall, Jaffe, and Trajtenberg (2001) discuss the details of the original version of the patent and citations data files,and indicate that they have matched almost 50–65% of US patents for 1965–1995. Thus, we are not sure whetherthe Compustat firms unmatched to patent and citation files are indeed non-patenting or have no citations.
15. The bias is defined as the difference of the mean values of the treatment group and the control group, divided bythe square root of the average sample variance in the treatment group and the not matched control group(Rosenbaum and Robin 1985). Our results are robust to other matching techniques, such as Kernel matching.
16. To check for the common support condition, we compare the min and max values of the propensity score in bothtarget and control groups. For details on this method, see Caliendo and Kopeinig (2008).
17. Chemicals includes chemical products, Computers consists of the computers and computing equipment, andDrugs includes optical and medical instruments, and pharmaceuticals. Electricals includes electrical machineryand electrical instrument and communication equipment, and Mechanicals includes primary metal products, fab-ricated metal products, machinery and engines, transportation equipment, motor vehicles, and auto parts.
Disclosure statement
No potential conflict of interest was reported by the author.
148 M. ENTEZARKHEIR AND S. MOSHIRI
References
Aghion, Philippe, Nicholas Bloom, Richard Blundell, Rachel Griffith, and Peter Howitt. 2005. “Competition and Innovation:An Inverted-U Relationship.” Quarterly Journal of Economics 120 (2): 701–728.
Aghion, Philippe, and Peter Howitt. 1992. “A Model of Growth Through Creative Destruction.” Econometrica 60 (1): 323–351.
Aghion, Philippe, and Jean Tirole. 1994. “On the Management of Innovation.” Quarterly Journal of Economics 109 (1):1185–1209.
Aghion, Philippe, John Van Reenen, and Luigi Zingales. 2013. “Innovation and Institutional Ownership.” AmericanEconomic Review 103 (1): 277–304.
Ahuja, Gautam, and Riitta Katila. 2001. “Technological Acquisition and the Innovation Performance of Acquiring Firms.”Strategic Management Journal 22 (3): 197–220.
Arellano, Manuel, and Stephen Bond. 1991. “Some Tests of Specification for Panel Data: Monte Carlo Evidence and anApplication to Employment Equations.” Review of Economic Studies 58 (2): 277–298.
Arrow, Kenneth. 1962. “Economic Welfare and Allocation of Resources to Invention.” In The Rate and Direction of InventiveActivity, edited by Richard Nelson, 609–626. Princeton, NJ: Princeton University Press.
Ashenfelter, Orley, Daniel Hosken, and Matthew Weinberg. 2009. “Generating Evidence to Guide Merger Enforcement.”CEPS Working Paper No. 183.
Bandick, Roger, Holger Gorg, and Patrik Karpaty. 2014. “Foreign Acquisitions, Domestic Multinationals, and R&D.”Scandinavian Journal of Economics 116 (4): 1091–1115.
Battisti, Giuliana, and Paul Stoneman. 2010. “The Diffusion of New Technology.” In Handbook of the Economics ofInnovation, edited by Bronwyn Hall and Nathan Rosenberg, 2 vols, 733–760. Stanford: Elsevier.
Bena, Jan, and Kai Li. 2014. “Corporate Innovations and Mergers and Acquisitions.” Journal of Finance 69 (5): 1923–1960.Bertrand, Olivier, and Pluvia Zuniga. 2006. “R&D and M&A: Are Cross-border M&A Different? An Investigation in OECD
Countries.” International Journal of Industrial Organization 24 (2): 401–423.Blonigen, Bruce, and Christopher Taylor. 2000. “R&D Intensity and Acquisitions in High-technology Industries: Evidence
from the US Electronic and Electrical Equipment Industries.” Journal of Industrial Economics 48 (1): 47–70.Bloom, Nick, Mirko Draca, and John Van Reenen. 2015. “Trade Induced Technical Change? The Impact of Chinese Imports
on Innovation, IT and Productivity.” Review of Economic Studies 83 (1): 87–117.Blundell, Richard, Rachel Griffith, and John VanReenen. 1999. “Market Share, Market Value and Innovation in a Panel of
British Manufacturing Firms.” The Review of Economic Studies 66 (3): 529–554.Caliendo, Marco, and Sabine Kopeinig. 2008. “Some Practical Guidance for the Implementation of Property Score
Matching.” Journal of Economic Surveys 22 (1): 31–72.Capron, Laurence. 1999. “The Long-term Performance of Horizontal Acquisitions.” Strategic Management Journal 20 (11):
987–1018.Carrier, Michael. 2008. “Two Puzzles Resolved: Of the Schumpeter-Arrow Stalemate and Pharmaceutical Innovation
Markets.” Iowa Law Review 93 (1): 393–450.Cloodt, Myriam, John Hagedoorn, and Hans Van Kranenburg. 2006. “Mergers and Acquisitions: Their Effect on the
Innovative Performance of Companies in High-tech Industries.” Research Policy 35 (1): 642–654.Cohen, Wesley. 1995. “Empirical Studies of Innovative Activity.” In Handbook of the Economics of Innovation and
Technological Change, edited by Paul Stoneman. Blackwell.Cohen, Wesley, and Daniel Levinthal. 1989. “Innovation and Learning: The Two Faces of R&D.” Economic Journal 99 (1):
569–596.Cohen, Wesley, Richard Nelson, and John Walsh. 2000. “Protecting Their Intellectual Assets: Appropriability Conditions
and Why US Manufacturing Firms Patent (or Not).” National Bureau of Economic Research Working Paper No. 7552.Correa, Juan, and Carmine Ornaghi. 2014. “Competition & Innovation: Evidence from US Patent and Productivity Data.”
Journal of Industrial Economics 62 (2): 258–285.Corredoira, Rafael, and Preeta Banerjee. 2015. “Measuring Patent’s Influence on Techno-logical Evolution: A Study of
Knowledge Spanning and Subsequent Inventive Activity.” Research Policy 44 (1): 508–521.Czarnitzki, Drik, and Kornelius Kraft. 2004. “An Empirical Test of the Asymmetric Models on Innovative Activity: Who
Invests More into R&D, the Incumbent or the Challenger?” Journal of Economic Behavior and Organization 54 (2):153–173.
Danzon, Patricia, Andrew Epstein, and Sean Nicholson. 2007. “Mergers and Acquisitions in the Pharmaceutical andBiotech Industries.” Managerial and Decision Economics 28 (4): 307–328.
Duso, Tomaso, LarsHendrik Roller, and Jo Seldeslachts. 2014. “Collusion Through Joint R&D: An Empirical Assessment.”Review of Economics and Statistics 96 (2): 349–370.
Entezarkheir, Mahdiyeh. 2017. “Patent Thickets, Defensive Patenting, and Induced R&D: An Empirical Analysis of the Costsand Potential Benefits of Fragmentation in Patent Ownership.” Empirical Economics 52 (2): 599–634.
Fundenberg, Drew, and Jean Tirole. 1985. “Pre-emption and Rent Equalization in the Adoption of New Technology.”Review of Economics 52 (3): 383–401.
ECONOMICS OF INNOVATION AND NEW TECHNOLOGY 149

Gilbert, Richard. 2006. “Looking for Mr. Schumpeter: Where Are We in the Competition-innovation Debate?” In InnovationPolicy and the Economy, edited by Adam Jaffe, Joshua Lerner, and Scott Stern, 159–215. Cambridge: National Bureau ofEconomic Research.
Gilbert, Richard, and David Newbery. 1982. “Preemptive Patenting and the Persistence of Monopoly.” American EconomicReview 72 (1): 514–526.
Giroud, Xavier, and Hogler Mueller. 2010. “Does Corporate Governance Matter in Competitive Industries?” Journal ofFinancial Economics 95 (1): 312–331.
Griliches, Zvi. 1992. “The Search for R&D Spillovers.” Scandinavian Journal of Economics 94 (1): 29–47.Griliches, Zvi, and Ariel Pakes. 1980. “Patents and R&D at the Firm Level: A First Look.” National Bureau of Economic
Research Working Paper No. 561.Grossman, Sanford, and Oliver Hart. 1986. “The Costs and Benefits of Ownership: A Theory of Vertical and Lateral
Integration.” Journal of Political Economy 94 (4): 691–719.Grossman, Gene, and Elhanan Helpman. 1991. Innovation and Growth in the Global Economy. Princeton, NJ: MIT Press.Hall, Bronwyn. 1999. Mergers and R&D Revisited. Mimeo.Hall, Bronwyn. 2004. “Innovation and Diffusion.” National Bureau of Economic Research Working Paper No. 10212.Hall, Bronwyn, Adam Jafe, and Manuel Trajtenberg. 2000. “Market Value and Patent Citations: A First Look." National
Bureau of Economic Research Working Paper No. 7741.Hall, Bronwyn, Adam Jaffe, and Manuel Trajtenberg. 2001. “The NBER Patent Citations Data File: Lessons, Insights and
Methodological Tools.” National Bureau of Economic Research Working Paper No. 8498.Hall, Bronwyn, Adam Jaffe, and Manuel Trajtenberg. 2005. “Market Value and Patent Citations.” RAND Journal of
Economics 36 (1): 16–38.Hall, Bronwyn, and Jacques Mairesse. 1995. “Exploring the Relationship Between R&D and Productivity in French
Manufacturing Firms.” Journal of Econometrics 65 (1): 263–293.Hall, Bronwyn, Grid Thoma, and Salvatore Torrisi. 2007. “The Market Value of Patents and R&D: Evidence from European
Firms.” National Bureau of Economic Research Working Paper No. 13426.Hall, Bronwyn, and Manuel Trajtenberg. 2004. “Uncovering GPTs Using Patent Data.” Journal of Economic History 64 (1):
61–99.Hall, Bronwyn, and Katrin Vopel. 1997. “Innovation, Market Share, and Market Value.” http://elsa.berkeley.edu/_bhhall/
papers/HallVopel97.pdf.Hall, Bronwyn, and Rosemarie Ziedonis. 2001. “The Patent Paradox Revisited: An Empirical Study of Patenting in the
Semiconductor Industry, 1979–1995.” RAND Journal of Economics 32 (1): 101–128.Hannan, Timothy, and John McDowell. 1984. “The Determinants of Technology Adoption: The Case of the Banking Firm.”
RAND Journal of Economics 15 (1): 328–335.Hansen, Lars. 1982. “Large Sample Properties of Generalized Method of Moments Estimators.” Econometrica 50 (4): 1029–
1054.Hitt, Michael, Robert Hoskisson, Duane Ireland, and Jeffrey Harrison. 1991. “Effects of Acquisitions on R&D Inputs and
Outputs.” Academy of Managements Journal 34 (3): 693–706.Hitt, Michael, Robert Hoskisson, Richard Johnson, and Douglas Moesel. 1996. “The Market for Corporate Control and Firm
Innovation.” Academy of Managements Journal 39 (5): 1084–1119.Huck, Steffen, Kai Konrad, and Wieland Muller. 2000. “Merger in Contests.” CESifo Working Paper No. 241.Jaffe, Adam, and Manuel Trajtenberg. 2002. Patent, Citations, and Innovations: A Window on the Knowledge Economy.
Cambridge: MIT Press.Jost, Peter, and Claus Velden. 2008. “Organizational Design of R&D after Mergers and the Role of Budget Responsibility.”
Journal of Economics and Business 60 (1): 469–484.Jovanovic, Boyan, and Peter Rousseau. 2002. “The Q-theory of Mergers.” Technological Change 92 (2): 198–204.Karshenas, Masoud, and Paul Stonemen. 1995. “Technological Diffusion.” In Handbook of the Economics of Innovation and
Technological Change, edited by Paul Stoneman, 265–297. Cambridge, MA: Blackwell.Katayama, Hajimeh, Shihua Lu, and James Tybout. 2009. “Firm-level Productivity Studies: Illusions and a Solution.”
International Journal of Industrial Organization 27 (3): 403–413.Katz, Michael, and Howard Shelanski. 2005. “Merger Policy and Innovation: Must En-forcement Change to Account for
Technological Change?” In Innovation Policy and the Economy, edited by Adam Jaffe, Joshua Lerner, and ScottStern, 109–165. Cambridge: MIT Press.
Keller, Wolfgang. 2010. “International Trade, Foreign Direct Investment, and Technology Spillovers.” In Handbook of theEconomics of Innovation, edited by Bronwyn Hall and Nathan Rosenberg, 2 vols, 793–829. Cambridge: Elsevier.
Komlenovic, Srdan, Abdullah Mamun, and Dev Mishra. 2011. “Business Cycle and Aggregate Industry Mergers.” Journal ofEconomic Finance 35 (1): 239–259.
Kukuk, Martin, and Manfred Stadler. 2005. “Market Structure and Innovation Races: An Empirical Assessment UsingIndirect Inference.” Journal of Economics and Statistics 225 (4): 427–440.
Lerner, Joshua. 1994. “The Importance of Patent Scope: An Empirical Analysis.” RAND Journal of Economics 25 (2): 319–333.
150 M. ENTEZARKHEIR AND S. MOSHIRI
Levin, Richard, Wesley Cohen, and David Mowery. 1985. “R&D Appropriability, Opportunity, and Market Structure.”American Economic Review 75 (2): 20–24.
Loecker, Jan De. 2011. “Product Differentiation, Multiproduct Firms, and Estimating the Impact of Trade Liberalization onProductivity.” Econometrics 79 (5): 1407–1451.
Mansfield, Edwin. 1968. Industrial Research and Technological Innovation. New York: Norton.Moeller, Sara, Frederik Schlingeman, and Rene Stulz. 2004. “Firm Size and the Gains from Acquisitions.” Journal of
Financial Economics 73 (1): 201–228.Moshiri, Saeed, and Nana Duah. 2016. “Changes in Energy Intensity in Canada.” Energy Journal 37 (4): 315–342.Moshiri, Saeed, and Wayne Simpson. 2011. “Information Technology and the Changing-workplace in Canada: Firm-level
Evidence.” Industrial and Corporate Change 20 (6): 1601–1636.Mueller, Denis. 1997. “Merger Policy in United States: A Reconsideration.” Review of In-dustrial Organization 12 (1): 655–
685.Nelson, Andrew, Andrew Earle, Jennifer Howard-Grenville, Julie Haack, and Doug Young. 2014. “Do Innovation Measures
Actually Measure Innovation? Obliteration, Symbolic Adoption, and Other Finicky Challenges in Tracking InnovationDiffusion.” Research Policy 43 (1): 927–940.
Nickell, Stephen. 1996. “Competition and Corporate Performance.” Journal of Political Economy 104 (4): 724–746.Noel, Michael, and Mark Schankerman. 2013. “Strategic Patenting and Software Innovation.” Journal of Industrial
Economics 61 (3): 481–520.Pavcnik, Nina. 2002. “Trade Liberalization, Exit and Productivity Improvement: Evidence from Chilean Plants.” Review of
Economic Studies 69 (4): 245–276.Pepall, Lynne, Dan Richards, and George Norman. 2011. Contemporary Industrial Organization: A Quantitative Approach.
New Jersey: John Wiley & Sons.Peters, Bettina. 2006. “Innovation and Firm Performance: An Empirical Investigation of German Firms.” Doctoral diss.,
University of Wuerzburg.Rajan, Raghuram, Henri Servaes, and Luigi Zingales. 2000. “The Cost of Diversity: The Diversification Discount and
Inefficient Investment.” Journal of Finance 55 (1): 35–80.Ravenscraft, David, and Frederic Scherer. 1987. Mergers, Sell-offs, and Economic Efficiency. Washington: Brookings
Institution.Reinganum, Jennifer. 1983. “Uncertain Innovation and the Persistence of Monopoly.” American Economic Review 73 (4):
741–748.Reinganum, Jennifer. 1984. “Practical Implications of Game Theoretic Models of R&D.” American Economic Review, Papers
and Proceedings 74 (1): 61–66.Reinganum, Jennifer. 1985. “Innovation and Industry Evolution.” The Quarterly Journal of Economics 100 (1): 81–100.Rhodes-Kropf, Matthew, and David Robinson. 2008. “The Market for Mergers and Boundaries of the Firm.” Journal of
Finance 63 (3): 1169–1211.Rhodes-Kropf, Matthew, and S. Viswanathan. 2004. “Market Valuation andMerger Waves.” Journal of Finance 59 (1): 2685–
2718.Riordan, Michael. 1992. “Regulation and Preemptive Technology Adoption.” RAND Journal of Economics 23 (3): 334–349.Rosenbaum, Paul, and Donald Robin. 1985. “Constructing a Control Group Using Multi-variate Matched Sampling
Methods that Incorporate the Propensity Score.” American Statistician 39 (1): 33–38.Saloner, Garth, and Andrea Shepard. 1995. “Adoption of Technologies with Network Effects: An Empirical Examination of
the Adoption of Teller Machines.” RAND Journal of Economics 26 (3): 479–501.Schulz, Norbert. 2007. “Review of the Literature on the Impact of Mergers on Innovation.” ZEW Discussion Paper No. 07-
061.Schumpeter, Joseph. 1934. The Theory of Economic Development. Cambridge: Harvard University Press.Schumpeter, Joseph. 1942. Capitalism, Socialism and Democracy. New York: Harper & Bros.Sevilir, Merih, and Xuan Tian. 2012. “Acquiring Innovation.” SSRN Electornic Journal.Stahl, Jassica. 2010. “Mergers and Sequential Innovation: Evidence from Patent Citations.” Working Paper in Board of
Governors of the Federal Reserve System.Szucs, Florian. 2014. “M&A and R&D: Asymmetric Effects on Acquirers and Targets?” Research Policy 43 (1): 1264–1273.Valentini, Giovanni. 2012. “Measuring the Effect of M&A on Patenting Quantity and Quality.” Strategic Management
Journal 33 (3): 336–346.Ziedonis, Rosemarie. 2004. “Don’t Fence Me In: FragmentedMarkets for Technology and the Patent Acquisition Strategies
of Firms.” Management Science 50 (6): 804–820.
ECONOMICS OF INNOVATION AND NEW TECHNOLOGY 151
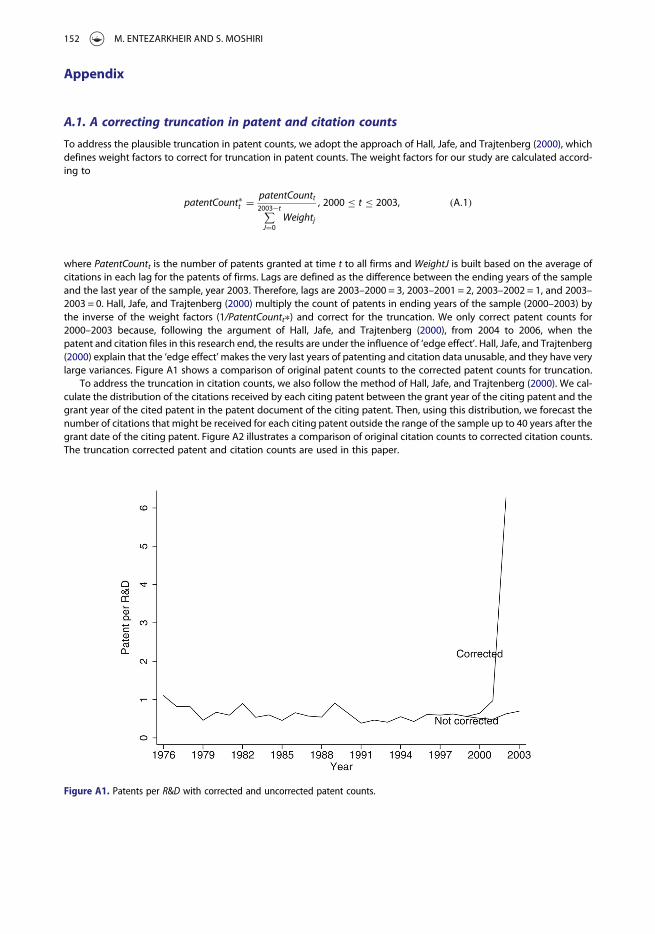
Appendix
A.1. A correcting truncation in patent and citation counts
To address the plausible truncation in patent counts, we adopt the approach of Hall, Jafe, and Trajtenberg (2000), whichdefines weight factors to correct for truncation in patent counts. The weight factors for our study are calculated accord-ing to
patentCount∗t = patentCountt∑2003−t
J=0Weightj
, 2000 ≤ t ≤ 2003, (A.1)
where PatentCountt is the number of patents granted at time t to all firms and WeightJ is built based on the average ofcitations in each lag for the patents of firms. Lags are defined as the difference between the ending years of the sampleand the last year of the sample, year 2003. Therefore, lags are 2003–2000 = 3, 2003–2001 = 2, 2003–2002 = 1, and 2003–2003 = 0. Hall, Jafe, and Trajtenberg (2000) multiply the count of patents in ending years of the sample (2000–2003) bythe inverse of the weight factors (1/PatentCountt∗) and correct for the truncation. We only correct patent counts for2000–2003 because, following the argument of Hall, Jafe, and Trajtenberg (2000), from 2004 to 2006, when thepatent and citation files in this research end, the results are under the influence of ‘edge effect’. Hall, Jafe, and Trajtenberg(2000) explain that the ‘edge effect’makes the very last years of patenting and citation data unusable, and they have verylarge variances. Figure A1 shows a comparison of original patent counts to the corrected patent counts for truncation.
To address the truncation in citation counts, we also follow the method of Hall, Jafe, and Trajtenberg (2000). We cal-culate the distribution of the citations received by each citing patent between the grant year of the citing patent and thegrant year of the cited patent in the patent document of the citing patent. Then, using this distribution, we forecast thenumber of citations that might be received for each citing patent outside the range of the sample up to 40 years after thegrant date of the citing patent. Figure A2 illustrates a comparison of original citation counts to corrected citation counts.The truncation corrected patent and citation counts are used in this paper.
Figure A1. Patents per R&D with corrected and uncorrected patent counts.
152 M. ENTEZARKHEIR AND S. MOSHIRI
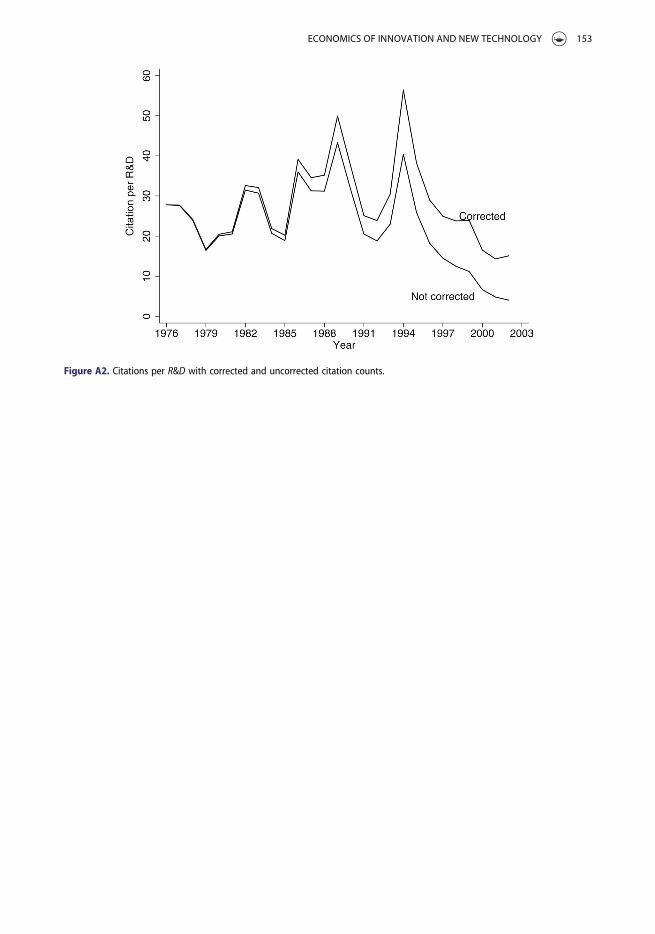
Figure A2. Citations per R&D with corrected and uncorrected citation counts.
ECONOMICS OF INNOVATION AND NEW TECHNOLOGY 153