Mental illness, poverty and stigma in India: a case control study
68
For peer review only Mental illness, poverty and stigma in India: A case control study Journal: BMJ Open Manuscript ID: bmjopen-2014-006355.R2 Article Type: Research Date Submitted by the Author: 13-Jan-2015 Complete List of Authors: Trani, Jean-Francois; Washington University, Brown School Bakhshi, Parul; Washington University in St. Louis, school of medicine Kuhlberg, Jill; Washington University in St. Louis, Brown School Venkataraman, Sreelatha; Dr. Ram Manohar Lohia Hospital, Psychiatry & De-addiction Services Venkataraman, Hemalatha; Dr. Ram Manohar Lohia Hospital, Psychiatry & De-addiction Services Mishra, Nagendra; Dr. Ram Manohar Lohia Hospital, Psychiatry & De- addiction Services Groce, Nora; University College London, Division of Epidemiology and Public Health Jadhav, Sushrut; University College London, Mental health science unit Deshpande, Smita; Dr. Ram Manohar Lohia Hospital, Psychiatry & De- addiction Services <b>Primary Subject Heading</b>: Global health Secondary Subject Heading: Mental health Keywords: Schizophrenia & psychotic disorders < PSYCHIATRY, PUBLIC HEALTH, MENTAL HEALTH For peer review only - http://bmjopen.bmj.com/site/about/guidelines.xhtml BMJ Open
Transcript of Mental illness, poverty and stigma in India: a case control study
For peer review only
Mental illness, poverty and stigma in India: A case control
study
Journal: BMJ Open
Manuscript ID: bmjopen-2014-006355.R2
Article Type: Research
Date Submitted by the Author: 13-Jan-2015
Complete List of Authors: Trani, Jean-Francois; Washington University, Brown School Bakhshi, Parul; Washington University in St. Louis, school of medicine Kuhlberg, Jill; Washington University in St. Louis, Brown School Venkataraman, Sreelatha; Dr. Ram Manohar Lohia Hospital, Psychiatry & De-addiction Services Venkataraman, Hemalatha; Dr. Ram Manohar Lohia Hospital, Psychiatry & De-addiction Services Mishra, Nagendra; Dr. Ram Manohar Lohia Hospital, Psychiatry & De-
addiction Services Groce, Nora; University College London, Division of Epidemiology and Public Health Jadhav, Sushrut; University College London, Mental health science unit Deshpande, Smita; Dr. Ram Manohar Lohia Hospital, Psychiatry & De-addiction Services
<b>Primary Subject Heading</b>:
Global health
Secondary Subject Heading: Mental health
Keywords: Schizophrenia & psychotic disorders < PSYCHIATRY, PUBLIC HEALTH, MENTAL HEALTH
For peer review only - http://bmjopen.bmj.com/site/about/guidelines.xhtml
BMJ Open
For peer review only
1
Mental illness, poverty and stigma in India: A case control study
Jean-Francois Trani*; Parul Bakhshi*; Jill Kuhlberg*; Sreelatha S. Narayanan#;
Hemalatha Venkataraman#; Nagendra N. Mishra #; Nora E. Groce; Sushrut Jadhav+ Smita Deshpande#;
Jean-Francois Trani, assistant professor, Brown School, Washington University in St. Louis, Campus Box 1196, Goldfarb Hall, Room 243, One Brookings Drive, St. Louis, MO 63130, United States of America; Parul Bakhshi, assistant professor, program in occupational therapy, school of medicine, Washington University in St. Louis, 4444 Forest Park avenue, 63108 St Louis, MO; Jill Kuhlberg, research assistant, Brown School; Sreelatha S. Narayanan, research assistant, , Dr. Ram Manohar Lohia Hospital, New Delhi 110001, India; Hemalatha Venkataraman, research assistant, Dr. Ram Manohar Lohia Hospital; Nagendra N. Mishra, research associate, Dr. Ram Manohar Lohia Hospital; Nora E. Groce, professor, Leonard Cheshire Chair & Director, Leonard Cheshire Disability & Inclusive Development Centre, Division of Epidemiology and Public Health University College London, Room 308, 1-19 Torrington Place, WC1E 6BT, London UK; Sushrut Jadhav, senior lecturer, Mental health science unit, University College London, Gower Street - London - WC1E 6BT, United Kingdom; Smita Deshpande, Head, Department Of Psychiatry & De-addiction Services & Resource Centre for Tobacco Control, PGIMER- Dr. Ram Manohar Lohia Hospital, New Delhi, India;
Correspondence to: Jean-Francois Trani Brown School Washington University in St. Louis Campus Box 1196, Goldfarb Hall, Room 243 One Brookings Drive St. Louis, MO 63130 [o] 314.935.9277 [c] 314.412.0077 [f] 314. 935.8511 [e] [email protected]
Keywords: mental illness, schizophrenia, bipolar disorders, severe affective
disorders, experienced discrimination, stigma.
Word count: 4687
Page 1 of 67
For peer review only - http://bmjopen.bmj.com/site/about/guidelines.xhtml
BMJ Open
123456789101112131415161718192021222324252627282930313233343536373839404142434445464748495051525354555657585960
For peer review only
2
Abstract
Objective –To assess the effect of experienced stigma on depth of multidimensional poverty of persons with severe mental illness (PSMI) in Delhi, India, controlling for gender, age and caste. Design – Matching Case (hospital) control (population) study. Setting – University Hospital (cases) and National Capital Region (NCR) (controls), India.
Participants A case-control study was conducted from November 2011 to June 2012. 647 cases diagnosed with schizophrenia or affective disorders were recruited and 647 individuals of same age, sex and location of residence were matched as controls at a ratio of 1:2:1. Individuals who refused consent or provided incomplete interview were excluded.
Main outcome measures – Higher risk of poverty due to stigma among PSMI.
Results - 38.5% of PSMI compared to 22.2% of controls were found poor on 6 dimensions or more. The difference in Multidimensional poverty index (MPI) was 69% between groups with employment and income the main contributors. Multidimensional poverty was strongly associated with stigma (odds ratio [OR] 2.60, 95% CI 1.27-5.31), scheduled castes/scheduled tribes/ other backward castes (SC/ST/OBC) (2.39, 1.39-4.08), mental illness (2.07, 1.25-3.41), and female gender (1.87, 1.36-2.58). A significant interaction between stigma, mental illness and gender or caste indicates female PSMI or PSMI from ‘lower castes’ were more likely to be poor due to stigma than male controls (p<0.001) or controls from other castes (p<0.001). Conclusions – Public stigma and multidimensional poverty linked to SMI are pervasive and intertwined. Particularly for low caste and women, it is a strong predictor of poverty. Exclusion from employment linked to negative attitudes and lack of income are the highest contributors to multidimensional poverty, increasing the burden for the family. Mental health professionals need to be aware of and address these issues.
Article summary
Strengths and limitations
• There is little research on effects of stigma and poverty in developing settings
• Lack of employment and income are major contributors to multidimensional poverty for PSMI
• Intensity of multidimensional poverty is higher for PSMI, particularly women with SMI and those from SC/ST/OBC
• Limitation: Stigma was operationalized through a single item question rather than a multiple-item scale and we could not assess reliability of this item. SMI was diagnosed for persons attending a public psychiatric department; PSMI not receiving medical treatment might be more marginalised and at greater risk of poverty than those receiving healthcare.
Page 2 of 67
For peer review only - http://bmjopen.bmj.com/site/about/guidelines.xhtml
BMJ Open
123456789101112131415161718192021222324252627282930313233343536373839404142434445464748495051525354555657585960

For peer review only
3
Introduction Mental health problems affect 450 million people worldwide, 80% in middle and low-income countries. In 2010, 2,319,000 persons died of mental and behavioural disorders1. Mental health conditions account for 13% of the total burden of disease, 31% of all years lived with disability and are one of the 4 main contributors to years lived with disability2,
3. Schizophrenia and bipolar disorder represent 7.4 % and 7·0% of DALYs caused by mental and substance use disorders respectively4. Severe mental illness (SMI) is a leading cause of disability and the standard prevalent biomedical care model is neither an exclusive nor a comprehensive solution as it does not address the link between mental illness, stigma and poverty 5. While the literature on poverty, poor mental health6 and disability7-9 is emerging, little has been done to examine the compounding associations between experienced stigma (unfair treatment or discrimination due to having a mental health issue)10, mental illness and poverty, especially in low-income countries. In high-income countries11, income deprivation is identified as a major risk factor for persons with mental health issues, even for common mental disorders12. Poor mental health linked to SMI has been associated with poverty during the recent economic crisis in middle and low-income countries, particularly India and China13-15. People with mental disorders living in these countries are not only more likely to be poorer, but also unemployed and less educated16, 17. Indisputably, a better understanding of the relationship between mental illness and poverty may yield useful knowledge to tailor public health interventions to complement biomedical treatment to improve outcomes. Link and Phelan (2001) defined stigma as a process with five interrelated components: discrimination through a process of separation based on negative attitudes and prejudice resulting from labelling and cultural stereotypes of society towards the stigmatized group leading to social, economic and political power differences18. Thornicroft et al. (2007) identify three elements of stigma: ignorance or misinformation, prejudice and discrimination19. Our paper focuses on the process of experienced discrimination as the manifestation of public stigma20. The congruence of self-stigma and social exclusion may lead persons with SMI (PSMIs) to face unfair treatment or discrimination and develop low self-esteem21-24. Such stigma may prevent mentally ill persons from improving their conditions25 by creating a “barrier to recovery”26 and worsen their situation by pushing them into poverty through discriminatory practices27-29. Stigma towards PSMI resulting in discrimination30, 31 is persistent in India32. Although the factors constituting poverty and discrimination linked to mental illness potentially can deprive persons of many resources33, 34 the dynamics of poverty, discrimination and mental health have not been fully addressed. The clinical literature argues that stigma is caused by mental illness and treating the latter biomedically will weaken the associated stigma35, 36. We argue instead that even treated PSMI are more likely to be multidimensionally poor due to discrimination resulting from stigma.
Page 3 of 67
For peer review only - http://bmjopen.bmj.com/site/about/guidelines.xhtml
BMJ Open
123456789101112131415161718192021222324252627282930313233343536373839404142434445464748495051525354555657585960

For peer review only
4
Many studies have focused on uni-dimensional effect of poverty on mental health, but have not explained how stigma towards mental illness can be an aggravating contributor to the intensity of poverty. We aimed to estimate the difference in incidence and intensity of poverty between PSMI and a comparable control group using a multidimensional poverty index (MPI) to explore deprivation in various dimensions of life37. Going beyond traditional welfare economics approaches to poverty (i.e. income or per capita expenditure) we explored non-monetary dimensions of poverty such as education, health, quality of shelter, food intake, and political participation. We assessed differences in intensity of poverty between PSMI and controls and explored how these differences vary as a function of discrimination resulting from stigma.
Methods
Study design and setting
The primary objective was to assess differences in exposure to discrimination resulting from stigma and multidimensional poverty among cases compared with non-psychiatrically ill controls. Between November 2011 and June 2012, we carried out a case-control study based at the Department of Psychiatry of the Dr Ram Manohar Lohia (RML) Hospital in New Delhi (cases), and in the neighbourhood of residence of the cases (controls) to assess the impact of stigma associated to mental illness on poverty. The Department of Psychiatry at Dr RML hospital received respectively 10881 and 19528 new outpatients and 52389 and 45319 follow-ups of existing patients in 2012 and 2013. The department has also a 42 bed general psychiatry and de-addiction inpatient facility for men and women. It serves patients from the national Capital Region of Delhi (NCR).
Participants
We defined cases as outpatients diagnosed with schizophrenia or affective disorders by one of the 10 board certified treating psychiatrists following ICD-10 criteria38. Outpatients were informed about the study and if they consented, were referred to researchers for written informed consent and evaluation with no further contact with those who refused. Transportation costs and a meal were provided to maximise recruitment and reduce selection bias. We used a non-psychiatrically ill control group composed of randomly selected individuals matching the patients according to gender, age (plus or minus 5 years) and neighbourhood of residence. Matched controls were selected by spinning a pointer at the door of the case’s home and randomly selecting one household among 30 in the pointed direction. In this household a person of same age and gender with no reported history of a mental health disorder was interviewed. It was not possible to conduct detailed interviews for diagnosis of all controls due to logistics as well as stigma of revealing mental illness. We excluded controls when unable to obtain consent. Only two case patients were not matched. Investigators together with the team manager contributed to sensitisation and awareness raising in the neighbourhoods of interest to maximise controls’ participation rates. Consent for patients and controls adolescent between 13 and 18 was obtained by asking the parent or the legal guardian of the study subjects. We conducted face-to-face interviews with all PSMI or a caregiver during hospital visits,
Page 4 of 67
For peer review only - http://bmjopen.bmj.com/site/about/guidelines.xhtml
BMJ Open
123456789101112131415161718192021222324252627282930313233343536373839404142434445464748495051525354555657585960
For peer review only
5
and controls at home. We obtained information on demographics, socioeconomic factors, health conditions and accessibility to services, education, employment, income, livelihoods, and social participation. The instrument was translated by experts into Hindi with iterative back-translation and tested in a pilot survey in October 2011. Investigators trained 2 experienced supervisors and 10 Masters-level students over two weeks on survey concepts and goals, mental illness awareness, interview techniques followed by review, test and debriefing.
Sample size
To determine sample size, we used a matched design with a control to case ratio of one, the probability of exposure to poverty among controls of 0.22 and the correlation coefficient for exposure between matched cases and controls of 0.1839. Considering the true odds ratio for one dimension of poverty in exposed subjects relative to unexposed subjects as 2.2, we needed to enroll 205 case patients to be able to reject the null hypothesis that this odds ratio equals 1with probability of 0.9. The type 1 error probability associated with this test of this null hypothesis is 0.05. We enrolled 649 case patients to allow for subgroup analyses including impact on poverty of discrimination stratified by gender, age and caste.
Efforts to minimize bias
New patients were first interviewed by a junior psychiatrist who made a provisional diagnosis and discussed details with a board of certified psychiatrist who then diagnosed and managed the case. To minimise diagnosis bias, we trained all psychiatrists on the ICD 10 criteria. Information bias was minimised by reviewing the questionnaire about exposure to poverty to ensure accuracy, completeness and content validity with experts and by testing it with a sample group of patients and families..Investigators revised the content for relevance to poverty in order to maximize item appropriateness. They first defined the concept of multidimensional poverty and reviewed the empirical and theoretical literature to identify the right deprivation items to include in the instrument they were developing. They then checked if the questions covered all dimensions of the concept of multidimensional poverty, if the phrasing respectively in English and Hindi was accurately reflecting the underlying concept of deprivation we were looking for in each dimension. Two experts familiar with multidimensional poverty reviewed the initial list of items and made suggestions about adding items that were omitted. We then organized a focus group discussion with 7 experts, psychiatrists, psychologists and social workers from Dr Ram Manohar Lohia hospital to establish if the 17 domains of poverty selected were adapted and relevant for the context of New Delhi and were providing a comprehensive overview of the concept. They also ranked these domains by order of importance of deprivation. A similar focus group was organized with 8 hospital outpatients with severe mental illness. We finally tested the poverty questionnaire with a group of 20 outpatients at the department of psychiatry at Dr RML hospital. We prompted them with questions to check for their understanding of poverty, to identify the language they used to explain the notion of poverty as well as ascertain their understanding of the questions in order to make sure the instrument’s purpose made sense to them. Finally, two other experts revised the final version to make sure items illustrate the content of multidimensional poverty.40
Page 5 of 67
For peer review only - http://bmjopen.bmj.com/site/about/guidelines.xhtml
BMJ Open
123456789101112131415161718192021222324252627282930313233343536373839404142434445464748495051525354555657585960
For peer review only
6
We also carried out test-retest to test for recall bias and social desirability bias. Interviews with 71 respondents (both cases and controls) for test-retest reliability were carried out on two occasions with a gap of 10 to 15 days by the same enumerator to check to what degree a given respondent provided same responses for the poverty items. We compared the scores between the two sets of responses. Results show overall acceptable level of reliability (over 0.7 for Inter class correlation) for the different poverty variables.
Quantitative variables
We selected 17 indicators of deprivation reflecting aspects of wellbeing (Table 1) identified by literature review and validated through focus group discussions (FGDs) with experts and PSMI/caregivers. Both groups identified and agreed on deprivation cut-offs for each indicator through participatory deliberation 41. Some standard dimensions were not included due to lack of relevance in Delhi. For instance, few respondents lacked access to diet staplesi.
We classified the selected indicators in three major domains of deprivation: individual level capabilities, household level material wellbeing, and individual level psychosocial factors. The first domain was composed of nine indicators. Access to secondary school was the indicator for education; dropping out before reaching secondary school was the cut-off. Unemployment was a major source of vulnerability; deprivation of work was the cut-off. Food security was measured by access to three meals per day and respondents eating less were considered deprived. Following the UNICEF definitions, improved indoor air quality using cooking gas, improved drinking water by pipe into residence and improved sanitation by private flush toilet defined absence of deprivation for indicators six to eight. Finally, individual income constituted a monetary indicator. Material wellbeing of the household was composed of two series of indicators. Three indicators outlined conditions of living: minimum space per person (deprivation threshold of 40 square feet per person); home ownership (renting was the cut-off ); poor quality housing was having either the flooring, walls or roof made of Kutcha (precarious or temporary) material. Material wealth was defined by three complementary indicators: the household average per capita income (threshold at the international poverty line of US$1.25 per day or 68 Indian rupees)42; assets included typical goods owned by the householdii; and monthly household expendituresiii. Finally, two psychosocial indicators were selected: physical safety, measured through an indicator of perception of unsafe environment and political participation in the municipal elections. Studies in India have shown that stigma resulting in discriminatory practices is perceived to be high in the family and the community43, 44. As a result, we measured experienced discrimination as a dimension of stigma through self-evaluation of unfair treatment by the family. We asked all respondents if they were excluded from family decision compared to other household members of the same generation. Unfair treatment within family is a feature of stigma in India44. We tested this through FGDs with PSMI of both genders. We
Page 6 of 67
For peer review only - http://bmjopen.bmj.com/site/about/guidelines.xhtml
BMJ Open
123456789101112131415161718192021222324252627282930313233343536373839404142434445464748495051525354555657585960
For peer review only
7
found high association between SMI and exclusion from regular family decisions, particularly for women. Other dimensions of participation did not show any discriminatory process. Inclusion in community activities showed similar 30% levels of participation between PSMI and controls. A possible explanation for participation is that where symptoms of mental illness are managed by treatment, family develop coping strategies through symbolic social participation and selective disclosure to avoid rejection, stigma and avoidance by others associated with their relative’s condition45-47. Finally, we enquired about participation in political activities such as “gram sabhas” or local associations. We found generalized low participation in political activities, which is a common feature in New Delhi and therefore not a good indicator of experienced discrimination. Table 1: approximately here
Statistical Analysis Our primary aim was to explore the effect of mental illness and stigma on poverty. We used an unmatched Multidimensional Poverty Index (MPI) measure to identify differences in levels of poverty between PSMI and controls48. Dimensions were independently assessed and the method focused on dimensional shortfalls. This method allowed us to aggregate dimensions of multidimensional poverty measures and consisted of two different forms of cutoffs: one for each dimension and the other relating to cross-cutting dimensions. If an individual fell below the chosen cut-off on a particular dimension he/she was identified as deprived. The second poverty cut-off determined the number of dimensions in which a person must be deprived to be deemed multidimensionally poor. We first performed one-way analyses to assess differences in poverty levels and discrimination between PSMI and controls, by gender and caste adjusting for post-hoc pairwise comparisons using the Scheffe method. We also carried out correlation analysis to assess overlap of dimensions of deprivation. We then calculated 3 indicators of multidimensional poverty: (i) the headcount ratio (H) indicating how many people fall below each deprivation cutoff; (ii) the average poverty gap (A) denoting the average number of deprivations each person experiences; (iii) the adjusted headcount (M0) which is the headcount ratio (H) by the average poverty gap (A) and indicates the breadth of poverty. We established the contribution of each dimension of poverty for cases and controls by dividing each of the two subgroups’ poverty level by the overall poverty level, multiplied by the population portion of each subgroup. To assess potential bias in our estimates of MPI, we carried out sensitivity analysis and compared three measures of poverty with: (i) Equal weight for every indicator in each dimension; (ii) Individual rankings of indicators done by experts at Dr RML hospital during the FGDs transformed into individual weights and then taking the average of the individual weights49; (iii) Group ranking based on the mean of individual rankings of
Page 7 of 67
For peer review only - http://bmjopen.bmj.com/site/about/guidelines.xhtml
BMJ Open
123456789101112131415161718192021222324252627282930313233343536373839404142434445464748495051525354555657585960
For peer review only
8
indicators during FGDs and taking the weight according to the group ranking 50. We found consistency across measures (data not shown). We finally calculated the crude and adjusted odd ratios (OR) with associated 95% confidence intervals using a logistic regression model to identify association between stigma, SMI and multidimensional poverty. We used ‘no participation’ as the reference category. We defined a binary outcome for poverty (poor/non poor) using the adjusted headcount ratio (M0) for a cutoff k=6 corresponding to the highest gap between PSMI and controls. This cutoff corresponds to a prevalence of poverty of 30.7% above the recent estimates of 13.7% of urban Indians below the poverty line fixed at 28.65 rupees by the Indian Planning Commission51 which has been criticised for being unrealistic. This cutoff is in line with World Bank recent estimate that 33% of India’s population lives below the international poverty line established at $1.25 dollars per capita per day52. We characterised how SMI results in higher intensity of multidimensional poverty due to stigma. Aware that stigma and discrimination may also affect women53 and members of lower castes54, we adjusted the model for potential confounders significantly associated with poverty and family discrimination: caste (in case of difference within the family), gender and age. We carried out sensitivity analysis for different values of the cutoff k and found robustness in our model (data not shown). For all analyses, a P-value of <0.05 was considered significant. Missing values were treated as being missing completely at random. We used Stata (version 12.0) for database processing and all analysis.
Results Participants
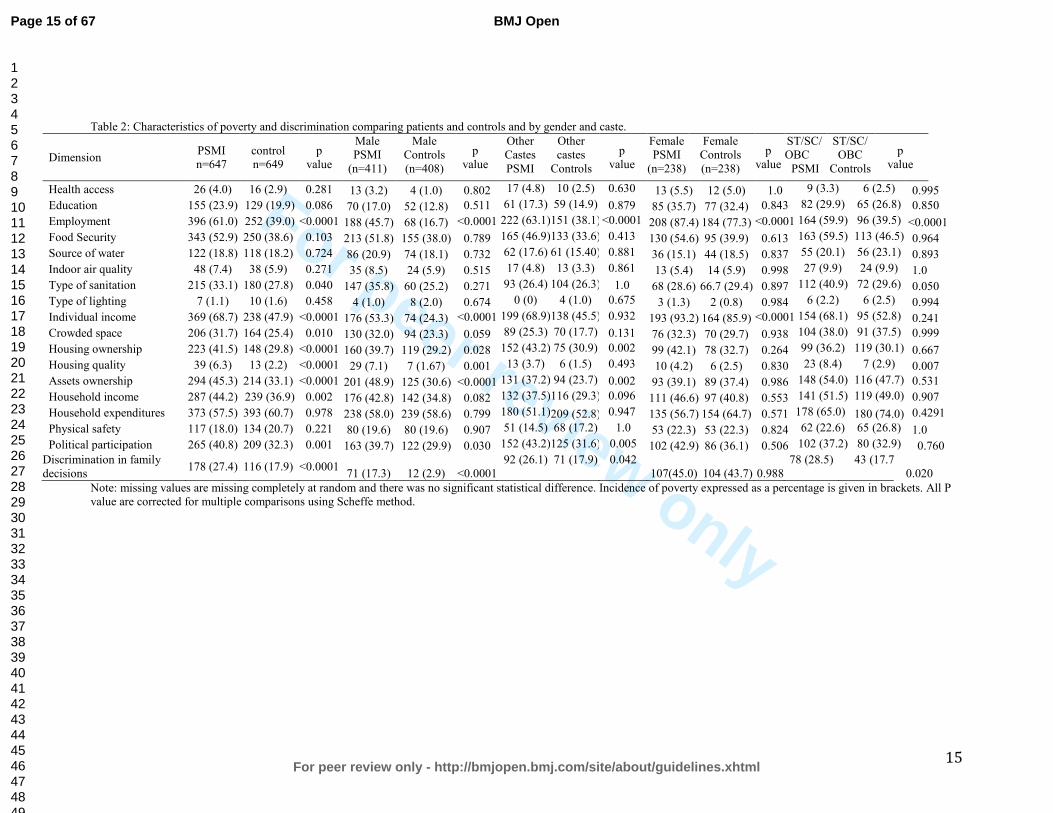
We interviewed 649 case patients and 647 controls. Of these, we excluded 110 (17%) cases and 151 (23%) controls respectively who did not complete the interview or for whom the data was incomplete. The final analysis included 537 cases and 496 controls (figure 1). The distribution between cases and controls was similar for gender (305 and 330 males respectively, 61.5% in both cases) and age ( 15-74 and 13-74 and median 35 and 36 respectively). Figure 1 approximately here. Table 2 reports the headcount ratios (H) or incidence of deprivation in each dimension. There were statistically significantly higher numbers of deprived PSMI than controls in nine dimensions. Differences were very high for access to employment (28.1% difference), individual income (20.7%) and relatively high for food security (15.1%) and house ownership (11.7%). In only one dimension -perception of physical safety- was there a reverse non-significant difference as number of controls were higher than the number of PSMI. Table 2 approximately here. Table 2 also show results by gender and caste. Compared to male PSMI, the proportion of deprived female PSMI was significantly higher (10 of 17 dimensions). Similarly, a higher number of PSMI (vs. controls) from ‘scheduled castes’, ‘scheduled tribes’ or ‘other
Page 8 of 67
For peer review only - http://bmjopen.bmj.com/site/about/guidelines.xhtml
BMJ Open
123456789101112131415161718192021222324252627282930313233343536373839404142434445464748495051525354555657585960
For peer review only
9
backward castes’ (SC/ST/OBC) were poorer on 13 (vs. 16 dimensions) compared to PSMI (vs. controls) from unreserved castes. To investigate possible overlap of dimensions of poverty, we calculated the estimates for the Spearman rank correlation coefficients between each pair of dimensions of deprivation (Table 3). We found no evidence of strong correlation between dimensions, illustrating absence of association except for household income and expenditures. We nevertheless kept both indicators to calculate the MPI to account for information bias (particularly recall bias) often associated with measures of income in household surveys55, 56. Significantly, this result demonstrates that a unique welfare indicator of poverty such as income, cannot represent all aspects of deprivation. Table 3 approximately here.
Multidimensional poverty
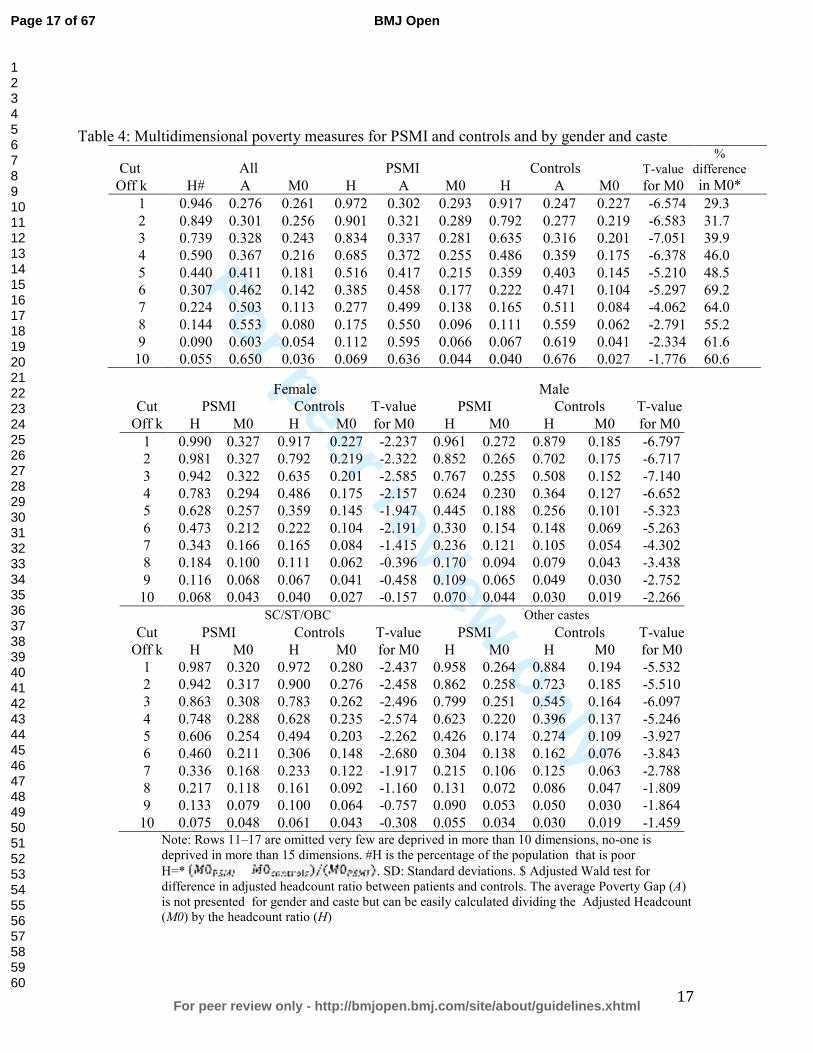
Results in Table 4 report the multidimensional headcount ratio (H), the average deprivation shared across the poor (A) and the adjusted headcount ratio (M0) for all possible cutoffs and for the two groups. Depending on the chosen cutoff, the proportion of PSMI and controls who were multidimensionally poor varied greatly. For a cutoff of one, 97.2% of PSMI and 91.7% of controls were deprived: taking a union approach of deprivation in one dimension, this translates into quasi-universal poverty. On average, PSMI were deprived on 5 dimensions and controls on 3.9. If multidimensional poverty requires deprivation in four, five, or six dimensions simultaneously, the proportion of poor PSMI (compared to poor controls) becomes 68.5% (compared to 48.6%), 51.6% (35.9%), or 38.5% (22.2%). Conversely, if we adopt the intersection approach where being poor implies being deprived in all 17 dimensions, nobody in the sample is poor and less than 1% of the sample is deprived in 13. Table 4 approximately here The adjusted headcount ratio (M0) shows that PSMI were worse off than controls for a cutoff (k) value between one and 12 dimensions. This difference is significant (p<0.001) for (k)=1 to (k)=10 dimensions and highest (69% difference) for (k)=6. The average deprivation share (A) is higher among PSMI for a value of (k) between one and five and highest for (k)=1 (22% difference). For a (k) between six and 14, the total number of deprivations faced by poor PSMI is slightly lower on average than for controls. Less than 30% of people were poor in six dimensions or more and the difference between PSMI and controls was the highest for a (k) value of 14 (7%). To further investigate the association between poverty and mental illness, analysis was repeated for all possible cutoffs and for gender and caste (Table 4). Multidimensional poverty was significantly higher for female PSMI compared to female controls for any threshold between one and seven dimensions (p<0.001) but also for male PSMI for any threshold between one and nine dimensions. On average, 62.8% of female PSMI were deprived on five dimensions or more, compared to 35.9% of female controls, 44.5% of male PSMI and 25.6% of male controls. For female PSMI and controls − and male PSMI and controls respectively − the difference is particularly pronounced and significant for
Page 9 of 67
For peer review only - http://bmjopen.bmj.com/site/about/guidelines.xhtml
BMJ Open
123456789101112131415161718192021222324252627282930313233343536373839404142434445464748495051525354555657585960
For peer review only
10
highest cutoff values, and maximum for six and seven dimensions respectively. The adjusted headcount ratio (M0) shows that SC/ST/OBC PSMI are worse off regardless of the value of (k) 1 through 10, than SC/ST/OBC controls and other caste PSMI or controls. (M0) for SC/ST/OBC controls is higher than for other caste PSMI for all (k) values. Table 5 presents the percentage contribution of each dimension to (M0) for different (k). Deprivations in individual income household expenditures and employment were contributing each more than 10% to the overall (M0) for PSMI, whatever the value (k) between 1 and 8. For controls, employment was a less salient contributor while the contribution from household income was among the highest. Table 5 approximately here
Poverty and stigma
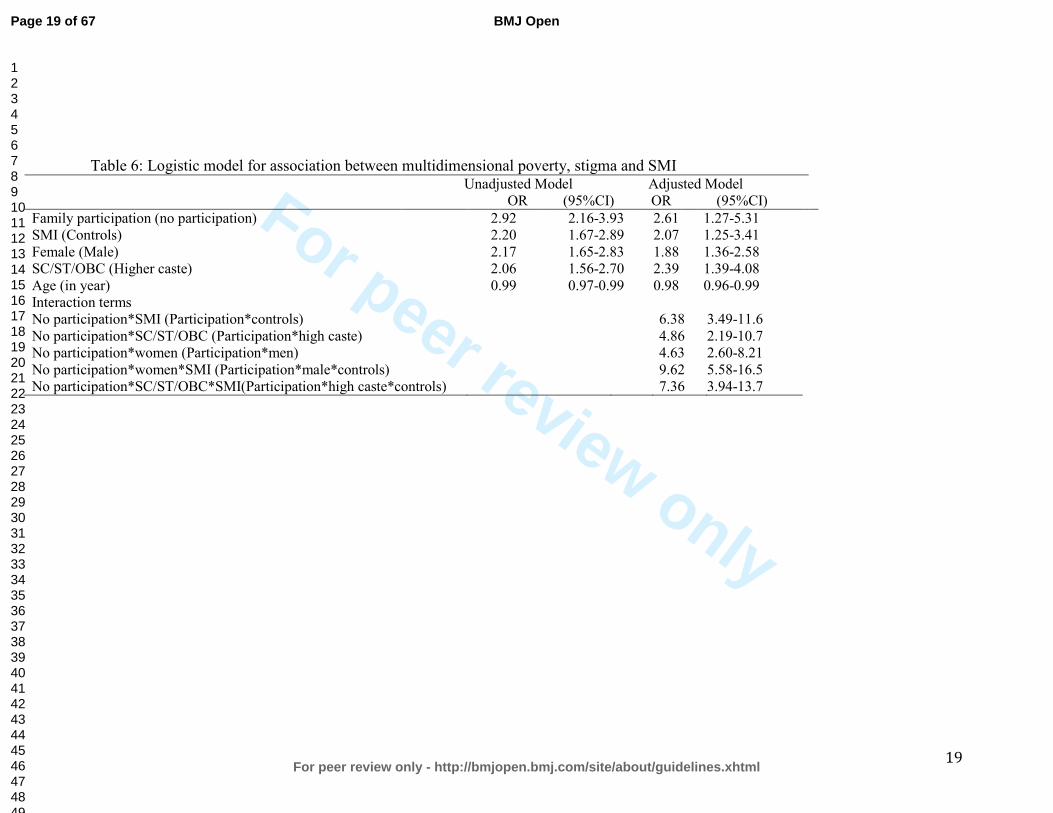
Association between multidimensional poverty and stigma was strong even when controlling for SMI, gender, caste and age (Table 6; all p<0·0001). We included interaction of stigma, SMI with caste and found that this term was strongly and positively associated with a high level of poverty: the odds ratio of being multidimensionally poor for PSMI from SC/ST/OBC compared with controls from unreserved castes was 7.36 (95% confidence interval 3.94 to 13.7). Similarly, we allowed for differential gender effects by including interaction of stigma and SMI with the gender of the respondent and found high effect on poverty: women PSMI were 9.61 (95% CI 5.58 to16.5) more likely to be poor compared to male controls.
Table 6 approximately here
Discussion Our findings establish that intensity of multidimensional poverty is higher for PSMI than the rest of the population. They also indicate that it is higher for women with SMI and for SC/ST/OBC with SMI. Deprivation of employment and income appear to be major contributing factors to MPI. Lack of employment and income appear to aggravate mental illness. Finally, our findings suggest that stigma linked to SMI, compounded with others (particularly SC/ST/OBC and women) negatively impact poverty. The congruence of SMI and poverty, in a context of high prejudice against mental illness compromises improvement. Mental illness in India is linked to lack of knowledge and pervasive negative assumptions, the most common being that PSMI are violent and unable to work18, 31, 44. Not surprisingly, deprivation of employment and income contributes highly to multidimensional poverty of PSMI compared to controls. This finding ties in with a study on employment for Indian men with schizophrenia which found that employment provided not just an essential social role but was also a condition for rehabilitation, enhanced confidence and self-esteem 44. Although there is evidence of differences in mental health outcomes between men and women, analyses of gender disparities are lacking in literature on poverty and mental health in low-income countries44, 57, 58. In our sample, women with SMI were systematically more deprived in higher numbers of dimensions. Similarly, SC/ST/OBC
Page 10 of 67
For peer review only - http://bmjopen.bmj.com/site/about/guidelines.xhtml
BMJ Open
123456789101112131415161718192021222324252627282930313233343536373839404142434445464748495051525354555657585960
For peer review only
11
SMI-poverty associations were found to be consistent across dimensions of poverty regardless of the threshold for multidimensional poverty. These findings strongly suggest stigma linked to various marginalized groups have the power to accelerate and intensify exclusion and related discrimination. For women, SMI can negatively impact wellbeing in two ways. Firstly, SMI limits women from fulfilling family and social roles, leading to these women being considered a burden for the family. This is true despite studies, such as the Indian study of women with schizophrenia abandoned by their husbands who expressed the desire to work to support themselves 59. Secondly, traditional beliefs (punishment for previous lives, evil eye/curse) as well as negative lay attitudes on causes and behaviours, lead to increased discrimination of and sometimes violence against SMIs, particularly for women 60. Our study finds that SC/ST/OBC and poverty further compound SMI. Discrimination linked to caste in accessing education or employment has been a leitmotif in modern India and only partially addressed through constitutional provisions and reservation policies. Caste discrimination still results in scant employment opportunities, less access to secondary and higher education- key for salaried public and private jobs, perpetuating powerlessness, traditional forms of dominance and oppression, inequalities, lower living standards among SC/ST/OBC as a entrenched social identity in India61, 62. This situation is even more catastrophic for PSMI from SC/ST/OBC. It is clear that a ‘negative feedback loop’ exists: stigma against SMI, particularly for SC/ST/OBC and women, is a strong predictor of persistent poverty. Moreover, stigma strongly bears on intensity of poverty. Stigma leads to difficulty for PSMI in finding and keeping a job, and this also increases the perceived burden of SMI by family members. In turn, this deprivation on various dimensions erodes self-esteem, brings shame and acceptance of discriminatory attitudes 63. These compounding factors may result in a worsening of mental illness. Beyond the PSMI, stigma and discrimination have a negative effect on family members and caregivers who often feel ashamed, embarrassed or unable to cope with the stigma59,
64-68. While there have been campaigns and policies to address discrimination against SC/ST/OBC and women in India, no large-scale awareness campaign has ever addressed the prejudice and discrimination faced by PSMIs. This study has some limitations. First, a potential limitation is that we measured experienced discrimination with a single-item question on exclusion from family decision rather than a multiple-item scale. There was not a specific formalized psychometrically validated measure of experienced stigma available focusing on the scope and content of discrimination before the Discrimination and Stigma Scale (DISC) made available after our study was carried out 10. Other factors may also explain exclusion from family decisions, in particular, symptomatic patients’ disruptive behavior. To account for this issue, we selected a large sample of PSMI at Dr RML hospital representing a wide variety of severity of symptoms. Yet all outpatients were successfully treated and mostly in follow-up, and therefore not symptomatic at the time of the survey. Despite treatment, SMI in cases was significantly associated with our measure of stigma compared to controls, showing that ‘‘pre- existing beliefs’’ or stereotypes linked to past experience
Page 11 of 67
For peer review only - http://bmjopen.bmj.com/site/about/guidelines.xhtml
BMJ Open
123456789101112131415161718192021222324252627282930313233343536373839404142434445464748495051525354555657585960
For peer review only
12
with the mental illness were critical to the activation of the discrimination process rather than the current mental health status of the person 69. Secondly, it was not possible to establish the direction of the association between poverty, and SMI; poverty can be a cause as well as a consequence of SMI. Thirdly, SMI was diagnosed within a psychiatric department of a free government hospital. Research indicates the poorest members of society may still not access such services, even when free; possibly introducing a selection bias in our sample 70. Additionally, PSMI not receiving medical treatment might be even more marginalised, at greater risk of poverty than those receiving healthcare. Thus the sampling bias might have underestimated association between SMI, stigma and poverty. Finally, due to the large sample size we could not evaluate each control using detailed diagnostic psychiatric questionnaires but only screen them for major mental disorders.
Conclusion Our study provides evidence that mental health professionals must incorporate an understanding of multidimensional poverty stressors as well as address family and community dynamics. Where resources are limited, medical professionals would benefit from working with public health and disability networks to weaken persistent stigma against SMI. Policies promoting employment support for PSMI (notably through reservations or fair employment policies, and access to credit) are critically important. The implications of our findings go beyond medical and public health and link mental health to international development. Promoting employment and fighting social stigma for PSMI not only mitigates the impact of illness for some but appears to be a central concern of global poverty.
Contributorship statement.
Study designed by JFT, SD, PB,SJ. Data collection supervised by SV, NM, SN,SD. Literature review by PB with JFT. Data analysis by JK,JFT. Data interpretation and writing by JFT,PB, and revised by SD and NG. All authors contributed to the final manuscript.
Competing interests
We declare no conflict of interest.
Ethics committee approval
Study approved by University College London Research Ethics Committee and the Dr Ram Manohar Lohia Hospital Institutional Ethics Committee.
Funding
Funded by DFID through the Cross-Cutting Disability Research Programme, Leonard Cheshire Disability and Inclusive Development Centre, University College London (GB-1-200474).
Page 12 of 67
For peer review only - http://bmjopen.bmj.com/site/about/guidelines.xhtml
BMJ Open
123456789101112131415161718192021222324252627282930313233343536373839404142434445464748495051525354555657585960
For peer review only
13
Study Sponsors had no role in study design, data collection, data analysis, data interpretation or writing, or in submission for publication. The corresponding author had full access to all data and final responsibility for publication submission.
Data sharing
Technical appendix, statistical code, and dataset available from the corresponding author at Dryad repository, which provides a permanent, citable, open access home for the dataset.
Glossary of terms:
MPI: Multidimensional poverty index NCR: National Capital Region of Delhi PSMI: Patients with Severe Mental Illness SC/ST/OBC: Scheduled Castes/Scheduled Tribes/Other Backward Castes
SMI: Severe mental illness
Page 13 of 67
For peer review only - http://bmjopen.bmj.com/site/about/guidelines.xhtml
BMJ Open
123456789101112131415161718192021222324252627282930313233343536373839404142434445464748495051525354555657585960

For peer review only
14
Table 1: Dimensions, Indicators and cutoff of deprivation Dimensions Indicators Questions Cutoff
Individual level basic capabilities
Health access Could you receive healthcare when
sick? Deprived of healthcare
Education What is your level of education? Primary education completed
Access to
employment What is your usual primary
activity? Not working
Food Security How many meals are usually
served in your household in a day? 1 or 2 meals
Source of drinking
water What is the primary source of
drinking water?
Pipe outside home/public pump
tanker truck/cart with small tank
water from a covered well unprotected well
spring/river/dam/lake/pond/stream
Indoor air quality What is the primary source of
cooking fuel?
Wood, coal/charcoal, dung, kerosene,
straw/shrubs/grass/crop
Type of sanitation What type of toilet facilities do
you use when at home?
Open field, pit latrine improved ventilated pit
public latrine
Type of lighting What is your primary source of
lighting? Generator, kerosene lamp,
petromax, candle, none
Individual income What is your income? Less than $1.25per day
Household level material wellbeing
Crowded space How many people live in the
dwelling? Less than 50sqfeet per
person
Housing ownership Does the family owns the house Do not own the house
Housing quality Are the material used for walls,
floor and roof in your house kutcha or pucca ?
Any of walls, floor or roof is kutcha
Assets ownership
Do you possess any of the following? Mobile phone,
landline, wooden/steel sleeping cot, mattress, table, clock/watch,
charpoy, refrigerator, radio/transistor, electric fan,
television, bicycle, computer, moped/scooter/motorcycle, car
Lowest two asset quintiles
Household per capita
income What is the family income?
Less than $1.25 per capita per day
Household
expenditures What is the household's monthly
expenditure ? Less than $1.25 per capita
per day
Individual level psychosocial dimensions
Physical safety How safe is the place where you
live? Rather or very unsafe
Political participation Did you vote in the last municipal
election? Did not vote
Page 14 of 67
For peer review only - http://bmjopen.bmj.com/site/about/guidelines.xhtml
BMJ Open
123456789101112131415161718192021222324252627282930313233343536373839404142434445464748495051525354555657585960
For peer review only
15
Table 2: Characteristics of poverty and discrimination comparing patients and controls and by gender and caste.
Dimension PSMI n=647
control n=649
p value
Male PSMI
(n=411)
Male Controls (n=408)
p value
Other Castes PSMI
Other castes
Controls
p value
Female PSMI
(n=238)
Female Controls (n=238)
p value
ST/SC/ OBC
PSMI
ST/SC/ OBC
Controls
p value
Health access 26 (4.0) 16 (2.9) 0.281 13 (3.2) 4 (1.0) 0.802 17 (4.8) 10 (2.5) 0.630 13 (5.5) 12 (5.0) 1.0 9 (3.3) 6 (2.5) 0.995
Education 155 (23.9) 129 (19.9) 0.086 70 (17.0) 52 (12.8) 0.511 61 (17.3) 59 (14.9) 0.879 85 (35.7) 77 (32.4) 0.843 82 (29.9) 65 (26.8) 0.850
Employment 396 (61.0) 252 (39.0) <0.0001 188 (45.7) 68 (16.7) <0.0001 222 (63.1)151 (38.1)<0.0001 208 (87.4) 184 (77.3) <0.0001 164 (59.9) 96 (39.5) <0.0001
Food Security 343 (52.9) 250 (38.6) 0.103 213 (51.8) 155 (38.0) 0.789 165 (46.9)133 (33.6) 0.413 130 (54.6) 95 (39.9) 0.613 163 (59.5) 113 (46.5) 0.964
Source of water 122 (18.8) 118 (18.2) 0.724 86 (20.9) 74 (18.1) 0.732 62 (17.6) 61 (15.40) 0.881 36 (15.1) 44 (18.5) 0.837 55 (20.1) 56 (23.1) 0.893
Indoor air quality 48 (7.4) 38 (5.9) 0.271 35 (8.5) 24 (5.9) 0.515 17 (4.8) 13 (3.3) 0.861 13 (5.4) 14 (5.9) 0.998 27 (9.9) 24 (9.9) 1.0
Type of sanitation 215 (33.1) 180 (27.8) 0.040 147 (35.8) 60 (25.2) 0.271 93 (26.4) 104 (26.3) 1.0 68 (28.6) 66.7 (29.4) 0.897 112 (40.9) 72 (29.6) 0.050
Type of lighting 7 (1.1) 10 (1.6) 0.458 4 (1.0) 8 (2.0) 0.674 0 (0) 4 (1.0) 0.675 3 (1.3) 2 (0.8) 0.984 6 (2.2) 6 (2.5) 0.994
Individual income 369 (68.7) 238 (47.9) <0.0001 176 (53.3) 74 (24.3) <0.0001 199 (68.9)138 (45.5) 0.932 193 (93.2) 164 (85.9) <0.0001 154 (68.1) 95 (52.8) 0.241
Crowded space 206 (31.7) 164 (25.4) 0.010 130 (32.0) 94 (23.3) 0.059 89 (25.3) 70 (17.7) 0.131 76 (32.3) 70 (29.7) 0.938 104 (38.0) 91 (37.5) 0.999
Housing ownership 223 (41.5) 148 (29.8) <0.0001 160 (39.7) 119 (29.2) 0.028 152 (43.2) 75 (30.9) 0.002 99 (42.1) 78 (32.7) 0.264 99 (36.2) 119 (30.1) 0.667
Housing quality 39 (6.3) 13 (2.2) <0.0001 29 (7.1) 7 (1.67) 0.001 13 (3.7) 6 (1.5) 0.493 10 (4.2) 6 (2.5) 0.830 23 (8.4) 7 (2.9) 0.007
Assets ownership 294 (45.3) 214 (33.1) <0.0001 201 (48.9) 125 (30.6) <0.0001 131 (37.2) 94 (23.7) 0.002 93 (39.1) 89 (37.4) 0.986 148 (54.0) 116 (47.7) 0.531
Household income 287 (44.2) 239 (36.9) 0.002 176 (42.8) 142 (34.8) 0.082 132 (37.5)116 (29.3) 0.096 111 (46.6) 97 (40.8) 0.553 141 (51.5) 119 (49.0) 0.907
Household expenditures 373 (57.5) 393 (60.7) 0.978 238 (58.0) 239 (58.6) 0.799 180 (51.1)209 (52.8) 0.947 135 (56.7) 154 (64.7) 0.571 178 (65.0) 180 (74.0) 0.4291
Physical safety 117 (18.0) 134 (20.7) 0.221 80 (19.6) 80 (19.6) 0.907 51 (14.5) 68 (17.2) 1.0 53 (22.3) 53 (22.3) 0.824 62 (22.6) 65 (26.8) 1.0
Political participation 265 (40.8) 209 (32.3) 0.001 163 (39.7) 122 (29.9) 0.030 152 (43.2)125 (31.6) 0.005 102 (42.9) 86 (36.1) 0.506 102 (37.2) 80 (32.9) 0.760 Discrimination in family decisions
178 (27.4) 116 (17.9) <0.0001 71 (17.3) 12 (2.9) <0.0001
92 (26.1) 71 (17.9) 0.042 107(45.0) 104 (43.7) 0.988
78 (28.5) 43 (17.7)0.020
Note: missing values are missing completely at random and there was no significant statistical difference. Incidence of poverty expressed as a percentage is given in brackets. All P value are corrected for multiple comparisons using Scheffe method.
Page 15 of 67
For peer review only - http://bmjopen.bmj.com/site/about/guidelines.xhtml
BMJ Open
123456789101112131415161718192021222324252627282930313233343536373839404142434445464748495051525354555657585960

For peer review only
16
Table 3 Spearman correlations between dimensions
Dimensions
Health access
Educ. Access to
work Food
Security Source of
water Air
quality Type of
sanitation Type of lighting
Ind. income
Crowded space
Housing ownership
Housing quality
Assets owner-
ship
HH/cap. income
HH spending
Physical safety
Pol. Partici-pation
Health access 1
Education 0.021 1
Access to work 0.1047* 0.1771* 1
Food Security 0.0016 0.1309* 0.0878* 1
Source of water -0.0277 0.1669* 0.0412 0.1263* 1
Indoor air quality 0.0341 0.1907* 0.0732* 0.1077* 0.1519* 1
Type of sanitation -0.0103 0.1514* 0.0369 0.1045* 0.3026* 0.2440* 1
Type of lighting 0.0193 0.0728* 0.0217 0.0642* 0.1079* 0.3018* 0.1550* 1
Individual income 0.0801* 0.1865* 0.7373* 0.0788* 0.0534 0.0875* 0.0199 -0.0134 1
Crowded space -0.0356 0.2471* 0.0521 0.1031* 0.1807* 0.1743* 0.2709* 0.0786* 0.0800* 1
Housing ownership 0.0145 0.0138 0.029 0.0518 0.0553 -0.0029 0.0207 0.0272 -0.0123 0.1442* 1
Housing quality 0.0087 0.1739* 0.0764* 0.0558 0.2384* 0.2767* 0.3345* 0.0534 0.0824* 0.1969* 0.0182 1
Assets ownership 0.0581 0.2727* 0.0751* 0.2544* 0.2364* 0.2820* 0.2330* 0.1634* 0.0797* 0.3079* 0.2926* 0.2753* 1
HH/capita income 0.0472 0.1949* 0.1623* 0.1513* 0.1989* 0.2070* 0.1597* 0.0805* 0.2066* 0.2712* 0.0443 0.1511* 0.2715* 1
HH spending 0.0428 0.1667* 0.1062* 0.1483* 0.2377* 0.1568* 0.1409* 0.0760* 0.1381* 0.2792* 0.037 0.1533* 0.2331* 0.5360* 1
Physical safety 0.044 0.0406 0.0413 0.0596 0.1026* 0.0602 0.1223* 0.0609 0.0441 0.1723* -0.0252 0.0834* 0.0932* 0.1136* 0.1254* 1
Political participation 0.0188 -0.0167 0.0386 0.0815* 0.1538* 0.031 0.1426* 0.0411 0.0125 0.1077* 0.2296* 0.0365 0.1617* 0.0714* 0.0735* 0.0493 1
Page 16 of 67
For peer review only - http://bmjopen.bmj.com/site/about/guidelines.xhtml
BMJ Open
123456789101112131415161718192021222324252627282930313233343536373839404142434445464748495051525354555657585960
For peer review only
17
Table 4: Multidimensional poverty measures for PSMI and controls and by gender and caste
Cut All PSMI Controls T-value %
difference
Off k H# A M0 H A M0 H A M0 for M0 in M0*
1 0.946 0.276 0.261 0.972 0.302 0.293 0.917 0.247 0.227 -6.574 29.3
2 0.849 0.301 0.256 0.901 0.321 0.289 0.792 0.277 0.219 -6.583 31.7
3 0.739 0.328 0.243 0.834 0.337 0.281 0.635 0.316 0.201 -7.051 39.9
4 0.590 0.367 0.216 0.685 0.372 0.255 0.486 0.359 0.175 -6.378 46.0
5 0.440 0.411 0.181 0.516 0.417 0.215 0.359 0.403 0.145 -5.210 48.5
6 0.307 0.462 0.142 0.385 0.458 0.177 0.222 0.471 0.104 -5.297 69.2
7 0.224 0.503 0.113 0.277 0.499 0.138 0.165 0.511 0.084 -4.062 64.0
8 0.144 0.553 0.080 0.175 0.550 0.096 0.111 0.559 0.062 -2.791 55.2
9 0.090 0.603 0.054 0.112 0.595 0.066 0.067 0.619 0.041 -2.334 61.6
10 0.055 0.650 0.036 0.069 0.636 0.044 0.040 0.676 0.027 -1.776 60.6
Female Male
Cut PSMI Controls T-value PSMI Controls T-value
Off k H M0 H M0 for M0 H M0 H M0 for M0
1 0.990 0.327 0.917 0.227 -2.237 0.961 0.272 0.879 0.185 -6.797
2 0.981 0.327 0.792 0.219 -2.322 0.852 0.265 0.702 0.175 -6.717
3 0.942 0.322 0.635 0.201 -2.585 0.767 0.255 0.508 0.152 -7.140
4 0.783 0.294 0.486 0.175 -2.157 0.624 0.230 0.364 0.127 -6.652
5 0.628 0.257 0.359 0.145 -1.947 0.445 0.188 0.256 0.101 -5.323
6 0.473 0.212 0.222 0.104 -2.191 0.330 0.154 0.148 0.069 -5.263
7 0.343 0.166 0.165 0.084 -1.415 0.236 0.121 0.105 0.054 -4.302
8 0.184 0.100 0.111 0.062 -0.396 0.170 0.094 0.079 0.043 -3.438
9 0.116 0.068 0.067 0.041 -0.458 0.109 0.065 0.049 0.030 -2.752
10 0.068 0.043 0.040 0.027 -0.157 0.070 0.044 0.030 0.019 -2.266
SC/ST/OBC Other castes
Cut PSMI Controls T-value PSMI Controls T-value
Off k H M0 H M0 for M0 H M0 H M0 for M0
1 0.987 0.320 0.972 0.280 -2.437 0.958 0.264 0.884 0.194 -5.532
2 0.942 0.317 0.900 0.276 -2.458 0.862 0.258 0.723 0.185 -5.510
3 0.863 0.308 0.783 0.262 -2.496 0.799 0.251 0.545 0.164 -6.097
4 0.748 0.288 0.628 0.235 -2.574 0.623 0.220 0.396 0.137 -5.246
5 0.606 0.254 0.494 0.203 -2.262 0.426 0.174 0.274 0.109 -3.927
6 0.460 0.211 0.306 0.148 -2.680 0.304 0.138 0.162 0.076 -3.843
7 0.336 0.168 0.233 0.122 -1.917 0.215 0.106 0.125 0.063 -2.788
8 0.217 0.118 0.161 0.092 -1.160 0.131 0.072 0.086 0.047 -1.809
9 0.133 0.079 0.100 0.064 -0.757 0.090 0.053 0.050 0.030 -1.864
10 0.075 0.048 0.061 0.043 -0.308 0.055 0.034 0.030 0.019 -1.459 Note: Rows 11–17 are omitted very few are deprived in more than 10 dimensions, no-one is deprived in more than 15 dimensions. #H is the percentage of the population that is poor
H=* . SD: Standard deviations. $ Adjusted Wald test for difference in adjusted headcount ratio between patients and controls. The average Poverty Gap (A) is not presented for gender and caste but can be easily calculated dividing the Adjusted Headcount (M0) by the headcount ratio (H)
Page 17 of 67
For peer review only - http://bmjopen.bmj.com/site/about/guidelines.xhtml
BMJ Open
123456789101112131415161718192021222324252627282930313233343536373839404142434445464748495051525354555657585960

For peer review only
18
Table 5: Percentage contribution of each dimension to poverty for PSMI and controls for k 1 to 8
Cut Health Level of Access to Food Source of
Indoor air
Type of Type of Individual Crowded Housing Housing Assets Household Household Physical
Political
Off k access education employment security drinking water
quality sanitation lighting income space ownership quality ownership
income expenses safety Participation
1 PSMI 0.86 4.63 11.62 10.87 3.74 1.31 4.37 0.22 13.79 4.56 8.33 1.27 4.82 8.86 12.63 3.59 4.52
Controls 0.78 5.33 7.74 10.15 4.86 1.57 3.50 0.47 12.45 4.71 7.74 0.58 3.92 9.62 16.42 5.75 4.39
2 PSMI 0.87 4.70 11.79 10.58 3.75 1.33 4.32 0.23 13.91 4.62 8.04 1.29 4.89 8.95 12.62 3.60 4.51
Controls 0.76 5.41 8.00 9.68 5.03 1.62 3.62 0.49 12.43 4.86 7.19 0.59 4.05 9.95 16.43 5.57 4.32
3 PSMI 0.86 4.79 11.77 10.44 3.86 1.36 4.29 0.23 13.64 4.72 8.07 1.33 4.99 9.00 12.51 3.55 4.60
Controls 0.77 5.61 8.15 9.33 5.31 1.77 3.54 0.47 12.16 5.14 6.85 0.65 4.43 10.45 15.58 5.55 4.25
4 PSMI 0.95 4.94 11.05 10.49 3.91 1.46 4.47 0.26 12.77 4.99 7.78 1.46 5.42 9.42 12.55 3.57 4.51
Controls 0.68 5.77 7.95 8.83 5.57 1.90 4.01 0.54 11.14 5.57 6.66 0.75 4.82 10.80 14.95 5.50 4.55
5 PSMI 0.87 5.25 10.30 10.24 4.33 1.63 4.59 0.31 11.67 5.30 7.54 1.68 6.17 9.73 12.18 3.72 4.49
Controls 0.74 6.39 7.79 8.36 5.90 2.05 4.26 0.66 10.49 6.15 6.48 0.90 5.33 10.82 13.77 5.41 4.51
6 PSMI 0.99 5.46 9.86 9.99 4.65 1.86 5.09 0.25 11.10 5.58 6.95 2.05 6.45 9.74 11.85 3.66 4.47
Controls 0.80 7.05 7.27 7.50 6.59 2.73 4.66 0.91 9.32 7.05 6.59 1.25 6.36 9.89 12.05 5.57 4.43
7 PSMI 1.11 5.62 9.65 9.57 4.91 2.14 5.22 0.32 10.76 5.70 6.41 2.37 7.04 9.57 11.16 3.88 4.59
Controls 0.42 7.44 7.02 7.16 6.60 3.37 5.06 1.12 9.13 7.72 6.18 1.40 6.74 9.55 11.38 5.62 4.07
8 PSMI 0.91 5.23 8.65 9.22 5.46 2.62 5.80 0.34 9.90 6.37 7.05 2.73 7.96 8.76 10.35 3.98 4.66
Controls 0.38 7.07 6.12 6.88 6.88 4.21 5.93 1.34 8.22 7.65 6.12 1.91 7.65 9.56 10.52 5.54 4.02
Page 18 of 67
For peer review only - http://bmjopen.bmj.com/site/about/guidelines.xhtml
BMJ Open
123456789101112131415161718192021222324252627282930313233343536373839404142434445464748495051525354555657585960
For peer review only
19
Table 6: Logistic model for association between multidimensional poverty, stigma and SMI
Unadjusted Model Adjusted Model OR (95%CI) OR (95%CI)
Family participation (no participation) 2.92 2.16-3.93 2.61 1.27-5.31 SMI (Controls) 2.20 1.67-2.89 2.07 1.25-3.41 Female (Male) 2.17 1.65-2.83 1.88 1.36-2.58 SC/ST/OBC (Higher caste) 2.06 1.56-2.70 2.39 1.39-4.08 Age (in year) 0.99 0.97-0.99 0.98 0.96-0.99 Interaction terms No participation*SMI (Participation*controls) 6.38 3.49-11.6 No participation*SC/ST/OBC (Participation*high caste) 4.86 2.19-10.7 No participation*women (Participation*men) 4.63 2.60-8.21 No participation*women*SMI (Participation*male*controls) 9.62 5.58-16.5 No participation*SC/ST/OBC*SMI(Participation*high caste*controls) 7.36 3.94-13.7
Page 19 of 67
For peer review only - http://bmjopen.bmj.com/site/about/guidelines.xhtml
BMJ Open
123456789101112131415161718192021222324252627282930313233343536373839404142434445464748495051525354555657585960
For peer review only
20
References
1. Lozano R, Naghavi M, Foreman K, et al. Global and regional mortality from
235 causes of death for 20 age groups in 1990 and 2010: a systematic
analysis for the Global Burden of Disease Study 2010. The Lancet
2012;380(9859):2095-2128.
2. World Health Organization. Mental health and development: Targeting people
with mental health conditions as a vulnerable group 2010.
3. Vos T, Flaxman AD, Naghavi M, et al. Years lived with disability (YLDs) for
1160 sequelae of 289 diseases and injuries 1990?2010: a systematic analysis
for the Global Burden of Disease Study 2010. The Lancet
2012;380(9859):2163-2196.
4. Whiteford HA, Degenhardt L, Rehm J, et al. Global burden of disease
attributable to mental and substance use disorders: findings from the Global
Burden of Disease Study 2010. The Lancet 2013.
5. Kleinman A, Hall-Clifford R. Stigma: A social, cultural and moral process.
Journal of Epidemiology Community Health 2009;63(6):418-419.
6. Boyce W, Raja S, Patranabish R, Bekoe T, Deme-der D, Gallupe O. Occupation,
poverty and mental health improvement in Ghana. ALTER European Journal
of Disability Research 2009;3:233-244.
7. Elwan A. Poverty and disability: A survey of the literature. Washington, DC:
Social Protection Advisory Service; 1999.
8. Groce N, Kett M, Lang R, Trani J-F. Disability and Poverty: the need for a more
nuanced understanding of implications for development policy and practice.
Third World Quarterly 2011 2011;32(8):1493-1513.
9. Skeen S, Lund C, Kleintjes S, Flisher A, Consortium MHRP. Meeting the
Millennium Development Goals in Sub-Saharan Africa: What about mental
health? International Review of Psychiatry 2010 2010;22(6):624-631.
10. Brohan E, Clement S, Rose D, Sartorius N, Slade M, Thornicroft G.
Development and psychometric evaluation of the Discrimination and Stigma
Scale (DISC). Psychiatry Research 2013;208(1):33-40.
11. Draine J. Mental health, mental illnesses, poverty, justice, and social justice.
American Journal of Psychiatric Rehabilitation 2013;16(2):87-90.
12. Fone D, Greene G, Farewell D, White J, Kelly M, Dunstan F. Common mental
disorders, neighbourhood income inequality and income deprivation: Small-
area multilevel analysis. British Journal of Psychiatry 2013;202(4):286-293.
13. Li N, Pang L, Du W, Chen G, Zheng X. Association between poverty and
psychiatric disability among Chinese population aged 15-64 years. Psychiatry
Research 2012;200(2-3):917-920.
14. Chatterjee P. Economic crisis highlights mental health issues in India. Lancet
2009;373(9670):1160-1161.
15. Kuruvilla A, Jacob KS. Poverty, social stress & mental health. Indian Journal of
Medical Research Oct 2007;126(4):273-278.
16. Das J, Do QT, Friedman J, McKenzie D, Scott K. Mental health and poverty in
developing countries: Revisiting the relationship. Social Science & Medicine
Aug 2007;65(3):467-480.
Page 20 of 67
For peer review only - http://bmjopen.bmj.com/site/about/guidelines.xhtml
BMJ Open
123456789101112131415161718192021222324252627282930313233343536373839404142434445464748495051525354555657585960
For peer review only
21
17. de Menil V, Osei A, Douptcheva N, Hill AG, Yaro P, De-Graft Aikins A.
Symptoms of common mental disorders and their correlates among women
in Accra, Ghana: a population-based survey. Ghana medical journal
2012;46(2):95-103.
18. Link BG, Phelan JC. Conceptualizing stigma. Annual Review of Sociology 2001
2001;27:363-385.
19. Thornicroft G, Rose D, Kassam A, Sartorius N. Stigma: Ignorance, prejudice or
discrimination? British Journal of Psychiatry 2007;190(MAR.):192-193.
20. Ilic M, Reinecke J, Bohner G, Röttgers HO, Beblo T, Driessen M, Frommberger
U, Corrigan PW. Belittled, Avoided, Ignored, Denied: Assessing Forms and
Consequences of Stigma Experiences of People With Mental Illness. Basic and
Applied Social Psychology 2013;35(1):31-40.
21. Wing JK, Agrawal N. Concepts and classification of schizophrenia. In: Hirsch
SR, Weinberger DR, eds. Schizophrenia. Oxford: Wiley-Blackwell; 2003:3-15.
22. Corrigan PW, Markowitz FE, Watson AC. Structural levels of mental illness
stigma and discrimination. Schizophrenia Bulletin 2004;30(3):481-491.
23. Link BG, Struening EL, Neese-Todd S, Asmussen S, Phelan JC. The
consequences of stigma for the self-esteem of people with mental illnesses.
Psychiatric Services Dec 2001;52(12):1621-1626.
24. Watson AC, Corrigan P, Larson JE, Sells M. Self-stigma in people with mental
illness. Schizophrenia Bulletin 2007;33(6):1312-1318.
25. Rüsch N, Angermeyer MC, Corrigan PW. Mental illness stigma: Concepts,
consequences, and initiatives to reduce stigma. European Psychiatry
2005;20(8):529-539.
26. Wahl OF. Stigma as a barrier to recovery from mental illness. Trends in
Cognitive Sciences 2012;16(1):9-10.
27. Link BG, Phelan JC. Stigma and its public health implications. Lancet Feb 11
2006;367(9509):528-529.
28. Link BG, Yang LH, Phelan JC, Collins PY. Measuring mental illness stigma.
Schizophrenia Bulletin 2004 2004;30(3):511-541.
29. Hatzenbuehler ML, Phelan JC, Link BG. Stigma as a fundamental cause of
population health inequalities. American Journal of Public Health
2013;103(5):813-821.
30. Crabb J, Stewart RC, Kokota D, Masson N, Chabunya S, Krishnadas R.
Attitudes towards mental illness in Malawi: A cross-sectional survey. BMC
Public Health 2012;12(1).
31. Gureje O, Lasebikan VO, Ephraim-Oluwanuga O, Olley BO, Kola L. Community
study of knowledge of and attitude to mental illness in Nigeria. British Journal
of Psychiatry 2005;186(MAY):436-441.
32. Jadhav S., Littlewood R., Ryder A.G., Chakraborty A., Jain S., Barua M.
Stigmatization of severe mental illness in India: Against the simple
industrialization hypothesis. Indian Journal of Psychiatry 2007;49(3):189-
194.
33. Ngui E, Khasakhala A, Ndetei D, Weiss Roberts L. Mental disorders, health
inequalities and ethics: A global perspective. International Review of
Psychiatry 2010;22(3):235-244.
Page 21 of 67
For peer review only - http://bmjopen.bmj.com/site/about/guidelines.xhtml
BMJ Open
123456789101112131415161718192021222324252627282930313233343536373839404142434445464748495051525354555657585960

For peer review only
22
34. Ssebunnya J, Kigozi F, Lund C, Kizza D, Okello E. Stakeholder perceptions of
mental health stigma and poverty in Uganda. Bmc International Health and
Human Rights 2009;9(1):5.
35. Phelan JC. Genetic bases of mental illness - A cure for stigma? Trends in
Neurosciences 2002;25(8):430-431.
36. Khandelwal SK, Pattanayak RD. Fight against Stigma. In: Chavan BS, Gupta N,
Arun P, Sidana AK, Jadhav S, eds. Comprehensive Textbook on Community
Psychiatry in India. Delhi: Jaypee Brothers; 2012:334-344.
37. Alkire S, Foster J. Counting and multidimensional poverty measurement.
Journal of Public Economics 2011;95(7-8):476.
38. World Health Organization. ICD-10 Classification Of Mental And Behavioral
Disorders: Clinical Descriptions And Diagnostic Guidelines. Geneva: World
Health Organisation; 1992.
39. Dupont WD, Plummer Jr WD. Power and sample size calculations. A review
and computer program. Controlled Clinical Trials 1990;11(2):116-128.
40. DeVellis RF. Scale development: Theory and applications Vol 26. Thousand
Oaks: Sage; 2012.
41. Sen AK. Capabilities, lists, and public reason: Continuing the conversation.
Feminist Economics 2004;10((3)):77-80.
42. Ravallion M, Chen S, Sangraula P. Dollar a day revisited. World Bank Economic
Review 2009;23(2):163-184.
43. Shrivastava A, Johnston M, Thakar M, Shrivastava S, Sarkhel G, Sunita I, Shah
N, Parkar S. Origin and Impact of Stigma and Discrimination in Schizophrenia
- Patients’ Perception: Mumbai Study. Stigma Research and Action
2011;1(1):67-72.
44. Loganathan S, Murthy RS. Living with schizophrenia in India: Gender
perspectives. Transcultural Psychiatry 2011;48(5):569-584.
45. Corrigan PW, Miller FE. Shame, blame, and contamination: A review of the
impact of mental illness stigma on family members. Journal of Mental Health
2004;13(6):537-548.
46. Karnieli-Miller O, Perlick DA, Nelson A, Mattias K, Corrigan P, Roe D. Family
members' of persons living with a serious mental illness: Experiences and
efforts to cope with stigma. Journal of Mental Health 2013;22(3):254-262.
47. Larson JE, Corrigan P. The stigma of families with mental illness. Academic
Psychiatry 2008;32(2):87-91.
48. Alkire S, Foster J. Counting and multidimensional poverty measurement.
Journal of Public Economics Aug 2011;95(7-8):476-487.
49. Bruckner T, Catalano RA. Economic Antecedents of Sudden Infant Death
Syndrome. Annals of Epidemiology 2006;16(6):415-422.
50. Eskenazi B, Marks AR, Catalano R, Bruckner T, Toniolo PG. Low birthweight
in New York city and upstate New York following the events of September
11th. Human Reproduction 2007;22(11):3013-3020.
51. Planning Commission. Poverty estimates for social groups: 2004-05 and
2011-12. New Delhi; 2013.
Page 22 of 67
For peer review only - http://bmjopen.bmj.com/site/about/guidelines.xhtml
BMJ Open
123456789101112131415161718192021222324252627282930313233343536373839404142434445464748495051525354555657585960
For peer review only
23
52. Olinto P, Beegle K, Sobrado C, Uematsu H. The State of the Poor: Where Are
The Poor, Where Is Extreme Poverty Harder to End, and What Is the Current
Profile of the World’s Poor? Economic Premise 2013;125:1-8.
53. Kohler Riessman C. Stigma and Everyday Resistance Practices: Childless
Women in South India. Gender and Society 2000;14(1):111-135.
54. Jaspal R. Caste, social stigma and identity processes. Psychology and
Developing Societies 2011;23(1):27-62.
55. Biemer PP, ed. Measurement Errors in Surveys. New York: John Wiley and
Sons; 1991.
56. Biemer PP, Lyberg LE. Introduction to survey quality. Hoboken: John Wiley &
Sons; 2003.
57. Das J, Das RK, Das V. The mental health gender-gap in urban India: Patterns
and narratives. Social Science and Medicine 2012;75(9):1660-1672.
58. Das J, Quy-Toan Do Q, Friedman J, McKenzie D, Scott K. Mental Health and
Poverty in Developing Countries: Revisiting the Relationship. Social Science
and Medicine 2007;65:467-480.
59. Thara R, Kamath S, Kumar S. Women with schizophrenia and broken
marriages - Doubly disadvantaged? Part I: Patient perspective. International
Journal of Social Psychiatry 2003;49(3):225-232.
60. Human Rights Watch. “Treated Worse than Animals”. Abuses against Women
and Girls with Psychosocial or Intellectual Disabilities in Institutions in India
Human Rights Watch; 2014.
61. Jeffrey C, Jeffery P, Jeffery R. Reproducing difference? Schooling, jobs, and
empowerment in Uttar Pradesh, India. World Development
2005;33(12):2085-2101.
62. Kijima Y. Caste and tribe inequality: Evidence from India, 1983-1999.
Economic Development and Cultural Change 2006;54(2):369-404.
63. Corrigan PW, Larson JE, Rüsch N. Self-stigma and the "why try" effect: Impact
on life goals and evidence-based practices. World Psychiatry 2009;8(2):75-
81.
64. Thara R, Kamath S, Kumar S. Women with schizophrenia and broken
marriages - Doubly disadvantaged? Part II: Family perspective. International
Journal of Social Psychiatry 2003;49(3):233-240.
65. Brady N, McCain GC. Living with schizophrenia: a family perspective. Online
journal of issues in nursing [electronic resource] 2005;10(1):7.
66. Lee S, Lee MTY, Chiu MYL, Kleinman A. Experience of social stigma by people
with schizophrenia in Hong Kong. British Journal of Psychiatry
2005;186(FEB.):153-157.
67. Yang LH, Purdie-Vaughns V, Kotabe H, Link BG, Saw A, Wong G, Phelan JC.
Culture, threat, and mental illness stigma: Identifying culture-specific threat
among Chinese-American groups. Social Science and Medicine 2013;88:56-67.
68. Yang LH, Pearson VJ. Understanding families in their own context:
Schizophrenia and structural family therapy in Beijing. Journal of Family
Therapy 2002;24(3):233-257.
Page 23 of 67
For peer review only - http://bmjopen.bmj.com/site/about/guidelines.xhtml
BMJ Open
123456789101112131415161718192021222324252627282930313233343536373839404142434445464748495051525354555657585960

For peer review only
24
69. Link BG, Cullen F, Frank J, Wozniak JF. The social rejection of former mental
patients: understanding why labels matter. American Journal of Sociology
1987;92(6):1461–1500.
70. Murali V, Oyebode F. Poverty, social inequality and mental health. Advances
in Psychiatric Treatment 2004;10(3):216-224.
Page 24 of 67
For peer review only - http://bmjopen.bmj.com/site/about/guidelines.xhtml
BMJ Open
123456789101112131415161718192021222324252627282930313233343536373839404142434445464748495051525354555657585960
For peer review only
25
i For vegan individuals, the diet staple included at least dal on a daily basis; for non-vegan individuals,
it included dairy products on a daily basis. Meat for non-vegetarian individuals was not considered as
a diet requirement and therefore deprivation of meat is not an indicator of poor diet. ii Assets include: Landline, mobile phones, wooden/steel sleeping cot, mattress, table, clock/watch,
charpoy, refrigerator, radio/transistor, electric fan, television, bicycle, computer,
moped/scooter/motorcycle, car.
iii Expenditures include: Food, health, school, transportation, savings and personal care products.
Page 25 of 67
For peer review only - http://bmjopen.bmj.com/site/about/guidelines.xhtml
BMJ Open
123456789101112131415161718192021222324252627282930313233343536373839404142434445464748495051525354555657585960
For peer review only
1
Association between Mental illness, poverty and stigma in India: A case control study
Abstract
Objective –To assess the effect of experienced stigma on depth of multidimensional poverty of persons with severe mental illness (PSMI) in Delhi, India, controlling for gender, age and caste. Design – Matching Case (hospital) control (population) study. Setting – University Hospital (cases) and National Capital Region (NCR) (controls), India.
Participants A case-control study was conducted from November 2011 to June 2012. 647 cases diagnosed with schizophrenia or affective disorders were recruited and 647 individuals of same age, sex and location of residence were matched as controls at a ratio of 1:2:1. Individuals who refused consent or provided incomplete interview were excluded.
Main outcome measures – Higher risk of poverty due to stigma among PSMI.
Results - 38.5% of PSMI compared to 22.2% of controls were found poor on 6 dimensions or more. The difference in Multidimensional poverty index (MPI) was 69% between groups with employment and income the main contributors. Multidimensional poverty was strongly associated with stigma (odds ratio [OR] 2.60, 95% CI 1.27-5.31), scheduled castes/scheduled tribes/ other backward castes (SC/ST/OBC) (2.39, 1.39-4.08), mental illness (2.07, 1.25-3.41), and female gender (1.87, 1.36-2.58). A significant interaction between stigma, mental illness and gender or caste indicates female PSMI or PSMI from ‘lower castes’ were more likely to be poor due to stigma than male controls (p<0.001) or controls from other castes (p<0.001). Conclusions – Public stigma and multidimensional poverty linked to SMI are pervasive and intertwined. Particularly for low caste and women, it is a strong predictor of poverty. Exclusion from employment linked to negative attitudes and lack of income are the highest contributors to multidimensional poverty, increasing the burden for the family. Mental health professionals need to be aware of and address these issues.
Article summary
Strengths and limitations
• There is little research on effects of stigma and poverty in developing settings
• Lack of employment and income are major contributors to multidimensional poverty for PSMI
Page 26 of 67
For peer review only - http://bmjopen.bmj.com/site/about/guidelines.xhtml
BMJ Open
123456789101112131415161718192021222324252627282930313233343536373839404142434445464748495051525354555657585960
For peer review only
2
• Intensity of multidimensional poverty is higher for PSMI, particularly women with SMI and those from SC/ST/OBC
• Limitation: Stigma was operationalized through a single item question rather than a multiple-item scale and we could not assess reliability of this item. SMI was diagnosed for persons attending a public psychiatric department; PSMI not receiving medical treatment might be more marginalised and at greater risk of poverty than those receiving healthcare.
Introduction Mental health problems affect 450 million people worldwide, 80% in middle and low-income countries. In 2010, 2,319,000 persons died of mental and behavioural disorders1. Mental health conditions account for 13% of the total burden of disease, 31% of all years lived with disability and are one of the 4 main contributors to years lived with disability2,
3. Schizophrenia and bipolar disorder represent 7.4 % and 7·0% of DALYs caused by mental and substance use disorders respectively4. Severe mental illness (SMI) is a leading cause of disability and the standard prevalent biomedical care model is neither an exclusive nor a comprehensive solution as it does not address the link between mental illness, stigma and poverty 5. While the literature on poverty, poor mental health6 and disability7-9 is emerging, little has been done to examine the compounding associations between experienced stigma (unfair treatment or discrimination due to having a mental health issue)10, mental illness and poverty, especially in low-income countries. In high-income countries11, income deprivation is identified as a major risk factor for persons with mental health issues, even for common mental disorders12. Poor mental health linked to SMI has been associated with poverty during the recent economic crisis in middle and low-income countries, particularly India and China13-15. People with mental disorders living in these countries are not only more likely to be poorer, but also unemployed and less educated16, 17. Indisputably, a better understanding of the relationship between mental illness and poverty may yield useful knowledge to tailor public health interventions to complement biomedical treatment to improve outcomes. Link and Phelan (2001) defined stigma as a process with five interrelated components: discrimination through a process of separation based on negative attitudes and prejudice resulting from labelling and cultural stereotypes of society towards the stigmatized group leading to social, economic and political power differences18. Thornicroft et al. (2007) identify three elements of stigma: ignorance or misinformation, prejudice and discrimination19. Our paper focuses on the process of experienced discrimination as the manifestation of public stigma20. The congruence of self-stigma and social exclusion may lead persons with SMI (PSMIs) to face unfair treatment or discrimination and develop low self-esteem21-24. Such stigma may prevent mentally ill persons from improving their conditions25 by creating a “barrier to recovery”26 and worsen their situation by pushing them into poverty through discriminatory practices27-29.
Page 27 of 67
For peer review only - http://bmjopen.bmj.com/site/about/guidelines.xhtml
BMJ Open
123456789101112131415161718192021222324252627282930313233343536373839404142434445464748495051525354555657585960
For peer review only
3
Stigma towards PSMI resulting in discrimination30, 31 is persistent in India32. Although the factors constituting poverty and discrimination linked to mental illness potentially can deprive persons of many resources33, 34 the dynamics of poverty, discrimination and mental health have not been fully addressed. The clinical literature argues that stigma is caused by mental illness and treating the latter biomedically will weaken the associated stigma35, 36. We argue instead that even treated PSMI are more likely to be multidimensionally poor due to discrimination resulting from stigma. Many studies have focused on uni-dimensional effect of poverty on mental health, but have not explained how stigma towards mental illness can be an aggravating contributor to the intensity of poverty. We aimed to estimate the difference in incidence and intensity of poverty between PSMI and a comparable control group using a multidimensional poverty index (MPI) to explore deprivation in various dimensions of life37. Going beyond traditional welfare economics approaches to poverty (i.e. income or per capita expenditure) we explored non-monetary dimensions of poverty such as education, health, quality of shelter, food intake, and political participation. We assessed differences in intensity of poverty between PSMI and controls and explored how these differences vary as a function of discrimination resulting from stigma.
Methods
Study design and setting
The primary objective was to assess differences in exposure to discrimination resulting from stigma and multidimensional poverty among cases compared with non-psychiatrically ill controls. Between November 2011 and June 2012, we carried out a case-control study based at the Department of Psychiatry of the Dr Ram Manohar Lohia (RML) Hospital in New Delhi (cases), and in the neighbourhood of residence of the cases (controls) to assess the impact of stigma associated to mental illness on poverty. The Department of Psychiatry at Dr RML hospital received respectively 10881 and 19528 new outpatients and 52389 and 45319 follow-ups of existing patients in 2012 and 2013. The department has also a 42 bed general psychiatry and de-addiction inpatient facility for men and women. It serves patients from the national Capital Region of Delhi (NCR).
Participants
We defined cases as outpatients diagnosed with schizophrenia or affective disorders by one of the 10 board certified treating psychiatrists following ICD-10 criteria38. Outpatients were informed about the study and if they consented, were referred to researchers for written informed consent and evaluation with no further contact with those who refused. Transportation costs and a meal were provided to maximise recruitment and reduce selection bias. We used a non-psychiatrically ill control group composed of randomly selected individuals matching the patients according to gender, age (plus or minus 5 years) and neighbourhood of residence. Matched controls were selected by spinning a pointer at the door of the case’s home and randomly selecting one household among 30 in the pointed direction. In this household a person of same age and gender with no reported history of a
Page 28 of 67
For peer review only - http://bmjopen.bmj.com/site/about/guidelines.xhtml
BMJ Open
123456789101112131415161718192021222324252627282930313233343536373839404142434445464748495051525354555657585960
For peer review only
4
mental health disorder was interviewed. It was not possible to conduct detailed interviews for diagnosis of all controls due to logistics as well as stigma of revealing mental illness. We excluded controls when unable to obtain consent. Only two case patients were not matched. Investigators together with the team manager contributed to sensitisation and awareness raising in the neighbourhoods of interest to maximise controls’ participation rates. Consent for patients and controls adolescent between 13 and 18 was obtained by asking the parent or the legal guardian of the study subjects. We conducted face-to-face interviews with all PSMI or a caregiver during hospital visits, and controls at home. We obtained information on demographics, socioeconomic factors, health conditions and accessibility to services, education, employment, income, livelihoods, and social participation. The instrument was translated by experts into Hindi with iterative back-translation and tested in a pilot survey in October 2011. Investigators trained 2 experienced supervisors and 10 Masters-level students over two weeks on survey concepts and goals, mental illness awareness, interview techniques followed by review, test and debriefing.
Sample size
To determine sample size, we used a matched design with a control to case ratio of one, the probability of exposure to poverty among controls of 0.22 and the correlation coefficient for exposure between matched cases and controls of 0.1839. Considering the true odds ratio for one dimension of poverty in exposed subjects relative to unexposed subjects as 2.2, we needed to enroll 205 case patients to be able to reject the null hypothesis that this odds ratio equals 1with probability of 0.9. The type 1 error probability associated with this test of this null hypothesis is 0.05. We enrolled 649 case patients to allow for subgroup analyses including impact on poverty of discrimination stratified by gender, age and caste.
Efforts to minimize bias
New patients were first interviewed by a junior psychiatrist who made a provisional diagnosis and discussed details with a board of certified psychiatrist who then diagnosed and managed the case. To minimise diagnosis bias, we trained all psychiatrists on the ICD 10 criteria. Information bias was minimised by reviewing the questionnaire about exposure to poverty to ensure accuracy, completeness and content validity with experts and by testing it with a sample group of patients and families..Investigators revised the content for relevance to poverty in order to maximize item appropriateness. They first defined the concept of multidimensional poverty and reviewed the empirical and theoretical literature to identify the right deprivation items to include in the instrument they were developing. They then checked if the questions covered all dimensions of the concept of multidimensional poverty, if the phrasing respectively in English and Hindi was accurately reflecting the underlying concept of deprivation we were looking for in each dimension. Two experts familiar with multidimensional poverty reviewed the initial list of items and made suggestions about adding items that were omitted. We then organized a focus group discussion with 7 experts, psychiatrists, psychologists and social workers from Dr Ram Manohar Lohia hospital to establish if the 17 domains of poverty selected were adapted and relevant for the context of New Delhi and were providing a comprehensive overview of the concept. They also ranked these domains by order of
Page 29 of 67
For peer review only - http://bmjopen.bmj.com/site/about/guidelines.xhtml
BMJ Open
123456789101112131415161718192021222324252627282930313233343536373839404142434445464748495051525354555657585960
For peer review only
5
importance of deprivation. A similar focus group was organized with 8 hospital outpatients with severe mental illness. We finally tested the poverty questionnaire with a group of 20 outpatients at the department of psychiatry at Dr RML hospital. We prompted them with questions to check for their understanding of poverty, to identify the language they used to explain the notion of poverty as well as ascertain their understanding of the questions in order to make sure the instrument’s purpose made sense to them. Finally, two other experts revised the final version to make sure items illustrate the content of multidimensional poverty.40 We also carried out test-retest to test for recall bias and social desirability bias. Interviews with 71 respondents (both cases and controls) for test-retest reliability were carried out on two occasions with a gap of 10 to 15 days by the same enumerator to check to what degree a given respondent provided same responses for the poverty items. We compared the scores between the two sets of responses. Results show overall acceptable level of reliability (over 0.7 for Inter class correlation) for the different poverty variables.
Quantitative variables
We selected 17 indicators of deprivation reflecting aspects of wellbeing (Table 1) identified by literature review and validated through focus group discussions (FGDs) with experts and PSMI/caregivers. Both groups identified and agreed on deprivation cut-offs for each indicator through participatory deliberation 41. Some standard dimensions were not included due to lack of relevance in Delhi. For instance, few respondents lacked access to diet staplesi.
We classified the selected indicators in three major domains of deprivation: individual level capabilities, household level material wellbeing, and individual level psychosocial factors. The first domain was composed of nine indicators. Access to secondary school was the indicator for education; dropping out before reaching secondary school was the cut-off. Unemployment was a major source of vulnerability; deprivation of work was the cut-off. Food security was measured by access to three meals per day and respondents eating less were considered deprived. Following the UNICEF definitions, improved indoor air quality using cooking gas, improved drinking water by pipe into residence and improved sanitation by private flush toilet defined absence of deprivation for indicators six to eight. Finally, individual income constituted a monetary indicator. Material wellbeing of the household was composed of two series of indicators. Three indicators outlined conditions of living: minimum space per person (deprivation threshold of 40 square feet per person); home ownership (renting was the cut-off ); poor quality housing was having either the flooring, walls or roof made of Kutcha (precarious or temporary) material. Material wealth was defined by three complementary indicators: the household average per capita income (threshold at the international poverty line of US$1.25 per day or 68 Indian rupees)42; assets included typical goods owned by the householdii; and monthly household expendituresiii. Finally, two psychosocial indicators were selected: physical safety, measured through an indicator of perception of unsafe environment and political participation in the municipal elections.
Page 30 of 67
For peer review only - http://bmjopen.bmj.com/site/about/guidelines.xhtml
BMJ Open
123456789101112131415161718192021222324252627282930313233343536373839404142434445464748495051525354555657585960
For peer review only
6
Studies in India have shown that stigma resulting in discriminatory practices is perceived to be high in the family and the community43, 44. As a result, we measured experienced discrimination as a dimension of stigma through self-evaluation of unfair treatment by the family. We asked all respondents if they were excluded from family decision compared to other household members of the same generation. Unfair treatment within family is a feature of stigma in India44. We tested this through FGDs with PSMI of both genders. We found high association between SMI and exclusion from regular family decisions, particularly for women. Other dimensions of participation did not show any discriminatory process. Inclusion in community activities showed similar 30% levels of participation between PSMI and controls. A possible explanation for participation is that where symptoms of mental illness are managed by treatment, family develop coping strategies through symbolic social participation and selective disclosure to avoid rejection, stigma and avoidance by others associated with their relative’s condition45-47. Finally, we enquired about participation in political activities such as “gram sabhas” or local associations. We found generalized low participation in political activities, which is a common feature in New Delhi and therefore not a good indicator of experienced discrimination. Table 1: approximately here
Statistical Analysis Our primary aim was to explore the effect of mental illness and stigma on poverty. We used an unmatched Multidimensional Poverty Index (MPI) measure to identify differences in levels of poverty between PSMI and controls48. Dimensions were independently assessed and the method focused on dimensional shortfalls. This method allowed us to aggregate dimensions of multidimensional poverty measures and consisted of two different forms of cutoffs: one for each dimension and the other relating to cross-cutting dimensions. If an individual fell below the chosen cut-off on a particular dimension he/she was identified as deprived. The second poverty cut-off determined the number of dimensions in which a person must be deprived to be deemed multidimensionally poor. We first performed one-way analyses to assess differences in poverty levels and discrimination between PSMI and controls, by gender and caste adjusting for post-hoc pairwise comparisons using the Scheffe method. We also carried out correlation analysis to assess overlap of dimensions of deprivation. We then calculated 3 indicators of multidimensional poverty: (i) the headcount ratio (H) indicating how many people fall below each deprivation cutoff; (ii) the average poverty gap (A) denoting the average number of deprivations each person experiences; (iii) the adjusted headcount (M0) which is the headcount ratio (H) by the average poverty gap (A) and indicates the breadth of poverty. We established the contribution of each dimension of poverty for cases and controls by dividing each of the two subgroups’ poverty level by the overall poverty level, multiplied by the population portion of each subgroup.
Page 31 of 67
For peer review only - http://bmjopen.bmj.com/site/about/guidelines.xhtml
BMJ Open
123456789101112131415161718192021222324252627282930313233343536373839404142434445464748495051525354555657585960
For peer review only
7
To assess potential bias in our estimates of MPI, we carried out sensitivity analysis and compared three measures of poverty with: (i) Equal weight for every indicator in each dimension; (ii) Individual rankings of indicators done by experts at Dr RML hospital during the FGDs transformed into individual weights and then taking the average of the individual weights49; (iii) Group ranking based on the mean of individual rankings of indicators during FGDs and taking the weight according to the group ranking 50. We found consistency across measures (data not shown). We finally calculated the crude and adjusted odd ratios (OR) with associated 95% confidence intervals using a logistic regression model to identify association between stigma, SMI and multidimensional poverty. We used ‘no participation’ as the reference category. We defined a binary outcome for poverty (poor/non poor) using the adjusted headcount ratio (M0) for a cutoff k=6 corresponding to the highest gap between PSMI and controls. This cutoff corresponds to a prevalence of poverty of 30.7% above the recent estimates of 13.7% of urban Indians below the poverty line fixed at 28.65 rupees by the Indian Planning Commission51 which has been criticised for being unrealistic. This cutoff is in line with World Bank recent estimate that 33% of India’s population lives below the international poverty line established at $1.25 dollars per capita per day52. We characterised how SMI results in higher intensity of multidimensional poverty due to stigma. Aware that stigma and discrimination may also affect women53 and members of lower castes54, we adjusted the model for potential confounders significantly associated with poverty and family discrimination: caste (in case of difference within the family), gender and age. We carried out sensitivity analysis for different values of the cutoff k and found robustness in our model (data not shown). For all analyses, a P-value of <0.05 was considered significant. Missing values were treated as being missing completely at random. We used Stata (version 12.0) for database processing and all analysis.
Results Participants
We interviewed 649 case patients and 647 controls. Of these, we excluded 110 (17%) cases and 151 (23%) controls respectively who did not complete the interview or for whom the data was incomplete. The final analysis included 537 cases and 496 controls (figure 1). The distribution between cases and controls was similar for gender (305 and 330 males respectively, 61.5% in both cases) and age ( 15-74 and 13-74 and median 35 and 36 respectively). Figure 1 approximately here. Table 2 reports the headcount ratios (H) or incidence of deprivation in each dimension. There were statistically significantly higher numbers of deprived PSMI than controls in nine dimensions. Differences were very high for access to employment (28.1% difference), individual income (20.7%) and relatively high for food security (15.1%) and house ownership (11.7%). In only one dimension -perception of physical safety- was there a reverse non-significant difference as number of controls were higher than the number of PSMI.
Page 32 of 67
For peer review only - http://bmjopen.bmj.com/site/about/guidelines.xhtml
BMJ Open
123456789101112131415161718192021222324252627282930313233343536373839404142434445464748495051525354555657585960

For peer review only
8
Table 2 approximately here. Table 2 also show results by gender and caste. Compared to male PSMI, the proportion of deprived female PSMI was significantly higher (10 of 17 dimensions). Similarly, a higher number of PSMI (vs. controls) from ‘scheduled castes’, ‘scheduled tribes’ or ‘other backward castes’ (SC/ST/OBC) were poorer on 13 (vs. 16 dimensions) compared to PSMI (vs. controls) from unreserved castes. To investigate possible overlap of dimensions of poverty, we calculated the estimates for the Spearman rank correlation coefficients between each pair of dimensions of deprivation (Table 3). We found no evidence of strong correlation between dimensions, illustrating absence of association except for household income and expenditures. We nevertheless kept both indicators to calculate the MPI to account for information bias (particularly recall bias) often associated with measures of income in household surveys55, 56. Significantly, this result demonstrates that a unique welfare indicator of poverty such as income, cannot represent all aspects of deprivation. Table 3 approximately here.
Multidimensional poverty
Results in Table 4 report the multidimensional headcount ratio (H), the average deprivation shared across the poor (A) and the adjusted headcount ratio (M0) for all possible cutoffs and for the two groups. Depending on the chosen cutoff, the proportion of PSMI and controls who were multidimensionally poor varied greatly. For a cutoff of one, 97.2% of PSMI and 91.7% of controls were deprived: taking a union approach of deprivation in one dimension, this translates into quasi-universal poverty. On average, PSMI were deprived on 5 dimensions and controls on 3.9. If multidimensional poverty requires deprivation in four, five, or six dimensions simultaneously, the proportion of poor PSMI (compared to poor controls) becomes 68.5% (compared to 48.6%), 51.6% (35.9%), or 38.5% (22.2%). Conversely, if we adopt the intersection approach where being poor implies being deprived in all 17 dimensions, nobody in the sample is poor and less than 1% of the sample is deprived in 13. Table 4 approximately here The adjusted headcount ratio (M0) shows that PSMI were worse off than controls for a cutoff (k) value between one and 12 dimensions. This difference is significant (p<0.001) for (k)=1 to (k)=10 dimensions and highest (69% difference) for (k)=6. The average deprivation share (A) is higher among PSMI for a value of (k) between one and five and highest for (k)=1 (22% difference). For a (k) between six and 14, the total number of deprivations faced by poor PSMI is slightly lower on average than for controls. Less than 30% of people were poor in six dimensions or more and the difference between PSMI and controls was the highest for a (k) value of 14 (7%). To further investigate the association between poverty and mental illness, analysis was repeated for all possible cutoffs and for gender and caste (Table 4). Multidimensional
Page 33 of 67
For peer review only - http://bmjopen.bmj.com/site/about/guidelines.xhtml
BMJ Open
123456789101112131415161718192021222324252627282930313233343536373839404142434445464748495051525354555657585960
For peer review only
9
poverty was significantly higher for female PSMI compared to female controls for any threshold between one and seven dimensions (p<0.001) but also for male PSMI for any threshold between one and nine dimensions. On average, 62.8% of female PSMI were deprived on five dimensions or more, compared to 35.9% of female controls, 44.5% of male PSMI and 25.6% of male controls. For female PSMI and controls − and male PSMI and controls respectively − the difference is particularly pronounced and significant for highest cutoff values, and maximum for six and seven dimensions respectively. The adjusted headcount ratio (M0) shows that SC/ST/OBC PSMI are worse off regardless of the value of (k) 1 through 10, than SC/ST/OBC controls and other caste PSMI or controls. (M0) for SC/ST/OBC controls is higher than for other caste PSMI for all (k) values. Table 5 presents the percentage contribution of each dimension to (M0) for different (k). Deprivations in individual income household expenditures and employment were contributing each more than 10% to the overall (M0) for PSMI, whatever the value (k) between 1 and 8. For controls, employment was a less salient contributor while the contribution from household income was among the highest. Table 5 approximately here
Poverty and stigma
Association between multidimensional poverty and stigma was strong even when controlling for SMI, gender, caste and age (Table 6; all p<0·0001). We included interaction of stigma, SMI with caste and found that this term was strongly and positively associated with a high level of poverty: the odds ratio of being multidimensionally poor for PSMI from SC/ST/OBC compared with controls from unreserved castes was 7.36 (95% confidence interval 3.94 to 13.7). Similarly, we allowed for differential gender effects by including interaction of stigma and SMI with the gender of the respondent and found high effect on poverty: women PSMI were 9.61 (95% CI 5.58 to16.5) more likely to be poor compared to male controls.
Table 6 approximately here
Discussion Our findings establish that intensity of multidimensional poverty is higher for PSMI than the rest of the population. They also indicate that it is higher for women with SMI and for SC/ST/OBC with SMI. Deprivation of employment and income appear to be major contributing factors to MPI. Lack of employment and income appear to aggravate mental illness. Finally, our findings suggest that stigma linked to SMI, compounded with others (particularly SC/ST/OBC and women) negatively impact poverty. The congruence of SMI and poverty, in a context of high prejudice against mental illness compromises improvement. Mental illness in India is linked to lack of knowledge and pervasive negative assumptions, the most common being that PSMI are violent and unable to work18, 31, 44. Not surprisingly, deprivation of employment and income contributes highly to multidimensional poverty of PSMI compared to controls. This finding ties in with a study on employment for Indian men with schizophrenia which
Page 34 of 67
For peer review only - http://bmjopen.bmj.com/site/about/guidelines.xhtml
BMJ Open
123456789101112131415161718192021222324252627282930313233343536373839404142434445464748495051525354555657585960

For peer review only
10
found that employment provided not just an essential social role but was also a condition for rehabilitation, enhanced confidence and self-esteem 44. Although there is evidence of differences in mental health outcomes between men and women, analyses of gender disparities are lacking in literature on poverty and mental health in low-income countries44, 57, 58. In our sample, women with SMI were systematically more deprived in higher numbers of dimensions. Similarly, SC/ST/OBC SMI-poverty associations were found to be consistent across dimensions of poverty regardless of the threshold for multidimensional poverty. These findings strongly suggest stigma linked to various marginalized groups have the power to accelerate and intensify exclusion and related discrimination. For women, SMI can negatively impact wellbeing in two ways. Firstly, SMI limits women from fulfilling family and social roles, leading to these women being considered a burden for the family. This is true despite studies, such as the Indian study of women with schizophrenia abandoned by their husbands who expressed the desire to work to support themselves 59. Secondly, traditional beliefs (punishment for previous lives, evil eye/curse) as well as negative lay attitudes on causes and behaviours, lead to increased discrimination of and sometimes violence against SMIs, particularly for women 60. Our study finds that SC/ST/OBC and poverty further compound SMI. Discrimination linked to caste in accessing education or employment has been a leitmotif in modern India and only partially addressed through constitutional provisions and reservation policies. Caste discrimination still results in scant employment opportunities, less access to secondary and higher education- key for salaried public and private jobs, perpetuating powerlessness, traditional forms of dominance and oppression, inequalities, lower living standards among SC/ST/OBC as a entrenched social identity in India61, 62. This situation is even more catastrophic for PSMI from SC/ST/OBC. It is clear that a ‘negative feedback loop’ exists: stigma against SMI, particularly for SC/ST/OBC and women, is a strong predictor of persistent poverty. Moreover, stigma strongly bears on intensity of poverty. Stigma leads to difficulty for PSMI in finding and keeping a job, and this also increases the perceived burden of SMI by family members. In turn, this deprivation on various dimensions erodes self-esteem, brings shame and acceptance of discriminatory attitudes 63. These compounding factors may result in a worsening of mental illness. Beyond the PSMI, stigma and discrimination have a negative effect on family members and caregivers who often feel ashamed, embarrassed or unable to cope with the stigma59,
64-68. While there have been campaigns and policies to address discrimination against SC/ST/OBC and women in India, no large-scale awareness campaign has ever addressed the prejudice and discrimination faced by PSMIs. This study has some limitations. First, a potential limitation is that we measured experienced discrimination with a single-item question on exclusion from family decision rather than a multiple-item scale. There was not a specific formalized psychometrically validated measure of experienced stigma available focusing on the scope and content of discrimination before the Discrimination and Stigma Scale (DISC) made available after
Page 35 of 67
For peer review only - http://bmjopen.bmj.com/site/about/guidelines.xhtml
BMJ Open
123456789101112131415161718192021222324252627282930313233343536373839404142434445464748495051525354555657585960
For peer review only
11
our study was carried out 10. Other factors may also explain exclusion from family decisions, in particular, symptomatic patients’ disruptive behavior. To account for this issue, we selected a large sample of PSMI at Dr RML hospital representing a wide variety of severity of symptoms. Yet all outpatients were successfully treated and mostly in follow-up, and therefore not symptomatic at the time of the survey. Despite treatment, SMI in cases was significantly associated with our measure of stigma compared to controls, showing that ‘‘pre- existing beliefs’’ or stereotypes linked to past experience with the mental illness were critical to the activation of the discrimination process rather than the current mental health status of the person 69. Secondly, it was not possible to establish the direction of the association between poverty, and SMI; poverty can be a cause as well as a consequence of SMI. Thirdly, SMI was diagnosed within a psychiatric department of a free government hospital. Research indicates the poorest members of society may still not access such services, even when free; possibly introducing a selection bias in our sample 70. Additionally, PSMI not receiving medical treatment might be even more marginalised, at greater risk of poverty than those receiving healthcare. Thus the sampling bias might have underestimated association between SMI, stigma and poverty. Finally, due to the large sample size we could not evaluate each control using detailed diagnostic psychiatric questionnaires but only screen them for major mental disorders.
Conclusion Our study provides evidence that mental health professionals must incorporate an understanding of multidimensional poverty stressors as well as address family and community dynamics. Where resources are limited, medical professionals would benefit from working with public health and disability networks to weaken persistent stigma against SMI. Policies promoting employment support for PSMI (notably through reservations or fair employment policies, and access to credit) are critically important. The implications of our findings go beyond medical and public health and link mental health to international development. Promoting employment and fighting social stigma for PSMI not only mitigates the impact of illness for some but appears to be a central concern of global poverty.
Contributorship statement.
Study designed by JFT, SD, PB,SJ. Data collection supervised by SV, NM, SN,SD. Literature review by PB with JFT. Data analysis by JK,JFT. Data interpretation and writing by JFT,PB, and revised by SD and NG. All authors contributed to the final manuscript.
Competing interests
We declare no conflict of interest.
Ethics committee approval
Page 36 of 67
For peer review only - http://bmjopen.bmj.com/site/about/guidelines.xhtml
BMJ Open
123456789101112131415161718192021222324252627282930313233343536373839404142434445464748495051525354555657585960
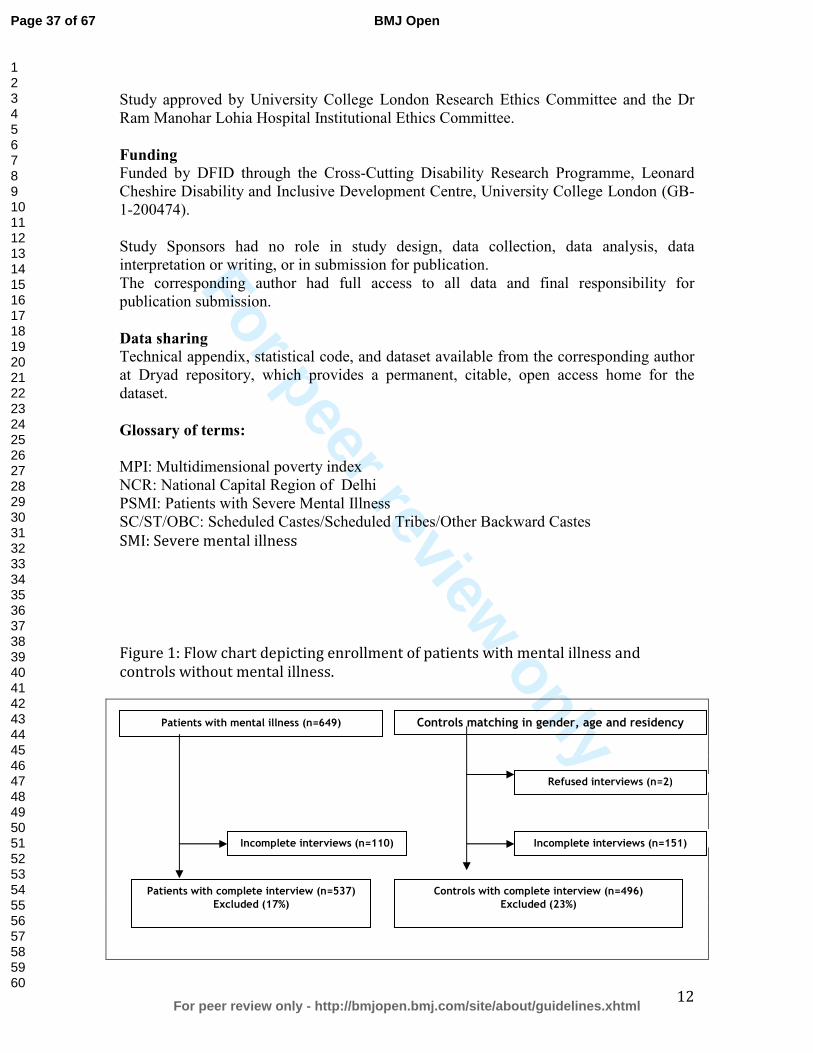
For peer review only
12
Study approved by University College London Research Ethics Committee and the Dr Ram Manohar Lohia Hospital Institutional Ethics Committee.
Funding
Funded by DFID through the Cross-Cutting Disability Research Programme, Leonard Cheshire Disability and Inclusive Development Centre, University College London (GB-1-200474). Study Sponsors had no role in study design, data collection, data analysis, data interpretation or writing, or in submission for publication. The corresponding author had full access to all data and final responsibility for publication submission.
Data sharing
Technical appendix, statistical code, and dataset available from the corresponding author at Dryad repository, which provides a permanent, citable, open access home for the dataset.
Glossary of terms:
MPI: Multidimensional poverty index NCR: National Capital Region of Delhi PSMI: Patients with Severe Mental Illness SC/ST/OBC: Scheduled Castes/Scheduled Tribes/Other Backward Castes
SMI: Severe mental illness
Figure 1: Flow chart depicting enrollment of patients with mental illness and
controls without mental illness.
Patients with mental illness (n=649) Controls matching in gender, age and residency (n=649)
Incomplete interviews (n=110)
Patients with complete interview (n=537)
Excluded (17%)
Controls with complete interview (n=496)
Excluded (23%)
Refused interviews (n=2)
Incomplete interviews (n=151)
Page 37 of 67
For peer review only - http://bmjopen.bmj.com/site/about/guidelines.xhtml
BMJ Open
123456789101112131415161718192021222324252627282930313233343536373839404142434445464748495051525354555657585960

For peer review only
13
Page 38 of 67
For peer review only - http://bmjopen.bmj.com/site/about/guidelines.xhtml
BMJ Open
123456789101112131415161718192021222324252627282930313233343536373839404142434445464748495051525354555657585960
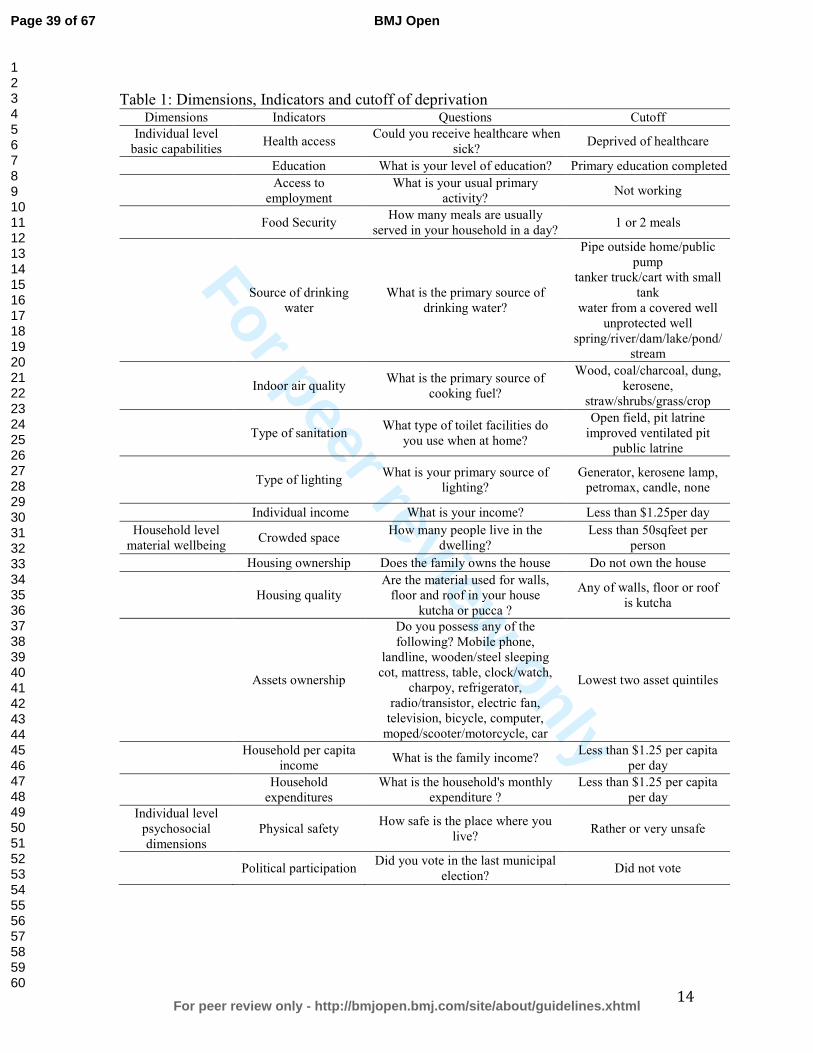
For peer review only
14
Table 1: Dimensions, Indicators and cutoff of deprivation Dimensions Indicators Questions Cutoff
Individual level basic capabilities
Health access Could you receive healthcare when
sick? Deprived of healthcare
Education What is your level of education? Primary education completed
Access to
employment What is your usual primary
activity? Not working
Food Security How many meals are usually
served in your household in a day? 1 or 2 meals
Source of drinking
water What is the primary source of
drinking water?
Pipe outside home/public pump
tanker truck/cart with small tank
water from a covered well unprotected well
spring/river/dam/lake/pond/stream
Indoor air quality What is the primary source of
cooking fuel?
Wood, coal/charcoal, dung, kerosene,
straw/shrubs/grass/crop
Type of sanitation What type of toilet facilities do
you use when at home?
Open field, pit latrine improved ventilated pit
public latrine
Type of lighting What is your primary source of
lighting? Generator, kerosene lamp,
petromax, candle, none
Individual income What is your income? Less than $1.25per day
Household level material wellbeing
Crowded space How many people live in the
dwelling? Less than 50sqfeet per
person
Housing ownership Does the family owns the house Do not own the house
Housing quality Are the material used for walls,
floor and roof in your house kutcha or pucca ?
Any of walls, floor or roof is kutcha
Assets ownership
Do you possess any of the following? Mobile phone,
landline, wooden/steel sleeping cot, mattress, table, clock/watch,
charpoy, refrigerator, radio/transistor, electric fan,
television, bicycle, computer, moped/scooter/motorcycle, car
Lowest two asset quintiles
Household per capita
income What is the family income?
Less than $1.25 per capita per day
Household
expenditures What is the household's monthly
expenditure ? Less than $1.25 per capita
per day
Individual level psychosocial dimensions
Physical safety How safe is the place where you
live? Rather or very unsafe
Political participation Did you vote in the last municipal
election? Did not vote
Page 39 of 67
For peer review only - http://bmjopen.bmj.com/site/about/guidelines.xhtml
BMJ Open
123456789101112131415161718192021222324252627282930313233343536373839404142434445464748495051525354555657585960
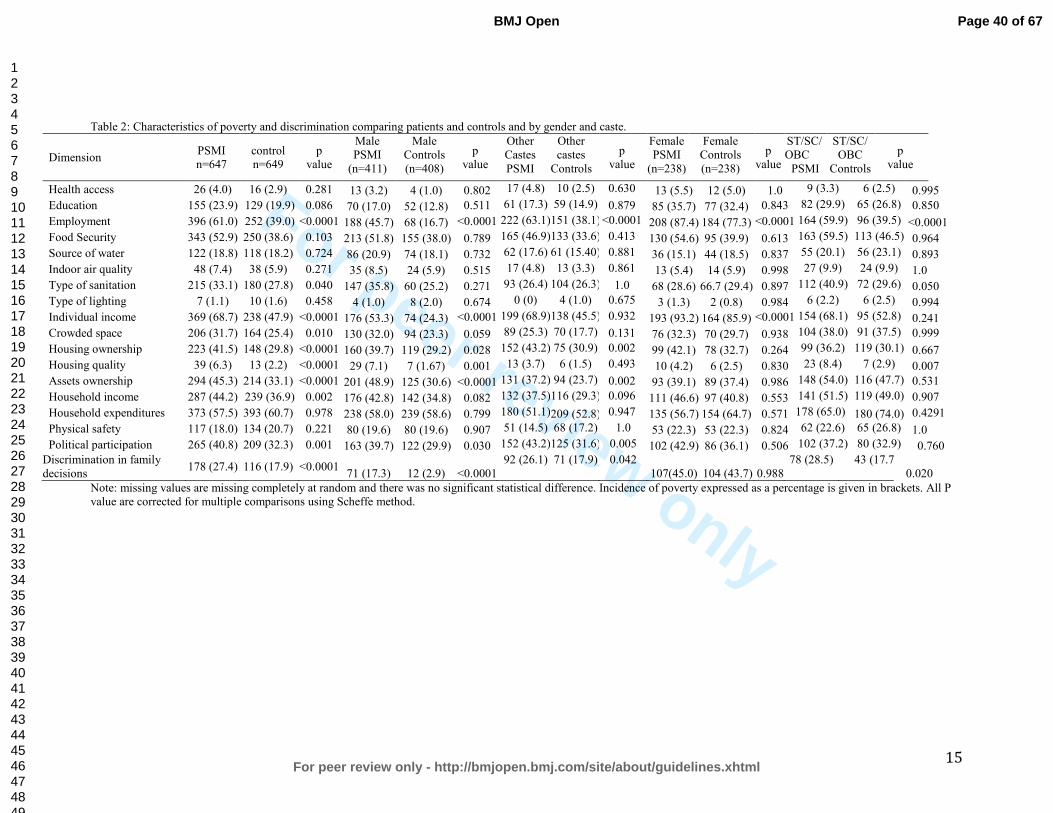
For peer review only
15
Table 2: Characteristics of poverty and discrimination comparing patients and controls and by gender and caste.
Dimension PSMI n=647
control n=649
p value
Male PSMI
(n=411)
Male Controls (n=408)
p value
Other Castes PSMI
Other castes
Controls
p value
Female PSMI
(n=238)
Female Controls (n=238)
p value
ST/SC/ OBC
PSMI
ST/SC/ OBC
Controls
p value
Health access 26 (4.0) 16 (2.9) 0.281 13 (3.2) 4 (1.0) 0.802 17 (4.8) 10 (2.5) 0.630 13 (5.5) 12 (5.0) 1.0 9 (3.3) 6 (2.5) 0.995
Education 155 (23.9) 129 (19.9) 0.086 70 (17.0) 52 (12.8) 0.511 61 (17.3) 59 (14.9) 0.879 85 (35.7) 77 (32.4) 0.843 82 (29.9) 65 (26.8) 0.850
Employment 396 (61.0) 252 (39.0) <0.0001 188 (45.7) 68 (16.7) <0.0001 222 (63.1)151 (38.1)<0.0001 208 (87.4) 184 (77.3) <0.0001 164 (59.9) 96 (39.5) <0.0001
Food Security 343 (52.9) 250 (38.6) 0.103 213 (51.8) 155 (38.0) 0.789 165 (46.9)133 (33.6) 0.413 130 (54.6) 95 (39.9) 0.613 163 (59.5) 113 (46.5) 0.964
Source of water 122 (18.8) 118 (18.2) 0.724 86 (20.9) 74 (18.1) 0.732 62 (17.6) 61 (15.40) 0.881 36 (15.1) 44 (18.5) 0.837 55 (20.1) 56 (23.1) 0.893
Indoor air quality 48 (7.4) 38 (5.9) 0.271 35 (8.5) 24 (5.9) 0.515 17 (4.8) 13 (3.3) 0.861 13 (5.4) 14 (5.9) 0.998 27 (9.9) 24 (9.9) 1.0
Type of sanitation 215 (33.1) 180 (27.8) 0.040 147 (35.8) 60 (25.2) 0.271 93 (26.4) 104 (26.3) 1.0 68 (28.6) 66.7 (29.4) 0.897 112 (40.9) 72 (29.6) 0.050
Type of lighting 7 (1.1) 10 (1.6) 0.458 4 (1.0) 8 (2.0) 0.674 0 (0) 4 (1.0) 0.675 3 (1.3) 2 (0.8) 0.984 6 (2.2) 6 (2.5) 0.994
Individual income 369 (68.7) 238 (47.9) <0.0001 176 (53.3) 74 (24.3) <0.0001 199 (68.9)138 (45.5) 0.932 193 (93.2) 164 (85.9) <0.0001 154 (68.1) 95 (52.8) 0.241
Crowded space 206 (31.7) 164 (25.4) 0.010 130 (32.0) 94 (23.3) 0.059 89 (25.3) 70 (17.7) 0.131 76 (32.3) 70 (29.7) 0.938 104 (38.0) 91 (37.5) 0.999
Housing ownership 223 (41.5) 148 (29.8) <0.0001 160 (39.7) 119 (29.2) 0.028 152 (43.2) 75 (30.9) 0.002 99 (42.1) 78 (32.7) 0.264 99 (36.2) 119 (30.1) 0.667
Housing quality 39 (6.3) 13 (2.2) <0.0001 29 (7.1) 7 (1.67) 0.001 13 (3.7) 6 (1.5) 0.493 10 (4.2) 6 (2.5) 0.830 23 (8.4) 7 (2.9) 0.007
Assets ownership 294 (45.3) 214 (33.1) <0.0001 201 (48.9) 125 (30.6) <0.0001 131 (37.2) 94 (23.7) 0.002 93 (39.1) 89 (37.4) 0.986 148 (54.0) 116 (47.7) 0.531
Household income 287 (44.2) 239 (36.9) 0.002 176 (42.8) 142 (34.8) 0.082 132 (37.5)116 (29.3) 0.096 111 (46.6) 97 (40.8) 0.553 141 (51.5) 119 (49.0) 0.907
Household expenditures 373 (57.5) 393 (60.7) 0.978 238 (58.0) 239 (58.6) 0.799 180 (51.1)209 (52.8) 0.947 135 (56.7) 154 (64.7) 0.571 178 (65.0) 180 (74.0) 0.4291
Physical safety 117 (18.0) 134 (20.7) 0.221 80 (19.6) 80 (19.6) 0.907 51 (14.5) 68 (17.2) 1.0 53 (22.3) 53 (22.3) 0.824 62 (22.6) 65 (26.8) 1.0
Political participation 265 (40.8) 209 (32.3) 0.001 163 (39.7) 122 (29.9) 0.030 152 (43.2)125 (31.6) 0.005 102 (42.9) 86 (36.1) 0.506 102 (37.2) 80 (32.9) 0.760 Discrimination in family decisions
178 (27.4) 116 (17.9) <0.0001 71 (17.3) 12 (2.9) <0.0001
92 (26.1) 71 (17.9) 0.042 107(45.0) 104 (43.7) 0.988
78 (28.5) 43 (17.7)0.020
Note: missing values are missing completely at random and there was no significant statistical difference. Incidence of poverty expressed as a percentage is given in brackets. All P value are corrected for multiple comparisons using Scheffe method.
Page 40 of 67
For peer review only - http://bmjopen.bmj.com/site/about/guidelines.xhtml
BMJ Open
123456789101112131415161718192021222324252627282930313233343536373839404142434445464748495051525354555657585960
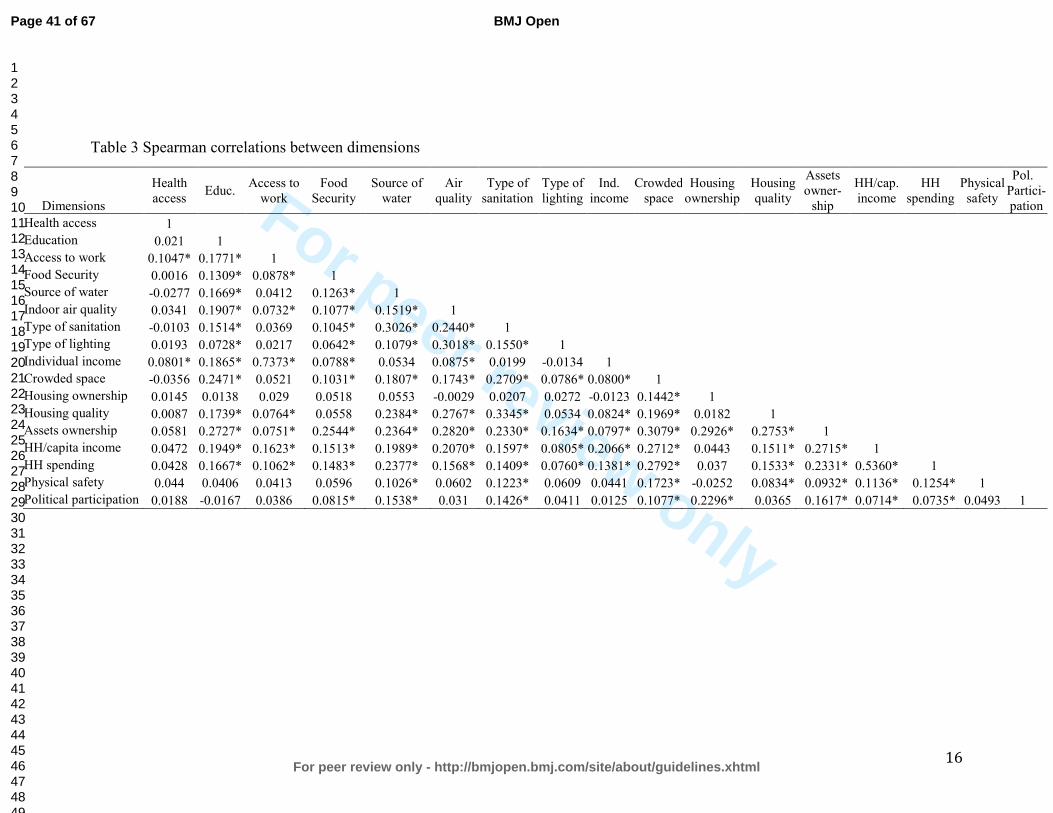
For peer review only
16
Table 3 Spearman correlations between dimensions
Dimensions
Health access
Educ. Access to
work Food
Security Source of
water Air
quality Type of
sanitation Type of lighting
Ind. income
Crowded space
Housing ownership
Housing quality
Assets owner-
ship
HH/cap. income
HH spending
Physical safety
Pol. Partici-pation
Health access 1
Education 0.021 1
Access to work 0.1047* 0.1771* 1
Food Security 0.0016 0.1309* 0.0878* 1
Source of water -0.0277 0.1669* 0.0412 0.1263* 1
Indoor air quality 0.0341 0.1907* 0.0732* 0.1077* 0.1519* 1
Type of sanitation -0.0103 0.1514* 0.0369 0.1045* 0.3026* 0.2440* 1
Type of lighting 0.0193 0.0728* 0.0217 0.0642* 0.1079* 0.3018* 0.1550* 1
Individual income 0.0801* 0.1865* 0.7373* 0.0788* 0.0534 0.0875* 0.0199 -0.0134 1
Crowded space -0.0356 0.2471* 0.0521 0.1031* 0.1807* 0.1743* 0.2709* 0.0786* 0.0800* 1
Housing ownership 0.0145 0.0138 0.029 0.0518 0.0553 -0.0029 0.0207 0.0272 -0.0123 0.1442* 1
Housing quality 0.0087 0.1739* 0.0764* 0.0558 0.2384* 0.2767* 0.3345* 0.0534 0.0824* 0.1969* 0.0182 1
Assets ownership 0.0581 0.2727* 0.0751* 0.2544* 0.2364* 0.2820* 0.2330* 0.1634* 0.0797* 0.3079* 0.2926* 0.2753* 1
HH/capita income 0.0472 0.1949* 0.1623* 0.1513* 0.1989* 0.2070* 0.1597* 0.0805* 0.2066* 0.2712* 0.0443 0.1511* 0.2715* 1
HH spending 0.0428 0.1667* 0.1062* 0.1483* 0.2377* 0.1568* 0.1409* 0.0760* 0.1381* 0.2792* 0.037 0.1533* 0.2331* 0.5360* 1
Physical safety 0.044 0.0406 0.0413 0.0596 0.1026* 0.0602 0.1223* 0.0609 0.0441 0.1723* -0.0252 0.0834* 0.0932* 0.1136* 0.1254* 1
Political participation 0.0188 -0.0167 0.0386 0.0815* 0.1538* 0.031 0.1426* 0.0411 0.0125 0.1077* 0.2296* 0.0365 0.1617* 0.0714* 0.0735* 0.0493 1
Page 41 of 67
For peer review only - http://bmjopen.bmj.com/site/about/guidelines.xhtml
BMJ Open
123456789101112131415161718192021222324252627282930313233343536373839404142434445464748495051525354555657585960
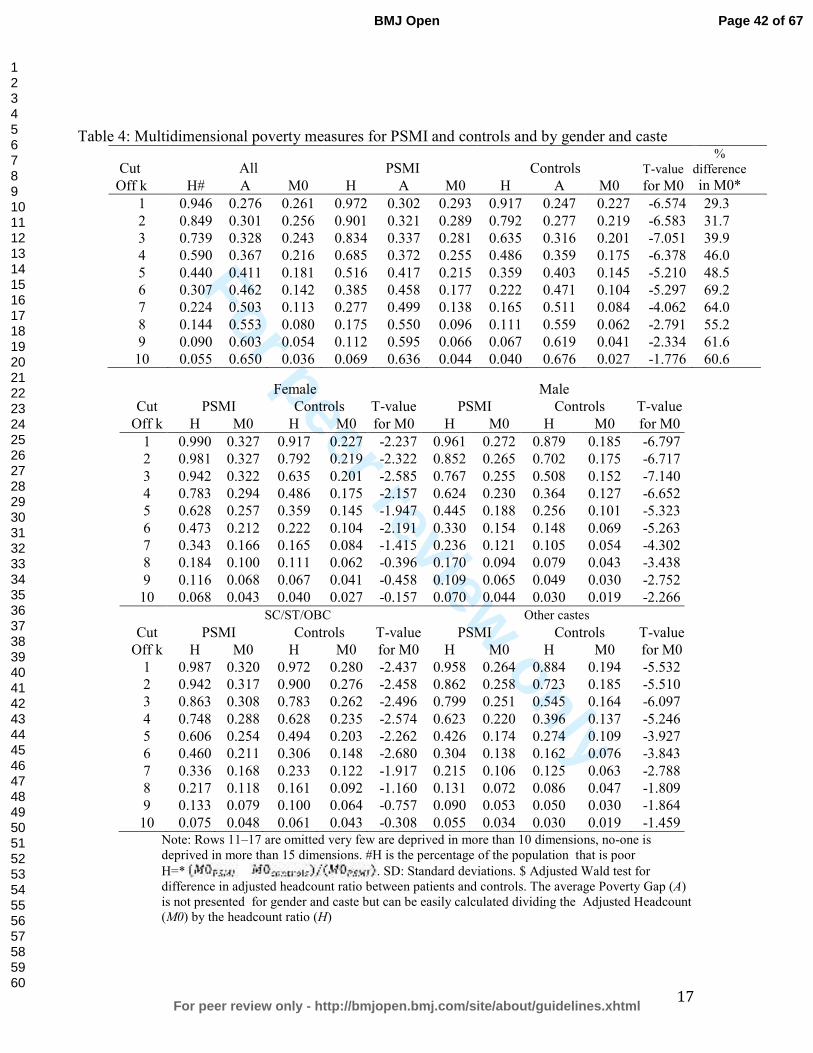
For peer review only
17
Table 4: Multidimensional poverty measures for PSMI and controls and by gender and caste
Cut All PSMI Controls T-value %
difference
Off k H# A M0 H A M0 H A M0 for M0 in M0*
1 0.946 0.276 0.261 0.972 0.302 0.293 0.917 0.247 0.227 -6.574 29.3
2 0.849 0.301 0.256 0.901 0.321 0.289 0.792 0.277 0.219 -6.583 31.7
3 0.739 0.328 0.243 0.834 0.337 0.281 0.635 0.316 0.201 -7.051 39.9
4 0.590 0.367 0.216 0.685 0.372 0.255 0.486 0.359 0.175 -6.378 46.0
5 0.440 0.411 0.181 0.516 0.417 0.215 0.359 0.403 0.145 -5.210 48.5
6 0.307 0.462 0.142 0.385 0.458 0.177 0.222 0.471 0.104 -5.297 69.2
7 0.224 0.503 0.113 0.277 0.499 0.138 0.165 0.511 0.084 -4.062 64.0
8 0.144 0.553 0.080 0.175 0.550 0.096 0.111 0.559 0.062 -2.791 55.2
9 0.090 0.603 0.054 0.112 0.595 0.066 0.067 0.619 0.041 -2.334 61.6
10 0.055 0.650 0.036 0.069 0.636 0.044 0.040 0.676 0.027 -1.776 60.6
Female Male
Cut PSMI Controls T-value PSMI Controls T-value
Off k H M0 H M0 for M0 H M0 H M0 for M0
1 0.990 0.327 0.917 0.227 -2.237 0.961 0.272 0.879 0.185 -6.797
2 0.981 0.327 0.792 0.219 -2.322 0.852 0.265 0.702 0.175 -6.717
3 0.942 0.322 0.635 0.201 -2.585 0.767 0.255 0.508 0.152 -7.140
4 0.783 0.294 0.486 0.175 -2.157 0.624 0.230 0.364 0.127 -6.652
5 0.628 0.257 0.359 0.145 -1.947 0.445 0.188 0.256 0.101 -5.323
6 0.473 0.212 0.222 0.104 -2.191 0.330 0.154 0.148 0.069 -5.263
7 0.343 0.166 0.165 0.084 -1.415 0.236 0.121 0.105 0.054 -4.302
8 0.184 0.100 0.111 0.062 -0.396 0.170 0.094 0.079 0.043 -3.438
9 0.116 0.068 0.067 0.041 -0.458 0.109 0.065 0.049 0.030 -2.752
10 0.068 0.043 0.040 0.027 -0.157 0.070 0.044 0.030 0.019 -2.266
SC/ST/OBC Other castes
Cut PSMI Controls T-value PSMI Controls T-value
Off k H M0 H M0 for M0 H M0 H M0 for M0
1 0.987 0.320 0.972 0.280 -2.437 0.958 0.264 0.884 0.194 -5.532
2 0.942 0.317 0.900 0.276 -2.458 0.862 0.258 0.723 0.185 -5.510
3 0.863 0.308 0.783 0.262 -2.496 0.799 0.251 0.545 0.164 -6.097
4 0.748 0.288 0.628 0.235 -2.574 0.623 0.220 0.396 0.137 -5.246
5 0.606 0.254 0.494 0.203 -2.262 0.426 0.174 0.274 0.109 -3.927
6 0.460 0.211 0.306 0.148 -2.680 0.304 0.138 0.162 0.076 -3.843
7 0.336 0.168 0.233 0.122 -1.917 0.215 0.106 0.125 0.063 -2.788
8 0.217 0.118 0.161 0.092 -1.160 0.131 0.072 0.086 0.047 -1.809
9 0.133 0.079 0.100 0.064 -0.757 0.090 0.053 0.050 0.030 -1.864
10 0.075 0.048 0.061 0.043 -0.308 0.055 0.034 0.030 0.019 -1.459 Note: Rows 11–17 are omitted very few are deprived in more than 10 dimensions, no-one is deprived in more than 15 dimensions. #H is the percentage of the population that is poor
H=* . SD: Standard deviations. $ Adjusted Wald test for difference in adjusted headcount ratio between patients and controls. The average Poverty Gap (A) is not presented for gender and caste but can be easily calculated dividing the Adjusted Headcount (M0) by the headcount ratio (H)
Page 42 of 67
For peer review only - http://bmjopen.bmj.com/site/about/guidelines.xhtml
BMJ Open
123456789101112131415161718192021222324252627282930313233343536373839404142434445464748495051525354555657585960
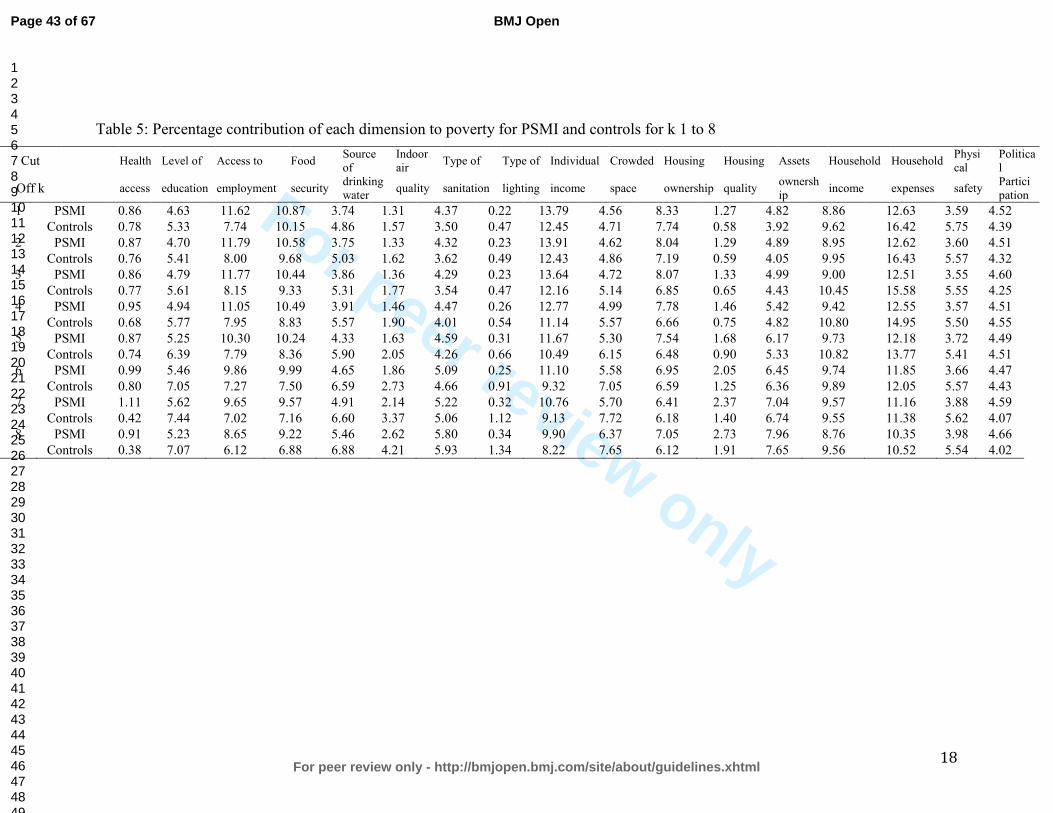
For peer review only
18
Table 5: Percentage contribution of each dimension to poverty for PSMI and controls for k 1 to 8
Cut Health Level of Access to Food Source of
Indoor air
Type of Type of Individual Crowded Housing Housing Assets Household Household Physical
Political
Off k access education employment security drinking water
quality sanitation lighting income space ownership quality ownership
income expenses safety Participation
1 PSMI 0.86 4.63 11.62 10.87 3.74 1.31 4.37 0.22 13.79 4.56 8.33 1.27 4.82 8.86 12.63 3.59 4.52
Controls 0.78 5.33 7.74 10.15 4.86 1.57 3.50 0.47 12.45 4.71 7.74 0.58 3.92 9.62 16.42 5.75 4.39
2 PSMI 0.87 4.70 11.79 10.58 3.75 1.33 4.32 0.23 13.91 4.62 8.04 1.29 4.89 8.95 12.62 3.60 4.51
Controls 0.76 5.41 8.00 9.68 5.03 1.62 3.62 0.49 12.43 4.86 7.19 0.59 4.05 9.95 16.43 5.57 4.32
3 PSMI 0.86 4.79 11.77 10.44 3.86 1.36 4.29 0.23 13.64 4.72 8.07 1.33 4.99 9.00 12.51 3.55 4.60
Controls 0.77 5.61 8.15 9.33 5.31 1.77 3.54 0.47 12.16 5.14 6.85 0.65 4.43 10.45 15.58 5.55 4.25
4 PSMI 0.95 4.94 11.05 10.49 3.91 1.46 4.47 0.26 12.77 4.99 7.78 1.46 5.42 9.42 12.55 3.57 4.51
Controls 0.68 5.77 7.95 8.83 5.57 1.90 4.01 0.54 11.14 5.57 6.66 0.75 4.82 10.80 14.95 5.50 4.55
5 PSMI 0.87 5.25 10.30 10.24 4.33 1.63 4.59 0.31 11.67 5.30 7.54 1.68 6.17 9.73 12.18 3.72 4.49
Controls 0.74 6.39 7.79 8.36 5.90 2.05 4.26 0.66 10.49 6.15 6.48 0.90 5.33 10.82 13.77 5.41 4.51
6 PSMI 0.99 5.46 9.86 9.99 4.65 1.86 5.09 0.25 11.10 5.58 6.95 2.05 6.45 9.74 11.85 3.66 4.47
Controls 0.80 7.05 7.27 7.50 6.59 2.73 4.66 0.91 9.32 7.05 6.59 1.25 6.36 9.89 12.05 5.57 4.43
7 PSMI 1.11 5.62 9.65 9.57 4.91 2.14 5.22 0.32 10.76 5.70 6.41 2.37 7.04 9.57 11.16 3.88 4.59
Controls 0.42 7.44 7.02 7.16 6.60 3.37 5.06 1.12 9.13 7.72 6.18 1.40 6.74 9.55 11.38 5.62 4.07
8 PSMI 0.91 5.23 8.65 9.22 5.46 2.62 5.80 0.34 9.90 6.37 7.05 2.73 7.96 8.76 10.35 3.98 4.66
Controls 0.38 7.07 6.12 6.88 6.88 4.21 5.93 1.34 8.22 7.65 6.12 1.91 7.65 9.56 10.52 5.54 4.02
Page 43 of 67
For peer review only - http://bmjopen.bmj.com/site/about/guidelines.xhtml
BMJ Open
123456789101112131415161718192021222324252627282930313233343536373839404142434445464748495051525354555657585960

For peer review only
19
Table 6: Logistic model for association between multidimensional poverty, stigma and SMI
Unadjusted Model Adjusted Model OR (95%CI) OR (95%CI)
Family participation (no participation) 2.92 2.16-3.93 2.61 1.27-5.31 SMI (Controls) 2.20 1.67-2.89 2.07 1.25-3.41 Female (Male) 2.17 1.65-2.83 1.88 1.36-2.58 SC/ST/OBC (Higher caste) 2.06 1.56-2.70 2.39 1.39-4.08 Age (in year) 0.99 0.97-0.99 0.98 0.96-0.99 Interaction terms No participation*SMI (Participation*controls) 6.38 3.49-11.6 No participation*SC/ST/OBC (Participation*high caste) 4.86 2.19-10.7 No participation*women (Participation*men) 4.63 2.60-8.21 No participation*women*SMI (Participation*male*controls) 9.62 5.58-16.5 No participation*SC/ST/OBC*SMI(Participation*high caste*controls) 7.36 3.94-13.7
Page 44 of 67
For peer review only - http://bmjopen.bmj.com/site/about/guidelines.xhtml
BMJ Open
123456789101112131415161718192021222324252627282930313233343536373839404142434445464748495051525354555657585960
For peer review only
20
References
1. Lozano R, Naghavi M, Foreman K, et al. Global and regional mortality from
235 causes of death for 20 age groups in 1990 and 2010: a systematic
analysis for the Global Burden of Disease Study 2010. The Lancet
2012;380(9859):2095-2128.
2. World Health Organization. Mental health and development: Targeting people
with mental health conditions as a vulnerable group 2010.
3. Vos T, Flaxman AD, Naghavi M, et al. Years lived with disability (YLDs) for
1160 sequelae of 289 diseases and injuries 1990?2010: a systematic analysis
for the Global Burden of Disease Study 2010. The Lancet
2012;380(9859):2163-2196.
4. Whiteford HA, Degenhardt L, Rehm J, et al. Global burden of disease
attributable to mental and substance use disorders: findings from the Global
Burden of Disease Study 2010. The Lancet 2013.
5. Kleinman A, Hall-Clifford R. Stigma: A social, cultural and moral process.
Journal of Epidemiology Community Health 2009;63(6):418-419.
6. Boyce W, Raja S, Patranabish R, Bekoe T, Deme-der D, Gallupe O. Occupation,
poverty and mental health improvement in Ghana. ALTER European Journal
of Disability Research 2009;3:233-244.
7. Elwan A. Poverty and disability: A survey of the literature. Washington, DC:
Social Protection Advisory Service; 1999.
8. Groce N, Kett M, Lang R, Trani J-F. Disability and Poverty: the need for a more
nuanced understanding of implications for development policy and practice.
Third World Quarterly 2011 2011;32(8):1493-1513.
9. Skeen S, Lund C, Kleintjes S, Flisher A, Consortium MHRP. Meeting the
Millennium Development Goals in Sub-Saharan Africa: What about mental
health? International Review of Psychiatry 2010 2010;22(6):624-631.
10. Brohan E, Clement S, Rose D, Sartorius N, Slade M, Thornicroft G.
Development and psychometric evaluation of the Discrimination and Stigma
Scale (DISC). Psychiatry Research 2013;208(1):33-40.
11. Draine J. Mental health, mental illnesses, poverty, justice, and social justice.
American Journal of Psychiatric Rehabilitation 2013;16(2):87-90.
12. Fone D, Greene G, Farewell D, White J, Kelly M, Dunstan F. Common mental
disorders, neighbourhood income inequality and income deprivation: Small-
area multilevel analysis. British Journal of Psychiatry 2013;202(4):286-293.
13. Li N, Pang L, Du W, Chen G, Zheng X. Association between poverty and
psychiatric disability among Chinese population aged 15-64 years. Psychiatry
Research 2012;200(2-3):917-920.
14. Chatterjee P. Economic crisis highlights mental health issues in India. Lancet
2009;373(9670):1160-1161.
15. Kuruvilla A, Jacob KS. Poverty, social stress & mental health. Indian Journal of
Medical Research Oct 2007;126(4):273-278.
16. Das J, Do QT, Friedman J, McKenzie D, Scott K. Mental health and poverty in
developing countries: Revisiting the relationship. Social Science & Medicine
Aug 2007;65(3):467-480.
Page 45 of 67
For peer review only - http://bmjopen.bmj.com/site/about/guidelines.xhtml
BMJ Open
123456789101112131415161718192021222324252627282930313233343536373839404142434445464748495051525354555657585960
For peer review only
21
17. de Menil V, Osei A, Douptcheva N, Hill AG, Yaro P, De-Graft Aikins A.
Symptoms of common mental disorders and their correlates among women
in Accra, Ghana: a population-based survey. Ghana medical journal
2012;46(2):95-103.
18. Link BG, Phelan JC. Conceptualizing stigma. Annual Review of Sociology 2001
2001;27:363-385.
19. Thornicroft G, Rose D, Kassam A, Sartorius N. Stigma: Ignorance, prejudice or
discrimination? British Journal of Psychiatry 2007;190(MAR.):192-193.
20. Ilic M, Reinecke J, Bohner G, Röttgers HO, Beblo T, Driessen M, Frommberger
U, Corrigan PW. Belittled, Avoided, Ignored, Denied: Assessing Forms and
Consequences of Stigma Experiences of People With Mental Illness. Basic and
Applied Social Psychology 2013;35(1):31-40.
21. Wing JK, Agrawal N. Concepts and classification of schizophrenia. In: Hirsch
SR, Weinberger DR, eds. Schizophrenia. Oxford: Wiley-Blackwell; 2003:3-15.
22. Corrigan PW, Markowitz FE, Watson AC. Structural levels of mental illness
stigma and discrimination. Schizophrenia Bulletin 2004;30(3):481-491.
23. Link BG, Struening EL, Neese-Todd S, Asmussen S, Phelan JC. The
consequences of stigma for the self-esteem of people with mental illnesses.
Psychiatric Services Dec 2001;52(12):1621-1626.
24. Watson AC, Corrigan P, Larson JE, Sells M. Self-stigma in people with mental
illness. Schizophrenia Bulletin 2007;33(6):1312-1318.
25. Rüsch N, Angermeyer MC, Corrigan PW. Mental illness stigma: Concepts,
consequences, and initiatives to reduce stigma. European Psychiatry
2005;20(8):529-539.
26. Wahl OF. Stigma as a barrier to recovery from mental illness. Trends in
Cognitive Sciences 2012;16(1):9-10.
27. Link BG, Phelan JC. Stigma and its public health implications. Lancet Feb 11
2006;367(9509):528-529.
28. Link BG, Yang LH, Phelan JC, Collins PY. Measuring mental illness stigma.
Schizophrenia Bulletin 2004 2004;30(3):511-541.
29. Hatzenbuehler ML, Phelan JC, Link BG. Stigma as a fundamental cause of
population health inequalities. American Journal of Public Health
2013;103(5):813-821.
30. Crabb J, Stewart RC, Kokota D, Masson N, Chabunya S, Krishnadas R.
Attitudes towards mental illness in Malawi: A cross-sectional survey. BMC
Public Health 2012;12(1).
31. Gureje O, Lasebikan VO, Ephraim-Oluwanuga O, Olley BO, Kola L. Community
study of knowledge of and attitude to mental illness in Nigeria. British Journal
of Psychiatry 2005;186(MAY):436-441.
32. Jadhav S., Littlewood R., Ryder A.G., Chakraborty A., Jain S., Barua M.
Stigmatization of severe mental illness in India: Against the simple
industrialization hypothesis. Indian Journal of Psychiatry 2007;49(3):189-
194.
33. Ngui E, Khasakhala A, Ndetei D, Weiss Roberts L. Mental disorders, health
inequalities and ethics: A global perspective. International Review of
Psychiatry 2010;22(3):235-244.
Page 46 of 67
For peer review only - http://bmjopen.bmj.com/site/about/guidelines.xhtml
BMJ Open
123456789101112131415161718192021222324252627282930313233343536373839404142434445464748495051525354555657585960
For peer review only
22
34. Ssebunnya J, Kigozi F, Lund C, Kizza D, Okello E. Stakeholder perceptions of
mental health stigma and poverty in Uganda. Bmc International Health and
Human Rights 2009;9(1):5.
35. Phelan JC. Genetic bases of mental illness - A cure for stigma? Trends in
Neurosciences 2002;25(8):430-431.
36. Khandelwal SK, Pattanayak RD. Fight against Stigma. In: Chavan BS, Gupta N,
Arun P, Sidana AK, Jadhav S, eds. Comprehensive Textbook on Community
Psychiatry in India. Delhi: Jaypee Brothers; 2012:334-344.
37. Alkire S, Foster J. Counting and multidimensional poverty measurement.
Journal of Public Economics 2011;95(7-8):476.
38. World Health Organization. ICD-10 Classification Of Mental And Behavioral
Disorders: Clinical Descriptions And Diagnostic Guidelines. Geneva: World
Health Organisation; 1992.
39. Dupont WD, Plummer Jr WD. Power and sample size calculations. A review
and computer program. Controlled Clinical Trials 1990;11(2):116-128.
40. DeVellis RF. Scale development: Theory and applications Vol 26. Thousand
Oaks: Sage; 2012.
41. Sen AK. Capabilities, lists, and public reason: Continuing the conversation.
Feminist Economics 2004;10((3)):77-80.
42. Ravallion M, Chen S, Sangraula P. Dollar a day revisited. World Bank Economic
Review 2009;23(2):163-184.
43. Shrivastava A, Johnston M, Thakar M, Shrivastava S, Sarkhel G, Sunita I, Shah
N, Parkar S. Origin and Impact of Stigma and Discrimination in Schizophrenia
- Patients’ Perception: Mumbai Study. Stigma Research and Action
2011;1(1):67-72.
44. Loganathan S, Murthy RS. Living with schizophrenia in India: Gender
perspectives. Transcultural Psychiatry 2011;48(5):569-584.
45. Corrigan PW, Miller FE. Shame, blame, and contamination: A review of the
impact of mental illness stigma on family members. Journal of Mental Health
2004;13(6):537-548.
46. Karnieli-Miller O, Perlick DA, Nelson A, Mattias K, Corrigan P, Roe D. Family
members' of persons living with a serious mental illness: Experiences and
efforts to cope with stigma. Journal of Mental Health 2013;22(3):254-262.
47. Larson JE, Corrigan P. The stigma of families with mental illness. Academic
Psychiatry 2008;32(2):87-91.
48. Alkire S, Foster J. Counting and multidimensional poverty measurement.
Journal of Public Economics Aug 2011;95(7-8):476-487.
49. Bruckner T, Catalano RA. Economic Antecedents of Sudden Infant Death
Syndrome. Annals of Epidemiology 2006;16(6):415-422.
50. Eskenazi B, Marks AR, Catalano R, Bruckner T, Toniolo PG. Low birthweight
in New York city and upstate New York following the events of September
11th. Human Reproduction 2007;22(11):3013-3020.
51. Planning Commission. Poverty estimates for social groups: 2004-05 and
2011-12. New Delhi; 2013.
Page 47 of 67
For peer review only - http://bmjopen.bmj.com/site/about/guidelines.xhtml
BMJ Open
123456789101112131415161718192021222324252627282930313233343536373839404142434445464748495051525354555657585960

For peer review only
23
52. Olinto P, Beegle K, Sobrado C, Uematsu H. The State of the Poor: Where Are
The Poor, Where Is Extreme Poverty Harder to End, and What Is the Current
Profile of the World’s Poor? Economic Premise 2013;125:1-8.
53. Kohler Riessman C. Stigma and Everyday Resistance Practices: Childless
Women in South India. Gender and Society 2000;14(1):111-135.
54. Jaspal R. Caste, social stigma and identity processes. Psychology and
Developing Societies 2011;23(1):27-62.
55. Biemer PP, ed. Measurement Errors in Surveys. New York: John Wiley and
Sons; 1991.
56. Biemer PP, Lyberg LE. Introduction to survey quality. Hoboken: John Wiley &
Sons; 2003.
57. Das J, Das RK, Das V. The mental health gender-gap in urban India: Patterns
and narratives. Social Science and Medicine 2012;75(9):1660-1672.
58. Das J, Quy-Toan Do Q, Friedman J, McKenzie D, Scott K. Mental Health and
Poverty in Developing Countries: Revisiting the Relationship. Social Science
and Medicine 2007;65:467-480.
59. Thara R, Kamath S, Kumar S. Women with schizophrenia and broken
marriages - Doubly disadvantaged? Part I: Patient perspective. International
Journal of Social Psychiatry 2003;49(3):225-232.
60. Human Rights Watch. “Treated Worse than Animals”. Abuses against Women
and Girls with Psychosocial or Intellectual Disabilities in Institutions in India
Human Rights Watch; 2014.
61. Jeffrey C, Jeffery P, Jeffery R. Reproducing difference? Schooling, jobs, and
empowerment in Uttar Pradesh, India. World Development
2005;33(12):2085-2101.
62. Kijima Y. Caste and tribe inequality: Evidence from India, 1983-1999.
Economic Development and Cultural Change 2006;54(2):369-404.
63. Corrigan PW, Larson JE, Rüsch N. Self-stigma and the "why try" effect: Impact
on life goals and evidence-based practices. World Psychiatry 2009;8(2):75-
81.
64. Thara R, Kamath S, Kumar S. Women with schizophrenia and broken
marriages - Doubly disadvantaged? Part II: Family perspective. International
Journal of Social Psychiatry 2003;49(3):233-240.
65. Brady N, McCain GC. Living with schizophrenia: a family perspective. Online
journal of issues in nursing [electronic resource] 2005;10(1):7.
66. Lee S, Lee MTY, Chiu MYL, Kleinman A. Experience of social stigma by people
with schizophrenia in Hong Kong. British Journal of Psychiatry
2005;186(FEB.):153-157.
67. Yang LH, Purdie-Vaughns V, Kotabe H, Link BG, Saw A, Wong G, Phelan JC.
Culture, threat, and mental illness stigma: Identifying culture-specific threat
among Chinese-American groups. Social Science and Medicine 2013;88:56-67.
68. Yang LH, Pearson VJ. Understanding families in their own context:
Schizophrenia and structural family therapy in Beijing. Journal of Family
Therapy 2002;24(3):233-257.
Page 48 of 67
For peer review only - http://bmjopen.bmj.com/site/about/guidelines.xhtml
BMJ Open
123456789101112131415161718192021222324252627282930313233343536373839404142434445464748495051525354555657585960
For peer review only
24
69. Link BG, Cullen F, Frank J, Wozniak JF. The social rejection of former mental
patients: understanding why labels matter. American Journal of Sociology
1987;92(6):1461–1500.
70. Murali V, Oyebode F. Poverty, social inequality and mental health. Advances
in Psychiatric Treatment 2004;10(3):216-224.
Page 49 of 67
For peer review only - http://bmjopen.bmj.com/site/about/guidelines.xhtml
BMJ Open
123456789101112131415161718192021222324252627282930313233343536373839404142434445464748495051525354555657585960
For peer review only
25
i For vegan individuals, the diet staple included at least dal on a daily basis; for non-vegan individuals,
it included dairy products on a daily basis. Meat for non-vegetarian individuals was not considered as
a diet requirement and therefore deprivation of meat is not an indicator of poor diet. ii Assets include: Landline, mobile phones, wooden/steel sleeping cot, mattress, table, clock/watch,
charpoy, refrigerator, radio/transistor, electric fan, television, bicycle, computer,
moped/scooter/motorcycle, car.
iii Expenditures include: Food, health, school, transportation, savings and personal care products.
Page 50 of 67
For peer review only - http://bmjopen.bmj.com/site/about/guidelines.xhtml
BMJ Open
123456789101112131415161718192021222324252627282930313233343536373839404142434445464748495051525354555657585960
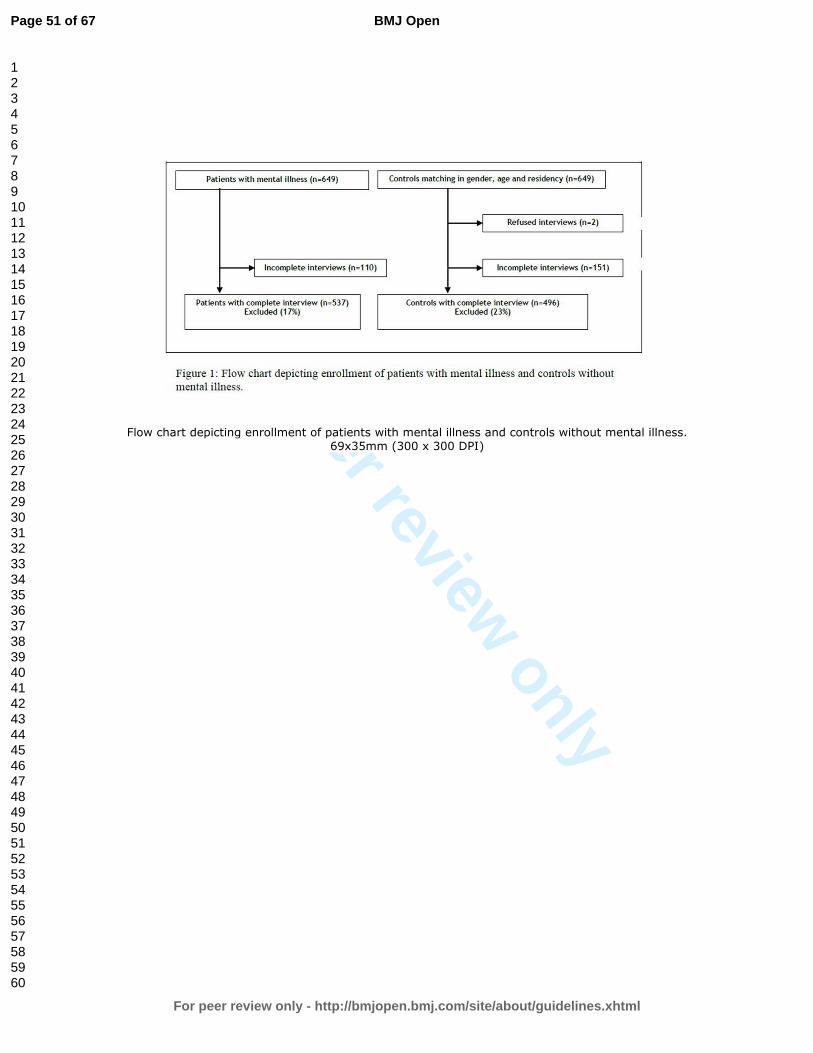
For peer review only
Flow chart depicting enrollment of patients with mental illness and controls without mental illness. 69x35mm (300 x 300 DPI)
Page 51 of 67
For peer review only - http://bmjopen.bmj.com/site/about/guidelines.xhtml
BMJ Open
123456789101112131415161718192021222324252627282930313233343536373839404142434445464748495051525354555657585960

For peer review only
1
STROBE Statement—Checklist of items that should be included in reports of case-control studies
Item
No
Recommendation
Where this is to be
found in our
submitted paper
Title and abstract 1 (a) Indicate the study’s design with a commonly used term in
the title or the abstract
See title and abstract
under ‘Design’ p.1
(b) Provide in the abstract an informative and balanced
summary of what was done and what was found
See abstract under
‘Results’ p.1
Introduction
Background/rationale 2 Explain the scientific background and rationale for the
investigation being reported
See ‘introduction’ pp.
1&2
Objectives 3 State specific objectives, including any prespecified hypotheses See ‘introduction’ p 2
Methods
Study design 4 Present key elements of study design early in the paper See ‘Study design and
setting’ p.3
Setting 5 Describe the setting, locations, and relevant dates, including
periods of recruitment, exposure, follow-up, and data collection
See ‘Study design and
setting’ p.3
Participants 6 (a) Give the eligibility criteria, and the sources and methods of
case ascertainment and control selection. Give the rationale for
the choice of cases and controls
See ‘Participants’ p.3
(b) For matched studies, give matching criteria and the number
of controls per case
See ‘Participants’ p.3
Variables 7 Clearly define all outcomes, exposures, predictors, potential
confounders, and effect modifiers. Give diagnostic criteria, if
applicable
See ‘Variables’ p.3
Data sources/
measurement
8* For each variable of interest, give sources of data and details of
methods of assessment (measurement). Describe comparability
of assessment methods if there is more than one group
See ‘Data sources’ p.4
Bias 9 Describe any efforts to address potential sources of bias See ‘Efforts to
minimize bias’ p.4
Study size 10 Explain how the study size was arrived at See ‘Sample size’ p.4
Quantitative variables 11 Explain how quantitative variables were handled in the
analyses. If applicable, describe which groupings were chosen
and why
See’ Quantitative
variables’ p.4
Statistical methods 12 (a) Describe all statistical methods, including those used to
control for confounding
See ‘Statistical
methods’ p. 5
(b) Describe any methods used to examine subgroups and
interactions
(c) Explain how missing data were addressed
(d) If applicable, explain how matching of cases and controls
was addressed
(e) Describe any sensitivity analyses
Results
Participants 13* (a) Report numbers of individuals at each stage of study—eg
numbers potentially eligible, examined for eligibility, confirmed
eligible, included in the study, completing follow-up, and
See ‘Participants’
p. 6
Page 52 of 67
For peer review only - http://bmjopen.bmj.com/site/about/guidelines.xhtml
BMJ Open
123456789101112131415161718192021222324252627282930313233343536373839404142434445464748495051525354555657585960
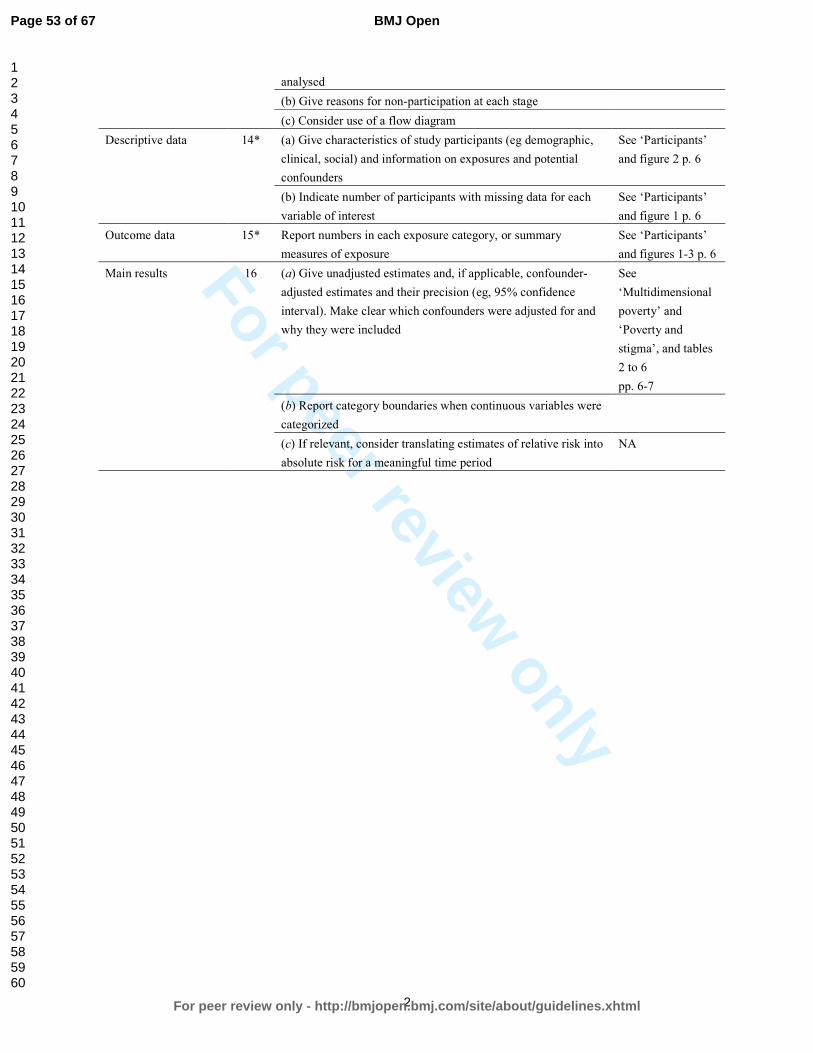
For peer review only
2
analysed
(b) Give reasons for non-participation at each stage
(c) Consider use of a flow diagram
Descriptive data 14* (a) Give characteristics of study participants (eg demographic,
clinical, social) and information on exposures and potential
confounders
See ‘Participants’
and figure 2 p. 6
(b) Indicate number of participants with missing data for each
variable of interest
See ‘Participants’
and figure 1 p. 6
Outcome data 15* Report numbers in each exposure category, or summary
measures of exposure
See ‘Participants’
and figures 1-3 p. 6
Main results 16 (a) Give unadjusted estimates and, if applicable, confounder-
adjusted estimates and their precision (eg, 95% confidence
interval). Make clear which confounders were adjusted for and
why they were included
See
‘Multidimensional
poverty’ and
‘Poverty and
stigma’, and tables
2 to 6
pp. 6-7
(b) Report category boundaries when continuous variables were
categorized
(c) If relevant, consider translating estimates of relative risk into
absolute risk for a meaningful time period
NA
Page 53 of 67
For peer review only - http://bmjopen.bmj.com/site/about/guidelines.xhtml
BMJ Open
123456789101112131415161718192021222324252627282930313233343536373839404142434445464748495051525354555657585960

For peer review only
3
Other analyses 17 Report other analyses done—eg analyses of subgroups and interactions, and sensitivity analyses
Discussion
Key results 18 Summarise key results with reference to study objectives
Limitations 19 Discuss limitations of the study, taking into account sources of potential bias or imprecision.
Discuss both direction and magnitude of any potential bias
Interpretation 20 Give a cautious overall interpretation of results considering objectives, limitations, multiplicity
of analyses, results from similar studies, and other relevant evidence
Generalisability 21 Discuss the generalisability (external validity) of the study results
Other information
Funding 22 Give the source of funding and the role of the funders for the present study and, if applicable,
for the original study on which the present article is based
*Give information separately for cases and controls.
Note: An Explanation and Elaboration article discusses each checklist item and gives methodological background and
published examples of transparent reporting. The STROBE checklist is best used in conjunction with this article (freely
available on the Web sites of PLoS Medicine at http://www.plosmedicine.org/, Annals of Internal Medicine at
http://www.annals.org/, and Epidemiology at http://www.epidem.com/). Information on the STROBE Initiative is
available at http://www.strobe-statement.org.
Page 54 of 67
For peer review only - http://bmjopen.bmj.com/site/about/guidelines.xhtml
BMJ Open
123456789101112131415161718192021222324252627282930313233343536373839404142434445464748495051525354555657585960

For peer review only
To The Editor
Ref: Our manuscript “Association between Mental illness, poverty and
stigma in India: A case control study ”
Response to reviewer’s comments.
Dear Editor,
Please find enclosed the revised version of our paper, entitled “Association
between Mental illness, poverty and stigma in India: A case control study ”
Thank you for giving us the opportunity to resubmit a revised manuscript to
British Medical Journal Open.
We are grateful for the positive comments of the reviewers. Indeed we
agree with them that this is an area, which needs a lot more research.
We addressed extensively all comments for improving the manuscript. Yet,
changes in the paper itself were necessarily brief due to word limits. If the
panel deems it necessary we can provide more details about methodology
in an online appendix.
In particular, we simplified tables, revised the methodology section for the
selection process of controls, and shortened the discussion.
Please find below after the reviewer’s comment our answers and then the
part of the manuscript with modified text in yellow highlights. We
extensively changed the discussion section as requested but it was too
large to include it in response to comments.
Thank you for considering our paper for possible publication in BMJO.
Yours Sincerely,
Jean-Francois Trani
Corresponding author
Page 55 of 67
For peer review only - http://bmjopen.bmj.com/site/about/guidelines.xhtml
BMJ Open
123456789101112131415161718192021222324252627282930313233343536373839404142434445464748495051525354555657585960

For peer review only
Reviewer(s)' Comments to Author:
Reviewer Name R PADMAVATI
Institution and Country SCHIZOPHRENIA RESEARCH FOUNDATION
R/7A NORTH MAIN ROAD
ANNA NAGAR WEST EXTENSION
CHENNAI 600101
TAMILNADU, INDIA
Please state any competing interests or state ‘None declared’: NONE
DECLARED
General comment
The selection of the control group need more elaboration
The results could be better presented, especially the Tables
Discussions need to be made more succinct
Response to general comments
We are thankful to reviewer for these pointers. In the revised version of
the manuscript, we have addressed these general comments. We have
further elaborated on the selection of the control group as explained in
detail in response to comment 2 (para 2 of ‘participants’ in methods,
copied below). We have simplified the Tables and shortened the discussion.
‘We used a non-psychiatrically ill control group composed of randomly selected
individuals matching the patients according to gender, age (plus or minus 5 years) and
neighbourhood of residence. Matched controls were selected by spinning a pointer at the
door of the case’s home and randomly selecting one household among 30 in the pointed
direction. In this household a person of same age and gender with no reported history of a
mental health disorder was interviewed. It was not possible to conduct detailed
interviews (for diagnosis) of all controls due to logistics as well as stigma of
revealing mental illness. We excluded controls when unable to obtain consent. Only
two case patients were not matched. Investigators together with the team manager
contributed to sensitisation and awareness raising in the neighbourhoods of interest to
maximise controls’ participation rates. Due to logistics as well as stigma towards mental
illness, it was not possible to psychiatrically examine all controls.’
Page 56 of 67
For peer review only - http://bmjopen.bmj.com/site/about/guidelines.xhtml
BMJ Open
123456789101112131415161718192021222324252627282930313233343536373839404142434445464748495051525354555657585960
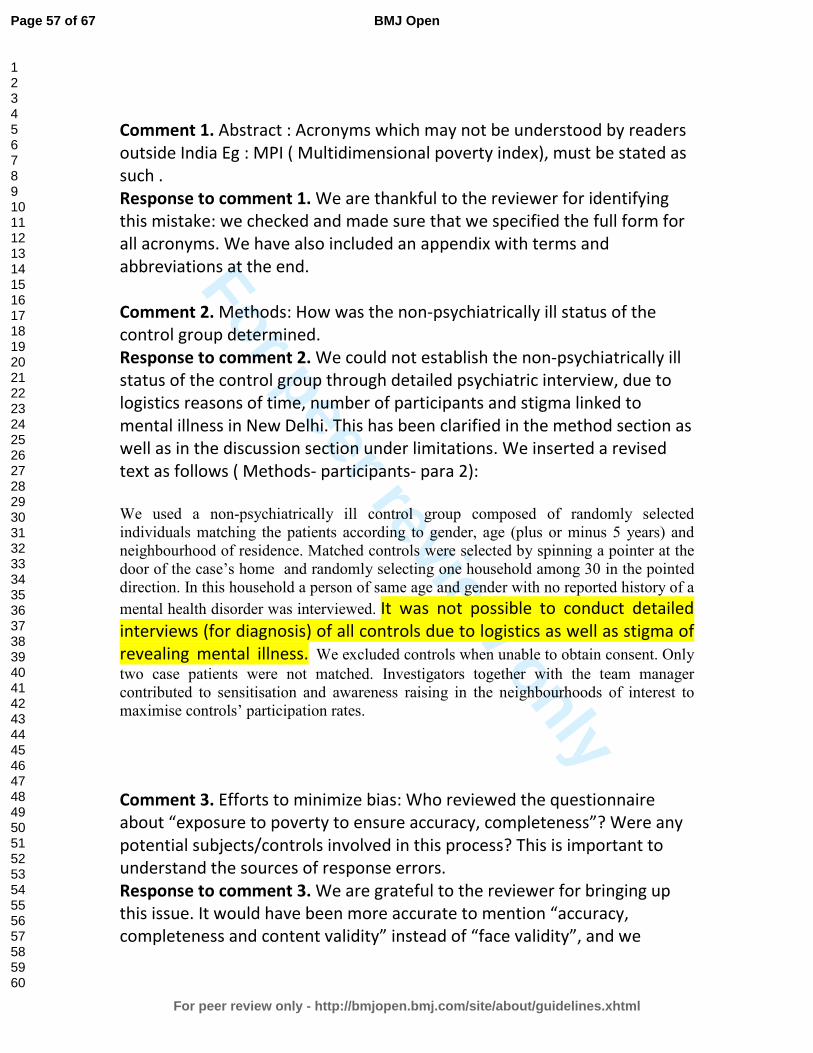
For peer review only
Comment 1. Abstract : Acronyms which may not be understood by readers
outside India Eg : MPI ( Multidimensional poverty index), must be stated as
such .
Response to comment 1. We are thankful to the reviewer for identifying
this mistake: we checked and made sure that we specified the full form for
all acronyms. We have also included an appendix with terms and
abbreviations at the end.
Comment 2. Methods: How was the non-psychiatrically ill status of the
control group determined.
Response to comment 2. We could not establish the non-psychiatrically ill
status of the control group through detailed psychiatric interview, due to
logistics reasons of time, number of participants and stigma linked to
mental illness in New Delhi. This has been clarified in the method section as
well as in the discussion section under limitations. We inserted a revised
text as follows ( Methods- participants- para 2):
We used a non-psychiatrically ill control group composed of randomly selected
individuals matching the patients according to gender, age (plus or minus 5 years) and
neighbourhood of residence. Matched controls were selected by spinning a pointer at the
door of the case’s home and randomly selecting one household among 30 in the pointed
direction. In this household a person of same age and gender with no reported history of a
mental health disorder was interviewed. It was not possible to conduct detailed
interviews (for diagnosis) of all controls due to logistics as well as stigma of
revealing mental illness. We excluded controls when unable to obtain consent. Only
two case patients were not matched. Investigators together with the team manager
contributed to sensitisation and awareness raising in the neighbourhoods of interest to
maximise controls’ participation rates.
Comment 3. Efforts to minimize bias: Who reviewed the questionnaire
about “exposure to poverty to ensure accuracy, completeness”? Were any
potential subjects/controls involved in this process? This is important to
understand the sources of response errors.
Response to comment 3. We are grateful to the reviewer for bringing up
this issue. It would have been more accurate to mention “accuracy,
completeness and content validity” instead of “face validity”, and we
Page 57 of 67
For peer review only - http://bmjopen.bmj.com/site/about/guidelines.xhtml
BMJ Open
123456789101112131415161718192021222324252627282930313233343536373839404142434445464748495051525354555657585960

For peer review only
modified the manuscript accordingly ( see “Efforts to minimize bias page 4
in methods section):
‘New patients were first interviewed by a junior psychiatrist who made a provisional
diagnosis and discussed details with a board of certified psychiatrist who then diagnosed
and managed the case. To minimise diagnosis bias, we trained all psychiatrists on the
ICD 10 criteria. Information bias was minimised by reviewing the questionnaire about
exposure to poverty to ensure accuracy, completeness and content validity with experts
from the department and by testing it with a sample group of patients and families.
Suggestions from the latter were incorporated’.
.’
We address the reviewer’s concerns in greater detail below. This
explanation was not included in the manuscript for obvious reasons of
word limit. To test the poverty questionnaire for accuracy, completeness
and content validity, investigators in New Delhi and at University College
London revised the content for relevance to poverty in order to maximize
item appropriateness. They first defined the concept of multidimensional
poverty and reviewed the empirical and theoretical literature to identify
the right deprivation items to include in the instrument they were
developing. They then checked if the questions covered all dimensions of
the concept of multidimensional poverty, if the phrasing respectively in
English and Hindi was accurately reflecting the underlying concept of
deprivation we were looking for in each dimension (see Table 1 for the
questions asked for various dimensions of poverty). Two experts familiar
with multidimensional poverty reviewed the initial list of items and made
suggestions about adding items that were omitted. We then organized a
focus group discussion with 7 experts, psychiatrists, psychologists and
social workers from Dr Ram Manohar Lohia hospital to establish if the 17
domains of poverty selected were adapted and relevant for the context of
New Delhi and were providing a comprehensive overview of the concept.
They also ranked these domains by order of importance of deprivation. A
similar focus group was organized with 8 hospital outpatients with severe
mental illness. We finally tested the poverty questionnaire with a group of
20 outpatients at the department of psychiatry at Dr RML hospital. We
prompted them with questions to check for their understanding of poverty,
to identify the language they used to explain the notion of poverty as well
as ascertain their understanding of the questions in order to make sure the
Page 58 of 67
For peer review only - http://bmjopen.bmj.com/site/about/guidelines.xhtml
BMJ Open
123456789101112131415161718192021222324252627282930313233343536373839404142434445464748495051525354555657585960

For peer review only
instrument’s purpose made sense to them. Finally, two other experts
revised the final version to make sure items illustrate the content of
multidimensional poverty.
Comment 4. Did the researchers employ any other methods to “validate”
the tool ?
Response to comment 4. Besides the methods described above in response
to the comment 3, we also carried out test-retest to test for recall bias and
social desirability bias. Interviews with 71 respondents (both cases and
controls) for test-retest reliability were carried out on two occasions with a
gap of 10 to 15 days by the same enumerator to check to what degree a
given respondent provided same responses for the poverty items. We
compared the scores between the two sets of responses. Results show
overall acceptable level of reliability (over 0.7 for Inter class correlation) for
the different poverty variables. Due to constraints of space we did not
mention this in the manuscript, but can do so if the editor permits, or place
these results online.
Comment 5. What is the “22-items discrimination and stigma scale looking
at unfair treatment” This makes a sudden appearance. It need not be
mentioned if it is not used.
Response to comment 5. Thank you for this useful comment. We removed
the reference as requested. This scale is a measure of stigma that was
developed after our case control study was carried out. Nevertheless, we
tested it for content validity with patients and controls and found that it
was not adapted to the north Indian context.
Comment 6. Results: Sample – The age range is 7-77 (patients) and 12-
74(controls) – Why were children chosen to participate? Who signed the
consent form for the children below legal age? What was the nature of the
responses obtained in this group?
Response to comment 6. This is a typo and we are grateful for the reviewer
for identifying it. The younger case was 15 at the time. We did not
interview children below 15 among cases. 6 controls were between 13 and
15 because of our rule of age selection with a 5 years gap. Consent for
adolescent between 15 and 18 were asked from the parent or the legal
Page 59 of 67
For peer review only - http://bmjopen.bmj.com/site/about/guidelines.xhtml
BMJ Open
123456789101112131415161718192021222324252627282930313233343536373839404142434445464748495051525354555657585960
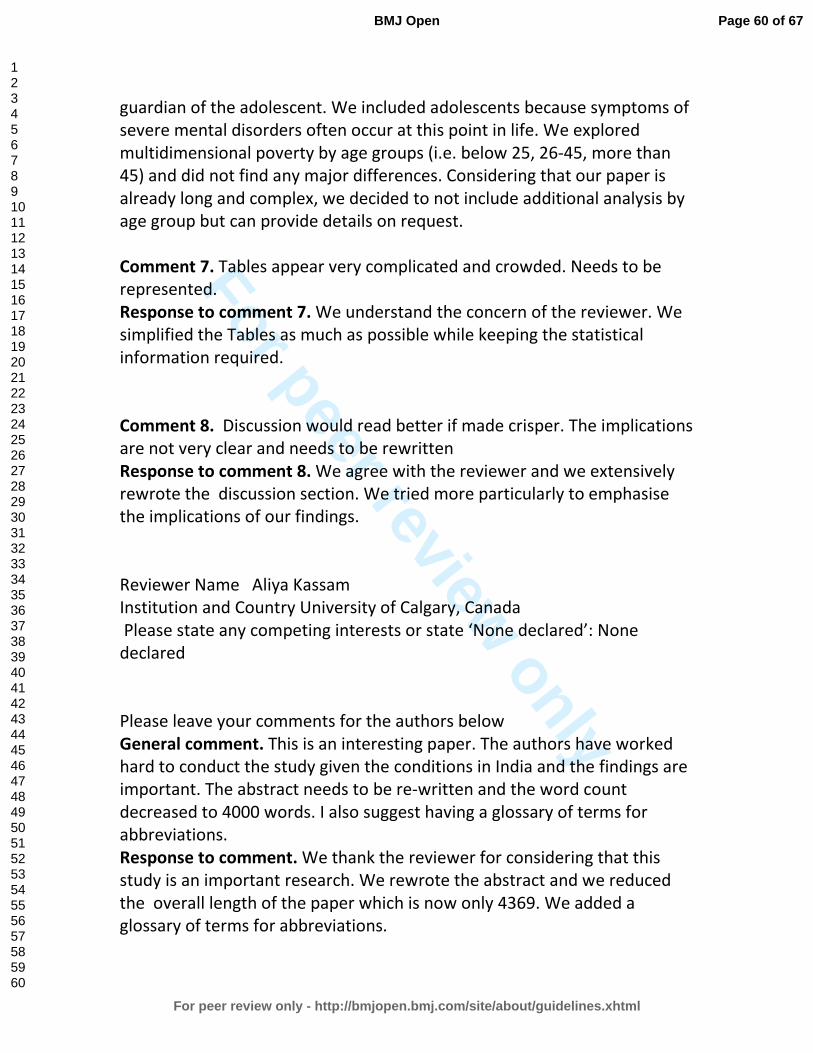
For peer review only
guardian of the adolescent. We included adolescents because symptoms of
severe mental disorders often occur at this point in life. We explored
multidimensional poverty by age groups (i.e. below 25, 26-45, more than
45) and did not find any major differences. Considering that our paper is
already long and complex, we decided to not include additional analysis by
age group but can provide details on request.
Comment 7. Tables appear very complicated and crowded. Needs to be
represented.
Response to comment 7. We understand the concern of the reviewer. We
simplified the Tables as much as possible while keeping the statistical
information required.
Comment 8. Discussion would read better if made crisper. The implications
are not very clear and needs to be rewritten
Response to comment 8. We agree with the reviewer and we extensively
rewrote the discussion section. We tried more particularly to emphasise
the implications of our findings.
Reviewer Name Aliya Kassam
Institution and Country University of Calgary, Canada
Please state any competing interests or state ‘None declared’: None
declared
Please leave your comments for the authors below
General comment. This is an interesting paper. The authors have worked
hard to conduct the study given the conditions in India and the findings are
important. The abstract needs to be re-written and the word count
decreased to 4000 words. I also suggest having a glossary of terms for
abbreviations.
Response to comment. We thank the reviewer for considering that this
study is an important research. We rewrote the abstract and we reduced
the overall length of the paper which is now only 4369. We added a
glossary of terms for abbreviations.
Page 60 of 67
For peer review only - http://bmjopen.bmj.com/site/about/guidelines.xhtml
BMJ Open
123456789101112131415161718192021222324252627282930313233343536373839404142434445464748495051525354555657585960
For peer review only
Reviewer Name Alexandre Andrade Loch
Institution and Country Institute of Psychiatry, University of Sao Paulo,
Brasil
Please state any competing interests or state ‘None declared’: None
declared.
Please leave your comments for the authors below
This is an interesting study assessing the relationship between mental
illness stigma and poverty in India. Results support this association, and
cover an important issue in an under researched area.
However, there seems to be several methodological questions regarding
the study.
Comment 1. First, the stigma outcome used by authors here is problematic.
Authors argue that this would be a proxy for experienced discrimination;
however, there might be several factors why someone with a mental illness
would not take part in family decisions. It could be, for example, that these
patients might be symptomatic (paranoid, unwilling, etc.), or that they
would have cognitive deficits, or too severe negative symptoms.
Nevertheless, authors in the discussion do not explore these possibilities.
Response to comment 1. We are aware of this limitation but under the
circumstances we believe that the variable of exclusion from family
decision is a good proxy for experienced discrimination. We explored how
this notion was perceived through focus group discussions with experts and
with patients. Results show that not taking part in important decisions is a
common way to express social distance within the family.
We did explore the possibility of using a stigma questionnaire, but could
not find one suited to North India and especially for the approach we took
to compare treated outpatients with SMI to controls from the community.
However we have removed the extra paragraph we put in about using a
stigma questionnaire, in view of the reviewer comment above as well as in
interest of reducing manuscript length. We address the esteemed
reviewer’s concerns in greater detail below.
Page 61 of 67
For peer review only - http://bmjopen.bmj.com/site/about/guidelines.xhtml
BMJ Open
123456789101112131415161718192021222324252627282930313233343536373839404142434445464748495051525354555657585960
For peer review only
First, at that time there was no available scale to measure personally
experienced stigma in India for the type of approach we favoured of
comparing patients with mental illness to a control group in the general
population. We carefully explored the literature to identify an adequate
scale measuring experienced discrimination that could be adapted to the
context of Delhi. Among the various measures reviewed in (Link, et al.
2004), only those related to the fourth component of the Link and Phelan
(2001) conceptualization of stigma, i.e. the “person experience of status
loss and discrimination” ((Link and Phelan 2001) p.370) could have been
used for the purpose of the present paper. We explored all of them (22)
and chose to build our own questionnaire to measure experienced stigma
while we used the Stigma Questionnaire (SQ) for exploration of labelling
and stereotyping which has been validated in Hindi (Littlewood, et al.
2007). This decision was taken after we tested some of the questions from
existing scales that we initially thought culturally adapted to the specific
hospital context, to our specific population –outpatients with severe
mental illness from low social class background and to our aim of showing
the link between poverty, mental illness and experienced discrimination. In
fact, there were few suitable measures of “experienced discrimination”. For
instance, we looked at the Consumer Experiences of Stigma Questionnaire
(CESQ) (Wahl 1999). We found that the notion of being a consumer was not
adapted. Furthermore, several items within the questions of the
discrimination section Consumer Experiences of Stigma Questionnaire
(CESQ) were not deemed relevant to the context by the research team. For
instance, very few patients ever tried to rent an apartment; patients at Dr
RML hospital do not benefit from the health insurance system; very few
have a licence or a passport.
Following Link et al. (2004) we considered that “very few aim to assess
discriminatory behaviour directly” (p. 527) and measuring experienced
stigma is not really a stigma measure, but a measurement of whether and
to what extent persons with mental illnesses “are denied access to the good
things our society affords and are differentially exposed to the bad things it
confers”” (p. 527). For instance, Link et al. (2004) explain, the measures
used can assess discrimination in employment, access to medical
treatment, or being put down or ignored among other discriminatory
processes. The stigma researcher is then tasked with the work of linking the
Page 62 of 67
For peer review only - http://bmjopen.bmj.com/site/about/guidelines.xhtml
BMJ Open
123456789101112131415161718192021222324252627282930313233343536373839404142434445464748495051525354555657585960
For peer review only
“bad outcome assessed” with “processes of labelling, stereotyping, and/or
being set apart”. S/he must “select outcome measures from the vast array
of possible good or bad outcome measures” and link this outcome “to the
theory being tested”. Link et al. (2004) review both “laboratory
experiments and behavioural measures indicating discrimination” and
“observational studies and behavioural measures indicating
discrimination”. There was not a specific formalized psychometrically
validated measure of experienced stigma available focusing “on the scope
and content of these experiences” before the Discrimination and Stigma
Scale (DISC) made available only recently and in any case after our study
was carried out (Brohan, et al. 2013), p. 33).
Second, we also tested the importance of participation in family decisions
through focus group discussions and in depth interviews with patients. We
proceeded as suggested by Link et al. (2004) identifying questions through
focus group discussions and in depth interviews with patients and experts,
then building and testing for reliability a non-experimental self reported
survey, looking at unfair treatment in various areas of everyday life as
reported by patients and controls. We then compared responses for these
questions: participation in family decisions, inclusion in community
activities, participation in political activities, participation on the labour
market, access to education. These questions were defined at hoc but were
influenced by existing scales particularly the Chinese Psychiatric Stigma
Experience Questionnaire (PSEQ) (Lee, et al. 2005). Two focus group
discussions and ten in depth qualitative interviews with adult out-patients
with severe mental illness demonstrated that participation in family
decisions made on a daily basis (decision for meals, visits to neighbours or
relatives, etc.), as well as for important matters (such as marriage of a child,
choice of a school or organisation of a ceremony) was a central indicator of
inclusion/exclusion for people with mental illness. Adult respondents
reported that they were excluded from these decisions: this was even more
the case for women and those persons with SMI with little education. Only
some of the respondents who were heads of family reported being the
ones taking the decisions. But in general, FGD participants and respondents
often internalised the stigma as they considered this absence of being
asked what they think as something if not totally acceptable, at least very
common and anticipated. To assess reliability, we asked follow up
Page 63 of 67
For peer review only - http://bmjopen.bmj.com/site/about/guidelines.xhtml
BMJ Open
123456789101112131415161718192021222324252627282930313233343536373839404142434445464748495051525354555657585960
For peer review only
questions for each household member regarding whether they were
included in family decisions. We then found significant differences between
the two groups for participation in family decision.
Third, we selected a large sample of 649 hospital outpatients with severe
mental illness (diagnosis of schizophrenia, affective disorders and recurrent
depression from low social class background) in order to represent diverse
degrees of disorders. Most patients were in follow-up. All patients
benefited from medical assistance from the team at the hospital. The
patients included in our study were successfully treated: a rather large
group were working (29%). Even the schizophrenia group were, for the
most part either working or helping out at home. Some were not
symptomatic or were presenting limited cognitive deficits or moderate
negative symptoms associated to schizophrenia, few would present
relatively more severe symptoms. The fact that we interviewed a large
sample of people was a way to control for the specific role of the individual
diagnostic condition in explaining the discrimination faced within the
family. Despite the treatment of the mental illness, we found that
discrimination was significantly linked to poverty for cases compared to
controls.
Comment 2. Furthermore, the issue of diagnosis here is another problem.
There is a study conducted in China and in Japan (Haragucki et al, 2009)
where higher stigma levels in China were attributed to the fact that Chinese
individuals with mental illness might not be treated adequately due to
lacking outpatient mental healthcare services. This would lead to a negative
impression towards them. So, what was the severity of the participants’
mental illnesses in the study? Could this have influenced families’ opinion
towards them? We know that there are several degrees of severity of
bipolar disorder and schizophrenia. On the one hand we might see fully
functional individuals with one or the other disorder, while on the other
hand we also see patients whose social functioning are greatly
compromised. We also know that, for instance, violence of individuals with
schizophrenia is greater towards their closest relatives, particularly when
they are undertreated. These greatly influences stigma, but is not explored
nor discussed in the work.
Response to comment 2. We agree with the reviewer that, as shown in
Page 64 of 67
For peer review only - http://bmjopen.bmj.com/site/about/guidelines.xhtml
BMJ Open
123456789101112131415161718192021222324252627282930313233343536373839404142434445464748495051525354555657585960
For peer review only
several cross-cultural studies in Asia, stigmatising attitudes vary depending
on the severity of the disorder (Griffiths, et al. 2006; Haraguchi, et al. 2009;
Kurihara, et al. 2000; Phillips, et al. 2000). As stated in response to
comment 1, we selected a large sample of 649 patients who were
successfully treated for various degrees of severity of mental illness. Thus
accessibility of treatment was not an issue in our sample. We do agree that
untreated patient would be more violent, symptomatic and therefore even
more exposed to discrimination and exclusion.
All patients were being treated for their condition at Dr Ram Manohar
Lohia hospital and were displaying limited degrees of disorders. The
hospital also dispenses essential medicines free of cost therefore
availability of medicines was not an issue in this sample. Due to the large
sample size we could not conduct more detailed assessment of symptoms,
through using a scale for example. We argue that the family’s attitude
reflects past experience with the patients’ disorders more than current
treated condition that allows the patient to function within the family.
Comment 3. Authors should state which were the Kappa values for the
other items of the scale. Also, they should explain why they maintained the
two items that displayed a rather low Kappa value.
Response to comment 3. We are sorry for the confusion we might have
introduced: The poverty questionnaire is not a scale but rather a
survey/series of questions examining the various domains of deprivation.
As a result, the responses that were captured in the scale did not vary since
the conditions did not change during the course of this study. Further,
calculating Kappa did not yield any significant information or change
regarding these conditions because this was not a RCT or introduced a
treatment that would alter their lifestyles/demographic/economic
information. To avoid confusion, we removed the sentence about the
Kappa measure (i.e. “It was pilot tested in the field and we validated the
measure of poverty using test-retest and inter-rater reliability measures.
The Kappa coefficient for both measures was between 0.5 and 1 for all
dimensions of poverty with two exceptions: food security (0.265) and
physical security (0.372)”.
The two questions represent important dimensions of deprivation and
were self-reported perception of food security and physical security. The
variation observed between the two interviews is probably due to a short-
Page 65 of 67
For peer review only - http://bmjopen.bmj.com/site/about/guidelines.xhtml
BMJ Open
123456789101112131415161718192021222324252627282930313233343536373839404142434445464748495051525354555657585960
For peer review only
term variation (within the 10-15 days of the second interview) in the
severity of food or physical security deprivation. Deprivation of food
reflects a basic need as well as a basic capability that is central to survival.
Similarly, deprivation of physical security is very important in the context of
New Delhi, which is a major metropolis with a rather high crime rate. Often
families are afraid of potential violence against their members with mental
illness, as they are perceived more susceptible to violence, particularly
women.
Comment 4. Analyzes displayed in tables 4 and 5 are very interesting,
however they are way too extensive and leaves the reader tired and
disinterested. Authors should summarize their findings, or should find a
way to simplify their statistical analysis.
Response to comment 4. We understand the concern of the reviewer but it
is uneasy to remove such important information. In any case, we did try to
summarize the information as follow. Tables 4 and 5 were replaced by a
unique Table 4 displaying multidimensional poverty measures for PSMI and
controls and by gender and caste. We removed the information for a cut off
k superior to 10 indicators of deprivation considering that very few
respondents were deprived on more than 10 dimensions (2.6% only of total
respondents, both cases and controls were deprived on 11 dimensions or
more).
Comment 5. Table 3 should be excluded from the manuscript, authors
should provide it as supplemental material.
Response to comment 5. Thank you, we agree to this very practical
suggestion. Table 3 is provided as a supplemental material available online.
Comment 6. Table 7 is also too extensive. Authors should exclude the lines
with “1” values, perhaps placing the reference category in parenthesis, just
after the comparison variable.
Response to comment 6. We agree with the reviewer and we modified
Table 7, now Table 6, to take into account this valuable suggestion. We put
the reference category into parenthesis. We also reported just two models
(unadjusted versus adjusted) for the association between the indicator of
stigma and the multidimensional poverty.
Page 66 of 67
For peer review only - http://bmjopen.bmj.com/site/about/guidelines.xhtml
BMJ Open
123456789101112131415161718192021222324252627282930313233343536373839404142434445464748495051525354555657585960
For peer review only
Comment 7. Discussion: authors fail to provide more in-depth discussion
regarding their results, and specially their limitations. Discussing the
possibilities of what not participating in family decisions might represent
and the issues point out above might produce a more balanced manuscript.
Response to comment 7. We rewrote the discussion to take into account
this comment. Limitations have now been described in greater detail.
Brohan, E., et al.
2013 Development and psychometric evaluation of the Discrimination and
Stigma Scale (DISC). Psychiatry Research 208(1):33-40.
Griffiths, K. M., et al.
2006 Stigma in response to mental disorders: A comparison of Australia
and Japan. BMC Psychiatry 6.
Haraguchi, K., et al.
2009 Stigma associated with schizophrenia: Cultural comparison of social
distance in Japan and China. Psychiatry and Clinical Neurosciences
63(2):153-160.
Kurihara, T., et al.
2000 Outcome of schizophrenia in a non-industrialized society:
Comparative study between Bali and Tokyo. Acta Psychiatrica Scandinavica
101(2):148-152.
Lee, S., et al.
2005 Experience of social stigma by people with schizophrenia in Hong
Kong. British Journal of Psychiatry 186(FEB.):153-157.
Link, B. G., and J. C. Phelan
2001 Conceptualizing stigma. Annual Review of Sociology 27:363-385.
Link, B. G., et al.
2004 Measuring mental illness stigma. Schizophrenia Bulletin 30(3):511-
541.
Littlewood, R., S. Jadhav, and A. G. Ryder
2007 A cross-national study of the stigmatization of severe psychiatric
illness: Historical review, methodological considerations and development of
the questionnaire. Transcultural Psychiatry 44(2):171-202.
Phillips, M. R., et al.
2000 Causes of Schizophrenia reported by patients' family members in
China. British Journal of Psychiatry 177(JUL.):20-25.
Wahl, O. F.
1999 Mental health consumers' experience of stigma. Schizophrenia
Bulletin 25(3):467-478.
Page 67 of 67
For peer review only - http://bmjopen.bmj.com/site/about/guidelines.xhtml
BMJ Open
123456789101112131415161718192021222324252627282930313233343536373839404142434445464748495051525354555657585960