Measuring stigma across neurological conditions: the development of the stigma scale for chronic...
18
Measuring Stigma Across Neurological Conditions: The Development of the Stigma Scale for Chronic Illness (SSCI) Deepa Rao 1,2,3 , Seung W. Choi 1,3 , David Victorson 1,2,3 , Rita Bode 4 , Amy Peterman 5 , Allen Heinemann 3,4,6 , and David Cella 1,2,3 1 Center on Outcomes, Research and Education, Evanston Northwestern Healthcare, Evanston, IL 2 Department of Psychiatry and Behavioral Sciences, Northwestern University, Chicago, IL 3 Institute for Healthcare Studies, Northwestern University, Chicago, IL 4 Center for Rehabilitation Outcomes Research, Rehabilitation Institute of Chicago, Chicago, IL 5 Department of Psychology, University of North Carolina, Charlotte, Charlotte, NC 6 Department of Physical Medicine and Rehabilitation, Northwestern University, Chicago, IL Abstract Purpose—Most measures of stigma are illness-specific and do not allow for comparisons across conditions. As part of a study of health-related quality of life for people with neurological disorders, our team developed an instrument to assess the stigma for people with chronic illnesses. Methods—We based item content on literature review, responses from focus groups, and cognitive interviews. We then administered the items to people with neurological disorders for psychometric testing. Results—Five hundred and eleven participants completed items of the stigma scale. Exploratory factor analysis produced 2 factors that were highly correlated (r = 0.81). Confirmatory factor analysis produced high standardized loadings on an overall stigma factor (0.68 to 0.94), with poorer loadings on the two sub-domains (−0.12 to 0.53). These results demonstrated a sufficiently unidimensional scale that corresponded with the bifactor model. Item response theory modeling suggested good model fit, and differential item functioning analyses indicated that the 24-item scale showed potential for measurement equivalence across conditions. Conclusions—Our efforts produced a stigma scale that had promising psychometric properties. Further study can provide additional information about the SSCI and its benefit in measuring the impact of stigma across conditions. Keywords Neurological Disorders; Measurement; Chronic Illness; Self Stigma; Enacted Stigma In 1963, Erving Goffman defined stigma as “the situation of the individual who is disqualified from full social acceptance (Preface)” [1], and since his time, social scientists have studied stigma manifested as stereotypes, prejudice, and discrimination [2]. Public stigma, or a negative attitude held by a community member, has consequences for people with stigmatizing conditions, such as loss of employment or social isolation [3]. These consequences can be exacerbated by six factors: concealability, course, disruptiveness, aesthetic qualities, origin, Corresponding Author: Deepa Rao, Ph.D. [email protected] Telephone: (224) 364-7677 Fax: (847) 570-8033. NIH Public Access Author Manuscript Qual Life Res. Author manuscript; available in PMC 2010 June 1. Published in final edited form as: Qual Life Res. 2009 June ; 18(5): 585–595. doi:10.1007/s11136-009-9475-1. NIH-PA Author Manuscript NIH-PA Author Manuscript NIH-PA Author Manuscript
-
Upload
northwestern -
Category
Documents
-
view
1 -
download
0
Transcript of Measuring stigma across neurological conditions: the development of the stigma scale for chronic...

Measuring Stigma Across Neurological Conditions: TheDevelopment of the Stigma Scale for Chronic Illness (SSCI)
Deepa Rao1,2,3, Seung W. Choi1,3, David Victorson1,2,3, Rita Bode4, Amy Peterman5, AllenHeinemann3,4,6, and David Cella1,2,31Center on Outcomes, Research and Education, Evanston Northwestern Healthcare, Evanston, IL2Department of Psychiatry and Behavioral Sciences, Northwestern University, Chicago, IL3Institute for Healthcare Studies, Northwestern University, Chicago, IL4Center for Rehabilitation Outcomes Research, Rehabilitation Institute of Chicago, Chicago, IL5Department of Psychology, University of North Carolina, Charlotte, Charlotte, NC6Department of Physical Medicine and Rehabilitation, Northwestern University, Chicago, IL
AbstractPurpose—Most measures of stigma are illness-specific and do not allow for comparisons acrossconditions. As part of a study of health-related quality of life for people with neurological disorders,our team developed an instrument to assess the stigma for people with chronic illnesses.
Methods—We based item content on literature review, responses from focus groups, and cognitiveinterviews. We then administered the items to people with neurological disorders for psychometrictesting.
Results—Five hundred and eleven participants completed items of the stigma scale. Exploratoryfactor analysis produced 2 factors that were highly correlated (r = 0.81). Confirmatory factor analysisproduced high standardized loadings on an overall stigma factor (0.68 to 0.94), with poorer loadingson the two sub-domains (−0.12 to 0.53). These results demonstrated a sufficiently unidimensionalscale that corresponded with the bifactor model. Item response theory modeling suggested goodmodel fit, and differential item functioning analyses indicated that the 24-item scale showed potentialfor measurement equivalence across conditions.
Conclusions—Our efforts produced a stigma scale that had promising psychometric properties.Further study can provide additional information about the SSCI and its benefit in measuring theimpact of stigma across conditions.
KeywordsNeurological Disorders; Measurement; Chronic Illness; Self Stigma; Enacted Stigma
In 1963, Erving Goffman defined stigma as “the situation of the individual who is disqualifiedfrom full social acceptance (Preface)” [1], and since his time, social scientists have studiedstigma manifested as stereotypes, prejudice, and discrimination [2]. Public stigma, or a negativeattitude held by a community member, has consequences for people with stigmatizingconditions, such as loss of employment or social isolation [3]. These consequences can beexacerbated by six factors: concealability, course, disruptiveness, aesthetic qualities, origin,
Corresponding Author: Deepa Rao, Ph.D. [email protected] Telephone: (224) 364-7677 Fax: (847) 570-8033.
NIH Public AccessAuthor ManuscriptQual Life Res. Author manuscript; available in PMC 2010 June 1.
Published in final edited form as:Qual Life Res. 2009 June ; 18(5): 585–595. doi:10.1007/s11136-009-9475-1.
NIH
-PA Author Manuscript
NIH
-PA Author Manuscript
NIH
-PA Author Manuscript
and peril [4]. Concealability refers to whether the condition is obvious or can be hidden, courserefers to the severity and pattern of the condition over time, and disruptiveness refers to thedegree of interference with usual patterns of social interaction. The term ‘aesthetic qualities’refers to how much the condition upsets others by way of the five senses, origin refers to theperceived cause and degree of responsibility a person has for contracting the illness, and finally,peril refers to the amount of fear and danger associated with a person’s illness.
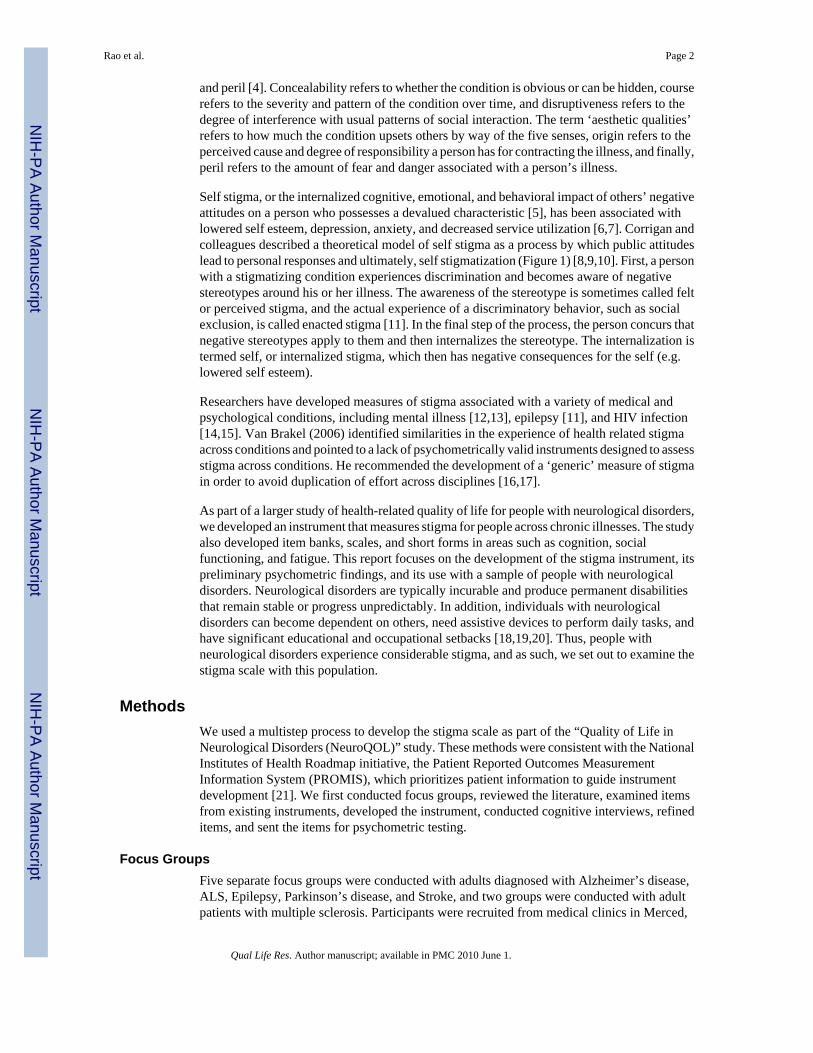
Self stigma, or the internalized cognitive, emotional, and behavioral impact of others’ negativeattitudes on a person who possesses a devalued characteristic [5], has been associated withlowered self esteem, depression, anxiety, and decreased service utilization [6,7]. Corrigan andcolleagues described a theoretical model of self stigma as a process by which public attitudeslead to personal responses and ultimately, self stigmatization (Figure 1) [8,9,10]. First, a personwith a stigmatizing condition experiences discrimination and becomes aware of negativestereotypes around his or her illness. The awareness of the stereotype is sometimes called feltor perceived stigma, and the actual experience of a discriminatory behavior, such as socialexclusion, is called enacted stigma [11]. In the final step of the process, the person concurs thatnegative stereotypes apply to them and then internalizes the stereotype. The internalization istermed self, or internalized stigma, which then has negative consequences for the self (e.g.lowered self esteem).
Researchers have developed measures of stigma associated with a variety of medical andpsychological conditions, including mental illness [12,13], epilepsy [11], and HIV infection[14,15]. Van Brakel (2006) identified similarities in the experience of health related stigmaacross conditions and pointed to a lack of psychometrically valid instruments designed to assessstigma across conditions. He recommended the development of a ‘generic’ measure of stigmain order to avoid duplication of effort across disciplines [16,17].
As part of a larger study of health-related quality of life for people with neurological disorders,we developed an instrument that measures stigma for people across chronic illnesses. The studyalso developed item banks, scales, and short forms in areas such as cognition, socialfunctioning, and fatigue. This report focuses on the development of the stigma instrument, itspreliminary psychometric findings, and its use with a sample of people with neurologicaldisorders. Neurological disorders are typically incurable and produce permanent disabilitiesthat remain stable or progress unpredictably. In addition, individuals with neurologicaldisorders can become dependent on others, need assistive devices to perform daily tasks, andhave significant educational and occupational setbacks [18,19,20]. Thus, people withneurological disorders experience considerable stigma, and as such, we set out to examine thestigma scale with this population.
MethodsWe used a multistep process to develop the stigma scale as part of the “Quality of Life inNeurological Disorders (NeuroQOL)” study. These methods were consistent with the NationalInstitutes of Health Roadmap initiative, the Patient Reported Outcomes MeasurementInformation System (PROMIS), which prioritizes patient information to guide instrumentdevelopment [21]. We first conducted focus groups, reviewed the literature, examined itemsfrom existing instruments, developed the instrument, conducted cognitive interviews, refineditems, and sent the items for psychometric testing.
Focus GroupsFive separate focus groups were conducted with adults diagnosed with Alzheimer’s disease,ALS, Epilepsy, Parkinson’s disease, and Stroke, and two groups were conducted with adultpatients with multiple sclerosis. Participants were recruited from medical clinics in Merced,
Rao et al. Page 2
Qual Life Res. Author manuscript; available in PMC 2010 June 1.
NIH
-PA Author Manuscript
NIH
-PA Author Manuscript
NIH
-PA Author Manuscript

California; Cleveland, Ohio; Columbia, Maryland; and Chicago, Illinois. These focus groupsoccurred between October 2005 and March 2006. Participants were included if they were 18years of age or older, diagnosed with one of the six conditions, and per physician report,possessed the cognitive and physical ability to participate in a focus group.
The purpose of the focus groups was to query participants on salient aspects of health-relatedquality of life, not to ask about stigma specifically. Participants were asked open-endedquestions about their quality of life and areas most affected by their illness and treatment.Recordings of discussions were transcribed and NVivo 2.0 (QSR International, 2002) was usedto organize the qualitative data. The data were analyzed by coders trained in qualitative dataanalytic techniques, and coding disagreements were reconciled through discussion. Agrounded theory approach guided the identification of themes, and incorporated the followingtechniques: coding, memo writing, and the constant comparative method [22].
Literature Review and Initial Item PoolWe conducted a literature review in order to examine the wording and content of existingillness-specific measures of stigma. We examined measures of stigma associated with a numberof conditions including physical distinctions resulting from severe burns [23], mental illness[13], epilepsy [24,25,26], HIV/AIDS [14], amyotrophic lateral sclerosis (ALS) [27], multiplesclerosis [28,29,30], and Parkinson’s Disease [31] (measures are listed in Table 1). We createdan item pool using ‘binning’ and ‘winnowing’ techniques [32]. We selected items from anexisting library of Functional Assessment of Chronic Illness Therapy (FACIT) items and wroteadditional items to correspond with patient-identified concerns. Each item was assigned to aprimary ‘bin’, or area. For stigma, each bin corresponded with six dimensions of stigma:concealability, course, disruptiveness, aesthetic qualities, origin, and peril [4]. Once items wereassigned to bins, we “winnowed”, or systematically removed, items because of redundancy,vague or confusing language, language translatability, or narrowness of coverage.
Cognitive Interviews and Item ReviewWe conducted cognitive interviews with draft stigma items to help ensure that items would beunderstood as intended [33]. Research assistants received training in cognitive interviewing,and once trained, they queried participants on the language, comprehensibility, and relevanceof the items. The interviews were audio-taped and transcribed verbatim.
We gathered a team of experts to analyze the content of responses [34] and revise items in aseries of discussions. The expert reviewers were neurology professionals, chosen based onreputation via publications and presentations, and outcomes measurement specialists from thefields of health psychology, rehabilitation medicine, psychometrics, and cross-culturaltranslation. The neurology and outcomes measurement experts reviewed item content andwording independently. In addition, our team scrutinized response categories (1=Never,2=Rarely, 3=Sometimes, 4=Often, 5=Always) and the context of the questionnaire ‘the past 7days’ versus ‘lately’.
Psychometric analysesWe recruited patients with Stroke, Multiple Sclerosis, Parkinson’s Disease, Epilepsy, and ALSvia an online internet panel. The participants completed a set of study measures, including asocio-demographic questionnaire and the stigma items. The participants provided onlineinformed consent before completing study measures. We were concerned about recruitingadequate numbers of people with particular neurological disorders. Thus, we prioritizedrecruitment of people with specific neurological disorders, and stratified the sample byneurological disorders but not other characteristics, such as racial/ethnic background. Onlinedata collection enabled us to recruit participants in adequate numbers from across the United
Rao et al. Page 3
Qual Life Res. Author manuscript; available in PMC 2010 June 1.
NIH
-PA Author Manuscript
NIH
-PA Author Manuscript
NIH
-PA Author Manuscript

States. The panel testing company used illness-stratified random sampling from their registeredpanel of over one million members. Participants were members of the online testing companywho completed questionnaires regularly for incentives provided by the company.
We examined Cronbach’s alpha and item-total correlations of the stigma item bank. We usedexploratory factor analysis (EFA) on the total item set, and then conducted single factor andbifactor confirmatory factor analysis (CFA) using Mplus 4.1 (Mplus, 2006) to assessdimensionality. The EFA and CFA used polychoric correlation coefficients, considered robustwith ordinal item responses. CFA was conducted using data from participants who hadcomplete data (no missing item responses). Goodness of fit was examined for each set of itemsusing the comparative-fit index (CFI) and the root-mean-square error of approximation(RMSEA). The criteria for good (or acceptable) model fit were: CFI values greater than 0.95(0.90) and RMSEA values less than 0.05 (0.08). We then fitted the items with the gradedresponse model, which assumes ordinal item responses, using the MULTILOG softwareprogram [35]. All items were examined for satisfactory model fit statistics S-X2 [36]. Localdependence, or item redundancy, was identified using a standard cutoff supported by ourprevious work (i.e., residual correlation ≥ .20) [21].
To assess convergent and divergent validity, we conducted three ANOVA analyses to examinethe relationship between total scores on finalized scale and a (1) self-rating of psychologicaldistress (“Please indicate the statement that best describes your current level of anxiety/depression: 1= not anxious/depressed, 2=moderately anxious/depressed, 3= extremelyanxious/depressed”), (2) patient rated performance status (“Please indicate which statementbelow best describes your current activity level: 0=normal activity, 1=some symptoms, but nobed rest during day, 2=bed rest for < 50% of day, 3= bed rest for > 50% of day, 4=unable toget out of bed”), and (3) a self-rating of pain (“Please indicate the statement that best describesyour current level of pain/discomfort: 1=no pain/discomfort, 2=moderate pain/discomfort,3=extreme pain/discomfort”).
Several studies have demonstrated that depression and anxiety are associated with stigma[37,38], and thus we examined the relationship between stigma and the combined constructwe called ‘psychological distress’ to demonstrate convergent validity. In addition, patient ratedperformance status has been used extensively in health-related quality of life studies as ameasure of general functional status reflecting the course of illness [39], and thus, we set outto examine the relationship between stigma and performance status. Furthermore, pain has notbeen associated with stigma, and we examined the relationship between pain and stigma todemonstrate divergent validity. Cohen considered 0.40 to be a large effect size and 0.10 to bea small effect size for a one way ANOVA [40]. Given this information, we expected that ananalysis of stigma and psychological distress would produce a large effect size (greater than0.40) and performance status would be moderately related to stigma and produce an effect sizeless than 0.40. Although pain could theoretically be related to stigma, we expected an analysisof pain and stigma to produce a small effect size (less than 0.10).
Measurement EquivalenceIn post-hoc analyses, we evaluated measurement equivalence (or differential item functioning:DIF) between responses from participants with epilepsy and stroke. These groups were chosenbecause numbers of participants in each group were large enough to allow for DIF analyses tobe conducted. DIF was evaluated in order to examine the differing probabilities of itemendorsement in selected groups of people [41]. A nonparametric DIF detection technique wasused, using the Mantel-Haenszel and Liu-Agresti cumulative common log odds ratio statisticsas implemented in the DIFAS software [42]. We examined the log odds ratio z statistic (z) inorder to determine the magnitude and direction of DIF across item responses from people withepilepsy and stroke.
Rao et al. Page 4
Qual Life Res. Author manuscript; available in PMC 2010 June 1.
NIH
-PA Author Manuscript
NIH
-PA Author Manuscript
NIH
-PA Author Manuscript
ResultsFocus Groups
Results from the focus groups pertaining to stigma are summarized here, and full results arereported elsewhere [43]. Each group was comprised of 8 patients for a total of 56 participants(sample characteristics are reported in Table 2). The concept of stigma emerged spontaneouslyin the patient focus groups. For example, the adult epilepsy group mentioned stigma on twooccasions (4.26% of all coded responses from this group), particularly as it related to havingseizures in public. During the multiple sclerosis groups, comments pertaining to stigma werementioned in relation to looking as though intoxicated when having difficulty walking in public(10 instances, 2.48%) and when others questioned their need for assistive devices (11 instances,2.73%). In the Parkinson’s disease groups, participants reported stigma (11 instances, 9.91%)when family and friends avoided them and doubted the legitimacy of their status. Strokeparticipants endorsed their experiences with stigma (10 instances, 4.46%) in relation to slurredspeech and difficulty walking.
Cognitive Interviews and Item ReviewWe developed a 33 item pool, and 17 participants with epilepsy, multiple sclerosis, ALS,Parkinson’s disease, and stroke responded to these items in cognitive interviews (samplecharacteristics are provided in Table 2). Participants commented in cognitive interviews thatthe draft item “I am unpredictable” was inapplicable to their situation, and so the item wasdropped. Item wordings were further revised based on participant feedback expert review. Forexample, the word ‘condition’ that appeared in the original item pool was changed to ‘illness’based on its potential for easier translation to Spanish. The response categories were generallywell understood by patients. However, the item context ‘the past 7 days’ was modified to‘lately’, as many of the items appeared to be more stable over short periods of time. After theparticipant and expert item review, 26 items remained.
Psychometric analysesFive hundred and eleven patients with neurological disorders completed the 26-item bank viathe online internet panel. Fifty-three percent of the respondents were male. In terms of raceand ethnicity, 5.3% self-reported as having Hispanic/Latino ethnicity and 95% reported thatthey were European-American on a separate question about race. Participants had a self-reported diagnosis of stroke, multiple sclerosis, Parkinson’s disease, epilepsy, or ALS. Detailsof the socio-demographic and clinical characteristics of the sample are in Table 2.
Cronbach’s alpha was 0.97 for the 26-item bank. All items had item-total correlations greaterthan 0.50, but item analyses showed the item distributions were skewed. Accordingly,polychoric correlations were used in our EFA and CFA, and this method is known to be morerobust with non-normally distributed and ordinal data. In addition, the unweighted least squares(ULS) estimator was used for EFA, and weighted least squares with adjustment for means andvariances (WLSMV) estimator was used for CFA.
When EFA results were interpreted using the Cattell (1966) method [44] (number of factorsbefore a break in the scree plot) the analysis produced one factor, whereas using the Kaiser(1960) method [45] (number of factors with eigenvalues greater than 1), the EFA producedthree factors with eigenvalues of 17.78, 1.44, and 1.12. We then used QUARTIMIN rotationto minimize the number of factors and allow the factors to be correlated. 13 items loaded ontoa factor measuring ‘self/internalized stigma’, and 11 items loaded onto a second factormeasuring ‘enacted stigma.’ Two items, “I was careful who I told that I have this illness” and“I worried that people who know I have this illness will tell others” loaded onto a third factor.We dropped items on this third factor because they were applicable only with conditions that
Rao et al. Page 5
Qual Life Res. Author manuscript; available in PMC 2010 June 1.
NIH
-PA Author Manuscript
NIH
-PA Author Manuscript
NIH
-PA Author Manuscript

are concealable, and our goal was to develop a ‘generic’ stigma scale. After the two items weredropped, we completed the EFA again and using the Kaiser (1960) method of interpretation,a 2 factor solution suggested by eigenvalues 16.90 and 1.12, accounting for 70% of the variance.Eleven items loaded onto the ‘enacted stigma’ factor and 13 items onto the ‘self stigma’ factor.The two factors were correlated considerably (r = .81).
Single factor and bifactor Confirmatory Factor Analyses were completed on the 24-item pool.For single factor CFA, RMSEA was 0.131 and CFI was 0.905. Two items had a tendencytowards local dependence (r = 0.18): “People with my illness lost jobs when their employersfound out about it” and “I lost friends by telling them that I have this illness,” and with theitems “Because of my illness, people were unkind to me” and “Because of my illness, peoplemade fun of me.” We retained these items because they did not meet the 0.20 cutoff, andbecause the items appeared to measure different facets of enacted stigma (i.e., employmentand social relationships).
Then, a bifactor CFA was run because the two factors were highly correlated and we believedthat an underlying general factor of stigma dominated. For this analysis, the RMSEA was 0.096and CFI was 0.939. These fit statistics did not support good model fit. However, McDonald(1999) suggested that sufficient unidimensionality can be interpreted by examiningstandardized loadings for bifactor analyses [46]. Lai, Crane, and Cella (2006) demonstratedthat even with poor CFA fit statistics, items of a fatigue scale fit a bifactor model by examiningfactor loadings [47]. Accordingly, the bifactor CFA indicated that standardized loadings on anoverall stigma factor ranged from 0.68 to 0.94. Within the same model, items from the self andenacted stigma sub-domains had poorer standardized loadings; on the self stigma sub-domain,loadings ranged from −0.12 to 0.43 and on the enacted stigma sub-domain, loadings rangedfrom 0.17 to 0.53. The dominant general factor explained the residual correlations among the2 subscales [48]. Furthermore, the examination of factor loadings suggested that a dominantgeneral stigma factor was sufficiently unidimensional for analyses requiring that the underlyingconstruct be unidimensional, such as item response theory (IRT) analyses.
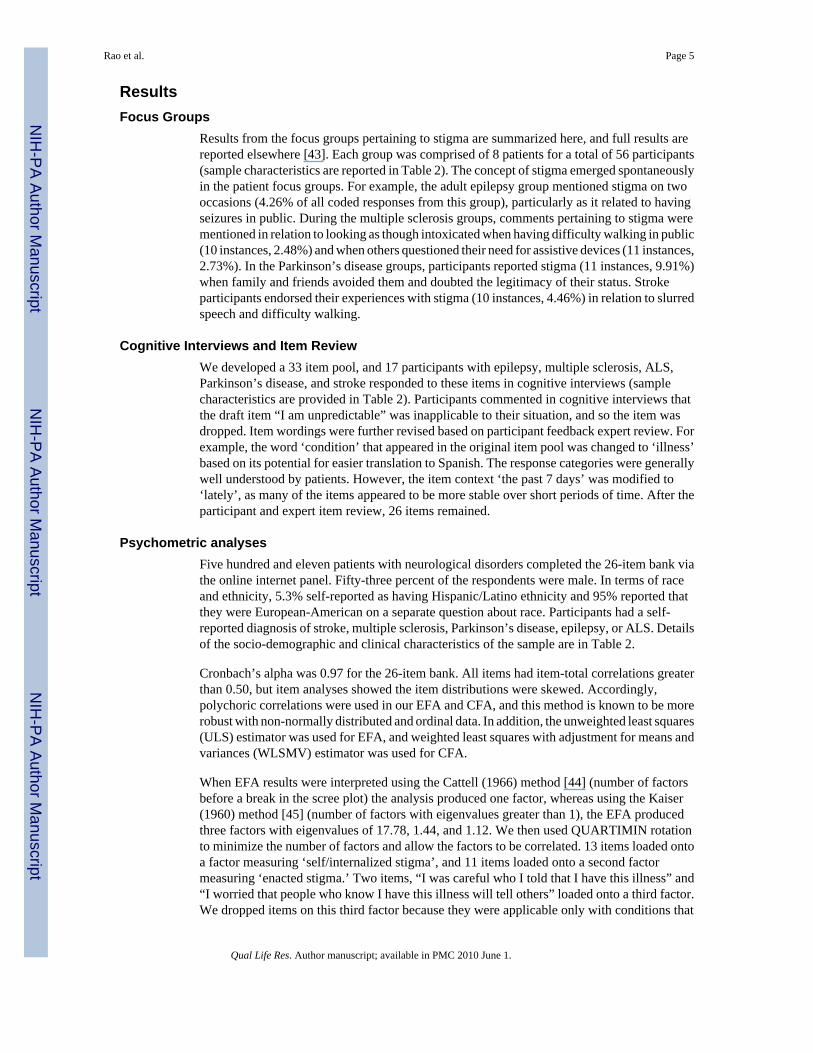
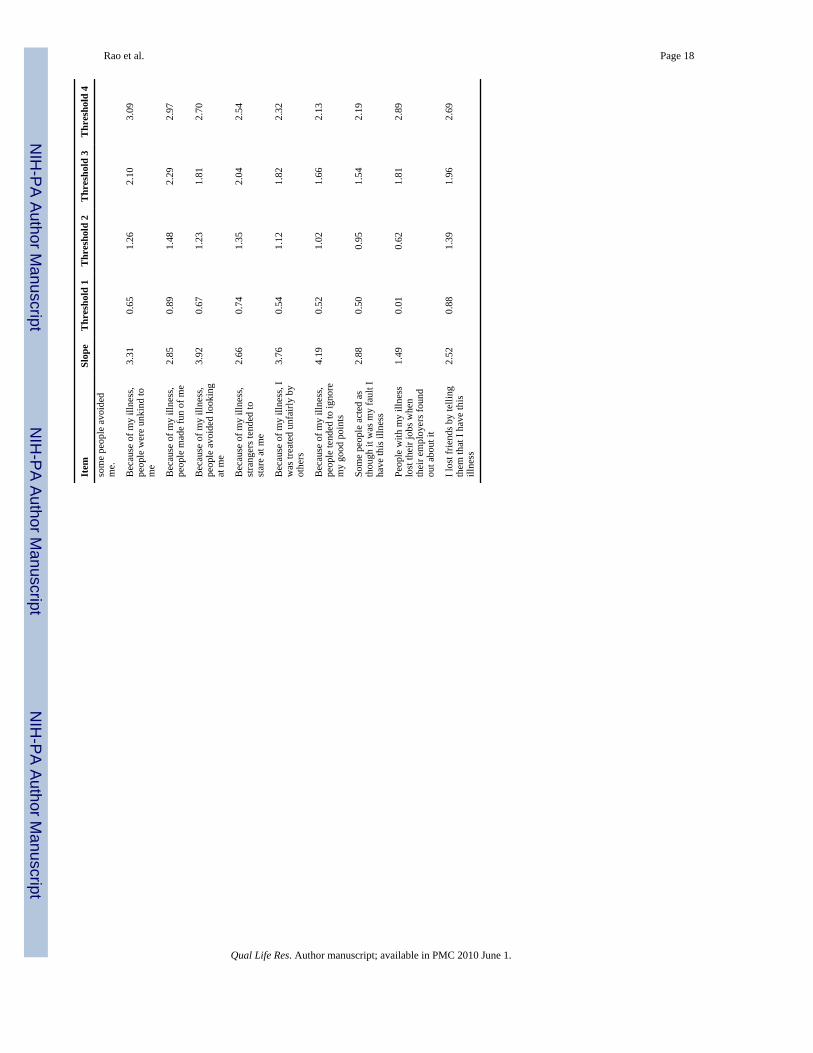
The IRT analyses indicated that items of the stigma scale fit the latent unidimensional constructof stigma. Item parameters from this analysis are shown in Table 3. Figure 2 shows theinformation function and trait distribution for the stigma items. The bimodal trait distributionshowed that two groups of people with different levels of stigma severity were sampled. Theinformation function suggested that the items measured the construct at moderate to severelevels of stigma, implying that the items would lack precision if used with people experiencingless severe stigma. The instrument is best used with participants whose stigma severity levelsare located where the vertical marks are placed at the bottom of the figure.
Our analyses of convergent and divergent validity were conducted on the total score (sum of24 items) of the scale we called the Stigma Scale for Chronic Illness (SSCI). The mean totalscore on the SSCI was 42.7 (standard deviation = 19.7). Details on the frequency of responsesfor psychological distress, performance status, and pain are listed in Table 2. The first ANOVAindicated a strong relationship between the total score on the SSCI (dependent variable) andpsychological distress (independent variable), producing an effect size of 0.58. In the secondANOVA, which analyzed the relationship between the SSCI (dependent variable) andperformance status (independent variable) produced a smaller effect size of 0.47. Lastly, theANOVA with pain (independent variable) and the SSCI (dependent variable) produced an evensmaller effect size of 0.36.
Measurement equivalenceWe examined DIF on a subset of the responses obtained in order to understand the scale’sperformance across conditions, in this case epilepsy (N = 165) and stroke (N = 190). Extreme
Rao et al. Page 6
Qual Life Res. Author manuscript; available in PMC 2010 June 1.
NIH
-PA Author Manuscript
NIH
-PA Author Manuscript
NIH
-PA Author Manuscript

categories (“Often” or “Always”) were rarely indicated in this sample, and so the responsecategories with fewer than five observations per group were collapsed with lower categories.A total of 16 items had one or more categories collapsed. Four items of the stigma scaledemonstrated DIF: “Because of my illness, I felt embarrassed in social situations” (z = +2.00),“Because of my illness, people avoided looking at me” (z = +2.11), “Because of my illness,people tended to ignore my good points” (z = −2.35), and “Because of my illness, I felt differentfrom others” (z = −2.11). The positive and negative z statistics indicated that the stroke sampletended to respond to the first two items (‘embarrassed in social situations’ and ‘avoided lookingat me’) with more severe stigma than the epilepsy sample, and the epilepsy sample tended torespond with more severe stigma than the stroke sample on the last two items (‘good points’and ‘different from others’), at the same levels of the underlying trait. Figure 3 depicts theexpected item score as a function of the logit transformed total score, corrected for overlap,separately for people with epilepsy and stroke. Although DIF was observed on these 4 items,the overall impact is likely to be small because the magnitude of DIF, as shown graphicallyand by the Root Mean Square Deviation values in Figure 3, was small and the directions ofDIF were balanced. The effects of the DIF would likely cancel out at the test level.
DiscussionOur multistep process for measurement development resulted in the 24-item Stigma Scale forChronic Illness (SSCI). The SSCI demonstrated essential unidimensionality while measuringthe theoretically-supported areas of self and enacted stigma. The scale had good internalconsistency, convergent validity, and IRT model fit. In addition, DIF analyses providedpreliminary evidence of measurement equivalence across the neurological conditions ofepilepsy and stroke. Further psychometric testing will strengthen the validation of thisinstrument, and comparisons across other neurological and non-neurological conditions willhelp evaluate the generalizability of the SSCI to other chronic conditions.
Our approach was unique in that it began with input on stigma from people with chronicillnesses. Focus group participants underscored the impact of stigma on quality of life, and thisinput then guided item development. The items underwent rigorous psychometric analyses,and results showed that the SSCI conformed to the bifactor model, demonstrating sufficientunidimensionality. Although we built the scale informed by six dimensions of stigma, ourfactor analytic results supported the more parsimonious bifactor model. Therefore, our analysessuggested that the SSCI can be examined as one total or as two subscales of enacted and self/internalized stigma. The resulting enacted and self/internalized stigma subscales locate theSSCI within the theoretical model depicted in Figure 1. Corrigan and colleagues (2002)developed the theoretical model, but further study with the SSCI can provide more informationabout the relationships between enacted and self/internalized stigma.
The scale demonstrated stronger than expected associations with psychological distress,performance status, and pain. It is possible that an unmeasured factor, severity of illness maybe driving the stronger than expected associations between these variables. Regardless, theSSCI did not demonstrate adequate divergent validity when compared to pain scores. Furtherstudy of the scale’s divergence with constructs unrelated to stigma should be undertaken.
The SSCI demonstrated high internal consistency, suggesting that items within the scale couldbe similar and the scale could be shortened without impacting its psychometric properties.Furthermore, our IRT analyses showed that people with two distinct stigma levels participatedin our study, indicating that across neurological conditions, our participants reported varyingseverity of stigma. The results showed that the scale might not be well utilized as a screeningmeasure to distinguish between those who do and do not experience stigma. Instead, the SSCIwould be best used to measure stigma at moderate to severe levels.
Rao et al. Page 7
Qual Life Res. Author manuscript; available in PMC 2010 June 1.
NIH
-PA Author Manuscript
NIH
-PA Author Manuscript
NIH
-PA Author Manuscript

Finally, results from the DIF analysis suggested that the measure has good potential to be usedacross conditions with minimal bias. However, the DIF analyses were conducted with smallsamples of people with epilepsy and stroke. Although response categories were collapsed inthese analyses, requiring fewer location parameters to be estimated per item, DIF studies withlarger samples can fully determine to the benefit of using the measure across conditions.
The study had some limitations. First, the participants from online panels lacked ethnic/racialdiversity; 95% were of European-American racial background. Therefore, caution should betaken in generalizing these results to other ethnic/racial groups, where stigma may becompounded by social differences, disadvantages, or discrimination. In addition, the itemdistributions were skewed, and although our EFA and CFA analyses used polychoriccorrelations to account for this non-normality, the IRT parameter estimates could be less stablethan their associated standard error estimates might indicate.
Overall, we developed the SSCI to be useful in better understanding the impact of stigma onpeople across chronic illnesses and the effectiveness of stigma reduction interventions. Futurestudy of the SSCI can provide more information on the instrument’s psychometric propertiesand further evidence about its use in comparing stigma across conditions. More study is needed,but the SSCI demonstrated potential to measure important aspects of stigma.
AcknowledgmentsThis study was funded by the National Institute of Neurological Disorders and Stroke (NINDS) contract numberHHSN265200423601C. Deepa Rao is supported by a career development award funded by the National Institute ofMental Health (NIMH: grant number K23 MH 084551). The authors would like to thank Claudia S. Moy assistancein making this study possible, Paul K. Crane for his psychometric guidance, and Patrick W. Corrigan and NicolasRüsch for providing comments on earlier drafts of this paper.
References1. Goffman, E. Stigma: Notes on the Management of Spoiled Identity. Simon and Schuster Inc.; New
York: 1963.2. Weiner B, Perry RP, Magnusson J. An Attributional Analysis of Reactions to Stigmas. Journal of
Personality & Social Psychology 1988;55(5):738–748. [PubMed: 2974883]3. Corrigan PW, Penn DL. Lessons from social psychology on discrediting psychiatric stigma. American
Psychologist Sep;1999 54(9):765–776. American Psychologist. [PubMed: 10510666]4. Jones, E.; Farina, A.; Hastorf, A.; Markus, H.; Miller, D.; Scott, R. Social Stigma The Psychology of
Marked Relationships. W.H. Freeman and Company; New York: 1984.5. Rüsch N, Angermeyer M, Corrigan P. Mental illness stigma: Concepts, consequences, and initiative
to reduce stigma. European Psychiatry 2005;20(8):529–539. [PubMed: 16171984]6. Sikkema K, Kalichman S, Hoffmann R, Koob J, Kelly J, Heckman T. Coping strategies and emotional
well-being among HIV-infected men and women experiencing AIDS-related bereavement. AIDS Care2000;12(5):613–624. [PubMed: 11218547]
7. Sirey JA, Bruce ML, Alexopoulos GS, Perlick DA, Friedman SJ, Meyers BS. Stigma as a barrier torecovery: Perceived stigma and patient-rated severity of illness as predictors of antidepressant drugadherence. Psychiatric Services Dec;2001 52(12):1615–1620. [PubMed: 11726752]
8. Corrigan P, Watson A, Barr L. The self-stigma of mental illness: Implications for self esteem and selfefficacy. Journal of Social & Clinical Psychology 2006;25(9):875–884.
9. Corrigan PW, Watson AC. The paradox of self-stigma and mental illness. Clinical Psychology: Scienceand Practice Feb;2002 9(1) 2002, 35:53.
10. Steward W, Herek GM, Ramakrishna J, Bharat S, Chandy S, Wrubel J, Ekstrand ML. HIV-relatedstigma: adapting a theoretical framework for use in India. Social Science & Medicine 2008;67(8):1225–1235. [PubMed: 18599171]
Rao et al. Page 8
Qual Life Res. Author manuscript; available in PMC 2010 June 1.
NIH
-PA Author Manuscript
NIH
-PA Author Manuscript
NIH
-PA Author Manuscript

11. Jacoby A. Felt versus enacted stigma: A concept revisited. Social Science & Medicine 1994;38(2):269–274. [PubMed: 8140453]
12. Link B, Yang L, Phelan J, Collins P. Measuring mental illness stigma. Schizophrenia Bulletin 2004;30(3):511–541. [PubMed: 15631243]
13. Watson A, Corrigan P, Larson J, Sells M. Self-stigma in people with mental illness. SchizophreniaBulletin. 2007 epub ahead of print.
14. Berger BE, Ferrans CE, Lashley FR. Measuring Stigma in People with HIV: PsychometricAssessment of the HIV Stigma Scale. Research in Nursing and Health 2001;24:518–529. [PubMed:11746080]
15. Sayles J, Hays R, Sarkisian C, Mahajan A, Spritzer K, Cunningham W. Development andpsychometric assessment of a multidimensional measure of internalized HIV stigma in a sample ofHIV-positive adults. AIDS & Behavior. 2008 epub ahead of print.
16. Van Brakel WH. Measuring health-related stigma: A literature review. Psychology, Health &Medicine Aug;2006 11(3):307–334.
17. Nyblade LC. Measuring HIV stigma: existing knowledge and gaps. Psychology, Health & MedicineAug;2006 11(3):335–345.
18. Gagliardi BA. The impact of Duchenne muscular dystrophy on families. Othropedic Nursing1991;10:41–49.
19. Weaver FM, Giobbie-Hurder AG, Hughes SL, Smith G, Kubal JD, Ulasevich A. Home medicalequipment receipt in a home care appropriate population. Journal of Aging and Health 1999;11(4):494–516. [PubMed: 10848075]
20. de Boer AG, Wijker W, Speelman JD, de Haes JC. Quality of life in patients with Parkinson’s disease:development of a questionnaire. Journal of Neurology, Neurosurgery, & Psychiatry 1996;61(1):70–4.
21. Cella D, Yount S, Rothrock N, Gershon R, Cook K, Reeve B. The Patient Reported OutcomesMeasurement Informational System (PROMIS) Overview and Developmental Work, 2004-2006.Medical Care 2007;45(5):S3–S11. [PubMed: 17443116]
22. Corbin, J.; Strauss, A. Basics of Qualitative Research. Sage; Los Angeles: 2008.23. Lawrence J, Fauerbach J, Heinberg L, Doctor M, Thombs D. The reliability and validity of the
Perceived Stigmatization Questionnaire (PSQ) and the Social Comfort Questionnaire (SCQ) amongan adult burn survivor sample. Psychological Assessment 2006;18(1):106–111. [PubMed:16594819]
24. Cramer J, Westbrook L, Devinsky O, Perrine K, Glassman M, Camfield C. Development of theQuality of Life in Epilepsy Inventory for Adolescents: The QOLIE-AD-48. Epilepsia 1999;40:1114–1121. [PubMed: 10448825]
25. Jacoby A, Baker G, Smith D, Dewey M, Chadwick D, Jacoby A, Baker G, Smith D, Dewey M,Chadwick D. Measuring the impact of epilepsy: the development of a novel scale. Epilepsy Research1993;16(1):83–8. [PubMed: 8243442]
26. Loring D, Larrabee G, Meador K, Lee G. Dimensions of the Epilepsy Foundation Concerns Index.Epilepsy and Behavior 2005;6(3):348–352. [PubMed: 15820342]
27. Green C, Kiebert G, Murphy C, Mitchell J, O’Brien M, Burrell A. Patients’ health-related quality oflife and health state values for motor neurone disease/amyotrophic lateral sclerosis. Quality of LifeResearch 2003;12:565–574. [PubMed: 13677501]
28. Cella D, Dineen K, Arnason B, Reder A, Webster K, Karabatsos G. Validation of the functionalassessment of multiple sclerosis quality of life instrument. Neurology 1996;47:129–139. [PubMed:8710066]
29. Ford H, Gerry E, Tennant A, Whalley D, Haigh R, Johnson M. Developing a disease-specific qualityof life measure for people with multiple sclerosis. Clinical Rehabilitation 2001;15:247–258.[PubMed: 11386394]
30. Rotstein Z, Barak Y, Noy S, Achiron A. Quality of life in multiple sclerosis: development andvalidation of the ‘RAYS’ Scale and comparison with the SF-36. International Journal for Quality inHealth Care 2000;12(6):511–517. [PubMed: 11202605]
Rao et al. Page 9
Qual Life Res. Author manuscript; available in PMC 2010 June 1.
NIH
-PA Author Manuscript
NIH
-PA Author Manuscript
NIH
-PA Author Manuscript

31. deBoer A, Wijker W, Speelman J, Haes J. d. Quality of life in patients with Parkinson’s disease:development of a questionnaire. Journal of Neurology, Neurosurgery & Psychiatry 1996;61(1):70–74.
32. DeWalt DA, Rothrock N, Yount S, Stone AA. Evaluation of item candidates: the PROMIS qualitativeitem review. Medical Care May;2007 45(5 Supplement 1):S12–21. Med Care. [PubMed: 17443114]
33. Willis, GB. Cognitive Interviewing: A “How To” Guide, From the short course “Reducing SurveyError through Research on the Cognitive and Decision Processes in Survey”. Meeting of theAmerican Statistical Association; 1999.
34. Ryan, G.; Bernard, H. Data Management and Analysis Methods. In: Denzin, N.; Lincoln, Y., editors.Handbook of Qualitative Research. Sage Publications; Thousand Oaks, CA: 2000.
35. Samejima F. Estimation of latent ability using a response pattern of graded scores. PsychometrikaMonograph, No. 17. 1969
36. Orlando M, Thissen D. Further investigation of the performance of S-X2: An item fit index for usewith dichotomous item response theory models. Applied Psychological Measurement 2003;27:289–298.
37. LaFrance WC, Kanner AM, Hermann B. Psychiatric comorbidities in epilepsy. International Reviewof Neurobiology 2008;83:347–83. [PubMed: 18929092]
38. Alonso J, Buron A, Bruffaerts R, He Y, Posada-Villa J, Lepine JP, Angermeyer MC, Levinson D, deGirolamo G, Tachimori H, Mneimneh ZN, Medina-Mora ME, Ormel J, Scott KM, Gureje O, HaroJM, Gluzman S, Lee S, Vilagut G, Kessler RC, Von Korff M. Association of perceived stigma andmood and anxiety disorders: results from the World Mental Health Surveys. Acta PsychiatricaScandinavica 2008;118(4):305–14. [PubMed: 18754833]
39. Zubrod C, Schneiderman M, Frei E. Appraisal of methods for the study of chemotherapy of cancerin man: Comparative therapeutic trial of nitrogen mustard and triethylene thiophosphoramide. Journalof Chronic Disease 1960;11:7–33.
40. Cohen J. A Power Primer. Psychological Bulletin 1992;112:155–159. [PubMed: 19565683]41. Hambleton, RK.; Swaminathan, H.; Rogers, HJ. Fundamentals of Item Response Theory. Sage
Publications, Inc.; Newbury Park, CA: 1992.42. Penfield R. DIFAS: Differential Item Functioning Analysis System. Applied Psychological
Measurement 2005;29:150.43. Perez L, Huang J, Jansky L, Nowinski C, Victorson D, Peterman A, et al. Using focus groups to
inform the Neuro-QOL measurement tool: Exploring patient-centered, health-related quality of lifeconcepts across neurological conditions. Journal of Neuroscience Nursing 2007;39(6):342–353.[PubMed: 18186419]
44. Cattell RB. The screen test for the number of factors. Multivariate Behavioral Research 1966;1:245–276.
45. Kaiser HF. The application of electronic computers to factor analysis. Educational and PsychologicalMeasurement 1960;20:141–151.
46. McDonald, RP. Test Theory: A Unified Treatment. Lawrence Erlbaum; Mahway, NJ: 1999.47. Lai JS, Crane PK, Cella D. Factor analysis techniques for assessing sufficient unidimensionality of
cancer related fatigue. Quality of Life Research 2006;15:1179–1190. [PubMed: 17001438]48. Reise S, Morizot J, Hays R. The role of the bifactor model in resolving dimensionality issues in health
outcomes measures. Quality of Life Research 2007;16:19–31. [PubMed: 17479357]
Rao et al. Page 10
Qual Life Res. Author manuscript; available in PMC 2010 June 1.
NIH
-PA Author Manuscript
NIH
-PA Author Manuscript
NIH
-PA Author Manuscript

Figure 1.The process by which stigma affects the person with an undesired condition.
Rao et al. Page 11
Qual Life Res. Author manuscript; available in PMC 2010 June 1.
NIH
-PA Author Manuscript
NIH
-PA Author Manuscript
NIH
-PA Author Manuscript

Figure 2. Information function and trait distribution for the Stigma Scale for Chronic Illness itemsNote: The information function and standard error are shown as lines within the plot. Thedistribution of individual trait scores are depicted as a histogram. The hash marks are locationsof the category threshold parameters that indicate that the test provides good measurement atmoderate to severe levels of stigma.
Rao et al. Page 12
Qual Life Res. Author manuscript; available in PMC 2010 June 1.
NIH
-PA Author Manuscript
NIH
-PA Author Manuscript
NIH
-PA Author Manuscript
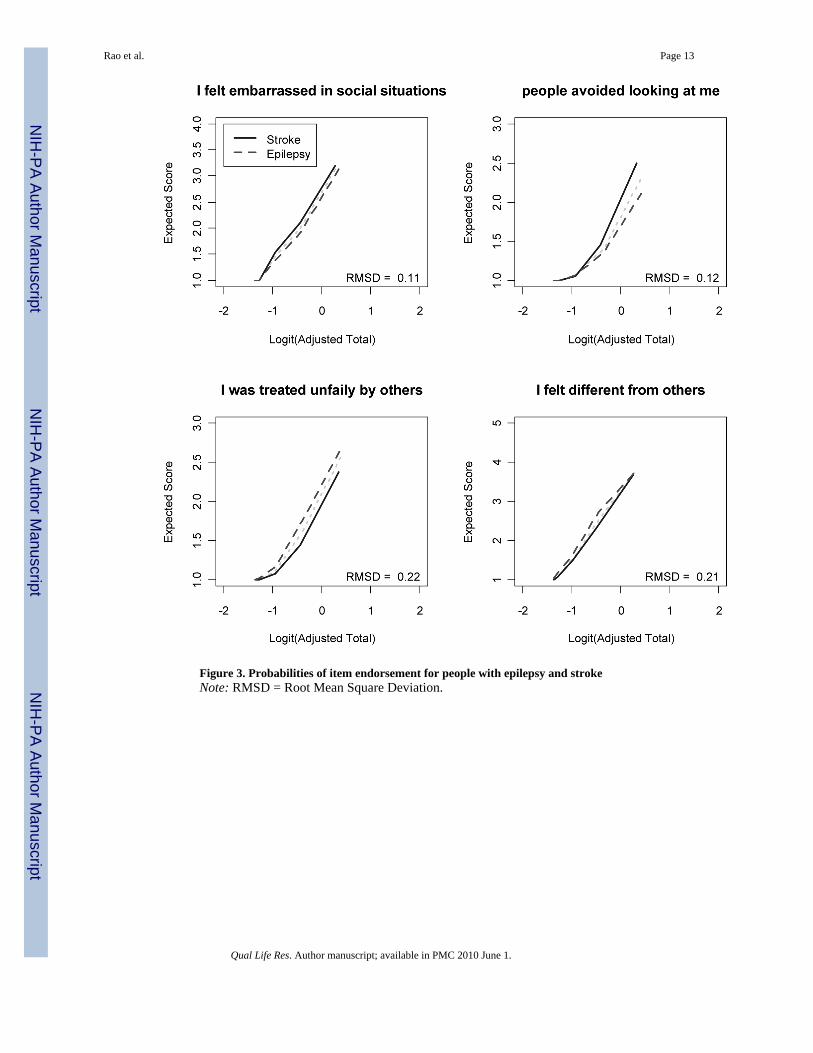
Figure 3. Probabilities of item endorsement for people with epilepsy and strokeNote: RMSD = Root Mean Square Deviation.
Rao et al. Page 13
Qual Life Res. Author manuscript; available in PMC 2010 June 1.
NIH
-PA Author Manuscript
NIH
-PA Author Manuscript
NIH
-PA Author Manuscript

NIH
-PA Author Manuscript
NIH
-PA Author Manuscript
NIH
-PA Author Manuscript
Rao et al. Page 14
Table 1
Instruments Examined Before Constructing Stigma Scale for Chronic Illness
Scale Target Illness [Reference]
Perceived Stigmatization Questionnaire (PSQ) Severe burns [22]
Self Stigma of Mental Illness Scale (SSMIS) Mental illness [12]
Quality of Life in Epilepsy Inventory for Adolescents(QOLIE-AD-48)
Epilepsy [23]
Epilepsy Foundation Concerns Index Epilepsy [24]
Impact on Epilepsy Scale Epilepsy [25]
HIV Stigma Scale HIV/AIDS [13]
Amyotrophic Lateral Sclerosis Assessment Questionnaire(ALSAQ-40)
Amyotrophic lateral sclerosis(ALS) [25]
Functional Assessment of Multiple Sclerosis (FAMS) Multiple sclerosis [26]
Leeds Multiple Sclerosis Quality of Life (LMSQoL) Multiple sclerosis [27]
The RAYS- A Quality of Life Scale for Multiple SclerosisPatients
Multiple sclerosis [28]
Parkinson’s Disease Quality of Life Questionnaire (PDQL) Parkinson’s Disease [29]
Qual Life Res. Author manuscript; available in PMC 2010 June 1.

NIH
-PA Author Manuscript
NIH
-PA Author Manuscript
NIH
-PA Author Manuscript
Rao et al. Page 15
Table 2
Self reported socio-demographic and clinical characteristics of the focus group, cognitive interview, and onlinesamples.
Variable Frequency (%2)
Focus Group Sample N = 56
Mean Age 52 years
Gender Male 28 (50)
Illness/Disease Alzheimer’s disease 8 (14)
Amyotrophic Lateral Sclerosis 8 (14)
Epilepsy 8 (14)
Parkinson’s disease 8 (14)
Stroke 8 (14)
Multiple sclerosis 16 (28)
Cognitive Interview Sample Total N = 17
Mean Age 55 years
Gender Male 7 (41)
Ethnicity Hispanic/Latino 0 (0)
Race European-American 16 (94)
Black/African-American 1 (6)
Native American, Asian-American, or PacificIslander
0 (0)
Illness/Disease Epilepsy 4 (23)
Amyotrophic Lateral Sclerosis 4 (23)
Multiple sclerosis 4 (23)
Parkinson’s disease 4 (23)
Stroke 1 (6)
Psychometric Sample Total N = 511
Mean Age 56 years
Gender Male 271 (53)
Ethnicity Hispanic/Latino 27 (5)
Race1 European-American 486 (95)
Black/African-American 15 (3)
Native American, Asian-American, or PacificIslander
29 (6)
Illness/Disease1 Stroke 209 (38)
Multiple Sclerosis 84 (15)
Parkinson’s Disease 59 (11)
Epilepsy 183 (33)
Amyotrophic Lateral Sclerosis 18 (3)
Psychological Distress Not anxious or depressed 263 (52)
Moderately anxious or depressed 215 (42)
Qual Life Res. Author manuscript; available in PMC 2010 June 1.

NIH
-PA Author Manuscript
NIH
-PA Author Manuscript
NIH
-PA Author Manuscript
Rao et al. Page 16
Variable Frequency (%2)
Extremely anxious or depressed 30 (6)
Performance Status Normal activity, without symptoms 167 (33)
Some symptoms, do not require bed restduring day
246 (48)
Bed rest for less than 50% of day 80 (16)
Bed rest for more than 50% of day 16 (3)
Unable to get out of bed 2 (0.4)
Pain No pain or discomfort 162 (32)
Moderate pain or discomfort 287 (57)
Extreme pain or discomfort 60 (12)
1Participants endorsed multiple categories
2Percentages may not add up to 100 due to rounding.
Qual Life Res. Author manuscript; available in PMC 2010 June 1.

NIH
-PA Author Manuscript
NIH
-PA Author Manuscript
NIH
-PA Author Manuscript
Rao et al. Page 17
Tabl
e 3
Item
Res
pons
e Th
eory
Mod
el F
it Pa
ram
eter
s
Item
Slop
eT
hres
hold
1T
hres
hold
2T
hres
hold
3T
hres
hold
4
Bec
ause
of m
y ill
ness
, Ife
lt em
otio
nally
dis
tant
from
oth
er p
eopl
e
3.53
−0.0
50.
380.
991.
67
Bec
ause
of m
y ill
ness
, Ife
lt le
ft ou
t of t
hing
s4.
00−0
.06
0.35
0.95
1.61
Bec
ause
of m
y ill
ness
, Ife
lt em
barr
asse
d in
soci
al si
tuat
ions
3.99
0.17
0.62
1.27
1.90
Bec
ause
of m
y ill
ness
, Iw
orrie
d ab
out o
ther
peop
le’s
atti
tude
sto
war
ds m
e
3.28
0.35
0.77
1.30
1.97
I was
unh
appy
abo
utho
w m
y ill
ness
aff
ecte
dm
y ap
pear
ance
2.67
0.17
0.62
1.19
1.63
Bec
ause
of m
y ill
ness
,it
was
har
d fo
r me
tost
ay n
eat a
nd c
lean
2.43
0.51
0.99
1.74
2.43
Bec
ause
of m
y ill
ness
, Iw
orrie
d th
at I
was
abu
rden
to o
ther
s
3.28
−0.1
60.
220.
931.
47
I fel
t em
barr
asse
d ab
out
my
illne
ss3.
460.
180.
591.
181.
69
I fel
t em
barr
asse
dbe
caus
e of
my
phys
ical
limita
tions
3.39
−0.0
70.
351.
021.
61
I fel
t em
barr
asse
d ab
out
my
spee
ch1.
940.
610.
981.
692.
43
Bec
ause
of m
y ill
ness
, Ife
lt di
ffer
ent f
rom
othe
rs
3.35
−0.1
10.
420.
961.
45
I ten
ded
to b
lam
em
ysel
f for
my
prob
lem
s1.
66−0
.34
0.31
1.24
2.16
I avo
ided
mak
ing
new
frie
nds t
o av
oid
telli
ngot
hers
abo
ut m
y ill
ness
3.09
0.54
0.98
1.43
1.93
Bec
ause
of m
y ill
ness
,so
me
peop
le se
emed
unco
mfo
rtabl
e w
ith m
e
3.44
0.10
0.75
1.43
2.40
Bec
ause
of m
y ill
ness
,4.
060.
350.
891.
552.
20
Qual Life Res. Author manuscript; available in PMC 2010 June 1.
NIH
-PA Author Manuscript
NIH
-PA Author Manuscript
NIH
-PA Author Manuscript
Rao et al. Page 18
Item
Slop
eT
hres
hold
1T
hres
hold
2T
hres
hold
3T
hres
hold
4so
me
peop
le a
void
edm
e.
Bec
ause
of m
y ill
ness
,pe
ople
wer
e un
kind
tom
e
3.31
0.65
1.26
2.10
3.09
Bec
ause
of m
y ill
ness
,pe
ople
mad
e fu
n of
me
2.85
0.89
1.48
2.29
2.97
Bec
ause
of m
y ill
ness
,pe
ople
avo
ided
look
ing
at m
e
3.92
0.67
1.23
1.81
2.70
Bec
ause
of m
y ill
ness
,st
rang
ers t
ende
d to
star
e at
me
2.66
0.74
1.35
2.04
2.54
Bec
ause
of m
y ill
ness
, Iw
as tr
eate
d un
fairl
y by
othe
rs
3.76
0.54
1.12
1.82
2.32
Bec
ause
of m
y ill
ness
,pe
ople
tend
ed to
igno
rem
y go
od p
oint
s
4.19
0.52
1.02
1.66
2.13
Som
e pe
ople
act
ed a
sth
ough
it w
as m
y fa
ult I
have
this
illn
ess
2.88
0.50
0.95
1.54
2.19
Peop
le w
ith m
y ill
ness
lost
thei
r job
s whe
nth
eir e
mpl
oyer
s fou
ndou
t abo
ut it
1.49
0.01
0.62
1.81
2.89
I los
t frie
nds b
y te
lling
them
that
I ha
ve th
isill
ness
2.52
0.88
1.39
1.96
2.69
Qual Life Res. Author manuscript; available in PMC 2010 June 1.