Mental Health Services Act (MHSA)
325
San Mateo County Health System Behavioral Health and Recovery Services (BHRS) Mental Health Services Act (MHSA) Annual Update for MHSA Programs and Expenditures Fiscal Year 2016-2017
-
Upload
khangminh22 -
Category
Documents
-
view
0 -
download
0
Transcript of Mental Health Services Act (MHSA)

San Mateo County Health System
Behavioral Health and Recovery Services (BHRS)
Mental Health Services Act (MHSA) Annual Update for MHSA Programs and Expenditures Fiscal Year 2016-2017
T A B L E O F C O N T E N T S TABLE OF CONTENTS .............................................................................................................................................. 2
MHSA COUNTY COMPLIANCE CERTIFICATION ....................................................................................................... 3
MHSA COUNTY FISCAL ACCOUNTABILITY COMPLIANCE ........................................................................................ 4
INTRODUCTION ..................................................................................................................................................... 5
MHSA BACKGROUND ............................................................................................................................................. 7
STAKEHOLDER INPUT ............................................................................................................................................. 8
COMMUNITY PROGRAM PLANNING PROCESS (CPP) ........................................................................................................ 9 PUBLIC COMMENT AND PUBLIC HEARING ..................................................................................................................... 12 ISSUE RESOLUTION PROCESS (IRP) .............................................................................................................................. 13 PRIORITY EXPANSION AND PROGRAM .......................................................................................................................... 14 INNOVATION PROJECT PLANNING ................................................................................................................................ 15
FUNDING SUMMARY ........................................................................................................................................... 16
FUNDING CONSIDERATIONS ......................................................................................................................................... 22 FUNDING ALLOCATION PER YEAR................................................................................................................................. 24
ANNUAL UPDATE FY 2016-2017 ........................................................................................................................... 25
COMMUNITY SERVICES AND SUPPORTS (CSS) – FULL SERVICE PARTNERSHIP (FSP) ......................................................... 25 COMMUNITY SERVICES AND SUPPORTS (CSS) – OUTREACH AND ENGAGEMENT (O&E) ................................................... 47 COMMUNITY SERVICES AND SUPPORTS (CSS) – SYSTEM DEVELOPMENT (SD) ................................................................. 54 PREVENTION AND EARLY INTERVENTION (PEI) .............................................................................................................. 64 INNOVATIONS (INN) .................................................................................................................................................. 86 WORKFORCE EDUCATION AND TRAINING (WET) .......................................................................................................... 90 HOUSING ................................................................................................................................................................... 99
APPENDIX .......................................................................................................... ERROR! BOOKMARK NOT DEFINED.
Page 2 of 101

M H S A C O U N T Y C O M P L I A N C E C E R T I F I C A T I O N
Page 3 of 101

M H S A C O U N T Y F I S C A L A C C O U N TA B I L I T Y C O M P L I A N C E
Page 4 of 101

I N T R O D U C T I O N Located on the San Francisco Peninsula, San Mateo County is bordered by the Pacific Ocean to the west and San Francisco Bay to the east. The County was formed in April 1856 out of the southern portion of then-San Francisco County. Within its 455 square miles, the County is known for a mild climate and scenic vistas. It is home to some of the most spectacular and varied geography in the United States that includes redwood forests, rolling hills, farmland, tidal marshes, creeks and beaches. The County is committed to building a healthy community. In collaboration with community-based partners, the County provides access to health care services, especially to the underserved and unserved as well as creating a safe and convenient opportunities for physical activities. Much of the shoreline along the San Francisco Bay is part of the San Francisco Bay Trail. This trail provides residents and visitors alike with miles of biking and walking in the numerous park and recreation areas, and trails. The County has long been a center for innovation. It is home to numerous colleges and research parks and is within the “golden triangle” of three of the top research institutions in the world: Stanford University, the University of California at San Francisco and the University of California at Berkeley. Today, San Mateo County’s bioscience, computer software, green technology, hospitality,
financial management, health care and transportation companies are industry leaders. Situated in San Mateo County is San Francisco International Airport, the second largest and busiest airport in California, and the Port of Redwood City, which is the only deep water port in the Southern part of the San Francisco Bay. These economic hubs have added to the rapidly growing vitality of the County.
Page 5 of 101
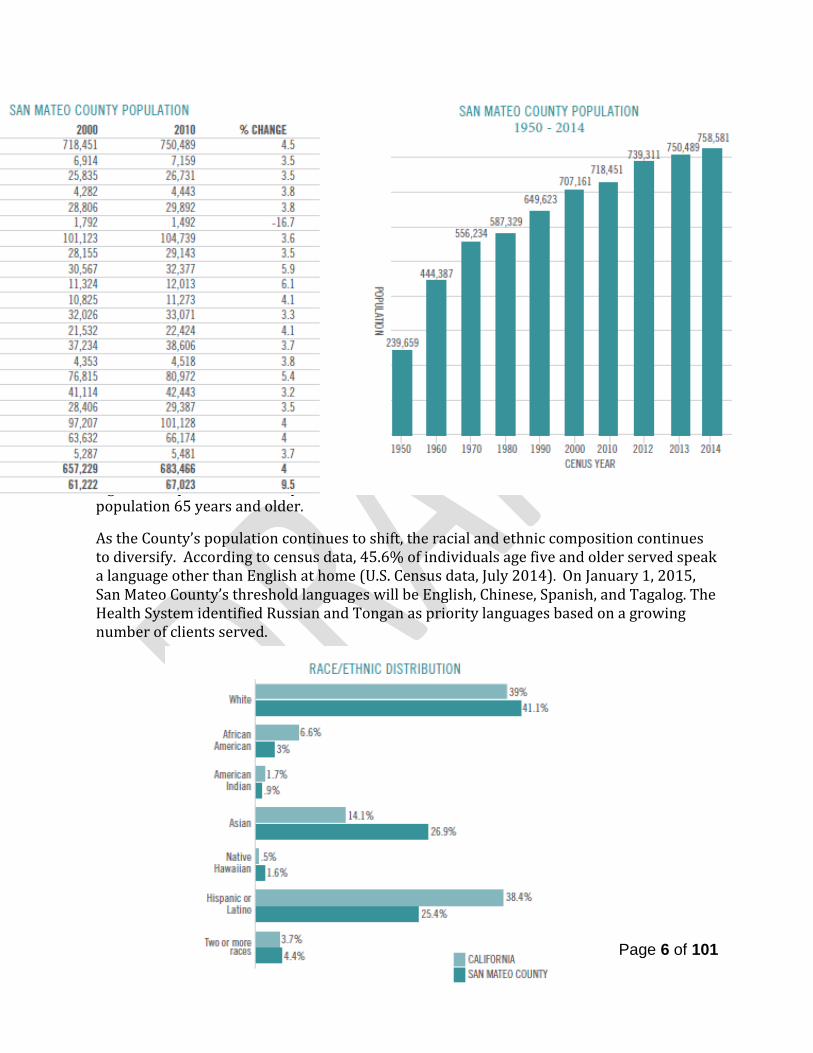
The 2013 population estimated by the U.S. Census Bureau was 750,489 — a 4.5 percent jump over the 2010 Census — and by 2014 that number had climbed by 5.6 percent over the last official count to 758,581.
Within San Mateo County, Daly City remains the most populous city followed by San Mateo and Redwood City.
The median age of San Mateo County residents was 39.3 years compared to the state’s median age of 35.2 years. Portola Valley had the highest median age of 51.3 years while East Palo Alto had the lowest at 28.1 years. Census projections indicate a significant spike in the county’s population 65 years and older.
As the County’s population continues to shift, the racial and ethnic composition continues to diversify. According to census data, 45.6% of individuals age five and older served speak a language other than English at home (U.S. Census data, July 2014). On January 1, 2015, San Mateo County’s threshold languages will be English, Chinese, Spanish, and Tagalog. The Health System identified Russian and Tongan as priority languages based on a growing number of clients served.
Page 6 of 101
M H S A B A C K G R O U N D Proposition 63, the Mental Health Services Act (MHSA), was approved by California voters in November 2004 and provided dedicated funding for mental health services by imposing a 1% tax on personal income over $1 million dollars translating to about $23 million annual average for San Mateo County in the last four years through Fiscal Year 2015-16.
Principles and Funding Boundaries MHSA emphasizes transformation of the mental health system while improving the quality of life for individuals living with mental illness. MHSA provides funding for treatment, prevention and early intervention, outreach, support services, family involvement, and programs to increase access to services for underserved communities. Core values include:
Community collaboration Cultural competence Consumer and family driven services Focus on wellness, recovery, resiliency Integrated service experience
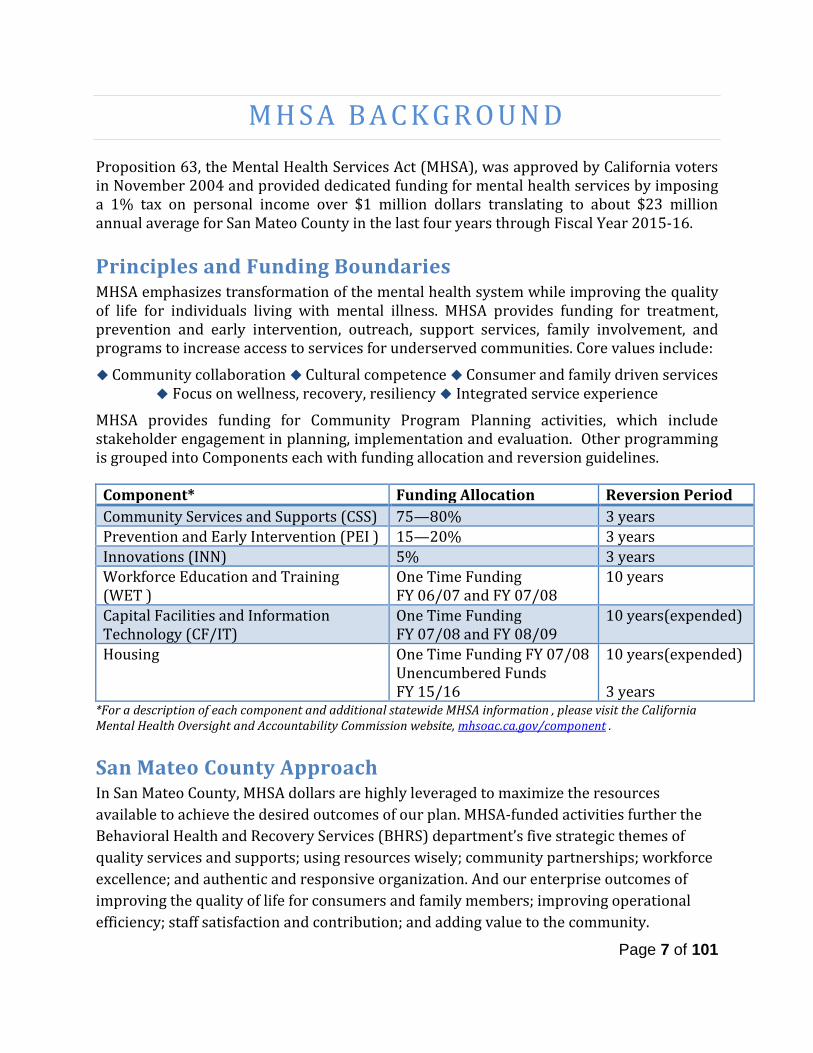
MHSA provides funding for Community Program Planning activities, which include stakeholder engagement in planning, implementation and evaluation. Other programming is grouped into Components each with funding allocation and reversion guidelines.
Component* Funding Allocation Reversion Period Community Services and Supports (CSS) 75—80% 3 years Prevention and Early Intervention (PEI ) 15—20% 3 years Innovations (INN) 5% 3 years Workforce Education and Training (WET )
One Time Funding FY 06/07 and FY 07/08
10 years
Capital Facilities and Information Technology (CF/IT)
One Time Funding FY 07/08 and FY 08/09
10 years(expended)
Housing One Time Funding FY 07/08 Unencumbered Funds FY 15/16
10 years(expended) 3 years
*For a description of each component and additional statewide MHSA information , please visit the California Mental Health Oversight and Accountability Commission website, mhsoac.ca.gov/component .
San Mateo County Approach In San Mateo County, MHSA dollars are highly leveraged to maximize the resources available to achieve the desired outcomes of our plan. MHSA-funded activities further the Behavioral Health and Recovery Services (BHRS) department’s five strategic themes of quality services and supports; using resources wisely; community partnerships; workforce excellence; and authentic and responsive organization. And our enterprise outcomes of improving the quality of life for consumers and family members; improving operational efficiency; staff satisfaction and contribution; and adding value to the community.
Page 7 of 101
S T A K E H O L D E R I N P U T
The San Mateo County Behavioral Health and Recovery Services (BHRS) promotes a vision of collaboration and integration by embedding MHSA programs and services within existing programmatic and administrative structures. San Mateo County does not separate MHSA planning from its other continuous planning processes. Given this, stakeholder input from system-wide planning activities is taken into account in MHSA planning. One of these system-wide planning and transformation activities is the Community Service Area (CSA) model development that was undertaken in 2012, by BHRS. CSAs provided a perfect opportunity to explore what integration could look like for San Mateo County by bringing together local resources from different fields—education, health care, nonprofits, faith-based organizations, law enforcement and others—together to connect people to mental health or substance use prevention, early intervention, treatment, and recovery supports in designated areas in the county. The following regional CSA’s were established; officially shifting the entire County and MHSA activities to this new service delivery approach:
• South CSA (San Carlos, Redwood City, Woodside, Atherton, West Menlo Park, Portola Valley)
• Central CSA (Burlingame, Hillsborough, San Mateo, Foster City, Belmont) • Coastside CSA (Half Moon Bay, La Honda, Pescadero) • East Palo Alto CSA (East Menlo Park, East Palo Alto) • Northwest CSA (Daly City, Pacifica, Colma) • Northeast CSA (Brisbane, South San Francisco, San Bruno, Milbrae)
Since the last MHSA Annual Update, the Community Advisory Committees (CAC), community-driven stakeholder convenings, have focused on tailoring the CSA model to the needs of specific geographical areas and developing action plans. The CAC, along with a CSA Manager, guide the work of the CSAs and implementation of the action plans. The goal is that the committees are comprised of 51% clients and family members. These permanent committees will have an important role in the local system transformation, its values, activities and directions, including MHSA planning. To-date, each CSA has hosted multiple days of partnering, at least one community event focused on local priority issues (e.g. strengthening service organizations collaboration, violence prevention, chronic homelessness, etc.), have localized field crisis efforts and CAC’s are meeting regularly to implement their action plans. For more on the CSA model please visit www.smchealth.org/BHRSGoodModern.
Page 8 of 101

Community Program Planning Process (CPP) In 2005, BHRS devised a local planning process and structure to seek input from the broad San Mateo County stakeholder community. This planning and input structure has remained in place and has since framed all the planning activities related to MHSA. The Mental Health and Substance Abuse Recovery Commission (MHSARC), formerly the Mental Health Board, is involved in all MHSA planning activities providing input and receiving regular updates. The meetings of the MHSARC are open to the public, and attendance is encouraged through various means: notice of meetings (flyers, emails) are sent to a broad, increasing network of contacts including community partners and County agencies, as well as consumer and advocacy organizations, and the general public. There is an MHSA update as a standing item on the MHSARC monthly meeting agenda. The MHSA Steering Committee was also created in 2005 and continues to play a critical role in the development of MHSA program and expenditure plans. The MHSA Steering Committee makes recommendations to the planning and services development process and as a group, assures that MHSA planning reflects local diverse needs and priorities, contains the appropriate balance of services within available resources and meets the criteria and goals established. The Steering Committee meetings are open to the public and include time for public comment as well as means for submission of written comments. The Steering Committee is co-chaired by a member of the San Mateo County Board of Supervisors and by the Chair of the MHSARC. Comprised of over 40 community leaders representing the diverse San Mateo community including behavioral health constituencies (clients, advocates, family members, community partners, County and CBO staff), and non-behavioral health constituencies (County leadership, Education, Healthcare, Criminal Justice, Probation, Courts, among others). Additionally, all members of the MHSARC are members of the MHSA Steering Committee. In FY 2015-16, the MHSA Steering Committee Guidelines were updated with input from the members to ensure diverse voices from all stakeholders. The updates include both membership targets and an application process, see Appendix 1. MHSA implementation is very much a part of BHRS’ day-to-day business. Information is made available on the San Mateo County MHSA webpage, www.smchealth.org/bhrs/mhsa The site includes a subscription feature to receive an email notification when the website is updated with MHSA developments, meetings and opportunities for input. This is currently at over 900 subscribers, increased 100+ in the last year. Hard copies of materials are made available upon request. The BHRS’s e-journal, Wellness Matters is published the first Wednesday of every other month and distributed electronically with a standing column written by the County’s MHSA Manager. The BHRS Blog, www. smcbhrsblog.org, provides an additional forum for MHSA to discuss policies and issues, make announcements and other communication. In addition, presentations and ongoing progress reports are provided by BHRS, and input is sought on an ongoing basis.
Page 9 of 101
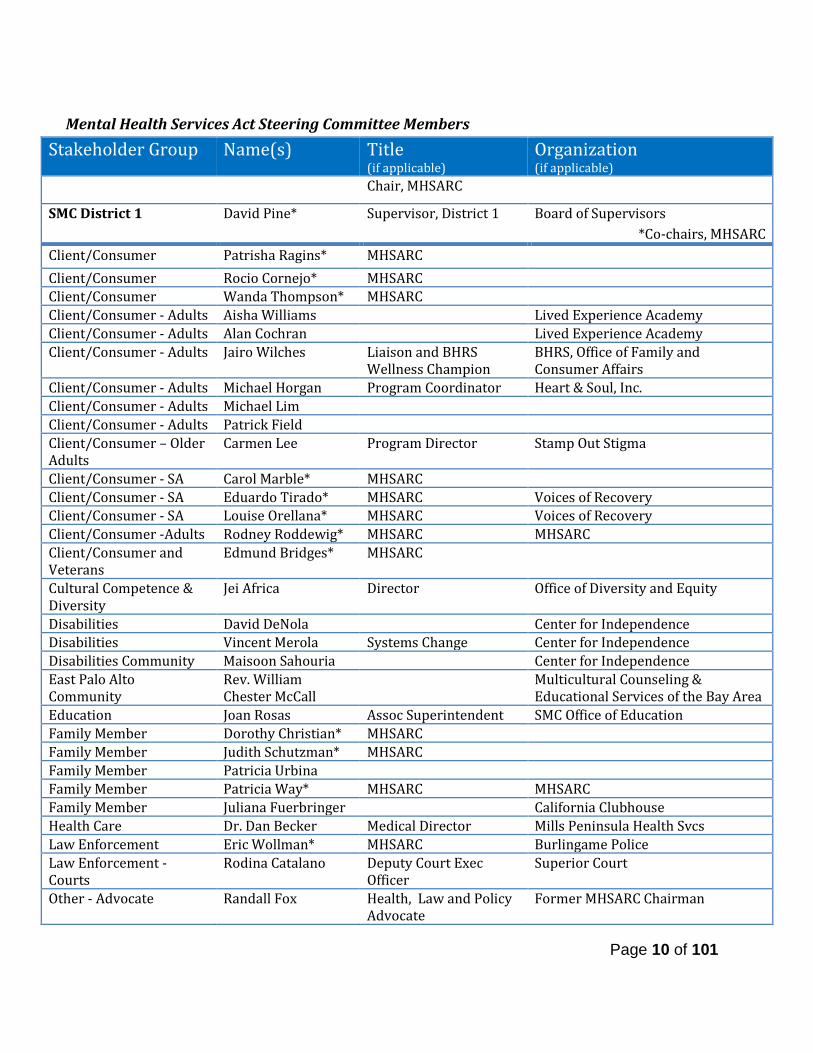
Mental Health Services Act Steering Committee Members
Stakeholder Group Name(s) Title (if applicable)
Organization (if applicable)
Chair, MHSARC
SMC District 1 David Pine* Supervisor, District 1 Board of Supervisors *Co-chairs, MHSARC
Client/Consumer Patrisha Ragins* MHSARC Client/Consumer Rocio Cornejo* MHSARC Client/Consumer Wanda Thompson* MHSARC Client/Consumer - Adults Aisha Williams Lived Experience Academy Client/Consumer - Adults Alan Cochran Lived Experience Academy Client/Consumer - Adults Jairo Wilches Liaison and BHRS
Wellness Champion BHRS, Office of Family and Consumer Affairs
Client/Consumer - Adults Michael Horgan Program Coordinator Heart & Soul, Inc. Client/Consumer - Adults Michael Lim Client/Consumer - Adults Patrick Field Client/Consumer – Older Adults
Carmen Lee Program Director Stamp Out Stigma
Client/Consumer - SA Carol Marble* MHSARC Client/Consumer - SA Eduardo Tirado* MHSARC Voices of Recovery Client/Consumer - SA Louise Orellana* MHSARC Voices of Recovery Client/Consumer -Adults Rodney Roddewig* MHSARC MHSARC Client/Consumer and Veterans
Edmund Bridges* MHSARC
Cultural Competence & Diversity
Jei Africa Director Office of Diversity and Equity
Disabilities David DeNola Center for Independence Disabilities Vincent Merola Systems Change Center for Independence Disabilities Community Maisoon Sahouria Center for Independence East Palo Alto Community
Rev. William Chester McCall
Multicultural Counseling & Educational Services of the Bay Area
Education Joan Rosas Assoc Superintendent SMC Office of Education Family Member Dorothy Christian* MHSARC Family Member Judith Schutzman* MHSARC Family Member Patricia Urbina Family Member Patricia Way* MHSARC MHSARC Family Member Juliana Fuerbringer California Clubhouse Health Care Dr. Dan Becker Medical Director Mills Peninsula Health Svcs Law Enforcement Eric Wollman* MHSARC Burlingame Police Law Enforcement - Courts
Rodina Catalano Deputy Court Exec Officer
Superior Court
Other - Advocate Randall Fox Health, Law and Policy Advocate
Former MHSARC Chairman
Page 10 of 101
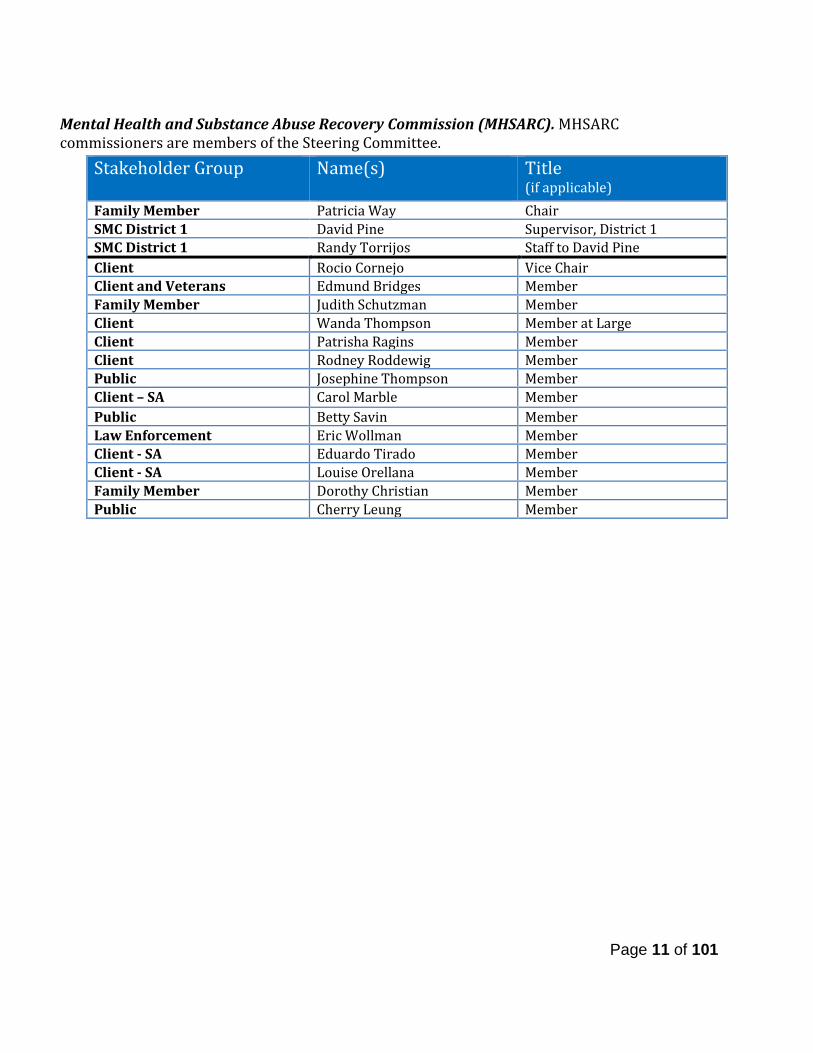
Mental Health and Substance Abuse Recovery Commission (MHSARC). MHSARC commissioners are members of the Steering Committee.
Stakeholder Group Name(s)
Title (if applicable)
Family Member Patricia Way Chair SMC District 1 David Pine Supervisor, District 1 SMC District 1 Randy Torrijos Staff to David Pine Client Rocio Cornejo Vice Chair Client and Veterans Edmund Bridges Member Family Member Judith Schutzman Member Client Wanda Thompson Member at Large Client Patrisha Ragins Member Client Rodney Roddewig Member Public Josephine Thompson Member Client – SA Carol Marble Member Public Betty Savin Member Law Enforcement Eric Wollman Member Client - SA Eduardo Tirado Member Client - SA Louise Orellana Member Family Member Dorothy Christian Member Public Cherry Leung Member
Page 11 of 101

Public Comment and Public Hearing This Annual Update will be presented to a combined MHSARC and MHSA Steering Committee meeting on December 7, 2016. At this meeting the MHSARC released the full document, Annual Update for MHSA Programs and Expenditures Fiscal Year 2016-2017 (covering program highlights and data from FY 2014-2015 programs), for a 30-day public comment. The MHSARC will hold a public hearing on January 4, 2017 to close the public comment period on January 7, 2017. Please see Appendix 2 for all public comments received during the implementation year and the MHSARC public comment periods. The final steps before submission of this Annual Update to the State of California Mental Health Services Oversight and Accountability Commission (MHSOAC), includes a presentation to our local Board of Supervisors for adoption of the plan and submission to the County of San Mateo Controller’s Office to certify expenditures. OUTREACH STRATEGIES Outreach strategies used to circulate information about the availability of the plan and request for public comment include:
• Flyers created and sent to/placed at County facilities, as well as other venues like family resource centers and community-based organizations;
• Numerous internal and external community meetings; • Information through program activities engaging diverse families and communities
(Parent Project, Health Ambassador Program, Lived Experience Academy, Mental Health First Aid trainings, etc.);
• E-mails disseminating information to over 1,800 electronic addresses; • Word of mouth on the part of committed staff and active stakeholders, • MHSA webpage smchealth.org/bhrs/mhsa, BHRS Wellness Matters e-journal and
the BHRS Blog www.smcbhrsblog.org
Page 12 of 101
Issue Resolution Process (IRP)
MHSA County Performance Contracts require that Counties adopt an Issue Resolution Process in order to resolve issues related to
1. the MHSA Community Program Planning (CPP) process; 2. consistency between approved MHSA plans and program implementation; and 3. the provision of MHSA funded programs.
Counties are required to keep and update an Issue Resolution Log to handle client disputes and complaints. The requirement is specific to having a formal process for stakeholders to bring up concerns related to MHSA planning, implementation and stakeholder engagement process, not just service/treatment issues. In San Mateo County, the Office of Consumer and Family Affairs (OCFA) manages service/treatment grievances. An MHSA IRP adds to the current BHRS grievance process in two ways:
• Any MHSA planning, implementation and stakeholder engagement issues would typically come through Public Comment, at a stakeholder input meeting or directly to the MHSA Manager, which will in turn report it to OCFA for appropriate logging, acknowledgement and other procedures as appropriate.
• OCFA will check off any service/treatment grievances related to MHSA-funded programs and this will allow us to query and identify these easily.
A draft IRP was brought to the OCFA team for input and to the April 2015 MHSA Steering Committee meeting for additional consideration and the BHRS Quality Improvement Team for further input. Also, the Mental Health Services Oversight and Accountability Commission held a Statewide technical assistance meeting on the topic, which San Mateo County staff attended. See Appendix 3 for the full San Mateo County MHSA IRP.
Page 13 of 101
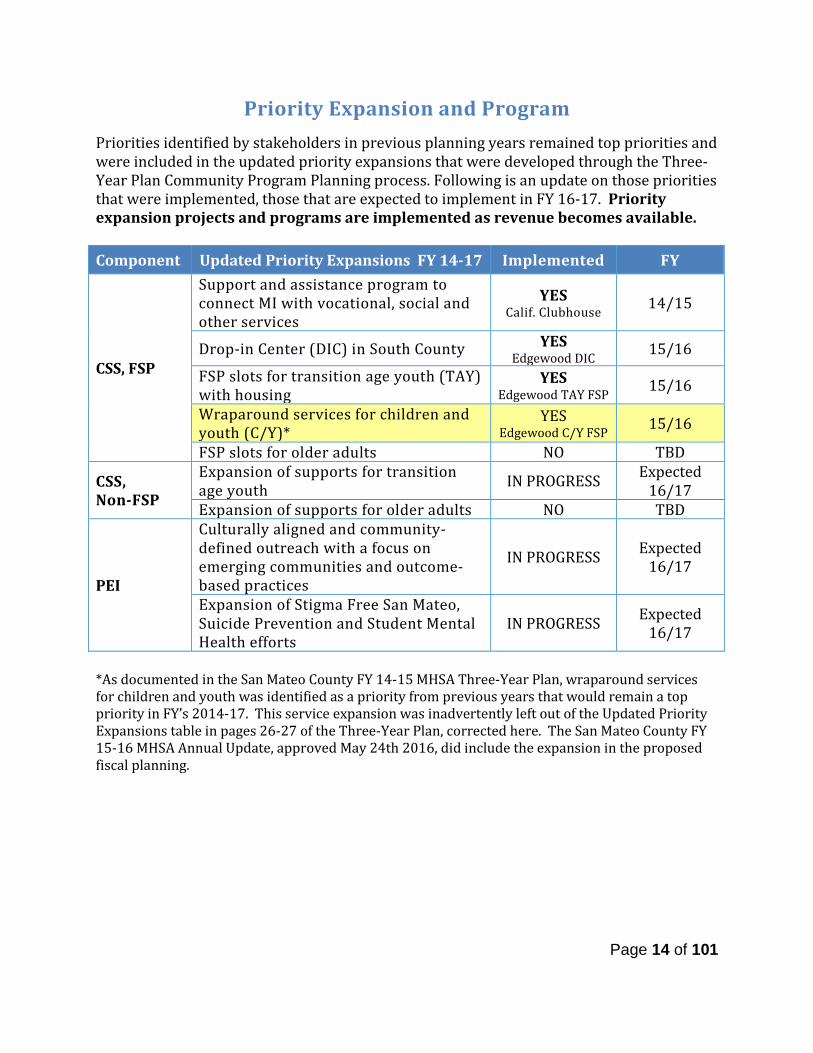
Priority Expansion and Program Priorities identified by stakeholders in previous planning years remained top priorities and were included in the updated priority expansions that were developed through the Three-Year Plan Community Program Planning process. Following is an update on those priorities that were implemented, those that are expected to implement in FY 16-17. Priority expansion projects and programs are implemented as revenue becomes available.
*As documented in the San Mateo County FY 14-15 MHSA Three-Year Plan, wraparound services for children and youth was identified as a priority from previous years that would remain a top priority in FY’s 2014-17. This service expansion was inadvertently left out of the Updated Priority Expansions table in pages 26-27 of the Three-Year Plan, corrected here. The San Mateo County FY 15-16 MHSA Annual Update, approved May 24th 2016, did include the expansion in the proposed fiscal planning.
Component Updated Priority Expansions FY 14-17 Implemented FY
CSS, FSP
Support and assistance program to connect MI with vocational, social and other services
YES Calif. Clubhouse 14/15
Drop-in Center (DIC) in South County YES Edgewood DIC 15/16
FSP slots for transition age youth (TAY) with housing
YES Edgewood TAY FSP 15/16
Wraparound services for children and youth (C/Y)*
YES Edgewood C/Y FSP 15/16
FSP slots for older adults NO TBD
CSS, Non-FSP
Expansion of supports for transition age youth IN PROGRESS Expected
16/17 Expansion of supports for older adults NO TBD
PEI
Culturally aligned and community-defined outreach with a focus on emerging communities and outcome-based practices
IN PROGRESS Expected 16/17
Expansion of Stigma Free San Mateo, Suicide Prevention and Student Mental Health efforts
IN PROGRESS Expected 16/17
Page 14 of 101
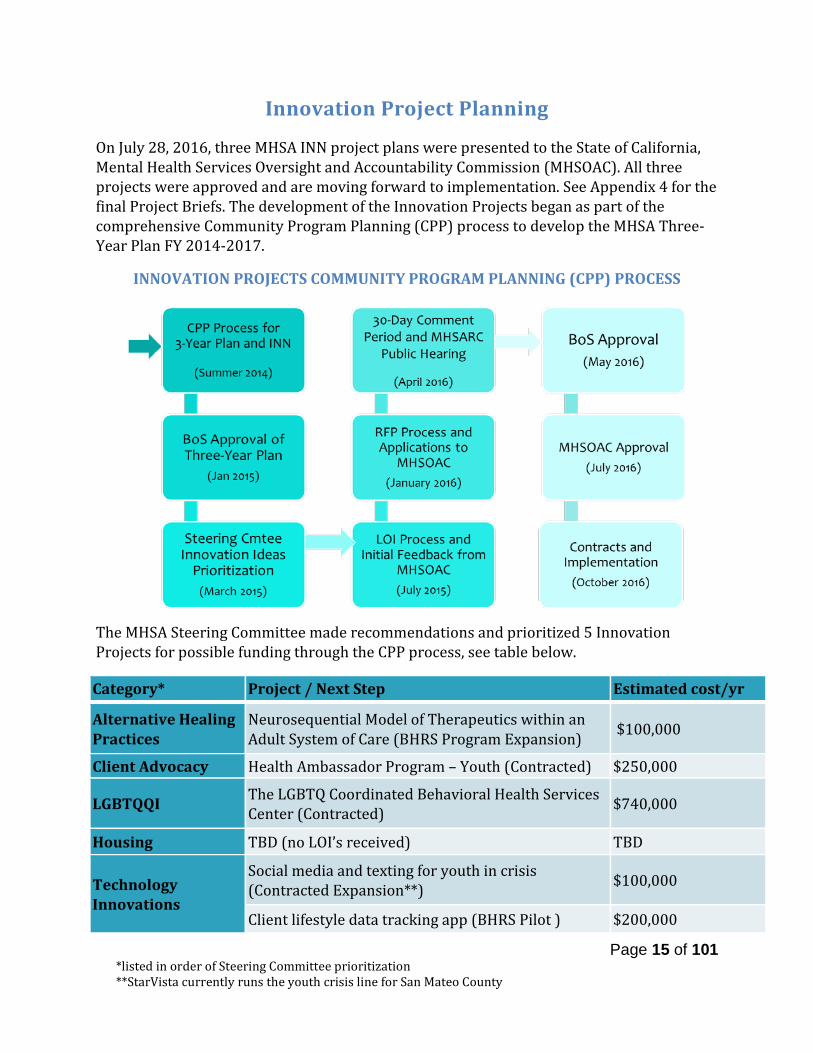
Innovation Project Planning On July 28, 2016, three MHSA INN project plans were presented to the State of California, Mental Health Services Oversight and Accountability Commission (MHSOAC). All three projects were approved and are moving forward to implementation. See Appendix 4 for the final Project Briefs. The development of the Innovation Projects began as part of the comprehensive Community Program Planning (CPP) process to develop the MHSA Three-Year Plan FY 2014-2017.
INNOVATION PROJECTS COMMUNITY PROGRAM PLANNING (CPP) PROCESS
The MHSA Steering Committee made recommendations and prioritized 5 Innovation Projects for possible funding through the CPP process, see table below.
Category* Project / Next Step Estimated cost/yr
Alternative Healing Practices
Neurosequential Model of Therapeutics within an Adult System of Care (BHRS Program Expansion) $100,000
Client Advocacy Health Ambassador Program – Youth (Contracted) $250,000
LGBTQQI The LGBTQ Coordinated Behavioral Health Services Center (Contracted) $740,000
Housing TBD (no LOI’s received) TBD
Technology Innovations
Social media and texting for youth in crisis (Contracted Expansion**) $100,000
Client lifestyle data tracking app (BHRS Pilot ) $200,000
*listed in order of Steering Committee prioritization **StarVista currently runs the youth crisis line for San Mateo County
Page 15 of 101
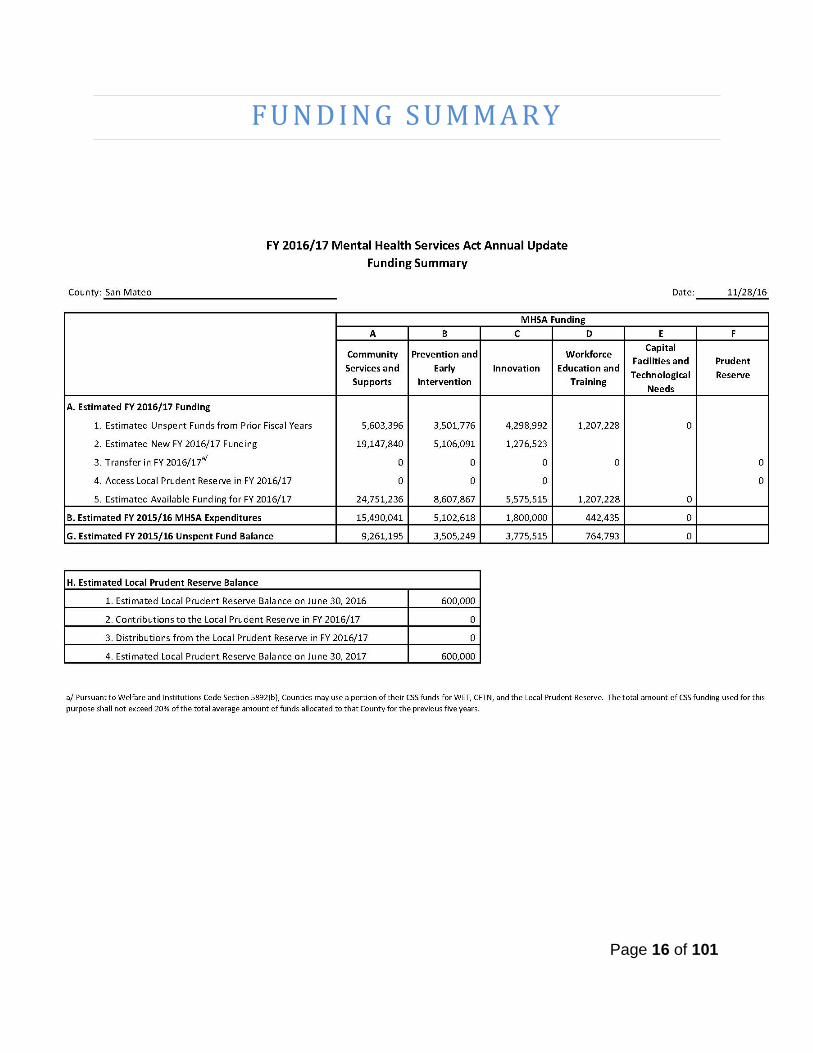
F U N D I N G S U M M A R Y
Page 16 of 101
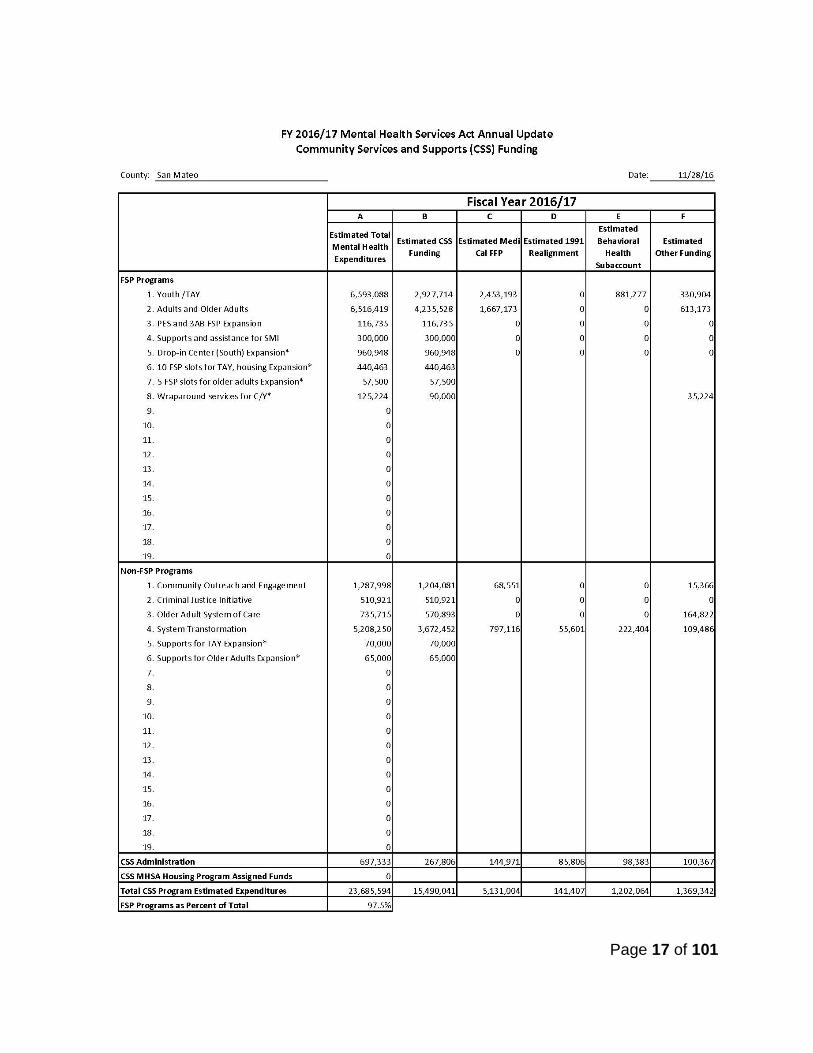
Page 17 of 101

Page 18 of 101
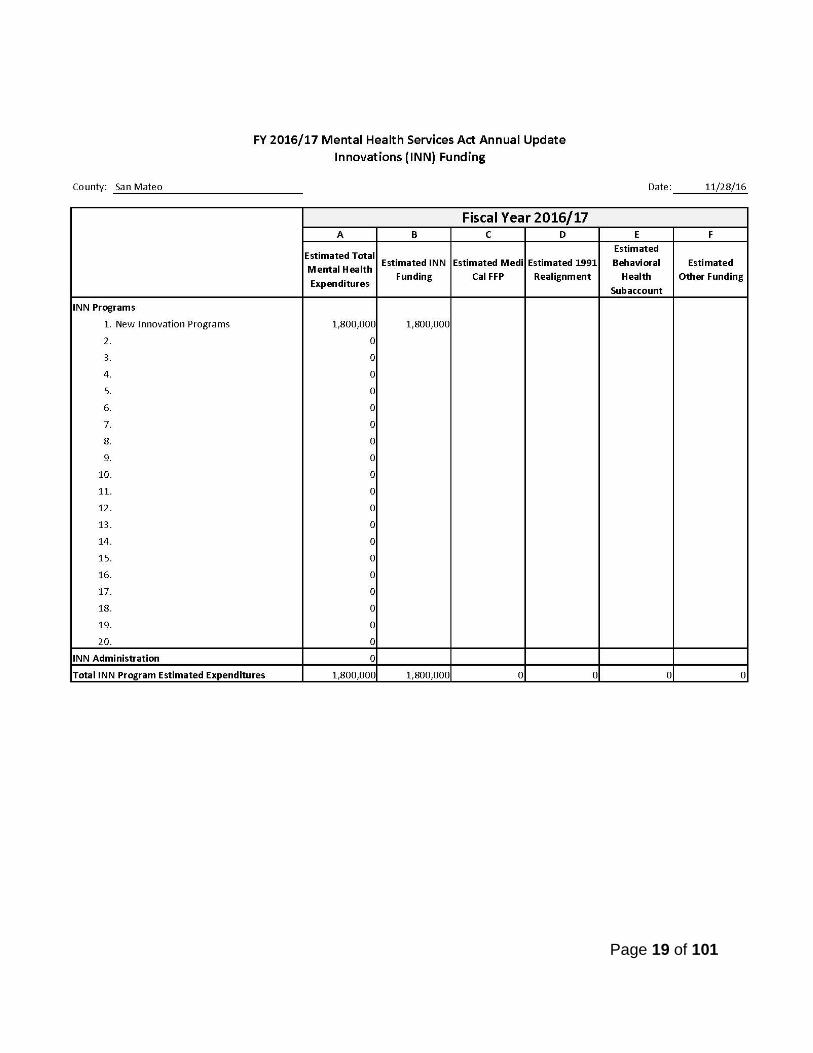
Page 19 of 101
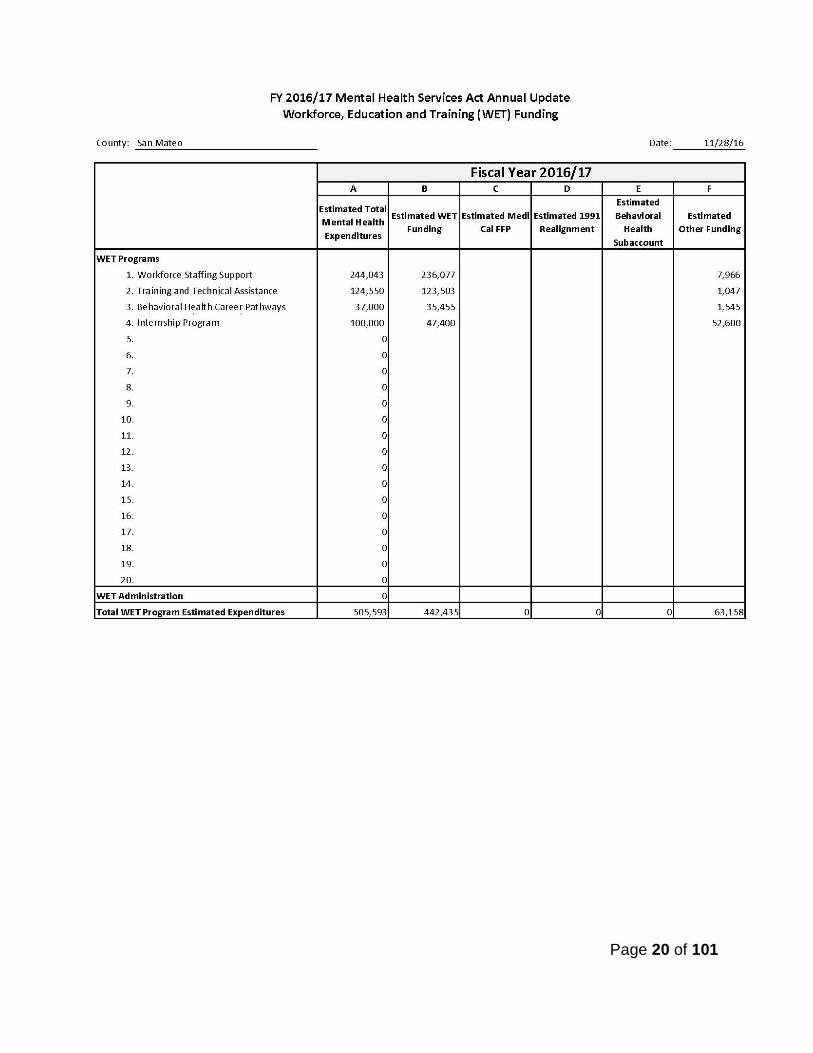
Page 20 of 101

Page 21 of 101

Funding Considerations Commencing on July 1, 2012, the County began receiving monthly MHSA allocations based on actual accrual of tax revenue (AB100). Since the State no longer provides an estimate of funding available to counties, it is impossible to know the exact allocation. We base the planning on various projections that take into account information produced by the State Department of Finance, analyses provided by the California Behavioral Health Director’s Association (CBHDA), and ongoing internal analyses of the State’s fiscal situation. When the new modality for the disbursement of MHSA revenue to counties was first implemented, there were funds in the Mental Health Services Funds (State level) waiting to be disbursed. These funds became a “one time” allocation that was sent in September of 2012 along with receipts from July, August and September. Additionally, changes in the tax law that took effect on January 1, 2013, led to many taxpayers filing in December 2012 in order to avoid paying higher taxes. This resulted in an additional increase in funding in FY 2013-14 and FY 2014-15. Reversion of MHSA one-time funding There are three MHSA funding components that were designated one-time allocation with a 10 year reversion, Workforce Education and Training (WET), Housing and Information Technology and Capital Facilities (IT/CF). The following is an update on each of the components:
• WET funds, totaling $3,437,600, were budgeted for 10 years through FY 17-18. We are currently working on a sustainability plan for WET efforts, which could include allocation of CSS and/or PEI funds for programs that have proven effective and further the component goals. A WET Impact Report is expected to be released in the spring of 2017.
• The majority of Housing funds were expended, see page 96 for the full Housing update. In September 2014, AB 1929 was passed which allowed counties to request and use unencumbered MHSA Housing Program funds to provide housing assistance. The San Mateo County Board of Supervisors adopted a resolution approving the request to release of these funds; a total of $1,073,038 was received from the Housing Program to be held in trust for housing assistance services.
• IT/CF dollars were used to fund the electronic health record system in FY 08/09, also known as eClinical Care or Avatar, which is the software used.
Priority Expansions During the Three-Year Plan and FY 2014-15 and 2015-16 Annual Update, significant decrease in PEI revenue was projected and BHRS anticipated having overall spending in the Three-Year Plan to decrease as well to make up for this deficit. Estimated unspent funds from previous years, increased projections for FY 2016-17and some savings from the Total Wellness (now funded by the Health Plan of San Mateo) program components that were covered under PEI, have allowed for implementation of the MHSA priority expansions identified in the Three-Year Plan.
Page 22 of 101
Most recently, the Governor’s May 2016 Revision included support for the portion of the Senate’s “No Place Like Home” housing proposal that relies on MHSA funds to securitize a $2 billion bond for chronically homeless individuals with serious mental illness. In order to help inform local analysis of the impacts, the County Behavioral Health Director’s Association (CBHDA) developed estimates of statewide and county-by-county impacts. San Mateo County cost would be $2 million in FY 16-17 funding, taken “off the top” of MHSA revenues each month, which means decreased expansion monies for MHSA programming. Prudent Reserve The prudent reserve remains at $600,000. The County has been reluctant to build up the reserve because the process for accessing was initially unclear. The prudent reserve concept was included in MHSA as a provision to ensure that unforeseen decreases in the revenue would not cause program to cease. We believe in this concept, and have actually managed significant fluctuations in MHSA funding with this same philosophy. However, we have preferred to leave unspent funds in an MHSA Trust Fund instead of constituting a reserve we weren’t sure we would be able to access if/when funds would be needed.
Page 23 of 101
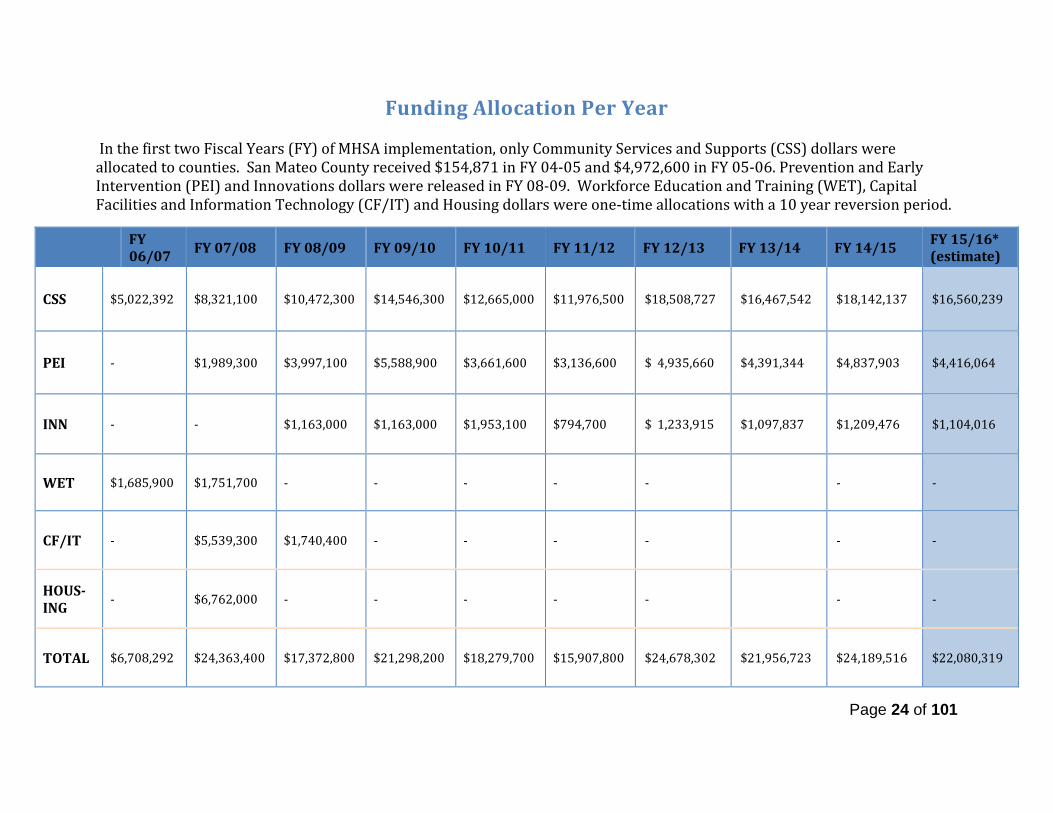
Funding Allocation Per Year In the first two Fiscal Years (FY) of MHSA implementation, only Community Services and Supports (CSS) dollars were allocated to counties. San Mateo County received $154,871 in FY 04-05 and $4,972,600 in FY 05-06. Prevention and Early Intervention (PEI) and Innovations dollars were released in FY 08-09. Workforce Education and Training (WET), Capital Facilities and Information Technology (CF/IT) and Housing dollars were one-time allocations with a 10 year reversion period.
FY 06/07 FY 07/08 FY 08/09 FY 09/10 FY 10/11 FY 11/12 FY 12/13 FY 13/14 FY 14/15 FY 15/16*
(estimate)
CSS $5,022,392 $8,321,100 $10,472,300 $14,546,300 $12,665,000 $11,976,500 $18,508,727 $16,467,542 $18,142,137 $16,560,239
PEI - $1,989,300 $3,997,100 $5,588,900 $3,661,600 $3,136,600 $ 4,935,660 $4,391,344 $4,837,903 $4,416,064
INN - - $1,163,000 $1,163,000 $1,953,100 $794,700 $ 1,233,915 $1,097,837 $1,209,476 $1,104,016
WET $1,685,900 $1,751,700 - - - - - - -
CF/IT - $5,539,300 $1,740,400 - - - - - -
HOUS-ING - $6,762,000 - - - - - - -
TOTAL $6,708,292 $24,363,400 $17,372,800 $21,298,200 $18,279,700 $15,907,800 $24,678,302 $21,956,723 $24,189,516 $22,080,319
Page 24 of 101
A N N U A L U P D A T E F Y 2 0 1 6 - 2 0 1 7
Community Services and Supports (CSS) – Full Service Partnership (FSP)
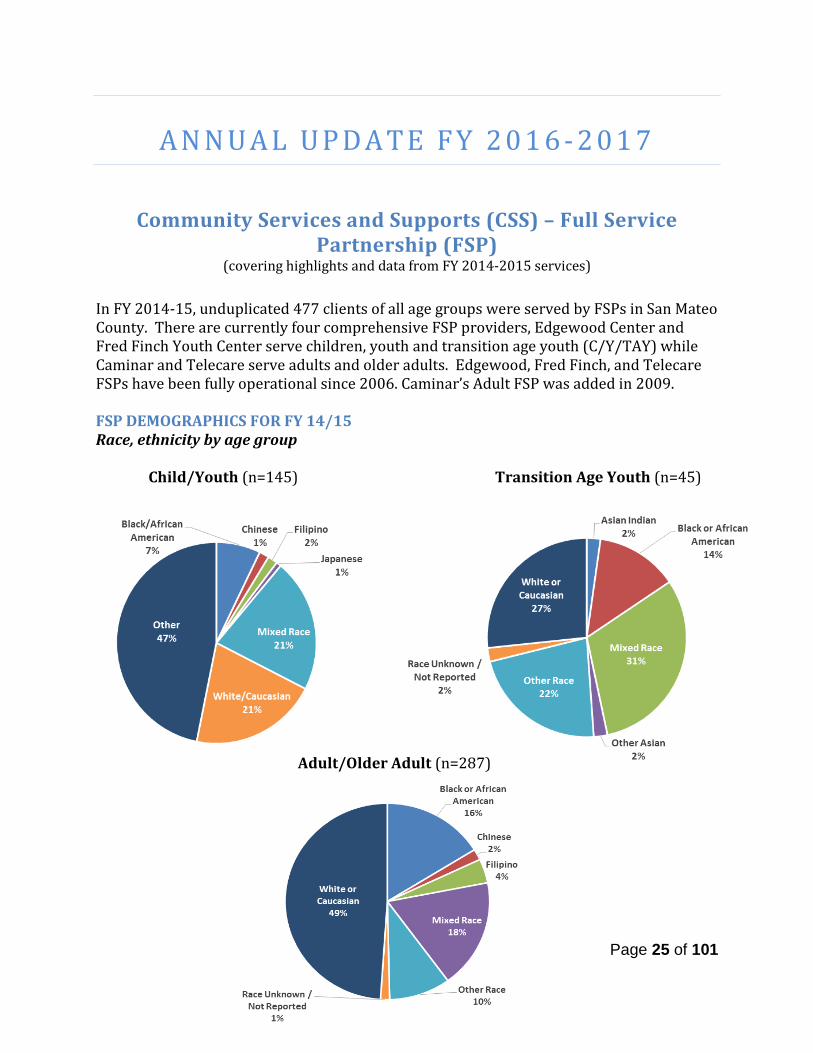
(covering highlights and data from FY 2014-2015 services) In FY 2014-15, unduplicated 477 clients of all age groups were served by FSPs in San Mateo County. There are currently four comprehensive FSP providers, Edgewood Center and Fred Finch Youth Center serve children, youth and transition age youth (C/Y/TAY) while Caminar and Telecare serve adults and older adults. Edgewood, Fred Finch, and Telecare FSPs have been fully operational since 2006. Caminar’s Adult FSP was added in 2009. FSP DEMOGRAPHICS FOR FY 14/15 Race, ethnicity by age group Child/Youth (n=145) Transition Age Youth (n=45)
Adult/Older Adult (n=287)
Page 25 of 101
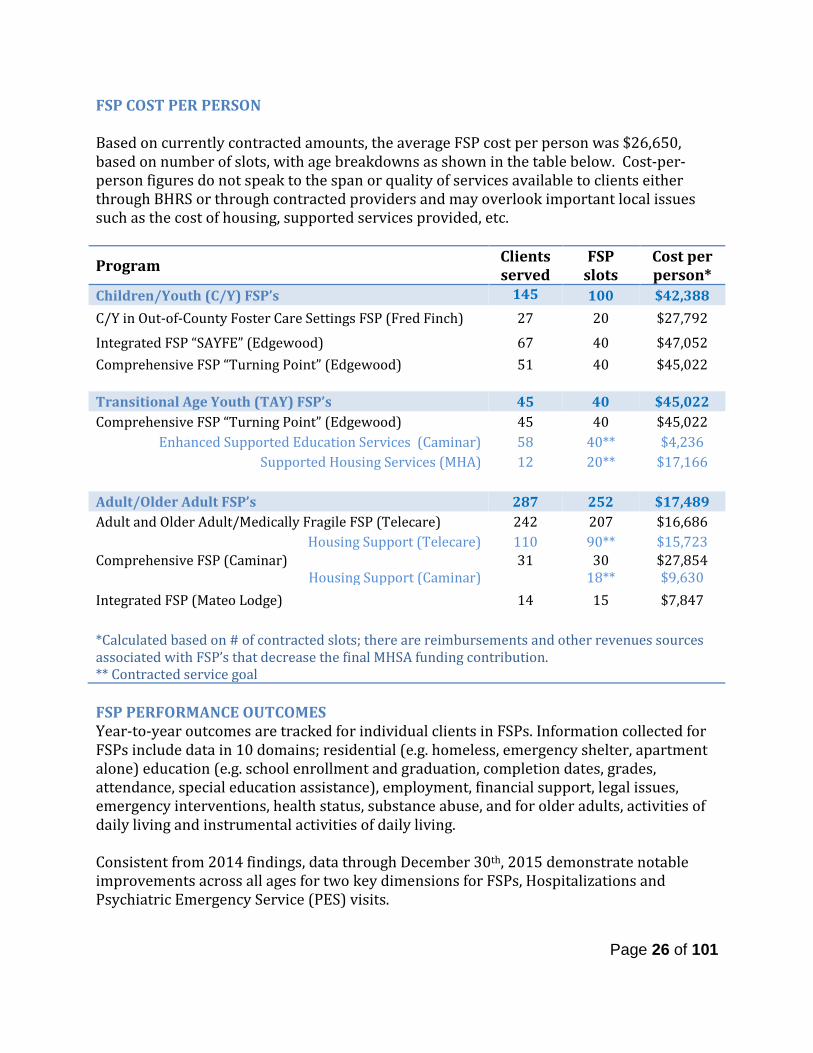
FSP COST PER PERSON Based on currently contracted amounts, the average FSP cost per person was $26,650, based on number of slots, with age breakdowns as shown in the table below. Cost-per-person figures do not speak to the span or quality of services available to clients either through BHRS or through contracted providers and may overlook important local issues such as the cost of housing, supported services provided, etc.
Program Clients served
FSP slots
Cost per person*
Children/Youth (C/Y) FSP’s 145 100 $42,388 C/Y in Out-of-County Foster Care Settings FSP (Fred Finch) 27 20 $27,792
Integrated FSP “SAYFE” (Edgewood) 67 40 $47,052 Comprehensive FSP “Turning Point” (Edgewood) 51 40 $45,022 Transitional Age Youth (TAY) FSP’s 45 40 $45,022 Comprehensive FSP “Turning Point” (Edgewood) 45 40 $45,022
Enhanced Supported Education Services (Caminar) 58 40** $4,236 Supported Housing Services (MHA) 12 20** $17,166
Adult/Older Adult FSP’s 287 252 $17,489 Adult and Older Adult/Medically Fragile FSP (Telecare) 242 207 $16,686
Housing Support (Telecare) 110 90** $15,723 Comprehensive FSP (Caminar)
Housing Support (Caminar) 31
30
18** $27,854 $9,630
Integrated FSP (Mateo Lodge) 14 15 $7,847 *Calculated based on # of contracted slots; there are reimbursements and other revenues sources associated with FSP’s that decrease the final MHSA funding contribution. ** Contracted service goal FSP PERFORMANCE OUTCOMES Year-to-year outcomes are tracked for individual clients in FSPs. Information collected for FSPs include data in 10 domains; residential (e.g. homeless, emergency shelter, apartment alone) education (e.g. school enrollment and graduation, completion dates, grades, attendance, special education assistance), employment, financial support, legal issues, emergency interventions, health status, substance abuse, and for older adults, activities of daily living and instrumental activities of daily living. Consistent from 2014 findings, data through December 30th, 2015 demonstrate notable improvements across all ages for two key dimensions for FSPs, Hospitalizations and Psychiatric Emergency Service (PES) visits.
Page 26 of 101
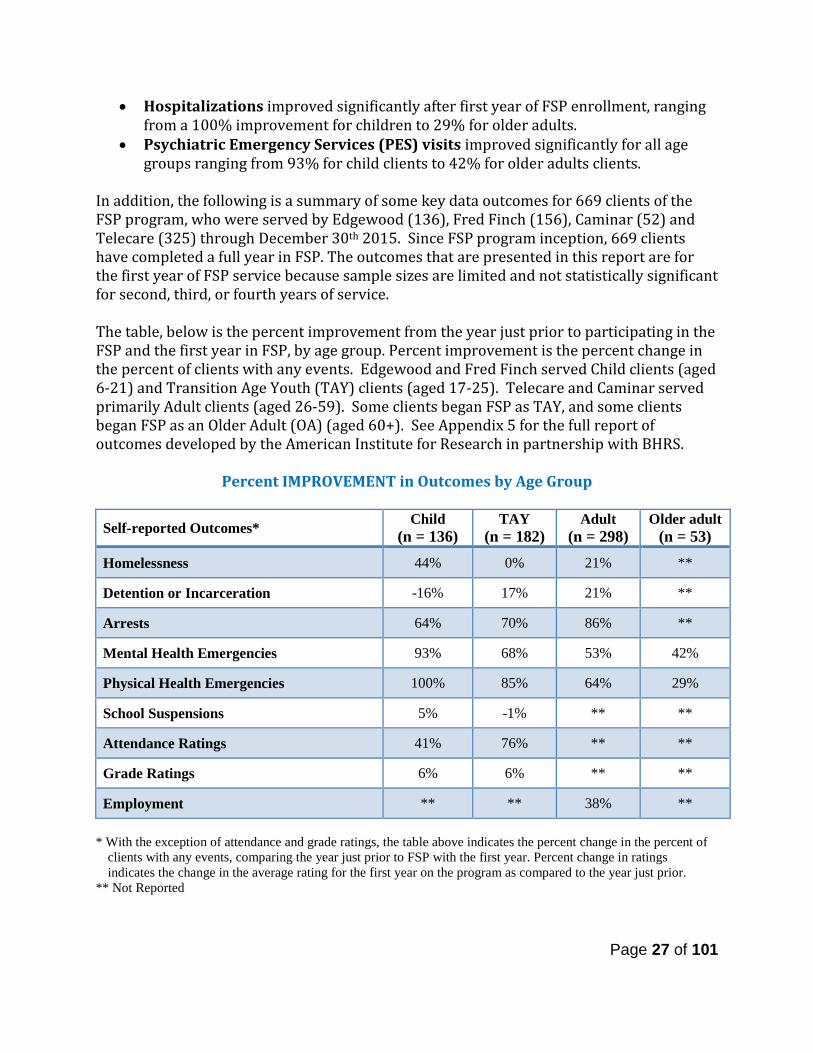
• Hospitalizations improved significantly after first year of FSP enrollment, ranging from a 100% improvement for children to 29% for older adults.
• Psychiatric Emergency Services (PES) visits improved significantly for all age groups ranging from 93% for child clients to 42% for older adults clients.
In addition, the following is a summary of some key data outcomes for 669 clients of the FSP program, who were served by Edgewood (136), Fred Finch (156), Caminar (52) and Telecare (325) through December 30th 2015. Since FSP program inception, 669 clients have completed a full year in FSP. The outcomes that are presented in this report are for the first year of FSP service because sample sizes are limited and not statistically significant for second, third, or fourth years of service. The table, below is the percent improvement from the year just prior to participating in the FSP and the first year in FSP, by age group. Percent improvement is the percent change in the percent of clients with any events. Edgewood and Fred Finch served Child clients (aged 6-21) and Transition Age Youth (TAY) clients (aged 17-25). Telecare and Caminar served primarily Adult clients (aged 26-59). Some clients began FSP as TAY, and some clients began FSP as an Older Adult (OA) (aged 60+). See Appendix 5 for the full report of outcomes developed by the American Institute for Research in partnership with BHRS.
Percent IMPROVEMENT in Outcomes by Age Group
Self-reported Outcomes* Child (n = 136)
TAY (n = 182)
Adult (n = 298)
Older adult (n = 53)
Homelessness 44% 0% 21% **
Detention or Incarceration -16% 17% 21% **
Arrests 64% 70% 86% **
Mental Health Emergencies 93% 68% 53% 42%
Physical Health Emergencies 100% 85% 64% 29%
School Suspensions 5% -1% ** **
Attendance Ratings 41% 76% ** **
Grade Ratings 6% 6% ** **
Employment ** ** 38% ** * With the exception of attendance and grade ratings, the table above indicates the percent change in the percent of
clients with any events, comparing the year just prior to FSP with the first year. Percent change in ratings indicates the change in the average rating for the first year on the program as compared to the year just prior.
** Not Reported
Page 27 of 101

FSP PROGRAMMATIC HIGHLIGHTS FOR FY 14/15 Children and Youth Placed in Out-of-County Foster Care Settings Background - Fred Finch Youth Center (FFYC) provides a wraparound-services model in the East Bay Wrap Full Service Partnership (EBW-FSP) to promote wellness, self-sufficiency, and self-care/healing to youth who are San Mateo County Court Dependents who now live out of County. When foster youth live out of their court dependent county, they often have difficulty accessing mental health services. The wraparound model helps provide intensive community based care that is rooted in a strengths-based approach. The youth and family receive individualized services to maximize families’ capacity to meet their child’s needs and thereby reduce the need for residential placement. All youth in the EBW-FSP are members of the sub-class for Katie A. services. To be eligible for EBW-FSP, youth must live outside of San Mateo County and demonstrate medical necessity. Child Welfare Workers refer youth to the program. BHRS screens the referrals through the inter-agency placement review committee process. After approval, the FFYC Program Manager receives notification that a specific youth has been authorized to receive services and staff coordinates a start date. Recommendations for interim care, including psychiatric and emergency care, are given as needed. Services are aimed at helping youth strengthen safe and healthy relationships, develop coping strategies and connect care givers and youth to support in their communities (both community and natural supports). The main goal of the EBW-FSP is to assist with “placement stability” and a reduction in mental health symptoms. To accomplish this, the FSP program helps provide intensive community based care that is rooted in a strengths-based approach using an active, individualized and family driven plan of action. The youth and family receive individualized services (combination of psychotherapy, behavioral interventions and case management) to maximize families’ capacity to meet their child’s needs and thereby reduce the need for residential placement. Staff utilizes Cognitive Behavioral Therapy, Assertive Community Treatment, Behavior Modification and Motivational Interviewing approaches. There is a trauma informed approach rooted in the EBW-FSP programming that understands early trauma impacts brain development and an important area of focus must be on sensory integration and self-regulation skill building. The EBW-FSP treatment team consists of 2.5 full time Care Coordinators, one Psychiatrist, one full time bilingual Youth Partner and one full time Parent Partner. The youth and parent partners require lived experience as a consumer or family member. Families also have access to on-call clinician to help during crisis and encourage de-escalation techniques.
Page 28 of 101
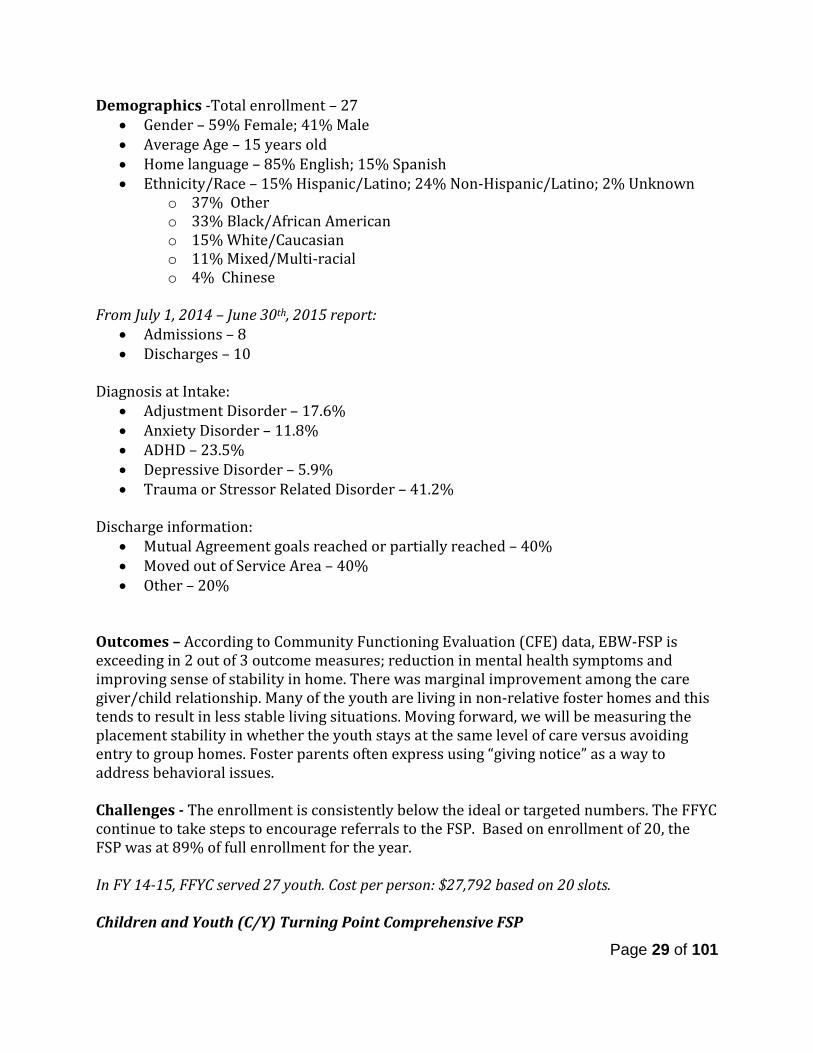
Demographics -Total enrollment – 27 • Gender – 59% Female; 41% Male • Average Age – 15 years old • Home language – 85% English; 15% Spanish • Ethnicity/Race – 15% Hispanic/Latino; 24% Non-Hispanic/Latino; 2% Unknown
o 37% Other o 33% Black/African American o 15% White/Caucasian o 11% Mixed/Multi-racial o 4% Chinese
From July 1, 2014 – June 30th, 2015 report:
• Admissions – 8 • Discharges – 10
Diagnosis at Intake:
• Adjustment Disorder – 17.6% • Anxiety Disorder – 11.8% • ADHD – 23.5% • Depressive Disorder – 5.9% • Trauma or Stressor Related Disorder – 41.2%
Discharge information:
• Mutual Agreement goals reached or partially reached – 40% • Moved out of Service Area – 40% • Other – 20%
Outcomes – According to Community Functioning Evaluation (CFE) data, EBW-FSP is exceeding in 2 out of 3 outcome measures; reduction in mental health symptoms and improving sense of stability in home. There was marginal improvement among the care giver/child relationship. Many of the youth are living in non-relative foster homes and this tends to result in less stable living situations. Moving forward, we will be measuring the placement stability in whether the youth stays at the same level of care versus avoiding entry to group homes. Foster parents often express using “giving notice” as a way to address behavioral issues. Challenges - The enrollment is consistently below the ideal or targeted numbers. The FFYC continue to take steps to encourage referrals to the FSP. Based on enrollment of 20, the FSP was at 89% of full enrollment for the year. In FY 14-15, FFYC served 27 youth. Cost per person: $27,792 based on 20 slots. Children and Youth (C/Y) Turning Point Comprehensive FSP
Page 29 of 101
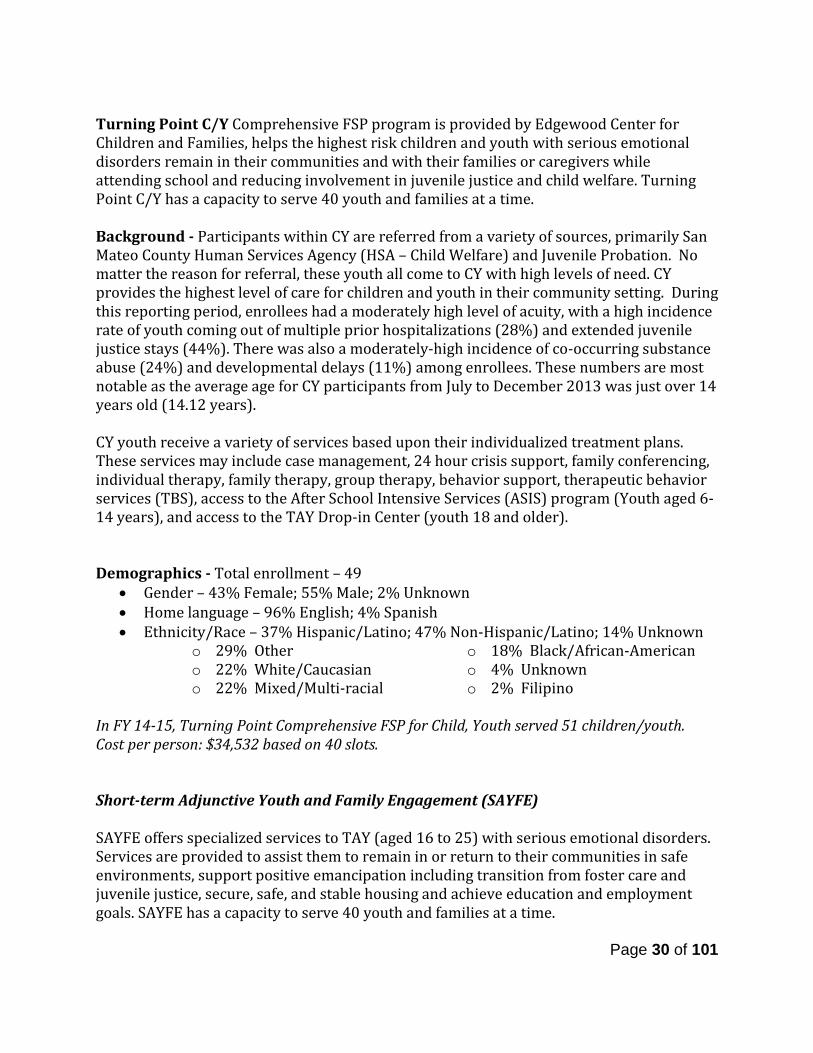
Turning Point C/Y Comprehensive FSP program is provided by Edgewood Center for Children and Families, helps the highest risk children and youth with serious emotional disorders remain in their communities and with their families or caregivers while attending school and reducing involvement in juvenile justice and child welfare. Turning Point C/Y has a capacity to serve 40 youth and families at a time. Background - Participants within CY are referred from a variety of sources, primarily San Mateo County Human Services Agency (HSA – Child Welfare) and Juvenile Probation. No matter the reason for referral, these youth all come to CY with high levels of need. CY provides the highest level of care for children and youth in their community setting. During this reporting period, enrollees had a moderately high level of acuity, with a high incidence rate of youth coming out of multiple prior hospitalizations (28%) and extended juvenile justice stays (44%). There was also a moderately-high incidence of co-occurring substance abuse (24%) and developmental delays (11%) among enrollees. These numbers are most notable as the average age for CY participants from July to December 2013 was just over 14 years old (14.12 years). CY youth receive a variety of services based upon their individualized treatment plans. These services may include case management, 24 hour crisis support, family conferencing, individual therapy, family therapy, group therapy, behavior support, therapeutic behavior services (TBS), access to the After School Intensive Services (ASIS) program (Youth aged 6-14 years), and access to the TAY Drop-in Center (youth 18 and older). Demographics - Total enrollment – 49
• Gender – 43% Female; 55% Male; 2% Unknown • Home language – 96% English; 4% Spanish • Ethnicity/Race – 37% Hispanic/Latino; 47% Non-Hispanic/Latino; 14% Unknown
o 29% Other o 22% White/Caucasian o 22% Mixed/Multi-racial
o 18% Black/African-American o 4% Unknown o 2% Filipino
In FY 14-15, Turning Point Comprehensive FSP for Child, Youth served 51 children/youth. Cost per person: $34,532 based on 40 slots. Short-term Adjunctive Youth and Family Engagement (SAYFE) SAYFE offers specialized services to TAY (aged 16 to 25) with serious emotional disorders. Services are provided to assist them to remain in or return to their communities in safe environments, support positive emancipation including transition from foster care and juvenile justice, secure, safe, and stable housing and achieve education and employment goals. SAYFE has a capacity to serve 40 youth and families at a time.
Page 30 of 101
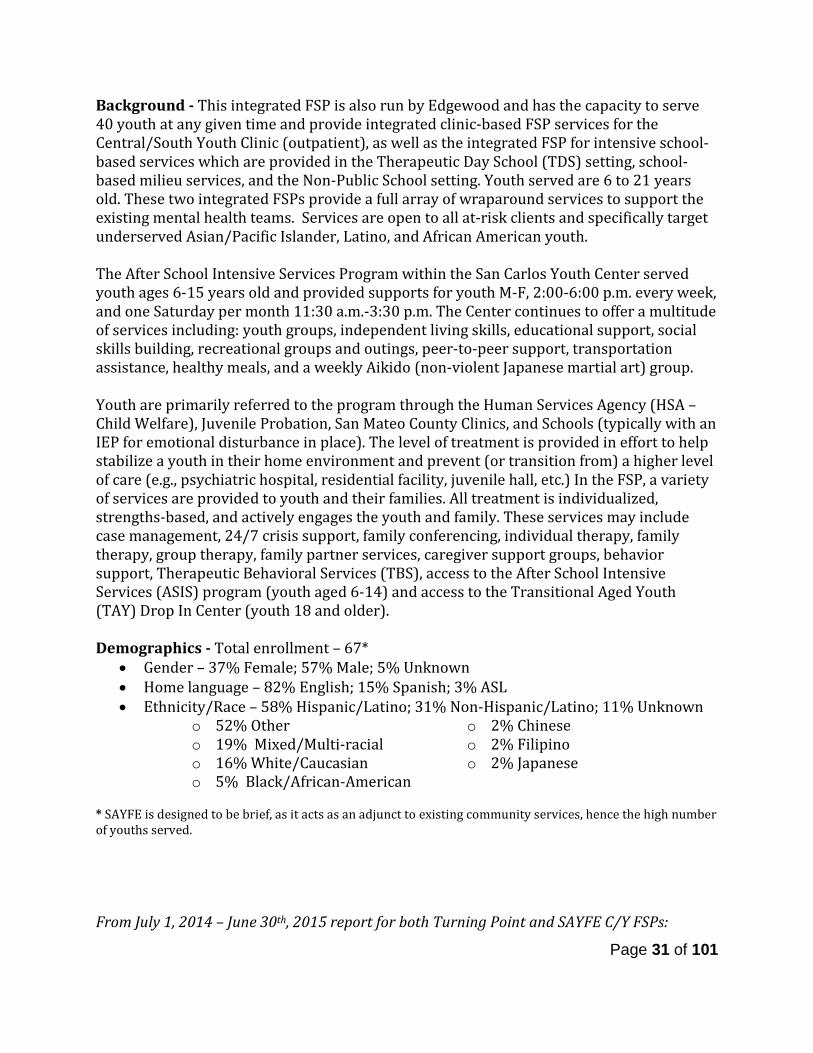
Background - This integrated FSP is also run by Edgewood and has the capacity to serve 40 youth at any given time and provide integrated clinic-based FSP services for the Central/South Youth Clinic (outpatient), as well as the integrated FSP for intensive school-based services which are provided in the Therapeutic Day School (TDS) setting, school-based milieu services, and the Non-Public School setting. Youth served are 6 to 21 years old. These two integrated FSPs provide a full array of wraparound services to support the existing mental health teams. Services are open to all at-risk clients and specifically target underserved Asian/Pacific Islander, Latino, and African American youth. The After School Intensive Services Program within the San Carlos Youth Center served youth ages 6-15 years old and provided supports for youth M-F, 2:00-6:00 p.m. every week, and one Saturday per month 11:30 a.m.-3:30 p.m. The Center continues to offer a multitude of services including: youth groups, independent living skills, educational support, social skills building, recreational groups and outings, peer-to-peer support, transportation assistance, healthy meals, and a weekly Aikido (non-violent Japanese martial art) group. Youth are primarily referred to the program through the Human Services Agency (HSA – Child Welfare), Juvenile Probation, San Mateo County Clinics, and Schools (typically with an IEP for emotional disturbance in place). The level of treatment is provided in effort to help stabilize a youth in their home environment and prevent (or transition from) a higher level of care (e.g., psychiatric hospital, residential facility, juvenile hall, etc.) In the FSP, a variety of services are provided to youth and their families. All treatment is individualized, strengths-based, and actively engages the youth and family. These services may include case management, 24/7 crisis support, family conferencing, individual therapy, family therapy, group therapy, family partner services, caregiver support groups, behavior support, Therapeutic Behavioral Services (TBS), access to the After School Intensive Services (ASIS) program (youth aged 6-14) and access to the Transitional Aged Youth (TAY) Drop In Center (youth 18 and older). Demographics - Total enrollment – 67*
• Gender – 37% Female; 57% Male; 5% Unknown • Home language – 82% English; 15% Spanish; 3% ASL • Ethnicity/Race – 58% Hispanic/Latino; 31% Non-Hispanic/Latino; 11% Unknown
o 52% Other o 19% Mixed/Multi-racial o 16% White/Caucasian o 5% Black/African-American
o 2% Chinese o 2% Filipino o 2% Japanese
* SAYFE is designed to be brief, as it acts as an adjunct to existing community services, hence the high number of youths served. From July 1, 2014 – June 30th, 2015 report for both Turning Point and SAYFE C/Y FSPs:
Page 31 of 101
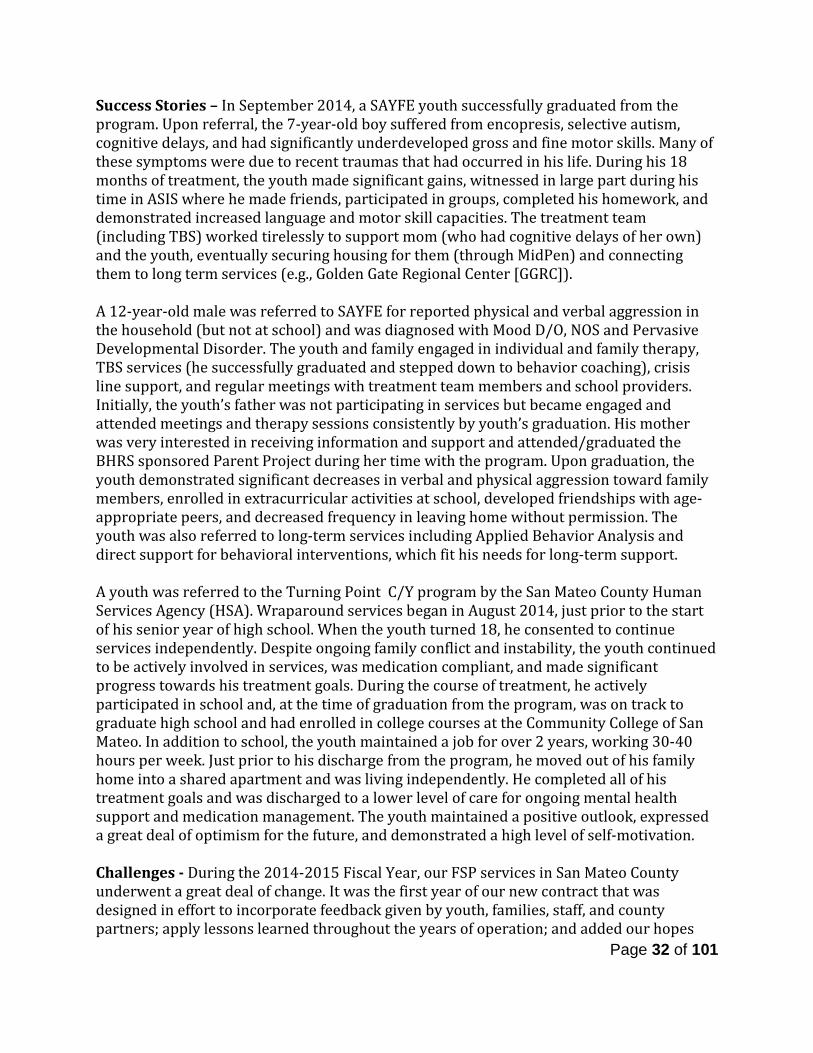
Success Stories – In September 2014, a SAYFE youth successfully graduated from the program. Upon referral, the 7-year-old boy suffered from encopresis, selective autism, cognitive delays, and had significantly underdeveloped gross and fine motor skills. Many of these symptoms were due to recent traumas that had occurred in his life. During his 18 months of treatment, the youth made significant gains, witnessed in large part during his time in ASIS where he made friends, participated in groups, completed his homework, and demonstrated increased language and motor skill capacities. The treatment team (including TBS) worked tirelessly to support mom (who had cognitive delays of her own) and the youth, eventually securing housing for them (through MidPen) and connecting them to long term services (e.g., Golden Gate Regional Center [GGRC]). A 12-year-old male was referred to SAYFE for reported physical and verbal aggression in the household (but not at school) and was diagnosed with Mood D/O, NOS and Pervasive Developmental Disorder. The youth and family engaged in individual and family therapy, TBS services (he successfully graduated and stepped down to behavior coaching), crisis line support, and regular meetings with treatment team members and school providers. Initially, the youth’s father was not participating in services but became engaged and attended meetings and therapy sessions consistently by youth’s graduation. His mother was very interested in receiving information and support and attended/graduated the BHRS sponsored Parent Project during her time with the program. Upon graduation, the youth demonstrated significant decreases in verbal and physical aggression toward family members, enrolled in extracurricular activities at school, developed friendships with age-appropriate peers, and decreased frequency in leaving home without permission. The youth was also referred to long-term services including Applied Behavior Analysis and direct support for behavioral interventions, which fit his needs for long-term support. A youth was referred to the Turning Point C/Y program by the San Mateo County Human Services Agency (HSA). Wraparound services began in August 2014, just prior to the start of his senior year of high school. When the youth turned 18, he consented to continue services independently. Despite ongoing family conflict and instability, the youth continued to be actively involved in services, was medication compliant, and made significant progress towards his treatment goals. During the course of treatment, he actively participated in school and, at the time of graduation from the program, was on track to graduate high school and had enrolled in college courses at the Community College of San Mateo. In addition to school, the youth maintained a job for over 2 years, working 30-40 hours per week. Just prior to his discharge from the program, he moved out of his family home into a shared apartment and was living independently. He completed all of his treatment goals and was discharged to a lower level of care for ongoing mental health support and medication management. The youth maintained a positive outlook, expressed a great deal of optimism for the future, and demonstrated a high level of self-motivation. Challenges - During the 2014-2015 Fiscal Year, our FSP services in San Mateo County underwent a great deal of change. It was the first year of our new contract that was designed in effort to incorporate feedback given by youth, families, staff, and county partners; apply lessons learned throughout the years of operation; and added our hopes
Page 32 of 101
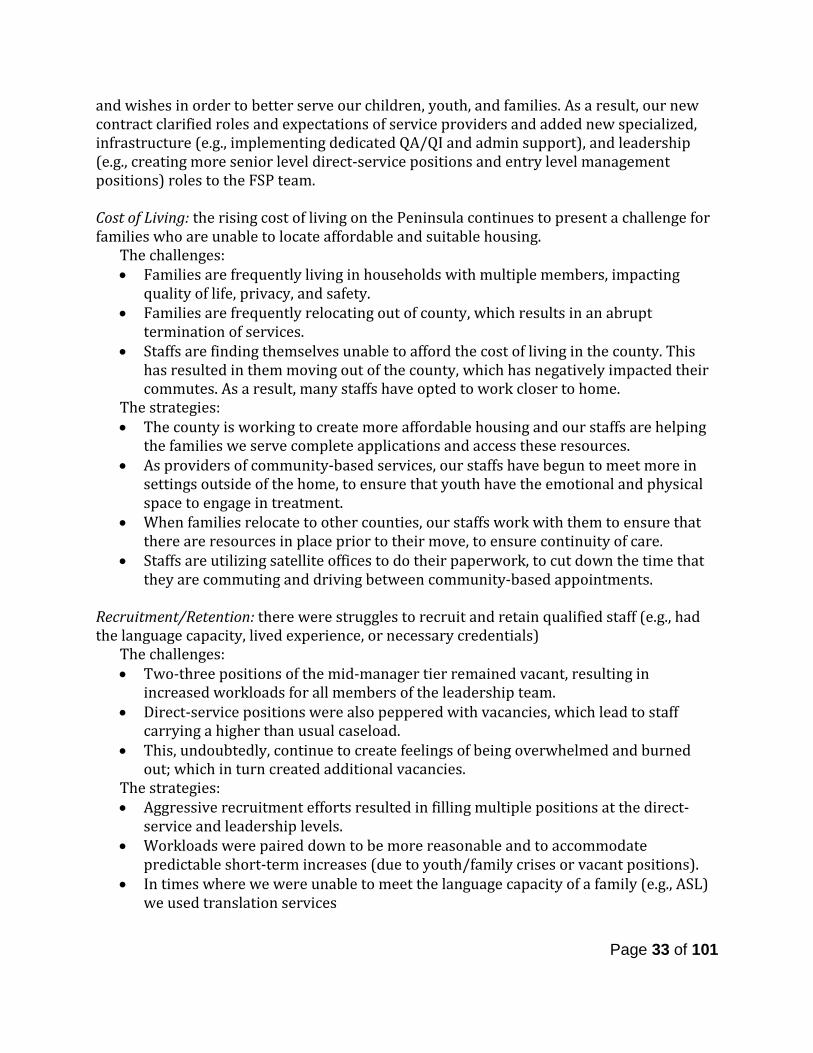
and wishes in order to better serve our children, youth, and families. As a result, our new contract clarified roles and expectations of service providers and added new specialized, infrastructure (e.g., implementing dedicated QA/QI and admin support), and leadership (e.g., creating more senior level direct-service positions and entry level management positions) roles to the FSP team. Cost of Living: the rising cost of living on the Peninsula continues to present a challenge for families who are unable to locate affordable and suitable housing.
The challenges: • Families are frequently living in households with multiple members, impacting
quality of life, privacy, and safety. • Families are frequently relocating out of county, which results in an abrupt
termination of services. • Staffs are finding themselves unable to afford the cost of living in the county. This
has resulted in them moving out of the county, which has negatively impacted their commutes. As a result, many staffs have opted to work closer to home.
The strategies: • The county is working to create more affordable housing and our staffs are helping
the families we serve complete applications and access these resources. • As providers of community-based services, our staffs have begun to meet more in
settings outside of the home, to ensure that youth have the emotional and physical space to engage in treatment.
• When families relocate to other counties, our staffs work with them to ensure that there are resources in place prior to their move, to ensure continuity of care.
• Staffs are utilizing satellite offices to do their paperwork, to cut down the time that they are commuting and driving between community-based appointments.
Recruitment/Retention: there were struggles to recruit and retain qualified staff (e.g., had the language capacity, lived experience, or necessary credentials)
The challenges: • Two-three positions of the mid-manager tier remained vacant, resulting in
increased workloads for all members of the leadership team. • Direct-service positions were also peppered with vacancies, which lead to staff
carrying a higher than usual caseload. • This, undoubtedly, continue to create feelings of being overwhelmed and burned
out; which in turn created additional vacancies. The strategies: • Aggressive recruitment efforts resulted in filling multiple positions at the direct-
service and leadership levels. • Workloads were paired down to be more reasonable and to accommodate
predictable short-term increases (due to youth/family crises or vacant positions). • In times where we were unable to meet the language capacity of a family (e.g., ASL)
we used translation services
Page 33 of 101
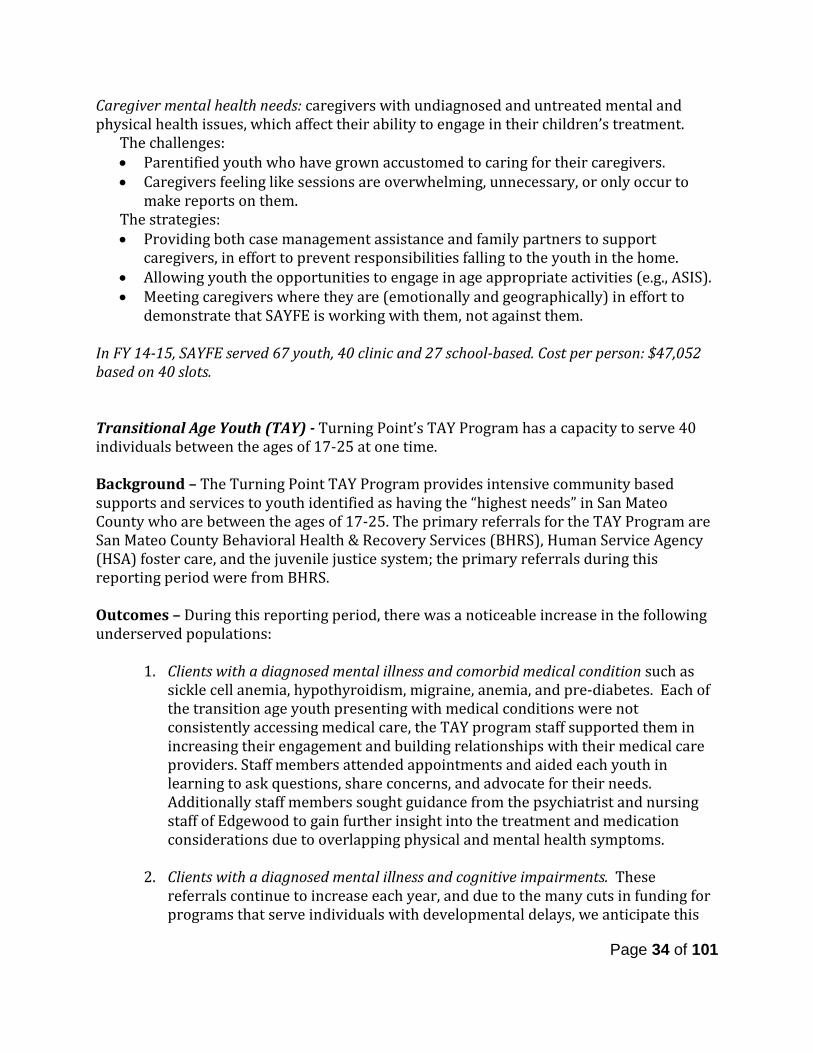
Caregiver mental health needs: caregivers with undiagnosed and untreated mental and physical health issues, which affect their ability to engage in their children’s treatment.
The challenges: • Parentified youth who have grown accustomed to caring for their caregivers. • Caregivers feeling like sessions are overwhelming, unnecessary, or only occur to
make reports on them. The strategies: • Providing both case management assistance and family partners to support
caregivers, in effort to prevent responsibilities falling to the youth in the home. • Allowing youth the opportunities to engage in age appropriate activities (e.g., ASIS). • Meeting caregivers where they are (emotionally and geographically) in effort to
demonstrate that SAYFE is working with them, not against them. In FY 14-15, SAYFE served 67 youth, 40 clinic and 27 school-based. Cost per person: $47,052 based on 40 slots. Transitional Age Youth (TAY) - Turning Point’s TAY Program has a capacity to serve 40 individuals between the ages of 17-25 at one time. Background – The Turning Point TAY Program provides intensive community based supports and services to youth identified as having the “highest needs” in San Mateo County who are between the ages of 17-25. The primary referrals for the TAY Program are San Mateo County Behavioral Health & Recovery Services (BHRS), Human Service Agency (HSA) foster care, and the juvenile justice system; the primary referrals during this reporting period were from BHRS. Outcomes – During this reporting period, there was a noticeable increase in the following underserved populations:
1. Clients with a diagnosed mental illness and comorbid medical condition such as sickle cell anemia, hypothyroidism, migraine, anemia, and pre-diabetes. Each of the transition age youth presenting with medical conditions were not consistently accessing medical care, the TAY program staff supported them in increasing their engagement and building relationships with their medical care providers. Staff members attended appointments and aided each youth in learning to ask questions, share concerns, and advocate for their needs. Additionally staff members sought guidance from the psychiatrist and nursing staff of Edgewood to gain further insight into the treatment and medication considerations due to overlapping physical and mental health symptoms.
2. Clients with a diagnosed mental illness and cognitive impairments. These referrals continue to increase each year, and due to the many cuts in funding for programs that serve individuals with developmental delays, we anticipate this
Page 34 of 101

trend will continue. In order to address the unique needs of this TAY population, the program has identified and adapted experiential and behaviorally based interventions designed for individuals with a myriad of cognitive impairments. These interventions, applied in consistent and repetitive one on one coaching sessions typically address emotional regulation, daily life skills, social interactions, and community safety; we have seen successful skills acquisition and application across settings leading us to believe these interventions are appropriate for the transition age youth we serve.
3. Clients who identify as Asian/Pacific Islander or Hispanic/Latino continue to rise. Unlike past years, the majority of Hispanic/Latino TAY preferred bilingual (Spanish/English) service provision vs. English only, and had legal residency/citizenship status. Additionally, the number of referrals of individuals who identify as Asian/Pacific Islander increased as well. While the census of this population remains low, it is still noteworthy to mention the steady increase.
Demographics - Total enrollment – 45
• Gender – 38% Female; 62% Male • Home language – 93% English; 4% Spanish; 2% Other • Ethnicity/Race – 33% Hispanic/Latino; 56% Non-Hispanic/Latino; 11% Unknown
o 31% Mixed/Multi-racial o 27% White/Caucasian o 22% Other o 13% - Black/African-American
o 2% Other Asian o 2% Asian Indian o 2% Unknown
Activities – Upon enrollment in the program each youth is assigned a Clinician and Case Manager. The two staff stay involved and invested throughout the youth’s time in the program. Ancillary team members are added on an as needed basis including any or all of the following roles:
• Independent Living Skills Specialist o 23 youth engaged in this level of support
• Behavioral Support Specialist o 24 youth engaged in this level of support
• Educational Support Advocate o 18 youth engaged in this level of support
• Employment Support Advocate o 20 youth engaged in this level of support
These staff members addressed needs expressed by the youth as noted on the Casey Life Skills Assessment, and/or identified by the Case Manager or Clinician. The specialists and advocates involve the youth at all times to identify specific goals and create a timeline for completion. As this is a time-limited support with the aim of skills/information acquisition, the bulk of their time together is focused on learning and practice. Through the years youth have expressed their appreciation for this level of support and noted their preference for
Page 35 of 101

receiving support in specific areas. We gather youth, family, and team feedback and make adjustments to the service delivery based on what works and what may need to be reevaluated in the program. It was due to youth feedback and the corroborating feedback of our staff that Edgewood added the Recreation & Activity Specialist to the care team. This position focuses on creating activities for 3-5 youth who need and/or want support with improving peer relationships. Activities that have been created were hiking, volunteering, grocery shopping, and visiting a college campus allows for real-time learning in an age appropriate cohort and setting while practicing social and relational skills.
Success Story - One of this year’s graduates was a young woman with a history of substance use, psychiatric hospitalizations, a medical condition, and family instability. She entered our program after seeking support at our Drop-In Center and coming to the attention of staff due to her expressed fears of relapse and impending homelessness. Her family had decided to move and gave her the option of going with them to another part of the state or staying in the bay area (on her own). While in the program she worked with her case manager on identifying housing options, accessing/understanding the medical care required to address her condition, and learning how to become her own case manager. With our clinician she discussed her fears, learned new methods of managing her anxiety, stopped her self-harming behaviors, and was able to maintain her sobriety. She lived in one of our subsidized apartments, met with our independent living skills specialist to address areas of limited skill (budgeting, preparing healthy meals, tenant-landlord rights/responsibilities), and successfully maintained a safe and clean living space. At the time of her graduation she was living with a friend in a shared apartment in the east bay and working full-time at a tech company. In FY 14-15, Turning Point for TAY served 45 youth. Cost per person: $45,022 based on 40 slots Enhanced Supported Education Services for TAY Background - Caminar’s Supported Education program at the College of San Mateo has been highly successful in supporting individuals with mental health/emotional needs in attending college and achieving academic, vocational, and/or personal goals. The program’s unique approach combines special emphasis on instruction, educational accommodations and peer support to assist students to succeed in college. Traditionally, the attrition rate for individuals with psychiatric disabilities has been exceptionally high as a result of anxiety, low stress tolerance, lack of academic and social skills, and low self-esteem. However, this program has become an innovative leader in reversing this trend. BHRS contracted with Caminar starting in 2006 to provide enhanced supported education services to approximately 40 TAY ages 18 to 25 with emotional and behavioral difficulties and/or alcohol or substance use issues; 20 referred by FSP provider Edgewood and 20 TAY identified by Caminar.
Page 36 of 101
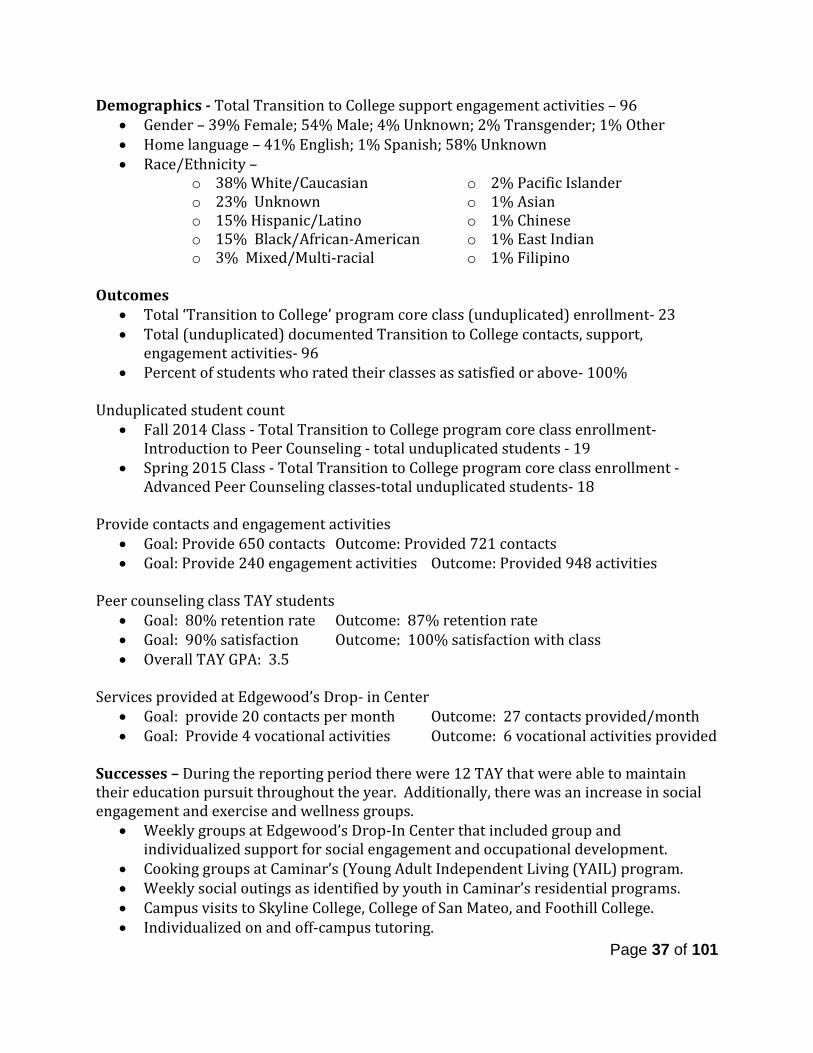
Demographics - Total Transition to College support engagement activities – 96 • Gender – 39% Female; 54% Male; 4% Unknown; 2% Transgender; 1% Other • Home language – 41% English; 1% Spanish; 58% Unknown • Race/Ethnicity –
o 38% White/Caucasian o 23% Unknown o 15% Hispanic/Latino o 15% Black/African-American o 3% Mixed/Multi-racial
o 2% Pacific Islander o 1% Asian o 1% Chinese o 1% East Indian o 1% Filipino
Outcomes
• Total ‘Transition to College’ program core class (unduplicated) enrollment- 23 • Total (unduplicated) documented Transition to College contacts, support,
engagement activities- 96 • Percent of students who rated their classes as satisfied or above- 100%
Unduplicated student count
• Fall 2014 Class - Total Transition to College program core class enrollment- Introduction to Peer Counseling - total unduplicated students - 19
• Spring 2015 Class - Total Transition to College program core class enrollment - Advanced Peer Counseling classes-total unduplicated students- 18
Provide contacts and engagement activities
• Goal: Provide 650 contacts Outcome: Provided 721 contacts • Goal: Provide 240 engagement activities Outcome: Provided 948 activities
Peer counseling class TAY students
• Goal: 80% retention rate Outcome: 87% retention rate • Goal: 90% satisfaction Outcome: 100% satisfaction with class • Overall TAY GPA: 3.5
Services provided at Edgewood’s Drop- in Center
• Goal: provide 20 contacts per month Outcome: 27 contacts provided/month • Goal: Provide 4 vocational activities Outcome: 6 vocational activities provided
Successes – During the reporting period there were 12 TAY that were able to maintain their education pursuit throughout the year. Additionally, there was an increase in social engagement and exercise and wellness groups.
• Weekly groups at Edgewood’s Drop-In Center that included group and individualized support for social engagement and occupational development.
• Cooking groups at Caminar’s (Young Adult Independent Living (YAIL) program. • Weekly social outings as identified by youth in Caminar’s residential programs. • Campus visits to Skyline College, College of San Mateo, and Foothill College. • Individualized on and off-campus tutoring.
Page 37 of 101
Challenges - There were continued challenges engaging TAY in educational activities and completion of educational goals. First, the instability of housing for youth often put them at risk of homelessness and lack of resources to ensure housing stability to continue engagement with education activities and making progress towards educational goals. Furthermore, personal crises often play a part in interrupting these educational and vocational pursuits causing significant delays or discontinuation of programming. Finally, the cost of educational materials continue to be unaffordable for most youth who lack adequate resources and support. In FY 14/15, 58 TAY were served by this program. Cost per person: $2,922. TAY Supported Housing Background –Edgewood’s TAY FSP partners with the Mental Health Association (MHA) who secures and manages 20 units of high quality housing for FSP clients. Addressing the housing needs of TAY is an important aspect of the work within the TAY Program at Edgewood. Through a partnership with the Mental Health Association (MHA) of San Mateo, the TAY Program is able to provide housing subsidies and a small cluster of apartments in order to reduce the risk of homelessness and increase the probability of stable housing as youth transition. Teaching daily living skills, medication management, household safety/cleanliness, budgeting, and roommate relationship are a part of the treatment and education of the youth accessing housing support. Demographics – TAY utilizing MHSA housing dollars for FY 14-15, which includes applying housing dollars for: rent, housing subsidy, security deposit, and/or use of one of the dedicated beds.
• 12 TAY served • 30% White/Caucasian, 25% Latino, 25% Asian, 10% Native American, 10% African
American • Youngest: 19 years old, Oldest 24 years old • Average age: 22
Successes – Success is measured daily wherein the number of TAY are housed in safe and appropriate housing. With dedicated beds at Ohevet’s and Maple Street Shelter, staff are able to offer emergency and temporary housing options, decreasing the numbers of TAY living on the streets, in abandoned buildings, in encampments, and in vehicles. In FY 14-15, enrolled clients lived in the following locations/entities:
• Caminar: Redwood House • Caminar: Eucalyptus House* • Cordilleras (Mental Health Rehabilitation Center) • Cordilleras: The Suites (Adult Residential Facility)* • Golden Gate Regional Center (GGRC) Host Homes • Mateo Lodge: Wally’s Place*
Page 38 of 101
• Shelter Network: Maple Street Shelter** • Mental Health Association: Spring Street Shelter • Ohevet’s Board & Care** • Silver Hotel • Edgewood San Benito Apartments* • Edgewood Scattered Site Apartments* • Independent apartments (found with support of TAY Case Managers and Craigslist)* • Homes, garages, and/or couches of friends and/or family
Challenges A. Identification of safe and appropriate housing options for 18-25 year olds within the
county of San Mateo a. Falling between:
i. Individuals who do not meet criteria for a social rehabilitation program and are not ready (based on skills, behavioral management, safety) for supported housing (such as YAIL, THP-Plus, Edgewood San Benito Apartments). Their options are limited to couch-surfing, finding a shelter, a SRO, or an unlicensed board and care.
ii. Former foster youth who are unable to access AB12 or THP Plus services due to their substance use, acute mental health symptoms, and/or inability to engage in work or school due to substance use or mental health symptoms despite actively seeking and engaging in treatment for one or both.
iii. Individuals who do not meet criteria for admission to an acute hospital unit and are turned down by social rehabilitation programs due to their high acuity
iv. A portion of our young women need emergency housing and due to their histories of trauma or exploitation living in a shelter is not an option.
b. Lack of “youth friendly” housing options. i. The current housing system/network generally holds transition age
youth to adult standards and does not account for age appropriate needs, skills, and relationships.
ii. Severe Mental Illness (SMI) diagnosis is a requirement for approval by Adult Resource Management to access adult mental health beds.
iii. Medication compliance is often required or preferred. 1. Enrollees under psychiatric care but not currently taking medications,
displaying medication ambivalence, and/or using holistic/alternative methods, are often denied community housing or placed lower on the waiting lists.
Page 39 of 101
iv. Curfew or required times to be in the home/program which conflict with age appropriate activities including: night classes, evening workshops or self-help groups, activities at youth centers, recreation or athletic activities, and peer socialization activities.
v. Group participation requirements which conflict with school/work/pre-vocational schedule.
B. Continuity & Permanence a. The lack of safe, affordable, and long-term housing options for TAY.
i. Upon graduation from the TAY Program, transition age youth no longer have access to a housing subsidy.
1. Waiting lists for state/federal housing subsidies or vouchers are on average 3 years.
ii. Most housing programs are time limited or available only if the transition age youth is engaged with a county (or contractor) mental health treatment program.
b. Bay Area rents continue to increase. i. Section 8 Housing Voucher is not enough of a subsidy to aid individuals
in covering the rent. ii. Families/Caregivers are resistant to their transition age youth moving
out of the family home as this will result in a lower household income.
Strategies – A continued commitment to aiding transition age youth in accessing safe and affordable housing allows the Supportive Housing program to identify new strategies, maintain existing partnerships, and creatively collaborate with providers, housing programs/entities, community members, families and the transition age youth. This year there was an identified trend in families preferring their transition age youth stay within the home, rather than encouraging them to move out. The common refrain from caregivers was, “we need their income to contribute to the household income,” and “they will be safer with us than with strangers or on their own.” The TAY clients of these families also expressed an interest to stay with the family, with one succinctly stating, “Maybe I will move out when I am in my 30s or when I am ready for my own family. Why would I leave and be stressed about money and being on my own when I can be with my family?” Due to this trend and the continued difficulty in accessing safe and affordable housing options in the Bay Area, the program saw an increase in teaching, coaching and modeling the practice of independent living skill building and acquisition. The Supportive Housing program plans to continue improving and enhancing housing support, whether it is direct or indirect, for/with TAY. The program has prioritized the importance of building relationships with community housing programs outside of San Mateo County in hopes of providing TAY and their families with more affordable options. The program will continue identifying the best supported housing design to meet the needs of the population. In FY 14-15, 12 TAY were served by MHA Supported Housing. Cost per person: $17,166
Page 40 of 101

FSP and Housing Support Program for Adult, Older Adult, and Medically Fragile Background - This FSP program, overseen by Telecare, Inc., provides services to the highest risk adults, highest risk older adults/medically fragile adults. Additionally, the Outreach and Support Services portion targets potential FSP enrollees through outreach, engagement and support services. These programs assist consumers/members to enroll and once enrolled, to achieve independence, stability and wellness within the context of their cultures and communities. Program staff are available 24/7 and provide services including: medication support, continuity of care during inpatient episodes and criminal justice contacts, medical treatment support, crisis response, housing and housing supports, vocational and educational services, and individualized service plans, transportation, peer services, and money management. Services specific to Older Adult/Medically Fragile include maximizing social and daily living skills and facilitating use of in-home supportive agencies. The overall goal of the program is to divert from the criminal justice system and/or acute and long term institutional levels of care (locked facilities) seriously mentally ill and dually diagnosed individuals who can succeed living in the community with sufficient structure and support. The program is grounded in research and evaluation findings that demonstrate that diversion and post incarceration services reduce incarceration, jail time and re-offense rates for offenders whose untreated mental illness has been a factor in their criminal behaviors. The program also follows the model and philosophies of California’s AB 2034 Homeless Mentally Ill Adult programs and the assertive community treatment (ACT) approach, aiming to use community-based services and a wide range of supports to enable seriously mentally ill and dually diagnosed adults to remain in the community and to reduce incarceration, homelessness, and institutionalization. The FY 09/10 approved expansion allowed for the introduction of the concept of integrated FSPs, in response to the need to be flexible in step-up/step-down processes in order to create a more seamless service delivery experience for clients. The word “integrated” reflects the FSP staff from community-based organizations in County-operated South/Central and North County clinics. Three levels of care are included in a redesigned FSP: an intensive level “1 to 10” (1 staff per 10 consumers/clients), a community case management level “1 to 27” (1 staff per 27 consumers/clients), and a wellness level of care. The program works with board and care facilities and with consumers living in the community to prevent them from being placed in locked or skilled nursing facilities, and with residents of skilled nursing and locked facilities to facilitate their returning to a less restrictive setting. Referrals to the program are received from locked facilities, skilled nursing facilities, acute care facilities, board and care facilities, primary care clinics, Aging and Adult Services, community agencies, and from individuals/family members.
Page 41 of 101
A full-time nurse enables the treatment team to more effectively collaborate with primary care providers and assist consumers in both their communications with their primary care doctors and in their follow-up. The licensed clinicians in the team oversee the completion of the multidisciplinary assessment and the development and implementation of a comprehensive service plan that involves all members of the team, the consumer and the family, contingent on the consumer’s wishes. Peer Partners provide support, information and practical assistance with routine tasks, and cultivate a system of volunteer support. Similarly, when a family is involved and the consumer is supportive of their involvement, a Family/Caregiver Partner works with the family to build their capacity in supporting their loved one. Telecare, Inc. was contracted in October 2009 for a total of 200 members: 75 Adult, 75 Older Adult/Medically Fragile, 40 Community Case Management and 10 in the new Wellness category. In February 2011, there was an amendment to the Telecare FSP to more effectively align needs with BHRS resources: ten case management slots were reduced in order to add seven intensive slots, and the rest of the savings was shifted to support the Housing Support Program for a total of 187 slots. During FY 2012-2013, Telecare FSP was amended to provide services to a total of 229 unduplicated individuals (207 of these were MHSA funded, 22 were Criminal Justice Realignment FSP slots), which continues to be the contracted service goal to-date. These services encompassed three different levels of intensity. Staff to client ratios were, Full Service Partnership 1:10, Community Case Management 1:27 and Wellness 1:40. The report will largely focus on the MHSA element but the comingling of populations is noteworthy. The MHSA total slots remain full. Openings that exist only do so for a matter of a few days with referrals being a constant. Demographics - Total enrollment – 242
• Gender – 33% Female; 67% Male • Home language – 97% English; 2% Spanish; 0.5% Thai; 0.5% Farsi • Race – 16% Hispanic/Latino
o 50% White/Caucasian o 17% Mixed/Multi-racial o 17% Black/African-American o 8% Other o 3% Filipino o 2% Unknown
o 2% Chinese o 0.5% Japanese o 0.5% Native Hawaiian
Successes - Over the past several years, Telecare,Inc. and its programs have been moving towards being Co-Occurring competent to the degree of having developed and rolled out a basic training on substance abuse/mental health for the entire corporation and developing a stage of change-appropriate, evidence based/promising practice-based engagement protocol. Both the basic training and the Stage of Change protocols have been brought online in the program as well as with the local MHRC since this is the dominant referral
Page 42 of 101
source. In addition to all staff getting trained to be co-occurring competent, all staff have received the 3-day WRAP training and half the staff are now certified WRAP facilitators. WRAP groups have been running alongside of the Co-Occurring groups and all facilitators include Case Managers, staff with lived experience and residential counselors. Challenges – Staffing and recruitment in the SF Bay Area, particularly on the Peninsula continues to be a significant challenged. The lack of affordable housing in San Mateo County is exceedingly difficult. Many of the qualified staff live out of county and opt for shorter commutes. Housing Support Services Background – Telecare, Inc. also provides housing for the Adult and Older Adult/Medically Fragile FSP programs. Telecare, Inc. provides up to 90 housing units of mixed types including augmented board and care, dormitory, congregate and supervised living, single room occupancy hotels, shelter and independent living. Outcomes - In the previous reporting year (FY 13-14), Telecare Inc.’s Supported Housing provided affordable, safe and stage of change appropriate housing for 140 adult, older adult, and medically fragile clients. This figure has waned closer to 110 during the 14-15 reporting year as costs have continued to increase while funding remains flat. Furthermore, this area of concern has negatively the ability to enroll new clients. Challenges – Telecare, Inc.’s continues to address a bed bug infestation at the Industrial Hotel. Over the course of the past fiscal year as well as the preceding fiscal year, Telecare, Inc. has invested thousands of dollars in combating an infestation in a building that the agency did not fully control and was caused by a non -Telecare, Inc. client. Beds were purchased several times, linens were purchased several times, numerous pest control agencies and fumigations efforts were made all funded by Telecare, Inc. but was funded out of pocket (and was not part of the BHRS contract). In FY 14-15, Telecare served 242 clients (159 adults and 83 older adults/medically fragile). Cost per person: $16,686 based on 207 slots / Housing Cost per person: $15,723 Comprehensive FSP and Housing for Adults and Older Adults/Medically Fragile Background - Caminar was contracted to provide these services beginning October 2009 for a maximum of 30 enrollees. The FSP provides intensive case management services including psychiatric services, injections (in-home when necessary), daily in-home medication monitoring and weekly medi-sets (medication management system). Nurses provide in-home assistance with teaching skills to manage diabetes, assessment, coordination and communication with medical providers. On occasion psychiatrists see clients in their homes/in the field. The FSP transports clients to appointments, offers after-hours warm-line, and 24/7 emergency response.
Page 43 of 101

Caminar’s FSP program served a total of 31 unique (or unduplicated) clients for fiscal year 2014-2015. There were 10 new clients enrolled during this time period, and 9 were discharged. Of the new clients enrolled, three was transferred from a higher level of care to FSP, one came from our REACH Supplemental program, and the remainders were referrals from BHRS regional clinics. Of the nine discharges, three were closed to an IMD facility due to increased symptoms and duration of stay, one client went into the step down program, New Ventures, two clients moved out-of-county, and one client passed away. Clients continue to experience major medical concerns in the FSP program. These clients will need long-term medical assistance, but are currently being managed in the community or temporarily placed in SNIFs in the hopes of returning to the community. Since moving to a Strengths-based case management model, there are improvements toward a better quality of living and some success with clients moving to a lower level of care. All FSP clients continue to be seen weekly for at least 2 hours by their case managers, nurses, psychiatrists, assistant case managers and/or community support workers who provide medication support them in their home. Fifty percent (50%) of FSP clients have WRAP plans and 90% of them participated in self-help and other community activities. Outcomes
• Homelessness: 3% (1 out of 31 this year) • Hospitalizations: 30% (10 out of 30 clients this year) • Incarcerations: 10% (3 out of 30 this year) • Stable Housing: 88% remained in stable housing for at least 1 year • In addition, this year 30% of clients provided their own transportation. • 97% of clients lived in satisfactory living environments (apartments, SRO hotels,
independent supportive housing or with family). • 50%of clients received housing subsidies and 13% received Caminar’s Sponsor-
based Shelter+Care (S+C) Supportive Housing. The REACH (Recovery, Empowerment and Community Housing) program served an average of 68 clients this year. Both programs also provide 24/7 Emergency Response and a Warm-line for clients to access for any issue they may have after hours. Caminar’s REACH program had 15 discharges and 15 new intakes this year. Of those discharged, three went to a lower level of care in the New Ventures program and six graduated Caminar services. Of the new intakes, two came from the New Ventures program, one came from Cordilleras, and one from Central County MH. Demographics – Total REACH enrollment – 40
• Gender – 35% Female; 65% Male • Home language – 90% English; 5% Spanish; 2.5% Thai; 2.5% Other • Race – 23% Hispanic/Latino; 58%Non-Hispanic/Latino; 20% Other
o 40% White/Caucasian o 20% Mixed/Multi-racial o 18% Other
o 12% Black/African-American o 7.5% Filipino o 2.5% Chinese
Page 44 of 101
The following are average outcomes for this year for the REACH Program: Homelessness: 3 % (2 clients this year) Hospitalizations: 36 %( 28 clients this year) Incarcerations: 10 % (8 clients this year) Stable Housing: 82 % remained in stable housing for at least 1 year 13% of REACH clients are being provided with Caminar’s Sponsor-based S+C Supportive Housing. 76% of the clients responding to the surveys in both FSP and REACH programs reported being satisfied with their services. Challenges - This year our intensive case management programs, REACH and FSP, are continuing to experience lack of housing options especially given our clients’ level of income and the high cost of housing. Landlords can rent to higher paying consumers and are choosing to do so. Another concern is the increased medical needs of our clients as they continue to grow older and their medical issues become a dominant component of their lives. For FY 2014-15, Caminar FSP served 31 clients. Cost per person: $27,854 based 30 slots. Integrated FSP Program Background - Mateo Lodge was contracted to run the South County Mental Health Clinic (SCC) to provide 50 hours of service per week for 3 different levels of intensity (task oriented case management, supplemental case management and FSP clinical case management). During this period a total of 128 unduplicated clients were served, 14 received service level C (FSP). A 1.0 FTE Mental Health Counselor and a 0.25 FTE Community Worker are assigned to SCC to provide case management services to a small caseload (up to 15 clients) of high risk, marginally engaged clients for six months to a year, with the goal of stabilizing and engaging clients in services at the SCC. Clients referred for supplemental case management are those who require services beyond the level an outpatient team or clinic can provide, but less than is needed for Full Service Partnership. Staffing/Staff Training – No changes to staff or Supervisor took place during this time frame. Case managers have completed all of the BHRS required documentation and compliance trainings, LOCUS and Motivational Interviewing trainings. However, as a result of a staff shortage at the clinic and the language capacity of the Intensive Case Managers (ICM), their job duties were focused on providing task oriented case management from September 2014 to January 2015. The FSP has a diverse and bilingual workforce that includes bicultural and bilingual Spanish speaking ICMs, MD, and Psychiatrist. Using the diverse workforce, the ICMs were able to support the entire caseload of 70 Spanish-speaking clients and were an integral part of the Spanish-speaking clinics that were arranged on a weekly rotational basis. The Psychiatrist was able to cover for the MD and case manager who were both on maternity leave.
Page 45 of 101
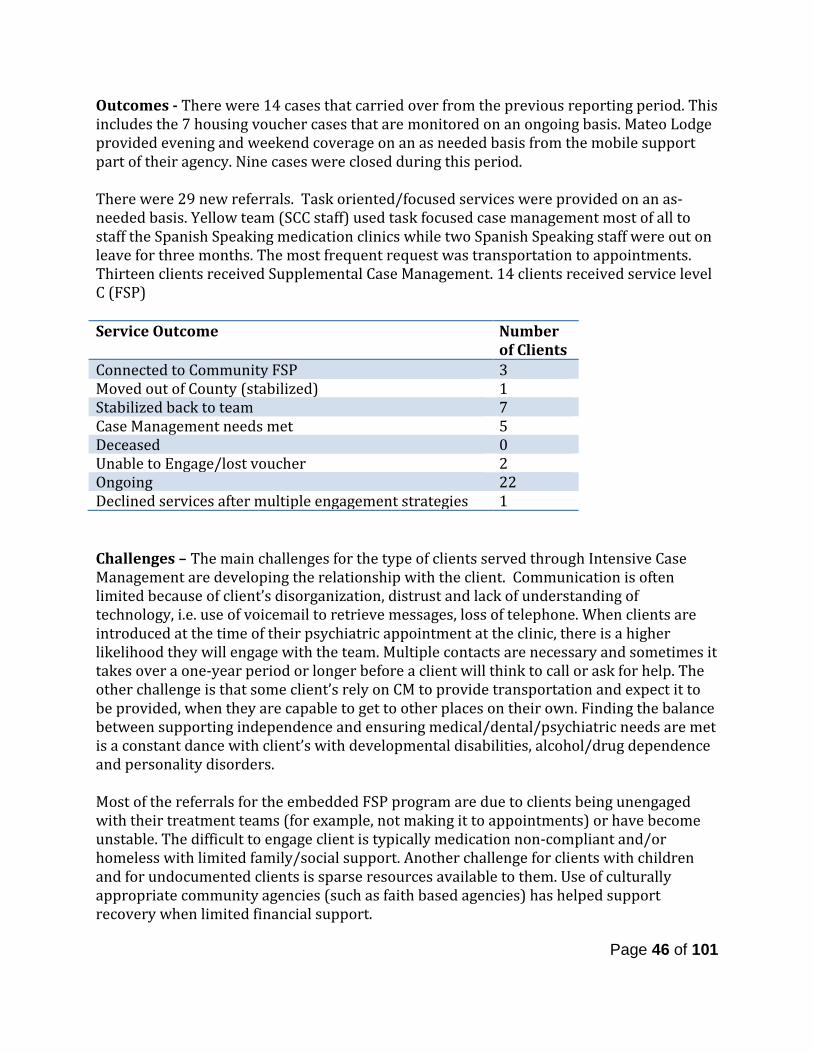
Outcomes - There were 14 cases that carried over from the previous reporting period. This includes the 7 housing voucher cases that are monitored on an ongoing basis. Mateo Lodge provided evening and weekend coverage on an as needed basis from the mobile support part of their agency. Nine cases were closed during this period. There were 29 new referrals. Task oriented/focused services were provided on an as-needed basis. Yellow team (SCC staff) used task focused case management most of all to staff the Spanish Speaking medication clinics while two Spanish Speaking staff were out on leave for three months. The most frequent request was transportation to appointments. Thirteen clients received Supplemental Case Management. 14 clients received service level C (FSP) Service Outcome Number
of Clients Connected to Community FSP 3 Moved out of County (stabilized) 1 Stabilized back to team 7 Case Management needs met 5 Deceased 0 Unable to Engage/lost voucher 2 Ongoing 22 Declined services after multiple engagement strategies 1 Challenges – The main challenges for the type of clients served through Intensive Case Management are developing the relationship with the client. Communication is often limited because of client’s disorganization, distrust and lack of understanding of technology, i.e. use of voicemail to retrieve messages, loss of telephone. When clients are introduced at the time of their psychiatric appointment at the clinic, there is a higher likelihood they will engage with the team. Multiple contacts are necessary and sometimes it takes over a one-year period or longer before a client will think to call or ask for help. The other challenge is that some client’s rely on CM to provide transportation and expect it to be provided, when they are capable to get to other places on their own. Finding the balance between supporting independence and ensuring medical/dental/psychiatric needs are met is a constant dance with client’s with developmental disabilities, alcohol/drug dependence and personality disorders. Most of the referrals for the embedded FSP program are due to clients being unengaged with their treatment teams (for example, not making it to appointments) or have become unstable. The difficult to engage client is typically medication non-compliant and/or homeless with limited family/social support. Another challenge for clients with children and for undocumented clients is sparse resources available to them. Use of culturally appropriate community agencies (such as faith based agencies) has helped support recovery when limited financial support.
Page 46 of 101
Due to the level of impairment of the clients referred, it has been challenging to make the initial connection with the client when they do not show for their appointments. There are clients who are homeless, with no social support, who unless they contact the clinic or are in hospital or jail, could not be contacted. There are clients who do not respond to phone calls. Warm handoffs by the team have had the best results for clients to engage with the Case Managers. Engagement strategies used are unannounced home visits (after safety evaluation), use of relatives with releases, hospital, jail, and joint home visits with a member of the treatment team. For FY 2014-15, Mateo Lodge served 14 clients. Cost per person: $7,847 based on 15 slots.
Community Services and Supports (CSS) – Outreach and Engagement (O&E)
The following are highlights for FY 14/15, per program. See Appendix 6 for a detailed report on Outreach & Engagement Outcomes. The Outreach and Engagement strategy increases access and improves linkages to behavioral health services for underserved communities. BHRS has seen a consistent increase in representation of these communities in its system since the strategies were deployed. Strategies include community outreach collaboratives, pre-crisis response and primary care-based efforts. Community outreach collaboratives funded by MHSA include the East Palo Alto Partnership for Mental Health Outreach (EPA PMHO), which targets at-risk youth, TAY and underserved adults (Latino, Black/African-American, Pacific Islander and LGBTQ) in East Palo Alto; and the North County Outreach Collaborative (NCOC), which targets rural and/or ethnic communities (Chinese, Filipino, Latino, Pacific Islander and LGBTQ) in North County region including Pacifica. These collaboratives provide advocacy, systems change, resident engagement, expansion of local resources, education and outreach to decrease stigma related to mental illness and substance abuse and increase awareness of and access and linkages to culturally and linguistically competent behavioral health, Medi-Cal and other public health services, and social services; a referral process to ensure those in need receive appropriate services; and promote and facilitate resident input into the development of MHSA funded services and other BHRS program initiatives.
Page 47 of 101
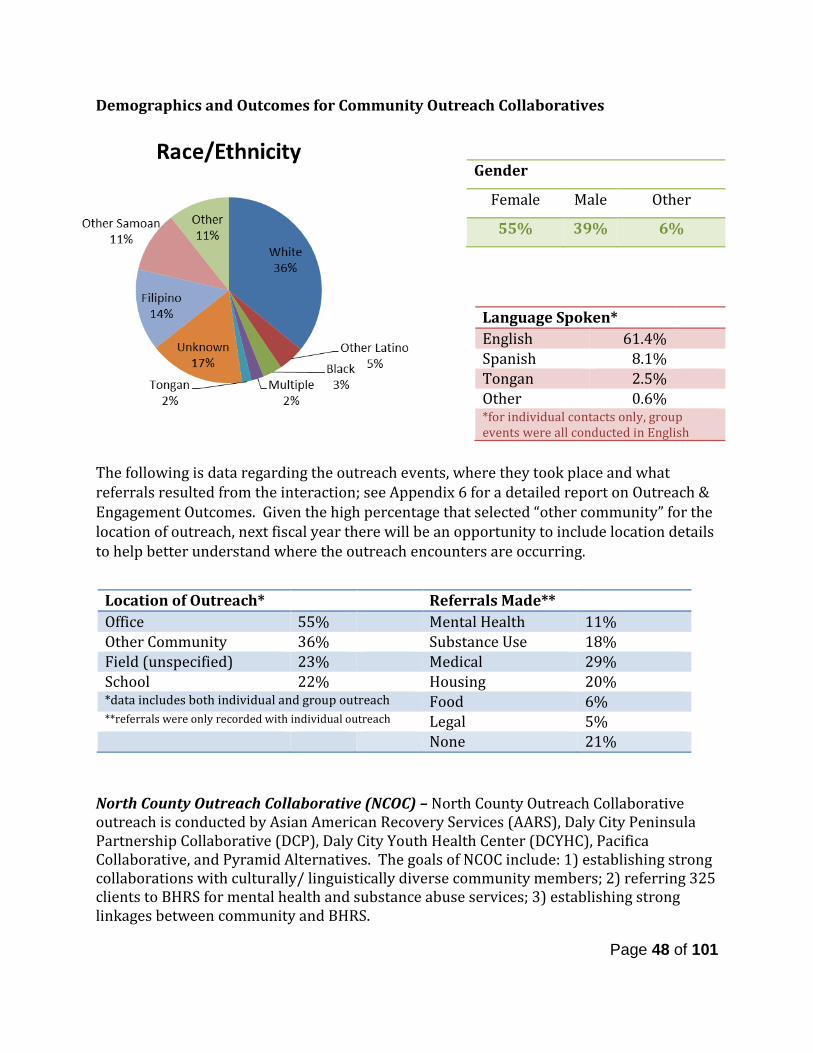
Demographics and Outcomes for Community Outreach Collaboratives
The following is data regarding the outreach events, where they took place and what referrals resulted from the interaction; see Appendix 6 for a detailed report on Outreach & Engagement Outcomes. Given the high percentage that selected “other community” for the location of outreach, next fiscal year there will be an opportunity to include location details to help better understand where the outreach encounters are occurring.
North County Outreach Collaborative (NCOC) – North County Outreach Collaborative outreach is conducted by Asian American Recovery Services (AARS), Daly City Peninsula Partnership Collaborative (DCP), Daly City Youth Health Center (DCYHC), Pacifica Collaborative, and Pyramid Alternatives. The goals of NCOC include: 1) establishing strong collaborations with culturally/ linguistically diverse community members; 2) referring 325 clients to BHRS for mental health and substance abuse services; 3) establishing strong linkages between community and BHRS.
Gender
Female Male Other
55% 39% 6%
Language Spoken* English 61.4% Spanish 8.1% Tongan 2.5% Other 0.6% *for individual contacts only, group events were all conducted in English
Location of Outreach* Referrals Made** Office 55% Mental Health 11% Other Community 36% Substance Use 18% Field (unspecified) 23% Medical 29% School 22% Housing 20% *data includes both individual and group outreach Food 6% **referrals were only recorded with individual outreach Legal 5% None 21%
Page 48 of 101
NCOC continues to build on its partner agencies diversity and has established stronger ties amongst the teams, which have proven to be very successful in a variety of ways. For example, frequently the NCOC partners were contacted to assist the needs of individuals or families that speak Chinese and the NCOC partners did not have the capacity to support these requests. Many times staff was able to contact Pyramid Alternatives for support and they were able to respond and support in a timely manner, thus having these potential Chinese clients feeling valued. NCOC partners have worked on establishing a relationship with a faith-based leader/organization. This is relationship building continues to be a work in progress. NCOC partners and leads have been able to attend the Daly City Partnership and Pacifica Collaborative meetings. Daly City Youth Health Center, Pyramid, Alternatives and AARS continue to work in sharing their resources with other agency leaders as they continue to foster those relationships and invite them to community events and meetings. NCOC partners have become more cohesive during this fiscal year. Being able to have the Community Outreach Team (COT) meet on a regular basis has strengthened the connection between the partner agencies. Staff have greatly improved supporting each other when conducting outreach activities. Even with staff transition within the team, providing a friendly welcoming atmosphere enhanced the connection and bond for those new staff and those remaining on the team. This has proven to be very valuable in outreaching to the community, especially when a warm handoff is needed for a potential client. An example of this happened when AARS staff was contacted by a local barbershop that had agreed to help outreach to his patrons. He was interested in giving his patron the needed information, but knew that it was a delicate situation as this was the first time this person was seeking services. AARS staff was able to discuss this at the COT team meeting and Pyramid Alternative staff agreed that it would be best if they were contacted instead of going through the normal “walk in” process. Even though this took a couple of months to get the actual person to feel comfortable enough to actually physically go to the services, when he did he felt at ease with his decision to follow through. This was truly a wonderful example of taking a communal/collaborative approach to make things happen; all of possible because of NCOC. During this year DCP & AARS partnered to have monthly community meetings to address health disparities seen in the Pacific Islander Community. From these series of educational and stigma free dialogues the Pacific Islander participants were able to have deep rooted conversations about really hard, even taboo topics. Many of these conversations being the first time individuals ever opened up to anyone. From these talks, 13 individuals have found the courage to step forward and no longer suffer in silence about being raped and molested. Each participant shared their own unique traumatic story, yet all of them connected by a common goal of trust, and that they were not alone in the experiences. This was a major breakthrough for these individuals and from these dialogues, many in the PI community is talking about how they can raise awareness to this issue and start the healing process while preventing rape and molestation from continuing in the community. Five of these 13 individuals have been able to connect to services.
Page 49 of 101
NCOC had 4,389 outreach encounters in FY 14-15. *Cost per person is not available. Encounters are not unique individuals, data is collected anonymously therefore, there is no information on number or range of duplicated individuals. East Palo Alto Partnership for Mental Health Outreach (EPA PMHO)– Outreach and linkage services to gain access to Medi-Cal, other public health services, behavioral health, and other services is conducted by a partnership with El Concilio of San Mateo County, Free at Last, the Multicultural Counseling and Education Services of the Bay Area (MCESBA) and One East Palo Alto. EPA PMHO is committed to bridging the mental health divide through advocacy, systems change, resident engagement and expansion of local resources leading to increased resident awareness and access to culturally and linguistically competent professional services. EPA PMHO provides the following services including:
• Technical assistance to BHRS initiatives to increase community education activities and integration of mental health services with other community organizations.
• Community Outreach and Access (marketing and publicity, including translation). • Promote increased East Palo Alto resident participation in County-wide mental
health functions and decision-making processes. • Sustain and strengthen education materials for and conduct outreach to residents
regarding mental health education and awareness. EPA PMHO had 956 outreach encounters in FY 14-15. *Cost per person is not available. Encounters are not unique individuals, data is collected anonymously therefore, there is no information on number or range of duplicated individuals. Ravenswood Family Health Center – Ravenswood is a community-based Federally Qualified Health Center (FQHC) that serves East Palo Alto residents. Ravenswood provides outreach and engagement services and identifies individuals presenting for healthcare services that have significant needs for behavioral health services. Ravenswood outreach and engagement services are funded at 40% under CSS and the remaining 60% is funded through Prevention and Early Intervention. The intent of the collaboration with Ravenswood FHC is to identify patients presenting for healthcare services that have significant needs for mental health services. Many of the diverse populations that are now un-served will more likely appear in a general healthcare setting. Therefore, Ravenswood FHC provides a means of identification of and referral for the underserved residents of East Palo Alto with SMI and SED to primary care based mental health treatment or to specialty mental health. In FY 14-15, CSS funded 40% of Ravenswood Family Health Center (the remaining 60% is funded through Community Services and Supports). The program served 638 total clients. Cost per person: $109
Page 50 of 101
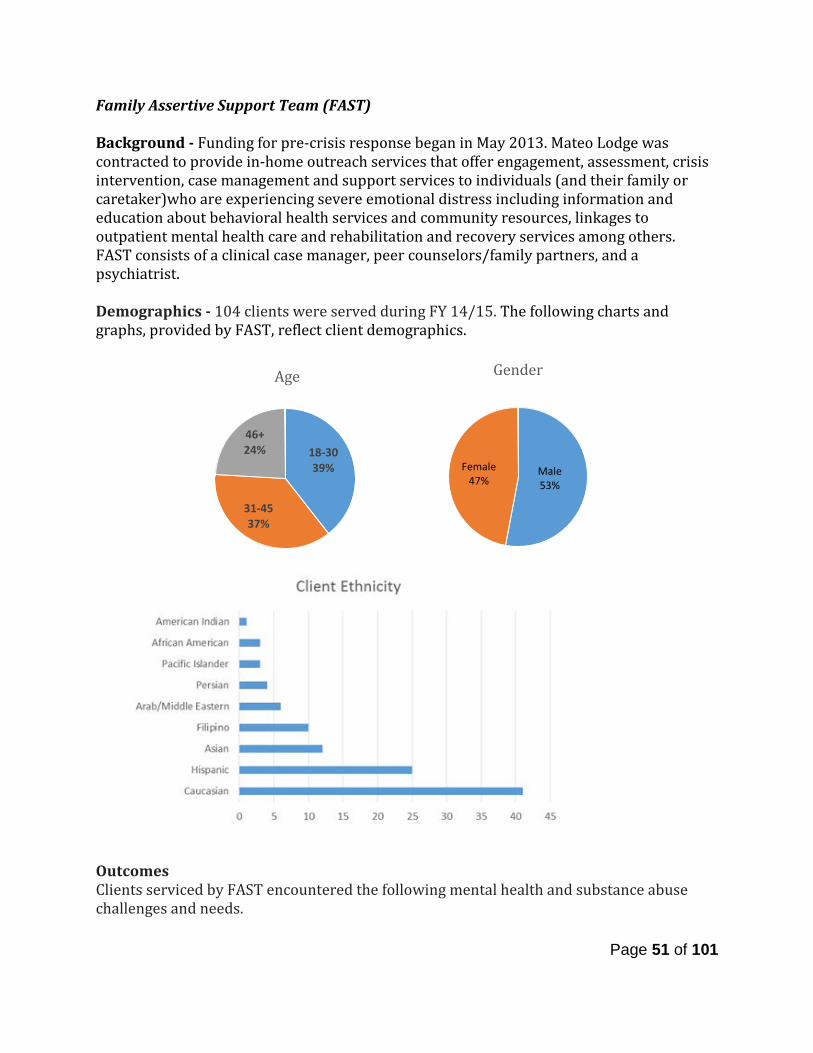
Family Assertive Support Team (FAST) Background - Funding for pre-crisis response began in May 2013. Mateo Lodge was contracted to provide in-home outreach services that offer engagement, assessment, crisis intervention, case management and support services to individuals (and their family or caretaker)who are experiencing severe emotional distress including information and education about behavioral health services and community resources, linkages to outpatient mental health care and rehabilitation and recovery services among others. FAST consists of a clinical case manager, peer counselors/family partners, and a psychiatrist. Demographics - 104 clients were served during FY 14/15. The following charts and graphs, provided by FAST, reflect client demographics.
Outcomes Clients serviced by FAST encountered the following mental health and substance abuse challenges and needs.
Male 53%
Female 47%
Gender
Page 51 of 101
18-30 39%
31-45 37%
46+ 24%
Age
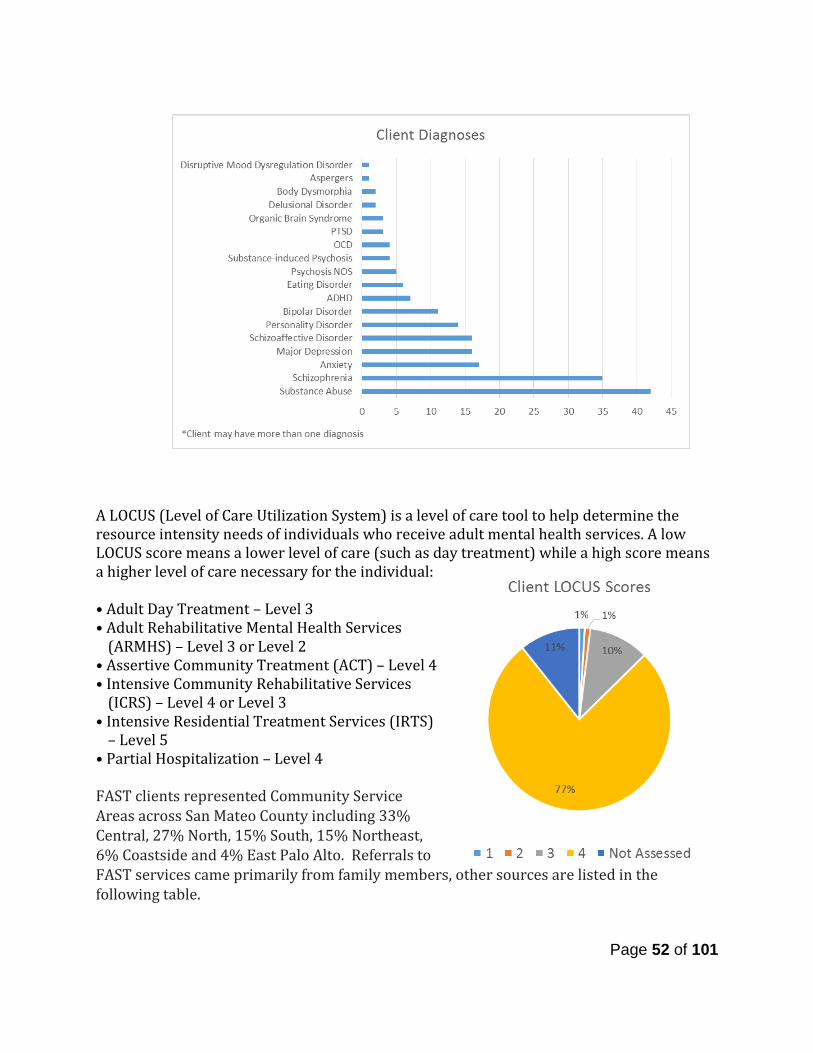
A LOCUS (Level of Care Utilization System) is a level of care tool to help determine the resource intensity needs of individuals who receive adult mental health services. A low LOCUS score means a lower level of care (such as day treatment) while a high score means a higher level of care necessary for the individual: • Adult Day Treatment – Level 3 • Adult Rehabilitative Mental Health Services
(ARMHS) – Level 3 or Level 2 • Assertive Community Treatment (ACT) – Level 4 • Intensive Community Rehabilitative Services
(ICRS) – Level 4 or Level 3 • Intensive Residential Treatment Services (IRTS)
– Level 5 • Partial Hospitalization – Level 4 FAST clients represented Community Service Areas across San Mateo County including 33% Central, 27% North, 15% South, 15% Northeast, 6% Coastside and 4% East Palo Alto. Referrals to FAST services came primarily from family members, other sources are listed in the following table.
Page 52 of 101
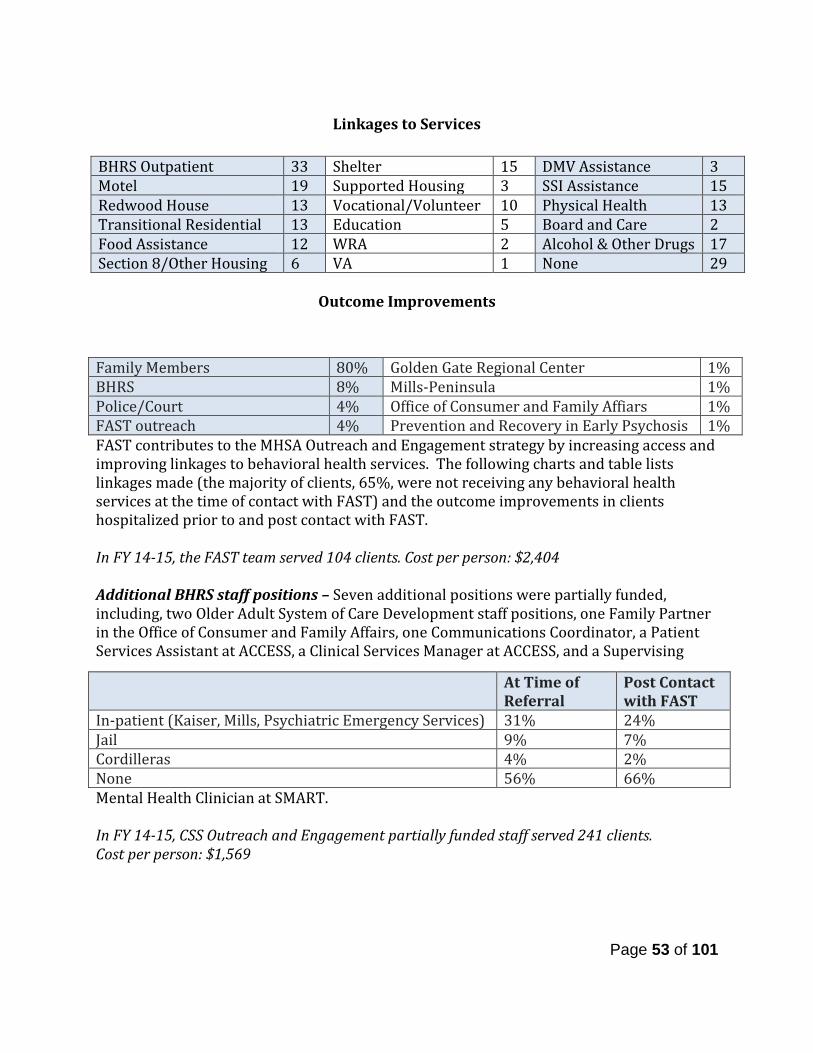
Linkages to Services
Outcome Improvements
FAST contributes to the MHSA Outreach and Engagement strategy by increasing access and improving linkages to behavioral health services. The following charts and table lists linkages made (the majority of clients, 65%, were not receiving any behavioral health services at the time of contact with FAST) and the outcome improvements in clients hospitalized prior to and post contact with FAST. In FY 14-15, the FAST team served 104 clients. Cost per person: $2,404 Additional BHRS staff positions – Seven additional positions were partially funded, including, two Older Adult System of Care Development staff positions, one Family Partner in the Office of Consumer and Family Affairs, one Communications Coordinator, a Patient Services Assistant at ACCESS, a Clinical Services Manager at ACCESS, and a Supervising
Mental Health Clinician at SMART. In FY 14-15, CSS Outreach and Engagement partially funded staff served 241 clients. Cost per person: $1,569
Family Members 80% Golden Gate Regional Center 1% BHRS 8% Mills-Peninsula 1% Police/Court 4% Office of Consumer and Family Affiars 1% FAST outreach 4% Prevention and Recovery in Early Psychosis 1%
BHRS Outpatient 33 Shelter 15 DMV Assistance 3 Motel 19 Supported Housing 3 SSI Assistance 15 Redwood House 13 Vocational/Volunteer 10 Physical Health 13 Transitional Residential 13 Education 5 Board and Care 2 Food Assistance 12 WRA 2 Alcohol & Other Drugs 17 Section 8/Other Housing 6 VA 1 None 29
At Time of Referral
Post Contact with FAST
In-patient (Kaiser, Mills, Psychiatric Emergency Services) 31% 24% Jail 9% 7% Cordilleras 4% 2% None 56% 66%
Page 53 of 101
Community Services and Supports (CSS) – System Development (SD)
The following are highlights for FY 14/15, per program: The Older Adult System of Integrated Services (OASIS) Background – OASIS serves older adults at risk of becoming or seriously mentally ill, including those served by specialty field-based outpatient mental health team, County clinics, community-based providers, mental health managed care network providers (private practitioners and agencies), primary care providers, and Aging and Adult Services. There is an emphasis on serving specific ethnic/linguistic populations for different regions of the County. For example, in the Coast region the focus is on Latino populations, while in North County the focus is on Asian populations, and in South and Central County the focus is on Black/African-American, Latino, and Asian and Pacific Islanders. Demographics - Total Clients served: 286 Total New cases: 42 Language Spoken – 81% English; 11% Spanish; 8% Chinese speaking Successes – New pilot programs continue to emerge that address the needs of the older adult population. Currently, the OASIS supervisor sits on two planning committees, which were developed during this period, including the Sequoia Health Care District Sequoia 70 project and the Community Care Settings Pilot program. In September of 2014, BHRS became part of a collaborative pilot with the Health Plan of San Mateo aimed at identifying individuals in skilled nursing facilities who could return to community living if provided with medical and case management supports. Given that many older adults occupy beds in these facilities, the OASIS supervisor sits on the review committee and is able to assist in identifying mental health needs of individuals presented for review. Those who are accepted into the program are either served by the OASIS home based team or are referred to community service area (CSA) BHRS clinic. Thus far, the pilot has been very successful with several former BHRS and OASIS clients having returned to living back in the community and some clients returning to their former treatment teams. Challenges – During FY14-15, the OASIS team experienced a larger than normal number of clients passing away due to physical health problems. The clinical staff discussed creating a ritual to recognize the loss of the often long-term relationship with the client. Additionally, this is a population, which often has multiple medical problems, requiring numerous visits to medical appointments. The OASIS team had particular difficulty hiring and maintaining drivers to transport clients, necessitating clinicians to do the transporting, sometimes reducing clinical availability and resources to other clients. Efforts are being made to recruit more drivers - also known as Older Adult assistants - who can not only drive clients to appointments, but also assist and support them during the visit. In FY 14-15, OASIS served 286 clients based on the clinicians partially funded by MHSA. Cost per person: $2,602
Page 54 of 101
Senior Peer Counseling Services Program Background - The Senior Peer Counseling Program, provided by Peninsula Family Service, recruits and trains volunteers to serve homebound seniors with support, information, consultation, peer counseling, and practical assistance with routine tasks such as accompanying seniors to appointments, assisting with transportation, and supporting social activities. The Senior Peer Counseling program has been expanded to include Chinese, Filipino and LGBT volunteers. In order to serve more people with the current resource of peer counselors, the program offers weekly support groups at various community sites. There are currently five groups in senior/community centers or other non-profit agencies throughout San Mateo County. A new multi-cultural group has also started up at the Hillcrest Gardens apartments. The Senior Peer Counseling offer group sessions with different formats. Some meetings are organized as an open discussion, which gives everyone an opportunity to engage and express their sentiments, thoughts, opinions, feelings. Other meetings are topic-based discussion exploring a variety of subjects including:
• You Have Beliefs – Belief Buster – The nature of beliefs • Time Outs – A Strategy for Dealing with Anger • Parent-Child Relationships • When your Kids Become Adults • What Is Fear - False Evidence Appearing Real • How to Overcome Fear
Other groups feature a guest speaker addressing issues of concern to seniors such as health insurance and abuse, avoiding scam and fall prevention strategies.La Esperanza Vive, the Spanish-speaking component of the program has 3 active groups. There is both a men’s and a women’s group at the Menlo Park Senior Center and a mixed gender group at the Fair Oaks Adult Activity Center called “La Platica”. Each group averages about 10 –15 participants per session. Some of the topics that have been covered this year have been: anxiety, dealing with loss, loneliness, physical effects of aging, psychological effects of aging, family histories and current family dynamics. Demographics Race/Ethnicity: 47% Latino, 24% Filipino, 21% Other, 8% Asian Age: 1% 26-59, 99% 60+ Language: 47% Spanish, 24% Tagalog, 21% English, 8% Chinese Outcomes
• This year 181 new clients entered the program and 198 clients were closed to services. There are currently 350 active clients in the program and 548 senior peer counseling clients have been served during the year, which is 168% of goal. Of the active clients 128 clients are seen weekly on an individual basis and 222 clients are participating in a group.
Page 55 of 101

• Upon completion of the senior peer counseling training, 95% of all new volunteers stated that they felt prepared to start working with clients.
• A total of 123 Senior Peer Counseling program participants completed a client survey during the period between June and July 2015. The vast majority of clients (73.1%) had been participating in the program for one year or longer. The survey results indicated that clients in the Senior Peer Counseling Program spoke with their counselors about a range of issues and that they were more likely to speak with the counselor than with anyone else, including family members or friends.
• Ninety-seven percent of clients indicated that services helped at least “a little bit.” In general, the majority of clients (65%) felt that their conversations with their peer counselors “helped them a lot.” This was true for all clients, including those who were relatively new to the program (0 to 6 months) and those who had been participating for 6 months or longer.
• The survey also identified that clients have many needs. Survey results suggest that a majority of the clients face difficulties related to issues such as worries or stressors, loneliness, and transportation. Additionally, individual counseling clients may need more assistance or motivation to engage in activities, and more support to lift their levels of satisfaction with life in general.
• The Senior Peer Counseling program participated in a variety of outreach activities during this quarter including staffing booths at several senior health fairs and the program is also a co-sponsor of the San Mateo County Pride event in June. In an effort to increase the number of program volunteers, Family Service Agency is planning an open house for later in the summer .
Successes • The recruitment goal set for this year is to recruit 60 new peer counselors. 87
counselors have been recruited, which reflects 145% of the goal. • The training goal set for this year is to train 36 new peer counselors. 45 counselors
have been trained to date (125%of the goal). • Through this year the Senior Peer Counseling Program had 131 senior peer
counselors participating in the program, 145% of the goal. 32 counselors retired over the year, bringing the current total of active peer counselors to 99.
Challenges
• Peninsula Family Service identified the need for additional support for the Mandarin speaking senior peer counselors. Funding was obtained from the Peninsula Healthcare District to provide these counselors with clinical supervision in their native language and also to fund a portion of the program evaluation. In an effort to increase the number of program volunteers with the specified language capabilities, several outreach activities were held. Furthermore, an open house will be held later this summer for additional exposure.
In FY 14-15, CSS funded 50% of Senior Peer Counseling (the remaining 50% is funded through PEI). The program served 548total clients. Cost per person: $532
Page 56 of 101
Pathways, Court Mental Health Program Background - The Pathways Program serves seriously mentally ill (SMI), nonviolent offenders with co-occurring disorders. The program is a partnership of San Mateo County Courts, the Probation Department, the District Attorney, the Private (Public) Defender, the Sheriff’s Department, Correctional Health, and the Behavioral Health and Recovery Services Division. Through criminal justice sanctions/approaches, and treatment and recovery supports addressing individuals’ underlying behavioral health issues, offenders are diverted from incarceration into community-based services. Typically, a Pathways client is sentenced to three years’ probation and remains as an active member of the Pathways Program for these three years. When they graduate from Pathways there is a formal ceremony in court where their case and their accomplishments are shared with all in the courtroom including prisoners who may become Pathways clients. Graduates receive a Pathways Certificate signed by the Pathways Judge. Pathways Graduates are no longer on probation but remain in the Pathways Program as Alumni to remain connected to ongoing activities and to help guide and support others in the program. Demographics Race/Ethnicity: 43% White/Caucasian, 24% African-American, 14% Asian, 12% Latino, 5% Mixed/Multi-racial, 2% Other Age: 7% 16-25, 69% 26-59, 17% 60+ Gender: 40% Female, 60% Male Outcomes
• 42 clients were served during FY 14-15. • Pathways currently has 71 Graduates since its inception in 2006. • The program celebrated 9 clients who successfully completed probation, clients
have both their court fines and fees forgiven.
Successes • This year Pathways has had 6 clients graduate from El Centro, 1 from Project 90, 5
completed social rehabilitations programs, 1 from Pyramid Alternatives’ outpatient program, 2 clients obtained full-time/part-time employment and 2 clients found volunteer positions. One client received Section 8 housing.
• The Pathways Clubhouse celebrates its 4th year providing activities to both men and women in our program. This group is every Saturday from 9:00am-Noon at Heart and Souls new location in San Carlos. The Clubhouse has been successful in empowering clients that are on probation that live with a mental illness to stay on the road of recovery and wellness. Pathways Alumni frequently attend the Clubhouse for support. They form friendships, receive psycho-education and support to be successful while on probation. The court acknowledges the Clubhouse in a positive light and supports the success of the clients who participate.
Page 57 of 101

Activities • The MFT volunteer intern who actively provided court ordered assessment and
individual and group therapy successfully completed an internship with Pathways. • The program hired two extra-help positions and one permanent employee. • A Mental Health Program Specialist was added to Pathways to supervise staff and
work on the forensic population team. • In November 2014, Pathways held its annual Holiday Party with the Pathways staff,
clients, family and providers. This event served over 70 providers and clients. In April 2015, Pathways had a Retreat to support our teams need to get back on track, focus on healthy partner communication to work more effectively.
In FY 14-15, Pathways served 42 individuals. Cost per person: $4,696 Pathways Co-occurring Housing Services – Shelter Network is contracted to provide a variety of services including two dedicated transitional beds per night, one fee-for-service one bedroom apartment on an as-needed basis; supported housing services for families with children; programmatic support; childcare services for women in the Pathways for Women program while they are attending clinical activities and meetings. A representative from Women’s Recovery Association participates three hours a week in the Pathways for Women program meetings. Mental Health Association (MHA) manages the fiscal distribution of the Pathways Flexible Fund to support clients. SYSTEM TRANSFORMATION AND EFFECTIVENESS STRATEGIES System Transformation and Effectiveness Strategies includes a focus on recovery/resilience and transformation; increased capacity and effectiveness of County and contractor services through training, bilingual/bicultural clinicians, peers/peer-run services and family partners; implementation of evidence-based and culturally competent practices; family support and education training for all providers serving all ages. San Mateo County BHRS has continued to support persons with lived experience working in our youth System and adult Systems. These employees provide direct services to consumers/clients as well as support and bring their unique perspectives throughout the entire behavioral health system and community.
Peer Community Workers
In the adult systems, there are 10 Community Workers (CW) who have lived experience as a consumer/client. These positions are mostly full time, civil service positions that are embedded in clinical teams. The Community Workers represent diverse cultural and linguistic backgrounds including staff who is bicultural and bilingual Spanish, Tagalog and Chinese as well as English speaking African American and White/Caucasian persons.
Page 58 of 101
Community Workers assist adult clients in the following ways: Facilitate groups such as WRAP, WRAP for housing, Dual Diagnosis Group, Welcome Registration/Orientation for new clients, Crochet and Knitting Group, Healthy Living group, Case Management Workshop, Ash Thinkers, Ash Kickers, Chinese Family Support Group, Cooking with Ease, Stress group. They also help clients find shelter beds, connect to vocational resources and provide transportation.
CWs bring their lived experience to the broader community by participating on the following community groups and initiatives: African American Community Initiative, Co-Occurring Committee, Lived Experience Speakers Academy and Speakers Bureau, Housing Committee, Workforce Development and Education Committee: Integrated Care, Co-Occurring Change Agents, Housing Operations and Policy Committee, Change Agent Housing Committee, Change Agent Recruitment and Education and Community Service Area planning.
Family Partners
In the youth system, there are 8 Family Partners with lived experience as a family member of someone with behavioral/mental health challenges. All but one position is full time and all are civil service positions. Seven Family Partners are embedded on the youth clinical service teams and one Family Partner is on the Adult Pathways Mental Health Court team. The Family Partners represent diverse cultural and linguistic backgrounds including staff that identify as bicultural and bilingual Spanish and Tongan, as well as English speaking African American.
Family Partners provide individual support to parents of the youth, sharing their lived experience with the families they serve. They also provide group support to parents/caregivers by providing educational activities around children and their mental health. Groups co-facilitated by Family Partners include: Wellness Recovery Action Planning (WRAP), Parent Project, Equip Educate and Support (EES), Parent support groups, and NAMI Basics.
FPs also bring their lived experience to the broader community by participating on the following community groups and initiatives: African American Community Initiative, Latino Collaborative, and North County Outreach Collaborative.
In FY 14-15, 489 clients were served, Peer Partners 313 and Family Partners 176 clients. Cost per person: $1,959 Puente Clinic - This specialty clinic sponsored by Behavioral Health and Recovery Services, Golden Gate Regional Center (GGRC) and Health Plan of San Mateo (HPSM) serves the special mental health needs of clients with developmental disabilities. Since the inception of The Puente Clinic in 2008 until June 30, 2015, Puente has received 333 referrals.
Page 59 of 101
Outcomes
• During the reporting year, Puente received 70 referrals. 50 of the referrals were opened for service.
• Of the 20 not opened: o 3 did not yet qualify for HPSM o 2 did not meet criteria o 4 were referred to CBEM, a GGRC contracted crisis behavioral team o 1 had private insurance o 4 were referred to North County o 3 were referred to South County o 3 were assigned to Central County.
Challenges - It has been a challenging year for Puente due to staffing issues and an increase in the usual amount of referrals in a given year. The clinic lost two psychiatrists, a nurse practitioner, and one half-time psychiatrist went on maternity leave causing delays opening cases and increasing current staff members’ caseloads. Successes - A 27 year old woman diagnosed with Bipolar II disorder, single episode with psychotic features and cognitive disorder NOS; along with impulse control disorder NOS. Client’s parents reported that their daughter had poor peer relations, volatile mood swings, was easily distracted and had poor problem solving skills from the age of 3. By client report she was molested at age 5 by a 13-year old boy. Before the age of 4, client’s school reported aggressive (biting), impulsive and sexual acting out behaviors. Client was sent home from school frequently and the school instituted a home–school program. The parents found this unsatisfactory and by age 15, client was admitted to Canyon Oaks Youth Center. At Canyon Oaks client received individual and group counseling, including Dialectical Behavior Therapeutic (DBT) services. After leaving Canyon Oaks, client went through a therapeutic day school, received services at Edgewood Center and returned to the community and came to Puente Clinic in 2009. Client was connected to a DBT group in her first year (2009) with Puente and most recently client was introduced to art therapy with a Puente intern. Client has used therapy to her benefit, providing an opportunity to work on abandonment issues regarding her mother and improving client’s judgment and impulse control. In FY 14-15, MHSA partially funded two 0.5 FTE clinical positions, and they served 100 total clients (50 clients based on FTE). Cost per person: $1,405 Co-Occurring Contracts with Alcohol and Other Drug Providers - BHRS contracts with nine AOD providers for either additional bed days (for residential providers) or additional hours of service (for non-residential providers), or to enhance/supplement services provided to clients already in residential or non-residential treatment.
Page 60 of 101
• El Centro - 665 Units of Service (UOS) delivered, 108% of contracted amount • Free At Last - 385 UOS delivered, 106% of contracted amount • Our Common Ground - 1182 UOS delivered, 302% of contracted amount • Project 90 - 565 UOS delivered, 102% of contracted amount • Pyramid - 912 UOS delivered, 123% of contracted amount • Service League - 1260 UOS delivered, 100% of contracted amount • WRA - 427 UOS delivered, 103% of contracted amount
StarVista GIRLS Program Background – The GIRLS Program is an intensive dual diagnosis (substance abuse and co-occurring mental health diagnosis) treatment program for adolescent females who have significant histories with substance use, trauma, Child Protective Services, and the juvenile court system. The girls are granted this program in lieu of placement such as incarceration at the Youth Services Center or a group home. StarVista is contracted with BHRS to provide services to 10 girls with co-occurring disorders. The program consists of three phases:
Phase I – in-custody intervention which may range from 90-180 days. Activities include crisis stabilization, substance abuse and mental health assessment, individual and group treatment, alcohol and other drug treatment groups, multi-family groups, treatment planning, meeting with the probation officer, and pre-release transition planning. Phase II – consists of out-of-custody interventions, which may range from 90-180 days. Activities include individual and group treatment, completion of multi-family groups, treatment planning, and meeting with the probation officer. GEP (GIRLS Empowerment program) consists of out-of-custody interventions ,which may range from 90-180 days for girls who are attending school at Kemp Camp. Activities include individual and group treatment, treatment planning, and meeting with the probation officer. Phase III – outpatient out-of-custody interventions, which may range from 90-180 days. Clients in this phase of the program attend treatment one day a week and receive one group and one individual counseling session. Treatment has also devised a maintenance phase for girls who are ready to progress from several group sessions a week to solely individual counseling sessions.
It has been observed generally by StarVista staff that the girls entering the Program continue to have more complex issues, including significant substance abuse, mental health issues, sexual trauma/commercial sexual exploitation, histories of running away, attachment issues, and family-of-origin issues that make it challenging for them to
Page 61 of 101

complete tasks necessary for release into Phase II. Additionally, there are significant levels of gang involvement and sexual exploitation, which adds an additional layer of complexity to this work. The initial focus of the GIRLS Program is addressing the trauma and co-occurring issues of the participants of the program by developing a treatment plan and strategies supporting recovery from both mental health and substance use issues. Introducing Cognitive Behavioral Treatment (CBT) strategies promote healthy choices and encourages a clean and sober lifestyle. Equally important is the understanding the clients emotional situation by initiating a psychological evaluation which helps identifying relevant mental health issues that are impacting a participant and may be creating challenges and impeding a participant’s progress. Additionally, the trauma issues impacting this population are significant and substantial and require specialized training and intervention skills. Some of the varied and relevant life skill curriculum topics this reporting year have included:
• Building hope, trust, and community • Anger Management • Relapse Prevention • Trauma issues • Communication Skills • Building healthy relationships • Body Image and Self-Care • Nurturing Parenting • Building Self-Esteem • Nutrition and Healthy Eating • Conflict Resolution • Women’s Sexuality • Grief and Loss • Domestic Violence and Teen Dating • Creative Process and Self Development • Mindfulness and AOD • Getting a job/interviewing skills
Demographics - The GIRLS Program is an intensive dual diagnosis (substance abuse and co-occurring mental health diagnosis) treatment program for adolescent females who have significant histories with substance use, trauma, CPS, and the juvenile court system. The girls are granted this program in lieu of placement such as incarceration at YSC or a group home.
• The girls are between the ages of 12 – 18 years old. • 65% arrive to the program from single-parent families • A significant number of the girls are gang affiliated and commercially sexually
exploited children.
Page 62 of 101
Race/Ethnicity: 63% Latino, 11% African-American, 8% Pacific Islander, 6% Filipino, 6% Mixed/Multi-racial, 6% Other Age: 42% 0-15, 58% 16-25 Challenges – A continuing challenge is how to provide sufficient support to clients in Phase II given the transportation barrier for many of the clients. Phase II clients that do not attend Camp Kemp school were typically receiving treatment only one day a week instead of three days in the past, which created a very sudden transition of services at a time when they need intensive support to cope with returning to their community. Two extended Leadership meetings of the multi-disciplinary team were held this quarter to determine how to go forward with this with the result that in 2016 Phase II clients will be required to attend two Phase II therapy groups. Phase II treatment would then include on a weekly basis two group therapy sessions, one individual therapy session, one family therapy session and the completion of the multi-family group. There has long been consensus within the mental health team that Phase II must include consistent contact with the client and their family through individual therapy and family therapy sessions/ the multi-family group so that issues regarding transitioning home can be adequately addressed. There was an unusually high number of Spanish speaking families, which together with the shortfall in BHRS clinicians resulted in some delays in proving family therapy to Spanish speaking families in particular. The appointment of a new BHRS clinician should help ease this situation significantly. In FY 14-15, StarVista’s AOD Juvenile Program served 36 clients. Cost per person: $8,800 based on 10 spots Child Welfare Partners – As part of the 2009-10 MHSA expansion plan, BHRS partially funds two clinicians serving high-risk children/youth referred through Child Welfare to Partners program. In FY 14-15, Child Welfare Partners program served 37 clients. Cost per person: $5,003 Evidence-based practice (EBP) expansion - System transformation is supported through an ongoing series of trainings that increase utilization of evidence-based treatment practices that better engage consumers and family members as partners in treatment and that contribute to improved consumer quality of life. MHSA funding supports staffing specialized in the provision of evidence-based services throughout the system, for youth and adult clients. In FY 14-15, clinicians served 219 youth and 1,003 adult clients. Cost per person: $1,084
Page 63 of 101

Prevention and Early Intervention (PEI) (covering highlights and data from FY 2014-2015 services)
PEI interventions target individuals of all ages prior to the onset of mental illness, with the sole exception of programs focusing on early onset of psychotic disorders such as schizophrenia. PEI programs are designed and implemented to help create access and linkage to treatment, improve timely access to mental health services for individuals and/or families from underserved populations in ways that are non-stigmatizing, non-discriminatory and culturally appropriate. San Mateo has focused its PEI dollars primarily on evidence-based interventions that have a proven track of success. PEI is approximately 15-20% of the MHSA budget and requires 51% of PEI funds be spent on children and youth ages 0 to 25. PEI PROGRAM EVALUATION In July 2013, Gibson & Associates was contracted to conduct an evaluation and provide data for two years of PEI implementation. The intent was to understand the impact these programs are having in terms of promoting mental health, reducing the risk of mental illness, and decreasing the severity and negative consequences associated with onset of mental illness. See Appendix 7 for the second year report, for services implemented in fiscal years 2014-15. Eight San Mateo County PEI programs were evaluated:
• Project Grow – Middle School Initiative • Teaching Pro-Social Skills • Project YES! & AC-OK, Seeking Safety Interventions • Project SUCCESS • Early Childhood Community Team (ECCT) • Crisis Hotline and Youth Intervention Team (YIT) • Prevention of Early Psychosis (PREP)
The full report includes a project description, in the areas of productivity, effectiveness/impact, satisfaction with services, responsiveness to target community and MHSA requirements, implementation success and lessons learned. Here are a few highlights (including barriers and challenges) from each program:
• Project Grow encountered a number of challenges, which hampered program implementation to a significant degree, and also limited the validity of the evaluation as only fourteen students were served all year, as compared with 32 last year.
• Project YES! experienced program barriers during the second year of implementation In response, the program was adapted to take a client-centered approach that was reflected in the client self-assessment surveys. This approach was valued by participants; to be able to speak with others about the issues challenging them in the moment rather than having a focused (discussion) group.
• El Centro’s AC-OK program initiated a second scheduled group in Redwood City to improve attendance and increase the number of sessions attended by clients.
• At all six Teaching Pro-Social sites, participation rates were exemplary with rates at each site exceeding 90%. Outcomes for the six school sites were also exemplary as every site
Page 64 of 101
experienced increases in teacher-reported positive behaviors, with four of the sites having especially impressive gains.
• Project SUCCESS achieved an extraordinary impact upon the social competencies and positive values of students who had been determined to be at-risk.
• ECCT is having a positive impact on the children, teachers, and families being served according to pre-post surveys.
• Crisis Hotline callers were extremely satisfied with their experience contacting the hotline with 80% of respondents indicating that they felt connected to the counselor, 87% finding the call helpful, and 88% indicating they would call the Hotline again if they had a problem.
• PREP built on last year’s success significantly with only one client experiencing an increase in hospitalization days and 97% of clients experiencing either a reduction in hospitalization days or no hospitalization days both before and during PREP.
Overall Process Findings and Outcomes Every project evaluation validated client satisfaction and/or positive client impact. Collaboration between project managers and the evaluator resulted in identification of
significant areas for improvement that could only have occurred as a result of an evaluation. Staff attrition impacted services and data collection efforts. Most PEI projects lacked capacity for participating in an external evaluation. All PEI programs now have a consistent evaluation plan currently being implemented PEI program reports will now include impact and satisfaction data, along with the usual
service dosage, demographics, successes and challenges PEI PROGRAMS FOR AGES 0-25 Early Childhood Community Team (ECCT) – Early Intervention Background – ECCT incorporates several major components that build on current models in the community, in order to support healthy social emotional development of young children. The ECCT comprises a community outreach worker, an early childhood mental health consultant, and a licensed clinician and targets a specific geographic community within San Mateo County, in order to build close networking relationships with local community partners also available to support families. The ECCT delivers three distinct service modalities that serve at risk children and families: 1) Clinical Services, 2) Case management/Parent Education services, and 3) Mental health consultations with childcare and early child development program staff and parents served by these centers. In addition, the ECCT team conducts extensive outreach in the community to build a more collaborative, interdisciplinary system of services for infants, toddlers and families. The ECCT focuses services on the Coastside community - a low-income, rural, coastal community geographically isolated community - comprised of Half Moon Bay, La Honda, Pescadero, Moss Beach, Montara and the unincorporated coastal communities of El Granada, Miramar and Princeton-By-The-Sea. While comprised of very small cities and unincorporated areas located significant distances from one another, collectively Coastside
Page 65 of 101
comprises 60% of the total area of the entire County while having a small fraction of the population. To better serve this disperse community, ECCT has built strong relationships with key community partners and successfully refers families to the local school district, other StarVista services, Coastside Mental Health clinic and Pre-to-Three Program , among others. Additionally, ECCT works with these partners to address gaps and needs in the community and to address the existing system of care for families with young children living in the Coastside areas. For several years, the ECCT has operated in North County with funding for only a clinician position, but with additional County funding (non MHSA), ECCT now has a full team, serving North County with all roles filled, albeit a team comprised of part-time staff. Operating with a primary office in donated space in Half Moon Bay contributed by Cabrillo School District, Mental Health Consultation services continue to support staff and families at early care and education settings in the Coastside. Consultation services continue to have a significant impact on the families and staff at the four programs receiving this service in the Coastside: Half Moon Bay Head Start; Moonridge Head Start and Early Head Start, and Coastside Children’s Program. While these are the primary early childhood mental health consultation sites, the ECCT is highly mobile, providing services at four early childhood programs as well as in the homes of families. Demographics Race/Ethnicity: 88% Latino, 4% Mixed Race, 3% White/Caucasian, 3%Black/African-American, 3% Other, 8% Asian Age: 1% 26-59, 99% 60+ Language: 47% Spanish, 24% Tagalog, 21% English, 8% Chinese See Appendix 7, PEI Program Year 2 Evaluation Report, for more outcomes and activities. In FY 14-15, ECTT-Star Vista served 75 child clients. Cost per person: $5,041 Community Interventions for School Age and Transition Age Youth– Prevention Project SUCCESS Background – Initiated in 2013, Puente de la Costa Sur (Puente) delivered Project SUCCESS (Schools Using Coordinated Community Efforts to Strengthen Students) services at three San Mateo South Coast schools: La Honda Elementary, Pescadero Middle School and Pescadero High School, and in 2014-15, Puente added a fourth site, Pescadero Elementary School. In addition to Project SUCCESS groups where coping skills, communication, decision-making and other social skills, are introduced, Puente delivers a range of educational and prevention services in large, school wide presentations, particularly at the high school. The SUCCESS groups and the school-wide presentations also serve as a point-of-entry to individual counseling services available at all four schools. Groups are designed to meet once per week for 8 weeks with the exception of the high school group which has met consistently once per week since being launched in Sept 2013.
Page 66 of 101
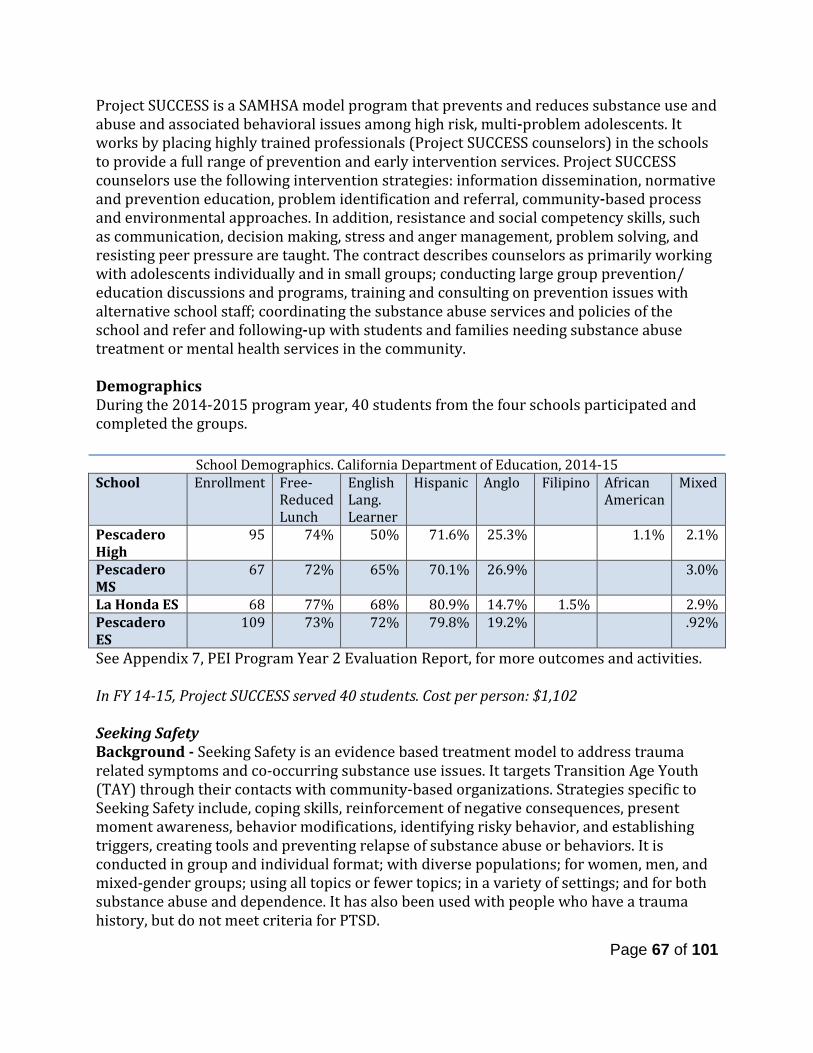
Project SUCCESS is a SAMHSA model program that prevents and reduces substance use and abuse and associated behavioral issues among high risk, multi-problem adolescents. It works by placing highly trained professionals (Project SUCCESS counselors) in the schools to provide a full range of prevention and early intervention services. Project SUCCESS counselors use the following intervention strategies: information dissemination, normative and prevention education, problem identification and referral, community-based process and environmental approaches. In addition, resistance and social competency skills, such as communication, decision making, stress and anger management, problem solving, and resisting peer pressure are taught. The contract describes counselors as primarily working with adolescents individually and in small groups; conducting large group prevention/ education discussions and programs, training and consulting on prevention issues with alternative school staff; coordinating the substance abuse services and policies of the school and refer and following-up with students and families needing substance abuse treatment or mental health services in the community. Demographics During the 2014-2015 program year, 40 students from the four schools participated and completed the groups.
See Appendix 7, PEI Program Year 2 Evaluation Report, for more outcomes and activities. In FY 14-15, Project SUCCESS served 40 students. Cost per person: $1,102 Seeking Safety Background - Seeking Safety is an evidence based treatment model to address trauma related symptoms and co-occurring substance use issues. It targets Transition Age Youth (TAY) through their contacts with community-based organizations. Strategies specific to Seeking Safety include, coping skills, reinforcement of negative consequences, present moment awareness, behavior modifications, identifying risky behavior, and establishing triggers, creating tools and preventing relapse of substance abuse or behaviors. It is conducted in group and individual format; with diverse populations; for women, men, and mixed-gender groups; using all topics or fewer topics; in a variety of settings; and for both substance abuse and dependence. It has also been used with people who have a trauma history, but do not meet criteria for PTSD.
School Demographics. California Department of Education, 2014-15 School Enrollment Free-
Reduced Lunch
English Lang. Learner
Hispanic Anglo Filipino
African American
Mixed
Pescadero High
95 74% 50% 71.6% 25.3% 1.1% 2.1%
Pescadero MS
67 72% 65% 70.1% 26.9% 3.0%
La Honda ES 68 77% 68% 80.9% 14.7% 1.5% 2.9% Pescadero ES
109 73% 72% 79.8% 19.2% .92%
Page 67 of 101
El Centro’s AC-OK Seeking Safety program targeted Transition Age Youth and young adults, the vast majority of whom were referred by the Department of Probation. El Centro named its Seeking Safety program the AC-OK Program as it conveyed a more positive image than Seeking Safety. El Centro delivers weekly Seeking Safety group sessions at their Redwood City clinic and in Half Moon Bay. Seeking Safety is an approach to help people attain safety from trauma/PTSD and substance abuse. Seeking Safety is a manualized intervention (also available in Spanish), providing both client handouts and guidance for clinicians. It is conducted in group and individual format; with diverse populations; for women, men, and mixed-gender groups; using all topics or fewer topics; in a variety of settings; and for both substance abuse and dependence. See Appendix 7, PEI Program Year 2 Evaluation Report, for more outcomes and activities. In FY 14-15, Seeking Safety program at El Centro served 33 clients. Cost per person: $1,800 Caminar’s Seeking Safety YES program provides individualized outreach, assessment, and population specific groups to Transition Age Youth (TAY) throughout San Mateo County. In order to “meet the youth where they are at” services are offered in a variety of settings and locations (e.g. youth drop-in centers, hospitals, residential facilities, and substance recovery facilities). Groups are offered a minimum of once weekly at each location and incorporate a variety of youth specific adaptations to address the unique needs of the TAY. Demographics A total of 99 unduplicated clients were served in the 2014-15 fiscal year. 5% were homeless, 22% on probation and 75% unemployed. Race/Ethnicity: 36% Latino, 16% White/Caucasian, 15% Mixed/Multi-racial, 11% Pacific Islander, 8% Other, 2% Asian Age: 46% 15-17, 19% 18-20, 13% 21-23, 21% 23+ Gender: 71% Male, 28% Female, 1% Transgender
Caminar’s Seeking Safety Program served transition age youth ages 16 to 27 delivering 13 groups at six different locations with the vast majority of participants 25 or under. For 2014-15, Sites for YES! are listed below:
• 2 groups at Redwood House (Monday & Friday at 10:30 am) • 3 groups at Cordilleras (Monday, Wednesday & Friday at 12:30 pm) • 1 group at South County BHRS, (Monday at 2 pm) • 5 groups serving 3 different units at the Youth Services Center (Tuesday & Thursday
at 3 and 4:15 pm; Wednesday at 3 pm) • 1 group at Eucalyptus House (Wednesday at 4 pm) • 1 group at Edgewood Drop-In Center (Wednesday then Monday at 6:30 pm).
See Appendix 7, PEI Program Year 2 Evaluation Report, for more outcomes and activities. In FY 14-15, Seeking Safety at Caminar served 99 clients. Cost per person: $1,248
Page 68 of 101
Middle School Initiative, Project Grow Background - Project Grow provides school-based, Evidence-Based Practice Trauma-Focused Cognitive Behavioral Therapy that focuses upon helping students develop resiliency skills necessary to be successful at school. Project Grow explicitly incorporates the development of Search Institute’s Forty-One Developmental Assets directly into each child’s individual treatment goals. Students targeted for services are determined to be at risk of serious emotional disturbance but are not eligible for special education. Project Grow offers strength-based individual counseling services as well as collateral services that include consulting with teachers and parents to support student success at home and in the classroom. In addition to mental health services, Project Grow provides case management services designed to connect students and their families to educational, medical, social, prevocational, rehabilitative and, as necessary, for out of home placement options. The program works not only with the students, but also with parents and teachers, providing technical assistance to the teachers, and support and education to the parents. Project Grow operates throughout the school year with caseloads of at least 14 adolescents at each site, although the summer program tends to be more recreational and socializing than clinical. Some families elect to continue family therapy throughout the year. A noteworthy characteristic of this program is that many students refer their peers to the program, which indicates a high level of buy-in on the part of the clients. In 2014-15 Project Grow encountered a number of challenges which hampered program implementation to a significant degree and also limited the validity of the evaluation as only fourteen students were served all year (10 at Pollicita and 4 at Parkway), as compared with 32 last year. Demographics - There were 14 students who participated in Project Grow (10 at Pollicita and 4 at Parkway); 58% of Pollicita and 70% of Parkway students were low income. Parkway Middle, Race/Ethnicity: 78% Latino, 22% Other Pollicita, Race/Ethnicity: 47% Asian, 43% Latino, 10% Other/Unknown See Appendix 7, PEI Program Year 2 Evaluation Report, for more outcomes and activities. In FY 14-15, Project Grow served 14 clients. Cost per person: $9,325 Teaching Pro-Social Skills Background - The Human Services Agency (HSA) delivers Teaching Pro-social Skills (TPS) groups in San Mateo County public elementary schools where HSA Family Resource Centers are located. These schools generally receive referrals from teachers for students with classroom behavioral issues. TPS addresses the social skill needs of students who display aggression, immaturity, withdrawal, or other problem behaviors. Students are at risk due to issues such as growing up in a low-income household and community; peer
Page 69 of 101

rejection; low quality child care and preschool experiences; afterschool care with poor supervision; school failure, among others. Demographics – There were 37 participants during the 2014-2015 reporting year. Six to ten-session series are held each semester at the following school locations:
Race/Ethnicity: 68% Latino, 14% Black/African-American, 11% Asian, 3% White/Caucasian, 3% Pacific Islander Age: 14% 6, 35% 7, 19% 8, 32% 9 In FY 14-15, Teaching Pro-social Skills served 38 clients. Cost per person: $3,425 PEI PROGRAMS FOR ADULTS AND OLDER ADULTS Primary Care Interface – Early Intervention Background – Primary Care Interface focuses on identifying persons in need of behavioral health services in the primary care setting, thus connecting people to needed services. BHRS clinicians are embedded in primary care clinics to facilitate referrals, perform assessments, and refer to appropriate behavioral health services if deemed necessary. The model utilizes essential elements of the IMPACT model to identify and treat individuals in primary care who do not have Serious Mental Illness (SMI), and are unlikely to seek services from the formal mental health system. The Interface program is successful in providing behavioral health services to underserved populations such as clients with mild to moderate mental illnessThe Interface team has 12 Spanish/English speaking providers. For 2014-2015, 2,090 patients were opened to Behavioral Health and Recovery Services from referrals initiated by primary care providers in 5 of our county clinics. The Primary Care Interface team continues to work closely with the county’s regional behavioral health clinics to transfer clients that are seriously mentally ill. There were 27 SMI clients that were referred to BHRS regional clinics. Successes – This past fiscal year included the expansion of Medication Assisted Treatment (MAT). 3 substance use counselors and a full time psychiatrist have been added to provide a full array of services to having co-occurring issues.
School Site Number Enrolled
Belle Haven 5 John F. Kennedy 6 Hoover 5 Taft 6 Wilson 5 Lead 10
Total 37
Page 70 of 101
Challenges – The Interface team grew quickly in the past few months of this fiscal year. A significant challenge is limited office space to accommodate the increase of staff. In an effort to address this challenge laptops and cell phones were requested for new staff making it an option to work in a conference room. While it is less than ideal, a good work around nonetheless while alternative options are explored. In FY 14-15, MHSA funded Primary Care Interface clinicians served 2,090 clients. Cost per person: $136 PEI PROGRAMS FOR ALL AGE GROUPS Office of Diversity and Equity (ODE) – Prevention ODE was formally established within BHRS in 2009 primarily as an information and resource hub for data, training, dialogue and collaboration regarding diversity-related and social justice. ODE promotes cultural competence, cultural humility and aims to address health inequities through the following current projects and through the work of the Health Equity Initiatives.
• Parent Project® • Mental Health First Aid • Youth Mental Health First Aid • Digital Storytelling • Photovoice • Stigma Free San Mateo (and the Be the One Campaign) • Suicide Prevention
In 2014-2015, ODE had 943 participants in these six programs. This does not include Stigma Free San Mateo County educational sessions, anti-stigma vignette screenings, outreach and tabling, and Public Stigma Storytelling Showcases, other ODE programs events, and participation in Health equity Initiatives. It is safe to assume that the total number of people reached was well over 1,000, with a potential reach of 3,000. ODE published a booklet in April 2014 titled “Eliminating Disparities, Inequities, and Stigma in Behavioral Health” available at www.smchealth.org/bhrs/ODE. Digital Storytelling - Digital Storytelling is a shortened form of digital media production allowing community members to share their own personal stories by creating a 3-5 minute video. Digital stories may include any combination of video, sound, music, animation, photographs, and other images in order to capture the individual's lived experience. The goal of these films include reduction of stigma and supporting participants’ wellness and recovery through sharing. Four workshops were held that where 19 participants created14 digital stories in 2014-2015. The participants for this year were:
Page 71 of 101

• Members of San Mateo County Behavioral Health & Recovery Services Pacific Islander Initiative.
• Members of San Mateo County Behavioral Health & Recovery Services Lived Experience Academy.
• San Mateo County students and youth in foster care. The majority of participants strongly agree or agree with the following:
• Their satisfaction with their final story. • Their satisfaction with their ability to express themselves through their digital story. • They learned something new about themselves as a result of creating a digital story • The workshop was sensitive to their cultural background. • Their thoughts about Mental Health have changed as result of the workshop. • Their thoughts about Substance Abuse have changed as a result of the workshop. • The workshop changed their way of viewing their story.
Health Ambassador Program (HAP) - ODE launched the Health Ambassador Program in 2013 as a response to feedback from the graduates of the Parent Project (PP) who wanted to continue learning about how to appropriately respond behavioral health issues. Many of these graduates wanted to further what they learned from the PP classes but also wanted to remain connected to the ODE. Community members are encouraged to participate in a series of workshops and trainings hosted by ODE. HAP graduates gained vital tools and knowledge to become an informed community participant (and leader). All Health Ambassadors begin by graduating from the Parent Project - a 12-week course that teaches parents the skills to improve their relationship with their children as well as effective prevention and intervention strategies. After completion of the Parent Project, individuals continue to increase their skills and knowledge in behavioral health and substance use related topics by completing four of the eight public education programs offered by ODE. Individuals interested in broadening their skills on how to help people who have a mental illness or may be experiencing a mental health crisis are encouraged to attend an 8-hour Mental Health First Aid (MHFA) certification training, the 12-week NAMI Family to Family program, the Applied Suicide Intervention Skills Training (ASIST), and/or a Wellness Recovery Action Plan (WRAP) workshop. All programs increase an individual’s mental health literacy and reduces stigma. Community members with lived experience who are interested in sharing their story can participate in an 8-hour BHRS Lived Experience Educational Workgroup, Photo Voice Project and/or Digital Story Telling workshop. All three opportunities provide individuals an opportunity to use their voice and share their unique story related to health, mental health and substance abuse issues. Health Ambassadors are also encouraged to become advocates in Stigma-Free San Mateo and be part of the BHRS Health Equity Initiatives. In this work, individuals engage in outreach, education and dialogue with members of our communities to reach our goal of a stigma free County.
Page 72 of 101
Becoming a Health Ambassador can potentially lead to opportunities to work and volunteer amongst other dedicated individuals; teach both youth and adult courses in their community; assist in identifying unmet needs in their community and help create change; or become a Community worker/Family Partner. During the fiscal year 2014-2015, 21 Health Ambassador Program courses and 395 participants graduated from these courses. The following courses were offered:
• Applied Suicide Intervention Skills Training • Digital Storytelling, Reconozca las Señales (Know the Signs, Spanish) • Lived Experience Academy, Mental Health First Aid (English and Spanish) • NAMI Basics & Family to Family • Stigma Free San Mateo (English and Spanish) • Wellness Recovery Action Plan (WRAP) • Youth Mental Health First Aid.
Mental Health First Aid (MHFA) – Mental Health First Aid is a public education program that helps the public identify, understand, and respond to signs of mental illnesses and substance use disorders. Mental Health First Aid is offered in the form of an interactive 8-hour course that presents an overview of mental illness and substance use disorders in the U.S. and introduces participants to risk factors and warning signs of mental health problems, builds understanding of their impact, and reviews common treatments. Those who take the 8-hour course to become certified as Mental Health First Aiders learn a 5-step action plan encompassing the skills, resources and knowledge to help an individual in crisis connect with appropriate professional, peer, social, and self-help care. The 8-hour Mental Health First Aid USA course has benefited a variety of audiences and professions, including: primary care professionals, employers and business leaders, faith communities, school personnel and educators, state police and corrections officers, nursing home staff, mental health authorities, state policymakers, volunteers, young people, families and the general public. Mental Health First Aid had 213 participants in San Mateo County classes in 2014-2015. Parent Project® – The Parent Project® (PP) is a free, 12-week course that is offered in English and Spanish to anyone who cares for a child or adolescent. The classes meet for three hours each week. Parents learn parenting skills and get information about resources and other support available. Parents/caregivers learn and practice skills such as:
• appropriate ways to discipline • preventing or stopping alcohol, drug and tobacco use • improving communication skills • improving grades and school attendance.
Page 73 of 101

During the fiscal year 2014-2015, two Parent Project® classes were offered in San Mateo and Daly City. A total of 35 people participated in the classes, 26 of which graduated. We collaborated with MidPen Housing, Peninsula Conflict Resolution Center, and Our Second Home to sponsor the PP classes. Classes were facilitated in English and provided culturally informed discussions and guest speakers who provided a variety of resources for the parents. On Friday, January 23, the Office of Diversity and Equity hosted its 3rd Annual Parent Project® Reunion. The Reunion is held each year as a way to bring together all graduates of the Parent Project® to celebrate their achievements, reunite with classmates and facilitators, hear about upcoming opportunities, and enjoy a joyous night together! This year’s celebration featured dinner, raffles, speeches from graduates, and a wonderful band from Half Moon Bay led by graduates from Adult Mental Health First Aid and Parent Project®. The band provided music to listen and dance to throughout the entire evening. The event was attended and supported by BHRS Director Stephen Kaplan, many of our Health Equity Initiatives (including PRIDE Initiative, Native American Initiative, Pacific Islander Initiative, Diversity and Equity Council, Filipino Mental Health Initiative, Spirituality Initiative, Latino Collaborative, and African American Community Initiative), and other BHRS Staff. Over 100 parents and children attended this year making it a very memorable night. One PP parent who spoke, Mylene R., credited graduating from the Parent Project® with opening many doors to help and empower her get back on track to achieving goals for herself and her family. Photovoice - the mission of Photovoice is to build skills within underserved communities by utilizing innovative participatory photography and storytelling methods. These skills enable individuals to represent themselves and create tools for advocacy and communication and positive social change.
• A total of 4 workshops were provided during 2014-2015. • A total of 48 individuals participated in the workshops and all participants successfully
completed their Photovoice project. Cultural Competency and Language Access Services: Cultural Competency
In 2012, ODE began developing a plan that began with integration, standardization, expanding, and integrating Culturally and Linguistically Appropriate Standards (CLAS) into mental health and alcohol/other drug programs. Benchmark criterion were established and the requirement was introduced into the terms of behavioral health agency contracts starting in FY 2013-2014. Contractors were required to submit their cultural competency plans by September 30th, and feedback is provided within 90 days. The benchmark criteria
Page 74 of 101
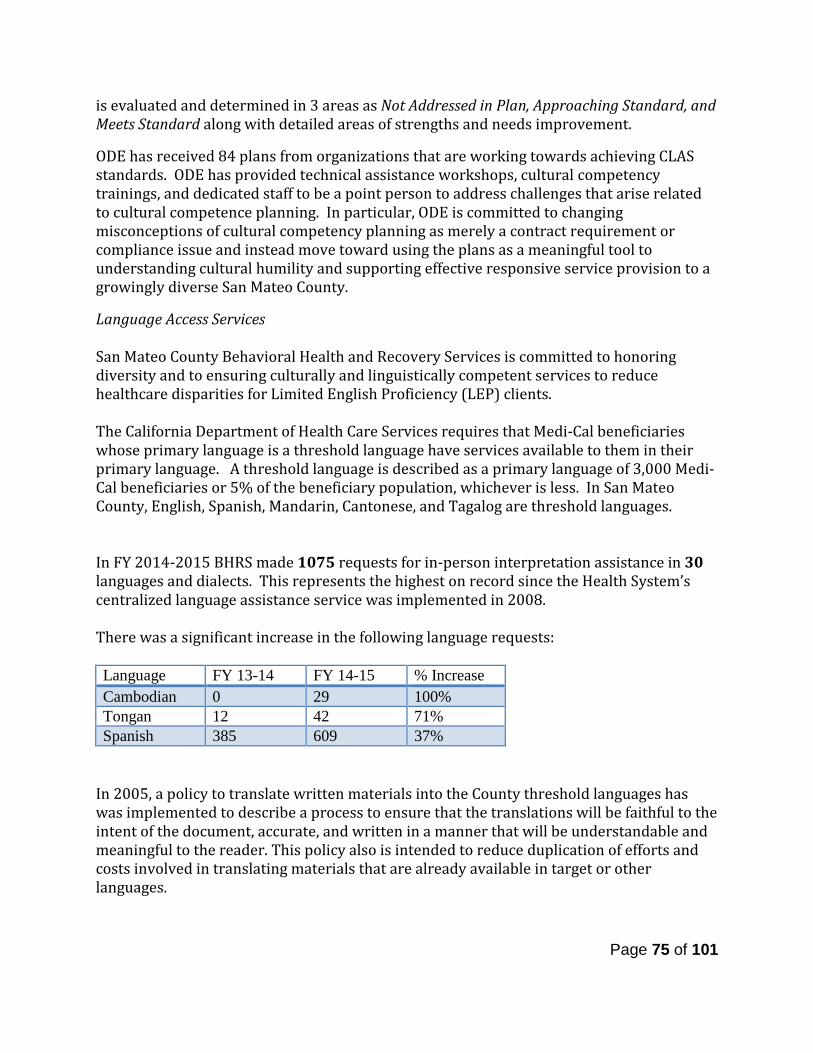
is evaluated and determined in 3 areas as Not Addressed in Plan, Approaching Standard, and Meets Standard along with detailed areas of strengths and needs improvement.
ODE has received 84 plans from organizations that are working towards achieving CLAS standards. ODE has provided technical assistance workshops, cultural competency trainings, and dedicated staff to be a point person to address challenges that arise related to cultural competence planning. In particular, ODE is committed to changing misconceptions of cultural competency planning as merely a contract requirement or compliance issue and instead move toward using the plans as a meaningful tool to understanding cultural humility and supporting effective responsive service provision to a growingly diverse San Mateo County.
Language Access Services San Mateo County Behavioral Health and Recovery Services is committed to honoring diversity and to ensuring culturally and linguistically competent services to reduce healthcare disparities for Limited English Proficiency (LEP) clients. The California Department of Health Care Services requires that Medi-Cal beneficiaries whose primary language is a threshold language have services available to them in their primary language. A threshold language is described as a primary language of 3,000 Medi-Cal beneficiaries or 5% of the beneficiary population, whichever is less. In San Mateo County, English, Spanish, Mandarin, Cantonese, and Tagalog are threshold languages. In FY 2014-2015 BHRS made 1075 requests for in-person interpretation assistance in 30 languages and dialects. This represents the highest on record since the Health System’s centralized language assistance service was implemented in 2008. There was a significant increase in the following language requests: Language FY 13-14 FY 14-15 % Increase Cambodian 0 29 100% Tongan 12 42 71% Spanish 385 609 37%
In 2005, a policy to translate written materials into the County threshold languages has was implemented to describe a process to ensure that the translations will be faithful to the intent of the document, accurate, and written in a manner that will be understandable and meaningful to the reader. This policy also is intended to reduce duplication of efforts and costs involved in translating materials that are already available in target or other languages.
Page 75 of 101
Cultural Humility (Culturally Focused/Relevant) Provider Trainings – The following two trainings are provided at least once annually. The concept and approach of Cultural Humility (CH) remains to be the heart of the Office of Diversity and Equity. During fiscal year 2014-2015, ODE committed to find new efforts to build BHRS and partner agency staff’s knowledge and understanding of this approach. Dr. Melanie Tervalon presented a system-wide 3-hour training on Cultural Humility: Working in Partnership with Family and Communities in September 2014 for BHRS and contract staff to improve the cultural responsiveness of our system of care in relation to service provision. 74 participants attended the training. This system-wide training was then followed by an in-depth 6-week Training of Trainers (TOT) from November 2014-January 2015 to help build an internal infrastructure to support CH. The TOT included 9 BHRS and contract agency staff who were mentored and taught to provide the training throughout our system of care for other staff. After receiving the training, these trainers provided 7 trainings throughout the system during that year. In October 2014 and May, 2015 ODE held a training for providers called Working Effectively with Interpreters in a Behavioral Health Setting. This training aims to enhance the cultural competency and humility of BHRS staff as well as to help providers learn to effectively communicate with clients when they do not speak the client’s language. This mandatory training for direct service staff was offered twice during the 2014-2015 reporting year. There were 43 attendees in October and 27 attendees in May. Health Equity Initiatives: Diversity and Equity Council (DEC) The DEC, San Mateo County’s cultural competence committee, started over ten years ago. Since then, the DEC has grown extensively. The DEC is the guiding body that works to embrace diversity, eliminate health disparities and advance equity in San Mateo County. The DEC coordinates, informs, supports, advocates and consults within BHRS and its communities. The DEC is also committed to supporting the eight HEIs: Native American Initiative, Chinese Health Initiative, Latino Collaborative, Spirituality Initiative, Filipino Mental Health Initiative, African American Community Health Initiative, PRIDE Initiative, and the Pacific Island Initiative. The DEC and the HEIs provide opportunities to discuss cultural competence among County employees, partners, and the public through networking, community outreach, training (sponsoring and hosting), facilitation, film viewings and just getting together. In FY 14-15, the DEC met monthly offering opportunities for collaboration and a place for dialogue and taking action on the following topics:
• Law enforcement and communities of color – community policing, culturally informed trainings for officers, connection to Community Service Areas
Page 76 of 101

• National Alliance for Mental Illness (NAMI) cultural adaptation project • Culturally sensitive and inclusive language on outreach materials – letter to the City
of Millbrae, Human Services Agency and community partners involved • Co-occurring training needs of AOD providers • Center for Independence of Individuals with Disabilities services and training
needed for working with clients with disabilities • Statewide stigma reduction efforts • Cal-learn program for teen parents or pregnant teens • California Reducing Disparities Report • Partner agency cultural competence plans and implementation support • Tony Hoffman Awards nominations • Caminar’s Transition to College program at College of San Mateo • Parent Project and Health Ambassador Program progress and outcomes • Immigration reform including Deferred Action for Childhood Arrivals (DACA)
expansion and Deferred Action for Parental Accountability (DAPA) introduction. • Mental Health Awareness month planning • Ongoing contribution to Wellness Matters and the BHRS blog • Cultural Stipend Intern program • HEI Co-chair roles and successful transitioning
FY 14-15 goals and actions taken to address each included the following:
• Increase input in program policy development o Collaborated with HEIs to create and screen digital stories as a way to
showcase diverse experiences with mental health and substance abuse related challenges and recovery
o Adapted activities/workshops to address needs of specific communities o Provided input in the MHSA community planning process o Provided feedback for the Workforce Education and Training plan
• Communicate unmet needs and barriers to access services o Diversity dialogue at each DEC meeting to provide opportunity for providers
to receive feedback and share their progress African American Community Health Initiative (AACI) The African American Community Initiative (AACI) is committed to helping African Americans become more empowered to advocate for equality and access to mental health services. AACI supports African-American community members in their road to recovery and mental wellness within our community. The AACI members include community members, providers and clients, who work together to support the African American community in San Mateo County. AACI celebrates the heritage and pride of the African American community by hosting an annual Black History Month Summit. The African American Community Initiative had a very active fiscal year 14-15 with several hosted outreach events. On September 24th, 2014 , AACI partnered with the AACHAC and
Page 77 of 101
held a day-long Men’s Health Symposium with over 100 attendees. The event was held at the Mills-Peninsula Health Center in San Mateo and open to anyone interested. Programs for this event included:
• Keynote address: Michael Julian Bond, Atlanta City Councilman • “A Discussion About Men’s Health Concerns” led by Thomas W. Hopkins, MD,
Internal Medicine Practitioner. • “Focus on Your Health: Smart Guide to the Health Care You Deserve” led by Brenda
B. Spriggs, MD and Glenda Newell, MD authors of Focus on Your Best Health: • A Special Young Men’s Focus Group Discussion • Health Education Sessions featuring various field experts • Free lab screenings for prostate, rectal, blood pressure, cholesterol, glucose,
HIV/AIDS, Hepatitis C, and eye health. • A concert by Keith Williams, Pianist/Vocalist/Composer/Arranger
On February 21st, 2015 The AACI held its 7th annual Black History Month Summit. This year’s summit was called Mental Wellness: the Key to Complete Health. Through partnership with the African-American Community Health Advisory Committee (AACHAC), the summit was able to reach over 100 community members. Several education workshops were held at the event, which included suicide prevention, engaging youth around mental health issues, and how to gain access to services. Chinese Health Initiative (CHI) The Chinese Health Initiative (CHI) was created out of the BHRS Office Of Diversity and Equity to promote cultural competence and address health inequities among the Chinese population in San Mateo County. CHI is comprised of county employees, community partners, consumers/clients and family members who are interested in improving the health and well-being of the Chinese community in San Mateo County. CHI’s goal is to:
• Raise awareness of health issues and availability of services available throughout the County through community outreach, engagement and education
• Educate the Health System and our partners around cultural issues and potential barriers around working with the Chinese community.
• Advocate for services that are culturally and linguistically accessible and welcoming to the Chinese community.
• Work collaboratively with partners to facilitate access to services for the Chinese community.
Three digital stories completed this year by Chinese young adults were shown, as an introduction of some of the behavioral health problems encountered by Chinese living in the county. These stories, made possible by a collaboration of CHI and the College of San Mateo, described the young people’s experience with immigration, their conflicts in day to day living, their struggles with their families, their lack of resource for help and their yearnings for a better future.
Page 78 of 101

A panel of experienced providers and individuals with lived experience presented their programs and/or their lived experience and gave suggestions for the best way to incorporate cultural factors in the design of an outreach program for the Chinese community. Presenters include: Anni Chung, President and CEO of Self Help for the Elderly; Christina Shea, Deputy Chief/Director of Clinical Services, Richmond Area MultiServices, Inc; Paul Chang, Executive Director, Pyramid Alternatives; and two individuals with lived experience. Finally, Sunny Choi, the newly hired outreach worker for the county gave a brief overview of the program and asked participants to sign on as partner agencies to collaborate in outreach efforts for the Chinese community. Pacific Islander Initiative (PII) The Pacific Islander Initiative (PII) was created to address health disparities within the community and to connect families to resources and services they may not know about, but are eligible for. Their mission is to raise awareness in the Pacific Islander community in order to dispel stigma associated with mental illness and substance abuse. Together with service providers throughout the county, we strive to address all barriers experienced by the community when accessing services. The Pacific Islander Initiative’s vision is a healthier community that feels supported by service providers; is more accepting of mental illness and substance abuse; and is knowledgeable of the various resources and services that are available. The PII held monthly meetings throughout the year. The outreach events that occurred in FY 14-15 were:
• Digital Storytelling workshop was held on March 23rd – March 25th where seven participants in created a digital story.
• A public screening was held on May 11th where over 56 were in attendance to view the digital stories.
Filipino Mental Health Initiative (FMHI) The mission of the Filipino Mental Health Initiative (FMHI) is to improve the well-being of Filipinos in San Mateo County by reducing the stigma of mental health, increasing access to services, and further empowering the community through outreach and engagement. FMHI strives to connect individuals to appropriate health, mental health and social services, and ensure culturally appropriate services through provider collaboration. FMHI grew out of a series of focus groups conducted in 2005 facilitated by Behavioral Health & Recovery Services of San Mateo County. Community members, providers, and interested individuals came together to discuss a broad array of issues pertaining to health and mental health, particularly the stigma associated with mental illness and the barriers that prevent Filipinos from obtaining appropriate services and treatment. Since its inception, FMHI have been active in providing community outreach, parent event nights, provider training, the development and dissemination of 5,000 community
Page 79 of 101
directories, and the inclusion of over 35 agency representatives to be part of an oversight committee. The Filipino Mental Health Initiative has grown to include a diverse range of members and collaborative partners including staff from Behavioral Health & Recovery Services of San Mateo County, Asian American Recovery Services, Pilipino Bayanihan Resource Center, Community Overcoming Relationship Abuse, San Mateo County Health System, community members and other stakeholders. FY 14-15 Activities Included:
• Behind the Smiles: Coping with Life’s Challenges – a community information event • Film Screening and Discussion of “Shadows of the Past” (a film about a Filipina
mother who suffered from psychosis) • Participating at the 24th annual UPSS: Uniting Pilipino Students for Success
Latino Collaborative (LC) The Latino Collaborative promotes holistic practices designed to build safe, strong, resilient families in San Mateo County. It works to increase access to stigma-free services and treatment involving mind, spirit and body to all San Mateo County residents, regardless of insurance eligibility. The Latino Collaborative believes that services that integrate Latino heritage, culture, spirituality and family values will nurture and strengthen the health of Latino individuals and families. San Mateo County’s 2rd annual Latino Health Forum “Sana Sana, Colita de Rana!,” hosted by the Latino Collaborative was held in September at the Fair Oaks Community Center. Over 200 people participated in this fun-filled event, which educated adults and children about the importance of taking care of their physical, emotional and social health and wellbeing, with breakout sessions such as cooking demonstrations, Zumba classes, and children’s activities. Native American Initiative (NAI) The Native American Initiative was created to bring about a comprehensive revival of the Native American community in San Mateo County through awareness, health education, and outreach, which honors culturally appropriate traditional Native healing practices. The vision is to provide support and build a safe environment for the Native American community in San Mateo. Additionally our goal is to appreciate and respect Native American history, culture, and spiritual and healing practices. The NAI strives to reduce stigma, provide assistance in accessing health care and establish ongoing training opportunities for behavioral health staff and community partners. PRIDE Initiative (Pride) The PRIDE Initiative was formed to be an inclusive environment based in equality and parity for lesbian, gay, bisexual, transgender, queer, questioning, intersex, and two-spirit (LGBTQQI2S) communities of San Mateo County. The initiative is committed to foster a
Page 80 of 101

welcoming environment for the LGBTQQI2S communities living and working in San Mateo County through an interdisciplinary and inclusive approach. Pride is made up of individuals who are concerned about the well-being of the LGBTQQI2S communities in San Mateo County. PRIDE Initiative is led by Behavioral Health & Recovery Services staff and funded through the Mental Health Services Act. The PRIDE Initiative collaborates with the newly formed San Mateo County LGBTQ Commission The San Mateo County 3rd Annual PRIDE celebration was held on Saturday, June 13th, at San Mateo Central Park. The event is a collaborative grassroots event hosted by the SMC PRIDE Initiative, led by BHRS Office of Diversity and Equity, and has received co-sponsorship by the San Mateo County LGBTQ Commission. Spirituality Initiative (SI) The Spirituality Initiative works to build opportunities for clients/consumers, family members, providers and community members to collaboratively explore, increase awareness of, and support spirituality and its relationship to health and well-being, especially for those with or at risk of co-occurring alcohol/drug addiction and mental health challenges. The Spirituality Initiative hosted multiple training opportunities on how to integrate client-centered spiritual practices in clinical treatment. “Be the One” (Stigma Free San Mateo County) As of May 2015, Stigma Free San Mateo County (SFSMC), was renamed to Be the One Campaign. Be the One is a program to raise awareness and provide mental health education to reduce the stigma around mental illness and substance use disorders. Throughout the fiscal year, SFSMC have implemented an anti-stigma communication campaign that involved education, trainings, presentations, Photovoice exhibits and other community events. The Be the One campaign’s launch included a revamped website, pledge post cards, pledge flyers and photo booth for photo pledges. Our stigma discrimination reduction efforts aim to improve system of care by building partnerships with public and non-profit providers and reducing barriers for the community, including language access and childcare. Be the One hosted community outreach events that shared resources (public and non-profit providers) of where people can learn more about behavioral health and where people can get appropriate health they need. Providers we refer to include San Mateo Medical Center, StarVista, Caminar, Heart and Soul, Inc. and many more. All public outreach events were offered the option of interpreter services if requested. FY14-15 activities included:
Page 81 of 101
• 4/28/15 Board of Supervisors Proclamation • 5/4/15 Mental Health Awareness Month Kickoff Event; over 100 people attended • 5/6/15 Tony Hoffman Awards Presentation; over 30 people attended • 5/7/15 Family Awareness Night: Wellness through Connection & Expression • 5/12/15 and 5/2/151 Lived Experience Panels; over 30 people attended • 5/30/15 BHRS Participation in NAMI Walk
Suicide Prevention In the fall of 2014, the San Mateo County Prevention Committee completed a strategic planning session to identify existing interventions and which additional interventions are still needed to prevent suicide in San Mateo County. This committee is comprised of behavioral health staff, community partners (e.g. Caltrain, County Office of Education, etc.), and concerned community members. The results of this strategic planning session were used to create this Suicide Prevention Report. The report outlines four suicide prevention strategies, the desired outcome of each strategy, descriptions of the organizations and programs that are addressing each strategy, and potential future activities to better implement each strategy. The overall goal is to provide a roadmap of what suicide prevention efforts and services are available and what still needs to be developed to reduce suicide in San Mateo County. There are three overarching strategies for suicide prevention in San Mateo County. Strategy 1: Create a System of Suicide Prevention
• Enhance links between systems and programs and identify gaps in services. • Deliver integrated services and establish formal partnerships that foster
communication and coordination. • Integrate suicide prevention programs into K-12 and higher education institutions. • Develop programs that reduce gaps for underserved populations. • Ensure that San Mateo County has at least one accredited suicide prevention hotline.
Strategy 2: Implement Training and Workforce Enhancements to Prevent Suicide
• Increase the priority of suicide prevention training through outreach. • Establish annual targets for suicide prevention training that identify individuals and
occupations that will receive the training as well as training models used. Strategy 3: Educate Communities to Take Action
• Build grassroots outreach and engagement efforts to meet local needs for suicide prevention.
• Engage and educate local media about their role in promoting suicide prevention. • Educate communities to identify, respond to, and refer people demonstrating acute
potential suicide warning signs. • Promote and provide suicide prevention education.
Page 82 of 101

• Develop and disseminate directory on local suicide prevention/ intervention services.
• Incorporate and build capacity for peer support and peer operated service models. Strategy 4: Improve Suicide Prevention Program Effectiveness and System Accountability
• Increase local capacity for data collection, reporting, surveillance and dissemination regarding suicide.
• Build local capacity to evaluate suicide prevention programs. • Establish and enhance capacity of forensic and clinical reviews of suicide deaths. • Work with Coroner’s Office to enhance reporting systems to improve consistency
and accuracy of suicide deaths. Community Outreach, Engagement and Capacity Building Crisis Hotline – StarVista provides a free, confidential 24-hour, seven days a week crisis intervention hotline. Trained volunteers and staff provide referrals for community resources and services for anyone who feels sad, hopeless, or suicidal; family and friends who are concerned about a loved one; anyone interested in mental health treatment and service referrals; and/or anyone who just needs some support through a personal crisis. The mental health clinician provided services to 12 new cases (case management/phone consultation); 3 new youth served in youth outreach interventions (evaluations at school sites), 30 follow-up sessions with youth, 13 follow up contacts with collateral contacts; and 131 youth and adults served through community outreach. The total number of clients served by the Crisis Hotline for FY 14-15 was 698. Cost per person: $152 Voices of Recovery - in collaboration with Total Wellness, Voices of Recovery continued to provide through FY 14-15 training, wellness services at BHRS sites, and health and wellness groups and activities. Trainings include health and wellness formal training and/or WRAP facilitator training, tobacco education, healthy eating, and physical exercise. Trained Wellness Coaches provide wellness calls, reminder calls, individual coaching or group WRAP support, Health and Wellness group activities, fairs and education forums, walking groups, cooking classes, and other social or education groups and activities. San Mateo Medical Center (SMMC) Memorandum of Understanding (MOU) - provides for the behavioral health treatment needs of clients who seek services or are brought in for services to the Psychiatric Emergency Services (PES) and Acute Psychiatric Inpatient Units. SMMC PES provides back-up Call Center functions for the BHRS Call Center outside of regular business hours; twenty-four hour, seven day a week emergency psychiatric care through its PES and through the acute psychiatric care units 3A and B; is the designated Point of Notification for the BHRS Mental Health Plan for all admissions to psychiatric inpatient hospital services whether to SMMC 3A/B or to private hospitals; provides
Page 83 of 101

psychiatric back-up coverage through PES for the San Mateo County Correctional Health Services outside of regular business hours and for Canyon Oaks Youth Facility; and provides psychiatric medical staff services to clients at Cordilleras Mental Health Center. San Mateo County Mental Health Assessment and Referral Team (SMART) MOU – was developed by the San Mateo County Health System and the American Medical Response West in which specially trained paramedic responds to law enforcement Code 2EMS requests for individuals having a behavioral health emergency. The SMART paramedic performs a mental health assessment, places a 5150 hold if needed and transports the client to Psychiatric Emergency Services or, in consultation with County staff, arranges for appropriate services. Access to SMART is only available through the County’s 911 system. Senior Peer Counseling Services Program - Peninsula Family Service trains volunteers to provide free peer counseling to older adults in their homes. Services are available in English, Spanish, Mandarin and Tagalog as well as for the LGBT community. In FY 14-15, PEI funded 50% of Senior Peer Counseling (the remaining 50% is CSS funded). The program served 548 total clients. Cost per person: $532 Ravenswood Family Health Center - Ravenswood is a community-based Federally Qualified Health Center (FQHC) that serves East Palo Alto and provides outreach and engagement services to identify individuals presenting for healthcare services that have significant needs for behavioral health services. In FY 14-15, PEI funded 60% of Ravenswood Family Health Center (the remaining 40% is funded through Community Services and Supports). The program served 638 total clients. Cost per person: $109 PEI PROGRAM FOCUSED ON EARLY ONSET OF PSYCHOTIC DISORDERS Prevention and Recovery in Early Psychosis (PREP) – Early Intervention The PREP program braids together five evidence-based practices into one integrated treatment approach, and uses community education and outreach to facilitate early identification of individuals at risk of psychosis. Felton Institute’s (formerly Family Service Agency) PREP program identifies and intervenes with transition age youth (14-25 years) experiencing a recent onset episode of psychosis and their families. The PREP Program provides evidence-based treatment and support for youth and families through an intensive outpatient model of care that includes the provision of: algorithm-based medication management, cognitive behavioral therapy for psychosis (CBTp), individual placement and support (IPS), assertive outreach, multi-family groups, cognitive remediation, and strength-based care management services. PREP is administered by Felton Institute.
Page 84 of 101

Felton Institute’s contract called for engaging 80-100 eligible residents and after a year of operations to serve 48 clients a year. During FY 14-15, PREP engaged 113 potential clients and enrolled 60 clients in services, maintaining a consistent caseload of between 31-36. Demographics Race/Ethnicity: 38% White/Caucasian, 34% Latino, 21% Asian, 4% African-American 2% Pacific Islander, 2% Native American See Appendix 7, PEI Program Year 2 Evaluation Report, for more outcomes and activities. EP During FY 14-15, 60 clients enrolled and received PREP services. Cost per person: $13,733 STATEWIDE PEI SUSTAINABILITY The California Mental Health Services Authority (CalMHSA) – In 2009 CalMHSA was formed and worked on developing strategic plans and executing a contract with the State Department of Health Care Services for $160 million ($40 million per year for 4 years) through FY 13/14. Statewide PEI funds to implement three PEI Statewide Programs:
• Suicide Prevention (SP) $10 million per year (25%) • Stigma and Discrimination Reduction (SDR) $15 million per year (37.5%) • Student Mental Health Initiative (SMHI) $15 million per year (37.5%)
In February 2014, CalMHSA Board meeting, members adopted a funding framework for sustaining CalMHSA PEI Statewide Projects. This framework includes using diverse funding to sustain the PEI statewide projects as well as local County PEI funds. Through the local MHSA Three-Year planning process it was recommended that San Mateo County fund CalMHSA 2% of PEI funds given that San Mateo County MHSA dollars are being used to fund local efforts in all these three areas and it’s important to continue collaborating with state-level efforts. This continued through FY 14/15.
Page 85 of 101
Innovations (INN) (covering highlights and data from FY 2014-2015 services)
Total Wellness In FY 14-15 Total Wellness completed its final year as an MHSA Innovation project. Services included timely access/linkage to primary care and specialty medical care, comprehensive nurse care coordination for every enrolled client to facilitate and coordinate all necessary physical behavioral health services, and the wide array of psycho-health education and stage-based wellness services. Total Wellness staffing and partnership with San Mateo Medical Center’s Mental Health Primary Care (MHPC) Team include a multi-disciplinary team of primary care providers, behavioral health nurses, nurse practitioner, health educators, and peer coaches. Total Wellness was located at two BHRS outpatient clinics, Central County Adult Clinic in San Mateo and South County Adult Clinic at Redwood City. Cumulative census reached 601 clients by September 2015. The primary role of the nurse care coordinator/manager is to facilitate linkage and timely access of the SPMI clients to much-needed primary care and specialty care services. The nurse care coordinators/managers work closely with the BHRS case managers/psychiatrists and the clients to assure timely access to these services. There have been strong relationships built with various county Primary Care Providers and specialty clinics that make referrals and linkages possible. In addition, the Total Wellness program also works closely with eligibility staff to assist in obtaining appropriate health insurance for clients. Peer wellness coaches are able to provide transportation to clients who have difficulty accessing the needed care due to limited mobility issues. The ability to access both the BHRS and SMMC electronic health record systems (EHRs), Avatar and eClinical Work respectively, by nurse care managers has tremendously enhanced the communication and care planning for clients with the rest of the County’s primary care providers who are practicing throughout the County. Ideally, one combined EHR for both physical and behavioral health systems will be a more effective way of coordinating client care! During the FY 14-15 period, a number of significant program activities were achieved:
• Total Wellness clients achieved high health outcomes: clients have made significant improvements in areas of fasting blood sugar (which is an indicator for diabetes) and cholesterol levels (which are indicators for hyperlipidemia). The improvements in these two areas are noted to be in the top 5% improvement range across all SAMHSA’s Grantees nationwide. San Mateo’s Total Wellness was mentioned in Spring 2015 by SAMHSA as one of the ten high-performing Grantees.
• Full funding support from the Health Plan of San Mateo (HPSM) for sustainability efforts: Total Wellness and BHRS Management met with the Health Plan of San Mateo (HPSM) and presented on the various outcome achievements from enrolled clients. Data indicated that clients not only made improvements in managing their chronic metabolic syndromes in the areas of diabetes, hypertension, and
Page 86 of 101
hyperlipidemia, but also showed decreases in ER & PES (psychiatric emergency services) admissions after their enrollment in Total Wellness. Furthermore, data revealed that their utilization of planned medical specialty services significantly increased after their enrollment in Total Wellness indicating difficulty to access such needed services without the comprehensive care management and coordination offered by the program. Early access to needed care, in turn, prevented potential worsening of their chronic conditions and improved their health outcomes. Hence, clients’ health is getting better, with lower healthcare cost over time.
• Total Wellness obtained from SAMHSA another full year (i.e. October 2014 through September 2015) of grant funds as No-Cost Extension. Beyond the original four years of SAMHSA PBHCI grant, Total Wellness applied and was approved for another full year of SAMHSA grant on No-Cost Extension. This full year of grant funds allowed Total Wellness to continue to build on program outcome achievements, conduct more outcome comparisons, prepare and compile needed data, and engage in various activities related to program sustainability.
• Needed infrastructure in process of building to continue with data-informed care delivery. In anticipation of discontinuation of SAMHSA database and technical support available to all grantees when the SAMHSA grant ends, Total Wellness has strategically allocated some existing staffing resources in this past year, building an internal excel database that will capture all the functional data (in addition to the health outcome data that has been collected). In addition, Total Wellness refined their internal processes so as to foster timely and accurate data collection, data entry, data analyses, and data review and evaluation, to continue striving to provide data-informed care to all our clients. The planning and building of this infrastructure before the ending of both MHSA and SAMHSA grant funds is extremely crucial for sustainability.
• Total Wellness expanded to other BHRS County Clinics. In line with the vision of BHRS management to provide Total Wellness to the entire San Mateo County across BHRS, services are at two additional BHRS outpatient clinics, Coastside Adult and East Palo Alto Adult Clinics since May and September 2015, respectively. There are plans to gradually ramp up services at these two sites due to increasing demands. In addition, there are also plans to expand Total Wellness to North County Adult Clinic next year when/if staffing capacity can be increased.
• Total Wellness Consumer and Family Advisory Committee as “Wellness Ambassador.” The Consumer and Family Advisory Committee continued to meet regularly on a monthly basis for the past year. The Committee has since expanded and is now composed of six consumers, one family partner, and the Chair and Co-Chair of the Committee. In addition, the Committee’s consumer members have actively taken on the role of “Wellness Ambassador” by writing their own wellness, recovery experience in the BHRS newsletter, “Wellness Matters.” Many consumers found these to be inspirational.
Page 87 of 101
Impacts • Data continued to show significant health outcome improvements of enrollees in
areas of blood glucose (diabetes) management, cholesterol management, and weight management. Enrollees could get early access to needed specialty medical care for both preventive and treatment purposes. Data also showed a decrease in utilization of emergency department and psychiatric emergency services.
• Total Wellness successfully acquired continuous funding from the Health Plan of San Mateo (HPSM) so that all services will not only be provided at the same current levels.
• Both the role of care management and care coordination provided by master-level nursing staff, and the peer support/peer coaching provided by peer coaches, have fully enriched the integrated care model for SPMI clients. These two components of the Total Wellness care model have been proven to be greatly effective, and have been asked by other SAMHSA Grantees to share learnings of how to define these roles, what these roles are, and how to develop staff in these roles not only initially but on an on-going basis.
The following satisfaction survey data are for the period of mid-February through early September 2015 using the National Outcome Measures (NOMs) questionnaire and where there were complete sets of data. These NOMs were not entered into SAMHSA TRAC database, but instead have been collected and internally tracked by Total Wellness. All NOMs conducted prior to February 2015 were entered into TRAC and results are no longer available.A total of 203 Perception of Care surveys were conducted during the period of seven months of FY2014-15 (i.e. February through early September, 2015). A brief analysis of the survey results suggested that the majority of clients surveyed have a very positive experience of care with Total Wellness program and felt supported and respected throughout their service duration. Furthermore, 90% of clients stated that they would recommend Total Wellness to a friend or family member who would need the services. Detailed breakdowns on some of the crucial survey items are in below:
• Staff helped me obtain the info I needed so that I can take charge of my illness. [85% agree/strongly agree; 12% disagree/strongly disagree/undecided]
• I, not staff, decided my treatment goals. [83% agree/strongly agree; 14% disagree/strongly disagree/undecided]
• If I had other choices, I would still get services from this agency. [89% agree/strongly agree; 8% disagree/undecided]
• Staff here believe that I can grow, change and recover. [91% agree/strongly agree; 6% disagree/strongly disagree/undecided]
• I like the services I received here. [92% agree/strongly agree; 6% disagree/undecided]
• I would recommend this agency to a friend or family member. [90% agree/strongly agree; 6% disagree/strongly disagree/undecided]
Page 88 of 101
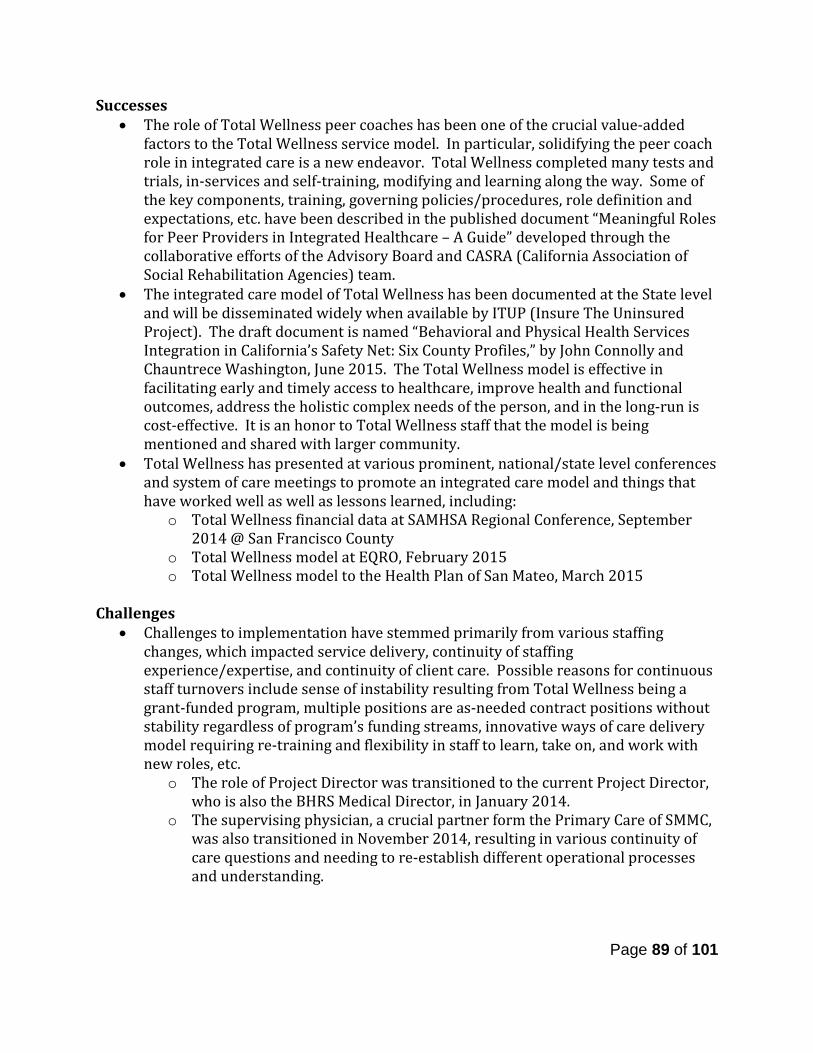
Successes • The role of Total Wellness peer coaches has been one of the crucial value-added
factors to the Total Wellness service model. In particular, solidifying the peer coach role in integrated care is a new endeavor. Total Wellness completed many tests and trials, in-services and self-training, modifying and learning along the way. Some of the key components, training, governing policies/procedures, role definition and expectations, etc. have been described in the published document “Meaningful Roles for Peer Providers in Integrated Healthcare – A Guide” developed through the collaborative efforts of the Advisory Board and CASRA (California Association of Social Rehabilitation Agencies) team.
• The integrated care model of Total Wellness has been documented at the State level and will be disseminated widely when available by ITUP (Insure The Uninsured Project). The draft document is named “Behavioral and Physical Health Services Integration in California’s Safety Net: Six County Profiles,” by John Connolly and Chauntrece Washington, June 2015. The Total Wellness model is effective in facilitating early and timely access to healthcare, improve health and functional outcomes, address the holistic complex needs of the person, and in the long-run is cost-effective. It is an honor to Total Wellness staff that the model is being mentioned and shared with larger community.
• Total Wellness has presented at various prominent, national/state level conferences and system of care meetings to promote an integrated care model and things that have worked well as well as lessons learned, including:
o Total Wellness financial data at SAMHSA Regional Conference, September 2014 @ San Francisco County
o Total Wellness model at EQRO, February 2015 o Total Wellness model to the Health Plan of San Mateo, March 2015
Challenges
• Challenges to implementation have stemmed primarily from various staffing changes, which impacted service delivery, continuity of staffing experience/expertise, and continuity of client care. Possible reasons for continuous staff turnovers include sense of instability resulting from Total Wellness being a grant-funded program, multiple positions are as-needed contract positions without stability regardless of program’s funding streams, innovative ways of care delivery model requiring re-training and flexibility in staff to learn, take on, and work with new roles, etc.
o The role of Project Director was transitioned to the current Project Director, who is also the BHRS Medical Director, in January 2014.
o The supervising physician, a crucial partner form the Primary Care of SMMC, was also transitioned in November 2014, resulting in various continuity of care questions and needing to re-establish different operational processes and understanding.
Page 89 of 101
o Various staffing changes took place over the reporting period including three full time nursing staff, one full time health educator, and multiple contract peer coach positions.
Demographics The following are demographics collected from a sample of 250 Total Wellness clients. 10 were homeless and 10 at-risk for homelessness Race/Ethnicity: 40% White/Caucasian, 18% Latino, 18% Unknown, 13% Mixed/Multi-racial, 7% Black/African-American, 4% Asian, 1% Pacific Islander, 0.4% Native American Age: 2% 16-25, 94% 26-64, 3% 64+ Gender: 52% Male, 48% Female, 1% Transgender Language: 82% English, 18% Spanish By the end of FY 14-15, Total Wellness served 250 clients.
Workforce Education and Training (WET) The following are highlights for FY 14/15 for Workforce Education and Training.
Workforce Staffing and Support During 2014-2015, the BHRS WET program was staffed by 1 FTE WET Coordinator and 1 FTE WET project support specialist. The Workforce Development and Education Committee (WDEC) and the Lived Experience Education Workgroup (LEEW) continued to serve as advisory committees/workgroups for the WET program during this fiscal year. The WDEC met 8 times and focused on the following priorities: developing and planning the WET survey and stakeholder process, deciding what BHRS trainings to prioritize and schedule, revising the training evaluation form, and addressing workforce issues. The LEEW also met 8 times and focused on the following priorities: developing a plan for the Lived Experience Academy trainings including an input session with former graduates, a refresher course, a new academy, and planning for an advocacy-focused academy. Training and Technical Assistance Targeted Training for and by Clients/Consumers and Family Members Lived Experience Academy (LEA) is a training program designed for individuals living with mental health and/or substance use challenges and/or their family members. Participants learn how to share their stories to empower themselves, reduce stigma, and educate others
Page 90 of 101
about behavioral health conditions. The program upholds the core value that lived experience is its own form of expertise, and that integrating people with lived experience into the workforce is a vital type of workforce diversity. It includes an annual training and Speakers’ Bureau. LEA training facts for FY 2014-2015:
● Offered once per year ● Five 2-hour training sessions ● 15 out of 17 participants graduated ● Five previous LEA graduates co-facilitated the LEA training
Graduates of the LEA are eligible to go on to be a part of the Speakers’ Bureau and receive a stipend to present their stories with behavioral health staff and community members at trainings and community events. This includes the opportunity to participate in Digital Storytelling workshops, and create a video which narrates an individual's’ personal history. Participants are paid for participating in the training and when they speak for a speakers’ bureau event.
The LEA Digital Storytelling Workshop was a 3-day workshop that occurred in April 2015. Five graduates of the LEA participated and successfully created digital narratives with accompanying photos and images. These digital narratives told stories of stigma as related to mental health, substance use, and how it affects or is affected by other identities and experiences, such as race, culture, gender, sexuality, experiences with incarceration, homelessness, institutionalization, and many others. Participants learned about storytelling, developed their stories, wrote and recorded their own personal stories, found and chose images, and used our software to technically create the digital story. The goal of the workshop was to educate others, reduce isolation, humanize people with mental health challenges, and heal themselves through the process. These digital stories were showcased at a widely attended community event organized for May Mental Health Month where over 100 people attended. The creators were paid to speak on a panel for this event. The Lived Experience Event Support Training was created during fiscal year 2014-2015. It is a 2-hour training designed to teach LEA graduates how to provide technical and logistical support for BHRS training, events, and the anti-stigma campaign “Be the One” photo booth. This training will be provided to interested LEA graduates starting in fiscal year 15-16. The Understanding the Voice-Hearing Experience training was presented by Inspired at Work and was designed to help participants understand and empathize with the experience of those who experience auditory hallucinations to reduce stigma and promote compassionate care toward those living with psychotic symptoms. Five LEA graduates
Page 91 of 101
participated in the delivery of the training by helping coordinate the different stations of the training and were paid for their time. Training to Support Wellness and Recovery Wellness Recovery Action Plan (WRAP) has served as an excellent approach to promote wellness and recovery for clients/consumers and staff in the behavioral health system. In 2014-2015, Inspired at Work coordinated San Mateo County’s WRAP efforts. This included a 2-day “Create Your Own WRAP” training in November 2014 that 21 people attended, followed by a 5-day WRAP facilitator training in January 2015 in which 15 new facilitators were certified. In fiscal year 2014-2015, BHRS also supported 2 partner agency staff to become Advanced Level WRAP Facilitators. There were 16 WRAP groups offered throughout San Mateo County this year, and there have been 752 unduplicated persons who have participated in a WRAP group by a certified WRAP facilitator since WRAP was introduced to San Mateo County in 2009. Trainings for Peer Support Workers Inspired at Work provided a series of four 2-hours trainings and one 7-hour retreat for BHRS and contract agency peer workers in 2014-2015 to support them in their positions. The training topics included: February 2, 2015: Client and Family Driven Care for Peer Support Workers- 2 hours March 2, 2015: Boundaries for Peer Support Workers (PSW)/Family Partners (FP)- 2 hours April 20, 2015: Group Facilitation for PSW/FP -2 hours June 15, 2015: Compassion Fatigue for PSW/FP -2 hours April 17, 2015: BHRS PSW/FP retreat- 7 hours Cultural Competence Training Spirituality Training In February 2015, the Spirituality Initiative sponsored a Spirituality 102 training for BHRS and contract staff to educate behavioral health staff on how to better address clients’ spirituality in treatment. Forty-nine participants attended. Cultural Competence Trainings Addressing Specific Populations The Health Equity Initiatives and workgroups took the lead in creating and/or sponsoring trainings on specific marginalized populations in San Mateo County. In January 2015, the Arab Community Workgroup organized a workshop on Working with the Arab and Arab-American Community presented by Hazem Hajaj. Thirty-four participants attended.
Page 92 of 101
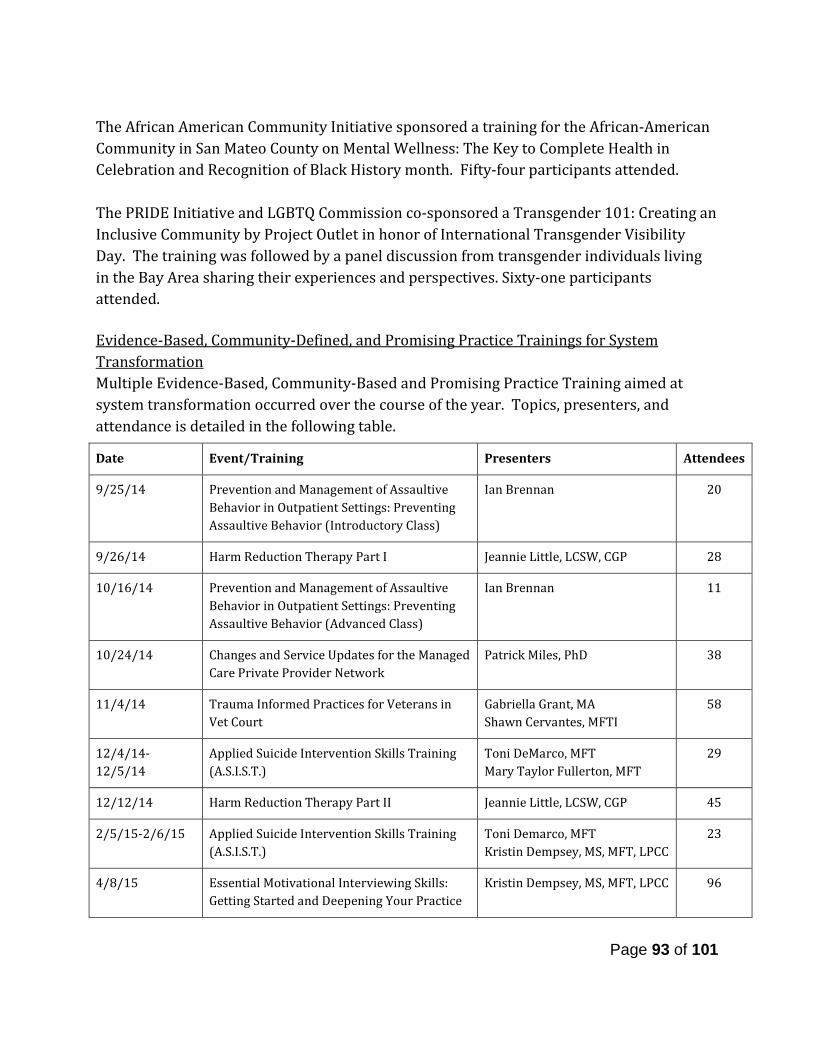
The African American Community Initiative sponsored a training for the African-American Community in San Mateo County on Mental Wellness: The Key to Complete Health in Celebration and Recognition of Black History month. Fifty-four participants attended. The PRIDE Initiative and LGBTQ Commission co-sponsored a Transgender 101: Creating an Inclusive Community by Project Outlet in honor of International Transgender Visibility Day. The training was followed by a panel discussion from transgender individuals living in the Bay Area sharing their experiences and perspectives. Sixty-one participants attended. Evidence-Based, Community-Defined, and Promising Practice Trainings for System Transformation Multiple Evidence-Based, Community-Based and Promising Practice Training aimed at system transformation occurred over the course of the year. Topics, presenters, and attendance is detailed in the following table.
Date Event/Training Presenters Attendees
9/25/14 Prevention and Management of Assaultive Behavior in Outpatient Settings: Preventing Assaultive Behavior (Introductory Class)
Ian Brennan 20
9/26/14 Harm Reduction Therapy Part I Jeannie Little, LCSW, CGP 28
10/16/14 Prevention and Management of Assaultive Behavior in Outpatient Settings: Preventing Assaultive Behavior (Advanced Class)
Ian Brennan 11
10/24/14 Changes and Service Updates for the Managed Care Private Provider Network
Patrick Miles, PhD 38
11/4/14 Trauma Informed Practices for Veterans in Vet Court
Gabriella Grant, MA Shawn Cervantes, MFTI
58
12/4/14-12/5/14
Applied Suicide Intervention Skills Training (A.S.I.S.T.)
Toni DeMarco, MFT Mary Taylor Fullerton, MFT
29
12/12/14 Harm Reduction Therapy Part II Jeannie Little, LCSW, CGP 45
2/5/15-2/6/15 Applied Suicide Intervention Skills Training (A.S.I.S.T.)
Toni Demarco, MFT Kristin Dempsey, MS, MFT, LPCC
23
4/8/15 Essential Motivational Interviewing Skills: Getting Started and Deepening Your Practice
Kristin Dempsey, MS, MFT, LPCC 96
Page 93 of 101

Also, during this 2014-2015 fiscal year the Selection of Evidenced-Based and Community Defined Practice Policy was passed by the BHRS Quality Improvement Committee. This policy aims to provide an inclusive process for the selection of clinical and non-clinical interventions that can be utilized throughout BHRS. The policy aims recognizes that effective interventions range from evidence-based, promising and community based or defined practices. The policy was approved and the list of interventions that were already in practice before July 2014 (and are therefore pre-approved) was started in this fiscal year. In fiscal year, 2015-2016, the members of this Committee will be chosen and will begin reviewing proposals for interventions. Behavioral Health Career Pathways Programs The following three objectives were established from the MHSA guidelines and the 2014 stakeholder process for the WET Plan Update in San Mateo County to promote behavioral health career pathways. 1) Attract prospective candidates to hard-to-fill positions and increase staff diversity The state-funded Mental Health Loan Assumption Program (MHLAP) continued to be implemented in San Mateo County BHRS to address 1) attracting, hiring, and retaining staff in hard-to-fill positions and 2) increasing diversity of staff and retaining diverse staff. The MHLAP program provides student loan forgiveness for BHRS and contract staff who
4/8/15 - 5/27/15
NMT SIX CORE STRENGTHS Toni DeMarco, MFT 21
4/22/15 Trauma 101 Mary Taylor Fullerton, JFT Katy Davis, PhD, LCSW Tiffany Totah, MFT Vanessa Fabian, LCSW
46
5/15/15 Hearing Voices “Understanding the Voice-Hearing Experience”
Lucinda Dei Rossi, CPRP, CFE Debra Brasher, MS, CPRP
18
5/20/2015 and 6/24/2015
Harm Reduction for Supervisors and Lead Staff Coaching Sessions I and II
Jeannie Little, LCSW, CGP 15
6/5/15 Reflective Supervision: Supervisory Matrix as Facilitating Environment
Maria Seymour St. John, PhD, MFT
35
6/10/15 - 7/8/15
NMT SIX CORE STRENGTHS Toni DeMarco , MFT 18
6/17/15 Law and Ethics Update and Review for Behavioral Health and Recovery Professionals
Daniel O. Taube, JD, PhD 98
Page 94 of 101
provide services in hard-to-fill positions, promote exhibit cultural and linguistic competence and/or have experience working in underserved areas. Applicants receive up to $10,000 to repay educational loans in exchange for a 12-month service obligation. 2) Promote and Support Workforce in the Behavioral Health Field Intern/Trainee Programs (Clinical and ODE) The BHRS clinical intern/trainee program provides clinical training opportunities each year at BHRS worksites throughout the county. BHRS partners and contracts with multiple graduate schools in the Bay Area and from other regions of the country to provide education, training, and clinical practice experiences for students. In 2014-2015, there were 41 BHRS interns and trainees placed at 15 different worksites throughout San Mateo County BHRS. The interns and trainees represented multiple professional disciplines including Alcohol and Other Drug certificate, doctoral psychology, MSW, MFT, and nurse practitioner students and interns. They received multiple training opportunities including a 2-day Intern Orientation that included sessions on crisis management, trauma-informed care, wellness and recovery, self-care, and health equity and a mid-year training on cultural humility. They each attended a weekly or biweekly regional didactic seminar at one of 4 sites. They were also invited to attend all of the system-wide trainings (listed earlier in this document). Nineteen of these trainees/interns received a $5,000 stipend as part of our Cultural Stipend Internship Program (CSIP) for their contributions to improving the cultural competence and cultural humility of our system of care (see full description below under Financial Incentives Programs). The Office of Diversity and Equity (ODE) Internship Training Program was created to give non-clinical students who want to be exposed to behavioral health careers through focusing on health equity and social justice work. In 2014-2015, ODE had 2 interns whose work focused on Prevention and Early Intervention initiatives including suicide prevention and stigma discrimination reduction related to behavioral health conditions. ODE interns receive a $5,000 stipend for their work. Daly City Youth Health Center Behavioral Health Career Pathways Program The Behavioral Health Career Pathways Program is designed to encourage San Mateo County high schools students to explore future careers in Behavioral Health, increase students understanding and support of individuals with behavioral health challenges and reduce stigma related to behavioral health conditions and services. BHRS contracted with the Daly City Youth Health Center (DCYHC) and Jefferson Union High School District (JUHSD) for the fourth year in 2014-2015 to facilitate this project. There have been over 400 high school juniors and seniors served over the 4-year span of this program. During the fiscal year 2014-2015, the program was implemented in 3 sections of a psychology course at Westmoor High School in Daly City, and 94 students participated in
Page 95 of 101
the program. The 94 student participants represented the diversity of the North San Mateo County community—68% identified as Asian, 12% as Latino, 10% as Mixed/Multi-racial, 3% Middle Eastern, 3% as White/Caucasian, and 4% as other. Many of these students are from immigrant families, speak a second language, and come from households in which behavioral health conditions are not discussed. The program’s curriculum educates the students about behavioral health careers and topics. In the 2014-2015 school year, the pre and post-tests demonstrated the project had impact on the students. The most dramatic change in responses were in regards to the students’ knowledge about mental and behavioral careers. Students reported a 23% increase from pre to post-test in knowledge of mental health careers and a 24% increase in knowledge of Alcohol and Other Drug related careers. They also increased 24% in their knowledge of education/degrees required to become a counselor, social worker, and psychologist. There was 13% increase in students stating they would like to help or work with people with mental illness. Students’ responses to the question about knowledge of causes of mental illness increased 18%. They also increased their sympathy in response to what it is like to have a mental illness (16%) and what it is like to have a family member or friend with mental illness (17%). Another result was an 18% increase in reports of students who have a friend or family member with mental illnesses. This shows students are more aware of mental and behavioral illnesses affecting those around them. 3) Career Pathways and Development for Clients/Consumers and Family Members Lived Experience Academy (LEA) By way of the Lived Experience Academy, clients/consumers and family members were offered many different paid opportunities during the 2015-2016 fiscal year. Opportunities included participating in up to 3 annual trainings, opportunities to speak in front of an audience, and opportunities to provide support to BHRS events. An “event” was classified as one organized program, which could have included multiple clients/consumers and family members. An “opportunity” captured each client/consumer and family member paid to work an “event”. FY 2014-2015 Paid Opportunities for Clients/Consumers and Families:
● Number of Paid Opportunities 126 ● Number of Paid Events 21 ● Number of Paid Speaking Opportunities 24 ● Number of Paid Speaking Events 10
Lived Experience Scholarship Program The Lived Experience Scholarship program provides up to $500 in scholarship to individual behavioral health clients/consumers and/or family members to pursue their academic goals toward a behavioral health profession.
Page 96 of 101
Financial Incentive Programs Cultural Stipend Internship Program (CSIP) The Cultural Stipend Internship Program awarded a $5,000 annual stipend to 19 BHRS clinical interns for fiscal year 2014-2015. Sixteen out of nineteen interns completed the program. Interns were selected based on numerous criteria including their racial/ethnic/cultural identity as well as having experience working with a marginalized community. First priority was given to those from communities of color and those with fluency in a language spoken by communities of color. Secondary priority included sexual orientation and gender identify, identifying as Lesbian Gay Bisexual Transgender Queer, or someone with a disability, from a rural area, or another marginalized group. Six of the 16 projects were institutionalized or continued on by staff after the intern finished. Intern demographics:
● White/Caucasian: 42% ● Mixed Race (any race): 10.5% ● People of color (POC): 58% ● LGBTQ: 10.5% ● Non-POC, non-LGBTQ: 37%
In exchange for the stipend award of $5,000, interns were asked to complete a year-long project and participate in one of nine Health Equity Initiatives. Completed intern projects:
● Research Paper on Native American communities and Attachment Theory ● Creation of a Meditation Room and spirituality survey (ongoing project) ● Training on the topic of Lesbian Gay Bisexual Transgender Queer People of Color ● Presentation on the topic of non-Native American identified clinicians working with
Native American Community ● Curricula Research for African American-centered mental health program ● Presentation on the topic of Restorative Justice ● Event organization and presentation for Chinese parents at Mills High School ● Focus groups on barriers to services for African American community ● Survey on Spirituality in clinical work for clinicians ● Guide on access to culturally sensitive services for Chinese ● Brochure on the topic of “How to talk to parents about mental health for first
generation Seriously Emotionally Disturbed youth” ● Photo Voice with Young Arab Clients ● Survey and Assessment about services for Chinese community in San Mateo County ● Survey of Filipino clinicians in San Mateo County ● Curriculum for 8 week group to support boys of color who are transitioning out of
juvenile detention
Page 97 of 101
Other Projects to Enhance Workforce Retention and Development BHRS New-Hire Orientation The BHRS New-Hire Orientation was created and provided to new BHRS staff in fiscal year 2014-2015. The Orientation consisted of a series of five 2-hour sessions that took place over the course of 6 months. The goal was to help new staff understand how BHRS works and connects to other agencies and departments, to meet and learn from BHRS managers, to explore the possibilities for career advancement, and to feel invested in and supported by BHRS as an organization. Thirty-five new employees who had been hired within the last year were invited to participate in the Orientation. The average number of attendees per session was 15. The session topics were as follows:
1. Orientation to What We Do at BHRS--guiding vision and mission of BHRS 2. BHRS Programs and Partnerships 3. Career Path and Professional Development Opportunities in BHRS 4. Who We Are Serving 5. Keys to Success at BHRS
BHRS Leadership College The BHRS Leadership College provides an opportunity for BHRS staff to learn about facets critical to the successful operation of BHRS. The College supports staff in considering their career development goals and is part of a succession planning strategy. The information and experiences received from participation gives staff an understanding of key policy, fiscal, operational and planning responsibilities that BHRS executes as part of its business practices. In 2014-2015, 25 employees applied and participated in the college cohort. The BHRS College consists of 9-sessions. Staff were required to attend 6 of 9 sessions to graduate from the College. In 2014-2015, 23 participants completed the college. They are eligible to make up missed sessions the next time the College is offered. The nine session topics were as follows:
1. Behavioral Health: History and Policy 2. Health System and Health Policy 3. County Governance and Administration 4. Quality Improvement, Performance Measurement, and Customer Service 5. LEAP Process and Institute 6. Finance and Budgeting 7. Servant Leadership 8. Community Partnerships, Requests for Proposals, and Contracting 9. BHRS Moves Toward the Future
Page 98 of 101
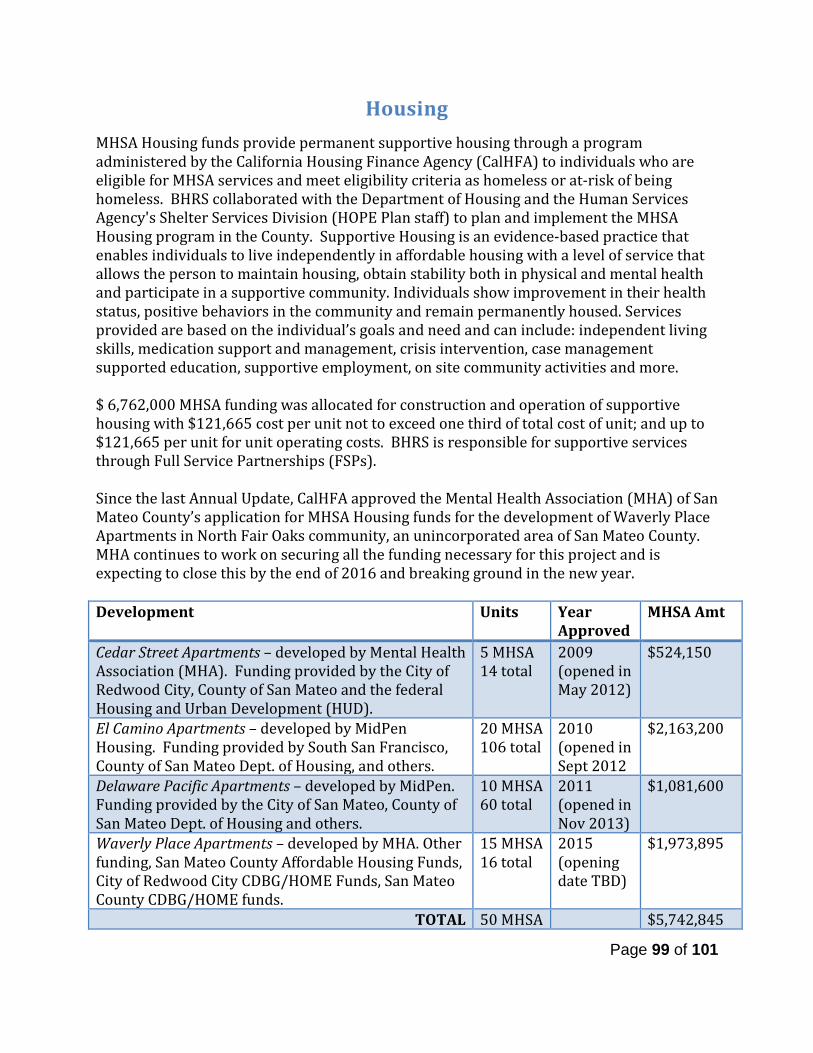
Housing MHSA Housing funds provide permanent supportive housing through a program administered by the California Housing Finance Agency (CalHFA) to individuals who are eligible for MHSA services and meet eligibility criteria as homeless or at-risk of being homeless. BHRS collaborated with the Department of Housing and the Human Services Agency's Shelter Services Division (HOPE Plan staff) to plan and implement the MHSA Housing program in the County. Supportive Housing is an evidence-based practice that enables individuals to live independently in affordable housing with a level of service that allows the person to maintain housing, obtain stability both in physical and mental health and participate in a supportive community. Individuals show improvement in their health status, positive behaviors in the community and remain permanently housed. Services provided are based on the individual’s goals and need and can include: independent living skills, medication support and management, crisis intervention, case management supported education, supportive employment, on site community activities and more. $ 6,762,000 MHSA funding was allocated for construction and operation of supportive housing with $121,665 cost per unit not to exceed one third of total cost of unit; and up to $121,665 per unit for unit operating costs. BHRS is responsible for supportive services through Full Service Partnerships (FSPs). Since the last Annual Update, CalHFA approved the Mental Health Association (MHA) of San Mateo County’s application for MHSA Housing funds for the development of Waverly Place Apartments in North Fair Oaks community, an unincorporated area of San Mateo County. MHA continues to work on securing all the funding necessary for this project and is expecting to close this by the end of 2016 and breaking ground in the new year. Development Units Year
Approved MHSA Amt
Cedar Street Apartments – developed by Mental Health Association (MHA). Funding provided by the City of Redwood City, County of San Mateo and the federal Housing and Urban Development (HUD).
5 MHSA 14 total
2009 (opened in May 2012)
$524,150
El Camino Apartments – developed by MidPen Housing. Funding provided by South San Francisco, County of San Mateo Dept. of Housing, and others.
20 MHSA 106 total
2010 (opened in Sept 2012
$2,163,200
Delaware Pacific Apartments – developed by MidPen. Funding provided by the City of San Mateo, County of San Mateo Dept. of Housing and others.
10 MHSA 60 total
2011 (opened in Nov 2013)
$1,081,600
Waverly Place Apartments – developed by MHA. Other funding, San Mateo County Affordable Housing Funds, City of Redwood City CDBG/HOME Funds, San Mateo County CDBG/HOME funds.
15 MHSA 16 total
2015 (opening date TBD)
$1,973,895
TOTAL 50 MHSA $5,742,845
Page 99 of 101

Cedar Street Apartments - Approved in 2009 (5 units)
El Camino Apartments - Approved in 2010 (20 units)
Delaware Street Apartments - Approved in 2011 (10 units)
Waverly Place Apartments – Approved 2015 (15 units)
Page 100 of 101

RELEASE OF UNENCUMBERED HOUSING FUNDS In September 2014, AB 1929 was passed which allows counties to use unencumbered MHSA Housing Program funds to provide housing assistance, not just permanent supportive housing, to mental health clients. The bill requires CalHFA - with CDHCS' concurrence - to release unencumbered MHSA Housing Program funds upon the written request of a county. Given the immediate need mental health clients have for assistance with housing supports, and the high cost and slow delivery of permanent units, BHRS recommended to the MHSA Steering Committee and the Mental Health and Substance Abuse and Recovery Commission (MHSARC) that the unencumbered Housing Program funds should be used to fund housing assistance activities in lieu of permanent supportive housing units. Both the MHSA Steering Committee and MHSARC voted unanimously in favor of this strategy. On April 21, 2015, the San Mateo County Board of Supervisors adopted a resolution approving the request to release the remaining funds; a total of $1,073,038 was received from the Housing Program to be held in trust for housing assistance services.
Page 101 of 101
A P P E N D I X 1 – S T E E R I N G C O M M I T T E E M E M B E R S H I P
G U I D E L I N E S & A P P L I C A T I O N
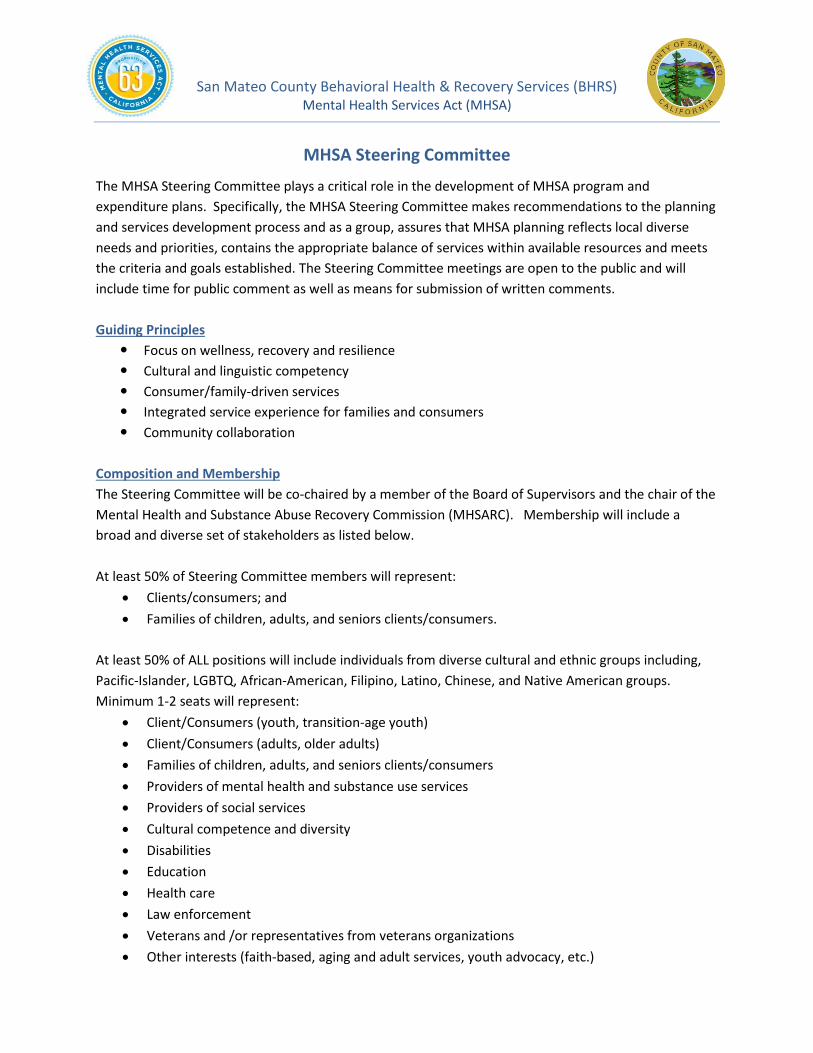
San Mateo County Behavioral Health & Recovery Services (BHRS) Mental Health Services Act (MHSA)
MHSA Steering Committee
The MHSA Steering Committee plays a critical role in the development of MHSA program and expenditure plans. Specifically, the MHSA Steering Committee makes recommendations to the planning and services development process and as a group, assures that MHSA planning reflects local diverse needs and priorities, contains the appropriate balance of services within available resources and meets the criteria and goals established. The Steering Committee meetings are open to the public and will include time for public comment as well as means for submission of written comments. Guiding Principles
Focus on wellness, recovery and resilience Cultural and linguistic competency Consumer/family-driven services Integrated service experience for families and consumers Community collaboration
Composition and Membership The Steering Committee will be co-chaired by a member of the Board of Supervisors and the chair of the Mental Health and Substance Abuse Recovery Commission (MHSARC). Membership will include a broad and diverse set of stakeholders as listed below. At least 50% of Steering Committee members will represent:
• Clients/consumers; and • Families of children, adults, and seniors clients/consumers.
At least 50% of ALL positions will include individuals from diverse cultural and ethnic groups including, Pacific-Islander, LGBTQ, African-American, Filipino, Latino, Chinese, and Native American groups. Minimum 1-2 seats will represent:
• Client/Consumers (youth, transition-age youth) • Client/Consumers (adults, older adults) • Families of children, adults, and seniors clients/consumers • Providers of mental health and substance use services • Providers of social services • Cultural competence and diversity • Disabilities • Education • Health care • Law enforcement • Veterans and /or representatives from veterans organizations • Other interests (faith-based, aging and adult services, youth advocacy, etc.)
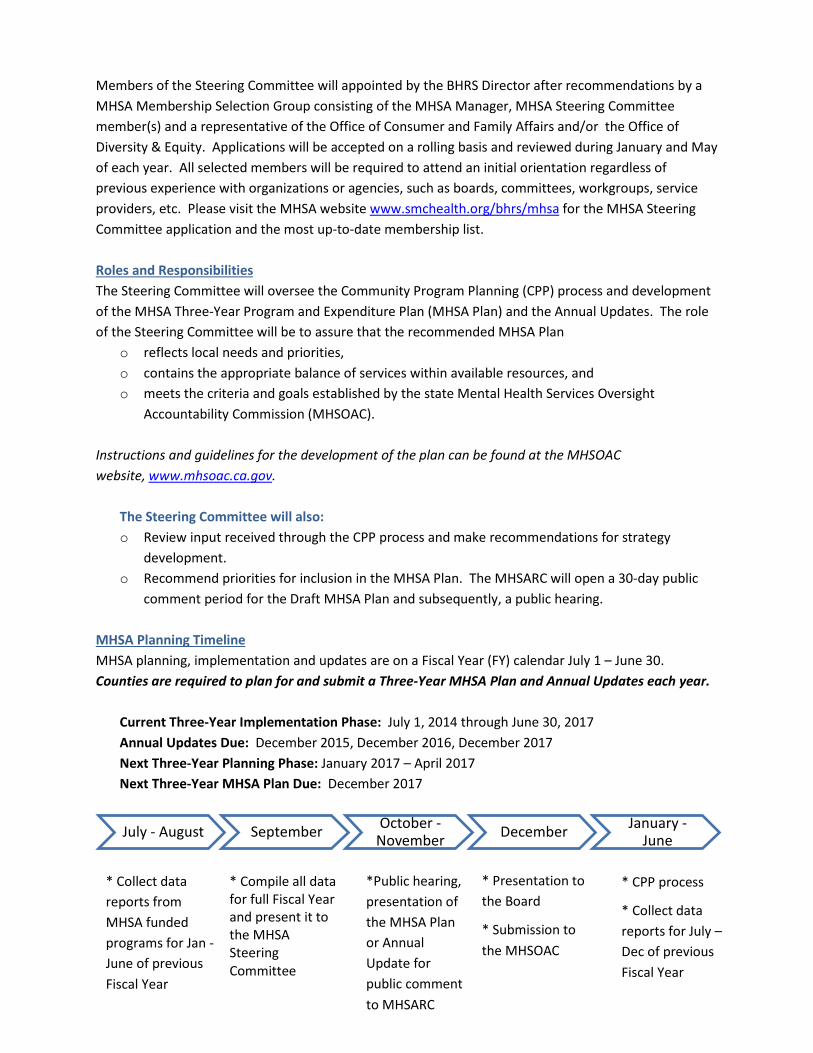
Members of the Steering Committee will appointed by the BHRS Director after recommendations by a MHSA Membership Selection Group consisting of the MHSA Manager, MHSA Steering Committee member(s) and a representative of the Office of Consumer and Family Affairs and/or the Office of Diversity & Equity. Applications will be accepted on a rolling basis and reviewed during January and May of each year. All selected members will be required to attend an initial orientation regardless of previous experience with organizations or agencies, such as boards, committees, workgroups, service providers, etc. Please visit the MHSA website www.smchealth.org/bhrs/mhsa for the MHSA Steering Committee application and the most up-to-date membership list. Roles and Responsibilities The Steering Committee will oversee the Community Program Planning (CPP) process and development of the MHSA Three-Year Program and Expenditure Plan (MHSA Plan) and the Annual Updates. The role of the Steering Committee will be to assure that the recommended MHSA Plan
o reflects local needs and priorities, o contains the appropriate balance of services within available resources, and o meets the criteria and goals established by the state Mental Health Services Oversight
Accountability Commission (MHSOAC). Instructions and guidelines for the development of the plan can be found at the MHSOAC website, www.mhsoac.ca.gov.
The Steering Committee will also: o Review input received through the CPP process and make recommendations for strategy
development. o Recommend priorities for inclusion in the MHSA Plan. The MHSARC will open a 30-day public
comment period for the Draft MHSA Plan and subsequently, a public hearing. MHSA Planning Timeline MHSA planning, implementation and updates are on a Fiscal Year (FY) calendar July 1 – June 30. Counties are required to plan for and submit a Three-Year MHSA Plan and Annual Updates each year.
Current Three-Year Implementation Phase: July 1, 2014 through June 30, 2017 Annual Updates Due: December 2015, December 2016, December 2017 Next Three-Year Planning Phase: January 2017 – April 2017 Next Three-Year MHSA Plan Due: December 2017
July - August September October - November December January -
June
* Collect data reports from MHSA funded programs for Jan - June of previous Fiscal Year
* Compile all data for full Fiscal Year and present it to the MHSA Steering Committee
*Public hearing, presentation of the MHSA Plan or Annual Update for public comment to MHSARC
* Presentation to the Board
* Submission to the MHSOAC
* CPP process
* Collect data reports for July – Dec of previous Fiscal Year

Steering Committee Meetings
o The MHSA Steering Committee will meet twice a year in the Fall and Spring during Implementation Phase July 1, 2014 – June 30, 2017.
o As we begin the Planning Phase, January 2017 – April 2017 for the next three years of MHSA services there may be 1-2 additional meetings to allow for more engagement in the CPP process and making recommendations.
Given that there are only 2-4 meetings per year, consistent attendance is very important and members who miss two meetings over the course of a year may be removed from the committee. Extenuating circumstances will be considered and the MHSA Membership Selection Group will make the final decision. We will make every attempt to provide you meeting date, time and location well in advance. For any additional questions about the the Steering Committee please contact Doris Estremera, MHSA Manager at [email protected] or (650) 573-2889.

1 of 3
Mental Health Services Act (MHSA) STEERING COMMITTEE MEMBER APPLICATION
Date:
Name: Title (if applicable): Organization (if applicable): Address: Phone #: E-mail:
1. Which stakeholder representative seat are you applying for (select all that apply)? Client/Consumers (youth, transition-age youth)
Client/Consumers (adults, older adults)
Families of children, adults, and seniors clients/consumers
Providers of mental health and substance use services
Providers of social services
Cultural competence and diversity
Disabilities
Education
Health care
Law enforcement
Veterans and /or representatives from veterans organizations
Other interests (faith-based, aging and adult services, youth advocacy, individuals served
by MHSA programs, etc.)
2. Age: <15 years 16-25 years 26-59 years 60+ years Decline to state
3. What is your preferred language? (select ONE)
English Spanish Cantonese/Mandarin Tagalog Other: ____________
4. Race: American Indian/Alaska Native Asian African-American/Black Caucasian/ White Native Hawaiian Other Pacific Islander Other: ____________ Decline to state
For more information about MHSA and the MHSA Steering Committee Roles and Responsibilities including current membership composition and past meeting materials, visit www.smchealth.org/bhrs/mhsa.

2 of 3
5. Ethnicity: (select all that apply) Hispanic/
Latino: Central American Mexican South American Caribbean Puerto Rican Other:
_____
Non-Hispanic/ Latino:
African Eastern European European Middle Eastern Other: ____________
Asian: Chinese Filipino Japanese Cambodian Korean Vietnamese Asian Indian/
South Asian Other: ____________
Decline to state
6. Gender assigned at birth: Male Female Decline to state 7. Gender identity: Male Female Transgender Genderqueer Questioning Decline to state Other:
8. Sexual orientation: Bisexual Gay/Lesbian Heterosexual Queer Questioning Decline to state Other: _____________
9. Do you have a disability or learning difficulty? (select all that apply) Difficulty seeing Difficulty hearing Physical/mobility disability Learning disability Developmental Dementia Chronic health condition Decline to state Other: _____________________
10. Are you a Veteran? Yes No Decline to state Applications will be accepted on a continuous basis and reviewed twice a year in January and May.
Please return your completed application via email, mail or fax to:
Colin Hart 225 37th Avenue, 3rd Floor San Mateo, CA 94403-4324
Fax: (650) 573-2841 Email: [email protected]
SEE PAGE 3 FOR ADDITIONAL QUESTIONS →For more information about MHSA and the MHSA Steering Committee Roles and Responsibilities including current membership composition and past meeting materials, visit www.smchealth.org/bhrs/mhsa.

3 of 3 1. Please describe your interest in serving as an MHSA Steering Committee member?
2. Please describe your experience working with organizations or agencies, such as boards, committees, workgroups, service providers, etc.?
3. What is your experience working with communities of culturally diverse backgrounds?
4. Every individual has strengths to contribute to a steering committee, what are some of
the strengths you would bring to the Steering Committee?
For more information about MHSA and the MHSA Steering Committee Roles and Responsibilities including current membership composition and past meeting materials, visit www.smchealth.org/bhrs/mhsa.

A P P E N D I X 2 – P U B L I C C O M M E N T S ( T B D )
A P P E N D I X 3 – M H S A I S S U E R E S O L U T I O N P R O C E S S
( I R P )

San Mateo County Behavioral Health and Recovery Services
MENTAL HEALTH SERVICES ACT (MHSA) – Issue Resolution Process
I. Behavioral Health & Recovery Services (BHRS) Grievance/Appeals BHRS consumer/clients receive client rights information upon admission to any program, which includes information on the right to a problem resolution process and how to file a grievance, appeal or request a state fair hearing after exhausting the internal problem resolution process. The Office of Consumer and Family Affairs (OFCA) is available to assist with grievances, appeals, and/or the fair hearing process. For a complete list of Consumer Rights, call OCFA at 800.388.5189 or visit www.smchealth.org/BHRS/OCFA.
II. MHSA Issue Resolution - Background MHSA County Performance Contracts require that Counties adopt an Issue Resolution Process in order to resolve issues related to
1) the MHSA Community Program Planning (CPP) process; 2) consistency between approved MHSA plans and program implementation; and 3) MHSA funded programs (accessibility, appropriate use of funds, etc).
Counties are required to keep and update an Issue Resolution Log to handle client disputes and complaints. The Issue Resolution Log must include brief description of the MHSA issue, dates, and final resolution. Specifically, CPP is defined in Title 9 California Codes and Regulations and ensures that:
• MHSA funded services are client and family driven meaning that clients and their families have the primary decision-making role in determining the services and supports that are most effective and helpful.
• The county will demonstrate a partnership with constituents and stakeholders throughout the process that includes meaningful stakeholder involvement on mental health policy, program planning and implementation, monitoring, quality improvement, evaluation, and budget allocations.
• Consumers and their family members will be provided training, opportunities to provide their viewpoints and experiences and granted stipends for their participation.
III. MHSA Issue Resolution Process When an MHSA specific grievances are received by the OCFA, the coordinator will:
• Note in the Grievance/Appeal Log that it is an MHSA-specific grievance. • Handle all issues related to treatment by MHSA funded programs.
SMC MHSA IRP, 12/5/2016 Page 1 of 2
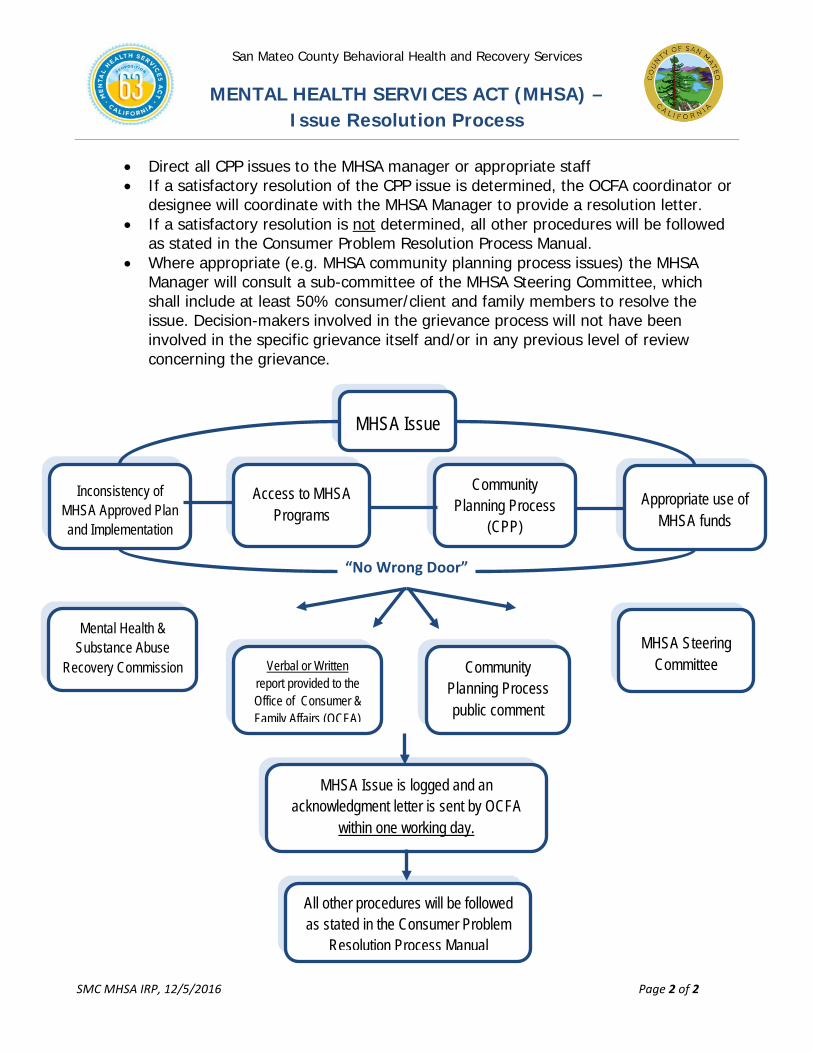
San Mateo County Behavioral Health and Recovery Services
MENTAL HEALTH SERVICES ACT (MHSA) – Issue Resolution Process
MHSA Issue is logged and an acknowledgment letter is sent by OCFA
within one working day.
MHSA Issue
Inconsistency of MHSA Approved Plan and Implementation
Community Planning Process
(CPP)
Access to MHSA Programs
All other procedures will be followed as stated in the Consumer Problem
Resolution Process Manual
Appropriate use of MHSA funds
“No Wrong Door”
Mental Health & Substance Abuse
Recovery Commission Verbal or Written report provided to the Office of Consumer & Family Affairs (OCFA)
Community Planning Process public comment
MHSA Steering Committee
• Direct all CPP issues to the MHSA manager or appropriate staff • If a satisfactory resolution of the CPP issue is determined, the OCFA coordinator or
designee will coordinate with the MHSA Manager to provide a resolution letter. • If a satisfactory resolution is not determined, all other procedures will be followed
as stated in the Consumer Problem Resolution Process Manual. • Where appropriate (e.g. MHSA community planning process issues) the MHSA
Manager will consult a sub-committee of the MHSA Steering Committee, which shall include at least 50% consumer/client and family members to resolve the issue. Decision-makers involved in the grievance process will not have been involved in the specific grievance itself and/or in any previous level of review concerning the grievance.
SMC MHSA IRP, 12/5/2016 Page 2 of 2

A P P E N D I X 4 – I N N O V A T I O N P R O J EC T B R I E F S
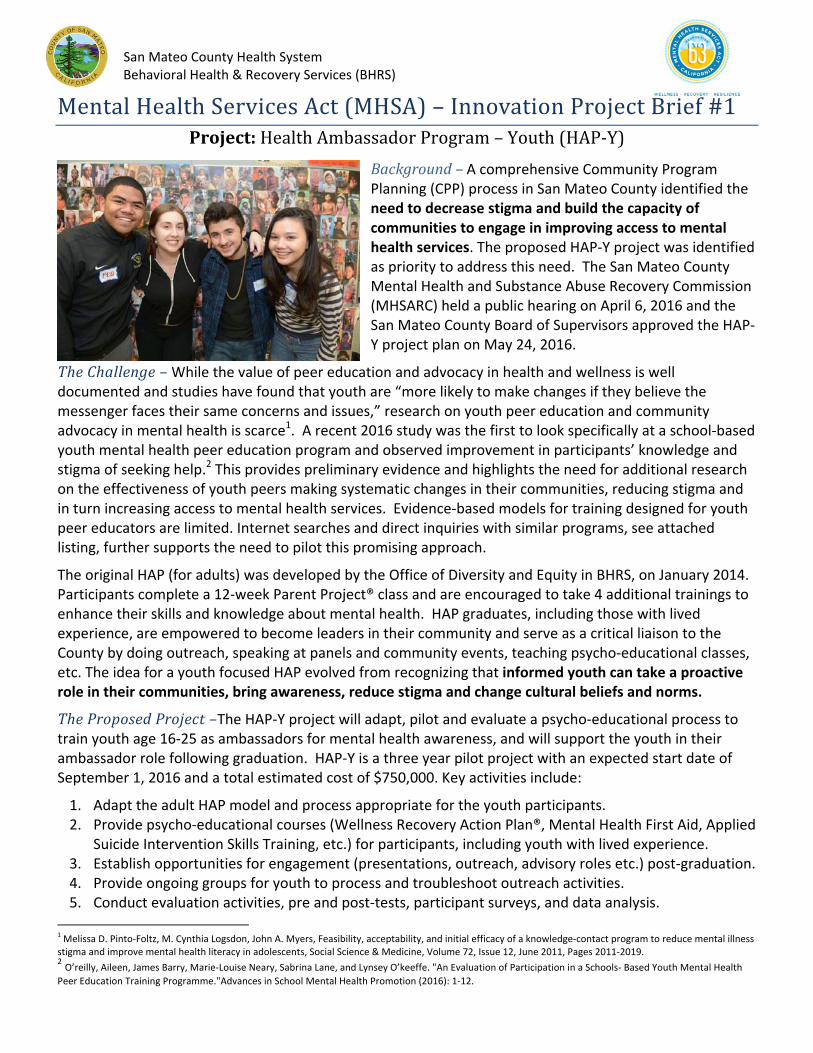
San Mateo County Health System Behavioral Health & Recovery Services (BHRS)
MentalHealthServicesAct(MHSA)–InnovationProjectBrief#1Project:HealthAmbassadorProgram–Youth(HAP‐Y)
Background– A comprehensive Community Program Planning (CPP) process in San Mateo County identified the need to decrease stigma and build the capacity of communities to engage in improving access to mental health services. The proposed HAP‐Y project was identified as priority to address this need. The San Mateo County Mental Health and Substance Abuse Recovery Commission (MHSARC) held a public hearing on April 6, 2016 and the San Mateo County Board of Supervisors approved the HAP‐Y project plan on May 24, 2016.
TheChallenge– While the value of peer education and advocacy in health and wellness is well documented and studies have found that youth are “more likely to make changes if they believe the messenger faces their same concerns and issues,” research on youth peer education and community advocacy in mental health is scarce1. A recent 2016 study was the first to look specifically at a school‐based youth mental health peer education program and observed improvement in participants’ knowledge and stigma of seeking help.2 This provides preliminary evidence and highlights the need for additional research on the effectiveness of youth peers making systematic changes in their communities, reducing stigma and in turn increasing access to mental health services. Evidence‐based models for training designed for youth peer educators are limited. Internet searches and direct inquiries with similar programs, see attached listing, further supports the need to pilot this promising approach.
The original HAP (for adults) was developed by the Office of Diversity and Equity in BHRS, on January 2014. Participants complete a 12‐week Parent Project® class and are encouraged to take 4 additional trainings to enhance their skills and knowledge about mental health. HAP graduates, including those with lived experience, are empowered to become leaders in their community and serve as a critical liaison to the County by doing outreach, speaking at panels and community events, teaching psycho‐educational classes, etc. The idea for a youth focused HAP evolved from recognizing that informed youth can take a proactive role in their communities, bring awareness, reduce stigma and change cultural beliefs and norms.
TheProposedProject–The HAP‐Y project will adapt, pilot and evaluate a psycho‐educational process to train youth age 16‐25 as ambassadors for mental health awareness, and will support the youth in their ambassador role following graduation. HAP‐Y is a three year pilot project with an expected start date of September 1, 2016 and a total estimated cost of $750,000. Key activities include:
1. Adapt the adult HAP model and process appropriate for the youth participants. 2. Provide psycho‐educational courses (Wellness Recovery Action Plan®, Mental Health First Aid, Applied
Suicide Intervention Skills Training, etc.) for participants, including youth with lived experience. 3. Establish opportunities for engagement (presentations, outreach, advisory roles etc.) post‐graduation. 4. Provide ongoing groups for youth to process and troubleshoot outreach activities. 5. Conduct evaluation activities, pre and post‐tests, participant surveys, and data analysis.
1 Melissa D. Pinto‐Foltz, M. Cynthia Logsdon, John A. Myers, Feasibility, acceptability, and initial efficacy of a knowledge‐contact program to reduce mental illness stigma and improve mental health literacy in adolescents, Social Science & Medicine, Volume 72, Issue 12, June 2011, Pages 2011‐2019. 2 O’reilly, Aileen, James Barry, Marie‐Louise Neary, Sabrina Lane, and Lynsey O’keeffe. "An Evaluation of Participation in a Schools‐ Based Youth Mental Health
Peer Education Training Programme."Advances in School Mental Health Promotion (2016): 1‐12.
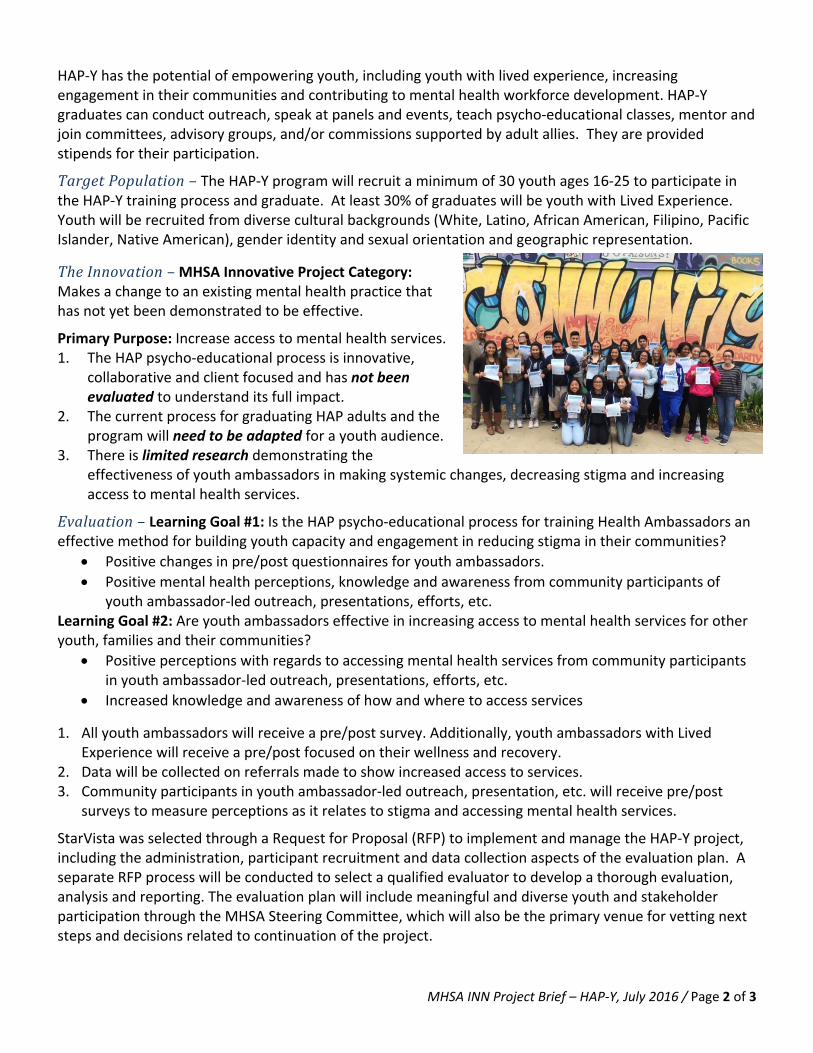
MHSA INN Project Brief – HAP‐Y, July 2016 / Page 2 of 3
HAP‐Y has the potential of empowering youth, including youth with lived experience, increasing engagement in their communities and contributing to mental health workforce development. HAP‐Y graduates can conduct outreach, speak at panels and events, teach psycho‐educational classes, mentor and join committees, advisory groups, and/or commissions supported by adult allies. They are provided stipends for their participation.
TargetPopulation–The HAP‐Y program will recruit a minimum of 30 youth ages 16‐25 to participate in the HAP‐Y training process and graduate. At least 30% of graduates will be youth with Lived Experience. Youth will be recruited from diverse cultural backgrounds (White, Latino, African American, Filipino, Pacific Islander, Native American), gender identity and sexual orientation and geographic representation.
TheInnovation– MHSA Innovative Project Category: Makes a change to an existing mental health practice that has not yet been demonstrated to be effective.
Primary Purpose: Increase access to mental health services. 1. The HAP psycho‐educational process is innovative,
collaborative and client focused and has not been evaluated to understand its full impact.
2. The current process for graduating HAP adults and the program will need to be adapted for a youth audience.
3. There is limited research demonstrating the effectiveness of youth ambassadors in making systemic changes, decreasing stigma and increasing access to mental health services.
Evaluation–Learning Goal #1: Is the HAP psycho‐educational process for training Health Ambassadors an effective method for building youth capacity and engagement in reducing stigma in their communities?
Positive changes in pre/post questionnaires for youth ambassadors.
Positive mental health perceptions, knowledge and awareness from community participants of youth ambassador‐led outreach, presentations, efforts, etc.
Learning Goal #2: Are youth ambassadors effective in increasing access to mental health services for other youth, families and their communities?
Positive perceptions with regards to accessing mental health services from community participants in youth ambassador‐led outreach, presentations, efforts, etc.
Increased knowledge and awareness of how and where to access services
1. All youth ambassadors will receive a pre/post survey. Additionally, youth ambassadors with Lived Experience will receive a pre/post focused on their wellness and recovery.
2. Data will be collected on referrals made to show increased access to services. 3. Community participants in youth ambassador‐led outreach, presentation, etc. will receive pre/post
surveys to measure perceptions as it relates to stigma and accessing mental health services.
StarVista was selected through a Request for Proposal (RFP) to implement and manage the HAP‐Y project, including the administration, participant recruitment and data collection aspects of the evaluation plan. A separate RFP process will be conducted to select a qualified evaluator to develop a thorough evaluation, analysis and reporting. The evaluation plan will include meaningful and diverse youth and stakeholder participation through the MHSA Steering Committee, which will also be the primary venue for vetting next steps and decisions related to continuation of the project.
MHSA INN Project Brief – HAP‐Y, July 2016 / Page 3 of 3
Attachment – List of similar youth peer education/advocacy programs
Program Name and Website
Year Established
Location Target Population
Method(s) of Engagement
Youth Mental Wellness Ambassadors http://www.somervillema.gov/calendar/youth‐mental‐wellness‐ambassador‐launch
2015 Somerville, MA
16‐25 years old
The Center for Teen Empowerment Inc. (TE) and the City of Somerville's Health and Human Services Department partner to launch the Youth Mental Wellness Ambassador Program. Youth Mental Wellness Ambassadors, ages 16‐24 years old, will implement city wide discussion workshops and events addressing mental health and wellness among youth in Somerville. In partnership with youth serving agencies, schools, and housing, Ambassadors will shift attitudes about mental health, and change cultural beliefs and norms. By providing more youth lead safe spaces to discuss and learn, this program will support the city's commitment to decrease the stigmatization around mental health. ‐ See more at: http://www.somervillema.gov/calendar/youth‐mental‐wellness‐ambassador‐launch#sthash.n9hXCf2V.dpuf
Mental Health Ambassadors http://www.sjsu.edu/counseling/Training_Program/Peer_Prevention_Programs/Mental_Health_Ambassadors/
2007 San Jose State University
SJSU students
The MHAs are similar to Peer Counselors in having positive attitudes toward mental health, good communication skills, and skills and knowledge to help students to be healthy and successful. However, MHAs are different from Peer Counselors in:
Primary goal: MHAs' primary goal is making systematic change ‐‐ changing the culture and attitudes as well as reducing the stigma related to mental health issues for SJSU students and community. Peer counselors primary goal is to provide support to their peers and produce individual changes.
Main activities: MHAs are encouraged to create and engage in diverse programs and activities to help them to achieve their mission (e.g., presentation, tabling, designing handouts, participating in student organization meetings, talking to professors), while peer counselors mainly provide individual peer counseling.

San Mateo County Health System Behavioral Health & Recovery Services
Mental Health Services Act (MHSA) – Innovation Project Brief #2
Project: Lesbian, Gay, Bisexual, Transgender and Questioning (LGBTQ) Behavioral Health Coordinated Services Center
Background – A comprehensive Community Program Planning (CPP) process identified the need for culturally specific services and supports including outreach and coordination of services for the LGBTQ community. The proposed LGBTQ Behavioral Health Coordinated Services Center (The Center) was identified as a priority project to address this need. The San Mateo County Mental Health and Substance Abuse Recovery Commission (MHSARC) held a public hearing on April 6, 2016, following a 30-day public comment period, and recommended the approval of the project to the San Mateo County Board of Supervisors, which approved the project plan on May 24, 2016.
The Challenge – LGBTQ individuals are at higher risk of mental disorders1 given their experience with multiple levels of stress including constant subtle or covert acts of homophobia, biphobia and transphobia against them. LGBTQ youth are especially vulnerable with higher rates of being victimized, having a mental health disorder and of homelessness and suicide.2 LGBTQ older adults are also at higher risk of depression and isolation from family and other social supports.3 Transgender persons and gender non-conforming/variant remain the most vulnerable to mental health problems including suicidality, depression, post-traumatic stress, and substance abuse.4 While there are LGBTQ services located in the Bay Area, there are very few services in San Mateo County and a thorough literature review points to the scarcity of published research on models of coordination across services for this community. An academic study of LGBTQ community centers across the U.S. found that while nearly 87% offer social support services, direct mental health services are the least offered service.5 This study also pointed to the need to create partnerships to increase quality, capacity and impact, training opportunities, clinical experience and specialized treatment programs for high risk groups; all services The Center will provide.
The Proposed Project – The Center will provide a coordinated approach across mental health treatment, recovery and supports for high risk LGBTQ communities through collaboration of multiple agencies. The Center will include a space where groups, events and other activities will be held and feature the coordination of three (3) components, summarized below. The Center pilot project has an expected start date of October 1, 2016 and a total estimated cost of $2.2 million for three years.
1 King, M., Semlyen, J., Tai, S. S., Killaspy, H., Osborn, D., Popelyuk, D., & Nazareth, I. (2008). A systematic review of mental disorder, suicide, and deliberate self-harm in lesbian, gay and bisexual people. BMC Psychiatry, 8:70 2 Mustanski, Brian, Rebecca Andrews, and Jae A. Puckett. "The Effects of Cumulative Victimization on Mental Health Among Lesbian, Gay, Bisexual, and Transgender Adolescents and Young Adults."American Journal of Public Health 106.3 (2016): 527. 3 Fredriksen-Goldsen, Karen I., Hyun-Jun Kim, Susan E. Barkan, Anna Muraco, and Charles P. Hoy-Ellis. "Health Disparities among Lesbian, Gay, and Bisexual Older Adults: Results from a Population- Based Study.(Author Abstract)." The American Journal of Public Health 103.10 (2013): 1802. 4 Clements-Nolle, K., Marx, R., Guzman, R., & Katz, M. (2001). HIV Prevalence, Risk Behaviors, Health Care Use, and Mental Health Status of Transgender Persons: Implications for Public Health Intervention. American Journal of Public Health, 91, 6, 915. 5 Rogers, Michael, Tania Israel, Merith Cosden, and Melissa Morgan Consoli. "Enhancing LGBTQ Emotional Health: The Role of LGBT Community Centers in Addressing Access to Mental Health and Social Support Services." N.p.: ProQuest Dissertations, 2012.
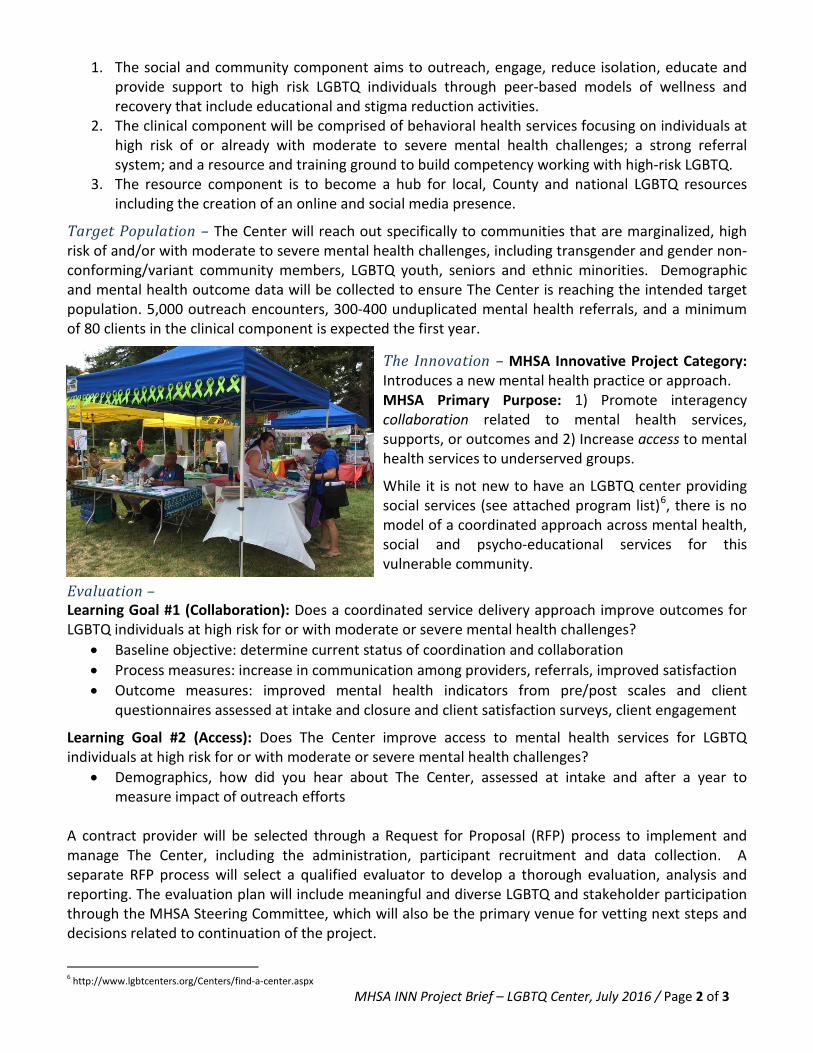
1. The social and community component aims to outreach, engage, reduce isolation, educate and provide support to high risk LGBTQ individuals through peer-based models of wellness and recovery that include educational and stigma reduction activities.
2. The clinical component will be comprised of behavioral health services focusing on individuals at high risk of or already with moderate to severe mental health challenges; a strong referral system; and a resource and training ground to build competency working with high-risk LGBTQ.
3. The resource component is to become a hub for local, County and national LGBTQ resources including the creation of an online and social media presence.
Target Population – The Center will reach out specifically to communities that are marginalized, high risk of and/or with moderate to severe mental health challenges, including transgender and gender non-conforming/variant community members, LGBTQ youth, seniors and ethnic minorities. Demographic and mental health outcome data will be collected to ensure The Center is reaching the intended target population. 5,000 outreach encounters, 300-400 unduplicated mental health referrals, and a minimum of 80 clients in the clinical component is expected the first year.
The Innovation – MHSA Innovative Project Category: Introduces a new mental health practice or approach. MHSA Primary Purpose: 1) Promote interagency collaboration related to mental health services, supports, or outcomes and 2) Increase access to mental health services to underserved groups.
While it is not new to have an LGBTQ center providing social services (see attached program list)6, there is no model of a coordinated approach across mental health, social and psycho-educational services for this vulnerable community.
Evaluation – Learning Goal #1 (Collaboration): Does a coordinated service delivery approach improve outcomes for LGBTQ individuals at high risk for or with moderate or severe mental health challenges?
• Baseline objective: determine current status of coordination and collaboration • Process measures: increase in communication among providers, referrals, improved satisfaction • Outcome measures: improved mental health indicators from pre/post scales and client
questionnaires assessed at intake and closure and client satisfaction surveys, client engagement
Learning Goal #2 (Access): Does The Center improve access to mental health services for LGBTQ individuals at high risk for or with moderate or severe mental health challenges?
• Demographics, how did you hear about The Center, assessed at intake and after a year to measure impact of outreach efforts
A contract provider will be selected through a Request for Proposal (RFP) process to implement and manage The Center, including the administration, participant recruitment and data collection. A separate RFP process will select a qualified evaluator to develop a thorough evaluation, analysis and reporting. The evaluation plan will include meaningful and diverse LGBTQ and stakeholder participation through the MHSA Steering Committee, which will also be the primary venue for vetting next steps and decisions related to continuation of the project.
6 http://www.lgbtcenters.org/Centers/find-a-center.aspx MHSA INN Project Brief – LGBTQ Center, July 2016 / Page 2 of 3

Attachment – List of LGBTQ programs providing similar services Program Name and Website
Year Established
Location Method(s) of Engagement
Fenway Health http://fenwayhealth.org/
1971 Boston, MA The mission of Fenway Community Health is to enhance the physical and mental health of the general community, with an emphasis on services for LGBT individuals. Fenway is 1 of only 9 LGBT-specific community health centers in the United States. Fenway's services include primary medical care and specialty HIV/AIDS, obstetrics, gynecology, gerontology, podiatry, and dermatology services; mental health and addiction services; complementary therapies including chiropractic, massage, acupuncture, and nutrition therapies; health promotion programs, community education programs, programs for the prevention of domestic and homophobic violence, and parenting programs; and family planning services.
Callen-Lorde Community Health Center http://callen-lorde.org/about/
1983 New York, NY
Callen-Lorde Community Health Center provides sensitive, quality health care and related services targeted to New York’s lesbian, gay, bisexual, and transgender communities — in all their diversity — regardless of ability to pay. To further this mission, Callen-Lorde promotes health education and wellness, and advocates for LGBT health issues. Callen-Lorde offers a full spectrum of full integrated services including patient care services, primary medical care, health outreach to teen (HOTT) targeting homeless LGBT youth, HIV medical care, Lesbian and Bisexual women’s health, mental health, transgender services, dentistry, care coordination services, sexual health education clinic, and pharmacy.
SF LGBT Center http://www.sfcenter.org/
2002 San Francisco, CA
The mission of the San Francisco Lesbian Gay Bisexual Transgender (LGBT) Community Center is to connect our diverse community to opportunities, resources and each other to achieve our vision of a stronger, healthier, and more equitable world for LGBT people and our allies. The Center’s strategies inspire and strengthen our community by: • Fostering greater opportunities for people to thrive. • Organizing for our future. • Celebrating our history and culture. • Building resources to create a legacy for future generations. Our own service programs provide leadership that brings the community together to work on issues of civil rights, public policy and community activism, tackling problems of discrimination, homophobia and disenfranchisement. The Center is sought out as a collaborative leader and partner, leveraging the work of community-based organizations through active engagement with over 70 local organizations. Services include: direct programming, economic development, health and wellness, children youth and family services, policy initiatives, and arts and culture.
Center Link: The Community of LGBT Centers http://www.lgbtcenters.org/Centers/find-a-center.aspx
1994 Nationwide Database
CenterLink develops strong, sustainable LGBT community centers and builds a thriving center network that creates healthy, vibrant communities. Using a nationwide database, LGBTQ members can search for centers on their website where lesbian, gay, bisexual and transgender people have access to flourishing LGBT community centers that advance their safety, equality and well-being.
MHSA INN Project Brief – LGBTQ Center, July 2016 / Page 3 of 3
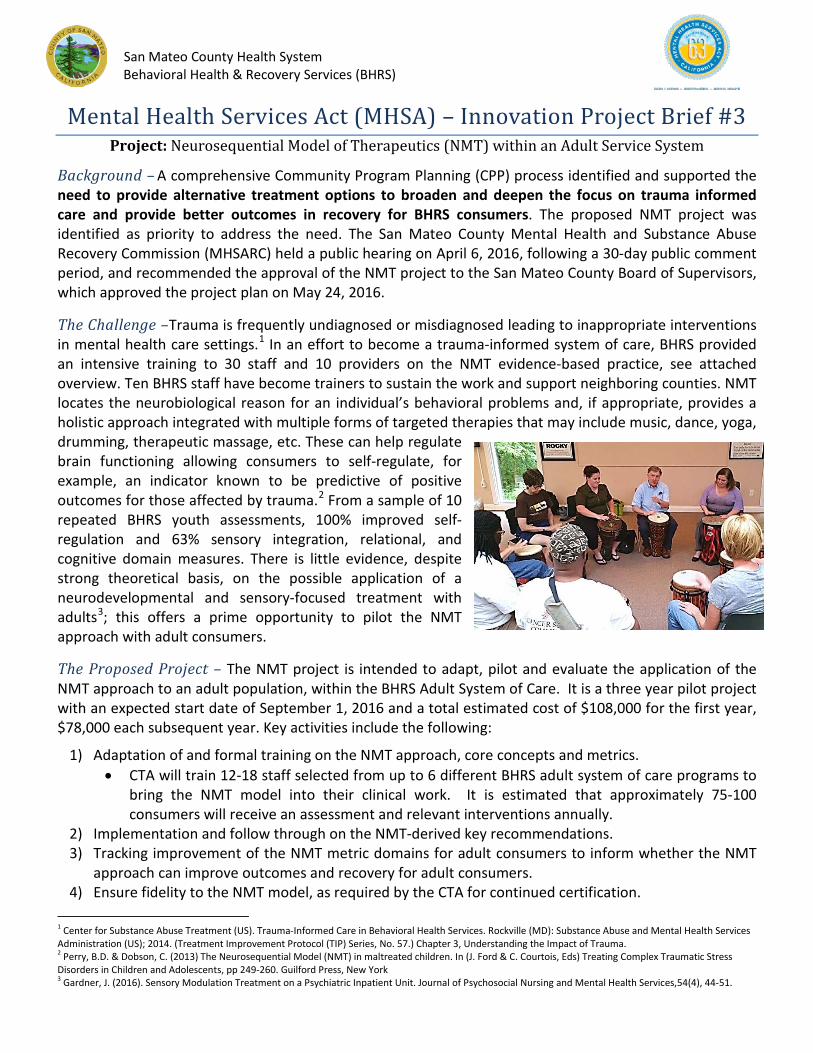
San Mateo County Health System Behavioral Health & Recovery Services (BHRS)
Mental Health Services Act (MHSA) – Innovation Project Brief #3 Project: Neurosequential Model of Therapeutics (NMT) within an Adult Service System
Background – A comprehensive Community Program Planning (CPP) process identified and supported the need to provide alternative treatment options to broaden and deepen the focus on trauma informed care and provide better outcomes in recovery for BHRS consumers. The proposed NMT project was identified as priority to address the need. The San Mateo County Mental Health and Substance Abuse Recovery Commission (MHSARC) held a public hearing on April 6, 2016, following a 30-day public comment period, and recommended the approval of the NMT project to the San Mateo County Board of Supervisors, which approved the project plan on May 24, 2016.
The Challenge –Trauma is frequently undiagnosed or misdiagnosed leading to inappropriate interventions in mental health care settings.1 In an effort to become a trauma-informed system of care, BHRS provided an intensive training to 30 staff and 10 providers on the NMT evidence-based practice, see attached overview. Ten BHRS staff have become trainers to sustain the work and support neighboring counties. NMT locates the neurobiological reason for an individual’s behavioral problems and, if appropriate, provides a holistic approach integrated with multiple forms of targeted therapies that may include music, dance, yoga, drumming, therapeutic massage, etc. These can help regulate brain functioning allowing consumers to self-regulate, for example, an indicator known to be predictive of positive outcomes for those affected by trauma.2 From a sample of 10 repeated BHRS youth assessments, 100% improved self-regulation and 63% sensory integration, relational, and cognitive domain measures. There is little evidence, despite strong theoretical basis, on the possible application of a neurodevelopmental and sensory-focused treatment with adults3; this offers a prime opportunity to pilot the NMT approach with adult consumers.
The Proposed Project – The NMT project is intended to adapt, pilot and evaluate the application of the NMT approach to an adult population, within the BHRS Adult System of Care. It is a three year pilot project with an expected start date of September 1, 2016 and a total estimated cost of $108,000 for the first year, $78,000 each subsequent year. Key activities include the following:
1) Adaptation of and formal training on the NMT approach, core concepts and metrics. • CTA will train 12-18 staff selected from up to 6 different BHRS adult system of care programs to
bring the NMT model into their clinical work. It is estimated that approximately 75-100 consumers will receive an assessment and relevant interventions annually.
2) Implementation and follow through on the NMT-derived key recommendations. 3) Tracking improvement of the NMT metric domains for adult consumers to inform whether the NMT
approach can improve outcomes and recovery for adult consumers. 4) Ensure fidelity to the NMT model, as required by the CTA for continued certification.
1 Center for Substance Abuse Treatment (US). Trauma-Informed Care in Behavioral Health Services. Rockville (MD): Substance Abuse and Mental Health Services Administration (US); 2014. (Treatment Improvement Protocol (TIP) Series, No. 57.) Chapter 3, Understanding the Impact of Trauma. 2 Perry, B.D. & Dobson, C. (2013) The Neurosequential Model (NMT) in maltreated children. In (J. Ford & C. Courtois, Eds) Treating Complex Traumatic Stress Disorders in Children and Adolescents, pp 249-260. Guilford Press, New York 3 Gardner, J. (2016). Sensory Modulation Treatment on a Psychiatric Inpatient Unit. Journal of Psychosocial Nursing and Mental Health Services,54(4), 44-51.

Target Population – Adult consumers receiving longer-term or residentially-based services will be selected to bring the NMT model into their current clinical treatment. Potential BHRS adult consumers present the following demographics:
Ethnicity: Race: Languages spoken: 19% Hispanic/Latino
The Innovation – MHSA Innovative Project Category: Makes a change to an existing mental health practice that has not yet been demonstrated to be effective. MHSA Primary Purpose: Increase quality of mental health services, including measurable outcomes.
NMT has been integrated into a variety of settings serving infants through young adults. Yet, there is no outcome research for NMT conducted in an adult setting or population and it has not been implemented anywhere in a formal and intentional manner for an Adult System of Care. Expansion and evaluation to the adult system of care would be the first of its kind. The Child Trauma Academy (CTA) and its creator, Dr. Perry, are very supportive and will collaborate on the adaptation, implementation and evaluation.
Evaluation – Learning Goal #1: Can NMT, a neurobiology and trauma-informed approach, be adapted in a way that leads to better outcomes in recovery for BHRS adult consumers?
• A decrease in psychiatric hospitalizations.4 • A minimum of 80% of consumers will agree that the NMT model was helpful in their recovery goals.
Learning Goal #2: Are alternative therapeutic and treatment options, focused on changing the brain organization and functioning, effective in adult consumers’ recovery?
• At least 60% of adult NMT consumers will show improvement in each of four NMT functional domains: Sensory Integration, Self-Regulation, Relational, and Cognitive.
1. All providers and consumers receiving NMT approach will participate in the evaluation plan. 2. Data will be aggregated from individual metric assessments, pre/post health questionnaires and
encounter data are all possible methods to be included. 3. The NMT “mapping process” provides scores in four functional domains (Sensory Integration, Self-
regulation, Relational, and Cognitive) and rescored as a follow up or post assessment.
BHRS will manage the project, coordinate with CTA to adapt and administer the training, and ensure proper data collection. A Request for Proposal process will be conducted to select a qualified evaluator. Data cleaning, analysis and reporting will be conducted by a contract evaluator. The evaluation plan will include meaningful and diverse stakeholder participation through the MHSA Steering Committee, which is made up of diverse stakeholders and cultural groups and is open to the public. The MHSA Steering Committee will also be the primary venue for vetting next steps and decisions related to continuation of the project.
4 Substance Abuse and Mental Health Services Administration. The Business Case for Preventing and Reducing Restraint and Seclusion Use. HHS Publication No. (SMA) 11-4632. Rockville, MD: Substance Abuse and Mental Health Services Administration, 2011.
MHSA INN Project Brief – NMT adults, July 2016 / Page 2 of 5
ASL, 0.1%
English 84%
Chinese (Cantonese Mandarin)
1%
Other 2%
Spanish 12%
Tagalog 1%
Amer Ind or Alaska
Native 2%
African American
8% Chinese
6%
Filipino 13%
Other Asian
2%
Other Pacific
Islander 1%
Unknown Not
Reported 19%
White or Caucasian
38%
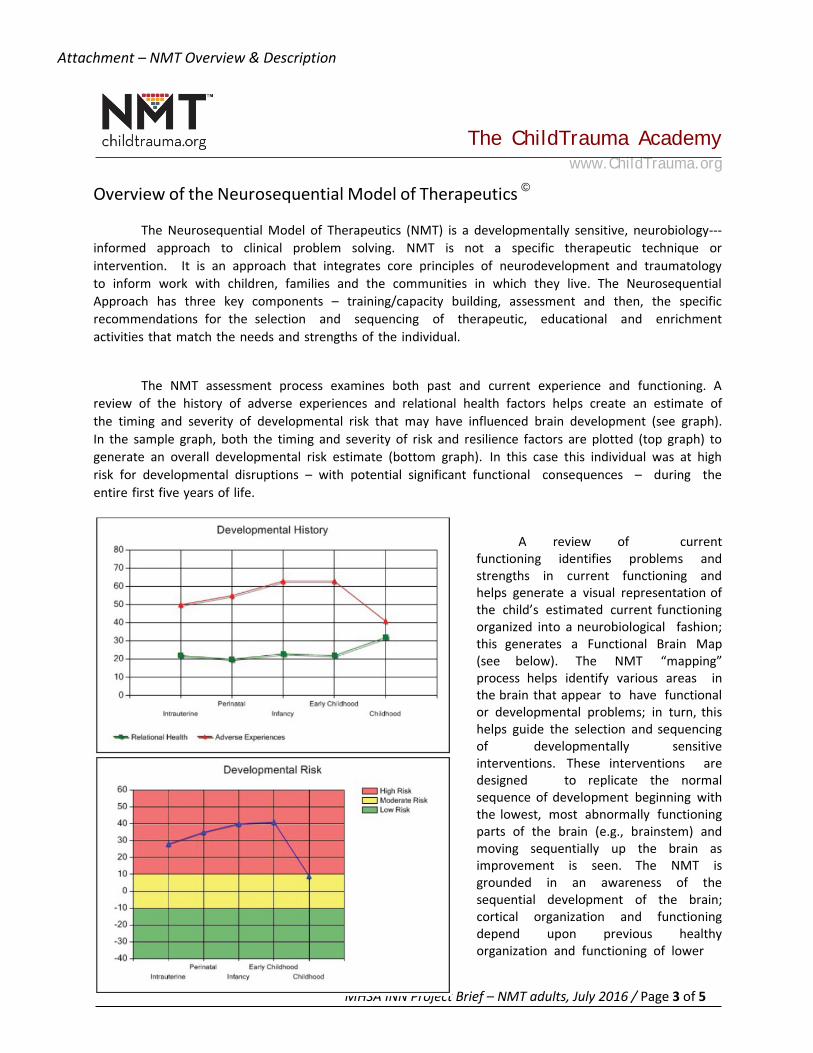
Attachment – NMT Overview & Description
The ChildTrauma Academy www.ChildTrauma.org
Overview of the Neurosequential Model of Therapeutics ©
The Neurosequential Model of Therapeutics (NMT) is a developmentally sensitive, neurobiology--- informed approach to clinical problem solving. NMT is not a specific therapeutic technique or intervention. It is an approach that integrates core principles of neurodevelopment and traumatology to inform work with children, families and the communities in which they live. The Neurosequential Approach has three key components – training/capacity building, assessment and then, the specific recommendations for the selection and sequencing of therapeutic, educational and enrichment activities that match the needs and strengths of the individual.
The NMT assessment process examines both past and current experience and functioning. A review of the history of adverse experiences and relational health factors helps create an estimate of the timing and severity of developmental risk that may have influenced brain development (see graph). In the sample graph, both the timing and severity of risk and resilience factors are plotted (top graph) to generate an overall developmental risk estimate (bottom graph). In this case this individual was at high risk for developmental disruptions – with potential significant functional consequences – during the entire first five years of life.
A review of current functioning identifies problems and strengths in current functioning and helps generate a visual representation of the child’s estimated current functioning organized into a neurobiological fashion; this generates a Functional Brain Map (see below). The NMT “mapping” process helps identify various areas in the brain that appear to have functional or developmental problems; in turn, this helps guide the selection and sequencing of developmentally sensitive interventions. These interventions are designed to replicate the normal sequence of development beginning with the lowest, most abnormally functioning parts of the brain (e.g., brainstem) and moving sequentially up the brain as improvement is seen. The NMT is grounded in an awareness of the sequential development of the brain; cortical organization and functioning depend upon previous healthy organization and functioning of lower
MHSA INN Project Brief – NMT adults, July 2016 / Page 3 of 5
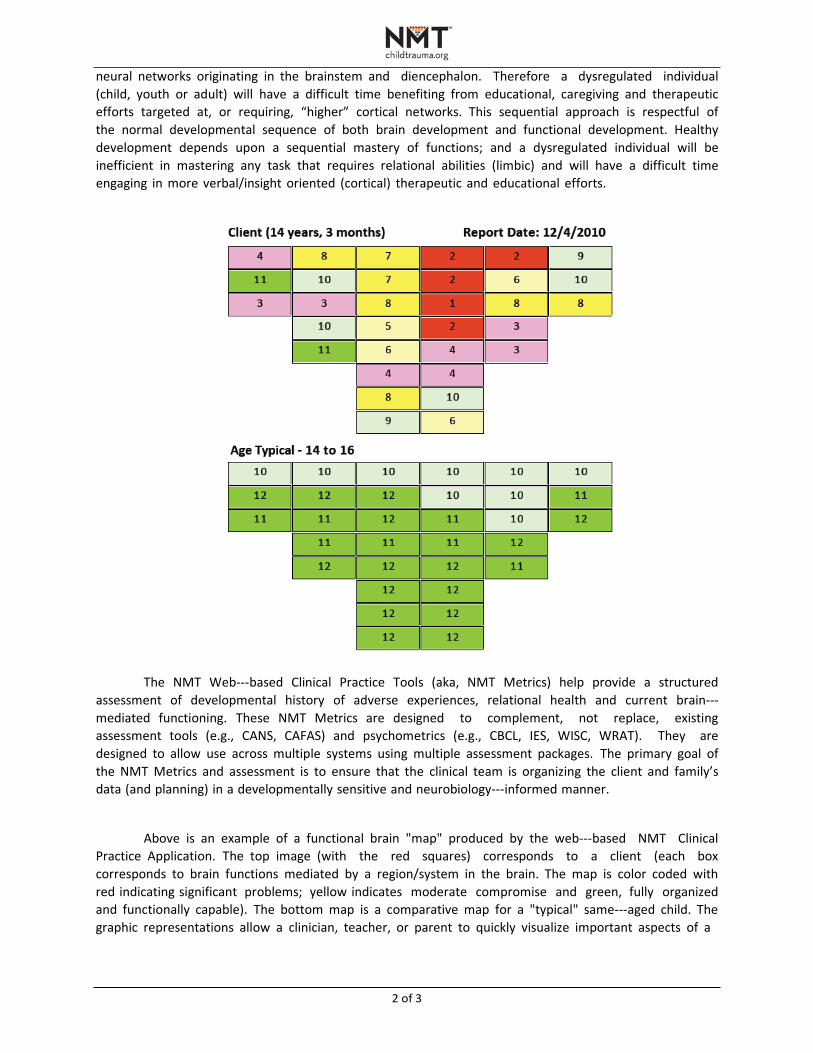
2 of 3
neural networks originating in the brainstem and diencephalon. Therefore a dysregulated individual (child, youth or adult) will have a difficult time benefiting from educational, caregiving and therapeutic efforts targeted at, or requiring, “higher” cortical networks. This sequential approach is respectful of the normal developmental sequence of both brain development and functional development. Healthy development depends upon a sequential mastery of functions; and a dysregulated individual will be inefficient in mastering any task that requires relational abilities (limbic) and will have a difficult time engaging in more verbal/insight oriented (cortical) therapeutic and educational efforts.
The NMT Web---based Clinical Practice Tools (aka, NMT Metrics) help provide a structured assessment of developmental history of adverse experiences, relational health and current brain--- mediated functioning. These NMT Metrics are designed to complement, not replace, existing assessment tools (e.g., CANS, CAFAS) and psychometrics (e.g., CBCL, IES, WISC, WRAT). They are designed to allow use across multiple systems using multiple assessment packages. The primary goal of the NMT Metrics and assessment is to ensure that the clinical team is organizing the client and family’s data (and planning) in a developmentally sensitive and neurobiology---informed manner.
Above is an example of a functional brain "map" produced by the web---based NMT Clinical Practice Application. The top image (with the red squares) corresponds to a client (each box corresponds to brain functions mediated by a region/system in the brain. The map is color coded with red indicating significant problems; yellow indicates moderate compromise and green, fully organized and functionally capable). The bottom map is a comparative map for a "typical" same---aged child. The graphic representations allow a clinician, teacher, or parent to quickly visualize important aspects of a
3 of 3
child's history and current status. The information is key in designing developmentally appropriate educational, enrichment and therapeutic experiences to help the child.
This clinical approach helps professionals determine the strengths and vulnerabilities of the child and create an individualized intervention, enrichment and educational plan matched to his/her unique needs. The goal is to find a set of therapeutic activities that meet the child’s current needs in various domains of functioning (i.e., social, emotional, cognitive and physical). An individual demonstrating significant problems in brainstem and diencephalic functions may end up with recommended activities that include music, dance, yoga, drumming, various sports, therapeutic massage to more traditional play therapy, sand tray or other art therapies. Later in the treatment process, after improved brainstem and diencephalic functioning, the treatment recommendations would shift to more insight oriented--- and cognitive---mental interventions such as PCIT or TF---CBT.
The NMT training and capacity building component incorporates didactic teaching with web--- based sessions using on clinical cases presented by participating clinicians. It also incorporates multimedia and reading materials that focus on child development, neurobiology, traumatology, attachment theory and a host of related areas relevant to understanding the impact of maltreatment and other developmental insults on the developing child. The CTA has developed an NMT training certification process for individual clinicians and organizations. This training process provides the necessary exposure to the core concepts, practical application and use of the web---based NMT Metrics to establish and maintain fidelity required for examining clinical outcomes and conducting research using the NMT Metrics as part of the evaluation package. Certified clinicians from across the world demonstrate high fidelity and inter---rater reliability when “evaluating” and scoring the same client data.
The NMT is widely applicable to a variety of clinical and educational environments and has been integrated into a variety of settings across the full life cycle – infants through adults --- including therapeutic preschools, early head start programs, infant mental health, ECI programs, residential treatment centers, and in numerous private and outpatient clinical practices working with young children, youth and adults. Several large public child protective services and child mental health settings have become certified and routinely use the NMT.
Selected references
Perry, B.D. The Neurosequential Model of Therapeutics: Applying principles of neuroscience to clinical work with traumatized and maltreated children In: Working with Traumatized Youth in Child Welfare (Nancy Boyd Webb, Ed.), The Guilford Press, New York, NY, pp. 27---52, 2006 Perry, B.D. Child maltreatment: the role of abuse and neglect in developmental psychopathology in Textbook of Child and Adolescent Psychopathology in (Theodore P. Beauchaine & Stephen P. Hinshaw, Eds) pp. 93---128 Wiley, New York 2008 Perry, B.D. Examining child maltreatment through a neurodevelopmental lens: clinical application of the Neurosequential Model of Therapeutics. Journal of Loss and Trauma 14: 240---255, 2009 Ludy---Dobson, C. & Perry, B.D. The role of healthy relational interactions in buffering the impact of childhood trauma in Working with Children to Heal Interpersonal Trauma in (Eliana Gil, Ed.) pp 26---44 The Guilford Press, New York, 2010
Barfield, S., Gaskill, R., Dobson, C. & Perry, B.D. Neurosequential Model of Therapeutics© in a Therapeutic Preschool: Implications for Work with Children with Complex Neuropsychiatric Problems. International Journal of Play Therapy Online First Publication, October 31, 2011. Doi:10.1037/a0025955
For more information visit The ChildTrauma Academy website: www.ChildTrauma.org
A P P E N D I X 5 – F U L L S E R V I C E P A R T N E R S H I P ( F S P )
O U T C O M E R E P O R T
MAY 2016
Full Service Partnership (FSP) Outcomes Findings from 2015
Elizabeth Mokyr Horner, PhD, MPP Grace Wang, PhD, MPH Wendy Lee, MPH
Full Service Partnership (FSP) Outcomes Findings from 2015
May 2016 Elizabeth Mokyr Horner, PhD, MPP Grace Wang, PhD, MPH Wendy Lee, MPH
2800 Campus Drive, Suite 200 San Mateo, CA 94403
www.air.org
Copyright © 2016 American Institutes for Research. All rights reserved.
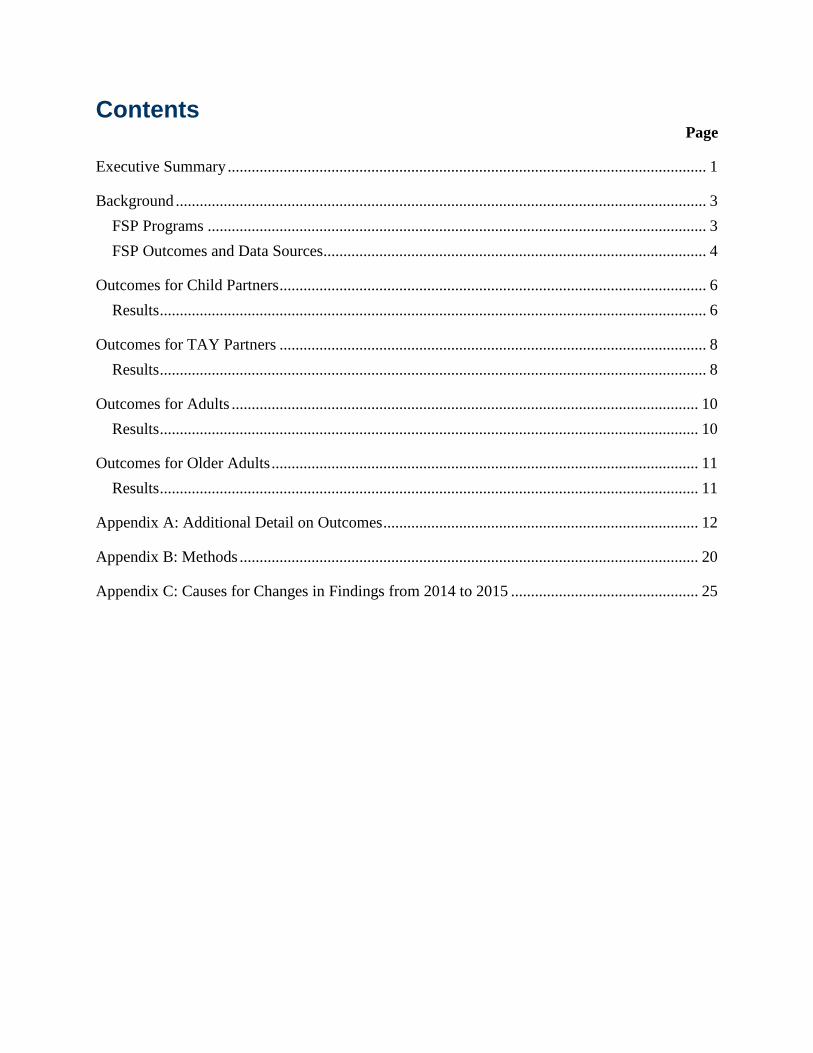
Contents Page
Executive Summary ........................................................................................................................ 1
Background ..................................................................................................................................... 3
FSP Programs ............................................................................................................................. 3
FSP Outcomes and Data Sources................................................................................................ 4
Outcomes for Child Partners ........................................................................................................... 6
Results ......................................................................................................................................... 6
Outcomes for TAY Partners ........................................................................................................... 8
Results ......................................................................................................................................... 8
Outcomes for Adults ..................................................................................................................... 10
Results ....................................................................................................................................... 10
Outcomes for Older Adults ........................................................................................................... 11
Results ....................................................................................................................................... 11
Appendix A: Additional Detail on Outcomes ............................................................................... 12
Appendix B: Methods ................................................................................................................... 20
Appendix C: Causes for Changes in Findings from 2014 to 2015 ............................................... 25
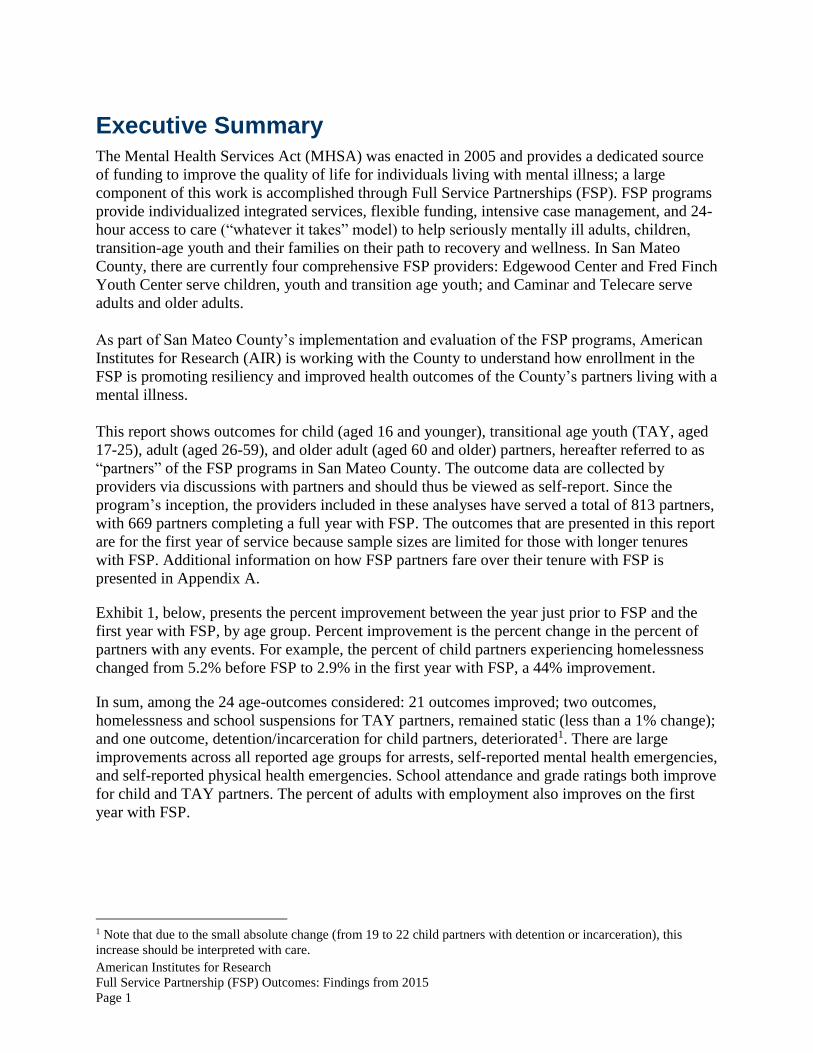
American Institutes for Research
Full Service Partnership (FSP) Outcomes: Findings from 2015
Page 1
Executive Summary The Mental Health Services Act (MHSA) was enacted in 2005 and provides a dedicated source
of funding to improve the quality of life for individuals living with mental illness; a large
component of this work is accomplished through Full Service Partnerships (FSP). FSP programs
provide individualized integrated services, flexible funding, intensive case management, and 24-
hour access to care (“whatever it takes” model) to help seriously mentally ill adults, children,
transition-age youth and their families on their path to recovery and wellness. In San Mateo
County, there are currently four comprehensive FSP providers: Edgewood Center and Fred Finch
Youth Center serve children, youth and transition age youth; and Caminar and Telecare serve
adults and older adults.
As part of San Mateo County’s implementation and evaluation of the FSP programs, American
Institutes for Research (AIR) is working with the County to understand how enrollment in the
FSP is promoting resiliency and improved health outcomes of the County’s partners living with a
mental illness.
This report shows outcomes for child (aged 16 and younger), transitional age youth (TAY, aged
17-25), adult (aged 26-59), and older adult (aged 60 and older) partners, hereafter referred to as
“partners” of the FSP programs in San Mateo County. The outcome data are collected by
providers via discussions with partners and should thus be viewed as self-report. Since the
program’s inception, the providers included in these analyses have served a total of 813 partners,
with 669 partners completing a full year with FSP. The outcomes that are presented in this report
are for the first year of service because sample sizes are limited for those with longer tenures
with FSP. Additional information on how FSP partners fare over their tenure with FSP is
presented in Appendix A.
Exhibit 1, below, presents the percent improvement between the year just prior to FSP and the
first year with FSP, by age group. Percent improvement is the percent change in the percent of
partners with any events. For example, the percent of child partners experiencing homelessness
changed from 5.2% before FSP to 2.9% in the first year with FSP, a 44% improvement.
In sum, among the 24 age-outcomes considered: 21 outcomes improved; two outcomes,
homelessness and school suspensions for TAY partners, remained static (less than a 1% change);
and one outcome, detention/incarceration for child partners, deteriorated1. There are large
improvements across all reported age groups for arrests, self-reported mental health emergencies,
and self-reported physical health emergencies. School attendance and grade ratings both improve
for child and TAY partners. The percent of adults with employment also improves on the first
year with FSP.
1 Note that due to the small absolute change (from 19 to 22 child partners with detention or incarceration), this
increase should be interpreted with care.

American Institutes for Research
Full Service Partnership (FSP) Outcomes: Findings from 2015
Page 2
Exhibit 1: Percent Improvement in Outcomes by Age Group, Year before FSP Compared with First Year with FSP
Self-reported Outcomes* Child
(n = 136)
TAY
(n = 182)
Adult
(n = 298)
Older
Adult
(n = 53)
Homelessness 44% 0% 21% **
Detention or Incarceration (16%) 17% 21% **
Arrests 64% 70% 86% **
Mental Health Emergencies 93% 68% 53% 42%
Physical Health Emergencies 100% 85% 64% 29%
School Suspensions 5% (1%) ** **
Attendance Ratings 41% 76% ** **
Grade Ratings 6% 6% ** **
Employment ** ** 38% ** * With the exception of attendance and grade ratings, the table above indicates the percent change in the percent of
partners with any events, comparing the year just prior to FSP with the first year on FSP. Percent change in
attendance and grade ratings indicates the change in the average rating for the first year on the program as
compared to the year just prior to FSP.
** Not Reported
American Institutes for Research
Full Service Partnership (FSP) Outcomes: Findings from 2015
Page 3
Background The Mental Health Services Act (MHSA) was enacted in 2005 and provides a dedicated source
of funding to improve the quality of life for individuals living with mental illness; a large
component of this work is accomplished through Full Service Partnerships (FSP). FSP programs
provide individualized integrated services, flexible funding, intensive case management, and 24-
hour access to care (“whatever it takes” model) to help seriously mentally ill adults, children,
transition-age youth and their families on their path to recovery and wellness. In San Mateo
County, there are currently four comprehensive FSP providers: Edgewood Center and Fred Finch
Youth Center serve children, youth and transition age youth; and Caminar and Telecare serve
adults and older adults.
Since the program’s inception, the providers included in these analyses have served a total of 813
partners, with 669 partners completing a full year with FSP. Exhibit 2, below, describes the total
number of partners since the program’s inception by age group.
Exhibit 2: Partners by Age Group and Year of Tenure
Cumulative FSP Partners Child TAY Adult Older
Adult
Total
Any FSP Partnership 187 245 321 60 813
Partnership 1 Year + 136 182 298 53 669
Partnership 2 Years + 55 112 279 48 494
Partnership 3 Years + 27 77 253 45 402
Partnership 4 Years + 13 50 217 43 323
Partnership 5 Years + 7 36 198 41 282
The outcomes that are presented in this report are for the first year of service because sample
sizes are limited for those with longer tenures with FSP. Additional information on how FSP
partners fare over their tenure with FSP is presented in Appendix A.
FSP Programs
Within San Mateo County, the initial FSP programs (Edgewood, Fred Finch, and Telecare) have
been fully operational since 2006. A fourth site (Caminar‘s Adult FSP) was added in 2009. This
report includes outcomes for clients (hereafter referred to as “partners”) of the Full Service
Partnership (FSP) program in San Mateo County who were served by Edgewood, Fred Finch,
Caminar, and Telecare. The data used for this report are collected by providers via self-report
from the partners.
Edgewood is the contracted provider for child/youth FSP services within San Mateo County,
running the Short-term Adjunctive Youth and Family Engagement (SAYFE) program. The
program targets seriously emotionally disturbed children/youth that are at-risk of being moved to
a higher level of care (including residential placement, incarceration or hospitalization) and their
families. The Wraparound model is used to emphasize the strengths of consumers and their
families and to actively engage them in the treatment planning process. An afterschool intensive
services component was added in 2010. Edgewood‘s Turning Point program targets transitional-
aged youth between 16 and 25 years of age who have serious emotional disorders and/or serious
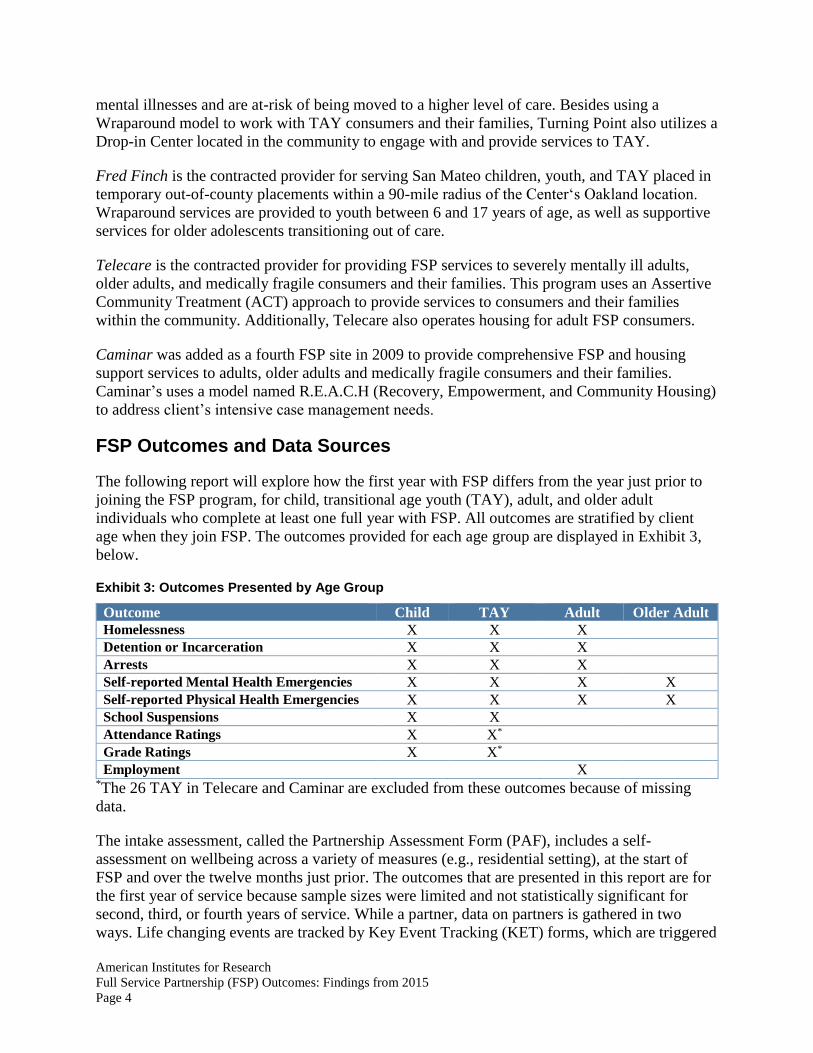
American Institutes for Research
Full Service Partnership (FSP) Outcomes: Findings from 2015
Page 4
mental illnesses and are at-risk of being moved to a higher level of care. Besides using a
Wraparound model to work with TAY consumers and their families, Turning Point also utilizes a
Drop-in Center located in the community to engage with and provide services to TAY.
Fred Finch is the contracted provider for serving San Mateo children, youth, and TAY placed in
temporary out-of-county placements within a 90-mile radius of the Center‘s Oakland location.
Wraparound services are provided to youth between 6 and 17 years of age, as well as supportive
services for older adolescents transitioning out of care.
Telecare is the contracted provider for providing FSP services to severely mentally ill adults,
older adults, and medically fragile consumers and their families. This program uses an Assertive
Community Treatment (ACT) approach to provide services to consumers and their families
within the community. Additionally, Telecare also operates housing for adult FSP consumers.
Caminar was added as a fourth FSP site in 2009 to provide comprehensive FSP and housing
support services to adults, older adults and medically fragile consumers and their families.
Caminar’s uses a model named R.E.A.C.H (Recovery, Empowerment, and Community Housing)
to address client’s intensive case management needs.
FSP Outcomes and Data Sources
The following report will explore how the first year with FSP differs from the year just prior to
joining the FSP program, for child, transitional age youth (TAY), adult, and older adult
individuals who complete at least one full year with FSP. All outcomes are stratified by client
age when they join FSP. The outcomes provided for each age group are displayed in Exhibit 3,
below.
Exhibit 3: Outcomes Presented by Age Group
Outcome Child TAY Adult Older Adult
Homelessness X X X
Detention or Incarceration X X X
Arrests X X X
Self-reported Mental Health Emergencies X X X X
Self-reported Physical Health Emergencies X X X X
School Suspensions X X
Attendance Ratings X X*
Grade Ratings X X*
Employment X *The 26 TAY in Telecare and Caminar are excluded from these outcomes because of missing
data.
The intake assessment, called the Partnership Assessment Form (PAF), includes a self-
assessment on wellbeing across a variety of measures (e.g., residential setting), at the start of
FSP and over the twelve months just prior. The outcomes that are presented in this report are for
the first year of service because sample sizes were limited and not statistically significant for
second, third, or fourth years of service. While a partner, data on partners is gathered in two
ways. Life changing events are tracked by Key Event Tracking (KET) forms, which are triggered
American Institutes for Research
Full Service Partnership (FSP) Outcomes: Findings from 2015
Page 5
by any key event (e.g., a change in residential setting). Partners are also assessed regularly with
Three Month (3M) forms. Changes in partner outcomes are gathered by comparing data on PAF
forms to data compiled from KET and 3M forms. For a summary of data outcomes and their data
sources, please see Exhibit 4 below.
Exhibit 4: Outcomes and Data Sources
Outcome Measured By
Homelessness Residential setting events of homelessness or emergency shelter
(previous year and first setting measured by PAF, ongoing data by KET)
Detention or
Incarceration
Residential setting events of Department of Juvenile Justice, Juvenile
Hall, Jail, or Prison (previous year and first setting measured by PAF,
ongoing data by KET)
Arrests Arrests in past 12 months (PAF) and date arrested (KET)
Self-reported Mental
Health Emergencies Mental health emergencies in past 12 months (PAF) and date of
mental health emergency (KET)
Self-reported Physical
Health Emergencies
Physical health emergencies in past 12 months (PAF) and date of mental
health emergency (KET)
School Suspensions Suspensions in past 12 months (PAF) and date suspended (KET)
Attendance Ratings Ordinal ranking (1-5) indicating overall attendance; measured for
past 12 months (PAF), at start of FSP (PAF), and over time on
FSP (3M)
Grade Ratings Ordinal ranking (1-5) indicating overall grades; measured for past 12
months (PAF), at start of FSP (PAF), and over time on FSP (3M)
Employment Employment in past 12 months (PAF), at start of FSP (PAF), and
date employment change (KET)
Additional information on how FSP partners fare over their tenure with FSP are presented in
Appendix A. In addition, details on our methodology are presented in Appendix B. Finally, some
notes on why findings are different this year as compared to last year are presented in Appendix
C.
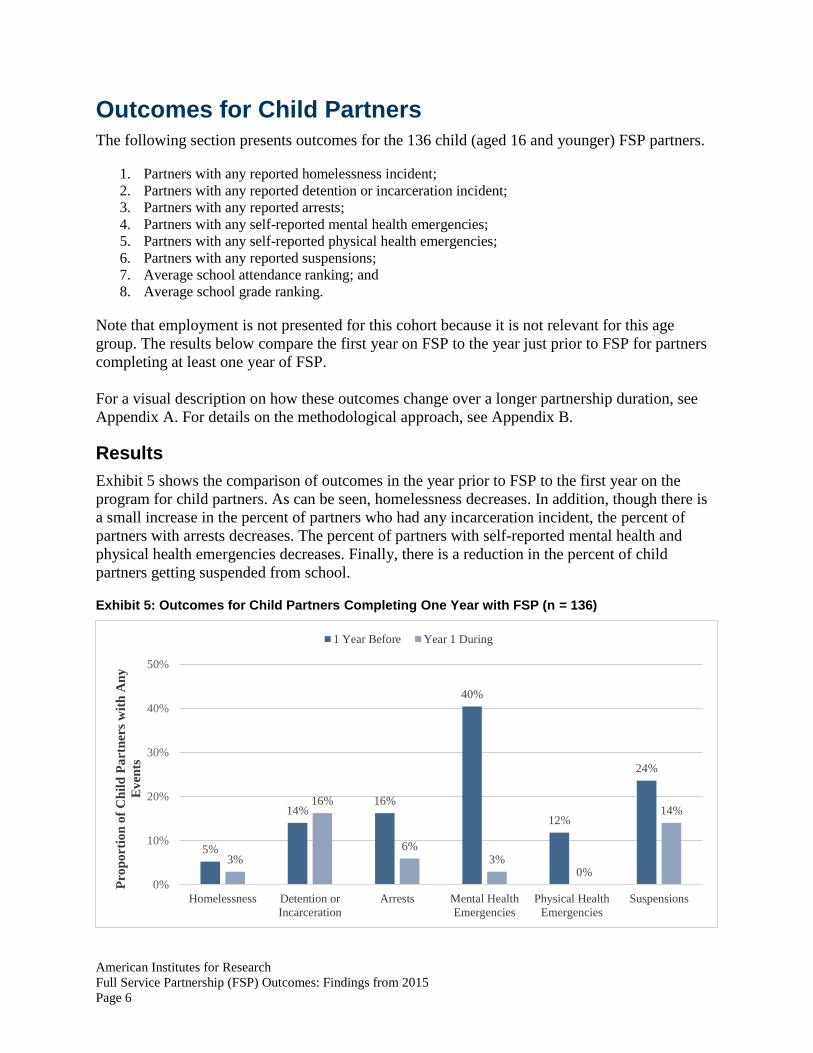
American Institutes for Research
Full Service Partnership (FSP) Outcomes: Findings from 2015
Page 6
Outcomes for Child Partners The following section presents outcomes for the 136 child (aged 16 and younger) FSP partners.
1. Partners with any reported homelessness incident;
2. Partners with any reported detention or incarceration incident;
3. Partners with any reported arrests;
4. Partners with any self-reported mental health emergencies;
5. Partners with any self-reported physical health emergencies;
6. Partners with any reported suspensions;
7. Average school attendance ranking; and
8. Average school grade ranking.
Note that employment is not presented for this cohort because it is not relevant for this age
group. The results below compare the first year on FSP to the year just prior to FSP for partners
completing at least one year of FSP.
For a visual description on how these outcomes change over a longer partnership duration, see
Appendix A. For details on the methodological approach, see Appendix B.
Results Exhibit 5 shows the comparison of outcomes in the year prior to FSP to the first year on the
program for child partners. As can be seen, homelessness decreases. In addition, though there is
a small increase in the percent of partners who had any incarceration incident, the percent of
partners with arrests decreases. The percent of partners with self-reported mental health and
physical health emergencies decreases. Finally, there is a reduction in the percent of child
partners getting suspended from school.
Exhibit 5: Outcomes for Child Partners Completing One Year with FSP (n = 136)
5%
14%16%
40%
12%
24%
3%
16%
6%3%
0%
14%
0%
10%
20%
30%
40%
50%
Homelessness Detention or
Incarceration
Arrests Mental Health
Emergencies
Physical Health
Emergencies
Suspensions
Pro
po
rtio
n o
f C
hil
d P
art
ner
s w
ith
An
y
Ev
ents
1 Year Before Year 1 During
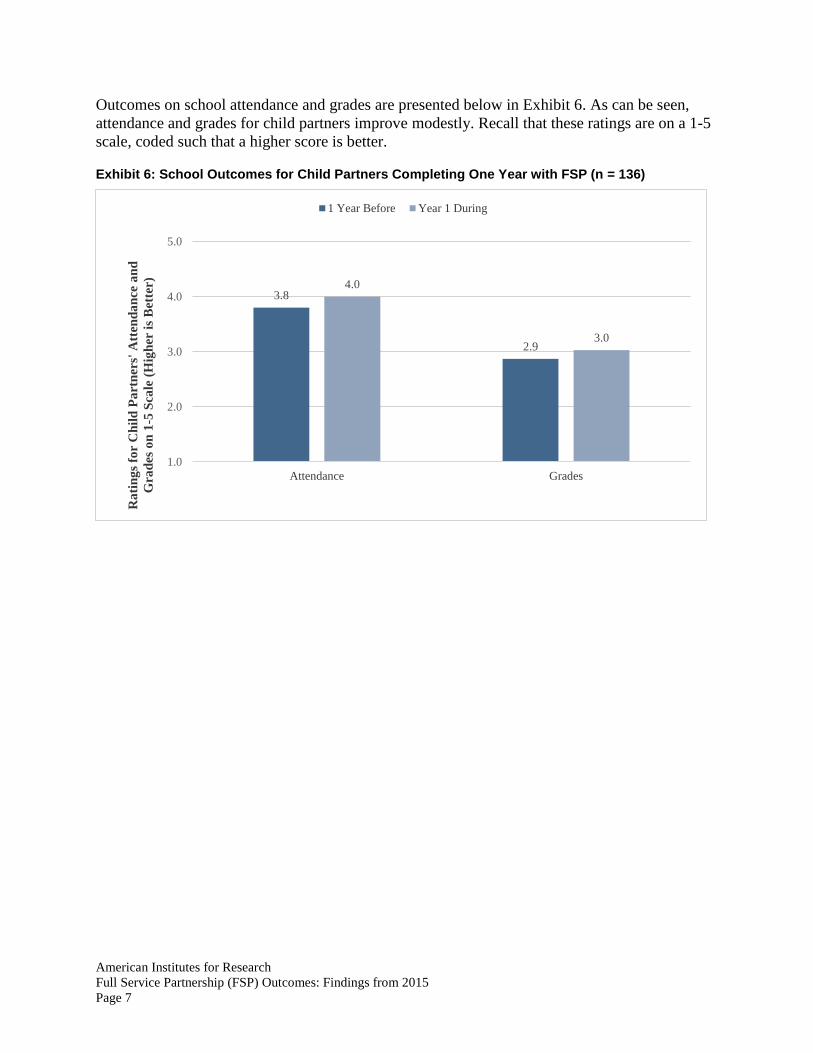
American Institutes for Research
Full Service Partnership (FSP) Outcomes: Findings from 2015
Page 7
Outcomes on school attendance and grades are presented below in Exhibit 6. As can be seen,
attendance and grades for child partners improve modestly. Recall that these ratings are on a 1-5
scale, coded such that a higher score is better.
Exhibit 6: School Outcomes for Child Partners Completing One Year with FSP (n = 136)
3.8
2.9
4.0
3.0
1.0
2.0
3.0
4.0
5.0
Attendance Grades
Ra
tin
gs
for
Ch
ild
Pa
rtn
ers'
Att
end
an
ce a
nd
Gra
des
on
1-5
Sca
le (
Hig
her
is
Bet
ter)
1 Year Before Year 1 During
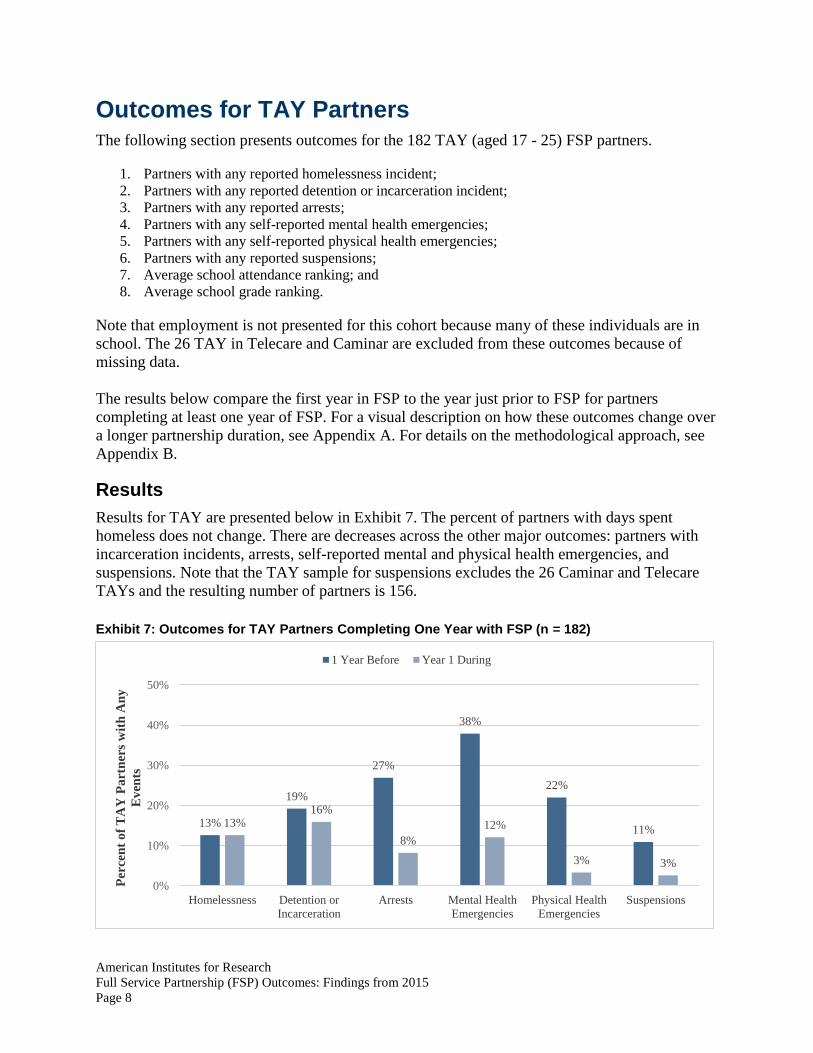
American Institutes for Research
Full Service Partnership (FSP) Outcomes: Findings from 2015
Page 8
Outcomes for TAY Partners The following section presents outcomes for the 182 TAY (aged 17 - 25) FSP partners.
1. Partners with any reported homelessness incident;
2. Partners with any reported detention or incarceration incident;
3. Partners with any reported arrests;
4. Partners with any self-reported mental health emergencies;
5. Partners with any self-reported physical health emergencies;
6. Partners with any reported suspensions;
7. Average school attendance ranking; and
8. Average school grade ranking.
Note that employment is not presented for this cohort because many of these individuals are in
school. The 26 TAY in Telecare and Caminar are excluded from these outcomes because of
missing data.
The results below compare the first year in FSP to the year just prior to FSP for partners
completing at least one year of FSP. For a visual description on how these outcomes change over
a longer partnership duration, see Appendix A. For details on the methodological approach, see
Appendix B.
Results Results for TAY are presented below in Exhibit 7. The percent of partners with days spent
homeless does not change. There are decreases across the other major outcomes: partners with
incarceration incidents, arrests, self-reported mental and physical health emergencies, and
suspensions. Note that the TAY sample for suspensions excludes the 26 Caminar and Telecare
TAYs and the resulting number of partners is 156.
Exhibit 7: Outcomes for TAY Partners Completing One Year with FSP (n = 182)
13%
19%
27%
38%
22%
11%13%
16%
8%
12%
3% 3%
0%
10%
20%
30%
40%
50%
Homelessness Detention or
Incarceration
Arrests Mental Health
Emergencies
Physical Health
Emergencies
Suspensions
Per
cen
t o
f T
AY
Pa
rtn
ers
wit
h A
ny
Ev
ents
1 Year Before Year 1 During
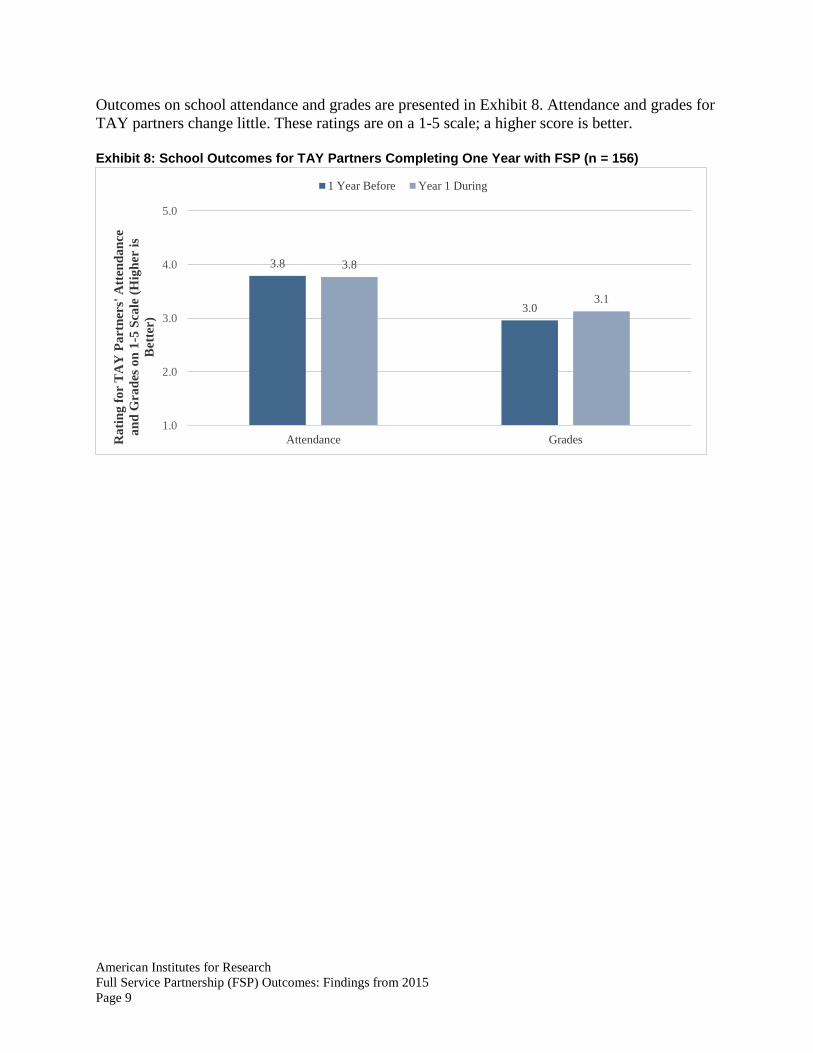
American Institutes for Research
Full Service Partnership (FSP) Outcomes: Findings from 2015
Page 9
Outcomes on school attendance and grades are presented in Exhibit 8. Attendance and grades for
TAY partners change little. These ratings are on a 1-5 scale; a higher score is better.
Exhibit 8: School Outcomes for TAY Partners Completing One Year with FSP (n = 156)
3.8
3.0
3.8
3.1
1.0
2.0
3.0
4.0
5.0
Attendance GradesRa
tin
g f
or
TA
Y P
art
ner
s' A
tten
da
nce
an
d G
rad
es o
n 1
-5 S
cale
(H
igh
er i
s
Bet
ter)
1 Year Before Year 1 During
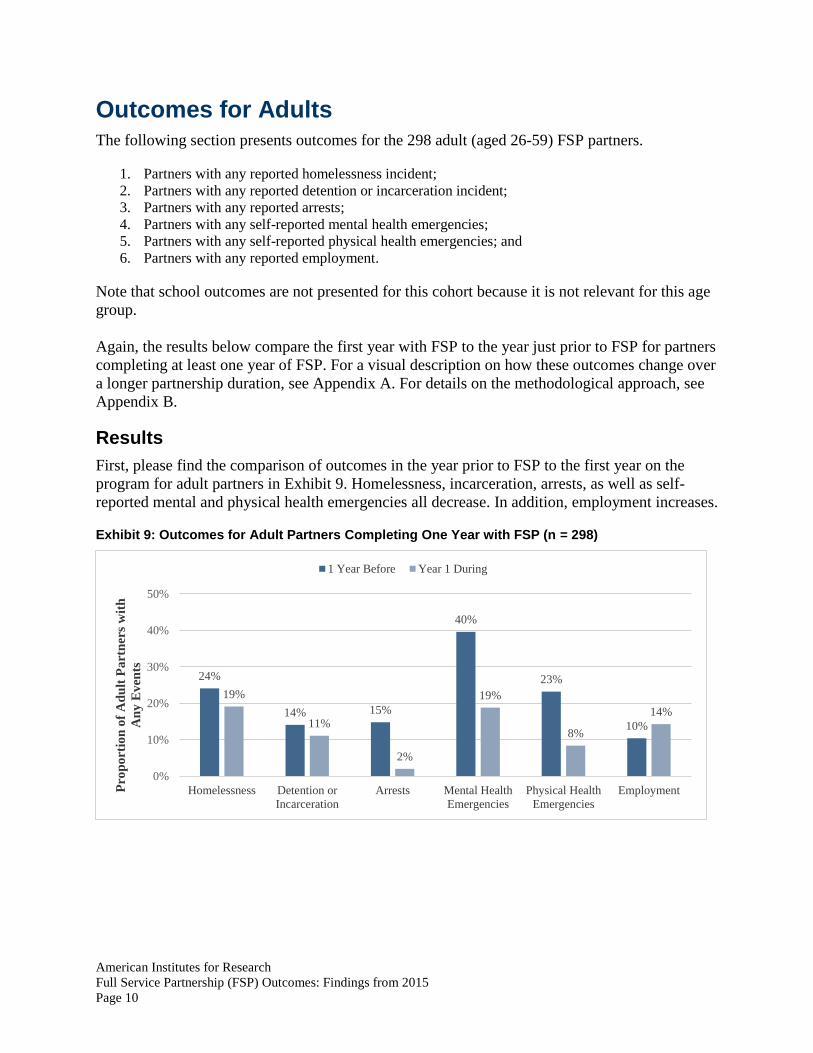
American Institutes for Research
Full Service Partnership (FSP) Outcomes: Findings from 2015
Page 10
Outcomes for Adults The following section presents outcomes for the 298 adult (aged 26-59) FSP partners.
1. Partners with any reported homelessness incident;
2. Partners with any reported detention or incarceration incident;
3. Partners with any reported arrests;
4. Partners with any self-reported mental health emergencies;
5. Partners with any self-reported physical health emergencies; and
6. Partners with any reported employment.
Note that school outcomes are not presented for this cohort because it is not relevant for this age
group.
Again, the results below compare the first year with FSP to the year just prior to FSP for partners
completing at least one year of FSP. For a visual description on how these outcomes change over
a longer partnership duration, see Appendix A. For details on the methodological approach, see
Appendix B.
Results First, please find the comparison of outcomes in the year prior to FSP to the first year on the
program for adult partners in Exhibit 9. Homelessness, incarceration, arrests, as well as self-
reported mental and physical health emergencies all decrease. In addition, employment increases.
Exhibit 9: Outcomes for Adult Partners Completing One Year with FSP (n = 298)
24%
14% 15%
40%
23%
10%
19%
11%
2%
19%
8%
14%
0%
10%
20%
30%
40%
50%
Homelessness Detention or
Incarceration
Arrests Mental Health
Emergencies
Physical Health
Emergencies
EmploymentPro
po
rtio
n o
f A
du
lt P
art
ner
s w
ith
An
y E
ven
ts
1 Year Before Year 1 During

American Institutes for Research
Full Service Partnership (FSP) Outcomes: Findings from 2015
Page 11
Outcomes for Older Adults The following section presents outcomes for the 53 adult (aged 60 and older) FSP partners.
1. Partners with any reported mental health emergencies; and
2. Partners with any reported physical health emergencies.
Note that school outcomes are not presented for this cohort because it is not relevant for this age
group. In addition, employment, homelessness, incarceration, and arrest outcomes are not
presented for older adults, as there are insufficient observations in this age group for meaningful
interpretation (i.e., there are less than 5 older adult partners total with any of these events).
Results Next, below in Exhibit 10, please find the comparison of outcomes in the year prior to FSP to the
first year on the program for older adult partners. Similar to adult partners, self-reported mental
and physical health emergencies also decrease.
Exhibit 10: Outcomes for Older Adult Partners Completing One Year with FSP (n = 53)
23%
32%
13%
23%
0%
10%
20%
30%
40%
50%
Mental Health Emergencies Physical Health Emergencies
Per
cen
t o
f O
lder
Ad
ult
Pa
rtn
ers
wit
h
An
y E
ven
ts
1 Year Before Year 1 During
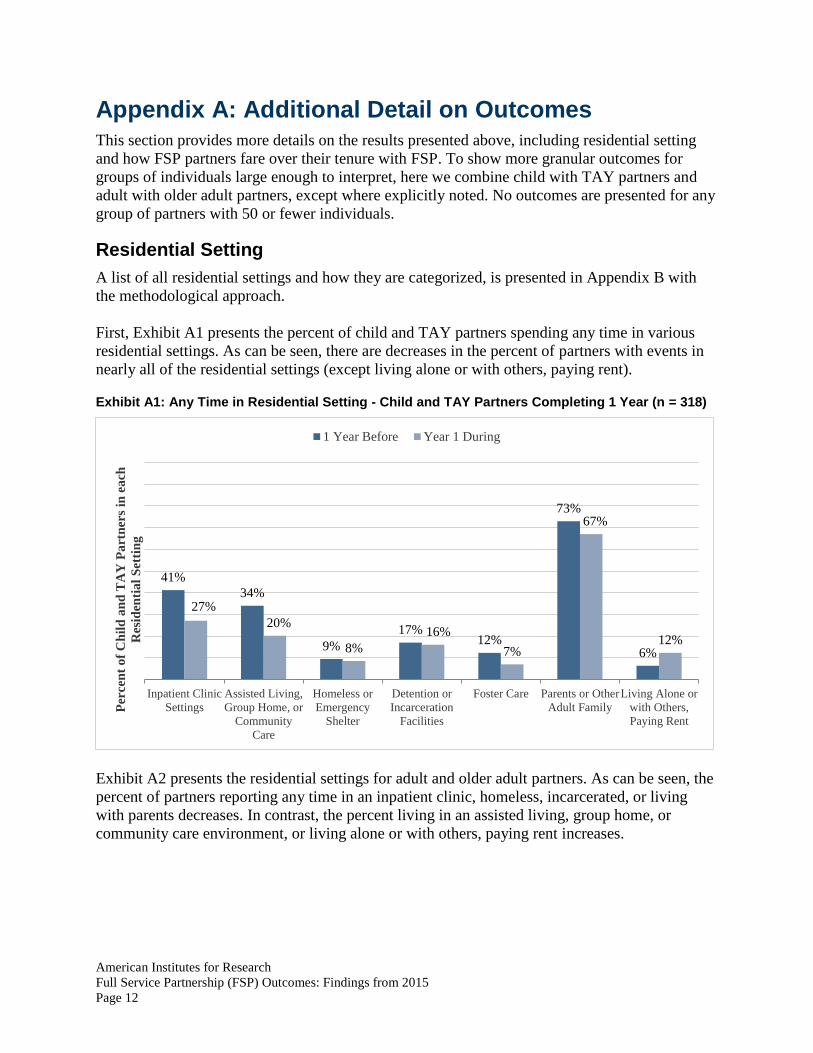
American Institutes for Research
Full Service Partnership (FSP) Outcomes: Findings from 2015
Page 12
Appendix A: Additional Detail on Outcomes This section provides more details on the results presented above, including residential setting
and how FSP partners fare over their tenure with FSP. To show more granular outcomes for
groups of individuals large enough to interpret, here we combine child with TAY partners and
adult with older adult partners, except where explicitly noted. No outcomes are presented for any
group of partners with 50 or fewer individuals.
Residential Setting A list of all residential settings and how they are categorized, is presented in Appendix B with
the methodological approach.
First, Exhibit A1 presents the percent of child and TAY partners spending any time in various
residential settings. As can be seen, there are decreases in the percent of partners with events in
nearly all of the residential settings (except living alone or with others, paying rent).
Exhibit A1: Any Time in Residential Setting - Child and TAY Partners Completing 1 Year (n = 318)
Exhibit A2 presents the residential settings for adult and older adult partners. As can be seen, the
percent of partners reporting any time in an inpatient clinic, homeless, incarcerated, or living
with parents decreases. In contrast, the percent living in an assisted living, group home, or
community care environment, or living alone or with others, paying rent increases.
41%
34%
9%
17%12%
73%
6%
27%
20%
8%
16%
7%
67%
12%
Inpatient Clinic
Settings
Assisted Living,
Group Home, or
Community
Care
Homeless or
Emergency
Shelter
Detention or
Incarceration
Facilities
Foster Care Parents or Other
Adult Family
Living Alone or
with Others,
Paying Rent
Per
cen
t o
f C
hil
d a
nd
TA
Y P
art
ner
s in
ea
ch
Res
iden
tia
l S
etti
ng
1 Year Before Year 1 During

American Institutes for Research
Full Service Partnership (FSP) Outcomes: Findings from 2015
Page 13
Exhibit A2: Any Time in Residential Setting – Adult and Older Partners Completing 1 Year (n = 351)
Arrests Exhibit A3 presents the percent of child and TAY partners with any arrests, broken down by
tenure with FSP and year of program. Arrests are more common among child and TAY partners
the year prior to FSP than in the first year. Gains are maintained across additional FSP years.
Exhibit A3: Any Arrests – Child and TAY Partners
61%
42%
21%
13% 12%
36%
58%62%
17%
10% 11%
48%
0%
10%
20%
30%
40%
50%
60%
70%
80%
90%
100%
Inpatient Clinic
Settings
Assisted Living,
Group Home, or
Community
Care
Homeless or
Emergency
Shelter
Detention or
Incarceration
Facilities
Parents or Other
Adult Family
Living Alone or
with Others,
Paying Rent
Per
cen
t o
f A
du
lt a
nd
Old
er A
du
lt P
art
ner
s in
each
Res
iden
tia
l S
etti
ng
1 Year Before Year 1 During
27%
22%21% 21%
24%
7% 8%7%
5%4% 4%5%
1% 2% 2%
0%
10%
20%
30%
Served Any Time
(N = 431)
Completed 1 Year
(N = 318)
Completed 2 Years
(N = 167)
Completed 3 Years
(N = 104)
Completed 4 Years
(N = 63)
Per
cen
t o
f C
hil
d a
nd
TA
Y P
art
ner
s w
ith
An
y A
rres
ts
1 Year Before Year 1 During Year 2 During
Year 3 During Year 4 During
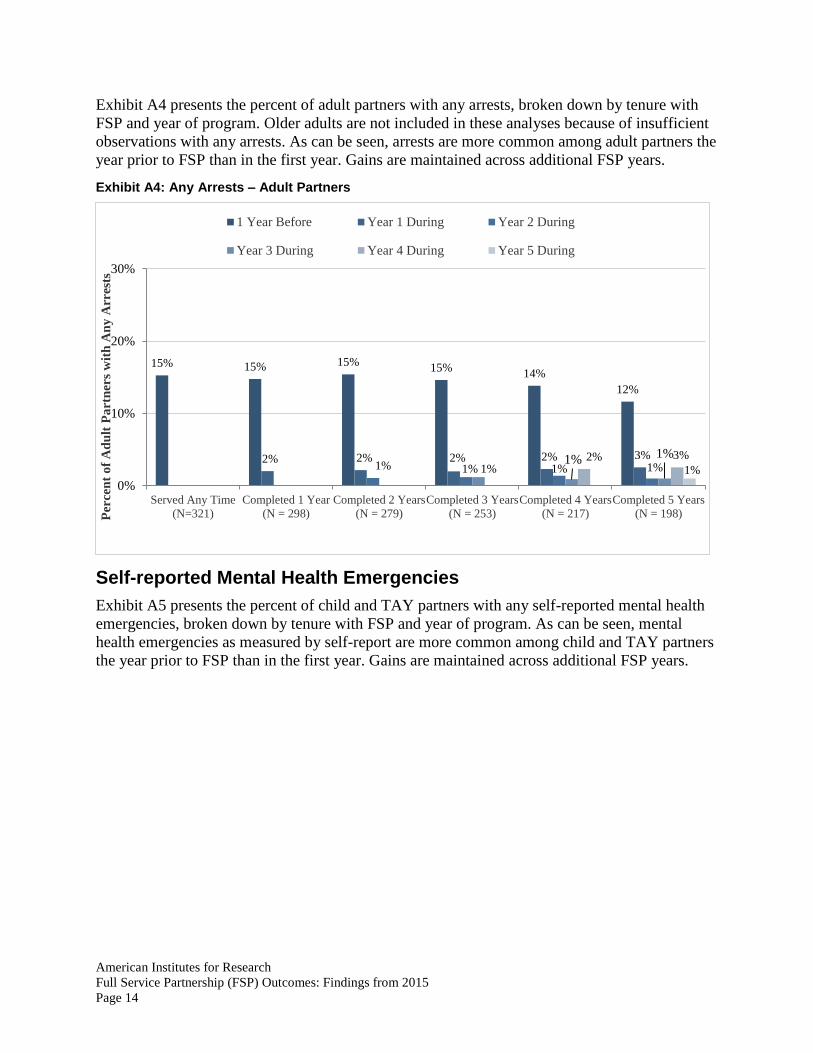
American Institutes for Research
Full Service Partnership (FSP) Outcomes: Findings from 2015
Page 14
Exhibit A4 presents the percent of adult partners with any arrests, broken down by tenure with
FSP and year of program. Older adults are not included in these analyses because of insufficient
observations with any arrests. As can be seen, arrests are more common among adult partners the
year prior to FSP than in the first year. Gains are maintained across additional FSP years.
Exhibit A4: Any Arrests – Adult Partners
Self-reported Mental Health Emergencies Exhibit A5 presents the percent of child and TAY partners with any self-reported mental health
emergencies, broken down by tenure with FSP and year of program. As can be seen, mental
health emergencies as measured by self-report are more common among child and TAY partners
the year prior to FSP than in the first year. Gains are maintained across additional FSP years.
15% 15% 15%15%
14%
12%
2% 2% 2% 2% 3%1% 1% 1% 1%1%
1% 1%2% 3%
1%
0%
10%
20%
30%
Served Any Time
(N=321)
Completed 1 Year
(N = 298)
Completed 2 Years
(N = 279)
Completed 3 Years
(N = 253)
Completed 4 Years
(N = 217)
Completed 5 Years
(N = 198)Per
cen
t o
f A
du
lt P
art
ner
s w
ith
An
y A
rres
ts
1 Year Before Year 1 During Year 2 During
Year 3 During Year 4 During Year 5 During
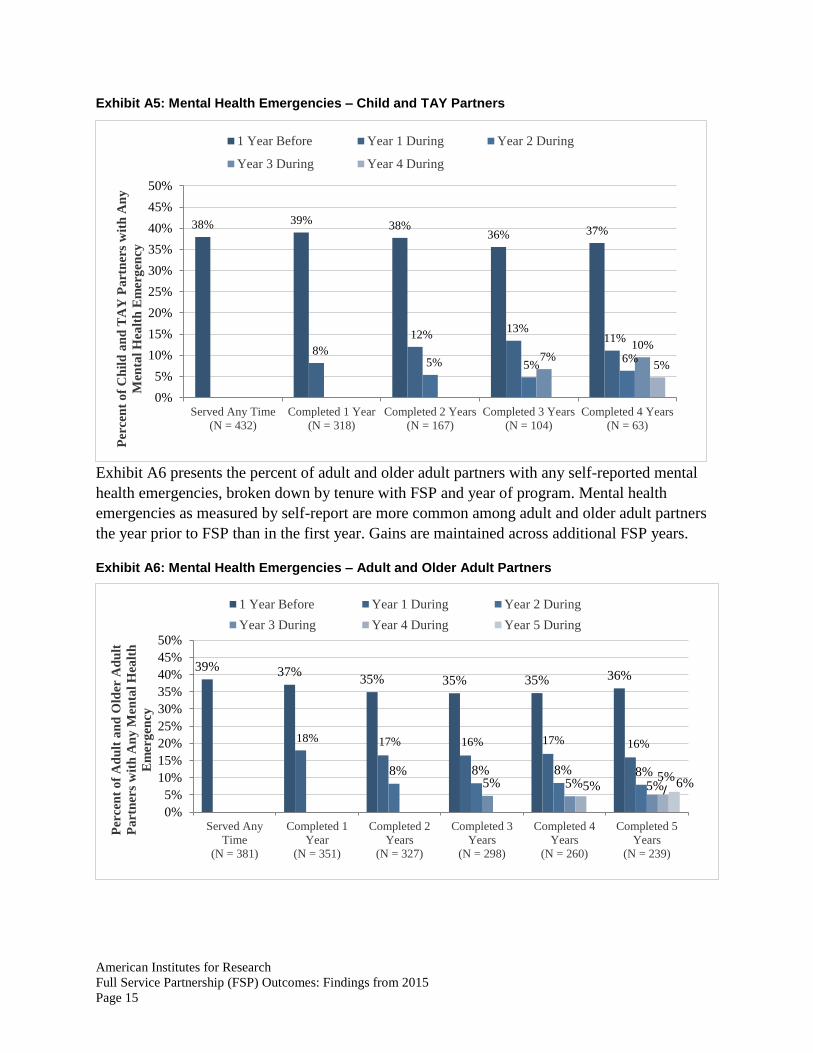
American Institutes for Research
Full Service Partnership (FSP) Outcomes: Findings from 2015
Page 15
Exhibit A5: Mental Health Emergencies – Child and TAY Partners
Exhibit A6 presents the percent of adult and older adult partners with any self-reported mental
health emergencies, broken down by tenure with FSP and year of program. Mental health
emergencies as measured by self-report are more common among adult and older adult partners
the year prior to FSP than in the first year. Gains are maintained across additional FSP years.
Exhibit A6: Mental Health Emergencies – Adult and Older Adult Partners
38% 39% 38%36% 37%
8%
12%13%
11%
5% 5%6%7%
10%
5%
0%
5%
10%
15%
20%
25%
30%
35%
40%
45%
50%
Served Any Time
(N = 432)
Completed 1 Year
(N = 318)
Completed 2 Years
(N = 167)
Completed 3 Years
(N = 104)
Completed 4 Years
(N = 63)
Per
cen
t o
f C
hil
d a
nd
TA
Y P
art
ner
s w
ith
An
y
Men
tal
Hea
lth
Em
erg
ency
1 Year Before Year 1 During Year 2 During
Year 3 During Year 4 During
39% 37%35% 35% 35% 36%
18% 17% 16% 17% 16%
8% 8% 8% 8%5% 5% 5%5%
5%6%
0%
5%
10%
15%
20%
25%
30%
35%
40%
45%
50%
Served Any
Time
(N = 381)
Completed 1
Year
(N = 351)
Completed 2
Years
(N = 327)
Completed 3
Years
(N = 298)
Completed 4
Years
(N = 260)
Completed 5
Years
(N = 239)
Per
cen
t o
f A
du
lt a
nd
Old
er A
du
lt
Pa
rtn
ers
wit
h A
ny
Men
tal
Hea
lth
Em
erg
ency
1 Year Before Year 1 During Year 2 During
Year 3 During Year 4 During Year 5 During

American Institutes for Research
Full Service Partnership (FSP) Outcomes: Findings from 2015
Page 16
Self-reported Physical Health Emergencies Exhibit A7 presents the percent of child and TAY partners with any self-reported physical health
emergencies, broken down by tenure with FSP and year of program. Physical health emergencies
as measured by self-report are more common among child and TAY partners the year prior to
FSP than in the first year. Gains are maintained across additional FSP years.
Exhibit A7: Physical Health Emergencies – Child and TAY Partners
Exhibit A8 presents the percent of adult and older adult partners with any self-reported physical
health emergencies, broken down by tenure with FSP and year of program. Physical health
emergencies as measured by self-report are more common among adult and older adult partners
the year prior to FSP than in the first year. Gains are maintained across additional FSP years.
16% 18% 19%16% 16%
4%2% 2% 3%2%
3%3%
0% 0%
2%
0%
5%
10%
15%
20%
25%
30%
35%
40%
45%
50%
Served Any Time
(N = 432)
Completed 1 Year
(N = 318)
Completed 2 Years
(N = 167)
Completed 3 Years
(N = 104)
Completed 4 Years
(N = 63)Per
cen
t o
f C
hil
d a
nd
TA
Y P
art
ner
s w
ith
An
y P
hy
sica
l H
ealt
h E
mer
gen
cy
1 Year Before Year 1 During Year 2 During
Year 3 During Year 4 During
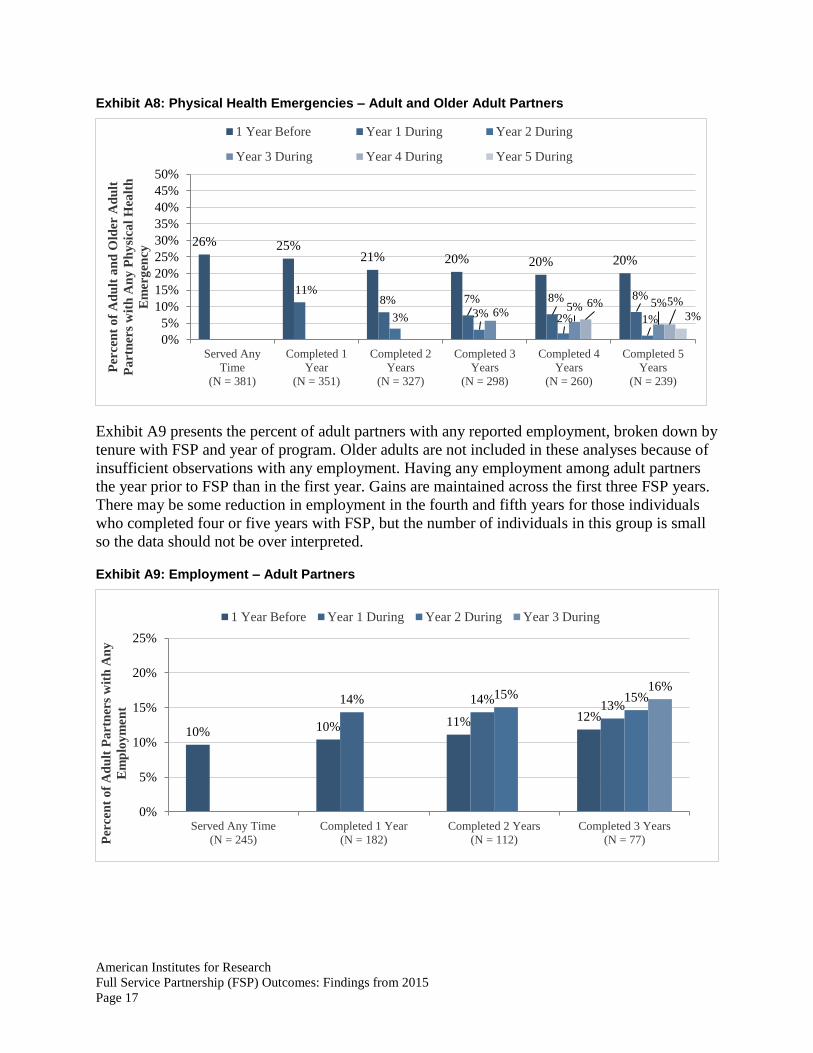
American Institutes for Research
Full Service Partnership (FSP) Outcomes: Findings from 2015
Page 17
Exhibit A8: Physical Health Emergencies – Adult and Older Adult Partners
Exhibit A9 presents the percent of adult partners with any reported employment, broken down by
tenure with FSP and year of program. Older adults are not included in these analyses because of
insufficient observations with any employment. Having any employment among adult partners
the year prior to FSP than in the first year. Gains are maintained across the first three FSP years.
There may be some reduction in employment in the fourth and fifth years for those individuals
who completed four or five years with FSP, but the number of individuals in this group is small
so the data should not be over interpreted.
Exhibit A9: Employment – Adult Partners
26% 25%21% 20% 20% 20%
11%8% 7% 8% 8%
3% 3% 2% 1%6%
5% 5%6% 5%
3%
0%
5%
10%
15%
20%
25%
30%
35%
40%
45%
50%
Served Any
Time
(N = 381)
Completed 1
Year
(N = 351)
Completed 2
Years
(N = 327)
Completed 3
Years
(N = 298)
Completed 4
Years
(N = 260)
Completed 5
Years
(N = 239)
Per
cen
t o
f A
du
lt a
nd
Old
er A
du
lt
Pa
rtn
ers
wit
h A
ny
Ph
ysi
cal
Hea
lth
Em
erg
ency
1 Year Before Year 1 During Year 2 During
Year 3 During Year 4 During Year 5 During
10% 10% 11% 12%
14% 14%13%
15% 15%16%
0%
5%
10%
15%
20%
25%
Served Any Time
(N = 245)
Completed 1 Year
(N = 182)
Completed 2 Years
(N = 112)
Completed 3 Years
(N = 77)Per
cen
t o
f A
du
lt P
art
ner
s w
ith
An
y
Em
plo
ym
en
t
1 Year Before Year 1 During Year 2 During Year 3 During
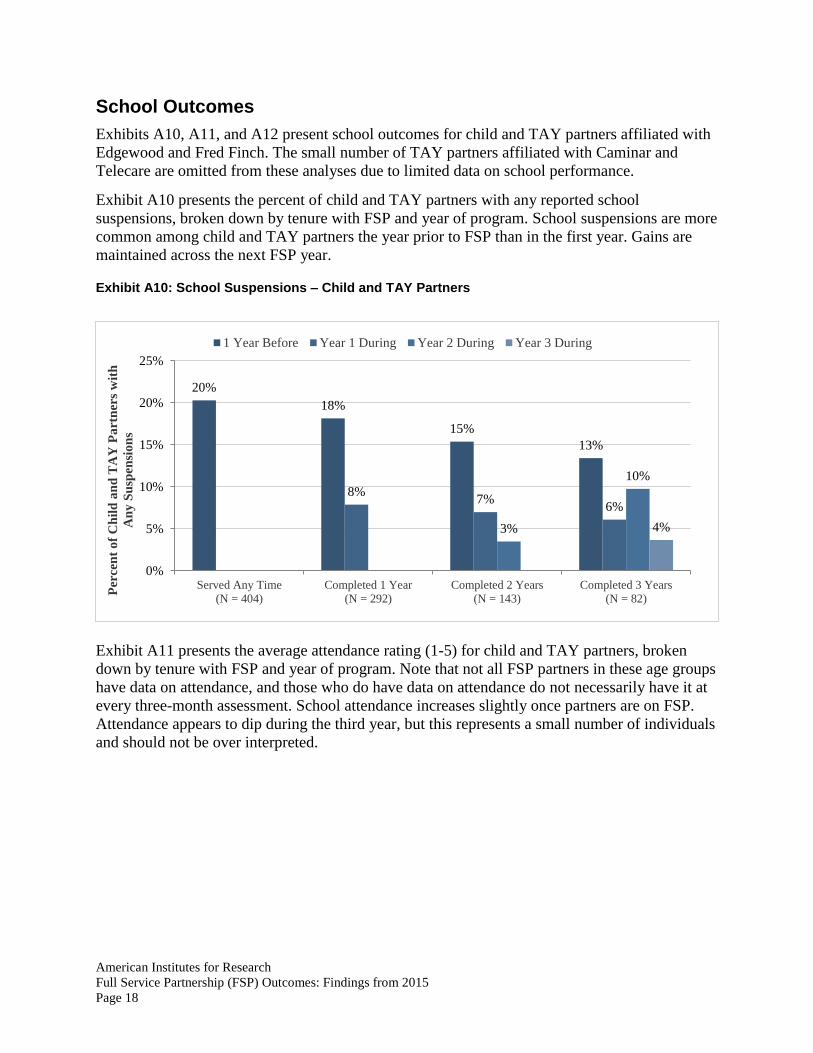
American Institutes for Research
Full Service Partnership (FSP) Outcomes: Findings from 2015
Page 18
School Outcomes Exhibits A10, A11, and A12 present school outcomes for child and TAY partners affiliated with
Edgewood and Fred Finch. The small number of TAY partners affiliated with Caminar and
Telecare are omitted from these analyses due to limited data on school performance.
Exhibit A10 presents the percent of child and TAY partners with any reported school
suspensions, broken down by tenure with FSP and year of program. School suspensions are more
common among child and TAY partners the year prior to FSP than in the first year. Gains are
maintained across the next FSP year.
Exhibit A10: School Suspensions – Child and TAY Partners
Exhibit A11 presents the average attendance rating (1-5) for child and TAY partners, broken
down by tenure with FSP and year of program. Note that not all FSP partners in these age groups
have data on attendance, and those who do have data on attendance do not necessarily have it at
every three-month assessment. School attendance increases slightly once partners are on FSP.
Attendance appears to dip during the third year, but this represents a small number of individuals
and should not be over interpreted.
20%
18%
15%
13%
8%7%
6%
3%
10%
4%
0%
5%
10%
15%
20%
25%
Served Any Time
(N = 404)
Completed 1 Year
(N = 292)
Completed 2 Years
(N = 143)
Completed 3 Years
(N = 82)
Per
cen
t o
f C
hil
d a
nd
TA
Y P
art
ner
s w
ith
An
y S
usp
ensi
on
s
1 Year Before Year 1 During Year 2 During Year 3 During
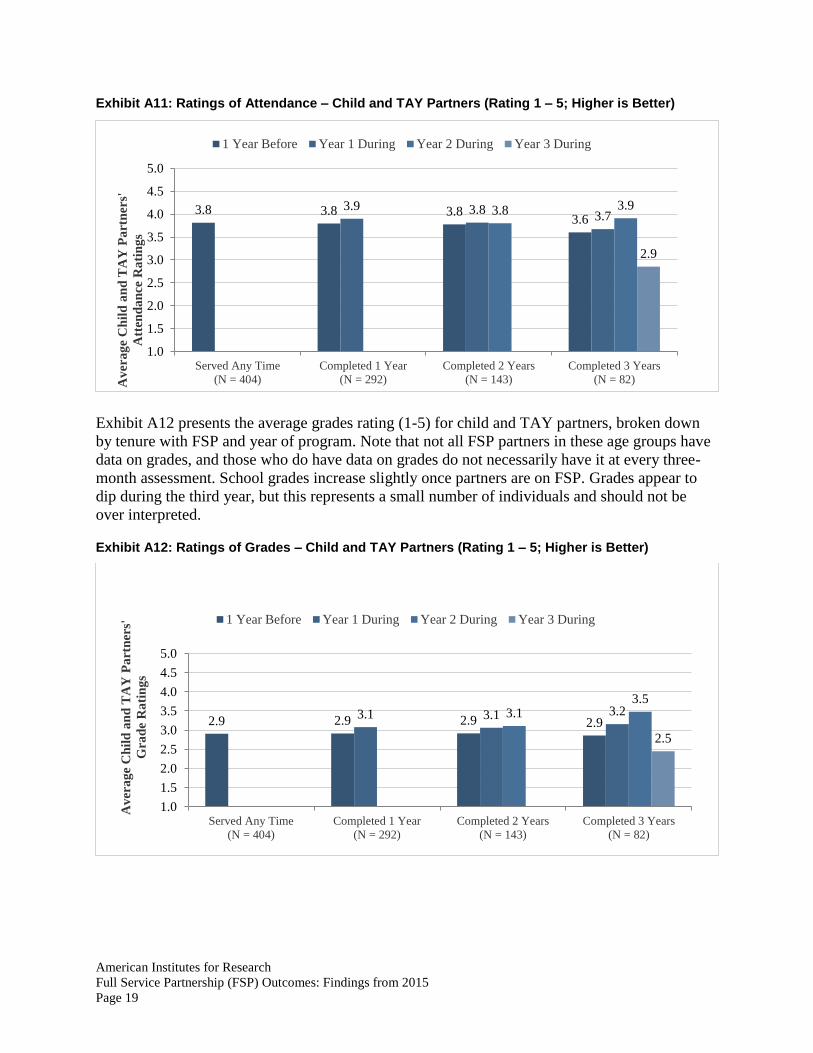
American Institutes for Research
Full Service Partnership (FSP) Outcomes: Findings from 2015
Page 19
Exhibit A11: Ratings of Attendance – Child and TAY Partners (Rating 1 – 5; Higher is Better)
Exhibit A12 presents the average grades rating (1-5) for child and TAY partners, broken down
by tenure with FSP and year of program. Note that not all FSP partners in these age groups have
data on grades, and those who do have data on grades do not necessarily have it at every three-
month assessment. School grades increase slightly once partners are on FSP. Grades appear to
dip during the third year, but this represents a small number of individuals and should not be
over interpreted.
Exhibit A12: Ratings of Grades – Child and TAY Partners (Rating 1 – 5; Higher is Better)
3.8 3.8 3.83.6
3.9 3.83.73.8 3.9
2.9
1.0
1.5
2.0
2.5
3.0
3.5
4.0
4.5
5.0
Served Any Time
(N = 404)
Completed 1 Year
(N = 292)
Completed 2 Years
(N = 143)
Completed 3 Years
(N = 82)Av
era
ge
Ch
ild
an
d T
AY
Pa
rtn
ers'
Att
end
an
ce R
ati
ng
s1 Year Before Year 1 During Year 2 During Year 3 During
2.9 2.9 2.9 2.93.1 3.1 3.23.1
3.5
2.5
1.0
1.5
2.0
2.5
3.0
3.5
4.0
4.5
5.0
Served Any Time
(N = 404)
Completed 1 Year
(N = 292)
Completed 2 Years
(N = 143)
Completed 3 Years
(N = 82)
Av
era
ge
Ch
ild
an
d T
AY
Pa
rtn
ers'
Gra
de
Ra
tin
gs
1 Year Before Year 1 During Year 2 During Year 3 During

American Institutes for Research
Full Service Partnership (FSP) Outcomes: Findings from 2015
Page 20
Appendix B: Methods Three datasets were obtained: one from Caminar, one from Telecare, and one from Edgewood
and Fred Finch. Caminar and Edgewood/Fred Finch were in very similar excel formats, while
Telecare was provided in a raw Access database that included individuals who were not affiliated
with FSP.
For Telecare only, we limited the dataset to FSP partners using the Client Admission data and
the System Agency Program.
Edgewood and Fred Finch data serve child partners and TAY partners. Caminar and Telecare
serve primarily adult and older adult partners, and a small number of older TAY partners.
Exhibit B1 below describes the age group of partners completing at least one full year of FSP by
provider. Note that Edgewood and Fred Finch data are presented together.
Exhibit B1: Summary of Partners (One Full Year of FSP)
Edgewood &
Fred Finch Caminar Telecare Total
Child Partners
(aged 16 and younger) 136 -- -- 136
TAY
(aged 17 – 25) 156 3 23 182
Adult
(aged 26 – 59) -- 43 255 298
Older Adult
(aged 60+) -- 6 47 53
Total 292 52 325 669
A master assessment file with FSP start and end dates and length of FSP tenure was created at
the client level. Note that for partners who stopped and then reestablished their FSPs, we only
kept the record corresponding with their most recent Global ID, as indicated in the State’s
documentation.
Partner type (child, TAY, adult, and older adult) is determined by the PAF data.
For Caminar and Edgewood/Fred Finch, this was done using the variable Age Group.
o Caminar: a value of (7) indicated a TAY partner, a value of (4) indicated an adult partner,
and a value of (10) indicated an older adult partner.
o Edgewood/Fred Finch: a value of (1) indicated a child partner, and a value of (4)
indicated a TAY partner.
o In both cases, this was confirmed using the Age variable.
For Telecare data, partners were given a PAF appropriate for their age; the partner type was
identified by the Form Type variable (TAY_PAF; Adult_PAF; or OA_PAF).
Partnership date and end date were determined as follows: End date was determined by the
reported date of the partnership status change in the KET, if the status is indicated to be

American Institutes for Research
Full Service Partnership (FSP) Outcomes: Findings from 2015
Page 21
“discontinued.” For partners still enrolled as of the data acquisition at the end of the year, we
assigned an end date of December 31, 2015.
All data management and analysis was conducted in Stata. All code is available upon request.
Additional details on the methodology for each outcome are presented below.
Residential Setting 1. Residential settings were grouped into categories as described in the table below (Exhibit
B2).
2. The baseline data was populated using the variable PastTwelveDays collected by the
PAF. Individuals without any reported locations were assigned to the “Don’t Know”
category.
3. First residential status for partners once they join FSP is determined by the Current
variable, collected by the PAF. Individuals without any reported current residence were
assigned to the “Don’t Know” category. Some individuals had more than one Current
location. In this case, if there was one residence with a later value for
DateResidentialChange, this value was considered to be the first residential setting. If the
residences were marked with the same date, both were considered as part of the partner’s
first year on FSP.
4. Additional residential settings for the first year were found using the KET data if the
DateResidentialChange variable is within the first year with FSP as determined by the
partnership date. If no residential data were captured by a KET, it was assumed that the
individual stayed in their original residential setting.
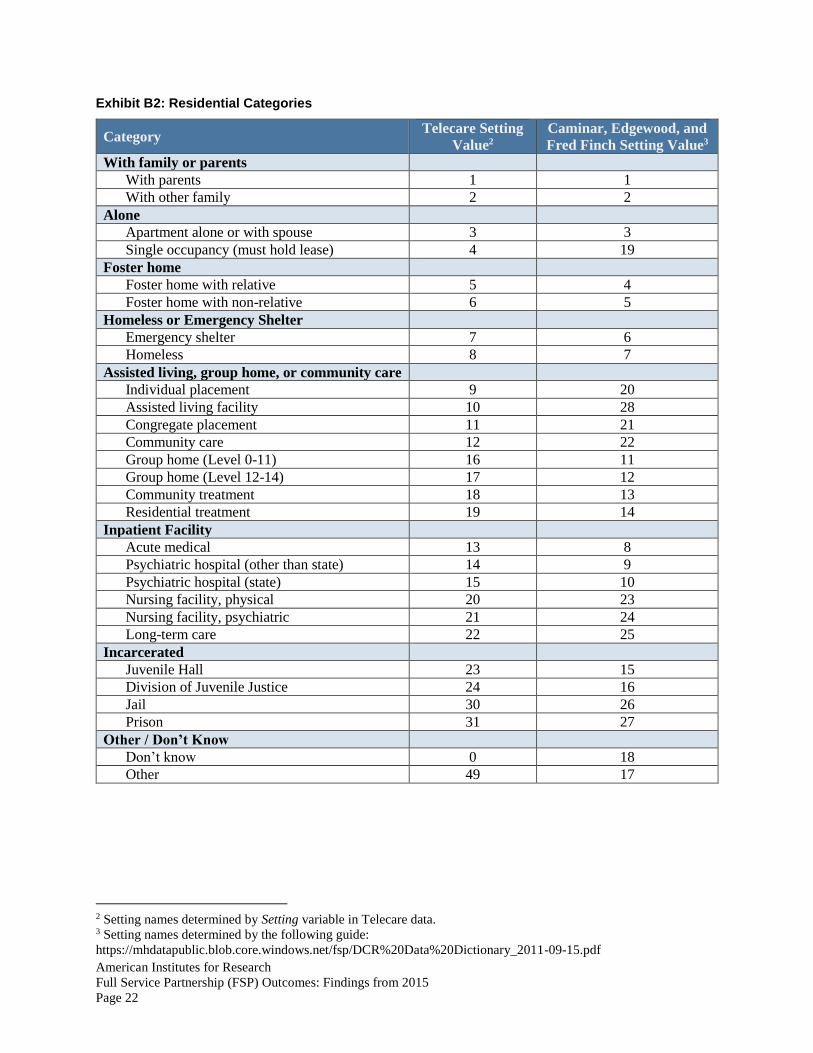
American Institutes for Research
Full Service Partnership (FSP) Outcomes: Findings from 2015
Page 22
Exhibit B2: Residential Categories
Category Telecare Setting
Value2
Caminar, Edgewood, and
Fred Finch Setting Value3
With family or parents
With parents 1 1
With other family 2 2
Alone
Apartment alone or with spouse 3 3
Single occupancy (must hold lease) 4 19
Foster home
Foster home with relative 5 4
Foster home with non-relative 6 5
Homeless or Emergency Shelter
Emergency shelter 7 6
Homeless 8 7
Assisted living, group home, or community care
Individual placement 9 20
Assisted living facility 10 28
Congregate placement 11 21
Community care 12 22
Group home (Level 0-11) 16 11
Group home (Level 12-14) 17 12
Community treatment 18 13
Residential treatment 19 14
Inpatient Facility
Acute medical 13 8
Psychiatric hospital (other than state) 14 9
Psychiatric hospital (state) 15 10
Nursing facility, physical 20 23
Nursing facility, psychiatric 21 24
Long-term care 22 25
Incarcerated
Juvenile Hall 23 15
Division of Juvenile Justice 24 16
Jail 30 26
Prison 31 27
Other / Don’t Know
Don’t know 0 18
Other 49 17
2 Setting names determined by Setting variable in Telecare data. 3 Setting names determined by the following guide:
https://mhdatapublic.blob.core.windows.net/fsp/DCR%20Data%20Dictionary_2011-09-15.pdf
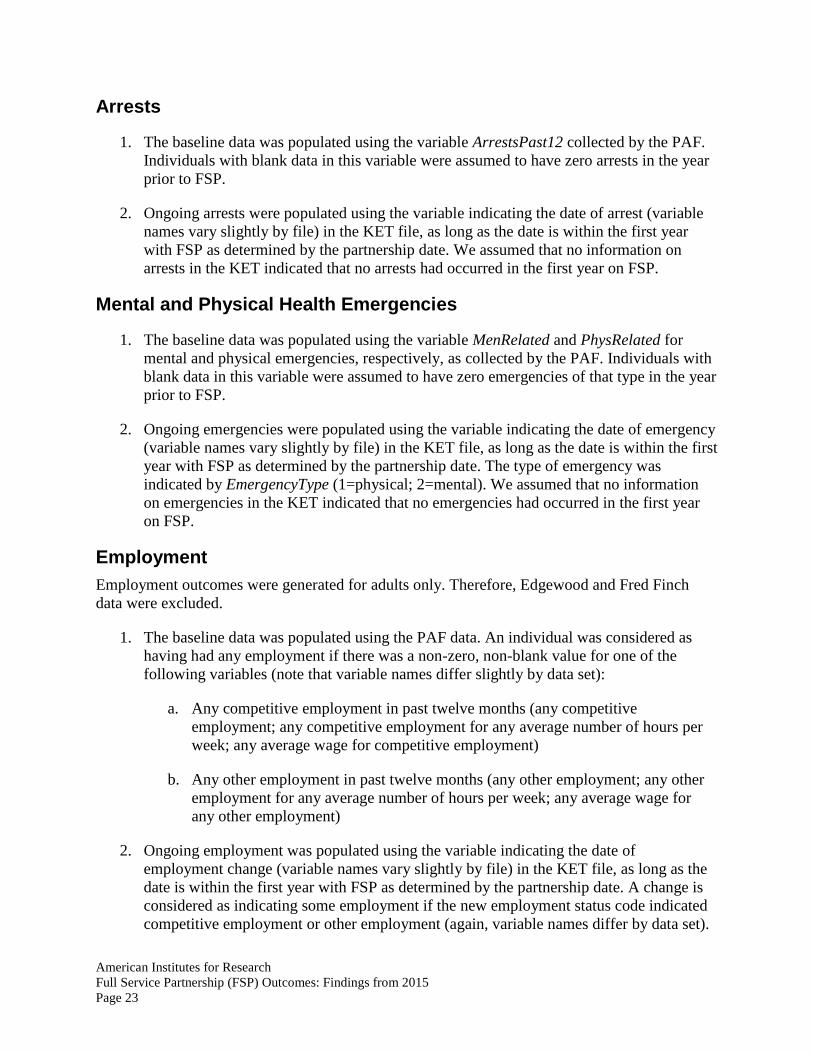
American Institutes for Research
Full Service Partnership (FSP) Outcomes: Findings from 2015
Page 23
Arrests
1. The baseline data was populated using the variable ArrestsPast12 collected by the PAF.
Individuals with blank data in this variable were assumed to have zero arrests in the year
prior to FSP.
2. Ongoing arrests were populated using the variable indicating the date of arrest (variable
names vary slightly by file) in the KET file, as long as the date is within the first year
with FSP as determined by the partnership date. We assumed that no information on
arrests in the KET indicated that no arrests had occurred in the first year on FSP.
Mental and Physical Health Emergencies
1. The baseline data was populated using the variable MenRelated and PhysRelated for
mental and physical emergencies, respectively, as collected by the PAF. Individuals with
blank data in this variable were assumed to have zero emergencies of that type in the year
prior to FSP.
2. Ongoing emergencies were populated using the variable indicating the date of emergency
(variable names vary slightly by file) in the KET file, as long as the date is within the first
year with FSP as determined by the partnership date. The type of emergency was
indicated by EmergencyType (1=physical; 2=mental). We assumed that no information
on emergencies in the KET indicated that no emergencies had occurred in the first year
on FSP.
Employment Employment outcomes were generated for adults only. Therefore, Edgewood and Fred Finch
data were excluded.
1. The baseline data was populated using the PAF data. An individual was considered as
having had any employment if there was a non-zero, non-blank value for one of the
following variables (note that variable names differ slightly by data set):
a. Any competitive employment in past twelve months (any competitive
employment; any competitive employment for any average number of hours per
week; any average wage for competitive employment)
b. Any other employment in past twelve months (any other employment; any other
employment for any average number of hours per week; any average wage for
any other employment)
2. Ongoing employment was populated using the variable indicating the date of
employment change (variable names vary slightly by file) in the KET file, as long as the
date is within the first year with FSP as determined by the partnership date. A change is
considered as indicating some employment if the new employment status code indicated
competitive employment or other employment (again, variable names differ by data set).

American Institutes for Research
Full Service Partnership (FSP) Outcomes: Findings from 2015
Page 24
We assumed that no information on employment in the KET indicated that the original
employment status sustained.
School Outcomes School outcomes were generated for child and TAY partners affiliated with Edgewood and Fred
Finch only. Caminar and Telecare TAY, adult, and older adult partners were excluded. Note that
these outcomes are presented as though they represent outcomes for all Child and TAY partners;
however, we do not know how many of these partners are enrolled in school.
Suspensions
1. The baseline data was populated using the variable SuspensionPast12 collected by the
PAF. Individuals with blank data in this variable were assumed to have zero suspensions
in the year prior to FSP.
2. Ongoing suspensions were populated using the variable indicating the date of suspension
(DateSuspension) in the KET file, as long as the date is within the first year with FSP as
determined by the partnership date. We assumed that no information on suspensions in
the KET indicated that no suspensions had occurred in the first year on FSP.
Grades and Attendance Note that grades and attendance are cardinal rankings. They are reported as ranging from 1 to 5,
where lower indicates a better outcome. For the purposes of reporting, we reverse-coded these
outcomes such that a 5 indicates a better outcome.
1. The baseline data was populated using the variables GradesPast12 and AttendancePast12
from the PAF data. Individuals with blank data in this variable were excluded.
2. Ongoing rankings of grades and attendance were gathered using the GradesCurrent and
AttendanceCurrent from the PAF (for the first ranking) and the 3M forms. Again,
individuals with blank data are excluded.
3. Because there were multiple observations for each person in each year, first averages by
person by year were created; then averages by year.
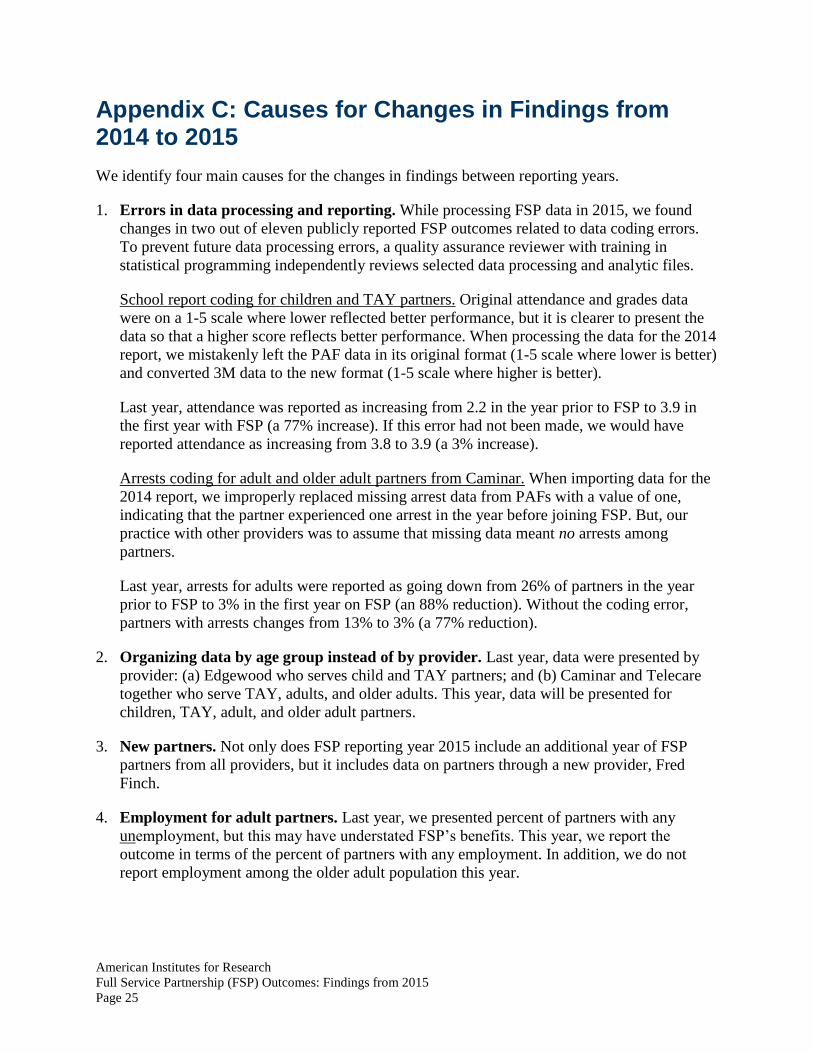
American Institutes for Research
Full Service Partnership (FSP) Outcomes: Findings from 2015
Page 25
Appendix C: Causes for Changes in Findings from 2014 to 2015 We identify four main causes for the changes in findings between reporting years.
1. Errors in data processing and reporting. While processing FSP data in 2015, we found
changes in two out of eleven publicly reported FSP outcomes related to data coding errors.
To prevent future data processing errors, a quality assurance reviewer with training in
statistical programming independently reviews selected data processing and analytic files.
School report coding for children and TAY partners. Original attendance and grades data
were on a 1-5 scale where lower reflected better performance, but it is clearer to present the
data so that a higher score reflects better performance. When processing the data for the 2014
report, we mistakenly left the PAF data in its original format (1-5 scale where lower is better)
and converted 3M data to the new format (1-5 scale where higher is better).
Last year, attendance was reported as increasing from 2.2 in the year prior to FSP to 3.9 in
the first year with FSP (a 77% increase). If this error had not been made, we would have
reported attendance as increasing from 3.8 to 3.9 (a 3% increase).
Arrests coding for adult and older adult partners from Caminar. When importing data for the
2014 report, we improperly replaced missing arrest data from PAFs with a value of one,
indicating that the partner experienced one arrest in the year before joining FSP. But, our
practice with other providers was to assume that missing data meant no arrests among
partners.
Last year, arrests for adults were reported as going down from 26% of partners in the year
prior to FSP to 3% in the first year on FSP (an 88% reduction). Without the coding error,
partners with arrests changes from 13% to 3% (a 77% reduction).
2. Organizing data by age group instead of by provider. Last year, data were presented by
provider: (a) Edgewood who serves child and TAY partners; and (b) Caminar and Telecare
together who serve TAY, adults, and older adults. This year, data will be presented for
children, TAY, adult, and older adult partners.
3. New partners. Not only does FSP reporting year 2015 include an additional year of FSP
partners from all providers, but it includes data on partners through a new provider, Fred
Finch.
4. Employment for adult partners. Last year, we presented percent of partners with any
unemployment, but this may have understated FSP’s benefits. This year, we report the
outcome in terms of the percent of partners with any employment. In addition, we do not
report employment among the older adult population this year.

ABOUT AMERICAN INSTITUTES FOR RESEARCH
Established in 1946, with headquarters in Washington, D.C.,
American Institutes for Research (AIR) is an independent,
nonpartisan, not-for-profit organization that conducts behavioral
and social science research and delivers technical assistance
both domestically and internationally. As one of the largest
behavioral and social science research organizations in the
world, AIR is committed to empowering communities and
institutions with innovative solutions to the most critical
challenges in education, health, workforce, and international
development.
2800 Campus Drive, Suite 200 San Mateo, CA 94403
www.air.org
LOCATIONS
Domestic Washington, D.C.
Atlanta, GA
Austin, TX
Baltimore, MD
Cayce, SC
Chapel Hill, NC
Chicago, IL
Columbus, OH
Frederick, MD
Honolulu, HI
Indianapolis, IN
Metairie, LA
Naperville, IL
New York, NY
Rockville, MD
Sacramento, CA
San Mateo, CA
Waltham, MA
International Egypt
Honduras
Ivory Coast
Kyrgyzstan
Liberia
Tajikistan
Zambia
A P P E N D I X 6 – O U T R E A C H C O L L A B O R A T I V E S
O U T C O M E S R E P O R T

Memo
Date: March 9, 2016
To: Doris Estremera, SMC BHRS
CC: Jei Africa and Scott Gruendl, SMC BHRS
From: Wendy Lee and Grace Wang, AIR
Re: Summary of SMC BHRS outreach efforts, FY2014-2015, Quarters 1-4
Summary This memo gives an overview of outreach efforts that occurred during fiscal year 2014-2015 (July 1, 2014 through June 30, 2015) across all providers. We present data for individual outreach events and group outreach events separately so that San Mateo County Behavioral Health and Recovery Services (SMC BHRS) can look at each in greater detail. We also report on outreach event attendees. But, attendees are not necessarily unique individuals seeking outreach because a person may have been part of more than one outreach event, taken part in both individual and group outreach events, and/or interacted with different providers.
This memo accompanies dashboards that display information about SMC BHRS outreach efforts. The dashboards: (1) provide SMC BHRS with summary analyses for state reporting purposes and (2) enable SMC BHRS and its providers to interact with the data to better understand each provider’s outreach efforts. We created dashboards using Tableau, a data visualization program. Please see Appendix 1, Group Outreach Dashboards User Guide, for instructions on navigating and understanding the various dashboard displays.
In FY 2014-2015, AIR created a new outreach form for provider use that was implemented in Q4. Providers used the original outreach forms from Q1 to Q3. Wherever possible, we coded Q1 to Q3 data from original forms to be consistent with Q4 data elements and structure from new forms. Form changes may explain sharp increases (or decreases) for measures added (or removed) starting in Q4. Please see Appendix 2, Methods, for detailed information about data coding.
Overall outreach by provider During FY2014-2015, SMC BHRS providers had 5,345 outreach attendees in total—902 attendees through individual outreach events and 4,443 attendees across 148 group outreach events. Table 1 shows outreach attendees stratified by provider and event type (i.e., individual or group). An attendee is not necessarily a unique individual because a person may have been
2800 Campus Drive, Suite 200, San Mateo, CA 94403-2552 | 650.843.8100 | www.air.org
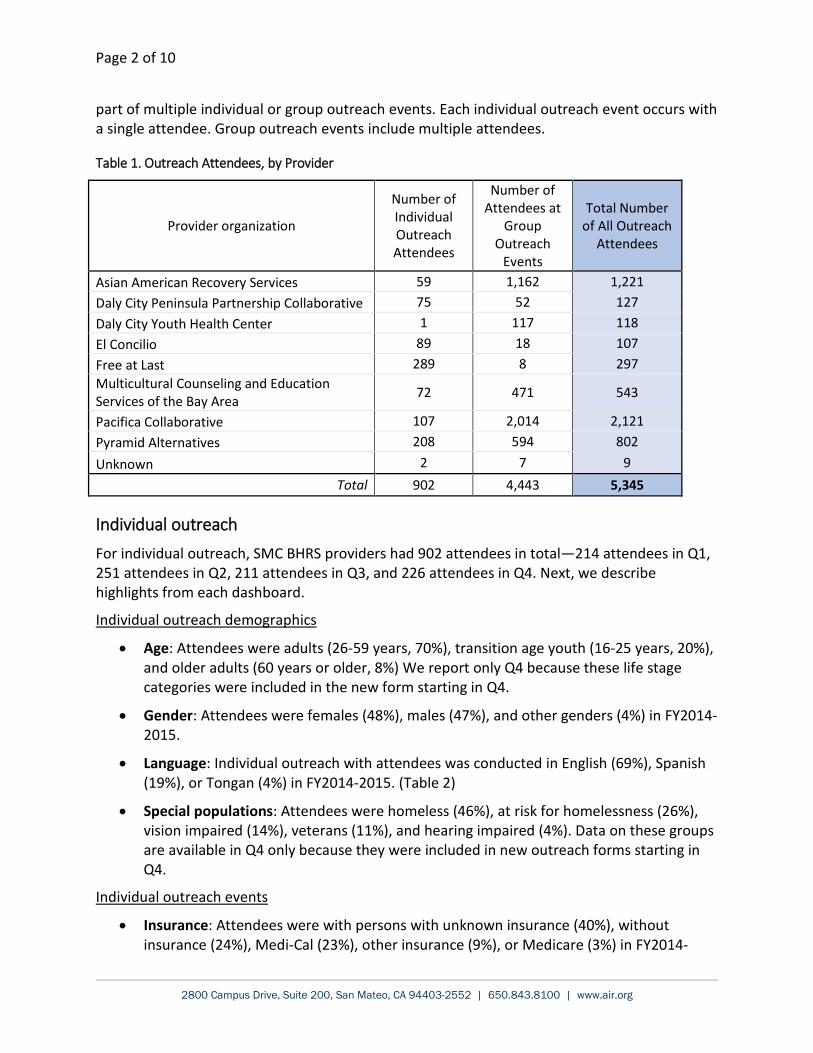
Page 2 of 10
part of multiple individual or group outreach events. Each individual outreach event occurs with a single attendee. Group outreach events include multiple attendees.
Table 1. Outreach Attendees, by Provider
Provider organization
Number of Individual Outreach Attendees
Number of Attendees at
Group Outreach
Events
Total Number of All Outreach
Attendees
Asian American Recovery Services 59 1,162 1,221 Daly City Peninsula Partnership Collaborative 75 52 127 Daly City Youth Health Center 1 117 118 El Concilio 89 18 107 Free at Last 289 8 297 Multicultural Counseling and Education Services of the Bay Area 72 471 543
Pacifica Collaborative 107 2,014 2,121 Pyramid Alternatives 208 594 802 Unknown 2 7 9
Total 902 4,443 5,345
Individual outreach For individual outreach, SMC BHRS providers had 902 attendees in total—214 attendees in Q1, 251 attendees in Q2, 211 attendees in Q3, and 226 attendees in Q4. Next, we describe highlights from each dashboard.
Individual outreach demographics
• Age: Attendees were adults (26-59 years, 70%), transition age youth (16-25 years, 20%), and older adults (60 years or older, 8%) We report only Q4 because these life stage categories were included in the new form starting in Q4.
• Gender: Attendees were females (48%), males (47%), and other genders (4%) in FY2014-2015.
• Language: Individual outreach with attendees was conducted in English (69%), Spanish (19%), or Tongan (4%) in FY2014-2015. (Table 2)
• Special populations: Attendees were homeless (46%), at risk for homelessness (26%), vision impaired (14%), veterans (11%), and hearing impaired (4%). Data on these groups are available in Q4 only because they were included in new outreach forms starting in Q4.
Individual outreach events
• Insurance: Attendees were with persons with unknown insurance (40%), without insurance (24%), Medi-Cal (23%), other insurance (9%), or Medicare (3%) in FY2014-
2800 Campus Drive, Suite 200, San Mateo, CA 94403-2552 | 650.843.8100 | www.air.org
Page 3 of 10
2015. Of note, the number of individuals who reported unknown insurance coverage decreased from Q1 to Q4 (Figure 1).
• Location: Individual outreach with attendees occurred in the office (55%), unspecified locations (23%), and other community locations (9%) in FY2014-2015.
• Medicaid Administrative Activities (MAA) code: Individual outreach with attendees used MAA code 400 (57%), 401 (15%), and 410 (11%) in FY2014-2015. Please see Appendix 2 for additional details on MAA codes.
• Mental health/Substance use outreach and referrals: Individual outreach with attendees included mental health outreach (40%), substance use referral (18%), mental health referral (11%), and substance use outreach (8%) in FY2014-2015.
• Other referrals: Individual outreach with attendees included medical care (29%), no (21%), housing (20%), other (13), food (6%), and legal (5%) referrals. Data on these groups are available in Q4 only because they were included in new outreach forms starting in Q4.
Individual race and ethnicity
• Race and ethnicity: Attendees were most often White (26%), other Latino (19%), Black (14%), multiple (9%), and Tongan (7%) race and ethnicity in FY2014-2015.
Individual length of contact
• Total contact: Individual outreach events had 35,287 minutes (588 hours) of total contact in FY2014-2015.
• Average contact: An individual outreach event lasted an average of 39 minutes in FY2014-2015.
Group outreach For group outreach, SMC BHRS providers reached 4,443 attendees in total across 148 group outreach events—49 events (1,591 attendees) in Q1, 50 events (1,349 attendees) in Q2, 23 events (413 attendees) in Q3, and 26 events (1,090 attendees) in Q4. Next, we describe highlights from each dashboard.
Group event characteristics
• Language: Group outreach events were conducted in English (100%) in Q4. We report only Q4 because language for Q1 to Q3 should be interpreted cautiously. Some providers recorded language of outreach event while others recorded language spoken at home (please see Appendix 2, Method).
• Location: Group outreach events occurred most often in “other community locations” (42%) or schools (22%) in FY2014-2015.
• MAA code: Group outreach events used MAA code 402 (41%) and 401 (31%) in FY2014-2015.
2800 Campus Drive, Suite 200, San Mateo, CA 94403-2552 | 650.843.8100 | www.air.org

Page 4 of 10
Group length of contact
• Total contact: Group outreach events had 11,717 minutes (195 hours) of total contact in FY2014-2015.
• Average contact: A group outreach event lasted an average of 79 minutes in FY2014-2015.
Group demographics
• Gender: Group outreach event attendees were females (57%), males (37%), and other genders (6%) in FY2014-2015.
• Special populations: Group outreach event attendees were at risk for homelessness (41%), homeless (25%), vision impaired (15%), or veterans (11%), hearing impaired (7%) in Q4. These special populations are reported for Q4 only because they were included in new outreach forms starting in Q4.
Group race/ethnicity
• Race and ethnicity: Group outreach event attendees were most often White (25%), unknown (14%), Filipino (12%), other Samoan (9%), and other (9%) race in FY2014-2015.
2800 Campus Drive, Suite 200, San Mateo, CA 94403-2552 | 650.843.8100 | www.air.org
Page 5 of 10
Appendix 1. Group Outreach Dashboards User Guide
How to Open Tableau Files in Tableau Reader 1. Use Tableau Reader (version 9.2) to open up the Tableau files (latest version downloadable
from: https://www.tableau.com/products/reader). 2. For best visualization, please view dashboards in Presentation Mode (press F7 or select
“Presentation Mode” from Window at top toolbar).
Navigating Through the Dashboards Each tab, across the bottom of the screen, is a dashboard on a specific set of data. You can view several variables within each dashboard.
Group characteristics The first tab, Group event characteristics, shows data on the group outreach events. Group characteristics are presented as the number (or percent) of all group outreach events. There are three dropdown menus in the upper right corner:
• FY shows “All” so data will display for fiscal years 2014-2015 (shown as “FY 2015”). As we accumulate data, we will also show 2015-2016 (shown as “FY 2016”). You will be able to choose a single fiscal year of interest from the dropdown menu.
• Quarter shows “All” so data will display for all quarters for which we have data. To look at a single quarter, please select a fiscal year from the “FY” dropdown menu, and then select a quarter from the “Quarter” dropdown menu.
• Variable allows you to choose language in which outreach was conducted, event location, or Medicaid Administrative Activities (MAA) code.
Understanding the display:
• The far left panel shows a table colored in shades of green. Here, the total counts of group outreach events for each quarter are shown. High counts are in darker green, and low counts are in lighter green. “High” and “low” are relative to overall counts for each characteristic.
• The top panel “Group outreach (number of events)” shows the total counts of outreach events. For example, if you choose the “maa” variable, the top panel will show the number of group outreach events that included codes 400, 401, 404, 410, or unknown for each month and quarter.
• The bottom panel “Group outreach (percent of total events)” shows the corresponding percentages for each category. For “maa”, the display shows the percent of all group outreach events that included each code.
2800 Campus Drive, Suite 200, San Mateo, CA 94403-2552 | 650.843.8100 | www.air.org
Page 6 of 10
Group length of contact The second tab, Group length of contact, shows data on total contact through all group outreach events combined. There are two dropdown menus in the upper right corner:
• FY shows “All” so data will display for fiscal years 2014-2015 (shown as “FY 2015”) and will accommodate 2015-2016 data later. You can choose a single fiscal year of interest from the drop down menu in the upper right.
• Quarter shows “All” so data will display for all quarters that we have data. To look at a single quarter, please select a fiscal year from the “FY” dropdown menu, and then select a quarter from the “Quarter” dropdown menu.
Understanding the display:
• The bottom panel shows a table colored in shades of green. Here, the total counts of contact time each quarter are shown. High counts are in darker green, and low counts are in lighter green.
• The top panel shows the total contact time from quarter to quarter.
Group Demographics The third tab, Demographics, shows data on group outreach event attendees. Each group outreach event includes multiple attendees. Demographic data are presented as both the number and corresponding percent of all group outreach attendees. Again, there are three dropdown menus in the upper right corner:
• FY shows “All” so data will display for fiscal years 2014-2015 (shown as “FY 2015”). As we accumulate data, we will also show 2015-2016 (shown as “FY 2016”). You will be able to choose a single fiscal year of interest from the dropdown menu.
• Quarter shows “All” so data will display for all quarters that we have data. To look at a single quarter, please select a fiscal year from the “FY” dropdown menu, and then select a quarter from the “Quarter” dropdown menu.
• Variable allows you to choose gender, LGBTQ, special populations (e.g., hearing and visually impaired), or total attendance.
Understanding the display:
• The far left panel shows a table colored in shades of green. Here, the total counts of group outreach attendees each quarter are shown. High counts are in darker green, and low counts are in lighter green.
• The top panel “Group outreach demographics (number of attendees)” shows the total numbers of group outreach attendees. For example, if you choose the gender variable, the top panel will show the number of group outreach attendees who identified as male, female, or other in each month in the chosen fiscal year.
2800 Campus Drive, Suite 200, San Mateo, CA 94403-2552 | 650.843.8100 | www.air.org
Page 7 of 10
• The bottom panel “Group outreach demographics (percent of total attendees)” shows the corresponding percentages for each category. For gender, you see the percent of all group outreach attendees who identified as male, female, or other gender in the chosen quarters and fiscal year.
Group race/ethnicity The fourth tab shows data on race/ethnicity of group outreach event attendees, presented as the number (or percent) of all group outreach attendees. Each group outreach event includes multiple attendees. Again, there are three dropdown menus in the upper right corner:
• FY shows “All” so data will display for fiscal years 2014-2015 (shown as “FY 2015”). As we accumulate data, we will also show 2015-2016 (shown as “FY 2016”). You will be able to choose a single fiscal year of interest from the dropdown menu.
• Quarter shows “All” so data will display for all quarters that we have data. To look at a single quarter, please select a fiscal year from the “FY” dropdown menu, and then select a quarter from the “Quarter” dropdown menu.
• Variable shows “All” so data will display for all race/ethnicity groups. Select from the dropdown list of race/ethnicity groups to customize the visualization to look at all single race/ethnicity groups, as well as any combination of groups.
Understanding the display:
• The far left panel (table colored in shades of green) shows the total attendees across all race/ethnicity categories. High counts are shaded in darker green, and the lower counts are in lighter green.
• The top panel “Group outreach race and ethnicity (number of attendees)” shows the total counts of attendees who have self-reported as each race/ethnicity category.
• The bottom panel “Group outreach race and ethnicity (percent of total attendees)” shows the corresponding percentages for each race/ethnicity category.
By organization dashboard The last tab shows group outreach data by provider organization. In the upper right corner, there are four dropdown menus followed by an organizations list.
• FY shows “All” so data will display for fiscal years 2014-2015 (shown as “FY 2015”). As we accumulate data, we will also show 2015-2016 (shown as “FY 2016”). You will be able to choose a single fiscal year of interest from the dropdown menu.
• Quarter shows “All” so data will display for all quarters for which we have data. To look at a single quarter, please select a fiscal year from the “FY” dropdown menu, and then select a quarter from the “Quarter” dropdown menu.
• Group: You can select which group of variables to examine more closely. You can select group characteristic to study counts of group outreach events (each event includes multiple attendees). In contrast, group demographics and group race and ethnicity show group outreach attendees.
2800 Campus Drive, Suite 200, San Mateo, CA 94403-2552 | 650.843.8100 | www.air.org

Page 8 of 10
• Variable allows you to choose the corresponding variable. Be sure to make a selection here once you have selected either group characteristic, group demographics, or group race and ethnicity (as described above).
• Organization allows you to choose one or more providers to study in depth.
Understanding the display:
• The left panel shows the counts for selected variable categories over time.
• On the right, green-colored table, you can identify categories with higher event or attendee counts (darker green). Some data on this green-colored table are missing, as indicated with the blue arrow below. This is because a provider organization may not have reported on group outreach for that quarter.
Please contact Wendy Lee at [email protected] with questions.
2800 Campus Drive, Suite 200, San Mateo, CA 94403-2552 | 650.843.8100 | www.air.org
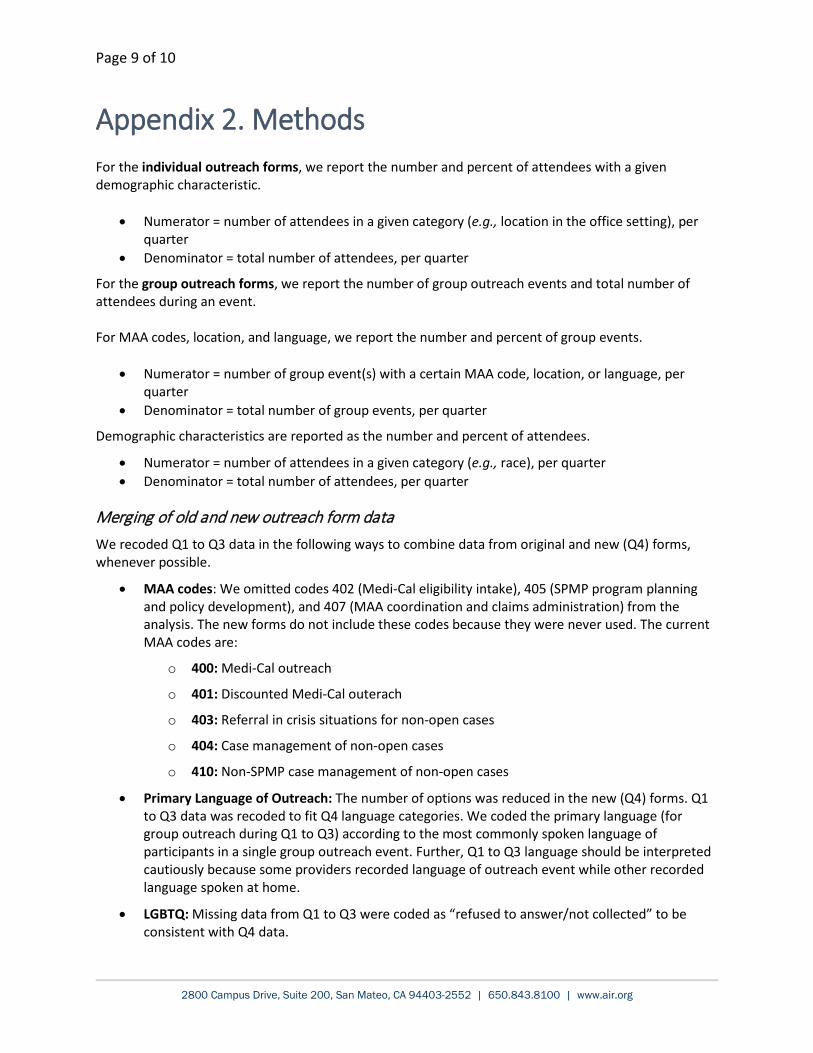
Page 9 of 10
Appendix 2. Methods For the individual outreach forms, we report the number and percent of attendees with a given demographic characteristic.
• Numerator = number of attendees in a given category (e.g., location in the office setting), per quarter
• Denominator = total number of attendees, per quarter
For the group outreach forms, we report the number of group outreach events and total number of attendees during an event. For MAA codes, location, and language, we report the number and percent of group events.
• Numerator = number of group event(s) with a certain MAA code, location, or language, per quarter
• Denominator = total number of group events, per quarter
Demographic characteristics are reported as the number and percent of attendees.
• Numerator = number of attendees in a given category (e.g., race), per quarter • Denominator = total number of attendees, per quarter
Merging of old and new outreach form data We recoded Q1 to Q3 data in the following ways to combine data from original and new (Q4) forms, whenever possible.
• MAA codes: We omitted codes 402 (Medi-Cal eligibility intake), 405 (SPMP program planning and policy development), and 407 (MAA coordination and claims administration) from the analysis. The new forms do not include these codes because they were never used. The current MAA codes are:
o 400: Medi-Cal outreach
o 401: Discounted Medi-Cal outerach
o 403: Referral in crisis situations for non-open cases
o 404: Case management of non-open cases
o 410: Non-SPMP case management of non-open cases
• Primary Language of Outreach: The number of options was reduced in the new (Q4) forms. Q1 to Q3 data was recoded to fit Q4 language categories. We coded the primary language (for group outreach during Q1 to Q3) according to the most commonly spoken language of participants in a single group outreach event. Further, Q1 to Q3 language should be interpreted cautiously because some providers recorded language of outreach event while other recorded language spoken at home.
• LGBTQ: Missing data from Q1 to Q3 were coded as “refused to answer/not collected” to be consistent with Q4 data.
2800 Campus Drive, Suite 200, San Mateo, CA 94403-2552 | 650.843.8100 | www.air.org
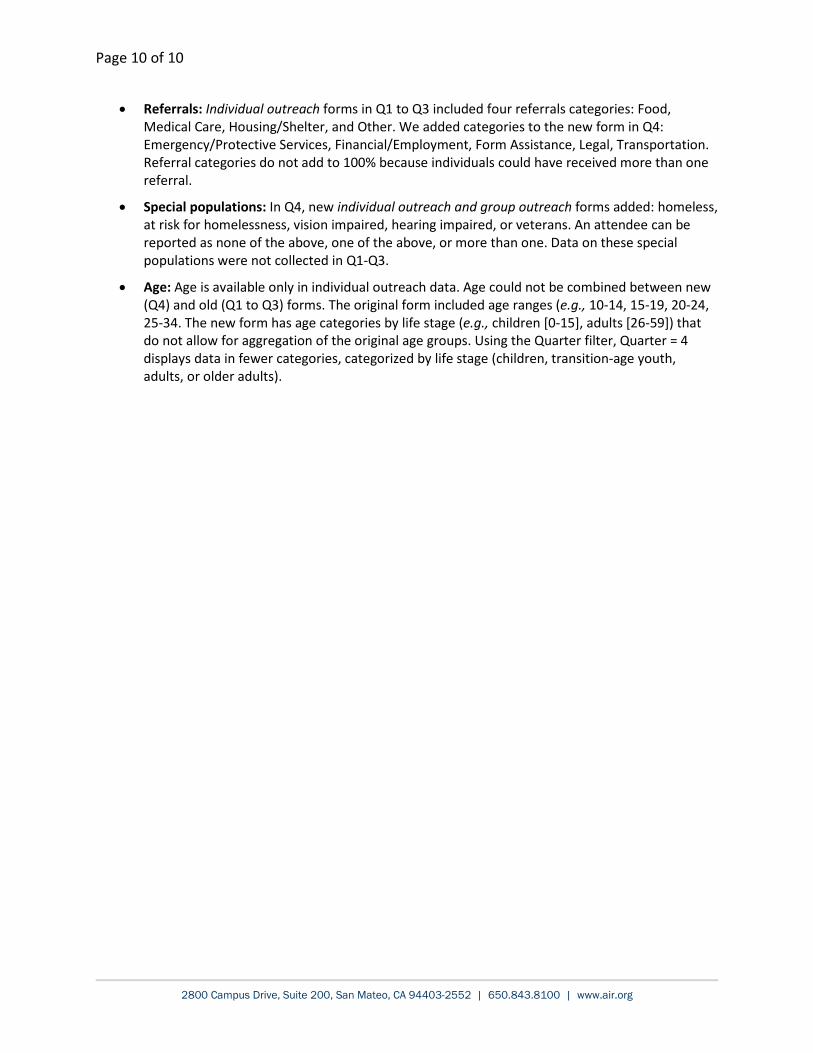
Page 10 of 10
• Referrals: Individual outreach forms in Q1 to Q3 included four referrals categories: Food, Medical Care, Housing/Shelter, and Other. We added categories to the new form in Q4: Emergency/Protective Services, Financial/Employment, Form Assistance, Legal, Transportation. Referral categories do not add to 100% because individuals could have received more than one referral.
• Special populations: In Q4, new individual outreach and group outreach forms added: homeless, at risk for homelessness, vision impaired, hearing impaired, or veterans. An attendee can be reported as none of the above, one of the above, or more than one. Data on these special populations were not collected in Q1-Q3.
• Age: Age is available only in individual outreach data. Age could not be combined between new (Q4) and old (Q1 to Q3) forms. The original form included age ranges (e.g., 10-14, 15-19, 20-24, 25-34. The new form has age categories by life stage (e.g., children [0-15], adults [26-59]) that do not allow for aggregation of the original age groups. Using the Quarter filter, Quarter = 4 displays data in fewer categories, categorized by life stage (children, transition-age youth, adults, or older adults).
2800 Campus Drive, Suite 200, San Mateo, CA 94403-2552 | 650.843.8100 | www.air.org
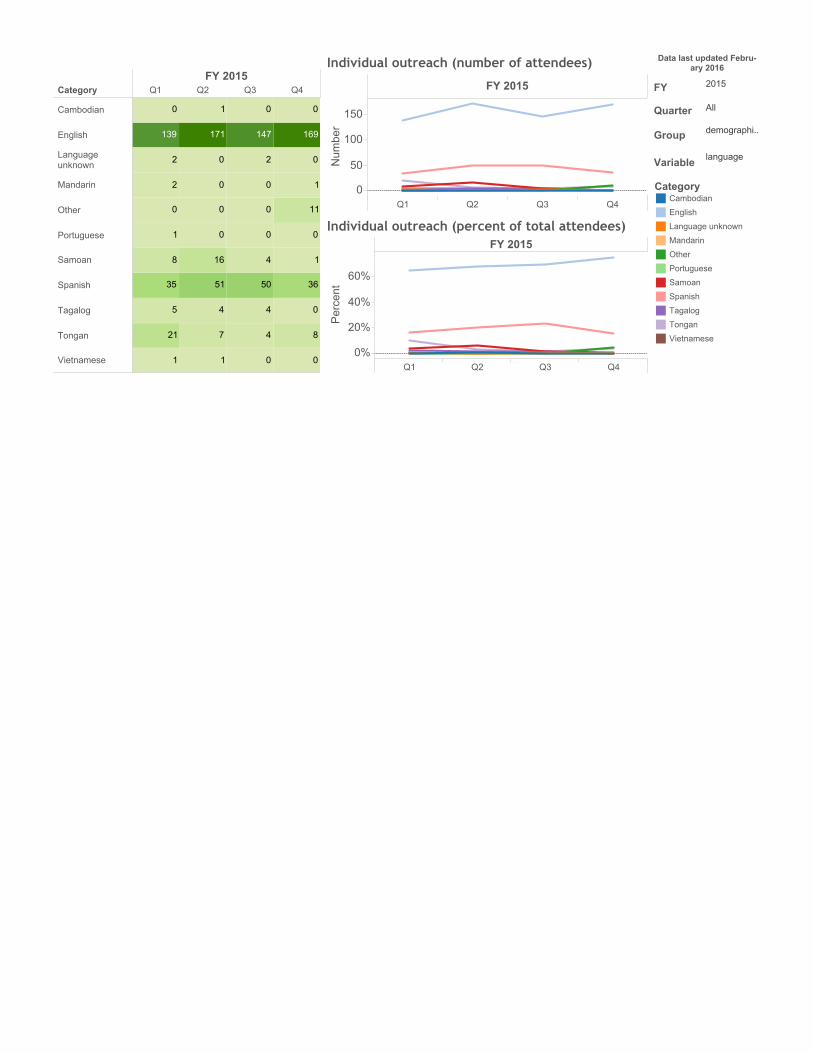
CategoryFY 2015
Q1 Q2 Q3 Q4
Cambodian
English
Languageunknown
Mandarin
Other
Portuguese
Samoan
Spanish
Tagalog
Tongan
Vietnamese 0
8
0
36
1
0
11
1
0
169
0
0
4
4
50
4
0
0
0
2
147
0
1
7
4
51
16
0
0
0
0
171
1
1
21
5
35
8
1
0
2
2
139
0
gp 1a. color table
FY 2015
Q1 Q2 Q3 Q40%
20%
40%
60%
Percent
Individual outreach (percent of total attendees)
FY 2015
Q1 Q2 Q3 Q40
50
100
150
Number
Individual outreach (number of attendees) Data last updated Febru-ary 2016
FY 2015
Quarter All
Group demographi..
Variable language
CategoryCambodian
English
Language unknown
Mandarin
Other
Portuguese
Samoan
Spanish
Tagalog
Tongan
Vietnamese
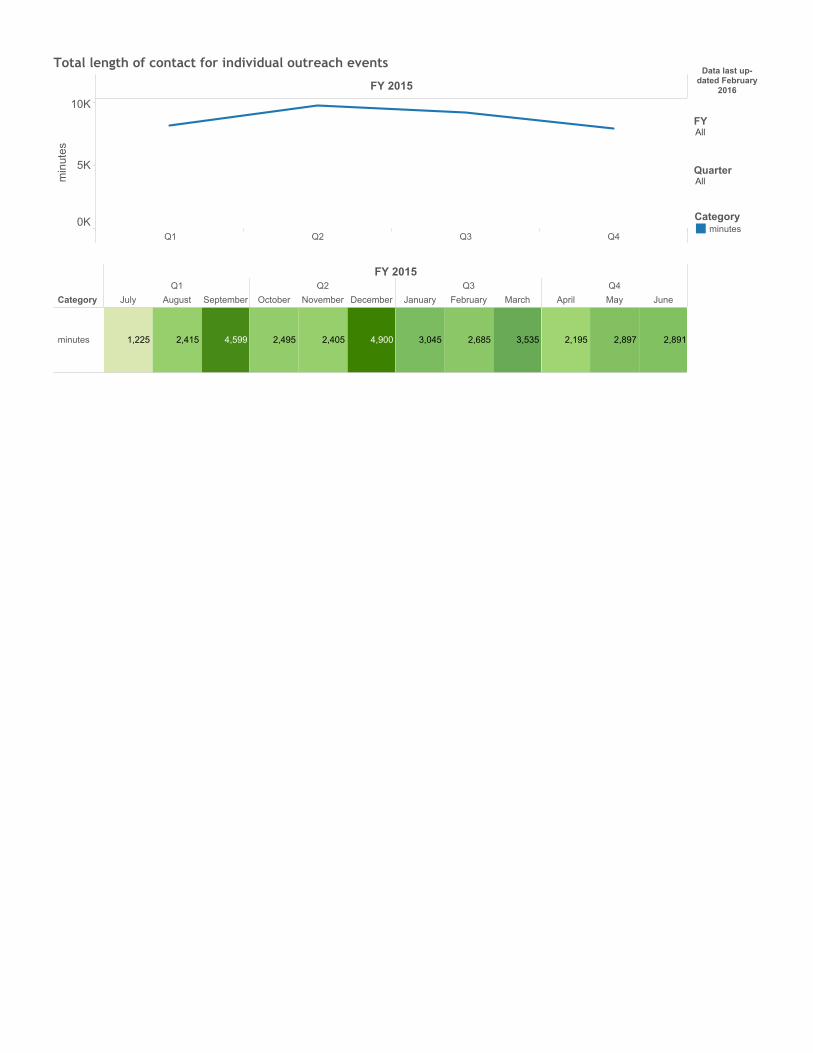
FY 2015
Q1 Q2 Q3 Q40K
5K
10K
minutes
Total length of contact for individual outreach events
Category
FY 2015Q1
July August SeptemberQ2
October NovemberDecemberQ3
January February MarchQ4
April May June
minutes 4,5992,4151,225 4,9002,4052,495 3,5352,6853,045 2,8912,8972,195
gp 1a. color table (2)
Data last up-dated February
2016
FYAll
QuarterAll
Categoryminutes

FY 2015
Q1 Q2 Q3 Q4
AsianAmerican R..
Daly CityYouth Healt..
PacificaCollaborative
PyramidAlternatives
Daly CityPeninsula P..
El Concilioof San Mate..
Free at Last
MulticulturalCounseling ..
Missing data
Outreach counts, by organizationFY 2015
Q1Q2Q3Q4
AsianAmericanRecoveryServices
Emergency/pr..
Financial/emp..
Food
Form assistan..
Housing/shelter
Legal
Medical care
No referral
Other
Transportation
Daly CityYouth HealthCenter
Emergency/pr..
Financial/emp..
Food
Form assistan..
Housing/shelter
0
21
1
1
12
5
2
4
0
0
0
1
0
0
0
0
0
0
0
0
0
21
0
1
0
5
0
3
0
0
0
7
0
0
0
0
0
1
0
0
0
1
0
0
0
gp 2a. color table by org
FY 2015Q1 Q2 Q3 Q4
Emergency/prote..
Financial/employ..
Food
Form assistance
Housing/shelter
Legal
Medical care
No referral
Other
Transportation 2
39
62
86
16
61
10
17
6
1
0
31
0
54
0
28
0
13
0
0
0
55
0
61
0
36
0
36
0
0
0
117
0
24
0
29
0
97
0
0
Total counts for selected organiza-tion(s)
Emergency/prote..
Financial/employ..
Food
Form assistance
Housing/shelter
Legal
Medical care
No referral
Other
Transportation
Data last updated Febru-ary 2016
FYAll
QuarterAll
Groupdemographicsoutreach eventrace and ethnicity
Variableother referrals
OrganizationAsian American Rec..Daly City Peninsula ..Daly City Youth Heal..El Concilio of San M..Free at Last
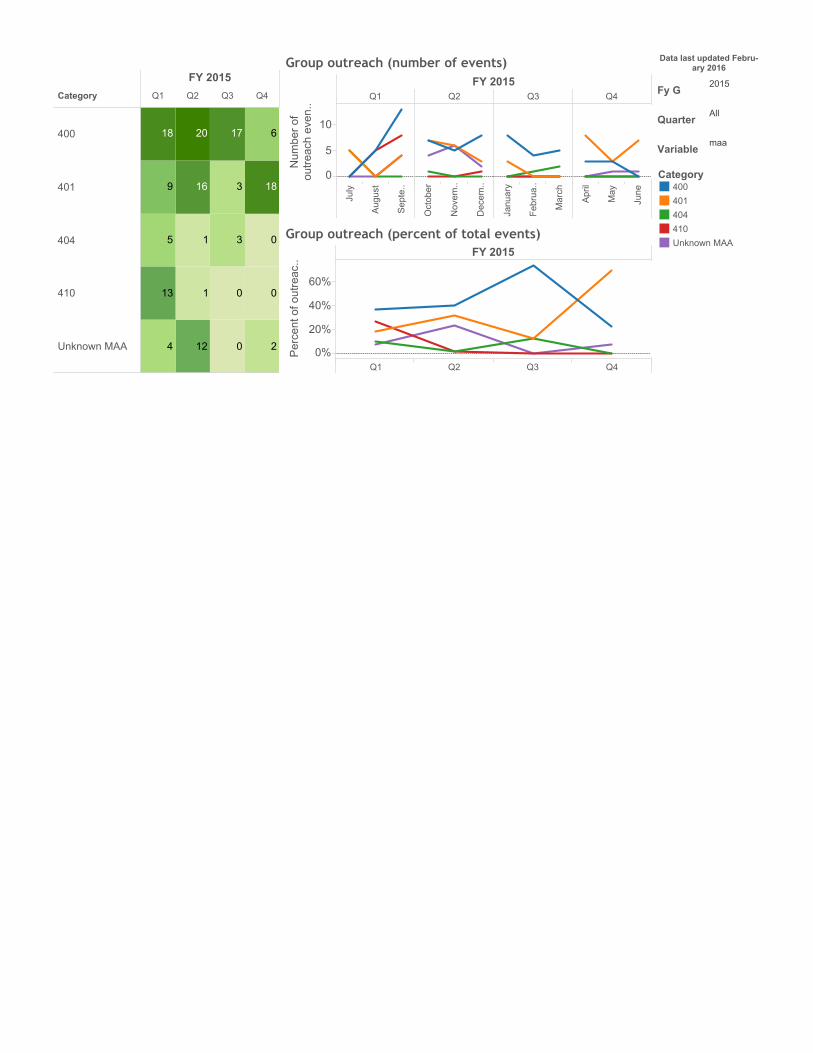
Category
FY 2015
Q1 Q2 Q3 Q4
400
401
404
410
Unknown MAA 2
0
0
18
6
0
0
3
3
17
12
1
1
16
20
4
13
5
9
18
Sheet 8
FY 2015Q1 Q2 Q3 Q4
July
August
Septe..
October
Novem..
Decem..
January
Februa..
March
April
May
June
0
5
10
Number of
outreach even..
Group outreach (number of events)
FY 2015
Q1 Q2 Q3 Q40%
20%
40%
60%Percent of outreac..
Group outreach (percent of total events)
Data last updated Febru-ary 2016
Fy G2015
QuarterAll
Variablemaa
Category400401404410Unknown MAA

FY 2015
0K
1K
2K
3K
4K
Number of minutes
Group outreach total contact length (minutes)
CategoryQ1
July AugustSeptem..Q2
OctoberNovemb..Decemb..Q3
JanuaryFebruary MarchQ4
April May June
minutes 2,5781,170355 1,2601,4651,463 350135820 4962401,385
Data last up-dated February
2016
Fy G2015
QuarterAll

FY 2015
Q1 Q2 Q3 Q40%
10%
20%
30%
40%
Percent
Group outreach demographics (percent of total attendees)
FY 2015Q1 Q2 Q3 Q4
July
August
Septe..
Octob..
Nove..
Dece..
Janua..
Febru..
March
April
May
June
01020
30
Number
Group outreach demographics (number of attendees) Data last updated Febru-ary 2016
FYAll
QuarterAll
Variablespecial populations
Categoryat risk for homelessne..hearing impairedhomelessveteranvision impaired
Category
FY 2015Q1 Q2 Q3 Q4
at risk for homelessness
hearingimpaired
homeless
veteran
visionimpaired
28
21
47
13
76
0
0
0
0
0
0
0
0
0
0
0
0
0
0
0
gp 1a. color table
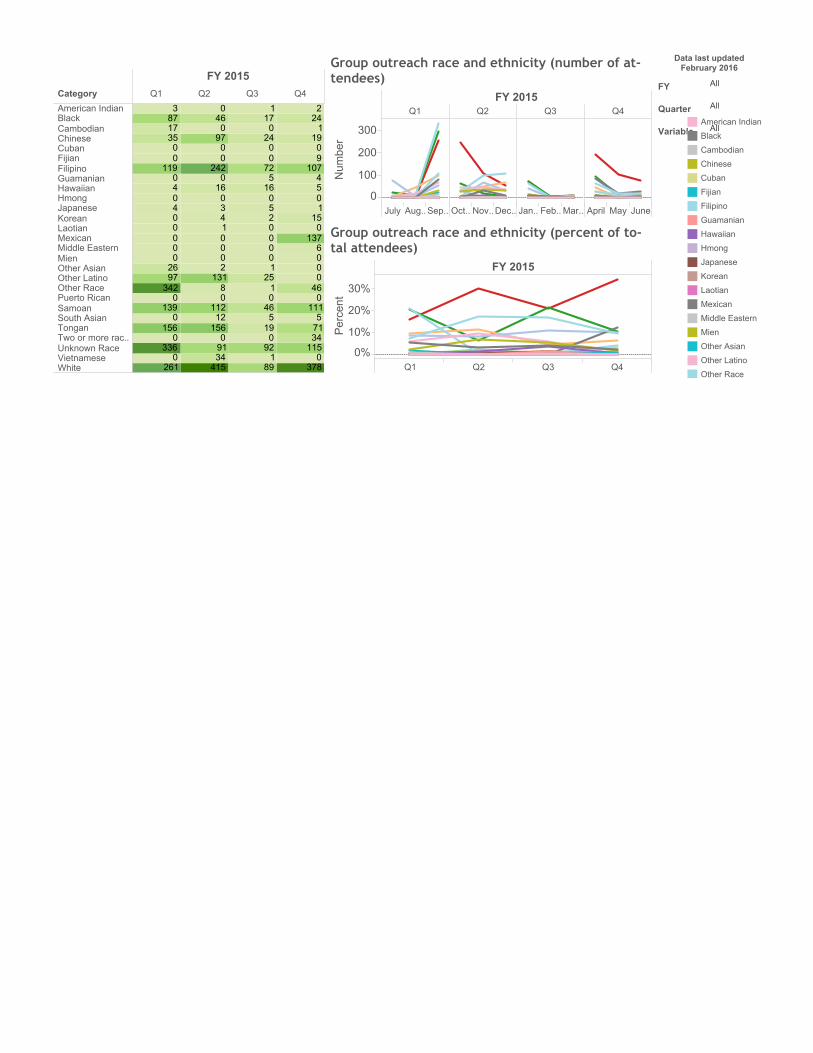
Category
FY 2015Q1 Q2 Q3 Q4
American IndianBlackCambodianChineseCubanFijianFilipinoGuamanianHawaiianHmongJapaneseKoreanLaotianMexicanMiddle EasternMienOther AsianOther LatinoOther RacePuerto RicanSamoanSouth AsianTonganTwo or more rac..Unknown RaceVietnameseWhite 378
0115347151110460006
1370151054
10790191242
891920195460125100002501657200240171
41534910
156121120813120001430160
24200970460
2610
3360
1560
1390
3429726000004040
119003517873
gp 1a. color table (2)
FY 2015
Q1 Q2 Q3 Q40%
10%
20%
30%
Percent
Group outreach race and ethnicity (percent of to-tal attendees)
FY 2015Q1 Q2 Q3 Q4
JulyAug..Sep..Oct..Nov..Dec..Jan..Feb..Mar..AprilMayJune0
100
200
300
Number
Group outreach race and ethnicity (number of at-tendees)
Data last updatedFebruary 2016
FY All
Quarter All
Variable AllAmerican Indian
Black
Cambodian
Chinese
Cuban
Fijian
Filipino
Guamanian
Hawaiian
Hmong
Japanese
Korean
Laotian
Mexican
Middle Eastern
Mien
Other Asian
Other Latino
Other Race
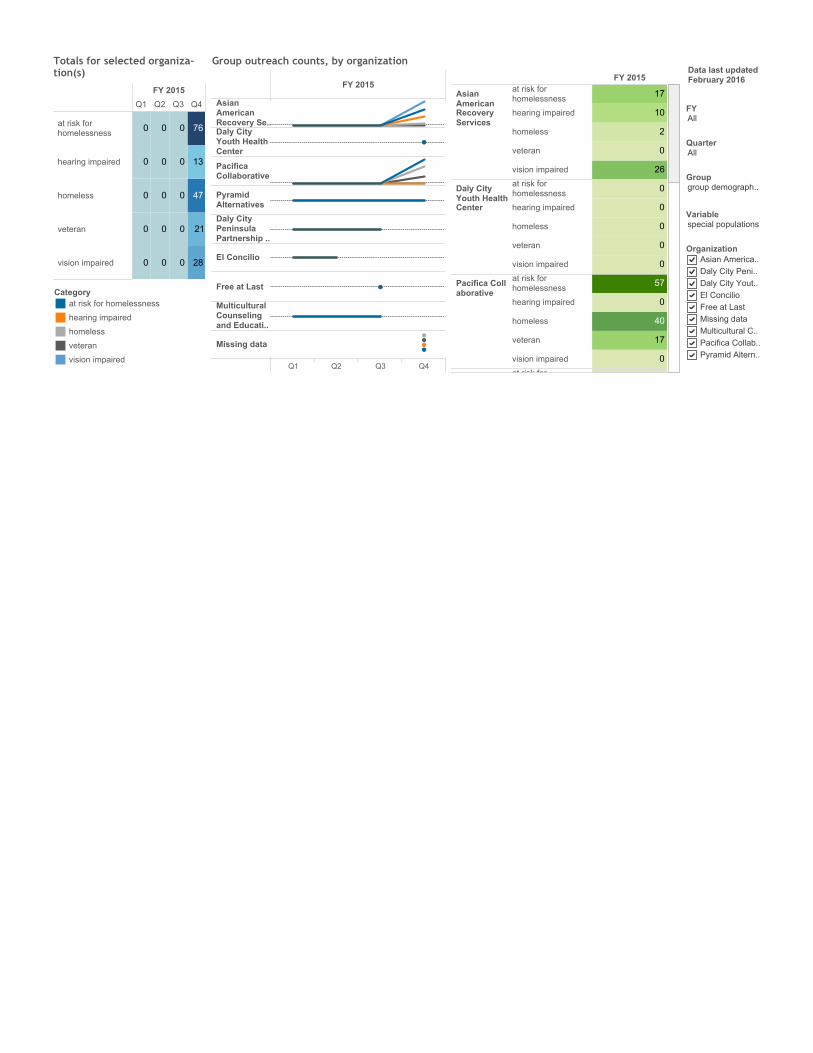
FY 2015
Q1 Q2 Q3 Q4
AsianAmericanRecovery Se..Daly CityYouth HealthCenter
PacificaCollaborative
PyramidAlternatives
Daly CityPeninsulaPartnership ..
El Concilio
Free at Last
MulticulturalCounselingand Educati..
Missing data
Group outreach counts, by organizationFY 2015
AsianAmericanRecoveryServices
at risk forhomelessness
hearing impaired
homeless
veteran
vision impaired
Daly CityYouth HealthCenter
at risk forhomelessness
hearing impaired
homeless
veteran
vision impaired
Pacifica Collaborative
at risk forhomelessness
hearing impaired
homeless
veteran
vision impaired
PyramidAlternatives
at risk forhomelessness
26
0
2
10
17
0
0
0
0
0
0
17
40
0
57
0
gp 2a. color table by orgData last updatedFebruary 2016
FYAll
QuarterAll
Groupgroup demograph..
Variablespecial populations
OrganizationAsian America..Daly City Peni..Daly City Yout..El ConcilioFree at LastMissing dataMulticultural C..Pacifica Collab..Pyramid Altern..
FY 2015
Q1 Q2 Q3 Q4
at risk forhomelessness
hearing impaired
homeless
veteran
vision impaired 28
21
47
13
76
0
0
0
0
0
0
0
0
0
0
0
0
0
0
0
Totals for selected organiza-tion(s)
Categoryat risk for homelessness
hearing impaired
homeless
veteran
vision impaired
A P P E N D I X 7 – P E I P R O G R A M E V A L U A T I O N
Y E A R 2 R E P O R T
San Mateo County Behavioral Health & Recovery Services Prevention & Early Intervention Evaluation Report 2014-15
Introduction Last year’s Countywide Evaluation Report was comprised of a brief description of the evaluation planning process and the agencies and projects evaluated, followed by an analysis of the evaluation process and the BHRS monitoring system, including a series of options for ensuring that the work done through this evaluation leads to sustained improvement in the collection, reporting and use of data by both PEI-funded agencies and the County managers who are overseeing these operations. For 2014-15, the report is far briefer, focusing on lessons learned in 2014-15 and a small number of recommendations to BHRS as to how they might foster funded agencies’ sustained focus on the use of data and research to inform program design, development and mid-course corrections in service delivery. Section I. Evaluation Process In 2013, SMC BHRS contracted with Gibson & Associates (G&A) to conduct a two-year evaluation of ten Prevention & Early Intervention projects being funded through the Mental Health Services Act. The evaluation was designed to produce evaluation reports for the 2013-14 and 2014-15 program years. The goals of the PEI evaluation were:
• To move beyond what is provided to the County by way of monitoring reports to produce
evaluation reports that captured project productivity, client impact, client and stakeholder satisfaction and recommendations for improvement in project areas and data collection procedures;
• To analyze how BHRS currently monitors PEI-funded projects including an assessment of the contracting and reporting processes;
• To identify ways to improve reporting to the County once the two-year evaluation cycle is complete;
• To help funded-agencies develop a better appreciation for the benefits of using data for their own internal quality improvement efforts and a greater capacity to do so; and
• To develop a transition plan or road map to help the county build upon what has been learned from this process and construct a sustainable approach to the use of data by County managers and the PEI projects they oversee.
The following projects were evaluated as part of this process.
Asian American Recovery Services’ Project Grow, a project that provides school-based, Evidence-Based Practice Trauma-Focused Cognitive Behavioral Therapy that focuses upon building student resiliency skills necessary to be successful at school. Project Grow explicitly nurtures Search Institute’s Forty-One Developmental Assets and directly incorporates their development into each child’s individual treatment goals. Caminar Project YES!. Caminar delivers thirteen Seeking Safety groups at six discrete locations serving transition age youth. Seeking Safety is an approach to help people attain safety from trauma/PTSD and
substance abuse. Caminar’s YES! Caminar collaborates with the Youth Center and an array of residential, transitional, and crisis intervention centers who serve TAY and delivers its groups at these facilities. El Centro AC-OK. El Centro’s AC-OK Seeking Safety project targets Transition Age Youth and young adults, the vast majority of whom were referred by the Department of Probation. El Centro named its Seeking Safety project the AC-OK Project as it conveyed a more positive image than Seeking Safety. During 2013-14 AC-OK served 40 transition-age youth involved in the juvenile or adult justice systems. Human Services Agency Teaching Pro-social Skills. HSA delivers Teaching Pro-social Skills (TPS) groups in San Mateo County public elementary schools where HSA Family Resource Centers are located. These schools generally receive referrals from teachers for students with classroom behavioral issues. TPS addresses the social skill needs of students who display aggression, immaturity, withdrawal, or other problem behaviors. Students are at risk due to issues such as growing up in a low-income household and community; peer rejection; low quality child care and preschool experiences; afterschool care with poor supervision; school failure, among others. Prevention & Recovery in Early Psychosis (PREP), was developed by a partnership led by Family Services Agency of San Francisco, now Felton Institute and the University of California, San Francisco. It is now operating in five Northern California counties. While delivered somewhat differently in each county, in San Mateo County PREP is comprised of the following five evidence-based practice components: Early, rigorous diagnosis: Cognitive Behavioral Therapy for Early Psychosis (CBTp); Algorithm guided Medication Management: Multifamily Psycho-education Groups (MFG): and Education and Employment Support. Puente. Project SUCCESS. Project SUCCESS (Schools Using Coordinated Community Efforts to Strengthen Students), is considered a SAMHSA model project that prevents and reduces substance use and abuse and associated behavioral issues among high risk, multi-problem adolescents. PROJECT SUCCESS places highly trained professionals (Project SUCCESS counselors) in four Southcoast schools to provide a full range of prevention and early intervention services. StarVista-Early Childhood Community Team. Early Childhood Community Team (ECCT) incorporates three service components that build on current models already operative in San Mateo County. The three service modalities are: 1) Clinical Services, 2) Case management services, and 3) Mental health consultations with childcare and early child development project staff and parents served by these centers. In addition, the ECCT team conducts extensive outreach in the community to build a more collaborative, interdisciplinary system of services for infants, toddlers and families. The ECCT is designed to support the healthy social emotional development of young children. ECCT is comprised of a community outreach worker, an early childhood mental health consultant, and a licensed clinician. BHRS PEI funding is supporting one Coastside team located in Half Moon Bay and providing funding for the clinical treatment component of a North Coast ECCT (First 5 and private funding support the other components). StarVista Crisis Intervention and Suicide Prevention Center, is a project comprised of a 24 hour phone Hotline and a Youth Intervention Team that works primarily through schools countywide offering crisis intervention services when a student is in crisis, training for school personnel and prevention education for thousands of middle and high school students. G&A developed a plan to collaborate in a participatory evaluation process working with project managers from the eight projects to be evaluated. The evaluations were organized around seven evaluation questions.
Evaluation Question # 1: Has the intervention/ project been implemented efficiently and according to the contract funding the project?
2

Evaluation Question # 2: Has the project implemented effective project strategies? i.e. Is the project well-designed and achieving a desired impact? Evaluation Question # 3: Have clients, families, partners, and/or communities been satisfied with services? Evaluation Question # 4: Have project services been responsive to the population targeted by the contract? Evaluation Question # 5: To what degree has the project advanced the vision, mission and objectives of the MHSA PEI plan? Evaluation Question # 6: What factors have impeded or contributed to successful implementation? How? Evaluation Question # 7: What steps can be taken in the future to improve project services and what data could verify that these improvements had occurred?
During the spring and summer 2013 began the evaluation by reviewing contracts for each agency that was operating a PEI-project. In addition to reviewing contracts, the evaluator reviewed all project monitoring reports submitted to the County, in some cases going back one or two years before the time period to be evaluated. Once a review of the contracts was complete, discussions were held between the evaluator and project managers for each of the projects described above. During these conferences, plans were developed for agencies to collect data that would be used to answer the evaluation questions above. Plans were developed to capture productivity at a client-level, with an effort to distinguish participation from among a variety of modalities delivered, where appropriate. To assess project impact, the evaluator tried to minimize the level of effort involved for project staff by using pre-post assessment tools that the project was already using, but in some instances the evaluator either searched for and secured existing assessment tools or created others based upon existing validated tools. The latter was done more often, as many of the validated tools identified would have required an inordinate commitment of time and resources to administer. Finally, all agencies identified satisfaction surveys to be used to assess satisfaction with services from clients, family, and/or stakeholders or, again, the evaluator developed surveys for this purpose. Along the way, challenges to the evaluation were identified that either required adjusting the evaluation scope of work, adjustments that also have informed recommendations for an improved reporting and monitoring system advanced in the 2013-14 countywide report. In the winter of 2013-14, follow-up meetings were held between project managers and the evaluator. In many instances, there were changes in project managers or other staffing that had limited project compliance with the data collection plan. This was especially the case when there was a change in project manager, as in most cases information about the evaluation was not conveyed from the exiting manager to the new one. This often resulted in the need to make adjustments in the evaluation plan. In late 2014, all project reports and a countywide report were completed. As part of the 2013-14 process, evaluation design planning was conducted to inform the 2014-15 process, as barriers to data collection were encountered, or where other, better tools were identified and introduced as part of the plan. Data collection was scheduled to take place in August, but a health issue for the evaluator delayed this by about six or eight weeks and then a work jam occurred as the evaluation had been slated to be completed by September and so the evaluator had scheduled to complete two major grants for Sept and October. As a result, while data collection occurred during the
3
summer, report development and agency-evaluator conferences did not occur until December and January with the last report completed on Feb 3. Lessons learned from this process are included in the section that follows. Section II. General Findings In order to ensure that Year II’s evaluation is placed in context and builds off of last year’s findings, this section includes findings from last year that are then updated. In every instance, 2014-15 commentary is preceded by: 2014-15: with text then presented in italics. Every project produced data validating either client satisfaction or positive client impact. While there was considerable difference in the quality, quantity and validity of data provided, even with the leanest evaluation, there was sufficient evidence that the project was having a positive impact. In the cases where evidence was weaker than in other projects, project managers were able to make commitments to strengthen data collection in 2014-15. Section V of each evaluation, includes excerpts from every individual project evaluation that includes a project description, general findings, and the recommendations for improvement for each project. 2014-15 Amplification: Satisfaction survey data collection remained inconsistent in 2014-15 with at least two agencies failing to collect satisfaction data at all and with others reporting a smaller N than in Year I. Where a program serving multiple populations with different service mixes, quite often these programs may have collected satisfaction data from one agency, but overlooked opportunities to collect that data from other clients served by a different mix of services. These represent consistent opportunities to obtain valuable information from clients. Satisfaction surveys do not need to be lengthy, but should offer opportunities for clients to identify program strengths and program weaknesses or area for improvement (including open ended questions that can elicit specific recommendations). Agencies that did collect satisfaction almost always received important and often very specific input. Collaboration between project managers and the evaluator resulted in identification of significant areas for improvement that could only have occurred as a result of an evaluation. In every one of the eight PEI evaluations areas where projects were under-performing were identified and in most instances resulting changes identified through the process should significantly improve services for clients. As project managers from PEI-funded agencies will attest, these findings were only possible because of persistent efforts to push far beyond what agencies typically produce in monitoring reports. Indeed, it is highly unusual to see monitoring reports describing areas where projects were under-performing, where there were areas where improvement was possible, or where additional data collection could provide better insight into project operations. 2014-15 Amplification: It was interesting to see the degree to which agencies did or did not actually incorporate 2013-14 findings in the context of program planning in Year II. Three agencies, in particular, deserve to be acknowledged for taking the findings very seriously and using them to make adjustments in service delivery. Human Service Agency, Puente and Felton’s PREP programs each used the data to significantly improve practice and this resulted in concrete program improvements and improved client outcomes. PREP, in particular, was extraordinarily committed to incorporating evaluation findings into a detailed program improvement plan that was shared with BHRS leadership within two months of the completion of the 2013-14 report. This is an excellent example of how an external evaluation or a rigorous program monitoring program can create stimulate significant improvement in program operations and client outcomes.
4
Staff attrition impacted services and data collection efforts. In all but one PEI project that was evaluated, at least one key staff person left the project during the evaluation and in several agencies several staff members left the project. Only two agencies being evaluated had the same project manager in place when evaluation discussions began in Spring 2013 and at the end of the process in December 2014. This impacted the evaluation significantly as in some instances the absence of a key staff meant that important data collection processes were inconsistently implemented or were not implemented at all for periods of time. More importantly, the absence of key staff also resulted in important project functions not being delivered, at least for a time. This is a well-documented challenge throughout the public mental health system, with numerous SAMHSA studies describing the impact high staff turnover has on project services. In many instances, staff moved to county positions or positions with private providers where pay and benefits are better, in some ways almost creating a kind of ‘minor leagues’ among the service providers with their best ‘players’ moving up to the big leagues, to the detriment of the clients served by these agencies. 2014-15 Amplification: Again this year, staff turnover had a significant impact on service delivery and on data collection, especially at AARS and El Centro. Also, StarVista’s Early Childhood Community Team was challenged by the constant transition of childcare teachers at the sites where the ECCT provided consultations to caregivers and to parents. This turnover created turmoil among these programs with parents and children experiencing anxiety over new faces caring for their children. What’s more, ECCT would invest time and resources to observe, consult with and coach caregivers who then left, most often without much notice. This kind of sudden turnover prevented any post-test observation which impacted the evaluation, but more importantly resulted in a new teacher replacing the teacher who had just received support and coaching to improve practice. Recommendation I. While each agency manages these transitions differently, it may be worthwhile exploring a more systemic solution to how these transitions are addressed. One possibility might involve the use of a flexible pool of MHSA Workforce Education & Training funding to enable agencies that operate projects that incorporate multiple evidence-based practices that require significant training to implement practices to fidelity to provide training promptly when new staff are hired. 2014-15: The two agencies that implement multiple EBPs are Felton and the ECCT and neither were plagued by turnover this year. Still, other agencies even implementing single EBPs were hit with high turnover and the issue remains important to address. High staff turnover remains perhaps the single greatest impediment to consistent, high quality service delivery. Monitoring reports to the county and measures stipulated in program contracts were very uneven in quality, specificity and appropriateness to achieving a reasonable understanding of program quality and productivity. The evaluator reviewed most all of the reports and submitted to the County and all program contracts. In most every instance the reports included little, if any, detail, certainly nothing that could be used to effectively monitor project operations. In some instances, reports stated that satisfaction surveys were administered, but no results were provided. In others, data on the number of groups offered was provided, but without any data describing the number of clients that participated. Even in the best County monitoring reports, where assertions were made about the percent of clients improving in one area or another, there was never actual data provided, information about the N used was absent, and the basic assertions were not really supported. 2014-15: Monitoring reports were not reviewed for 2014-15, however several agencies consulted with the evaluator about outcomes that were recommended by BHRS as the single outcome measure to be used in reports to the County Board of Supes. In at least two instances, the outcome measure was not appropriate to the program’s focus, but even if the recommended measure had been a good one, the evaluator feels strongly that a handful of measures concisely reported make way more sense than any single measure. A single outcome measure
5
says nothing about productivity measures or satisfaction and a single outcome measure can be misleading or tell an incomplete story, especially for multi-prong programs like PREP, ECCT, Hotline and Puente. Based upon this experience, the following recommendation is made. Recommendation # II. Whatever reports are required from PEI programs should serve multiple purposes: 1) ensuring that programs are collecting and using data to inform their service delivery being the most important; 2) providing validation to the County Board of Supervisors of results accruing from funding provided and at the same time educating those Supervisors about the mental health field, its potential impacts and the limits to those impacts; and 3) data/reports that inform BHRS senior leadership as to how best to invest scarce resources. To achieve these purposes, it is recommended that BHRS incorporate a data and evaluation plan as part of the contract negotiations. Moreover, the measures incorporated into the contract would best be derived from the RFPs funding future programs. These RFPS could/should include a section that is scored and requires agencies to produce the following:
• A single productivity measure for each component of the program; • A single outcome measure for each component of the program; • A single satisfaction measure for each population served or component of the program; and • A single case study of no more than ½-1 page in length that describes a specific example of a the
way in which the program achieved its purpose. During contract negotiations, the section on data collection plan in the submitted grant could be a starting point for discussion with BHRS to finalize a set of measures to be reported annually. This does not have to be an elaborate report, indeed it shouldn’t be. But some thought needs to go into the selection of any measures included or the result can be to produce reports that do not accurately tell the story of the program. For example, one agency had a productivity measure in its contract calling for the agency to deliver 60 groups, but that measure incorporated nothing about either how many clients might participate in groups or with what frequency. In the absence of this data, there would be no difference between a program that delivered 60 groups with an average attendance of one and a program that delivered 59 groups with an average attendance of 12. Indeed, the latter agency would not have met its objective while the former would have. In another measure that had been suggested by BHRS, the agency was to increase coping skills for 90% of clients to prevent or delay their use of drugs, but there was no stipulation as to how this measure was to be determined. Here the measure should also include, the assessment instrument to be used and something about what constitutes an appropriate increase in coping skills. In the example, given the county had initially indicated that 90% of clients would achieve significant increases in the use of coping skills, a percentage that is likely much too high for a program working with high risk clients. In short, the measures selected should involve serious deliberation on the part of both the agency and BHRS. As such the task should not be left to just a BHRS manager and an Executive Director, but should include a clinician who has an intimate grasp of the program, its clients, the tools in use and realistic expectations for change among clients. To achieve any of the three purposes listed above from any monitoring report, serious deliberation is required or the reports will not inform the Board or stakeholders in a meaningful way and the agency will not be able to utilize the data to inform practice.
6
Most Funded PEI Project Personnel Lack Experience, Resources and Capacity for Participating in an External Evaluation or collecting and using data. A number of challenges emerged in attempting to secure sufficient data to create robust, valid evaluation reports.
Most agencies are simply not accustomed to collecting and using data. In most every agency, some level of attendance/participation, assessment and satisfaction data is collected, however, in most every instance agencies either failed to collect this data consistently or missed opportunities to gather data that could better validate the impact of their projects. The likely reason for this, is that agencies do not appear to use most of the data they collect, except to inform specific and individual clinical decisions. Virtually every agency had to compile pre-post assessment, attendance and/or satisfaction data in July and apparently only because it was being sought by the evaluator. If data is not organized into a database system that allows some level of manipulation and disaggregation, it is of limited value. Ideally, a database would allow project managers to examine results of pre-post test assessments at a client-level within a spreadsheet or database that allows analysis of the relationship between positive outcomes and participation levels or differences in outcomes between sites, groups, different populations or conditions. For managers to be able to do this, the data system must be simple, intuitive, and easy to operated. Once data is entered, it should easily create reports that are immediately useful to the manager. Only when managers see the value in data reports will there be motivation for gathering and compiling data. In the absence of this, data reports to an evaluator or the county will only feel like jumping through hoops. 2014-15: The recommendation below would provide agencies with technical support in identifying and using this kind of data system. Lack of sufficient administrative staffing. On several occasions data to be provided for the evaluation was entered into spreadsheets by clinical directors, accountants and project managers. If this is the only option a project has, this level of personnel may support the effort for a required evaluation or monitoring report, but will not do so for ongoing internal project improvement efforts. While there may have been administrative assistants or research assistants operating in large agencies, in most instances projects had to secure their time on a temporary basis. Even essential project management was often under-funded. For example one agency operating a complex, multi-component serving a large geographic community had only four hours a week of project management support. 2014-15. In Year II, the same situation plagued all but one or two agencies. If 10% of grant funding were dedicated to administrative support, it would go some ways to ameliorating this situation. Lack of funding. Budgets for all projects were not reviewed, but in the budgets that were reviewed and in interviews with project managers, it is clear that the County does not directly fund staffing for data collection or funding for software that would make use of data easier. While project managers understood why the County would want an evaluation of project activities, the lack of personnel to support this activity compromised the evaluation significantly.
Recommendation III—If the County is committed to promoting the use of data in ongoing project planning, quality improvement efforts, or evaluations, funding should be provided to support the required work. It would also be good to offer training in how to interpret and use data. 2014-15: In the course of conducting the Year II evaluation, it became even clearer that there was a significant gap between those with the resources and/or personnel/leadership commitment to data collection and those agencies without such a commitment. Those that were strong on this (primarily HSA, Puente and PREP),
7
were very good, used findings to inform practice and benefitted tremendously. Most of the other agencies struggled to varying degrees generally due to a seeming lack of focus on data collection and lack of appreciation for its potential value to the program, staff and clients. 2014-15: It might be possible to create quarterly or semi-annual meetings with staff from programs skilled in data collection presenting on how they collect and use data and how it has improved their services. Each session could then involve problem solving how the other agencies who had historically struggled with data collection, could improve their practice. It can’t be stressed enough that if the county wants agencies to collect and use data to inform their practice, very specific data collection and reporting requirements should be included in their contract and an annual report should be required that MUST include the agreed to data. It will continue to be exceedingly rare for agencies to consistently commit to cycles of inquiry that are embedded in their ongoing operations and used to inform program design, planning and mid-course corrections. Client emergencies, staff transition, and other factors should not be an excuse for not sustaining a commitment to this. In the absence of an effort on the part of the County to support data collection (e.g. 10% of contract funds committed to data collection and entry), technical assistance either coming from exemplary agencies, consultants, interns, a college or university, and then clearly articulated and enforced expectations, it is entirely unrealistic to expect agencies swamped with the challenge of service delivery to make it a priority to commit time and resources to data collection and inquiry. Recommendation IV from 2014-15. Achieving the above is highly unlikely to occur if it is left to a BHRS manager to work with agencies to develop their data collection plans and/or to conduct the kind of ongoing support that effective collection and use of data requires. The County should seriously consider the assignment of a single person with experience in research and evaluation and making it that person’s sole responsibility to develop measures such as those above and to provide technical assistance and support to all MHSA Programs. That person could develop an annual calendar of check-ins and site visits to meet with agencies, review data collection protocols and the databases that secure the data. The person could also then facilitate discussions with program leadership based upon an interim review of a selection of data. Through this process, the agencies can become more practiced in data collection and more appreciative of how it can improve agency practice. In this context, a commitment to data collection, research and inquiry would be fostered and supported by the county and the practice would be taken seriously by agencies. Over time, it could have a very significant impact on the quality of services and the degree to which stakeholders---who would benefit from reports that told compelling stories and validated program strengths and shortcomings—would become more informed and astute about the potential and limitations of programs funded with MHSA dollars.
8
Asian American Recovery Services: Project Grow PEI Evaluation Report 2014-15
Section I Agency & Program Description I.A. Description of Program Services Project Grow provides school-based, Evidence-Based Practice Trauma-Focused Cognitive Behavioral Therapy that focuses upon helping students develop resiliency skills necessary to be successful at school. Project Grow explicitly incorporates the development of Search Institute’s Forty-One Developmental Assets directly into each child’s individual treatment goals. Students targeted for services are determined to be at risk of serious emotional disturbance but are not eligible for an IEP. Project Grow offers strength-based individual counseling services as well as collateral services that include consulting with teachers and parents to support student success at home and in the classroom. In addition to mental health services, Project Grow provides case management services designed to connect students and their families to educational, medical, social, prevocational, rehabilitative and, as necessary, for out of home placement options. The program works not only with the students, but with parents and teachers, providing technical assistance to the teachers, and support and education to the parents. Additionally the therapist provides a high level of collateral services to both teachers and parents. Collateral services most often include consultation with the parent or teachers about behavior issues with the child. Project Grow operates throughout the school year with caseloads of at least 14 adolescents at each site although the summer program tends to be more recreational and socializing than clinical. Some families do elect to continue family therapy throughout the year. A noteworthy characteristic of this program is that many students refer their peers to the program, which indicates a high level of buy‐in on the part of the clients. I.B. Research Basis for Approach
Trauma-Focused Cognitive Behavioral Therapy (TF-CBT) is a psychosocial treatment model designed to treat posttraumatic stress and related emotional and behavioral problems in children and adolescents. Initially developed to address the psychological trauma associated with child sexual abuse, the model has been adapted for use with children who have a wide array of traumatic experiences, including domestic violence, traumatic loss, and the often multiple psychological traumas experienced by children prior to foster care placement. The treatment model is designed to be delivered by trained therapists who initially provide parallel individual sessions with children and their parents (or guardians), with conjoint parent-child sessions increasingly incorporated over the course of treatment. The acronym PRACTICE reflects the components of the treatment model:
• Psycho-education and parenting skills, • Relaxation skills, • Affect expression and regulation skills, • Cognitive coping skills and processing, • Trauma narrative, • In vivo exposure (when needed), • Conjoint parent-child sessions, and • Enhancing safety and future development.
Although TF-CBT is generally delivered in 12-16 sessions of individual and parent-child therapy, it also may be provided in the context of a longer-term treatment process or in a group therapy format. AARS
has incorporated many of the elements of the PRACTICE model but has been challenged in trying to engage parents sufficiently to incorporate parent psycho-education and conjoint sessions consistently. I.C. Target Population, Number Served and Sites
Project Grow is a school-based behavioral health project operated by Asian American Recovery Services (AARS) at two San Mateo County middle schools, Parkway Heights Middle School in South San Francisco and Thomas R. Pollicita Middle School in Daly City. Parkway Middle School serves a student population that is 78% Latino with almost 70% of students low-income, as reflected by their eligibility for Free & Reduced Lunch. Pollicita serves a more diverse population with 47% Asian and 43% Latino with 58% of students eligible for Free & Reduced Lunch. The schools are but 3 miles distant from each other with both schools located near the San Bruno Mountain State Park. Project Grow was contracted to maintain a caseload of 14 students delivering 20 hours per week per site of mental health services that include individual, group and family therapy, as well as collateral services like parent and teacher conferences. The contract stipulates that services should be delivered throughout the year, even when school is not in session. While weekly treatment services are not delivered during the summer, an array of low-intensity recreational, social, a movie with discussion, a games day with discussion and a field trip to the San Francisco zoo, and other activities are delivered throughout the summer. As the evaluation describes, site construction resulting in the lack of counseling space, challenges hiring bilingual staff, and poor communication with the Pollicita principal and the Parkway Guidance Counselor combined to significantly limit AARS’ capacity to meet these service goals. AARS reports that most all of these issues have been addressed and that the 2015-16 program year is meeting its goals, but for 2014-15, the results were far short of contract goals. Section II Evaluation Process The evaluation plan was first developed in June-July 2013 through a series of participatory meetings that included the evaluator and Fran George AARS Clinical Supervisor for AARS. A second series of meetings was held in December 2013 to assess and adapt the evaluation process and still more adjustments were made in July 2014 to secure the data. Finally, an interview was held with Fran George to review findings for 2013-14 and to make small adjustments for the 2015-16 evaluation. The primary adjustment to the evaluation plan was to:
• Seek satisfaction surveys from parents served; and • Seek satisfaction surveys from teachers as in the prior evaluation surveys from 2012-13 were
used due to a lack of surveys for 2013-14. Recommended programmatic changes were:
• To utilize a validated assessment tool to assess levels of parental stress, as anecdotal evidence of high levels of stress were reported, especially at Parkway;
• To increase parent outreach at Pollicita; and
2
• Closely monitor service delivery at Parkway as last year post-tests and social worker interviews revealed exceedingly high levels of family stress at this school.
For 2014‐15, the plan was to continue measure dosage, impact and satisfaction in the following ways. Service Dosage. Project Grow maintained a database on student participation in individual treatment sessions, and extracted case management contacts, and family therapy sessions from case notes. This enabled the evaluator to answer EQ # 1. While data was collected on group participation, no data was collected for family counseling or case management services. Service Impact. Project Grow administered a pre-post test of students upon entry to the project and upon completion of each school year. The pre-post test asks students to self report on the frequency with which they experience a variety of symptoms common to trauma exposure: (loneliness, anxiety, anger, sadness, irritability, worries) as well asking them how well they are managing these symptoms. The survey also asks students to describe the frequency with which they get into trouble at school and have conflict at home, as well as a general question asking how they are doing in school. Together, these questions provide a good snapshot of student perceptions as to how well they are doing managing stress and succeeding in school. While in 2013-14,Pre-Post tests were collected on 20 students at Policita and 12 students at Parkway and were used to evaluate the impact of the program in 2014-15 for a variety of reasons discussed under Evaluation Question I, only 14 students in total were served by groups (ten at Pollicita and four at Parkway) and only eight of these students completed Pre-Post tests, a significant constraint on the validity of findings. Satisfaction Data. While plans were made to administer satisfaction surveys with teachers and parents, due to staff turnover at the end of the school year and poor administrative oversight, no surveys were collected from teachers and only 4 parents surveys were collected. Recall that in the 2013-14 program year, plans for collecting satisfaction surveys from parents and teachers were also made, but were never administered forcing the evaluation to rely on satisfaction survey results from 2012-13. So this is the second year in a row that satisfaction surveys were not administered, as planned. The Clinical Supervisor assured the evaluator that she will personally oversee administration of satisfaction surveys with both parents and teachers for the 2015-16 evaluation. Section III Evaluation Findings There are seven evaluation questions that frame the evaluation of the Prevention & Early Intervention programs supported with Mental Health Services Act funds.
Evaluation Question # 1: Has the intervention/ program been implemented efficiently and according to the contract funding the program? Evaluation Question # 2: Has the program implemented effective program strategies? i.e. Is the program well-designed and achieving a desired impact? Evaluation Question # 3: Have clients, families, partners, and/or communities been satisfied with services?
3
Evaluation Question # 4: Have program services been responsive to the population targeted by the contract? Evaluation Question # 5: To what degree has the program advanced the vision, mission and objectives of the MHSA PEI plan? Evaluation Question # 6: What factors have impeded or contributed to successful implementation? How? Evaluation Question # 7: What steps can be taken in the future to improve program services and what data could verify that these improvements had occurred?
In 2014-15 Project Grow encountered a number of challenges which hampered program implementation to a significant degree and also limited the validity of the evaluation as only fourteen students were served all year (10 at Pollicita and 4 at Parkway), as compared with 32 last year. Project Grow Clinical Supervisor reported that both schools were in the process of rebuilding their entire campuses, which resulted a shortage of space for outside programs. At Parkway Heights the program was limited to one day a week with services not even being initiated at all until February due to space and language constraints described below. At Pollicita, the program was cut from four days a week to two days a week because of the need for the school psychologist to use the Project Grow office while her building was being demolished and rebuilt. Another significant problem was AARS’ inability to hire a Spanish-speaking Family Partner to serve both sites or a Spanish-speaking therapist for Parkway Heights Middle School, which has a parent population which is approximately 80% Spanish-speaking. As a result, the Parkway Guidance Counselor did not refer any children whose parents were monolingual Spanish, further restricting service delivery. A bilingual clinician for who is fluent in Spanish was not hired for Parkway until July 2015, which will resolve this problem for the coming academic year. However, the absence of bilingual capacity for all of 2014-15 was a significant constraint. As of November 2015, a Family Partner has still not been hired, although the Clinical Supervisor reported that approval to begin the hiring process should occur soon. The lack of bilingual capacity not only restricted referrals at Parkway, but impeded obtaining consent forms for students to participate in groups at both schools. A third challenge at Pollicita was a greatly increased difficulty in communicating with the principal, who had informed Project Grow staff at the initial meeting that he wanted to move on to either a high school or a district position. While in prior years he sometimes had to be contacted several times before replying to emails or phone calls, this year he seldom responded to either and was very difficult to engage around setting up program activities. He did obtain a position with the district office and the new principal is a former Pollicita vice-principal who was very supportive of Project Grow when he served in this role.
Finally, at Pollicita there were communication challenges between AARS and the Guidance Counselor who routinely scheduled IEPs and family or child meetings with Project Grow clients without informing AARS.
4
Taken together these significant barriers to service, many of which were outside the span of control of AARS staff significantly impeded service delivery and data collection in 2014-15. Far fewer students were served than in 2013-14, data collection was very inconsistent, and as a result the evaluation’s scope and validity was compromised to a significant degree. Evaluation Question # 1: Has the intervention/ program been implemented according to its contract? Evaluation Question 1 was answered through an analysis of data on service utilization provided by the Clinical Supervisor. As noted above, the total number of students served was severely limited due to personnel and facility issues, the latter being entirely out of AARS’ control. Nonetheless, Table I below summarizes the number of students served, the number of therapy sessions held and the number of case management contacts and family counseling sessions. The contract stipulates that caseloads of 14 should be maintained at each site, but while last year a consistent level of services was delivered during throughout the year at both schools, this year services were limited to one day a week at Parkway and two days at Pollicita. What’s more, services at Parkway were not initiated until February.
Table I: Summary of Services Delivered Service Type Tot for
Y Ave‐Per Student
Comments
Parkway N = 4 Student 1-1 therapy
29 7.17 At Parkway, only four students were served during the year, with only one individual session held before February, that a single session in January. Two students received 11 sessions over the five months of services and one received seven. This student left school in April. Last year ten students were served, receiving 298 individual sessions for an average of 24.75. So once services began in February students who participated in the program received the an appropriate number of 1-1 sessions, especially considering site constraints and services only be offered one day a week.
Case Management
While last year students received 154 case management contacts, no case management services were recorded as being delivered in 2014-15. The Clinical Supervisor reported that a limited number of case management contacts were actually completed but that they were recorded as collateral services instead of case management.
Family Therapy
While last year 38 family counseling sessions were conducted, none were conducted in 2014-15 in part due to the lack of a bilingual therapist for the entire year.
Pollicita N = 10 Student 1-1 therapy
282
28.2 Students tended to receive at least 3-4 sessions each month. The only students who didn’t receive over 20 sessions during the year were students who either entered mid-year or exited mid-year, both due to moving to a different school. Most students received over 30 sessions. Last year, the total number of students served was 20 with 495 sessions held and an average of 24.5.
Case Management
While last year 354 case management contacts were recorded, this year no case management services were recorded for the same reasons as stated by the Clinical Supervisor above.
Family Therapy
Last year seven family therapy sessions were held, but this year there were none delivered.
5
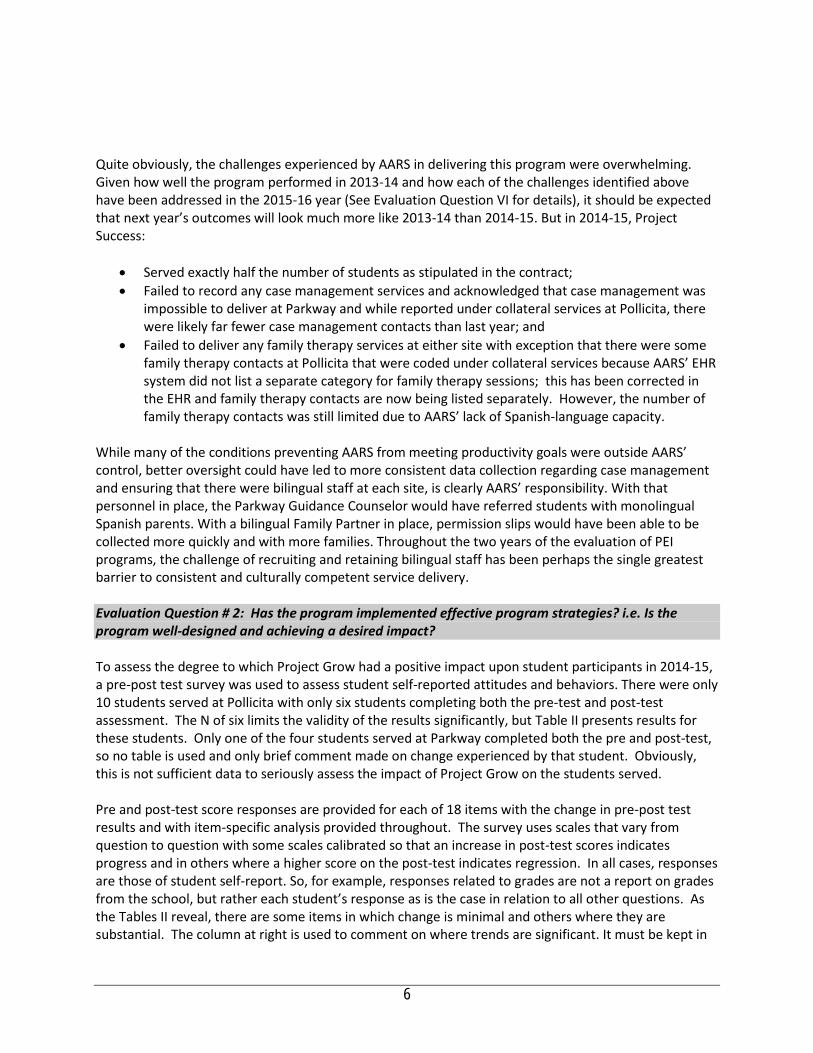
Quite obviously, the challenges experienced by AARS in delivering this program were overwhelming. Given how well the program performed in 2013-14 and how each of the challenges identified above have been addressed in the 2015-16 year (See Evaluation Question VI for details), it should be expected that next year’s outcomes will look much more like 2013-14 than 2014-15. But in 2014-15, Project Success:
• Served exactly half the number of students as stipulated in the contract; • Failed to record any case management services and acknowledged that case management was
impossible to deliver at Parkway and while reported under collateral services at Pollicita, there were likely far fewer case management contacts than last year; and
• Failed to deliver any family therapy services at either site with exception that there were some family therapy contacts at Pollicita that were coded under collateral services because AARS’ EHR system did not list a separate category for family therapy sessions; this has been corrected in the EHR and family therapy contacts are now being listed separately. However, the number of family therapy contacts was still limited due to AARS’ lack of Spanish-language capacity.
While many of the conditions preventing AARS from meeting productivity goals were outside AARS’ control, better oversight could have led to more consistent data collection regarding case management and ensuring that there were bilingual staff at each site, is clearly AARS’ responsibility. With that personnel in place, the Parkway Guidance Counselor would have referred students with monolingual Spanish parents. With a bilingual Family Partner in place, permission slips would have been able to be collected more quickly and with more families. Throughout the two years of the evaluation of PEI programs, the challenge of recruiting and retaining bilingual staff has been perhaps the single greatest barrier to consistent and culturally competent service delivery. Evaluation Question # 2: Has the program implemented effective program strategies? i.e. Is the program well-designed and achieving a desired impact? To assess the degree to which Project Grow had a positive impact upon student participants in 2014-15, a pre-post test survey was used to assess student self-reported attitudes and behaviors. There were only 10 students served at Pollicita with only six students completing both the pre-test and post-test assessment. The N of six limits the validity of the results significantly, but Table II presents results for these students. Only one of the four students served at Parkway completed both the pre and post-test, so no table is used and only brief comment made on change experienced by that student. Obviously, this is not sufficient data to seriously assess the impact of Project Grow on the students served. Pre and post-test score responses are provided for each of 18 items with the change in pre-post test results and with item-specific analysis provided throughout. The survey uses scales that vary from question to question with some scales calibrated so that an increase in post-test scores indicates progress and in others where a higher score on the post-test indicates regression. In all cases, responses are those of student self-report. So, for example, responses related to grades are not a report on grades from the school, but rather each student’s response as is the case in relation to all other questions. As the Tables II reveal, there are some items in which change is minimal and others where they are substantial. The column at right is used to comment on where trends are significant. It must be kept in
6
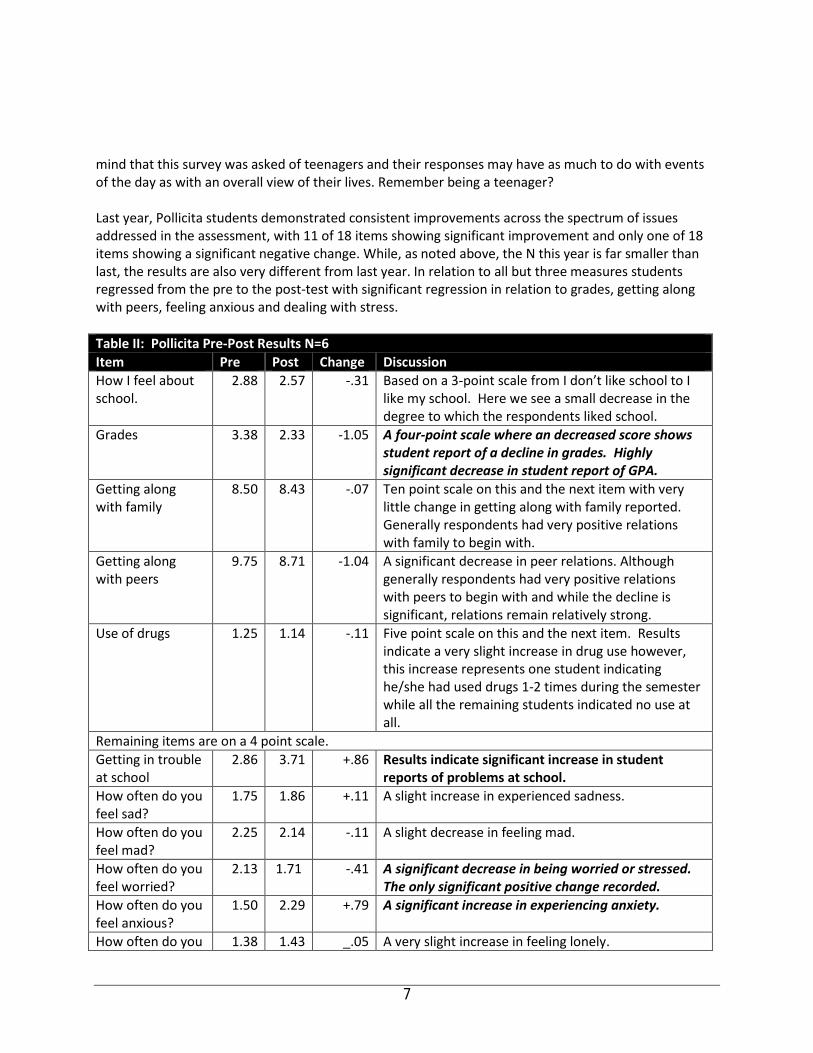
mind that this survey was asked of teenagers and their responses may have as much to do with events of the day as with an overall view of their lives. Remember being a teenager? Last year, Pollicita students demonstrated consistent improvements across the spectrum of issues addressed in the assessment, with 11 of 18 items showing significant improvement and only one of 18 items showing a significant negative change. While, as noted above, the N this year is far smaller than last, the results are also very different from last year. In relation to all but three measures students regressed from the pre to the post-test with significant regression in relation to grades, getting along with peers, feeling anxious and dealing with stress. Table II: Pollicita Pre‐Post Results N=6 Item Pre Post Change Discussion How I feel about school.
2.88 2.57 -.31 Based on a 3-point scale from I don’t like school to I like my school. Here we see a small decrease in the degree to which the respondents liked school.
Grades 3.38 2.33 -1.05 A four-point scale where an decreased score shows student report of a decline in grades. Highly significant decrease in student report of GPA.
Getting along with family
8.50 8.43 -.07 Ten point scale on this and the next item with very little change in getting along with family reported. Generally respondents had very positive relations with family to begin with.
Getting along with peers
9.75 8.71 -1.04 A significant decrease in peer relations. Although generally respondents had very positive relations with peers to begin with and while the decline is significant, relations remain relatively strong.
Use of drugs 1.25 1.14 -.11 Five point scale on this and the next item. Results indicate a very slight increase in drug use however, this increase represents one student indicating he/she had used drugs 1-2 times during the semester while all the remaining students indicated no use at all.
Remaining items are on a 4 point scale. Getting in trouble at school
2.86 3.71 +.86 Results indicate significant increase in student reports of problems at school.
How often do you feel sad?
1.75 1.86 +.11 A slight increase in experienced sadness.
How often do you feel mad?
2.25 2.14 -.11 A slight decrease in feeling mad.
How often do you feel worried?
2.13 1.71 -.41 A significant decrease in being worried or stressed. The only significant positive change recorded.
How often do you feel anxious?
1.50 2.29 +.79 A significant increase in experiencing anxiety.
How often do you 1.38 1.43 _.05 A very slight increase in feeling lonely.
7
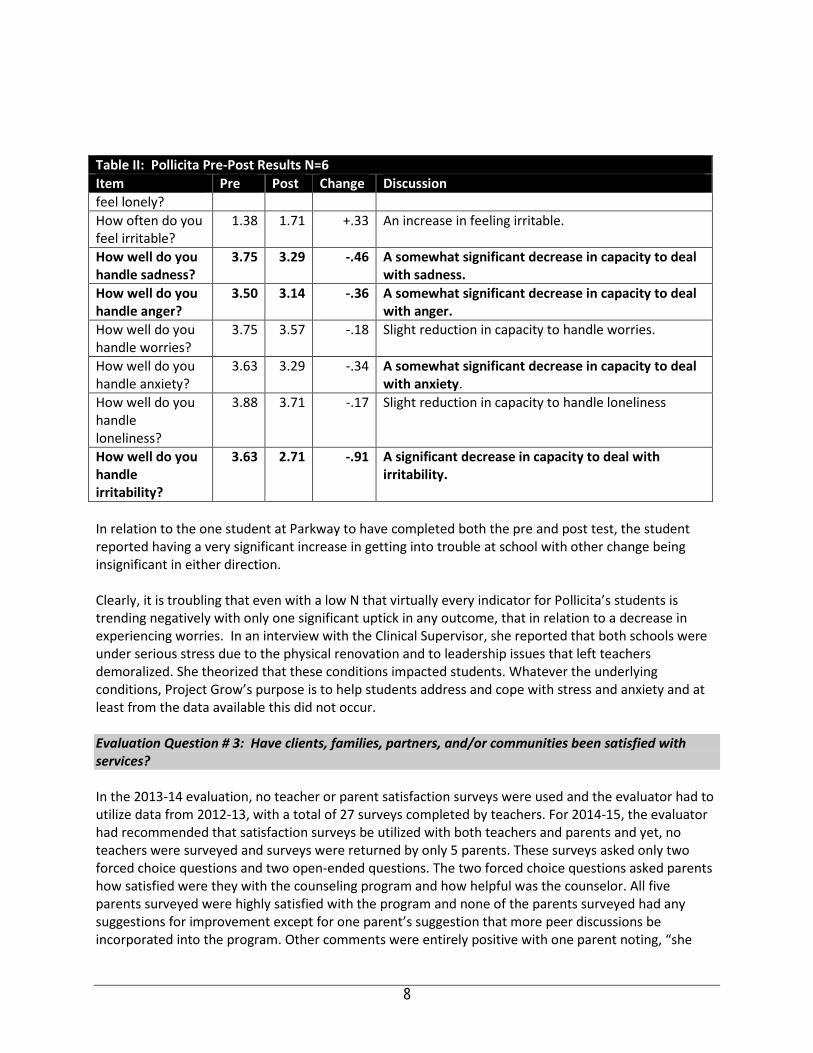
Table II: Pollicita Pre‐Post Results N=6 Item Pre Post Change Discussion feel lonely? How often do you feel irritable?
1.38 1.71 +.33 An increase in feeling irritable.
How well do you handle sadness?
3.75 3.29 ‐.46 A somewhat significant decrease in capacity to deal with sadness.
How well do you handle anger?
3.50 3.14 ‐.36 A somewhat significant decrease in capacity to deal with anger.
How well do you handle worries?
3.75 3.57 -.18 Slight reduction in capacity to handle worries.
How well do you handle anxiety?
3.63 3.29 -.34 A somewhat significant decrease in capacity to deal with anxiety.
How well do you handle loneliness?
3.88 3.71 -.17 Slight reduction in capacity to handle loneliness
How well do you handle irritability?
3.63 2.71 ‐.91 A significant decrease in capacity to deal with irritability.
In relation to the one student at Parkway to have completed both the pre and post test, the student reported having a very significant increase in getting into trouble at school with other change being insignificant in either direction. Clearly, it is troubling that even with a low N that virtually every indicator for Pollicita’s students is trending negatively with only one significant uptick in any outcome, that in relation to a decrease in experiencing worries. In an interview with the Clinical Supervisor, she reported that both schools were under serious stress due to the physical renovation and to leadership issues that left teachers demoralized. She theorized that these conditions impacted students. Whatever the underlying conditions, Project Grow’s purpose is to help students address and cope with stress and anxiety and at least from the data available this did not occur. Evaluation Question # 3: Have clients, families, partners, and/or communities been satisfied with services? In the 2013-14 evaluation, no teacher or parent satisfaction surveys were used and the evaluator had to utilize data from 2012-13, with a total of 27 surveys completed by teachers. For 2014-15, the evaluator had recommended that satisfaction surveys be utilized with both teachers and parents and yet, no teachers were surveyed and surveys were returned by only 5 parents. These surveys asked only two forced choice questions and two open-ended questions. The two forced choice questions asked parents how satisfied were they with the counseling program and how helpful was the counselor. All five parents surveyed were highly satisfied with the program and none of the parents surveyed had any suggestions for improvement except for one parent’s suggestion that more peer discussions be incorporated into the program. Other comments were entirely positive with one parent noting, “she
8

seems more open and secure,” another noting “uses methods she has learned for coping with stress,” and another noting, “he seems happier and better able to solve problems.” While these results are encouraging, quite obviously having the insights of the teachers and of more parents would provide a more complete understanding of how well the program met the needs of these two important stakeholders. Evaluation Question # 4: Have program services been responsive to the population targeted by the contract? Project Grow is clearly serving demographic populations that are historically identified as being under-served. Parkway Middle School serves a student population that is 78% Latino with almost 70% of students low-income, as reflected by their eligibility for Free & Reduced Lunch. Pollicita serves a more diverse population with 47% Asian and 43% Latino with 58% of students eligible for Free & Reduced Lunch. That students are referred because of teacher concerns about student behavior and their capacity to function effectively in the classroom suggests that students are at high risk of school failure. The Clinical Supervisor shared a few examples of the kinds of children that their program serves and these snapshots give a pretty clear indication that the students are experiencing extraordinary levels of stress, anxiety and depression:
• Student was riding in the back seat of the car and parents were arguing when suddenly the mother flung open the door and threw herself out of the car and was killed;
• Student was in the kitchen with the family when an argument erupted between the step-mother and the student’s half-brother. The father stepped between the step-mother and half-brother and the half-brother stabbed and killed the father; and
• Another student was on home study as she was struggling with sever depression and couldn’t face other students (she is back in school this year).
Given the evidence-based support for the therapeutic approach, it is clear that Project Grow services are responsive to these children. While it is clear that Project Grow serves a population at high risk of future and more costly behavior health interventions and that the evidence-based approach is tailored to this population, facility renovation activity at both sites placed considerable constraints on the program and AARS’ inability to staff the program with linguistic and culturally appropriate staff further diminished access to and quality of the program. As noted above, services were not offered at Parkway until February due to space issues and then only one day a week and services at Pollicita was limited to only two days a week all year. Under such severe constraints it is not surprising that so few students were served and such a significant reduction in the number and types of services delivered. From AARS reports, the situation is much improved in 2015-16 as is described under Evaluation Question Six. Evaluation Question # 5: To what degree has the program advanced the vision, mission and objectives of the MHSA PEI plan? The vision, mission and values of San Mateo County Behavioral Health & Recovery Services stress empowering individuals to direct their own recovery process. BHRS stresses the adoption of culturally
9
competent treatment approaches and through its MHSA planning processes, a further focus has been placed upon implementing evidence-based practices that have demonstrated the capacity to support client wellness and recovery. From the perspective of prevention, BHRS has also described the journey towards a transformed system requiring that programs:
• move “upstream” to primary prevention strategies; • partner with other health prevention efforts to focus on wellness and recovery; • achieve desired outcomes; and • integrate efforts to support sustainability;
What’s more, San Mateo’s MHSA plan clearly described the priority of intervening early and identified stress, PTSD, and use of alcohol and drugs as factors where early intervention were most important, particularly in relation to individuals from historically underserved populations.
Project Grow addresses a number of key priorities identified in the San Mateo County MHSA plan. Project Grow is an early intervention program that serves cultural populations that are historically under-served and hence is increasing access to treatment among populations that have been challenged accessing these services. The program intervenes early, providing coping skills for youth while screening for more serious conditions with early access and screening for other conditions both being priorities of the MHSA plan. Finally, Project Grow focuses on helping students cope with stress, developing coping skills and in doing so, reduce risk of school failure. Project Grow works closely with teachers at both sites, using teacher referrals as a means of identifying students at risk of academic failure. Addressing conditions triggered by trauma is an expressed priority of the MHSA plan, as is serving students at risk of school failure. So while in design Project Grow is fully aligned with the mission, vision and priorities of the MHSA and San Mateo County Behavioral Health and Recovery Services, in practice in 2014-15 space limitations and personnel issues have severely limited the degree to which students have been served at both schools, particularly at Parkway. Evaluation Question VI re-summarizes these factors and Evaluation Question VII updates the County on the status of services at the sites and identifies other changes that should be considered for 2015-16.
Evaluation Question # 6: What factors have impeded or contributed to successful implementation? How? The evaluation identified a number of factors that have impeded Project Grow’s success. Specifically: Site Construction & Lack of Space. he lack of appropriate counseling space at either school due to a significant level construction activities, thus limiting service delivery to one day a week at Parkway and two days at Pollicitas, with Parkway not even beginning services until February. Lack of Culturally Responsive Staffing. AARS’ inability to hire and retain staff, particularly bilingual staff so important to working with parents, particularly at Parkway where 70% of parents are monolingual Spanish. The lack of bilingual Family Partner who would have served both sites undermined the program in two ways: 1) it made obtaining consent for treatment forms much more challenging; 2) it made ongoing communication with parents about the counseling process and the child in counseling also more difficult. The lack of a bilingual therapist at Parkway further reduced program effectiveness as it
10
caused the school Guidance Counselor to refuse to refer students if their parents were monolingual Spanish. Poor communication with leadership at Pollicita. For years, it had been a challenge to communicate and collaborate with the principal, but in 2014-15, the principal had made it clear that he wanted no communication with AARS and that he had determined he wanted to leave his position for a district position. A poor working relationship with the School Guidance Counselor was another barrier to collaboration as she would routinely schedule IEPs or meetings with students and/or families without notifying AARS. With a strong, supportive principal in place, AARS would have had recourse for addressing and solving this challenge, but in the absence of that support, communication with the Guidance Counselor never improved.
Taken together, AARS served less than half the number of students served in 2013-14 and offered no case management services or family counseling services. What’s more, results from the very limited data available on the impact of the program with Pollicita’s students indicated that participants actually regressed in relation to all but one outcome measure. Evaluation Question # 7: What steps can be taken in the future to improve program services and what data could verify that these improvements had occurred? Clearly, the factors described under EQ # Six severely impeded AARS from implementing Project Grow to fidelity. As a result, the program served precisely half as many students as called for in the contract and failed to deliver case management to an optimal degree and did not offer family counseling at all. Fortunately in an interview with the AARS’ Clinical Supervisor it was reported that:
• Construction is nearly complete at both sites and a room is now available for counseling with services operative five days a week at both schools this year;
• A bilingual therapist is in place at Parkway and her caseload is over half full already;
• The Parkway Guidance Counselor who had refused to refer students with monolingual parents due to the absence of bilingual capacity is now making referrals to Project Grow and has formed a very positive working relationship with the Project Grow therapist;
• The 2013-14 Pollicita principal has moved on to a district position and the new principal at Pollicita is a Project Grow supporter, creating solid leadership support for the program;
• A Dean has been hired at Pollica and this person is responsible for making referrals to Project Grow and is handling the behavioral health needs of students instead of the Guidance Counselor who had been less than communicative with AARS last year.
AARS anticipates a significant improvement in this area in the coming year. However, a return to the generally highly favorable results of 2013-14 depends upon a number of factors other than those described above. Restoration of both case management and family counseling components. In 2013-14, Parkway operated a robust family counseling program while Pollicita offered almost no family counseling. It had been hoped that Parkway would sustain its level of services to families while Pollicita would increase its
11
offerings. This obviously did not occur. In 2015-16 significant improvement is needed here. While a Spanish speaking therapist has been hired at Parkway, there remains no bilingual Family Partner, the key outreach person for parents who is responsible for both case management and securing permissions from parents. In the absence of this position, AARS is likely to remain hamstrung. In an interview with the Clinical Supervisor on November 3, it was reported that the project “was close to obtaining approval from AARS leadership to post for this position and begin recruitment and that this was not possible last year as the site restrictions limited capacity to house such a person or to enable the level of case management services that would subsidize this position. With space no longer an issue and with anticipation of an larger caseload, the evaluator would hope that AARS leadership would accelerate the hiring process as from so many other evaluations of agencies throughout San Mateo County it is clear that recruitment of Spanish speaking staff in any position is an extreme challenge. The evaluator strongly recommends that the hiring process be accelerated. Pre‐Post‐test scores. The results of the Pollicita pre-post test may be an aberration, but it is impossible to overlook that post-test results showed regression in every outcome measure but one. While the N was very small, the evaluator recommends that the Clinical Supervisor meet with project staff to explore how outcomes could have deteriorated so significantly from last year. Fran George, Clinical Supervisor, suggested that school climate due to poor leadership, disruptive construction and poor teacher morale may have contributed to these low scores and high student stress, however, as noted earlier, Project Grow is designed to help students address these kinds of factors and it would be expected that outcomes would return to 2013-14 levels in 2015-16. A deep discussion among project staff could help in identifying other factors that may have contributed to such poor outcomes and help identify strategies to address those factors. Data collection at both sites needs to improve significantly. Faculty satisfaction surveys have not been administered since 2012-13 and parent satisfaction surveys were barely administered at all in 2014-15 and not at all in 2013-14. The Clinical Supervisor had promised in last year’s evaluation had promised that both surveys would be administered in 2014-15, but conditions described above resulted in this not occurring. What’s more, teacher responses to pre and post tests of the behavior checklist were very inconsistent, resulting in an N of less than 50% of the participating students. While personnel changes can lead to intended data collection from occurring, the development of written protocols describing when different survey tools should be administered and by whom would certainly increase the likelihood of more consistent practice. Further, prior to the distribution of pre and post-test surveys to principals, a join communication from the school principal and the Clinical Supervisor to all teachers should clearly specify how surveys are to be completed (i.e. providing responses to all behaviors in the checklist) and by when. Finally, the Clinical Supervisor should oversee these data collection practices much more closely, checking in with project staff before and after a satisfaction survey or pre-post survey was scheduled to be administered. With more consistent staffing, clearer protocols, and tighter oversight, significant improvement in data collection should be achievable. There is no way to characterize 2014-15 positively. The number served declined, outcomes declined, and the range of services narrowed significantly. Much of this was beyond the control of AARS, as they do not have dominion over space allocations and can’t offer counseling without appropriate space. It is encouraging to hear that 2015-16 has started off on a better foot and the evaluator hopes that with
12

more stable staffing, adequate space and better communication with the Pollicita’s principal, a return to 2013-14 outcomes and productivity will be achievable.
13
Caminar YES! Program-Seeking Safety Groups PEI Evaluation Report 2014-15
Section I Agency & Program Description I.A. Description of Program Services Caminar was established in 1964 as a non-profit corporation located in San Mateo, California. Initially envisioned to provide community-based rehabilitation support services for adults in mental health recovery, the agency’s introduction of services began with the opening of El Camino House. Since the opening of its first program, El Camino House, Caminar recovery, treatment, and support services have expanded dramatically. With services delivered in San Mateo, Solano, and Butte, California, the number of people Caminar serves yearly has grown from 41 individuals to more than 3,600. Caminar’s San Mateo mental health services focus on health & wellness, recovery, and community integration.
Since 2011 Caminar has utilized San Mateo County Behavioral Health & Recovery Services’ Prevention & Early Intervention funding to implement the YES! Program through which Caminar delivers thirteen Seeking Safety groups at six discrete locations serving transition age youth. Seeking Safety is an approach to help people attain safety from trauma/PTSD and substance abuse. Caminar’s YES! Program targets Transition Age Youth through its contacts with community‐based organizations. Seeking Safety is a manualized intervention (also available in Spanish), providing both client handouts and guidance for clinicians. It is conducted in group and individual format; with diverse populations; for women, men, and mixed‐gender groups; using all topics or fewer topics; in a variety of settings; and for both substance abuse and dependence. The key principles of Seeking Safety are:
1. Safety as the overarching goal (helping clients attain safety in their relationships, thinking,
behavior, and emotions); 2. Integrated treatment (working on both PTSD and substance abuse at the same time); 3. A focus on ideals to counteract the loss of ideals in both PTSD and substance abuse; 4. Four content areas: cognitive, behavioral, interpersonal, case management; and 5. Attention to clinician processes (helping clinicians work on countertransference, self‐care, and
other issues).
Since 1992, Seeking Safety has been implemented in more than 3,000 clinical settings and as part of statewide initiatives in Connecticut, Hawaii, Oregon, Texas, and Wyoming. It has been implemented in programs for substance abuse, mental health, domestic violence, homelessness, women and children, and veterans and in correctional, medical, and school settings in the United States and internationally, including in Argentina, Australia, Canada, France, Germany, Italy, Japan, the Netherlands, New Zealand, Scotland, and Sweden. I.B. Research Basis for Approach For programs utilizing MHSA funding, San Mateo Behavioral Health & Recovery Services has prioritized the adoption of evidence-based practices and so as part of the evaluation of PEI programs, the evaluator has conducted a brief review of the literature related to Seeking Safety. A recent comprehensive review of the literature on treatment for Post Traumatic Stress Disorder (PTSD) and Substance Use Disorder (SUD) identified Seeking Safety as the most rigorously studied treatment thus far for PTSD/SUD with 13 pilot studies, three controlled studies, and six Random Controlled Trials (Helping Vulnerable Populations: A Comprehensive Review of the Treatment Outcome Literature on Substance Use Disorder and PTSD, Najavits and Hien, 2013). Clients in Seeking Safety studies were challenged by complex trauma/PTSD, with comorbidity, high severity and chronicity, and multiple life problems. Many of the studies examined by Najavits and Hien included significant minority representation.
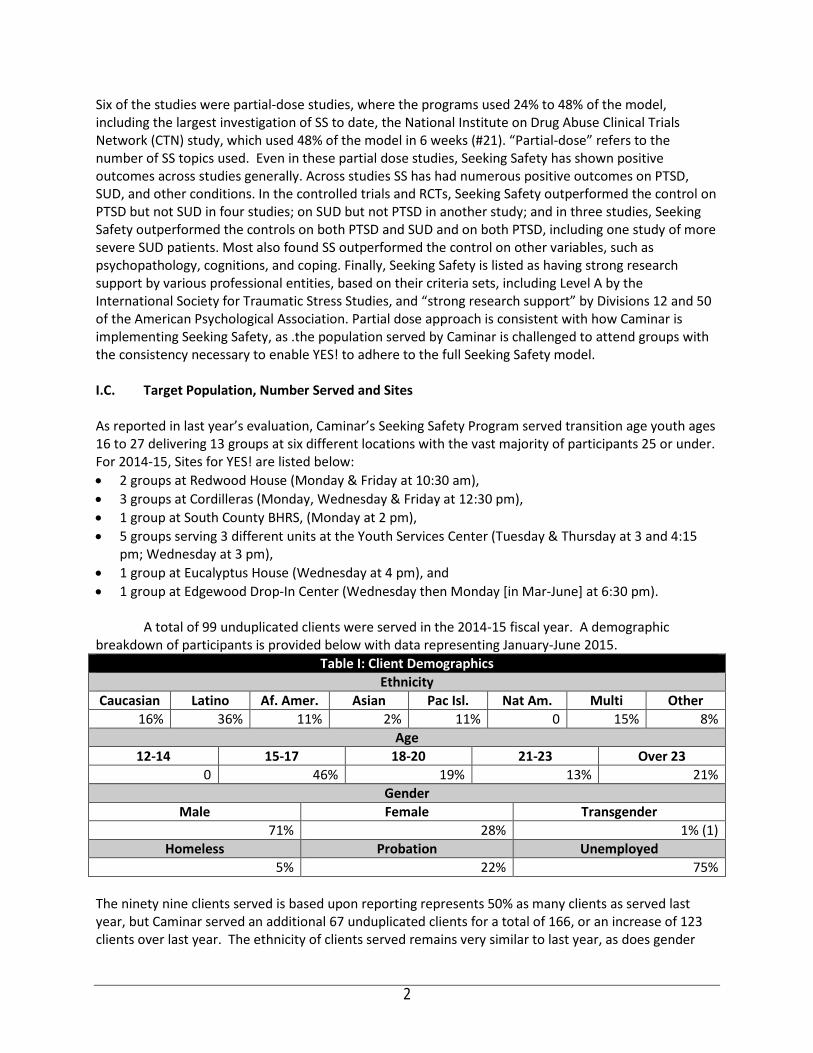
Six of the studies were partial-dose studies, where the programs used 24% to 48% of the model, including the largest investigation of SS to date, the National Institute on Drug Abuse Clinical Trials Network (CTN) study, which used 48% of the model in 6 weeks (#21). “Partial-dose” refers to the number of SS topics used. Even in these partial dose studies, Seeking Safety has shown positive outcomes across studies generally. Across studies SS has had numerous positive outcomes on PTSD, SUD, and other conditions. In the controlled trials and RCTs, Seeking Safety outperformed the control on PTSD but not SUD in four studies; on SUD but not PTSD in another study; and in three studies, Seeking Safety outperformed the controls on both PTSD and SUD and on both PTSD, including one study of more severe SUD patients. Most also found SS outperformed the control on other variables, such as psychopathology, cognitions, and coping. Finally, Seeking Safety is listed as having strong research support by various professional entities, based on their criteria sets, including Level A by the International Society for Traumatic Stress Studies, and “strong research support” by Divisions 12 and 50 of the American Psychological Association. Partial dose approach is consistent with how Caminar is implementing Seeking Safety, as .the population served by Caminar is challenged to attend groups with the consistency necessary to enable YES! to adhere to the full Seeking Safety model.
I.C. Target Population, Number Served and Sites
As reported in last year’s evaluation, Caminar’s Seeking Safety Program served transition age youth ages 16 to 27 delivering 13 groups at six different locations with the vast majority of participants 25 or under. For 2014-15, Sites for YES! are listed below: • 2 groups at Redwood House (Monday & Friday at 10:30 am), • 3 groups at Cordilleras (Monday, Wednesday & Friday at 12:30 pm), • 1 group at South County BHRS, (Monday at 2 pm), • 5 groups serving 3 different units at the Youth Services Center (Tuesday & Thursday at 3 and 4:15
pm; Wednesday at 3 pm), • 1 group at Eucalyptus House (Wednesday at 4 pm), and • 1 group at Edgewood Drop-In Center (Wednesday then Monday [in Mar-June] at 6:30 pm).
A total of 99 unduplicated clients were served in the 2014-15 fiscal year. A demographic breakdown of participants is provided below with data representing January-June 2015.
Table I: Client Demographics Ethnicity
Caucasian Latino Af. Amer. Asian Pac Isl. Nat Am. Multi Other 16% 36% 11% 2% 11% 0 15% 8%
Age 12‐14 15‐17 18‐20 21‐23 Over 23
0 46% 19% 13% 21% Gender
Male Female Transgender 71% 28% 1% (1)
Homeless Probation Unemployed 5% 22% 75%
The ninety nine clients served is based upon reporting represents 50% as many clients as served last year, but Caminar served an additional 67 unduplicated clients for a total of 166, or an increase of 123 clients over last year. The ethnicity of clients served remains very similar to last year, as does gender
2

and ages served. This year, Caminar was able to report on the % of clients who were homeless (5%), on probation (22%) or unemployed (75%). I.C. Budget Amount Funding supporting the YES! Program totaled $120,000 for the year. Funds were used to:
• 1.0 FTE case manager-facilitator; • .25 FTE assistant case manager; • snacks and beverages for groups; • local transportation; • office space and supplies; and • Supervision from the Program Director.
No funding is in the contract to cover the cost of collecting and compiling assessment and attendance data for reporting to the county or for working with the independent evaluator. While Caminar is a large agency with significant resources, Project YES! is a very small program with a small staff, six sites and thirteen groups on which to report. Nonetheless, the YES! Program Director was extremely cooperative in working with the evaluator to develop this report.
Section II Evaluation Process An evaluation plan was developed in June-July 2013 for the 2013-14 evaluation, one important component of which was a plan to collect pre and post test data on the impact of services. Unfortunately, the evaluation ran into barriers in collecting sufficient pre and post surveys to allow for statistically significant analysis. As a result, last year’s evaluation focused very much upon the degree to which participants attended a sufficient number of groups to presume an impact based upon research cited above about threshold levels of involvement required to achieve benefit. While not ideal, that was the only viable option. During that evaluation process plans the evaluator and Program Director Rick Ralphson collaborated to develop a number of changes for the 2014-15 evaluation. Since last year’s evaluation required a significant level of effort on the part of both Caminar and the evaluation, reducing the level of effort was an important priority in making these changes. Changes included:
• Client-level data was collected on attendance in all groups from January 2015 through the end
of June 2015; • A survey was administered seeking client self-report of knowledge obtained in groups related to
coping skills and triggers and related to their satisfaction with the groups, but no effort was made to collect this as pre and post test; and
• A survey was created and administered to stakeholders at Redwood, Eucalyptus, Edgewood, South County, Cordilleras, and Youth Service Center with questions seeking validation of the program’s value and impact.
3
Section III Evaluation Findings There are seven evaluation questions that frame the evaluation of the Prevention & Early Intervention programs supported with Mental Health Services Act funds.
Evaluation Question # 1: Has the intervention/ program been implemented efficiently and according to the contract funding the program? Evaluation Question # 2: Has the program implemented effective program strategies? i.e. Is the program well-designed and achieving a desired impact? Evaluation Question # 3: Have clients, families, partners, and/or communities been satisfied with services? Evaluation Question # 4: Have program services been responsive to the population targeted by the contract? Evaluation Question # 5: To what degree has the program advanced the vision, mission and objectives of the MHSA PEI plan? Evaluation Question # 6: What factors have impeded or contributed to successful implementation? How? Evaluation Question # 7: What steps can be taken in the future to improve program services and what data could verify that these improvements had occurred?
In both 2013-14 and 2014-15, YES! served a population that is highly inconsistent in group attendance due to court dates (YSC), changes in schedule in the residential programs (YSC, Cordilleras, Eucalyptus and Redwood House), the small size of the population served at South County (11 clients + 6 guests) due to the informal structure at the drop-in-centers in San Bruno and South County Clinic. Inconsistency in participation levels, something well beyond Caminar’s control, made it difficult to administer pre and post test assessments from a sufficiently large pool in 2013-14. So in 2014-15 only a single administration was conducted and 45% of all participants completed that assessment. Questions in the survey were designed to allow the evaluator to determine the degree to which the program was contributing to clients being better able to manage symptoms, identify triggers, and adopt the use of coping skills. Another factor in eliminating an effort to conduct a pre-post test was the shared perception that it would be difficult to attribute changes in client capacities in the context of Caminar’s delivering a relatively low-intensity program intervention with clients unable to attend with consistency when so many of those clients were engaged in more intensive treatment at their residential programs. In 2013-14, inconsistent participation patterns not only impeded administration of evaluation tools, but also challenged YES! staff in delivering a structured sequencing of topics that build upon prior work. So while YES! delivered all 25 Seeking Safety topics over the year, it was exceedingly difficult to go from week to week and sustain conversations with the same participants about patterns in triggers and the use of coping skills or the consequences from failure to do so. However, while during 2013-14 only two program-sites ever achieved a consistent group of participants over more than two or three weeks, in 2014-15 four groups sustained consistent participation over a period of at least 2-3 months (YSC E-7 W, YSC-7 Th, Eucalyptus, and Edgewood). Nonetheless, Caminar adapted the program to make it responsive to those in attendance at that day with case managers coming to the group with a planned topic, but adapting it to perceived or expressed client needs that day. From a review of the client self-assessment surveys it seems clear that this client-centered approach was appreciated and that participants valued the opportunity to speak with others about the issues challenging them in the moment rather than have the topic for the group foisted on them because it was time for Topic # 12.
4
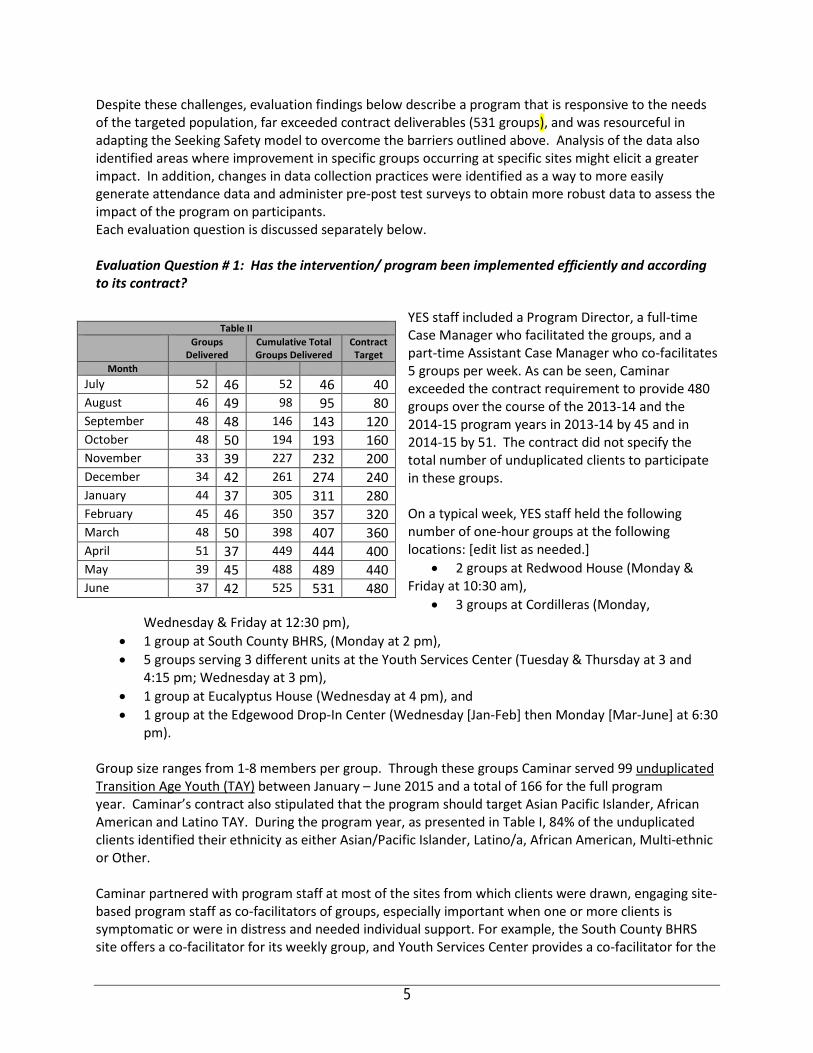
Despite these challenges, evaluation findings below describe a program that is responsive to the needs of the targeted population, far exceeded contract deliverables (531 groups), and was resourceful in adapting the Seeking Safety model to overcome the barriers outlined above. Analysis of the data also identified areas where improvement in specific groups occurring at specific sites might elicit a greater impact. In addition, changes in data collection practices were identified as a way to more easily generate attendance data and administer pre-post test surveys to obtain more robust data to assess the impact of the program on participants. Each evaluation question is discussed separately below. Evaluation Question # 1: Has the intervention/ program been implemented efficiently and according to its contract?
YES staff included a Program Director, a full-time Case Manager who facilitated the groups, and a part-time Assistant Case Manager who co-facilitates 5 groups per week. As can be seen, Caminar exceeded the contract requirement to provide 480 groups over the course of the 2013-14 and the 2014-15 program years in 2013-14 by 45 and in 2014-15 by 51. The contract did not specify the total number of unduplicated clients to participate in these groups. On a typical week, YES staff held the following number of one-hour groups at the following locations: [edit list as needed.]
• 2 groups at Redwood House (Monday & Friday at 10:30 am),
• 3 groups at Cordilleras (Monday, Wednesday & Friday at 12:30 pm),
• 1 group at South County BHRS, (Monday at 2 pm), • 5 groups serving 3 different units at the Youth Services Center (Tuesday & Thursday at 3 and
4:15 pm; Wednesday at 3 pm), • 1 group at Eucalyptus House (Wednesday at 4 pm), and • 1 group at the Edgewood Drop-In Center (Wednesday [Jan-Feb] then Monday [Mar-June] at 6:30
pm).
Group size ranges from 1-8 members per group. Through these groups Caminar served 99 unduplicated Transition Age Youth (TAY) between January – June 2015 and a total of 166 for the full program year. Caminar’s contract also stipulated that the program should target Asian Pacific Islander, African American and Latino TAY. During the program year, as presented in Table I, 84% of the unduplicated clients identified their ethnicity as either Asian/Pacific Islander, Latino/a, African American, Multi-ethnic or Other.
Caminar partnered with program staff at most of the sites from which clients were drawn, engaging site-based program staff as co-facilitators of groups, especially important when one or more clients is symptomatic or were in distress and needed individual support. For example, the South County BHRS site offers a co-facilitator for its weekly group, and Youth Services Center provides a co-facilitator for the
Table II Groups
Delivered Cumulative Total Groups Delivered
Contract Target
Month July 52 46 52 46 40 August 46 49 98 95 80 September 48 48 146 143 120 October 48 50 194 193 160 November 33 39 227 232 200 December 34 42 261 274 240 January 44 37 305 311 280 February 45 46 350 357 320 March 48 50 398 407 360 April 51 37 449 444 400 May 39 45 488 489 440 June 37 42 525 531 480
5
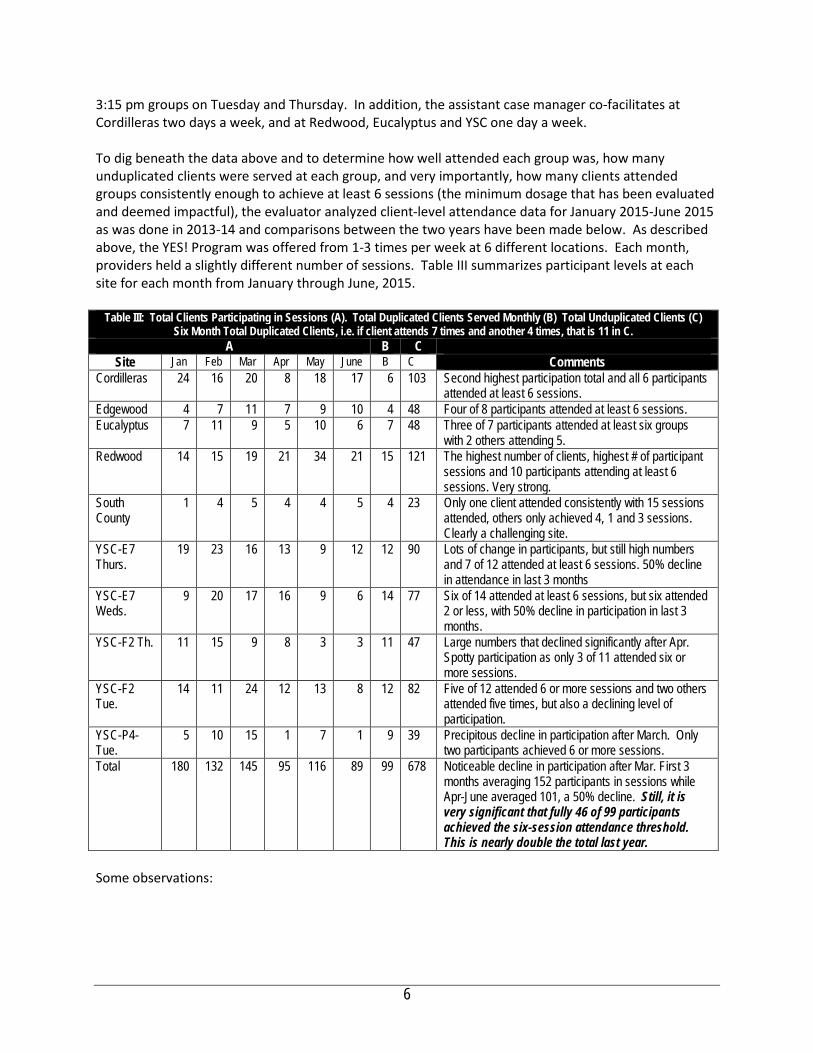
3:15 pm groups on Tuesday and Thursday. In addition, the assistant case manager co-facilitates at Cordilleras two days a week, and at Redwood, Eucalyptus and YSC one day a week. To dig beneath the data above and to determine how well attended each group was, how many unduplicated clients were served at each group, and very importantly, how many clients attended groups consistently enough to achieve at least 6 sessions (the minimum dosage that has been evaluated and deemed impactful), the evaluator analyzed client-level attendance data for January 2015-June 2015 as was done in 2013-14 and comparisons between the two years have been made below. As described above, the YES! Program was offered from 1-3 times per week at 6 different locations. Each month, providers held a slightly different number of sessions. Table III summarizes participant levels at each site for each month from January through June, 2015.
Table III: Total Clients Participating in Sessions (A). Total Duplicated Clients Served Monthly (B) Total Unduplicated Clients (C)
Six Month Total Duplicated Clients, i.e. if client attends 7 times and another 4 times, that is 11 in C. A B C
Site Jan Feb Mar Apr May June B C Comments Cordilleras 24 16 20 8 18 17 6 103 Second highest participation total and all 6 participants
attended at least 6 sessions. Edgewood 4 7 11 7 9 10 4 48 Four of 8 participants attended at least 6 sessions. Eucalyptus 7 11 9 5 10 6 7 48 Three of 7 participants attended at least six groups
with 2 others attending 5. Redwood 14 15 19 21 34 21 15 121 The highest number of clients, highest # of participant
sessions and 10 participants attending at least 6 sessions. Very strong.
South County
1 4 5 4 4 5 4 23 Only one client attended consistently with 15 sessions attended, others only achieved 4, 1 and 3 sessions. Clearly a challenging site.
YSC-E7 Thurs.
19 23 16 13 9 12 12 90 Lots of change in participants, but still high numbers and 7 of 12 attended at least 6 sessions. 50% decline in attendance in last 3 months
YSC-E7 Weds.
9 20 17 16 9 6 14 77 Six of 14 attended at least 6 sessions, but six attended 2 or less, with 50% decline in participation in last 3 months.
YSC-F2 Th. 11 15 9 8 3 3 11 47 Large numbers that declined significantly after Apr. Spotty participation as only 3 of 11 attended six or more sessions.
YSC-F2 Tue.
14 11 24 12 13 8 12 82 Five of 12 attended 6 or more sessions and two others attended five times, but also a declining level of participation.
YSC-P4-Tue.
5 10 15 1 7 1 9 39 Precipitous decline in participation after March. Only two participants achieved 6 or more sessions.
Total 180 132 145 95 116 89 99 678 Noticeable decline in participation after Mar. First 3 months averaging 152 participants in sessions while Apr-June averaged 101, a 50% decline. Still, it is very significant that fully 46 of 99 participants achieved the six-session attendance threshold. This is nearly double the total last year.
Some observations:
6
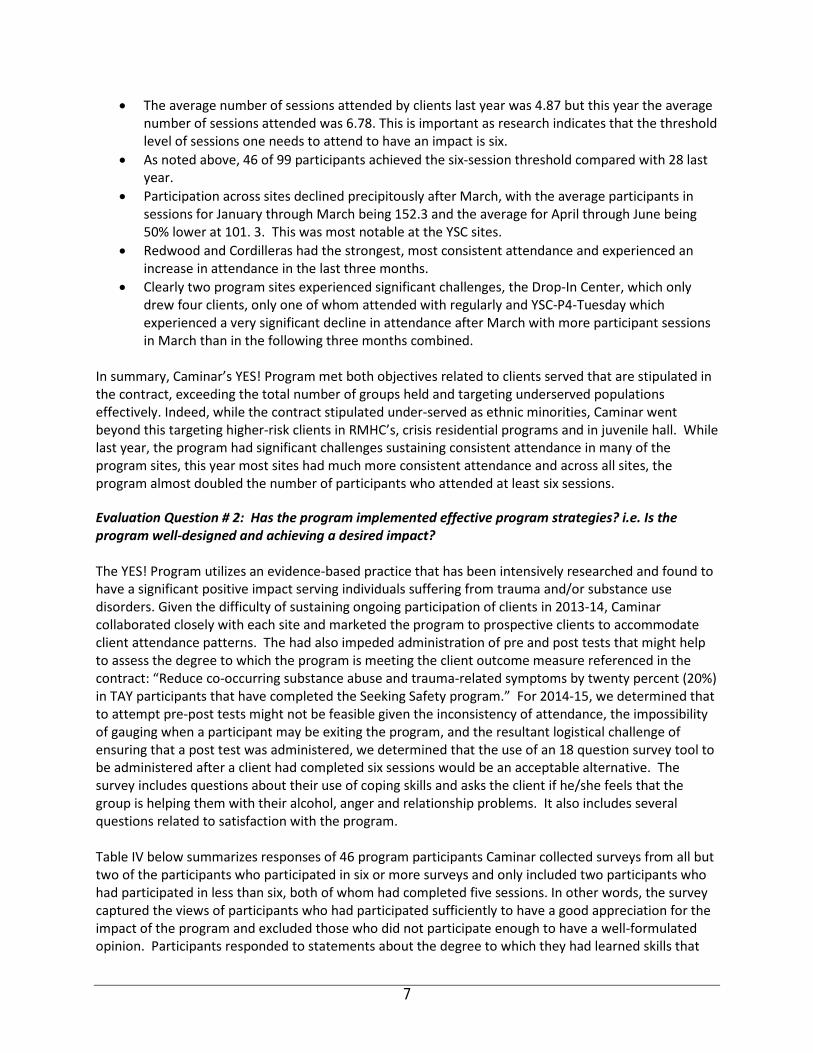
• The average number of sessions attended by clients last year was 4.87 but this year the average number of sessions attended was 6.78. This is important as research indicates that the threshold level of sessions one needs to attend to have an impact is six.
• As noted above, 46 of 99 participants achieved the six-session threshold compared with 28 last year.
• Participation across sites declined precipitously after March, with the average participants in sessions for January through March being 152.3 and the average for April through June being 50% lower at 101. 3. This was most notable at the YSC sites.
• Redwood and Cordilleras had the strongest, most consistent attendance and experienced an increase in attendance in the last three months.
• Clearly two program sites experienced significant challenges, the Drop-In Center, which only drew four clients, only one of whom attended with regularly and YSC-P4-Tuesday which experienced a very significant decline in attendance after March with more participant sessions in March than in the following three months combined.
In summary, Caminar’s YES! Program met both objectives related to clients served that are stipulated in the contract, exceeding the total number of groups held and targeting underserved populations effectively. Indeed, while the contract stipulated under-served as ethnic minorities, Caminar went beyond this targeting higher-risk clients in RMHC’s, crisis residential programs and in juvenile hall. While last year, the program had significant challenges sustaining consistent attendance in many of the program sites, this year most sites had much more consistent attendance and across all sites, the program almost doubled the number of participants who attended at least six sessions. Evaluation Question # 2: Has the program implemented effective program strategies? i.e. Is the program well-designed and achieving a desired impact? The YES! Program utilizes an evidence-based practice that has been intensively researched and found to have a significant positive impact serving individuals suffering from trauma and/or substance use disorders. Given the difficulty of sustaining ongoing participation of clients in 2013-14, Caminar collaborated closely with each site and marketed the program to prospective clients to accommodate client attendance patterns. The had also impeded administration of pre and post tests that might help to assess the degree to which the program is meeting the client outcome measure referenced in the contract: “Reduce co-occurring substance abuse and trauma-related symptoms by twenty percent (20%) in TAY participants that have completed the Seeking Safety program.” For 2014-15, we determined that to attempt pre-post tests might not be feasible given the inconsistency of attendance, the impossibility of gauging when a participant may be exiting the program, and the resultant logistical challenge of ensuring that a post test was administered, we determined that the use of an 18 question survey tool to be administered after a client had completed six sessions would be an acceptable alternative. The survey includes questions about their use of coping skills and asks the client if he/she feels that the group is helping them with their alcohol, anger and relationship problems. It also includes several questions related to satisfaction with the program. Table IV below summarizes responses of 46 program participants Caminar collected surveys from all but two of the participants who participated in six or more surveys and only included two participants who had participated in less than six, both of whom had completed five sessions. In other words, the survey captured the views of participants who had participated sufficiently to have a good appreciation for the impact of the program and excluded those who did not participate enough to have a well-formulated opinion. Participants responded to statements about the degree to which they had learned skills that
7
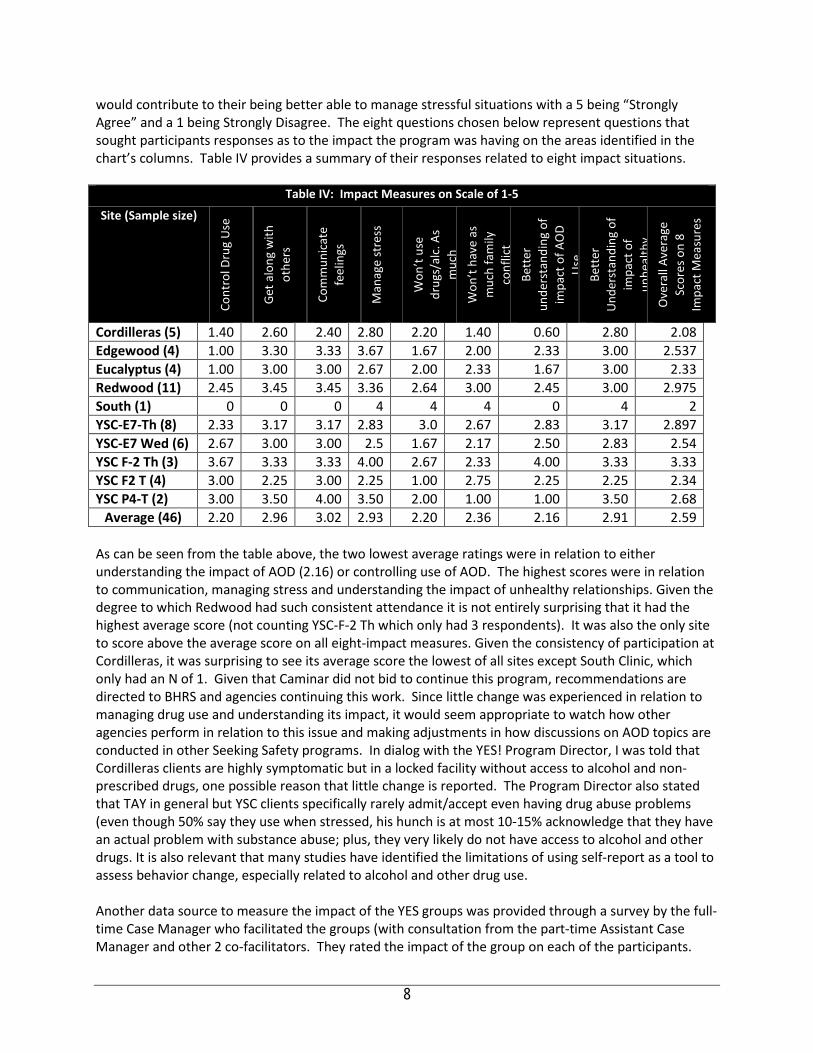
would contribute to their being better able to manage stressful situations with a 5 being “Strongly Agree” and a 1 being Strongly Disagree. The eight questions chosen below represent questions that sought participants responses as to the impact the program was having on the areas identified in the chart’s columns. Table IV provides a summary of their responses related to eight impact situations.
Table IV: Impact Measures on Scale of 1‐5
Site (Sample size) Co
ntro
l Dru
g U
se
Get a
long
with
ot
hers
Com
mun
icat
e fe
elin
gs
Man
age
stre
ss
Won
’t us
e dr
ugs/
alc.
As
muc
h W
on’t
have
as
muc
h fa
mily
co
nflic
t Be
tter
un
ders
tand
ing
of
impa
ct o
f AO
D U
se
Bett
er
Und
erst
andi
ng o
f im
pact
of
unhe
alth
y
Ove
rall
Aver
age
Scor
es o
n 8
Impa
ct M
easu
res
Cordilleras (5) 1.40 2.60 2.40 2.80 2.20 1.40 0.60 2.80 2.08 Edgewood (4) 1.00 3.30 3.33 3.67 1.67 2.00 2.33 3.00 2.537 Eucalyptus (4) 1.00 3.00 3.00 2.67 2.00 2.33 1.67 3.00 2.33 Redwood (11) 2.45 3.45 3.45 3.36 2.64 3.00 2.45 3.00 2.975 South (1) 0 0 0 4 4 4 0 4 2 YSC‐E7‐Th (8) 2.33 3.17 3.17 2.83 3.0 2.67 2.83 3.17 2.897 YSC‐E7 Wed (6) 2.67 3.00 3.00 2.5 1.67 2.17 2.50 2.83 2.54 YSC F‐2 Th (3) 3.67 3.33 3.33 4.00 2.67 2.33 4.00 3.33 3.33 YSC F2 T (4) 3.00 2.25 3.00 2.25 1.00 2.75 2.25 2.25 2.34 YSC P4‐T (2) 3.00 3.50 4.00 3.50 2.00 1.00 1.00 3.50 2.68
Average (46) 2.20 2.96 3.02 2.93 2.20 2.36 2.16 2.91 2.59
As can be seen from the table above, the two lowest average ratings were in relation to either understanding the impact of AOD (2.16) or controlling use of AOD. The highest scores were in relation to communication, managing stress and understanding the impact of unhealthy relationships. Given the degree to which Redwood had such consistent attendance it is not entirely surprising that it had the highest average score (not counting YSC-F-2 Th which only had 3 respondents). It was also the only site to score above the average score on all eight-impact measures. Given the consistency of participation at Cordilleras, it was surprising to see its average score the lowest of all sites except South Clinic, which only had an N of 1. Given that Caminar did not bid to continue this program, recommendations are directed to BHRS and agencies continuing this work. Since little change was experienced in relation to managing drug use and understanding its impact, it would seem appropriate to watch how other agencies perform in relation to this issue and making adjustments in how discussions on AOD topics are conducted in other Seeking Safety programs. In dialog with the YES! Program Director, I was told that Cordilleras clients are highly symptomatic but in a locked facility without access to alcohol and non-prescribed drugs, one possible reason that little change is reported. The Program Director also stated that TAY in general but YSC clients specifically rarely admit/accept even having drug abuse problems (even though 50% say they use when stressed, his hunch is at most 10-15% acknowledge that they have an actual problem with substance abuse; plus, they very likely do not have access to alcohol and other drugs. It is also relevant that many studies have identified the limitations of using self-report as a tool to assess behavior change, especially related to alcohol and other drug use. Another data source to measure the impact of the YES groups was provided through a survey by the full-time Case Manager who facilitated the groups (with consultation from the part-time Assistant Case Manager and other 2 co-facilitators. They rated the impact of the group on each of the participants.
8
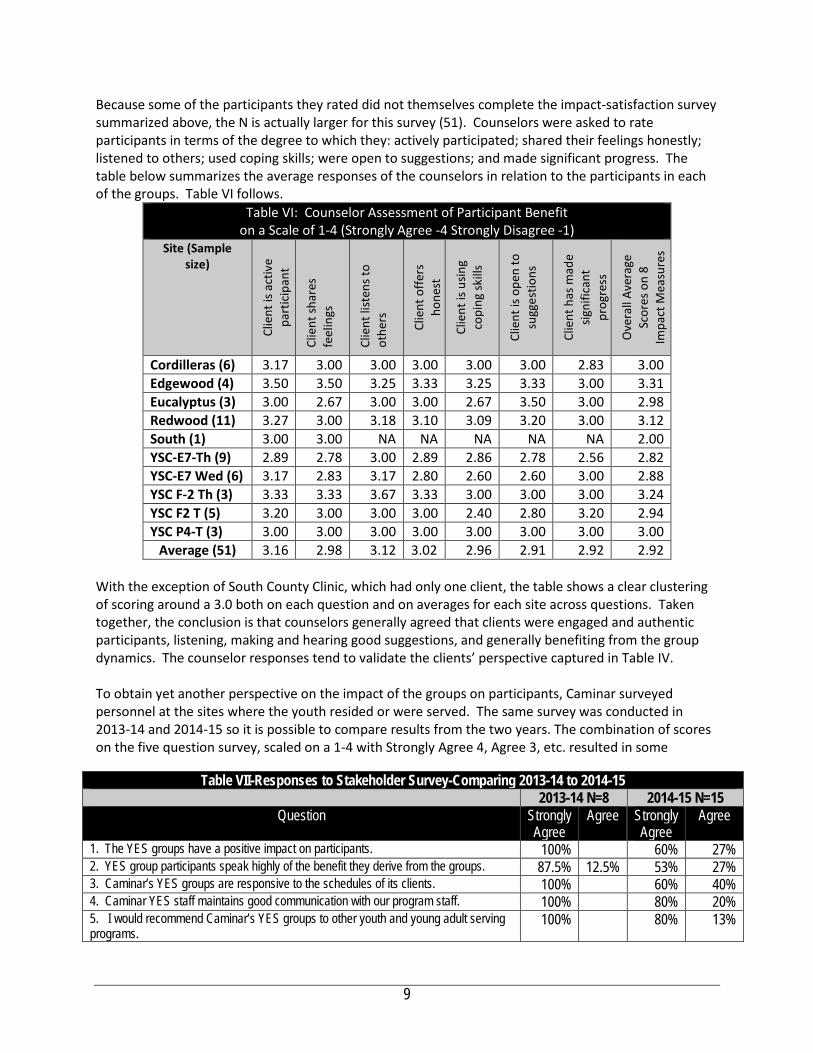
Because some of the participants they rated did not themselves complete the impact-satisfaction survey summarized above, the N is actually larger for this survey (51). Counselors were asked to rate participants in terms of the degree to which they: actively participated; shared their feelings honestly; listened to others; used coping skills; were open to suggestions; and made significant progress. The table below summarizes the average responses of the counselors in relation to the participants in each of the groups. Table VI follows.
Table VI: Counselor Assessment of Participant Benefit on a Scale of 1-4 (Strongly Agree -4 Strongly Disagree -1)
Site (Sample size)
Clie
nt is
act
ive
part
icip
ant
Clie
nt sh
ares
fe
elin
gs
Clie
nt li
sten
s to
othe
rs
Clie
nt o
ffers
ho
nest
Clie
nt is
usin
g co
ping
skill
s
Clie
nt is
ope
n to
su
gges
tions
Clie
nt h
as m
ade
signi
fican
t pr
ogre
ss
Ove
rall
Aver
age
Scor
es o
n 8
Impa
ct M
easu
res
Cordilleras (6) 3.17 3.00 3.00 3.00 3.00 3.00 2.83 3.00 Edgewood (4) 3.50 3.50 3.25 3.33 3.25 3.33 3.00 3.31 Eucalyptus (3) 3.00 2.67 3.00 3.00 2.67 3.50 3.00 2.98 Redwood (11) 3.27 3.00 3.18 3.10 3.09 3.20 3.00 3.12 South (1) 3.00 3.00 NA NA NA NA NA 2.00 YSC‐E7‐Th (9) 2.89 2.78 3.00 2.89 2.86 2.78 2.56 2.82 YSC‐E7 Wed (6) 3.17 2.83 3.17 2.80 2.60 2.60 3.00 2.88 YSC F‐2 Th (3) 3.33 3.33 3.67 3.33 3.00 3.00 3.00 3.24 YSC F2 T (5) 3.20 3.00 3.00 3.00 2.40 2.80 3.20 2.94 YSC P4‐T (3) 3.00 3.00 3.00 3.00 3.00 3.00 3.00 3.00
Average (51) 3.16 2.98 3.12 3.02 2.96 2.91 2.92 2.92 With the exception of South County Clinic, which had only one client, the table shows a clear clustering of scoring around a 3.0 both on each question and on averages for each site across questions. Taken together, the conclusion is that counselors generally agreed that clients were engaged and authentic participants, listening, making and hearing good suggestions, and generally benefiting from the group dynamics. The counselor responses tend to validate the clients’ perspective captured in Table IV. To obtain yet another perspective on the impact of the groups on participants, Caminar surveyed personnel at the sites where the youth resided or were served. The same survey was conducted in 2013-14 and 2014-15 so it is possible to compare results from the two years. The combination of scores on the five question survey, scaled on a 1-4 with Strongly Agree 4, Agree 3, etc. resulted in some
Table VII-Responses to Stakeholder Survey-Comparing 2013-14 to 2014-15 2013-14 N=8 2014-15 N=15
Question Strongly Agree
Agree Strongly Agree
Agree
1. The YES groups have a positive impact on participants. 100% 60% 27% 2. YES group participants speak highly of the benefit they derive from the groups. 87.5% 12.5% 53% 27% 3. Caminar’s YES groups are responsive to the schedules of its clients. 100% 60% 40% 4. Caminar YES staff maintains good communication with our program staff. 100% 80% 20% 5. I would recommend Caminar’s YES groups to other youth and young adult serving programs.
100% 80% 13%
9
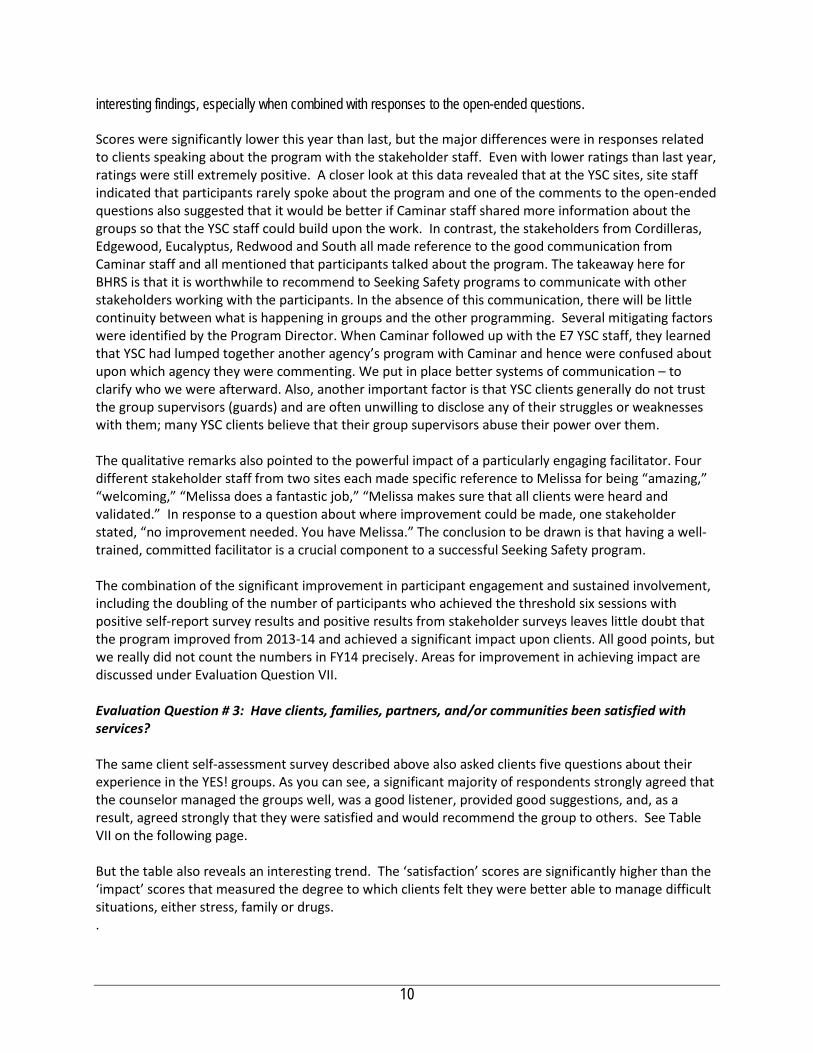
interesting findings, especially when combined with responses to the open-ended questions. Scores were significantly lower this year than last, but the major differences were in responses related to clients speaking about the program with the stakeholder staff. Even with lower ratings than last year, ratings were still extremely positive. A closer look at this data revealed that at the YSC sites, site staff indicated that participants rarely spoke about the program and one of the comments to the open-ended questions also suggested that it would be better if Caminar staff shared more information about the groups so that the YSC staff could build upon the work. In contrast, the stakeholders from Cordilleras, Edgewood, Eucalyptus, Redwood and South all made reference to the good communication from Caminar staff and all mentioned that participants talked about the program. The takeaway here for BHRS is that it is worthwhile to recommend to Seeking Safety programs to communicate with other stakeholders working with the participants. In the absence of this communication, there will be little continuity between what is happening in groups and the other programming. Several mitigating factors were identified by the Program Director. When Caminar followed up with the E7 YSC staff, they learned that YSC had lumped together another agency’s program with Caminar and hence were confused about upon which agency they were commenting. We put in place better systems of communication – to clarify who we were afterward. Also, another important factor is that YSC clients generally do not trust the group supervisors (guards) and are often unwilling to disclose any of their struggles or weaknesses with them; many YSC clients believe that their group supervisors abuse their power over them. The qualitative remarks also pointed to the powerful impact of a particularly engaging facilitator. Four different stakeholder staff from two sites each made specific reference to Melissa for being “amazing,” “welcoming,” “Melissa does a fantastic job,” “Melissa makes sure that all clients were heard and validated.” In response to a question about where improvement could be made, one stakeholder stated, “no improvement needed. You have Melissa.” The conclusion to be drawn is that having a well-trained, committed facilitator is a crucial component to a successful Seeking Safety program.
The combination of the significant improvement in participant engagement and sustained involvement, including the doubling of the number of participants who achieved the threshold six sessions with positive self-report survey results and positive results from stakeholder surveys leaves little doubt that the program improved from 2013-14 and achieved a significant impact upon clients. All good points, but we really did not count the numbers in FY14 precisely. Areas for improvement in achieving impact are discussed under Evaluation Question VII. Evaluation Question # 3: Have clients, families, partners, and/or communities been satisfied with services? The same client self-assessment survey described above also asked clients five questions about their experience in the YES! groups. As you can see, a significant majority of respondents strongly agreed that the counselor managed the groups well, was a good listener, provided good suggestions, and, as a result, agreed strongly that they were satisfied and would recommend the group to others. See Table VII on the following page. But the table also reveals an interesting trend. The ‘satisfaction’ scores are significantly higher than the ‘impact’ scores that measured the degree to which clients felt they were better able to manage difficult situations, either stress, family or drugs. .
10
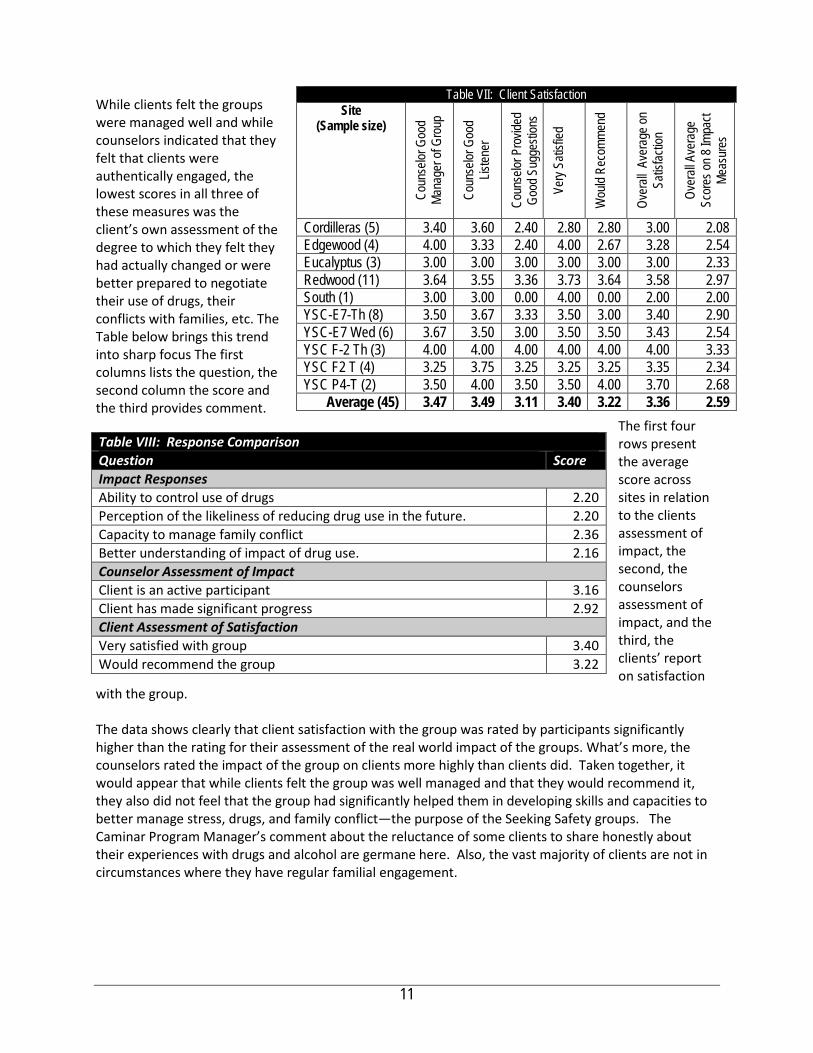
While clients felt the groups were managed well and while counselors indicated that they felt that clients were authentically engaged, the lowest scores in all three of these measures was the client’s own assessment of the degree to which they felt they had actually changed or were better prepared to negotiate their use of drugs, their conflicts with families, etc. The Table below brings this trend into sharp focus The first columns lists the question, the second column the score and the third provides comment.
The first four rows present the average score across sites in relation to the clients assessment of impact, the second, the counselors assessment of impact, and the third, the clients’ report on satisfaction
with the group. The data shows clearly that client satisfaction with the group was rated by participants significantly higher than the rating for their assessment of the real world impact of the groups. What’s more, the counselors rated the impact of the group on clients more highly than clients did. Taken together, it would appear that while clients felt the group was well managed and that they would recommend it, they also did not feel that the group had significantly helped them in developing skills and capacities to better manage stress, drugs, and family conflict—the purpose of the Seeking Safety groups. The Caminar Program Manager’s comment about the reluctance of some clients to share honestly about their experiences with drugs and alcohol are germane here. Also, the vast majority of clients are not in circumstances where they have regular familial engagement.
Table VII: Client Satisfaction Site
(Sample size)
Coun
selor
Goo
d Ma
nage
r of G
roup
Coun
selor
Goo
d Lis
tener
Coun
selor
Pro
vided
Go
od S
ugge
stion
s
Very
Satis
fied
Wou
ld Re
comm
end
Over
all A
vera
ge on
Sa
tisfac
tion
Over
all A
vera
ge
Scor
es on
8 Im
pact
Meas
ures
Cordilleras (5) 3.40 3.60 2.40 2.80 2.80 3.00 2.08 Edgewood (4) 4.00 3.33 2.40 4.00 2.67 3.28 2.54 Eucalyptus (3) 3.00 3.00 3.00 3.00 3.00 3.00 2.33 Redwood (11) 3.64 3.55 3.36 3.73 3.64 3.58 2.97 South (1) 3.00 3.00 0.00 4.00 0.00 2.00 2.00 YSC-E7-Th (8) 3.50 3.67 3.33 3.50 3.00 3.40 2.90 YSC-E7 Wed (6) 3.67 3.50 3.00 3.50 3.50 3.43 2.54 YSC F-2 Th (3) 4.00 4.00 4.00 4.00 4.00 4.00 3.33 YSC F2 T (4) 3.25 3.75 3.25 3.25 3.25 3.35 2.34 YSC P4-T (2) 3.50 4.00 3.50 3.50 4.00 3.70 2.68
Average (45) 3.47 3.49 3.11 3.40 3.22 3.36 2.59
Table VIII: Response Comparison Question Score Impact Responses Ability to control use of drugs 2.20 Perception of the likeliness of reducing drug use in the future. 2.20 Capacity to manage family conflict 2.36 Better understanding of impact of drug use. 2.16 Counselor Assessment of Impact Client is an active participant 3.16 Client has made significant progress 2.92 Client Assessment of Satisfaction Very satisfied with group 3.40 Would recommend the group 3.22
11
Evaluation Question # 4: Have program services been responsive to the population targeted by the contract? Caminar’s contract stipulated that it should target “at-risk” transition-age youth with a focus on Asian, Pacific Islander, African American and Latino/a populations. Demographic data on clients’ served demonstrates that during the program year, 84% of the 99 unduplicated clients identified their ethnicity as either Asian/Pacific Islander, Filipino, Latino/a, African American, Israeli, or Multi-ethnic, so clearly the YES! groups were reaching the demographic population identified in the contract. Table I provides a breakdown of the total ethnicity of clients enrolled in YES! and shows clearly that YES! worked with a diverse client base that is historically under-served. A clear demonstration of the degree to which Caminar’s Seeking Safety Program serves ‘at-risk’ transition age youth ages 16 to 27 is evident from a review of the populations served by the six different locations from which Caminar drew clients:
• Cordilleras, located in Redwood City, Cordilleras is a locked mental health rehabilitation center for
adults with chronic mental illness housing 68 clients many of whom have serious mental health conditions;
• Redwood House, located in Redwood City and operated by Caminar, Redwood House is a crisis residential program that offers an alternative to hospitalization for individuals in the recovery process;
• South County BHRS Clinic, located in Redwood City, South County Clinic is part of the BHRS mental health system offering a wide range of outpatient treatment services;
• Eucalyptus House, located in Daly City, Eucalyptus House is 12-bed transitional residential program that helps people prepare for independent living;
• Edgewood Drop-In Center, located in San Bruno, the Drop-In Center is a voluntary, peer-driven program that provides interpersonal, educational, vocational, wellness, and recreational opportunities for San Mateo County young adults between the ages of 18-25 to expand the skills necessary for a successful transition into adulthood.; and
• Youth Services Center, a locked prison facility located in the city of San Mateo, YSC provides the Juvenile Probation charges with a range of mental health services and supports for adolescents and their families needing more than routine probation. At this location, Caminar offers five separate groups, as described below.
By definition, clients served at the above locations are at extremely high-risk. Additional evidence of client risk was identified through another survey developed by the evaluator. In last years survey administered to participants, the 17-item survey included questions about the level of stress experienced and the frequency with which clients used coping skills to address stressful situations. One can assume that this year’s population did not differ significantly from those taking this survey last year. Survey results showed that:
• 37% of respondents indicated that they often or almost always found that anxiety interfered with
their personal relationships; • 50% of respondents indicated that they often or always used drugs or alcohol when stressed with
25% of respondents indicating always; • 43% of respondents indicated that they rarely or never got the sleep they need with 32% indicating
that they never do;
12
• 48% of respondents indicated that they often or always were very stressed with 32% indicating that they were always very stressed;
• 43% of respondents indicated that they never or rarely were able to use relaxation techniques to calm themselves when stressed with 32% indicating never; and
• 44% of respondents indicated that they never or rarely were able to ask someone for help when stressed, with 31% indicating never.
Taken together, these results present a client base that experiences significant levels of stress; where that stress has a negative impact upon their relationships; and where they are not able to access help appropriately, calm themselves or get the sleep needed that might help prevent the stress. The data above provides ample evidence that the client-base served by YES! groups is ‘at high-risk.’ In sum, Caminar has partnered with referring agencies whose population are by definition at high risk, has successfully engaged demographic populations that are historically under-served and were identified to be targeted in the contract; and has presented data that shows that clients have experienced high levels of stress and lack coping skills to manage that stress effectively.
Evaluation Question # 5: To what degree has the program advanced the vision, mission and objectives of the MHSA PEI plan? The vision, mission and values of San Mateo County Behavioral Health & Recovery Services stress empowering individuals to direct their own recovery process. BHRS stresses the adoption of culturally competent treatment approaches and through its MHSA planning processes, a further focus has been placed upon implementing evidence-based practices that have demonstrated the capacity to support client wellness and recovery. From the perspective of prevention, BHRS has also described the journey towards a transformed system requiring that programs:
• move “upstream” to primary prevention strategies; • partner with other health prevention efforts to focus on wellness and recovery; • achieve desired outcomes; and • integrate efforts to support sustainability;
What’s more, San Mateo’s MHSA plan clearly described the priority of intervening early and identified stress, PTSD, and use of alcohol and drugs as factors where early intervention were most important, particularly in relation to individuals from historically underserved populations.
Caminar’s YES! Project clearly responds to the vast majority of these expressed priorities. The treatment approach, Seeking Safety, is perhaps the most studied evidence-based practice in mental health and it was explicitly designed to build the competence of participants, to help them develop coping skills, identify stress-triggers and learn to manage their stress rather than be managed by it. Caminar partnered with referring agencies that serve populations experiencing extreme levels of stress and Caminar successfully engaged clients from historically under-served populations. Caminar also partnered with six different treatment centers, incorporating their clinicians at YSC and South County into the framework of the Seeking Safety groups with clinicians and case managers from these sites serving as co-facilitators. In addition, YES staff work intensively with staff at all sites to coordinate and schedule services, to select clients to ensure that the groups will be cohesive (e.g. no rival gang members without careful deliberation).
13

Evaluation Question # 6: What factors have impeded or contributed to successful implementation? How? Last year, Caminar faced significant challenges in delivering the Seeking Safety model to a consistent client base and in collecting data to validate the impact of the program. The greatest challenge was in relation to inconsistent client attendance at some sites and last-minute site-specific schedule changes. Clients participate voluntarily and enjoy their experiences. But they are not always at the group location at the time of the group (e.g., a client(s) just may not be at South County or Edgewood on a given Monday afternoon or evening. Also, Youth Services Center clients are routinely in and out of custody). The other, though much less frequent, obstacles to effective groups is site-specific. Groups can be cancelled at the last minute. For instance, if there is a “code” or emergency lock-down at the Youth Services Center, then groups may be cancelled or shortened (or “groups” are held individually through client jail cell doors). The inconsistency of attendance made it challenging for Caminar to deliver the Seeking Safety model to fidelity. While all 25 topics were delivered over the course of the year, Caminar staff flexibility and creativity have allowed the program to navigate the challenges. From the evaluator’s perspective, the population served by Caminar’s YES! program is at extreme high risk of future incarceration and/or hospitalization. In 2014-15, however, with one significant exception, attendance was far more consistent resulting in 46 clients participating in at least six sessions, almost double the number achieving this threshold last year. The exception to a decided improvement in consistency of attendance was found in the YSC from April through June when attendance declined by 50% across the YSC groups. Evaluation Question # 7: What steps can be taken in the future to improve program services and what data could verify that these improvements had occurred? In order to improve the quality of the YES! program and enhance its ability to demonstrate clear client benefit, the following recommendations (in bullets) were made last year. After each bullet, comments are made as to the degree to which the recommendations were addressed. • Examine ways to incorporate the YES groups more integrally within Eucalyptus, Cordilleras, and
Redwood so as to foster greater, more consistent participation; Comments from the open-ended questions in the survey administered with stakeholders noted the high degree to which the Seeking Safety counselor communicated with staff at these sites at the sites other than at YSC and these comments indicated that they greatly valued this communication. As noted above, it appears that the YSC staff had misunderstood about which program they were actually commenting upon, so their providing a low rating may be attributable to that confusion.
• Develop a protocol with partner agencies through which YES staff are notified in advance of pending discharges whenever possible so that YES could more easily schedule post-test surveys needed to document program impact upon clients; and
• Implement a protocol to administer a pre-post test to all clients attending their first group and then
track client participation more consistently throughout the year to better enable administering a post-test whenever a client completes a sixth session.
14

A decision was made after the evaluation that pre and post test surveys were both too cumbersome and logistically difficult to manage given the uncertain attendance of the participants. The Caminar Program Director also, that he felt it was impossible to isolate the precise effects of the YES groups given that most clients only experience 1 hour (or, for a handful, a max of 3 hours) per week of the intervention; so many, many more factors influence a client’s progression. Hence, he wondered at the validity of using pre and post test surveys when other factors could be more important and be impacting the clients more significantly than the YES Groups. As a result, instead several forms of one-time assessments were used to assess with some precision, the impact of the group on clients. Surveys were administered with participants after their sixth session; with stakeholder staff at YSC, Redwood, Cordilleras, etc. and with the Seeking Safety counselors themselves.
Since Caminar elected not to seek continuing funds for this program, recommendations below are addressed to BHRS and contracted agencies operating Seeking Safety groups in 2015-16 and beyond.
• Communication with host agencies (schools, mental health clinics, juvenile facilities, etc.) is important to extending the impact of the program and enabling host staff to discuss the groups with participants in a more informed manner;
• Participants indicated that they did not feel that the groups were having a significant impact upon their ability to manage drugs or conflict with families. It would be worthwhile for BHRS leadership to consult to monitor outcomes related to the areas where groups did not achieve their goals and if it is found that the new Seeking Safety groups are equally challenged, then it would be worthwhile consulting the literature and making adjustments or augmentations to program design to address this challenge; and
• Consistency in attendance correlated highly with better outcomes. Caminar was working with a population that faced significant barriers in maintaining consistent attendance, yet improved in this regard in 2014-15. It would be important to emphasize with other agencies offering Seeking Safety groups, the importance of consistent attendance and build into their contracts requirements to collect and share data at the client level, related to attendance. Simply presenting data on the number of groups presented and the average attendance in each group tells you nothing about how frequently and how consistently individual clients attended.
• Finally, evaluation or monitoring efforts should also seek to gather pre-post test data and analyze it at a client level to facilitate analysis of differences in impact between those who attend consistently and those who attend irregularly or infrequently.
15
El Centro’s AC-OK Program (Seeking Safety Groups) PEI Independent Evaluation 2014-15 Conducted by Gibson & Associates
Report of Findings Section I Agency & Program Description I.A. Description of Program Services Since 2011 El Centro has utilized San Mateo County Behavioral Health & Recovery Services’ Prevention & Early Intervention funding to implement the Seeking Safety through which El Centro delivers weekly Seeking Safety group sessions at El Centro’s Redwood City clinic and in Half Moon Bay. Seeking Safety is an approach to help people attain safety from trauma/PTSD and substance abuse. Seeking Safety is a manualized intervention (also available in Spanish), providing both client handouts and guidance for clinicians. It is conducted in group and individual format; with diverse populations; for women, men, and mixed‐gender groups; using all topics or fewer topics; in a variety of settings; and for both substance abuse and dependence.
El Centro’s AC-OK Seeking Safety program targeted Transition Age Youth and young adults, the vast majority of whom were referred by the Department of Probation. El Centro named its Seeking Safety program the AC-OK Program as it conveyed a more positive image than Seeking Safety. In 2013-14, AC-OK served 40 transition-age youth involved in the juvenile or adult justice systems. Between the two sites, a total of ninety-six groups were contracted to be conducted in 2013-14, however as described in last year’s report, El Centro was unable to engage sufficient numbers of Half Moon Bay residents to sustain attendance for groups in that Coastside community, however El Centro offered 130 individual counseling sessions to 18 Coastside residents and conducted outreach to promote the program via participation in community events, networking with other providers in the area, communicating with probation officers. As a result, El Centro plans to initiate groups in Half Moon Bay in 2015. This report examines the degree to which these planned changes were implemented and the degree to which El Centro achieved productivity, satisfaction and impact objectives.
The key principles of Seeking Safety are:
1. Safety as the overarching goal (helping clients attain safety in their relationships, thinking, behavior, and emotions);
2. Integrated treatment (working on both PTSD and substance abuse at the same time); 3. A focus on ideals to counteract the loss of ideals in both PTSD and substance abuse; 4. Four content areas: cognitive, behavioral, interpersonal, case management; and 5. Attention to clinician processes (helping clinicians work on countertransference, self‐care,
and other issues).
Since 1992, Seeking Safety has been implemented in more than 3,000 clinical settings and as part of statewide initiatives in Connecticut, Hawaii, Oregon, Texas, and Wyoming. It has been implemented in programs for substance abuse, mental health, domestic violence, homelessness, women and children, and veterans and in correctional, medical, and school settings in the United States and internationally, including in Argentina, Australia, Canada, France, Germany, Italy, Japan, the Netherlands, New Zealand, Scotland, and Sweden. I.B. Research Basis for Approach
For programs utilizing MHSA funding, San Mateo Behavioral Health & Recovery Services has prioritized the adoption of evidence-based practices and so as part of the evaluation of PEI programs, the evaluator has conducted a brief review of the literature related to Seeking Safety. A recent comprehensive review of the literature on treatment for Post Traumatic Stress Disorder (PTSD) and Substance Use Disorder (SUD) identified Seeking Safety as the most rigorously studied

treatment thus far for PTSD/SUD with 13 pilot studies, three controlled studies, and six Random Controlled Trials (Helping Vulnerable Populations: A Comprehensive Review of the Treatment Outcome Literature on Substance Use Disorder and PTSD, Najavits and Hien, 2013). Clients in Seeking Safety studies were challenged by complex trauma/PTSD, with comorbidity, high severity and chronicity, and multiple life problems. Many of the studies examined by Najavits and Hien included significant minority representation. Six of the studies were partial-dose studies, where the programs used 24% to 48% of the model, including the largest investigation of SS to date, the National Institute on Drug Abuse Clinical Trials Network (CTN) study, which used 48% of the model in 6 weeks (#21). “Partial-dose” refers to the number of SS topics used. Even in these partial dose studies, Seeking Safety has shown positive outcomes across studies generally, an important finding since both SMC BHRS PEI agencies (Caminar and El Centro) implementing Seeking Safety had difficulty sustaining sufficient client engagement to have clients achieve the six-session threshold. Across studies SS has had numerous positive outcomes on PTSD, SUD, and other conditions. In the controlled trials and RCTs, Seeking Safety outperformed the control on PTSD but not SUD in four studies; on SUD but not PTSD in another study; and in three studies, Seeking Safety outperformed the controls on both PTSD and SUD and on both PTSD, including one study of more severe SUD patients. Most also found SS outperformed the control on other variables, such as psychopathology, cognitions, and coping. Finally, Seeking Safety is listed as having strong research support by various professional entities, based on their criteria sets, including Level A by the International Society for Traumatic Stress Studies, and “strong research support” by Divisions 12 and 50 of the APA.
I.C. Target Population, Number Served and Sites El Centro’s AC-OK Program served a population of youth and young adults identified as being at high risk primarily by virtue of client involvement in the juvenile or adult justice system. The table presented under Evaluation Question I (below), captures the age, ethnicity, and referral source of the forty clients served by El Centro’s Seeking Safety Program. The contract stipulated that El Centro target Latino, Asian, Pacific Islander, and African American populations as these are historically unders-served populations who, aside from Asian youth, are also historically over-represented in the justice system. The table shows that while El Centro was successful in serving over 82% clients of color with 78% of clients being Latino. While the contract stipulated that El Centro target a more diverse range of cultures, certainly they met the objective of 60% of their clients coming from communities of color. In an interview with the Program Manager and agency CFO, they explained that El Centro has a specific service niche in the community with a focus upon delivering culturally relevant services to the Latino/a community. This is reflected in the high percentage of Latino participants. While El Centro conducts extensive outreach to identify potential clients, the community has come to view El Centro more as a provider for the Latino community, a view shared by probation officers who make over 80% of the referrals to the program. The contract did not stipulate how many clients should be served or with what frequency clients should participate, instead only stipulating that 96 groups be offered. Weekly open-enrollment groups were delivered at El Centro’s clinic in Redwood City and while the Redwood City site conducted 51 groups in 2013-14 (3 above its goal), no groups were conducted in Half Moon Bay. As El Centro leadership recognized that groups were simply not engaging consistent attendance, it shifted service delivery to offering individual counseling services while continuing outreach to community providers to promote group participation. During 2013-14, El Centro served a total of 18 clients with 130 individual counseling sessions an indication that services are in demand, but that more work must be done to engage a sufficient threshold level of participation in the group
2
model. During 2014-15, El Centro did not serve as many clients as in 2013-14, serving a total of 33, seven (25%) fewer than the 40 served in 2013-14. In addition, El Centro delivered 154 individual counseling sessions to 33 clients, an increase from 2013-14 both in the number served (33 vs. 18) and the number of sessions delivered (154 vs 130). What’s more, in 2014-15, El Centro also provided 53 case management contacts for 20 clients. These increases were offset by El Centro’s again not being able to engage clients in Half Moon Bay where, as in 2013-14, El Centro failed to gain a foothold in the community and did not serve any clients in that community. Section II Evaluation Process The evaluation plan was developed in June-July 2013 through a series of participatory meetings that included the evaluator and El Centro’s Program Manager Joe Macedo. A second series of meetings was held in December 2013 to assess and adapt the evaluation process and still more adjustments were made in July and August 2014 to respond to challenges El Centro incurred in collecting data. As with the other Seeking Safety program supported by PEI funding (Caminar), a pre-post test was developed to measure change in the use of coping skills to mitigate the degree to which trauma, stress, and drug and/or alcohol use were impacting social functioning. However, for different reasons both agencies failed to utilize this pre-post test tool. El Centro did utilize a tool that included questions selected from the Addiction Severity Index (ASI). However, even when using this tool, El Centro was only able to produce pre-post- test results for ten clients served in 2013-14. In addition to the pre-post test data, El Centro also collected and provided client-level data was collected on attendance in all groups from July 1, 2013 through the end of June 2014. In addition, El Centro administered a series of satisfaction surveys with 34 clients providing responses to 11 items related to various aspects of client satisfaction. Throughout the process, staff at El Centro was very responsive, acknowledging that their data collection fell short of what had been planned. To address this staff re-engaged clients who had completed the program to take the post-test to increase the number of clients with pre and post tests. For 2014-15, the same pre-post test was used, again derived from parts of the ASI. This year, while El Centro completed 33 survey pre-tests, once again, they were able to complete only sever post-tests, again significantly constraining evaluation efforts. What’s more, no satisfaction surveys were collected. So once again, as Section III describes, the lack of sufficient data limited the scope of the evaluation. Section III Evaluation Findings There are seven evaluation questions that frame the evaluation of the Prevention & Early Intervention programs supported with Mental Health Services Act funds.
Evaluation Question # 1: Has the intervention/ program been implemented efficiently and according to the contract funding the program? Evaluation Question # 2: Has the program implemented effective program strategies? i.e. Is the program well-designed and achieving a desired impact? Evaluation Question # 3: Have clients, families, partners, and/or communities been satisfied with services? Evaluation Question # 4: Have program services been responsive to the population targeted by the contract? Evaluation Question # 5: To what degree has the program advanced the vision, mission and objectives of the MHSA PEI plan?
3
Evaluation Question # 6: What factors have impeded or contributed to successful implementation? How? Evaluation Question # 7: What steps can be taken in the future to improve program services and what data could verify that these improvements had occurred?
In brief, the El Centro’s contract for 2013-14 did not have many specific contract deliverables. Goals included that El Centro should conduct 96 groups, to reduce trauma and alcohol and drug related symptoms, to increase the use of coping skills, and to reduce psychiatric hospitalizations. No goals were included specifying the numbers to be served in groups or client participation levels (frequency of participation in groups). The 2014-15 contract did not include hospitalization reductions as an outcome but otherwise retained as outcomes:
• Delivery of 96 groups, • Use of a pre-post test to measure change in coping skills, and • Administration of a satisfaction survey.
In 2013-14, El Centro had difficulty collecting post-test data as clients would terminate from the program without prior notice. In discussions with the Program Manager and CFO in August 2014, El Centro shared with the evaluator its plans to address these shortcomings. Specifically, it the evaluator was told that El Centro had begun holding monthly program planning meetings with the program manager, two group facilitators, administrative assistant and the CFO. These meetings were to focus on a review of data related to attendance/participation, retention, and quality of data being collected. In August 2014, El Centro also reported having initiated a practice of entering data as assessments are completed so that results can be used for program improvement purposes. Data collection would include administration of the pre-post test developed by the evaluator which will provide better data on client use of coping skills and the impact of alcohol, drugs and stress on social, family and work relations. To improve attendance and increase the number of sessions attended by clients in Redwood City, El Centro planned to initiate a second group on another day to provide more options for participation. Lastly, El Centro planned to build upon its outreach efforts and individual client work in Half Moon Bay and will begin offering a Coastside group in 2015. The resulting evaluation plan developed in the summer of 2014 called for El Centro to:
“Impact is to be measured through the use of the attached assessment survey to be administered after each client’s sixth group session. It can be later, indeed, if you are confident you will know when a client is exiting the group, you could administer this Client Assessment Survey and the Satisfaction Survey at that time. This would actually be better, as long as you don’t lose too many clients who simply stop coming. In addition, I have developed a survey for EC counselors to complete seeking their input as to how well the program has appeared to benefit each client. This should be administered near the end of a client’s participation or upon completion.”
The evaluator also developed two satisfaction surveys, one for use by Probation Officers overseeing clients in the program and one for clients. Unfortunately in 2014-15, as in the prior year, El Centro failed to adhere to the data collection plan severely limiting the scope of the evaluation. While participation data was available, the level of
4
services delivered was roughly half what was called for in the contract. What’s more, impact evaluation, while attempted, was severely constrained by El Centro’s not following the plan quoted above. While 43 clients took Addiction Severity Index (ASI)-based pre-tests and while the vast majority of clients attended more than six sessions 65%, post-test data was only collected on 11 clients, and no satisfaction surveys were administered to probation officers or clients. As a result, findings were limited to analysis of attendance data and an ASI pre-post test administered with just 11 clients. Based upon this data, it is clear that while El Centro met the contract goal for providing groups in Redwood City (goal = 48; actual = 51), it did not meet the goal for number of groups in Half Moon Bay, indeed no groups were held in this Coastside community and while the Project Manager reported that individual services were delivered in Half Moon Bay, no data was provided to document this claim. In short, El Centro’s ACOK programs looks very much like it did last year: underperforming and lacking data to document impact or level of services. And while last year, satisfaction survey data gave strong evidence of client satisfaction with services, there were no satisfaction surveys to reflect either client or probation officer satisfaction.
5
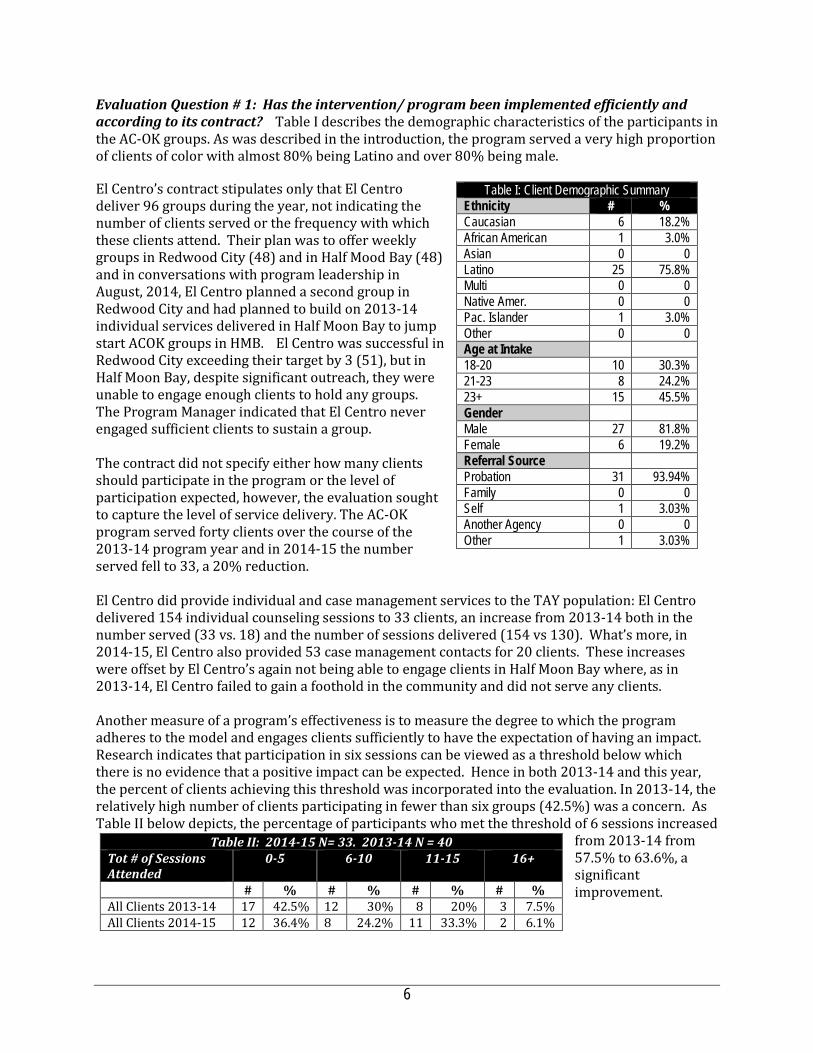
Evaluation Question # 1: Has the intervention/ program been implemented efficiently and according to its contract? Table I describes the demographic characteristics of the participants in the AC-OK groups. As was described in the introduction, the program served a very high proportion of clients of color with almost 80% being Latino and over 80% being male. El Centro’s contract stipulates only that El Centro deliver 96 groups during the year, not indicating the number of clients served or the frequency with which these clients attend. Their plan was to offer weekly groups in Redwood City (48) and in Half Mood Bay (48) and in conversations with program leadership in August, 2014, El Centro planned a second group in Redwood City and had planned to build on 2013-14 individual services delivered in Half Moon Bay to jump start ACOK groups in HMB. El Centro was successful in Redwood City exceeding their target by 3 (51), but in Half Moon Bay, despite significant outreach, they were unable to engage enough clients to hold any groups. The Program Manager indicated that El Centro never engaged sufficient clients to sustain a group. The contract did not specify either how many clients should participate in the program or the level of participation expected, however, the evaluation sought to capture the level of service delivery. The AC-OK program served forty clients over the course of the 2013-14 program year and in 2014-15 the number served fell to 33, a 20% reduction. El Centro did provide individual and case management services to the TAY population: El Centro delivered 154 individual counseling sessions to 33 clients, an increase from 2013-14 both in the number served (33 vs. 18) and the number of sessions delivered (154 vs 130). What’s more, in 2014-15, El Centro also provided 53 case management contacts for 20 clients. These increases were offset by El Centro’s again not being able to engage clients in Half Moon Bay where, as in 2013-14, El Centro failed to gain a foothold in the community and did not serve any clients. Another measure of a program’s effectiveness is to measure the degree to which the program adheres to the model and engages clients sufficiently to have the expectation of having an impact. Research indicates that participation in six sessions can be viewed as a threshold below which there is no evidence that a positive impact can be expected. Hence in both 2013-14 and this year, the percent of clients achieving this threshold was incorporated into the evaluation. In 2013-14, the relatively high number of clients participating in fewer than six groups (42.5%) was a concern. As Table II below depicts, the percentage of participants who met the threshold of 6 sessions increased
from 2013-14 from 57.5% to 63.6%, a significant improvement.
Table I: Client Demographic Summary Ethnicity # % Caucasian 6 18.2% African American 1 3.0% Asian 0 0 Latino 25 75.8% Multi 0 0 Native Amer. 0 0 Pac. Islander 1 3.0% Other 0 0 Age at Intake 18-20 10 30.3% 21-23 8 24.2% 23+ 15 45.5% Gender Male 27 81.8% Female 6 19.2% Referral Source Probation 31 93.94% Family 0 0 Self 1 3.03% Another Agency 0 0 Other 1 3.03%
Table II: 2014-15 N= 33. 2013-14 N = 40 Tot # of Sessions Attended
0-5 6-10 11-15 16+
# % # % # % # % All Clients 2013-14 17 42.5% 12 30% 8 20% 3 7.5% All Clients 2014-15 12 36.4% 8 24.2% 11 33.3% 2 6.1%
6
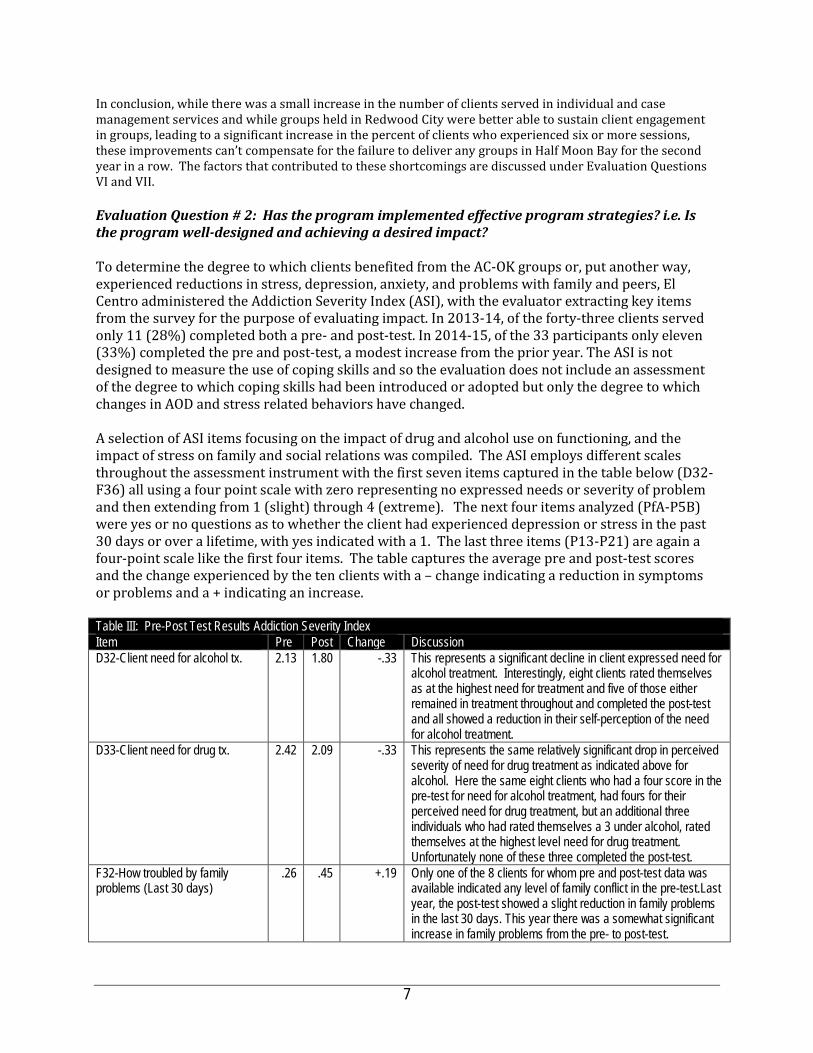
In conclusion, while there was a small increase in the number of clients served in individual and case management services and while groups held in Redwood City were better able to sustain client engagement in groups, leading to a significant increase in the percent of clients who experienced six or more sessions, these improvements can’t compensate for the failure to deliver any groups in Half Moon Bay for the second year in a row. The factors that contributed to these shortcomings are discussed under Evaluation Questions VI and VII. Evaluation Question # 2: Has the program implemented effective program strategies? i.e. Is the program well-designed and achieving a desired impact? To determine the degree to which clients benefited from the AC-OK groups or, put another way, experienced reductions in stress, depression, anxiety, and problems with family and peers, El Centro administered the Addiction Severity Index (ASI), with the evaluator extracting key items from the survey for the purpose of evaluating impact. In 2013-14, of the forty-three clients served only 11 (28%) completed both a pre- and post-test. In 2014-15, of the 33 participants only eleven (33%) completed the pre and post-test, a modest increase from the prior year. The ASI is not designed to measure the use of coping skills and so the evaluation does not include an assessment of the degree to which coping skills had been introduced or adopted but only the degree to which changes in AOD and stress related behaviors have changed. A selection of ASI items focusing on the impact of drug and alcohol use on functioning, and the impact of stress on family and social relations was compiled. The ASI employs different scales throughout the assessment instrument with the first seven items captured in the table below (D32-F36) all using a four point scale with zero representing no expressed needs or severity of problem and then extending from 1 (slight) through 4 (extreme). The next four items analyzed (PfA-P5B) were yes or no questions as to whether the client had experienced depression or stress in the past 30 days or over a lifetime, with yes indicated with a 1. The last three items (P13-P21) are again a four-point scale like the first four items. The table captures the average pre and post-test scores and the change experienced by the ten clients with a – change indicating a reduction in symptoms or problems and a + indicating an increase.
Table III: Pre-Post Test Results Addiction Severity Index Item Pre Post Change Discussion D32-Client need for alcohol tx. 2.13 1.80 -.33 This represents a significant decline in client expressed need for
alcohol treatment. Interestingly, eight clients rated themselves as at the highest need for treatment and five of those either remained in treatment throughout and completed the post-test and all showed a reduction in their self-perception of the need for alcohol treatment.
D33-Client need for drug tx. 2.42 2.09 -.33 This represents the same relatively significant drop in perceived severity of need for drug treatment as indicated above for alcohol. Here the same eight clients who had a four score in the pre-test for need for alcohol treatment, had fours for their perceived need for drug treatment, but an additional three individuals who had rated themselves a 3 under alcohol, rated themselves at the highest level need for drug treatment. Unfortunately none of these three completed the post-test.
F32-How troubled by family problems (Last 30 days)
.26 .45 +.19 Only one of the 8 clients for whom pre and post-test data was available indicated any level of family conflict in the pre-test.Last year, the post-test showed a slight reduction in family problems in the last 30 days. This year there was a somewhat significant increase in family problems from the pre- to post-test.
7
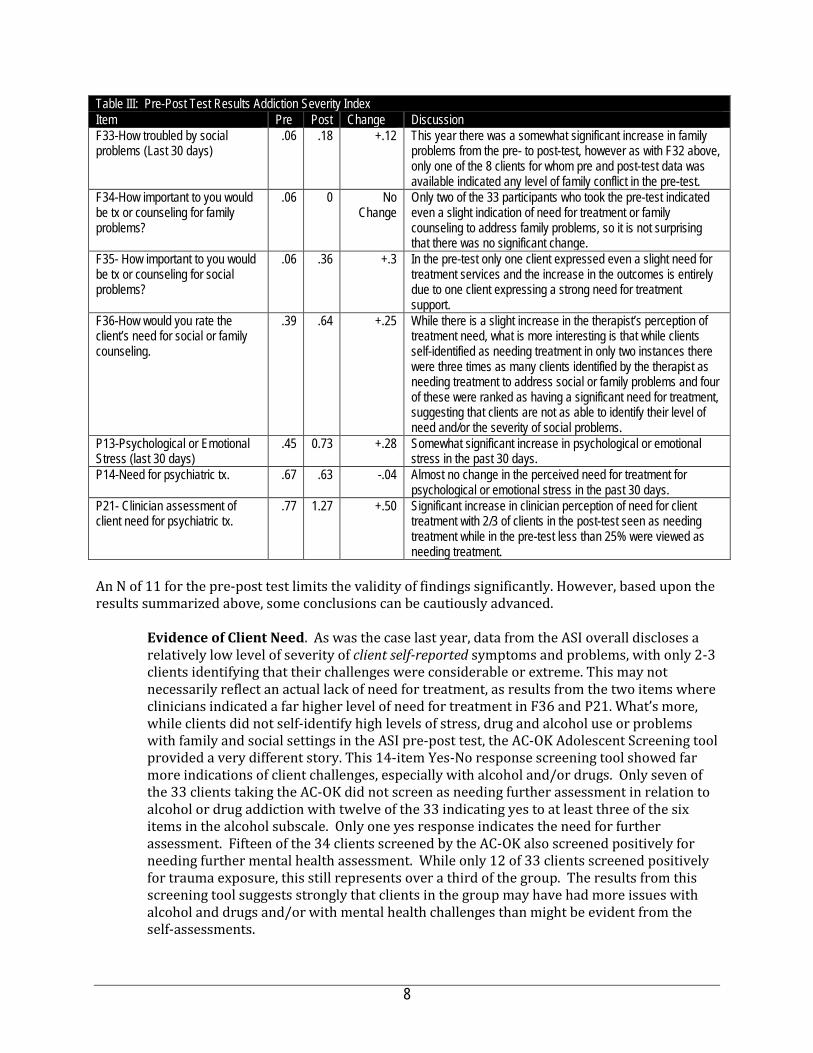
Table III: Pre-Post Test Results Addiction Severity Index Item Pre Post Change Discussion F33-How troubled by social problems (Last 30 days)
.06 .18 +.12 This year there was a somewhat significant increase in family problems from the pre- to post-test, however as with F32 above, only one of the 8 clients for whom pre and post-test data was available indicated any level of family conflict in the pre-test.
F34-How important to you would be tx or counseling for family problems?
.06 0 No Change
Only two of the 33 participants who took the pre-test indicated even a slight indication of need for treatment or family counseling to address family problems, so it is not surprising that there was no significant change.
F35- How important to you would be tx or counseling for social problems?
.06 .36 +.3 In the pre-test only one client expressed even a slight need for treatment services and the increase in the outcomes is entirely due to one client expressing a strong need for treatment support.
F36-How would you rate the client’s need for social or family counseling.
.39 .64 +.25 While there is a slight increase in the therapist’s perception of treatment need, what is more interesting is that while clients self-identified as needing treatment in only two instances there were three times as many clients identified by the therapist as needing treatment to address social or family problems and four of these were ranked as having a significant need for treatment, suggesting that clients are not as able to identify their level of need and/or the severity of social problems.
P13-Psychological or Emotional Stress (last 30 days)
.45 0.73 +.28 Somewhat significant increase in psychological or emotional stress in the past 30 days.
P14-Need for psychiatric tx. .67 .63 -.04 Almost no change in the perceived need for treatment for psychological or emotional stress in the past 30 days.
P21- Clinician assessment of client need for psychiatric tx.
.77 1.27 +.50 Significant increase in clinician perception of need for client treatment with 2/3 of clients in the post-test seen as needing treatment while in the pre-test less than 25% were viewed as needing treatment.
An N of 11 for the pre-post test limits the validity of findings significantly. However, based upon the results summarized above, some conclusions can be cautiously advanced.
Evidence of Client Need. As was the case last year, data from the ASI overall discloses a relatively low level of severity of client self-reported symptoms and problems, with only 2-3 clients identifying that their challenges were considerable or extreme. This may not necessarily reflect an actual lack of need for treatment, as results from the two items where clinicians indicated a far higher level of need for treatment in F36 and P21. What’s more, while clients did not self-identify high levels of stress, drug and alcohol use or problems with family and social settings in the ASI pre-post test, the AC-OK Adolescent Screening tool provided a very different story. This 14-item Yes-No response screening tool showed far more indications of client challenges, especially with alcohol and/or drugs. Only seven of the 33 clients taking the AC-OK did not screen as needing further assessment in relation to alcohol or drug addiction with twelve of the 33 indicating yes to at least three of the six items in the alcohol subscale. Only one yes response indicates the need for further assessment. Fifteen of the 34 clients screened by the AC-OK also screened positively for needing further mental health assessment. While only 12 of 33 clients screened positively for trauma exposure, this still represents over a third of the group. The results from this screening tool suggests strongly that clients in the group may have had more issues with alcohol and drugs and/or with mental health challenges than might be evident from the self-assessments.
8

Evidence of Program Impact. Whereas last year, there was a consistent and significant decrease in client-reported need for treatment for either alcohol or drug treatment, a possible indicator that the contract goal related to reducing symptoms is being addressed, the results this year were much more mixed. As was the case last year, clients reported significant decreases in their perception of need for alcohol or mental health treatment (D32 and D33). But in most all other measures either as reported by the client or clinician, movement was in the wrong direction with slight to significant increases reported in perceived need for treatment related to social and family problems, increases in stress experienced in the last 30 days, and increases in the perceived need for psychiatric treatment. Evidence of Symptom Acuity. Again this year, levels of depression and anxiety, as with the levels of family-peer conflict, were extremely low making small change in either direction statistically insignificant and hence the evaluation did not include this data.
Taken together, last year’s results suggested that the AC-OK groups have a positive impact upon clients managing modest levels of alcohol and drug use and family and peer conflict. This year the level of change reported by either client or clinician was much less consistent, with as much increase in treatment needs, anxiety and depression as there were decreases. However, the very low number of clients who took both the pre and post-test makes it hard to attribute much validity to these findings.
9

Evaluation Question # 3: Have clients, families, partners, and/or communities been satisfied with services? In 2013-14, satisfaction with AC-OK services was measured through analysis of responses from 33 clients responding to an eleven-item satisfaction survey using a five-point Likkert scale with responses ranging from 1= Strongly Agree; 2 = Somewhat Agree; 3 = Not Sure; 4 = Disagree; and 5 = Strongly Disagree. This year no satisfaction data was collected. Obviously given the very low N in pre- post-data and the less than compelling evidence of the impact the program had on client symptoms, satisfaction data would have provided another data set to measure the program’s overall quality. But that data was not collected.
Evaluation Question # 4: Have program services been responsive to the population targeted by the contract? The contract indicated that El Centro should target high-risk clients and specified under-served populations. Over 80% of clients were referred by the Probation Department and over 60% of those served came from demographic populations who have been historically underserved. While the low number of African American clients (6.1%) is surprising, by all other criteria, El Centro has met this criteria. El Centro leadership indicated that the likely reason for low numbers of African Americans in the program is that the agency is viewed by the community and by referring agencies as primarily a Latino-serving agency, an assertion supported by even lower levels of African Americans in other El Centro programs. In relation to design and program intent, the AC-OK program is clearly designed to address the needs of a high need population. However, when factoring in the delivery of only half of the groups proposed in the contract, the lack of any groups in Half Moon Bay, the lack of either satisfaction data or sufficient pre-post-data to document impact, it is a fair question as to whether the program is meeting the needs of the population. Evaluation Question # 5: To what degree has the program advanced the vision, mission and objectives of the MHSA PEI plan? The vision, mission and values of San Mateo County Behavioral Health & Recovery Services stress empowering individuals to direct their own recovery process. BHRS stresses the adoption of culturally competent treatment approaches and through its MHSA planning processes, a further focus has been placed upon implementing evidence-based practices that have demonstrated the capacity to support client wellness and recovery. From the perspective of prevention, BHRS has also described the journey towards a transformed system requiring that programs:
• move “upstream” to primary prevention strategies; • partner with other health prevention efforts to focus on wellness and recovery; • achieve desired outcomes; and • integrate efforts to support sustainability;
What’s more, San Mateo’s MHSA plan clearly described the priority of intervening early and identified stress, PTSD, and use of alcohol and drugs as factors where early intervention were most important, particularly in relation to individuals from historically underserved populations. By serving clients involved in the juvenile-adult justice system (over 80% of clients) and by using evidence-based intervention to help these clients develop coping skills that prevent alcohol and drug addiction or trauma from impeding in functioning, El Centro is clearly designed in alignment
10
with MHSA vision, values and priorities. The problem with the AC-OK program is not with its design but with El Centro’s seeming inability to deliver the program model effectively or to capture data with enough consistency to enable a fair assessment of program impact. Evaluation Question # 6: What factors have impeded or contributed to successful implementation? How? The AC-OK program successfully implemented 51 Seeking Safety groups in Redwood City, but as described throughout, achieved less of an impact on those clients served, served 20% fewer clients from the prior year, and failed to collect sufficient pre-post data or any satisfaction surveys from the clients who were served. The data also points to several areas where improvement is needed: Coastside. According to the new CEO, El Centro’s programming in Half Moon Bay has been in disarray for a couple years. There has been a significant drop in referrals for all of their services, particularly in relation to youth and TAY. For example in September 2015, only 3 youth were referred to EC. Factors contributing to this paucity of service in Half Moon Bay include:
• The emergence of Healthy Rights 360 a large non-profit that has obtained a contract with BHRS to serve the same populations as El Centro and they appear to be getting the majority of referrals; and
• Proposition 47, decriminalizing personal drug use as a misdemeanor instead of a felony has reduced probation referrals by 60-70%.
It seems that a meeting with San Mateo County BHRS is warranted to consider how to address this ongoing issue and perhaps considering reallocating funds for HMB services to another community in need of these services. I know in communication with One East Palo Alto, they have identified a need for a program that addresses high levels of individual and community streets. Participation Levels. In Redwood City, the total number of clients served decreased by 20% from the prior year while the number of participants who achieved the threshold level of six sessions increased somewhat significantly from last year. However, the absence of any groups in HMB remains a concern. While a second group was not offered in Redwood City, it would seem that with the recent El Centro reorganization (see Evaluation Question VII, below), there may be reason to feel the level of services will increase. According to the new CEO, some TAY clients were not classified as TAY because they were put in adult groups due to the absence of a Spanish-speaking TAY facilitator. El Centro now has a Spanish-speaking TAY facilitator. The new Spanish-speaking TAY facilitator has reportedly identified 20 TAY clients served by the adult group. Data Collection. El Centro leadership had indicated that this year data collection would be a priority, that the status of data collection would be discussed monthly and that post-tests would be administered with clients after they had completed six groups. This did not happen and the evaluation of the program was severely hampered by the absence of satisfaction data, lack of data on service delivery in HMB, and insufficient N due to the post-test only being administered to 11 clients. An N of eleven is simply too small to draw valid conclusions about the impact of services. According to the new CEO, the prior CEO was not involved in data collection at all and the person who oversaw data collection was a bookkeeper with other responsibilities and limited understanding of program and the purpose or importance of the data to be collected. Due to turnover during 2014-15, two people had been responsible for TAY services and data collection and neither person followed through in collecting data, as planned. The combination of lack of oversight and poor performance by those responsible for data collection resulted in a failure to collect data as
11
planned. Over the two years of the evaluation El Centro has had four people managing the TAY programs and the lack of continuity of personal and the poor performance of the AC-OK program led El Centro to reorganize. The Program Manager who had oversight of the TAY programs has had his foot to the fire and is said to now be paying more attention and the Clinical Supervisor is now charged with doing file reviews to ensure the fidelity of files and data collection. Evaluation Question # 7: What steps can be taken in the future to improve program services and what data could verify that these improvements had occurred? In 2013-14, El Centro was unable to deliver groups in HMB and had challenges collecting sufficient post-test data, however, the little pre-post test data available pointed to consistent albeit modest improvement in outcomes, significant evidence of client satisfaction with the program and statements from El Centro leadership committing themselves to improved data collection and more effective engagement of HMB clients resulted in a balanced evaluation report with specific commitments to improve performance in 2014-15. Unfortunately, El Centro served 20% fewer clients, again offered no groups in HMB and had collected even less data than in 2013-14. Use of Data. Data provided for this evaluation was again not representative of the full population served and it appears that despite planning to monitor and use data more effectively, this did not occur even though using data to analyze ongoing operations and plan for ongoing program improvement is a key objective stipulated in all BHRS contract. El Centro had committed to improving data collection processes in a number of ways. Citing from the 2013-14 report:
First, it [El Centro] will expedite data entry of client intake, and client pre- and post-test assessments, ensuring that a far higher proportion of clients complete pre and post tests, and capturing the reasons for program exit in their database. In addition, a monthly Program Planning meeting has been instituted where the Program Manager, Group Facilitators, Administrative Assistant and CFO will review data, specifically looking for the impact of recruitment efforts, group participation levels, client retention, and quality and completeness of data being collected. In addition, with data entered as clients complete assessments, impact data will also be reviewed in these meetings, allowing for the opportunity to identify specific areas where clients are showing gains and where they are not.
For the reasons identified above under Evaluation Question VI, this did not occur. The remedy reported by the new CEO is for the Clinical Supervisor to do file reviews and more closely supervise the Program Manager. The evaluator recommends that BHRS meet with the CEO, Clinical Supervisor and Program Manager as soon as possible to review this plan and to develop a reporting schedule through which BHRS receives interim reports that demonstrate the collection of data. Participation Levels. El Centro served 20% fewer clients than last year but also improved on the percent of clients participating in over six groups from 57.5% to 63.6%, a level of involvement that is indicated by the literature as being essential to achieving significant client impact. While El Centro planned to offer a second group in Redwood City and to use its individual counseling services in HMB as a springboard to generate sufficient numbers for AC-OK groups, neither occurred. There is time for the reorganization of El Centro’s administration to take hold over the next six-month and generate both better data collection and more consistent service delivery, In the recommended meeting between El Centro leadership and BHRS managers, it is recommended that a set of benchmarks be developed as indicators of improved service delivery (and data collection). The
12
degree to which those benchmarks are met should inform future contracting decisions related to El Centro and its delivery of AC-OK services. Half Moon Bay. While in 2013-14 El Centro provided participation data for a range of individual counseling services in HMB, this did not occur in 2014-15 and no Seeking Safety groups were offered. Given that HMB is a region of the county noted as being under-served, it seems critical to not allow a continued failure to engage this community to continue. Meetings should be convened of BHRS, El Centro and HMB leadership to brainstorm ways in which to help El Centro better engage and serve this community. In the meeting recommended above, discussion should occur as relates to both the viability of continued El Centro service to HMB. The irony here is that in many needs assessment reports, HMB is identified as being under-served. For whatever, reasons El Centro has not been able to address this unmet need and it may be that reallocated the funds supporting El Centro’s HMB operation to another agency OR relocating El Centro’s AC-OK services to another community in the peninsula may make sense, with one possible community being East Palo Alto. In conclusion, El Centro served less clients, again failed to provide groups in HMB, and failed to follow through on plans to ensure better data collection resulting in no satisfaction data, limited pre-post test data and no service delivery data on services reported to have been delivered in HMB. There is a critical need to re-think how services are promoted and/or delivered in Half Moon Bay. Improvements in data collection should be a far easier fix, but El Centro staff had promised numerous improvements in 2013-14 and they have not materialized. It will be important that SMC BHRS very closely monitor El Centro service delivery and data collection the remainder of 2015-16 to help El Centro identify how they can improve service delivery and data collection.
13
Ms. Doris Estremera Manager of Strategic Operations Office of Diversity & Equity 225 37th Avenue 3rd Floor San Mateo, CA 94403 Dear Doris: Thank you for your email of September 28 regarding the need to address the Seeking Safety Reports for FY 2013-2014 and FY 2014-2015. Even though Mr. Gibson was kind enough to seek my opinion on some items, by then the second report was pretty much completed. This has been a difficult and lengthy exercise, but we are now able to provide additional information on the two main points of the Reports, 1) the number of TAY groups required vs held, and 2) data collection.
The Challenges of History Our difficulty is that, without knowing the rationale behind changing the proposal objectives of serving individuals to the eventual contract deliverables of providing groups, it is difficult to evaluate any plan that there may have been to actually meet all the contract requirements. Groups Contracts for both years listed a deliverable of providing 48 TAY groups in Redwood City and 48 TAY groups in Half Moon Bay. Our records, while admittedly incomplete, show that proposals submitted for funding consideration did NOT contain numbers of groups as measureable objectives nor were the specific objectives separated between Half Moon Bay and Redwood City; instead the proposal objectives listed numbers of TAY participants as a baseline measureable outcome. Both Seeking Safety reports made a point of questioning this change by stating that “the contract did not stipulate how many clients should be served or with what frequency clients should participate, instead stipulating only 96 groups should be offered”. The flaw in the Group approach of course is that the contracts do not specify how many individuals constitute a group. While it seems that documenting that a group was held only requires a dated Group Roster signed by a Counselor, even if no-one attended, The Seeking Safety Reports state that, while no “(TAY) groups” were held in Half Moon Bay in FY 2013-2014 and FY 2014-2015, El Centro did indicate that 130 and 154 individual counseling sessions were held for this age group. Data Collection It appears that tracking TAY data was not correctly attempted before part of FY 2014-2015 and even then it was quite a struggle for a few reasons: 1) strategies discussed at the management level did not reach those who actually provided services, so TAY services may not have been accurately recorded or even recorded at all, 2) lack of program continuity resulted in a revolving

door of new staff not being trained in what data had to be collected or even advised of its importance, 3) using hardware that was new in 2001 was a problem as was using a database that had been discontinued in 2006 so that not only was it not customizable to meet TAY needs, but anyone who could do this service had long since left the industry.
Update Brings a New Perspective Last winter (2015) a review of our files required by another contract revealed errors in data collection that dramatically impacted TAY reporting. Consequently, we have just completed a significant amount of time reviewing all client files for the current year as well as the three preceding years, and have come to the conclusion that staff who were not sufficiently trained and/or who were not aware of the age group reporting requirements placed many TAY individuals in either youth groups or adult groups. These individuals were not included in any TAY reporting data. We are now able to forward corrected information that provides a more accurate picture of services offered to this population: FY 2013-2014: Number of 18 to 25 y/o Individuals Signed Up for Treatment HMB 18 RWC 68 Number of Groups Containing 18 to 25 y/o (may not be TAY Groups) HMB 58 RWC 196 Number of Individual Counseling Sessions provided to 18 to 25 y/o HMB 54 RWC 370 FY 2014-2015: Number of 18 to 25 y/o Individuals Signed Up for Treatment HMB 0 RWC 33 Number of Groups Containing 18 to 25 y/o (may not be TAY Groups) HMB 0 RWC 157 Number of Individual Counseling Sessions Provided to 18 to 25 y/o HMB 0 RWC 298 FY 2015-2016 Number of 18 to 25 y/o Individuals Signed Up for Treatment HMB 0 RWC 38 Number of Groups Containing 18 to 25 y/o (some may not be TAY Groups) HMB 0 RWC 188 Number of Individual Counseling Sessions Provided to 18 to 25 y/o HMB 0 RWC 226
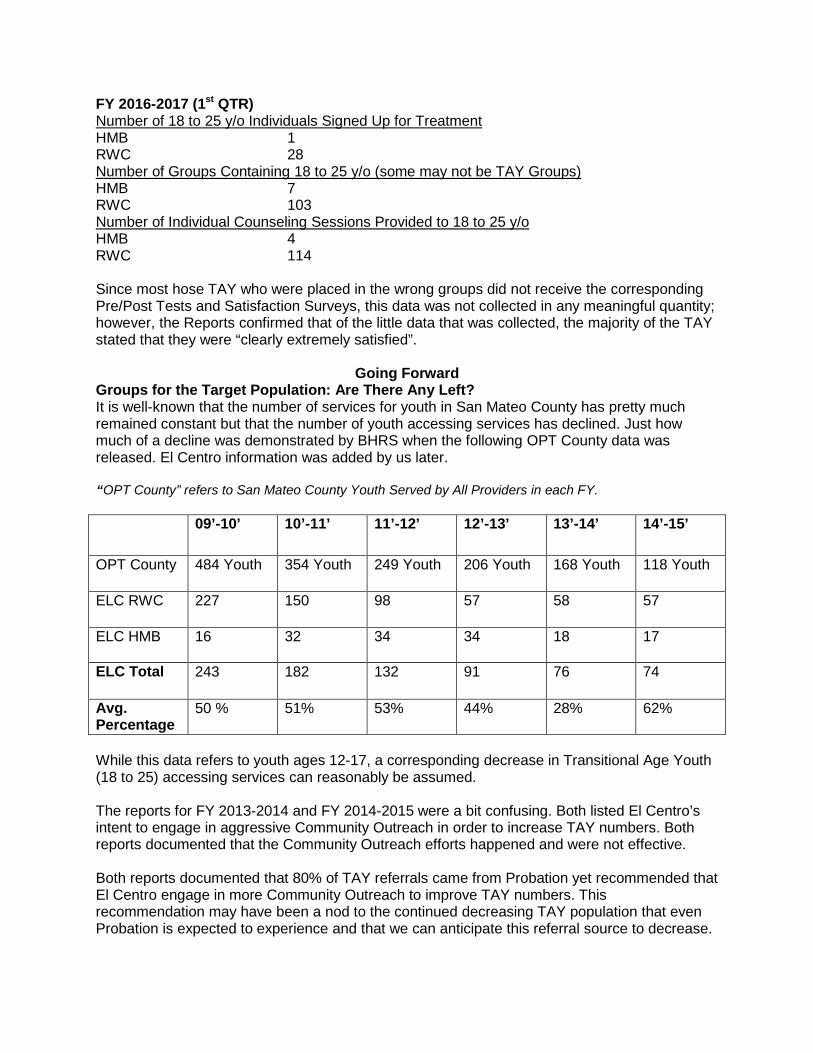
FY 2016-2017 (1st QTR) Number of 18 to 25 y/o Individuals Signed Up for Treatment HMB 1 RWC 28 Number of Groups Containing 18 to 25 y/o (some may not be TAY Groups) HMB 7 RWC 103 Number of Individual Counseling Sessions Provided to 18 to 25 y/o HMB 4 RWC 114 Since most hose TAY who were placed in the wrong groups did not receive the corresponding Pre/Post Tests and Satisfaction Surveys, this data was not collected in any meaningful quantity; however, the Reports confirmed that of the little data that was collected, the majority of the TAY stated that they were “clearly extremely satisfied”.
Going Forward
Groups for the Target Population: Are There Any Left? It is well-known that the number of services for youth in San Mateo County has pretty much remained constant but that the number of youth accessing services has declined. Just how much of a decline was demonstrated by BHRS when the following OPT County data was released. El Centro information was added by us later.
“OPT County” refers to San Mateo County Youth Served by All Providers in each FY.
09’-10’ 10’-11’ 11’-12’ 12’-13’ 13’-14’ 14’-15’
OPT County 484 Youth 354 Youth 249 Youth 206 Youth 168 Youth 118 Youth
ELC RWC 227 150 98 57 58 57
ELC HMB 16 32 34 34 18 17
ELC Total 243 182 132 91 76 74
Avg. Percentage
50 % 51% 53% 44% 28% 62%
While this data refers to youth ages 12-17, a corresponding decrease in Transitional Age Youth (18 to 25) accessing services can reasonably be assumed. The reports for FY 2013-2014 and FY 2014-2015 were a bit confusing. Both listed El Centro’s intent to engage in aggressive Community Outreach in order to increase TAY numbers. Both reports documented that the Community Outreach efforts happened and were not effective. Both reports documented that 80% of TAY referrals came from Probation yet recommended that El Centro engage in more Community Outreach to improve TAY numbers. This recommendation may have been a nod to the continued decreasing TAY population that even Probation is expected to experience and that we can anticipate this referral source to decrease.

Data Gets Better El Centro recently (2016) upgraded our server/network hardware so our agency data is now safe. In spite of the fact that we were able to manipulate our database software to produce this report, we are in a 6 month process to migrate our database platform to a newer system that will provide the capability to generate reports in minutes instead of months. Thank you for the opportunity to submit this supplemental information which I believe provides a more accurate picture of our agencies commitment and growing capacity to serve Transitional Age Youth. Should you have any questions, please do not hesitate to contact me at 650. 599-9955 or [email protected]. Sincerely, Michael Stoll C.E.O.

Human Services Agency: Skillstreaming Teaching Prosocial Skills School-Based Groups PEI Evaluation Report 2014-15
Section I Agency & Program Description I.A. Description of Program Services San Mateo County Human Services Agency, Children & Family Services Division is a division of San Mateo County that operates:
• Children & Family Services • Child Abuse and Neglect Hotline • Child Protective Services • Family Resource Centers • Foster Care Program • Adoptions • Child care • Kinship Support Services • Youth Services • Safe Surrender Baby Info • Children and Family Services Resources
The vision of the Children’s Division is: Healthy, thriving children, youth and families with a mission of protecting the welfare of children; improving the lifelong stability of children and youth; and improving the health and strength of families. HSA achieves these goals by helping families understand and solve the issues that lead to child neglect, abuse or exploitation. In those cases when a child must be removed from the home for safety reasons, HSA helps families resolve their issues as soon as possible so that the child can be returned to a safe and loving home. When a child cannot be reunited with the biological family, HSA helps identify a suitable adoptive home or other safe and permanent living arrangement.
Since 2007, HSA has operated Teaching Pro‐social Skills (TPS) groups in San Mateo County public elementary schools where HSA Family Resource Centers are located. These schools generally receive referrals from teachers for students with classroom behavioral issues. TPS addresses the social skill needs of students who display aggression, immaturity, withdrawal, or other problem behaviors. Students are at risk due to issues such as growing up poor; peer rejection; low quality child care and preschool experiences; afterschool care with poor supervision; school failure, among others. Teaching Pro‐social Skills is based on Aggression Replacement Training (ART). ART was developed by Arnold P. Goldstein, Barry Glick and John C. Gibbs, and takes concepts from a number of other theories for working with youth, and incorporates them into a comprehensive system. Peer learning and repetition are elements of the model. ART is an evidence‐based program broadly utilized. Social skills training, anger control, and moral reasoning are the main components of both ART and TPS. While originally designed for older youth with juvenile justice involvement, TPS and ART have been utilized in dozens of health and human service contexts including with: nurses, home attendant care providers, undergraduate students, military personnel, counselors, teachers, and with youth beginning as early as Kindergarten. TPS training is provided by the California Institute of Mental Health using the TPS curriculum developed by Skillstreaming. Skillstreaming for Elementary School children employs a four-part training approach—modeling, role-playing, performance feedback, and generalization—to teach essential pro-social skills to elementary school students.

I.B. Research Basis for Approach
The vast majority of studies of the efficacy of TPS have been focused upon older youth, principally youth involved in the juvenile justice system. However, as noted above TPS has also been adapted to support elementary school students experiencing challenges conforming with classroom expectations and behavior norms. Brief summaries of a number of appropriate studies are provided below. Choi, H. S., & Heckenlaible-Gotto, M. J. (1998). Classroom-based social skills training: Impact on peer acceptance of first-grade students. Journal of Educational Research, 91(4), 209–214. Trainees: First-grade general education students (n=13), two 30-minute groups per week for four weeks. Included control group (n=12). Skills: Problem-solving, using self-control, accepting consequences, avoiding trouble Experimental design: Peer ratings (work with, play with); pretesting and posttesting Results: T-test showed significant increase from pretest to posttest on “work with” peer rating for treatment group; no increase in control group. No significant differences on “play with.” Cobb, F. M. (1973). Acquisition and retention of cooperative behavior in young boys through instructions, modeling, and structured learning. Unpublished doctoral dissertation, Syracuse University. Trainees: First-grade boys (N = 80) Skill(s): Cooperation Experimental design: (1) Skillstreaming for cooperation, (2) instructions plus modeling of cooperation, (3) instructions for cooperation, (4) attention control, (5) no-treatment control Results: Skillstreaming significantly increased all other conditions on both immediate and delayed tests of cooperative behavior. Leonardi, R., Roberts, J., & Wasoka, Ds. (2001). Skillstreaming: A report to the Vermont State Department of Education. Montpelier: Vermont State Department of Education. Trainees: Elementary students (grades 2–6) with either emotional-behavioral disorders or high incidences of school disciplinary problems (N = 12). Skills: Variety of Skillstreaming skills Results: Students demonstrated a substantial reduction in discipline referrals. Sarmento, P., Almeida, K., Rauktis, M. E., & Bernardo, S. (2008). Promoting social competence and inclusion: Taking alternative paths. Reclaiming Children and Youth, 16(4), 47–54. Trainees: Elementary-age youth with oppositional behaviors attending public school Skills: Combined Skillstreaming instruction with positive reinforcement for participation, following rules, and practicing skills Experimental design: Correlations among group attendance, motivation points, and social skills Results: The greater the number of group sessions attended, the greater degree of advanced social skills demonstrated by the end of training. Swanstrom, C. R. (1978). An examination of Structured Learning Therapy and the helper therapy principle in teaching a self-control strategy to school children with conduct problems. Unpublished doctoral dissertation, Syracuse University. Trainees: Elementary school children with acting-out problems (30 boys, 11 girls; N = 41) Skill(s): Self-control Experimental design: Skillstreaming versus structured discussion by helper experience versus helper structuring versus no helper role plus brief instructions control
2

Results: Skillstreaming and structured discussion significantly increase in self-control acquisition. No significant transfer or helper role effects. Wight, M., & Chapparo, C. (2008). Social competence and learning difficulties: Teacher perceptions. Australian Occupational Therapy Journal, 55, 256–265. Subjects: A total of 21 elementary-aged (ages 5–11) boys with learning difficulties; 21 elementary-aged boys as comparison Experimental design: Point bi-serial analysis on Teacher Skillstreaming Checklist ratings Results: As a group, boys with learning difficulties received significantly poorer scores as rated by their teachers. Most difficult areas in order included (1) Classroom Survival Skills; (2) Friendship-Making Skills; (3) Skill Alternatives to Aggression; (4) Skills for Dealing with Stress; and (5) Skills for Dealing with Feelings. Authors concluded that the Teacher Skillstreaming Checklist is a comprehensive and valid assessment tool. A number of conclusions can be drawn from the above research:
• TPS is an appropriate program for elementary school-age children experiencing behavior control
issues; • TPS has demonstrated effectiveness in improving self-control, problem solving, cooperation,
following rules and other behaviors important to functioning effectively in a classroom and at home; • TPS effectiveness has been demonstrated multiple times using statistically valid tools, including the
one used by HSA (Teacher Skillstreaming Checklist) and in reducing discipline referrals; and • TPS effectiveness increases with the dosage experienced by the students. I.C. Target Population, Number Served and Sites
HSA’s TPS program targets at risk youth ages 6-9, by implementing on Teaching Pro-Social Skills six to ten-session series each semester at the following ten school locations: • Bayshore Elementary School in Daly City; • Hoover Elementary School in Redwood City; • Fair Oaks Elementary School in Redwood City; • Taft Elementary School in Redwood City; • Belle Haven Elementary School in Menlo Park; • John F. Kennedy Elementary; • Woodrow Wilson Elementary; • Sunset Ridge Elementary; • Pescadero Elementary; and • Lead Elementary.
The demographic profile of the students served is relevant to the evaluation as all Behavioral and Recovery Health Services Prevention & Early Intervention programs are asked to targeted under-served populations and the contract stipulated serving students ages 6-9. As Table I at left depicts, all but one student served came
Table I: Teaching Pro‐Social Skills Participant Demographic Profile Ethnicity Caucasian Latino Afr. Amer. Pac Isl Asian
3% 68% 14% 3% 11%
Age Six Seven Eight Nine 14% 35% 19% 32%
3
from an under-served community of color. The N for students served at each site was too small to be relevant and differences in age and ethnicity were not significant, so an aggregated summary is provided. The degree to which these students were also at risk is underscored by the program serving students who had been referred by a teacher (59%), school social worker (14%), Administrator (14%) or parent (5%). HSA’s contract calls for approximately 8 students per group at ten different elementary school sites dispersed throughout the County, including schools as remote as South Coastside. The contract also stipulates that additional individual counseling services and/or linkages to other relevant services will also be provided. This evaluation is focused upon the delivery of Teaching Pro-Social Skills (TPSS) and did not consider the scope or quality of other individual or family counseling services. But given a $200,000 contract for providing TPSS groups and individual and family counseling at ten sites to be served, HSA has been very obviously stretched thin to cover this ground and vulnerable to challenges in the event of personnel changes, etc. As the evaluation will reveal, this challenge did impact service delivery. I.C. Budget Amount HSA was awarded a contract with a budget of $200,000 for the period beginning July 1, 2014 through June 30, 2015. Funding supported a .20 FTE Supervising Mental Health Clinician, .15 Psychiatric Social Worker II, and 1.30 caseworkers (1.00+ .30 FTE) who facilitated the TPS groups. Bob Oliver trained Donovan Fones in a train-the-trainer model and then Mr. Fones trained all staff who were new to the program and sent a video of the training to the TPS center who conferred accreditation on Mr. Fones. In addition, the county paid $9,505 for TPS training and $20,000 for Administrative Costs. Section II Evaluation Process The evaluation plan was initially developed in December 2013 and January 2014 in a series of meetings that included the evaluator and Donovan Fones, the Supervising Mental Health Clinician for the program. A plan was agreed to collect the following data to assess the degree to which the TPS met its contract deliverables and had a positive impact upon the targeted population. The evaluation plan for 2014-15 remained substantially unchanged, except that during mid-year discussions, Mr. Fones informed the evaluator that engagement of parents in any kind of meaningful way was not easily accomplished. Since teachers referred the students for a school-based program that did not involve parents, there sensitivity to the impact of the program would be difficult and their “satisfaction’ with the program would be without any real experiential basis. The following evaluation strategies were implemented in 2014-15.
• Client-level data was collected on attendance in all groups from January 2014 through the end of June 2014;
• Data on source of referral, ethnicity, home language and age; and • Pre-post test administration of the Skillstreaming Teacher checklist that afforded teachers an
opportunity to rate students they referred to TPS on specific social skills that were the focus of the TPS groups.
Section III Evaluation Findings There are seven evaluation questions that frame the evaluation of the Prevention & Early Intervention programs supported with Mental Health Services Act funds.
4
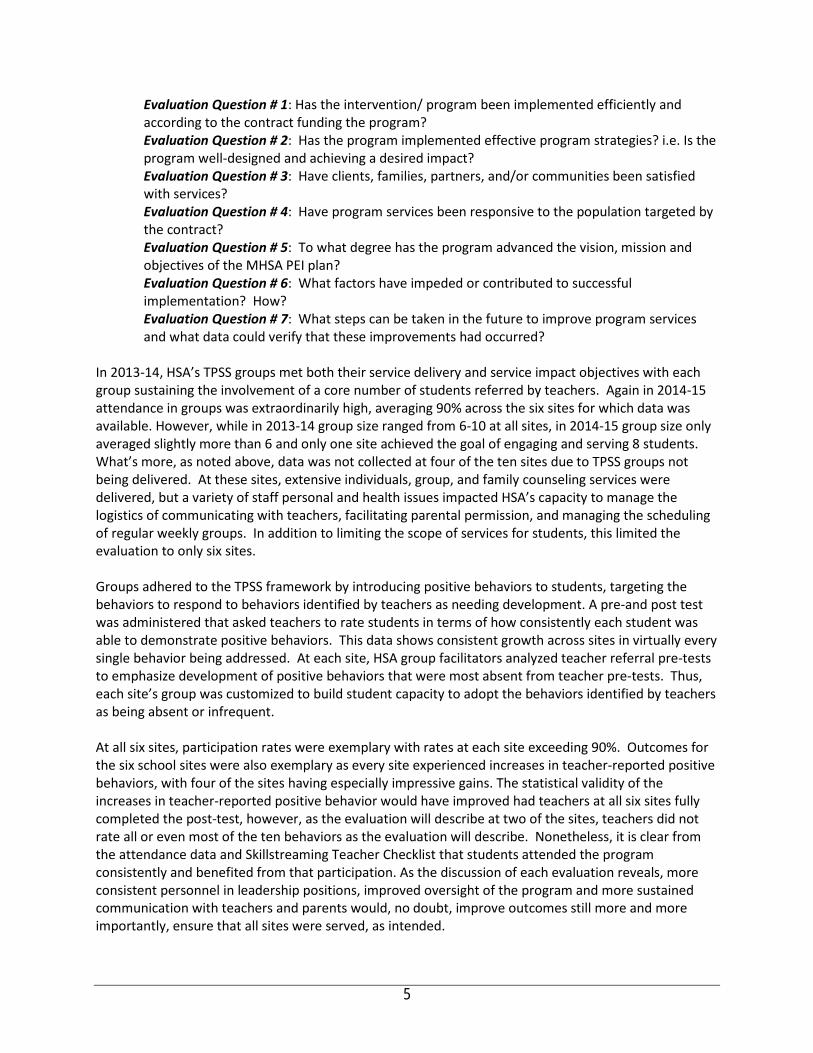
Evaluation Question # 1: Has the intervention/ program been implemented efficiently and according to the contract funding the program? Evaluation Question # 2: Has the program implemented effective program strategies? i.e. Is the program well-designed and achieving a desired impact? Evaluation Question # 3: Have clients, families, partners, and/or communities been satisfied with services? Evaluation Question # 4: Have program services been responsive to the population targeted by the contract? Evaluation Question # 5: To what degree has the program advanced the vision, mission and objectives of the MHSA PEI plan? Evaluation Question # 6: What factors have impeded or contributed to successful implementation? How? Evaluation Question # 7: What steps can be taken in the future to improve program services and what data could verify that these improvements had occurred?
In 2013-14, HSA’s TPSS groups met both their service delivery and service impact objectives with each group sustaining the involvement of a core number of students referred by teachers. Again in 2014-15 attendance in groups was extraordinarily high, averaging 90% across the six sites for which data was available. However, while in 2013-14 group size ranged from 6-10 at all sites, in 2014-15 group size only averaged slightly more than 6 and only one site achieved the goal of engaging and serving 8 students. What’s more, as noted above, data was not collected at four of the ten sites due to TPSS groups not being delivered. At these sites, extensive individuals, group, and family counseling services were delivered, but a variety of staff personal and health issues impacted HSA’s capacity to manage the logistics of communicating with teachers, facilitating parental permission, and managing the scheduling of regular weekly groups. In addition to limiting the scope of services for students, this limited the evaluation to only six sites. Groups adhered to the TPSS framework by introducing positive behaviors to students, targeting the behaviors to respond to behaviors identified by teachers as needing development. A pre-and post test was administered that asked teachers to rate students in terms of how consistently each student was able to demonstrate positive behaviors. This data shows consistent growth across sites in virtually every single behavior being addressed. At each site, HSA group facilitators analyzed teacher referral pre-tests to emphasize development of positive behaviors that were most absent from teacher pre-tests. Thus, each site’s group was customized to build student capacity to adopt the behaviors identified by teachers as being absent or infrequent. At all six sites, participation rates were exemplary with rates at each site exceeding 90%. Outcomes for the six school sites were also exemplary as every site experienced increases in teacher-reported positive behaviors, with four of the sites having especially impressive gains. The statistical validity of the increases in teacher-reported positive behavior would have improved had teachers at all six sites fully completed the post-test, however, as the evaluation will describe at two of the sites, teachers did not rate all or even most of the ten behaviors as the evaluation will describe. Nonetheless, it is clear from the attendance data and Skillstreaming Teacher Checklist that students attended the program consistently and benefited from that participation. As the discussion of each evaluation reveals, more consistent personnel in leadership positions, improved oversight of the program and more sustained communication with teachers and parents would, no doubt, improve outcomes still more and more importantly, ensure that all sites were served, as intended.
5
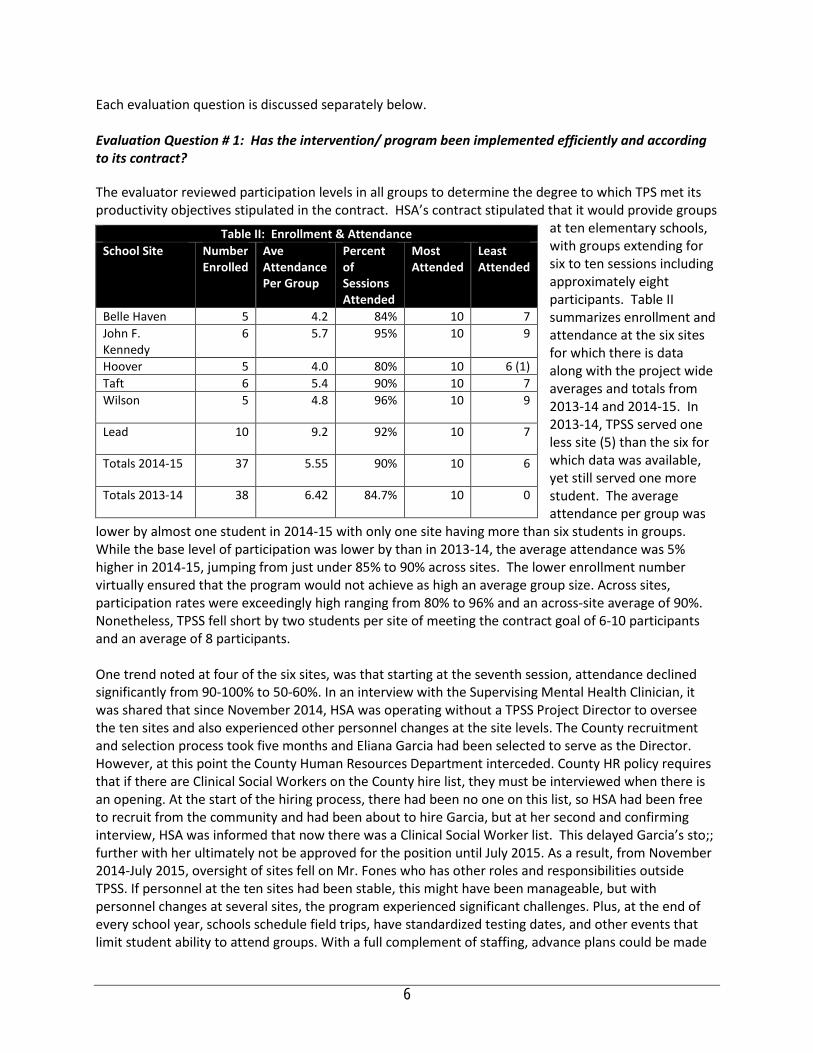
Each evaluation question is discussed separately below. Evaluation Question # 1: Has the intervention/ program been implemented efficiently and according to its contract? The evaluator reviewed participation levels in all groups to determine the degree to which TPS met its productivity objectives stipulated in the contract. HSA’s contract stipulated that it would provide groups
at ten elementary schools, with groups extending for six to ten sessions including approximately eight participants. Table II summarizes enrollment and attendance at the six sites for which there is data along with the project wide averages and totals from 2013-14 and 2014-15. In 2013-14, TPSS served one less site (5) than the six for which data was available, yet still served one more student. The average attendance per group was
lower by almost one student in 2014-15 with only one site having more than six students in groups. While the base level of participation was lower by than in 2013-14, the average attendance was 5% higher in 2014-15, jumping from just under 85% to 90% across sites. The lower enrollment number virtually ensured that the program would not achieve as high an average group size. Across sites, participation rates were exceedingly high ranging from 80% to 96% and an across-site average of 90%. Nonetheless, TPSS fell short by two students per site of meeting the contract goal of 6-10 participants and an average of 8 participants. One trend noted at four of the six sites, was that starting at the seventh session, attendance declined significantly from 90-100% to 50-60%. In an interview with the Supervising Mental Health Clinician, it was shared that since November 2014, HSA was operating without a TPSS Project Director to oversee the ten sites and also experienced other personnel changes at the site levels. The County recruitment and selection process took five months and Eliana Garcia had been selected to serve as the Director. However, at this point the County Human Resources Department interceded. County HR policy requires that if there are Clinical Social Workers on the County hire list, they must be interviewed when there is an opening. At the start of the hiring process, there had been no one on this list, so HSA had been free to recruit from the community and had been about to hire Garcia, but at her second and confirming interview, HSA was informed that now there was a Clinical Social Worker list. This delayed Garcia’s sto;; further with her ultimately not be approved for the position until July 2015. As a result, from November 2014-July 2015, oversight of sites fell on Mr. Fones who has other roles and responsibilities outside TPSS. If personnel at the ten sites had been stable, this might have been manageable, but with personnel changes at several sites, the program experienced significant challenges. Plus, at the end of every school year, schools schedule field trips, have standardized testing dates, and other events that limit student ability to attend groups. With a full complement of staffing, advance plans could be made
Table II: Enrollment & Attendance School Site Number
Enrolled Ave Attendance Per Group
Percent of Sessions Attended
Most Attended
Least Attended
Belle Haven 5 4.2 84% 10 7 John F. Kennedy
6 5.7 95% 10 9
Hoover 5 4.0 80% 10 6 (1) Taft 6 5.4 90% 10 7 Wilson 5 4.8 96% 10 9
Lead 10 9.2 92% 10 7
Totals 2014-15 37 5.55 90% 10 6
Totals 2013-14 38 6.42 84.7% 10 0
6

to ensure that groups were rescheduled to accommodate these grade-level or schoolwide events, as was the case in 2013-14 when no attendance drop off was experienced. But in the absence of a full staff this did not occur in 2014-15, especially at Lead, Hoover, Taft and Belle Haven. In fairness to TPSS, even with the drop off in attendance in the last three sessions, each site still achieved at least 80% attendance and even two of the four that experienced drop offs had an overall attendance rate of 90% or better. The major shortfall for TPSS in 2014-15 was not the drop off in attendance, but rather the fact that four school sites went without any TPSS groups whatsoever for major portions of the year and a County Human Resources hiring process that makes filling positions immensely challenging. The reasons for each of the four site’s lack of TPSS is described below.
Pescadero Elementary was a new site added for services in 2014-15 and HSA was unable to hire a clinician for this site until May 2014. While this seems an extremely long time to go without a clinician, from other South Coastside evaluations, other programs have also experienced a a very difficult time replacing personnel, as South Coastside is very distant from the rest of the County. A concern raised by the evaluator was why there was a need for TPS groups at a school currently being delivered groups by Puente and to the same age group with largely the same purpose. It would seem that the County might be better served by seeking another elementary school in the heart of the county where logistics would be easier to manage and where a clinician could more easily manage two sites that might be geographical proximate. Moreover, it would seem that offering two different groups by different agencies at a school with only 25 fifth graders will simply introduce confusion in the school district, especially given that Puente is serving all the schools in this district and has for some time. Bayshore Elementary also experienced personnel dislocations as one staff resigned abruptly in November. While that person was replaced reasonably quickly [get timing from DF], the new clinician had a very high caseload of individual and family counseling clients and was simply unable to juggle that caseload and facilitate and coordinate a full complement of groups. With a Program Director in place, support could have been provided to enable the clinician to manage both. [Is this OK?] Sunset Ridge Elementary had a clinician who had to leave on a medical leave of absence and is only returning in October 2015. Fair Oaks Elementary also experienced the loss of a clinician that prevented delivery of the TPSS groups. Here Mr. Fones acknowledged that the clinician hired for this school probably should not have been hired as in the end, while he offered groups, he did not follow any record keeping protocols and departed very suddenly at the end of the year with no records to confirm service delivery or surveys from teachers.
All of the above personnel issues could have been far more easily managed with a full time Project Director, but the County hiring process was exceedingly slow. Eliana Garcia is now a full time the TPSS Director who will bring more consistency to the program. She will also sustain ongoing communication with teachers, sending them monthly updates on the behaviors being emphasized in groups as well as working with site clinicians to ensure teachers understand the importance of rating all behaviors on the Teacher Checklist. She will also ensure monthly delivery of a TPSS parent bulletin that describes the program, the behaviors being developed in groups and strategies that parents can implement at home to reinforce what is taught in groups.
7

The HSA contract also called for TPS staff to participate in TPS training with $9,505 of funding dedicated to that purpose. [Fill in what training has occurred.] were trained by CIMH in Aggression Replacement Therapy which included TPSS. On May 6, 2014, the same staff received a booster training. The overall productivity is certainly a mixed bag. While the attendance rate at six sites was exemplary, the total served at these sites was 25% below the number specified in the contract (an average of 6 instead of an average of 8). What’s more, four entire schools went without the TPSS program. Mr. Fones has ensured that with the addition of Eliana Garcia as TPSS Director and stable staffing now in place at the ten sites, service delivery in 2015-16 should not experience anything like this kind of shortfall.
8
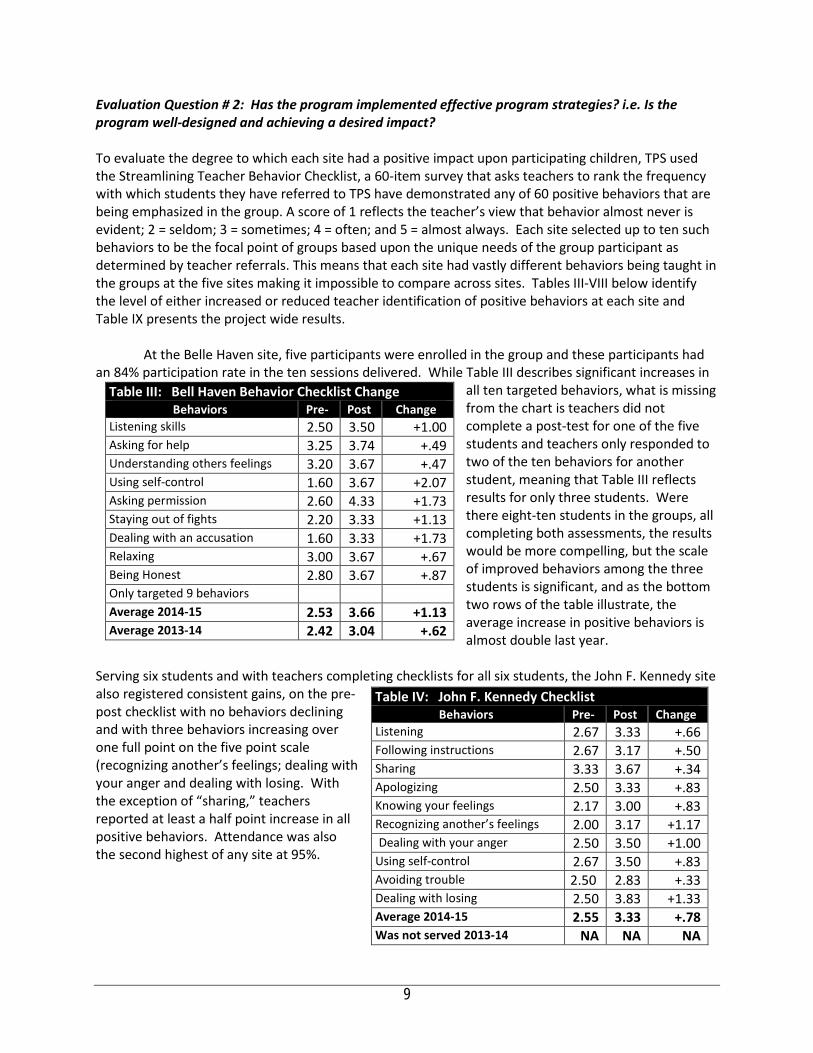
Evaluation Question # 2: Has the program implemented effective program strategies? i.e. Is the program well-designed and achieving a desired impact? To evaluate the degree to which each site had a positive impact upon participating children, TPS used the Streamlining Teacher Behavior Checklist, a 60-item survey that asks teachers to rank the frequency with which students they have referred to TPS have demonstrated any of 60 positive behaviors that are being emphasized in the group. A score of 1 reflects the teacher’s view that behavior almost never is evident; 2 = seldom; 3 = sometimes; 4 = often; and 5 = almost always. Each site selected up to ten such behaviors to be the focal point of groups based upon the unique needs of the group participant as determined by teacher referrals. This means that each site had vastly different behaviors being taught in the groups at the five sites making it impossible to compare across sites. Tables III-VIII below identify the level of either increased or reduced teacher identification of positive behaviors at each site and Table IX presents the project wide results. At the Belle Haven site, five participants were enrolled in the group and these participants had an 84% participation rate in the ten sessions delivered. While Table III describes significant increases in
all ten targeted behaviors, what is missing from the chart is teachers did not complete a post-test for one of the five students and teachers only responded to two of the ten behaviors for another student, meaning that Table III reflects results for only three students. Were there eight-ten students in the groups, all completing both assessments, the results would be more compelling, but the scale of improved behaviors among the three students is significant, and as the bottom two rows of the table illustrate, the average increase in positive behaviors is almost double last year.
Serving six students and with teachers completing checklists for all six students, the John F. Kennedy site also registered consistent gains, on the pre-post checklist with no behaviors declining and with three behaviors increasing over one full point on the five point scale (recognizing another’s feelings; dealing with your anger and dealing with losing. With the exception of “sharing,” teachers reported at least a half point increase in all positive behaviors. Attendance was also the second highest of any site at 95%.
Table III: Bell Haven Behavior Checklist Change Behaviors Pre‐ Post Change
Listening skills 2.50 3.50 +1.00 Asking for help 3.25 3.74 +.49 Understanding others feelings 3.20 3.67 +.47 Using self-control 1.60 3.67 +2.07 Asking permission 2.60 4.33 +1.73 Staying out of fights 2.20 3.33 +1.13 Dealing with an accusation 1.60 3.33 +1.73 Relaxing 3.00 3.67 +.67 Being Honest 2.80 3.67 +.87 Only targeted 9 behaviors Average 2014‐15 2.53 3.66 +1.13 Average 2013‐14 2.42 3.04 +.62
Table IV: John F. Kennedy Checklist Behaviors Pre‐ Post Change
Listening 2.67 3.33 +.66 Following instructions 2.67 3.17 +.50 Sharing 3.33 3.67 +.34 Apologizing 2.50 3.33 +.83 Knowing your feelings 2.17 3.00 +.83 Recognizing another’s feelings 2.00 3.17 +1.17 Dealing with your anger 2.50 3.50 +1.00
Using self-control 2.67 3.50 +.83 Avoiding trouble 2.50 2.83 +.33 Dealing with losing 2.50 3.83 +1.33 Average 2014‐15 2.55 3.33 +.78 Was not served 2013‐14 NA NA NA
9
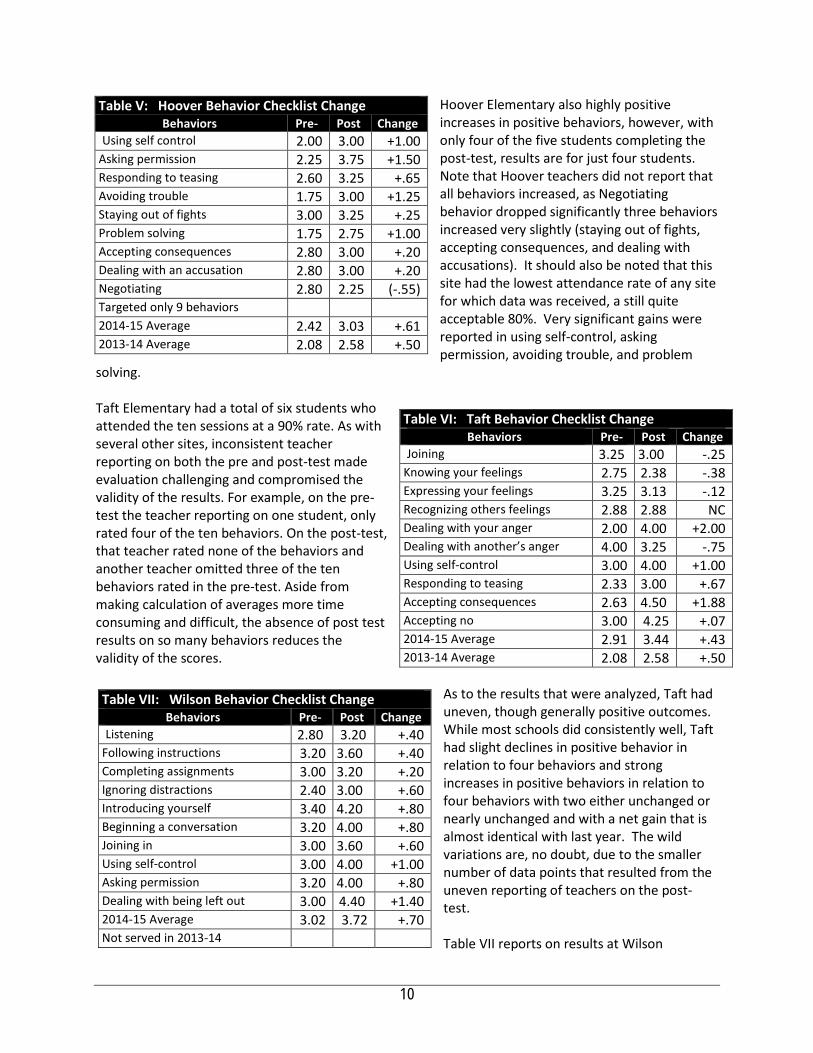
Hoover Elementary also highly positive increases in positive behaviors, however, with only four of the five students completing the post-test, results are for just four students. Note that Hoover teachers did not report that all behaviors increased, as Negotiating behavior dropped significantly three behaviors increased very slightly (staying out of fights, accepting consequences, and dealing with accusations). It should also be noted that this site had the lowest attendance rate of any site for which data was received, a still quite acceptable 80%. Very significant gains were reported in using self-control, asking permission, avoiding trouble, and problem
solving. Taft Elementary had a total of six students who attended the ten sessions at a 90% rate. As with several other sites, inconsistent teacher reporting on both the pre and post-test made evaluation challenging and compromised the validity of the results. For example, on the pre-test the teacher reporting on one student, only rated four of the ten behaviors. On the post-test, that teacher rated none of the behaviors and another teacher omitted three of the ten behaviors rated in the pre-test. Aside from making calculation of averages more time consuming and difficult, the absence of post test results on so many behaviors reduces the validity of the scores.
As to the results that were analyzed, Taft had uneven, though generally positive outcomes. While most schools did consistently well, Taft had slight declines in positive behavior in relation to four behaviors and strong increases in positive behaviors in relation to four behaviors with two either unchanged or nearly unchanged and with a net gain that is almost identical with last year. The wild variations are, no doubt, due to the smaller number of data points that resulted from the uneven reporting of teachers on the post-test. Table VII reports on results at Wilson
Table V: Hoover Behavior Checklist Change Behaviors Pre‐ Post Change
Using self control 2.00 3.00 +1.00 Asking permission 2.25 3.75 +1.50 Responding to teasing 2.60 3.25 +.65 Avoiding trouble 1.75 3.00 +1.25 Staying out of fights 3.00 3.25 +.25 Problem solving 1.75 2.75 +1.00 Accepting consequences 2.80 3.00 +.20 Dealing with an accusation 2.80 3.00 +.20 Negotiating 2.80 2.25 (-.55) Targeted only 9 behaviors 2014-15 Average 2.42 3.03 +.61 2013-14 Average 2.08 2.58 +.50
Table VII: Wilson Behavior Checklist Change Behaviors Pre‐ Post Change
Listening 2.80 3.20 +.40 Following instructions 3.20 3.60 +.40 Completing assignments 3.00 3.20 +.20 Ignoring distractions 2.40 3.00 +.60 Introducing yourself 3.40 4.20 +.80 Beginning a conversation 3.20 4.00 +.80 Joining in 3.00 3.60 +.60 Using self-control 3.00 4.00 +1.00 Asking permission 3.20 4.00 +.80 Dealing with being left out 3.00 4.40 +1.40 2014-15 Average 3.02 3.72 +.70 Not served in 2013-14
Table VI: Taft Behavior Checklist Change Behaviors Pre‐ Post Change
Joining 3.25 3.00 -.25 Knowing your feelings 2.75 2.38 -.38 Expressing your feelings 3.25 3.13 -.12 Recognizing others feelings 2.88 2.88 NC Dealing with your anger 2.00 4.00 +2.00 Dealing with another’s anger 4.00 3.25 -.75 Using self-control 3.00 4.00 +1.00 Responding to teasing 2.33 3.00 +.67 Accepting consequences 2.63 4.50 +1.88 Accepting no 3.00 4.25 +.07 2014-15 Average 2.91 3.44 +.43 2013-14 Average 2.08 2.58 +.50
10
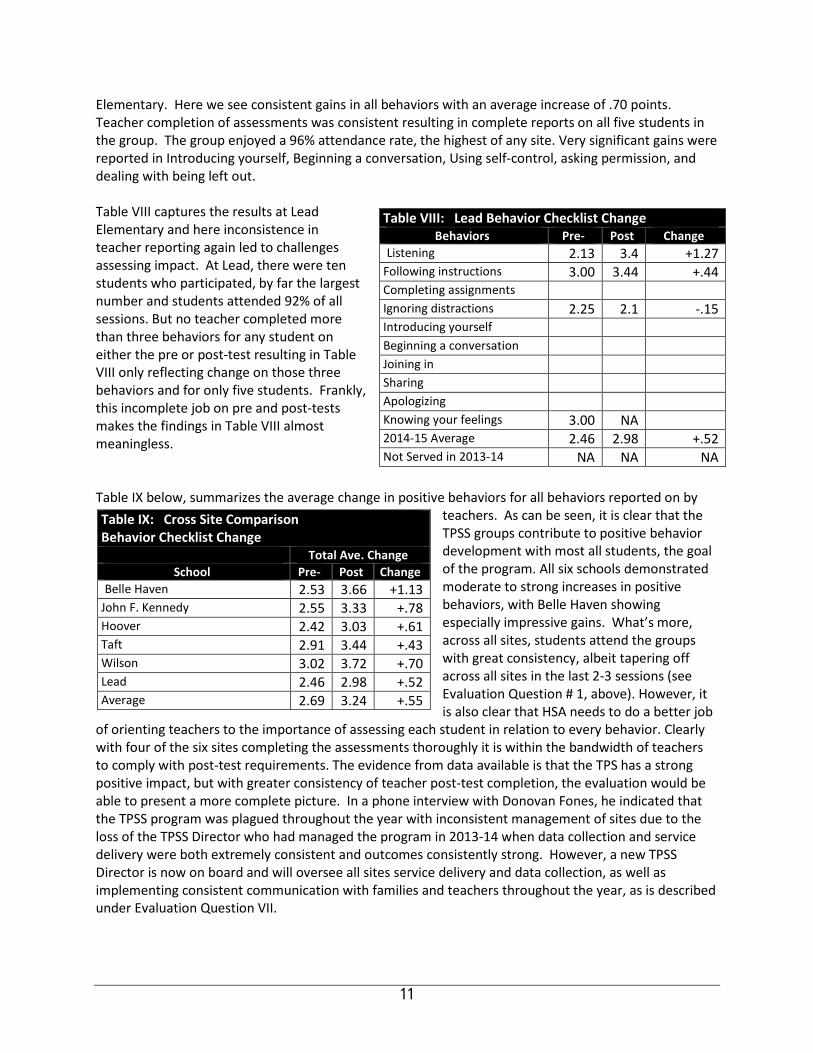
Elementary. Here we see consistent gains in all behaviors with an average increase of .70 points. Teacher completion of assessments was consistent resulting in complete reports on all five students in the group. The group enjoyed a 96% attendance rate, the highest of any site. Very significant gains were reported in Introducing yourself, Beginning a conversation, Using self-control, asking permission, and dealing with being left out. Table VIII captures the results at Lead Elementary and here inconsistence in teacher reporting again led to challenges assessing impact. At Lead, there were ten students who participated, by far the largest number and students attended 92% of all sessions. But no teacher completed more than three behaviors for any student on either the pre or post-test resulting in Table VIII only reflecting change on those three behaviors and for only five students. Frankly, this incomplete job on pre and post-tests makes the findings in Table VIII almost meaningless. Table IX below, summarizes the average change in positive behaviors for all behaviors reported on by
teachers. As can be seen, it is clear that the TPSS groups contribute to positive behavior development with most all students, the goal of the program. All six schools demonstrated moderate to strong increases in positive behaviors, with Belle Haven showing especially impressive gains. What’s more, across all sites, students attend the groups with great consistency, albeit tapering off across all sites in the last 2-3 sessions (see Evaluation Question # 1, above). However, it is also clear that HSA needs to do a better job
of orienting teachers to the importance of assessing each student in relation to every behavior. Clearly with four of the six sites completing the assessments thoroughly it is within the bandwidth of teachers to comply with post-test requirements. The evidence from data available is that the TPS has a strong positive impact, but with greater consistency of teacher post-test completion, the evaluation would be able to present a more complete picture. In a phone interview with Donovan Fones, he indicated that the TPSS program was plagued throughout the year with inconsistent management of sites due to the loss of the TPSS Director who had managed the program in 2013-14 when data collection and service delivery were both extremely consistent and outcomes consistently strong. However, a new TPSS Director is now on board and will oversee all sites service delivery and data collection, as well as implementing consistent communication with families and teachers throughout the year, as is described under Evaluation Question VII.
Table VIII: Lead Behavior Checklist Change Behaviors Pre‐ Post Change
Listening 2.13 3.4 +1.27 Following instructions 3.00 3.44 +.44 Completing assignments Ignoring distractions 2.25 2.1 -.15 Introducing yourself Beginning a conversation Joining in Sharing Apologizing Knowing your feelings 3.00 NA 2014-15 Average 2.46 2.98 +.52 Not Served in 2013-14 NA NA NA
Table IX: Cross Site Comparison Behavior Checklist Change
Total Ave. Change School Pre‐ Post Change
Belle Haven 2.53 3.66 +1.13 John F. Kennedy 2.55 3.33 +.78 Hoover 2.42 3.03 +.61 Taft 2.91 3.44 +.43 Wilson 3.02 3.72 +.70 Lead 2.46 2.98 +.52 Average 2.69 3.24 +.55
11

Evaluation Question # 3: Have clients, families, partners, and/or communities been satisfied with services? During meetings with the Supervising Mental Health Consultant, Donovan Fones, the evaluator was told that the program as currently operated has very little direct communication with either teachers or parents and hence a satisfaction survey would have had no experiential basis for either population. However, together a plan was made to use a TPSS-developed parent bulletin and send it home monthly so that parents could understand the program and utilize advice in the bulletin as to how they can support the development of the targeted behaviors. In this context, parents would have a basis upon which to provide their level of satisfaction. A similar bulletin will be used with teachers, but in relation to teachers, additional satisfaction questions would be developed to get feedback on the consistency of TPSS clinician support and communication around the completion of the initial assessment Checklist and the post-test Checklist. In this context, a plan was made for the administration of a teacher satisfaction survey that focused on communication, scheduling, responsiveness, and impact of the TPS program. The questions were identified after a review of prior end-of-year reports submitted by HSA to BHRS where there had been problems identified about these issues. Mr. Fones has agreed to use the satisfaction survey in 2015-16, both with teachers and parents each semester. Evaluation Question # 4: Have program services been responsive to the population targeted by the contract? The TPS successfully targeted and served the students at highest risk of social emotional problems at each of the six sites as determined by the teachers--who are best able to make this assessment. The population served was almost 100% students of color, with only one Caucasian student among the 37 students. The positive outcomes experienced at the five sites that collected pre and post-test data suggest that the program was responsive to the teacher-identified needs. For 2015-16, it is advised that teachers are engaged more effectively as their detachment from the process was evident at several sites from their failure to complete post-tests completely. Last year of the 38 children participating in the program, 26 come from homes where Spanish was the home language. In 2014-15 data on home language was collected at only two sites where half of the students came from homes where Spanish was spoken. The lead Community Worker who facilitated all the TPS groups is bilingual Spanish speaking. The PSWs who helped to coordinate the groups and have relationships with the teachers and the parents are all also bilingual Spanish speaking. In fact, one of the groups at Hoover was conducted in Spanish due to the language needs of the children in that group. Finally, as reported elsewhere in this report, TPSS didn’t offer groups at four of the ten sites where they were contracted to deliver services and hence this absence of programming represents an obvious failure to provide those services to the populations to be targeted. Strategies for addressing this deficiency have been described above and under Evaluation Question # 7.
12
Evaluation Question # 5: To what degree has the program advanced the vision, mission and objectives of the MHSA PEI plan? The vision, mission and values of San Mateo County Behavioral Health & Recovery Services stress empowering individuals to direct their own recovery process. BHRS stresses the adoption of culturally competent treatment approaches and through its MHSA planning processes, a further focus has been placed upon implementing evidence-based practices that have demonstrated the capacity to support client wellness and recovery. From the perspective of prevention, BHRS has also described the journey towards a transformed system requiring that programs:
• move “upstream” to primary prevention strategies; • partner with other health prevention efforts to focus on wellness and recovery; • achieve desired outcomes; and • integrate efforts to support sustainability;
The TPSS groups clearly address the first bullet above, moving upstream, identifying children who are at risk at an early age and providing an evidence-based intervention that has shown positive results with grade-school children. Pre-test results show that among all 37 participating children, across a wide range of potential positive social behaviors, teachers had indicated that these positive behaviors were uniformly seldom evident. Elementary school children who seldom can control their emotions, follow directions, share, control their anger, ask for help, stay out of trouble or avoid fights, clearly are at-risk and in need of intervention. The TPS program is a strength-based, helping children develop social skills that will help them better navigate school, family and community stresses. In short, HSA targets young children whose teachers have identified them as being at very high risk and TPS provides an evidence-based approach designed to address the precise behaviors identified by teachers as needing development. Incomplete data provision by teachers and sites prevented the evaluation from getting as complete a picture of the impact of TPS groups, however, in the four sites where data provided was very complete, all schools had a strong positive impact. BHRS goals identified in the contract are listed below with commentary as to the degree to which the program has addressed these goals.
1. Reduce out-of-home placement. 2. Reduce risk and/or involvement in the juvenile justice system. 3. Increase school attendance. 4. Improve child functioning in home, school and community. 5. Achieve high level of consumer satisfaction. 6. Achieve high level of youth, family and professional partnership. 7. Achieve high degree of interagency coordination and collaboration. 8. Achieve high degree of cultural competence while addressing disproportional (over
representation of a group) in reporting, removal, placement, reunification and permanence.
9. Reduce acute care usage. Targeted children have been identified as being at risk of failure in the classroom and moreover have identified social skills needed to be successful at home or in the community. While most all the children are too young to be considered at risk of acute care usage, they do seem at risk in relation to each of the first four goals above. While HSA has addressed these four goals, it failed to collect satisfaction data
13
that could measure the degree to which schools or parents are satisfied and more importantly, it has not provided individual family counseling or effectively engaged parents to help build their capacity to reinforce the skill-building conducted in the TPS groups. This is a missed opportunity. Evaluation Question # 6: What factors have impeded or contributed to successful implementation? How? Certainly the use of an evidence-based program with a track record of success in building positive social behaviors is one of the most important factors contributing to the success of the program. While no data was collected to validate that teachers felt that the program was responsive to their needs, that teachers at all sites referred students and completed pre and post test surveys suggests that teachers bought into the groups. However, HSA should ensure that in 2014-15, teacher (and parent) satisfaction surveys are administered to validate this and/or identify ways the program could be strengthened.
According to Mr. Fones, one area where HSA struggled with was in getting the students to turn in their TPSS ‘homework’ and practice. While no data was collected on this, Mr. Fones indicated that it was not common for this work to be completed. The evaluator has suggested and Mr. Fones has agreed that in 2015-16, facilitators will make a greater effort to engage parents, inform them of the importance of the homework and also send home a monthly bulletin describing the skills being worked on and how they can reinforce what is being learned. This should strengthen the program, enhance student learning of new behaviors, increase student homework completion and increase parental understanding of the program. A similar monthly bulletin will be provided to teachers so that they can understand better what behaviors are being practiced in group and how they can support that development. Evaluation Question # 7: What steps can be taken in the future to improve program services and what data could verify that these improvements had occurred? While attendance rates in groups has been exemplary and outcomes significantly exceeding contract goals, service level was below contract goals at the six sites where services were delivered and as has been noted above, TPSS groups were not offered with any consistency at four of the ten sites targeted. So there is obvious room for improvement in program services. In the general report to the County on the eight programs evaluated in 2014-15, the evaluator will focus on the impact of personnel changes upon consistent delivery of services as this has been an issue with many agencies in each year. As relates to data collection, discussion under Evaluation Questions II and III identified two areas for improvement. First, better communication with teachers and a clear protocol for completing the post-test would ensure a more valid assessment of impact of services. Second, with more communication with parents and teachers, an experience base would be created that would allow parents and teachers to legitimately comment on their satisfaction with the program. Far and away, the most important improvement required is for TPSS services to be delivered with consistency at all ten sites. While these improvements would, no doubt, strengthen the program and improve the capacity of the evaluation to validate these improvements, the TPS program clearly is benefiting the children served and helping them build the kind of social skills they will need to succeed at home, in school and in the community and in so doing, contribute to their avoiding the need for higher end services and supports.
14

Felton Institute: Prevention & Recovery in Early Psychosis (PREP) PEI Evaluation Report 2014-15
Section I Agency & Program Description I.A. Description of Program Services Founded in 1889, Family Service Agency is San Francisco’s oldest and largest provider of outpatient social services. In its 125-year history, FSA has been a leader in social service innovation having introduced numerous research-informed services and social service reforms over the years. These historic advances are FSA’s legacy, a legacy that has continued into the 21st Century with the founding of the Felton Institute in 2004, to provide a home for university-FSA research partnerships and a home within FSA where innovation could be borne, tested, refined and replicated. FSA offers a unique setting for testing a broad range of social service innovations. FSA directs over 30 community-based social services, offered in 11 languages, serving more than 13,000 individuals of all ages. In 2014, FSA changed its name to Felton Institute since it was replicating a variety of innovative treatment approaches in communities outside San Francisco, San Mateo being one. One of Felton’s signature programs is Prevention & Recovery in Early Psychosis (PREP), developed in partnership with the University of California, San Francisco that is now operating in five Northern California counties. While delivered somewhat differently in each county, in San Mateo County PREP is comprised of the following five evidence-based practice components:
Early, rigorous diagnosis: The PREP diagnosis and assessment is both rigorous and comprehensive, addressing not only the psychotic disorder but other mental health or substance abuse issues the client might have. The focus of PREP-SMC is on first onset clients, PREP used the Structured Clinical Interview for DSM-IV (SCID). PREP staff goes through a one-year training, testing, and clinical supervision process to ensure that they can use these tools reliably.
Cognitive Behavioral Therapy for Early Psychosis (CBTP): Widely available in England and Australia but not in the US, this therapy teaches clients to understand and manage their symptoms, avoid triggers that make symptoms worse and to collaboratively develop a relapse prevention plan. CBTP represents the heart of the PREP intervention.
Algorithm guided Medication Management: The first goal of the PREP medication algorithm is to guide the doctor, the patient, and the family toward finding the single best antipsychotic medica-tion—one that can provide symptom control with the fewest side effects. This then becomes a medication regimen to which the client is much more likely to adhere over the long-term. Secondly, the algorithm guides treatment for the additional behavioral health issues that a client is experiencing. Third, the model emphasizes close coordination between therapist, psychiatrists, clients, and family members. In the PREP model, all treatment options are explained (including risks as well as benefits). A treatment plan is developed that coordinates medication with psychosocial treatment, that has the agreement of all parties (including the client and outside providers, as relevant), and that is closely monitored for effectiveness over time.
Multifamily Psycho-education Groups (MFG): A number of studies have shown that extended multifamily group education and support has a strong positive impact on outcomes for the client, independent of the client’s level of commitment to treatment. PREP provides MFG groups for the families of teens and young adults experiencing schizophrenia. Even when the primary client chooses not to attend treatment, the family is served. In addition to MFG, PREP engaged family members in individual/family psycho-education, consultation with family about medication and case management.
Education and Employment Support: Schizophrenia tends to erupt into a young person’s life during the time when they are making the most important steps into adulthood. PREP follows Dartmouth’s Individual Placement and Support (IPS) model of education and employment support. This model
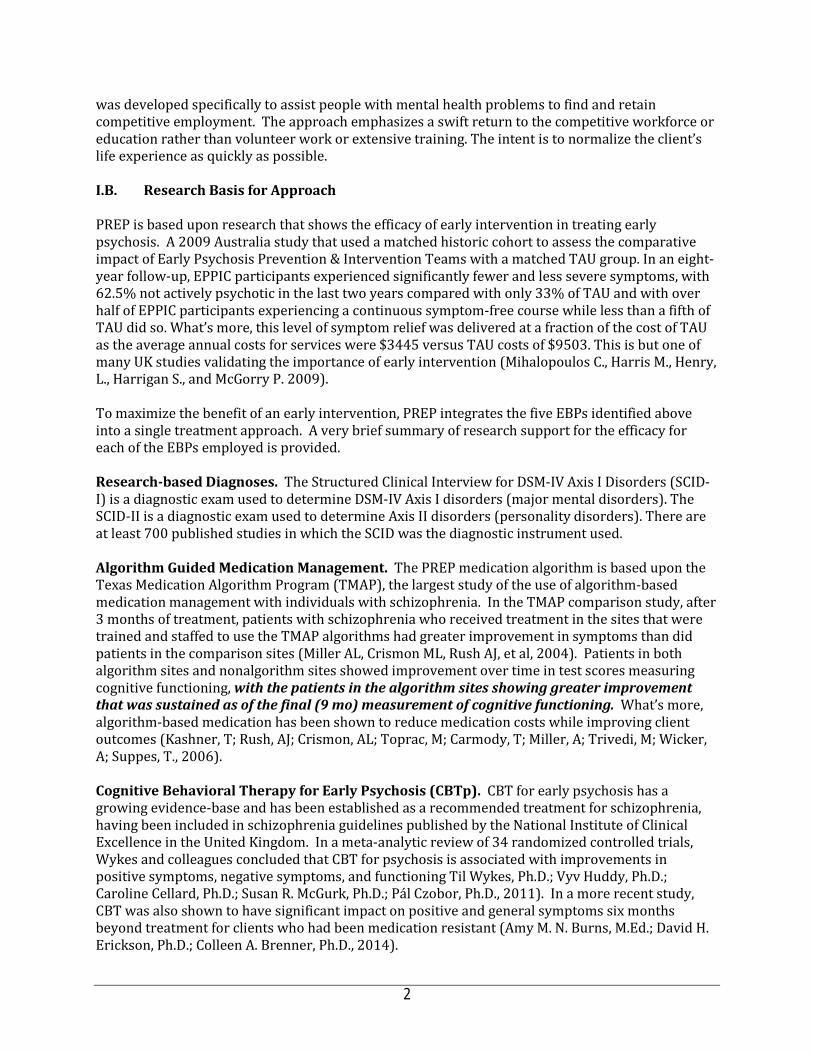
was developed specifically to assist people with mental health problems to find and retain competitive employment. The approach emphasizes a swift return to the competitive workforce or education rather than volunteer work or extensive training. The intent is to normalize the client’s life experience as quickly as possible. I.B. Research Basis for Approach
PREP is based upon research that shows the efficacy of early intervention in treating early psychosis. A 2009 Australia study that used a matched historic cohort to assess the comparative impact of Early Psychosis Prevention & Intervention Teams with a matched TAU group. In an eight-year follow-up, EPPIC participants experienced significantly fewer and less severe symptoms, with 62.5% not actively psychotic in the last two years compared with only 33% of TAU and with over half of EPPIC participants experiencing a continuous symptom-free course while less than a fifth of TAU did so. What’s more, this level of symptom relief was delivered at a fraction of the cost of TAU as the average annual costs for services were $3445 versus TAU costs of $9503. This is but one of many UK studies validating the importance of early intervention (Mihalopoulos C., Harris M., Henry, L., Harrigan S., and McGorry P. 2009).
To maximize the benefit of an early intervention, PREP integrates the five EBPs identified above into a single treatment approach. A very brief summary of research support for the efficacy for each of the EBPs employed is provided. Research-based Diagnoses. The Structured Clinical Interview for DSM-IV Axis I Disorders (SCID-I) is a diagnostic exam used to determine DSM-IV Axis I disorders (major mental disorders). The SCID-II is a diagnostic exam used to determine Axis II disorders (personality disorders). There are at least 700 published studies in which the SCID was the diagnostic instrument used. Algorithm Guided Medication Management. The PREP medication algorithm is based upon the Texas Medication Algorithm Program (TMAP), the largest study of the use of algorithm-based medication management with individuals with schizophrenia. In the TMAP comparison study, after 3 months of treatment, patients with schizophrenia who received treatment in the sites that were trained and staffed to use the TMAP algorithms had greater improvement in symptoms than did patients in the comparison sites (Miller AL, Crismon ML, Rush AJ, et al, 2004). Patients in both algorithm sites and nonalgorithm sites showed improvement over time in test scores measuring cognitive functioning, with the patients in the algorithm sites showing greater improvement that was sustained as of the final (9 mo) measurement of cognitive functioning. What’s more, algorithm-based medication has been shown to reduce medication costs while improving client outcomes (Kashner, T; Rush, AJ; Crismon, AL; Toprac, M; Carmody, T; Miller, A; Trivedi, M; Wicker, A; Suppes, T., 2006). Cognitive Behavioral Therapy for Early Psychosis (CBTp). CBT for early psychosis has a growing evidence-base and has been established as a recommended treatment for schizophrenia, having been included in schizophrenia guidelines published by the National Institute of Clinical Excellence in the United Kingdom. In a meta-analytic review of 34 randomized controlled trials, Wykes and colleagues concluded that CBT for psychosis is associated with improvements in positive symptoms, negative symptoms, and functioning Til Wykes, Ph.D.; Vyv Huddy, Ph.D.; Caroline Cellard, Ph.D.; Susan R. McGurk, Ph.D.; Pál Czobor, Ph.D., 2011). In a more recent study, CBT was also shown to have significant impact on positive and general symptoms six months beyond treatment for clients who had been medication resistant (Amy M. N. Burns, M.Ed.; David H. Erickson, Ph.D.; Colleen A. Brenner, Ph.D., 2014).
2
Family Psycho-education. Family involvement, particularly in psycho-educational groups, can create a supportive therapeutic community that has resulted in significant reductions in relapse, reduced acute episodes and increase adherence to medication regimen. In three studies, participation in Psycho-educational MultiFamily Group (MFG) correlated with significantly improved client outcomes and reduced reliance upon emergency psychiatric hospitalization. In one study, a total of 172 acutely psychotic patients, aged 18 to 45 years, with DSM-III-R schizophrenic disorders were randomly assigned to single- or multiple-family psycho-educational treatment at six public hospitals in the state of New York. Supported Education. Seventeen randomized controlled trials of the efficacy of Individual Placement Support (IPS) were conducted between 1996 and 2012 in various parts of the USA and in a number of countries abroad. Competitive employment rates were significantly higher in programs that implemented the IPS model. More jobs were acquired, for more hours per week, with a shorter period of time to placement on the job, and for better wages, in the IPS model programs than in the controls. Research also indicates that programs that followed the IPS model, conducted fidelity reviews and used the results of fidelity reviews to drive performance improvement had consistently better employment outcomes for enrolled consumers. Taken together, the research strongly suggests that early intervention in early psychosis is critical to reducing long-term care costs and increasing the likelihood of sustained recovery. What’s more, the components that comprise PREP’s service model each have a strong basis of support in the literature. Certainly, PREP meets one of BHRS’ priorities in the use of PEI funding: that interventions be grounded in research and represent evidence based practices.
I.C. Target Population, Number Served and Sites
Felton’s contract calls for PREP to annually engage 80-100 eligible SMC residents, serve 48 clients and maintain a caseload of approximately 36 clients. During the program year 2013-14, PREP engaged 84 potential clients with 46 of those engaged in the program. In 2014-15, PREP engaged 113 potential clients and enrolled 60 clients in services, maintaining a consistent caseload of between 31-36 clients. Thus PREP exceeded engagement and service goals and fell somewhat short of caseload goals. Caseload and clients served is analyzed under Evaluation Question # 1. The demographic breakdown for clients served is captured in Table I, below. While no stipulation in the contract indicated that ‘under-served’ populations be targeted, clearly PREP engaged highly diverse populations with almost two-thirds being from populations of color and 77% of clients were male with 23% being female. As Table I illustrates, there is virtually no change in the population demographics.
Table I: PREP Client Ethnicity Summary 2014-15
Caucasian Latino Afr. Amer. Asian Pacific Isl. Nat. Amer Mixed Other 2013-14 34.8% 32.6% 4.3% 13.0% 8.7% 0.0% 2.2% 4.3% 2014-15 37.5% 33.93% 3.57% 21.43% 1.79% 1.79% 0 0 Section II Evaluation Process The initial evaluation plan was developed in three stages, in June-July 2013 through a series of participatory meetings that included the evaluator and Felton’s Research Director, Dr. Erika Van Buren. A second series of meetings was held in July 2014 with the new Research Director, Dr. Shobha Pais, and the new Research Assistant, Julia Gloria Godzikovskaya. In addition, the evaluator
3
consulted with Drs. Rachel Loewy (UCSF) and Kate Hardy (UCSF and now Stanford), each of whom played key roles in the development of the PREP model. Considerable work was done by Ms. Godzikofskaya, Adriana Furuzawa and others at Felton, to extract data from Felton’s data system. A third series of conversations was held during January and February 2015 to update the evaluation plan for 2014-15 and to discuss PREP’s intent to provide San Mateo County BHRS with a written status report updating the County upon program and data collection changes made in response to 2013-14 findings. This update was completed in December 2014. Among the data collected and reported by PREP for both the 2013-14 and 2014-15 evaluations:
• Client-level data was collected on attendance in all program components; • Demographic and home language data was collected on all clients; • A range of validated tools were used to capture change in client symptoms with these tools
being administered at six month intervals; • A highly detailed Semi-Annual Evaluation Form Consumer Evaluation Tool completed by all
clients that is comprised of an array of validated tools was used to assess client satisfaction with an array of programmatic components—this semi-annual evaluation is composed of a number of validated assessment tools that provides a robust report not just on client satisfaction but in relationship to therapist-client alliance, access to various program components, symptoms and symptom management and other measures important to understanding the program’s impact. These validated tools are described below; and
• A Staff Survey was developed by the evaluator and administered to assess the degree to which staff felt prepared to deliver PREP’s complex model, the impact of staff turnover and to identify areas of the program that staff felt could be improved.
Together these tools provided ample data for answering the evaluation questions that form the framework of this evaluation. It should be noted that while PREP had great difficulty delivering data last year due to pervasive lack of clarity about how the program defined a “client” and because of data being housed in different data bases and in an inconsistent manner, this year data was delivered promptly without any challenge whatsoever. Moreover, it is worth noting that without question, PREP maintains the more comprehensive data of any PEI program allowing for a much more detailed and comprehensive evaluation. PREP leadership used the findings from last year’s report as a catalyst to make significant improvement not only in data collection, but in service delivery, as this report will describe.
Section III Evaluation Findings There are seven evaluation questions that frame the evaluation of the Prevention & Early Intervention programs supported with Mental Health Services Act funds.
Evaluation Question # 1: Has the intervention/ program been implemented efficiently and according to the contract funding the program? Evaluation Question # 2: Has the program implemented effective program strategies? i.e. Is the program well-designed and achieving a desired impact? Evaluation Question # 3: Have clients, families, partners, and/or communities been satisfied with services? Evaluation Question # 4: Have program services been responsive to the population targeted by the contract?
4
Evaluation Question # 5: To what degree has the program advanced the vision, mission and objectives of the MHSA PEI plan? Evaluation Question # 6: What factors have impeded or contributed to successful implementation? How? Evaluation Question # 7: What steps can be taken in the future to improve program services and what data could verify that these improvements had occurred?
Evaluation findings are described in detail below, but in brief, as was the case last year, PREP collected far more data on program operations than any PEI program resulting in a robust understanding of program operations and their impact. Last year’s evaluation shed considerable light on all that worked at PREP while also illuminating important areas where improvement would be desirable, specifically in relation to:
• High staff turnover which impacted delivery of services and data collection; • Failure to engage families in Multi-Family Groups (MFG) or other family supports; • Inconsistent charting of medication consultation and delivery of medication consultation
services; and • A need to more clearly define PREP in terms of the model and to develop a clear definition
of a ‘client,’ as in 2013-14 there was ambiguity as to whether a person was a client when they called the program? Were screened? Assessed? Or received their first counseling session? Clarifying this was important to calculating hospitalization and acute care rates before entry into service and after entry.
As noted in last year’s report, despite these shortcomings, clients experienced a reduction in symptoms and significantly reduced level of hospitalizations, with every one of a dozen outcome measures showing improvement to varying degrees. Clients were also extremely satisfied with the program as is evidenced through a detailed client self-assessment survey administered every six months. What’s more many of the inconsistencies in data collection and reporting were resolved during the evaluation process and leadership developed strategies for clarifying terminology and expectations regarding service delivery and program exit. As was noted last year, PREP is by far the most complex of all PEI programs, integrating the use of five EBPs with a population that is difficult to engage. PREP has achieved significant positive outcomes last year and as importantly, PREP leadership has entirely embraced the evaluation findings and used them to inform significant improvements in how PREP is delivered services and collected and reported data. The report will go into great detail as to the performance this year, but briefly:
• Staff turnover issues were virtually non-existent, changes in personnel were addressed seamlessly, mostly by recruiting staff from other Felton programs, and as a result there were no disruptions in service delivery;
• Family engagement improved significantly with the creation of an open-ended psycho-educational family group that served to ‘bridge’ and support families as they awaited the initiation of a new MFG group;
• Charting of medication consultation was corrected so that consultations were entered clearly and retrievably and from this data it is clear that clients received appropriate levels of medication consultation;
• PREP leadership clarified definitions related to when an individual becomes a client and the criteria for determining that someone has ‘graduated’ from the program; and
5
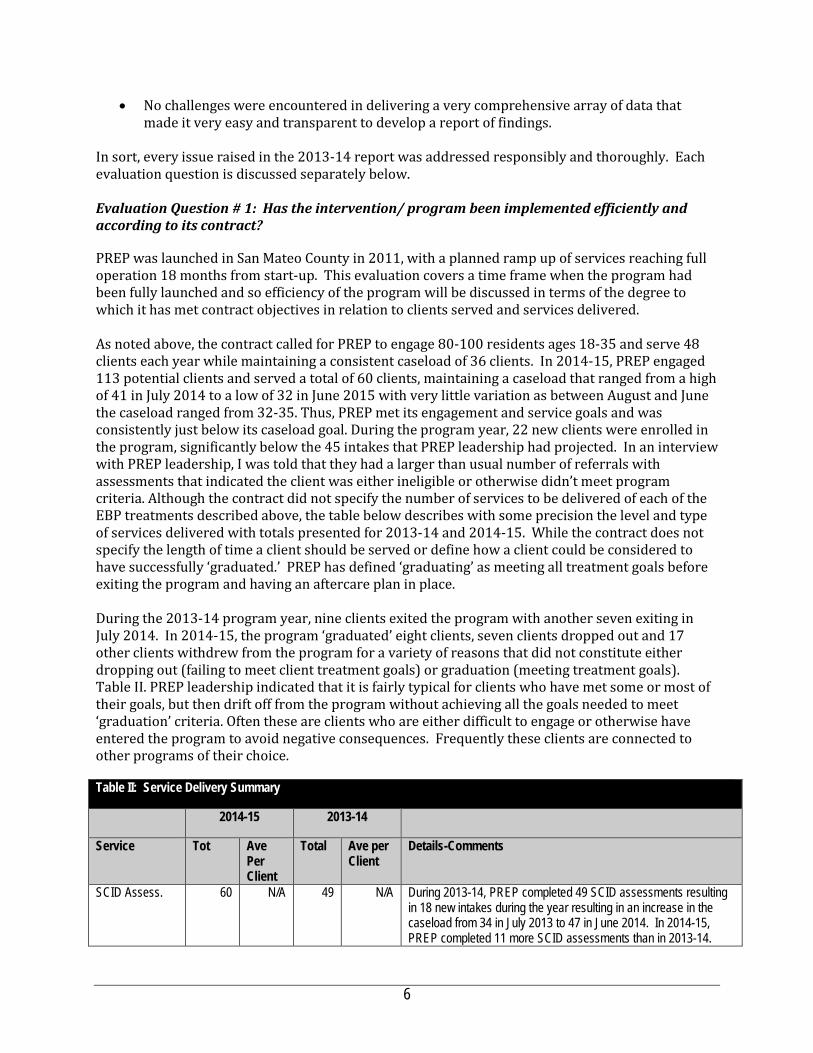
• No challenges were encountered in delivering a very comprehensive array of data that made it very easy and transparent to develop a report of findings.
In sort, every issue raised in the 2013-14 report was addressed responsibly and thoroughly. Each evaluation question is discussed separately below. Evaluation Question # 1: Has the intervention/ program been implemented efficiently and according to its contract? PREP was launched in San Mateo County in 2011, with a planned ramp up of services reaching full operation 18 months from start-up. This evaluation covers a time frame when the program had been fully launched and so efficiency of the program will be discussed in terms of the degree to which it has met contract objectives in relation to clients served and services delivered. As noted above, the contract called for PREP to engage 80-100 residents ages 18-35 and serve 48 clients each year while maintaining a consistent caseload of 36 clients. In 2014-15, PREP engaged 113 potential clients and served a total of 60 clients, maintaining a caseload that ranged from a high of 41 in July 2014 to a low of 32 in June 2015 with very little variation as between August and June the caseload ranged from 32-35. Thus, PREP met its engagement and service goals and was consistently just below its caseload goal. During the program year, 22 new clients were enrolled in the program, significantly below the 45 intakes that PREP leadership had projected. In an interview with PREP leadership, I was told that they had a larger than usual number of referrals with assessments that indicated the client was either ineligible or otherwise didn’t meet program criteria. Although the contract did not specify the number of services to be delivered of each of the EBP treatments described above, the table below describes with some precision the level and type of services delivered with totals presented for 2013-14 and 2014-15. While the contract does not specify the length of time a client should be served or define how a client could be considered to have successfully ‘graduated.’ PREP has defined ‘graduating’ as meeting all treatment goals before exiting the program and having an aftercare plan in place. During the 2013-14 program year, nine clients exited the program with another seven exiting in July 2014. In 2014-15, the program ‘graduated’ eight clients, seven clients dropped out and 17 other clients withdrew from the program for a variety of reasons that did not constitute either dropping out (failing to meet client treatment goals) or graduation (meeting treatment goals). Table II. PREP leadership indicated that it is fairly typical for clients who have met some or most of their goals, but then drift off from the program without achieving all the goals needed to meet ‘graduation’ criteria. Often these are clients who are either difficult to engage or otherwise have entered the program to avoid negative consequences. Frequently these clients are connected to other programs of their choice. Table II: Service Delivery Summary
2014-15 2013-14
Service Tot Ave Per Client
Total Ave per Client
Details-Comments
SCID Assess. 60 N/A 49 N/A During 2013-14, PREP completed 49 SCID assessments resulting in 18 new intakes during the year resulting in an increase in the caseload from 34 in July 2013 to 47 in June 2014. In 2014-15, PREP completed 11 more SCID assessments than in 2013-14.
6

Table II: Service Delivery Summary
2014-15 2013-14
Service Tot Ave Per Client
Total Ave per Client
Details-Comments
However, this only resulted in 22 intakes and with 32 clients exiting the program, hence the census declined from 41 in July 2014 to 32 in June 2015.
CBT Session 1065 30.5 933 20.3 In 2013-14, the average shows an average of almost 2 sessions a month. A closer look at the client-level data shows that 25 clients received 15 sessions or more with seven others receiving at least 10 and nine receiving 3 or less. CBT, case management and IPS supports appear to be the PREP components most consistently accessed by clients. In 2014-15, with an average caseload of 35, the average number of CBT sessions per client increased by 50% from 20.3 to 30.5.
Med Mgt. Consult.
448 12.8 415 9.06 In 2013-14, the average of 9 sessions per client masks client-level data that reveals that 19 clients received no medication consultation and six received but one, meaning that over half of the clients served had one or less medication consultations. However, according to PREP client files only 19 clients were utilizing anti-psychotic medication during the year and fourteen of these clients received 10 or more medication consultations while six others received at least 5. The low-level of medication consultations is mitigated by delivery of family consultations focused on medication issues that were delivered to 16 clients with a total of 134 such consultations provided over the year, or over 8 per client. Another factor contributing to the low number of consultations is a combination of poor reporting and frankly, failure to fully implement the model. Poor recording is a factor because many PREP clients continue their relationship with their psychiatrist who continues to monitor their meds. PREP leadership indicated that the Nurse Practitioner should be recording consultations with these outside psychiatrists and because that had not been occurring, those medication consultations are not reflected in the data. While inaccurate charting may partially describe the low number of medication consults, it is clear that many clients are not having consistent medication consultations. In 2014-15, the total number of medication consultations increased while the number of clients was smaller, resulting in a 30% increase in the average number of consultations and whereas in 2013-14 staff turnover significantly impacted delivery of medication consultations, this was not the case in 2014-15. Even though the nurse practitioner transferred to another Felton site, a new nurse practitioner was recruited within Felton resulting in a seamless transition.
7
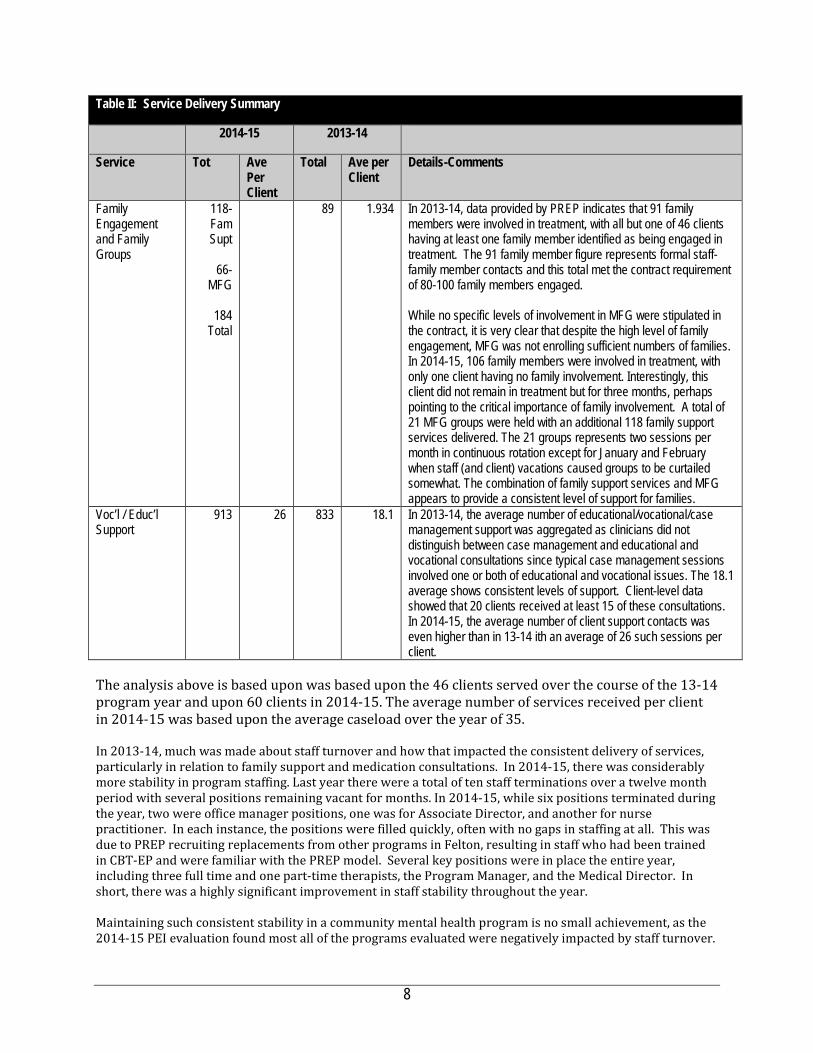
Table II: Service Delivery Summary
2014-15 2013-14
Service Tot Ave Per Client
Total Ave per Client
Details-Comments
Family Engagement and Family Groups
118-Fam Supt
66-
MFG
184 Total
89 1.934 In 2013-14, data provided by PREP indicates that 91 family members were involved in treatment, with all but one of 46 clients having at least one family member identified as being engaged in treatment. The 91 family member figure represents formal staff-family member contacts and this total met the contract requirement of 80-100 family members engaged. While no specific levels of involvement in MFG were stipulated in the contract, it is very clear that despite the high level of family engagement, MFG was not enrolling sufficient numbers of families. In 2014-15, 106 family members were involved in treatment, with only one client having no family involvement. Interestingly, this client did not remain in treatment but for three months, perhaps pointing to the critical importance of family involvement. A total of 21 MFG groups were held with an additional 118 family support services delivered. The 21 groups represents two sessions per month in continuous rotation except for January and February when staff (and client) vacations caused groups to be curtailed somewhat. The combination of family support services and MFG appears to provide a consistent level of support for families.
Voc’l / Educ’l Support
913 26 833 18.1 In 2013-14, the average number of educational/vocational/case management support was aggregated as clinicians did not distinguish between case management and educational and vocational consultations since typical case management sessions involved one or both of educational and vocational issues. The 18.1 average shows consistent levels of support. Client-level data showed that 20 clients received at least 15 of these consultations. In 2014-15, the average number of client support contacts was even higher than in 13-14 ith an average of 26 such sessions per client.
The analysis above is based upon was based upon the 46 clients served over the course of the 13-14 program year and upon 60 clients in 2014-15. The average number of services received per client in 2014-15 was based upon the average caseload over the year of 35. In 2013-14, much was made about staff turnover and how that impacted the consistent delivery of services, particularly in relation to family support and medication consultations. In 2014-15, there was considerably more stability in program staffing. Last year there were a total of ten staff terminations over a twelve month period with several positions remaining vacant for months. In 2014-15, while six positions terminated during the year, two were office manager positions, one was for Associate Director, and another for nurse practitioner. In each instance, the positions were filled quickly, often with no gaps in staffing at all. This was due to PREP recruiting replacements from other programs in Felton, resulting in staff who had been trained in CBT-EP and were familiar with the PREP model. Several key positions were in place the entire year, including three full time and one part-time therapists, the Program Manager, and the Medical Director. In short, there was a highly significant improvement in staff stability throughout the year. Maintaining such consistent stability in a community mental health program is no small achievement, as the 2014-15 PEI evaluation found most all of the programs evaluated were negatively impacted by staff turnover.
8

Furthermore, as noted last year, retention in mental health programs is a well-recognized concern, cited in the President’ New Freedom in Mental Health Commission which stated that without significant attention to workforce development in the mental health field, all of the Commission’s goals were largely unattainable. Indeed in a Community Living Brief published by the Independent Living Research Unit the following amplification on this issue was identified. It is worth noting that PREP relies almost entirely upon staff who do not posses advanced degrees. In this context PREP is to be commended for sustaining such high staff retention in 2014-15. Evaluation Question # 2: Has the program implemented effective program strategies? i.e. Is the program well-designed and achieving a desired impact? To evaluate program impact, the evaluation examined changes in client symptoms, medication adherence, and functioning, as well as levels of psychiatric hospitalizations. To measure changes in symptoms, functioning and medication adherence PREP utilized a battery of standardized assessment tools identified in Column 2 below. A brief summary of each instrument is provided below. PHQ-9. The Patient Health Questionnaire Depression Scale (PHQ-9) is a 9-item depression scale from the Patient Health Questionnaire (PHQ). It yields a single score ranging from 0 to 27 that yields both provisional diagnosis of depression and a measure symptom severity. The PHQ-9 has proven to be sensitive to change over time. It has been validated in a variety of U.S. practice settings and used successfully in international contexts. GAD-7. The Patient Health Questionnaire Anxiety Scale (GAD7) is a validated 7-item measure of generalized anxiety scale from the Patient Health Questionnaire (PHQ). It yields a single score ranging from 0 to 21 that yields both provisional diagnosis and a measure symptom severity. MARS. The MARS is a 10-item self-report scale of medication adherence that is specifically designed for individuals with psychosis. The MARS assesses willingness and ability to take oral medications, as well as perceptions of medication side effects. The MARS is only completed by consumers who are currently being prescribed medication for psychosis at the time of evaluation. QSANS-QSAPS. Both tools involve the provider assessing the level of positive and negative. symptoms manifest in the client using the Quick Scale for the Assessment of Positive Symptoms (QSAPS) and the Quick Scale for the Assessment of Negative Symptoms (QSANS). On both scales, providers are asked to rate the presence of positive and negative symptoms on a scale of 0 to 100, with the following response anchors: 0= “Absent,” 20= “Minimal/Questionable,” 40= “Mild/Minimal,” 60= “Moderate,” 80= “Marked,” and 100= “Severe.” Responses associated with positive symptoms (e.g. hallucinations, delusions), disorganized symptoms (e.g. disorganized speech, disorganized behavior, agitation/aggression), and negative symptoms (e.g. affective flattening or blunting, alogia, avolition, anhedonia, and asociality) were summed and averaged to create 3 scales. Two items were also added to assess distress associated with hallucinations and delusions, respectively. Global Functioning Scale. The GFS Social scale assesses the "quality of peer relationships, level of peer conflict, age-appropriate intimate relationships and involvement with family members"
“Although staff shortages affect all levels of professionals, including psychiatrists, social workers, and psychologists, the problem is especially daunting for mental health workers whose jobs do not require advanced degrees, for example case managers, frontline hospital staff, community treatment workers, and mental health technicians.”
9
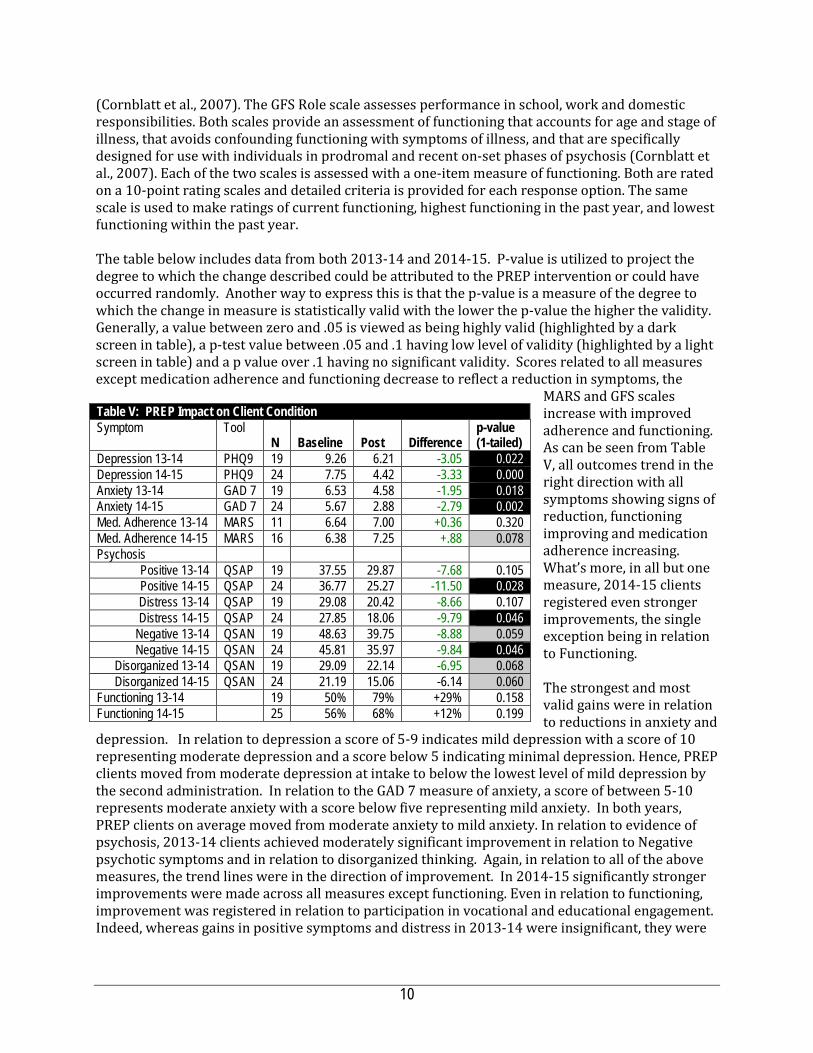
(Cornblatt et al., 2007). The GFS Role scale assesses performance in school, work and domestic responsibilities. Both scales provide an assessment of functioning that accounts for age and stage of illness, that avoids confounding functioning with symptoms of illness, and that are specifically designed for use with individuals in prodromal and recent on-set phases of psychosis (Cornblatt et al., 2007). Each of the two scales is assessed with a one-item measure of functioning. Both are rated on a 10-point rating scales and detailed criteria is provided for each response option. The same scale is used to make ratings of current functioning, highest functioning in the past year, and lowest functioning within the past year. The table below includes data from both 2013-14 and 2014-15. P-value is utilized to project the degree to which the change described could be attributed to the PREP intervention or could have occurred randomly. Another way to express this is that the p-value is a measure of the degree to which the change in measure is statistically valid with the lower the p-value the higher the validity. Generally, a value between zero and .05 is viewed as being highly valid (highlighted by a dark screen in table), a p-test value between .05 and .1 having low level of validity (highlighted by a light screen in table) and a p value over .1 having no significant validity. Scores related to all measures except medication adherence and functioning decrease to reflect a reduction in symptoms, the
MARS and GFS scales increase with improved adherence and functioning. As can be seen from Table V, all outcomes trend in the right direction with all symptoms showing signs of reduction, functioning improving and medication adherence increasing. What’s more, in all but one measure, 2014-15 clients registered even stronger improvements, the single exception being in relation to Functioning. The strongest and most valid gains were in relation to reductions in anxiety and
depression. In relation to depression a score of 5-9 indicates mild depression with a score of 10 representing moderate depression and a score below 5 indicating minimal depression. Hence, PREP clients moved from moderate depression at intake to below the lowest level of mild depression by the second administration. In relation to the GAD 7 measure of anxiety, a score of between 5-10 represents moderate anxiety with a score below five representing mild anxiety. In both years, PREP clients on average moved from moderate anxiety to mild anxiety. In relation to evidence of psychosis, 2013-14 clients achieved moderately significant improvement in relation to Negative psychotic symptoms and in relation to disorganized thinking. Again, in relation to all of the above measures, the trend lines were in the direction of improvement. In 2014-15 significantly stronger improvements were made across all measures except functioning. Even in relation to functioning, improvement was registered in relation to participation in vocational and educational engagement. Indeed, whereas gains in positive symptoms and distress in 2013-14 were insignificant, they were
Table V: PREP Impact on Client Condition Symptom Tool
N Baseline Post Difference p-value (1-tailed)
Depression 13-14 PHQ9 19 9.26 6.21 -3.05 0.022 Depression 14-15 PHQ9 24 7.75 4.42 -3.33 0.000 Anxiety 13-14 GAD 7 19 6.53 4.58 -1.95 0.018 Anxiety 14-15 GAD 7 24 5.67 2.88 -2.79 0.002 Med. Adherence 13-14 MARS 11 6.64 7.00 +0.36 0.320 Med. Adherence 14-15 MARS 16 6.38 7.25 +.88 0.078 Psychosis
Positive 13-14 QSAP 19 37.55 29.87 -7.68 0.105 Positive 14-15 QSAP 24 36.77 25.27 -11.50 0.028 Distress 13-14 QSAP 19 29.08 20.42 -8.66 0.107 Distress 14-15 QSAP 24 27.85 18.06 -9.79 0.046
Negative 13-14 QSAN 19 48.63 39.75 -8.88 0.059 Negative 14-15 QSAN 24 45.81 35.97 -9.84 0.046
Disorganized 13-14 QSAN 19 29.09 22.14 -6.95 0.068 Disorganized 14-15 QSAN 24 21.19 15.06 -6.14 0.060
Functioning 13-14 19 50% 79% +29% 0.158 Functioning 14-15 25 56% 68% +12% 0.199
10
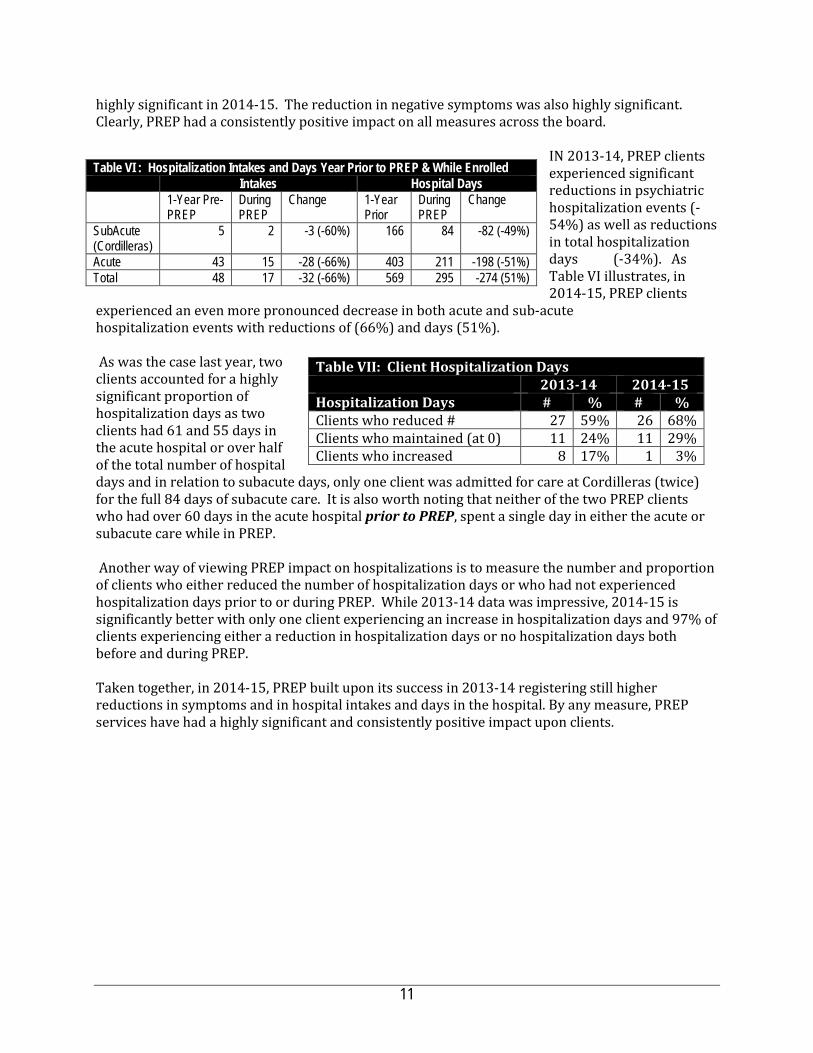
highly significant in 2014-15. The reduction in negative symptoms was also highly significant. Clearly, PREP had a consistently positive impact on all measures across the board.
IN 2013-14, PREP clients experienced significant reductions in psychiatric hospitalization events (-54%) as well as reductions in total hospitalization days (-34%). As Table VI illustrates, in 2014-15, PREP clients
experienced an even more pronounced decrease in both acute and sub-acute hospitalization events with reductions of (66%) and days (51%). As was the case last year, two clients accounted for a highly significant proportion of hospitalization days as two clients had 61 and 55 days in the acute hospital or over half of the total number of hospital days and in relation to subacute days, only one client was admitted for care at Cordilleras (twice) for the full 84 days of subacute care. It is also worth noting that neither of the two PREP clients who had over 60 days in the acute hospital prior to PREP, spent a single day in either the acute or subacute care while in PREP. Another way of viewing PREP impact on hospitalizations is to measure the number and proportion of clients who either reduced the number of hospitalization days or who had not experienced hospitalization days prior to or during PREP. While 2013-14 data was impressive, 2014-15 is significantly better with only one client experiencing an increase in hospitalization days and 97% of clients experiencing either a reduction in hospitalization days or no hospitalization days both before and during PREP.
Taken together, in 2014-15, PREP built upon its success in 2013-14 registering still higher reductions in symptoms and in hospital intakes and days in the hospital. By any measure, PREP services have had a highly significant and consistently positive impact upon clients.
Table VI : Hospitalization Intakes and Days Year Prior to PREP & While Enrolled Intakes Hospital Days
1-Year Pre-PREP
During PREP
Change 1-Year Prior
During PREP
Change
SubAcute (Cordilleras)
5 2 -3 (-60%) 166 84 -82 (-49%)
Acute 43 15 -28 (-66%) 403 211 -198 (-51%) Total 48 17 -32 (-66%) 569 295 -274 (51%)
Table VII: Client Hospitalization Days 2013-14 2014-15 Hospitalization Days # % # % Clients who reduced # 27 59% 26 68% Clients who maintained (at 0) 11 24% 11 29% Clients who increased 8 17% 1 3%
11
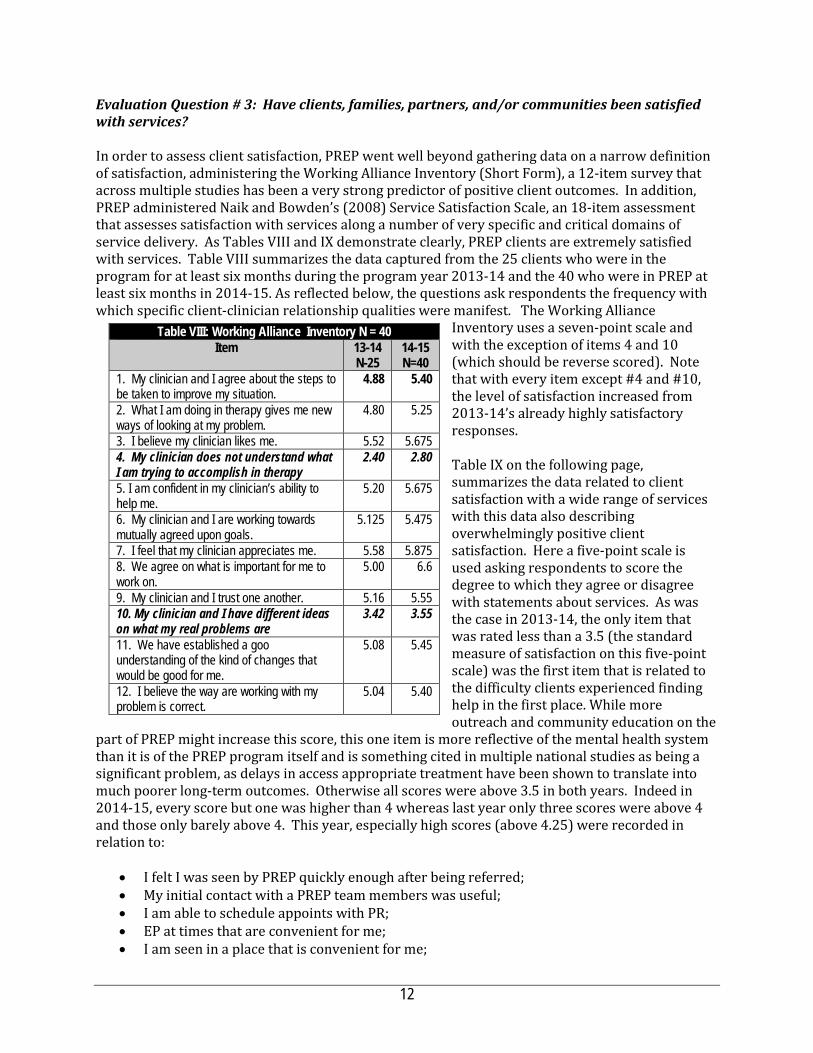
Evaluation Question # 3: Have clients, families, partners, and/or communities been satisfied with services? In order to assess client satisfaction, PREP went well beyond gathering data on a narrow definition of satisfaction, administering the Working Alliance Inventory (Short Form), a 12-item survey that across multiple studies has been a very strong predictor of positive client outcomes. In addition, PREP administered Naik and Bowden’s (2008) Service Satisfaction Scale, an 18-item assessment that assesses satisfaction with services along a number of very specific and critical domains of service delivery. As Tables VIII and IX demonstrate clearly, PREP clients are extremely satisfied with services. Table VIII summarizes the data captured from the 25 clients who were in the program for at least six months during the program year 2013-14 and the 40 who were in PREP at least six months in 2014-15. As reflected below, the questions ask respondents the frequency with which specific client-clinician relationship qualities were manifest. The Working Alliance
Inventory uses a seven-point scale and with the exception of items 4 and 10 (which should be reverse scored). Note that with every item except #4 and #10, the level of satisfaction increased from 2013-14’s already highly satisfactory responses. Table IX on the following page, summarizes the data related to client satisfaction with a wide range of services with this data also describing overwhelmingly positive client satisfaction. Here a five-point scale is used asking respondents to score the degree to which they agree or disagree with statements about services. As was the case in 2013-14, the only item that was rated less than a 3.5 (the standard measure of satisfaction on this five-point scale) was the first item that is related to the difficulty clients experienced finding help in the first place. While more outreach and community education on the
part of PREP might increase this score, this one item is more reflective of the mental health system than it is of the PREP program itself and is something cited in multiple national studies as being a significant problem, as delays in access appropriate treatment have been shown to translate into much poorer long-term outcomes. Otherwise all scores were above 3.5 in both years. Indeed in 2014-15, every score but one was higher than 4 whereas last year only three scores were above 4 and those only barely above 4. This year, especially high scores (above 4.25) were recorded in relation to:
• I felt I was seen by PREP quickly enough after being referred; • My initial contact with a PREP team members was useful; • I am able to schedule appoints with PR; • EP at times that are convenient for me; • I am seen in a place that is convenient for me;
Table VIII: Working Alliance Inventory N = 40 Item 13-14
N-25 14-15 N=40
1. My clinician and I agree about the steps to be taken to improve my situation.
4.88 5.40
2. What I am doing in therapy gives me new ways of looking at my problem.
4.80 5.25
3. I believe my clinician likes me. 5.52 5.675 4. My clinician does not understand what I am trying to accomplish in therapy
2.40 2.80
5. I am confident in my clinician’s ability to help me.
5.20 5.675
6. My clinician and I are working towards mutually agreed upon goals.
5.125 5.475
7. I feel that my clinician appreciates me. 5.58 5.875 8. We agree on what is important for me to work on.
5.00 6.6
9. My clinician and I trust one another. 5.16 5.55 10. My clinician and I have different ideas on what my real problems are
3.42 3.55
11. We have established a goo understanding of the kind of changes that would be good for me.
5.08 5.45
12. I believe the way are working with my problem is correct.
5.04 5.40
12
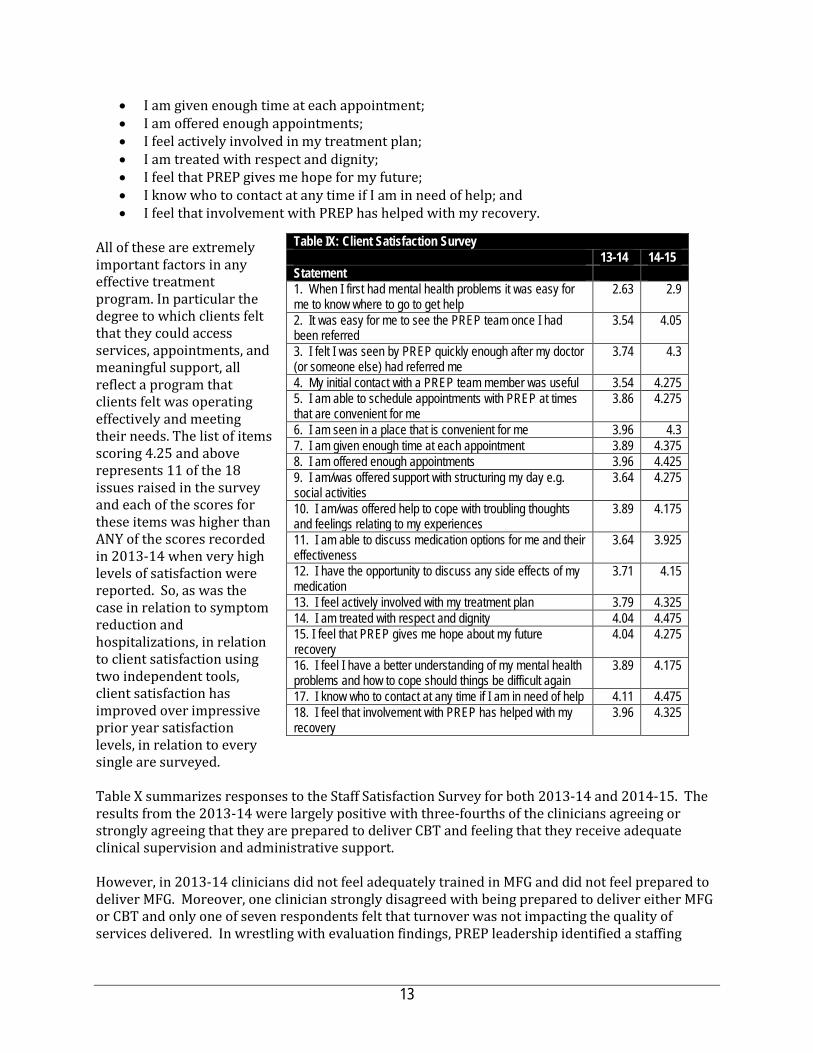
• I am given enough time at each appointment; • I am offered enough appointments; • I feel actively involved in my treatment plan; • I am treated with respect and dignity; • I feel that PREP gives me hope for my future; • I know who to contact at any time if I am in need of help; and • I feel that involvement with PREP has helped with my recovery.
All of these are extremely important factors in any effective treatment program. In particular the degree to which clients felt that they could access services, appointments, and meaningful support, all reflect a program that clients felt was operating effectively and meeting their needs. The list of items scoring 4.25 and above represents 11 of the 18 issues raised in the survey and each of the scores for these items was higher than ANY of the scores recorded in 2013-14 when very high levels of satisfaction were reported. So, as was the case in relation to symptom reduction and hospitalizations, in relation to client satisfaction using two independent tools, client satisfaction has improved over impressive prior year satisfaction levels, in relation to every single are surveyed. Table X summarizes responses to the Staff Satisfaction Survey for both 2013-14 and 2014-15. The results from the 2013-14 were largely positive with three-fourths of the clinicians agreeing or strongly agreeing that they are prepared to deliver CBT and feeling that they receive adequate clinical supervision and administrative support. However, in 2013-14 clinicians did not feel adequately trained in MFG and did not feel prepared to deliver MFG. Moreover, one clinician strongly disagreed with being prepared to deliver either MFG or CBT and only one of seven respondents felt that turnover was not impacting the quality of services delivered. In wrestling with evaluation findings, PREP leadership identified a staffing
Table IX: Client Satisfaction Survey 13-14 14-15 Statement 1. When I first had mental health problems it was easy for me to know where to go to get help
2.63 2.9
2. It was easy for me to see the PREP team once I had been referred
3.54 4.05
3. I felt I was seen by PREP quickly enough after my doctor (or someone else) had referred me
3.74 4.3
4. My initial contact with a PREP team member was useful 3.54 4.275 5. I am able to schedule appointments with PREP at times that are convenient for me
3.86 4.275
6. I am seen in a place that is convenient for me 3.96 4.3 7. I am given enough time at each appointment 3.89 4.375 8. I am offered enough appointments 3.96 4.425 9. I am/was offered support with structuring my day e.g. social activities
3.64 4.275
10. I am/was offered help to cope with troubling thoughts and feelings relating to my experiences
3.89 4.175
11. I am able to discuss medication options for me and their effectiveness
3.64 3.925
12. I have the opportunity to discuss any side effects of my medication
3.71 4.15
13. I feel actively involved with my treatment plan 3.79 4.325 14. I am treated with respect and dignity 4.04 4.475 15. I feel that PREP gives me hope about my future recovery
4.04 4.275
16. I feel I have a better understanding of my mental health problems and how to cope should things be difficult again
3.89 4.175
17. I know who to contact at any time if I am in need of help 4.11 4.475 18. I feel that involvement with PREP has helped with my recovery
3.96 4.325
13

adjustment that they felt would help address staff readiness to deliver the full range of PREP interventions and in 2014-15, PREP also both experienced far greater staff stability and when a staff change occurred, new staff were recruited quickly, most always from Felton itself, thereby ensuring that these staff were better oriented to PREP and in most instances had been trained in PREP interventions before being selected. See EQ # 7. In this context, one would expect that satisfaction levels would be even higher in 2014-15 and as Table X reflects, that is the case. But the results are not as positive as one would expect, especially given the positive client outcomes. While clinicians generally felt more prepared than their 2013-14 counterparts for delivering MFG and CBT and also felt that their training in these practices had been better than in 2013-14 and also felt that PREP successfully engaged clients, there were several areas in which staff satisfaction was surprisingly low:
• No clinician reported feeling they had consistent access to clinical supervision; • Again, only one clinician felt that staff turnover was not having an impact on the quality of
services, with four clinicians strongly disagreeing that turnover was not having an impact; • Whereas only 2 clinicians in 2013-14 disagreed that there was adequate administrative
support, in 2014-15 2 strongly disagreed and 3 more disagreed, a significant difference from the prior year; and
• Lastly, while six of seven clinicians in 2013-14 agreed or strongly agreed that PREP did a good job of engaging families, only three of seven agreed or strongly agreed in 2014-15.
Table X: Staff Satisfaction Survey— Statements
Year Strongly Disagree
Disagree Neither Agree or Disagree
Agree Strongly Agree
I feel fully prepared to deliver CBT with clients 2013-14 1 (25%) 0 0 0 3 (75%) I feel fully prepared to deliver CBT with clients 2014-15 0 0 2 (29%) 3 (43%) 2 (29%) I feel fully prepared to facilitate MFG groups 2013-14 0 1 (25%) 2- (50%) 1 (25%) 0 I feel fully prepared to facilitate MFG groups 2014-15 0 1 (14%) 2 (29%) 3 (43%) I have received good training in CBT. 2013-14 1- 25% 0 0 1 (25%) 2 (50%) I have received good training in CBT. 2014-15 0 1 (14%) 1 (14%) 1 (14%) 4 (57%) I have received good training in MFG. 2013-14 1 (25%) 2 (50%) 0 1 (25%) 0 I have received good training in MFG. 2014-15 1 (14%) 0 1 (14%) 3 (43%) 2 (29%) I have consistent access to clinical supervision 2013-14 1 (25%) 0 0 1 (25%) 2 (50%) I have consistent access to clinical supervision 2014-15 1 (14%) 4 (57%) 2 (29%) 0 0 Staff turnover has not had a significant impact on the quality of PREP services.
2013-14 2 (29%) 2 (29%) 2 (29%) 1 (14%) 0
Staff turnover has not had a significant impact on the quality of PREP services.
2014-15 4 (57%) 2 (29%) 0 1 (14%) 0
There is adequate administrative support. 2013-14 0 2 (28.6%) 2 (28.6%) 2 (28.6%) 1 (14.3%)
There is adequate administrative support. 2014-15 2 (29%) 3 (43%) 0 1 (14%) 1 (14%) I am confident that the treatment provided by PREP is helping clients achieve recovery.
2013-14 0 0 1 (14.%) 5 (74%) 1 (14.3%)
I am confident that the treatment provided by PREP is helping clients achieve recovery.
2014-15 0 0 1 (14%) 4 (57%) 2 (29%)
PREP does a good job of engaging clients when they first seek treatment.
2013-14 0 0 1 (14%) 4 (57%) 2 (29%)
PREP does a good job of engaging clients when they first seek treatment.
2014-15 0 0 0 5 (71%) 2 (29%)
PREP does a good job engaging family members. 2013-14 0 0 1 (14.3%) 3 (42.9%) 3 (42.9%) PREP does a good job engaging family members. 2014-15 0 1 (14%) 3 (43%) 2 (29%) 1 (14%)
14
While seven is a very low N on which to base any strong findings, the relatively low staff satisfaction results in these four areas is something that PREP leadership should explore. In conversation with PREP leadership, they indicated that throughout the year, turnover had not been a problem, as noted in findings above, but that at the time of the Satisfaction Survey, staff concerns developed over the Program Manager’s departure. This may partially explain the relatively low scores on satisfaction. PREP leadership reported that the transition required due to the Manager’s departure has been managed effectively. One last concern that should be expressed is that PREP failed to administer a Family Satisfaction Survey. This concern was raised with PREP leadership and they indicated that a Family Satisfaction Survey had been developed and was in use now, however, not enough families had participated in the survey to warrant inclusion in this evaluation. Nonetheless, it should be noted that, once again, PREP staff had taken seriously the areas for improvement identified in the 2013-14 report and with the development of this family survey had now addressed every single issue. Evaluation Question # 4: Have program services been responsive to the population targeted by the contract? The satisfaction data above shows clearly that clients felt that services were responsive to their needs. The program targeted a high-risk population where early intervention has demonstrated great promise for reducing long-term hospitalization and fostering recovery. PREP also served a highly diverse population with over 2/3 of clients being from demographic groups that are historically under-served. By all measures, the PREP program is responsive to the population targeted by the contract. Evaluation Question # 5: To what degree has the program advanced the vision, mission and objectives of the MHSA PEI plan? The vision, mission and values of San Mateo County Behavioral Health & Recovery Services stress empowering individuals to direct their own recovery process. BHRS stresses the adoption of culturally competent treatment approaches and through its MHSA planning processes, a further focus has been placed upon implementing evidence-based practices that have demonstrated the capacity to support client wellness and recovery. From the perspective of prevention, BHRS has also described the journey towards a transformed system requiring that programs:
• move “upstream” to primary prevention strategies; • partner with other health prevention efforts to focus on wellness and recovery; • achieve desired outcomes; and • integrate efforts to support sustainability;
What’s more, San Mateo’s MHSA plan clearly described the priority of intervening early and identified stress, PTSD, and use of alcohol and drugs as factors where early intervention were most important, particularly in relation to individuals from historically underserved populations.
Schizophrenia is one of the most common and devastating of mental illnesses, generally beginning in late adolescence or early adulthood and lasting a lifetime. It is estimated that this single disease accounts for about 2.5 - 3% of US healthcare expenditures. (Mauskopf, JA, David, K, Grainger, DL, Gibson, PJ, 1999). Although the disease occurs in a socioeconomic cross-section of the population, long-term treatment costs tend to fall disproportionately on Medicaid, as chronic schizophrenia
15

sufferers age off parental health insurance and are unlikely to have stable employment through which private health coverage would be available. (Marcus, FC, Olfson, M, 2008)
Once schizophrenia has manifested itself, the prognosis for sustained recovery is poor. Within the first five years of the disease, fewer than 14% show sustained recovery, and perhaps 30% achieve stable remission over the longer term (Insel TR, , 2010). Life expectancy for schizophrenia sufferers may be shortened as much as 15-25 years. In addition to the loss of both quality and duration of life, there are serious cost implications for treatment of physical health conditions of this chronically ill population. Key physical health issues include much higher risks of cardiovascular disease, obesity, smoking, and substance use, as well as the consequences of physical inactivity, homelessness, misadventure, and suicide. (Chang, C, Hayes, RD, Perera, G, Broadbent, M, Fernandes, A, Lee, W, Hotopf, M, Stewart, R, 2011). In delivering an intervention program to treat psychosis early in the disease, PREP is clearly meeting a critical BHRS priority. What’s more, PREP is employing multiple evidence-based practices in treating early psychosis. As Table VIII demonstrates, prior to enrolling in PREP, clients found accessing mental health services very difficult and thus PREP is also serving a population that had had difficulty finding either effective services or any services prior to enrolling in PREP. By any measure, PREP is addressing a clear BHRS priority with services aligned to its mission, vision and values.
Evaluation Question # 6: What factors have impeded or contributed to successful implementation? How? In 2013-14, the very deep dive into PREP data revealed a program that was achieving very strong outcomes, but that also was beset by a number of operational challenges, including: Staff turnover is clearly having a negative impact on service delivery, particularly as relates to staff involved in MFG delivery, including Family Partner, AA and clinicians who must complete an intensive MFG training in order to deliver the model to fidelity. As the staff survey indicated, while most clinicians felt strongly that they were trained and prepared to deliver CBT, most felt that they were unprepared to deliver MFG. This points to the challenge imposed by turnover and the reality that complex, costly training in either CBT or MFG can’t be delivered every time a single staff member is hired. The evaluator and PREP leadership spoke at length about this issue. See the plan to address this challenge under EQ # 7 below. In 2014-15, PREP experienced very little turnover and the turnover that did occur was addressed and filled very quickly, largely due to PREP being able to recruit replacement staff from Felton and these staff were already very aware of the PREP program, inducted into the Felton culture, and in most instances trained in many of the PREP interventions. Not surprisingly, staff satisfaction surveys reflect high levels of readiness to treat PREP clients and implement PREP interventions. [Ask Adriana if they used the Phase concept described in EQ 7. Low Involvement of Clients in MFG. MFG is a complex approach to implement to fidelity and failure to engage large numbers of clients is likely related to the turnover problem. While PREP engaged 91 family members and engaged them in a significant level of treatment planning, including family involvement in treatment planning, case management, psycho-education and medication consultation. But this engagement did not translate into a sufficient number of families participating in either F&F groups or MFG. MFG is a critical component of PREP because MFG is how PREP educates family members about psychosis, helping them to identify symptoms that
16

correlate with relapse and helping them develop a long-term recovery plan through which family members can support the client after graduation from PREP. In 2014-15, PREP sustained a practice introduced in late 2013-14, the introduction of a Friends & Family Group that now meets alternate weeks. This and the far more stable staffing resulted in much greater family engagement, participation in Friends & Family Groups, and in MFG. Need for strategies for identifying potential high-end users. As described at length above, two clients used 67 and 162 hospital days respectively significantly reducing the percentage drop in hospital days. While the data shows that while in PREP 29% had zero hospitalizations and another 54% of clients reduced their hospital days while in PREP (i.e. 83% of all clients), to maximize the fiscal benefit to the County and to alleviate client suffering, it is important to identify evidence of treatment disengagement, presenting symptoms, or other indicators that could predict developing crisis and find ways to intervene to prevent a crisis or at least to reduce the length of hospitalization. Conversation with PREP leadership on this topic led to a number of identified strategies outlined in EQ # 7 below. The best indicator of a client at especially high-risk of hospitalization is lack of consistent engagement in treatment. This is consistent with PREP’s experience in 2013-14. The second indicator would be client involvement with substance abuse. If those clients can reduce their use, then engagement can occur and hospitalization avoided. Other factors that can contribute are simply the stage of the disease upon enrollment with clients with more advanced symptoms being more likely to require hospitalization at some point in the future. Lack of a definition for what constitutes an ‘engaged client, when a client ‘drops out’ or ‘graduates’ can obfuscate outcome data and make caseload planning more challenging. As a result of the 2013-14 evaluation, PREP leadership met over a period of weeks, determined very specific definitions for when an individual is officially enrolled in the program and a client and what constitutes graduation. Leadership also charged researchers with the task of ‘cleaning’ the data so that it was entered with more precision, i.e. where different services were clearly distinguished. Recall in 2013-14, medication consultations were not clearly distinguished from family consultations and consultations about medications with psychiatrists who retained involvement with PREP clients were also not captured as a mediation consultation. Changes to these and a host of other data entry issues resulted in a much smoother evaluation process. Data was delivered in one piece at one time and was very easy to work with. More importantly, that the data could be provided to the evaluator this easily suggests strongly that it is also available to staff to be used in ongoing program improvement efforts. What’s more, PREP has developed a program dashboard with productivity, charting and program outcome data that helps program managers monitor program implementation. The dashboard is shared with Steering Committee members, which includes Paul Sorbo and other senior leadership across BHRS system of care. Individual Consumer Reports and Clinician Reports are also developed on a systematic basis. Consumers receive an individualized report that includes a compilation of measures related to self-reported anxiety, depressions, substance abuse and other symptoms. The Clinician Reports are more complex as they reflect an analysis of change from baseline to every six months of a client’s enrollment. These measures are based upon clinician assessment of positive and negative symptoms. The clinicians are receiving these reports on a regular basis are help the clinician assess the impact of the program on clients and to identify trends in service delivery that might predict success or challenges. The degree to which PREP utilizes data to report to County leadership, to provide feedback directly to consumers, and to inform clinical decision-making is extremely uncommon and worthy of acknowledgment.
17
Evaluation Question # 7: What steps can be taken in the future to improve program services and what data could verify that these improvements had occurred? PREP leadership was unflinching in its response to last year’s evaluation. They used it to provide the county with a report on how they would make improvements in staff retention, data collection, family engagement and service delivery. And they delivered on every promise. Charting has been improved significantly resulting in far more useful data summaries that can be used for evaluation and for program planning. Staff retention has benefitted from targeted recruitment strategies that draw upon recruitment from Felton to fill PREP vacancies, ensuring that new staff are more trained and prepared to implement the PREP model. In this context, new staff are not ‘thrown into the fray’ but enter more prepared. This contributes to staff morale and more seamless, consistent service delivery. Engagement of hard-to-serve clients. This is one area where PREP could benefit from deeper exploration. Again this year, 2-3 clients represented the vast majority of hospitalizations and those clients tended to be less satisfied with services. While not as obviously a problem as in 2013-14, if there is anything that PREP leadership could do to improve their program, it would be to take a deep, deep dive into the last two years of data and examine the clients who have experienced a high number of hospital days while in PREP and seek out patterns either in:
• How long it took to engage them in services; • How well family and friends were involved in treatment; • How consistently clients participated in services; and • Other socio-economic and cultural factors that may be impeding successful treatment.
As noted above, PREP has indeed examined trends in service delivery with clients experiencing lengthy hospitalizations. That analysis does cause the program to emphasize the critical importance of engaging the client early and developing a strong therapeutic relationship. However, some level of hospitalization is going to occur for any program working with a population that by design is at high risk of hospitalization. Taken together, the PREP program should be quite proud of the progress made in just one year. On virtually every single measure: productivity, impact and consumer satisfaction significant advances have been made on a program that was already high performing. While significant operational and data collection shortcomings were identified in 2013-14, all have been addressed in 2014-15. PREP serves an extremely difficult population to engage, retain and treat, as evidenced by innumerable national studies. The degree to which this model is achieving such positive outcomes is not just good news for San Mateo County, but for the State and Nation. I would highly recommend a more intensive study of precisely how PREP operates in San Mateo with a goal of expanding the program very broadly. Not only is the model worth honing, PREP leadership are the right people to do the honing.
18
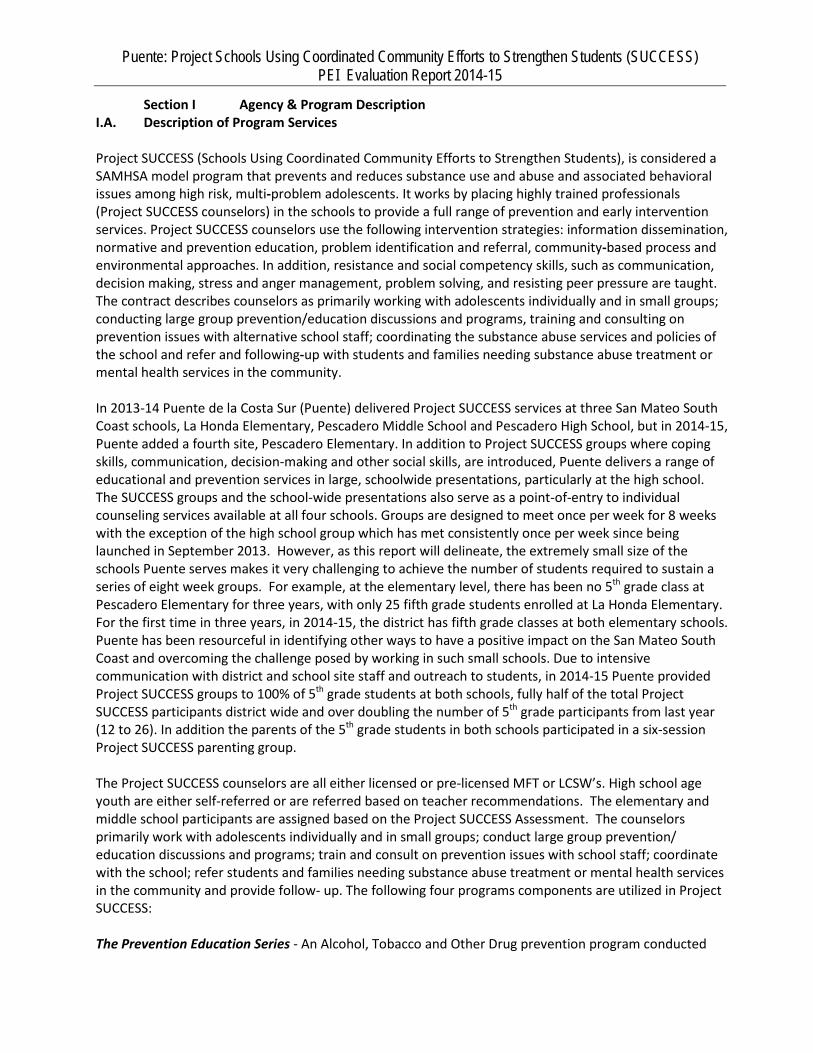
Puente: Project Schools Using Coordinated Community Efforts to Strengthen Students (SUCCESS) PEI Evaluation Report 2014-15
Section I Agency & Program Description I.A. Description of Program Services Project SUCCESS (Schools Using Coordinated Community Efforts to Strengthen Students), is considered a SAMHSA model program that prevents and reduces substance use and abuse and associated behavioral issues among high risk, multi‐problem adolescents. It works by placing highly trained professionals (Project SUCCESS counselors) in the schools to provide a full range of prevention and early intervention services. Project SUCCESS counselors use the following intervention strategies: information dissemination, normative and prevention education, problem identification and referral, community‐based process and environmental approaches. In addition, resistance and social competency skills, such as communication, decision making, stress and anger management, problem solving, and resisting peer pressure are taught. The contract describes counselors as primarily working with adolescents individually and in small groups; conducting large group prevention/education discussions and programs, training and consulting on prevention issues with alternative school staff; coordinating the substance abuse services and policies of the school and refer and following‐up with students and families needing substance abuse treatment or mental health services in the community. In 2013-14 Puente de la Costa Sur (Puente) delivered Project SUCCESS services at three San Mateo South Coast schools, La Honda Elementary, Pescadero Middle School and Pescadero High School, but in 2014-15, Puente added a fourth site, Pescadero Elementary. In addition to Project SUCCESS groups where coping skills, communication, decision-making and other social skills, are introduced, Puente delivers a range of educational and prevention services in large, schoolwide presentations, particularly at the high school. The SUCCESS groups and the school-wide presentations also serve as a point-of-entry to individual counseling services available at all four schools. Groups are designed to meet once per week for 8 weeks with the exception of the high school group which has met consistently once per week since being launched in September 2013. However, as this report will delineate, the extremely small size of the schools Puente serves makes it very challenging to achieve the number of students required to sustain a series of eight week groups. For example, at the elementary level, there has been no 5th grade class at Pescadero Elementary for three years, with only 25 fifth grade students enrolled at La Honda Elementary. For the first time in three years, in 2014-15, the district has fifth grade classes at both elementary schools. Puente has been resourceful in identifying other ways to have a positive impact on the San Mateo South Coast and overcoming the challenge posed by working in such small schools. Due to intensive communication with district and school site staff and outreach to students, in 2014-15 Puente provided Project SUCCESS groups to 100% of 5th grade students at both schools, fully half of the total Project SUCCESS participants district wide and over doubling the number of 5th grade participants from last year (12 to 26). In addition the parents of the 5th grade students in both schools participated in a six-session Project SUCCESS parenting group.
The Project SUCCESS counselors are all either licensed or pre-licensed MFT or LCSW’s. High school age youth are either self-referred or are referred based on teacher recommendations. The elementary and middle school participants are assigned based on the Project SUCCESS Assessment. The counselors primarily work with adolescents individually and in small groups; conduct large group prevention/ education discussions and programs; train and consult on prevention issues with school staff; coordinate with the school; refer students and families needing substance abuse treatment or mental health services in the community and provide follow- up. The following four programs components are utilized in Project SUCCESS: The Prevention Education Series - An Alcohol, Tobacco and Other Drug prevention program conducted
by the Project SUCCESS Counselor with small groups of students. Individual and Group Counseling - At the school sites, Project SUCCESS counselors conduct time-limited group counseling for students following participation in the Prevention Education Series. Individual assessments and individual sessions are provided when a higher level of care is deemed necessary. Students needing a higher level of care are identified by teachers, parents, self-referral or on the recommendation of a Puente Therapist. All students that receive individual or group therapy complete a referral package that has been signed by parents, and includes and Authorization for Treatment, a Release of Information if required and all HIPPA requirements. Summer Supervision Groups. With funding from SMC and local foundations, each Summer Puente hires Youth ages 14-18 from the community to work at Puente. The youth are given a two-week orientation and divided into supervision groups by age and placement. The Project SUCCESS team provides weekly supervision for each group. In these groups, Puente utilizes the Project SUCCESS model to educate the youth about drugs and alcohol prevention. The youth are assigned for working roles throughout the area, some working at the local YMCA camp, school district recreation programs, local businesses, non-profits and ranches. The program provides a foundation of understanding of issues related to drugs and alcohol while also providing students opportunities to use their skills, work with adults and other peers, and develop assets that are consistent with the Search Institute model. Parent Programs - Project SUCCESS includes parents and teachers as collaborative partners in prevention through parent education programs:
• Enough Abuse is a Spanish only parenting model sanctioned by the county. Two Project SUCCESS team members were trained in the approach and deliver this program. The group is a one-time event and focuses on increasing awareness of Child Abuse. Puente incorporated a section on Drug and Alcohol Prevention Strategies and how the use of drugs and alcohol is often intertwined with incidents of Child Abuse in our society. This program and training is provided by culturally competent Puente staff and creates an opportunity to utilize a model that specifically targets the Latino community.
• Grupo de las Madres was an (11) session group. This group was based on a process group model and served Latino women and parents who were identified as having had difficulties with maternal depression and parenting skills.
• Groups for Parents of 5th grade students. This six-session group was provided to all parents of 5th grade students on both elementary school campuses. The curriculum focused on drug and alcohol prevention education, and strategies for parents with students transitioning to middle school. In addition parents received a session on the developmental process of their students, and what to expect as they transition into teenagers. Parents also received a session on how social media affects their child. This topic is especially relevant and was reported by Puente staff as being an overwhelming success. District staff has asked Puente Therapists to provide this same training and information to all elementary school parents.
In addition, Puente serves as the Differential Response program for the Sam Mateo South Coast. So, for example, if someone calls Children’s Protective Services (CPS), CPS could elect to refer the case to Puente. Similarly, if Puente identifies a child, parent, or family in need of services more intensive than those available through Project SUCCESS, Puente need not work through ACCESS and can simply enroll the individual or family in need for more intensive services provided by Puente. In this way, Project SUCCESS can serve as a point of entry to comprehensive services for anyone on the San Mateo South Coast identified as in need of those services. In this way, Puente serves as a de facto one-stop-shop for behavioral health services.
2

I.B. Research Basis for Approach
Identified by SAMHSA as an evidence-based approach to prevention, Project SUCCESS builds on the findings of other successful prevention programs by using interventions that are effective in reducing risk factors and enhancing protective measures such as those promoted by the Search Institute. The San Mateo County Health System has adopted the Search Institute's 41 Developmental Assets as the framework to use when addressing the needs of young people in the community. This strengths-based model works with youth, their families, schools and community to promote the forty-one (41) internal and external assets needed to build positive self-esteem, the ability to solve problems and build healthy social relationships. Research has shown that youth with levels of assets over thirty (30) are more likely to succeed academically, maintain good health, and contribute to their community. For the 2014-15 program year, Puente adopted the Developmental Assets Profile (DAP), a Search Institute tool designed to document the degree to which Project SUCCESS participants are developing assets and building resilience. The DAP is a 58-item, forced choice assessment that enabled Puente to assess each student in terms of the number of developmental assets they possess at intake and then measure again when the student exits the group program, providing valuable data to validate the degree to which the groups are building student assets. As will be described under Evaluation Question II, there are a number of subscales within the DAP that allowed Puente and the evaluator to focus upon specific critical asset groups that can be viewed as ‘coping skills.” Increasing coping skills is the performance measure used by the County to assess project impact. The aggregated pre-test assessment data for a group of students will also inform the group facilitator as to areas where the group may have common areas where assets need to be developed, enabling the program to target these assets for development. It also enables the facilitator to identify “challenged” students, defined by Search Institute as students with fewer than 30 assets.
Two studies were examined by SAMHSA in determining SUCCESS to be an evidence-based practice: 1) Morehouse, E. R., & Tobler, N. S. (2000). Project SUCCESS final report: Grant number 4 HD1 SP07240. Report submitted January 26, 2000, to the Center for Substance Abuse Prevention, U.S. Department of Health and Human Services. 2) Vaughan, R., & Johnson, P. (2007). The effectiveness of Project SUCCESS (Schools Using Coordinated Community Efforts to Strengthen Students) in a regular secondary school setting. Unpublished manuscript.
Both studies utilized a revised version of the American Drug and Alcohol Survey (ADAS) to measure changes in attitudes and behaviors related to ATOD. The survey was revised so that it could be administered in one class session. A drug use index was created by summing the scores of self-reported use of 13 drugs: tobacco, alcohol, marijuana, crack, cocaine, heroin, inhalants, LSD, PCP, amphetamines, meta-amphetamines, ecstasy, and "andrenochomes," a false drug included to identify students who over-reported drug use.
In one study, for the purposes of analysis, students were classified as ATOD users and nonusers based on their pretest use status. At posttest in the first year of a study involving alternative secondary school students:
3

• Self-reports showed a 37% decrease in ATOD use among Project SUCCESS participants relative to students in the comparison group who did not participate in Project SUCCESS (p < .001).
• Of the students using ATOD at pretest, 23% of those in the Project SUCCESS program reportedly stopped ATOD use, whereas only 5% in the comparison condition reported stopping (p < .001).
• For those Project SUCCESS students who did not discontinue ATOD use, there was a significant reduction in reported ATOD use across the drugs assessed, ranging from 17% (p < .05) to 26.6% (p < .01).
• At follow-up in the second year of the same study, among Project SUCCESS students who reported using ATOD at pretest, 33.3% reportedly stopped using alcohol, 45.0% reportedly stopped using marijuana, and 22.9% reportedly stopped using tobacco (all p values < .05).
In another study, 21 months following the intervention, regular secondary school students who were involved in Project SUCCESS were less likely than students in the control group to report having ever used marijuana, having smoked in the past month, and having ever used any other substance alone (all p values < .05).
Among pretest users, 21 months following the intervention:
• Among students who used alcohol and cigarettes at pretest, students in the control group were 2.32
times more likely than similar intervention students to report continued use of alcohol and cigarettes; 4.3 times more likely to report use of alcohol, cigarettes, and marijuana; and 5 times more likely to report use of illicit substances (all p values < .05).
• Among students who used alcohol, cigarettes, and marijuana at pretest, students in the control group were 4.16 times more likely than similar intervention students to report continued use of alcohol and cigarettes; 4.54 times more likely to report continued use of alcohol, cigarettes, and marijuana; and 7.33 times more likely to report use of illicit substances (all p values < .05).
• Among students who used illicit substances at pretest, students in the control group were 4.76 times more likely than intervention students to report continued use of alcohol and cigarettes; 5 times more likely to report continued use of alcohol, cigarettes, and marijuana; and 2.7 times more likely to report continued use of illicit substances (all p values < .05).
It is important to note that the Project SUCCESS model generally and the Search Institute’s 41 Developmental Assets were not designed for rural, highly Latino, low-income populations where low literacy is commonplace. However in a meta study by Peter Benson that examined programs and communities adopting models based upon the intentional creation of community wide connections and partnerships focused upon providing youth with opportunities to develop assets, it was found that no matter the ethnic population, income levels or size of the community or community setting, youth benefit tremendously from “asset accumulation.” A component of Puente’s Project SUCCESS is its Summer Youth Leadership and Employment Program Supervision program which is an excellent example of the intentional establishment of an expanding community partnership focused on providing summer opportunities for adolescents to participate in community functions, work with adults, build personal competence and accumulate assets.
4
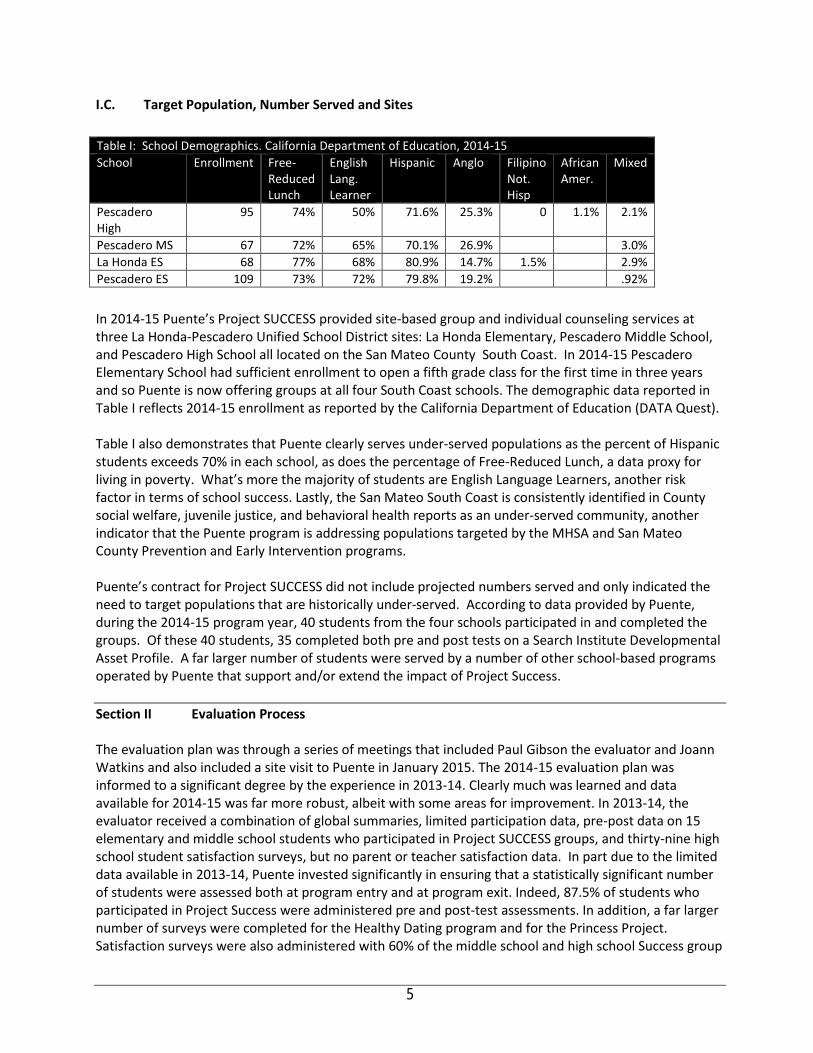
I.C. Target Population, Number Served and Sites
In 2014-15 Puente’s Project SUCCESS provided site-based group and individual counseling services at three La Honda-Pescadero Unified School District sites: La Honda Elementary, Pescadero Middle School, and Pescadero High School all located on the San Mateo County South Coast. In 2014-15 Pescadero Elementary School had sufficient enrollment to open a fifth grade class for the first time in three years and so Puente is now offering groups at all four South Coast schools. The demographic data reported in Table I reflects 2014-15 enrollment as reported by the California Department of Education (DATA Quest). Table I also demonstrates that Puente clearly serves under-served populations as the percent of Hispanic students exceeds 70% in each school, as does the percentage of Free-Reduced Lunch, a data proxy for living in poverty. What’s more the majority of students are English Language Learners, another risk factor in terms of school success. Lastly, the San Mateo South Coast is consistently identified in County social welfare, juvenile justice, and behavioral health reports as an under-served community, another indicator that the Puente program is addressing populations targeted by the MHSA and San Mateo County Prevention and Early Intervention programs. Puente’s contract for Project SUCCESS did not include projected numbers served and only indicated the need to target populations that are historically under-served. According to data provided by Puente, during the 2014-15 program year, 40 students from the four schools participated in and completed the groups. Of these 40 students, 35 completed both pre and post tests on a Search Institute Developmental Asset Profile. A far larger number of students were served by a number of other school-based programs operated by Puente that support and/or extend the impact of Project Success. Section II Evaluation Process The evaluation plan was through a series of meetings that included Paul Gibson the evaluator and Joann Watkins and also included a site visit to Puente in January 2015. The 2014-15 evaluation plan was informed to a significant degree by the experience in 2013-14. Clearly much was learned and data available for 2014-15 was far more robust, albeit with some areas for improvement. In 2013-14, the evaluator received a combination of global summaries, limited participation data, pre-post data on 15 elementary and middle school students who participated in Project SUCCESS groups, and thirty-nine high school student satisfaction surveys, but no parent or teacher satisfaction data. In part due to the limited data available in 2013-14, Puente invested significantly in ensuring that a statistically significant number of students were assessed both at program entry and at program exit. Indeed, 87.5% of students who participated in Project Success were administered pre and post-test assessments. In addition, a far larger number of surveys were completed for the Healthy Dating program and for the Princess Project. Satisfaction surveys were also administered with 60% of the middle school and high school Success group
Table I: School Demographics. California Department of Education, 2014-15 School Enrollment Free-
Reduced Lunch
English Lang. Learner
Hispanic Anglo Filipino Not. Hisp
African Amer.
Mixed
Pescadero High
95 74% 50% 71.6% 25.3% 0 1.1% 2.1%
Pescadero MS 67 72% 65% 70.1% 26.9% 3.0% La Honda ES 68 77% 68% 80.9% 14.7% 1.5% 2.9% Pescadero ES 109 73% 72% 79.8% 19.2% .92%
5
participants, a percentage that could be increased next year and with 34 students who participated in the Summer Supervision Groups. In relation to individual counseling, family education and support, and referrals for more intensive services, these services are delivered through a separate contract and represents a different program than SUCCESS and so no data was analyzed in relation to these individual and family counseling services. Section III Evaluation Findings There are seven evaluation questions that frame the evaluation of the Prevention & Early Intervention programs supported with Mental Health Services Act funds.
Evaluation Question # 1: Has the intervention/ program been implemented efficiently and according to the contract funding the program? Evaluation Question # 2: Has the program implemented effective program strategies? i.e. Is the program well-designed and achieving a desired impact? Evaluation Question # 3: Have clients, families, partners, and/or communities been satisfied with services? Evaluation Question # 4: Have program services been responsive to the population targeted by the contract? Evaluation Question # 5: To what degree has the program advanced the vision, mission and objectives of the MHSA PEI plan? Evaluation Question # 6: What factors have impeded or contributed to successful implementation? How? Evaluation Question # 7: What steps can be taken in the future to improve program services and what data could verify that these improvements had occurred?
Each evaluation question is discussed separately below in separate sections.
6
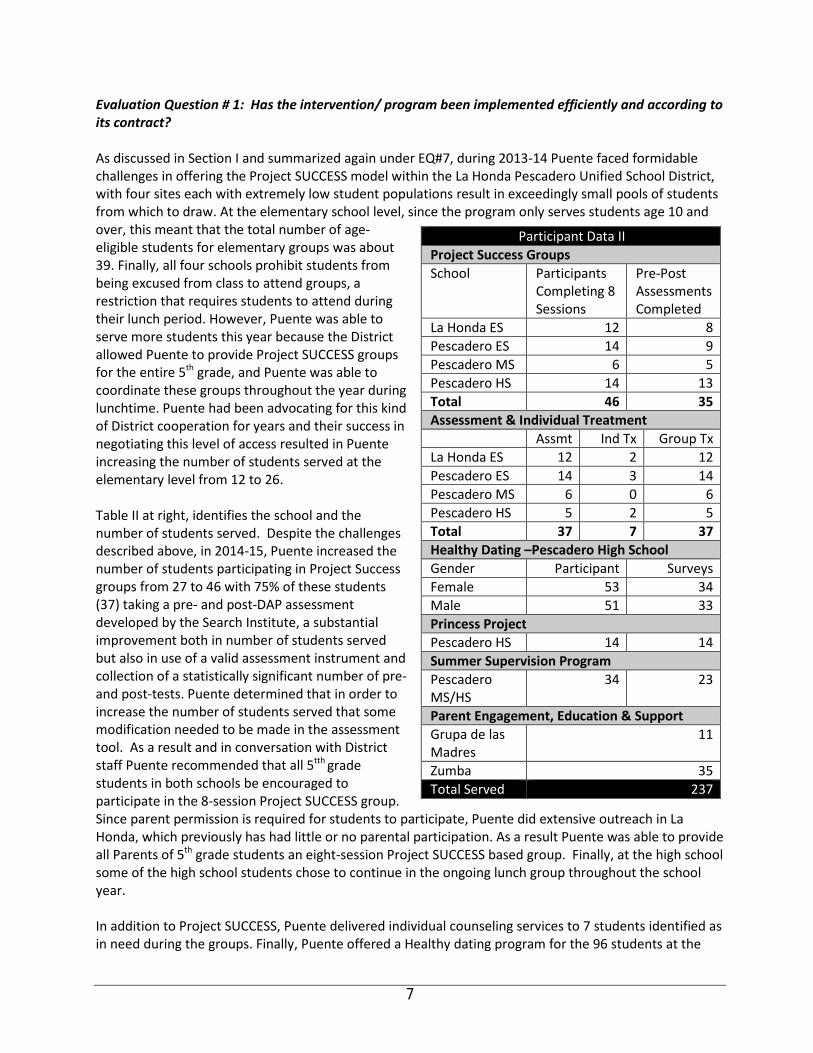
Evaluation Question # 1: Has the intervention/ program been implemented efficiently and according to its contract? As discussed in Section I and summarized again under EQ#7, during 2013-14 Puente faced formidable challenges in offering the Project SUCCESS model within the La Honda Pescadero Unified School District, with four sites each with extremely low student populations result in exceedingly small pools of students from which to draw. At the elementary school level, since the program only serves students age 10 and over, this meant that the total number of age-eligible students for elementary groups was about 39. Finally, all four schools prohibit students from being excused from class to attend groups, a restriction that requires students to attend during their lunch period. However, Puente was able to serve more students this year because the District allowed Puente to provide Project SUCCESS groups for the entire 5th grade, and Puente was able to coordinate these groups throughout the year during lunchtime. Puente had been advocating for this kind of District cooperation for years and their success in negotiating this level of access resulted in Puente increasing the number of students served at the elementary level from 12 to 26. Table II at right, identifies the school and the number of students served. Despite the challenges described above, in 2014-15, Puente increased the number of students participating in Project Success groups from 27 to 46 with 75% of these students (37) taking a pre- and post-DAP assessment developed by the Search Institute, a substantial improvement both in number of students served but also in use of a valid assessment instrument and collection of a statistically significant number of pre- and post-tests. Puente determined that in order to increase the number of students served that some modification needed to be made in the assessment tool. As a result and in conversation with District staff Puente recommended that all 5tth grade students in both schools be encouraged to participate in the 8-session Project SUCCESS group. Since parent permission is required for students to participate, Puente did extensive outreach in La Honda, which previously has had little or no parental participation. As a result Puente was able to provide all Parents of 5th grade students an eight-session Project SUCCESS based group. Finally, at the high school some of the high school students chose to continue in the ongoing lunch group throughout the school year. In addition to Project SUCCESS, Puente delivered individual counseling services to 7 students identified as in need during the groups. Finally, Puente offered a Healthy dating program for the 96 students at the
Participant Data II Project Success Groups School Participants
Completing 8 Sessions
Pre-Post Assessments Completed
La Honda ES 12 8 Pescadero ES 14 9 Pescadero MS 6 5 Pescadero HS 14 13 Total 46 35 Assessment & Individual Treatment Assmt Ind Tx Group Tx La Honda ES 12 2 12 Pescadero ES 14 3 14 Pescadero MS 6 0 6 Pescadero HS 5 2 5 Total 37 7 37 Healthy Dating –Pescadero High School Gender Participant Surveys Female 53 34 Male 51 33 Princess Project Pescadero HS 14 14 Summer Supervision Program Pescadero MS/HS
34 23
Parent Engagement, Education & Support Grupa de las Madres
11
Zumba 35 Total Served 237
7

high school and received completed satisfaction surveys from 67 students 33 young women and 34 young men Puente also continued the Princess Project that worked with 14 Pescadero High females around issues of good decision-making around drugs, alcohol and sex in the context of providing assistance in purchasing a prom dress and preparing for the Prom. The Healthy Dating and Princess Project are described below. In 2014-15, a Puente clinical staff member and two chaperones took 14 female high school students to the Princess Project in Santa Clara to pick out a prom dress and accessories free of charge. Most of the students came from rural low-income families and wouldn’t have otherwise been able to afford to buy a dress and attend the prom. Puente used the Princess Project as a platform for conveying information about dating, refusal skills, and alcohol and drugs. Puente reported that feedback from this event was very positive and that many of the young men in the high school commented that they would like to have a similar program that would allow them to either borrow tuxedo’s or be given appropriate clothes to wear to the prom. Unfortunately Puente was unable to fund or find a willing donor to sponsor the young men receiving complimentary tuxedos for the prom. Puente plans to continue to conduct outreach to community partners to try and establish a donor fund that Puente can make this possible for the next academic year. Puente promotes healthy dating because it believes that it goes hand in hand with drug and alcohol prevention education. Puente staff believes that this type of event is extremely valuable as a way to cultivate self-esteem and self-worth in students. The hypothesis is that if you feel good about how you look, and understand the boundaries of healthy dating, then you will be less likely to use drugs and alcohol as a way to mask the fear and insecurity when self-esteem and confidence are lacking. This is an excellent example of addressing a tangible, social need of a low-income, historically underserved population and using it as both a gateway to providing important prevention messages while also cementing Puente’s status in the San Mateo South Coast community. According to Clinical Director, Joann Watkins, the program significantly cements relationships between Puente and the community. “I think it absolutely happened, many of the girls would not have gone to prom without the Princess Project, and our work around healthy dating established comradery, especially among the young women. In addition to the Princess Project, all high school students attended a healthy dating/domestic violence prevention workshop developed and put on by Project SUCCESS staff. The topic of healthy dating has come up continually as a concern among students, teachers, and family members. Because this topic is tied closely to student use of drugs and alcohol Puente wanted to target the whole school and provide a comprehensive overview, and handouts with phone numbers for the National Domestic Violence Hotline, and the Child Abuse and Prevention Hotline. In addition students were given the Power and Control wheel of physical and sexual violence. Student feedback on this event was extremely positive with many students asking that the workshop be done in small groups with more time for dialogue, and question and answer. The girls clearly heard the message that it is not necessary, nor advisable to use drugs and alcohol in potentially vulnerable situations like a prom date. In separate groups, men received the same message loud and clear that it is wholly unacceptable, illegal, and unethical to use drugs and alcohol as a means of fostering a physical relationship with a potential partner.” Based upon the satisfaction survey results for this project discussed in Section III, it seems clear that both males and females appreciated this advice. Last year, Puente High students advised that the Healthy Dating presentation would be more effective if done in smaller groups and as a result, Puente broke up the students into separate groups for men and women. Puente would like to work in even smaller groups with students pulled from classes for this purpose but has so far been unable to obtain permission and access to students during school hours.
8
Puente views this presentation as a potential gateway for students to participate in Project SUCCESS groups. See also data from the healthy dating presentation discussed under EQ # 3. For the past 9 years, Puente has provided youth in the community with an opportunity for employment and enrichment through its Youth Employment Program. This program allows youth 14-21 to apply for employment with Puente and participate in a one-week orientation and enrichment program. The youth are all required to attend the orientation, which begins with an overnight stay at a local YMCA camp. The youth all become certified in CPR and First Aid, become Mandated Reporters, complete a resume, take a sex education course, customer service seminar, and Cultural Competency trainings and then are referred to jobs in at Puente, as camp counselors at the local YMCA, or in other community organizations as interns.. This is often the first job that many of these youth have ever had and it not only provides valuable life skills and training but it helps financially support the youth and their families. Each youth staff member is assigned to a supervision group run by a member of the Puente BHRS staff. Youth meet once a week for work related check-ins and topic discussions. The Project SUCCESS curriculum is included in the weekly supervision session. As with the Princess Project, this initiative meets a tangible student need (employment), leverages other community partners where students are placed to perform work contributing to community organizations while also building their skills. As with the Princess Project, this kind of school-community initiative not only meets the needs of the participating students, but it builds Puente’s stature in the community, critically important to success in a small, rural community. Puente also delivers a range of parent education programs. In 2014-15 early intervention parenting groups were offered in Spanish l using the Abriendo Puertas (Opening Doors) model. • An eleven-session group, Grupo de las Madres was a process related group for 11 women, and
targeted maternal depression and other trauma related symptoms. The group is ongoing. • A Zumba group that meets twice a week, targets parents suffering from depression providing
culturally responsive exercise to combat depression for over 35 men women and children. This program has become extraordinarily popular and serves as another stigma-free entry point into services. There is now a Zumba group in La Honda taught by a member of that community. In addition two of the original members of the Zumba group went on to receive their certification and now lead the Zumba classes in Pescadero.
Lastly, Project SUCCESS serves as a point-of-entry into Puente’s more comprehensive array of behavioral health services since Puente is the Differential Response program for the San Mateo South Coast community. As a result, Project SUCCESS students or families identified as in need of intensive services can bypass the ACCESS system and enroll in those services with Puente. As Table II reflects, Puente served 237 students with the program exceeding the Performance Measure related to productivity (number served = 15) and as Evaluation Question III describes also exceeding the satisfaction element of the measure. Evaluation Question # 2: Has the program implemented effective program strategies? i.e. Is the program well-designed and achieving a desired impact? Last year, when the evaluator sought pre-post data, there were only 3 students with pre and post-test data for the Coopersmith Self-Esteem and data from 15 La Honda Elementary School participants who completed the Hemingway Connectedness Scale. However, this year Puente utilized The SEARCH Institute’s DAP to measure the impact of the eight-week Project Success group upon clients in terms of
9
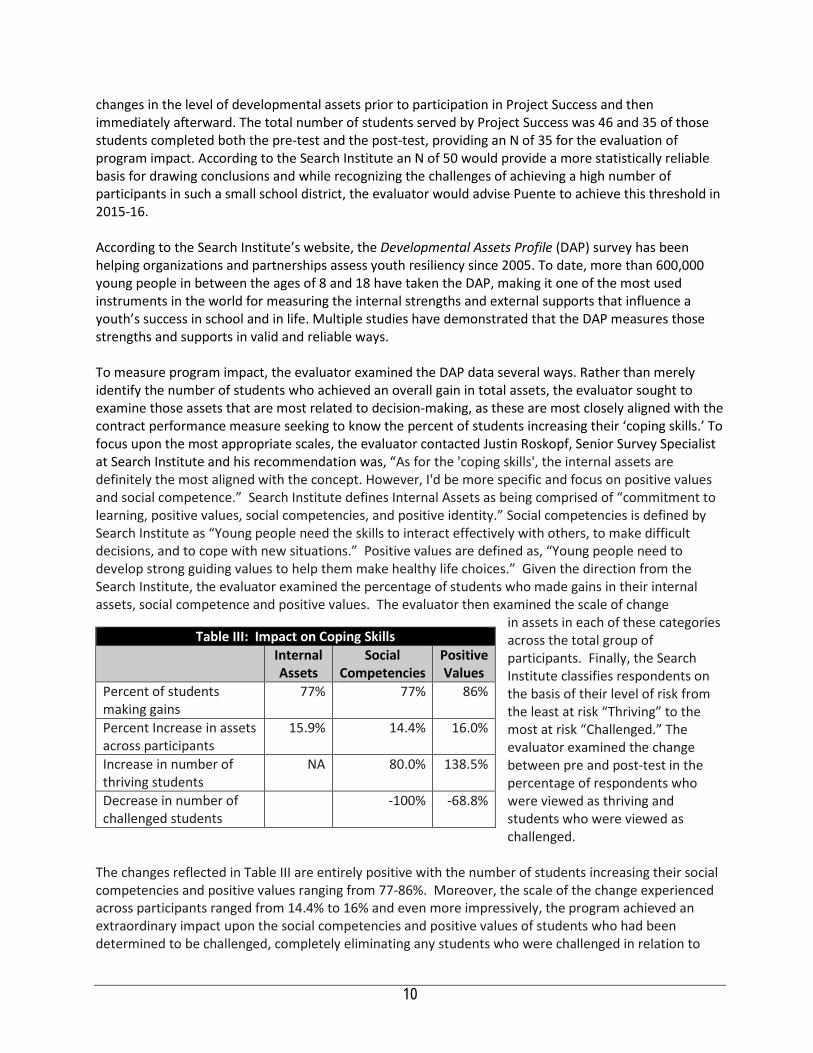
changes in the level of developmental assets prior to participation in Project Success and then immediately afterward. The total number of students served by Project Success was 46 and 35 of those students completed both the pre-test and the post-test, providing an N of 35 for the evaluation of program impact. According to the Search Institute an N of 50 would provide a more statistically reliable basis for drawing conclusions and while recognizing the challenges of achieving a high number of participants in such a small school district, the evaluator would advise Puente to achieve this threshold in 2015-16. According to the Search Institute’s website, the Developmental Assets Profile (DAP) survey has been helping organizations and partnerships assess youth resiliency since 2005. To date, more than 600,000 young people in between the ages of 8 and 18 have taken the DAP, making it one of the most used instruments in the world for measuring the internal strengths and external supports that influence a youth’s success in school and in life. Multiple studies have demonstrated that the DAP measures those strengths and supports in valid and reliable ways. To measure program impact, the evaluator examined the DAP data several ways. Rather than merely identify the number of students who achieved an overall gain in total assets, the evaluator sought to examine those assets that are most related to decision-making, as these are most closely aligned with the contract performance measure seeking to know the percent of students increasing their ‘coping skills.’ To focus upon the most appropriate scales, the evaluator contacted Justin Roskopf, Senior Survey Specialist at Search Institute and his recommendation was, “As for the 'coping skills', the internal assets are definitely the most aligned with the concept. However, I'd be more specific and focus on positive values and social competence.” Search Institute defines Internal Assets as being comprised of “commitment to learning, positive values, social competencies, and positive identity.” Social competencies is defined by Search Institute as “Young people need the skills to interact effectively with others, to make difficult decisions, and to cope with new situations.” Positive values are defined as, “Young people need to develop strong guiding values to help them make healthy life choices.” Given the direction from the Search Institute, the evaluator examined the percentage of students who made gains in their internal assets, social competence and positive values. The evaluator then examined the scale of change
in assets in each of these categories across the total group of participants. Finally, the Search Institute classifies respondents on the basis of their level of risk from the least at risk “Thriving” to the most at risk “Challenged.” The evaluator examined the change between pre and post-test in the percentage of respondents who were viewed as thriving and students who were viewed as challenged.
The changes reflected in Table III are entirely positive with the number of students increasing their social competencies and positive values ranging from 77-86%. Moreover, the scale of the change experienced across participants ranged from 14.4% to 16% and even more impressively, the program achieved an extraordinary impact upon the social competencies and positive values of students who had been determined to be challenged, completely eliminating any students who were challenged in relation to
Table III: Impact on Coping Skills Internal
Assets Social
Competencies Positive Values
Percent of students making gains
77% 77% 86%
Percent Increase in assets across participants
15.9% 14.4% 16.0%
Increase in number of thriving students
NA 80.0% 138.5%
Decrease in number of challenged students
-100% -68.8%
10
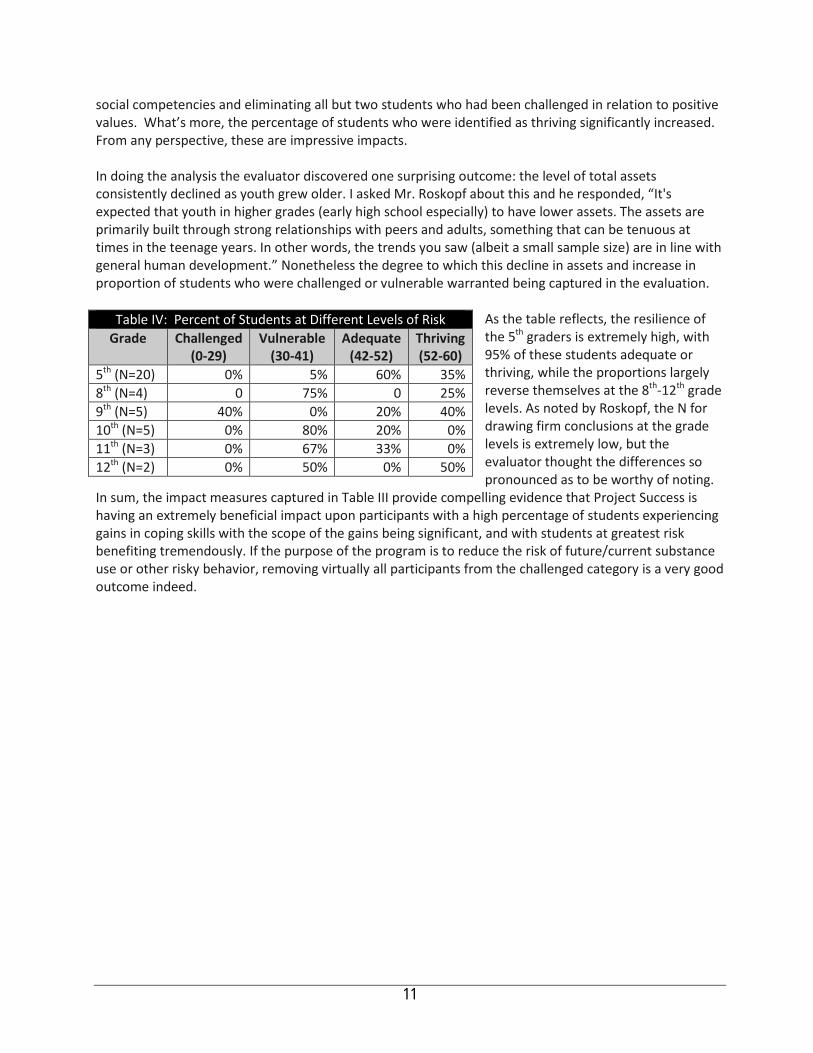
social competencies and eliminating all but two students who had been challenged in relation to positive values. What’s more, the percentage of students who were identified as thriving significantly increased. From any perspective, these are impressive impacts. In doing the analysis the evaluator discovered one surprising outcome: the level of total assets consistently declined as youth grew older. I asked Mr. Roskopf about this and he responded, “It's expected that youth in higher grades (early high school especially) to have lower assets. The assets are primarily built through strong relationships with peers and adults, something that can be tenuous at times in the teenage years. In other words, the trends you saw (albeit a small sample size) are in line with general human development.” Nonetheless the degree to which this decline in assets and increase in proportion of students who were challenged or vulnerable warranted being captured in the evaluation.
As the table reflects, the resilience of the 5th graders is extremely high, with 95% of these students adequate or thriving, while the proportions largely reverse themselves at the 8th-12th grade levels. As noted by Roskopf, the N for drawing firm conclusions at the grade levels is extremely low, but the evaluator thought the differences so pronounced as to be worthy of noting.
In sum, the impact measures captured in Table III provide compelling evidence that Project Success is having an extremely beneficial impact upon participants with a high percentage of students experiencing gains in coping skills with the scope of the gains being significant, and with students at greatest risk benefiting tremendously. If the purpose of the program is to reduce the risk of future/current substance use or other risky behavior, removing virtually all participants from the challenged category is a very good outcome indeed.
Table IV: Percent of Students at Different Levels of Risk Grade Challenged
(0‐29) Vulnerable
(30‐41) Adequate
(42‐52) Thriving (52‐60)
5th (N=20) 0% 5% 60% 35% 8th (N=4) 0 75% 0 25% 9th (N=5) 40% 0% 20% 40% 10th (N=5) 0% 80% 20% 0% 11th (N=3) 0% 67% 33% 0% 12th (N=2) 0% 50% 0% 50%
11
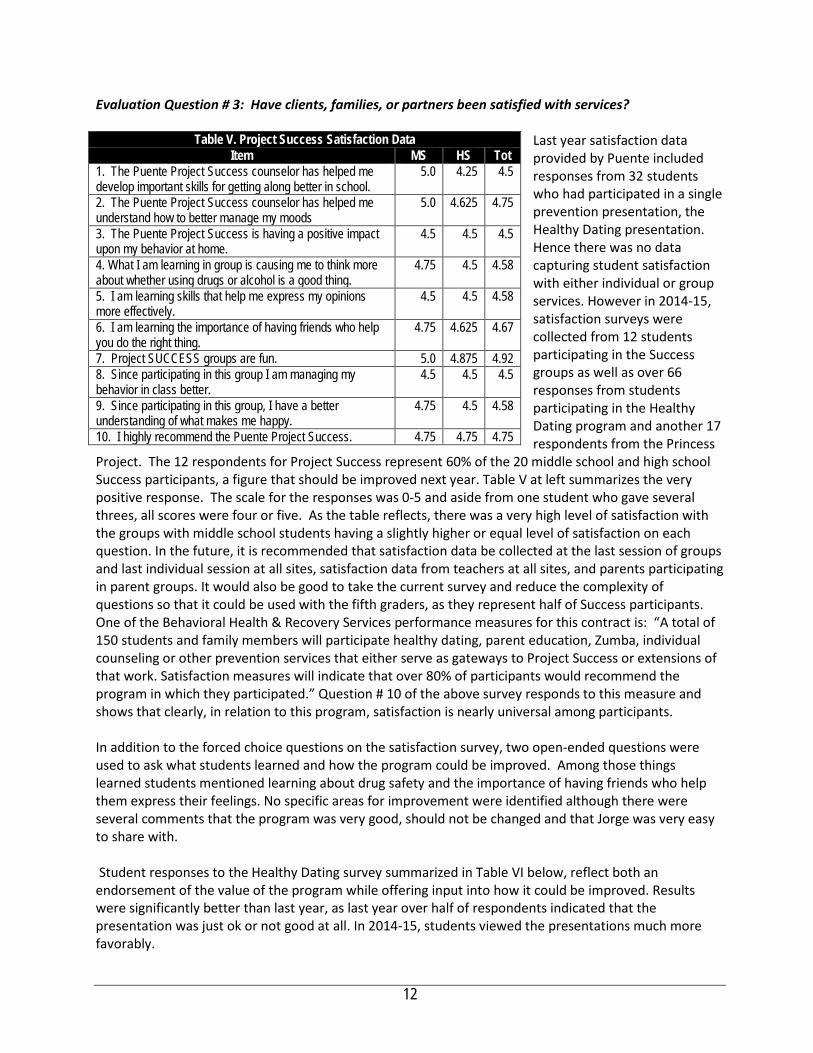
Evaluation Question # 3: Have clients, families, or partners been satisfied with services?
Last year satisfaction data provided by Puente included responses from 32 students who had participated in a single prevention presentation, the Healthy Dating presentation. Hence there was no data capturing student satisfaction with either individual or group services. However in 2014-15, satisfaction surveys were collected from 12 students participating in the Success groups as well as over 66 responses from students participating in the Healthy Dating program and another 17 respondents from the Princess
Project. The 12 respondents for Project Success represent 60% of the 20 middle school and high school Success participants, a figure that should be improved next year. Table V at left summarizes the very positive response. The scale for the responses was 0-5 and aside from one student who gave several threes, all scores were four or five. As the table reflects, there was a very high level of satisfaction with the groups with middle school students having a slightly higher or equal level of satisfaction on each question. In the future, it is recommended that satisfaction data be collected at the last session of groups and last individual session at all sites, satisfaction data from teachers at all sites, and parents participating in parent groups. It would also be good to take the current survey and reduce the complexity of questions so that it could be used with the fifth graders, as they represent half of Success participants. One of the Behavioral Health & Recovery Services performance measures for this contract is: “A total of 150 students and family members will participate healthy dating, parent education, Zumba, individual counseling or other prevention services that either serve as gateways to Project Success or extensions of that work. Satisfaction measures will indicate that over 80% of participants would recommend the program in which they participated.” Question # 10 of the above survey responds to this measure and shows that clearly, in relation to this program, satisfaction is nearly universal among participants. In addition to the forced choice questions on the satisfaction survey, two open-ended questions were used to ask what students learned and how the program could be improved. Among those things learned students mentioned learning about drug safety and the importance of having friends who help them express their feelings. No specific areas for improvement were identified although there were several comments that the program was very good, should not be changed and that Jorge was very easy to share with. Student responses to the Healthy Dating survey summarized in Table VI below, reflect both an endorsement of the value of the program while offering input into how it could be improved. Results were significantly better than last year, as last year over half of respondents indicated that the presentation was just ok or not good at all. In 2014-15, students viewed the presentations much more favorably.
Table V. Project Success Satisfaction Data Item MS HS Tot
1. The Puente Project Success counselor has helped me develop important skills for getting along better in school.
5.0 4.25 4.5
2. The Puente Project Success counselor has helped me understand how to better manage my moods
5.0 4.625 4.75
3. The Puente Project Success is having a positive impact upon my behavior at home.
4.5 4.5 4.5
4. What I am learning in group is causing me to think more about whether using drugs or alcohol is a good thing.
4.75 4.5 4.58
5. I am learning skills that help me express my opinions more effectively.
4.5 4.5 4.58
6. I am learning the importance of having friends who help you do the right thing.
4.75 4.625 4.67
7. Project SUCCESS groups are fun. 5.0 4.875 4.92 8. Since participating in this group I am managing my behavior in class better.
4.5 4.5 4.5
9. Since participating in this group, I have a better understanding of what makes me happy.
4.75 4.5 4.58
10. I highly recommend the Puente Project Success. 4.75 4.75 4.75
12
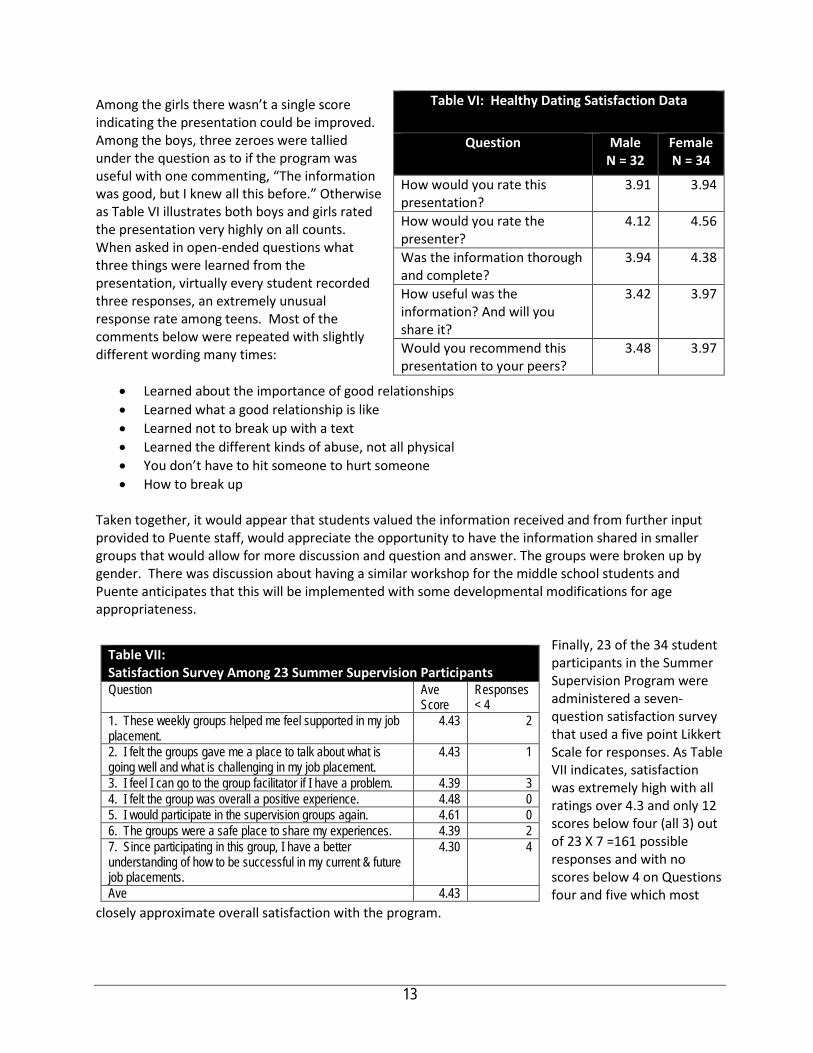
Among the girls there wasn’t a single score indicating the presentation could be improved. Among the boys, three zeroes were tallied under the question as to if the program was useful with one commenting, “The information was good, but I knew all this before.” Otherwise as Table VI illustrates both boys and girls rated the presentation very highly on all counts. When asked in open-ended questions what three things were learned from the presentation, virtually every student recorded three responses, an extremely unusual response rate among teens. Most of the comments below were repeated with slightly different wording many times:
• Learned about the importance of good relationships • Learned what a good relationship is like • Learned not to break up with a text • Learned the different kinds of abuse, not all physical • You don’t have to hit someone to hurt someone • How to break up
Taken together, it would appear that students valued the information received and from further input provided to Puente staff, would appreciate the opportunity to have the information shared in smaller groups that would allow for more discussion and question and answer. The groups were broken up by gender. There was discussion about having a similar workshop for the middle school students and Puente anticipates that this will be implemented with some developmental modifications for age appropriateness.
Finally, 23 of the 34 student participants in the Summer Supervision Program were administered a seven-question satisfaction survey that used a five point Likkert Scale for responses. As Table VII indicates, satisfaction was extremely high with all ratings over 4.3 and only 12 scores below four (all 3) out of 23 X 7 =161 possible responses and with no scores below 4 on Questions four and five which most
closely approximate overall satisfaction with the program.
Table VI: Healthy Dating Satisfaction Data
Question Male N = 32
Female N = 34
How would you rate this presentation?
3.91 3.94
How would you rate the presenter?
4.12 4.56
Was the information thorough and complete?
3.94 4.38
How useful was the information? And will you share it?
3.42 3.97
Would you recommend this presentation to your peers?
3.48 3.97
Table VII: Satisfaction Survey Among 23 Summer Supervision Participants Question Ave
Score Responses < 4
1. These weekly groups helped me feel supported in my job placement.
4.43 2
2. I felt the groups gave me a place to talk about what is going well and what is challenging in my job placement.
4.43 1
3. I feel I can go to the group facilitator if I have a problem. 4.39 3 4. I felt the group was overall a positive experience. 4.48 0 5. I would participate in the supervision groups again. 4.61 0 6. The groups were a safe place to share my experiences. 4.39 2 7. Since participating in this group, I have a better understanding of how to be successful in my current & future job placements.
4.30 4
Ave 4.43
13
It is clear that in each of the programs in which satisfaction surveys were administered, there was an exceedingly high level of satisfaction with services. Evaluation Question # 4: Have program services been responsive to the population targeted by the contract? From demographic data provided in the report, it is clear that the demographic profile of the students served are consistent with the County’s priority of serving populations that are historically under-served. What’s more, the community served—the San Mateo South Coast—has been identified in numerous county reports as being an under-served community. By these criteria, the program has been attempting to meet the needs of those populations identified in the contract. Puente negotiations with the district resulted in an over 100% increase in the number of 5th graders in the program and resulted in district requests that parent education programs be delivered to all 5th grade parents. The Princess Project clearly targeted low-income, rural and Hispanic students and by collaborating with a Santa Clara project was able to help these students participate in prom activities while receiving valuable prevention information about drugs and alcohol. The summer Supervision Groups provided 23 students 14-21 with both jobs and income, along with prevention education related to drugs and alcohol. In addition, effective outreach to the parent community resulted in a significant increase in parent involvement in Puente programming. Of particular note are the Spanish-speaking parent group and the Zumba group, both being linguistically and culturally appropriate initiatives. Zumba provides culturally relevant exercise to help parents fighting depression, at the same time that the group was used to introduce parenting information and promote participation in other parenting groups. A final measure of Puente’s meeting the needs of the community can be understood by examining how the program succeeded in relation to the three performance measures identified by the County in its contract with Puente. BHRS-1: 75% of 50 students who complete their participation in Project Success groups will increase their coping skills as reflected in an increase in their internal assets (a composite measure of five critical coping skills) from prior to participation in Project Success to after participation. Seventy-seven percent of students increased their internal assets based upon pre and post DAP assessments. What’s more, other results from the DAP assessments suggest that this one measure understates the impact achieved. See Evaluation Question II for details. This measure is also reported to the Board of Supervisors. BHRS-2: Fifty students in grades 5-12 will participate in and complete the 8-week Project Success groups with at least 45 completing both the pre and post Developmental Asset Profile. Puente fell just short of achieving this measure, serving 50 students and assessing 35 of these students. Still, 46 students served presents an increase from 27 served last year and a much greater proportion of students administered both pre and post tests. BHRS-3: A total of 150 students and family members will participate healthy dating, parent education, Zumba, individual counseling or other prevention services that either serve as gateways to Project Success or extensions of that work. Satisfaction measures will indicate that over 80% of participants would recommend the program in which they participated.
14

Puente served 50% more students and family members (237) than stated in the performance measure and across all programs experienced almost universal satisfaction, easily exceeding this performance measure. Taken together, while it is clear that there are numerous challenges in serving a small, rural community, Puente has shown great resourcefulness in ensuring it is addressing the needs of the under-served and has achieved both a significant impact upon those served, while achieving exceedingly high levels of satisfaction from participants in each program component.
15
Evaluation Question # 5: To what degree has the program advanced the vision, mission and objectives of the MHSA PEI plan? The vision, mission and values of San Mateo County Behavioral Health & Recovery Services stress empowering individuals to direct their own recovery process. BHRS stresses the adoption of culturally competent treatment approaches and through its MHSA planning processes, a further focus has been placed upon implementing evidence-based practices that have demonstrated the capacity to support client wellness and recovery. From the perspective of prevention, BHRS has also described the journey towards a transformed system requiring that programs:
• move “upstream” to primary prevention strategies; • partner with other health prevention efforts to focus on wellness and recovery; • achieve desired outcomes; and • integrate efforts to support sustainability;
What’s more, San Mateo’s MHSA plan clearly described the priority of intervening early and identified stress, PTSD, and use of alcohol and drugs as factors where early intervention were most important, particularly in relation to individuals from historically underserved populations.
Project Success meets all of these criteria:
• In relation to ‘upstream’ Puente works upstream by engaging youth in elementary through high school, providing mental health services at the school site to make access to services easier, expanding this year to serve both elementary schools and increasing service to this group by over 100%;
• As relates to partnering, Puente serves as the County’s Differential Response resource for San Mateo South Coast, students or families identified in Project SUCCESS as in need of more intensive services, can do so immediately. This places serves as a de-facto point of entry into the Puente’s comprehensive continuum of behavioral health services and as an extension of Children’s Protective Services.
• As relates to outcomes, Puente has demonstrated significant impact on students participating in the Success groups;
• As relates to evidence-based practices, Puente introduces an evidence-based approach to prevention, building assets of students, helping them develop coping skills and educating them about the risks from drug and alcohol use and their alternatives while also utilizing Abriendo Puertas (Opening Doors) model, which has been heavily evaluated; and
• As relates to serving under-served populations, Puente serves a demographic group that is well over 70% of which is Hispanic with very high proportions of the children served being both English Language Learners and Socie-Economically Disadvantaged. What’s more, the the South Coast community which has been identified repeatedly by the County as being under-served.
Puente addresses every criterion expressed in County planning documents related to behavioral health and does so while achieving significant impact and high levels of satisfaction.
16
Evaluation Question # 6: What factors have impeded or contributed to successful implementation? How? The 2013-14 evaluation report described a number of factors that had impeded effective delivery of services in that year. Each of these factors is described below. Extremely small enrollment at every grade level. The small number of students, particularly at the elementary and middle school levels, limits the pool of students from which to draw. More typically sized elementary and middle schools would have 4-5 times the number of students, significantly reducing the challenge in engaging sufficient numbers of students for a series of eight-week groups. Update 2014-15. Despite this challenge, sustained negotiations with the district and sites has resulted in accommodations that has resulted in almost doubling the number served and over doubling the number served at the elementary schools. District requirement that groups not occur during class time. In most schools, students enrolled in individual or group counseling are routinely released from class for this purpose. This makes it far easier to sustain consistent participation. In La Honda-Pescadero, despite efforts on the part of Puente leadership, students participating in groups can only do so during lunch-time, a time that is historically viewed by students as being “their” time. This is a very significant barrier to group work and could explain by itself the low numbers in groups. Update 2014-15. While the district has not changed this policy, it is hoped that this report’s documentation of the clear benefit derived by students, the significant room for growth in engaging higher numbers of middle and high school students in Project SUCCESS, and Puente’s continued advocacy for being able to access students during class time, will result in movement in this area. Slow school process gathering passive consent forms. In order to participate in Project SUCCESS groups, the school district must collect these forms signed by parents. This is a challenge in all schools, as school staff priorities are more focused on getting instructional programs launched than in promoting or supporting counseling or after school programs. As a result, Puente is unable to launch groups until late fall. Update 2014-15. Puente outreach at the elementary school level resulted in the program both engaging a far higher percent of 5th grade students, but also resulted in parents being engaged in the Parent Education program. Last year’s report noted that these challenges are not easily overcome and from the structured interview, it is clear that Puente had made significant efforts to work with the district to achieve changes that might make group services more accessible to students. It has also introduced a range of alternative programming to better serve the high school and parent communities. Yet through Puente’s persistence in communication with the district and sites and outreach to parents, most all of the challenges identified above have been either removed or ameliorated and productivity, impact and satisfaction have all increased significantly this year.
17

Evaluation Question # 7: What steps can be taken in the future to improve program services and what data could verify that these improvements had occurred? Last year the following recommendations for improvement were made: 1. Search Institute adoption. Share with the evaluator the new tools and protocols that will be part of Puente’s contract with the Search Institute, including specific pre and post-test assessment instruments, specific plans for when those instruments will be administered and with whom. Update 2014-15. This recommendation was followed and the DAP was used, much improving evaluation efforts. 2. Consistent administration of pre-post assessments. Ensure that Search Institute Pre-Post Data for participants in groups and in individual work. Update 2014-15. This recommendation was followed and the DAP was used, much improving evaluation efforts. 3. Facilitate analysis of the impact of higher levels of student participation in programming. Ensure that data collected from Pre-Post tests, whether for individual or group work, can be provided at a student level in a spreadsheet or report that allows comparison of outcomes between students who participate in individual versus group work and to compare outcomes for students who participate with consistency with those who are not as engaged. The evaluator will work with Puente to facilitate this occurring. Update 2014-15. This recommendation was followed with 36 students administered the pre and post-test of the DAP, much improving evaluation efforts. 4. Expand use of satisfaction surveys. Satisfaction surveys can provide valuable data to program managers and to the county as to how well a program meets client needs. It can also facilitate specific input into how programming can be improved. Puente should administer satisfaction surveys with students and parents participating in both group and individual work at all four sites, as well as from teachers. Update 2014-15. While expanded somewhat, it would be good to have this data from all Success group participants and more data from parents in 2016-17. 5. Obtain student attendance, suspension, and discipline referral data. Puente should follow up with the district to ensure receipt of data on student attendance, discipline referrals, and suspensions. This data is generally easily accessible by school districts and requires no work on the part of Puente other than seeking it and providing lists of participating students. But if the program is having a positive impact on these outcomes, the resulting report can only increase the district’s commitment to the program. What’s more, it would be invaluable data for Puente grant proposals and other funding requests. Update 2014-15. Puente did seek and obtain limited data from the district, however, this data did not include data on suspensions or discipline referrals and there were no expulsions. The data that was
18
received was attendance data and the data was in a format that would have been enormously difficult and time consuming to aggregate and analyze, so it was left out of this report. 6. Sustain development of new programming that addresses community needs and serves as a gateway to other programming. Sustain expansion of parenting groups and Summer Supervision groups and use them as building blocks for establishing greater enrollment in other Project SUCCESS counseling services. Update 2014-15. Puente expanded the number of fifth graders served, created a Parent Education to assist 5th grade parents with the transition to 8th grade, and plans to create a similar parent program for 8th grade parents along with a healthy life skills program similar to the Healthy Dating program for 8th graders in 2015-16. 7. Increase engagement of students in the 5th grades at Pescadero and La Honda Elementary Schools and Pescadero Middle School. This is perhaps the most important recommendation and yet the most challenging. It appears to the evaluator that Puente has approached the district to remove barriers to student participation in groups, but that the district is adamant about prioritizing classroom time over time devoted to building student assets, coping skills and understanding of the consequences of the use of drugs and alcohol. While it is common practice at other schools to release students for group counseling, this did not going to happen on the Sam Mateo South Coast in 2014-15 and so Puente will have to use the same resourcefulness it has used with the high school students and parents to better engage students in middle school and high school. The expansion to the middle school of schoolwide education related to dating is one such strategy and working with the district to allow for Project SUCCESS groups to serve the entire fifth grade classes at La Honda and Pescadero Elementary Schools is another. Puente leadership indicated that 40-minute, whole-class groups have been launched during lunch at the elementary schools and at the middle schools, a lunch group has also been initiated. Update 2014-15. This recommendation was followed and far more elementary students were engaged in services over doubling the number of 5th grade students served by Project SUCCESS and engaging all 5th grade parents in the Parent Education program focused upon child development and healthy transition to middle school. In 2013-14, Puente clearly did not engage sufficient numbers of elementary and middle school students and some of the reasons that impeded that engagement have been discussed. At least part of the challenge at the elementary school level had been that the last three years, the district only had one 5th grade class to draw from. In 2014-15, the district created two fifth grade classes, and Puente significantly increased outreach to parents and the results speak for themselves. Puente has also been very resourceful in expanding programming at the high school and in relation to its work with parents. Opportunities for Improvement in 2015-16. Increased Services to Middle School Students. It is especially important that some expansion of services occur with this population as the high school students have a wider range of programming to engage them than is the case at the middle school, much of this the result of the difference in age. Parents of middle school students are fearful of introducing dating, sex and drug discussions at this age and these students are not working and so not eligible for the Summer Supervision program. Hence the planned expansion of services at the middle school to include both parent education and life skills education for
19
students, is a good idea as the number of middle school students engaged in services remains lower than idea. Continued Outreach to Elementary School Parents. The gains made this year are significant and with continued outreach, the program should increase engagement of elementary school students. Increase Numbers Served Across All Ages in Project Success and increase the percentage of students completing pre and post DAP assessments. While tremendous progress was made in this regard in 2014-15, numbers served and numbers completing DAP pre and post-tests fell just short of the relevant performance measure. Capture Parent Satisfaction Data from 75% of 5th and 8th Grade Parent Education Program Participants. Satisfaction data can provide valuable information both in terms of what you have achieved and areas where you could expand or improve programming. There really was no data in relation to services delivered to parents. While areas for improvement remain, Puente’s performance in 2014-15 represented a very significant improvement over 2013-14. From conversations with both the Executive Director and Clinical Director, it is clear they took last year’s evaluation and its recommendations seriously and the results are very apparent.
20
StarVista Early Childhood Community Team (ECCT) PEI Evaluation Report 2014-15
Section I Agency & Program Description I.A. Description of Program Services Formerly known as Youth and Family Enrichment Services, StarVista came into being when Youth and Family Assistance and Family and Community Enrichment Services merged in 2003. StarVista offers counseling, prevention, early intervention and education resources and services to more than 34,000 people throughout San Mateo County every year. One program operated by StarVista is the Early Childhood Community Team, a project supported with San Mateo County’s Mental Health Services Act, Prevention & Early Intervention funding, The Early Childhood Community Team (ECCT) project incorporates several major components that build on current models already operative in San Mateo County. The ECCT is designed to support healthy social emotional development of young children. The ECCT is comprised of a community outreach worker, an early childhood mental health consultant, and a license-eligible clinician. BHRS PEI funding is supporting one full team and the clinical component of a North County team with private funds and First 5 supporting the consultation and outreach components. In the 2015-16 Program Year, StarVista received additional San Mateo County Measure A funding to expand the North County team and create two additional teams: one in Pescadero/La Honda and one in Redwood City. The MHSA funded ECCT targets the geographically isolated Coastside community experiencing a significant degree of interpersonal violence, which has traumatic impact on families and young children. It is also a community identified in multiple County reports as being historically underserved, low-income, rural, and with many migrant farm residents.
While the ECCT delivered three distinct service modalities, in many cases a child or family identified as being at risk and referred to ECCT might benefit from all three of these services. Indeed, from the perspective of the community, the ECCT represents a systemic intervention that addresses the needs of children and families and builds the capacity of the community of service providers who work with these families.
The three service modalities are: 1) Clinical Services, 2) Case management/Parent Education services, and 3) Mental health consultations with childcare and early child development program staff and parents served by these centers. In addition, the ECCT team conducts extensive outreach in the community to build a more collaborative, interdisciplinary system of services for infants, toddlers and families. The ECCT community outreach worker networks within the community and provides community based services to identify young families with children from birth to five with an emphasis upon children zero to three and connects them with necessary supports both as provided by ECCT and other community agencies. The community outreach worker also provides both home based and group based parent education services. Groups for families with young children, integrate concepts drawn from Brazelton’s Touchpoints Program, the Parents as Teachers curriculum, the Promoting First Relationships curriculum, and the Circle of Security Parenting DVD, approaches in which ECCT team members have been trained. Participants learn how to use relationship-building and communication strategies when they deliver care and interact with children and families. The Touchpoints groups include fathers as well as mothers and other caregivers. ECCT clinical services are delivered by ECCT licensed and licensed-eligible clinicians who provides focused services to families who have been identified as being in need by the ECCT community outreach worker. The clinician screens for postpartum depression and facilitates appropriate service plans with primary care and/or mental health services. The SV ECCT clinician has been
trained in Infant-Parent and Early Childhood mental health and/ or Child-Parent Psychotherapy (CPP). CPP model has been shown to be particularly effective with young families at risk due to trauma. The goal of CPP treatment is to support and strengthen the parent-child relationship as a vehicle to long-term healthy child development. With trauma-exposed individuals, these treatments incorporate a focus on trauma experienced by the parent, the child, or both. Sessions include the parent(s) and the child and can be conducted in the home. Individual parent, child, or family sessions may be added as needed. Another ECCT team member, the Early Childhood Mental Health Consultant, focuses on supporting social emotional development in child care settings by providing early childhood mental health consultation. This service typically consists of the following activities:
• Observing the interaction of the caregiver(s) with young children; • Observing a child’s interaction with caregiver(s) and other young children; • Consulting with the caregiver(s) regarding overall support of positive social emotional
development; • Consulting with the caregiver(s) on developmental or behavioral concerns regarding a
specific child; • Facilitating family and caregiver meetings; and • Facilitating referrals for additional services for children and families
Historically early childhood mental health consultation services were operated by another agency that merged with SV and now SV operates all consultation in the county. Prior to launching the ECCT in Coastside, ECMH Consultation services were offered throughout the County. Since StarVista operated consultation in 34 sites in San Mateo County, including Head Start preschool programs, Early Head Start family childcare programs, and other programs in Redwood City, Daly City, South San Francisco, central San Mateo and East Palo Alto, the county determined it best to offer StarVista the contract to work in Coastside. Through the 40 sites currently receiving ECMH Consultation, childcare consultation reaches about 2000-2200 children annually, with consultants working with childcare settings ranging from those provided by licensed family day care providers, license exempt providers, and family/friends/neighbors. I.B. Research Basis for Approach The Mental Health Services Act proscribes that funding is used to adopt, adapt and implement prevention and treatment services that are evidence-based. The ECCT initiative is informed by the following evidence-based or promising practices and ECCT staff has been trained in or have utilized practices and principles from each of the following:
• The Circle of Security Parenting DVD • Child Parent Psychotherapy • Touchpoints • Parents as Teachers • Promoting First Relationships • Early Childhood Mental Health Consultation.
Each model is described briefly, followed by a summary of the research base that supports the efficacy of each approach.
2

The Circle of Security DVD (Circle of Security Parenting Training©) is a DVD parent education program offering the core components of the evidence-based Circle of Security protocol. This 4-Day seminar trains professionals to use an eight chapter DVD to educate caregivers. The program presents video examples of secure and problematic parent/child interaction in the zero to five age range, healthy options in caregiving, and animated graphics designed to clarify principles central to Circle of Security. Circle of Security Parenting implements decades of attachment research in an accessible step-by-step process for use in group settings, home visitation, or individual counseling.
Parents as Teachers (PAT) is an early childhood family support and parent education home-visiting model. Families may enroll in Parents as Teachers beginning with pregnancy and may remain in the program until the child enters kindergarten. Based on theories of human ecology, empowerment, self-efficacy, and developmental parenting, Parents as Teachers involves the training and certification of parent educators who work with families using a comprehensive research-based and evidence-informed curriculum. Parent educators work with parents to strengthen protective factors and ensure that young children are healthy, safe, and ready to learn. The goals of the model are to increase parent knowledge of early childhood development, improve parenting practices, provide early detection of developmental delays and health issues, prevent child abuse and neglect, and increase children's school readiness and school success. Different curriculum materials are used for those working with families of children up to age 3 and those working with families of children from age 3 to kindergarten. Home visitation is the key component of the Parents as Teachers model, with personal visits of approximately 60 minutes delivered weekly, every 2 weeks, or monthly, depending on family needs. Parent educators share research-based information and use evidence-based practices by partnering, facilitating, and reflecting with families. Parent educators use the Parents as Teachers curriculum in culturally sensitive ways to deliver services that emphasize parent-child interaction, development-centered parenting, and family well-being. Parent-child interaction focuses on promoting positive parenting behaviors and child development through parent-child activities. Development-centered parenting focuses on the link between child development and parenting and on key developmental topics (i.e., attachment, discipline, health, nutrition, safety, sleep, transitions/routines, healthy births). Family well-being includes a focus on family strengths, capabilities, skills, and the building of protective factors. Parents as Teachers was established and first piloted in Missouri in 1981 to alleviate the learning and achievement gaps in children entering kindergarten. More than 2,000 Parents as Teachers affiliates are implementing the model, serving more than 250,000 children in more than 200,000 families across all 50 States and in other countries (including Australia, Canada, England, Germany, Mexico, New Zealand, Scotland, Switzerland, and Wales). Research studies have been conducted and supported by State governments, independent school districts, private foundations, universities, and research organizations, and outcome data have been collected from more than 16,000 children and parents. The intervention has been evaluated in four independent, randomized controlled trials and many quasi-experimental and qualitative studies, many of which have been described in peer-reviewed publications. Touchpoints. This approach, developed by T. Berry Brazelton, is based on the concept of building relationships between children, parents and providers around the framework of “Touchpoints,” or key points in early development. The quality of the infant-caregiver relationship is a risk or protective factor for infants’ later development. Infants who develop a "secure" attachment relationship with the primary caregiver during the first year of life are more likely to have positive relationships with peers, to be liked by their teachers, to perform better in school, and to be more
3
resilient in the face of stress or adversity as preschoolers and later. Infants who develop an insecure attachment relationship are at risk for a more troublesome trajectory; factors associated with insecure relationships include maternal mental health problems, including depression, substance abuse, family violence, and unresolved grief. Because of the strength of influence of the infant-caregiver relationship, any factors that impact the infant-caregiver relationship play a determining role in the emotional functioning of the young child (Zeanah et al.,2000). As a specific program, one study finds that the Touchpoints model increases the parenting self-confidence of adolescent parents (Percy et al, 2001). Child-Parent Psychotherapy. Child-Parent Psychotherapy (CPP) is an intervention for children from birth through age 5 who have experienced at least one traumatic event (e.g., maltreatment, the sudden or traumatic death of someone close, a serious accident, sexual abuse, exposure to domestic violence) and, as a result, are experiencing behavior, attachment, and/or mental health problems, including posttraumatic stress disorder (PTSD). The primary goal of CPP is to support and strengthen the relationship between a child and his or her parent (or caregiver) as a vehicle for restoring the child's sense of safety, attachment, and appropriate affect and improving the child's cognitive, behavioral, and social functioning.
The type of trauma experienced and the child's age or developmental status determine the structure of CPP sessions. For example, with infants, the child is present, but treatment focuses on helping the parent to understand how the child's and parent's experience may affect the child's functioning and development. With older children, including toddlers, the child is a more active participant in treatment, and treatment often includes play as a vehicle for facilitating communication between the child and parent. When the parent has a history of trauma that interferes with his or her response to the child, the therapist helps the parent understand how this history can affect perceptions of and interactions with the child and helps the parent interact with the child in new, developmentally appropriate ways.
CPP was developed in the 1980s through an adaptation of the infant-parent psychotherapy model, which was developed in the 1970s by Selma Fraiberg and colleagues. The first efficacy trial of CPP began in 1985. The Child Trauma Research Program began disseminating CPP through the National Child Traumatic Stress Network (NCTSN) in 2002. Since then, approximately 143 sites have implemented the intervention. Five randomized controlled trials have been conducted, and the findings from these studies have been published. In addition, reports have been written on the evaluation of dissemination efforts, including the dissemination of CPP within the NCTSN. Since 1996, more than 527 individuals have received training in CPP. Approximately 10 additional individuals per year have received CPP training through internships and fellowships with the Child Trauma Research Program, and other internships and fellowships in CPP are available through the Child Witness to Violence Program; the Tulane University Infant Team; the Louisiana State University Child Violence Exposure Program; and the Mount Hope Family Center, University of Rochester. Early Childhood Mental Health Consultations (ECMHC). Early childhood mental health consultation builds upon the well- established field of mental health consultation, pioneered by Gerald Caplan in the mid-sixties. In Caplan’s seminal work (1964), he outlined an approach that involves mental health professionals working with human services staff to enhance their provision of mental health services to clients. Similarly, in ECMHC, a professional consultant with mental health expertise “works collaboratively with Early Childhood Educatoin (ECE) staff, programs, and families to improve their ability to prevent, identify, treat, and reduce the impact of mental health problems among children from birth through age 6” (Cohen & Kaufmann, 2000; revised 2005).
4

Ultimately, early childhood mental health consultation seeks to achieve positive outcomes for infants and young children in early childhood settings by using an indirect approach to fostering their social and emotional well-being. Studies on the impact of ECMHC in early childhood settings are increasing in complexity, and evidence of the effectiveness of this approach is mounting. In a clustered randomized control study of Chicago School Readiness Program classrooms, outside observers found that teachers receiving ECMHC had significant improvements in teacher sensitivity and enhanced classroom management skills, compared with teachers in classrooms without consultation (Raver et al., 2008). Observers also found that the classroom climates improved after consultation, with more positive interactions between teachers and children and fewer negative exchanges, in contrast to classrooms where no consultation was present. Staff members also rated themselves as significantly more able to manage children’s difficult behavior after consultation in 9 of 11 studies reviewed by Brennan et al. (in press; see, for example, Alkon, Ramler, & MacLennan, 2003; James Bowman Associates & Kagan, 2003; Olmos & Grimmer, 2004). Finally, teachers have also generally reported lower levels of job stress after they receive consultation services (Green et al., 2006; Langkamp, 2003; Olmos & Grimmer, 2004). Teachers in classrooms with ECMHC services reported that children had fewer problem behaviors after these services were implemented (Bleecker & Sherwood, 2004; Gilliam, 2007; Perry, Dunne, McFadden, & Campbell, 2008; Upshur, Wenz-Gross, & Reed, 2008). Particularly, there is evidence that externalizing (aggressive, disruptive) behavior was less frequent after consultation (Gilliam, 2007; Raver et al., 2008; Williford & Shelton, 2008). Children with difficult internalizing (withdrawn, disconnected) behavior showed improvement in some studies (Bleecker, Sherwood, & Chan-Sew, 2005; Raver et al., 2008), but not in others (Duffy, 1986; Gilliam, 2007). Positive social skill development also accelerated for children with ECMHC services in several studies (Bleecker & Sherwood, 2003, 2004; Farmer- Dougan, Viechtbauer, & French, 1999; Upshur et al., 2008). Finally, there is evidence that when mental health consultation is available in early childhood programs, the rate of expulsion of children with difficult or challenging behavior decreases (Gilliam, 2005; Perry et al., 2008). While there is less evidence related to the impact of ECMHC interventions on longer-term outcomes for children and families, this is largely due to the complexity of such evaluations and that early childhood providers do not typically track these outcomes. Nonetheless, there is ample evidence that ECMHC has a positive impact upon child functioning in the classroom and teacher capacity to address the needs of children exhibiting challenging behaviors. I.C. Target Population, Number Served and Sites
The ECCT was charged with working within the Coastside community, a low-income, rural and coastal community geographically isolated community comprised of Half Moon Bay, La Honda, Pescadero, Moss Beach, Montara and the unincorporated coastal communities of El Granada, Miramar and Princeton-By-The-Sea. While comprised of very small cities and unincorporated areas located significant distances from one another, collectively Coastside comprises 60% of the total area of the entire County while having a small fraction of the population. To better serve this disperse community, ECCT has built strong relationships with key community partners and successfully refers families to the local school district, other StarVista services, Coastside Mental Health and Pre to Three, among others. Additionally, ECCT works with these partners to address gaps and needs in the community and to address the existing system of care for families with young children living in the Coastside.
For several years, the ECCT has operated in North County with funding for only the clinician position, but having secured County Ballot funding, ECCT now has a full team, serving North County
5

with all roles filled, albeit a team comprised of part-time staff..
Operating with a primary office in donated space in Half Moon Bay contributed by Cabrillo School District, Mental Health Consultation services continue to support staff and families at early care and
education settings in the Coastside. Consultation services continue to have a significant impact on the families and staff at the four programs receiving this service in the Coastside: Half Moon Bay Head Start; Moonridge Head Start and Early Head Start, and Coastside Children’s Program. While these are the primary early childhood mental health consultation sites, the ECCT is highly mobile, providing services at four early childhood programs as well as in the homes of families. The table at left summarizes the ethnicity of the children served and the primary language of the parent/caregiver. While data is not collected about income status of families, three of the four early childhood programs are Head Start or Early Headstart programs that have income criteria for enrollment and approximately one-fourth of the families enrolled in the fee-for-service center are subsidized by state early childhood
subsidies eligible to low-income families. A summary of the units of services and types of services delivered is provided under EQ # 1.
Section II Evaluation Process The evaluation plan was initially developed in June-July 2013 through a series of participatory meetings that included the evaluator, Program Director, Christina Lansdown and Sarah Dobkin Program Manager for the Early Childhood Mental Health Consultation Program. A second series of discussions occurred in November and December of 2013 with a final series of conversations occurring in October and November 2014 when the final evaluation report was developed. In June 2013, ECCT leadership shared with the consultant a myriad of screening, assessment, observation and diagnostic tools utilized in their practice. The evaluator reviewed the varied tools and together a plan was developed to use and determined that the following tools would be used in the evaluation. While several new tools were introduced in clinical practice in 2014-15, these were not used for the purpose of providing evaluation data. As such, the following data was used in 2014-15: Arnett Caregiver Interaction Scale (CIS). The CISs is an observational tool used with the ECMHC program that is designed to measure changes in the caregiver’s approach to a child in their care. The Devereaux Early Child Assessment, a pre-post assessment tool comprised of a sixty-two item, forced choice assessment that can be completed by a caregiver, mental health consultant or by a parent with each item representing a kind of child behavior. The assessment produces subscale scores for: initiative, self-control, withdrawal, emotional control problems, attention problems, aggression, as well as Total Protective Factors and Total Behavioral Concerns. While used in 2013-14, there were an insufficient number of children assessed in the post-test to allow inclusion in the evaluation. Child Behavior Checklist. A pre-post test assessment which is used more for therapeutic purposes to assess how services are impacting the child’s behavior. Parent Stress Index. Is a pre-post assessment tool designed to capture the level and type of stress experienced by the parents.
Table I: Client Ethnicity= 75 Ethnicity # %
Latino 66 88.0% Caucasian 2 2.6% Mixed Race 3 4.0% African American
2 2.6%
Other 2 2.6% Total 75 99.8% Primary Lang Spanish 61 80.0% English 13 17.3% Other 2 2.6%
6
Life Stressor Checklist that provides a good profile of the kinds of stresses experienced by families served by ECCT. It is only given at intake so it does not contribute to evaluating the program’s impact. While used in 2013-14, there were an insufficient number of parents assessed to allow inclusion in the evaluation. The Parenting Relationship Questionnaire. Developed by the authors of the BASC-2, the Parenting Relationship Questionnaire (PRQ) is an assessment that can be completed in 10-15 minutes by a mother, father or other primary caregiver. It is designed to capture a parent's perspective on the parent-child relationship. The PRQ has two forms, one for Preschool (ages 2-5) and another for Child and adolescent (ages 6-18). Features of the PRQ:
• Multiple dimensions that are relevant to the development of strong and healthy parent-child relationships;
• Normative samples, for both female and male raters, that are closely matched to U.S. Census population estimates;
• Items written at a third-grade reading level; • Validity indexes that can be used to detect careless or exaggerated responding; • Three types of record forms: hand-scored, computer-entry, and scannable; and • Computer software that provides detailed single- or multiple-administration reports,
including progress reports and multi-rater reports that can be used to compare mother and father settings
Provider Satisfaction Survey. A seventeen-item forced choice survey was used with 14 of the 20 teachers who had received mental health consultation services in 2014-15. With such a rich array of validated tools, the evaluator and ECCT leadership were confident of being able to develop a robust evaluation support by a variety of forms of data. Unfortunately in both 2014 and 2015, the evaluator learned that each of these tools is used to respond to very specific kinds of client families and children and more importantly, the focus of the ECCT was to use these for diagnostic and clinical purposes, not for evaluation. These factors, plus the reality that many cases closed quickly without allowing for a battery of post-test assessments, led to an extremely low N for many of the above tools. Factors contributing to a small number of post-test results included:
• High turnover in the early child care programs, with teachers with whom ECCT consultation team was working, leaving without sufficient time to arrange a post-test observation (both years);
• While the ECCT served 83 children 2013-14 and 75 in 2014-15, some were served through consultations with parents, others in play groups, others through consultation with teachers, and still others in child-parent psychotherapy. Each of these service components utilize different tools to suit their specific clinical and programmatic focus; and
• High mobility among client families involved in group and/or individual counseling services and with families exiting the program without scheduling an exit interview where a post-test might have been administered.
Despite these challenges sufficient data was organized to assess the degree to which the program had served the Coastside community. Data included:
7

• Program participation data which captured the number of families and childcare professionals served by a range of distinct services;
• Pre-post data from the Parenting Relationship Questionnaire (PRQ), the Child Behavior Checklist (CBCL) and the Arnett Global Rating Scale (ARQ). While in eacn instance the N was small relative to the number of pre-tests, the results still showed reasonably clear trends in terms of program impact.
• In 2013-14, parent satisfaction survey results for six parents, again a relatively low N but with clear indications of satisfaction, however in 2014-15 only one parent satisfaction survey was administered, preventing inclusion of this important data in this year’s evaluation;
• Childcare professional satisfaction survey indicating level of satisfaction and impact of consultation services, with an N of 14 being a very representative sampling, 70% of those served; and
• Structured interviews were conducted with ECCT Program Manager, Sarah Dobkin and used to construct two case studies illustrating how the ECCT system operates and how it how its services benefit children, parents and childcare workers.
While this data allowed for a reasonably rich evaluation, many opportunities for data collection were missed that could have contributed to the program achieving a clearer, more specific view of its program effectiveness and impact. StarVista leadership acknowledged these missed opportunities and while leadership was committed to taking better advantage of them in 2014-15, this did not materialize. These opportunities are discussed under EQ # 7. Section III Evaluation Findings There are seven evaluation questions that frame the evaluation of the Prevention & Early Intervention programs supported with Mental Health Services Act funds.
Evaluation Question # 1: Has the intervention/ program been implemented efficiently and according to the contract funding the program? Evaluation Question # 2: Has the program implemented effective program strategies? i.e. Is the program well-designed and achieving a desired impact? Evaluation Question # 3: Have clients, families, partners, and/or communities been satisfied with services? Evaluation Question # 4: Have program services been responsive to the population targeted by the contract? Evaluation Question # 5: To what degree has the program advanced the vision, mission and objectives of the MHSA PEI plan? Evaluation Question # 6: What factors have impeded or contributed to successful implementation? How? Evaluation Question # 7: What steps can be taken in the future to improve program services and what data could verify that these improvements had occurred?
The ECCT program evaluation encountered a significant challenge resulting from the program delivering three distinct components, each of which utilized different assessment tools for clinical purposes. This significantly reduced the size of the N on any one of these assessments. Nonetheless, available data was sufficient to produce a reasonably robust evaluation report. The 2013-14 process of developing the report also resulted in identifying opportunities for expanded data collection that should have resulted in a more data rich report this year as well as opportunities for use of data in program improvement activities. While this did not materialize, ECCT leadership
8
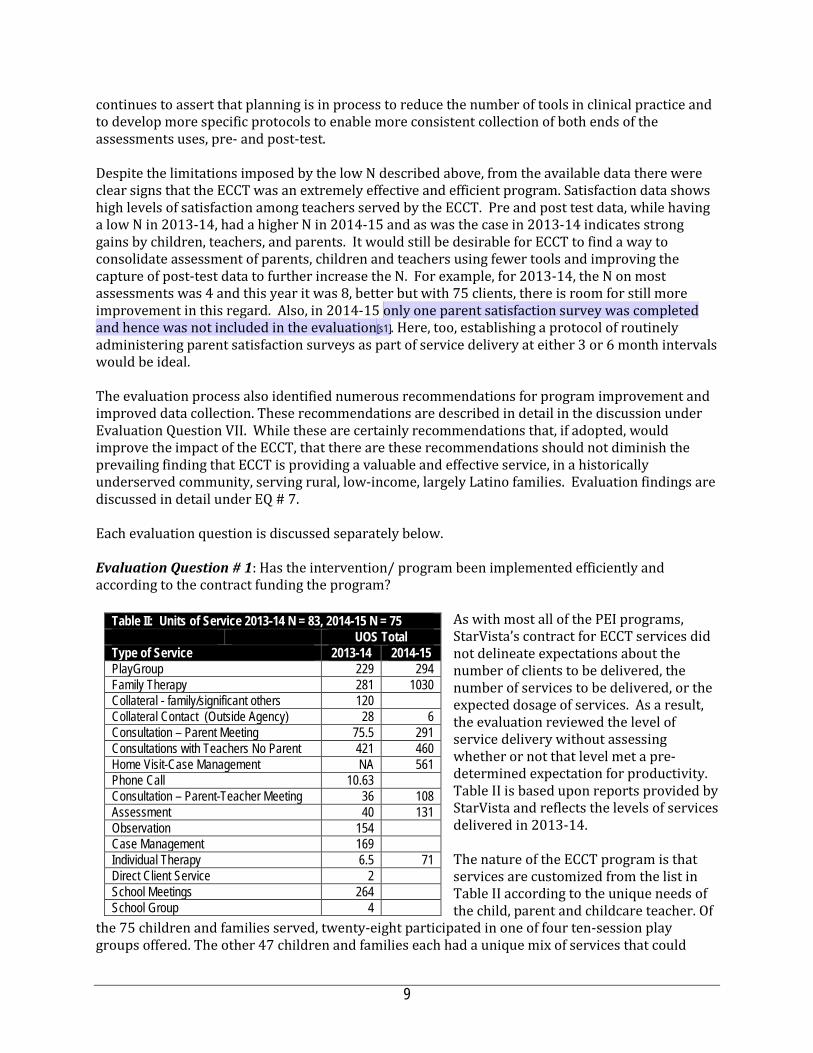
continues to assert that planning is in process to reduce the number of tools in clinical practice and to develop more specific protocols to enable more consistent collection of both ends of the assessments uses, pre- and post-test. Despite the limitations imposed by the low N described above, from the available data there were clear signs that the ECCT was an extremely effective and efficient program. Satisfaction data shows high levels of satisfaction among teachers served by the ECCT. Pre and post test data, while having a low N in 2013-14, had a higher N in 2014-15 and as was the case in 2013-14 indicates strong gains by children, teachers, and parents. It would still be desirable for ECCT to find a way to consolidate assessment of parents, children and teachers using fewer tools and improving the capture of post-test data to further increase the N. For example, for 2013-14, the N on most assessments was 4 and this year it was 8, better but with 75 clients, there is room for still more improvement in this regard. Also, in 2014-15 only one parent satisfaction survey was completed and hence was not included in the evaluation[s1]. Here, too, establishing a protocol of routinely administering parent satisfaction surveys as part of service delivery at either 3 or 6 month intervals would be ideal. The evaluation process also identified numerous recommendations for program improvement and improved data collection. These recommendations are described in detail in the discussion under Evaluation Question VII. While these are certainly recommendations that, if adopted, would improve the impact of the ECCT, that there are these recommendations should not diminish the prevailing finding that ECCT is providing a valuable and effective service, in a historically underserved community, serving rural, low-income, largely Latino families. Evaluation findings are discussed in detail under EQ # 7.
Each evaluation question is discussed separately below. Evaluation Question # 1: Has the intervention/ program been implemented efficiently and according to the contract funding the program?
As with most all of the PEI programs, StarVista’s contract for ECCT services did not delineate expectations about the number of clients to be delivered, the number of services to be delivered, or the expected dosage of services. As a result, the evaluation reviewed the level of service delivery without assessing whether or not that level met a pre-determined expectation for productivity. Table II is based upon reports provided by StarVista and reflects the levels of services delivered in 2013-14. The nature of the ECCT program is that services are customized from the list in Table II according to the unique needs of the child, parent and childcare teacher. Of
the 75 children and families served, twenty-eight participated in one of four ten-session play groups offered. The other 47 children and families each had a unique mix of services that could
Table II: Units of Service 2013-14 N = 83, 2014-15 N = 75 UOS Total Type of Service 2013-14 2014-15 PlayGroup 229 294 Family Therapy 281 1030 Collateral - family/significant others 120 Collateral Contact (Outside Agency) 28 6 Consultation – Parent Meeting 75.5 291 Consultations with Teachers No Parent 421 460 Home Visit-Case Management NA 561 Phone Call 10.63 Consultation – Parent-Teacher Meeting 36 108 Assessment 40 131 Observation 154 Case Management 169 Individual Therapy 6.5 71 Direct Client Service 2 School Meetings 264 School Group 4
9
include case management, family therapy, home visits, collateral support and consultation with parents, with teachers and with parents and teachers together. Referrals came from head start programs, parents, Cabrillo Unified School District, Coastside Mental Health, a variety of local elementary schools, Edgewood Center, Pre-3, and Watch Me Grow: an indication of the degree to which the ECCT has become known throughout the Coastside community. A closer examination of client-level data shows the following trends in services:
• Total served as roughly equivalent to 2013-14 with a 10% dip in total served, largely due to staff turnover;
• Clearly between the 2013-14 and 2014-15 evaluations some changes in the definition of services occurred, resulting in some curious comparisons, e.g. Family Therapy going from 281 to over 1000 and the failure to isolate observation and case management as distinct services (see below for discussion); nonetheless,
• From the data provided, it is clear that ECCT was providing a comprehensive array of services.
The collapsing of case management and home visits into a service type and the inability to report on observation, school meetings, collateral services as separate, trackable units of service is the fault of the evaluator who provided ECCT with a spreadsheet that identified a distinct number of service types which then were interpreted by ECCT as best as possible. One of the recommendations for 2014-15 is for the ECCT to establish clear definitions that allow it to more clearly distinguish case management, collateral, home visits, the different forms of consultation, and mental health treatment. See Evaluation Question VII for this discussion. Another limitation to the evaluation is that the way the relatively small number of clients and the large number of service types and assessment tools utilized made it difficult to analyze a correlation between dosage of services and impact as determined from pre-post test assessment. This is not a service delivery limitation as much as a challenge to conducting evaluation. As noted above, the service plans are developed to respond to the unique needs of the child and family and can depend upon such issues as parental work schedule, transportation, and receptivity and/or capacity to sustain involvement. Many of the parents served often work multiple, low-wage jobs and as such, have limited capacity to sustain involvement. Nonetheless, in dialogue with Ms. Dobkin, she concurred that for treatment AND evaluation purposes it would be desirable to limit the number of tools in use. Her view is that doing so would facilitate alignment of assessment practice across the sites where StarVista operates ECCT programs while reducing the level of effort involved in training new clinicians to use such a broad array to assessment instruments. In addition to ECCT direct services, in 2013-14 StarVista engaged the Coastside community to find ways that the team’s expertise could build community capacity or fill unmet needs. One example of this was in the teams provision of training in areas related to early child development. ECCT staff has collaborated to respond to the needs expressed by ECCT partners at the school district and the Coastside Clinic to provide multiple workshops this year. Themes included School Readiness, Children and Trauma, Social Emotional Development, and Positive Discipline. These presentations were adapted for each unique audience. In this manner the ECCT was able to serve diverse groups such as teachers, providers, and administrators as well as parents. In 2014-15,ECCT reduced the scope of its community training, focusing upon outreach and community education about ECCT services, building relationships among local providers and community organizations, and conducting outreach to parents.
10
In 2013-14, ECCT staff supported teachers and families participating in Kick-Off to Kindergarten (K2K) this year by administering the ASQ-3 and ASQ-SE screening tools and providing needed referrals to any child identified with a potential need for additional support. The Early Childhood Community Team collaborated with Cabrillo Unified School District to perform screenings of children entering kindergarten and to connect with families with young children needing additional support services through the Kick-Off to Kindergarten program. However, ECCT has not been satisfied with how the district operates this program. For example, the program is supposed to help prepare entering kindergartners, particularly those with no structured child care experience, with the typical kindergarten routine. However, ECCT reports that teachers assigned to the project are typically teachers who volunteer for the assignment and ECCT’s experience is that most often these teachers have no kindergarten or early childhood experience, being teachers of much older students. In ECCT’s experience, these teachers have an entirely unrealistic set of expectations for child behavior, expectations that are considerably out of alignment with normal child development. As a result, ECCT found itself placating exasperated teachers who were not appropriate to the project and who very likely were causing more anxiety in children instead of the reverse. ECCT efforts to educate the district and recommendations to modify the program to ensure that project teachers had a reasonable level of Kindergarten experience and familiarity with normal early child development, were not heeded by the District and so in 2014-15, ECCT only gave a presentation to parents participating in the K2K program presenting the resources available through the ECCT, but otherwise did not participate in the program. In sum, ECCT delivers an array of highly specialized services that support parents and childcare teachers and through that work, improve the environment in which the children develop. Parents and teachers become sensitized to each child’s developmental and emotional needs and are therefore better able to support healthy development. Since the contract was silent as to a projection of the number served and the number of units of service for each type of service, it is not possible to assess whether the level of services was sufficient for the resources in the contract. Also, it was not possible to assess the degree to which individual client/families/children/teacher received specific dosages of services. Nonetheless, based upon available data, it would appear that ECCT engaged relatively high numbers of high-risk, difficult to engage families, served under-served populations (88% Latino, 80% Spanish-speaking) and provided the range of services identified in the contract. Evaluation Question # 2: Has the program implemented effective program strategies? i.e. Is the program well-designed and achieving a desired impact? To assess ECCT’s impact on children, parents and teachers, the evaluator examined assessment data derived from the Child Behavior Checklist (CBCL) pre-post test data, the Parenting Relationship Questionnaire (PRQ) and the Arnett Caregiver Interaction Scale (CIS). The Child Behavior Checklist (CBCL), a 100-item forced choice list of problem behaviors where a parent is asked to identify if that behavior is not true, somewhat true or very true as relates to their child. The 100-item checklist is disaggregated to produce scaled scores for each of 15 domains of behavior, including:
Emotionally reactive Anxiety-Depression; Somatic complaints; Withdrawn; Sleep problems; Attention problems;
11

Aggressive behavior; Affective problems; Anxiety problems; Pervasive development problems ADHD; Oppositional disorder; Internalizing problems; and Externalizing problems.
In addition a global score is produced for Total Problems. For each domain and for Total Problems, are produced with ranges denoting “clinical,” “borderline” and “normal.” For Total Problem, Internalization, and Externalization Scales, scores of less than 60 are considered non-clinical, 60-63 are borderline [Yellow Shade in Table III], and 64 or more are considered clinical (Red Screen). For all syndrome scales, scores of 65 or less are considered non-clinical, 66 through 70 are considered borderline [Yellow Shade in Table III], and 71 or greater are considered clinical (Red Screen). In Table III, all clinical level scores are highlighted in red and all borderline are highlighted in yellow.
While the N for the CBCL was quite low in 2013-14 (4), we had double the number to analyze in 2014-15 (N=8). As was the case last year, the trends indicated in Table III are quite positive. In 15 instances where a child was indicated as having a clinical level deficit in the pre-test, significant enough improvement was made in the post-test that none of these children even registered in the borderline range, i.e. post-test results indicated that in all 15 cases, the child now registered in the normal range. In addition, among all 16 instances of a child behavior being marked borderline in the pre-test, all but one behavior was scored normal in the post-test. What’s more, if you examine client # 4 and # 6, the two clients with the most assessed borderline and clinical scores, you can see dramatic improvement in every behavior identified as being abnormal with an average improvement across behaviors for #4 of 20 and for # 6 of 27. Finally, when examining the average change between pre and post-tests for each of the fourteen behaviors, all fourteen register improvement from pre- to post-test. So while the N for the CBCL remains low, the trends are
Table III: Child Behavior Checklist Pre-Post Test Summary #1 #2 #3 #4 #5 # 6 # 7 # 8 Ave Pre Post Pre Post Pre Pos Pre Post Pre Post Pre Post Pre Post Pre Post Pre Post
Emotionally reactive
62 59 55 50 51 50 62 55 50 51 69 50 51 50 59 59 57.4 52.0 Anxiety-Depression;
52 59 52 51 50 50 69 52 50 50 69 50 50 50 66 63 57.2 53.1 Somatic complaints;
50 62 50 50 50 50 50 62 50 50 70 53 50 50 50 50 52.5 47.1 Withdrawn; 67 63 51 51 63 50 73 51 50 50 70 50 50 50 56 51 60.0 52.0 Sleep problems; 53 53 50 50 50 50 56 50 51 50 67 56 50 50 50 50 53.4 51.1 Attention problems 53 53 62 53 51 51 67 50 53 51 67 53 50 50 53 51 57.0 51.5 Aggressive behavior;
59 59 77 51 59 56 66 53 55 55 65 50 50 53 69 58 62.5 54.4 Affective problems 60 67 52 52 51 50 72 52 52 50 67 52 50 51 56 52 57.5 53.1 Anxiety problems; 60 57 51 54 50 50 60 50 50 50 75 54 50 50 54 54 56.3 52.4 Pervasive development problems
66 63 52 52 56 50 68 52 50 50 68 50 50 50 56 59 58.3 53.4
ADHD; 52 52 60 51 57 51 60 50 51 50 64 50 50 50 52 50 55.8 50.5 Oppositional disorder;
59 59 70 51 55 55 59 52 51 52 59 50 50 51 77 64 60.0 54.3 Internalizing problems; and
60 63 49 43 49 33 66 56 33 37 73 43 41 43 59 56 53.7 45.5 Externalizing problems.
58 58 73 50 57 55 67 50 55 54 66 46 44 46 66 56 60.7 52.4 Total Problems 59 61 58 47 51 43 69 49 44 42 72 45 38 45 52 54 55.4 47.6 Change +2 -9 -8 -20 -2 -27 +7 +2 -7.8
12
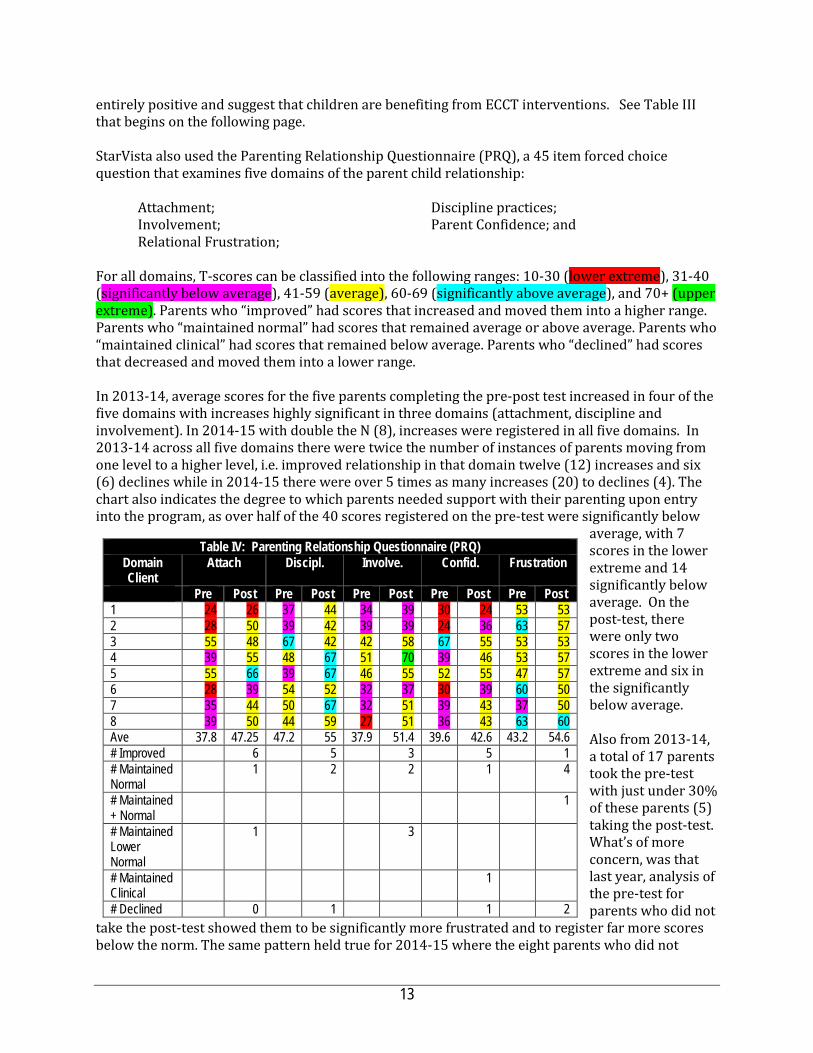
entirely positive and suggest that children are benefiting from ECCT interventions. See Table III that begins on the following page. StarVista also used the Parenting Relationship Questionnaire (PRQ), a 45 item forced choice question that examines five domains of the parent child relationship:
Attachment; Discipline practices; Involvement; Parent Confidence; and Relational Frustration;
For all domains, T-scores can be classified into the following ranges: 10-30 (lower extreme), 31-40 (significantly below average), 41-59 (average), 60-69 (significantly above average), and 70+ (upper extreme). Parents who “improved” had scores that increased and moved them into a higher range. Parents who “maintained normal” had scores that remained average or above average. Parents who “maintained clinical” had scores that remained below average. Parents who “declined” had scores that decreased and moved them into a lower range.
In 2013-14, average scores for the five parents completing the pre-post test increased in four of the five domains with increases highly significant in three domains (attachment, discipline and involvement). In 2014-15 with double the N (8), increases were registered in all five domains. In 2013-14 across all five domains there were twice the number of instances of parents moving from one level to a higher level, i.e. improved relationship in that domain twelve (12) increases and six (6) declines while in 2014-15 there were over 5 times as many increases (20) to declines (4). The chart also indicates the degree to which parents needed support with their parenting upon entry into the program, as over half of the 40 scores registered on the pre-test were significantly below
average, with 7 scores in the lower extreme and 14 significantly below average. On the post-test, there were only two scores in the lower extreme and six in the significantly below average. Also from 2013-14, a total of 17 parents took the pre-test with just under 30% of these parents (5) taking the post-test. What’s of more concern, was that last year, analysis of the pre-test for parents who did not
take the post-test showed them to be significantly more frustrated and to register far more scores below the norm. The same pattern held true for 2014-15 where the eight parents who did not
Table IV: Parenting Relationship Questionnaire (PRQ) Domain Client
Attach Discipl. Involve. Confid. Frustration
Pre Post Pre Post Pre Post Pre Post Pre Post 1 24 26 37 44 34 39 30 24 53 53 2 28 50 39 42 39 39 24 36 63 57 3 55 48 67 42 42 58 67 55 53 53 4 39 55 48 67 51 70 39 46 53 57 5 55 66 39 67 46 55 52 55 47 57 6 28 39 54 52 32 37 30 39 60 50 7 35 44 50 67 32 51 39 43 37 50 8 39 50 44 59 27 51 36 43 63 60 Ave 37.8 47.25 47.2 55 37.9 51.4 39.6 42.6 43.2 54.6 # Improved 6 5 3 5 1 # Maintained Normal
1 2 2 1 4
# Maintained + Normal
1
# Maintained Lower Normal
1 3
# Maintained Clinical
1
# Declined 0 1 1 2
13
complete the post-test had a higher risk profile than those who sustained involvement in the program and were administered both the pre and post-test. Initially, this raised a concern that ECCT had been unable to successfully engage and sustain engagement with the families/parents who were at highest risk. This concern was mitigated to a significant degree by the relatively low-functioning of the parents who took both pre and post-tests and the degree to which improvement was found across the board. Recall also that in the CBCL above, it was the two children with the lowest functioning who improved the most. Based upon these results, it seems clear that just as children’s behavior showed marked improvement in the CBCL, so here with the PRQ it is equally clear that parent caregiving capacity also benefited significantly from involvement in the ECCT program. The evaluation also utilized the results from the Arnett Caregiver Interaction Scale (CIS) to assess program impact. The CIS is used to rate the behavior of individual teachers in the childcare setting. All caregivers are observed for 45 minutes with scores noted for every instance of 26 different behaviors. These scores are then aggregated into four subscales: Sensitivity, Harshness, Detachment, and Permissiveness. As was the case last year, high teacher turnover prevented ECCT from obtaining pre and post test surveys from many teachers as before enough classroom support could be given after a pre-test was administered, only three teachers remained to have the post-test observation conducted. As a result, a table was not developed to present results. Still in all three instances, teachers registered significant gains in each of the four domains, with significant gains in Sensitivity for all three teachers and more modest gains in all other domains. Finally, as part of the evaluation, a structured interview was conducted with the ECCT Program Manager to explore ways in which specific families and teachers had benefited from ECCT services. One mother and child received all three of the ECCT services (parent education, teacher consultation, mental health treatment) after the child was identified first by the teacher and later by the parent as being ‘active.’ The ECCT consultant worked with the teacher while a parent educator helped the parent identify ways in which to work more effectively with the child. Unfortunately, the parent educator who had formed such a positive relationship with the mother, significantly reduced his hours so he could pursue a Masters Degree. The new parent educator was not as able to develop and sustain as positive a working relationship with the parent and the parent discontinued this work. This would have been the end of parent education support except that the parent continued to talk with the classroom consultant about the child’s behavior and through those discussions the relationship with the Parent Educator was repaired. Ultimately the parent nad new parent educator formed a trusting relationship and through their work together the mom came to realize how her habit of focusing more attention on her younger daughter, leaving the son to play independently was actually contributing to her perception of her son being hyperactive. The parent educator was able to suggest more home activities that involved the mom, the son and the younger daughter together, much improving the home dynamic. At the same time, the parent educator and the classroom consultant recognized the degree to which the mom’s behavior was contributing to her son’s behavior issues. At this point, the ECCT mental health clinician became involved and helped the mom better understand her role in the son’s behavior and how her own mental health issues were impacting her relationship with her son. The collective impact of this highly integrated support was responsible for the child being able to complete the school year in the center, something that looked highly unlikely when ECCT began working with the family. Another example of how the ECCT has benefited Coastside families involves another boy. A classroom teacher sought support from the Classroom Consultant to help her manage this boy’s behavior which she saw as inappropriately aggressive. The boy was a bit larger than the other
14
children and his behavior was not developmentally inappropriate, but that the teacher was simply seeing the child as older and so should be more able to manage his perceived ‘aggressiveness.’ The mom also had an unrealistic understanding of developmentally appropriate behavior and had come to label the child as ‘the devil.’ Compounding this, the consultant came to realize that the separated parents had had a history of domestic violence, which triggered a referral to the mental health clinician. The mental health clinician helped the mom to understand that the child was far more aware of the violence than the mom had realized. The clinician was able to coach the mom to use developmentally appropriate language to help the child understand what he had seen and that she could now protect him. Moreover, the clinician helped the mom also understand the degree to which her anger with her child was to a significant degree the result of her transferring her anger with her husband to the child. Understanding this, she was better able to modify her behavior with her child. What is also illuminating about this case, is that months later the same father who had been abusive in this home, became involved with another mother whose child attended the program, the point being that one of the complications of delivering any mental health program in Coastside is the degree to which so many families are interrelated and how close the community is. This can quite obviously be both a strength and a challenge. Despite the limited number of pre and post-tests on the three assessments utilized in this evaluation, the pre-post assessment data that was available strongly suggests that the ECCT is having a positive impact on the children, teachers, and families being served. This is reinforced by the qualitative data presented by the Program Manager in relation to the above two cases. Evaluation Question # 3: Have clients, families, partners, and/or communities been satisfied with services? As has been noted elsewhere, ECCT has not managed to collect large numbers of pre-post test assessments and this occurred in relation to satisfaction surveys as well, particularly in relation to parent satisfaction with only one survey collected from among the 19 families who received consultations. In relation to Childcare Worker satisfaction ECCT did a much better job with 14 surveys returned from among the 20 teachers receiving consultations. With only one parent survey collected, satisfaction will be gleaned only from the results of the teacher satisfaction survey. Surveys were administered for 14 classroom teachers with whom the ECCT consultant worked, generally in relation to a specific child. A series of 17 statements in relation to program services were included in the survey, with respondents asked to indicate the level of effectiveness of each service component. The statements were:
Please answer the following questions if the consultant was involved in discussion about an individual child. Q1 How effective was the consultant in helping you accomplish what you wanted
Q2 How effective was the consultant in increasing your understanding of the child's experience and feelings?
Q3 How effective was the consultant in contributing to your willingness to continue caring for the child?
Q4 How effective was the consultant in contributing to your ability to handle this child?
Q5 How effective was the consultant in helping you in your relationship with this child's family?
Q6 How effective was the consultant in contributing to your understanding of the family's situations and its effects on the child's current behavior?
15

Q7 How effective was the consultant in helping to relieve some of the pressure in responding to the family's needs?
Q8 How effective was the consultant in helping to find services that the child and family need?
Q9 How effective was the consultant in helping you apply what you learned about the child to other children?
Please answer these questions about your program:
Q10 How useful was the consultant in helping you to think about children's development and behavior?
Q11 How useful was the consultant in helping you to think about curricula planning?
Q12 How useful was the consultant in helping you to think about your classroom environment?
Q13 How useful was the consultant in helping you to think about classroom management? Q14 How useful was the consultant in helping you think about parent involvement? Q15 How useful was the consultant in helping you to think about staff relationships?
As someone who has used Early Childhood Mental Health Consultation: Q16 Overall, how would you rate the quality of services provided by the consultant?
If you rated "fair" or "poor," what suggestions would you offer to improve services?
Q17 Would you recommend the Early Childhood Mental Health Consultation Program to others who need help with similar concerns?
Q18 Are there any other comments you would like to make about the services you received?
As Table V reveals, satisfaction levels were extremely high among the Childcare Workers. On Questions 1-9 which focused on the consultant’s effectiveness, only one of sixteen respondents scored services lower than effective. In relation to Q10-17, ratings were almost as high for questions 10-17 with the only Q-11 being the only instance in which the respondent indicated “somewhat useful” on a question related to helping with curricula planning. Open-ended responses asking respondents to identify areas where the program could be improved did not result in a single suggestion. However, there were 16 different narrative responses with every one entirely positive. A sampling: “The Consultant has also helped me a lot in speaking about my own personal issue. She is very interested in helping everyone and is always at the center and available.” And “The consultant provides excellent support in all areas including, challenging behaviors, parents, staff relationship and classroom management.” And “It is so nice to have someone to look forward to talk to when you need it. I feel comfortable knowing that I can trust Sarah and the she cares and does it positively and professionally.”
Table V: Childcare Worker Satisfaction Part 1. N=14 Response Q1 Q2 Q3 Q4 Q5 Q6 Q7 Q8 Q9 Very effective 28.57% 50.00% 42.86% 57.14% 50.00% 42.86% 21.43% 21.43% 28.57% Effective 57.14% 50.00% 57.14% 42.86% 35.71% 57.14% 64.29% 57.14% 57.14% Somewhat effective 7.14% 0.00% 0.00% 0.00% 14.29% 0.00% 7.14% 0.00% 7.14% Not at all effective 0.00% 0.00% 0.00% 0.00% 0.00% 0.00% 0.00% 0.00% 0.00% Not applicable 0.00% 0.00% 0.00% 0.00% 0.00% 0.00% 7.14% 21.43% 7.14% Unanswered 7.14% 0.00% 0.00% 0.00% 0.00% 0.00% 0.00% 0.00% 0.00%
16

(Sum of VE/E) 85.71% 100.00% 100.00% 100.00% 85.71% 100.00% 85.71% 78.57% 85.71% (Sum of VE/E w/o NA/X) 92.31% 100.00% 100.00% 100.00% 85.71% 100.00% 92.31% 100.00% 92.31%
Q10 Q11 Q12 Q13 Q14 Q15
Very useful 57.14% 14.29% 21.43% 28.57% 28.57% 50.00% Useful 42.86% 42.86% 35.71% 42.86% 57.14% 42.86% Somewhat useful 0.00% 21.43% 28.57% 21.43% 0.00% 7.14% Not at all useful 0.00% 0.00% 0.00% 0.00% 0.00% 0.00% Not applicable 0.00% 21.43% 14.29% 7.14% 7.14% 0.00% Unanswered 0.00% 0.00% 0.00% 0.00% 7.14% 0.00%
0.00% 100.00% 57.14% 57.14% 71.43% 85.71% 92.86%
100.00% 72.73% 66.67% 76.92% 100.00% 92.86%
While it is disappointing that more satisfaction surveys were not collected from parents, the degree to which child and parent impact measures improved with almost universal consistency and the exceedingly high satisfaction expressed by fourteen teachers, it is clear that both parents and teachers are highly satisfied with the ECCT program. Evaluation Question # 4: Have program services been responsive to the population targeted by the contract? The ECCT is funded to serve the geographically isolated, low-income, rural community of Coastside. More specifically, it is supposed to target under-served families where either child behaviors raise concerns of emotional or psychological risk or where parenting practices raise concerns. A measure of the degree to which ECCT has successfully engaged families where the parent-child relationship is less than ideal can be seen from the PRQ discussed under EQ # 2 above. As can been seen, every one of the eight parents taking both the pre and post test had at least one domain that was significantly below average and as described in the analysis below the table. The program’s impact is further underscored by the results of the CBCL. Again, while the numbers of pre-and post-test results is lower than would be desired, the results were very strong. Lastly, satisfaction surveys of childcare workers indicate an exceedingly high level of satisfaction indicating the programs’ being responsive to the needs of the targeted population. Clearly the program is targeting and engaging families at very high risk and with better data collection practices, it would be possible to assess the level of services accessed by each child and family, but it seems clear that while data collection practices could be strengthened, the program is responsive to the targeted population and targeted community needs, with one exception. Evaluation Question # 5: To what degree has the program advanced the vision, mission and objectives of the MHSA PEI plan? The vision, mission and values of San Mateo County Behavioral Health & Recovery Services stress empowering individuals to direct their own recovery process. BHRS stresses the adoption of culturally competent treatment approaches and through its MHSA planning processes, a further focus has been placed upon implementing evidence-based practices that have demonstrated the capacity to support client wellness and recovery. From the perspective of prevention, BHRS has also described the journey towards a transformed system requiring that programs:
17

• move “upstream” to primary prevention strategies; • partner with other health prevention efforts to focus on wellness and recovery; • achieve desired outcomes; and • integrate efforts to support sustainability;
What’s more, San Mateo’s MHSA plan clearly described the priority of intervening early and identified stress, PTSD, and use of alcohol and drugs as factors where early intervention were most important, particularly in relation to individuals from historically underserved populations.
Childcare Consultation. By making early childhood mental health consultation available to more childcare providers, the ECCT team reaches individuals who have the potential to be a long-term support for families at risk and in distress at an early point in the developmental process, magnifying the impact of their work over years. Child-parent psychotherapy is reaching families with infants and toddlers, very early in their development and providing parents with parenting tools that should benefit the child over the course of their development, as well as with any future children that the family may produce. Community Outreach and Case Management. The ECCT community outreach worker is also able to identify and connect with family/friend/neighbor providers that may not have been previously known to the resource and referral agency and facilitate their connection to ongoing supports.
Taken together it is clear that ECCT is collaborating with other community providers, engaging families and children ‘upstream’ and are achieving the desired results from their services. While ECCT’s data collection could be improved, it is clear that this vital service is appreciated by parents and childcare workers and is consistent with SMC BHRS vision and values.
Evaluation Question # 6: What factors have impeded or contributed to successful implementation? How? Transition of Childcare Staff. As was the case last year, staffing changes at all four centers led to feelings of instability and mistrust among teaching staff, parents, and children. While not as chaotic as last year when one center in particular saw over half of their teachers change in the course of three weeks (including one classroom in which all three teachers were new to the class), turnover among childcare staff was a significant barrier. Such changes impact children attending the center significantly as they lose a reliable and consistent connection with an adult with whom they have developed trust and respect and the new staff saw major changes in the behaviors of the children following these staffing shifts. Similarly, parents reported feeling anxious about leaving children with new faces and frustrated in not knowing which staff was permanent and which were substitutes. Turnover in childcare staff involved in consultations means that resources poured into building the capacity of a specific childcare worker has been wasted while also requiring that the new worker receive training. This turnover also impedes the evaluation as a childcare worker may have identified a challenging child behavior, begun to work with the ECCT Consultant and then leave in midstream without the opportunity to do a post-consultation observation. Turnover in the childcare industry is endemic and simply makes the work of the ECCT more challenging. Almost without exception, every agency evaluated this year has been impacted by staff transition. While each agency manages these transitions differently, it may be worthwhile exploring a more systemic solution, perhaps involving use of MHSA Workforce Education & Training funding.
18
Clarify ECCT Role and Scope of Responsibility in Kicking Off Kindergarten. As described above under EQ # I, ECCTs becoming involved in Kicking Off Kindergarten was very well received, but also encountered challenges that resulted in some inefficiencies with teachers expecting the ECCT to support students with either behavioral problems or academic problems. Academic problems are simply not part of ECCT’s clinical expertise and so children were referred to ECCT for academic reasons with ECCT not prepared to address those issues. This led to frustration from the school as they had thought that ECCT would be a resource for this. From ECCT’s perspective, most of the teachers in the program in 2013-14 were not experienced in working with younger children, often being 4th and 5th grade teachers. These teachers, unfamiliar with the developmental capacities of five year olds, often had very unrealistic expectations and were disappointed when children did not behave more maturely. New, collaborative projects frequently encounter these kinds of challenges and while ECCT made an effort to educate district personnel about the need to utilize teachers with early child development experience, this did not materialize and while ECCT did give a presentation to parents about the ECCT and its services, it did not provide ongoing involvement in the K2K program. Data collection. With 83 clients in 2013-14 and 75 in 2014-15, the ECCT delivers three distinct strategies (child-parent psychotherapy; mental health consultation with child care providers; and case management/parent education (including parent-child activity groups) each employing different clinical tools that can produce pre and post test results. So the N for any given strategy is never going to be large. Families exiting the program do not always leave in a predictable timeframe and hence many post-tests are not obtained. However, given that the average client sustains program involvement for an average of over 200 days with that involvement typically including weekly sessions, a larger N should possible. The low number of pre- and post-tests has been identified as a barrier to the development of a robust evaluation, but it is also a barrier to ECCT conducting internal program improvement efforts. With larger N’s and more valid findings, ECCT leadership would be able to identify specific areas where improvement in teacher, parent or child outcomes is occurring and where it is not. This information is invaluable in strengthening and focusing staff supervision and training. Aside from the number of parents, children and teachers who complete pre and post tests, a data system that easily allows for ECCT managers and the evaluator to analyze the relationship between involvement in specific program components and the level of that involvement with child, teacher and parent outcomes would also enhance both program improvement and program evaluation. In the structured interview, ECCT leadership acknowledged that it would be beneficial to collect data more methodically and to use it in a cycle of inquiry focused on program improvement. Current practice is that data is primarily used for clinical purposes, meaning that the individual clinician or consultant uses client-level data in support of work with the individual client and data is not aggregated to analyze trends in client outcomes. ECCT leadership felt that the program is already stretched thin, with a large geographic service area and a waiting list and so the choice faced is to devote more resources to data collection and program improvement at the expense of maintaining service levels. North County Engagement/Penetration. In dialog with ECCT leadership, they shared that while not apparent from the data presented under EQ # I, ECCT has done a much better job of becoming integrated into the Coastside community than it has in North County. Indeed, with funding from the County, ECCT was able to expand its services in North County from just a mental health clinician, to a full (part-time) ECCT team. Evaluation Question # 7: What steps can be taken in the future to improve program services and what data could verify that these improvements had occurred?
19
The ECCT is clearly a well-managed, effective program that is of great benefit to the Coastside and North County communities it serves, nonetheless as with most any program, there are opportunities to improve operations and achieve still greater benefit. Recommendations identified in this evaluation are identified below. Staff transitions. Two manifestations of turnover impacted the ECCT, turnover within the childcare programs they served and staff transition within StarVista. From what was reported by leadership, transitions among the ECCT, were handled proactively and effectively. And while this is encouraging, this evaluation has found in virtually every PEI program a longstanding and serious crisis in trying to retain staff. The truth is that in a very expensive county in which to live and contracts that make it very difficult, if not impossible to raise wages sufficiently to be competitive with private sector or public agency salaries. As a result, community-based programs essentially serve as a minor league team, training staff who then leave for ‘the majors’ as soon as a position becomes available. It is a serious problem. While turnover among the staff at the childcare providers served by ECCT is certainly not something ECCT could prevent, it might be possible to create a kind of training for new staff at these centers that introduces them to managing challenging behaviors. In an early childhood program I evaluated ten years ago, the early childhood mental health team developed a video library of consultations and classroom demonstrations that were available both to new staff at each site as well as to more veteran teachers. Certainly such an initiative would require additional resources, but perhaps a grant or even funding from MHSA Workforce Education & Training could subsidize the project. This recommendation was made last year, but seems even more appropriate given another year in which transition in childcare staff was a significant problem. Clarification of ECCT roles and responsibilities in the context of the Kick-Off to Kindergarten program. As an outside evaluator, it is difficult to assess the degree to which the differences in perspective between ECCT leadership and the school district are bridgeable. The evaluator has a significant level of experience evaluating early childhood programs, having been the consultant to Oakland Unified School Districts Early Childhood Education program for five years and having evaluated the kind of early kindergarten program almost identical to Kick-Off-to Kindergarten. The value of such a program is very clear and it is identified as a best-practice, but to be effective, the teachers must be experienced working with five year old children or their frustrations over developmentally appropriate but challenging behavior simply will undermine the entire purpose of the program, to help young children become comfortable in a classroom setting. It might be useful for the school district and ECCT to identify a local child development specialist, perhaps through First 5, to facilitate a conversation about how to address both side’s concerns. In the absence of a shared understanding of how the program should operate, then sustaining ECCT involvement may be pointless.
Data Collection. While there are certainly resource issues in expanding data collection practices, there were some relatively low-cost strategies that were recommended last year that could have resulted in more useful data and create procedures for using that data in program improvement activities. The recommendations are repeated with additional comment from 2014-15 in bold italics.
Use a tickler system to notify clinical staff when a client has been engaged in service for 3 or 6 months and schedule post-tests at this time rather than waiting for a client to indicate their plan to exit the program. This practice would not just serve the evaluation and
20
program improvement efforts, but would also serve a clinical purpose, as it would inform the clinician as to client improvement and areas where improvement has not occurred. While this did not occur in 2014-15, it remains a valid recommendation and if implemented could increase the N for both assessment pre- and post-tests and satisfaction surveys from parents. This data could be very useful as satisfaction data can point to both program elements that were especially appreciated and barriers to effective service delivery that can be fixed. Development of a database system that aligns participation (units of service) with assessment data. With such a database, ECCT leadership could analyze what program strategies and treatment dosages elicit the biggest impact on outcomes. Is there a threshold level of engagement and program participation that is necessary to achieving positive outcomes? Given the low N of the program, it is possible that even with a sophisticated data base and a tickler system, this kind of analysis simply may not have the scale necessary to produce valid results. In conjunction with development of a database program that allows for easier analysis of the relationship between service dosage and changes in assessment results, ECCT should also create clear definitions for all services delivered so that no services are aggregated when they are analyzing or reporting data. Inadvertently, the evaluator may have contributed to the collapsing of several services into a single entry and this should be undone.
Expand use of satisfaction surveys. There were many missed opportunities for administering satisfaction surveys: 1) after school-based training or consultations, surveys could be administered with teachers participating in the training; 2) parent satisfaction surveys could be incorporated into the fabric of child-parent psychotherapy, play groups, and parent education with surveys used after 3-4 months of service engagement; 3) teacher satisfaction surveys should be continued as 14 of the 20 teachers involved in consultations in 2013-14 were surveyed, eliciting important information. Each of these recommendations remain valid in 2014-15. ECCT was able to sustain a high completion rate of teacher satisfaction surveys, a difficult task given the high turnover rate of teachers, but it didn’t administer parents surveys except to one parent. This needs to be improved. Create a very few data reports. Starting with only a very few data reports showing participation levels and one or two outcome reports, establish a quarterly or semi-annual cycle of inquiry process where ECCT teams review these reports and discuss their clinical or programmatic implications. Through this kind of process, an organization will quickly identify the benefit to this practice and either find internal resources to sustain the work or seek outside resources to support them. In an interview with the Program Manager for ECCT, shared that the program is seriously looking for ways to consolidate the number of tools used, not so much to allow for larger N in evaluations, but due to the challenge of having expertise across the agency in so many instruments.
North County Penetration. Last year, the evaluation recommended that an internal retreat to clarify purpose and North County engagement strategies precede outreach to North County Community Service Area leadership. The ECMHC Program Manager participated in the Northwest County Community Service Area (CSA) planning week, allowing her the opportunity to meet and work with community partners throughout the North County region. Building these relationships furthered an awareness of how
21
outreach within the North County might progress. Towards the end of the 2014-15 program year, we were able to have more stable staffing with regards to the consultation work, which presented additional opportunities to build relationships with community partners and develop a greater understanding of the needs of the North County. With both Daly City and South San Francisco communities accepted to participate in the first round of Big Lift funding, additional funding for consultation has become available and StarVista proposed through Measure A funds to add a part-time team (clinician, community worker/parent educator, and consultant) to round out the North County team and further enhance collaboration in this region. ECCT leadership has been extremely receptive and reflective throughout the evaluation process, acknowledging where data collection practices could be improved and open in revealing areas where they felt improvement in program could occur (e.g. Kick-Off to Kindergarten, North County penetration and data collection practices). Since 2013-14, ECCT has been able to expand services to North County, addressing one concern from last year. It has also increased the number of children/parents assessed with both pre and post-tests and the data from those assessments is very good, as was the teacher satisfaction data. All this data point to a program that is delivery highly impactful services to a population at high risk in an under-served community. It is puzzling why a program delivering such quality services could remain challenged in implementing just a few protocols (tickler system, schedule of post-tests) that would significantly improve data collection and provide ECCT with data that could lead to not just a more valid evaluation, but to the kind of data-informed inquiry that can help programs sustain and increase the quality of its services.
22

StarVista: Hotline & Crisis Intervention Evaluation Report PEI Evaluation Report 2014-15
Section I Agency & Program Description I.A. Description of Program Services Formerly known as Youth and Family Enrichment Services, StarVista came into being when Youth and Family Assistance and Family and Community Enrichment Services merged in 2003. StarVista offers counseling, prevention, early intervention and education resources and services to more than 34,000 people throughout San Mateo County every year. One of its programs is the Crisis Intervention and Suicide Prevention Center, a program comprised of a 24-hour phone Hotline, teen chat room, and a Youth Intervention Team that works primarily through schools countywide offering both crisis intervention services when a student is in crisis, training for school personnel and prevention education for thousands of middle and high school students. The Center is staffed by:
• Program Director (part-time, only 4 hours allocated per week), • Volunteer Coordinator (full-time), • Clinician (full-time) and clinical interns, • One AmeriCorps member (receives a stipend, Full-time), • Four overnight workers (each working less than 25 hours per week), and • A cadre of approximately 60 community volunteers who staff the hotline and Teen Chat Line.
StarVista Hotline StarVista manages and supports 41 Crisis Line Volunteers to run its 24/7 Crisis hotline and 19 youth volunteers for its Teen Crisis Chat room (with an adult supervising) who are very active and a number of others who are periodically active. The Chat Room is a facilitated discussion forum for youth to get support, discuss the issues they are facing. If someone is in crisis or needs individual support, they have access to a private chat feature where they can communicate with a peer counselor 1-on-1. The hotline is staffed 24-7 and is accredited by the American Association of Suicidology. AAS accreditation validates service delivery programs that are performing according to nationally recognized standards. Achieving AAS accreditation involves submitting a detailed report to the AAS and hosting a one or two day site visit during which an AAS. Once accreditation is achieved, agencies must submit an annual report verifying their continued compliance with AAS standards. Each agency is revisited and reaccredited every five years. StarVista is required to attend a minimum number of Annual AAS conferences, and pay yearly dues. Achieving AAS accreditation ensures the County that an outside, expert eye has examined StarVista operations and has met all AAS standards related to: volunteer training, curriculum, information shared with volunteers, hotline procedures and policies, how quality assurance is conducted, protocol for threat assessments, the outreach, presentations and education that is conducted, the teen Chat Room, and involvement in crisis response planning. The AAS panel was extremely impressed with the quality of work conducted by StarVista and received full accreditation as described in relation to Evaluation Question II.
• Administrative operations and organizational structure; • Screening, Training and Monitoring Crisis Workers; • General Service Delivery System; • Services in Life-Threatening Crises; • Ethical Standards and Practice; • Community Integration; and • Program Evaluation.

The Crisis Line program is overseen by the Volunteer Coordinator and a licensed clinician. The use of volunteers for crisis lines is routine throughout the State. A study, California Suicide Prevention Hotline Survey Report, conducted by the California Department of Mental Health found that 90% of hotlines surveyed deployed primarily volunteers with an average of 60 volunteers per crisis center with the volunteers trained and supervised by paid clinical staff. This is precisely the model utilized by StarVista.
Before taking a shift on the phone lines, each volunteer must participate in a 32-hour training that takes place four weeks. Volunteers are also required to participate in HIPAA and mandated reporter trainings. During the 32-Hour training, guest speakers with specialized expertise come from other community based organizations to provide most of the training. The training covers a number of crisis related topics including:
• Active Listening • Suicide Risk & Assessment • Alcohol and Drugs • Sexual Abuse, • Domestic Abuse • Parenting • Working with Youth • LQBTQ Issues • Stigma reduction • Lived Experience • Mental Health • Child and Elder Abuse and • Training in managing difficult cases.
In addition, training covers how to complete required paper and provides volunteers opportunities to role-play with each other. Once volunteers complete the training sequence, each volunteer picks up two observation shifts (each shift is 4 hours), during which they listen in on experienced Crisis Line counselors fielding calls. After they do two observation shifts they sign up for two active shifts where they pick up the lines with an experience volunteer guiding them and offering them feedback. Building upon the training, staff offers ongoing evaluations and constructive feedback. If the volunteer feels like they need more observation or active shift the Hotline offers additional support and training. Volunteers also receive support from staff during the week. StarVista usually has a staff member present from 9:00 am - 7:00 pm on weekdays. Staff is available to debrief, offer support, information and feedback. After-hours, the Hotline is operated by paid StarVista overnight staff. The Volunteer Coordinator is also on site weekdays and is able to monitor and gauge if a volunteer needs support. For non-weekday hours, StarVista provides a 24-7 licensed clinician on call and StarVista residential program that can also be a resource. Through this line, volunteers can reach a StarVista licensed mental health clinician to debrief or consult after a difficult call. Volunteers are also able to flag difficult calls in the StarVista database or write incident reports and get feedback on a specific call. When calls escalate - volunteers can check in with staff to see what steps need to be taken. Staff can also help with initiating emergency rescue/services e.g. welfare check filling CPS reports and follow up calls to callers who need additional support. Clinical staff also provide follow-up calls to callers who are in need.
2

StarVista evaluates each volunteer twice a year during which staff observes volunteer shifts and provides constructive feedback. Nineteen youth volunteers work in the Chat Room with a StarVista staff member supervising them at all times. Chat room supervisors offer support and guidance to other teens Monday and Thursday from 4:30pm to 9:30pm and during the summer on a varied schedule. It provides teens an opportunity to engage in group chats to discuss more general issues of concern, while also allowing for private 1-1 chats with a peer counselor.
Youth Intervention Team As part of this contract, StarVista also operates a Youth Intervention Team housed at the Crisis Intervention and Suicide Prevention Center. The Team is led by the Prevention Program Director and Prevention Center Clinical Supervisor and supported by an unlicensed intern. The team responds to requests from schools, providing crisis intervention services to youth (which can include short-term counseling for youth in crisis), consultation and training to school staff, and provision of referrals for youth and families as clinically indicated. The YIT also provides educational presentations for middle school and high school students focused upon identifying signs of suicide risk in youth, suicide prevention strategies, and to de-stigmatize behavioral health conditions. This is done by the Youth Outreach Team, an AmeriCorps member. The team also also offers training to school personnel. The Team can make referrals to the mental health system through the ACCESS Team. As a member of the BHRS Community Response Team, StarVista attends related meetings and trainings, and is available to respond to community crises, although even in the event of a community crisis like the San Bruno fire, the Crisis Team tends to operate mostly from affected schools. I.B. Research Basis for Approach
The clearest measure of a crisis hotline intervention effectiveness would be a follow-up study of all crisis callers to determine whether they continued to have suicidal thoughts after calling the crisis hotlines, or in the worst case scenario, died by suicide. These studies, however, are difficult to conduct given the sheer volume of individuals who call the crisis hotlines, privacy concerns, and the difficulty in extracting follow-up contact information when an individual is in crisis. The best proxy of crisis hotline effectiveness in saving lives can be found in a 2007 study by Gould and Kalafat, et al.1 – this study found that seriously suicidal individuals reached out to telephone crisis services and that significant decreases in suicidality were found during the course of the telephone sessions, with continuing decreases in hopelessness and psychological pain in the following weeks. In addition, anecdotal evidence by crisis center staff who were interviewed for the survey as part of the study showed that callers responded positively to the counseling and the resources provided to them for aftercare.
I.C. Target Population, Number Served and Sites The target population for the Hotline is anyone who is experiencing crisis and as described below, clients call for a wide range of reasons with varying levels of crisis from being at extreme risk of suicide, to seeking resources and supports for a wide variety of reasons. Volunteers at the Hotline report also having ‘regular’ callers who call frequently and come to rely upon volunteers to provide support. Volunteers reported that in most instances, these callers are very isolated socially and their contacts are critically important to them. The YIT targets middle and high school youth throughout the County and
1 Gould MS, Kalafat J, et al. (2007). An Evaluation of Crisis Hotline Outcomes Part 2: Suicidal Callers. Suicidal and Life‐Threatening Behavior, 37(3): 338‐ 352
3

responds to youth in crisis or at risk of suicide and provides education to middle and high school youth throughout San Mateo County. Since psychological crises cross all class and ethnic boundaries, the program does not target specific.
4

Section II Evaluation Process The evaluation plan was developed in June-July 2013 through a series of meetings with Director of Wellness and Recovery Services, Stephanie Weisner and former Program Director of the Crisis Intervention Suicide Prevention Center, Julie Kinloch. (The new Program Director Narges Dillon was also involved). The evaluation plan was then updated in July and August 2014 with Julie Kinloch and Sarah George being the Hotline staff primarily involved. Plans were made to provide data on the number of hotline calls and the number of school and community interventions where Crisis Center clinicians provided support during immediate crises or in the aftermath of school or community trauma. To measure satisfaction with the program and to get a view of the perceived impact that the crisis hotline had on callers, a survey was developed for volunteers. A separate survey of callers was also conducted, along with an online survey for school personnel involved in StarVista crisis interventions. In addition, findings from a 2015 accreditation report prepared by the American Association of Suicidology was reviewed. Finally, structured interviews were conducted with:
• Narges Dillon, new and current Program Director; • Stephanie Weisner, Wellness and Recovery Department Director; and • Two school-site personnel, one Student Services Director and one Principal (identities not
disclosed to protect the identities of students discussed in these interviews). Early in evaluation design discussions it became clear that pre-post test assessments, such as those used in most of the PEI programs, were unrealistic as neither the crisis hotline program nor the school-community intervention services sustained long-term involvement with clients. The contract for Crisis Hotline services did not delineate specific numbers of anticipated calls, trainings, or school-community interventions. Nonetheless, with the data above, it was possible to assess the scope of services delivered, the satisfaction with services from the perspective of the school, those calling the hotline, and the volunteers who staff it. So while pre-post tests were not practical, a view of the impact of services was gleaned from these data sources. Lastly, as data was being reviewed, discussions with the Clinical Director resulted in opportunities to better assess the impact of crisis intervention services in 2014-15 via the use of an online survey that remained open throughout the year, enabling school personnel to describe its experience with the crisis intervention team, their satisfaction with its operations, and their perceptions as to the impact the interventions have had on the student(s) in crisis, school personnel supporting those students and the general school community. Section III Evaluation Findings There are seven evaluation questions that frame the evaluation of the Prevention & Early Intervention programs supported with Mental Health Services Act funds.
Evaluation Question # 1: Has the intervention/ program been implemented efficiently and according to the contract funding the program? Evaluation Question # 2: Has the program implemented effective program strategies? i.e. Is the program well-designed and achieving a desired impact? Evaluation Question # 3: Have clients, families, partners, and/or communities been satisfied with services?
5
Evaluation Question # 4: Have program services been responsive to the population targeted by the contract? Evaluation Question # 5: To what degree has the program advanced the vision, mission and objectives of the MHSA PEI plan? Evaluation Question # 6: What factors have impeded or contributed to successful implementation? How? Evaluation Question # 7: What steps can be taken in the future to improve program services and what data could verify that these improvements had occurred?
The review of StarVista data leaves little doubt that both program components, the Crisis Hotline (including the teen chat room) and the Youth Intervention Team has operated with a high level of efficiency and positive effectiveness, responding to crisis calls on the Hotline 24-7 every day of the year and responding every school request for crisis support promptly. The impact of both services components is also clear. While tracking the long-term outcomes of Crisis Hotline services is identified in the research as being impractical without a very expensive evaluation, an exceedingly high percent of Hotline volunteers surveyed indicated that they felt that they had had a very important and positive impact upon callers who were in crisis. In addition, the California Suicide Prevention Network (CSPN) conducted two months of random surveys of Crisis Hotline callers and this data also describes callers as being highly satisfied with the hotline services, that the services had been positive and that they would utilize the service again if they had problems. StarVista also provided specific data on the scope of school training and school interventions delivered during the program year. While there was no stipulation in the contract delineating an objective for the numbers of schools served, it is clear that the YIT responded promptly to all calls and delivered training to many schools and intervened in 28 crises at schools where a student was either in immediate risk of suicide or where a school was grieving over the loss of a student. While there was less quantitative data supporting the impact of these services, a survey of school personnel and interviews with other personnel where YIT services were delivered make it clear that these services are both highly valued and respond to situations where there really is no other option for schools in crisis to obtain immediate intervention or consultation to support students in crisis. Through the evaluation process, StarVista and the evaluator identified ways in which more data could be obtained from schools via an online survey that would be posted and open all program year. As a part of end of an intervention process, the crisis team intern or clinician would ask the school contact person to complete the brief survey. While this would provide yet another form of data validating the impact of StarVista’s Crisis Intervention and Suicide Prevention Center, even without it there is ample evidence of it effectiveness and impact of Center and of the satisfaction of those served by the Center. Each evaluation question is discussed separately below. Evaluation Question # 1: Has the intervention/ program been implemented efficiently and according to its contract? To answer Evaluation Question # 1, the evaluator was provided data on the number of crisis calls fielded by month, the number of crisis interventions conducted at schools, and the number of trainings provided throughout the year. Since there were no projected numbers to be served referenced in the contract, the analysis below does not reflect a comparison with a contract-specified projected productivity totals.
6

In terms of crisis calls, Table I, on the following page, provides the number of crisis calls fielded by month for both 2013-14 and 2014-15. As can be seen, just under 15,000 calls were received during each program year, with an average of almost 1250 calls per month in 2013-14 and about 50 less calls per month in 2014-15. Interestingly, in both years July had by far the largest number of calls received. As a point of comparison, Contra Costa County has a population of 1.05 M residents, almost 50% more residents than live in San Mateo County (718,000). Contra Costa County’s countywide crisis line receives 1150 calls per month, 50-100 fewer calls than does StarVista.2
In addition to operating a Crisis Hotline, the Crisis Center also operated a Teen Chat Room that operated Monday through Thursday from 4:30-9:30 and on a more irregular schedule during the summer. This Chat Room is staffed by up to 19 teen volunteers, supervised by a StarVista Youth Outreach Coordinator, the AmeriCorps' staff. The Clinician and Coordinator also provide on-going support. In 2013-14, Chat Room Peer Counselors provided 159 private chats and the Chat Room website had 546,570 hits. In 2014-15 StarVista experienced a 10% increase in the number of private chats (174) and achieved over 840,000 website hits, a 50% increase from 2013-14. According to the Clinical Director, ‘chats’ are teens have been expressing a preference for texting and so StarVista is exploring how to develop texting chats to better respond to how teens want to communicate. As a result of this suggestion, StarVista submitted a letter of intent to develop a texting capacity, to post on Instagram, and to otherwise expand social media activity. The county was impressed with the LOI and has agreed to develop an RFP for this work.
Suicide Prev. Presentation for Middle and High School Students. The Crisis Center also provides crisis intervention and training in suicide prevention, largely in response to calls from schools throughout the County. Based upon data provided by StarVista, the Crisis Center provided the following training and education services.
As Table II illustrates, StarVista delivered twice the number of prevention presentations as in 2013-14 and reached almost 1200 more students than in 2013-14. Data is presented on the effectiveness of these presentations under Evaluation Question II, below. In 2014-15, StarVista
also presented community-based presentations in every month except September with a total of 495 individuals participating, an increase over the total reached over four times the number reached in 2013-14 (120). In addition to the above, StarVista’s Youth Outreach Team (part of the Youth Intervention Team (YIT)) conducted crisis intervention services where either an individual student was experiencing an immanent
2 California Suicide Prevention Hotline Survey Report, Office of Suicide Prevention, California Department of Mental Health, January 2011.
Table I: Crisis Calls Month 2014-
15 2013-
14 July 1548 1657 Aug 943 1369 Sept. 965 1312 Oct. 1477 1279 Nov. 1023 1093 Dec. 1389 990 Jan 967 1328 Feb. 1015 1184 Mar. 1091 1257 Apr. 1109 1275 May 1485 1275 June 1225 946 Total 14,237 14,965 Ave. 1186 1247
Table II: School Prevention Presentations 2013-14 2014-15 One-Hour Presentations 61 123 Students Served 2494 3617 Schools Served 14 11 School Districts Served 9 6
7
risk of suicide or where a student, group of students or an entire school had been exposed to serious individual or schoolwide trauma. In 2014-15, StarVista conducted 31 such interventions, with 151 follow up sessions and 66 collateral contacts. This also represented a significant increase from 2013-14 when 21 consultations were conducted. Finally, StarVista also conducted phone consultations and case management support to 32 individuals in crisis involving 79 follow-up services. It is important to note that in each of the YIT crisis interventions, as well as in the phone consultations, StarVista is delivering urgently needed supports at moments of extreme crisis. While there were no service levels projected in the StarVista contract, the data above reflects a program that is consistently responsive to all demands for its services and that the Crisis Center staff and volunteers of the Hotline, Teen Chat Room, and youth crisis intervention team delivered services both efficiently and effectively.
Evaluation Question # 2: Has the program implemented effective program strategies? i.e. Is the program well-designed and achieving a desired impact? As summarized in Section I.B., evaluating outcomes from crisis hotlines is an extremely difficult challenge, far beyond the scope of this evaluation. While it would be desirable to track future caller suicide rates, use of psychiatric emergency services or other crises services, or utilization of services to which the caller was referred by the phone counselor, these measures would require a very elaborate evaluation design. Further, the real purpose of a hotline is to provide immediate, short-term support in moments of significant personal crisis, not to provide an ongoing therapeutic intervention where reduction of utilization of crises services might be a realistic impact. However, the Crisis Intervention and Suicide Prevention Center assembled a range of data sources that allowed the evaluator to easily assess the impact this program has had on local schools, communities and individuals in crisis. In assessing the Center’s impact, the evaluation has examined a number of forms of data including:
• A review of the American Association of Suicidology’s (AAS) 2015 accreditation report;
• Crisis line volunteer surveys asking volunteers about their experience handling crisis calls (some responses in this survey are used to assess satisfaction with StarVista training, supervision and support);
• Teen Chat Line survey results; • Survey and structured
interviews with school personnel served by the Youth Outreach Team;
• Survey of students participating in suicide prevention presentations; and • Caller survey data since the questions involved in the survey directly relate to the degree to
which the caller felt helped by their conversation with the phone counselor.
“Star Vista Crisis Intervention and Suicide Prevention Center is one of the oldest suicide prevention hotlines in California. While its name has changed over the years, it is clear that the dedication and commitment to suicide prevention in San Mateo County by the agency staff has not. Despite a modest budget, the program management and line staff appear to be enthusiastic, multi-tasking team members who provide a substantial amount of crisis services to the community. They have clearly worked hard to sustain and grow this program over the years. Their commitment to quality services is evident as they meet the standards for Accreditation by the American Association of Suicidology.”
Closing Statement to AAS accreditation report, 2015.
8
AAS Accreditation Report The report was completed on April 24, 2015, aside from the pull-quote above right which served as the concluding remarks to the Accreditation Report, AAS included observations, not just on the hotline and chat room, but on StarVista’s prevention presentations at schools and the community, its crisis response team, the Youth Outreach Team, and upon its participation in a range of countywide planning and service delivery initiatives. It is important to note, that achieving AAS accreditation is a very high bar and that a team of expert suicidologists spent a full day at StarVista to conduct this review. Participating in the review from StarVista: Department Director (Stephanie Weisner), Program Director (Narges Dillon), Program Coordinator (Rahael Solomon), Mental Health Clinician and Supervisor (Sarah George), Outreach Coordinator (David Zarubin), Clinical Director (Clarise Blanchard) and 4 volunteers (Stacy Gebhardt, Jenny Miller, Wendy Chan and Linda Friedlin.). StarVista Board President Lesley Martin also came to meet with AAS staff and share how the agency supports the Crisis Center. The reviewer from AAS was there all day reviewing records, interviewing staff and volunteers, observing the crisis line operations and even making calls to the hotline pretending to be individuals in crisis. As such, the depth of review conducted by the AAS Team goes well beyond what could have been conducted within the scope of this evaluation and their observations should be viewed as being highly valid. The following excerpts are provided as:
• Trainers have extensive experience and a host of subject-matter experts are used to train in specialties. Most trainers have evidence-based trainer certificates such as in ASIST, Mental Health First Aid, and QPR.
• The program monitors volunteers through listening in while in training and then during shifts
with supervisors. The program has just acquired the capability of silent monitoring and possibly recording phone calls
• Star Vista's Crisis Center has an annual budget of approximately $370,000. About $60,000 of
that budget will be ending with the end of the Cal MHSA grant but the crisis center staff is certain the overall agency will find a way to continue the program. The Crisis Center is hopeful about a grant application to provide back-up phone services for several counties. The current budget is low compared to many crisis centers and would appear to put the program at risk unless additional revenue is found. The program seems to run so well due to the dedication of many veteran staff who appear to both work well together and who serve a variety of positions within the program.
• The Crisis Center does not operate walk-in hours but goes one better in responding promptly to
requests from schools for suicide assessment at the school location during business hours. The Crisis Center does provide follow-up phone services for the hotline.
• Star Vista Crisis Center prides itself on its community outreach, especially to schools, and is
always working on additional ways to reach underserved community groups. Star Vista is unique in delivering on-site suicide assessments and intervention to schools on demand.
• Volunteers appear well trained in the use of crisis intervention and suicide prevention skills, thus
reducing the need for rescue and active intervention. The amount of community education
9
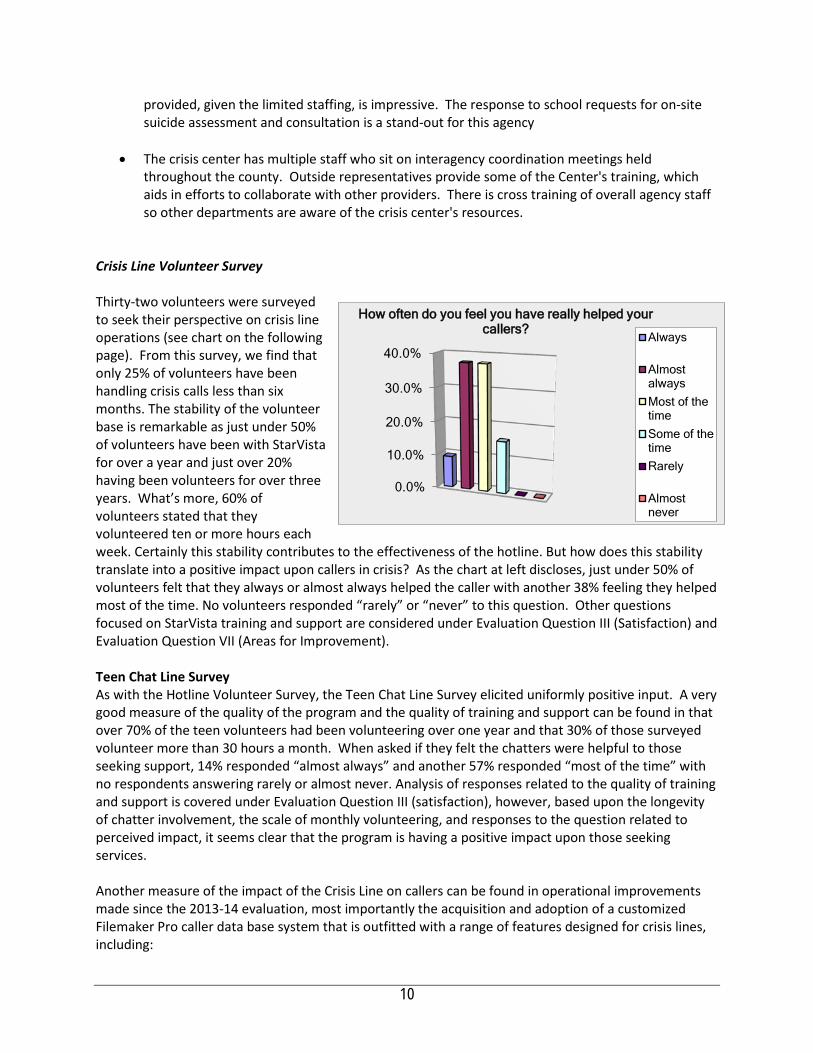
provided, given the limited staffing, is impressive. The response to school requests for on-site suicide assessment and consultation is a stand-out for this agency
• The crisis center has multiple staff who sit on interagency coordination meetings held
throughout the county. Outside representatives provide some of the Center's training, which aids in efforts to collaborate with other providers. There is cross training of overall agency staff so other departments are aware of the crisis center's resources.
Crisis Line Volunteer Survey Thirty-two volunteers were surveyed to seek their perspective on crisis line operations (see chart on the following page). From this survey, we find that only 25% of volunteers have been handling crisis calls less than six months. The stability of the volunteer base is remarkable as just under 50% of volunteers have been with StarVista for over a year and just over 20% having been volunteers for over three years. What’s more, 60% of volunteers stated that they volunteered ten or more hours each week. Certainly this stability contributes to the effectiveness of the hotline. But how does this stability translate into a positive impact upon callers in crisis? As the chart at left discloses, just under 50% of volunteers felt that they always or almost always helped the caller with another 38% feeling they helped most of the time. No volunteers responded “rarely” or “never” to this question. Other questions focused on StarVista training and support are considered under Evaluation Question III (Satisfaction) and Evaluation Question VII (Areas for Improvement). Teen Chat Line Survey As with the Hotline Volunteer Survey, the Teen Chat Line Survey elicited uniformly positive input. A very good measure of the quality of the program and the quality of training and support can be found in that over 70% of the teen volunteers had been volunteering over one year and that 30% of those surveyed volunteer more than 30 hours a month. When asked if they felt the chatters were helpful to those seeking support, 14% responded “almost always” and another 57% responded “most of the time” with no respondents answering rarely or almost never. Analysis of responses related to the quality of training and support is covered under Evaluation Question III (satisfaction), however, based upon the longevity of chatter involvement, the scale of monthly volunteering, and responses to the question related to perceived impact, it seems clear that the program is having a positive impact upon those seeking services. Another measure of the impact of the Crisis Line on callers can be found in operational improvements made since the 2013-14 evaluation, most importantly the acquisition and adoption of a customized Filemaker Pro caller data base system that is outfitted with a range of features designed for crisis lines, including:
0.0%
10.0%
20.0%
30.0%
40.0%
How often do you feel you have really helped your callers?
Always
AlmostalwaysMost of thetimeSome of thetimeRarely
Almostnever
10
• The Home Page includes important updates that volunteers and staff have to be looked at
before logging in. When a volunteer logs in he/she must first look at recent High risk callers these are callers that have been identified to be low, medium, high lethality. Volunteer is able to look at call notes. (see if their safety plan, support network in place, what worked for the caller etc.)
• File maker pro also makes it easier to keep tabs on Banned caller's and abusive callers as this list is also on the home page.
• Volunteers are able to flag calls that they would like staff to review, facilitating staff giving volunteer feedback via file maker pro (FMP) regarding a specific call. The volunteer can review feedback next time they log in.
• The most impressive feature is a thorough Suicide Risk assessment built into the system. Once the volunteer indicates that the caller has low, medium, or high lethality. The volunteer is redirected to the suicide risk assessment tab. That offers step-by-step prompts to complete a lethality assessment (this assessment includes: do they have thoughts of suicide, plan, means, access to means, how lethal are the means, when, recent losses, past suicide attempts, 5150's, recently been discharged from PES, drug use, mental health diagnosis etc.) In line with evidence based practices the volunteer has to rate the callers’ suicidal intent from 1 -5 scale at the beginning and end of the call. This is made mandatory to do in the database and staff/volunteer cannot move forward without filling it out.
• A Suicide Safety Plan also lights up when caller is low-medium or high lethality. Volunteer have access to questions that help them get the caller to contract for safety e.g. (5 steps: disable suicide plan, develop safety plan, explore internal coping strategies, social support and Link to previous or new resources.
• More accurate call logs: volunteers can look up caller profile use number, name or characteristics. e.g. if the data base doesn't have a name for the caller, the volunteer can type in other identifiers like, caller had an Australian accent. Volunteer can view caller profiles and select a match.
• More detailed caller profiles: Helps volunteers have easy access to important information when talking to callers: directives (what helps), background, characteristics, self care, living situation, marital status, employment, pets, suicide attempts, reported diagnosis, medication, drug use and history of mental health services. All this information is helpful when assessing callers’ safety and resources.
• FileMakerPro also requires volunteers to complete all call notes info and demographic data in order to get a complete call. If volunteer has an incomplete call, they wont be able to log out of FileMakerPro (FMP) database. This feature leads to more and better demographic data and details accounts of crisis line calls.
• FMP also has an information section to look at tips on how to deal with challenging callers e.g. sex callers, prank callers and fantasy callers.
Taken together, the incorporation of the FMP system gives the Crisis Line and its volunteers a much more effective and efficient protocol for managing calls, accessing resources and supports, and collecting information. Survey and Structured Interviews of School Personnel Served by the Youth Intervention Team StarVista also operates a mobile Youth Intervention Team that responds to calls from schools throughout the County. Three sources of data were used to assess the impact of the team: 1) results
11

from an online survey completed by two school administrators; 2) interviews with a school administrator; and 3) a structured interview with the intervention team’s clinical supervisor which elicited detailed descriptions of how the team has operated and where it has had a significant impact. While the survey of school personnel was completed by only four staff members from different schools, the responses to the Likert Scale forced choice questions elicited almost unanimous satisfaction with the services with 100% of respondents indicating that StarVista support was important to achieving positive outcomes in the crisis and 100% also stating that services received were helpful in resolving the immediate situation. Seventy-five percent of respondents felt that the YIT responded promptly to the request for services. See above left and below right for quotes excerpted from these open-ended questions. To probe a bit more deeply into how the YIT operated, a structured interview with Student Service Directors, school Principals, and site-based counselors. To protect the identify of the students involved, school personnel are not identified, nor are the schools, but the details offered are typical of the kinds of situations StarVista’s YIT addresses. In October 2015, at one San Mateo County middle school there was a gun incident on campus involving a significant number of kids, with some having no pre-history of violence or even behavioral incidents
and others involving students who could go either way. The incident was triggered by a threat from a gang from a neighboring county due to a San Mateo middle school student dating someone from another gang. The brother of the targeted student came to campus with a gun in his backpack and gave it to his brother, who then gave it to someone else when the
police arrived. Eventually, the gun was retrieved, but half-dozen students were identified as having been involved and school districts have strict policies about guns on campus. The lives of all these students could have been seriously derailed and several of them were excellent students with very little to suggest that they were a threat: In a moment and without any pre-thought: they grabbed a backpack; they protected their friend or brother; they made mistakes. The targeted younger brother was a straight A student with no real record of trouble or gang involvement, but suddenly was facing expulsion. StarVista sent an advocate to explain the situation to the family and advocated for all the students. Some were suspended and/or transferred to other schools, but none were expelled. StarVista counseled both the targeted child and his single mom and helped him enroll in an opportunity school and get involved in extra curricular activities before transferring to a new school. For all the students who transferred, StarVista met with the kids, their parents and the new school to help with the transition, an especially difficult time for all involved. New school personnel were going to be watchful, the student would feel this and was also navigating new relationships with unfamiliar peers. StarVista was there to support the school, the parents and the children in these challenging weeks and months. Over a year later, none of the kids have been involved in future gang activity or otherwise been disciplined significantly. It could
“The Crisis Counselor really helped the girl have an outlet and get some counseling. StarVista also consulted with us and assessed her likelihood of self-harm. We created a plan to support her. As a result, and she finished the year well.”
“StarVista plays a critical role throughout our district, transforming potentially catastrophic situations, from a punitive moment to a healing and transformative moment. Many lives are restored through their work. These are just two examples.” Student Services Director
12
have played out very differently and StarVista played a key roll in helping all involved reach a positive resolution. In another incident this year, a student with a long record of being in trouble brought a knife to his after school program, showing it to some students and with some suggestion that he may have threatened a student. He was kicked out of the after school program and received a five-day suspension from school. Bringing a knife to an afterschool program and possibly threatening a student when you already have a long list of behavioral issues, is a serious offense and the five-day suspension was hardly an over-reaction by the school. But look at how this plays out for a struggling family. The single mom works 12 hours a day as a housekeeper and she is inconsolable. She can take her son to work with her for five days but if he isn’t in an afterschool program she is convinced the lack of supervision will drive him into the wrong circles. She senses that this could be a defining moment in the life of her son. She is monolingual Spanish, doesn’t have time or knowledge of how to navigate the school district policies or advocate for her son. The school contacted StarVista who then came to the house and engaged the family, going well above and beyond to make sure the family understood that there was a way to make this work. They could perhaps get their son back into the afterschool program, but that the pre-condition was family counseling. StarVista didn’t just give the family a phone number. They met with the family several times, advocated with the after school program director, promised sustained support and counseling and got the boy back into school and the after school program. Given that the mom had always resisted counseling, the boy might well have been headed for more serious trouble in any case, but the knife incident coupled with StarVista’s intervention and support, got the child back on track. To get the perspective of a school principal, the evaluator reached out to a Principal for a San Mateo County elementary school. She shared that until recently the only school-based program at their school was the YIT, so they have called upon them often, perhaps 4-5 times a year. Often the calls related to a student who was identified as cutting themselves or threatening suicide. The counselor expressed a very high level of satisfaction with the YIT, describing them as quick to respond and able to deliver a range of services responsive to each situation. The principal described how schools without school-based clinicians or social workers are often in the dark when working with children suffering from trauma or depression as a very distraught child may not emote signs that suggest the depth of their trauma and with cases in which the trauma is obvious, school personnel are simply not equipped to help the child. The principal explained that this is where the YIT comes in, conducting assessments, and working with the school, the child and the family to get to the source and depth of the issue and provide immediate services until the crisis is lessened and a more permanent treatment relationship can be formed. For example, at the end of last school year a kid was having serious problems at home and the child was refusing to go home. The YIT intervened, conducted a home visit, and finding cause for concerned, contacted Children’s Protective Services. With their involvement, the child was quickly placed in a relative’s home with supportive counseling provided by StarVista. In another instance, two elementary school brothers witnessed the murder of their cousin’s newborn child in their home. Clearly, such an event caused serious trauma and could have resulted in these children that could have resulted in significant PTSD or other forms of trauma. In this instance the school had a school-based social worker who immediately contacted the YIT. StarVista provided different counselors for each child and worked with each for several months. Both children were able to remain in school and have stabilized. The school and parents also know who to call in the event that either child begins to experience trauma related to the event.
13
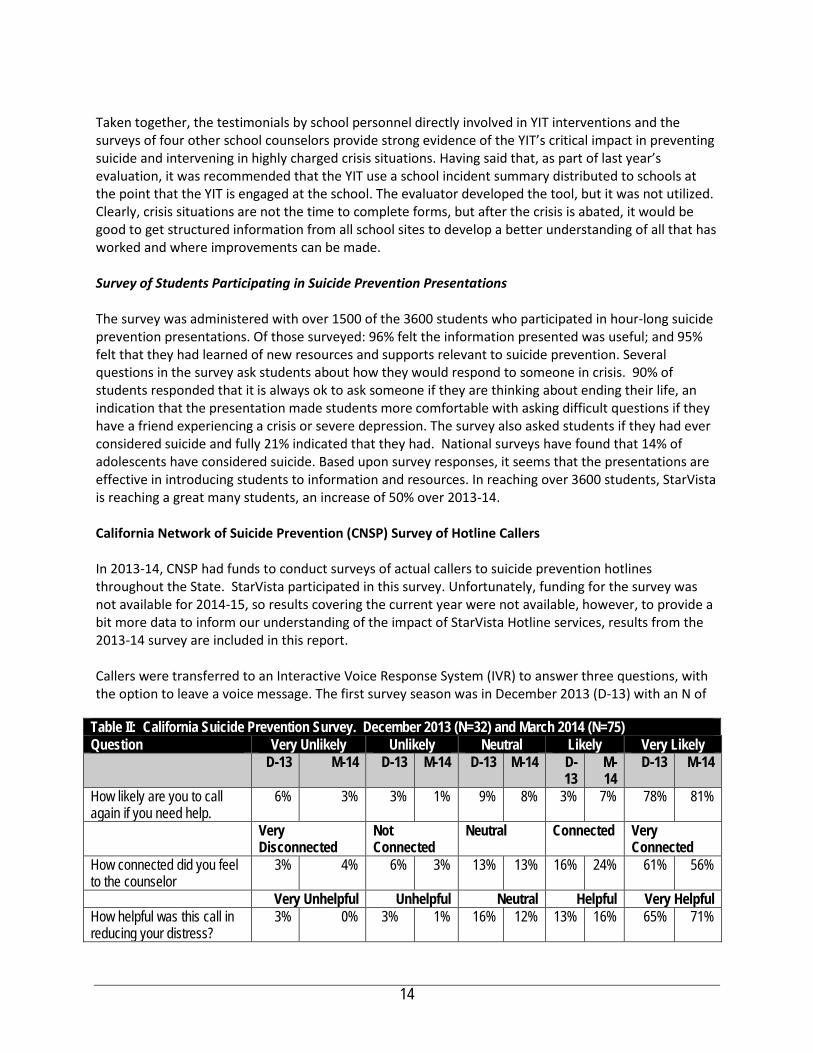
Taken together, the testimonials by school personnel directly involved in YIT interventions and the surveys of four other school counselors provide strong evidence of the YIT’s critical impact in preventing suicide and intervening in highly charged crisis situations. Having said that, as part of last year’s evaluation, it was recommended that the YIT use a school incident summary distributed to schools at the point that the YIT is engaged at the school. The evaluator developed the tool, but it was not utilized. Clearly, crisis situations are not the time to complete forms, but after the crisis is abated, it would be good to get structured information from all school sites to develop a better understanding of all that has worked and where improvements can be made. Survey of Students Participating in Suicide Prevention Presentations The survey was administered with over 1500 of the 3600 students who participated in hour-long suicide prevention presentations. Of those surveyed: 96% felt the information presented was useful; and 95% felt that they had learned of new resources and supports relevant to suicide prevention. Several questions in the survey ask students about how they would respond to someone in crisis. 90% of students responded that it is always ok to ask someone if they are thinking about ending their life, an indication that the presentation made students more comfortable with asking difficult questions if they have a friend experiencing a crisis or severe depression. The survey also asked students if they had ever considered suicide and fully 21% indicated that they had. National surveys have found that 14% of adolescents have considered suicide. Based upon survey responses, it seems that the presentations are effective in introducing students to information and resources. In reaching over 3600 students, StarVista is reaching a great many students, an increase of 50% over 2013-14. California Network of Suicide Prevention (CNSP) Survey of Hotline Callers In 2013-14, CNSP had funds to conduct surveys of actual callers to suicide prevention hotlines throughout the State. StarVista participated in this survey. Unfortunately, funding for the survey was not available for 2014-15, so results covering the current year were not available, however, to provide a bit more data to inform our understanding of the impact of StarVista Hotline services, results from the 2013-14 survey are included in this report. Callers were transferred to an Interactive Voice Response System (IVR) to answer three questions, with the option to leave a voice message. The first survey season was in December 2013 (D-13) with an N of
Table II: California Suicide Prevention Survey. December 2013 (N=32) and March 2014 (N=75) Question Very Unlikely Unlikely Neutral Likely Very Likely D-13 M-14 D-13 M-14 D-13 M-14 D-
13 M-14
D-13 M-14
How likely are you to call again if you need help.
6% 3% 3% 1% 9% 8% 3% 7% 78% 81%
Very Disconnected
Not Connected
Neutral Connected Very Connected
How connected did you feel to the counselor
3% 4% 6% 3% 13% 13% 16% 24% 61% 56%
Very Unhelpful Unhelpful Neutral Helpful Very Helpful How helpful was this call in reducing your distress?
3% 0% 3% 1% 16% 12% 13% 16% 65% 71%
14
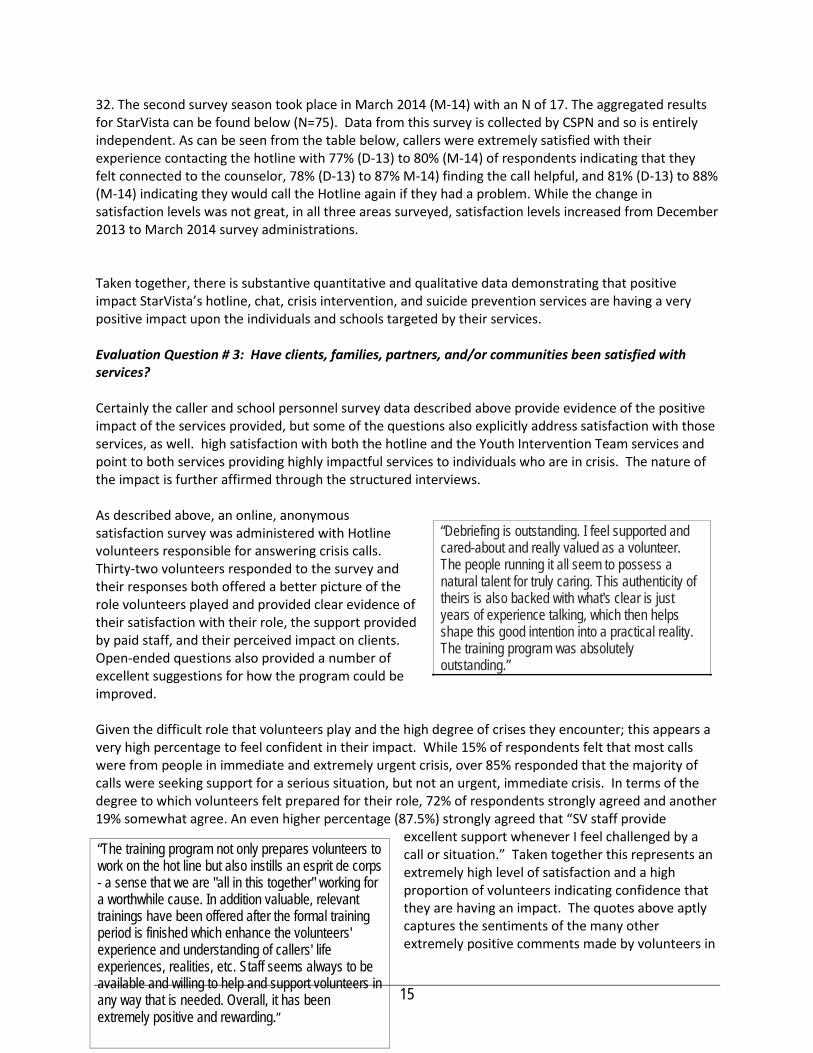
32. The second survey season took place in March 2014 (M-14) with an N of 17. The aggregated results for StarVista can be found below (N=75). Data from this survey is collected by CSPN and so is entirely independent. As can be seen from the table below, callers were extremely satisfied with their experience contacting the hotline with 77% (D-13) to 80% (M-14) of respondents indicating that they felt connected to the counselor, 78% (D-13) to 87% M-14) finding the call helpful, and 81% (D-13) to 88% (M-14) indicating they would call the Hotline again if they had a problem. While the change in satisfaction levels was not great, in all three areas surveyed, satisfaction levels increased from December 2013 to March 2014 survey administrations. Taken together, there is substantive quantitative and qualitative data demonstrating that positive impact StarVista’s hotline, chat, crisis intervention, and suicide prevention services are having a very positive impact upon the individuals and schools targeted by their services. Evaluation Question # 3: Have clients, families, partners, and/or communities been satisfied with services? Certainly the caller and school personnel survey data described above provide evidence of the positive impact of the services provided, but some of the questions also explicitly address satisfaction with those services, as well. high satisfaction with both the hotline and the Youth Intervention Team services and point to both services providing highly impactful services to individuals who are in crisis. The nature of the impact is further affirmed through the structured interviews. As described above, an online, anonymous satisfaction survey was administered with Hotline volunteers responsible for answering crisis calls. Thirty-two volunteers responded to the survey and their responses both offered a better picture of the role volunteers played and provided clear evidence of their satisfaction with their role, the support provided by paid staff, and their perceived impact on clients. Open-ended questions also provided a number of excellent suggestions for how the program could be improved. Given the difficult role that volunteers play and the high degree of crises they encounter; this appears a very high percentage to feel confident in their impact. While 15% of respondents felt that most calls were from people in immediate and extremely urgent crisis, over 85% responded that the majority of calls were seeking support for a serious situation, but not an urgent, immediate crisis. In terms of the degree to which volunteers felt prepared for their role, 72% of respondents strongly agreed and another 19% somewhat agree. An even higher percentage (87.5%) strongly agreed that “SV staff provide
excellent support whenever I feel challenged by a call or situation.” Taken together this represents an extremely high level of satisfaction and a high proportion of volunteers indicating confidence that they are having an impact. The quotes above aptly captures the sentiments of the many other extremely positive comments made by volunteers in
“The training program not only prepares volunteers to work on the hot line but also instills an esprit de corps - a sense that we are "all in this together" working for a worthwhile cause. In addition valuable, relevant trainings have been offered after the formal training period is finished which enhance the volunteers' experience and understanding of callers' life experiences, realities, etc. Staff seems always to be available and willing to help and support volunteers in any way that is needed. Overall, it has been extremely positive and rewarding.”
“Debriefing is outstanding. I feel supported and cared-about and really valued as a volunteer. The people running it all seem to possess a natural talent for truly caring. This authenticity of theirs is also backed with what's clear is just years of experience talking, which then helps shape this good intention into a practical reality. The training program was absolutely outstanding.”
15

response to an open-ended question about what how the program could be better. Volunteers were not reluctant to share their views as to how the program could be improved and these comments are discussed under Evaluation Question VII. The survey of Chat Room volunteers also provided insight into satisfaction with the Chat Room service and StarVista training and support for volunteers. When asked how strongly they agreed with the statement: StarVista staff provide excellent training to prepare you for your Chat Room role, over 70% strongly agreed and another 15% somewhat agreed. When asked how strongly they agreed with the statement: StarVista staff provide excellent support whenever I am feeling challenged, 72% strongly agreed and all of the remaining respondents indicated that they somewhat agreed. Chat Room volunteer respondents also provided numerous specific open-ended praise, including this comment that was typical: “They have a great staff and volunteers who help whenever I’m struggling to help the chatter. The environment is very safe and open which is nice.” The large number of positive comments about staff support, training and volunteer camaraderie in both expressed by both the Hotline and Chat Room volunteers along with the thoughtful, constructive suggestions (see EQ VII), are indicative of a well-managed program that despite operating in extremely stressful contexts, has achieved a very positive moral among the volunteers. The extremely high reviews of the suicide prevention presentations from 1500 students is another indicator of community satisfaction with StarVista’s suicide prevention services and the qualitative data provided through structured interviews with school personnel who have partnered with the YIT during times of crises, provided still more evidence of client impact and satisfaction with services. Evaluation Question # 4: Have program services been responsive to the population targeted by the contract? StarVista provided significant and varied forms of highly affirmative data verifying the degree to which the Hotline program responded to the needs of both the volunteers and callers in crisis. Volunteers felt well-trained and callers felt that they were heard and supported by those volunteers. While there was less evidence from the schools and none from those directly served by the Youth Intervention Team, the survey and interviews with school personnel and the interview with the clinical director provided ample evidence that this program was also meeting the needs of the intended population. EQ # 6 and 7 provide suggestions as to how the intervention program could gather more data on school personnel satisfaction with both training and intervention support.
Evaluation Question # 5: To what degree has the program advanced the vision, mission and objectives of the MHSA PEI plan? The vision, mission and values of San Mateo County Behavioral Health & Recovery Services stress empowering individuals to direct their own recovery process. BHRS stresses the adoption of culturally competent treatment approaches and through its MHSA planning processes, a further focus has been placed upon implementing evidence-based practices that have demonstrated the capacity to support client wellness and recovery. From the perspective of prevention, BHRS has also described the journey towards a transformed system requiring that programs:
• move “upstream” to primary prevention strategies; • partner with other health prevention efforts to focus on wellness and recovery; • achieve desired outcomes; and
16
• integrate efforts to support sustainability; San Mateo’s MHSA plan clearly described the priority of intervening early and identified stress, PTSD, and use of alcohol and drugs as factors where early intervention were most important, particularly in relation to individuals from historically underserved populations. The hotline and intervention programs clearly promote wellness and recovery, provide services, supports and referrals to individuals in extreme crisis. While the crisis intervention and hotline are not classically preventive or ‘upstream’ as they serve clients who have reached extreme crisis, both programs target youth and provide referrals to other partner health promotion supports and based upon the data presented, both programs are achieving the desired outcomes. What’s more, the extensive school training of school personnel and consultations with counseling staff facilitate schools adopting suicide prevention programs and assist in identifying students at risk of suicide. The school presentations to over 3000 students also contributes to creating student bodies that are sensitive to the needs of individuals under stress and better equipping them to be supportive. StarVista Crisis Center has also put on two panel events, called Navigating the Tides of Adolescence. StarVista, in partnership with the San Mateo County Office of Education and the San Mateo Unified School District, is hosting a special panel discussion on teen stress, mental health, and wellness in September 2015 and February 2016. The panel features former Stanford freshman dean Julie Lythcott Haims, author of the highly acclaimed book, “How to Raise an Adult;” Stanford child psychiatrist Dr. Steven Adelsheim; and Gunn High School parent Kathleen Blanchard, and will be moderated by Rachael Myrow of KQED. The event was simultaneously translated in Mandarin and Spanish in February. StarVista has also had clinicians appear on a range of panels in schools to provide outreach and awareness on suicide prevention in schools around San Mateo County for parents and the community.
17
Evaluation Question # 6: What factors have impeded or contributed to successful implementation? How? Through the evaluation process in 2013-14 a number of factors were identified that impede StarVista from maximizing its impact and in this 2014-15 report the evaluation reviewed how StarVista has or has not addressed these factors. Text in bold italics or indented are responses from Crisis Line leadership. Response to 2013-14 Feedback and Areas Identified as Barriers to Effectiveness. Crisis call back-up system. StarVista had been using the Bill Wilson Center in Santa Clara to back up StarVista’s system when they are over-extended. Unfortunately, the AAS requires that all back up providers also be AAS certified, as StarVista is. Bill Wilson is not AAS certified and so StarVista is in the process of engaging Bay Area certified providers to see if a back-up plan can be developed. 2014-15: StarVista now manages these periods internally and no longer relies on non-AAS certified support. Language can be a barrier. StarVista is part of a collaborative Bay Area Spanish speakers’ crisis line, and refers people to that line both via outreach and when they call the Hotline. While StarVista does have a few Spanish speaking volunteers, they are only occasionally on duty. Having a language interpretation service account has been too expensive for the StarVista budget in the past, though the Program Director indicated that with adequate funding, they would use this resource. 2014-15: This remains a problem as to fully address even just the Spanish-speaking population would require Spanish-speaking volunteers for every shift and then there are the other monolingual populations served by the hotline. As do most all California hotlines, StarVista relies on language line to interpret non-English calls as needed and they also have a list list of Crisis Line Services that are offered in different language. Volunteers will also have the capability to transfer callers to crisis lines that offer services in different languages instead of giving callers a number to call. Outreach in diverse language communities are very important. StarVista has a small, short-term grant to do outreach about suicide prevention in the Asian Pacific Islander Community they have been doing presentations in the community in Spanish and English, working closely with the schools and community. Out-of-date referral information. Volunteers noted that contact information for many referral resources were out of date and that callers had reported to them that some of the resources to whom they had been referred were not very useful. From experience working with hotlines in most Bay Area counties, I know that this is a very common challenge and one not easily overcome, as once any list of referrals is complete, within weeks they begin to become out of date. 2014-15: While this is an ongoing battle, two other SV programs, the Child and Adolescent Hotline and the Prevention Program are always updating their resource referrals resources and so they update the crisis line referral agencies at the same time. But this is an ongoing challenge for all crisis line agencies. All resources binders and sheets have been updated as of April 2015 (when they had our AAS evaluation). I think the volunteers responded to this Survey before our AAS site visit. They expanded the File Maker Pro data base & created a google document to keep resources updates and accessible. The Crisis Line uses the 2015 San Mateo county resources handbooks as well smc-connect.org. Updating resources is a project that our AmeriCorps work on when they first start working at the Crisis Center. Most of the time they need to be trained before running the chat room or doing presentations and this would be a good project to work on. Lack of automation or easy access to information and/or outside support. A couple of volunteer comments suggested that at times they become flustered when seeking referral numbers and one
18
volunteer suggested that it would be beneficial to have automatic connections established with emergency services providers like the police or to put a tracer on calls so that the location could be identified. 2014-15. It is not best practice to transfer someone who is in crisis. Best practice is to keep the caller on the line and use another line to call police and get them to the person in crisis. Trying to trace calls is a challenge in that often people call on cell phones that may not be associated with the local community. The incorporation of the FileMakerPro data base with all kinds of informational prompts and links to outside resources is evidence of StarVista’s responsiveness to volunteer input, as is their LOI seeking funding to expand their use of social media. Ability to balance need to address high volumes of calls with the need to stay with callers who are experiencing extreme crisis or require complex referral support. Two volunteers sited either side of this conundrum, one asking for more flexibility to stay with callers and the other asking for tighter regulations to force volunteers to get off long calls when there is also a high volume of callers. 2014-15. The evaluator was told that the crisis line time limit is a common evidence-based-practice. Given the volume of calls, StarVista leadership indicated that having two volunteers on any shift would be over-staffing and result in insufficient calls for each volunteer to be engaged. Hence, with only one volunteer per shift, some kind of call time-limit is important. There is more on this below as a volunteer again commented about not liking the 10-minute call limit. 2014-15 Input In addition to feedback from volunteers, StarVista also benefited from input during its AAS Accreditation visit. The most important input is summarized below. Lack of sufficient funding. The Hotline is significantly underfunded and this impacts all of the above items. The program is funded for only four hours a week for a program manager when a full-time manager would be warranted. Developing a new back up relationships, exploring development of a texting system for the Teen Chat Room, coordinating outreach efforts to secure more bilingual volunteers, or translation options and sustaining a up-to-date referral information all require managers with time to do the research, design and outreach. StarVista simply does not have sufficient management to address these challenges as quickly or thoroughly as would be the case with more funding for management. 2014-15. One of the few criticisms made in the AAS Accreditation Report was its comments on the tight budget and its further observation that the Center would benefit from an increase in funding.
“The current budget is low compared to many crisis centers and would appear to put the program at risk unless additional revenue is found. The program seems to run so well due to the dedication of many veteran staff who appear to both work well together and who serve a variety of positions within the program.” AAS Accreditation Report, April 24, 2015.
The evaluator was told that StarVista leadership will use this comment in efforts to secure increased funding for the crisis line. Volunteer Input
19
As was the case in 2013-14, the vast majority of volunteer comments were entirely positive. However, the 2014-15 Hotline Volunteer Survey did identify ways in which the program could improve, including the bulleted list below. The Crisis Line Director’s response is indented:
• Sustained training, expert presentations, and “refresher” training were suggested by a number of volunteers;
o StarVista is working to provide monthly trainings specific to the Crisis Center – including on-line webinars, movies to watch, and virtual book groups. They also provide weekly didactics for interns and staff that are available to all volunteers and staff. StarVista also has quarterly get-togethers for volunteers to connect and bond and build a community of support.
o Volunteers are encouraged to attend training available for staff through the county or StarVista e.g. ASIST, Mental Health Frist Aid, and QPR. They have have weekly StarVista trainings that Crisis Center staff and volunteers are invited to attend. Staff present Motivational Interview trainings 1 -2 times a year and StarVista is trying to increase ED opportunities for volunteers. The Coordinator lets volunteers know when a volunteer training for new volunteers is scheduled and they are more than welcome to join some of the training sessions if they need a refresher.
• Better use of the bulletin board with information highlight clearly and possibly offering a monthly ‘agency profile’ on one of the agencies with whom Hotline works;
o This is incorporated into monthly ALL VOLUNTEER emails with new resources. The Bulletin board also has a lot of information. will continue to review and get feedback on how to better organize all the information with the little space available. The online database with FileMakePro and CAHPP is useful as well.
• “If you get an intern with technical skills, have them create a "crisis line wiki" (or other type of online repository) so that you can easily edit and provide access to all crisis line documentation (everything from procedures and hints to the sex caller list, unless that would be a privacy issue). You could also make a section for volunteers to share resources, as some have done via email lately. This would help to formalize resource sharing and make it easy to find something we might have missed in email.” When this input was shared with Weisner, she responded:
o Stephanie Weisner commented on this: “I think this is something that we can work on. As far as the privacy concern goes. we can update this information to File Maker Pro. There is an information section that we can add this to. We do have a sex caller binder that has tips, procedures and what worked for each sex caller (not sure if this comment was made before or after the sex caller binder was created, but we have addressed this issue last year). If we want to update File Maker Pro, we need support from a staff to do so. As for sharing resources, we developed software to share database with our CAHPP line. We also have created a Google docs spreadsheet that volunteers can contribute to. As to resource sharing, right now we use most common referrals list that was updated recently, the San Mateo county information hand book and SMC-connect an online search engine with San Mateo resources https://www.smc-connect.org/. We also have licensed clinicians on-call 24/7 for StarVista, including the Crisis Center.”
• • "10 minute limit". Research recommends 10-20 minutes. It's harmful to both callers and staff.
IMHO, it has contributed to the high turnover of volunteers. Our frequent callers who are vulnerable, stressed, isolated, rejected, etc. resent, or take offence at, the rudeness of being cut
20

off. Some express this to counselors who in turn take offence or end up feeling redundant when they have, in fact, signed up in order to feel helpful, to make a difference. Promote a thoroughly compassionate attitude towards callers, including the annoying and abusive callers. Only ban callers for a limited amount of time only, not a "life-time", which could be shortened by the ban. We're here to listen, to serve, all our callers.” While volunteer concerns about the 10 minute limit were provided last year, StarVista noted then that the 10 minute limit is commonplace among crisis lines and an evidence-based practice. Nonetheless, this year’s comment seemed to warrant a response and so the evaluator incorporated seeking comment from StarVista during the structured interview. Stephanie Weisner, Program Director, and she stated that:
• “The 10-minute rule is in place to foster healthy boundaries with callers and also to promote their development of healthy coping skills outside of calling crisis lines (e.g. expanding support network). StarVista crisis lines are mainly used for first stage crisis intervention, information and emotional support, and the crisis line wants to encourage callers to access additional mental health services and social supports instead of the crisis line being the only source of support.
• The 10 -20-minute rule does not apply to callers that are in crisis. Volunteers can stay on calls for 45 minutes + when needed. Staff want volunteers to be available to stay on calls with a caller in crisis for a longer period of time but want to limit the amount of time devoted to “regular” callers who are calling to check in. Volunteers receive training on how to end calls and invite callers to call back etc. Enforcing the 10-minute rule is up to the volunteer if they deem that a caller needs additional support they can stay on the line longer.
• The main purpose of this rule is to avoid compassion fatigue so volunteers don't feel overwhelmed with talking to each caller for 30 + minutes. Callers are referred to other services as needed to make sure they get needs met.
• One challenge to addressing this issue is that the crisis line only has one volunteer on the lines at any given time as the line does not receive a high enough call volume to warrant having two volunteers on each shift. We would like to in the future. We are continuing to explore this to have staff on the line as well and do outreach.
• As relates to the other concern expressed by the volunteer, Weisner noted that staff gives callers several chances and warnings before banning them. First callers who over-use the system are put on a probation period e.g. calling once a day or once a shift. Callers are only banned when they refuse to comply with boundaries. For example, the crisis line currently has a banned caller “Adam,” who started calling after 1 year of being banned from a different number. Staff decided to give him second chance while reinforcing consistent boundaries. Weisner reiterated that the crisis line bans callers VERY infrequently. We work very hard to support all callers, and try hard not to ban a caller. When we do, we do so with compassion and only if safety issues are at play and the callings are enabling unhealthy behaviors. We also refer to other hotlines and resources as needed.
• However, the crisis line has a 0 tolerance rule for sex callers that have called multiple times. Volunteers are directed to tell sexually abusive callers that the crisis line will ban them if they continue to misuse the lines. Recognizing that while abusive, anyone making sexually abusive calls to a crisis line is clearly in need of help and so volunteers are directed to be compassionate and to refer these callers to other supports so that they can get help. This is the same response for callers who threaten the safety of volunteers (i.e. I am going to find your crisis center and physically assault you).”
21
• Several volunteers suggested that the call center was in need of cleaning—a comment that was also raised last year;
o In conversation, with Stephanie Wiesner responded that someone comes in to clean the Crisis Center, and they often do not do a thorough cleaning of the Crisis Line room since someone is there taking calls. However, they did clear out the office when it was reorganized, and they have cleaning supplies handy for volunteers if they want. She said that the Hotline can also look into creating a cleaning schedule for overnight staff and Crisis Center staff.
• Several volunteers wondered if it would be possible to schedule three-hour shifts instead of
four-hour shifts. o Weisner reported that: Two factors weigh against shortening the shifts. First the pure
logistics of having shorter shifts that would require recruiting for and staff an additional shift each day. What’s more many volunteers prefer to do a substantive shift so they minimize travel time in volunteering.
It is clear from the StarVista leadership’s response that input provided by both the Accreditation process and the volunteers themselves, is taken very seriously. The development of the new FMP system responded to concerns expressed by volunteers, the intent to explore the Wiki Evaluation Question # 7: What steps can be taken in the future to improve program services and what data could verify that these improvements had occurred? As was the case in 2013-14, there were very few areas in which there was any evidence of a significant need for improvement in the services delivered by the school-based suicide prevention presentations as StarVista increased productivity, reaching 50% more students in 2014-15 and achieved 95%+ ratings in terms of the quality and relevance of information and resources provided. The incorporation of the robust FileMakerPro system represents another programmatic advance from last year. And achieving AAS accreditation also is an external validation of program excellence. And while volunteer and school-site satisfaction levels are already exceedingly high. Nonetheless, the following volunteer suggestions (responded to in Evaluation Question VI above), seem worthy of tracking in 2015-16:
• More ongoing training on varying topics is again being recommended by volunteers; and • Utilizing the bulletin board more effectively, also seems a low cost suggestion that could
possibly be assigned to an experienced volunteer; and • Lastly, the suggestion of using a “techie” volunteer, perhaps from the Chat Room’s younger
volunteers, to develop the ‘wiki’ suggested above seems at least worthy of consideration. The above recommendations are related to the hotline services. As relates to the YIT, as was the case last year, there is room for improvement in data collection in the YIT program and specific recommendations were made last year as to how the program could obtain data to validate program effectiveness and to identify areas where improvement might be possible. However, these recommendations were not implemented and so the evaluator would like to recommend again that StarVista:
• Incorporate a protocol at the end of a school crisis intervention that directs the primary school contact to complete a brief online survey once the crisis has been reduced with open-ended
22
questions asking what was most valuable about the intervention and how the intervention might have been implemented more effectively or what more could have been done;
• Utilize and/or revise, the Crisis Intervention Incident Report developed by the evaluator last year as it would capture demographic data of students served, a checklist of services delivered, and a brief summary of the nature of the crisis and the outcome; and
• Establish a procedure for entering this data into a database so that it can be used by program managers to identify areas in which programs could be improved.
While the above recommendations could possibly improve StarVista’s Crisis Intervention and Suicide Prevention Center, as the evaluation report describes throughout, this is a very well managed program that consistently meets the needs of schools and individuals experiencing high levels of crisis and where there really is no other resource other than the Crisis Center. If it were at all possible for the County to dedicate additional funding to support expansion of the program’s management position OR to partner with StarVista in seeking private funding, this would significantly boost the program’s capacity to continue to expand its program and fill gaps where they exist.
23