Setting Priorities in South Australian Community Health II: Marginal Analysis of Mental Health...
101
RESEARCH REPORT 13 Setting Priorities in South Australian Community Health I: The Mental health Program Budget Stuart Peacock Lecturer, Health Economics Unit Diana Edwards Research Fellow, Health Economics Unit November, 1997 ISSN 1325 – 0671 ISBN 1 875677 79 8
-
Upload
independent -
Category
Documents
-
view
2 -
download
0
Transcript of Setting Priorities in South Australian Community Health II: Marginal Analysis of Mental Health...

RESEARCH REPORT 13
Setting Priorities in South AustralianCommunity Health I: The Mental health
Program Budget
Stuart PeacockLecturer, Health Economics Unit
Diana EdwardsResearch Fellow, Health Economics Unit
November, 1997ISSN 1325 – 0671
ISBN 1 875677 79 8

CENTRE PROFILE
The Centre for Health Program Evaluation (CHPE) is a research and teachingorganisation established in 1990 to:
• undertake academic and applied research into health programs, healthsystems and current policy issues;
• develop appropriate evaluation methodologies; and
• promote the teaching of health economics and health program evaluation, inorder to increase the supply of trained specialists and to improve the level ofunderstanding in the health community.
The Centre comprises two indepedent research units, the Health Economics Unit(HEU) which is part of the Faculty of Business and Economics at Monash University,and the Program Evaluation Unit (PEU) which is part of the Department of PublicHealth and Community Medicine at The University of Melbourne. The two unitsundertake their own individual work programs as well as collaborative research andteaching activities.
PUBLICATIONS
The views expressed in Centre publications are those of the author(s) and do notnecessarily reflect the views of the Centre or its sponsors. Readers of publicationsare encouraged to contact the author(s) with comments, criticisms and suggestions.
A list of the Centre's papers is provided inside the back cover. Further informationand copies of the papers may be obtained by contacting:
The Co-ordinatorCentre for Health Program Evaluation
PO Box 477West Heidelberg Vic 3081, Australia
Telephone + 61 3 9496 4433/4434 Facsimile + 61 3 9496 4424E-mail [email protected]

ACKNOWLEDGMENTS
The Health Economics Unit of the CHPE receives core funding from the NationalHealth and Medical Research Council and Monash University.
The Program Evaluation Unit of the CHPE is supported byThe University ofMelbourne.
Both units obtain supplementary funding through national competitive grants andcontract research.
The research described in this paper is made possible through the support of thesebodies.
AUTHOR(S) ACKNOWLEDGMENTS
The research reported in this paper has been supported by funding from the SouthAustralian Health Commission, as part of the Health Economics Work Program beingundertaken by the Health Economics Unit. The authors would like to acknowledgethe significant contribution to the project by the Project Management Committee, andby the Project Manager (Ms Nancy McWaters) and Project Assistant (Ms AlexandraHurley). The authors would also like to acknowledge the advice and support given bythe Steering Committee for the project.

Setting Priorities in South Australian Community Health I: The Mental Health Program Budget 4
TABLE OF CONTENTS
1 Introduction 1
2 Priority Setting in Health Care 2
3 Program Budgeting and Marginal Analysis 4
3.1 Key Principles of PBMA 43.2 PBMA Methodology 53.3 Applications of PBMA 6
4 The Mental Health Program Budget 11
4.1 Community Health in Metropolitan South Australia 114.2 The Study Process 144.3 Defining Mental Health 174.4 Defining Mental Health Services in Community Health 19
5 The Mental Health Program Budget 26
5.1 Activity 265.2 Costs 32
6 Conclusions and Recommendations 40
References 43
Appendix 1 Membership of the Pilot Study Management Committee andthe Project Steering Committee 45
Appendix 2 Service Descriptions 46
Appendix 3 The Mental Health Program Budget 53

Setting Priorities in South Australian Community Health I: The Mental Health Program Budget 5
Setting Priorities in South AustralianCommunity Health I: The Mental
Health Program Budget
1 INTRODUCTION
Priority setting is a major issue facing health systems throughout the world. Resourcesfor providing health services are finite, whilst the demand for those services is very large,and rising over time. In all countries health systems have insufficient resources toprovide all the health services which may yield potential health related benefits toindividuals and populations. Health service planners therefore need to decide whathealth services to provide, as well as where, how, and for whom, to provide thoseservices. This process inevitably involves setting priorities between different healthservices. The problem then is how to determine what those priorities should be.
Program Budgeting and Marginal Analysis (PBMA) is an aid to setting priorities which isenjoying increasing popularity both in Australia and overseas (Shiell et al, 1993). Itrepresents a practical application of economic principles to the issue of setting prioritiesin health services, with a particular emphasis on problem solving at the local, regional,and State levels.
The Health Economics Unit, at the Centre for Health Program Evaluation, wascommissioned to advise the South Australian Health Commission on the use of PBMA inthe Community Health Sector. The Unit was asked to conduct two pilot studies, applyingPBMA to priority setting in the Community Health sector. The first pilot study examinespriorities in mental health services provided by the Community Health sector inmetropolitan South Australia. This report covers the principles of PBMA and itsapplication, and the development and results of the program budget for the first pilotPBMA study. Results from the marginal analysis phase of this study are the subject of alater report (Peacock, Richardson and Carter, 1997) which should be read in conjunctionwith this paper.

Setting Priorities in South Australian Community Health I: The Mental Health Program Budget 6
2 PRIORITY SETTING IN HEALTH CARE
To introduce PBMA it is important to first ask the question why do we need to setpriorities in health services? The answer to this questions stems from what economistshave called the economic problem: within the whole of society there are scarce resourcesand infinite wants. This problem provides the foundation for the whole of the economicsdiscipline. The economic problem can be rephrased in terms of the health sector to whatwe might call the ‘health economic’ problem: society faces a finite level of healthresources which are insufficient to meet all the health services needs of individuals withinthe population. Alternatively, there are insufficient health service resources to provide allhealth services which may yield some potential benefits to individuals within thepopulation. Even if the health sector budget was increased dramatically as a proportionof Gross Domestic Product, we would still face a position where some potential benefitsto individuals from health services could not be provided. Under the situation of scarcehealth service resources for meeting health services needs and providing health benefitsto individuals, health sector planners and decision makers have to address a series ofquestions:
1. What health services should be provided? 2. For whom to provide those services? 3. How to provide those services? 4. Where such services should be provided?
Priority setting tools in health economics seek to aid health service planners in makingthese decisions.
In attempting to answer these questions we can start from the basic premise that for agiven level of resources, or budget, health services should seek to maximise the welfareof the population they serve. If we seek to maximise the welfare of the population wethen need to consider exactly what is meant by welfare. In the context of health services,welfare is most often considered in terms of the health of individuals, or the sum of thehealth of individuals which make up a population. More specifically, we can look at theimprovements in welfare to individuals and populations in terms of the health gains orhealth outcomes they obtain from receiving health services.
However, given we face scarce resources for the provision of health services,consideration of health gains in isolation is not enough to fully answer the abovequestions. If resources are scarce not all health services can be provided, and by usingresources to provide one type of service we are foregoing the provision of a range ofother potential services, which may have been made available using those resources.That is, providing one particular health service which results in health gains for thepopulation will mean foregoing providing a range of other services, which could also yieldhealth gains for that population. This notion underpins a concept which economists callopportunity cost. The opportunity cost of using a set of resources to provide a particularhealth service is the benefit which is foregone by not using those resources to provideother health services. In economics this is the only true cost of providing a service: the

Setting Priorities in South Australian Community Health I: The Mental Health Program Budget 7
health gains, or benefits, which could have been achieved by using those resources toprovide other types of health services. In terms of planning services we should then beattempting to provide services which yield the most health gains for the dollars spent.Otherwise those dollars could be used to provide other services which offer greaterhealth gains, and would serve to improve the welfare of the population further. Healthservice planners must, therefore, consider both the health gains which are provided bydifferent services, and the costs of providing those services.
Economists refer to the principle of maximising health gains from a given level of healthservice resources in terms of the concept of allocative efficiency. Allocative efficiency isachieved when the welfare, or health status, of a population is maximised given theresources available. This occurs when the marginal cost of a service is equal to themarginal benefit provided by that service. In other terms, allocative efficiency asks thequestion: if we have an extra health service dollar to spend, what is the best way tospend that dollar so it will maximise health gains? Clearly, if we have an extra sum ofmoney to spend on health services we should seek to provide the services which offerthe greatest benefits in terms of health gain or health outcome to individuals.
The notion of allocative efficiency underpins much of the health economics discipline, andis the guiding principle of economic evaluation which is becoming adopted across theworld as a method for assessing alternative health service interventions. Economicevaluation is often of limited to use to health service planners, however, for two majorreasons. Firstly, reliable evidence from economic evaluations is only currently availablefor a limited number of health service interventions from the vast array of health careservices which are actually provided. Health service planners routinely have to makedecisions about the provision of different health services without the benefit of soundevidence from an economic evaluation. Secondly, economic evaluation is usually limitedto comparing resources and health gains for two or three alternative interventions, andgenerally only for a single condition or health related problem. Health service planners,however, are frequently faced with decisions on a much broader scale. The nextquestion to ask then is: how may we apply the principle of allocative efficiency when wemay be considering a whole range of services covering a number of different conditionareas, and where evidence on costs and effectiveness is limited?
Setting Priorities in South Australian Community Health I: The Mental Health Program Budget 8
3 PROGRAM BUDGETING AND MARGINAL ANALYSIS
3.1 Key Principles of PBMA
One response to these problems has been the use of PBMA, which offers a pragmaticapproach to applying the principle of allocative efficiency (Mooney et al, 1992). PBMAexamines how benefits, or health gains, to individuals and populations may bemaximised for a given budget covering a wide range of services and interventions. Thetechnique first gained favour in the health services context in the 1980s, and has becomeincreasingly popular in publicly run health systems, most notably the UK (Donaldson,1995). The approach was adopted due to a lack of useful aids in setting priorities in thehealth services context. Historically, health services have used tools such as needsassessment and historic budgets in health service planning. However, both approachesare of limited use in setting priorities as they often take no account of the costs of, and thehealth gains from, specific health services designed to meet the needs identified(Donaldson and Mooney, 1991; Cohen, 1994). PBMA on the other hand has beendeveloped as a systematic approach to maximising benefits for a given budget,considering both the health gains from services and the costs of the providing thoseservices.
PBMA is a practical problem solving tool which offers guidelines for identifying majorimprovements in health service delivery with only limited effort. In its simplest formPBMA asks three questions:
1. For budget increases: how should the extra dollars be allocated between healthservices to maximise benefits?
2. For budget reductions: how should service reductions be made to minimise the
impact on benefits? 3. For a given budget: how do we allocate dollars between services so that benefits
are maximised?
The approach works within the organisational context, existing budget areas, and healthservice objectives. PBMA can be applied to any organisation within the health sector,and is typically used to aid problem solving within the confines of the organisationconcerned. The objectives of the organisation and the existing budgets can then be usedto define which services are to be examined. For example PBMA can been applied toservices within hospital specialties, services for particular diseases, or services forparticular population groups, depending on the organisational context. Emphasis inAustralia and overseas has been on the local, regional, and State levels of health careplanning and commissioning.

Setting Priorities in South Australian Community Health I: The Mental Health Program Budget 9
3.2 PBMA Methodology
PBMA can be broken down into several discrete steps. The first stage of a PBMA studyconsists of defining program areas to be studied. The exact choice and nature of theprograms to be examined will depend on the organisation, its objectives, and existingbudget areas, as outlined above. It is desirable that any chosen program structure ismanageable, and that program areas are comprehensive, covering all services provided,but without overlap between program areas. Services provided within programs are thenidentified and activity data collected for each service. The costs of providing differentservices are estimated, and are added to the activity information to construct the programbudget. The program budget establishes a link between the costs of providing differentservices, and the activity levels of those services.
The second stage is to identify services which may be potential options for contraction orexpansion in the future. That is, a range of services are identified which may beconsidered for change in the future to attempt to improve the overall levels of benefits, orhealth gains, which individuals and populations receive. In considering services whichare options for change, PBMA may be used to examine changes in services within agiven program, or between programs. For example, if programs are defined by diseaseareas, PBMA can be used to consider options for changes in services within a givendisease area (such as the balance between primary, secondary and tertiary careservices), or PBMA can be used to examine options for changes in services betweendifferent disease areas (such as the balance between services for diabetes and endstage renal failure). By identifying only a relatively small number of services to beconsidered as options for change, the focus of PBMA is on incremental change toservices and programs, and the not global reform of health care service delivery.
The third step is to take the identified options for changes in services and evaluate thoseservices in terms of their effectiveness, and in terms of the costs of providing thoseservices. Published evidence on the effectiveness of services can be used, whereavailable, to evaluate the options for change. Where published evidence is not availableexpert opinion can be used to estimate effectiveness, using techniques such as optionsappraisal and decision analysis. Estimates of effectiveness and costs can then becombined to determine cost-effectiveness of the services which are to be considered asoptions for change. If the notion of allocative efficiency is followed (and we are seekingto maximise health gains to individuals and populations) then the study results willindicate which options are the most and least cost-effective, with the implication thatresources are better employed in providing the most cost-effective services. Followingthis process, the equity implications of any change in the configuration of services can beassessed, and any decisions modified accordingly.
The fourth, and final, step is to reallocate money according to the cost-effectivenesscriteria and equity judgements. The process can then be repeated over a period of time,perhaps a number of years, so that progressively more and more difficult services toevaluate are assessed. By sequentially repeating the process the emphasis of PBMA isto gradually move towards the allocative efficiency goal of maximising health gains for agiven level of resources.

Setting Priorities in South Australian Community Health I: The Mental Health Program Budget 10
3.3 Applications of PBMA
Applications of PBMA have concentrated on three types of program structure, reflectingdifferences in objectives, definitions of output, and organisational context. The types ofprogram structure adopted include programs defined by: client/service group (eg women,the elderly); specialty (eg general surgery, orthopaedics); and disease group/problemarea (eg cardiovascular diseases, asbestosis)
Client or service group programs have been used in a significant number of PBMAstudies to date. The major rationale is that client groups tend to be the focus of thestrategic priority setting and planning process. Analysis based on client groups providesa clearer focus on health gain than under specialty based studies. However, theallocation of costs from several different specialty or treatment areas to a client basedprogram can provide problems with this approach to PBMA. Some studies have facedsignificant problems in attributing costs to elements of client based programs, but havemaintained the approach as stakeholders viewed the client focus to be pivotal in theirobjectives for the service.
Specialty based PBMA studies have been most common in PBMA studies which assessmarginal changes within a single program. Many such studies have been undertakenwithin a relatively short time frame, with the relative ease of obtaining specialty basedprogram costs and activity data being an important factor in the choice of this programstructure. Where specialty based costing systems have been used this has also avoidedthe need to make the sometimes difficult cost allocation decisions which are required fora client or disease based approach. Typically the focus of these studies has been onshorter term goals, rather than strategic long term planning, for which client groups havefrequently be found to be more appropriate.
Disease based programs have been used in a limited number of hospital sector studies(for example cardiovascular diseases and cancers). The boundary between a clientbased and a disease based approach can be somewhat blurred, however. For instance,it could be argued that a study on care of the elderly with dementia is following either adisease based model or a client based model depending on the perspective adopted. Inpractice, a client group approach tends to relate more closely to strategic planning,whereas the disease based approach conforms more closely with operational issues.Disease group programs have the same drawback as client based programs, in that itmay be difficult to allocate costs to diseases from available local data. However,published literature on both costs and outcomes is much more common for the diseasebased approach than the client or specialty based approach. The disease basedapproach is consistent with specific health priorities and goals. However, some servicesmay not conform to strict disease area boundaries, and the focus of the study may tend torevert to inputs rather than outputs in such cases.

Setting Priorities in South Australian Community Health I: The Mental Health Program Budget 11
The majority of published PBMA studies have been based in the UK, primarily becausethe purchaser/provider split has produced a clear priority setting role for HealthAuthorities (purchasers) which is compatible with the PBMA approach. Table 1 gives abrief summary of some of the published studies to indicate the types of programstructures adopted by different groups. Three of these studies were only designed toprovide a monitoring tool for the service in question through program budgets, and asthese studies were not used for priority setting marginal analysis was not undertaken.Table 2 summarises the approach adopted in marginal analysis, where marginal wasreported.

Setting Priorities in South Australian Community Health I: The Mental Health Program Budget
: Program structure used in published PBMA studies
StudySetting
Study Objective Program Structure Program(s) PBMA type MarginalAnalysis
GrampianHealth Board
Informationand Monitoring
Client/Service groups Medicine, surgery, elderly,mental, dental, ophthalmology,maternity, child
BetweenPrograms
No
Steele and Gray 1980 GrampianHealth Board
Informationand Monitoring
Client/Service group Maternity WithinPrograms
No
Jones and Wright 1995 Health/LocalAuthority
Informationand Monitoring
Client/Service group People with learning disabilities WithinPrograms
No
Craig et al 1995 NewcastleDistrict HealthAuthority
Priority Setting Specialty Orthopaedics WithinPrograms
Yes
Donaldson and Farrar GrampianHealth Board
Priority Setting Client/Service group Elderly people with dementia WithinPrograms
Yes
Mid GlamorganDistrict HealthAuthority
Priority Setting Client/Service group Maternal and early child health WithinPrograms
Yes
Mid GlamorganDistrict HealthAuthority
Priority Setting Client/Service groupsand Disease groups
Maternal and early child health,injuries, cardiovascular diseases,respiratory diseases, cancers,oral health, disabilities, palliativecare, healthy living
BetweenPrograms
Yes
Twaddle and Walker Greater GlasgowHealth Board
Priority Setting Specialty Gynaecology WithinPrograms
Yes

Setting Priorities in South Australian Community Health I: The Mental Health Program Budget
: Marginal Analysis methods used in published PBMA studies
Program(s) Option Assessment Cost Measurement BenefitMeasurement
Implemented
Craig et al 1995 Orthopaedics Expert groupNo areas for contractionidentified
Local cost dataLocal judgement
Option AppraisalNo weighting ofcriteria
Not stated
Donaldson and Farrar 1993 Elderly people with dementia Expert groupOnly two options generated
Published literatureLocal cost data
Published literature Yes
Maternal and early childhealth
Expert group Local cost dataLocal judgement
Option AppraisalNo weighting ofcriteria
Yes
Maternal/early child health,injuries, cardiovasculardiseases, respiratorydiseases, cancers, oral health,disabilities, palliative care,healthy living
Expert groups for eachprogramCore evaluationteam
Local cost dataLocal judgement
Option Appraisal bycore evaluation teamNo weighting ofcriteria
Not stated
Twaddle and Walker 1995 Gynaecology Expert groupNo community representation
Local cost data Option AppraisalLimited analysis only
Yes

Setting Priorities in South Australian Community Health I: The Mental Health Program Budget 14
Experiences in published PBMA studies have suggested that successful implementationof study results can be difficult to accomplish. In PBMA studies problems inimplementation may be significant due to potential misconceptions and a lack ofunderstanding about issues in priority setting in the health service and in the generalcommunity. In the first instance health service staff and the community should beinformed and educated about the nature of priority setting in health services, within thecontext of such possible goals as maximising health gains for the community, equalaccess for equal need, and improvements in the quality of care provided. PBMA studieshave highlighted several factors which need careful attention if the study is to besuccessful.
(i) Ownership
Key stakeholders in health services must have ownership of the project. This includesnot only the Steering Committee and the Management Committee for the project, but alsoservice providers and community representatives. Training sessions for these groupsshould be arranged, and relevant staff should be involved from the outset where everpossible.
(ii) Strong leadership from health service management
Senior health service management have to ensure that relevant staff are represented onthe Management Committee for the project, and ensure that other key staff are keptinformed of the study’s progress. The senior management have an important role inguiding the study through what may be seen as some rather uncomfortable issues.
(iii) Training and education of staff priority setting issues and techniques
Concepts such as efficiency and prioritisation can often be misinterpreted. Key conceptsshould be covered in training sessions, and the evaluation methodology to be adopted.The study results should not be seen to be merely a method of cutting costs, theemphasis of PBMA is clearly on achieving the best possible benefits from givenresources. It is also important that the process is open, and that key decision areas aremade explicit for acceptance of the project.
(iv) Program choice
The area(s) chosen for study should be high on the local agenda, but not so importantthat analysis becomes pressurised or hurried. Ultimately this could lead to a poorunderstanding of the issues and weakened analysis, and a lack of acceptance by staff ifresults are to be implemented. Background data on the program should be readilyavailable, preferably with indications of current inefficiencies to help with the difficultissue of identifying areas for potential contraction. It is also preferable that no majorservice development or policy review has recently been undertaken in the area(s) to bestudied, as this may limit the options available for change.

Setting Priorities in South Australian Community Health I: The Mental Health Program Budget 15
(v) Generating options for changes in programs
This is largely the responsibility of the project Management Committee. It is an areawhere some PBMA studies have found difficulties, where some staff have been willing toidentify areas for services expansion, but less willing to identify areas for contraction. It isimportant that a full range of options is generated, as failure to do so weakens theanalysis and ultimately reduces the chances of meeting local objectives. The chair of theManagement Committee has a vital role in ensuring all options are considered, and thathidden agendas do not hamper the process.
(vi) Implementation
Implementation of results must be a gradual process, otherwise severe financialdislocation of services may occur. For instance, if the study recommends a shift awayfrom acute care services to health promotion activities the shift of resources should begradual so existing acute care services are not jeopardised in the short run.
4 THE MENTAL HEALTH PROGRAM
4.1 Community Health in Metropolitan South Australia
Following a recent reorganisation of Community Health Services (CHS) in metropolitanSouth Australia, three Community Health Services regions have been established:Northern Metropolitan CHS, Central Adelaide CHS, and Noarlunga CHS1. Each CHSregion acts as an administrative centre for the delivery of Community Health Services tothe population within their geographically defined boundary. Each region is responsiblefor several Community Health Centres (CHCs), and provides a range of services throughthese centres. Some services are coordinated on a regional basis and delivered throughindividual CHCs (the extent of coordination of regional services varies between regions),whilst other services are managed and provided directly by individual CHCs. The SouthAustralian Health Commission influences service organisation through the use of HealthService Agreements.
There are several major staffing groups within the three CHS regions. Staffing groupsare defined in terms of discipline or work tasks. Figure 1 gives a summary of staffgroups according to service organisation. The diagram is by no means definitive as staffgroups and the organisation of services varies between regions, rather it is intended toprovide a broad overview across metropolitan South Australia.
1 Noarlunga Community Health Services does not include Southern Women’s Community Health Centre.

Setting Priorities in South Australian Community Health I: The Mental Health Program Budget 16
Figure 1: Metropolitan South Australian CHS staffing structure
Regional CHS
Regionally Based Services CHC Based Services
Allied Health Physiotherapy,Occupationaltherapy,Podiatry,Dentistry,HealthPromotion,Research.
Allied Health Psychology,Social Work,SpeechPathology,Nutrition,Podiatry,CommunityHealth Nursing,CommunityHealth Work.
Medical GeneralPractice.
Medical GeneralPractice.
Admin Finance,Computing,MedicalRecords,Clerical,Secretarial.
Admin Clerical,Secretarial.
Setting Priorities in South Australian Community Health I: The Mental Health Program Budget 17
Client based services offered by Community Health Services include: direct primaryhealth care (including medical, nursing, dental and allied health care); psychosocial andfamily support services; screening, prevention and health education services; services forparticular population groups (eg recent migrant groups); group and one to onecounselling and support services; and community planning, development and advocacywork. Non-client based activities include staff development, research, andadministration.
Historically service activity has been grouped into one to one services, group services,and community based services and initiatives, which may be organised regionally or byindividual CHCs. Services offered by CHCs can also be thought of in terms of “core”services and local priority services. Core services may be those services which areprovided by most, if not all, CHCs within metropolitan South Australia. Possibleexamples include counselling and national priority areas for health promotion. Localpriority services may include services for specific local community health problems.Examples in South Australia may include health education on occupational safety inwineries in rural areas, and services for the homeless in Central Adelaide.
Service delivery in metropolitan South Australia is currently grouped into a range ofservice programs. Such service programs cover a wide range of clients, for exampledomestic violence services for women; speech pathology services for children; needleexchange facilities; health promotion for specific problems (including diabetes,osteoporosis, arthritis etc); and services for the Aboriginal and Torres Strait Islandercommunity. Service program areas may include one to one contacts, group sessions,and community initiatives (such as services for domestic violence), or only specific typesof activity (such as group sessions for stress management).
Figure 2 shows examples of current service programs across Metropolitan SouthAustralia according to the client group targeted by programs. Several of the currentservice programs span several client groups (for example domestic violence anddiabetes services), but individual services offered to different client groups may be quitedifferent.

Setting Priorities in South Australian Community Health I: The Mental Health Program Budget 18
Figure 2: Examples of CHS service programs in Metropolitan South Australia
Client/Service Group Examples of service program/problem area
Youth Young parentingEnuresisNeedle exchangeChildhood abuse
Women Domestic violenceYoung parentingMental HealthGynaecology
Men Domestic violence
Elderly ArthritisOsteoporosis
Aboriginal and Torres StraitIslanders
Domestic violenceDiabetesWomen’s health
Multicultural groups Domestic violenceDiabetesWomen’s health
Whole community Health promotion and educationEnvironmental HealthDiabetesHealthy cities
The organisational structure shown above highlights some areas of services provided byCommunity Health Services. Many services are provided in conjunction with otheragencies however, providing a rather complex overall structure for Community Health inmetropolitan South Australia. Moreover, funding for some CHS activities is drawn from arange of sources and some services are provided by community volunteers who are notdirectly employed by the Community Health Centres.
4.2 The Study Process
The first stage of the study involved setting up two committees: a Steering Committee tooversee the whole study (consisting of executives from the South Australian HealthCommission, representatives of the three Community Health Service regions in Adelaideincluding the Chief Executive Officers of each region, and representatives from theHealth Economics Unit and the South Australian Community Health Research Unit); anda management committee to act as the expert panel (consisting of service providers,finance officers, and systems controllers from each region, and representatives from thePurchasing Office of the South Australian Health Commission). A full list of committeemembers is given in Appendix 1.

Setting Priorities in South Australian Community Health I: The Mental Health Program Budget 19
The steering committee decided that two pilots were to be run, the first examining optionsfor changes in services within a program area, and the second assessing options forchanges in services between program areas. Mental health services provided within theCommunity Health sector were chosen as the program area for the first pilot study.Mental health services were chosen for the first pilot for several reasons: mental healthservices represent a significant part of the services provided by Community Health inAdelaide; mental health is currently a priority at the international, national, and statelevels; and mental health services will remain a significant program area in CommunityHealth after completion of the pilot study.
The approach adopted for the whole of the PBMA study was “hands on”, with significantemphasis placed on educating and training Community Health staff in priority setting andPBMA techniques. The emphasis was placed firmly on the management committeeunderstanding, owning, and running the project, with the Health Economics Unitproviding expert advice, and the steering committee acting as an overseer to theprocess. By including service providers and managers from the outset, and encouraging,(where ever possible) ownership of the project by the management committee theintention was to remove some, or all, of the barriers to a successful PBMA study.
Prior to the first management committee meeting the Health Economics Unit felt it wasimportant to familiarise itself with Community Health in the metropolitan South Australiancontext. Consequently, a week was spent in Adelaide visiting service providers andmanagers at all three Community Health Service regions, and visiting as manyCommunity Health Centres as possible across the metropolitan area. Time was alsospent meeting with members of the South Australian Community Health Research Unit(SACHRU) and the South Australian Health Commission. The week provided anopportunity to explain the study to service providers, hopefully to dispel any myths aboutthe approach and to increase ownership and understanding of the process by CommunityHealth workers.
The week produced valuable information for this study in learning about the objectivesand underlying philosophy of Community Health in Adelaide, the range of servicesprovided, the population groups served and their individual health care needs, and thecurrent issues facing Community Health. Several themes became evident through thisprocess: the holistic approach to health services provided by Community Health; thefocus on primary health care approaches and the importance of the Ottawa Charter andCHASP in guiding Community Health policy (World Health Organisation, 1986); thediversity of health service needs and Community Health services provided acrossAdelaide; the complex multicultural issues which underlie health care needs and serviceprovision; and the importance of collaboration with other health and social servicesagencies.

Setting Priorities in South Australian Community Health I: The Mental Health Program Budget 20
The management committee formally met seven times over the 10 month duration of thestudy. The emphasis in these meetings was placed on education and discussion, withthe committee as a whole taking responsibility for making major decisions relating to theproject. At all stages it was attempted to provide the committee with enough informationand understanding to make informed choices about how the study was to progress.Specifically the committee received training and advice on: economic principles whichunderpin priority setting and PBMA; options for program structure relating toorganisational context and objectives; output and outcomes definition and measurement;resource use and cost definitions and measurement; the PBMA process and experiencesto date; the meaning and importance of marginal analysis; and the need for explicit andinformed decision making. Throughout the study the emphasis was placed very firmly onthis study being a pilot study, which would not lead to direct changes in services. Instead,the emphasis was on encountering issues and problems, learning and understanding,and establishing a framework for health service planning in the longer term.
Outside of the formal meetings members of the management committee also met toundertake work for the study. Significant work was undertaken at the regional level indefining mental health and mental health services, in identifying services for inclusion inthe mental health program, in collecting activity and cost information, in developing thecosting model, and in preparation for the marginal analysis phase of the study. A smallworking group, covering all three regions, met several times to discuss and develop thecosting model and issues around collecting activity and cost information. At each stagethese groups were provided with advice on possible approaches to problems, and theirrelative merits, with the aim of making recommendations to the full managementcommittee. The committee then made decisions about the relevant approach to take.
An integral part of this study was also to evaluate the process undertaken, and theapproaches used. The results from this evaluation will be presented elsewhere.
Setting Priorities in South Australian Community Health I: The Mental Health Program Budget 21
4.3 Defining Mental Health
The next stage of the study was to determine which services were to be included in themental health program. The starting point was to define mental health, which is, at best,a rather nebulous concept. The management committee identified several possibledefinitions which highlighted the breadth of mental health, and the difficulties associatedin obtaining a clear and concise understanding. Mental health is integral to just aboutevery aspect of individual’s health, and virtually all Community Health services will lead tosome form of mental health outcomes. Moreover, health services cannot be taken inisolation in considering mental health, as a whole range of social and environmentalfactors (including transport, education, and employment) affect individuals’ mental healthin complex and diverse ways. Following considerable debate by the managementcommittee, the following broad definition of mental health was adopted:
‘Expressed in its most simple terms, for the individual, mental health arisesfrom a balance between our capabilities and the demands made on us.The pressures of the physical and social environment, the opportunitiesand the resources available to us, and our individual constitution, all insome part shape our mental well-being. But mental health does not fiteasily within the usual boundaries of a health system tailored largely to theneeds of the medically ill. Many of the pre-conditions for mental health arenot under the control of the health system. They are influenced by broadersocial and economic policies in the intersectoral domain, which are theresponsibilities of all the participants in social life.’ (Baum, Fry and Lennie,1992).
In arriving at this definition of mental health the management committee also defined thefocus of mental health services in Community Health, which make them distinct fromother mental health services. In Community Health Services, activities with a primarymental health focus include:
• Counselling - preventative and crisis; providing individuals with strategies tomaintain their mental health and not become clients of the mental health system;
• Groups - a range of groups provide health information, strategies, and supports tostrengthen people’s capacity to maintain their mental health;
• Support and direct links with people living in the community who have received adiagnosis from the mental health system by providing contacts and networks, anddeveloping skills to prevent further problems;
• Services to families to support and maintain their ability to function and thrivewhen they have experienced severe trauma;
• Medical services - to clients who have, as part of their range of problems, mentalhealth difficulties;
• Advocacy on behalf of groups and supporting groups who are already advocatingfor the needs of people with mental health problems;

Setting Priorities in South Australian Community Health I: The Mental Health Program Budget 22
• Being a resource to mental health services through working together on specificissues and developing alternative ways of perceiving and working with mentalhealth and strengthening a preventative focus to it.
The community health focus is therefore on:
• Promotion of mental health;
• Prevention of mental illness;
• Provision of early intervention and support to individuals and populations withmental health problems;
• Systems and individual advocacy.
This involves:
• Promotion of healthy environments which enhance mental health;
• Strengthening supports for positive mental health;
• Strengthening community action for positive mental health through mutual aid,self help and community supports;
• Reducing inequities which increase vulnerability, such as poverty, discrimination,and isolation.
The next step was to identify the specific mental health services to be included in theprogram budget. Whilst the mental health definition for the study was extremely useful inproviding the foundations which are crucial for such a project, it proved to be only oflimited use in deciding which services should be considered as mental health services.The problem is that the definition is so broad that one might legitimately put almost alltypes of health services into a mental health program, if this definition is the sole criteriafor identifying mental health services. Virtually all health services will provide individualswith some form of mental health benefits. For instance, hernia repair operations maywell provide individuals with significant relief from the pain and discomfort of having ahernia, and in that sense they would gain mental health benefits under this type ofdefinition.
Setting Priorities in South Australian Community Health I: The Mental Health Program Budget 23
4.4 Defining Mental Health services in Community Health
The challenge was to take this definition of mental health and to use it as the basis for ameaningful method to construct the mental health program. To do this the managementcommittee used the distinct focus of mental health services in Community Health, inconjunction with their objectives in providing different Community Health services. Aservice was chosen to be included in the mental health program if the direct aim orobjective of the service was to address a mental health problem for an individual or agroup of individuals. That is, the main problem being directly addressed by a particularservice (or the main reason for attendance by an individual) had to be a mental healthproblem if it that service was to be included in the mental health program. The mentalhealth program did not include services which directly addressed other underlyingproblems, such as services for domestic violence or drug alcohol dependency, etc.Whilst services for problems such as domestic violence or drug and alcohol dependencywill have mental outcomes, the primary problem being tackled by the service is not theindividual’s mental health. For such services we may consider that mental health is anindirect objective or goal of providing the service, but the direct objective of the service isto address some other underlying health related problem.
To identify services to be included in the mental health program the managementcommittee were given distinctions between three types of services, according to theobjective or aim of providing a given service.
(i) Services with a direct mental health objective
A service with a direct mental health objective is one which is aimed directly at treatingor preventing a recognised mental health problem such as anxiety, stress, or depression.The individuals treated are not receiving that service as a result of some other majorunderlying problem such as domestic violence.
(ii) Services with an indirect mental health objective
Where mental health problems are part of the co-morbidity associated with a specifichealth related problem, and the service is directed at that underlying problem, the servicehas an indirect mental health objective. Mental health problems in such cases are aresult of the another underlying problem or issue, and are not the problem in its own right.For example, is the service provided because the individual concerned is in a situation ofdomestic violence and as a result suffers from anxiety and stress, or because theindividual is suffering from anxiety and stress not directly related to another underlyinghealth related problem?

Setting Priorities in South Australian Community Health I: The Mental Health Program Budget 24
(iii) Services with no mental health objective, but which yield mental healthbenefits
The third distinction which can be made is to identify services where there is no mentalhealth objective, but from which individuals may still receive mental health benefits. Thistype of service may be referred to as a service which has a mental health benefit as anexternality effect (any mental health benefits are external to the aims of providing theservice). Some services clearly have no real mental health focus, and are not directlyaimed at the individual’s mental health, but result in an improvement in the individualsmental well-being. An example of this would be a GP consultation for the treatment ofosteoporosis. The aim of the service is to improve the functional capabilities of thepatient, but that patient may also feel a sense of relief in being treated, and in theimproved physical quality of life they may enjoy. Clearly, this is not a mental healthservice, but it may impact on an individual’s mental health (albeit unintentionally).
Obviously not all Community Health services fell neatly under these headings, so wherethere was some ambiguity the committee was asked to choose the type of objectivewhich they felt most closely fitted the service being considered. Using the distinctionsbetween types of objectives the management committee then constructed the mentalhealth program, which included only those services which had a direct mental healthobjective.
The management committee identified over one hundred individual services provided bythe Community Health Regions across Adelaide which were to be included in the mentalhealth program. However, such services were defined as mental health services onlywithin the specific context of Community Health services in Adelaide. The criteria forchoosing services for inclusion in the mental health program in other health servicesectors may well be different, reflecting differences in the organisational context,objectives, approaches to mental health and mental health problems, and the range ofservices provided by other organisations. Whilst the approach taken in this study maynot be appropriate in other contexts, this reflects a major strength of PBMA: the approachis intended to be a practical tool which is adapted to the particular set of problems andissues which an organisation faces.

Setting Priorities in South Australian Community Health I: The Mental Health Program Budget 25
Within the large array of services in the mental health program, the managementcommittee identified four sub-programs reflecting specific mental health objectives andissues. Each service in the mental health program was then placed into one of these foursub-programs. The aim was to break down the large range of diverse services intocoherent groups, making planning and monitoring less opaque by clarifying theobjectives of the regions and the issues they face. Again, the process of determining andagreeing upon coherent objectives for use in defining sub-program areas took muchdiscussion by the management committee. The four sub-program areas adopted for thestudy were:
1. Services which increase access to services which promote personaldevelopment.
2. Services which reduce the effects of psychosocial crisis and distress.
3. Services which increase awareness of issues which impact on psychosocial well-being.
4. Services which address systems issues which impact on psychosocial well-being.
For each service under the four sub-program areas the exact type of service and theclient group addressed by the service were identified. The types of services providedwithin the Community Health sector in Adelaide cover: health promotion; education,information, and resources; advocacy and intersectoral (other health and welfareorganisations) work; one-to-one client counselling; group sessions for clients; referrals toother agencies; and community action and initiatives. Client groups which are addressedby specific services include: child and youth; women; men; Aboriginal and Torres StraitIslanders; non-English speaking background; and older people. Many other services arenot directed at a specific client group, but address the general population as a whole.
The services included in the mental health program and sub-programs are shown byeach Community Health region in tables 3 to 5. Brief descriptions of the individualservices for each region, where they were available, are given in Appendix 2.

Setting Priorities in South Australian Community Health I: The Mental Health Program Budget
Table 3: Northern Metropolitan Community Health Service Mental Health Program (January - June 1996)
Sub-Program One to One Groups Community Initiatives
1. Increase community access to services thatpromote personal development.
• Registered Client Contacts• Neighbourhood House
• Multi-Cultural Women’s Group• Spanish speaking Women’s
Group
• Emotional/Mental Health - General• Emotional/Mental Health - Vietnamese
Women• Panic Attack/Agoraphobia Drop-in• Body Image General• Cambodian Women’s Group• Isolation - General• Cambodian Elderly Group
2. Reduce the negative effects of psychosocialcrisis and distress on individuals and families inthe community.
• Registered Client Contacts(Counselling)
• Unregistered ClientContacts (Counselling,Assessment, andInformation)
• Panic Attack/Agoraphobia Drop-in• Beginners Meditation• Claim your space with B&T• Confidence Building for Women• Glance Backwards, Look
Forwards• Marvellous Matriarchs Moments• Motherhood and Myths• Self Esteem• Strategies for Change• Stress Management
• Relationships - General• Cancer Support Group• Gender Issues - General

Setting Priorities in South Australian Community Health I: The Mental Health Program Budget
Table 3 (contd): Northern Metropolitan Community Health Service Mental Health Program (January - June 1996)
Sub-Program One to One Groups Community Initiatives
3. Increase community awareness of issues whichimpact on psychosocial well-being.
• Health Education for NESBWomen
• Post Natal Distress• Self Esteem and Confidence - General• Parenting• Stress/Anxiety - General• Social Health - General• Health General NESB• Health - General• Aboriginal Community• Sexuality -General
4. Address systems issues which impact onindividual’s psychosocial well-being.
• Women for Better Births• Northfield Women’s Prison Project• Cambodian Working Party• Community Action - General• Community Participation• Youth Participation Project• Supportive Environment - General

Setting Priorities in South Australian Community Health I: The Mental Health Program Budget
Table 4: Adelaide Central Community Health Service Mental Health Program (January - June 1996)
Sub-Program One to One Groups Community Initiatives
1. Increase community access to services thatpromote personal development.
• Assertiveness and Confidence• Working Through Conflict• Women, Health and Well-being• McMhap Support Group• Aboriginal Well-being• Aboriginal Elders
• Mental Health Women’s Group• IPPON• Stress/Relaxation Group• Western Aboriginal Health Program• Taperoo/Osborne Steering Group• Aboriginal Primary Health• McMhap Project
2. Reduce the negative effects of psychosocialcrisis and distress on individuals and familiesin the community.
• Registered Client Contacts• Unregistered Client
Contacts
• Take a Break • Great Expectations
3. Increase community awareness of issues whichimpact on psychosocial well-being.
• Port Owls• Krinkly Wobblies (Elders)• Silver Threads (Elders)• Tuesday Social Group (Elders)
• Mental Health Friendly Lunch• Mental Health Music Club• Mental Health Travel Club• Mental Illness Community Education
4. Address systems issues which impact onindividual’s psychosocial well-being.
• Well-being Project• Inner City Homeless• Aged Homeless Working Party• Better Health Homeless Project• WOW Safe
Setting Priorities in South Australian Community Health I: The Mental Health Program Budget
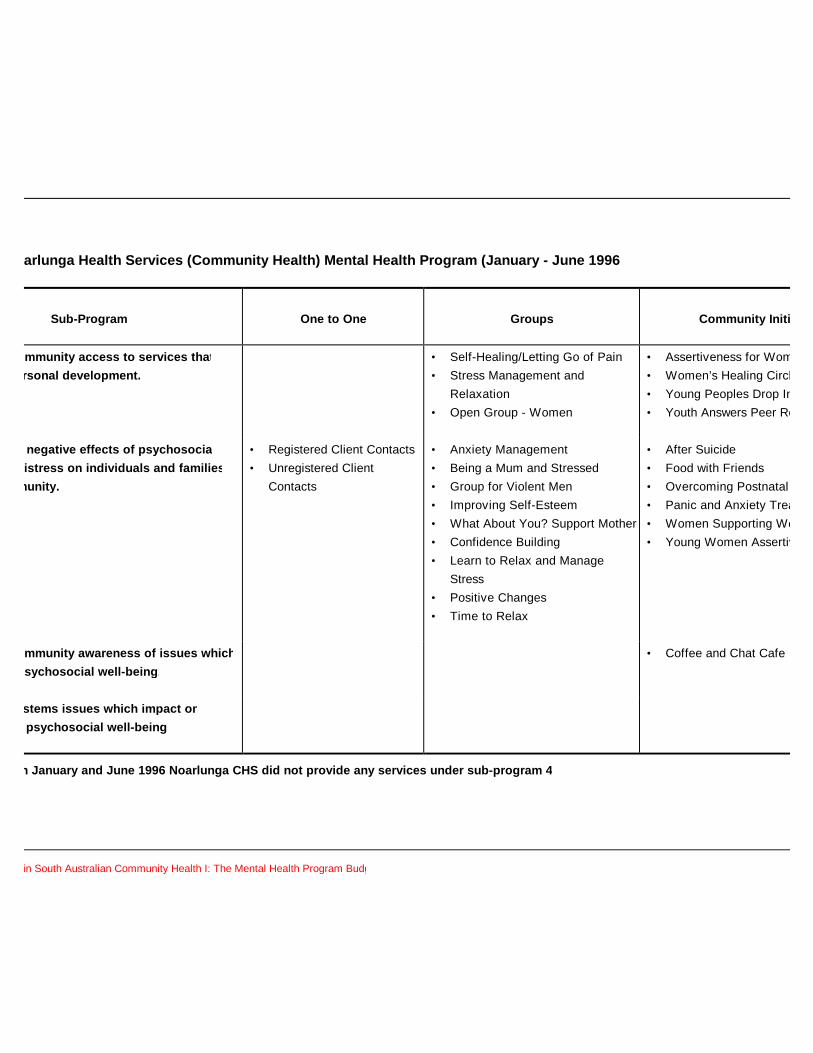
Table 5: Noarlunga Health Services (Community Health) Mental Health Program (January - June 1996)
Sub-Program One to One Groups Community Initiatives
1. Increase community access to services thatpromote personal development.
• Self-Healing/Letting Go of Pain• Stress Management and
Relaxation• Open Group - Women
• Assertiveness for Women• Women’s Healing Circle• Young Peoples Drop In• Youth Answers Peer Research
2. Reduce the negative effects of psychosocialcrisis and distress on individuals and familiesin the community.
• Registered Client Contacts• Unregistered Client
Contacts
• Anxiety Management• Being a Mum and Stressed• Group for Violent Men• Improving Self-Esteem• What About You? Support Mother• Confidence Building• Learn to Relax and Manage
Stress• Positive Changes• Time to Relax
• After Suicide• Food with Friends• Overcoming Postnatal Depression• Panic and Anxiety Treatment• Women Supporting Women• Young Women Assertive/Confident
3. Increase community awareness of issues whichimpact on psychosocial well-being.
• Coffee and Chat Cafe
4. Address systems issues which impact onindividual’s psychosocial well-being.
Note: Between January and June 1996 Noarlunga CHS did not provide any services under sub-program 4.

Setting Priorities in South Australian Community Health I: The Mental Health Program Budget 30
5 THE MENTAL HEALTH PROGRAM BUDGET
Using the mental health program structure shown above the program budget wasconstructed, providing a complete summary of costing and activity information for allCommunity Health mental health services. This involved collecting activity informationfrom community based health information systems (CHSS) and from service providers.Activity data was collected separately for one to one counselling, group, and communityinitiative services to reflect differences in the nature of these activities. A costing modelwas constructed to attach cost information to each service provided in the mental healthprogram. The final program budget represents the first time that activity and costsassociated with individual services in Community Health in South Australia have beenavailable.
5.1 Activity
Each Region collected activity information for the services identified in the mental healthprogram. Activity data was collected for the 6 month period January 1996 to June 1996,as this represented the most up to date data which was relatively straightforward tocollect from the CHSS information system. Each region was asked to collate as muchactivity data as possible within the time frame of the project, to build up ascomprehensive picture as possible about services provided in the mental healthprogram. However, as the regionalisation of Community Health Services had onlyrecently be completed the collection of activity data was difficult at times, as not allinformation is currently collected at the regional level for the three regions in Adelaide.
The Community Health regions were sent documents outlining the types of informationwhich are useful in examining activity within the program budget. The Northern regionthen developed an activity reporting framework which it presented to the managementcommittee, and was subsequently adopted by the other two regions for this project.Information collected covered activity under the three main types of services: one to one,groups, and community initiative services. The specific activity measures adopted for thestudy were: (i) One to one services Unique client: An individual registered client that attends for a service (A unique client may attend more than once)
Client attendances: The total number of attendances by clients (registered and unregistered clients) (ii) Groups Number of sessions Total number of sessions held for that group
Hours per session Contact time with participants
Unique client An individual registered client who attended one or more sessions of a group program
Client attendances The total number of attendances by unique clients

Setting Priorities in South Australian Community Health I: The Mental Health Program Budget 31
(iii) Community Initiatives Number of sessions Number of incidents of activity recorded for a program
Number receiving Total number of participants at sessions where aservices service was provided
Full activity data relating to individual services provided under the mental health programis shown in Appendix 3 in tables A1 to A4 (Northern), tables A13 to A16 (Central), andtables A25 to A27 (Noarlunga). Some differences occurred between regions in theinformation collected, and some data was unavailable for some regions. Wheredifferences occurred, they are outlined in the notes for the activity tables shown inAppendix 3.
Presented below is summary information about activity in the mental health programs forthe three regions for the six month period January 1996 to June 1996. Table 6 shows thenumber of sessions, and table 7 the number of client attendances/numbers receivingservices by region, sub-programs, and service type. Tables 8 to 13 show sessions andclient attendances/numbers receiving services across the whole of Adelaide.
Note, number of sessions refers only to groups and community initiatives (number ofsessions for each group, and number of incidents of activity for community initiatives).Information for number of one to one sessions was not available for all regions, hence allsessions based activity reported here does not provide a comprehensive description ofall mental health services activity. Client attendances refer to one to one contacts andgroups, and are the total number of attendances by clients. Numbers receiving servicesrefers only to community initiatives, giving the total number of participants for the serviceprovided.

Setting Priorities in South Australian Community Health I: The Mental Health Program Budget 32
Table 6: Mental Health Program - Number of Sessions *(January - June 1996)
(a) Northern
One to One Groups CommunityInitiatives
Sub-Program TotalSessions
Sub-Program 1Sub-Program 2Sub-Program 3Sub-Program 4
----
10706-
21938
436155
229108442155
Regional Total - 86 848 934
(b) Central
One to One Groups CommunityInitiatives
Sub-Program TotalSessions
Sub-Program 1Sub-Program 2Sub-Program 3Sub-Program 4
----
382046
-
1471717
193
1853763
193
Regional Total - 104 374 478
(c) Noarlunga
One to One Groups CommunityInitiatives
Sub-ProgramTotal Sessions
Sub-Program 1Sub-Program 2Sub-Program 3Sub-Program 4
----
3258
--
10813010
-
140188100
Regional Total - 90 248 338
* Sessions refer to group and community initiative activity only.

Setting Priorities in South Australian Community Health I: The Mental Health Program Budget 33
Table 7: Mental Health Program - Client Attendances/Numbers Receiving Services(January - June 1996)
(a) Northern
One to One(Client
Attendances)
Groups(Client
Attendances)
CommunityInitiatives
(Numbers)
Sub-ProgramTotal
Sub-Program 1Sub-Program 2Sub-Program 3Sub-Program 4
73489
--
6463558
-
591538
1161264
66246621219264
Regional Total 3496 757 2554 6807
(b) Central
One to One(Client
Attendances)
Groups(Client
Attendances)
CommunityInitiatives
(Numbers)
Sub-ProgramTotal
Sub-Program 1Sub-Program 2Sub-Program 3Sub-Program 4
-4917
--
437120440
-
101324
187788
14505061627788
Regional Total 4917 997 2012 7926
(c) Noarlunga
One to One(Client
Attendances)
Groups(Client
Attendances)
CommunityInitiatives
(Numbers)
Sub-ProgramTotal
Sub-Program 1Sub-Program 2Sub-Program 3Sub-Program 4
-6419
--
225385
--
47831379
-
7037117
790
Regional Total 6419 610 870 7899

Setting Priorities in South Australian Community Health I: The Mental Health Program Budget 34
Table 8: Mental Health Program - Service Type Total Number of Sessions* byRegion, and as a Percentage of All Adelaide Mental Health Total (January -June 1996)
One to One Groups CommunityInitiatives
RegionalProgram
Total Sessions
Sessions (%) Sessions (%) Sessions (%) Sessions
(%)
NorthernCentralNoarlunga
---
---
8610490
4.95.95.1
848374248
48.521.414.2
934478338
53.427.319.3
All Adelaide - - 280 15.9 1470 84.1 1750 100
* Sessions refer to group and community initiative activity only.
Table 9: Mental Health Program - Service Type Total Client Attendances/NumbersReceiving Services by Region, and as a Percentage of All Adelaide MentalHealth Total (January - June 1996)
One to One Groups CommunityInitiatives
RegionalProgram Total
Attends/Nos.
(%) Attends/Nos.
(%) Attends/Nos.
(%) Attends/Nos.
(%)
NorthernCentralNoarlunga
349649176419
15.521.728.4
757997610
3.34.42.7
25542012870
11.38.93.8
680779267889
30.135.034.9
All Adelaide 14832 65.6 2364 10.4 5436 24.0 22632 100
Table 10: Mental Health Program - Sub-Program Total Number of Sessions* byRegion (January - June 1996)
Sub-Program 1
Sub-Program 2
Sub-Program 3
Sub-Program4
RegionalProgram Total
Sessions Sessions Sessions Sessions Sessions
NorthernCentralNoarlunga
229185140
10837
188
4426310
155193
0
934478338
All Adelaide 554 333 515 348 1750
* Sessions refer to group and community initiative activity only.

Setting Priorities in South Australian Community Health I: The Mental Health Program Budget 35
Table 11: Mental Health Program: Sub-Program Total Number of Sessions* byRegion as a Percentage of All Adelaide Total (January - June 1996)
Sub-Program 1
Sub-Program 2
Sub-Program 3
Sub-Program 4
Regional ProgramTotal
(%) (%) (%) (%) (%)
NorthernCentralNoarlunga
13.110.68.0
6.22.1
10.8
25.33.60.1
8.911.0
0
53.527.318.9
All Adelaide 31.7 19.1 29.0 19.9 100
* Sessions refer to group and community initiative activity only.
Table 12: Mental Health Program - Sub-Program Total Client Attendances/NumbersReceiving Services by Region (January - June 1996)
Sub-Program 1
Sub-Program2
Sub-Program3
Sub-Program 4
RegionalProgram
Total
Attends/Nos Attends/Nos Attends/Nos Attends/Nos Attends/Nos.
NorthernCentralNoarlunga
6621450703
466250617117
121962779
264788
0
680779267899
All Adelaide 2815 16840 1925 1052 22632
Table 13: Mental Health Program: Sub-Program Total Client Attendances/NumbersReceiving Services by Region as a Percentage of All Adelaide Total(January - June 1996)
Sub-Program 1
Sub-Program 2
Sub-Program 3
Sub-Program 4
Regional ProgramTotal
(%) (%) (%) (%) (%)
NorthernCentralNoarlunga
2.96.43.1
20.622.431.5
5.42.80.0
1.23.50
30.135.134.6
All Adelaide 12.4 74.5 8.2 4.7 100

Setting Priorities in South Australian Community Health I: The Mental Health Program Budget 36
5.2 Costs
Prior to this study cost data was only collected in standard accounting format forCommunity Health in metropolitan South Australia, with costs appearing in input basedcost centres in the health service accounts. The purpose of the program budget is totake input based cost data, and use it to construct cost estimates for services provided.To achieve this a costing model was needed, as no service based cost information wasavailable. It was important that any costing model was developed in conjunction with themanagement committee if cost estimates were to hold credibility with service providersand planners. Moreover, the committee’s judgement on resource use issues in servicedelivery is often vital in developing a costing model, as accurate resource use informationis frequently unavailable or extremely time consuming to obtain.
The committee received training about the nature of the different types of costs, and theirimportance in setting priorities and planning services. Two sets of distinctions in types ofcosts were made for the group: between direct, indirect, and overhead costs; andbetween fixed, semi-fixed, and variable costs. The distinctions are:
Direct costs Costs which can be directly attributed to activity
Indirect costs Costs which can indirectly be attributed to activity
Overhead costs Costs for which there is no information on the linkbetween resource use and the individuals who receivebenefits from those resources
Fixed costs Costs which do not vary with activity over the decisionperiod (usually a year)
Semi-fixed costs Costs which vary unevenly with activity
Variable costs Costs which vary directly with activity
The relative merits of the bottom up costing method verses the top down method todevelop a costing model were then presented. The bottom up method usesdisaggregated resource use data for the different inputs used in the provision of eachservice to provide a cost estimate, whereas the top down method uses aggregated dataand allocation rules to apportion costs to services. Whilst the bottom up method tends toprovide more accurate estimates of service costs, it has large data requirements. Thetop down method gives slightly less accurate estimates but with significantly reduceddemands on the data. The committee was also presented with possible suggestions forallocation rules if the top down method was to be employed.

Setting Priorities in South Australian Community Health I: The Mental Health Program Budget 37
At first, the committee found the task of deciding upon the appropriate cost model quitedifficult, particularly in determining which allocation rules to adopt, and whichassumptions may be reasonable to make in constructing cost estimates. Followingdiscussion by the committee, Northern Region again agreed to take the lead andconstruct a costing methodology following the principles outlined above. Theirmethodology was based on a combination of the top down and bottom up approaches,due to difficulties in obtaining disaggregated data on all areas of resource use. Themethodology was then presented to the management committee, and the model wassubsequently adopted across all three Community Health regions. The costing modeldistinguished between direct, indirect, and overhead costs.
(i) Direct Costs
Within the context of this study it became evident that disaggregated data linkingresource use to individual services was only available for the time workers spent in directcontact with individuals receiving services. In many cases direct worker time spent onthe provision of services was available on the Community Health CHSS informationsystem. Direct worker time is defined as the time a Community Health service providerspends actually providing a given service to individuals. Where data was not recordedon the CHSS system the committee felt it could, in conjunction with service providers,give reasonable estimates of the direct worker time spent in providing services forindividuals. As a result the bottom up approach was used in estimating the costs ofworker time spent directly providing services, with the remaining costs allocated toindividual services under the top down approach.
Each region provided data on the direct worker hours spent in contact with individualsreceiving the service. These data were applied to an hourly cost for the worker based ona wage rate estimate, with adjustments for the employers contribution to superannuation,annual leave loading, sick leave, and workers compensation levy. These adjustmentswere based on the South Australian Health Commission’s “on-cost” recharge policy.
The management committee decided that it was inappropriate to base the wage rateestimate for different services on different staff grades, as the staff member(s) whoactually provided a given service varied according to the availability and the particularinterests and expertise of staff, and not according to their grade or level of experience.The management committee therefore decided to use a representative wage rateestimate for all services, intended to reflect the average wage rate across serviceproviders. The committee chose this representative wage rate to be approximately themid-point of the ASO5/PSO2 salary scale, at a basic wage rate of $23.00 per hour.

Setting Priorities in South Australian Community Health I: The Mental Health Program Budget 38
The hourly estimate for direct worker time was then calculated as:
Basic wage rate: $23.00
“On-cost” component (% of basic wage rate)
Superannuation (minimum SA Govt. contribution) 6.0%Annual Leave and Leave Loading 8.5%Sick Leave 2.5%
Administration and Workers Compensation 3.0%
Total “on-costs” 20.0%
Giving an hourly estimated cost = $23.00 x 1.2 = $27.60 per hour
For one to one services this hourly cost estimate was applied directly to the number ofhours spent by workers in contact with individuals. For groups the total direct workertime in contact with the group was calculated as the total number of sessions multipliedby the hours per session multiplied by the number of workers involved, and the hourlycost was then applied to this total group contact time. For community initiatives the totaldirect worker time in contact with participants was calculated as the total number of hoursfor the activity multiplied by the number of workers involved at sessions, and the hourlycost was then applied to this total.
(ii) Indirect costs
Indirect costs in the program budget include the costs of additional worker time spentoutside of direct contacts with individuals, in preparing services, advocacy, and follow upafter services have been provided. The management committee agreed on an estimatethat for every hour a worker spends in direct service provision (in contact withindividuals), another hour is spent on preparation, writing of notes, data collection, andfollow up. Indirect worker costs were then calculated as being 100 per cent of directworker costs, yielding an estimated total worker cost (direct and indirect) which wasequal to double the direct worker cost.
(iii) Overheads
Overheads consisted of the costs of administration and clerical staff, and of goods andservices. The committee decided, following discussion about the Northern Region’sapproach to overheads, on allocation rules for each of these two areas of overheads.The decision was that 75 per cent of all Community Health administration and clericalstaff time could reasonably be attributed to the support of service delivery, and equallythat 75 per cent of Community Health goods and services were used in service support.The remaining 25 per cent of both areas of overheads was allocated to infrastructurenecessary for the running of Community Health as a whole, and were not included in thecosts of services in the program budget. Elements included in goods and services variedslightly across the three regions, but in general included motor vehicle expenses, buildingleases, information technology, equipment and repairs, supplies, food, photocopying,advertising, telephones and postage, and power.

Setting Priorities in South Australian Community Health I: The Mental Health Program Budget 39
To obtain estimates of the overhead costs of individual services, the committee thenneeded to adopt an allocation rule for apportioning the overheads for service support tothe mental health program as a whole, and to services within that program. Twosuggestions were made for the allocation rule: direct worker hours, or numbers ofclients/participants. The committee decided to use direct worker hours as the basis ofallocating overheads, but to also develop a cost model using numbers ofclients/participants for comparison. However, the second model could not be used asdata for unique clients across all three regions was incomplete. As a result the costingmodel presented here only used direct worker hours as the basis for allocatingoverheads.
Overheads were allocated to the whole mental health program on the basis of theproportion of all Community Health direct worker hours which were spent in the provisionof mental health services. The allocation percentages for the three regions were:
Northern 38.07%Central 26.30%Noarlunga 30.00%
The figures for Northern and Central were based on CHSS data and worker advice ondirect worker hours. Full CHSS data for Noarlunga was not available however, and the30 per cent figure is based on the region’s estimate of the proportion of worker timespent in mental health. Application of this allocation rule gave an overhead total for themental health program. The proportion of direct worker hours spent on each service ofthe total direct worker hours for each region’s mental health program was then used toallocate overheads to individual services. This proportion was then applied to eachregion’s estimate of mental health program overheads. The mental health program directworker hours and overheads for each region were:
Program direct worker hours Program Overheads
Northern 5428 $260,796Central 7387 $237,315Noarlunga 4259 $167,357
Estimates of the total cost for each service consisted of the sum of direct, indirect, andoverhead costs. Total costs for all individuals mental health services in the program, forthe period January to June 1996, are shown in Appendix 3 in tables A5 to A7 (Northern),tables A17 to A20 (Central), and A28 to A30 (Noarlunga). The approaches andassumptions used in costing services varied slightly between regions, and details ofthese differences are provided in the notes for Appendix 3. Presented below is summaryinformation relating to the program budget and mental health services provided byCommunity Health in Adelaide over the period January 1996 to June 1996. Table 14shows the mental health program total costs for each region by service type and sub-program. Tables 15 and 16 show the mental health program total costs by service typeacross the whole of Adelaide, and table 17 and 18 show the mental health program totalcosts by sub-program across Adelaide.

Setting Priorities in South Australian Community Health I: The Mental Health Program Budget 40
Table 14: Mental Health Program - Service Type and Sub-Program Total Costs, andas a Percentage of Regional Program Total Costs (January - June 1996)
(a) Northern
One to One Groups CommunityInitiatives
Sub-ProgramTotal Cost
Cost ($) (%) Cost ($) (%) Cost ($) (%) Cost ($) (%)
Sub-Program 1Sub-Program 2Sub-Program 3Sub-Program 4
878239,525
--
0.242.7
--
5,98828,0821,239
-
1.15.00.2
-
61,7459,963
157,09855,924
11.01.8
28.010.0
68,610277,570158,33755,924
12.349.528.210.0
Regional Total 240,403 42.9 35,309 6.3 284,730 50.8 560,442 100
Costs presented here are based on the costing model developed for the PBMA study, and should beinterpreted in light of the context of this study and the methodology adopted. They do not representunit costs derived from an individual level costing exercise.
(b) Central
One to One Groups CommunityInitiatives
Sub-ProgramTotal Cost
Cost($) (%) Cost ($) (%) Cost ($) (%) Cost ($) (%)
Sub-Program 1Sub-Program 2Sub-Program 3Sub-Program 4
-429,382
--
-66.6
--
18,4693,4938,820
-
2.90.51.4
-
83,1349,7816,724
85,274
12.91.51.0
13.2
101,604442,65615,54485,274
15.868.62.4
13.2
Regional Total 429,382 66.6 30,782 4.8 184,913 28.7 645,077 100
Costs presented here are based on the costing model developed for the PBMA study, and should beinterpreted in light of the context of this study and the methodology adopted. They do not representunit costs derived from an individual level costing exercise.
(c) Noarlunga
One to One Groups CommunityInitiatives
Sub-ProgramTotal Cost
Cost ($) (%) Cost ($) (%) Cost ($) (%) Cost ($) (%)
Sub-Program 1Sub-Program 2Sub-Program 3Sub-Program 4
-334,322
--
-83.1
--
7,56013,701
--
1.93.4
--
20,41224,5691,890
-
5.16.10.1
-
27,972372,592
1,8900
7.092.60.1
0
Regional Total 334,322 83.1 21,261 5.3 46,871 11.3 402,454 100
Costs presented here are based on the costing model developed for the PBMA study, and should beinterpreted in light of the context of this study and the methodology adopted. They do not representunit costs derived from an individual level costing exercise.

Setting Priorities in South Australian Community Health I: The Mental Health Program Budget 41
Table 15: Mental Health Program - Service Type Total Costs by Region (January -June 1996)
One to One Groups CommunityInitiatives
Regional ProgramTotal Cost
Cost ($) Cost ($) Cost ($) Cost ($)
NorthernCentralNoarlunga
240,403429,382334,322
35,30930,78221,261
284,730184,91346,871
560,442645,077402,454
All Adelaide 1,004,107 87,352 516,514 1,607,973
Costs presented here are based on the costing model developed for the PBMA study, and should beinterpreted in light of the context of this study and the methodology adopted. They do not representunit costs derived from an individual level costing exercise.
Table 16: Mental Health Program - Service Type Total Costs by Region as aPercentage of All Adelaide Total Cost (January - June 1996)
One to One Groups CommunityInitiatives
Regional ProgramTotal Cost
(%) (%) (%) (%)
NorthernCentralNoarlunga
15.026.720.8
2.21.91.3
17.711.52.9
34.940.125.0
All Adelaide 62.5 5.4 32.1 100
Costs presented here are based on the costing model developed for the PBMA study, and should beinterpreted in light of the context of this study and the methodology adopted. They do not representunit costs derived from an individual level costing exercise.
Table 17: Mental Health Program - Sub-Program Total Costs by Region (January -June 1996)
Sub-Program 1
Sub-Program 2
Sub-Program 3
Sub-Program 4
Regional ProgramTotal Cost
Cost ($) Cost ($) Cost ($) Cost ($) Cost ($)
NorthernCentralNoarlunga
68,610101,60427,972
277,570442,656372,592
158,33715,5441,890
55,92485,274
-
560,442645,077402,454
All Adelaide 198,186 1,092,818 175,771 141,198 1,607,973
Costs presented here are based on the costing model developed for the PBMA study, and should beinterpreted in light of the context of this study and the methodology adopted. They do not representunit costs derived from an individual level costing exercise.

Table 18: Mental Health Program - Sub-Program Total Costs by Region as aPercentage of All Adelaide Total Cost (January - June 1996)
Sub-Program 1
Sub-Program 2
Sub-Program 3
Sub-Program 4
Regional ProgramTotal Cost
(%) (%) (%) (%) (%)
NorthernCentralNoarlunga
4.36.31.7
17.327.523.2
9.91.00.1
3.55.3-
34.940.125.0
All Adelaide 12.3 68.0 10.9 8.8 100
Costs presented here are based on the costing model developed for the PBMA study, and should beinterpreted in light of the context of this study and the methodology adopted. They do not representunit costs derived from an individual level costing exercise.
The following tables show average cost figures from the program budget. Table 19shows the all Adelaide and regional average costs per client attendance (one to oneservices and groups)/per individual receiving services (community initiatives) by servicetype, and table 20 shows the all Adelaide and regional average costs per clientattendance/per individual receiving services by sub-program.
Table 19: Mental Health Program - Service Type Average Cost per clientattendance/individual receiving service by Region (January - June 1996)
One to One Groups CommunityInitiatives
Regional ProgramAve Cost
Cost ($) Cost ($) Cost ($) Cost ($)
NorthernCentralNoarlunga
68.7787.3352.08
46.6430.8834.85
111.4891.9153.88
82.3381.3951.02
All Adelaide 67.70 36.95 95.07 71.05
Costs presented here are based on the costing model developed for the PBMA study, and should beinterpreted in light of the context of this study and the methodology adopted. They do not representunit costs derived from an individual level costing exercise.
Table 20: Mental Health Program - Sub-Program Average Costs per clientattendance/individual receiving service by Region (January - June 1996)
Sub-Program 1
Sub-Program 2
Sub-Program 3
Sub-Program 4
Regional ProgramAve Cost
Cost ($) Cost ($) Cost ($) Cost ($) Cost ($)
NorthernCentralNoarlunga
103.6470.0737.79
59.5487.4652.35
129.8924.7923.92
211.83108.22
-
82.3381.3951.02
All Adelaide 70.40 64.89 91.31 134.22 71.05
Costs presented here are based on the costing model developed for the PBMA study, and should beinterpreted in light of the context of this study and the methodology adopted. They do not representunit costs derived from an individual level costing exercise.

Setting Priorities in South Australian Community Health I: The Mental Health Program Budget 43
In developing the costing model for mental health services several areas of resource usewere identified which could only be partially addressed in the costing methodology used,and within the remit of this study.
(i) Infrastructure costs 25 percent of administration and goods and services costs were allocated to
infrastructure costs. These are the costs of running the infrastructure necessary tosupport the whole of community health. Infrastructure costs were not allocated toindividual services in the costing model. As a result service cost estimates are not thefull costs of providing services. The intention of the study was not to develop unitcosts for purchasing decisions, and the cost estimates should not be regarded as unitcosts. The cost estimates were developed for management and planning informationwithin the confines of existing cost information and knowledge. A larger costing studywould be able to address the issue of infrastructure costs more fully.
(ii) Worker time spent in planning services and in systems administration The costing model could not fully pick up the time workers spent in planning and
preparing individual services, and the time spent in administering the CommunityHealth Service system. Such time includes planning meetings, liaison with otherproviders and agencies, networking, and multidisciplinary meetings etc. Some of thistime will have been picked up in direct costs. However, significant part of this timewill have not been included in the service cost estimates, and included instead ininfrastructure costs (and hence will not appear in service cost estimates).
(iii) Community volunteer time Cost estimates relate only to the costs to the Community Health Sector. The costs to
community volunteers of the time they spend in providing services and support ofservices has not been included in this study. Community volunteer time may be asignificant input into some services, and may be crucial in the provision of suchservices. A more detailed costing study would seek to determine the size andimportance of community volunteer time in service delivery.
(iv) Inter-sectoral links Some Community Health services are provided in conjunction with other government and
non-government health and social service agencies. Again, the costs associated withnon Community Health Sector inputs in service were not considered in this study.Such inputs may be large, and important in the provision of a range of services.
(v) Capital and buildings
The costs of building space were not considered as part of this study. Arrangementsconcerning ownership and leasing of buildings vary between regions and CommunityHealth Centres. A more detailed cost study would explore these costs more fully.

Setting Priorities in South Australian Community Health I: The Mental Health Program Budget 44
6 CONCLUSIONS AND RECOMMENDATIONS
The main purpose of constructing the program budget is to provide information for themarginal analysis section of PBMA, which looks directly at issues around priorities inhealth services and options for change in the future. Whilst it has been suggested thatconstruction of the program budget is not necessary to undertake marginal analysis,experiences from this pilot suggest, at least in the context of this study, that the processof constructing the program budget is vital for the undertaking of marginal analysis. Theprocess of constructing the program budget involved clarifying Community Healthobjectives and the nature of mental health services in the context of Community Health.The program budget gave the first clear guidelines to which Community Health servicesmay be considered as mental health services, and linked cost and activity data to thoseservices. Without this process priority setting would have been beset with problems indefinitional issues, in identifying services to be considered as mental health services, andin estimating the activity and resource implications of future levels of services. In such asituation it is doubtful that a marginal analysis study would be fully informed which couldlimit the usefulness of the planning information generated by the study.
Indeed the process of constructing the program budget has been important in its ownright. Construction of the program budget has involved service providers directlyaddressing their objectives in providing services, and specifically the objectivesunderpinning mental health services. If strategic planning of health services is to beadvanced it is clear that both health authorities and service providers will need to clarifytheir objectives underlying the services they provide, not least to assess whether theobjectives of health services coincide with the desires of the community they serve.
During the process of constructing the program budget a significant change in theorganisational culture of Community Health was also facilitated, and a large number ofnew issues and concepts were introduced which will help inform Community Healthplanning both now, and in the future. The process has raised service providersawareness of costs (and hopefully opportunity costs), activity levels, and outcomes inCommunity Health planning. Within the Community Health sector the process hasprovided an increased emphasis on strategic approaches to priorities and planning. Thisis leading to a move away from implicit (and potentially ad hoc) decision making, to moreexplicit and transparent decision making in planning health services.
The project has established the need for an ongoing framework for the collection ofactivity information, and has included the development of a new costing methodology forCommunity Health. This framework was developed as a common model for all threeCommunity Health service regions within the context of this study. The project will alsoinform the development of a new Community Health information system in SouthAustralia. In developing this framework, the project has also raised a number of issues.They include the need for the development of an integrated model for data collection toprovide consistent information across regions, the identification of areas where costmodeling should be refined, and the need for more qualitative and quantitative researchon outcomes in Community Health.

Setting Priorities in South Australian Community Health I: The Mental Health Program Budget 45
The program budget has provided a guide to assessing the relative balance betweenindividual services provided, and between sub-programs, across all Community Healthmental health services in Adelaide. This information is vital for strategic planning inhealth services. However, the program budget in its own right is not sufficient todetermine whether the balance between services provided is the appropriate balance.To determine the appropriate balance consideration of the benefits and the costs ofservices provided is necessary. The benefits and costs of selected Community Healthmental health services are to be addressed by the marginal analysis phase of this pilotstudy.
On completion of this phase of the first PBMA pilot in mental health we would like tomake the following recommendations:
• That strategic based planning moves away from an input based focus to anoutcome based focus, using programs which are consistent with the objectivesand organisation of Community Health Services in metropolitan South Australia.
• That resources are made available for the data collection and analysis required to
construct, and potentially implement, a program budgeting planning model inCommunity Health Services.
• That further research be conducted into to needs for, and the outcomes from,
Community Health Services in metropolitan South Australia, to inform strategicplanning and to improve the welfare of the population through the provision ofcost-effective health services.
• That work is undertaken to establish the size and importance of links with other
government and non-government agencies in the provision of Community HealthServices.
• That work is undertaken to establish the size and importance of service provision
by unpaid community members and volunteers of the community as part of, or asa result of Community Health Services.
• That the costing model should be refined in the future, especially in relation to
gathering data on worker time spent in preparation, follow up, and advocacy; thata common costing model is applied across all three regions; and that further workis undertaken to determine the costs of capital to Community Health with respectto the costs of building space. The costing model for PBMA should be developedjointly by the Community Health Sector and the SAHC, following economicprinciples.
• That information technology systems be developed which are responsive to boththe requirements of strategic planning and financial and management accounting.

Setting Priorities in South Australian Community Health I: The Mental Health Program Budget 46
• That, whilst members of the Pilot Study Management Committee have receivedtraining and education in priority setting methods, further education, training, anddissemination of knowledge is needed throughout Community Healthorganisations in South Australia.
• That the areas where difficulties in gathering cost and activity data outlined in the
text and appendices of this report inform the development of the new SouthAustralian Community based Health information system (the CHIME project),specifically:
• The new information system should provide consistent information acrossall Community Health Service region to be of use in strategic planning.Data fields should be common for all regions with the same definitions foractivity and worker time information, and should include the introduction ofa single set of reason for attendance codes across all regions.
• Worker time spent in contact with clients/participants should be routinely
collected for all regions.
• Worker time spent in preparation, follow up, and advocacy should beroutinely collected for all regions.
• Activity information for one to one, group, and community initiatives should
be routinely collected for all regions.

Setting Priorities in South Australian Community Health I: The Mental Health Program Budget 47
References
Baum F, Fry D, Lennie I 1992, Community Health Policy and Practice in Australia, PlutoPress Australia, Leichhardt NSW.
Cohen D 1994, ‘Marginal analysis in practice: an alternative to needs assessment forcontracting health care’, British Medical Journal, vol 309, pp 781-785.
Cohen D 1995, ‘Messages from Mid Glamorgan: a multi-programme experiment withmarginal analysis’, Health Policy, vol 33, pp 147-155.
Craig N, Parkin D, Gerrard K 1995, ‘Clearing the fog on the Tyne: Programme budgetingin Newcastle and North Tyneside Health Authority’, Health Policy, vol 33, pp 107-125.
Donaldson C 1995, ‘Economics, public health and health care purchasing: reinventing thewheel?’, Health Policy, vol 33, pp 79-90.
Donaldson C, Farrar S 1993, ‘Needs assessment: developing an economic approach’,Health Policy, vol 25, pp 95-108.
Donaldson C, Mooney G 1991, ‘Needs assessment, priority setting, and contracts forhealth care: an economic view’, British Medical Journal, vol 303, pp 1529-1530.
Jones C, Wright, K 1995, Programme budgeting revisited: special reference to peoplewith learning disabilities, Centre for Health Economics, Discussion Paper 127, Universityof York.
Mooney G 1977, ‘Programme budgeting in an area health board’, Hospital and HealthServices Review, pp 379-384.
Mooney G, Gerard K, Donaldson C, Farrar S 1992, Priority setting in purchasing: Somepractical guidelines. NAHAT Research Paper 6, Health Economics Research Unit,University of Aberdeen.
Peacock S, Richardson J, Carter R 1997, Setting Priorities in South AustralianCommunity Health II: Marginal Analysis of Mental Health Services, Research Report 14,Centre for Health Program Evaluation, Monash University, Melbourne.
Posnett J, Street A 1996, ‘Programme budgeting and marginal analysis: an approach topriority setting in need of refinement’, Journal of Health Service Research and Policy,vol 1, pp 1-7.

Setting Priorities in South Australian Community Health I: The Mental Health Program Budget 48
Shiell A, Hall J, Stephen J, Seymour J 1993, Advancing Health in NSW: Planning in aneconomic framework, Discussion Paper 23, CHERE, University of Sydney.
Steele R, Gray A 1980, ‘Beyond the programme budget: Economics and resourceplanning in the NHS’, Hospital and Health Services Review, pp 96-101.
Twaddle S, Walker A 1995, ‘Programme budgeting and marginal analysis: applicationwithin programmes to assist purchasing in Greater Glasgow Health Board’, Health Policy,vol 33, pp 91-105.
World Health Organisation 1986, ‘Ottawa Charter for Health Promotion’, HealthPromotion International, vol 1 no 4, pp i-iv.

Setting Priorities in South Australian Community Health I: The Mental Health Program Budget 49
Appendix 1
Pilot Study Management Committee Membership
Mr Richard Hicks (Chairperson) (Noarlunga Health Services)Ms Roslyn Street (Noarlunga Health Services)Ms Sandy Edwards (Noarlunga Health Services)Mr Geoff Evans (Noarlunga Health Services)Ms Raven North (Northern Metropolitan CHS)Ms Cathy LeCornu (Northern Metropolitan CHS)Ms Bron Marie (Northern Metropolitan CHS)Ms Rosie Bonnin (Adelaide Central CHS)Mr Matt Dougherty (Adelaide Central CHS)Ms Pam Quick (Adelaide Central CHS)Ms Joanne Gell (Purchasing Office, SAHC)Mr Ian Hender (Purchasing Office, SAHC)Ms Nancy McWaters (Project Manager) (Purchasing Office, SAHC)Ms Alexandra Hurley (Project Assistant) (Purchasing Office, SAHC)Mr Stuart Peacock (Academic Consultant) (Health Economics Unit, Monash University)
Project Steering Committee Membership
Ms Marguerite Tohl (Chairperson) (Purchasing Office, SAHC)Mr Richard Hicks (Noarlunga Health Services)Ms Liz Fudge (Noarlunga Health Services)Ms Adaire Garrett (Northern Metropolitan CHS)Ms Raven North (Northern Metropolitan CHS)Ms Marj Ellis (Adelaide Central CHS)Ms Claire Shuttleworth (Adelaide Central CHS)Mr Rob Carter (Health Economics Unit, Monash University)Mr Richard Cooke (South Australian Community Health
Research Unit)Ms Nancy McWaters (Project Manager) (Purchasing Office, SAHC)Mr Stuart Peacock (Academic Consultant) (Health Economics Unit, Monash University)

Setting Priorities in South Australian Community Health I: The Mental Health Program Budget 50
Appendix 2
Service Descriptions
A2.1 Northern Metropolitan Community Health Service
SUB PROGRAM 1
Emotional/Mental Health - GeneralPrograms which address a wide range of emotional and mental health issues. Usually ascombinations. Eg. Stress/anxiety, self esteem/confidence, body image, sexuality.
Emotional/Mental Health Vietnamese WomenActivities which address emotional and mental health issues for Vietnamese Women.
Panic Attacks/Agoraphobia Drop-In Centre-Salisbury WestRegular Drop in Service for clients dealing with panic attacks and/or agoraphobia.
Body Image - GeneralProgram aimed at developing a healthy body image.
Cambodian Women’s Group - Salisbury WestProgram which address various health issues for women from Cambodia.
Isolation - GeneralProgram to reduce the isolation felt by member of our community. Isolation may becultural, economic, geographical, educational etc.
Cambodian elderly Group - Salisbury WestProgram to meet the emotional and mental health needs for the elderly members of theCambodian community.
SUB PROGRAM 2
Relationships - GeneralActivities which deal with relationship issues.
Cancer Support GroupProgram to assist clients with cancer, their carers and loved ones with coping withterminal illness and bereavement.
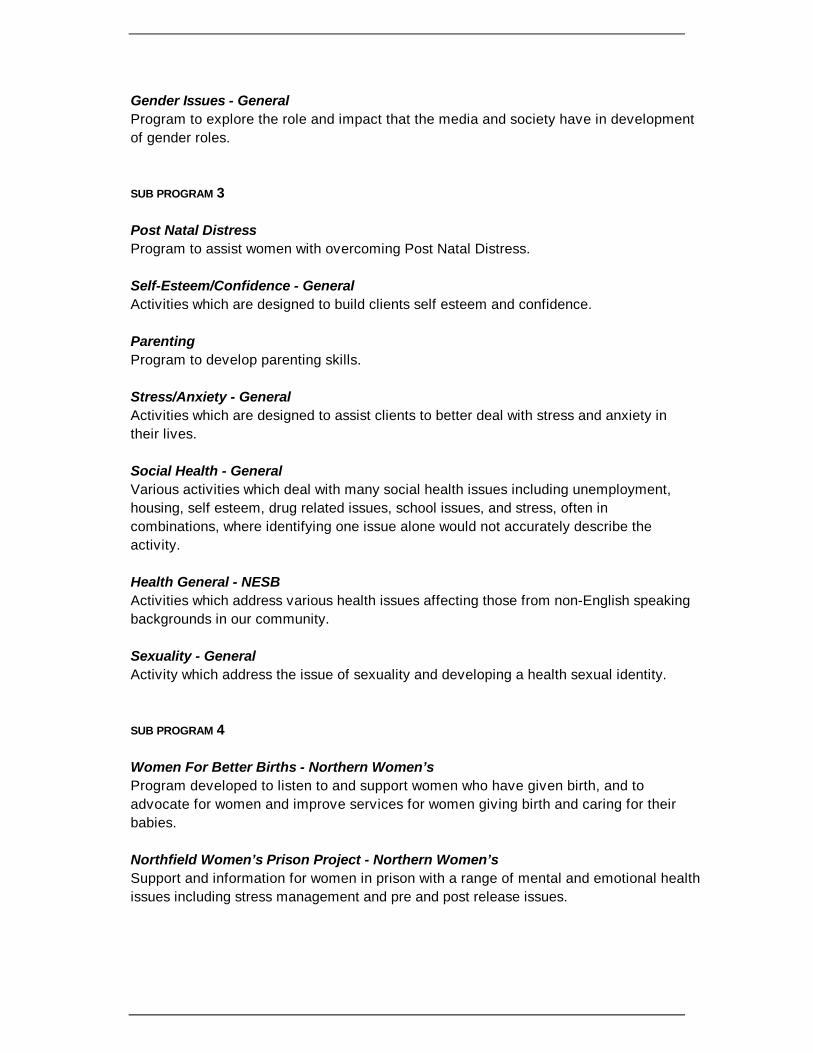
Setting Priorities in South Australian Community Health I: The Mental Health Program Budget 51
Gender Issues - GeneralProgram to explore the role and impact that the media and society have in developmentof gender roles.
SUB PROGRAM 3
Post Natal DistressProgram to assist women with overcoming Post Natal Distress.
Self-Esteem/Confidence - GeneralActivities which are designed to build clients self esteem and confidence.
ParentingProgram to develop parenting skills.
Stress/Anxiety - GeneralActivities which are designed to assist clients to better deal with stress and anxiety intheir lives.
Social Health - GeneralVarious activities which deal with many social health issues including unemployment,housing, self esteem, drug related issues, school issues, and stress, often incombinations, where identifying one issue alone would not accurately describe theactivity.
Health General - NESBActivities which address various health issues affecting those from non-English speakingbackgrounds in our community.
Sexuality - GeneralActivity which address the issue of sexuality and developing a health sexual identity.
SUB PROGRAM 4
Women For Better Births - Northern Women’sProgram developed to listen to and support women who have given birth, and toadvocate for women and improve services for women giving birth and caring for theirbabies.
Northfield Women’s Prison Project - Northern Women’sSupport and information for women in prison with a range of mental and emotional healthissues including stress management and pre and post release issues.

Setting Priorities in South Australian Community Health I: The Mental Health Program Budget 52
Cambodian Working Party - Salisbury WestInteragency Working Party who’s aim is to develop guidelines for culturally appropriateservice delivery to the Cambodian Community.
Community Action - GeneralActivities to assist the community respond to health system issues which impact on theirhealth.
Community ParticipationActivities aimed at increasing community participation in all areas of service provisionincluding identifying needs and development of appropriate services.
Youth Participation Project - Tee Tree GullySelf help program developed to assess the issues for your people in the Tee Tree Gullyarea. This included the Boredom Survey and looking at youth space and school holidayprograms.
Supportive Environment - GeneralRange of programs aimed at providing supportive environment for community members.
A2.2 Adelaide Central Community Health Service
SUB PROGRAM 1
Taperoo Young Mums Reference GroupWomen meeting monthly to address mental health and other issues as a group.
Promoting Mentally Healthy Communities ProjectMental Health Women’s group - fortnightly - skills development, information.
I.P.P.O.N.St Peter’s/Norwood, Isolated and Homeless Persons group meeting to address healthissues.
McMhap ProjectMulti-cultural Mental Health Access Project now incorporated to increase access andaddress issues initially with Vietnamese, Chinese, Polish and Cambodian Communities.
Assertiveness and ConfidenceCOPE lead course - 4-6 sessions.
Women, Health & Well-beingCOPE lead course - 4-6 sessions increasing awareness of Mental Health issues andhealth promotion lifestyles.

Setting Priorities in South Australian Community Health I: The Mental Health Program Budget 53
SUB PROGRAM 2
Take a Break GroupWomen’s group - take a break from the children - discussions and outings.
Great Expectations GroupIssues of post natal depression addressed in a group setting.
Aboriginal Family Health & Well-being ProgrammeMixture of groups - community initiatives meeting the needs of Western Nungapopulation.
SUB PROGRAM 3
Promoting Mentally Healthy Communities Project• Mental Health Friendly Club - once a month for isolated men addressing mental
health issues.• Mental Health Music Club - promotes mental health music groups with SAMHS.• Mental Health Travel Club - organise trips ad theatre outings for mental health
groups.
Decrease Social Isolation Groups• Krinkly Wobblies - Elders• OWLS - decrease social isolation by outings - groups and individual sessions.• Tuesday Social Group - fortnightly group for the housebound elderly.• Silver Threads - activities of the socially isolated.
SUB PROGRAM 4
WOWSafe - Action GroupWomen of the West meet as an action group to help promote the health and safety ofwomen particularly regarding family safety around domestic violence issues.
Aged Homeless Working PartyGroup addressing the needs of homeless people particularly in the city area.
Inner City Homeless Health Network Project• Better Health Homeless Programme• Inner City Homeless- Group and individual programmes to meet the needs of homeless people and
promote health. Information screening and group sessions are general cityvenues.
A2.3 Noarlunga Health Services

Setting Priorities in South Australian Community Health I: The Mental Health Program Budget 54
SUB PROGRAM 1
Self Healing - Letting Go of the PainAims to provide information on the short and long term effects of trauma. Providenurturing and supportive environment to allow participants to safely explore past traumasand the effects they have had on their lives. Identify and recognise the qualities and skillswhich have allowed participants to cope.
Stress Management and RelaxationEach session provides half to three quarters of an hour of practical relaxation, threequarters to one hour of education, information sharing, small group work and discussion.
Open Group - The Power of Women’s StoriesThis group is for women to come together for support and to talk about worries, fears,experiences and how they can make us feel “crazy” (especially when they keep goinground and round in your head). By sharing women’s life stories we stop the silencing ofour realities and often find that many others have similar stories to tell.
Assertiveness for Women - Confidence BuildingJust what is this magical thing call “confidence”? The group will explore what confidenceis, what help and hinders and ways to feel better about ourselves.
Youth Answers - Peer Research ProjectAims to work with local youth to improve services fro them and to foster a positive imageof young people in the community.
Women’s Healing CircleAims to reduce the isolation of women by encouraging supportive networks - for womento practise and explore healing skills in a safe supportive environment and to assistparticipants in identifying issues relevant to them.
Young People Drop InProvides informal counselling, access to free pregnancy testing, free condoms available,referrals to other services and information on a range of health issues.
SUB PROGRAM 2
Anxiety Management - Understanding and Coping with AnxietyThis course will utilise cognitive/behavioural techniques to provide participants withinformation and skills training in anxiety management.
Being a Mum and StressedIncludes issues of post-natal depression, stress, parenting and isolation.

Setting Priorities in South Australian Community Health I: The Mental Health Program Budget 55
Men Managing Their AngerIncludes taking responsibility for self and control of violence against a partner.Understand that violence is never justified regardless of provocation. Use of “time out”methods of control.
Improving Self EsteemTo provide participants information about self esteem and offer strategies to entrance apositive self-esteem.
What About You? Support and Fun for MothersAims to form a self supporting network for parents of children with special needs.Provide a safe environment to explore the broader issues of parenting, as well as issuesspecific to parenting children who have special needs. Provide social support and avenue in which participants can share resources, ideas and strategies.
Confidence Building for WomenAims to develop participants ability to appreciate themselves. Increase participantsawareness re women in society. Develop listening skills and assertiveness skills.
Learn to Relax and Manage StressThis is a four week group to learn a variety of ways to relax and manage the day to daystresses of living full, satisfying lives. Women can learn to identify what stresses them,how to change it, and ways of looking after themselves.
Positive ChangesA chance to share ideas, learn some skills, give and receive support in a group-1. Feeling good about yourself (self esteem and confidence building),2. Facing the future (getting started, making changes),3. Taking care of yourself (reducing stress, relaxing).
Time to RelaxThis is a four week group to explore what relaxation means, who needs it, different kindsof relaxation methods, and how to do it. Each session will include one and a half hours ofinformation and discussion plus thirty minutes of practising different relaxation methods.
After Suicide• To provide social support for adults who have been bereaved through suicide.• Normalise grief experiences through education recognitive, behavioural, emotional
and physiological sequelae of bereavement through suicide.• Promote improved psychological functioning through identification of maladaptive
cognition’s/behaviours and education re coping strategies.• Act as referral source for individual/family therapy if indicated or requested.

Setting Priorities in South Australian Community Health I: The Mental Health Program Budget 56
Food With FriendsStage 1 Community involvement in planning initial events to attract target group
members (ie socially isolated community residents eg single parents livingalone, recently single, low income earners and people from non-Englishspeaking backgrounds).
Stage 2 Preparation and running of a series of community meals.
Stage 3 Self management of the group.
Overcoming Post Natal DepressionProvides support and encouragement to women suffering from post natal depression,give information on PND and other relevant issues to assist participants and to provideinformation on other services to refer as appropriate.
Panic and Anxiety Treatment Service (PATS)A treatment program formalised by the Clinical Psychology Department designed toassist people who suffer from anxiety disorders.
Women Supporting WomenA ten week course for women who are interested in extending and developing their skillsin order to provide support to local women on issues that affect their emotional health andwell-being. Participants will have the opportunity to explore these issues within a numberof cultural frameworks and social settings. Discussion will centre around the strategiesthat can be used to provide effective support, the resources that can be utilised and howto take care of yourself in the process.
SUB PROGRAM 3
Coffee and Chat Cafe (Sidewalk Cafe)Come and have a cuppa and a chat. All women and children are welcome.

Setting Priorities in South Australian Community Health I: The Mental Health Program Budget 57
Appendix 3
The Mental Health Program Budget

Setting Priorities in South Australian Community Health I: The Mental Health Program Budget 58
A3.1 Northern Metropolitan Community Health Service

Setting Priorities in South Australian Community Health I: The Mental Health Program Budget 59
Table A1: Service Activity for Sub-Program 1 (January-June 1996)
NORTHERN METROPOLITAN COMMUNITY HEALTH SERVICE
Sub-Program 1 Activity (January – June 1996)
Service No. ofSessions
HoursperSession
No. ofUniqueClients
ClientAttendances
NumberReceivingServices
One to One Services
Registered Client Contacts
Neighbourhood House 7 7
Total One to One Service 7 7
Group Activity
Multi-Cultural Women’s Group 6 12 26
Spanish Speaking Women’s Group 4 12 38
Total Group Activity 10 24 64
Community Initiative Activity
Emotional/Mental Health – General 111 359
Emotional/Mental Health – Viet. Women 34 9
Panic Attack/Agor.Drop-in-Centre SW 37 78
Body Image – General 3 11
Cambodian Women’s Group – SW 16 91
Isolation – General 8 18
Cambodian Elderly Group – SW 10 25
Total Community Initiatives 219 591
TOTAL SUB-PROGRAM 1 229 31 71 591

Table A2: Service Activity for Sub-Program 2 (January-June 1996)
NORTHERN METROPOLITAN COMMUNITY HEALTH SERVICE
Sub-Program 2 Activity (January - June 1996)
Service No. ofSessions
Hours perSession
No. ofUniqueClients
ClientAtten-dances
NumberReceivingServices
One to One Services
Registered Client Contacts
Counselling 567 1409
Unregistered Client Contacts
Counselling 709
Assessment 485
Information 886
Total One to One Service 567 3489
Group Activity
Drop in Centre Panic/Agoraphobia 4 2 15 46
Beginners Meditation 4 2 13 52
Claim your Space with B&T 4 2 13 43
Confidence Building for Women 7 2 18 68
Confidence Building for Women 2 2 8 11
Glance Backwards, Look Forward 6 2.5 14 61
Marvellous Matriarchs Moments 4 2.5 5 18
Motherhood and Myths 5 2 16 52
Self Esteem 8 2 11 68
Self Esteem for Young Women 7 2 11 62
Strategies for Change 6 3 7 30
Stress Management 3 2 16 31
Stress Management 5 2 18 36
Stress Management 4 2 16 48
Stress M’ment and Relax. Seminar 1 2 9 9
Total Group Activity 70 190 635
(Continued on next page)

(Continued from previous page)
Table A2: Service Activity for Sub-Program 2 (January-June 1996)
NORTHERN METROPOLITAN COMMUNITY HEALTH SERVICE
Sub-Program 2 Activity (January - June 1996)
Service No. ofSessions
Hours perSession
No. ofUniqueClients
ClientAtten-dances
NumberReceivingServices
Community Initiative
Relationships – General 3 0
Cancer Support Group 23 534
Gender Issues – General 12 4
Total Community Initiative 38 538
TOTAL SUB-PROGRAM 2 108 757 4124 538

Setting Priorities in South Australian Community Health I: The Mental Health Program Budget 62
Table A3: Service Activity for Sub-Program 3 (January-June 1996)
NORTHERN METROPOLITAN COMMUNITY HEALTH SERVICE
Sub-Program 3 Activity (January - June 1996)
Service No. ofSessions
HoursperSession
No. ofUniqueClients
ClientAttendances
NumberReceivingServices
Group Activity
Health Education for NESB Women 6 2 16 58
Total Group Activity 6 16 58
Community Initiative Activity
Post Natal Distress 58 201
Self Esteem/Confidence – General 96 166
Parenting 5 7
Stress/Anxiety – General 84 229
Social Health – General 43 175
Health General NESB 133 296
Health – General Aboriginal Community 12 59
Sexuality – General 5 28
Total Community Initiatives 436 1161
TOTAL SUB-PROGRAM 3 442 16 58 1161

Setting Priorities in South Australian Community Health I: The Mental Health Program Budget 63
Table A4: Service Activity for Sub-Program 4 (January-June 1996)
NORTHERN METROPOLITAN COMMUNITY HEALTH SERVICES
Sub-Program 4 Activity (January - June 1996)
Service No. ofSessions
HoursperSession
No. ofUniqueClients
ClientAttendances
NumberReceivingServices
Community Initiative Activity
Women for Better Births – NW 10 38
Northfield Women’s Prison Project – NW 4 2
Cambodian Working Party – SW 37 45
Community Action – General 15 32
Community Participation 51 52
Youth Participation Project 14 70
Supportive Environment – General 24 25
Total Community Initiatives 155 264
TOTAL SUB-PROGRAM 4 155 264

Setting Priorities in South Australian Community Health I: The Mental Health Program Budget 64
Table A5: Service Total Costs for Sub-Program 1 (January-June 1996)
NORTHERN METROPOLITAN COMMUNITY HEALTH SERVICE
Sub-Program 1 Costs (January - June 1996)
Service WorkerContactHours
EstimatedWorkerHours
Cost ofWorkerTime$
Infra-structureCosts$
ServiceTotalCost$
One to One
Registered Client Contacts
Neighbourhood House 8.5 17 469 408 878
Total One to One 8.5 17 469 408 878
Groups
Multi-Cultural Women’s Group 36 72 1,987 1,730 3,717
Spanish Speaking Women’s Group 22 44 1,214 1,057 2,271
Total Groups 58 116 3,202 2,787 5,988
Community Initiatives
Emotional/Mental Health – General 302.82 605.64 16,716 14,548 31,264
Emotional/Mental Health – Viet. Women 94.25 188.5 5,203 4,528 9,731
Panic Attack/Agor.Drop-in-Cen-SW 76.31 152.62 4,212 3,666 7,879
Body Image – General 6 12 331 288 619
Cambodian Women’s Group – SW 55.17 110.34 3,045 2,651 5,696
Isolation – General 28 56 1,546 1,345 2,891
Cambodian Elderly Group – SW 35.5 71 1,960 1,706 3,665
Total Community Initiatives 598.05 1196.1 33,012 28,732 61,745
TOTAL SUB-PROGRAM 1 664.55 1329.1 36,683 31,927 68,610
Costs presented here are based on the costing model developed for the PBMA study, and should beinterpreted in light of the context of this study and the methodology adopted. They do not representunit costs derived from an individual level costing exercise.
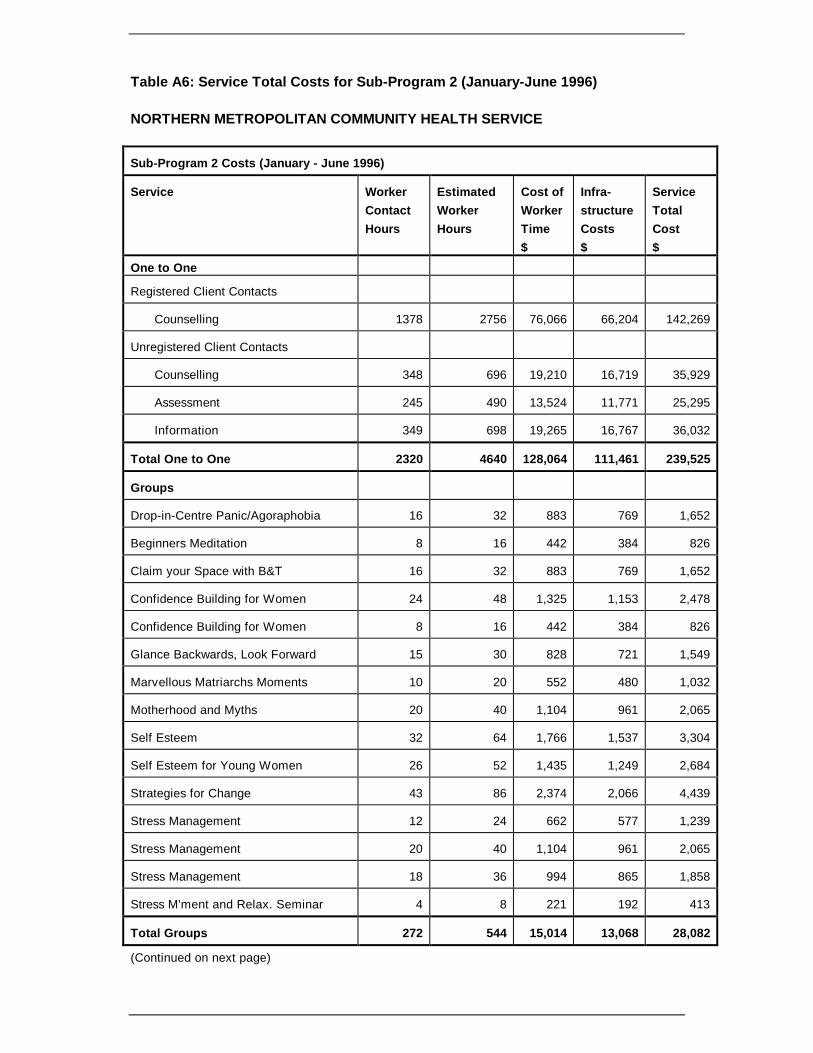
Setting Priorities in South Australian Community Health I: The Mental Health Program Budget 65
Table A6: Service Total Costs for Sub-Program 2 (January-June 1996)
NORTHERN METROPOLITAN COMMUNITY HEALTH SERVICE
Sub-Program 2 Costs (January - June 1996)
Service WorkerContactHours
EstimatedWorkerHours
Cost ofWorkerTime$
Infra-structureCosts$
ServiceTotalCost$
One to One
Registered Client Contacts
Counselling 1378 2756 76,066 66,204 142,269
Unregistered Client Contacts
Counselling 348 696 19,210 16,719 35,929
Assessment 245 490 13,524 11,771 25,295
Information 349 698 19,265 16,767 36,032
Total One to One 2320 4640 128,064 111,461 239,525
Groups
Drop-in-Centre Panic/Agoraphobia 16 32 883 769 1,652
Beginners Meditation 8 16 442 384 826
Claim your Space with B&T 16 32 883 769 1,652
Confidence Building for Women 24 48 1,325 1,153 2,478
Confidence Building for Women 8 16 442 384 826
Glance Backwards, Look Forward 15 30 828 721 1,549
Marvellous Matriarchs Moments 10 20 552 480 1,032
Motherhood and Myths 20 40 1,104 961 2,065
Self Esteem 32 64 1,766 1,537 3,304
Self Esteem for Young Women 26 52 1,435 1,249 2,684
Strategies for Change 43 86 2,374 2,066 4,439
Stress Management 12 24 662 577 1,239
Stress Management 20 40 1,104 961 2,065
Stress Management 18 36 994 865 1,858
Stress M’ment and Relax. Seminar 4 8 221 192 413
Total Groups 272 544 15,014 13,068 28,082
(Continued on next page)

Setting Priorities in South Australian Community Health I: The Mental Health Program Budget 66
(Continued from previous page)
Table A6: Service Total Costs for Sub-Program 2 (January-June 1996)
NORTHERN METROPOLITAN COMMUNITY HEALTH SERVICE
Sub-Program 2 Costs (January - June 1996)
Service WorkerContactHours
EstimatedWorkerHours
Cost ofWorkerTime$
Infra-structureCosts$
ServiceTotalCost$
Community Initiatives
Relationships – General 9 18 497 432 929
Cancer Support Group 55 110 3,036 2,642 5,678
Gender Issues – General 32.5 65 1,794 1,561 3,355
Total Community Initiatives 96.5 193 5,327 4,636 9,963
TOTAL SUB-PROGRAM 2 2688.5 5377 148,405 129,165 277,570
Costs presented here are based on the costing model developed for the PBMA study, and should beinterpreted in light of the context of this study and the methodology adopted. They do not representunit costs derived from an individual level costing exercise.

Setting Priorities in South Australian Community Health I: The Mental Health Program Budget 67
Table A7: Service Total Costs for Sub-Program 3 (January-June 1996)
NORTHERN METROPOLITAN COMMUNITY HEALTH SERVICE
Sub-Program 3 Costs (January - June 1996)
Service WorkerContactHours
EstimatedWorkerHours
Cost ofWorkerTime$
Infra-structureCosts$
ServiceTotalCost$
Groups
Health Education for NESB Women 12.00 24.00 662 577 1,239
Total Groups 12.00 24.00 662 577 1.239
Community Initiatives
Post Natal Distress 194.66 389.32 10,745 9,352 20,097
Self Esteem/Confidence - General 272.25 544.50 15,028 13,080 28,108
Parenting 12.00 24.00 662 577 1,239
Stress/Anxiety - General 241.40 482.80 13,325 11,598 24,923
Social Health - General 83.17 166.34 4,591 3,996 8,587
Health General NESB 624.48 1248.96 34,471 30,002 64,473
Health - General Aboriginal Community 74.17 148.34 4,094 3,563 7,658
Sexuality - General 19.50 39.00 1,076 937 2,013
Total Community Initiatives 1521.63 3043.26 83,994 73,104 157,098
TOTAL SUB-PROGRAM 3 1533.63 3067.26 84,656 73,681 158,337
Costs presented here are based on the costing model developed for the PBMA study, and should beinterpreted in light of the context of this study and the methodology adopted. They do not representunit costs derived from an individual level costing exercise.

Setting Priorities in South Australian Community Health I: The Mental Health Program Budget 68
Table A8: Service Total Costs for Sub-Program 4 (January-June 1996)
NORTHERN METROPOLITAN COMMUNITY HEALTH SERVICE
Sub-Program 4 Costs (January - June 1996)
Service WorkerContactHours
EstimatedWorkerHours
Cost ofWorkerTime$
Infra-structureCosts$
ServiceTotalCost$
Community Initiatives
Women for Better Births - NW 26.50 53.00 1,463 1,273 2,736
Northfield Women’s Prison Project - NW 7.50 15.00 414 360 774
Cambodian Working Party - SW 217.00 434.00 11,978 10,425 22,404
Community Action - General 51.50 103.00 2,843 2,474 5,317
Community Participation 131.75 263.50 7,273 6,330 13,602
Youth Participation Project 40.50 81.00 2,236 1,946 4,181
Supportive Environment - General 66.92 133.84 3,694 3,215 6,909
Total Community Initiatives 541.67 1083.34 29,900 26,024 55,924
TOTAL SUB-PROGRAM 4 541.67 1083.34 29,900 26,024 55,924
Costs presented here are based on the costing model developed for the PBMA study, and should beinterpreted in light of the context of this study and the methodology adopted. They do not representunit costs derived from an individual level costing exercise.

Setting Priorities in South Australian Community Health I: The Mental Health Program Budget 69
Table A9: Service Average Costs for Sub-Program 1 (January-June 1996)
NORTHERN METROPOLITAN COMMUNITY HEALTH SERVICE
Sub-Program 1 Average Costs (January - June 1996)
Service ServiceTotalCost$
Cost perSession
$
Cost perUniqueClient$
Cost perClientA’dance$
Cost perRecipient
$
One to One Services
Registered Client Contacts
Neighbourhood House 878 125 125
Total One to One Services 873
Group Activity
Multi-Cultural Women’s Group 3,717 619 310 143
Spanish Speaking Women’s Group 2,271 568 189 60
Total Group Activity 5,988
Community Initiative Activity
Emotional/Mental Health - General 31,264 282 87
Emotional/Mental Health - Viet. Women 9,731 286 1,081
Panic Attack/Agor. Drop-in-Centre SW 7,879 213 101
Body Image - General 619 206 56
Cambodian Women’s Group - SW 5,696 356 63
Isolation - General 2,891 361 161
Cambodian Elderly Group - SW 3,665 367 147
Total Community Initiatives 61,745
TOTAL SUB-PROGRAM 1 68,610
Costs presented here are based on the costing model developed for the PBMA study, and should beinterpreted in light of the context of this study and the methodology adopted. They do not representunit costs derived from an individual level costing exercise.

Setting Priorities in South Australian Community Health I: The Mental Health Program Budget 70
Table A10: Service Average Costs for Sub-Program 2 (January-June 1996)
NORTHERN METROPOLITAN COMMUNITY HEALTH SERVICE
Sub-Program 2 Average Costs (January - June 1996)
Service ServiceTotalCost$
Cost perSession
$
Cost perUniqueClient$
Cost perClientA’dance$
Cost perRecipient
$
One to One Services
Registered Client Contacts
Counselling 142,269 251 101
Unregistered Client Contacts
Counselling 35,929 51
Assessment 25,295 52
Information 36,032 41
Total One to One Services 239,525
Group Activity
Drop-in Centre Panic/Agoraphobia 1,652 413 110 36
Beginners Meditation 826 206 64 16
Claim your Space with B&T 1,652 413 127 38
Confidence Building for Women 2,478 354 138 36
Confidence Building for Women 826 413 103 75
Glance Backwards, Look Forward 1,549 258 111 25
Marvellous Matriarchs Moments 1,032 258 206 57
Motherhood and Myths 2,065 413 129 40
Self Esteem 3,304 413 300 49
Self Esteem for young Women 2,684 383 244 43
Strategies for Change 4,439 740 634 148
Stress Management 1,239 413 77 40
Stress Management 2,065 413 115 57
Stress Management 1,858 465 116 39
Stress M’ment and Relax. Seminar 413 413 46 46
Total Group Activity 28,082
(Continued on next page)

Setting Priorities in South Australian Community Health I: The Mental Health Program Budget 71
(Continued from previous page)
Table A10: Service Average Costs for Sub-Program 2 (January-June 1996)
NORTHERN METROPOLITAN COMMUNITY HEALTH SERVICE
Sub-Program 2 Average Costs (January - June 1996)
Service ServiceTotalCost$
Cost perSession
$
Cost perUniqueClient$
Cost perClientA’dance$
Cost perRecipient
$
Community Initiative
Relationships - General 929 310
Cancer Support Group 5,678 247 11
Gender Issues - General 3,355 280 839
Total Community Initiative 9,963
TOTAL SUB-PROGRAM 2 277,570
Costs presented here are based on the costing model developed for the PBMA study, and should beinterpreted in light of the context of this study and the methodology adopted. They do not representunit costs derived from an individual level costing exercise.

Setting Priorities in South Australian Community Health I: The Mental Health Program Budget 72
Table A11: Service Average Costs for Sub-Program 3 (January-June 1996)
NORTHERN METROPOLITAN COMMUNITY HEALTH SERVICE
Sub-Program 3 Average Costs (January - June 1996)
Service ServiceTotalCost$
Cost perSession
$
Cost perUniqueClient$
Cost perClientA’dance$
Cost perRecipient
$
Group Activity
Health Education for NESB Women 1,239 206 77 21
Total Group Activity 1,239
Community Initiative Activity
Post Natal Distress 20,097 347 100
Self Esteem/Confidence - General 28,108 293 169
Parenting 1,239 248 177
Stress/Anxiety - General 24,923 297 109
Social Health - General 8,587 200 49
Health General NESB 64,473 485 218
Health - General Aboriginal Community 7,658 638 130
Sexuality - General 2,013 403 72
Total Community Initiatives 157,098
TOTAL SUB-PROGRAM 3 158,337
Costs presented here are based on the costing model developed for the PBMA study, and should beinterpreted in light of the context of this study and the methodology adopted. They do not representunit costs derived from an individual level costing exercise.

Setting Priorities in South Australian Community Health I: The Mental Health Program Budget 73
Table A12: Service Average Costs for Sub-Program 4 (January-June 1996)
NORTHERN METROPOLITAN COMMUNITY HEALTH SERVICES
Sub-Program 4 Average Costs (January - June 1996)
Service ServiceTotalCost$
Cost perSession
$
Cost perUniqueClient$
Cost perClientA’dance$
Cost perRecipient
$
Community Initiative Activity
Women for Better Births - NW 2,736 274 72
Northfield Women’s Prison Project - NW 774 194 387
Cambodian Working Party - SW 22,404 606 498
Community Action - General 5,317 354 166
Community Participation 13,602 267 262
Youth Participation Project 4,181 299 60
Supportive Environment - General 6,909 288 276
Total Community Initiatives 55,924
TOTAL SUB-PROGRAM 4 55,924
Costs presented here are based on the costing model developed for the PBMA study, and should beinterpreted in light of the context of this study and the methodology adopted. They do not representunit costs derived from an individual level costing exercise.

Setting Priorities in South Australian Community Health I: The Mental Health Program Budget 74
A3.2 Adelaide Central Community Health Service

Setting Priorities in South Australian Community Health I: The Mental Health Program Budget 75
Table A13: Service Activity for Sub-Program 1 (January-June 1996)
ADELAIDE CENTRAL COMMUNITY HEALTH SERVICE
Sub-Program 1 Activity (January - June 1996)
Service No. ofSessions
HoursperSession
No. ofUniqueClients
ClientAttendances
NumbersReceivingServices
Group Activity
Assertiveness & Confidence 10 107
Working Through Conflict 1 9
Women, Health & Well Being 3 31
McMhap Support Group 10 120
Aboriginal Wellbeing 4 20
Aboriginal Elders 10 150
Total Group Activity 38 437
Community Initiative Activity
Mental Health Women’s Group 12 120
I.P.P.O.N. 8 65
Stress/Relaxation Group 7 15
Western Ab. Health Program 5 13
Taperoo/Osborne Steering Group 5 0
Aboriginal Primary Health 50 500
McMhap Project 60 300
Total Community Initiative Activity 147 1013
Total for Sub-program 1 185 437 1013

Setting Priorities in South Australian Community Health I: The Mental Health Program Budget 76
Table A14: Service Activity for Sub-Program 2 (January-June 1996)
ADELAIDE CENTRAL COMMUNITY HEALTH SERVICE
Sub-Program 2 Activity (January - June 1996)
Service No. ofSessions
HoursperSession
No. ofUniqueClients
ClientAttendances
NumbersReceivingServices
One to One Contacts
Registered Client Contacts 3668
Unregistered Client Contacts 1249
Total One to One Services 4917
Group Activity
Take a Break 20 120
Total Group Activity 20 120
Community Initiative Activity
Great Expectations 17 24
Total Community Initiative Activity 17 24
TOTAL SUB-PROGRAM 2 37 5037 24

Setting Priorities in South Australian Community Health I: The Mental Health Program Budget 77
Table A15: Service Activity for Sub-Program 3 (January-June 1996)
ADELAIDE CENTRAL COMMUNITY HEALTH SERVICE
Sub-Program 3 Activity (January - June 1996)
Service No. ofSessions
HoursperSession
No. ofUniqueClients
ClientAttendances
NumbersReceivingServices
Group Activity
Port Owls 6 40
Krinkley Wobblies (Elders) 20 200
Silver Threads (Elders) 10 120
Tuesday Social Group (Elders) 10 80
Total Group Activity 46 440
Community Initiative Activity
Mental Health Friendly Lunch 5 89
Mental Health Music Club 6 70
Mental Health Travel Club 3 10
Mental Illness Community 3 18
Education
Total Community Initiative Activity 17 187
TOTAL SUB-PROGRAM 3 63 440 187

Setting Priorities in South Australian Community Health I: The Mental Health Program Budget 78
Table A16: Service Activity for Sub-Program 4 (January-June 1996)
ADELAIDE CENTRAL COMMUNITY HEALTH SERVICE
Sub-Program 4 Activity (January - June 1996)
Service No. ofSessions
HoursperSession
No. ofUniqueClients
ClientAttendances
NumbersReceivingServices
Community Initiative Activity
Well Being Project 145 587
Inner City Homeless 16 56
Aged Homeless Working Party 2 22
Better Health Homeless Project 10 43
WOW Safe 20 80
Total Community Initiative Activity 193 788
TOTAL SUB-PROGRAM 3 193 788

Setting Priorities in South Australian Community Health I: The Mental Health Program Budget 79
Table A17: Service Total Costs for Sub-Program 1 (January-June 1996)
ADELAIDE CENTRAL COMMUNITY HEALTH SERVICE
Sub-Program 1 Costs (January - June 1996)
Service WorkerContactHours
Estimated WorkerHours
Cost ofWorkerTime$
Infra-structureCosts$
ServiceTotalCost$
Groups
Assertiveness & Confidence 35 70 1,932 1,124 3,056
Working Through Conflict 3.5 7 193 112 306
Women, Health & Well Being 21 42 1,159 675 1,834
McMhap Support Group 40 80 2,208 1,285 3,493
Aboriginal Wellbeing 42 84 2,318 1,349 3,668
Aboriginal Elders 70 140 3,864 2,249 6,113
Total Groups 211.5 423 11,675 6,795 18,469
Community Initiatives
Mental Health Women’s Group 84 168 4,637 2,699 7,335
I.P.P.O.N 28 56 1,546 900 2,445
Stress/Relaxation Group 24.5 49 1,352 787 2,139
Western Ab. Health Program 28 56 1,546 900 2,445
Taperoo/Osborne Steering Group 17.5 35 966 562 1,528
Aboriginal Primary Health 350 700 19,320 11,244 30,564
McMhap Project 420 840 23,184 13,493 36,677
Total Community Initiatives 952 1904 52,550 30,584 83,134
TOTAL SUB-PROGRAM 1 1163.5 2327 64,225 37,379 101,604
Costs presented here are based on the costing model developed for the PBMA study, and should beinterpreted in light of the context of this study and the methodology adopted. They do not representunit costs derived from an individual level costing exercise.

Setting Priorities in South Australian Community Health I: The Mental Health Program Budget 80
Table A18: Service Total Costs for Sub-Program 2 (January-June 1996)
ADELAIDE CENTRAL COMMUNITY HEALTH SERVICE
Sub-Program 2 Costs (January - June 1996)
Service WorkerContactHours
Estimated WorkerHours
Cost ofWorkerTime$
Infra-structureCosts$
ServiceTotalCost$
One to One
Registered Client Contacts 3668 7336 202,474 117,838 320,312
Unregistered Client Contacts 1249 2498 68,945 40,125 109,070
Total One to One 4917 9834 271,418 157,964 429,382
Groups
Take a Break 40 80 2,208 1,285 3,493
Total Groups 40 80 2,208 1,285 3,493
Community Initiatives
Great Expectations 112 224 6,182 3,598 9,781
Total Community Initiatives 112 224 6,182 3,598 9,781
TOTAL SUB-PROGRAM 2 5069 10138 279,809 162,847 442,656
Costs presented here are based on the costing model developed for the PBMA study, and should beinterpreted in light of the context of this study and the methodology adopted. They do not representunit costs derived from an individual level costing exercise.

Setting Priorities in South Australian Community Health I: The Mental Health Program Budget 81
Table A19: Service Total Costs for Sub-Program 3 (January-June 1996)
ADELAIDE CENTRAL COMMUNITY HEALTH SERVICE
Sub-Program 3 Costs (January - June 1996)
Service WorkerContactHours
Estimated WorkerHours
Cost ofWorkerTime$
Infra-structureCosts$
ServiceTotalCost$
Group Activity
Port Owls 21 42 1,159 675 1,834
Krinkley Wobblies (Elders) 40 80 2,208 1,285 3,493
Silver Threads (Elders) 20 40 1,104 643 1,747
Tuesday Social Group (Elders) 20 40 1,104 643 1,747
Total Groups 101 202 5,575 3,245 8,820
Community Initiatives
Mental Health Friendly Lunch 35 70 1,932 1,124 3,056
Mental Health Music Club 21 42 1,159 675 1,834
Mental Health Travel Club 10.5 21 580 337 917
Mental Illness Community 10.5 21 580 337 917
Education
Total Community Initiatives 77 154 4,250 2,474 6,724
Total Sub-Program 3 178 356 9,826 5,718 15,544
Costs presented here are based on the costing model developed for the PBMA study, and should beinterpreted in light of the context of this study and the methodology adopted. They do not representunit costs derived from an individual level costing exercise.

Setting Priorities in South Australian Community Health I: The Mental Health Program Budget 82
Table A20: Service Total Costs for Sub-Program 4 (January-June 1996)
ADELAIDE CENTRAL COMMUNITY HEALTH SERVICE
Sub-Program 4 Costs (January - June 1996)
Service WorkerContactHours
Estimated WorkerHours
Cost ofWorkerTime$
Infra-structureCosts$
ServiceTotalCost$
Community Initiatives
Well Being Project 766.5 1533 42,311 24,625 66,935
Inner City Homeless 94.5 189 5,216 3,036 8,252
Aged Homeless Working Party 7 14 386 225 611
Better Health Homeless Project 38.5 77 2,125 1,237 3,362
WOW Safe 70 140 3,864 2,249 6,113
Total Community Initiatives 976.5 1953 53,903 31,371 85,274
Total Sub-Program 4 976.5 1953 53,903 31,371 85,274
Costs presented here are based on the costing model developed for the PBMA study, and should beinterpreted in light of the context of this study and the methodology adopted. They do not representunit costs derived from an individual level costing exercise.

Setting Priorities in South Australian Community Health I: The Mental Health Program Budget 83
Table A21: Service Average Costs for Sub-Program 1 (January-June 1996)
ADELAIDE CENTRAL COMMUNITY HEALTH SERVICE
Sub-Program 1 Average Costs (January - June 1996)
Service ServiceTotalCost$
Cost perSession
$
CostperUniqueClient$
Cost perClientA’dance$
Cost perRecipient
$
Group Activity
Assertiveness & Confidence 3,056 306 29
Working Through Conflict 306 306 34
Women, health & Well Being 1,834 611 59
McMhap Support Group 3,493 349 29
Aboriginal Wellbeing 3,668 917 183
Aboriginal Elders 6,113 611 41
Total Group Activity 18,469
Community Initiative Activity
Mental Health Women’s Group 7,335 611 61
I.P.P.O.N. 2,445 306 38
Stress/Relaxation Group 2,139 306 143
Western Ab. Health Program 2,445 489 188
Taperoo/Osborne Steering Group 1,528 306
Aboriginal Primary Health 30,564 611 61
McMhap Project 36,677 611 122
Total Community Initiative Activity 83,134
Total Sub-Program 1 101,604
Costs presented here are based on the costing model developed for the PBMA study, and should beinterpreted in light of the context of this study and the methodology adopted. They do not representunit costs derived from an individual level costing exercise.
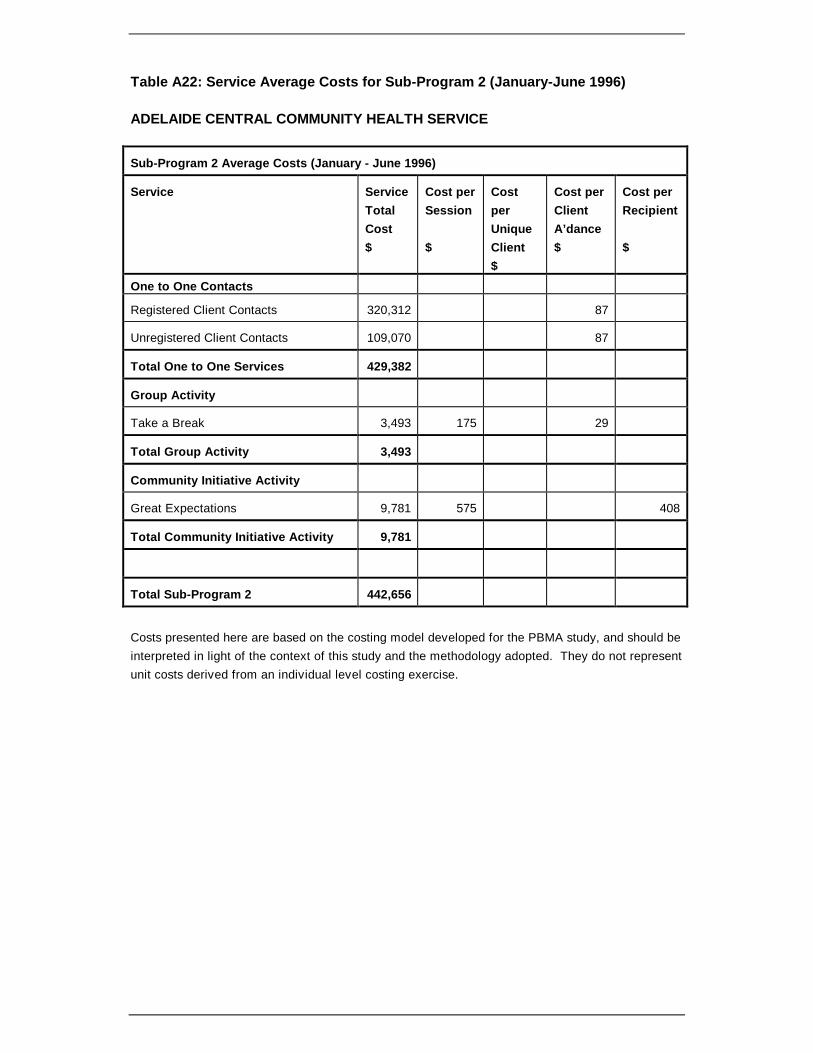
Setting Priorities in South Australian Community Health I: The Mental Health Program Budget 84
Table A22: Service Average Costs for Sub-Program 2 (January-June 1996)
ADELAIDE CENTRAL COMMUNITY HEALTH SERVICE
Sub-Program 2 Average Costs (January - June 1996)
Service ServiceTotalCost$
Cost perSession
$
CostperUniqueClient$
Cost perClientA’dance$
Cost perRecipient
$
One to One Contacts
Registered Client Contacts 320,312 87
Unregistered Client Contacts 109,070 87
Total One to One Services 429,382
Group Activity
Take a Break 3,493 175 29
Total Group Activity 3,493
Community Initiative Activity
Great Expectations 9,781 575 408
Total Community Initiative Activity 9,781
Total Sub-Program 2 442,656
Costs presented here are based on the costing model developed for the PBMA study, and should beinterpreted in light of the context of this study and the methodology adopted. They do not representunit costs derived from an individual level costing exercise.

Setting Priorities in South Australian Community Health I: The Mental Health Program Budget 85
Table A23: Service Average Costs for Sub-Program 3 (January-June 1996)
ADELAIDE CENTRAL COMMUNITY HEALTH SERVICE
Sub-Program 3 Average Costs (January - June 1996)
Service ServiceTotalCost$
Cost perSession
$
CostperUniqueClient$
Cost perClientA’dance$
Cost perRecipient
$
Group Activity
Port Owls 1,834 306 46
Krinkley Wobblies (Elders) 3,493 175 17
Silver Threads (Elders) 1,747 175 15
Tuesday Social Group (Elders) 1,747 175 22
Total Group Activity 8,820
Community Initiative Activity
Mental Health Friendly Lunch 3,056 611 34
Mental Health Music Club 1,834 306 26
Mental Health Travel Club 917 306 92
Mental Illness Community 917 306 51
Education
Total Community Initiative Activity 6,724
Total Sub-Program 3 15,544
Costs presented here are based on the costing model developed for the PBMA study, and should beinterpreted in light of the context of this study and the methodology adopted. They do not representunit costs derived from an individual level costing exercise.

Setting Priorities in South Australian Community Health I: The Mental Health Program Budget 86
Table A24: Service Average Costs for Sub-Program 4 (January-June 1996)
ADELAIDE CENTRAL COMMUNITY HEALTH SERVICE
Sub-Program 4 Average Costs (January - June 1996)
Service ServiceTotalCost$
Cost perSession
$
CostperUniqueClient$
Cost perClientA’dance$
Cost perRecipient
$
Community Initiative Activity
Well Being Project 66,935 462 114
Inner City Homeless 8,252 516 147
Aged Homeless Working Party 611 306 28
Better Health Homeless Project 3,362 336 78
WOW Safe 6,113 306 76
Total Community Initiative Activity 85,274
Total Sub-Program 4 85,274
Costs presented here are based on the costing model developed for the PBMA study, and should beinterpreted in light of the context of this study and the methodology adopted. They do not representunit costs derived from an individual level costing exercise.

Setting Priorities in South Australian Community Health I: The Mental Health Program Budget 87
A3.3 Noarlunga Community Health Service

Setting Priorities in South Australian Community Health I: The Mental Health Program Budget 88
Table A25: Service Activity for Sub-Program 1 (January-June 1996)
NOARLUNGA HEALTH SERVICES
Sub-Program 1 Activity (January - June 1996)
Service No. of
Sessions
HoursperSession
No. ofUniqueClients
ClientAttendances
NumbersReceivingServices
Group Activity
Self-Healing/Letting Go Pain 2 2.5 8 14
Stress Management & Relaxation 15 2.5 15 90
Open Group 15 2.5 28 121
Total Group Activity 32 51 225
Community Initiatives
Assertiveness for Women 6 2
Peer Research Project - Youth 16 2
Women’s Healing Circle 44 2 92
Young Peoples Drop In 15 2 56
Youth Answers Peer Research 27 2 330
Total Community Initiatives 108 478
Total for Sub-Program 1 140 51 225 478

Setting Priorities in South Australian Community Health I: The Mental Health Program Budget 89
Table A26: Service Activity for Sub-Program 2 (January-June 1996)
NOARLUNGA HEALTH SERVICES
Sub-Program 2 Activity (January - June 1996)
Service No. of
Sessions
HoursperSession
No. ofUniqueClients
ClientAttendances
NumbersReceivingServices
One to One Contacts
Registered Clients 940 2577
Unregistered Clients (Informals) 3842
Total One to One Services 940 6419
Group Activity
Anxiety Management 14 2.5 15 90
Being a Mum and Stressed 7 2.5 5 32
Group for Violent Men 6 2.5 10 57
Improving Self-Esteem 4 2.5 11 31
What About You? Support Mother 13 2.5 7 55
Confidence Building 2 2.5 6 12
Learn to Relax and Manage Stress 4 2.5 11 25
Positive Changes 3 2.5 12 27
Time to Relax 5 2.5 22 56
Total Group Activity 58 99 385
Community Initiatives
After Suicide 19 2 33
Food with Friends 69 2 106
Overcoming Postnatal Depression 31 2 77
Panic & Anxiety Treatment Services 6 2 16
Women Supporting Women 4 2 16
Young Women Assertive/Confident 1 2 65
Total Community Initiatives 130 313
Total for Sub-Program 2 188 1039 6804 313

Setting Priorities in South Australian Community Health I: The Mental Health Program Budget 90
Table A27: Service Activity for Sub-Program 3 (January-June 1996)
NOARLUNGA HEALTH SERVICES
Sub-Program 3 Activity (January - June 1996)
Service No. of
Sessions
HoursperSession
No. ofUniqueClients
ClientAttendances
NumbersReceivingServices
Community Initiatives
Coffee and Chat Café 10 2 79
Total Community Initiatives 10 2 79
Total for Sub-Program 3 10 2 79

Setting Priorities in South Australian Community Health I: The Mental Health Program Budget 91
Table A28: Service Total Costs for Sub-Program 1 (January-June 1996)
NOARLUNGA HEALTH SERVICES
Sub-Program 1 Costs (January - June 1996)
Service WorkerContactHours
Estimated WorkerHours
Cost ofWorkerTime$
Infra-structureCosts$
ServiceTotalCost$
Groups
Self-Healing/Letting Go Pain 5 10 276 196 472
Stress Management & Relaxation 37.5 75 2,070 1,474 3,544
Open Group 37.5 75 2,070 1,474 3,544
Total Groups 80 160 4,416 3,144 7,560
Community Initiatives
Assertiveness for Women 12 24 662 472 1,134
Peer Research Project - Youth 32 64 1,766 1,257 3,024
Women’s Healing Circle 88 176 4,858 3,458 8,316
Young Peoples Drop In 30 60 1,656 1,179 2,835
Youth Answers Peer Research 54 108 2,981 2,122 5,103
Total Community Initiatives 216 432 11,923 8,488 20,411
Total for Sub-Program 1 296 592 16,339 11,631 27,970
Costs presented here are based on the costing model developed for the PBMA study, and should beinterpreted in light of the context of this study and the methodology adopted. They do not representunit costs derived from an individual level costing exercise.

Table A29: Service Total Costs for Sub-Program 2 (January-June 1996)
NOARLUNGA HEALTH SERVICES
Sub-Program 2 Costs (January - June 1996)
Service WorkerContactHours
Estimated WorkerHours
Cost ofWorkerTime$
Infra-structureCosts$
ServiceTotal Cost
$
One to One
Registered Clients 2577 5154 142,250 101,262 243,513
Unregistered Clients (Informals) 961 1922 53,047 37,762 90,809
Total One to One 3538 7076 195,298 139,024 334,322
Groups
Anxiety Management 35 70 1,932 1,375 3,307
Being a Mum and Stressed 17.5 35 966 688 1,654
Group for Violent Men 15 30 828 589 1,417
Improving Self-Esteem 10 20 552 393 945
What About You? Support Mother 32.5 65 1,794 1,277 3.071
Confidence Building 5 10 276 196 472
Learn to Relax and Manage Stress 10 20 552 393 945
Positive Changes 7.5 15 414 295 709
Time to Relax 12.5 25 690 491 1,181
Total Groups 145 290 8,004 5,698 13,702
Community Initiatives
After Suicide 38 76 2,098 1,493 3,591
Food with Friends 138 276 7,618 5,423 13,040
Overcoming Postnatal Depression 62 124 3,422 2,436 5,859
Panic & Anxiety Treatment Services 12 24 662 472 1,134
Women Supporting Women 8 16 442 314 756
Young Women Assertive/Confident 2 4 110 79 189
Total Community Initiatives 260 520 14,352 10,217 24,569
Total for Sub-Program 2 3943 7886 217,654 154,939 372,592
Costs presented here are based on the costing model developed for the PBMA study, and should beinterpreted in light of the context of this study and the methodology adopted. They do not representunit costs derived from an individual level costing exercise.

Setting Priorities in South Australian Community Health I: The Mental Health Program Budget 93
Table A30: Service Total Costs for Sub-Program 3 (January-June 1996)
NOARLUNGA HEALTH SERVICES
Sub-Program 3 Costs (January - June 1996)
Service WorkerContactHours
Estimated WorkerHours
Cost ofWorkerTime$
Infra-structureCosts$
ServiceTotalCost$
Community Initiatives
Coffee and Chat Café 20 40 1,104 786 1,890
Total Community Initiatives 20 40 1,104 786 1,890
Total for Sub-Program 3 20 40 1,104 786 1,890
Costs presented here are based on the costing model developed for the PBMA study, and should beinterpreted in light of the context of this study and the methodology adopted. They do not representunit costs derived from an individual level costing exercise.

Setting Priorities in South Australian Community Health I: The Mental Health Program Budget 94
Table A31: Service Average Costs for Sub-Program 1 (January-June 1996)
NOARLUNGA HEALTH SERVICES
Sub-Program 1 Average Costs (January - June 1996)
Service ServiceTotalCost$
Cost perSession
$
CostperUniqueClient$
Cost perClientA’dance$
Cost perRecipient
$
Group Activity
Self-Healing/Letting Go Pain 472 236 59 34
Stress Management & Relaxation 3,544 236 236 39
Open Group 3,544 236 127 29
Total Group Activity 7,560
Community Initiatives
Assertiveness for Women 1,134 189
Peer Research Project - Youth 3,024 189
Women’s Healing Circle 8,316 189 90
Young Peoples Drop In 2,835 189 51
Youth Answers Peer Research 5,103 189 15
Total Community Initiatives 20,411
Total for Sub-Program 1 27,970
Costs presented here are based on the costing model developed for the PBMA study, and should beinterpreted in light of the context of this study and the methodology adopted. They do not representunit costs derived from an individual level costing exercise.

Table A32: Service Average Costs for Sub-Program 2 (January-June 1996)
NOARLUNGA HEALTH SERVICES
Sub-Program 2 Average Costs (January - June 1996)
Service ServiceTotalCost$
Cost perSession
$
CostperUniqueClient$
Cost perClientA’dance$
Cost perRecipient
$
One to One Contacts
Registered Clients 243,513 259 94
Unregistered Clients (Informals) 90,809 24
Total One to One Services 334,322
Group Activity
Anxiety Management 3,307 236 220 37
Being a Mum and Stressed 1,654 236 331 52
Group for Violent Men 1,417 236 142 25
Improving Self-Esteem 945 236 11 30
What About You? Support Mother 3,071 236 439 56
Confidence Building 472 236 79 39
Learn to Relax and Manage Stress 945 236 86 38
Positive Changes 709 236 59 26
Time to Relax 1,181 236 54 21
Total Group Activity 13,702
Community Initiatives
After Suicide 3,591 189 109
Food with Friends 13,040 189 123
Overcoming Postnatal Depression 5,589 189 76
Panic & Anxiety Treatment Services 1,134 189 71
Women Supporting Women 756 189 47
Young Women Assertive/Confident 189 189 3
Total Community Initiatives 24,569
Total for Sub-Program 2 372,592

Costs presented here are based on the costing model developed for the PBMA study, and should beinterpreted in light of the context of this study and the methodology adopted. They do not representunit costs derived from an individual level costing exercise.

Setting Priorities in South Australian Community Health I: The Mental Health Program Budget 97
Table A33: Service Average Costs for Sub-Program 3 (January-June 1996)
NOARLUNGA HEALTH SERVICES
Sub-Program 3 Average Costs (January - June 1996)
Service ServiceTotalCost$
Cost perSession
$
CostperUniqueClient$
Cost perClientA’dance$
Cost perRecipient
$
Community Initiatives
Coffee and Chat Café 1,890 189 24
Total Community Initiatives 1,890
Total for Sub-Program 3 1,890
Costs presented here are based on the costing model developed for the PBMA study, and should beinterpreted in light of the context of this study and the methodology adopted. They do not representunit costs derived from an individual level costing exercise.
Setting Priorities in South Australian Community Health I: The Mental Health Program Budget 98
A3.4 Activity and Cost data notes
(i) Activity
(a) One to one services
Unique client: An individual registered client that attends for a service (Aunique client may attend more than once)
Data on the number of unique clients for one to one services was available only forNorthern and Noarlunga regions.
Client attendances The total number of attendances by clients (registered andunregistered clients)
Client attendances included registered and unregistered clients for all regions.
All regions determined client attendances for one to one services by including contactswith a primary reason for attendance code which related to a specific emotional /mentalhealth problem or condition. Central region also included one to one contacts withprimary reason for attendance codes for violence, which may lead to an overestimation ofone to one client attendances in that region.
Noarlunga region did not have reason for attendance codes for informal and intakecontacts (unregistered clients). Unregistered client attendances were estimated to be30% of all Community Health unregistered attendances, following Noarlunga’sassumption that 30% of direct worker hours were spent in providing mental healthservices.
(b) Groups
Number of sessions Total number of sessions held for that group
Hours per session Contact time with group participants
Data for group hours per session was available on the CHSS information system forNorthern, but not for Central region. Central region assumed each group session ran forapproximately 3.5 hours (a morning or an afternoon). Noarlunga region found the CHSSdata on group hours per session to be unreliable, and adjusted the data according toworker estimates from estimates of service duration collected by worker disciplinegroups.
Unique client An individual registered client who attended one or moresessions of a group program.
Data on the number of unique clients for group services was available only for Northernand Noarlunga regions.
Client attendances The total number of attendances by registered clients.
(c) Community Initiatives

Setting Priorities in South Australian Community Health I: The Mental Health Program Budget 99
Number of sessions Number of incidents of activity recorded for a program.
Number receiving Total number of participants at sessions where a serviceservices was provided.
Data relating to number of participants receiving services from community initiatives wasfound to be unreliable in places for all regions. Northern reported zero participants forone service, and very low numbers in three other services (number of participants under10). Noarlunga reported two services with no participants, and Central reported oneservice with no participants. This may be due to problems in coding activity in somecases, where a session may have been recorded when it was actually a planning sessionfor Community Health service staff where participants were not present. Central andNoarlunga had to rely on worker estimates of the number of participants in some, ormany, community initiatives, and as a result potential exists for over and underestimationof numbers receiving care. This information must be interpreted with care.
Activity data in general from the CHSS information system appeared to be mostcomplete and accurate for Northern region. Whilst most activity data was recorded onthe CHSS system for Noarlunga, the region felt information was too unreliable in places,and used worker estimates to revise figures. Central reported that data was not availableon the CHSS system for a significant number of services, this is mainly due to therecency of regionalisation in Central. Previously, data have been collected and kept atindividual Community Health Centres, and remains difficult to collect. Moreover, in thepast some Centres have not been collecting activity information for some services inCentral region.
(ii) Costs
Worker contact Worker time spent in direct provision of services hours(contact time with clients or participants)
Estimated worker Worker contact time plus worker time spent time inpreparation, data collection, follow up, and advocacy for clientcontacts. This additional worker time was estimated to be100 per cent of worker contact time.
All regions assumed only one worker at a time provided one to one services.
Worker hours for one to one services in Northern region were based on CHSSinformation, Central and Noarlunga estimated that the direct contact time with registeredone to one clients was on average 1 hour. Central also estimated that direct contact timewith unregistered one to one clients was on average 1 hour. Noarlunga estimated thedirect worker contact time with unregistered one to one clients to be 15 minutes onaverage.

Setting Priorities in South Australian Community Health I: The Mental Health Program Budget 100
Noarlunga only allowed for the primary worker to be used in calculating costs for workercontact time in providing groups and community initiatives. Where there was more thanone worker involved in providing the group or community initiative this will lead to anunderestimation of worker costs. Moreover, some preparation time for groups and one toone services may be recorded as community initiative time for Noarlunga region.
Superannuation was added at 6% (minimum SA Government contribution) toadministration and clerical staff costs. No other “on costs” were added.
Cost per unique client was not available for Central region, as unique client data wasunavailable.
1 Noarlunga Community Health Services does not include Southern Women’s Community Health Centre.
Setting Priorities in South Australian Community Health I: The Mental Health Program Budget
Setting Priorities in South Australian Community Health I: The Mental Health Program Budget
Setting Priorities in South Australian Community Health I: The Mental Health Program Budget
Setting Priorities in South Australian Community Health I: The Mental Health Program Budget
Setting Priorities in South Australian Community Health I: The Mental Health Program Budget
Setting Priorities in South Australian Community Health I: The Mental Health Program Budget
Author(s) name(s)

Setting Priorities in South Australian Community Health I: The Mental Health Program Budget 101
Paper title
Setting Priorities in South Australian Community Health I: The Mental Health Program Budget
Setting Priorities in South Australian Community Health I: The Mental Health Program Budget