
Optimization of Screw Mixer to Improve Drying Performance of ...

Ž .Chemometrics and Intelligent Laboratory Systems 48 1999 59–70
Melt granulation in a high shear mixer: optimization of mixtureand process variables using a combined experimental design
B. Campisi a,), D. Vojnovic b, D. Chicco b, R. Phan-Tan-Luu c
a Department of Economics and Commodity Science, UniÕersity of Trieste, Õia Valerio 6, I-34127 Trieste, Italyb Department of Pharmaceutical Sciences, UniÕersity of Trieste, P. le Europa 1, I-34127 Trieste, Italy
c LMRE, Centre de St. Jerome, AÕenue Escadrille Normandie-Niemen, F-13397 Marseille Cedex 20, France´ ˆ
Received 7 January 1999; accepted 15 January 1999
Abstract
Melt granulation of a formulation of theophylline, containing lactose, microcrystalline cellulose and hydroxypropylmeth-ylcellulose as excipients, was investigated in a 10 l high shear mixer as an alternative method to the wet granulation process,using polyethylene glycol 6000 as melting binder. The experimentation was planned by combining mixture and factorial de-signs in order to study the effect of two process variables, namely impeller speed and massing time, and of excipient mixturecomposition on two characteristics of the granules. By the response surface methodology, it was possible to find the mixturecomposition and the processing conditions leading to granulates with optimal granule characteristics. q 1999 Elsevier Sci-ence B.V. All rights reserved.
Keywords: Melt granulation; High shear mixer; Mixture-process variable approach; Response surface methodology
1. Introduction
Melt granulation is an alternative technique to thewet agglomeration process for the granulation ofpharmaceutical powders. In melt granulation, the ag-gregation of the powder particles is promoted by alow melting point binder, which is normally added tothe other components as a powder. Once in the moltenform, the binder acts like a granulating liquid. Thetemperature of the mixture is risen to above the bindermelting point either by a heating jacket or by heat offriction generated by the impeller blades, if the im-
w xpeller speed is high enough 1 .
) Corresponding author. Tel.: q39-040-6767031; Fax: q39-040-6763215; E-mail: [email protected]
Melt granulation offers several advantages com-pared to the conventional wet process. It is a good al-ternative to wet granulation of water-sensitive mate-rials, which require organic solvents for granulation.Moreover, the wetting and drying phases are elimi-nated, making the whole process less consuming in
w xterms of energy and time 1 .Melt granulation has been studied by several au-
thors, using different kinds of low-melting point ex-cipients as binders: polyethylene glycols 3000, 6000and 8000, various types of waxes and stearic acidw x1–5 .
In this study, the melt granulation of a formula-Ž .tion containing theophylline as a model drug was
investigated. Lactose, microcrystalline cellulose andhydroxypropylmethylcellulose were used as excipi-
0169-7439r99r$ - see front matter q 1999 Elsevier Science B.V. All rights reserved.Ž .PII: S0169-7439 99 00008-8
( )B. Campisi et al.rChemometrics and Intelligent Laboratory Systems 48 1999 59–7060
ents and PEG 6000 as melting binder. The aim wasto study the effect of excipient proportions on someproduct characteristics called response variables: thegeometric mean diameter of the granules and thepercentage of particles having a geometric mean di-ameter smaller than 250 mm. As the effects of com-ponent proportions on these properties were sup-posed to be affected by the operating conditions, theinfluence of two process parameters, i.e., impellerspeed and granulation time, was also investigated.
A combined experimental design was used for thispurpose, and a polynomial equation was estimated forthe description of each response variable as a func-tion of both mixture and process variables. Further-
more, the process variable conditions were consid-ered separately in order to display graphically the ef-fect of each blending composition as well as the op-timal mixtures that yielded the properties of interest.
2. Experimental
2.1. Experimental design
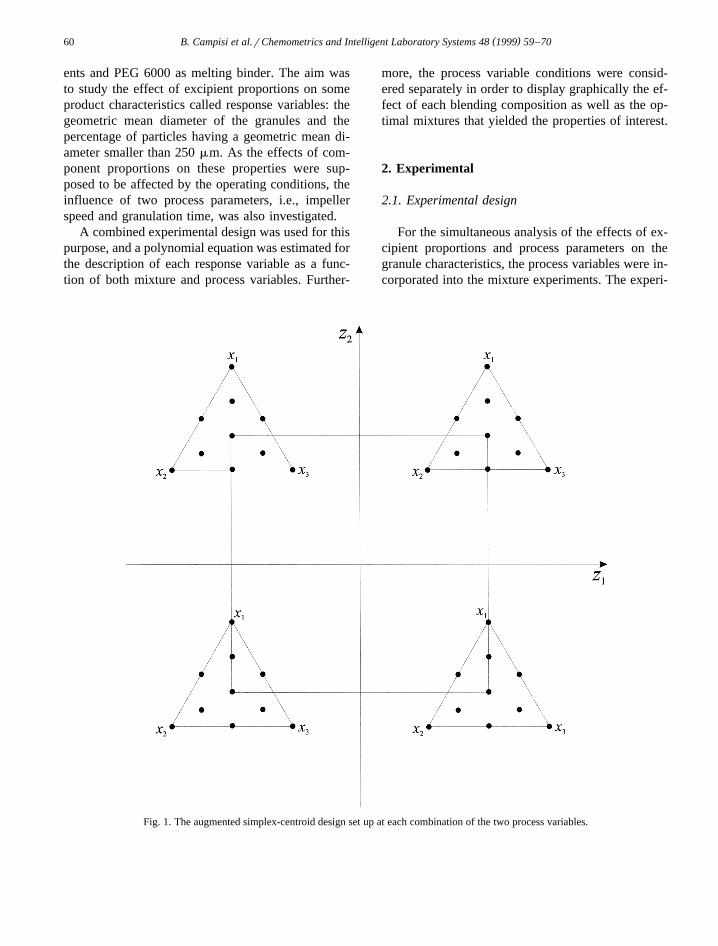
For the simultaneous analysis of the effects of ex-cipient proportions and process parameters on thegranule characteristics, the process variables were in-corporated into the mixture experiments. The experi-
Fig. 1. The augmented simplex-centroid design set up at each combination of the two process variables.
( )B. Campisi et al.rChemometrics and Intelligent Laboratory Systems 48 1999 59–70 61
Table 1Process variables, mixture components and response variables
Process variables Coded Originalunits units
Impeller speed y1 300 rpmq1 500 rpm
Massing time y1 10 minq1 15 min
Original mixture Lower UpperŽ . Ž .components bound a bound bi i
Ž .Lactose x 0.6 11
Microcrystalline 0 0.4Ž .cellulose x2
Hydroxypropylmethyl- 0 0.4Ž .cellulose x3
Response variables Units
Ž .Geometric mean diameter h mm1Ž .Granules-250 mm h %2
mental design was obtained by crossing a three-com-Žponent mixture design simplex-centroid design aug-
. kmented with three interior points with a classical 2w xfactorial arrangement 6–8 . In general, the aug-
mented simplex-centroid design is recommend formixture experiments as this simplex-lattice arrange-ment includes the design points to fit Scheffe poly-´
Žnomials from first-order model to the special cubic.model inclusive and check points as well. In this
study, in addition to check points, the blend corre-sponding to the simplex centroid was replicated inorder to have a model independent measure of pureerror for testing the model adequacy. Including repli-cates in the experimental design allows the partition
Ž .of the residual sum of squares SS into two com-EŽ .ponents: the one due to pure error SS and that duePE
Ž .to lack of fit SS . A test statistic based on theLOF
F-ratio can be used for testing the significance of thenull hypothesis about zero lack of fit of the model.
As shown in Fig. 1, by adopting an experimentaldesign like this, the blending properties of interest aretested at all possible combinations of the extremelevels of process variables. The development of atextile formulation, the optimization of a sustainedrelease system, and the optimization of a wet granu-lation process are some examples where such pro-cess-mixture designs have been successfully appliedw x9–11 .
In order to fit a mathematical model for the de-scription of the response variables as a function of
Ž .process variables and mixture components Table 1 ,� 4the 3, 2 Scheffe quadratic polynomial for a three-´
Ž Ž ..component mixture Eq. 1 was multiplied by thefirst-order model with interaction for the 22 factorial
Ž Ž .. Ž Ž ..design Eq. 2 . In the resulting equation Eq. 3 ,the 24 parameters to be estimated g j represent a bi j i
� 4 � 4where ig 1, 2, 3, 12, 13, 23 and jg 0, 1, 2, 12 :
ysb x qb x qb x qb x x1 1 2 2 3 3 12 1 2
qb x x qb x x , 1Ž .13 1 3 23 2 3
ysa qa z qa z qa z z , 2Ž .0 1 1 2 2 12 1 2
ysg 0 x qg 0 x qg 0 x qg 0 x x1 1 2 2 3 3 12 1 2
qg 0 x x qg 0 x x13 1 3 23 2 3
1 1 1 1q g x qg x qg x qg x x1 1 2 2 3 3 12 1 2
1 1qg x x qg x x z13 1 3 23 2 3 1
2 2 2 2q g x qg x qg x qg x x1 1 2 2 3 3 12 1 2
2 2qg x x qg x x z13 1 3 23 2 3 2
12 12 12 12q g x qg x qg x qg x x1 1 2 2 3 3 12 1 2
12 12qg x x qg x x z z . 3Ž .13 1 3 23 2 3 1 2
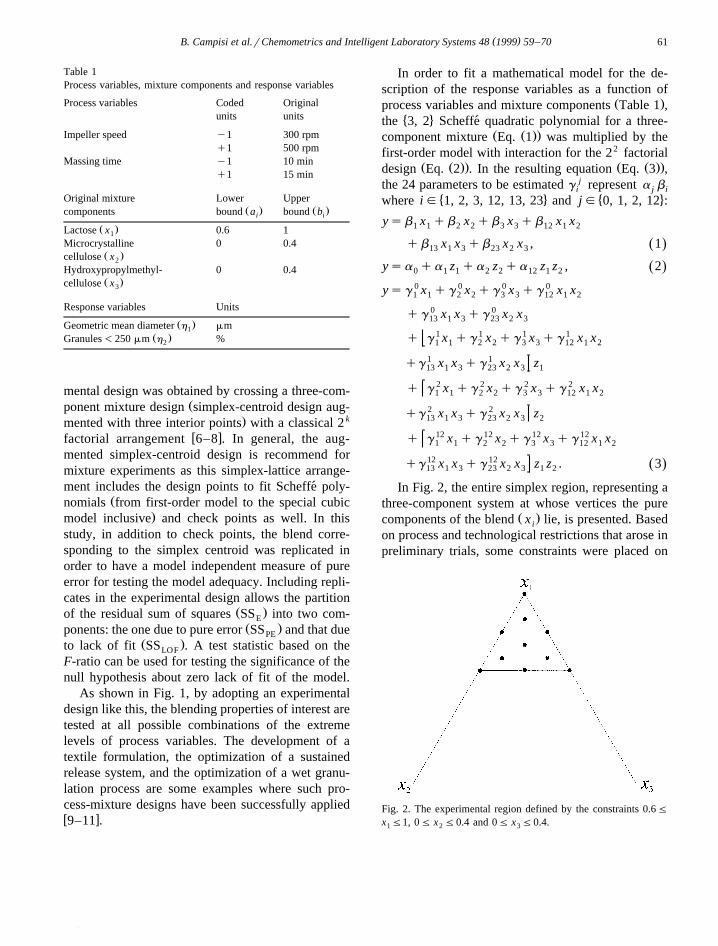
In Fig. 2, the entire simplex region, representing athree-component system at whose vertices the pure
Ž .components of the blend x lie, is presented. Basedi
on process and technological restrictions that arose inpreliminary trials, some constraints were placed on
Fig. 2. The experimental region defined by the constraints 0.6Fx F1, 0F x F0.4 and 0F x F0.4.1 2 3
( )B. Campisi et al.rChemometrics and Intelligent Laboratory Systems 48 1999 59–7062
Ž .the proportions of microcrystalline cellulose x and2Ž . Ž Ž ..hydroxypropylmethylcellulose x Eq. 4 . The re-3
sulting experimental region was rather a subregionwithin the simplex, but still with a regular simplexshape:
0.6Fx F1,1
0Fx F0.4,2
0Fx F0.4. 4Ž .3
In Fig. 2, the dots located along and inside the re-gion of interest mark the mixture design points atwhich the data were collected for fitting the polyno-
Ž .mial in Eq. 3 . Due to the restrictions on the compo-Ž .nent proportions, only lactose x was tested ‘pure’.1
Indeed, the other two components represent binarymixtures. The coordinates of each of the lattice pointsŽ .x , corresponding to the mixture settings to bei
tested, are listed in Table 2. Mixture composition isreported in grams as well as in weight fraction so thatthe real amounts of the excipients used are also given.
In Tables 3 and 4, the data refer to the ten blendstested at each combination of the two process vari-ables. Here, the mixture coordinates are reported af-
Ž .ter transformation of the original variables x toiŽ X .‘pseudocomponents’ x obtained with the follow-i
ing linear transformation:
xX s x ya rR , 5Ž . Ž .i i i a
Žwhere a is the lower bound of the component i isi. q1, 2, . . . ,q and R s1yÝ a . Also the arrange-a is1 i
ment for the two process variables is reported in termsof coded units calculated as follows:
z y max z qmin z r2Ž . Ž .Ž .Ž .i i iXz s , 6Ž .i max z qmin z r2Ž . Ž .Ž .i i
Ž . Ž .where max z and min z are the high and lowi iŽ .level of the variables z , respectively.i
These transformations are done to facilitate the in-terpretation of the regression coefficients and avoidill-conditioning of the matrix XX X. In particular,when restraints on mixture composition are consid-ered, the ill-conditioning or collinearity between thepredictors often lead to an unstable least squares so-lution. The model coefficients b , estimated by BsiŽ X .y1 XX X X y, are in fact poorly accurate, and one ofthe possible solution is the transformation to pseudo-
w xcomponents 12,13 .
2.2. Materials and methods
2.2.1. MaterialsŽ .Lactose Pharmatose, 200 mesh and anhydrous
theophylline were purchased from Prodotti GianniŽ . ŽItaly . Microcrystalline cellulose MC-Avicel PH
. Ž101 , hydroxypropylmethylcellulose Methocel E5. ŽPremium , and polyethylene glycol PEG 6000, melt-
.ing point 60–708C were obtained from FaravelliŽ .Milano, Italy .
2.2.2. EquipmentThe granulations were prepared in the 10-l
Ž .laboratory scale Zanchetta Roto J high shear mixer,
Table 2Ž .The mixture composition expressed in grams and weight fractions xi
Trial no. Mixture Composition
Lactose Microcrystalline cellulose Hydroxypropylmethylcellulose
g x g x g x1 2 3
1 870 1 0 0 0 02 522 0.6 348 0.4 0 03 522 0.6 0 0 348 0.44 696 0.8 174 0.2 0 05 696 0.8 0 0 174 0.26 522 0.6 174 0.2 174 0.27 635.1 0.73 117.4 0.135 117.4 0.1358 753.4 0.866 58.3 0.067 58.3 0.0679 579.4 0.666 232.3 0.267 58.3 0.067
10 579.4 0.666 58.3 0.067 232.3 0.267
( )B. Campisi et al.rChemometrics and Intelligent Laboratory Systems 48 1999 59–70 63
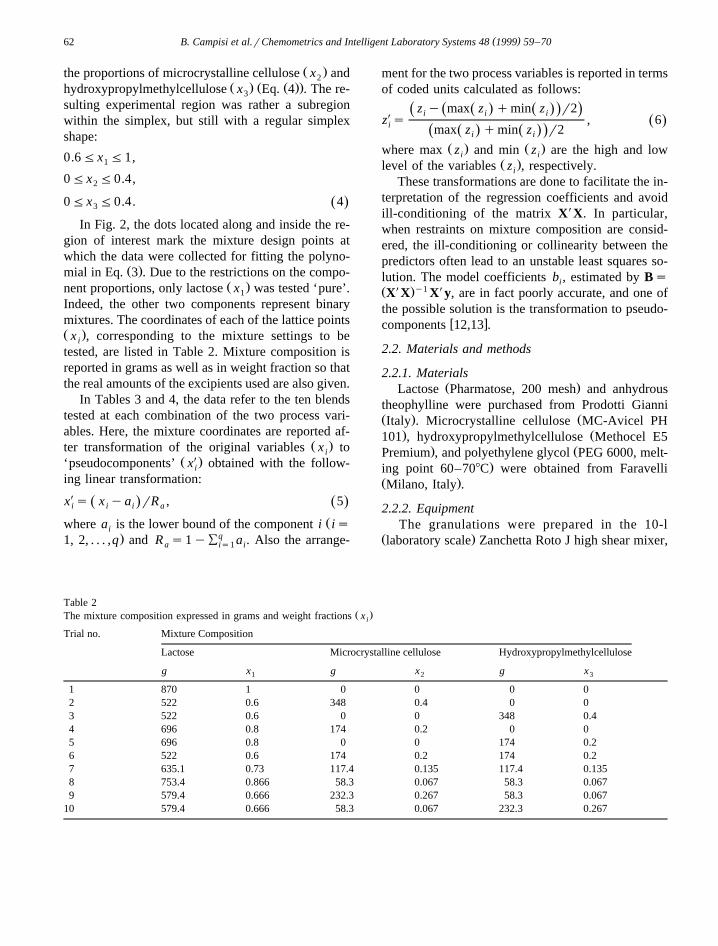
Table 3Ž .Geometric mean diameter of the granules y1
X XŽ .Trial no. Mixture composition Process variable settings z , z1 2
X X X Ž . Ž . Ž . Ž .x x x y1, y1 y1, q1 q1, y1 q1, q11 2 3
1 1 0 0 292 327 309 3732 0 1 0 374 462 375 4783 0 0 1 546 726 555 6284 0.5 0.5 0 396 475 335 4165 0.5 0 0.5 495 610 457 5506 0 0.5 0.5 454 520 467 6087 0.333 0.333 0.333 436, 410 549, 521 440, 417 528, 5728 0.667 0.167 0.167 388 510 385 4669 0.167 0.667 0.167 412 517 400 501
10 0.167 0.167 0.667 525 591 474 561
w xalready described in a previous article 14 . Thegranulator was equipped with a heating jacket, whichsupplied the heat required to melt the binder.
Ž .A vibrating apparatus Octagon 200, EndecottsŽand a set of sieves 1250, 800, 630, 500, 400, 315,
.250 and 200 mm were used for the granule charac-terization.
2.2.3. Granulation manufactureThe total amount of theophylline and excipient
Žmixture lactose, microcrystalline cellulose and hy-.droxypropylmethylcellulose used in each experi-
ment was 1.5 kg. The amount of theophylline was42% wrw of 1.5 kg, that is 630 g in each experi-
Ž .ment. The proportion of each excipient x in thei
mixture was varied according to the experimental ar-
rangement reported in Table 2. The amount of PEGwas calculated referring to the quantity of each ex-cipient in the 1.5 kg mass, i.e., 18% of the weight oflactose and 61% of the weight of Avicel or Metho-cel.
The granulation procedure was standardized on thebasis of preliminary trials, and the temperature of thepowders inside the bowl continuously recorded by athermoresistance probe fixed on the bowl lid anddipped in the powder mass.
The excipients without PEG were first mixed,while heating, at an impeller speed of 50 rpm, untiltheir temperature had reached 558C. The mixing wasinterrupted in order to add the PEG, and then contin-ued for 3 min at 50 rpm and for other 3 min at 100rpm. At this point, the PEG reached a molten state
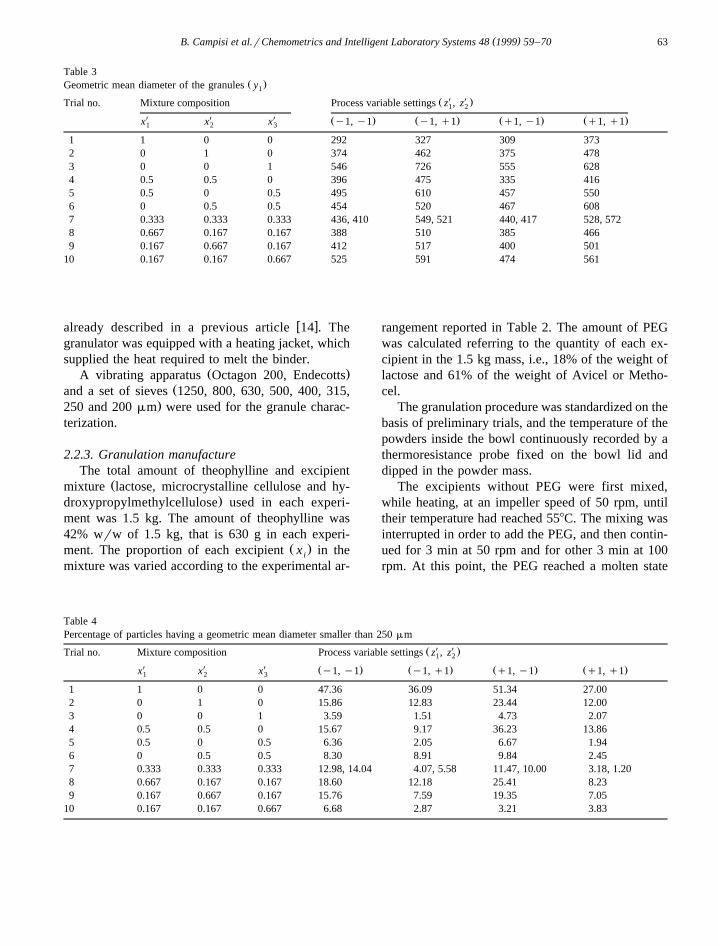
Table 4Percentage of particles having a geometric mean diameter smaller than 250 mm
X XŽ .Trial no. Mixture composition Process variable settings z , z1 2
X X X Ž . Ž . Ž . Ž .x x x y1, y1 y1, q1 q1, y1 q1, q11 2 3
1 1 0 0 47.36 36.09 51.34 27.002 0 1 0 15.86 12.83 23.44 12.003 0 0 1 3.59 1.51 4.73 2.074 0.5 0.5 0 15.67 9.17 36.23 13.865 0.5 0 0.5 6.36 2.05 6.67 1.946 0 0.5 0.5 8.30 8.91 9.84 2.457 0.333 0.333 0.333 12.98, 14.04 4.07, 5.58 11.47, 10.00 3.18, 1.208 0.667 0.167 0.167 18.60 12.18 25.41 8.239 0.167 0.667 0.167 15.76 7.59 19.35 7.05
10 0.167 0.167 0.667 6.68 2.87 3.21 3.83
( )B. Campisi et al.rChemometrics and Intelligent Laboratory Systems 48 1999 59–7064
Ž .the temperature was around 658C . During the sub-sequent massing process, impeller speed and massingtime were applied according to the combined experi-mental design. At the end of the granulation process,the granules were cooled at room temperature byspreading them out in thin layers on trays.
2.2.4. Granule characterizationThe cooled granules were stored in well-closed
bags for 10 days, thereafter the geometric mean di-Ž .ameter and the percentage in weight wrw of gran-
ules smaller than 250 mm were evaluated by sievew xanalysis, as described in a previous paper 15 .
3. Results and discussion
The mixture design and data processing, as well asplots and contours surfaces here presented, were ob-
w xtained using NEMRODW software 16 .The experimental runs were carried out in a com-
pletely random order according to the combined de-sign. As two replicates at the simplex centroid for
Žeach combination of process variables design point.7 were performed, the estimate of the variance due
to pure error was possible. Hence, the adequacy of thefitted model could be checked by comparing the er-ror component due to the model to that one due toexperimental error. For that purpose, a test procedurewas used to see whether to reject the null hypothesis
Žabout the zero lack of fit or not the so-called LOF.test . The test statistic was the F-ratio given by the
Ž .estimate of the variance due to lack of fit MSLOF
and the estimate of the variance due to pure errorŽ .MS . In general, lack of fit of the model is sus-PE
pected when the computed value of F is significant.
Table 5Model coefficients estimated by least square method for geometric
Ž . Žmean diameter y , along with their estimated standard errors est.1.S.E.
X X X XMean z z z z est. S.E.1 2 1 2
Xx 329.28 15.10 26.66 5.30 10.431Xx 424.41 1.42 47.79 2.43 10.432Xx 609.25 y26.79 57.18 y23.04 10.433X Xx x 121.51 y130.71 38.69 y42.04 47.241 2X Xx x 215.19 y59.12 43.47 5.00 47.241 3X Xx x y45.54 158.52 y7.26 110.27 47.242 3
Table 6Model coefficients estimated by least square method for percent-
Ž .age of particles -250 mm y , along with their estimated stan-2Ž .dard errors est. S.E.
X X X XMean z z z z est. S.E.1 2 1 2
Xx 39.78 y1.25 y8.84 y3.62 0.921Xx 16.30 1.58 y3.87 y1.94 0.922Xx 3.48 0.62 y0.93 0.07 0.923X Xx x y38.84 24.27 y4.20 y5.51 4.611 2X Xx x y70.15 y2.35 11.78 6.14 4.611 3X Xx x y6.97 y8.98 2.83 y2.74 4.612 3X X Xx x x 27.03 y93.40 y21.94 57.86 3.031 2 3
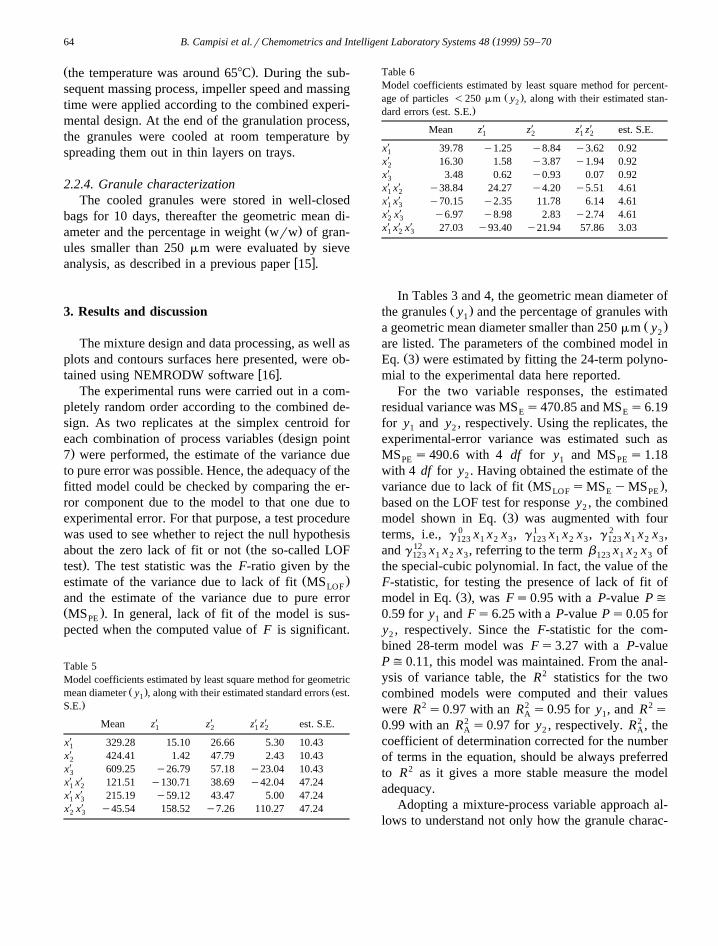
In Tables 3 and 4, the geometric mean diameter ofŽ .the granules y and the percentage of granules with1
Ž .a geometric mean diameter smaller than 250 mm y2
are listed. The parameters of the combined model inŽ .Eq. 3 were estimated by fitting the 24-term polyno-
mial to the experimental data here reported.For the two variable responses, the estimated
residual variance was MS s470.85 and MS s6.19E E
for y and y , respectively. Using the replicates, the1 2
experimental-error variance was estimated such asMS s 490.6 with 4 df for y and MS s 1.18PE 1 PE
with 4 df for y . Having obtained the estimate of the2Ž .variance due to lack of fit MS sMS yMS ,LOF E PE
based on the LOF test for response y , the combined2Ž .model shown in Eq. 3 was augmented with four
terms, i.e., g 0 x x x , g 1 x x x , g 2 x x x ,123 1 2 3 123 1 2 3 123 1 2 3
and g 12 x x x , referring to the term b x x x of123 1 2 3 123 1 2 3
the special-cubic polynomial. In fact, the value of theF-statistic, for testing the presence of lack of fit of
Ž .model in Eq. 3 , was Fs0.95 with a P-value P(0.59 for y and Fs6.25 with a P-value Ps0.05 for1
y , respectively. Since the F-statistic for the com-2
bined 28-term model was Fs3.27 with a P-valueP(0.11, this model was maintained. From the anal-ysis of variance table, the R2 statistics for the twocombined models were computed and their valueswere R2 s0.97 with an R2 s0.95 for y , and R2 sA 1
0.99 with an R2 s0.97 for y , respectively. R2 , theA 2 A
coefficient of determination corrected for the numberof terms in the equation, should be always preferredto R2 as it gives a more stable measure the modeladequacy.
Adopting a mixture-process variable approach al-lows to understand not only how the granule charac-
( )B. Campisi et al.rChemometrics and Intelligent Laboratory Systems 48 1999 59–70 65
teristics studied depend on the component propor-tions, but also on the level of the process variablesand how the effects of the component proportions onthe response may be influenced by the process vari-able settings. As a matter of fact, in the combined
equation, the first six terms involve only the mixturecomponents, whereas the remaining eighteen termsshould give an estimation of the effect of the processparameters on the blending property of each compo-nent. Such effects can be evaluated considering the
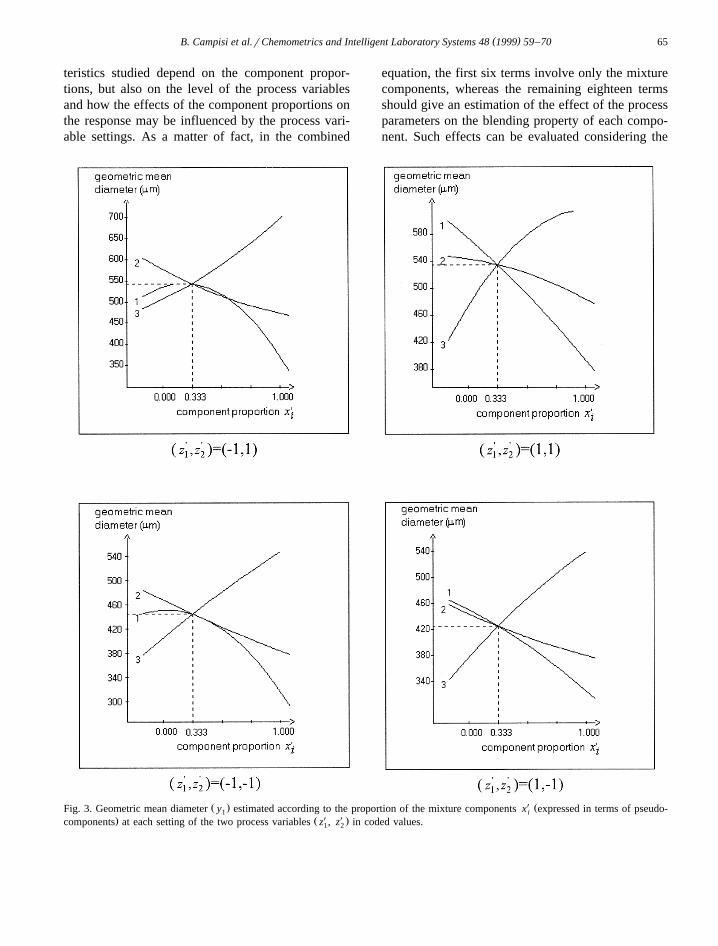
Ž . X ŽFig. 3. Geometric mean diameter y estimated according to the proportion of the mixture components x expressed in terms of pseudo-1 i. Ž X X .components at each setting of the two process variables z , z in coded values.1 2
( )B. Campisi et al.rChemometrics and Intelligent Laboratory Systems 48 1999 59–7066
coefficient estimates reported in Tables 5 and 6, alongŽ .with their estimated standard errors est. S.E. .
Another possible approach to analyse the effect ofprocess variables and mixture composition on thegranule characteristics is to consider the four process
variable combinations separately. In particular, whena combined model is considered, the analysis of theeffect of process and mixture variables can be actu-ally not so easy to be interpreted. On the contrary,displaying graphically the variable responses under
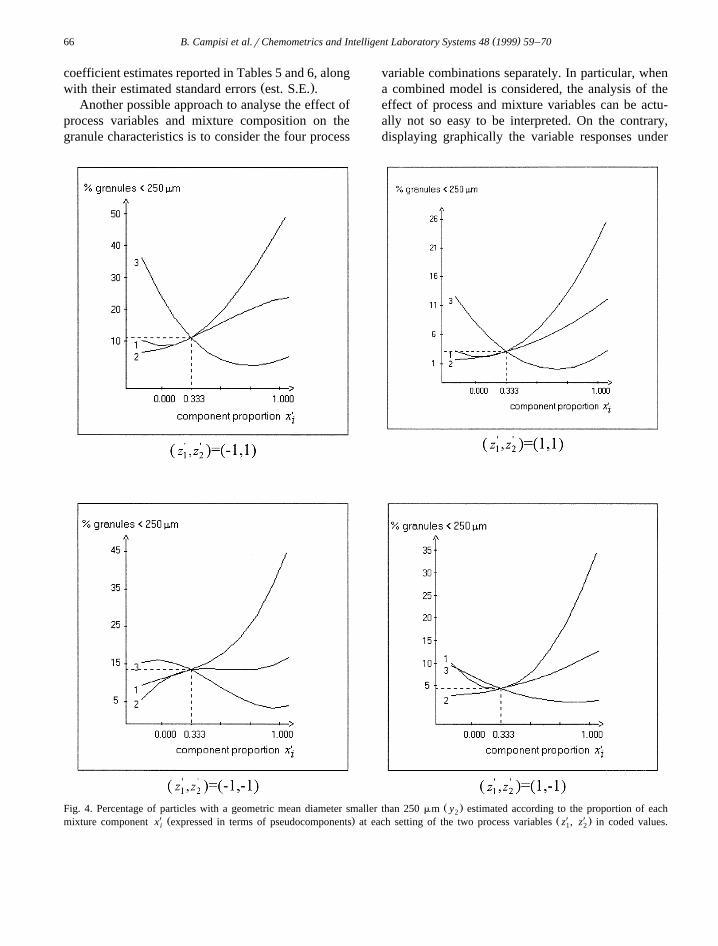
Ž .Fig. 4. Percentage of particles with a geometric mean diameter smaller than 250 mm y estimated according to the proportion of each2X Ž . Ž X X .mixture component x expressed in terms of pseudocomponents at each setting of the two process variables z , z in coded values.i 1 2
( )B. Campisi et al.rChemometrics and Intelligent Laboratory Systems 48 1999 59–70 67
study according to the proportion of component iwhile holding fixed the relative proportions of the
Ž .other components Figs. 3 and 4 , or using contourŽ .plots Figs. 5 and 6 can make more easy the inter-
pretation of the influence of the process variables onthe mixture composition.
Each plot and contour surface displayed in Figs.3–6 were obtained from the data collected at the cor-responding arrangement of the two-level factors.From the contour plots, it is evident that according toprocess variable levels the fitted models are quitedifferent. In fact, as far as the response y is consid-1
Ž X X .ered, the surfaces turned out to be planar for z , z1 2Ž . Ž X X . Ž .s y1, q1 and quadratic for z , z s q1, q1 ,1 2
Ž . Ž .y1, q1 , and y1, y1 . As regards response y ,2Ž X X . Ž .the surfaces were quadratic for z , z s q1, q1 ,1 2
Ž . Ž X X . Žy1, q1 , and special cubic for z , z s y1,1 2. Ž .y1 and y1, q1 .
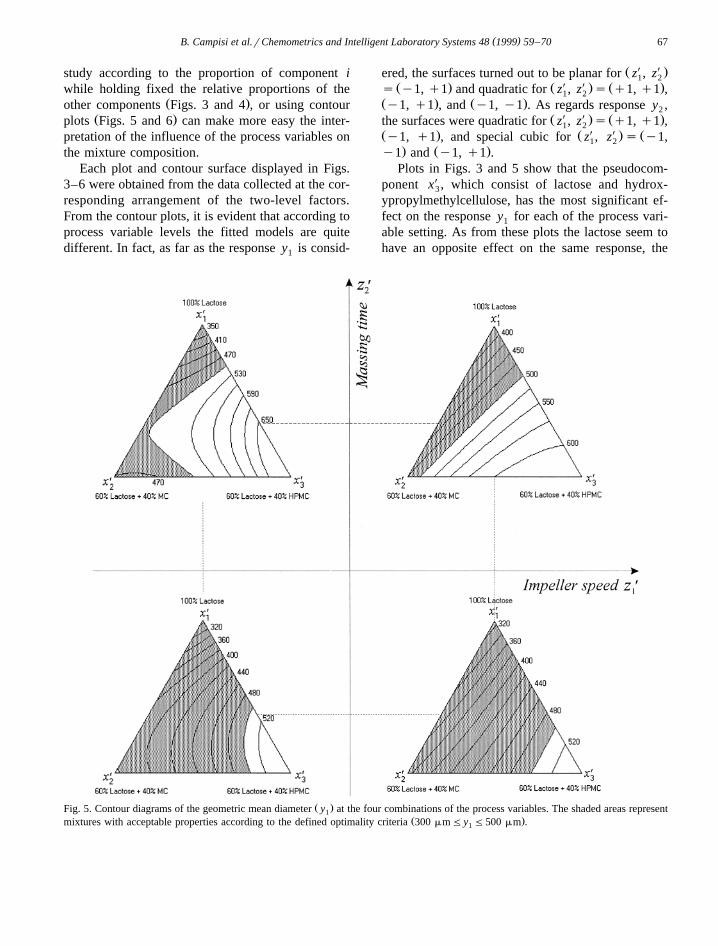
Plots in Figs. 3 and 5 show that the pseudocom-ponent xX , which consist of lactose and hydrox-3
ypropylmethylcellulose, has the most significant ef-fect on the response y for each of the process vari-1
able setting. As from these plots the lactose seem tohave an opposite effect on the same response, the
Ž .Fig. 5. Contour diagrams of the geometric mean diameter y at the four combinations of the process variables. The shaded areas represent1Ž .mixtures with acceptable properties according to the defined optimality criteria 300 mmFy F500 mm .1
( )B. Campisi et al.rChemometrics and Intelligent Laboratory Systems 48 1999 59–7068
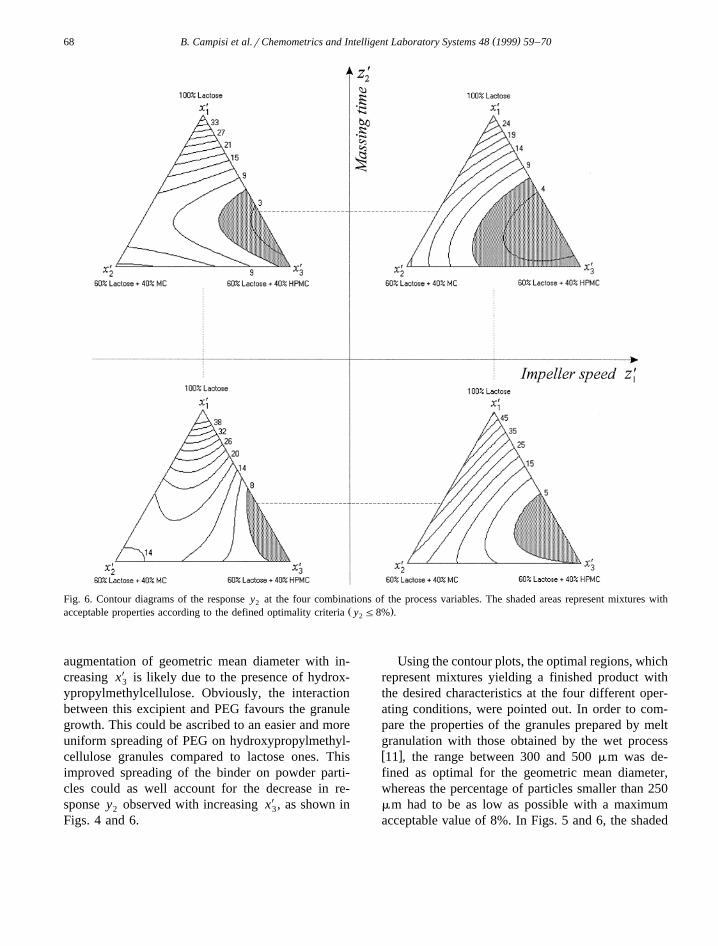
Fig. 6. Contour diagrams of the response y at the four combinations of the process variables. The shaded areas represent mixtures with2Ž .acceptable properties according to the defined optimality criteria y F8% .2
augmentation of geometric mean diameter with in-creasing xX is likely due to the presence of hydrox-3
ypropylmethylcellulose. Obviously, the interactionbetween this excipient and PEG favours the granulegrowth. This could be ascribed to an easier and moreuniform spreading of PEG on hydroxypropylmethyl-cellulose granules compared to lactose ones. Thisimproved spreading of the binder on powder parti-cles could as well account for the decrease in re-sponse y observed with increasing xX , as shown in2 3
Figs. 4 and 6.
Using the contour plots, the optimal regions, whichrepresent mixtures yielding a finished product withthe desired characteristics at the four different oper-ating conditions, were pointed out. In order to com-pare the properties of the granules prepared by meltgranulation with those obtained by the wet processw x11 , the range between 300 and 500 mm was de-fined as optimal for the geometric mean diameter,whereas the percentage of particles smaller than 250mm had to be as low as possible with a maximumacceptable value of 8%. In Figs. 5 and 6, the shaded
( )B. Campisi et al.rChemometrics and Intelligent Laboratory Systems 48 1999 59–70 69
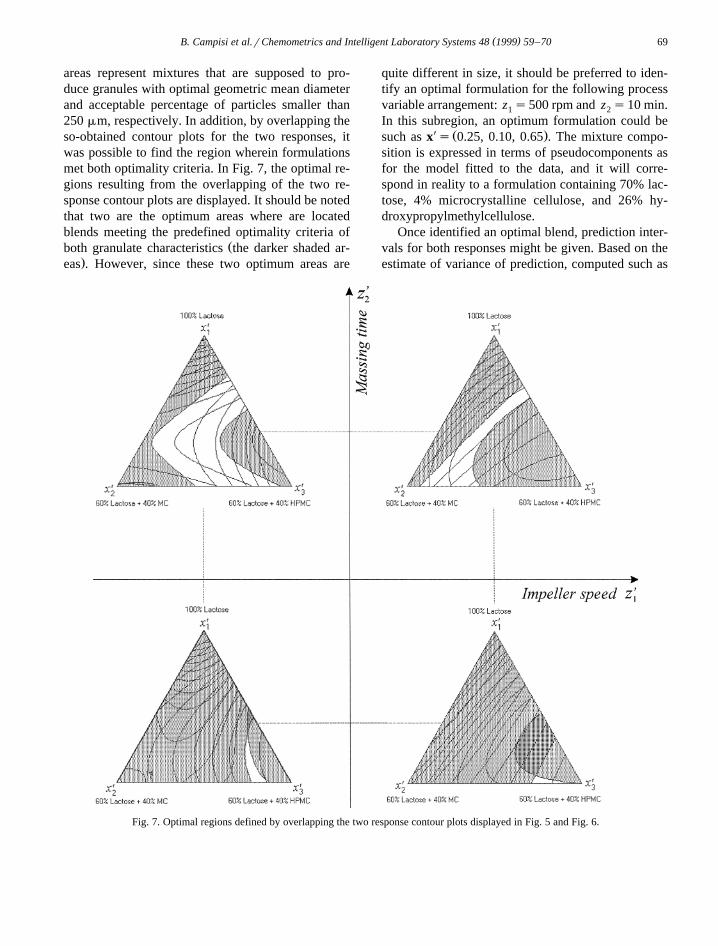
areas represent mixtures that are supposed to pro-duce granules with optimal geometric mean diameterand acceptable percentage of particles smaller than250 mm, respectively. In addition, by overlapping theso-obtained contour plots for the two responses, itwas possible to find the region wherein formulationsmet both optimality criteria. In Fig. 7, the optimal re-gions resulting from the overlapping of the two re-sponse contour plots are displayed. It should be notedthat two are the optimum areas where are locatedblends meeting the predefined optimality criteria of
Žboth granulate characteristics the darker shaded ar-.eas . However, since these two optimum areas are
quite different in size, it should be preferred to iden-tify an optimal formulation for the following processvariable arrangement: z s500 rpm and z s10 min.1 2
In this subregion, an optimum formulation could beX Ž .such as x s 0.25, 0.10, 0.65 . The mixture compo-
sition is expressed in terms of pseudocomponents asfor the model fitted to the data, and it will corre-spond in reality to a formulation containing 70% lac-tose, 4% microcrystalline cellulose, and 26% hy-droxypropylmethylcellulose.
Once identified an optimal blend, prediction inter-vals for both responses might be given. Based on theestimate of variance of prediction, computed such as
Fig. 7. Optimal regions defined by overlapping the two response contour plots displayed in Fig. 5 and Fig. 6.
( )B. Campisi et al.rChemometrics and Intelligent Laboratory Systems 48 1999 59–7070
w Ž .x XŽ X .I1 2est. var y x s x X X x s , the 95% confi-ˆdence limits for the values of y and y for the opti-1 2
mal formulation could be determined by y " D,ˆiw x � w Ž .x41r2where D s t est. var y x , f is theˆf , a r2
number of degrees of freedom associated with thesample estimates s2, and t is the t-value with f de-
w xgrees of freedom at the ar2 level of significance 7 .Therefore, the 95% confidence intervals on the tworesponses for the optimal blend above mentionedshould become 482.5y14.25Fy F482.5q14.25ˆ1
and 1.58y1.25Fy F1.58q1.25, respectively.ˆ2
In conclusion, the approach presented here hasundoubtedly made possible to improve knowledgegained through previous investigation on melt granu-lation. Combining mixture composition and processvariables using experimental design has proved to beappropriate and effective, in particular, in findingprocessing conditions and subregion yielding blendformulations leading to a product with the character-istics required.
Acknowledgements
The authors wish to thank Zanchetta-RomacoGroup for supporting this research. It must be alsomentioned that this study has been made possible bya fellowship from the Italian National Research
Ž .Council CNR to the first author for the ResearchProject ‘Quality optimization of products and pro-cesses using Experimental Design Methodology’.
References
w x1 T. Schaefer, P. Holm, H.G. Kristensen, Melt granulation in alaboratory scale high shear mixer, Drug Dev. Ind. Pharm. 16Ž . Ž .8 1990 1249–1277.
w x2 C.M. McTaggart, J.A. Ganley, A. Sickmueller, S.E. Walker,
The evaluation of formulation and processing conditions of aŽ .melt granulation process, Int. J. Pharm. 19 1984 139–148.
w x3 P. Flanders, G.A. Dyer, D. Jordan, The control of drug re-lease from conventional melt granulation matrices, Drug Dev.
Ž . Ž .Ind. Pharm. 13 6 1987 1001–1022.w x4 B. Evrard, L. Delattre, Melt granulation with a new labora-
tory high shear mixer, 6th International Conference on Phar-Ž .maceutical Technology APGI , Paris, France, 2–4 June 1992,
pp. 187–196.w x5 A. Royce, J. Suryawanshi, U. Shah, K. Vishnupad, Alterna-
tive granulation technique: melt granulation, Drug Dev. Ind.Ž . Ž .Pharm. 22 9 and 10 1996 917–924.
w x6 E.P. Box, W.G. Hunter, J.S. Hunter, Statistics for experi-menters, An Introduction to Design, Data Analysis, andModel Building, Wiley, New York, 1978.
w x7 J.A Cornell, Experiments with mixtures, Design, Models, andthe Analysis of Mixture Data, Wiley, New York, 1990.
w x8 G.A. Lewis, D. Mathieu, R. Phan-Tan-Luu, PharmaceuticalExperimental Design, Marcel Dekker, New York, 1998.
w x9 J. Chardon, J. Nony, M. Sergent, D. Mathieu, R. Phan-Tan-Luu, Experiment research methodology applied to the devel-opment of a formulation for use with textiles, Chemometrics
Ž .and Intelligent Laboratory Systems 6 1989 313–321.w x10 M. Hirata, K. Takayama, T. Nagai, Formulation optimization
of sustained-release tablet of chlorpheniramine maleate bymeans of extreme vertices design and simultaneous optimiza-
Ž .tion technique, Chem. Pharm. Bull. 40 1992 741–746.w x11 D. Vojnovic, M. Moneghini, F. Rubessa, Optimization of
granulates in a high shear mixer by mixture design, Drug Dev.Ž . Ž .Ind. Pharm. 20 6 1994 1035–1047.
w x12 R.D. Snee, A.A. Rayner, Assessing the accuracy of mixturemodel regression calculations, Journal of Quality TechnologyŽ . Ž .2 14 1982 67–79.
w x13 R.C. St. John, Experiments with mixtures, ill-conditioning,Ž .and ridge regression, Journal of Quality Technology 2 16
Ž .1984 81–96.w x14 D. Vojnovic, P. Rupena, M. Moneghini, F. Rubessa, S.
Coslovich, R. Phan-Tan-Luu, M. Sergent, Experimental re-search methodology applied to wet pelletization in high shear
Ž .mixer: Part I, STP Pharma Sci. 3 1993 130–135.w x15 D. Vojnovic, M. Moneghini, F. Rubessa, Experimental de-
sign for a granulation process with a priori criteria, Drug Dev.Ž .Ind. Pharm. 21 1995 823–831.
w x16 D. Mathieu, J. Nony, R. Phan-Tan-Luu, New EfficientŽMethodology for Research using Optimal Design NEMRO-
.DW Software-L.P.R.A.I., Marseille, 1998.
Copyright © 2022 FDOKUMEN