Fiery Climates: A Story of Wildland Firefighters by Robert Scott ...
Upload
khangminh22Category
view
1download
0
MEETING NOTICE of POLICE and FIREFIGHTERS’ PENSION BOARDS OF TRUSTEES
There will be a joint meeting of the Wilmette Police Pension Board of Trustees and the Wilmette Firefighters’ Pension Board of Trustees at 3:30 P.M. on Thursday, October 22, 2020
Village Board Council Chambers – Broadcast only (Village Hall is closed due to the Village President’s Declaration of Local Disaster and Public Health Emergency Order) 1
I. CALL TO ORDER
II. ROLL CALL
III. PUBLIC COMMENT
IV. APPROVAL OF MINUTES
a. Police Joint Meeting July 23, 2020 b. Fire Joint Meeting July 23, 20 c. Police Special meeting September 1, 2020
V. PENSION TRUSTEE UPDATE
a. Appoint the FOIA / OMA officer b. Reminder - Open Meetings Act and Freedom of Information Act training
VI. PENSION MEMBERSHIP CHANGES a. Approval of new pension member(s) b. Approval of new pensioner(s) c. Approval of annual increase d. Notification of the death of pensioner e. Refund of member contribution f. Notice of Intent to Receive Benefits Pursuant to 40 ILCS 5/4-109.3 / Election Form Combine
Creditable Service (Reciprocity) – M. Wessel
VII. FINANCIAL DATA a. Approval of Disbursements b. Presentation of summary of cash bank account activity c. Presentation of cash flows d. Notification of Filing of Annual Statements to Illinois Department of Insurance
VIII. INVESTMENT REPORT
a. Presentation of 3rd Quarter Investment results by Graystone Consulting b. Discuss Current S&P 500 buy orders c. Approve strategy to fund cash flow needs by Graystone Consulting d. Asset allocation review and possible portfolio rebalance e. Manager Review – London / Small cap Managers Search f. Manager Review – Lazard / Emerging Market Equity Search
IX. MISCELLANEOUS
a. 2021 Meeting schedule b. Presentation of Actuary Reports c. Investment policy – review and update d. Board rules - updates for approval e. Semi-annual review of closed executive session minutes to determine what needs to remain
confidential f. Fire disability matters updates – L. Burns Annual Evaluation for Disability Pension update g. Police disability matters updates
i. Review and Discuss Decision and Order in the Matter of the Disability Application of Officer Sam Walker.
ii. Vote to Approve, Adopt and Publish the Decision and Order in the Matter of the Disability Application of Officer Sam Walker.
h. Conference / Seminar / Training discussion and approval

X. NEW, OLD, UNFINISHED BUSINESS
a. Discuss and Vote to approve a Legal Service Agreement between the law firm of Reimer & Dobrovolny PC and the Board of Trustees of the Wilmette Police Pension Fund.
b. Update on the Consolidation process as well as potential legal action to overturn the Public Act 101-0610.
XI. ADJOURNMENT Christopher Canning, President David Farina, President Firefighters’ Pension Board Police Pension Board October 15, 2020 1 This meeting will be held remotely by the Police and Firefighters’ Pension Funds Board of Trustees. There is the option to participate in the meeting via a PC, mobile device or phone. For additional information regarding participating in the meeting, please click here
To Watch: Live on YouTube at https://www.youtube.com/user/villageofwilmette/live
Live on Channel 6 with periodic re-broadcast To Speak:
Click the link to join via Join Microsoft Teams Meeting (video and audio) Call (872) 239-8225 and use code 560 510 560# (audio only)
In Writing: Send written comments to [email protected]
YouTube Chat – comments made in YouTube Chat during the meeting will be read to the Trustees
If you are a person with a disability and need special accommodations to attend and/or participate in a Village of Wilmette public meeting, please notify the Management Services Department at 251-2700 (TDD# 853-7634) as soon as possible.

MINUTES OF THE BOARD OF TRUSTEES TELECONFERENCE MEETING WILMETTE FIRE PENSION FUND
July 23, 2020 This was a meeting of the Wilmette Fire Pension Fund. Location: This meeting was held remotely by the Police and Firefighters’ Pension Funds Board of Trustees. There is the option to participate in the meeting via a PC, mobile device or phone. Live on YouTube at https://www.youtube.com/user/villageofwilmette/live. Live on Channel 6 with periodic re-broadcast. To Speak: Click the link to join via Join Microsoft Teams Meeting (video and audio) Call (872) 239-8225 and use code 304 677 3# (audio only) In Writing: Send written comments to [email protected] YouTube Chat – comments made in YouTube Chat during the meeting will be read to the Trustees If you are a person with a disability and need special accommodations to attend and/or participate in a Village of Wilmette public meeting, please notify the Management Services Department at 251-2700 (TDD# 853-7634) as soon as possible.
I. CALL TO ORDER The meeting was called to order at 2:00pm.
II. ROLL CALL
The roll call showed the following members present: Mr. Canning President Ms. Molloy Treasurer Mr. Mitchell Mr. Weglarz
Members Absent:
III. PUBLIC COMMENT
a. No prior comments to review b. No comments via YouTube live c. No phone comments
IV. APPROVAL OF MINUTES
a. Ms. Molloy made a motion to approve the minutes of the May 21, 2020 Joint Special Meeting. Mr. Mitchel seconded.
Roll call vote shows the following: Mr. Canning – Aye Ms. Molloy – Aye Mr. Mitchell – Aye Mr. Weglarz – Aye
Mr. Grajewski

The motion passed.
V. PENSION TRUSTEE UPDATE a. Election of officers
i. Mr. Weglarz made a motion to nominate and elect David Grajewski for Pension Board Secretary. There were no other nominations for the position. Mr. Mitchell seconded the motion. Roll call vote shows the following:
Mr. Canning – Aye Ms. Molloy – Aye Mr. Mitchell – Aye Mr. Weglarz – Aye
The motion passed. ii. Mr. Mitchell made a motion to nominate and elect Mr. Chris Canning for
Pension Board President. Ms. Molloy seconded the motion. Roll call vote shows the following:
Mr. Canning – Aye Ms. Molloy – Aye Mr. Mitchell – Aye Mr. Weglarz – Aye
The motion passed.
VI. PENSION MEMBERSHIP CHANGES a. None
VII. MANAGER REVIEW (JOHCM) a. Mr. Canning advanced item VIII d.
i. At 2:20pm a Presentation of JOHCM funds presented by guests Tom McAvoy and Damon Gough was given. The presentation ended at 2:26pm.
VIII. FINANCIAL DATA
a. Approval of Disbursements i. Mr. Mitchell made a motion to approve the disbursements presented. Mr.
Weglarz seconded. Roll call vote shows the following:
Mr. Canning – Aye Ms. Molloy – Aye Mr. Mitchell – Aye Mr. Weglarz – Aye
The motion passed.
b. Presentation of summary of cash bank account activity. i. Ms. Molloy presented summary of bank account activity.
c. Presentation of cash flows. i. Ms. Molloy presented summary of cash flows.

d. Notification of Filing of Annual Statements to Illinois Department of Insurance. i. Ms. Molloy gave an update that the filings for the Illinois Department of
Insurance statements have been accepted.
IX. INVESTMENT REPORT (Tom McShane) a. Presentation of 2nd quarter results by Tom McShane of Graystone Consulting b. Discuss current S&P500 buy orders and approve strategy to fund cash flow needs
by Graystone Consulting. c. Asset allocation review and possible portfolio rebalance:
i. Mr. Mitchell mad a motion to move $500k from the Vanguard SP500 Inst Index and move to Weaver – Fixed Income fund. Mr. Weglarz seconded the motion. Roll call vote shows the following:
Mr. Canning – Aye Ms. Molloy – Aye Mr. Mitchell – Aye Mr. Weglarz – Aye
The motion passed.
ii. Mr. McShane suggested a closer look at removing Lazard from the fund. I. Mr. Canning recommended forming a subcommittee to work with
Graystone Consulting to review Emerging market and Small cap managers for the board to action at next meeting to possibly replace Lazard.
X. MISCELLANEOUS a. Conference/Seminar/Training
i. Ms. Molloy reminded trustees to obtain 4 hour class for transition training. b. Semi-annual review of closed session minutes
i. None. XI. NEW, OLD, UNFINISHED BUSINESS
a. Ms. Molloy informed trustees of the training & elections for the transition to consolidation.
b. 10 year audit by Illinois Department of Insurance c. Actuarial reports will be included in next meeting packet. d. A letter was received in reference to challenging the consolidation law.
XII. ADJOURNMENT a. Trustee Mitchell made a motion to adjourn the meeting, Trustee Weglarz
seconded. Roll call vote shows the following:
Mr. Canning – Aye Ms. Molloy – Aye Mr. Mitchell – Aye Mr. Weglarz – Aye
The motion passed. The meeting adjourned at 4:08pm.


MINUTES OF THE BOARD OF TRUSTEES MEETING
WILMETTE POLICE PENSION FUND
July 23, 2020
1 Draft
There will be a joint meeting of the Wilmette Police Pension Board of Trustees and the Wilmette Firefighters’ Pension Board of Trustees at 2:00 P.M. on Thursday, July 23, 2020. Location: The joint meeting was conducted remotely via Microsoft Teams App in accordance with Section 6 of Governor Pritzker’s Executive Order 2020-07 (COVID-19 Executive Order No. 5) and Executive Order 2020-33 (COVID-19 Executive Order No. 31). There is the option to participate in the meeting via a PC, mobile device or phone. Live on YouTube at https://www.youtube.com/user/villageofwilmette/live. Live on Channel 6 with periodic re-broadcast. To Speak: Click the link to join via Join Microsoft Teams Meeting (video and audio) Call (872) 239-8225 and use code 304 677 3# (audio only) In Writing: Send written comments to [email protected] YouTube Chat – comments made in YouTube Chat during the meeting will be read to the Trustees If you are a person with a disability and need special accommodations to attend and/or participate in a Village of Wilmette public meeting, please notify the Management Services Department at 251-2700 (TDD# 853-7634) as soon as possible.
I. CALL TO ORDER. The meeting was called to order at 2:00 PM.
II. ROLL CALL.
The roll call showed the following members present and all members could hear each other:
Mr. Farina President Mr. Kinzel Vice President Mr. Collins Secretary Mr. Sokolnik Active Member Mr. Paulson Retired Member
The roll call showed the following members absent:
None
III. PUBLIC COMMENT. There was no public comment prior to the meeting; no public comment on YouTube live channel; and no comment through Teams App.
IV. APPROVAL OF MINUTES
Mr. Kinzel moved to approve the Minutes for the Joint Meeting on May 21st, 2020 without modifications, adjustments, clarifications, comments. Mr. Sokolnik seconded the motion. No further discussion occurred on the motion and the following roll call vote was taken.

MINUTES OF THE BOARD OF TRUSTEES MEETING
WILMETTE POLICE PENSION FUND
July 23, 2020
2 Draft
Roll Call Vote: Mr. Farina Aye Mr. Kinzel Aye Mr. Collins Aye Mr. Sokolnik Aye Mr. Paulson Aye
The motion carried approving the Minutes for the Joint Meeting on May 21st, 2020 without modifications, adjustments, clarifications, comments.
V. PENSION TRUSTEE UPDATE
a. Election of Officers – i. President Nominee.
Mr. Kinzel motioned to nominate Mr. Farina as President. Mr. Collins seconded the motion. Roll Call Vote: Mr. Farina Abstain Mr. Kinzel Aye Mr. Collins Aye Mr. Sokolnik Aye Mr. Paulson Aye The motion carried nominating Mr. Farina as the President of the Police Pension Board.
ii. Vice President Nominee. Mr. Farina motioned to nominate Mr. Kinzel as Vice-President. Mr. Sokolnik seconded the motion. Roll Call Vote: Mr. Farina Aye Mr. Kinzel Aye Mr. Collins Aye Mr. Sokolnik Aye Mr. Paulson Aye
The motion carried nominating Mr. Kinzel as the Vice President of the Police Pension Board.
iii. Secretary Nominee.
Mr. Farina motioned to nominate Mr. Collins as Secretary.

MINUTES OF THE BOARD OF TRUSTEES MEETING
WILMETTE POLICE PENSION FUND
July 23, 2020
3 Draft
Mr. Sokolnik seconded the motion. Roll Call Vote: Mr. Farina Aye Mr. Kinzel Aye Mr. Collins Aye Mr. Sokolnik Aye Mr. Paulson Aye The motion carried nominating Mr. Collins as the Secretary of the Police Pension Board.
iv. Assistant Secretary Nominee.
Mr. Collins motioned to nominate Mr. Sokolnik as Assistant Secretary. Mr. Farina seconded the motion. Roll Call Vote: Mr. Farina Aye Mr. Kinzel Aye Mr. Collins Aye Mr. Sokolnik Aye Mr. Paulson Aye The motion carried nominating Mr. Sokolnik as the Assistant Secretary of the Police Pension Board.
VI. PENSION MEMBERSHIP CHANGES
a. Approval of new pension member(s) – No Action Needed
b. Approval of new pensioner(s) – No Action Needed
c. Approval of annual increase – No Action Needed.
d. Approval of initial increase –
i. Daniel Walsh 06/01/2020
Mr. Kinzel motioned to approve the initial increase for Pensioner Daniel Walsh. Mr. Sokolnik seconded the motion.

MINUTES OF THE BOARD OF TRUSTEES MEETING
WILMETTE POLICE PENSION FUND
July 23, 2020
4 Draft
Roll Call Vote: Mr. Farina Aye Mr. Kinzel Aye Mr. Collins Aye Mr. Sokolnik Aye Mr. Paulson Aye The motion carried approving the initial increase for Pensioner Daniel Walsh.
ii. Jeffrey Hemesath 02/01/2020 – The initial increase for Pensioner
Jeffrey Hemesath was approved during the approval of the annual increase on January 23, 2020. Director Molloy included the documentation for the initial increase during this meeting.
e. Notification of the death of pensioner. Geraldine Yohe 06/24/2020 The
Board was notified the passing away of Geraldine Yohe, who was the surviving spouse of Richard Yohe.
f. Refund of member contribution. No Action Needed.
g. Other: Arlene Walsh – Director Molloy notified the Board that the Quildro
payment of $1000.00 to Arlene Walsh, ex-spouse of Daniel Walsh, for 20 years began on February 2020.
VII. FINANCIAL DATA
a. Approval of Disbursements The Pension Board discussed and reviewed the disbursements for the 2nd quarter of 2020 totaling $34,793.10. Disbursements included payments for investment management fees to Morgan Stanley Smith Barney; SKBA Capital Mgmt & Weaver Barksdale; for actuarial services to Foster & Foster; for share of audit expenses to Lauterbach & Amen; annual compliance fee to Illinois Dept of Insurance; IDOI filing preparation to K. Krueger and for legal fees to Reimer & Dobrovolny PC. Mr. Kinzel moved to approve the disbursements for the second quarter of 2020. Mr. Sokolnik seconded the motion. No further discussion occurred on the motion.
Roll Call Vote: Mr. Farina Aye

MINUTES OF THE BOARD OF TRUSTEES MEETING
WILMETTE POLICE PENSION FUND
July 23, 2020
5 Draft
Mr. Kinzel Aye Mr. Collins Aye Mr. Sokolnik Aye Mr. Paulson Aye
The motion carried approving the disbursements for the second quarter of 2020.
b. Presentation of summary of cash bank account activity.
Finance Director Molloy reviewed the 2020 North Shore Community Bank Activity Report.
c. Presentation of cash flows
Finance Director Molloy reviewed cash flow projections for 2020. Reviewed the flows and end balance which is carried into cash flow projections. Director Molloy doesn’t see any need to do any transfers at this time
d. Notification of Filing of Annual Statements to Illinois Department of
Insurance Director Molloy related that the IDOI annual statement was submitted, and just got the IDOI acceptance certification.
VIII. INVESTMENT REPORT
a. Presentation of 2020 2nd Quarter Investment results by Graystone Consulting representative Tom McShane.
McShane reviewed the Summary of Recent actions. He related that the Board’s actions were beneficial for the Funds.
b. Discuss Current S&P 500 buy orders and approve strategy to fund cash flow needs by Graystone Consulting. Mr. McShane review
McShane reviewed S&P 500, Asset Class Index Performance, an GIC Weekly. He also reviewed impacts on the market that a rising permanent job losses would have.
c. Asset allocation review and possible portfolio rebalance. Mr. McShane discussed asset allocation and believes at current level don’t need to do anything unless the Board wants to balance the funds. Mr. Farina proposed moving funds from large capital stock to bonds to start rebalancing. The Board discussed the different transferring options.

MINUTES OF THE BOARD OF TRUSTEES MEETING
WILMETTE POLICE PENSION FUND
July 23, 2020
6 Draft
i. Mr Farina made a motion to transfer $500K from the Vandguard S&P 500 Inst. Index to Weaver - Fixed Income. Mr. Sokolnik seconded the motion.
Roll Call Vote: Mr. Farina Aye Mr. Kinzel Aye Mr. Collins Aye Mr. Sokolnik Aye Mr. Paulson Aye
The motion carried approving transfer $500K from the Vandguard S&P 500 Inst. Index to Weaver - Fixed Income.
ii. Mr. McShane reviewed performance of the fund managers and the portfolio performance. Director Molloy had questions concerning Lazard-Emerging Markets Equity. Mr. McShane related that he believes the Board has given enough time for Lazard to perform. Mr. Canning suggested establishing a subcommittee to review different managers and then report to the Boards at the October Quarterly Meeting. A subcommittee consisting of Mr. McShane, Mr. Kinzel and Mr. Grajewski was established to review small caps and emerging market funds.
d. Manager Review – JOHCM International Select Mutual Fund. Symbol
JOHIX. Tom McAvoy and Damon Gough This item was advanced to after the discussion of Pension Membership Changes (VI.). Mr. McShane provided some introduction information. Mr. McAvoy and Mr. Gough provided information concerning themselves and JOHCM International. They reviewed the investment philosophy and the possible impacts on the market by COVID-19 and the upcoming election.
IX. MISCELLANEOUS a. Conference / Seminar / Training discussion and approval
i. Training Request. Mr. Collins mentioned the online trustee training available from IPPFA.
ii. July 23, 2020 Joint Meeting hours of training is TBD at October
meeting.
iii. Training Documents Distributed.

MINUTES OF THE BOARD OF TRUSTEES MEETING
WILMETTE POLICE PENSION FUND
July 23, 2020
7 Draft
1. Legal Updates July 2020 from Ottosen, DiNolfo, Hasenbalg & Castaldo, Ltd.
2. Pension Insights (Third Quarter 2020)
b. Semi-annual review of closed executive session minutes to determine
what needs to remain confidential. This was tabled to the October meeting.
c. Police disability matters updates. Disability Hearing for Officer Sam Walker has been set for September 1st at 3:00 PM with a location TBD.
I. NEW, OLD, UNFINISHED BUSINESS.
a. Director Molloy notified that the trustees will need to obtain the mandatory 4-hour class on consolidation transition training and that nominations for the election of trustees for the Police Officers’ Pension Investment Fund and Firefighters’ Pension Investment Fund are ongoing.
b. Director Molloy provided an update on the status of the IDOI 10 year audit. c. Actuary reports have been completed and will be included in the October
meeting packet. d. The Boards discuss the letter from attorney firm of Konicek & Dillon
concerning legal action to stop the consolidation of pension funds to the Police Officers Pension Investment Fund under Public Act 101-0610.
II. ADJOURNMENT
Mr. Collins moved to adjourn. Mr. Sokolnik seconded the motion. No further discussion occurred on the motion.
Roll Call Vote: Mr. Farina Aye Mr. Kinzel Abstained Mr. Collins Aye Mr. Sokolnik Aye Mr. Paulson Aye
The motion carried and the meeting was adjourned at 4:08 PM.

MINUTES OF THE BOARD OF TRUSTEES SPECIAL MEETING
WILMETTE POLICE PENSION FUND
September 1st, 2020
1 Draft
This was a special meeting of the Wilmette Police Pension Board of Trustees. Location: This special meeting regarding the disability claim of Officer Sam Walker pursuant to the applicable provisions of Article 3 of the Illinois Pension Code was held remotely by the Wilmette Police Pension Funds Board of Trustees via videoconference in accordance with Executive Order 2020-52 issued by Governor Pritzker and Public Act 100-640. No in-person meeting will take place. David Farina, the President of the Wilmette Police Pension Board, finds that an in-person meeting is not practical or prudent and that in person attendance by one of the Pension Board Trustees at the Wilmette Fire Station 26 or Police Department is not feasible due to the corona virus and the Governor’s Disaster Proclamation.
The public was given the opportunity to participate by calling in or logging in at zoom.us using the below Zoom Invite and view live on Channel 6. By entering this meeting, participants agreed to be audio and video recorded. Zoom Invite: Public Invited via videoconference https://zoom.us/join Meeting ID: 955 2867 3759 Passcode: 201808 Dial In Invite: Public Invited via audio +1 312 626 6799 Meeting ID: 955 2867 3759.
I. CALL TO ORDER. The meeting was called to order at 3:07 PM.
II. ROLL CALL. The roll call showed the following members present and can hear one another:
Mr. Farina President Mr. Kinzel Vice President Mr. Collins Secretary Mr. Sokolnik Active Member Mr. Paulson Retired Member
The roll call showed the following members absent.
None
III. PUBLIC COMMENT. There was no public comment.
IV. OPEN HEARING TO CONSIDER EVIDENCE AND TESTIMONY ON MR. SAM WALKER’S PENSION DISABILITY CLAIM.

MINUTES OF THE BOARD OF TRUSTEES SPECIAL MEETING
WILMETTE POLICE PENSION FUND
September 1st, 2020
2 Draft
a. Attorney Richard Reimer represented the Board and Attorney Timothy O’Neil represented Mr. Sam Walker.
b. The Board heard testimony and evidence concerning the pension disability
claim of Mr. Sam Walker. See transcripts.
V. EXECUTIVE/CLOSED SESSION TO CONSIDER EVIDENCE OR TESTIMONY PRESENTED IN OPEN HEARING.
a. At 4:07 PM, the Board voted by roll call vote to adjourn to executive closed
session to consider evidence and testimony presented in open hearing pursuant to Section 2 (c)(4) of the Illinois Open Meetings Act. See transcripts.
b. At 4:32 PM, the Board came out of executive closed session. There was
no final action taken in executive closed session. See transcripts. VI. OPEN HEARING TO PRESENT THE BOARD’S DECISION CONCERNING MR.
SAM WALKER’S PENSION DISABILITY CLAIM.
a. At 4:35 PM, the Board voted by roll call vote to reconvene the open hearing to present the Board’s decision concerning Mr. Sam Walker’s pension disability claim. See transcripts.
b. The Board voted by roll call to approved a non-duty disability pension to
Mr. Sam Walker. See transcripts.
VII. ADJOURNMENT Mr. Farina made a motion to adjourn. Mr. Sokolnik seconded the motion.
The Board Voted by roll call and all voted AYE and the meeting was adjourned at 4:42PM.

Freedom of Information Act and Open Meetings Act
Designation of Freedom of Information Officers
Each public body is required to designate an officer or employee to be responsible for ensuring compliance with the OMA and FOIA. Within 30 days of being so designated, that individual must complete an electronic training curriculum developed by the Illinois Attorney General’s Public Access Counselor (“PAC”). The PAC’s on-line training for FOIA can be found at http://foia.ilattorneygeneral.net/default.aspx.

Open Meetings Act
Elected and Appointed Members OMA Electronic Training Effective January 1, 2012, elected or appointed members of a public body subject to OMA must complete the electronic training once during their term of election or appointment as follows:
• Any person who is an elected or appointed member of a public body subject to the Act on January 1, 2012, must complete the electronic training between January 1, 2012, and January 1, 2013.
• Any person who becomes an elected or appointed member of a public body subject to the Act after January 1, 2012, must complete the electronic training no later than the 90th day after taking the oath of office or, if not required to take an oath of office, after otherwise assuming responsibilities as a member of the public body.
Elected or appointed members need not complete the electronic training on an annual basis thereafter unless they are also designated to receive training on compliance with the Open Meetings Act. The Public Access Counselor’s Office’s OMA electronic training is available free of charge at: http://foia.ilattorneygeneral.net/electronic_foia_training.aspx.

New Pension Members: Start DateN/A
New Pensioners: Start DateN/A
Initial Increases: Start DateKlausing, Louis 8/1/2020
Deceased: End Date
Refunds: Date Amount N/A
Other:
Village of WilmetteFire Pension
Membership Changes3rd Quarter 2020

Lou Klausing
Initial Pension Increase
Retirement Date 7/5/2019
Birth Date 7/8/1960
Date Attained Age 55 7/8/2015
Effective date of initial pension increase 8/1/2020
Number of Full Months Retired Upon Attaining Age 55 12
Percentage Increase (1/12 X 3% X each full month retired) 3.00%
Original Base Pension 6,688.00
Initial Increase (percentage increase X base mo. Pension) 200.64
New Monthly Pension Amount 6,888.64

New Pension Members: Start Date
New Pensioners: Start Date
Initial Increases: Start Date
Deceased: End DateC Stoekinger 8/2/2020R Lamantia 8/1/2020
Refunds: Date
Other:
Village of WilmettePolice Pension
Membership Changes3rd Quarter 2020

June 11, 2020
Michael Wessel c/o Lake Villa FPD Firefighters’ Pension Fund Lake Villa, Illinois
RE: Creditable Service – “Reciprocity”
Michael Wessel:
We have received a request to calculate the amount due to combine your creditable service between the Wilmette Firefighters’ Pension Fund and the Lake Villa FPD Firefighters’ Pension Fund under “reciprocity” (40 ILCS 5/4-109.3).
The statutory cost to a Firefighter to combine creditable service for reciprocity includes (1) repaying a contribution refund, with interest, if a refund was received from a prior pension fund, and (2) paying an additional 1% contribution to each pension fund whose service is being combined. Please keep in mind that all reciprocity balances must be paid in full to all pension funds before the firefighter has separated from service with the final pension fund.
WILMETTE FIREFIGHTERS’ PENSION FUND
Records indicate that your length of service with the Wilmette Firefighters’ Pension Fund was 9 years, 4 months, 4 days (September 27, 2010 through January 30, 2020) and that you did not receive a refund of your employee contributions.
Per statutes, you owe the Wilmette Firefighters’ Pension Fund a contribution equal to 1% of your monthly salary for each month of service with the fund, plus 6% interest compounded annually from your first day of employment with the fund or the first day of the fiscal year of that fund that immediately precedes your first day of employment with the fund, whichever is earlier, to the repayment date.
Below please find a table reflecting the amounts due to the Wilmette Firefighters’ Pension Fund using various upcoming repayment dates.
Payments can be made via various methods, including personal check and/or a direct roll-over from another Qualified Plan, such as a deferred compensation plan. All remittances for amounts due to the Wilmette Firefighters’ Pension Fund should be made payable to the WILMETTE FIREFIGHTERS’ PENSION FUND and mailed to 1200 Wilmette Avenue / Wilmette, Illinois 60091.
1% Interest06/30/20 $7,986.51 $2,960.63 $10,947.1407/31/20 $7,986.51 $3,013.91 $11,000.4208/31/20 $7,986.51 $3,067.46 $11,053.97
Payment Date Additional Contribution Total Amount Due

LAKE VILLA FPD FIREFIGHTERS’ PENSION FUND
The additional 1% contribution is also due to your current fund. For the time period between your date of hire with your current fund and your date of declaration, interest is assessed on the 1% contribution due (the Lake Villa FPD Firefighters’ Pension Fund will provide this calculation for you). The additional 1% contribution from your date of declaration through to your date of retirement is then to be deducted directly from your paycheck, making your total current deduction 10.455%. You will need to coordinate this deduction with the payroll department for the Lake Villa Fire Protection District.
Please keep in mind that all reciprocity balances must be paid in full to all pension funds before you have separated from service with your final pension fund. Please do not hesitate to contact me if you have any questions.
Cordially,
Anie M. Wascher Lauterbach & Amen, LLP
Encl.
CC: Wilmette Firefighters’ Pension Fund Lake Villa FPD Firefighters’ Pension Fund


3rd Quarter - 2020
Payee Amount Description
SKBA Capital Mgmt. 3,555.92 Investment Management Fee - Fixed Income A/C - 3rd QuarterWeaver Barksdale 2,833.94 Investment Management Fee - Fixed Income A/C - 3rd QuarterLauterbach & Amen 350.00 Benefit Calculation
K. Krueger 1,618.75 IDOI filing preperation
Ottosen, Dinolfo, Hasenbalb & Castaldo, 299.00 Disability ClaimOttosen, Britz, Kelly, Cooper & Gilbert 690.00 General Services
Total 9,347.61
Village of Wilmette Firemen's Pension FundDisbursements other than Pension Benefits

3rd Quarter - 2020
Payee Amount Description
SKBA Capital Mgmt. 3,736.60 Investment Management Fee - Fixed Income - 3rd QuarterWeaver Barksdale 2,924.45 Investment Management Fee - Fixed Income - 3rd Quarter
K. Krueger 1,618.75 Professional Accounting Services
Total 8,279.80
Village of Wilmette Police Pension FundDisbursements other than Pension Benefits

2020 North Shore Community Bank Activity Report
Firefighters' PolicePension Fund Pension Fund
12/31/19 Balances 2,362,642.25 1,915,025.59
Employee Contributions 37,487.84 40,475.29 Property Tax Collections 1,288.65 1,058.18 Pension Payroll (353,867.17) (305,445.38) Investment Transfer - - Expense Reimb. To General Fund (8,685.10) (11,212.90) Bank Charges - - Interest Credit 3,495.88 2,779.64
1/31 Balances 2,042,362.35 1,642,680.42
Employee Contributions 36,834.43 40,470.67 Property Tax Collections 369,902.23 299,971.97 Pension Payroll (353,867.17) (305,648.27) Investment Transfer - - Other - Record Copy Services / Fire Copy - Expense Reimb. To General Fund (1,506.71) (3,897.55) Bank Charges - - Interest Credit 2,909.13 2,270.52
2/28 Balances 2,096,634.26 1,675,847.76
Employee Contributions 36,851.65 40,546.81 Property Tax Collections 1,078,765.82 874,699.66 Pension Payroll (353,867.17) (305,648.27) Expense Reimb. To General Fund - (918.15) Bank Charges - - Interest Credit 3,158.32 2,458.32
3/31 Balances 2,861,542.88 2,286,986.13
Employee Contributions 36,860.25 40,646.76 Property Tax Collections 39,050.15 31,676.39 Pension Payroll (353,867.17) (305,648.27) Expense Reimb. To General Fund (621.00) (359.25) Bank Charges - - Interest Credit 2,508.11 1,904.81
4/30 Balances 2,585,473.22 2,055,206.57
Employee Contributions 36,882.78 40,726.26 Property Tax Collections 13,680.15 11,101.45 Pension Payroll (353,867.17) (305,648.27) Transfer to Morgan Stanley - Expense Reimb. To General Fund (23,421.31) (23,661.99) Bank Charges - - Interest Credit 1,618.61 1,207.73
5/31 Balances 2,260,366.28 1,778,931.75
Employee Contributions 36,882.78 40,675.85 Property Tax Collections - - Pension Payroll (353,867.17) (304,875.08) Expense Reimb. To General Fund - - Bank Charges - - Interest Credit 1,012.58 714.37
6/30 Balances 1,944,394.47 1,515,446.89
Employee Contributions 37,389.52 40,802.36 Property Tax Collections 452,156.01 398,931.31 Pension Payroll (353,867.17) (306,079.64) Expense Reimb. To General Fund (1,687.75) (1,618.75) Bank Charges (10.00) - Transfer from Vanguard - S&P Inst Index 500,000.00 500,000.00 Interest Credit 486.01 344.50
7/31 Balances 2,578,861.09 2,147,826.67
Employee Contributions 37,536.59 40,840.08 Property Tax Collections 643,075.83 532,055.31 Additional Village Contribution - Reserves 76,000.00 115,000.00 Pension Payroll (354,067.81) (290,597.04) Expense Reimb. To General Fund (603.00) - Bank Charges (25.00) - Transfer to Weaver - fixed income (500,000.00) (500,000.00) Interest Credit 457.90 283.49
8/31 Balances 2,481,235.60 2,045,408.51
Employee Contributions 37,618.53 40,851.01 Property Tax Collections 52,964.88 43,955.02 Pension Payroll (354,067.81) (290,182.94) Expense Reimb. To General Fund - - Bank Charges - - Interest Credit 361.29 214.57
9/30 Balances 2,218,112.49 1,840,246.17

Cash Flow Projections - 2020For discussion purposes to determine draws from investment earinings
Firefighters Pension Fund 2020 2020 2020 2020 2020 2020 2020 2020 2020 2020 2020 2020 2021Est Est Est Est.
January February March April May June July August September October November December JanuaryInformation for Oct 2020 MeetingBeg. Bal. 2,362,642.25 2,042,362.35 2,096,634.26 2,861,542.88 2,585,473.22 2,260,366.28 1,944,394.47 2,578,861.09 2,481,235.60 2,218,112.49 2,067,512.10 1,708,795.44 1,350,078.77
Employee Contribution 37,488 36,834 36,852 36,860 36,883 36,883 37,390 37,537 37,619 38,700 38,700 38,700 38,700 Employer Contribution - Reserve 76,000
Property Tax Collections 1,289 369,902 1,078,766 39,050 13,680 - 452,156 643,076 52,965 208,116 - Earnings / Investment transfer 3,496 2,909 3,158 2,508 1,619 1,013 486 458 361 - - - -
Regular Pension Payroll (353,867) (353,867) (353,867) (353,867) (353,867) (353,867) (353,867) (354,068) (354,068) (383,333) (383,333) (383,333) (363,600) Other Expenses (8,685) (1,507) - (621) (23,421) - (1,698) (628) - (14,083) (14,083) (14,083) (20,000) Transfer In/Out 500,000 (500,000)
Ending Bal. 2,042,362.35 2,096,634.26 2,861,542.88 2,585,473.22 2,260,366.28 1,944,394.47 2,578,861.09 2,481,235.60 2,218,112.49 2,067,512.10 1,708,795.44 1,350,078.77 1,005,178.77
Police Pension Fund 2020 2020 2020 2020 2020 2020 2020 2020 2020 2020 2020 2020 2021Est Est Est Est.
January February March April May June July August September October November December JanuaryInformation for Oct 2020 MeetingBeg. Bal. 1,915,025.59 1,642,680.42 1,675,847.76 2,286,986.13 2,055,206.57 1,778,931.75 1,515,446.89 2,147,826.67 2,045,408.51 1,840,246.17 1,711,046.88 1,398,296.88 1,085,546.88
Employee Contribution 40,475 40,471 40,547 40,647 40,726 40,676 40,802 40,840 40,851 40,833 40,833 40,833 40,833 Employer Contribution - Reserve 115,000
Property Tax Collections 1,058 299,972 874,700 31,676 11,101 - 398,931 532,055 43,955 183,551 Earings / Investment transfer 2,780 2,271 2,458 1,905 1,208 714 345 283 215 - - - -
Regular Pension Payroll (305,445) (305,648) (305,648) (305,648) (305,648) (304,875) (306,080) (290,597) (290,183) (339,500) (339,500) (339,500) (318,300) Other Expenses (11,213) (3,898) (918) (359) (23,662) - (1,619) - - (14,083) (14,083) (14,083) (26,000) Transfer In/Out 500,000 (500,000)
Ending Bal. 1,642,680.42 1,675,847.76 2,286,986.13 2,055,206.57 1,778,931.75 1,515,446.89 2,147,826.67 2,045,408.51 1,840,246.17 1,711,046.88 1,398,296.88 1,085,546.88 782,080.21


INVESTMENT STRATEGY
During the past month, several key risks have surfaced, producing thefirst meaningful correction in this new bull market. The S&P 500Index dropped over 10% from its recent highs, led by a 14% decline inthe tech-heavy Nasdaq Composite Index. In our view, there are fourreasons why this correction is happening.
First, fiscal stimulus is fading and, with Congress embroiled in election-year politicsand a tussle over when to fill the Supreme Court vacancy, the odds of the CARES2.0 legislation passing before the election have dropped considerably. Second isCOVID-19, with a looming potential second wave and risk of further lockdowns.Third, real long-term interest rates appear to have bottomed as the Federal Reserveformally told us asset purchases won’t increase from here. Finally, we have theelection itself and the uncertainty surrounding both the process and the outcome.
The good news is that investors have started to discount these very visible concernsvia lower prices. However, with uncertainty on these events remaining high for thenext one to two months, volatility will likely remain high, too. Longer-term supportfor equity markets—still 5% to 10% lower than current prices—may be tested.
Looking beyond the near term, three of the aforementioned risks are likely to beresolved positively by the end of the year or shortly thereafter. More specifically,additional fiscal stimulus is likely as both parties want to spend more even if theycan’t come to terms before the election process is completed. More marketpressure could assist in accelerating that timeline. Meanwhile, progress on a COVID-19 vaccine and natural herd immunity via a second wave should become clearer and,eventually, we will have a conclusion to the election. The one risk we think willremain with us is that long-term interest rates are likely to rise further from here.That suggests valuations remain vulnerable for the most expensive growth stocksthat have done so well in recent years.
The bottom line is that the recent correction was inevitable, as all bull marketsneed to consolidate. Trying to trade these corrections is difficult and the bestapproach is to ride it out given how early we are in this new cycle. With therecovery likely to continue in 2021, those stocks most levered to the economiccycle should do best. They include consumer cyclicals and services, materials,industrials and financials. We also like high-quality growth stocks once they fullyadjust to the rise in long-term interest rates we expect. ■
A Bull Market Consolidation Michael WilsonChief Investment OfficerChief US Equity StrategistMorgan Stanley & Co. LLC
TABLE OF CONTENTS
2 The Fed's New Framework: This Time IsDifferentAverage inflation targeting could keep fedfunds at zero at least through 2023.
4 The 2020 Election: Learning From thePast, Preparing for the FutureDemocratic presidents have been betterfor equities, Republicans for bonds.
5 Going AbroadProspects are improved for non-USequities to outperform US stocks.
7 Despite COVID-19, China's Super-CityInitiative Remains on Track"Urbanization 2.0" includes digitalinfrastructure and high-speed rail.
7 Energy & Climate Change—a Story in 23ChartsHere are key facts and figures to helpunderstand this important issue.
8 Short TakesWe look at booming IPOs, activelymanaged ETFs and a large "savings float."
8 Even With the Recent Sell-Off, Muni BondValuations Remain SolidThe pandemic has challenged state andlocal governments, but high-qualitymunicipal bonds are still attractive.
9 Tax Swap Opportunities Abound in CEFsand ETFsLosses in your portfolio may be able tocreate some tax savings.
10 Maximizing Returns With Tax-AwareStrategiesDavid Gordon of Eaton Vance explains thethree tenets of tax-aware investing.
Global Investment Committee | October 2020
On the Markets
Morgan Stanley Wealth Management is the trade name of Morgan Stanley Smith Barney LLC, a registered broker-dealer in the United States.This material has been prepared for informational purposes only and is not an offer to buy or sell or a solicitation of any offer to buy or sell anysecurity or other financial instrument or to participate in any trading strategy.Past performance is not necessarily a guide to future performance.

ECONOMICS
The Fed's New Framework: This Time Is DifferentEllen Zentner, Chief US Economist , Morgan Stanley & Co.
On Aug. 27, Federal Reserve Chair Jerome Powell and theFederal Open Market Committee made history, rolling out anew inflation-targeting framework. I believe the central bankis now more likely to achieve its desired inflation target in thecurrent cycle. If it does, this new framework may well bePowell’s legacy.
The change in the framework was broadly in line withexpectations. The chair outlined a flexible average inflation-targeting (AIT) framework that avoids setting a formulaictime horizon over which the Fed seeks to maintain averageinflation at 2% (see chart). Instead, the Fed seeks to targetinflation overshoots in recoveries following inflationshortfalls during downturns. In our view, this means the fedfunds rates will be zero-bound until the first half of 2024.
Policymakers Look for Inflation to Be Better Centered on the 2% Goal
Source: Bureau of Economic Analysis, Morgan Stanley Research as of Sept. 11,2020
ECONOMIC AND POLICY OUTCOMES. The implications forthe medium-term outlook for economic and policy outcomesare important. The Fed has now solidified a more dovish pathcompared with previous recoveries. This new outcome-basedapproach entails seeing inflation appear first before raisingrates, rather than simply forecasting it to rise.
Assessing how this policy would have been implemented inthe last cycle based on ex-post economic outcomes haspitfalls because a different policy framework would haveaffected not only monetary policy expectations but alsoinflation expectations dynamics. What we can say is that withthis policy framework in place and with inflation andunemployment exactly where they stood in December 2015—5.0% unemployment rate and 1.5% core inflation based onthe Personal Consumption Expenditure (PCE) Index—the Fedwould not have raised interest rates at that time. It mayinstead have waited to begin removing accommodation untilconditions looked more like 2018, with core inflationsustained around 2% and unemployment low.
MONETARY POLICY DYNAMICS. It’s not just policy outcomesthat are likely to differ. A change in monetarypolicy dynamics over time is likely to influence inflationexpectations that are relevant for setting prices and wages.That, in combination with other factors that make it morelikely for central bank inflation targets to be reached duringthis cycle, would make it more likely the Fed can actuallyachieve average 2% inflation outcomes over time (seesidebar). Accounting for such higher inflation outcomestogether with a mark-to-market of our longer-term modelsimulations, we think the labor market and inflationconditions needed for the Fed to consider raising rates couldbe in place in the first half of 2024. In our view, policymakerswill not be compelled to raise rates at the first signs of
Fed Chair Jerome Powell Explains Why Inflation Needs to Be HigherIn a Sept. 4 interview with Steve Inskeep, host of NPR’s “Morning Edition,” Fed Chair Jerome Powell explained why the Fedwants inflation to be higher:We all know that high inflation can be a problem—and I'm old enough to remember when it was a serious problem in the1970s and [former Federal Reserve] Chairman [Paul] Volcker at the Fed and his colleagues managed to get it under control.But persistently low inflation can be a problem, too—and this is less obvious and intuitive, and the reason is really this:When inflation is very, very low, it means lower interest rates. For example, in every interest rate is built, whether we knowit or not, an expectation of what inflation will be. And if people expect inflation to be very low, then interest rates will keepgoing down. Again, we've seen this around the world: lower and lower interest rates, lower and lower inflation.When interest rates get very low, the Fed will have less room to cut interest rates to support the economy. That means thatunemployment will be higher, more of the time. It means less attractive economic outcomes, and those burdens tend to fallmost on those who are least able to bear them. So we really want some inflation. We want inflation to be around 2%—andthat's sort of the global standard these days. We don't want inflation to slide down closer to zero, which frankly ishappening in many places in the world. And it's not a good feature of an economy when that happens.Source: NPR interview as of Sept. 4, 2020
ON THE MARKETS
Please refer to important information, disclosures and qualifications at the end of this material. Morgan Stanley Wealth Management 2

success on inflation in order to demonstrate their fullcommitment to the new strategy. What's more, since thelookback period for 2% average inflation is undefined,policymakers could argue for continued accommodation givenyears of below-target inflation.
LIFTING OFF. Adopting a risk management approach,policymakers are likely to recognize the asymmetric risks oflifting off too soon with policy already at the zero lowerbound. We expect the Fed will want to end asset purchasesaround a year before the expected timing of the first ratehike, suggesting an end to asset purchases in early 2023—though tapering is likely to come sooner, at some point inmid-2022. This would mean Fed communication around
tapering as early as late 2021. The first hike could comesooner if the V-shaped economic recovery continues to runahead of expectations.
Do the new framework and a protracted stretch of low ratesimply more froth in asset markets? We’d highlight thereciprocity between the Fed and financial conditions that areunderpinned by market expectations, and current marketpricing reflects an expectation of no rate hikes through 2023.Chair Powell has also noted that “the connection betweenlow interest rates and financial instability generally is not astight as many people would think.” Still, emerging signs offinancial instability would pose a challenge for the Fed,particularly if they require quick action. ■
ON THE MARKETS
Please refer to important information, disclosures and qualifications at the end of this material. Morgan Stanley Wealth Management 3

POLITICS
The 2020 Election: Learning Fromthe Past, Preparing for the FutureJodie M. Gunzberg, Institutional Investment Strategist, Morgan StanleyWealth ManagementMonica Guerra, Investment Strategist, Morgan Stanley Wealth Management
The 2020 presidential election is one month away, and manyinvestors are questioning how the election may impact theirportfolios. History suggests that investor fears related toelection outcomes may often be misplaced. What’s more,conventional wisdom frequently does not align with marketresults. Importantly, market performance is more closelycorrelated with the business cycle than political party control.
In our two-part report, US Policy Pulse: A History of GeneralElection Performance, Part 1 and Part 2, we analyzed marketperformance from 1928 through Aug. 31, 2020. We examinedboth election- and nonelection- year performance, as well ashistorical market performance by political party and individualpresidential term, and patterns do emerge.
MACRO CONSIDERATIONS. To start with, GDP growthtended to be stronger during presidential election years thanin other years and, when assessing the average annual GDPgrowth of all years of a presidential term by political partysince 1928, we found that GDP growth under Democraticpresidents outperformed Republicans by 2.6%. We also foundthat, regardless of political party, the US dollar weakenedsignificantly in the six months prior to the inauguration andremained flat for the subsequent six months. Notably,performance tended to improve in the latter part of apresident’s first year in office, increasing 4%. Watch for thedollar to continue to weaken.
EQUITY PERFORMANCE. We also found that Democraticadministrations had higher S&P 500 average annual returnsfor all years in office compared with GOP administrations,outperforming by 6%. Furthermore, US equities analyzed bysize, style and sector reported their strongest results onaverage under the Democrats, with the S&P 500 Pure
Growth Total Return Index up 134.1%, the S&P MidCap 400Pure Growth Total Return Index up 120.6% and the S&P 500Information Technology Index up 138.4%.
However, the far-reaching strength of equities underDemocratic presidents does not tell the whole story. It's alsoimportant to consider who controls the House ofRepresentatives and the Senate. We found that Democraticcontrol of the executive and legislative branches was morepositive for markets in the first two years in office versusGOP counterparts. However, when the House and Senatewere controlled by different parties, results were mixed.Value and growth stocks reported stronger average returnswithin the first year of a Republican president and dividedCongress, at 24% and 29%, respectively. Under a Democraticpresident and a divided Congress, small-cap and large-capstock returns were stronger, 31% and 25%, respectively.
OTHER ASSET CLASSES. In an analysis of 108 indexescovering multiple asset classes, on average, 77% performedbest under Democratic presidencies, while 23% did betterwith Republicans. Although performance on a whole wasweaker under Republican presidents, when we found thatother than US equities, returns were mixed when comparingthe average term performance by party and the greatestreturn by president. Notably, these two components do notalways align. For example, the Nikkei 225 Index reported itsbest average term performance by party under Democraticadministrations (see table). Even so, its best single-termperformance was under a Republican president, gaining160.5% during Ronald Reagan’s second term.
Homogenous results were also uncovered. The BloombergBarclays US Aggregate Index performed better underRepublican presidents. Also doing better under the GOP werethe Bloomberg Commodity Total Return Index and China's CSI300 Index. When reviewing performance by individualpresidential term, we found these assets also posted theirstrongest returns under Republicans. ■
Presidential and Party Performance Is Mixed for Major Asset Classes
Note: Red indicates Republican presidency and blue indicates Democratic presidency. Source: Morgan Stanley Wealth Management as of Aug. 31, 2020
ON THE MARKETS
Please refer to important information, disclosures and qualifications at the end of this material. Morgan Stanley Wealth Management 4

EQUITIES
Going AbroadLisa Shalett, Chief Investment Officer and Head of Wealth ManagementInvestment Resources, Morgan Stanley Wealth Management
As has been the case for much of the past four years, non-USequities have been disappointing in 2020. Even after theSeptember sell-off, stocks in Europe, Japan and the emergingmarkets were trailing the S&P 500 Index's 2.8% total return.In US dollars, stocks in Europe were down 12.9% andemerging markets down 3.9%, while Japan was barelypositive at 0.2%. Even though US management of the COVID-19 pandemic has been poor as measured by deaths permillion, policymakers’ outsized policy response has supportedrelative outperformance. As leadership within US equitiesmoves to cyclicals, and small-cap and mid-cap stocks, we alsoexpect a rotation toward non-US stocks.
We see US relative outperformance fading based on growingrelative risks. The recent mini-meltdown in megacap techstocks confirmed that these stocks were at valuationextremes, crowded concentration and potentially peakdemand. As the global recovery gains steam, the perceiveddefensive characteristics of many of those stocks may paleagainst more cyclical companies, which have significantoperating leverage from improving volumes and increasedeconomic activity. Equally concerning are rising risksassociated with the potential fiscal cliff and a material pausein the V-shaped recovery as unemployment benefits roll offdue to the apparent failure/delay of the CARES 2.0legislation. Already, labor market momentum appears to beslowing and consumer confidence has yet to rebound. Finally,US markets are prone to churn around the contentiouspresidential election, not only because of the usual policyuncertainty but because the chances of delayed and/orcontested results are increasing. A final headwind is theapparent inflection in the US dollar after a nearly seven-yearbull market; the greenback peaked in February and is downroughly 7% for the year to date.
CHINA’S RECOVERY. On the other hand, non-US marketsexhibit notable advantages. To start with, the economicrecovery in China leads the West by as much as a year (seechart). For the year to date, the MSCI China Index is the best-performing regional market, benefitting from a solid pickup inglobal trade and a robust cycle of initial public offerings byemerging technology companies. Although trade tensionswith the US cast a shadow, Morgan Stanley & Co.’s Chinastrategists note that the COVID-19 recession has had apositive impact on the domestic economy: Nearly $300billion that would have otherwise been spent by Chinesetourists and students abroad is now being recycled at home.Unlike many Western countries, whose coronavirus-relatedstimulus programs dwarf what was spent in 2009, that is notso for China, leaving policymakers with ample capacity tosustain their new business cycle—one that will likely be aided
by a stronger renminbi. Although a strengthening currencycan be a headwind for exports, we view it as absolutelycritical to the country’s goal of making the renminbi aninternational currency. Our analysts estimate that China’sglobal sovereign bond issuance priced in renminbi will triplein the next three to five years while the currency's share ofcentral bank foreign exchange reserves will double to 4%.
China' Economic Data Is on the Upswing
Source: Bloomberg as of Sept. 18, 2020
For the rest of emerging markets, most of which are linked toChina, the weaker US dollar/stronger renminbi is a Goldilocksscenario; it should aid capital flows and debt repaymentswhile supporting trade competitiveness. Interestingly, thetypically strong positive correlation between the emergingmarkets and commodities has yet to be fully priced, with theemerging markets lagging the big gains in industrial andprecious metals for the year to date. With the FederalReserve planning to keep the fed funds rate at zero through2023 while driving inflation higher, the emerging marketsshould be the world’s biggest beneficiary.
CONSIDER EUROPE AND JAPAN. The stories in Europe andJapan are equally compelling. The latest PMI data in Europeand the ZEW Euro Zone Expectation of Economic GrowthIndex, as well as the more procyclical attributes of their stockmarket indexes, should allow better relative operatingleverage to the 2021 growth rebound (see chart).
European Growth Expectations Highest Since 2004
Source: Bloomberg as of Sept. 17, 2020
ON THE MARKETS
Please refer to important information, disclosures and qualifications at the end of this material. Morgan Stanley Wealth Management 5
Furthermore, both regions boast more reasonable valuationswith forward price/earnings multiples of 16 and 15,respectively. Specifically, in the case of Europe, we are excitedat the prospects for recent moves toward fiscal integrationwith the EU’s recovery fund. Not only will the fund befinanced in euro-denominated EU sovereign bonds but itsloans and grants will be distributed based on need and noteconomic heft—a breakthrough that should finally channelaid to the southern periphery. Equally compelling is the vowthat nearly one-third of proceeds will be directed toward job-creating, green-energy projects that should improveproductivity. Such a shift represents a material breakthroughthat MS & Co. strategists believe will lead to higher across-the-board valuations for European equities.
ONGOING TRANSFORMATION. In Japan, our investmentnarrative is premised on both ongoing economictransformation and an important break we see in thedollar/yen correlation. For most of the past decade andbusiness cycle, there was a strong positive correlationbetween the two because both currencies were seen as safehavens in risk-off markets. In the next cycle, we see the yencontinuing to weaken even against a weaker US dollar. At theheart of that dynamic is Japan’s unique positioning in amultipolar world; it is uniquely positioned to optimize traderelationships with both China and the US, and incrementalyen weakness is an outgrowth of relative strength in therenminbi. Beyond the more constructive currency backdrop,MS & Co. analysts are excited about the momentum Japan hascoming out of the COVID-19 crisis and the transition in the
government. Japan went into the crisis on the back of nearly adecade of success driving improvements in return on equitythat should now be recognized by global investors astechnology investing shifts to Japan’s expertise in artificialintelligence, robotics, the internet of things, virtual reality,natural language processing and voice recognition. Already,MS & Co. economists note a double-digit gain in capitalinvestment this year. That should fuel a productivity pickup inan economy that has the lowest level of unemployment andleast COVID-19 mortality of any developed country.
PORTFOLIO ADJUSTMENT. All told, it appears that USequities’ outperformance relative to non-US stocks over thepast decade was idiosyncratic—not permanently structural assome assert—and appears poised to end with the COVID-19recession. US stock indexes now seem fragile under theweight of excessive valuations, crowding and concentration.Meanwhile, the dollar is weakening, and the Fed is singularlyfocused on reflating the economy, unfettered by historicalconstraints of inflation and employment. This suggestsprocyclical factors could ultimately dominate, and they’remore robustly expressed through non-US stocks currently.Watch the weakening of the dollar and the strengthening ofthe MSCI All Country World Index ex US for signs theregional stock rotation is gaining steam. Consider rebalancingglobal portfolios away from the US. For US-biased portfolios,enhance both risk management and diversification. ■
ON THE MARKETS
Please refer to important information, disclosures and qualifications at the end of this material. Morgan Stanley Wealth Management 6

ECONOMICS/EQUITIES
Despite COVID-19, China's Super-CityInitiative Remains on TrackRobin Xing, Chief China Economist, Morgan Stanley Asia Limited+Laura Wang, Chief Equity Strategist, Morgan Stanley Asia Limited+
In 2017 and 2019, Morgan Stanley's Bluepapers on Chinaforecast that the country would reach high-income status by2025 amid easing structural imbalances, transition to highervalue-added activities and next-phase urbanization, themarriage of mega-city clusters and digitalization. Together,these changes, we argued, would allow China to overcomestructural headwinds of trade barriers and agingdemographics. However, with COVID-19 and heightened US-China tensions and the associated tech barriers, investorshave cast doubts on our thesis.
In our view, COVID-19 and rising external challenges have notderailed China's “Urbanization 2.0.” In fact, Chinese equitieshave so far this year outperformed such major indexes as theS&P 500, TOPIX, MSCI Europe and MSCI Emerging Markets(see chart). Chinese equities that we have determined aredirectly tied to the Urbanization 2.0 theme have done evenbetter (see chart). On a sectoral basis, we see “new economy”sectors such as consumer staples, consumer discretionary,health care, information technology and media/entertainmentbenefiting more from the urbanization trend than such “oldeconomy” as energy, industrials and materials (see chart).
In particular, we see robust progress on Urbanization 2.0through these key enablers:
Digitalization: New Infrastructure Push And Smooth 5G RolloutWe have argued that digitalization is key for China to reap thebenefits of further urbanization by accommodating higherconcentration of population and resources while minimizinginefficiencies typically seen in mega-cities such as trafficcongestion and pollution.
Echoing our view, China has initiated “new infrastructure”projects to mitigate the economic impact of COVID-19 whilefast-tracking the smart-city buildup. These efforts includeconstruction of 5G base stations; the industrial internet ofthings; artificial intelligence (AI) and data centers; ultrahighvoltage; high-speed intercity railways and rail transit; andelectrical vehicle charging stations. Our bottom-up estimatessuggest that the annual average investment in newinfrastructure would reach $180 billion between 2020 and2030, almost twice the average over the past three years, ledby AI/data centers, high-speed intercity and rail transit, and5G base stations.
China Has Among 2020's Best-Performing Markets
*MSCI Asia-Pacific ex Japan, MSCI Emerging Markets and MSCI Hong KongIndexes Source: Bloomberg as of Sept. 22, 2020
In the Past Decade, China's New Economy Stocks Have Outperformed
MSCI China sector-level subindexes are used to construct performance indexfor New Economy (consumer staples, consumer discretionary,media/entertainment, information technology, health care) and Old Economy(materials, energy and industrials). Source: FactSet, Morgan Stanley Research as of Sept. 22, 2020
Stocks Tied to Urbanization 2.0 Initiative HaveOutperformed the Broader Chinese Market
China Urbanization stock beneficiary basket v1.0 was effective from Oct. 10,2019, until Sept. 1, 2020, after which we published v2.0, effective since Sept. 2,2020. The basket can be found in Exhibit 15 of our Sept. 2 report, "Revisit:Progress on Track." Morgan Stanley Research as of Sept. 1, 2020
ON THE MARKETS
Please refer to important information, disclosures and qualifications at the end of this material. Morgan Stanley Wealth Management 7

Reflecting the steady progress of smart-city development, therollout of 5G network, a key pillar, has been on track. In thefirst half of 2020, China built about 250,000 5G basetransceiver stations, and it is on track to meet our telecomteam's expected target of 550,000 to 600,000 this year.Meanwhile, 5G coverage is now in more than 50 cities, andthe country's three main domestic telco operators plan toprovide coverage to urban areas of all cities at prefecturelevel or above (337 in total) by the end of the year. Consumeradoption has been faster than expected, already exceedingoperator targets for the year, while take-up has also beenmore rapid than that of 4G.
Policymakers are also increasingly focused on industrial 5Gapplications. Sectors under the radar include health care,power grid, autos and education. As an example, Qingdao cityannounced in July that it had completed the largest 5G smartgrid in the country, allowing the city to shorten the length ofpower shutdowns and facilitate repair work.
Connectivity: High-Speed Rail to Be Longer and SmarterChina's city clusters rest on the world's longest and fastesthigh-speed rail system. As an example, it takes just 45 to 60minutes to travel from Shanghai to Hangzhou by high-speedrail, much faster than the 80 to 120 minutes required totravel from London to Birmingham, UK, a comparabledistance.
In light of the secular external challenges in the post-COVIDworld, Beijing announced a high-speed railway upgrade plan,which outlines mid- to long-term targets on networkcoverage, technological development and operationalefficiency. The total mileage target under the new blueprint is200,000 kilometers by 2035. It is worth noting thatexecution of the previous railway blueprints has usuallysurprised to the upside. For example, Beijing's 2025 high-speed rail target was 38,000 kilometers in its 2016 blueprint,and the goal will likely be reached by the end of this
year—five years earlier than planned.
Does the blueprint mean another wave of unproductiveinvestments and massive debt buildup? Our answer is no. Inour view, the plan suggests that length is no longer the onlything that matters, with the focus now moving to enhancingconnectivity within major city clusters instead of aggressivebuildouts into less-populated inland regions. Meanwhile, theplan calls for leveraging cutting-edge technology to improvethe consumer experience through improvements such aselectronic ticketing and gates driven by facial recognition.
Reform: Stronger Integration in Key ClustersWe have argued that the productivity gains from deeperurban agglomeration would arise from labor matching, thespillover of knowledge and tech know-how, specialized supplychains, and synergies across different sectors. In turn, givenlingering Hukou restrictions and a locally segregated socialsecurity safety net, structural reforms are needed to enableproductive factors (particularly human capital) to accumulateand concentrate in China's mega-city clusters. In fact,concerted reform initiatives have been rolled out to facilitatefactor mobility and regional integration.
From a top-down perspective, an article by the president ofChina in December 2019 emphasized the importance ofrespecting economic principles and allowing furtherconcentration of industry and population in more advancedregions, with city clusters and hub cities becoming the keygrowth engines. In April 2020, China issued a comprehensiveguideline on deepening factor market reforms (on land, labor,capital, technology and data), which, if successfullyimplemented, would improve China's land and labor mobilityand economy-wide resource allocation. ■
The above was excerpted from the Sept. 2, 2020,report, "Revisit: Progress on Track." For the full report, pleasecontact your Financial Advisor.
ON THE MARKETS
Please refer to important information, disclosures and qualifications at the end of this material. Morgan Stanley Wealth Management 8

SCIENCE
Energy & Climate Change—a Storyin 23 ChartsMartijn Rats, CFA, Equity Analyst and Commodity Strategist, Morgan Stanley& Co. International PLC+
Climate change is often referred to as the defining challengeof our time. How the world meets this challenge hasprofound implications for the global energy system and thecompanies that operate within it.
Although detailed information on energy and climate changeis available freely and in the public domain, it is not alwayseasily accessible. Hence we collected key facts and figures tohelp investors navigate this issue.
This is not a forward-looking note and we express noopinions. Instead, we simply document the facts as they havealready taken place. Among others, this provides answers tothe following questions:
How much energy does the world consume, and how much ofthis comes from fossil fuels?
How much carbon does each fuel emit, and what is theconcentration of carbon dioxide in the atmosphere?
As a result, how much has the global temperature risenalready?
Which countries emit the most, in absolute terms and perhead of population? How has this changed over time, andwhich countries are growing/shrinking emissions the fastest?
What do emissions look like when we adjust them for trade?Does it make a difference?
Which fuels emit the most, and which end-use sector?
What other gases besides carbon dioxide (CO2) contribute tothe greenhouse effect? What has the relationship betweenoil, GDP and population growth been?
Can GDP grow while carbon emissions shrink?
What are scenarios for the future? Where does the globalenergy system need to end up?
To what extent has the energy system already electrified? Iselectricity demand growing, and what does this look like in a“well below 2 degree” world?
How Big Is the Energy System?
In 2019, the world consumed about 100 million barrels of oilproducts, which contained about 193 exajoule (EJ) of energy(exa means 10 followed by 18 zeroes). Adding other sourcessuch as coal, gas and renewables, total primary energydemand amounted to about 584 EJ in 2019, according tothe BP Statistical Review. The International Energy Agencyputs its estimate at 605 EJ.
Given there are 31.5 million seconds in a year, this meant theworld consumed energy at a rate of 19 trillion Joule persecond. Numbers of this order of magnitude are often hard torelate to, but a comparison may provide some context: If theworld's 2019 energy consumption had been spread out overthe lifetime of the universe, it would have been sufficient topower 27 50-watt light bulbs since the Big Bang, 13.8 billionyears ago.
Also noteworthy is that energy consumption has beengrowing consistently. Primary energy demand has increasedby 20% over the past decade, and has only shrunk on twooccasions in the past 55 years: in 1980-1982, after oil pricestripled; and in 2009, a result of the financial crisis andrecession. ■
How Primary Energy Consumption Breaks Down by Fuel
Note: Renewables include energy from wind, geothermal, biomass and waste,stated on an input-equivalent basis. Source: SMIL (2010), BP Statistical Review, Morgan Stanley Research as ofSept. 2, 2020
For the other 22 charts, ask your Financial Advisor for theSept. 2, 2020, Morgan Stanley & Co. report, Energy & ClimateChange—a Story in 23 Charts.
ON THE MARKETS
Please refer to important information, disclosures and qualifications at the end of this material. Morgan Stanley Wealth Management 9

Short Takes
Source: Bloomberg as of Sept. 24, 2020
Source: Bloomberg as of Sept. 28, 2020
Note: We calculate excess savings by taking the cumulative difference inpersonal savings from April to July compared with the 12-month averagepersonal savings level from March 2019 to February 2020. Source: Bureau of Economic Analysis, Morgan Stanley Research as of July 31,2020
Initial Public Offerings Are Having a Banner Year
The market for initial public offerings (IPOs) is hot, with theRenaissance IPO Index outpacing the S&P 500 Index by 65%since the March 23 market low (see chart). The indexrepresents companies that have gone public in the pastthree years, and is largely made up of flashy tech companieswith limited financial histories. We see this recordperformance as a sign of market exuberance that was fueledby the market rally. Flows into new IPOs have poweredrecord-setting returns on their opening days. "Specialpurpose acquisition vehicles," which are an alternative wayto go public, are also booming. Although we recognize thatan early-cycle environment is an appropriate time to tiltportfolios toward risk, it is important to remain disciplined.Gains that are driven by manic buying are equally susceptible to sentiment swings in the opposite direction.—Nick Lentini
More Actively Managed Exchange-Traded Funds Are Coming to Market
Not only have more actively managed exchange-traded funds(ETFs) come to market recently, but the issuer base isbroadening impressively. Looking back to 2015, there were 272new ETFs launched, of which 21 were active, representing 8%of new launches (see chart). So far this year, 98 active ETFshave launched, or 55% of the total. While BlackRock, Vanguardand State Street are the largest ETF providers and combine forroughly 80% of ETF market share, only one of the 101 newactive funds launched in 2020 has come from this group. Theother 100 have been issued by 33 other ETF providers acrossequity, fixed income and alternatives. While active ETFscomprise only 3% of US-listed ETF assets, they continue tomake up an increasing percentage of new funds. We expect thistrend to continue, providing additional options for investors in
the still-expanding investment vehicle.—Michael Suchanick
Savings Float Could Help Keep the US Economy Above Water
Morgan Stanley & Co.’s economists believe the US economyhas remained resilient despite expiring benefits, due largelyto the cushion of savings households have built since theCOVID-19 lockdown. Indeed, we estimate that from Aprilthrough July, the US consumer built up a cumulative $12.5trillion (annualized) in excess savings—that is, above themonthly pre-COVID average (see chart). Of course, much ofthe savings sits with higher-income households that typicallycarry high saving rates. However, unlike most downturns,savings have accrued to lower-income households as well.The willingness of consumers to draw upon these savings inthe coming months is yet to be known, but our economistsbelieve it can provide an important stop-gap to the loss ofgovernment transfers.—Ellen Zentner
ON THE MARKETS
Please refer to important information, disclosures and qualifications at the end of this material. Morgan Stanley Wealth Management 10

FIXED INCOME
Even With the Recent Sell-Off, MuniBond Valuations Remain SolidDaryl Helsing, CFA, Associate, Morgan Stanley Wealth ManagementMatthew Gastall, Investment Strategist, Morgan Stanley WealthManagement
Following March's historic sell-off, the municipal marketstaged an impressive recovery that lasted through much ofthe summer, culminating in record-high valuations/low yieldsfor higher-quality bonds (see chart). However, the positivemomentum stalled in mid-August as Treasury yields movedhigher, driving modest weakness in municipals and the firstmonth of negative total returns since April.
Muni Bonds Made a Strong Recovery
Source: Refinitiv as of Sept. 25, 2020
ABOVE EXPECTATIONS. Even so, the monetary and fiscalresponses, unprecedented in terms of their immediacy, sizeand scope, have supported a faster-than-expected pace ofeconomic recovery and financial performance that has beenabove expectations. According to estimates by Moody’sAnalytics, extraordinary income support through expandedunemployment insurance and economic income impact checksconstituted more than 9% of personal income during thesecond quarter. Strong stock market performance,corresponding to higher realized capital gains taxes andsurging sales taxes derived from e-commerce activity, has alsohelped boost state revenue collections. As a result of thesedevelopments, Moody’s now forecasts a two-year 50-staterevenue decline of 11.2% from fiscal year 2019 to the current2021 fiscal year compared with the prior forecast of 14%,which is comparable to what took place from 2008 to 2010.
The economic rebound occurred during a supportive seasonalbackdrop of heavy redemptions and reduced issuance.Positive fundamental and technical dynamics kept themunicipal market on an upward trajectory through much ofthe summer. Improved market sentiment has fueled thehealthy demand made evident by the fact that municipal
bond funds have recovered nearly all of the assets lost inMarch’s historic outflow.
CLOUDIER OUTLOOK. Now, the outlook is cloudier. MorganStanley & Co.’ s public policy strategists no longer expectanother round of federal municipal aid in 2020. The firm’seconomists have recently flagged the downside risk posed bythe lack of further fiscal support, as it has significantly helpedblunt the economic effects of COVID-19. In order to fillbudget gaps, state and local governments may need toaccelerate public sector layoffs and spending cuts, whichwould slow the recovery. In light of the fundamentals,municipals are vulnerable to near-term volatility as the risk ofnegative headlines and credit rating downgrades has risen.
It is also important to consider the Federal Reserve’s role inthe muni market. Its zero interest rate policy and balancesheet expansion have driven yields lower across fixed incomeasset classes, municipals included. This has buoyed valuationsand provided issuers an opportunity to refinance their debt atlower interest costs. Now limited in their ability to issue tax-exempt advance refunding bonds, issuers have instead usedproceeds from taxable deals to refinance outstanding tax-exempt debt, putting taxable issuance on pace to be thehighest since 2010 when the Build America Bonds programexpired. Furthermore, low yields have driven less traditionalinvestor types such as banks and insurance companies toincrease their holdings as municipals have continued to offervalue on a tax-adjusted basis.
LIQUIDITY HELP. What’s more, the Fed’s Municipal LiquidityFacility serves as a funding backstop through which largeissuers can borrow directly to meet near-term liquidity needs.While utilization has been very low thus far, the Fed hasshown a willingness to modify the terms by expandingeligibility to more borrowers and lowering the financing costs.Should financial conditions deteriorate, there appears to beample room for further modification, and perhaps evenadditional forms of support.
All told, we believe investors should remain comfortableholding highly rated state and local government bonds andthose of essential-service providers, as they are likely well-positioned to navigate the COVID-19 recession. Creditselection is paramount as the pandemic’s impact has variedacross the market, and an issuer’s prior credit strength willlikely be an important determinant of its performance goingforward. We are cautious on sectors that have been hardesthit by the pandemic, borrowers that may be deemed“unessential” and lower-rated credits. They may face a greaterlikelihood of negative rating actions, reduced public supportand fewer resources. Thus, we stress that investors stay closeto their Financial Advisors, review portfolios and consideradding a modest amount of high-quality exposure.Importantly, remain prepared for opportunity if pandemic-related volatility affects highly rated issuers. ■
ON THE MARKETS
Please refer to important information, disclosures and qualifications at the end of this material. Morgan Stanley Wealth Management 11

INVESTING
Tax Swap Opportunities Abound in CEFs and ETFsJohn Duggan, Investment Strategist, Morgan Stanley Wealth ManagementGray Perkins, Associate, Morgan Stanley Wealth ManagementMichael Suchanick, Investment Strategist, Morgan Stanley WealthManagement
With the market's strong rebound, investors might assumethat opportunities for “tax swaps” with closed-end funds(CEFs) and exchange-traded funds (ETFs) have disappeared.That's not the case. The rebound was narrow, leaving manysectors—and the ETFs and CEFs that track them—in the red.Widening of CEF market price discounts to net asset valuehas contributed as well (see charts).
CEFs With Losses Offer Chances for Tax Savings
Source: Bloomberg as of Sept. 28, 2020
Energy-Related ETFs Have the Year's Worst Returns
Source: Morningstar as of Sept. 28, 2020
Tax swaps involve the sale of one security/fund to capture aloss alongside the simultaneous purchase of anothersecurity/fund with generally similar objectives. The losses canoffset gains realized in 2020 or going forward. In the case ofCEFs, by buying the replacement at a discount to NAV,investors may profit both from portfolio appreciation anddiscount narrowing. Importantly, tax swaps may not violate
“wash sale” rules. That means if an investor sells a security ata loss and, within 30 days before or after the sale, buys a“substantially identical” stock or security, the write-off can benegated.
CLOSED-END BOND FUNDS. The taxable bond CEF universe isdominated by credit portfolios, and, as such, many large fundcategories have come back strongly, thus reducingopportunities. However, senior loan CEFs—depressed byinvestor sentiment and weaker earnings related to lowerinterest rates—show multiple instances of price declinesversus prior years. Funds that concentrate on areas notdirectly supported by government or central bank buying,such as nonagency mortgage-backed securities andcommercial mortgage-backed securities, likewise have lagged,thereby offering a chance to capture losses.
In a twist on tax swap strategies, we encourage investors inhigh yield muni CEFs, some of which are down so far thisyear, to consider swapping into higher-quality portfolios,many of which continue to trade at wide discounts. Notably,several higher-quality muni CEFs have experienced dividendincreases driven by lower borrowing costs on leverage,making for compelling distribution rates and less of a yieldsacrifice than would otherwise be the case. A partial moveinto higher quality would also be consistent with the views ofMorgan Stanley & Co.'s municipal bond strategists.
EQUITY CLOSED-END FUNDS. Since the bottoming of globalequity markets on March 23, the average equity CEF hasdelivered a price total return of 54.0%. That said, the steepfirst quarter decline left its mark, whereby year-to-date pricetotal returns for the group remain in the red at -17.3%. As aresult, equity CEF holders are left with various tax-lossharvesting opportunities. Notably, funds concentrating onenergy, particularly master limited partnerships or those withpartial energy exposure, may be ripe for harvesting.
Looking ahead, investors may find opportunities to swap intodividend-oriented strategies, which currently are tradingbelow historical valuations, along with several differentiatedsector and style funds. For those more cautious on equitymarkets through the end of 2020, option income CEFs, mostof which are not leveraged, may be a relatively desirablechoice; they are also trading at attractive valuations.
EXCHANGE-TRADED FUNDS. Like CEFs, tax swaps on ETFsneed to be structured to comply with wash sale rules. Thisposes challenges, as swap opportunities within the samemarket segments may not satisfy those requirements. Givenits broad geographical and sector scope, however, theexpanding ETF universe offers numerous opportunities tobuild diversified portfolios while navigating year-end taxplans. New issuance trends have also boosted the number ofactive ETFs, which may enhance opportunities for investorsholding active strategies to employ ETFs for swaps withoutconverting to passive exposure. ■
ON THE MARKETS
Please refer to important information, disclosures and qualifications at the end of this material. Morgan Stanley Wealth Management 12
Q&A
Maximizing Returns With Tax-Aware StrategiesThe prospect of generally lower-than-average investmentreturns going forward has made long-term planning aroundinvestment goals more difficult. Consider the S&P 500 Index,which has returned an average of more than 8% per yearsince 1928. Over the next two decades, our Global InvestmentCommittee estimates US equities will return an average ofless than 5%. Tax-related investing strategies can helpimprove realized returns without adding substantially moreportfolio risk or reducing flexibility. “Tax planning reallyshould be a year-round endeavor,” explains David Gordon,director of the Eaton Vance Advisor Institute. “You neverknow when opportunities are going to present themselves.”He recently spoke with Morgan Stanley WealthManagement’s Tara Kalwarski about the tax implications ofinvesting, and discussed strategies for maximizing aftertaxgains. The following is an edited version of their conversation.
TARA KALWARSKI (TK): Why is it important for investors tothink about taxes?
DAVID GORDON (DG): Although I'm not a tax advisor, I havespent a few decades in investment management. I believemost people tend to evaluate their investment choices basedon published returns. When you’re looking at a ranking ofmutual funds, the returns that you are seeing—for year todate, one year, three years, etc.—are always presented beforetaxes because asset managers don't know what eachindividual investor’s tax rate is going to be.
For many people, taxes can take a big bite out of investmentreturns. The experience you have is often quite different fromthe experience that you expect, which is why it's reallyimportant for investors to think about what is going to beavailable after taxes, and what is really going to be availableto them to pursue their goals and to grow their wealth.
TK: Is there a “why now?” element to this topic?
DG: I don't have a crystal ball on what will happen after theelection, and certainly taxes are part of both major parties’campaign platforms. As a response to the pandemic, we’veseen that governments at all levels are spending an awful lotof money to try to keep the economy afloat, battle thepandemic and help people who have been affected byunemployment.
With government spending on a tear, the question aroundhow that gets answered through taxes is open-ended. Taxrates could go up significantly across the board. They couldgo up selectively, affecting only certain people. If theeconomy stagnates, taxes could even go down as a way tostimulate the economy. The important takeaway is that
they're almost guaranteed not to stay exactly where they aretoday.
TK: Does the current market environment impact how much—or how little—an investor should pay attention to taximplications in any given year?
DG: An excellent example of how taxes and current marketconditions affect investors is to think about mutual funds.Most mutual funds have to distribute their net realizedcapital gains each year. As a fund sells positions, some ofthose holdings may have increased in value. The result formany investors is if you hold a mutual fund outside of a tax-sheltered account like a 401(k) or IRA, at the end of the yearyou may receive a Form 1099 telling you what your share ofcapital gains is on that mutual fund—and that can happeneven if the value of the mutual fund has gone down duringthe year.
It's a head-scratcher for a lot of investors, but it really speaksto how you have to think about where you locate differentinvestments in your overall investment strategy.
TK: What are some strategies to enhance aftertax returns?
DG: What's interesting about the tax code in comparison withthe investment industry is that Uncle Sam has a progressivetax system, which means the more you make, the higher thetax rate. The investment management industry, meanwhile, isoften organized in the opposite way; the larger your account,the more likely you are to experience a break on your fees orexpenses. So, ultimately, as wealth increases, it’s reallyimportant to think about taxes as an investment “fee” thatyou can reduce. That’s the first "tax tenet" investors shouldthink about.
The second tax tenet is that asset location can be asimportant as asset allocation, and I alluded to this earlierwhen I talked about Form 1099 on mutual funds.
Asset allocation refers to the kinds of investments you make,including whether you have equities or bonds or cash. Howyou're invested is very important because, of course, yourreturn from an asset class that you don't own is zero bydefinition, but owning the right investment in the wrong placecan also be costly. If you own certain investments that offer alot of tax protection such as municipal bond funds in a tax-protected account like an IRA, you haven’t optimized thatprotection. Likewise, if you own a growth-oriented fund thattypically generates a 1099 form, you might want that in a tax-deferred account.
The third tax tenet is that Uncle Sam can be a coach and notjust a referee. Congress encourages certain behavior anddiscourages others, and so the tax code can be viewed as acollection of carrots and sticks. A smart investor knows it’s allabout picking up more of the carrots—that is, the things thatUncle Sam wants you to do—and avoiding getting hit by the
ON THE MARKETS
Please refer to important information, disclosures and qualifications at the end of this material. Morgan Stanley Wealth Management 13

sticks, or the things that Uncle Sam doesn’t want you to do.By doing so, you start to realize that there are a lot ofopportunities to reduce your taxes in fairly simple ways that alot of investors don’t take advantage of, but should.
TK: Let’s dig a bit deeper into these tenets. Why is itimportant for investors to look at taxes as a fee and employstrategies to reduce that fee?
DG: Imagine you’re a married couple filing jointly with$500,000 in income and you live in a state with no incometax. Let’s say you’re still working, but you have to start takingmoney out of your IRA or 401(k). If you take a requiredminimum distribution of 5.0%, it will be taxed at the 35%ordinary income tax rate, which means you will pay 35% of5%, which is 1.75% of the total value of your traditional IRA or401(k). That’s likely more than all of your management andadvisory fees combined.
Another example is if you sell an asset for more than you paidfor it, incurring what is called a capital gain. If you pay $10and sell for $12, you have a $2 capital gain. How that capitalgain is taxed depends not only on your overall income level,but also on how long you’ve held that asset. If you sellsomething that’s held for less than a year, you pay taxes at amuch higher rate than if you held it for a year or longer.
The same thing is true with dividends. A lot of people likereceiving dividends, but there are two different types: There’squalified dividend income, which receives favorable taxtreatment, and there’s nonqualified dividend income, whichdoes not. If you can find the same dividends in a qualifiedform versus a nonqualified form, you will end up keepingmore of those dollars.
TK: Why is asset location important?
DG: It boils down to where you hold your investments. Youwant to own them in the place that’s most tax-optimal forthat type of investment. The key to asset location is figuringout whether the type of investment return that you’re goingto receive needs a high or a low level of tax protection.
If it’s likely to be taxed at a high rate, then it needs a highlevel. Ordinary income and nonqualified dividends ought to berealized in accounts that have a high level of tax protection,like traditional IRA and 401(k). These types of accounts arenot taxed annually, and in the case for Roth IRAs and 401(k)s,they may never be taxed at all.
The flip side is things that are taxed at a low level. Manyforms of muni bond interest income, for example, aren’t taxedat all. These types of holdings need a low level of taxprotection and should go in fully taxable accounts where youcan enjoy the full benefits.
TK: Regarding the third tenet, what can investors learn?
DG: One of the best examples is the idea of tax losses, whichthe government allows investors to use to their advantage.
It’s tough for us to get past the word “loss.” If I say the word“loss” in a sentence, you hear almost nothing that I say afterthat—but a tax loss is when the IRS loses money. It’s not thesame thing as you losing money. Think of tax losses like acoupon.
We understand that if we take a coupon to the store, thestore gets less of our money. Tax losses work the same,because in taxable accounts, you can accumulate your taxlosses and use them to reduce the amount of capital gainsthat you pay taxes on. The great news is that there’s noexpiration date. If you can’t use the losses this year becauseyou don’t have any gains, you can carry them forward to nextyear. However, they do expire at the taxpayer's passing.
TK: Does tax-aware investing have much impact?
DG: Our long-term research shows that successful tax-lossharvesting strategies alone can add 1.5% to 2.0% a year overlong periods, through both up markets and down markets.
In 2018, the S&P 500 was down 4.3%, but over the course ofthe year, if you looked at all of the stocks that were a part ofthat index, one third were up for the year and two thirds weredown. However, close to 90% of the stocks in the index had“drawdowns” or price declines of 10% or more at some pointduring the year. Last year, when the market was up over 30%,only 65 stocks were down for the year. Even so, north of 80%of all stocks in the index had drawdowns at some point of10% or more. Those are real opportunities to harvest taxlosses. ■
David Gordon is not an employee of Morgan Stanley WealthManagement or its affiliates, nor is he a tax advisor. Opinionsexpressed by him are his own and may not necessarily reflectthose of Morgan Stanley Wealth Management or its affiliates.
ON THE MARKETS
Please refer to important information, disclosures and qualifications at the end of this material. Morgan Stanley Wealth Management 14

Global Investment CommitteeTactical Asset AllocationThe Global Investment Committee provides guidance on asset allocation decisions through its various models. The five modelsbelow are recommended for investors with up to $25 million in investable assets. They are based on an increasing scale of risk(expected volatility) and expected return.
Source: Morgan Stanley Wealth Management GIC as of Sept. 30, 2020
ON THE MARKETS
Please refer to important information, disclosures and qualifications at the end of this material. Morgan Stanley Wealth Management 15

The Global Investment Committee provides guidance on asset allocation decisions through its various models. The five modelsbelow are recommended for investors with over $25 million in investable assets. They are based on an increasing scale of risk(expected volatility) and expected return.
Source: Morgan Stanley Wealth Management GIC as of Sept. 30, 2020
ON THE MARKETS
Please refer to important information, disclosures and qualifications at the end of this material. Morgan Stanley Wealth Management 16

Tactical Asset Allocation Reasoning
Global Equities Relative WeightWithin Equities
US Overweight
Global stock markets have entered a bear market on concerns about the negative growth impact ofthe coronavirus. Although we expect US and global recessions in the second quarter of 2020, ourbase case is that recent extraordinary policy actions from both central banks and nationalgovernments will help cushion the economic impact. Markets are already pricing the most likelyscenarios. We recently upgraded our exposure to large-cap growth and small- and mid-cap equities,believing that active stock pickers have a good entry point over the next several months.
International Equities(Developed Markets) Market Weight
We recently reduced exposure to both Europe and Japan believing that, while policy responses weremeaningful, their impact may ultimately be lumpy and diluted by additional headwinds—in the caseof Europe, the lack of fiscal integration, and in Japan, the strength of yen.
Emerging Markets Overweight
China was the first country to enter the COVID-19 crisis and appears poised to be the first out.Resumption of economic activity during the second quarter should jump-start global growth,especially given huge government stimulus programs. Ample liquidity from the Fed and a weakeningdollar should catalyze investor interest. China stands to gain the most from US tariff rollbacks andglobal trade dynamics should improve. Valuations are attractive and local central banks should beable to maintain accommodation and stimulus. For most countries, especially China, the collapse inoil prices is a material tailwind for consumer purchasing power.
Global Fixed Income Relative WeightWithin Fixed Income
US Investment Grade Market Weight
We have recommended shorter-duration* (maturities) since March 2018, given the extremely lowyields and potential capital losses associated with rising interest rates from such low levels, and hadbeen pairing that position with a large exposure to long-term US Treasuries to hedge what weexpected would be a modest correction in stocks. With long-term Treasury yields troughing for thecycle, we recently removed that position and resumed a benchmark exposure to duration. Recentdislocation of investment grade credit spreads and market illiquidity have created opportunities. Fedprograms aimed at backstopping this market give reason to be an active bond selector.
InternationalInvestment Grade
UnderweightNegative interest rates suggest that this is not a preferred asset class for US-dollar clients at thistime. Actively managed funds may provide very patient, risk-tolerant clients with incomeopportunities in select corporate credits.
Inflation-Protection Securities Underweight The “sudden stop” recession has caused a severe pricing of real interest rates, pushing them negative
and near all-time lows. In the near term, upside appears limited.
High Yield Overweight
High yield bonds remain at the epicenter of the dual risks from COVID-19 and the collapse in oilprices from the failure of OPEC negotiations. In our view, some of the most extreme risks have beendiscounted, especially in light of unprecedented monetary and fiscal policy intervention aimed notonly at market liquidity but in bridging cash flow requirements. It’s time to ease in opportunistically,using active managers.
Alternative Investments Relative Weight WithinAlternative Investments
REITs UnderweightReal estate investment trusts (REITs) have performed very well as global growth slowed and interestrates fell. However, REITs remain expensive and are vulnerable to credit risks. We will revisit ourposition as nominal GDP troughs and/or valuations become more attractive.
Commodities Overweight
The “sudden stop” global recession has driven commodities such as oil to multidecade lows. The rushto the "safe haven” US dollar, which is near its multiyear high, has exacerbated these dynamics. Whilewe recognize the complexity of the geopolitical issues that surround oil, we believe that on a six-to-12-month basis the outlook for the global economy and overall demand will improve materially.Thus, we suggest risk-oriented clients establish exposure to the broad diversified asset class throughthe use of active managers. Pure passive exposure is not advised at this time.
Hedged Strategies (HedgeFunds and Managed Futures) Overweight
The bear market associated with COVID-19 has driven volatility to historic extremes and led to widedispersion in price performance and stock-level idiosyncratic risk. These factors tend to create aconstructive environment for hedge fund managers who are good stock-pickers and can use leverageand risk management techniques to amplify returns. We prefer very active and fundamentalstrategies, especially equity long/short.
*For more about the risks to Duration, please see the Risk Considerations section beginning on page 18 of this report. Source: Morgan Stanley Wealth Management GlC as of Sept. 30, 2020
ON THE MARKETS
Please refer to important information, disclosures and qualifications at the end of this material. Morgan Stanley Wealth Management 17

Disclosure SectionThe Global Investment Committee (GIC) is a group of seasoned investment professionals from Morgan Stanley & Co. and Morgan StanleyWealth Management who meet regularly to discuss the global economy and markets. The committee determines the investment outlook thatguides our advice to clients. They continually monitor developing economic and market conditions, review tactical outlooks and recommendasset allocation model weightings, as well as produce a suite of strategy, analysis, commentary, portfolio positioning suggestions and otherreports and broadcasts.
John Duggan, Matthew Gastall, Monica Guerra, Jodie Gunzberg, Daryl Helsing, Nick Lentini, Gray Perkins, Martijn Rats, Laura Wang, Robin Xingand Ellen Zentner are not members of the Global Investment Committee and any implementation strategies suggested have not been reviewedor approved by the Global Investment Committee.
Index Definitions
For index, indicator and survey definitions referenced in this report please visit the following: https://www.morganstanley.com/wealth-investmentsolutions/wmir-definitions
Risk Considerations
Alternative Investments
The sole purpose of this material is to inform, and it in no way is intended to be an offer or solicitation to purchase or sell any security, otherinvestment or service, or to attract any funds or deposits. Investments mentioned may not be appropriate for all clients. Any product discussedherein may be purchased only after a client has carefully reviewed the offering memorandum and executed the subscription documents.Morgan Stanley Wealth Management has not considered the actual or desired investment objectives, goals, strategies, guidelines, or factualcircumstances of any investor in any fund(s). Before making any investment, each investor should carefully consider the risks associated withthe investment, as discussed in the applicable offering memorandum, and make a determination based upon their own particular circumstances,that the investment is consistent with their investment objectives and risk tolerance.
Alternative investments often are speculative and include a high degree of risk. Investors could lose all or a substantial amount of theirinvestment. Alternative investments are appropriate only for eligible, long-term investors who are willing to forgo liquidity and put capital atrisk for an indefinite period of time. They may be highly illiquid and can engage in leverage and other speculative practices that may increasethe volatility and risk of loss. Alternative Investments typically have higher fees than traditional investments. Investors should carefully reviewand consider potential risks before investing.
Certain information contained herein may constitute forward-looking statements. Due to various risks and uncertainties, actual events, resultsor the performance of a fund may differ materially from those reflected or contemplated in such forward-looking statements. Clients shouldcarefully consider the investment objectives, risks, charges, and expenses of a fund before investing.
Alternative investments involve complex tax structures, tax inefficient investing, and delays in distributing important tax information. Individualfunds have specific risks related to their investment programs that will vary from fund to fund. Clients should consult their own tax and legaladvisors as Morgan Stanley Wealth Management does not provide tax or legal advice.
Interests in alternative investment products are offered pursuant to the terms of the applicable offering memorandum, are distributed byMorgan Stanley Smith Barney LLC and certain of its affiliates, and (1) are not FDIC-insured, (2) are not deposits or other obligations of MorganStanley or any of its affiliates, (3) are not guaranteed by Morgan Stanley and its affiliates, and (4) involve investment risks, including possibleloss of principal. Morgan Stanley Smith Barney LLC is a registered broker-dealer, not a bank.
Hypothetical Performance
General: Hypothetical performance should not be considered a guarantee of future performance or a guarantee of achieving overall financialobjectives. Asset allocation and diversification do not assure a profit or protect against loss in declining financial markets.
Hypothetical performance results have inherent limitations. The performance shown here is simulated performance based on benchmarkindices, not investment results from an actual portfolio or actual trading. There can be large differences between hypothetical and actualperformance results achieved by a particular asset allocation.
Despite the limitations of hypothetical performance, these hypothetical performance results may allow clients and Financial Advisors to obtaina sense of the risk / return trade-off of different asset allocation constructs.
Investing in the market entails the risk of market volatility. The value of all types of securities may increase or decrease over varying timeperiods.
This analysis does not purport to recommend or implement an investment strategy. Financial forecasts, rates of return, risk, inflation, and otherassumptions may be used as the basis for illustrations in this analysis. They should not be considered a guarantee of future performance or aguarantee of achieving overall financial objectives. No analysis has the ability to accurately predict the future, eliminate risk or guaranteeinvestment results. As investment returns, inflation, taxes, and other economic conditions vary from the assumptions used in this analysis, youractual results will vary (perhaps significantly) from those presented in this analysis.
The assumed return rates in this analysis are not reflective of any specific investment and do not include any fees or expenses that may beincurred by investing in specific products. The actual returns of a specific investment may be more or less than the returns used in thisanalysis. The return assumptions are based on hypothetical rates of return of securities indices, which serve as proxies for the asset classes.
ON THE MARKETS
Morgan Stanley Wealth Management 18

Moreover, different forecasts may choose different indices as a proxy for the same asset class, thus influencing the return of the asset class.
An investment in a money market fund is not insured or guaranteed by the Federal Deposit Insurance Corporation or any other governmentagency. Although the Fund seeks to preserve the value of your investment at $1.00 per share, it is possible to lose money by investing in thefund.
ETF Investing
An investment in an exchange-traded fund involves risks similar to those of investing in a broadly based portfolio of equity securities traded onan exchange in the relevant securities market, such as market fluctuations caused by such factors as economic and political developments,changes in interest rates and perceived trends in stock and bond prices. Investing in an international ETF also involves certain risks andconsiderations not typically associated with investing in an ETF that invests in the securities of U.S. issues, such as political, currency, economicand market risks. These risks are magnified in countries with emerging markets, since these countries may have relatively unstable governmentsand less established markets and economics. ETFs investing in physical commodities and commodity or currency futures have special taxconsiderations. Physical commodities may be treated as collectibles subject to a maximum 28% long-term capital gains rates, while futures aremarked-to-market and may be subject to a blended 60% long- and 40% short-term capital gains tax rate. Rolling futures positions may createtaxable events. For specifics and a greater explanation of possible risks with ETFs¸ along with the ETF’s investment objectives, charges andexpenses, please consult a copy of the ETF’s prospectus. Investing in sectors may be more volatile than diversifying across many industries.The investment return and principal value of ETF investments will fluctuate, so an investor’s ETF shares (Creation Units), if or when sold, maybe worth more or less than the original cost. ETFs are redeemable only in Creation Unit size through an Authorized Participant and are notindividually redeemable from an ETF.
Investors should carefully consider the investment objectives and risks as well as charges and expenses of an exchange-traded fund or mutualfund before investing. The prospectus contains this and other important information about the mutual fund. To obtain a prospectus, contactyour Financial Advisor or visit the mutual fund company’s website. Please read the prospectus carefully before investing.
MLPs
Master Limited Partnerships (MLPs) are limited partnerships or limited liability companies that are taxed as partnerships and whose interests(limited partnership units or limited liability company units) are traded on securities exchanges like shares of common stock. Currently, mostMLPs operate in the energy, natural resources or real estate sectors. Investments in MLP interests are subject to the risks generally applicableto companies in the energy and natural resources sectors, including commodity pricing risk, supply and demand risk, depletion risk andexploration risk.
Individual MLPs are publicly traded partnerships that have unique risks related to their structure. These include, but are not limited to, theirreliance on the capital markets to fund growth, adverse ruling on the current tax treatment of distributions (typically mostly tax deferred), andcommodity volume risk.
The potential tax benefits from investing in MLPs depend on their being treated as partnerships for federal income tax purposes and, if the MLPis deemed to be a corporation, then its income would be subject to federal taxation at the entity level, reducing the amount of cash availablefor distribution to the fund which could result in a reduction of the fund’s value.
MLPs carry interest rate risk and may underperform in a rising interest rate environment. MLP funds accrue deferred income taxes for future taxliabilities associated with the portion of MLP distributions considered to be a tax-deferred return of capital and for any net operating gains aswell as capital appreciation of its investments; this deferred tax liability is reflected in the daily NAV; and, as a result, the MLP fund’s after-taxperformance could differ significantly from the underlying assets even if the pre-tax performance is closely tracked.
Duration
Duration, the most commonly used measure of bond risk, quantifies the effect of changes in interest rates on the price of a bond or bondportfolio. The longer the duration, the more sensitive the bond or portfolio would be to changes in interest rates. Generally, if interest ratesrise, bond prices fall and vice versa. Longer-term bonds carry a longer or higher duration than shorter-term bonds; as such, they would beaffected by changing interest rates for a greater period of time if interest rates were to increase. Consequently, the price of a long-term bondwould drop significantly as compared to the price of a short-term bond.
International investing entails greater risk, as well as greater potential rewards compared to U.S. investing. These risks include political andeconomic uncertainties of foreign countries as well as the risk of currency fluctuations. These risks are magnified in countries with emergingmarkets and frontier markets, since these countries may have relatively unstable governments and less established markets and economies.
Investing in currency involves additional special risks such as credit, interest rate fluctuations, derivative investment risk, and domestic andforeign inflation rates, which can be volatile and may be less liquid than other securities and more sensitive to the effect of varied economicconditions. In addition, international investing entails greater risk, as well as greater potential rewards compared to U.S. investing. These risksinclude political and economic uncertainties of foreign countries as well as the risk of currency fluctuations. These risks are magnified incountries with emerging markets, since these countries may have relatively unstable governments and less established markets and economies.
Managed futures investments are speculative, involve a high degree of risk, use significant leverage, have limited liquidity and/or may begenerally illiquid, may incur substantial charges, may subject investors to conflicts of interest, and are usually appropriate only for the riskcapital portion of an investor’s portfolio. Before investing in any partnership and in order to make an informed decision, investors should readthe applicable prospectus and/or offering documents carefully for additional information, including charges, expenses, and risks. Managedfutures investments are not intended to replace equities or fixed income securities but rather may act as a complement to these assetcategories in a diversified portfolio.
Investing in commodities entails significant risks. Commodity prices may be affected by a variety of factors at any time, including but not limited
ON THE MARKETS
Morgan Stanley Wealth Management 19

to, (i) changes in supply and demand relationships, (ii) governmental programs and policies, (iii) national and international political and economicevents, war and terrorist events, (iv) changes in interest and exchange rates, (v) trading activities in commodities and related contracts, (vi)pestilence, technological change and weather, and (vii) the price volatility of a commodity. In addition, the commodities markets are subject totemporary distortions or other disruptions due to various factors, including lack of liquidity, participation of speculators and governmentintervention.
Physical precious metals are non-regulated products. Precious metals are speculative investments, which may experience short-term and longterm price volatility. The value of precious metals investments may fluctuate and may appreciate or decline, depending on market conditions. Ifsold in a declining market, the price you receive may be less than your original investment. Unlike bonds and stocks, precious metals do notmake interest or dividend payments. Therefore, precious metals may not be appropriate for investors who require current income. Preciousmetals are commodities that should be safely stored, which may impose additional costs on the investor. The Securities Investor ProtectionCorporation (“SIPC”) provides certain protection for customers’ cash and securities in the event of a brokerage firm’s bankruptcy, other financialdifficulties, or if customers’ assets are missing. SIPC insurance does not apply to precious metals or other commodities.
Bonds are subject to interest rate risk. When interest rates rise, bond prices fall; generally the longer a bond's maturity, the more sensitive it isto this risk. Bonds may also be subject to call risk, which is the risk that the issuer will redeem the debt at its option, fully or partially, beforethe scheduled maturity date. The market value of debt instruments may fluctuate, and proceeds from sales prior to maturity may be more orless than the amount originally invested or the maturity value due to changes in market conditions or changes in the credit quality of the issuer.Bonds are subject to the credit risk of the issuer. This is the risk that the issuer might be unable to make interest and/or principal payments on atimely basis. Bonds are also subject to reinvestment risk, which is the risk that principal and/or interest payments from a given investment maybe reinvested at a lower interest rate.
Bonds rated below investment grade may have speculative characteristics and present significant risks beyond those of other securities,including greater credit risk and price volatility in the secondary market. Investors should be careful to consider these risks alongside theirindividual circumstances, objectives and risk tolerance before investing in high-yield bonds. High yield bonds should comprise only a limitedportion of a balanced portfolio.
Interest on municipal bonds is generally exempt from federal income tax; however, some bonds may be subject to the alternative minimum tax(AMT). Typically, state tax-exemption applies if securities are issued within one's state of residence and, if applicable, local tax-exemption appliesif securities are issued within one's city of residence.
Treasury Inflation Protection Securities’ (TIPS) coupon payments and underlying principal are automatically increased to compensate forinflation by tracking the consumer price index (CPI). While the real rate of return is guaranteed, TIPS tend to offer a low return. Because thereturn of TIPS is linked to inflation, TIPS may significantly underperform versus conventional U.S. Treasuries in times of low inflation.
Ultrashort-term fixed income asset class is comprised of fixed income securities with high quality, very short maturities. They are thereforesubject to the risks associated with debt securities such as credit and interest rate risk.
Although they are backed by the full faith and credit of the U.S. Government as to timely payment of principal and interest, Treasury Bills aresubject to interest rate and inflation risk, as well as the opportunity risk of other more potentially lucrative investment opportunities.
CDs are insured by the FDIC, an independent agency of the U.S. Government, up to a maximum of $250,000 (including principal and accruedinterest) for all deposits held in the same insurable capacity (e.g. individual account, joint account, IRA etc.) per CD depository. Investors areresponsible for monitoring the total amount held with each CD depository. All deposits at a single depository held in the same insurablecapacity will be aggregated for the purposes of the applicable FDIC insurance limit, including deposits (such as bank accounts) maintaineddirectly with the depository and CDs of the depository. For more information visit the FDIC website at www.fdic.gov.
The majority of $25 and $1000 par preferred securities are “callable” meaning that the issuer may retire the securities at specific prices anddates prior to maturity. Interest/dividend payments on certain preferred issues may be deferred by the issuer for periods of up to 5 to 10 years,depending on the particular issue. The investor would still have income tax liability even though payments would not have been received. Pricequoted is per $25 or $1,000 share, unless otherwise specified. Current yield is calculated by multiplying the coupon by par value divided by themarket price.
The initial interest rate on a floating-rate security may be lower than that of a fixed-rate security of the same maturity because investors expectto receive additional income due to future increases in the floating security’s underlying reference rate. The reference rate could be an index oran interest rate. However, there can be no assurance that the reference rate will increase. Some floating-rate securities may be subject to callrisk.
The market value of convertible bonds and the underlying common stock(s) will fluctuate and after purchase may be worth more or less thanoriginal cost. If sold prior to maturity, investors may receive more or less than their original purchase price or maturity value, depending onmarket conditions. Callable bonds may be redeemed by the issuer prior to maturity. Additional call features may exist that could affect yield.
Some $25 or $1000 par preferred securities are QDI (Qualified Dividend Income) eligible. Information on QDI eligibility is obtained from thirdparty sources. The dividend income on QDI eligible preferreds qualifies for a reduced tax rate. Many traditional ‘dividend paying’ perpetualpreferred securities (traditional preferreds with no maturity date) are QDI eligible. In order to qualify for the preferential tax treatment allqualifying preferred securities must be held by investors for a minimum period – 91 days during a 180 day window period, beginning 90 daysbefore the ex-dividend date.
Principal is returned on a monthly basis over the life of a mortgage-backed security. Principal prepayment can significantly affect the monthlyincome stream and the maturity of any type of MBS, including standard MBS, CMOs and Lottery Bonds. Yields and average lives are estimatedbased on prepayment assumptions and are subject to change based on actual prepayment of the mortgages in the underlying pools. The levelof predictability of an MBS/CMO’s average life, and its market price, depends on the type of MBS/CMO class purchased and interest ratemovements. In general, as interest rates fall, prepayment speeds are likely to increase, thus shortening the MBS/CMO’s average life and likely
ON THE MARKETS
Morgan Stanley Wealth Management 20

causing its market price to rise. Conversely, as interest rates rise, prepayment speeds are likely to decrease, thus lengthening average life andlikely causing the MBS/CMO’s market price to fall. Some MBS/CMOs may have “original issue discount” (OID). OID occurs if the MBS/CMO’soriginal issue price is below its stated redemption price at maturity, and results in “imputed interest” that must be reported annually for taxpurposes, resulting in a tax liability even though interest was not received. Investors are urged to consult their tax advisors for moreinformation.
Rebalancing does not protect against a loss in declining financial markets. There may be a potential tax implication with a rebalancing strategy.Investors should consult with their tax advisor before implementing such a strategy.
Equity securities may fluctuate in response to news on companies, industries, market conditions and general economic environment.
Companies paying dividends can reduce or cut payouts at any time.
Value investing does not guarantee a profit or eliminate risk. Not all companies whose stocks are considered to be value stocks are able to turntheir business around or successfully employ corrective strategies which would result in stock prices that do not rise as initially expected.
Growth investing does not guarantee a profit or eliminate risk. The stocks of these companies can have relatively high valuations. Because ofthese high valuations, an investment in a growth stock can be more risky than an investment in a company with more modest growthexpectations.
Asset allocation and diversification do not assure a profit or protect against loss in declining financial markets.
REITs investing risks are similar to those associated with direct investments in real estate: property value fluctuations, lack of liquidity, limiteddiversification and sensitivity to economic factors such as interest rate changes and market recessions.
Because of their narrow focus, sector investments tend to be more volatile than investments that diversify across many sectors andcompanies. Technology stocks may be especially volatile. Risks applicable to companies in the energy and natural resources sectors includecommodity pricing risk, supply and demand risk, depletion risk and exploration risk.
Yields are subject to change with economic conditions. Yield is only one factor that should be considered when making an investment decision.
Credit ratings are subject to change.
The indices are unmanaged. An investor cannot invest directly in an index. They are shown for illustrative purposes only and do not representthe performance of any specific investment.
The indices selected by Morgan Stanley Wealth Management to measure performance are representative of broad asset classes. MorganStanley Smith Barney LLC retains the right to change representative indices at any time.
Disclosures
Morgan Stanley Wealth Management is the trade name of Morgan Stanley Smith Barney LLC, a registered broker-dealer in the United States.This material has been prepared for informational purposes only and is not an offer to buy or sell or a solicitation of any offer to buy or sell anysecurity or other financial instrument or to participate in any trading strategy. Past performance is not necessarily a guide to futureperformance.
The author(s) (if any authors are noted) principally responsible for the preparation of this material receive compensation based upon variousfactors, including quality and accuracy of their work, firm revenues (including trading and capital markets revenues), client feedback andcompetitive factors. Morgan Stanley Wealth Management is involved in many businesses that may relate to companies, securities orinstruments mentioned in this material.
This material has been prepared for informational purposes only and is not an offer to buy or sell or a solicitation of any offer to buy or sell anysecurity/instrument, or to participate in any trading strategy. Any such offer would be made only after a prospective investor had completed itsown independent investigation of the securities, instruments or transactions, and received all information it required to make its owninvestment decision, including, where applicable, a review of any offering circular or memorandum describing such security or instrument. Thatinformation would contain material information not contained herein and to which prospective participants are referred. This material is basedon public information as of the specified date, and may be stale thereafter. We have no obligation to tell you when information herein maychange. We make no representation or warranty with respect to the accuracy or completeness of this material. Morgan Stanley WealthManagement has no obligation to provide updated information on the securities/instruments mentioned herein.
The securities/instruments discussed in this material may not be appropriate for all investors. The appropriateness of a particular investment orstrategy will depend on an investor’s individual circumstances and objectives. Morgan Stanley Wealth Management recommends that investorsindependently evaluate specific investments and strategies, and encourages investors to seek the advice of a financial advisor. The value of andincome from investments may vary because of changes in interest rates, foreign exchange rates, default rates, prepayment rates,securities/instruments prices, market indexes, operational or financial conditions of companies and other issuers or other factors. Estimates offuture performance are based on assumptions that may not be realized. Actual events may differ from those assumed and changes to anyassumptions may have a material impact on any projections or estimates. Other events not taken into account may occur and may significantlyaffect the projections or estimates. Certain assumptions may have been made for modeling purposes only to simplify the presentation and/orcalculation of any projections or estimates, and Morgan Stanley Wealth Management does not represent that any such assumptions will reflectactual future events. Accordingly, there can be no assurance that estimated returns or projections will be realized or that actual returns orperformance results will not materially differ from those estimated herein.
This material should not be viewed as advice or recommendations with respect to asset allocation or any particular investment. This
ON THE MARKETS
Morgan Stanley Wealth Management 21

information is not intended to, and should not, form a primary basis for any investment decisions that you may make. Morgan Stanley WealthManagement is not acting as a fiduciary under either the Employee Retirement Income Security Act of 1974, as amended or under section 4975of the Internal Revenue Code of 1986 as amended in providing this material except as otherwise provided in writing by Morgan Stanley and/oras described at www.morganstanley.com/disclosures/dol.
Morgan Stanley Smith Barney LLC, its affiliates and Morgan Stanley Financial Advisors do not provide legal or tax advice. Each client shouldalways consult his/her personal tax and/or legal advisor for information concerning his/her individual situation and to learn about any potentialtax or other implications that may result from acting on a particular recommendation.
This material is primarily authored by, and reflects the opinions of, Morgan Stanley Smith Barney LLC (Member SIPC), as well as identifiedguest authors. Articles contributed by employees of Morgan Stanley & Co. LLC (Member SIPC) or one of its affiliates are used under licensefrom Morgan Stanley.
This material is disseminated in Australia to “retail clients” within the meaning of the Australian Corporations Act by Morgan Stanley WealthManagement Australia Pty Ltd (A.B.N. 19 009 145 555, holder of Australian financial services license No. 240813).
Morgan Stanley Wealth Management is not incorporated under the People's Republic of China ("PRC") law and the material in relation to thisreport is conducted outside the PRC. This report will be distributed only upon request of a specific recipient. This report does not constitute anoffer to sell or the solicitation of an offer to buy any securities in the PRC. PRC investors must have the relevant qualifications to invest in suchsecurities and must be responsible for obtaining all relevant approvals, licenses, verifications and or registrations from PRC's relevantgovernmental authorities.
If your financial adviser is based in Australia, Switzerland or the United Kingdom, then please be aware that this report is being distributed bythe Morgan Stanley entity where your financial adviser is located, as follows: Australia: Morgan Stanley Wealth Management Australia Pty Ltd(ABN 19 009 145 555, AFSL No. 240813); Switzerland: Morgan Stanley (Switzerland) AG regulated by the Swiss Financial Market SupervisoryAuthority; or United Kingdom: Morgan Stanley Private Wealth Management Ltd, authorized and regulated by the Financial Conduct Authority,approves for the purposes of section 21 of the Financial Services and Markets Act 2000 this material for distribution in the United Kingdom.
Morgan Stanley Wealth Management is not acting as a municipal advisor to any municipal entity or obligated person within the meaning ofSection 15B of the Securities Exchange Act (the “Municipal Advisor Rule”) and the opinions or views contained herein are not intended to be,and do not constitute, advice within the meaning of the Municipal Advisor Rule.
This material is disseminated in the United States of America by Morgan Stanley Wealth Management.
Third-party data providers make no warranties or representations of any kind relating to the accuracy, completeness, or timeliness of the datathey provide and shall not have liability for any damages of any kind relating to such data.
This material, or any portion thereof, may not be reprinted, sold or redistributed without the written consent of Morgan Stanley Smith BarneyLLC.
© 2020 Morgan Stanley Smith Barney LLC. Member SIPC.
RSI1601504337905 09/2020
ON THE MARKETS
Morgan Stanley Wealth Management 22

3Q2020

Past performance is no guarantee of future results. Estimates of future performance are based on assumptions that may not be realized. This material is not a solicitation of any offer to buy or sell any security or other financial instrument or to participate in any trading strategy. Please refer to important information, disclosures and qualifications at the end of this material. This slide sourced from Market Performance section.
WEALTH MANAGEMENT INVESTMENT RESOURCES | CHARTBOOK | MARKET PERFORMANCE
Capital Markets Overview: 3Q 2020 Introduction
Quarterly Update as of October 1, 2020 and Forecasts as of September 25, 2020
Source: FactSet, Bloomberg, Morgan Stanley & Co. Research, Morgan Stanley Wealth Management GIC
• The S&P 500 saw continued moderate gains in the third quarter following a sharp rally in the second quarter, despite volatility in September.
Equities rallied 8.9% on the quarter, following a quarter in which they gained 20.5%. Equities continued to rally despite a selloff in September
and investor uncertainty surrounding the passage of a second fiscal stimulus plan, Fed ambiguity on Quantitative Easing and average inflation
targeting details, 2020 presidential election results, and COVID vaccine timing as well as expectations for rising cases as we head into the colder
season. International developed equities have underperformed the US on the quarter, while emerging markets have very slightly outperformed
US equities. Morgan Stanley & Co. U.S. Equity Strategy has a 3,350 price target on the S&P 500 for 2Q21E.
• After the S&P 500 sectors finished the second quarter posting strong returns, the sectors finished the third quarter with a more moderate
performance. While Tech, Energy, and Consumer Discretionary were the top-performing sectors in 2Q20, returning 30.5%, 30.5%, and 32.9%,
respectively, Consumer Discretionary, Materials, and Industrials were the top-performing sectors in 3Q20, returning 14.9%, 12.7%, and 12.0%,
respectively. Laggards this quarter included Financials, Real Estate, and Energy, which returned 3.8%, 2.6%, and -20.9%, respectively. Other
major US indices were also up for the quarter: The Dow Jones Industrial Average rose 8.2% and the NASDAQ Composite rose 11.2%.
• The MSCI EAFE Index (a benchmark for international developed markets) rose 4.9% while the MSCI Emerging Markets Index rose 9.7% for the
quarter. Although underperforming US equities for the quarter, international developed markets outperformed the month of September by 109
basis points. Emerging markets outperformed US equities for the quarter by 120 basis points .
• The US aggregate bond market was positive for a consecutive quarter and outperformed on an absolute but not on a relative basis as investors
took on more risk within pro-recovery trades. The Bloomberg Barclays US Aggregate Bond Index, a general measure of the bond market, rose
0.62%.
• Morgan Stanley & Co. economists expect US real GDP will be -1.5% in Q4 2020, but forecast positive GDP growth for 2021 as economic
recovery continues.
• Commodities were up in the second quarter; the Bloomberg Commodity Index rose by 9.0% and Gold rose by 5.9%.

Past performance is no guarantee of future results. Estimates of future performance are based on assumptions that may not be realized. This material is not a solicitation of any offer to buy or sell any security or other financial instrument or to participate in any trading strategy. Please refer to important information, disclosures and qualifications at the end of this material. This slide sourced from Market Performance section.
WEALTH MANAGEMENT INVESTMENT RESOURCES | CHARTBOOK | MARKET PERFORMANCE
Capital Markets Overview: 3Q 2020
Source: FactSet, Bloomberg, Morgan Stanley Wealth Management GIC
INDEX IN USD Quarter 12 Months5-Years
(Annualized)
7-Years
(Annualized
S&P 500 8.93% 15.15% 14.13% 12.67%
Dow Jones 8.22% 5.70% 14.00% 11.73%
Russell 2000 4.93% 0.39% 7.99% 6.42%
Russell Midcap 7.46% 4.55% 10.12% 9.36%
Russell 1000 9.47% 16.01% 14.08% 12.53%
Key US Stock Market Index Returns (%) for the Period Ending 9/30/2020
US Equity Markets
As of 3Q 2020
The Dow Jones Industrial Average gained 8.2% in the third quarter of 2020, while the NASDAQ Composite Index gained 11.02%. The S&P 500 Index
climbed 8.9% over the same time period.
Ten out of the 11 sectors of the S&P 500 gained in the third quarter with Energy being the laggard. Consumer Discretionary proved to be resilient in
the third quarter with a return of 15.06% for 3Q. In addition, Materials outperformed amid an uptick in demand for construction materials, leading
to a gain of 13.31% . Consumer Discretionary, Materials, and Information Technology were the top-performing sectors, returning 15.06%, 13.31%,
and 12.48%, respectively. Laggards included Energy, Real Estate, and Financials despite still increasing by -19.72%, 1.92%, and 4.45%, respectively.
The Russell 1000, a large-cap index, increased 9.5% for the quarter, as large-cap growth (13.2% ) outperformed large-cap value (5.6%).
The Russell Midcap gained 7.46% on the quarter, with mid-cap growth (9.4%) outperforming mid-cap value (6.4%).
The Russell 2000, a small-cap index, gained 4.93% for the quarter, with small-cap growth (7.16%) outperforming small-cap value (2.56%).

Past performance is no guarantee of future results. Estimates of future performance are based on assumptions that may not be realized. This material is not a solicitation of any offer to buy or sell any security or other financial instrument or to participate in any trading strategy. Please refer to important information, disclosures and qualifications at the end of this material. This slide sourced from Market Performance section.
WEALTH MANAGEMENT INVESTMENT RESOURCES | CHARTBOOK | MARKET PERFORMANCE
Capital Markets Overview: 3Q 2020
Source: FactSet, Bloomberg, Morgan Stanley Wealth Management GIC
INDEX IN USD Quarter 12 Months5-Years
(Annualized)
7-Years
(Annualized)
MSCI EAFE 4.88% 0.93% 5.77% 3.49%
MSCI EAFE Growth 8.48% 13.81% 9.62% 6.60%
MSCI EAFE Value 1.30% -11.45% 1.74% 0.24%
MSCI Europe 4.58% -0.27% 4.86% 2.99%
MSCI Japan 6.88% 7.20% 7.82% 5.40%
S&P 500 8.93% 15.15% 14.13% 12.67%
MSCI Emerging Markets 9.70% 10.91% 9.36% 4.12%
Key Global Stock Market Index Returns (%) for the Period Ending 9/30/2020
International underperformed US equities in the second quarter of 2020 despite still gaining on the back of global stimulus and among choppy
progress on the fight against the COVID pandemic. The MSCI EAFE Index (a benchmark for international developed markets) advanced 4.88% for
US-currency investors.
In the third quarter, the MSCI Emerging Markets Index also rallied by 9.7% for US-currency investors, as import-heavy countries, especially with
heavy exposure to China, fell in recent quarters and then bounced back. The MSCI Europe Index advanced 4.6% for US-currency investors, while
the MSCI Japan outperformed, gaining 6.88%.
The S&P 500 Index rallied 8.93% for the quarter.
Emerging economy equity market indices also rallied in the third quarter. The MSCI BRIC (Brazil, Russia, India and China) Index gained 9.57% in US
dollar terms, while the MSCI EM Asia Index rose 11.09%.
Global Equity Markets
As of 3Q 2020

Past performance is no guarantee of future results. Estimates of future performance are based on assumptions that may not be realized. This material is not a solicitation of any offer to buy or sell any security or other financial instrument or to participate in any trading strategy. Please refer to important information, disclosures and qualifications at the end of this material. This slide sourced from Market Performance section.
WEALTH MANAGEMENT INVESTMENT RESOURCES | CHARTBOOK | MARKET PERFORMANCE
Capital Markets Overview: 3Q 2020
Source: FactSet, Bloomberg, Morgan Stanley & Co. Research, Federal Reserve Bank of St. Louis, Morgan Stanley Wealth Management GIC
The Bureau of Economic Analysis estimated that real Gross Domestic Product decreased at an annualized rate of -31.4% in 2Q20, in comparison to
a 1.5% increase a year ago in 2Q19. Morgan Stanley & Co. economists forecast US Real GDP growth will be -3% in Q3 2020 and -1.5% in Q4 2020.
The seasonally adjusted unemployment rate for August 2020 was 8.4%, slowly decreasing each month after peaking in April at 14.7%. Even in
August, total nonfarm payrolls remain down by more than 11.5 million since the February 2020 peak in the labor market, equivalent to nearly half a
decade worth of job gains lost. The number of long-term unemployed (those jobless for 27 weeks or more) was 1.6 million, an increase of 123,000
over the month.
According to the most recent data from the Federal Reserve Bank of St. Louis, corporate profits dropped 10.7% quarter over quarter and declined
18.8% year over year as of Q2 2020.
Inflation in the US increased since the previous quarter, according to the Bureau of Labor Statistics. The year-over-year Consumer Price Index was
1.4% in August, up from the 0.3% low in April. Morgan Stanley & Co. economists forecast a 1.1% inflation rate for Q3 2020 and 1.1% annual rate for
2020.
The Census Bureau reported that the number of new private-sector housing starts in August was at a seasonally adjusted annual rate of
1,416,000— up 2.8% from August of last year.
The Census Bureau also reported that seasonally adjusted retail and food services sales rose 0.6% from the previous month and 2.6% above August
2019. Consumer confidence increased in 3Q2020, with Conference Board Consumer Confidence reading 101.8 in September, compared to 86.3 in
August, which is still below July 2019’s peak of 135.8.
In September, the Institute for Supply Management’s (ISM) Purchasing Managers Index (PMI), a manufacturing sector index, registered 55.4, down
0.6 from August’s 56 reading. Overall, this figure indicates expansion in the overall economy for the fifth month in a row after a contraction in April ,
which had been the lowest since 2008. Generally speaking, a PMI or NMI (ISM Non-Manufacturing Index) over 50 indicates that the sector is
expanding, and a PMI below 50 indicates that the sector is shrinking.
The ISM’s Non-Manufacturing Index (NMI) for August was 56.9—this represents the third straight month of growth in the services sector after the
April and May contraction.
The US Economy
Quarterly Update as of October 1, 2020 and Forecasts as of September 25, 2020

Past performance is no guarantee of future results. Estimates of future performance are based on assumptions that may not be realized. This material is not a solicitation of any offer to buy or sell any security or other financial instrument or to participate in any trading strategy. Please refer to important information, disclosures and qualifications at the end of this material. This slide sourced from Market Performance section.
WEALTH MANAGEMENT INVESTMENT RESOURCES | CHARTBOOK | MARKET PERFORMANCE
ASSET CLASS INDEX IN USD 1-MONTH YTD 1-YR 3-YR ANN 5-YR ANN
Global Equity
Global Equity MSCI All Country World -3.2% 1.8% 11.0% 7.7% 10.8%
US Equity S&P 500 -3.8% 5.6% 15.1% 12.2% 14.1%
International Equity MSCI All Country World ex US -2.4% -5.1% 3.4% 1.6% 6.6%
Emerging Markets Equity MSCI Emerging Markets -1.6% -0.9% 10.9% 2.8% 9.2%
Global Fixed Income
Investment Grade Fixed Income Barclays US Aggregate -0.1% 6.8% 7.0% 5.2% 4.2%
Inflation-Linked Securities Barclays Universal Govt Inflation-Linked 0.4% 7.5% 4.6% 6.1% 5.5%
High Yield Barclays Global High Yield (H) -1.5% -1.0% 2.0% 3.2% 6.4%
Emerging Markets Fixed Income JP Morgan EM Bonds (UH in USD) -2.0% -6.3% -1.4% 0.8% 1.9%
Alternative Investments
Global REITs FTSE EPRA/NAREIT Global REITs -3.0% -19.5% -16.6% -0.8% 3.3%
Commodities Bloomberg Commodities -3.4% -12.1% -8.2% -4.4% -3.1%
MLPs Alerian MLP -13.6% -46.2% -48.4% -20.7% -12.3%
Hedged Strategies HFRX Global Hedge Fund Index -0.2% 1.6% 4.2% 1.5% 2.1%
Managed Futures HFRX Macro/CTA Index -1.3% 0.0% -0.2% 1.4% 0.1%
Private Real Estate NCREIF Private Real Estate - -0.3% 2.7% 5.4% 6.8%
Global Cash
Cash Citigroup 3-month Treasury Bill 0.0% 0.6% 1.0% 1.6% 1.2%
Other Fixed Income
Municipal Fixed Income Barclays Municipal Bond 0.0% 3.3% 4.1% 4.3% 3.8%
Asset Class Index Performance
Source: FactSet, Morgan Stanley Wealth Management GIC. For more information about the risks to Master Limited Partnerships (MLPs), please refer to the Risk Considerations section at the end of this material.
Capital Market Returns As of October 1, 2020; Private Real Estate as of June 30, 2020

Past performance is no guarantee of future results. Estimates of future performance are based on assumptions that may not be realized. This material is not a solicitation of any offer to buy or sell any security or other financial instrument or to participate in any trading strategy. Please refer to important information, disclosures and qualifications at the end of this material. This slide sourced from Market Performance section.
WEALTH MANAGEMENT INVESTMENT RESOURCES | CHARTBOOK | MARKET PERFORMANCE
Capital Markets Overview: 3Q 2020
INDEX IN USD Quarter 12 Months5-Years
(Annualized)
7-Years
(Annualized)
Bloomberg Barclays Capital US Aggregate 0.62% 6.98% 4.17% 3.97%
Bloomberg Barclays Capital High Yield 4.60% 3.25% 6.79% 5.32%
Bloomberg Barclays Capital Government/Credit 0.74% 8.23% 4.65% 4.29%
Bloomberg Barclays Capital Government 0.17% 8.04% 3.74% 3.54%
Bloomberg Barclays Capital Intermediate Govt/Credit 0.60% 6.41% 3.40% 3.13%
Bloomberg Barclays Capital Long Govt/Credit 1.22% 12.92% 8.77% 8.51%
Bloomberg Barclays Capital Mortgage Backed Securities 0.11% 4.36% 2.98% 3.16%
Bloomberg Barclays Capital Muni 1.23% 4.09% 3.84% 4.32%
Key US Bond Market Index Returns (%) for the Period Ending 9/30/2020
The bond market was positive for a second consecutive quarter, outperforming on an absolute but not relative basis, as investors continued to take
on risk in 3Q. The Bloomberg Barclays US Aggregate Bond Index, a general measure of the bond market, rose 0.62%.
Interest rates remained zero-bound, as the yield on the 10-year US Treasury note remained rang-bound, closing the quarter at 0.69% from 1.92% at
the end of 2019. The shortest end of the curve fell in 1Q as the Fed cut its Fed funds target rate, with the yield on 3-month Treasury bills falling to
0.10% as of Q3, from 1.54% at the start of the year.
Riskier parts of the bond market such as US high yield debt gained the most in the third quarter, buoyed by the market’s risk-on sentiment. The
Bloomberg Barclays Capital High Yield Index, a measure of lower-rated corporate bonds, rallied 4.6%.
Mortgage-backed continued to show slight gains in the third quarter. The Bloomberg Barclays Capital Mortgage-Backed Securities Index rose
0.11%. Municipal bonds rallied slightly more; the Bloomberg Barclays Capital Muni Index gained 1.2%.
The US Bond Market
As of 3Q 2020
Source: FactSet, Bloomberg, Morgan Stanley & Co. Research, Morgan Stanley Wealth Management GIC

!"#$%&'($%)*+&,*$)(-& $%$#*.*%(&/0&(-*&("$1*&%$.*&!2& !"#$%&'($%)*+&'./(-&3$"%*+&4456&$&"*#/0(*"*1&7"!8*"91*$)*"&/%&(-*&:%/(*1&'($(*0;
!"#$%&"#'()'%$"#%*#+!,$#-.+"),.&#,$#+%#,/*%)-0#./1#,+#,/#/%#2.3#,$#,/+"/1"1#+%#4"#./#%5")#%)#$%&,6,+.+,%/#+%#'()6!.$"#%)#$"&&#./3#$"6(),+30#%+!")#,/7"$+-"/+#%)#$")7,6"0#%)#+%#.++).6+#./3#*(/1$#%)#1"'%$,+$8#
9/7"$+-"/+$#-"/+,%/"1#-.3#/%+#4"#.'')%'),.+"#*%)#.&&,"/+$8#:/3#')%1(6+#1,$6($$"1#!")",/#-.3#4"#'()6!.$"1#%/&3#.*+")#.#6&,"/+#!.$#6.)"*(&&3#)"7,"2"1#+!"#%5"),/;#-"-%)./1(-#./1#"<"6(+"1#+!"#
$(4$6),'+,%/#1%6(-"/+$8#=%);./#>+./&"3#?".&+!#=./.;"-"/+#!.$#/%+#6%/$,1")"1#+!"#.6+(.&#%)#1"$,)"1#,/7"$+-"/+#%4@"6+,7"$0#;%.&$0#$+).+";,"$0#;(,1"&,/"$0#%)#*.6+(.,)6(-$+./6"$#%*#./3#,/7"$+%)#,/#
./3#*(/1A$B8#C"*%)"#-.D,/;#./3#,/7"$+-"/+0#".6!#,/7"$+%)#$!%(&1#6.)"*(&&3#6%/$,1")#+!"#),$D$#.$$%6,.+"1#2,+!#+!"#,/7"$+-"/+0#.$#1,$6($$"1#,/#+!"#.''&,6.4&"#%5"),/;#-"-%)./1(-0#./1#-.D"#.#
1"+")-,/.+,%/#4.$"1#('%/#+!",)#%2/#'.)+,6(&.)#6,)6(-$+./6"$0#+!.+#+!"#,/7"$+-"/+#,$#6%/$,$+"/+#2,+!#+!",)#,/7"$+-"/+#%4@"6+,7"$#./1#),$D#+%&")./6"8#=%);./#>+./&"3#>-,+!#C.)/"3#EEF#%5")$#
,/7"$+-"/+#')%;).-#$")7,6"$#+!)%(;!#.#7.),"+3#%*#,/7"$+-"/+#')%;).-$0#2!,6!#.)"#%'"/"1#'()$(./+#+%#2),++"/#6&,"/+#.;)""-"/+$8#G.6!#')%;).-#%5")$#,/7"$+-"/+#-./.;")$0#*(/1$#./1#*".+()"$#+!.+#
.)"#/%+#.7.,&.4&"#,/#%+!")#')%;).-$H#6%/7")$"&30#$%-"#,/7"$+-"/+#-./.;")$0#*(/1$#%)#,/7"$+-"/+#$+).+";,"$#-.3#4"#.7.,&.4&"#,/#-%)"#+!./#%/"#')%;).-8
=%);./#>+./&"3I$#,/7"$+-"/+#.17,$%)3#')%;).-$#-.3#)"J(,)"#.#-,/,-(-#.$$"+#&"7"&#./10#1"'"/1,/;#%/#3%()#$'"6,K6#,/7"$+-"/+#%4@"6+,7"$#./1#K/./6,.&#'%$,+,%/0#-.3#/%+#4"#.'')%'),.+"#*%)#3%(8#
L&".$"#$""#+!"#=%);./#>+./&"3#>-,+!#C.)/"3#EEF#')%;).-#1,$6&%$()"#4)%6!()"#A+!"#M=%);./#>+./&"3#:NOPB#*%)#-%)"#,/*%)-.+,%/#,/#+!"#,/7"$+-"/+#.17,$%)3#')%;).-$#.7.,&.4&"8# !"#=%);./#>+./&"3#
:NO#,$#.7.,&.4&"#.+#2228-%);./$+./&"386%-Q:NO8#'!<"=*0&!2&>$($;&9/*%)-.+,%/#,/#+!,$#-.+"),.&#,/#+!,$#)"'%)+#!.$#4""/#%4+.,/"1#*)%-#$%()6"$#+!.+#2"#4"&,"7"#+%#4"#)"&,.4&"0#4(+#2"#1%#/%+#;(.)./+""#
,+$#.66().630#6%-'&"+"/"$$#%)#+,-"&,/"$$8# !,)1R'.)+3#1.+.#')%7,1")$#-.D"#/%#2.))./+,"$#%)#)"')"$"/+.+,%/$#)"&.+,/;#+%#+!"#.66().630#6%-'&"+"/"$$#%)#+,-"&,/"$$#%*#+!"#1.+.#+!"3#')%7,1"#./1#.)"#/%+#
&,.4&"#*%)#./3#1.-.;"$#)"&.+,/;#+%#+!,$#1.+.8#:&&#%',/,%/$#,/6&(1"1#,/#+!,$#-.+"),.%/$+,+(+"#+!"#S,)-I$#@(1;-"/+#.$#%*#+!"#1.+"#%*#+!,$#-.+"),.&#./1#.)"#$(4@"6+#+%#6!./;"#2,+!%(+#/%+,6" 8# !,$#-.+"),.&#
2.$#/%+#')"'.)"1#43#+!"#)"$".)6!#1"'.)+-"/+$#%*#=%);./#>+./&"3#T#F%8#EEF#%)#=%);./#>+./&"3#>-,+!#C.)/"3#EEF8#>%-"#!,$+%),6.&#K;()"$#-.3#4"#)"7,$"1#1("#+%#/"2&3#,1"/+,K"1#')%;).-$0#K)-#
)"$+.+"-"/+$0#"+68
?)!7$)&@%A*0(.*%(& $%$#*"&B%$)+0/0&C?@ BD&E!=<0&4/0(6&BFF"!A*1&4/0(&$%1&G$=(/=$)&HFF!"(<%/(/*0&4/0(I&,$(=-&J!)/=+;&U9=:#($"$#+2%#-"+!%1$#+%#"7.&(.+"#,/7"$+-"/+#')%1(6+$#,/#.''&,6.4&"#
.17,$%)3#')%;).-$V#E!=<0&A./1#,/7"$+-"/+#')%1(6+$#-""+,/;#+!,$#$+./1.)1#.)"#1"$6),4"1#.$#4",/;#%/#+!"#S%6($#E,$+B#./1#BFF"!A*1&A./1#,/7"$+-"/+#')%1(6+$#-""+,/;#+!,$#$+./1.)1#.)"#1"$6),4"1#.$#
4",/;#%/#+!"#:'')%7"1#E,$+B8#9/#;"/").&0#S%6($#"/+.,&$#.#-%)"#+!%)%(;!#"7.&(.+,%/#%*#./#,/7"$+-"/+#')%1(6+#+!./#:'')%7"18#>%-"+,-"$#./#,/7"$+-"/+#')%1(6+#-.3#4"#"7.&(.+"1#($,/;#+!"#S%6($#E,$+#
')%6"$$#4(+#+!"/#'&.6"1#%/#+!"#:'')%7"1#E,$+#,/$+".1#%*#+!"#S%6($#E,$+8#9/7"$+-"/+#')%1(6+$#-.3#-%7"#*)%-#+!"#S%6($#E,$+#+%#+!"#:'')%7"1#E,$+0#%)#7,6"#7")$.8#U9=:#-.3#.&$%#1"+")-,/"#+!.+#./#
,/7"$+-"/+#')%1(6+#/%#&%/;")#-""+$#+!"#6),+"),.#(/1")#",+!")#')%6"$$#./1#2,&&#/%#&%/;")#4"#)"6%--"/1"1#,/#,/7"$+-"/+#.17,$%)3#')%;).-$#A,/#2!,6!#6.$"#+!"#,/7"$+-"/+#')%1(6+#,$#;,7"/#.#MW%+#
:'')%7"1P#$+.+($B8#U9=:#!.$#.#X,$(=-P#'%&,63#./1#-.3#1"$6),4"#.#S%6($#E,$+#%)#:'')%7"1#E,$+#,/7"$+-"/+#')%1(6+#.$#4",/;#%/#M?.+6!P#,*#U9=:#,1"/+,K"$#$'"6,K6#.)".$#+!.+#A.B#-"),+#*()+!")#"7.&(.+,%/#
43#U9=:#./1#A4B#-.30#4(+#.)"#/%+#6")+.,/#+%0#)"$(&+#,/#+!"#,/7"$+-"/+#')%1(6+#4"6%-,/;#MW%+#:'')%7"18P# !"#?.+6!#'"),%1#1"'"/1$#%/#+!"#&"/;+!#%*#+,-"#/""1"1#*%)#U9=:#+%#6%/1(6+#,+$#"7.&(.+,%/#
./1#*%)#+!"#,/7"$+-"/+#-./.;")#%)#*(/1#+%#.11)"$$#./3#6%/6")/$8#F")+.,/#,/7"$+-"/+#')%1(6+$#%/#",+!")#+!"#S%6($#E,$+#%)#:'')%7"1#E,$+#-.3#.&$%#4"#)"6%--"/1"1#*%)#+!"#G$=(/=$)&HFF!"(<%/(/*0&
4/0(&4.$"1#,/#'.)+#%/#+.6+,6.&#%''%)+(/,+,"$#"<,$+,/;#.+#.#;,7"/#+,-"8# !"#,/7"$+-"/+#')%1(6+$#%/#+!"# .6+,6.&#Y''%)+(/,+,"$#E,$+#6!./;"#%7")#+,-"8#S%)#-%)"#,/*%)-.+,%/#%/#+!"#S%6($#E,$+0#:'')%7"1#E,$+0#
.6+,6.&#Y''%)+(/,+,"$#E,$+#./1#?.+6!#')%6"$$"$0#'&".$"#$""#+!"#.''&,6.4&"#S%)-#:NO#N,$6&%$()"#N%6(-"/+#*%)#=%);./#>+./&"3#?".&+!#=./.;"-"/+8#Z%()#S,/./6,.&#:17,$%)#%)#L),7.+"#?".&+!#:17,$%)#
6./#.&$%#')%7,1"#('%/#)"J("$+#.#6%'3#%*#.#'(4&,6.+,%/#"/+,+&"1#M=./.;")#>"&"6+,%/#L)%6"$$8P
!"#?)!7$)&@%A*0(.*%(&5!../((**&,$#.#;)%('#%*#$".$%/"1#,/7"$+-"/+#')%*"$$,%/.&$#2!%#-""+#)";(&.)&3#+%#1,$6($$#+!"#;&%4.&#"6%/%-3#./1#-.)D"+$8# !"#6%--,++""#1"+")-,/"$#+!"#,/7"$+-"/+#
%(+&%%D#+!.+#;(,1"$#%()#.17,6"#+%#6&,"/+$8# !"3#6%/+,/(.&&3#-%/,+%)#1"7"&%',/;#"6%/%-,6#./1#-.)D"+#6%/1,+,%/$0#)"7,"2#+.6+,6.&#%(+&%%D$#./1#)"6%--"/1#-%1"&#'%)+*%&,%#2",;!+,/;$0#.$#2"&&#.$#
')%1(6"#.#$(,+"#%*#$+).+";30#./.&3$,$0#6%--"/+.)30#'%)+*%&,%#'%$,+,%/,/;#$(;;"$+,%/$#./1#%+!")#)"'%)+$#./1#4)%.16.$+$8
!"#U9F#:$$"+#:&&%6.+,%/#=%1"&$#.)"#/%+#.7.,&.4&"#+%#4"#1,)"6+&3#,-'&"-"/+"1#.$#'.)+#%*#./#,/7"$+-"/+#.17,$%)3#$")7,6"#./1#$!%(&1#/%+#4"#)";.)1"1#.$#.#)"6%--"/1.+,%/#%*#./3#=%);./#>+./&"3#
,/7"$+-"/+#.17,$%)3#$")7,6"8# !"#U9F#:$$"+#:&&%6.+,%/#=%1"&$#1%#/%+#)"')"$"/+#.6+(.&#+).1,/;#%)#./3#+3'"#%*#.66%(/+#%)#./3#+3'"#%*#,/7"$+-"/+#$+).+";,"$#./1#/%/"#%*#+!"#*""$#%)#%+!")#"<'"/$"$#A" 8;8#
6%--,$$,%/$0#-.)DR('$0#-.)DR1%2/$0#.17,$%)3#*""$0#*(/1#"<'"/$"$B#.$$%6,.+"1#2,+!#.6+(.&#+).1,/;#%)#.66%(/+$#.)"#)"["6+"1#,/#+!"#U9F#:$$"+#:&&%6.+,%/#=%1"&$#2!,6!0#2!"/#6%-'%(/1"1#%7")#.#'"),%1#
%*#3".)$0#2%(&1#1"6)".$"#)"+()/$8
B1A*"0*&B=(/A*&B)F-$' &K;L#,$#.#'.+"/+"1#$6)""/,/;#./1#$6%),/;#')%6"$$#1"$,;/"1#+%#!"&'#,1"/+,*3#!,;!RJ(.&,+3#"J(,+3#./1#K<"1#,/6%-"#-./.;")$#2,+!#6!.).6+"),$+,6$#+!.+#-.3#&".1#+%#*(+()"#
%(+'")*%)-./6"#)"&.+,7"#+%#,/1"<#./1#'"")$8#?!,&"#!,;!&3#)./D"1#-./.;")$#'")*%)-"1#2"&&#.$#.#;)%('#,/#%()#:17")$"#:6+,7"#:&'!.#-%1".6D#+"$+$0#/%+#.&&#%*#+!"#-./.;")$#2,&&#%(+'")*%)-8#L&".$"#/%+"#
+!.+#+!,$#1.+.#-.3#4"#1"),7"1#*)%-#4.6DR+"$+,/;0#2!,6!#!.$#+!"#4"/"K+#%*#!,/1$,;!+8#9/#.11,+,%/0#!,;!&3#)./D"1#-./.;")$#6./#!.7"#1,5"),/;#),$D#')%K&"$#+!.+#-,;!+#/%+#4"#.'')%'),.+"#*%)#.&&#,/7"$+%)$8#
Y()#7,"2#,$#+!.+#:17")$"#:6+,7"#:&'!.#,$#.#;%%1#$+.)+,/;#'%,/+#./1#$!%(&1#4"#($"1#,/#6%/@(/6+,%/#2,+!#%+!")#,/*%)-.+,%/8#=%);./#>+./&"3#?".&+!#=./.;"-"/+I$#J(.&,+.+,7"#./1#J(./+,+.+,7"#,/7"$+-"/+#
-./.;")#1("#1,&,;"/6"#')%6"$$#.)"#"J(.&&3#,-'%)+./+#*.6+%)$#*%)#,/7"$+%)$#2!"/#6%/$,1"),/;#-./.;")$#*%)#($"#+!)%(;!#./#,/7"$+-"/+#.17,$%)3#')%;).-8#S.6+%)$#,/6&(1,/;0#4(+#/%+#&,-,+"1#+%0#-./.;")#
+()/%7")#./1#6!./;"$#+%#,/7"$+-"/+#')%6"$$#6./#'.)+,.&&3#%)#*(&&3#/";.+"#.#'%$,+,7"#:17")$"#:6+,7"#:&'!.#)./D,/;8#:11,+,%/.&&30#!,;!&3#)./D"1#-./.;")$#6./#!.7"#1,5"),/;#),$D#')%K&"$#+!.+#-,;!+#/%+#4"#
!"#$%"&'("

.'')%'),.+"#*%)#.&&#,/7"$+%)$8
!"#')%'),"+.)3#M$)<*&'=!"*#-"+!%1%&%;3#6%/$,1")$#./#.6+,7"#,/7"$+-"/+#$+).+";,"$I#7.&("#')%'%$,+,%/#)"&.+,7"#+%#,+$#6%$+$8#S)%-#.#!,$+%),6.&#J(./+,+.+,7"#$+(13#%*#$"7").&#J(./+,+.+,7"#-.)D")$0#O.&("#
>6%)"#-".$()"$#'")6",7"1#*%)2.)1R&%%D,/;#4"/"K+#./1#6%-'(+"$#A\B#M*.,)#7.&("P#"<'"/$"#).+,%$#*%)#-%$+#+).1,+,%/.&#,/7"$+-"/+#-./.;")$#.6)%$$#]^#6.+";%),"$#./1#A_B#-./.;")$I#'")6",7"1#M"<6"$$#
7.&("P#43#6%-'.),/;#+!"#*.,)#7.&("#"<'"/$"#).+,%$#+%#.6+(.&#"<'"/$"#).+,%$8#=./.;")$#.)"#+!"/#)./D"1#2,+!,/#".6!#6.+";%)3#43#+!",)#"<6"$$#7.&("#+%#.$$,;/#.#O.&("#>6%)"8#Y()#./.&3$,$#$(;;"$+$#+!.+#
;)".+")#&"7"&$#%*#"<6"$$#7.&("#!.7"#!,$+%),6.&&3#6%))"$'%/1"1#+%#.++).6+,7"#$(4$"J("/+#'")*%)-./6"8
S%)#-%)"#,/*%)-.+,%/#%/#+!"#)./D,/;#-%1"&$0#'&".$"#$""# !"#$%#& '()"#& *+,-./&0123&.'4$)56& '()"#&/-5-6#$%& ''4$!)56&(4&74(#5()-*& *+,-#./1#8-*9#&.'4$#3&.'4$)56&:##&;<')#5'=&>=&?4@+-$)56&
/-5-6#$%A&B:-)$&8-*9#C&-5!& '(9-*&;D+#5%#&E-()4%8# !"#2!,+"'.'")$#.)"#.7.,&.4&"#*)%-#3%()#S,/./6,.&#:17,$%)#%)#L),7.+"#?".&+!#:17,$%)8#:NOG`>G#:F 9OG#:ELa:#,$#.#)";,$+")"1#$")7,6"#-.)D#%*#=%);./#
>+./&"3#./1Q%)#,+$#.b&,.+"$8#c8>8#L.+8#W%8#d0efg0^hd#.''&,"$#+%#+!"#:17")$"#:6+,7"#:&'!.#$3$+"-#./1Q%)#-"+!%1%&%;38
:11,+,%/.&&30#!,;!&3#)./D"1#-./.;")$#6./#!.7"#1,5"),/;#),$D#')%K&"$#+!.+#-,;!+#/%+#4"#.'')%'),.+"#*%)#.&&#,/7"$+%)$8#S%)#-%)"#,/*%)-.+,%/#%/#:::0#'&".$"#$""#+!"#:17")$"#:6+,7"#:&'!.#`./D,/;#=%1"&#
./1#>"&"6+,/;#=./.;")$#2,+!#:17")$"#:6+,7"#:&'!.#2!,+"'.'")$8# !"#2!,+"'.'")#.)"#.7.,&.4&"#*)%-#3%()#S,/./6,.&#:17,$%)#%)#L),7.+"#?".&+!#:17,$%)8#:NOG`>G#:F 9OG#:ELa:#,$#.#)";,$+")"1#$")7,6"#
-.)D#%*#=%);./#>+./&"3#./1Q%)#,+$#.b&,.+"$8#c8>8#L.+8#W%8#d0efg0^hd#.''&,"$#+%#+!"#:17")$"#:6+,7"#:&'!.#$3$+"-#./1Q%)#-"+!%1%&%;38
G-*&?)!7$)&@%A*0(.*%(& $%$#*"&B%$)+0/0&C?@ BD&'*"A/=*0&H%)+&BFF)+&(!&5*"($/%&@%A*0(.*%(&B1A/0!"+&J"!#"$.0&U9=:#"7.&(.+"$#6")+.,/#,/7"$+-"/+#')%1(6+$#*%)#+!"#'()'%$"$#%*#$%-"#i#4(+#/%+#.&&#
i#%*#=%);./#>+./&"3#>-,+!#C.)/"3#EEFI$#,/7"$+-"/+#.17,$%)3#')%;).-$#A.$#1"$6),4"1#,/#-%)"#1"+.,&#,/#+!"#.''&,6.4&"#S%)-#:NO#N,$6&%$()"#N%6(-"/+#*%)#=%);./#>+./&"3#?".&+!#=./.;"-"/+B8#9*#3%(#
1%#/%+#,/7"$+#+!)%(;!#%/"#%*#+!"$"#,/7"$+-"/+#.17,$%)3#')%;).-$0#=%);./#>+./&"3#?".&+!#=./.;"-"/+#,$#/%+#%4&,;.+"1#+%#')%7,1"#3%(#/%+,6"#%*#./3#U9=:#>+.+($#6!./;"$#"7"/#+!%(;!#,+#-.3#;,7"#
/%+,6"#+%#6&,"/+$#,/#%+!")#')%;).-$8
'("$(*#+& $+&3*&BA$/)$7)*&$0&$&'*F$"$(*)+& $%$#*1&B==!<%(&!"& <(<$)&E<%1&>+).+";,"$#.)"#$%-"+,-"$#.7.,&.4&"#,/#=%);./#>+./&"3#?".&+!#=./.;"-"/+#,/7"$+-"/+#.17,$%)3#')%;).-$#4%+!#,/#+!"#
*%)-#%*#.#$"'.).+"&3#-./.;"1#.66%(/+#AM>=:PB#./1#.#-(+(.&#*(/18# !"$"#-.3#!.7"#1,5")"/+#"<'"/$"$#./1#,/7"$+-"/+#-,/,-(-$8#Z%()#S,/./6,.&#:17,$%)#%)#L),7.+"#?".&+!#:17,$%)#6./#')%7,1"#-%)"#
,/*%)-.+,%/#%/#2!"+!")#./3#'.)+,6(&.)#$+).+";3#,$#.7.,&.4&"#,/#-%)"#+!./#%/"#*%)-#,/#.#'.)+,6(&.)#,/7"$+-"/+#.17,$%)3#')%;).-8#9/#-%$+#=%);./#>+./&"3#?".&+!#=./.;"-"/+#,/7"$+-"/+#.17,$%)3#
.66%(/+$0#*""$#.)"#1"1(6+"1#J(.)+")&3#./1#!.7"#.#6%-'%(/1,/;#"5"6+#%/#'")*%)-./6"8#S%)#"<.-'&"0#%/#./#.17,$%)3#.66%(/+#2,+!#.#jk#.//(.&#*""0#,*#+!"#;)%$$#.//(.&#'")*%)-./6"#,$#g8^^k0#+!"#
6%-'%(/1,/;#"5"6+#%*#+!"#*""$#2,&&#)"$(&+#,/#.#/"+#'")*%)-./6"#%*#.'')%<,-.+"&3#j8hjk#.*+")#%/"#3".)0#\#.*+")#+!)""#3".)$0#./1#_\8_jk#.*+")#K7"#3".)$8#5!%N/=(0&!2&@%(*"*0(O&U9=:I$#;%.&#,$#+%#')%7,1"#
')%*"$$,%/.&0#%4@"6+,7"#"7.&(.+,%/$#,/#$(''%)+#%*#+!"#=%);./#>+./&"3#?".&+!#=./.;"-"/+#,/7"$+-"/+#.17,$%)3#')%;).-$8#?"#!.7"#'%&,6,"$#./1#')%6"1()"$#+%#!"&'#($#-""+#+!,$#;%.&8#a%2"7")0#%()#
4($,/"$$#,$#$(4@"6+#+%#7.),%($#6%/[,6+$#%*#,/+")"$+8#S%)#"<.-'&"0#,1".$#./1#$(;;"$+,%/$#*%)#2!,6!#,/7"$+-"/+#')%1(6+$#$!%(&1#4"#"7.&(.+"1#43#U9=:#6%-"#*)%-#.#7.),"+3#%*#$%()6"$0#,/6&(1,/;#%()#=%);./#
>+./&"3#?".&+!#=./.;"-"/+#S,/./6,.&#:17,$%)$#./1#+!",)#1,)"6+#%)#,/1,)"6+#-./.;")$0#./1#%+!")#4($,/"$$#'")$%/$#2,+!,/#=%);./#>+./&"3#?".&+!#=./.;"-"/+#%)#,+$#.b&,.+"$8#>(6!#'")$%/$#-.3#!.7"#./#
%/;%,/;#4($,/"$$#)"&.+,%/$!,'#2,+!#6")+.,/#,/7"$+-"/+#-./.;")$#%)#-(+(.&#*(/1#6%-'./,"$#2!")"43#+!"30#=%);./#>+./&"3#?".&+!#=./.;"-"/+#%)#,+$#.b&,.+"$#)"6",7"#6%-'"/$.+,%/#*)%-0#%)#
%+!")2,$"#)"&.+"1#+%0#+!%$"#,/7"$+-"/+#-./.;")$#%)#-(+(.&#*(/1$8#S%)#"<.-'&"0#.#S,/./6,.&#:17,$%)#-.3#$(;;"$+#+!.+#U9=:#"7.&(.+"$#./#,/7"$+-"/+#-./.;")#%)#*(/1#,/#2!,6!#.#'%)+,%/#%*#!,$#%)#!")#
6&,"/+$I#.$$"+$#.)"#.&)".13#,/7"$+"18#?!,&"#$(6!#.#)"6%--"/1.+,%/#,$#'")-,$$,4&"0#U9=:#,$#)"$'%/$,4&"#*%)#+!"#%',/,%/$#"<')"$$"1#43#U9=:8#>""#+!"#6%/[,6+$#%*#,/+")"$+#$"6+,%/#,/#+!"#.''&,6.4&"#S%)-#
:NO#N,$6&%$()"#N%6(-"/+#*%)#=%);./#>+./&"3#?".&+!#=./.;"-"/+#*%)#.#1,$6($$,%/#%*#%+!")#+3'"$#%*#6%/[,6+$#+!.+#-.3#4"#)"&"7./+#+%#U9=:I$#"7.&(.+,%/#%*#-./.;")$#./1#*(/1$8#9/#.11,+,%/0#=%);./#
>+./&"3#?".&+!#=./.;"-"/+0#=>#T#F%80#-./.;")$#./1#+!",)#.b&,.+"$#')%7,1"#.#7.),"+3#%*#$")7,6"$#A,/6&(1,/;#)"$".)6!0#4)%D").;"0#.$$"+#-./.;"-"/+0#+).1,/;0#&"/1,/;#./1#,/7"$+-"/+#4./D,/;#$")7,6"$B#
*%)#".6!#%+!")#./1#*%)#7.),%($#6&,"/+$0#,/6&(1,/;#,$$(")$#%*#$"6(),+,"$#+!.+#-.3#4"#)"6%--"/1"1#*%)#'()6!.$"#%)#$.&"#43#6&,"/+$#%)#.)"#%+!")2,$"#!"&1#,/#6&,"/+#.66%(/+$# 0#./1#-./.;")$#,/#7.),%($#.17,$%)3#
')%;).-$8#=%);./#>+./&"3#?".&+!#=./.;"-"/+0#-./.;")$0#=>#T#F%80#./1#+!",)#.b&,.+"$#)"6",7"#6%-'"/$.+,%/#./1#*""$#,/#6%//"6+,%/#2,+!#+!"$"#$")7,6"$8#=%);./#>+./&"3#?".&+!#=./.;"-"/+#
4"&,"7"$#+!.+#+!"#/.+()"#./1#)./;"#%*#6&,"/+$#+%#2!,6!#$(6!#$")7,6"$#.)"#)"/1")"1#,$#$(6!#+!.+#,+#2%(&1#4"#,/.17,$.4&"#+%#"<6&(1"#6.+";%),6.&&3#.&&#%*#+!"$"#6%-'./,"$#*)%-#./#.66%(/+ 8
=%);./#>+./&"3#6!.);"$#".6!#*(/1#*.-,&3#2"#%5")#.#-(+(.&#*(/1#$(''%)+#*""0#.&$%#6.&&"1#.#M)"7"/("R$!.),/;#'.3-"/+0P#%/#6&,"/+#.66%(/+#!%&1,/;$#,/#*(/1#*.-,&,"$#.66%)1,/;#+%#.#+,")"1#).+"#+!.+#
,/6)".$"$#.&%/;#2,+!#+!"#-./.;"-"/+#*""#%*#+!"#*(/1#$%#+!.+#&%2")#-./.;"-"/+#*""#*(/1$#'.3#&%2")#).+"$#+!./#+!%$"#2,+!#!,;!")#-./.;"-"/+#*""$8
Y7")&.3#=./.;")$#%)#G<"6(+,/;#>(4R=./.;")$#AM-./.;")$PB#,/#$%-"#%*#=%);./#>+./&"3I$#>"'.).+"&3#=./.;"1#:66%(/+#AM>=:PB#')%;).-$#-.3#.5"6+#+)./$.6+,%/$#+!)%(;!#4)%D")R1".&")$#%+!")#+!./#
=%);./#>+./&"3#%)#%()#.b&,.+"$8##9*#3%()#-./.;")#+).1"$#2,+!#./%+!")#K)-0#3%(#-.3#4"#.$$"$$"1#6%$+$#43#+!"#%+!")#K)-#,/#.11,+,%/#+%#=%);./#>+./&"3I$#*""$8## !%$"#6%$+$#2,&"#,/6&(1"1#,/#+!"#/"+#
'),6"#%*#+!"#$"6(),+30#/%+#$"'.).+"&3#)"'%)+"1#%/#+).1"#6%/K)-.+,%/$#%)#.66%(/+#$+.+"-"/+$8##F")+.,/#-./.;")$#!.7"#!,$+%),6.&&3#1,)"6+"1#-%$+0#,*#/%+#.&&0#%*#+!",)#+).1"$#+%#%(+$,1"#K)-$8##9/*%)-.+,%/#
')%7,1"1#43#-./.;")$#6%/6")/,/;#+).1"#"<"6(+,%/#.2.3#*)%-#=%);./#>+./&"3#,$#$(--.),l"1#.+V#2228-%);./$+./&"386%-Q2".&+!Q,/7"$+-"/+$%&(+,%/$Q'1*$Q.17Q$%+)"$'%/$"8'1*8##S%)#-%)"#
,/*%)-.+,%/#%/#+).1,/;#./1#6%$+$0#'&".$"#)"*")#+%#+!"#:NO#C)%6!()"#*%)#3%()#')%;).-A$B0#.7.,&.4&"#.+#2228-%);./$+./&"386%-Q:NO0#%)#6%/+.6+#3%()#S,/./6,.&#:17,$%)QL),7.+"#?".&+!#:17,$%)8
!"#$%"&'("

5!%0/1*"&P!<"&HQ%&@%A*0(.*%(&R**10O& !"#-%1"&#'%)+*%&,%$#./1#$+).+";,"$#1,$6($$"1#,/#+!"#-.+"),.&#.)"#*%)-(&.+"1#4.$"1#%/#;"/").&,"/+#6!.).6+"),$+,6$#,/6&(1,/;#),$D#+%&")./6" 8# !,$#-.+"),.&#,$#/%+#
,/+"/1"1#+%#4"#./#./.&3$,$#%*#2!"+!")#'.)+,6(&.)#,/7"$+-"/+$#%)#$+).+";,"$#.)"#.'')%'),.+"#*%)#3%(#%)#.#)"6%--"/1.+,%/0#%)#./#%5")#+%#'.)+,6,'.+"#,/#./3#,/7"$+-"/+8# !")"*%)"0#6&,"/+$#$!%(&1#/%+#($"#
+!,$#')%K&"#.$#+!"#$%&"#4.$,$#*%)#,/7"$+-"/+#1"6,$,%/$8# !"3#$!%(&1#6%/$,1")#.&&#)"&"7./+#,/*%)-.+,%/0#,/6&(1,/;#+!",)#"<,$+,/;#'%)+*%&,%0#,/7"$+-"/+#%4@"6+,7"$0#),$D#+%&")./6"0#&,J(,1,+3#/""1$#./1#
,/7"$+-"/+#+,-"#!%),l%/8#>(6!#.#1"+")-,/.+,%/#-.3#&".1#+%#.$$"+#.&&%6.+,%/#)"$(&+$#+!.+#.)"#-.+"),.&&3#1,5")"/+#*)%-#+!"#.$$"+#.&&%6.+,%/#$!%2/#,/#+!,$#')%K&"8# .&D#+%#3%()#S,/./6,.&#:17,$%)#.4%(+#2!.+#
2%(&1#4"#./#.'')%'),.+"#.$$"+#.&&%6.+,%/#*%)#3%(0#2!"+!")#FUF=#,$#./#.'')%'),.+"#')%;).-#*%)#3%(8
R!&!7)/#$(/!%&(!&%!(/2+&i#=%);./#>+./&"3#?".&+!#=./.;"-"/+#!.$#/%#%4&,;.+,%/#+%#/%+,*3#3%(#2!"/#+!"#-%1"&#'%)+*%&,%$0#$+).+";,"$0#%)#./3#%+!")#,/*%)-.+,%/0#,/#+!,$#-.+"),.!./;"$8
J)*$0*&=!%0/1*"&(-*&/%A*0(.*%(&!7S*=(/A*06&"/0806&2**06&$%1&=-$"#*0&$%1&*TF*%0*0&!2&.<(<$)&2<%106&UGE06&=)!0*1&*%1&2<%106&<%/(&/%A*0(.*%(&("<0(06&$%1&A$"/$7)*&/%0<"$%=*&F"!1<=(0&=$"*2<))+&
7*2!"*&/%A*0(/%#;&G-*&F"!0F*=(<0&=!%($/%0&(-/0&$%1&!(-*"&/%2!".$(/!%&$7!<(&*$=-&2<%1;&G!&!7($/%&$&F"!0F*=(<06&=!%($=(&+!<"&E/%$%=/$)&B1A/0!"&!"&J"/A$(*&,*$)(-&B1A/0!"&!"&A/0/(&(-*& !"#$%&
'($%)*+&Q*70/(*&$(&QQQ;.!"#$%0($%)*+;=!.;&J)*$0*&"*$1&/(&=$"*2<))+&7*2!"*&/%A*0(/%#;
!"#!$%&'(%!'"#!")"(*!%+"(),-%'"./!0"#&"!*'"#!&/,%0"*,"1/),)!'%%0"2+"'3%"4%0%,)5"6%7*&#'"8!&/,)!9%":*,7*,)'#*!"*,")!+"*'3%,"1*$%,!(%!'")1%!9+;" 5'3*/13"'3%"4/!0"&%%-&"'*"7,%&%,$%"'3%"$)5/%"*."
+*/,"#!$%&'(%!'")'"<=;>>"7%,"&3),%?"#'"#&"7*&%"'*"5*&%"(*!%+"2+"#!$%&'#!1"#!"'3%"./!0;
!"#+3'"#%*#-(+(.&#*(/1$#./1#G S$#1,$6($$"1#,/#+!,$#')"$"/+.+,%/#(+,&,l"$#/%/+).1,+,%/.&#%)#6%-'&"<#,/7"$+-"/+#$+).+";,"$#./1Q%)#1"),7.+,7"$8#G<.-'&"$#%*#+!"$"#+3'"$#%*#*(/1$#,/6&(1"#+!%$"#+!.+#(+,&,l"#
%/"#%)#-%)"#%*#+!"#4"&%2#/%+"1#,/7"$+-"/+#$+).+";,"$#%)#6.+";%),"$#%)#2!,6!#$""D#"<'%$()"#+%#+!"#*%&&%2,/;#-.)D"+$V#A\B#6%--%1,+,"$#A" 8;80#.;),6(&+().&0#"/");3#./1#-"+.&$B0#6())"/630#')"6,%($#-"+.&$H#
A_B#-./.;"1#*(+()"$H#AjB#&"7").;"10#,/7")$"#%)#,/7")$"#&"7").;"1H#A]B#4".)#-.)D"+0#!"1;,/;0#&%/;R$!%)+#"J(,+30#-.)D"+#/"(+).&H#AfB#)".&#"$+.+"H#AgB#7%&.+,&,+3#A$""D,/;#"<'%$()"#+%#+!"#FCYG#O9m#9/1"<B8#
9/7"$+%)$#$!%(&1#D""'#,/#-,/1#+!.+#2!,&"#-(+(.&#*(/1$#./1#G S$#-.30#.+#+,-"$0#(+,&,l"#/%/+).1,+,%/.&#,/7"$+-"/+#%'+,%/$#./1#$+).+";,"$0#+!"3#$!%(&1#/%+#4"#"J(.+"1#2,+!#(/)";,$+")"1#'),7.+"&3#%5")"1#
.&+")/.+,7"#,/7"$+-"/+$8#C"6.($"#%*#)";(&.+%)3#&,-,+.+,%/$0#-(+(.&#*(/1$#./1#G S$#+!.+#$""D#.&+")/.+,7"R&,D"#,/7"$+-"/+#"<'%$()"#-($+#(+,&,l"#.#-%)"#&,-,+"1#,/7"$+-"/+#(/,7")$"8#:$#.#)"$(&+0#
,/7"$+-"/+#)"+()/$#./1#'%)+*%&,%#6!.).6+"),$+,6$#%*#.&+")/.+,7"#-(+(.&#*(/1$#./1#G S$#-.3#7.)3#*)%-#+).1,+,%/.&#!"1;"#*(/1$#'()$(,/;#$,-,&.)#,/7"$+-"/+#%4@"6+,7"$8#=%)"%7")0#+).1,+,%/.&#!"1;"#*(/1$#
!.7"#&,-,+"1#&,J(,1,+3#2,+!#&%/;#M&%6DR('P#'"),%1$#.&&%2,/;#+!"-#+%#'()$("#,/7"$+-"/+#$+).+";,"$#2,+!%(+#!.7,/;#+%#*.6+%)#,/#+!"#/""1#+%#-""+#6&,"/+#)"1"-'+,%/$#./1#G S$#+).1"#%/#./#"<6!./;" 8#Y/#+!"#
%+!")#!./10#-(+(.&#*(/1$#+3',6.&&3#-($+#-""+#1.,&3#6&,"/+#)"1"-'+,%/$8# !,$#1,5"),/;#&,J(,1,+3#')%K&"#6./#!.7"#.#-.+"),.&#,-'.6+#%/#+!"#,/7"$+-"/+#)"+()/$#;"/").+"1#43#.#-(+(.&#*(/1#%)#G S#'()$(,/;#
./#.&+")/.+,7"#,/7"$+,/;#$+).+";3#6%-'.)"1#2,+!#.#+).1,+,%/.&#!"1;"#*(/1#'()$(,/;#+!"#$.-"#$+).+";38
W%/+).1,+,%/.&#,/7"$+-"/+#%'+,%/$#./1#$+).+";,"$#.)"#%*+"/#"-'&%3"1#43#.#'%)+*%&,%#-./.;")#+%#*()+!")#.#*(/1I$#,/7"$+-"/+#%4@"6+,7"#./1#+%#!"&'#%5$"+#-.)D"+#),$D$ 8#a%2"7")0#+!"$"#*".+()"$#-.3#4"#
6%-'&"<0#-.D,/;#,+#-%)"#1,b6(&+#+%#(/1")$+./1#+!"#*(/1I$#"$$"/+,.!.).6+"),$+,6$#./1#),$D$0#./1#!%2#,+#2,&&#'")*%)-#,/#1,5")"/+#-.)D"+#"/7,)%/-"/+$#./1#%7")#7.),%($#'"),%1$#%*#+,-"8# !"3#-.3#.&$%#
"<'%$"#+!"#*(/1#+%#,/6)".$"1#7%&.+,&,+3#./1#(/./+,6,'.+"1#),$D$#'.)+,6(&.)&3#2!"/#($"1#,/#6%-'&"<#6%-4,/.+,%/$#./1Q%)#.66%-'./,"1#43#+!"#($"#%*#4%))%2,/;#%)#M&"7").;"8P
!"#=%);./#>+./&"3#=%4,&"#:''#,$#6())"/+&3#.7.,&.4&"#*%)#,L!%/"n#./1#,L.1n#*)%-#+!"#:''#>+%)"n#./1#:/1)%,1o#%/#U%%;&"#L&.3o8#>+./1.)1#-"$$.;,/;#./1#1.+.#).+"$#*)%-#3%()#')%7,1")#-.3#.''&38#
>(4@"6+#+%#1"7,6"#6%//"6+,7,+38
:''&"n0#+!"#:''&"#&%;%0#,L!%/"n0#,L.1n0#./1#,L.1#:,)n#.)"#+).1"-.)D$#%*#:''&"#9/680#)";,$+")"1#,/#+!"#c>#./1#%+!")#6%(/+),"$8#:''&"#L.3o#./1#,L.1#-,/,o#.)"#+).1"-.)D$#%*#:''&"#9/68#:''#>+%)"#,$#.#
$")7,6"#-.)D#%*#:''&"#9/68#:/1)%,1#./1#U%%;&"#L&.3#.)"#+).1"-.)D$#%*#U%%;&"#9/68
!"#=%);./#>+./&"3#N,;,+.&#O.(&+#ApN,;,+.&#O.(&+pB#,$#.66"$$,4&"#+%#6&,"/+$#2,+!#1"1,6.+"1#S,/./6,.&#:17,$%)$8#N%6(-"/+$#$!.)"1#7,.#+!"#N,;,+.&#O.(&+#$!%(&1#4"#&,-,+"1#+%#+!%$"#)"&"7./+#+%#3%()#=%);./#
>+./&"3#.66%(/+#)"&.+,%/$!,'8#c'&%.1,/;#.#1%6(-"/+#+%#+!"#N,;,+.&#O.(&+#1%"$#/%+#%4&,;.+"#($#+%#)"7,"2#%)#+.D"#./3#.6+,%/#%/#,+0#./1#2"#2,&&#/%+#4"#&,.4&"#*%)#./3#*.,&()"#+%#.6+#('%/#+!"#6%/+"/+$#%*#$(6!#
1%6(-"/+8#L&".$"#6%/+.6+#3%()#S,/./6,.&#:17,$%)#%)#C)./6!#=./.;"-"/+#+%#1,$6($$#+!"#.'')%'),.+"#')%6"$$#*%)#')%7,1,/;#+!"#1%6(-"/+#+%#($#*%)#)"7,"28#9*#3%(#-.,/+.,/#.# )($+#%)#"/+,+3#.66%(/+#2,+!#
($0#%/&3#%()#6")+,K6.+,%/#*%)-#2,&&#;%7")/#%()#%4&,;.+,%/$#*%)#$(6!#.66%(/+8#L&".$"#)"*")#+%#+!"#=%);./#>+./&"3#N,;,+.&#O.(&+#+")-$#./1#6%/1,+,%/$#*%)#-%)"#,/*%)-.+,%/8
9/*%)-.+,%/#)"&.+"1#+%#3%()#"<+")/.&#.66%(/+$#,$#')%7,1"1#*%)#,/*%)-.+,%/.&#'()'%$"$#%/&38#9+#,$#')%7,1"1#43#+!,)1#'.)+,"$0#,/6&(1,/;#+!"#K/./6,.&#,/$+,+(+,%/$#2!")"#3%()#"<+")/.&#.66%(/+$#.)"#!"&18#
=%);./#>+./&"3#1%"$#/%+#7"),*3#+!.+#+!"#,/*%)-.+,%/#,$#.66().+"#./1#-.D"$#/%#)"')"$"/+.+,%/#%)#2.))./+3#.$#+%#,+$#.66().630#+,-"&,/"$$0#%)#6%-'&"+"/"$$8#:11,+,%/.&#,/*%)-.+,%/#.4%(+#+!"#*".+()"$#./1#
$")7,6"$#%5")"1#+!)%(;!# %+.&#?".&+!#O,"2#.)"#.7.,&.4&"#%/#+!"# %+.&#?".&+!#O,"2#$,+"#%/#=%);./#>+./&"3#Y/&,/"#./1#.&$%#,/#+!"# %+.&#?".&+!#O,"2# ")-$#./1#F%/1,+,%/$#%*#c$" 8
!"#$%"&'("

=%4,&"#6!"6D#1"'%$,+$#.)"#$(4@"6+#+%#6")+.,/#+")-$#./1#6%/1,+,%/$8#F!"6D$#-($+#4"#1).2/#%/#.#c8>8#C./D8
>"/1#=%/"3#2,+!#q"&&"n#,$#.7.,&.4&"#%/#+!"#=%);./#>+./&"3#=%4,&"#:''#*%)#,L!%/"#./1#:/1)%,1#./1#%/#=%);./#>+./&"3#Y/&,/"8#G/)%&&-"/+#,$#)"J(,)"1#./1#1%&&.)#./1#*)"J("/63#&,-,+$#-.3#.''&38#
N%-"$+,6#*(/1#+)./$*")$#-($+#4"#-.1"#*)%-#./#"&,;,4&"#.66%(/+#.+#=%);./#>+./&"3#>-,+!#C.)/"3#EEF#A=%);./#>+./&"3B#+%#.#c>R4.$"1#.66%(/+#.+#./%+!")#K/./6,.&#,/$+,+(+,%/8#=%);./#>+./&"3#
-.,/+.,/$#.))./;"-"/+$#2,+!#rL#=%);./#F!.$"#C./D0#W8:8#./1#c=C#C./D0#W8:8#.$#W:Fa:R'.)+,6,'.+,/;#1"'%$,+%)3#K/./6,.&#,/$+,+(+,%/$#*%)#+!"#')%6"$$,/;#%*#+)./$*")$#%/#q"&&"n8#N.+.#6%//"6+,%/#
)"J(,)"10#./1#-"$$.;"#./1#1.+.#).+"$#-.3#.''&30#,/6&(1,/;#+!%$"#*)%-#3%()#6%--(/,6.+,%/$#$")7,6"#')%7,1")8#=($+#!.7"#./#"&,;,4&"#.66%(/+#,/#+!"#c8>8#+%#($"#q"&&"n8# )./$.6+,%/$#+3',6.&&3#%66()#,/#
-,/(+"$#2!"/#+!"#)"6,',"/+I$#"-.,&#.11)"$$#%)#c8>8#-%4,&"#/(-4")#,$#.&)".13#"/)%&&"1#2,+!#q"&&"8#>""#+!"#=%);./#>+./&"3#>"/1#=%/"3#2,+!#q"&&"n#+")-$#*%)#1"+.,&$8
q"&&"#./1#+!"#q"&&"#)"&.+"1#-.)D$#.)"#2!%&&3#%2/"1#43#G.)&3#?.)/,/;#>")7,6"$0#EEF#./1#.)"#($"1#!")",/#(/1")#&,6"/$"8#=%);./#>+./&"3#,$#/%+#.b&,.+"1#2,+!#q"&&"n8
G&"6+)%/,6#'.3-"/+$#.)),7"#+%#+!"#'.3""#2,+!,/#\R_#4($,/"$$#1.3$0#6!"6D#'.3-"/+$#.)),7"#+%#+!"#'.3""#2,+!,/#f#4($,/"$$#1.3$8#>.-"R1.3#./1#%7")/,;!+#'.3-"/+$#.)"#.7.,&.4&"#*%)#./#.11,+,%/.&#*""#
2,+!,/#+!"#.7.,&.4&"#'.3-"/+#+,-"*).-"$8
VUP&B''UG&54B''&5HR'@>UWBG@HR'&BR>&HGXUW&W@'V'
9/7"$+,/;#,/#+!"#-.)D"+$#"/+.,&$#+!"#),$D#%*#-.)D"+#7%&.+,&,+38# !"#7.&("#%*#.&&#+3'"$#%*#,/7"$+-"/+$0#,/6&(1,/;#$+%6D$0#-(+(.&#*(/1$0#"<6!./;"R+).1"1#*(/1$#AMG S$PB0#6&%$"1R"/1#*(/1$0#./1#(/,+#
,/7"$+-"/+#+)($+$0#-.3#,/6)".$"#%)#1"6)".$"#%7")#7.)3,/;#+,-"#'"),%1$8# %#+!"#"<+"/+#+!"#,/7"$+-"/+$#1"',6+"1#!")",/#)"')"$"/+#/%(*"%$(/!%$)&0*=<"/(/*00#3%(#$!%(&1#4"#.2.)"#+!.+#+!")"#-.3#4"#
.11,+,%/.&#),$D$#.$$%6,.+"1#2,+!#,/+")/.+,%/.&#,/7"$+,/;0#,/6&(1,/;#*%)",;/#"6%/%-,60#'%&,+,6.&0#-%/"+.)3#./1Q%)#&";.&#*.6+%)$0#6!./;,/;#6())"/63#"<6!./;"#).+"$0#*%)",;/#+.<"$0#./1#1,5")"/6"$#,/#
K/./6,.&#./1#.66%(/+,/;#$+./1.)1$8# !"$"#),$D$#-.3#4"#-.;/,K"1#,/#*.*"#/%#&.$"8*(0&$%1&2"!%(/*"&.$"8*(08#'.$))9&$%1&./19=$F/($)/Y$(/!%&=!.F$%/*0&-.3#&.6D#+!"#K/./6,.&#)"$%()6"$0#')%1(6+#
1,7")$,K6.+,%/#./1#6%-'"+,+,7"#$+)"/;+!$#%*#&.);")#6%-'./,"$8#9/#.11,+,%/0#+!"#$"6(),+,"$#%*#$-.&&R#./1#-,1R6.',+.&,l.+,%/#6%-'./,"$#-.3#/%+#+).1"#.$#)".1,&3#.$0#./1#4"#$(4@"6+#+%#!,;!")#7%&.+,&,+3#+!./0#
+!%$"#%*#&.);")0#-%)"#"$+.4&,$!"1#6%-'./,"$8# !"#7.&("#%*#ZT*1&/%=!.*&0*=<"/(/*0&2,&&#[(6+(.+"#./10#('%/#.#$.&"0#-.3#4"#2%)+!#-%)"#%)#&"$$#+!./#+!",)#%),;,/.%$+#%)#-.+(),+3#7.&("8#C%/1$#.)"#$(4@"6+#
+%#,/+")"$+#).+"#),$D0#6.&&#),$D0#)",/7"$+-"/+#),$D0#&,J(,1,+3#),$D0#./1#6)"1,+#),$D#%*#+!"#,$$(")8#X/#-&+/*)1&7!%10&.)"#$(4@"6+#+%#.11,+,%/.&#),$D$#$(6!#.$#,/6)".$"1#),$D#%*#1"*.(&+#./1#;)".+")#7%&.+,&,+3#4"6.($"#
%*#+!"#&%2")#6)"1,+#J(.&,+3#%*#+!"#,$$("$8#9/#+!"#6.$"#%*#.<%/=/F$)&7!%100#,/6%-"#,$#;"/").&&3#"<"-'+#*)%-#*"1").&#,/6%-"#+.<"$8#>%-"#,/6%-"#-.3#4"#$(4@"6+#+%#$+.+"#./1#&%6.&#+.<"$#./1#+%#+!"#*"1").&#
.&+")/.+,7"#-,/,-(-#+.<8#F.',+.&#;.,/$0#,*#./30#.)"#$(4@"6+#+%#+.<8#G"*$0<"+&@%N$(/!%&J"!(*=(/!%&'*=<"/(/*0[&CG@J'D&6%('%/#'.3-"/+$#./1#(/1")&3,/;#'),/6,'.&#.)"#.(+%-.+,6.&&3#,/6)".$"1#+%#
6%-'"/$.+"#*%)#,/[.+,%/#43#+).6D,/;#+!"#6%/$(-")#'),6"#,/1"<#AFL9B8#?!,&"#+!"#)".&#).+"#%*#)"+()/#,$#;(.)./+""10# 9L>#+"/1#+%#%5")#.#&%2#)"+()/8#C"6.($"#+!"#)"+()/#%*# 9L>#,$#&,/D"1#+%#,/[.+,%/0# 9L>#
-.3#$,;/,K6./+&3#(/1")'")*%)-#7")$($#6%/7"/+,%/.&#c8>8# )".$(),"$#,/#+,-"$#%*#&%2#,/[.+,%/8# !")"#,$#/%#;(.)./+""#+!.+#,/7"$+%)$#2,&&#)"6",7"#'.)#,*# 9L>#.)"#$%&1#'),%)#+%#-.+(),+38# !"#)"+()/$#%/#.#
'%)+*%&,%#6%/$,$+,/;#'),-.),&3#%*#*%A/"!%.*%($)6&0!=/$)6&$%1&#!A*"%$%=*9$Q$"*&/%A*0(.*%(0&C\U'?]D&-.3#4"#&%2")#%)#!,;!")#+!./#.#'%)+*%&,%#+!.+#,$#-%)"#1,7")$,K"1#%)#2!")"#1"6,$,%/$#.)"#4.$"1#
$%&"&3#%/#,/7"$+-"/+#6%/$,1").+,%/$8#C"6.($"#G>U#6),+"),.#"<6&(1"#$%-"#,/7"$+-"/+$0#,/7"$+%)$#-.3#/%+#4"#.4&"#+%#+.D"#.17./+.;"#%*#+!"#$.-"#%''%)+(/,+,"$#%)#-.)D"+#+)"/1$#.$#,/7"$+%)$#+!.+#1%#/%+#
($"#$(6!#6),+"),.8# !"#6%-'./,"$#,1"/+,K"1#./1#,/7"$+-"/+#"<.-'&"$#.)"#*%)#,&&($+).+,7"#'()'%$"$#%/&3#./1#$!%(&1#/%+#4"#1""-"1#.#)"6%--"/1.+,%/#+%#'()6!.$" 0#!%&1#%)#$"&&#./3#$"6(),+,"$#%)#
,/7"$+-"/+#')%1(6+$8# !"3#.)"#,/+"/1"1#+%#1"-%/$+).+"#+!"#.'')%.6!"$#+.D"/#43#-./.;")$#2!%#*%6($#%/#G>U#6),+"),.#,/#+!",)#,/7"$+-"/+#$+).+";38# !")"#6./#4"#/%#;(.)./+""#+!.+#.#6&,"/+s$#.66%(/+#
2,&"#-./.;"1#.$#1"$6),4"1#!")",/8#HF(/!%0&./1#-.);,/#+).1,/;#,/7%&7"#$(4$+./+,.&#),$D#./1#.)"#/%+#.'')%'),.+"#*%)#.&&#,/7"$+%)$8#C"$,1"$#+!"#;"/").&#,/7"$+-"/+#),$D#%*#!%&1,/;#$"6(),+,"$#+!.+#-.3#
1"6&,/"#,/#7.&("#./1#+!"#'%$$,4&"#&%$$#%*#'),/6,'.&#,/7"$+"10#=)!0*19*%1&2<%10&-.3#!.7"#.11,+,%/.&#),$D$#)"&.+"1#+%#1"6&,/,/;#-.)D"+#'),6"$#)"&.+,7"#+%#/"+#.$$"+#7.&("$#AW:O$B0#.6+,7"#-./.;")#
(/1")'")*%)-./6"#./1#'%+"/+,.&#&"7").;"8#F&%$"1R"/1#*(/1$0#(/&,D"#%'"/R"/1#*(/1$0#.)"#/%+#6%/+,/(%($&3#%5")"18# !")"#,$#.#%/"R+,-"#'(4&,6#%5"),/;#./1#%/6"#,$$("10#$!.)"$#%*#6&%$"1R"/1#*(/1$#.)"#
$%&1#,/#+!"#%'"/#-.)D"+#+!)%(;!#.#$+%6D#"<6!./;"8#W:O#,$#+%+.&#.$$"+$#&"$$#+%+.&#&,.4,&,+,"$#1,7,1"1#43#+!"#/(-4")#%*#$!.)"$#%(+$+./1,/;8#:+#+!"#+,-"#./#,/7"$+%)#'()6!.$"$#$!.)"$#%*#.#6&%$"1R"/1#*(/10#
$!.)"$#-.3#!.7"#.#-.)D"+#'),6"#+!.+#,$#.4%7"#%)#4"&%2#W:O8#L%)+*%&,%$#+!.+#,/7"$+#.#&.);"#'")6"/+.;"#%*#.$$"+$#,/#%/&3#%/"#,/1($+)3#0*=(!"&A%)#,/#%/&3#.#*"2#$"6+%)$B#.)"#-%)"#7(&/").4&"#+%#'),6"#
[(6+(.+,%/#+!./#+!%$"#+!.+#1,7")$,*3#.-%/;#.#4)%.1#)./;"#%*#$"6+%)$8
B)(*"%$(/A*&/%A*0(.*%(0&%*+"/#.)"#$'"6(&.+,7"#./1#,/6&(1"#.#!,;!#1";)""#%*#),$D8#9/7"$+%)$#6%(&1#&%$"#.&&#%)#.#$(4$+./+,.&#.-%(/+#%*#+!",)#,/7"$+-"/+8#:&+")/.+,7"#,/7"$+-"/+$#.)"#.'')%'),.+"#%/&3#*%)#
"&,;,4&"0#&%/;R+")-#,/7"$+%)$#2!%#.)"#2,&&,/;#+%#*%);%#&,J(,1,+3#./1#'(+#6.',+.&#.+#),$D#*%)#./#,/1"K/,+"#'"),%1#%*#+,-"8# !"3#-.3#4"#!,;!&3#,&&,J(,1#./1#6./#"/;.;"#,/#&"7").;"#./1#%+!")#$'"6(&.+,7"#
').6+,6"$#+!.+#-.3#,/6)".$"#+!"#7%&.+,&,+3#./1#),$D#%*#&%$$8#:&+")/.+,7"#9/7"$+-"/+$#+3',6.&&3#!.7"#!,;!")#*""$#+!./#+).1,+,%/.&#,/7"$+-"/+$8#9/7"$+%)$#$!%(&1#6.)"*(&&3#)"7,"2#./1#6%/$,1")#'%+"/+,.&#),$D$#
4"*%)"#,/7"$+,/;8#F")+.,/#%*#+!"$"#),$D$#-.3#,/6&(1"#4(+#.)"#/%+#&,-,+"1#+%V#E%$$#%*#.&&#%)#.#$(4$+./+,.&#'%)+,%/#%*#+!"#,/7"$+-"/+#1("#+%#&"7").;,/;0#$!%)+R$"&&,/;0#%)#%+!")#$'"6(&.+,7"#').6+,6"$H#E.6D#%*#
&,J(,1,+3#,/#+!.+#+!")"#-.3#4"#/%#$"6%/1.)3#-.)D"+#*%)#.#*(/1H#O%&.+,&,+3#%*#)"+()/$H#`"$+),6+,%/$#%/#+)./$*")),/;#,/+")"$+$#,/#.#*(/1H#L%+"/+,.&#&.6D#%*#1,7")$,K6.+,%/#./1#)"$(&+,/;#!,;!")#),$D#1("#+%#
6%/6"/+).+,%/#%*#+).1,/;#.(+!%),+3#2!"/#.#$,/;&"#.17,$%)#,$#(+,&,l"1H#:4$"/6"#%*#,/*%)-.+,%/#)";.)1,/;#7.&(.+,%/$#./1#'),6,/;H#F%-'&"<#+.<#$+)(6+()"$#./1#1"&.3$#,/#+.<#)"'%)+,/;H#E"$$#)";(&.+,%/#./1#
!,;!")#*""$#+!./#-(+(.&#*(/1$H#`,$D$#.$$%6,.+"1#2,+!#+!"#%'").+,%/$0#'")$%//"&0#./1#')%6"$$"$#%*#+!"#-./.;")H#./1#`,$D$#.$$%6,.+"1#2,+!#634")$"6(),+38#:$#.#1,7")$,K"1#;&%4.&#K/./6,.&#$")7,6"$#K)-0#
=%);./#>+./&"3#?".&+!#=./.;"-"/+#"/;.;"$#,/#.#4)%.1#$'"6+)(-#%*#.6+,7,+,"$#,/6&(1,/;#K/./6,.&#.17,$%)3#$")7,6"$0#,/7"$+-"/+#-./.;"-"/+#.6+,7,+,"$0#$'%/$%),/;#./1#-./.;,/;#'),7.+"#,/7"$+-"/+#
!"#$%"&'("

*(/1$0#"/;.;,/;#,/#4)%D")R1".&")#+)./$.6+,%/$#./1#'),/6,'.&#$"6(),+,"$0#6%--%1,+,"$#./1#*%)",;/#"<6!./;"#+)./$.6+,%/$0#)"$".)6!#'(4&,6.+,%/0#./1#%+!")#.6+,7,+,"$8#9/#+!"#%)1,/.)3#6%()$"#%*#,+$#4($,/"$$0#
=%);./#>+./&"3#?".&+!#=./.;"-"/+#+!")"*%)"#"/;.;"$#,/#.6+,7,+,"$#2!")"#=%);./#>+./&"3#?".&+!#=./.;"-"/+I$#,/+")"$+$#-.3#6%/[,6+#2,+!#+!"#,/+")"$+$#%*#,+$#6&,"/+$# 0#,/6&(1,/;#+!"#'),7.+"#
,/7"$+-"/+#*(/1$#,+#-./.;"$8#=%);./#>+./&"3#?".&+!#=./.;"-"/+#6./#;,7"#/%#.$$()./6"#+!.+#6%/[,6+$#%*#,/+")"$+#2,&"#)"$%&7"1#,/#*.7%)#%*#,+$#6&,"/+$#%)#./3#$(6!#*(/18#:&&#"<')"$$,%/$#%*#%',/,%/#.)"#
$(4@"6+#+%#6!./;"#2,+!%(+#/%+,6"#./1#.)"#/%+#,/+"/1"1#+%#4"#.#*%)"6.$+#%*#*(+()"#"7"/+$#%)#)"$(&+$8#S()+!")0#%',/,%/$#"<')"$$"1#!")",/#-.3#1,5")#*)%-#+!"#%',/,%/$#"<')"$$"1#43#=%);./#>+./&"3#?".&+!#
=./.;"-"/+#./1Q%)#%+!")#4($,/"$$"$Q.b&,.+"$#%*#=%);./#>+./&"3#?".&+!#=./.;"-"/+8# !,$#,$#/%+#.#p)"$".)6!#)"'%)+p#.$#1"K/"1#43#S9W`:#`(&"#__]\#%)#.#p1"4+#)"$".)6!#)"'%)+p#.$#1"K/"1#43#S9W`:#
`(&"#__]_#./1#2.$#/%+#')"'.)"1#43#+!"#`"$".)6!#N"'.)+-"/+$#%*#=%);./#>+./&"3#>-,+!#C.)/"3#EEF#%)#=%);./#>+./&"3#T#F%8#EEF#%)#,+$#.b&,.+"$8#F")+.,/#,/*%)-.+,%/#6%/+.,/"1#!")",/#-.3#6%/$+,+(+"#
*%)2.)1R&%%D,/;#$+.+"-"/+$8#N("#+%#7.),%($#),$D$#./1#(/6")+.,/+,"$0#.6+(.&#"7"/+$0#)"$(&+$#%)#+!"#'")*%)-./6"#%*#.#*(/1#-.3#1,5")#-.+"),.&&3#*)%-#+!%$"#)"["6+"1#%)#6%/+"-'&.+"1#,/#$(6!#
*%)2.)1R&%%D,/;#$+.+"-"/+$8#F&,"/+$#$!%(&1#6.)"*(&&3#6%/$,1")#+!"#,/7"$+-"/+#%4@"6+,7"$0#),$D$0#6!.);"$0#./1#"<'"/$"$#%*#.#*(/1#4"*%)"#,/7"$+,/;8#?!,&"#+!"#aS`9#,/1,6"$#.)"#*)"J("/+&3#($"10#+!"3#!.7"#
&,-,+.+,%/$#A$%-"#%*#2!,6!#.)"#+3',6.&#%*#%+!")#2,1"&3#($"1#,/1,6"$B8# !"$"#&,-,+.+,%/$#,/6&(1"#$()7,7%)$!,'#4,.$#A+!"#)"+()/$#%*#+!"#,/1,6"$#-.3#/%+#4"#)"')"$"/+.+,7"#%*#.&&#+!"#!"1;"#*(/1$#,/#+!"#(/,7")$"#
4"6.($"#%*#+!"#+"/1"/63#%*#&%2")#'")*%)-,/;#*(/1$#+%#&".7"#+!"#,/1"<BH#!"+")%;"/",+3#A/%+#.&&#!"1;"#*(/1$#.)"#.&,D"#%)#6%-'.).4&"#+%#%/"#./%+!")0#./1#+!"#,/1"<#-.3#/%+#.66().+"&3#)"["6+#+!"#
'")*%)-./6"#%*#.#1"$6),4"1#$+3&"BH#./1#&,-,+"1#1.+.#A-./3#!"1;"#*(/1$#1%#/%+#)"'%)+#+%#,/1,6"$0#./1#+!"#,/1"<#-.3#%-,+#*(/1$0#+!"#,/6&($,%/#%*#2!,6!#-,;!+#$,;/,K6./+&3#.5"6+#+!"#'")*%)-./6"#$!%2/8#
!"#aS`9#,/1,6"$#.)"#4.$"1#%/#,/*%)-.+,%/#$"&*R)"'%)+"1#43#!"1;"#*(/1#-./.;")$#+!.+#1"6,1"#%/#+!",)#%2/0#.+#./3#+,-"0#2!"+!")#%)#/%+#+!"3#2./+#+%#')%7,1"0#%)#6%/+,/("#+%#')%7,1"0#,/*%)-.+,%/#+%#aS`#
:$$"+#=./.;"-"/+0#E8E8F8#`"$(&+$#*%)#*(/1$#+!.+#;%#%(+#%*#4($,/"$$#.)"#,/6&(1"1#,/#+!"#,/1"<#(/+,&#+!"#1.+"#+!.+#+!"3#6".$"#%'").+,%/$8# !")"*%)"0#+!"$"#,/1,6"$#-.3#/%+#4"#6%-'&"+"#%)#.66().+"#
)"')"$"/+.+,%/$#%*#+!"#!"1;"#*(/1#(/,7")$"0#./1#-.3#4"#4,.$"1#,/#$"7")..3$8#F%-'%$,+"#,/1"<#)"$(&+$#.)"#$!%2/#*%)#,&&($+).+,7"#'()'%$"$#./1#1%#/%+#)"')"$"/+#+!"#'")*%)-./6"#%*#.#$'"6,K6#
,/7"$+-"/+8#9/1,7,1(.&#*(/1$#!.7"#$'"6,K6#+.<#),$D$#)"&.+"1#+%#+!",)#,/7"$+-"/+#')%;).-$#+!.+#2,&.)3#*)%-#*(/1#+%#*(/18#F&,"/+$#$!%(&1#6%/$(&+#+!",)#%2/#+.<#./1#&";.&#.17,$%)$#.$#=%);./#>+./&"3#
?".&+!#=./.;"-"/+#1%"$#/%+#')%7,1"#+.<#%)#&";.&#.17,6"8#9/+")"$+$#,/#.&+")/.+,7"#,/7"$+-"/+#')%1(6+$#.)"#%5")"1#'()$(./+#+%#+!"#+")-$#%*#+!"#.''&,6.4&"#%5"),/;#-"-%)./1(-#0#.)"#1,$+),4(+"1#43#
=%);./#>+./&"3#?".&+!#=./.;"-"/+#./1#6")+.,/#%*#,+$#.b&,.+"$0#./1#A\B#.)"#/%+#SN9FR,/$()"10#A_B#.)"#/%+#1"'%$,+$#%)#%+!")#%4&,;.+,%/$#%*#=%);./#>+./&"3#?".&+!#=./.;"-"/+#%)#./3#%*#,+$#.b&,.+"$0#AjB#
.)"#/%+#;(.)./+""1#43#=%);./#>+./&"3#?".&+!#=./.;"-"/+#./1#,+$#.b&,.+"$0#./1#A]B#,/7%&7"#,/7"$+-"/+#),$D$0#,/6&(1,/;#'%$$,4&"#&%$$#%*#'),/6,'.&8#=%);./#>+./&"3#?".&+!#=./.;"-"/+#,$#.#)";,$+")"1#
4)%D")R1".&")0#/%+#.#4./D8# !,$#-.+"),.&#,$#/%+#+%#4"#)"')%1(6"1#%)#1,$+),4(+"1#+%#./3#%+!")#'")$%/$#A%+!")#+!./#')%*"$$,%/.&#.17,$%)$#%*#+!"#,/7"$+%)$#%)#')%$'"6+,7"#,/7"$+%)$# 0#.$#.''&,6.4&"0#)"6",7,/;#
+!,$#-.+"),.&B#./1#,$#,/+"/1"1#$%&"&3#*%)#+!"#($"#%*#+!"#'")$%/$#+%#2!%-#,+#!.$#4""/#1"&,7")"18# !,$#-.+"),.&#,$#/%+#*%)#1,$+),4(+,%/#+%#+!"#;"/").&#'(4&,68#L.$+#'")*%)-./6"#,$#/%#;(.)./+""#%*#*(+()"#
)"$(&+$8#:6+(.&#)"$(&+$#-.3#7.)38#>9LF#,/$()./6"#1%"$#/%+#.''&3#+%#')"6,%($#-"+.&$0#%+!")#6%--%1,+,"$0#%)#+).1,+,%/.&#.&+")/.+,7"#,/7"$+-"/+$8#9/#F%/$(&+,/;#U)%('I$#.17,$%)3#')%;).-$0#.&+")/.+,7"#
,/7"$+-"/+$#.)"#&,-,+"1#+%#c>R)";,$+")"1#-(+(.&#*(/1$0#$"'.).+"#.66%(/+#$+).+";,"$#./1#"<6!./;"R+).1"1#*(/1$#AG S$B#+!.+#$""D#+%#'()$("#.&+")/.+,7"#,/7"$+-"/+#$+).+";,"$#%)#)"+()/$#(+,&,l,/;#'(4&,6&3#
+).1"1#$"6(),+,"$8#9/7"$+-"/+#')%1(6+$#,/#+!,$#6.+";%)3#-.3#"-'&%3#7.),%($#,/7"$+-"/+#$+).+";,"$#./1#+"6!/,J("$#*%)#4%+!#!"1;,/;#./1#-%)"#$'"6(&.+,7"#'()'%$"$#$(6!#.$#$!%)+# R$"&&,/;0#&"7").;"0#
1"),7.+,7"$#./1#%'+,%/$0#2!,6!#6./#,/6)".$"#7%&.+,&,+3#./1#+!"#),$D#%*#,/7"$+-"/+#&%$$8#:&+")/.+,7"#,/7"$+-"/+$#.)"#/%+#.'')%'),.+"#*%)#.&&#,/7"$+%)$8#:$#.#1,7")$,K"1#;&%4.&#K/./6,.&#$")7,6"$#K)-0#=%);./#
>+./&"3#?".&+!#=./.;"-"/+#"/;.;"$#,/#.#4)%.1#$'"6+)(-#%*#.6+,7,+,"$#,/6&(1,/;#K/./6,.&#.17,$%)3#$")7,6"$0#,/7"$+-"/+#-./.;"-"/+#.6+,7,+,"$0#$'%/$%),/;#./1#-./.;,/;#'),7.+"#,/7"$+-"/+#*(/1$0#
"/;.;,/;#,/#4)%D")R1".&")#+)./$.6+,%/$#./1#'),/6,'.&#$"6(),+,"$0#6%--%1,+,"$#./1#*%)",;/#"<6!./;"#+)./$.6+,%/$0#)"$".)6!#'(4&,6.+,%/0#./1#%+!")#.6+,7,+,"$8#9/#+!"#%)1,/.)3#6%()$"#%*#,+$#4($,/"$$0#=%);./#
>+./&"3#?".&+!#=./.;"-"/+#+!")"*%)"#"/;.;"$#,/#.6+,7,+,"$#2!")"#=%);./#>+./&"3#?".&+!#=./.;"-"/+I$#,/+")"$+$#-.3#6%/[,6+#2,+!#+!"#,/+")"$+$#%*#,+$#6&,"/+$# 0#,/6&(1,/;#+!"#'),7.+"#,/7"$+-"/+#*(/1$#
,+#-./.;"$8#=%);./#>+./&"3#?".&+!#=./.;"-"/+#6./#;,7"#/%#.$$()./6"#+!.+#6%/[,6+$#%*#,/+")"$+#2,&"#)"$%&7"1#,/#*.7%)#%*#,+$#6&,"/+$#%)#./3#$(6!#*(/18#:&+")/.+,7"#,/7"$+-"/+$#,/7%&7"#6%-'&"<#+.<#
$+)(6+()"$0#+.<#,/"b6,"/+#,/7"$+,/;0#./1#1"&.3$#,/#1,$+),4(+,/;#,-'%)+./+#+.<#,/*%)-.+,%/8#9/1,7,1(.&#*(/1$#!.7"#$'"6,K6#),$D$#)"&.+"1#+%#+!",)#,/7"$+-"/+#')%;).-$#+!.+#2,&.)3#*)%-#*(/1#+%#*(/18#
F&,"/+$#$!%(&1#6%/$(&+#+!",)#%2/#+.<#./1#&";.&#.17,$%)$#.$#=%);./#>+./&"3#?".&+!#=./.;"-"/+#1%"$#/%+#')%7,1"#+.<#%)#&";.&#.17,6"8
:#-.@%),+3#%*#:&+")/.+,7"#9/7"$+-"/+#-./.;")$#)"7,"2"1#./1#$"&"6+"1#43#U9=:#'.3#%)#6.($"#+%#4"#'.,1#./#%/;%,/;#*""#*%)#1,$+),4(+,%/#*)%-#+!",)#-./.;"-"/+#*""$#+%#=%);./#>+./&"3#?".&+!#
=./.;"-"/+#,/#6%//"6+,%/#2,+!#=%);./#>+./&"3#?".&+!#=./.;"-"/+#6&,"/+$#+!.+#'()6!.$"#./#,/+")"$+#,/#./#:&+")/.+,7"#9/7"$+-"/+#./1#,/#$%-"#,/$+./6"$#'.3#+!"$"#*""$#%/#+!"#,/7"$+-"/+$#!"&1#43#
.17,$%)3#6&,"/+$8#=%);./#>+./&"3#?".&+!#=./.;"-"/+#)"4.+"$#$(6!#*""$#+!.+#.)"#)"6",7"1#./1#.++),4(+.4&"#+%#./#,/7"$+-"/+#!"&1#43#./#.17,$%)3#6&,"/+#./1#)"+.,/$#+!"#*""$#'.,1#,/#6%//"6+,%/#2,+!#
,/7"$+-"/+$#!"&1#43#4)%D").;"#6&,"/+$8#=%);./#>+./&"3#?".&+!#=./.;"-"/+#!.$#.#6%/[,6+#%*#,/+")"$+#,/#%5"),/;#.&+")/.+,7"#,/7"$+-"/+$#4"6.($"#=%);./#>+./&"3#?".&+!#=./.;"-"/+#%)#%()#.b&,.+"$0#
,/#-%$+#,/$+./6"$0#".)/#-%)"#-%/"3#,/#3%()#.66%(/+#*)%-#3%()#,/7"$+-"/+$#,/#.&+")/.+,7"#,/7"$+-"/+$#+!./#*)%-#%+!")#,/7"$+-"/+#%'+,%/$8
9+#$!%(&1#4"#/%+"1#+!.+#+!"#-.@%),+3#%*#!"1;"#*(/1#,/1"<"$#.)"#6%-'),$"1#%*#!"1;"#*(/1#-./.;")#)"+()/$8# !,$#,$#,/#6%/+).$+#+%#+).1,+,%/.&#,/1"<"$0#2!,6!#.)"#6%-'),$"1#%*#,/1,7,1(.&#$"6(),+,"$#,/#+!"#
7.),%($#-.)D"+#$";-"/+$#+!"3#)"')"$"/+#./1#%5")#6%-'&"+"#+)./$'.)"/63#.$#+%#-"-4")$!,'#./1#6%/$+)(6+,%/#-"+!%1%&%;38#:$#$(6!0#$%-"#4"&,"7"#+!.+#!"1;"#*(/1#,/1"<#)"+()/$#!.7"#6")+.,/#4,.$"$#
+!.+#.)"#/%+#')"$"/+#,/#+).1,+,%/.&#,/1"<"$8#>%-"#%*#+!"$"#4,.$"$#,/[.+"#,/1"<#'")*%)-./6"0#2!,&"#%+!")$#-.3#$D"2#'")*%)-./6"#/";.+,7"&38#a%2"7")0#-./3#$+(1,"$#,/1,6.+"#+!.+#%7").&&#!"1;"#*(/1#
,/1"<#'")*%)-./6"#!.$#4""/#4,.$"1#+%#+!"#('$,1"8#>%-"#$+(1,"$#$(;;"$+#'")*%)-./6"#!.$#4""/#,/[.+"1#43#('#+%#_g^#4.$,$#'%,/+$#%)#-%)"#.//(.&&3#1"'"/1,/;#%/#+!"#+3'"$#%*#4,.$"$#,/6&(1"1#./1#+!"#
+,-"#'"),%1#$+(1,"18#:&+!%(;!#+!")"#.)"#/(-")%($#'%+"/+,.,.$"$#+!.+#6%(&1#.5"6+#!"1;"#*(/1#)"+()/$0#2"#,1"/+,*3#$%-"#%*#+!"#-%)"#6%--%/#%/"$#+!)%(;!%(+#+!,$#'.'")8
>"&*R$"&"6+,%/#4,.$#)"$(&+$#2!"/#6")+.,/#-./.;")#)"+()/$#.)"#/%+#,/6&(1"1#,/#+!"#,/1"<#)"+()/$#./1#-.3#)"$(&+#,/#'")*%)-./6"#4",/;#$D"2"1#('#%)#1%2/8#C"6.($"#!"1;"#*(/1$#.)"#'),7.+"#'&.6"-"/+$0#
!"1;"#*(/1#-./.;")$#.)"#.4&"#+%#1"6,1"#2!,6!#*(/1#)"+()/$#+!"3#2./+#+%#)"'%)+#./1#.)"#.4&"#+%#%'+#%(+#%*#)"'%)+,/;#+%#+!"#7.),%($#1.+.4.$"$8#F")+.,/#!"1;"#*(/1#-./.;")$#-.3#6!%%$"#%/&3#+%#)"'%)+#
!"#$%"&'("

)"+()/$#*%)#*(/1$#2,+!#$+)%/;#)"+()/$#./1#%'+#%(+#%*#)"'%)+,/;#)"+()/$#*%)#2".D#'")*%)-")$8#Y+!")#!"1;"#*(/1$#+!.+#6&%$"#-.3#1"6,1"#+%#$+%'#)"'%)+,/;#,/#%)1")#+%#)"+.,/#$"6)"630#2!,6!#-.3#6.($"#.#
1%2/2.)1#4,.$#,/#)"+()/$8
>()7,7%)$!,'#4,.$#)"$(&+$#2!"/#6")+.,/#6%/$+,+("/+$#.)"#)"-%7"1#*)%-#./#,/1"<8# !,$#%*+"/#)"$(&+$#*)%-#+!"#6&%$()"#%*#*(/1$#1("#+%#'%%)#'")*%)-./6"0#M4&%2#('$0P#%)#%+!")#$(6!#"7"/+$8#:$#$(6!0#+!,$#4,.$#
+3',6.&&3#)"$(&+$#,/#'")*%)-./6"#4",/;#$D"2"1#!,;!")8#:$#/%+"10#!"1;"#*(/1#,/1"<#'")*%)-./6"#4,.$"$#6./#)"$(&+#,/#'%$,+,7"#%)#/";.+,7"#$D"28#a%2"7")0#,+#2%(&1#.''".)#+!.+#+!"#$D"2#,$#-%)"#%*+"/#
'%$,+,7"8#?!,&"#,+#,$#1,b6(&+#+%#J(./+,*3#+!"#"5"6+$#')"6,$"&30#,/7"$+%)$#$!%(&1#4"#.2.)"#+!.+#,1,%$3/6).+,6#*.6+%)$#-.3#4"#;,7,/;#!"1;"#*(/1#,/1"<#)"+()/$#./#.)+,K6,.&#M&,*+P#%)#('2.)1$#4,.$8
X*1#*&E<%10&!2&E<%10&./1#-./3#*(/1$#%*#*(/1$#.)"#'),7.+"#,/7"$+-"/+#7"!,6&"$#)"$+),6+"1#+%#6")+.,/#J(.&,K"1#'),7.+"#./1#,/$+,+(+,%/.&#,/7"$+%)$8# !"3#.)"#%*+"/#$'"6(&.+,7"#./1#,/6&(1"#.#!,;!#1";)""#%*#
),$D8#9/7"$+%)$#6./#&%$"#.&&#%)#.#$(4$+./+,.&#.-%(/+#%*#+!",)#,/7"$+-"/+8# !"3#-.3#4"#!,;!&3#,&&,J(,10#6./#"/;.;"#,/#&"7").;"#./1#%+!")#$'"6(&.+,7"#').6+,6"$#+!.+#-.3#,/6)".$"#7%&.+,&,+3#./1#+!"#),$D#%*#&%$$0#
./1#-.3#4"#$(4@"6+#+%#&.);"#,/7"$+-"/+#-,/,-(-$#./1#,/,+,.&#&%6D('$8# !"3#,/7%&7"#6%-'&"<#+.<#$+)(6+()"$0#+.<R,/"b6,"/+#,/7"$+,/;#./1#1"&.3$#,/#1,$+),4(+,/;#,-'%)+./+#+.<#,/*%)-.+,%/8#F.+";%),6.&&30#
!"1;"#*(/1$#./1#*(/1$#%*#*(/1$#!.7"#!,;!")#*""$#./1#"<'"/$"$#+!./#+).1,+,%/.&#,/7"$+-"/+$0#./1#$(6!#*""$#./1#"<'"/$"$#6./#&%2")#+!"#)"+()/$#.6!,"7"1#43#,/7"$+%)$8#S(/1$#%*#*(/1$#!.7"#./#.11,+,%/.&#
&.3")#%*#*""$#%7")#./1#.4%7"#!"1;"#*(/1#*""$#+!.+#2,&&#%5$"+#)"+()/$8#:/#,/7"$+-"/+#,/#./#*T=-$%#*9("$1*1&2<%1&,/7%&7"$#),$D$#$,-,&.)#+%#+!%$"#%*#,/7"$+,/;#,/#.#4)%.1&3#4.$"1#'%)+*%&,%#%*#"J(,+3#
$"6(),+,"$#+).1"1#%/#./#"<6!./;"#,/#+!"#)"&"7./+#$"6(),+,"$#-.)D"+0#$(6!#.$#-.)D"+#[(6+(.+,%/$#6.($"1#43#$(6!#*.6+%)$#.$#"6%/%-,6#./1#'%&,+,6."7"&%'-"/+$0#6!./;"$#,/#,/+")"$+#).+"$#./1#'")6",7"1#
+)"/1$#,/#$+%6D#./1#4%/1#'),6"$8#:/#,/7"$+-"/+#,/#.#($"#*(&1$(*&F!"(2!)/!&,$#$(4@"6+#+%#+!"#),$D$#.++"/1./+#+%#+!"#(/1")&3,/;#*(/1$#,/#2!,6!#,+#,/7"$+$0#,/#+!"$"#'%)+*%&,%$#+!"#*(/1$#.)"#+!"#F%/$(&+,/;#
U)%('#F.',+.&#=.)D"+#*(/1$8#:#+.);"+#1.+"#'%)+*%&,%#,$#;".)"1#+%#,/7"$+%)$#2!%#2,&&#)"+,)"#./1Q%)#)"J(,)"#,/6%-"#.+#./#.'')%<,-.+"#3".)8# !"#'%)+*%&,%#,$#-./.;"1#+%#-""+#+!"#,/7"$+%)I$#;%.&$#43#+!"#
')"R"$+.4&,$!"1#3".)#%)#M+.);"+#1.+"8P#:#+.);"+#1.+"#'%)+*%&,%#2,&&#+)./$,+,%/#,+$#,/7"$+"1#.$$"+$#*)%-#.#-%)"#.;;)"$$,7"#'%)+*%&,%#+%#.#-%)"#6%/$")7.+,7"#'%)+*%&,%#.$#+!"#+.);"+#1.+"#1).2$#6&%$") 8#:/#
,/7"$+-"/+#,/#+!"#+.);"+#1.+"#'%)+*%&,%#,$#/%+#;(.)./+""1#.+#./3#+,-"0#,/6&(1,/;0#4"*%)"#%)#.*+")#+!"#+.);"+#1.+"#,$#)".6!"18# $%$#*1&2<(<"*0&,/7"$+-"/+$#.)"#$'"6(&.+,7"0#,/7%&7"#.#!,;!#1";)""#%*#),$D0#
($"#$,;/,K6./+#&"7").;"0#.)"#;"/").&&3#,&&,J(,10#!.7"#$(4$+./+,.!.);"$0#$(4@"6+#,/7"$+%)$#+%#6%/[,6+$#%*#,/+")"$+0#./1#.)"#.'')%'),.+"#%/&3#*%)#+!"#),$D#6.',+.&#'%)+,%/#%*#./#,/7"$+%)I$#'%)+*%&,%8#=./.;"1#
*(+()"$#,/7"$+-"/+$#1%#/%+#)"'&.6"#"J(,+,"$#%)#4%/1$#4(+#).+!")#-.3#.6+#.$#.#6%-'&"-"/+#,/#.#2"&,7")$,K"1#'%)+*%&,%8#=./.;"1#S(+()"$#.)"#6%-'&"<#./1#/%+#.'')%'),.+"#*%)#.&&#,/7"$+%)$8#W*7$)$%=/%##
1%"$#/%+#')%+"6+#.;.,/$+#.#&%$$#,/#1"6&,/,/;#K/./6,.&#-.)D"+$8# !")"#-.3#4"#.#'%+"/+,.&#+.<#,-'&,6.+,%/#2,+!#.#)"4.&./6,/;#$+).+";38
B00*(&$))!=$(/!%&$%1&1/A*"0/Z=$(/!%&1%#/%+#.$$()"#.#')%K+#%)#')%+"6+#.;.,/$+#&%$$#,/#1"6&,/,/;#K/./6,.&#-.)D"+$8#L.$+#'")*%)-./6"#,$#/%#;(.)./+""#%*#*(+()"#)"$(&+$8#:6+(.&#)"$(&+$#-.3#7.)38
G$T&)$Q0&$"*&=!.F)*T&$%1&0<7S*=(&(!&=-$%#*;& !"#$%&'($%)*+&'./(-&3$"%*+&445&C\ !"#$%&'($%)*+]D6&/(0&$^)/$(*0&$%1& !"#$%&'($%)*+&E/%$%=/$)&B1A/0!"0&$%1&J"/A$(*&,*$)(-&B1A/0!"0&1!&%!(&
F"!A/1*&($T&!"&)*#$)&$1A/=*&$%1&$"*&%!(&\Z1<=/$"/*0]&C<%1*"&UW@'B6&(-*&@%(*"%$)&W*A*%<*&5!1*&!"&!(-*"Q/0*D&Q/(-&"*0F*=(&(!&(-*&0*"A/=*0&!"&$=(/A/(/*0&1*0="/7*1&-*"*/%&*T=*F(&$0&!(-*"Q/0*&
F"!A/1*1&/%&Q"/(/%#&7+& !"#$%&'($%)*+&$%1_!"&$0&1*0="/7*1&$(&QQQ;.!"#$%0($%)*+;=!._1/0=)!0<"*0_1!);&@%1/A/1<$)0&$"*&*%=!<"$#*1&(!&=!%0<)(&(-*/"&($T&$%1&)*#$)&$1A/0!"0&C$D&7*2!"*&
*0($7)/0-/%#&$&"*(/"*.*%(&F)$%&!"&$==!<%(6&$%1&C7D&"*#$"1/%#&$%+&F!(*%(/$)&($T6&UW@'B&$%1&"*)$(*1&=!%0*`<*%=*0&!2&$%+&/%A*0(.*%(0&.$1*&<%1*"&0<=-&F)$%&!"&$==!<%(;
://(,+,"$#./1#,/$()./6"#')%1(6+$#.)"#%5")"1#,/#6%/@(/6+,%/#2,+!#=%);./#>+./&"3#>-,+!#C.)/"3#EEFI$#&,6"/$"1#,/$()./6"#.;"/63#.b&,.+"$8
9/1,6"$#.)"#(/-./.;"1#./1#,/7"$+%)$#6.//%+#1,)"6+&3#,/7"$+#,/#+!"-8# !"3#.)"#/%+#$(4@"6+#+%#"<'"/$"$#%)#*""$#./1#.)"#%*+"/#6%-'),$"1#%*#$"6(),+,"$#./1#%+!")#,/7"$+-"/+#,/$+)(-"/+$#+!"#&,J(,1,+3#%*#
2!,6!#,$#/%+#)"$+),6+"18#:#'.)+,6(&.)#,/7"$+-"/+#')%1(6+#-.3#6%/$,$+#%*#$"6(),+,"$#$,;/,K6./+&3#1,5")"/+#+!./#+!%$"#,/#./3#,/1"<#)"*"))"1#+%#!")",/ 8#F%-'%$,+"#,/1"<#)"$(&+$#.)"#$!%2/#*%)#,&&($+).+,7"#
'()'%$"$#%/&30#;"/").&&3#1%#/%+#)"')"$"/+#+!"#'")*%)-./6"#%*#.#$'"6,K6#,/7"$+-"/+0#-.3#/%+0#*%)#.#7.),"+3#%*#)".$%/$0#4"#./#.'')%'),.+"#6%-'.),$%/#%)#4"/6!-.)D#*%)#.#'.)+,6(&.)#,/7"$+-"/+#./1#-.3#
/%+#/"6"$$.),&3#)"["6+#+!"#.6+(.&#,/7"$+-"/+#$+).+";3#%)#%4@"6+,7"#%*#.#'.)+,6(&.)#,/7"$+-"/+8#F%/$"J("/+&30#6%-'.),/;#./#,/7"$+-"/+#+%#.#'.)+,6(&.)#,/1"<#-.3#4"#%*#&,-,+"1#($"8
!,$#-.+"),.&#,$#/%+#.#K/./6,.&#'&./#./1#1%"$#/%+#6)".+"#./#,/7"$+-"/+#.17,$%)3#)"&.+,%/$!,'#4"+2""/#3%(#./1#3%()#=%);./#>+./&"3#S,/./6,.&#:17,$%)8#?"#.)"#/%+#3%()#K1(6,.)3#",+!")#(/1")#+!"#
G-'&%3""#`"+,)"-"/+#9/6%-"#>"6(),+3#:6+#%*#\he]#AG`9>:B#%)#+!"#9/+")/.&#`"7"/("#F%1"#%*#\hdg0#./1#./3#,/*%)-.+,%/#,/#+!,$#)"'%)+#,$#/%+#,/+"/1"1#+%#*%)-#+!"#'),-.)3#4.$,$#*%)#./3#,/7"$+-"/+#1"6,$,%/#
43#3%(0#%)#./#,/7"$+-"/+#.17,6"#%)#)"6%--"/1.+,%/#*%)#",+!")#G`9>:#%)#9/+")/.&#`"7"/("#F%1"#'()'%$"$8#=%);./#>+./&"3#L),7.+"#?".&+!#=./.;"-"/+#2,&&#%/&3#')"'.)"#.#K/./6,.&#'&./#.+#3%()#$'"6,K6#
)"J("$+#($,/;#L),7.+"#?".&+!#=./.;"-"/+#.'')%7"1#K/./6,.&#'&.//,/;#$,;/.+()"8
?"#-.3#.6+#,/#+!"#6.'.6,+3#%*#.#4)%D")#%)#+!.+#%*#./#.17,$%)8#:$#3%()#4)%D")0#2"#.)"#/%+#3%()#K1(6,.)3#./1#%()#,/+")"$+$#-.3#/%+#.&2.3$#4"#,1"/+,6.&#+%#3%()$8#L&".$"#6%/$(&+#2,+!#3%()#L),7.+"#?".&+!#
:17,$%)#+%#1,$6($$#%()#%4&,;.+,%/$#+%#1,$6&%$"#+%#3%(#./3#6%/[,6+$#2"#-.3#*)%-#+,-"#+%#+,-"#!.7"#./1#%()#1(+3#+%#.6+#,/#3%()#4"$+#,/+")"$+8#?"#-.3#4"#'.,1#4%+!#43#3%(#./1#43#%+!")$#2!%#6%-'"/$.+"#
($#4.$"1#%/#2!.+#3%(#4(38#Y()#6%-'"/$.+,%/0#,/6&(1,/;#+!.+#%*#3%()#L),7.+"#?".&+!#:17,$%)0#-.3#7.)3#43#')%1(6+#./1#%7")#+,-"8
9/7"$+-"/+#./1#$")7,6"$#%5")"1#+!)%(;!#=%);./#>+./&"3#L),7.+"#?".&+!#=./.;"-"/+0#.#1,7,$,%/#%*#=%);./#>+./&"3#>-,+!#C.)/"3#EEF0#="-4")#>9LF8
!"#$%"&'("

4*,"#!0%A?"#!0#9)'*,")!0"&/,$%+"0%B!#'#*!&",%.%,%!9%0"#!"'3#&",%7*,'"75%)&%"$#&#'"'3%".*55*C#!1D"3''7&DEECCC;(*,1)!&')!5%+;9*(EC%)5'3F#!$%&'(%!'&*5/'#*!&EC(#,F0%B!#'#*!&
?4H3B4&@RMU'G URG&5H @GGUU&C?@5D&B''UG&B44H5BG@HR& H>U4'O# !"#:$$"+#:&&%6.+,%/#=%1"&$#.)"#6)".+"1#43#=%);./#>+./&"3#?".&+!#=./.;"-"/+I$#U9F8#
XPJHGXUG@5B4& H>U4&JUWEHW BR5U&C?WH''DO#a3'%+!"+,6.&#-%1"&#'")*%)-./6"#)"$(&+$#1%#/%+#)"["6+#+!"#,/7"$+-"/+#%)#'")*%)-./6"#%*#./#.6+(.&#'%)+*%&,%#*%&&%2,/;#.#U9F#>+).+";30#4(+#$,-'&3#
)"["6+#.6+(.&#!,$+%),6.&#'")*%)-./6"#%*#$"&"6+"1#,/1,6"$#%/#.#)".&R+,-"#4.$,$#%7")#+!"#$'"6,K"1#'"),%1#%*#+,-"#)"')"$"/+,/;#+!"#U9FI$#$+).+";,6#./1#+.6+,6.&#.&&%6.+,%/$#.$#%*#+!"#1.+"#%*#+!,$#)"'%)+ 8# !"#
'.$+#'")*%)-./6"#$!%2/#!")"#,$#$,-(&.+"1#'")*%)-./6"#4.$"1#%/#4"/6!-.)D#,/1,6"$0#/%+#,/7"$+-"/+#)"$(&+$#*)%-#./#.6+(.&#'%)+*%&,%#%)#.6+(.&#+).1,/;8# !")"#6./#4"#&.);"#1,5")"/6"$#4"+2""/#
!3'%+!"+,6.&#./1#.6+(.&#'")*%)-./6"#)"$(&+$#.6!,"7"1#43#.#'.)+,6(&.)#.$$"+#.&&%6.+,%/#%)#+).1,/;#$+).+";38#a3'%+!"+,6.&#'")*%)-./6"#)"$(&+$#1%#/%+#)"')"$"/+#.6+(.&#+).1,/;#./1#.)"#;"/").&&3#1"$,;/"1#
2,+!#+!"#4"/"K+#%*#!,/1$,;!+8#:6+(.&#'")*%)-./6"#)"$(&+$#%*#.66%(/+$#7.)3#1("#+%0#*%)#"<.-'&"0#-.)D"+#*.6+%)$#A$(6!#.$#&,J(,1,+3B#./1#6&,"/+R$'"6,K6#*.6+%)$#A$(6!#.$#,/7"$+-"/+#7"!,6&"#$"&"6+,%/0#+,-,/;#
%*#6%/+),4(+,%/$#./1#2,+!1).2.&$0#)"$+),6+,%/$#./1#)"4.&./6,/;#$6!"1(&"$B8#F&,"/+$#2%(&1#/%+#/"6"$$.),&3#!.7"#%4+.,/"1#+!"#'")*%)-./6"#)"$(&+$#$!%2/#!")"#,*#+!"3#!.1#,/7"$+"1#,/#.66%)1./6"#2,+!#./3#
U9F#:$$"+#:&&%6.+,%/#=%1"&#*%)#+!"#'"),%1$#,/1,6.+"18#N"$',+"#+!"#&,-,+.+,%/$#%*#!3'%+!"+,6.&#'")*%)-./6"0#+!"$"#!3'%+!"+,6.&#'")*%)-./6"#)"$(&+$#.&&%2#6&,"/+$#./1#S,/./6,.&#:17,$%)$#+%#%4+.,/#.#$"/$"#
%*#+!"#),$DQ)"+()/#+).1"R%5#%*#1,5")"/+#.$$"+#.&&%6.+,%/#6%/$+)(6+$8# !"#!3'%+!"+,6.&#'")*%)-./6"#)"$(&+$#,/#+!,$#)"'%)+#.)"#6.&6(&.+"1#($,/;#+!"#)"+()/$#%*#4"/6!-.)D#,/1,6"$#*%)#+!"#.$$"+#6&.$$"$0#./1#
/%+#+!"#)"+()/$#%*#$"6(),+,"$0#*(/1#%)#%+!")#,/7"$+-"/+#')%1(6+$8#=%1"&$#-.3#6%/+.,/#.&&%6.+,%/$#+%#a"1;"#S(/1$0#L),7.+"#GJ(,+3#./1#L),7.+"#`".&#G$+.+"8# !"#4"/6!-.)D#,/1,6"$#*%)#+!"$"#.$$"+#6&.$$"$#
.)"#/%+#,$$("1#%/#.#1.,&3#4.$,$8#?!"/#6.&6(&.+,/;#-%1"&#'")*%)-./6"#%/#.#1.3#*%)#2!,6!#/%#4"/6!-.)D#,/1"<#1.+.#,$#,$$("10#2"#!.7"#.$$(-"1#$+).,;!+#&,/"#;)%2+!#4"+2""/#+!"#,/1"<#&"7"&$#,$$("1#4"*%)"#
./1#.*+")#+!.+#1.+"8
EUU'&WU>:5U&GXU&JUWEHW BR5U&HE&B5G:B4&B55H:RG'O#W%/"#%*#+!"#*""$#%)#%+!")#"<'"/$"$#A"8;8#6%--,$$,%/$0#-.)DR('$0#-.)DR1%2/$0#*""$B#.$$%6,.+"1#2,+!#.6+(.&#+).1,/;#%)#.66%(/+$#.)"#
)"["6+"1#,/#+!"#U9F#:$$"+#:&&%6.+,%/#=%1"&$8# !"#U9F#:$$"+#:&&%6.+,%/#=%1"&$#./1#./3#-%1"&#'")*%)-./6"#,/6&(1"1#,/#+!,$#')"$"/+.+,%/#.)"#,/+"/1"1#.$#"1(6.+,%/.&#-.+"),.&$ 8#?")"#.#6&,"/+#+%#($"#+!"$"#
-%1"&$#,/#6%//"6+,%/#2,+!#,/7"$+,/;0#./3#,/7"$+-"/+#1"6,$,%/$#-.1"#2%(&1#4"#$(4@"6+#+%#+)./$.6+,%/#./1#%+!")#6%$+$#2!,6!0#2!"/#6%-'%(/1"1#%7")#.#'"),%1#%*#3".)$0#2%(&1#1"6)".$"#)"+()/$8#
9/*%)-.+,%/#)";.)1,/;#=%);./#>+./&"3I$#$+./1.)1#.17,$%)3#*""$#,$#.7.,&.4&"#,/#+!"#S%)-#:NO#L.)+#_0#2!,6!#,$#.7.,&.4&"#.+#2228-%);./$+./&"386%-Q.178# !"#*%&&%2,/;#!3'%+!"+,6.&#,&&($+).+"$#+!"#
6%-'%(/1#"5"6+#*""$#!.7"#%/#,/7"$+-"/+#)"+()/$V#S%)#"<.-'&"0#,*#.#'%)+*%&,%I$#.//(.&#).+"#%*#)"+()/#,$#\fk#*%)#f#3".)$#./1#+!"#.66%(/+#'.3$#f^#4.$,$#'%,/+$#,/#*""$#'")#.//(-0#+!"#;)%$$#6(-(&.+,7"#
K7"R3".)#)"+()/#2%(&1#4"#\^\8\k#./1#+!"#K7"R3".)#)"+()/#/"+#%*#*""$#2%(&1#4"#hg8dk8#S""$#./1Q%)#"<'"/$"$#2%(&1#.''&3#+%#6&,"/+$#2!%#,/7"$+#,/#,/7"$+-"/+$#,/#./#.66%(/+#4.$"1#%/#+!"$"#.$$"+#
.&&%6.+,%/$0#./1#2%(&1#)"1(6"#6&,"/+$I#)"+()/$8# !"#,-'.6+#%*#*""$#./1Q%)#"<'"/$"$#6./#4"#-.+"),.&8
M$"/$7)*&$%%</(/*0#.)"#&%/;R+")-#,/7"$+-"/+$#1"$,;/"1#*%)#)"+,)"-"/+#'()'%$"$#./1#-.3#4"#$(4@"6+#+%#-.)D"+#[(6+(.+,%/$0#,/7"$+-"/+#),$D0#./1#'%$$,4&"#&%$$#%*#'),/6,'.&8#:&&#;(.)./+""$0#,/6&(1,/;#
%'+,%/."/"K+$0#.)"#4.$"1#%/#+!"#K/./6,.&#$+)"/;+!#./1#6&.,-$R'.3,/;#.4,&,+3#%*#+!"#,$$(,/;#,/$()./6"#6%-'./3#./1#1%#/%+#.''&3#+%#+!"#(/1")&3,/;#,/7"$+-"/+#%'+,%/$8#Y'+,%/.&#),1")$#-.3#/%+#4"#.4&"#
+%#4"#'()6!.$"1#,/#6%-4,/.+,%/#./1#.)"#.7.,&.4&"#.+#./#.11,+,%/.%$+8#>%-"#%'+,%/.&#),1")$#-($+#4"#"&"6+"1#.+#+,-"#%*#'()6!.$"8#Y'+,%/.&#),1")$#-.3#4"#$(4@"6+#+%#$'"6,K6#&,-,+.+,%/$0#)"$+),6+,%/$0#
!%&1,/;#'"),%1$0#6%$+$0#./1#"<'"/$"$#.$#$'"6,K"1#43#+!"#,/$()./6"#6%-'./3#,/#+!"#.//(,+3#6%/+).6+8#9*#3%(#.)"#,/7"$+,/;#,/#.#A$"/$7)*&$%%</(+#+!)%(;!#.#+.<R.17./+.;"1#)"+,)"-"/+#'&./#$(6!#.$#./#9`:0#
3%(#2,&&#;"+#/%#.11,+,%/.&#+.<#.17./+.;"#*)%-#+!"#7.),.4&"#.//(,+38#c/1")#+!"$"#6,)6(-$+./6"$0#3%(#$!%(&1#%/&3#6%/$,1")#4(3,/;#.#7.),.4&"#.//(,+3#4"6.($"#%*#,+$#%+!")#*".+()"$0#$(6!#.$#&,*"+,-"#,/6%-"#
'.3-"/+$#./1#1".+!#4"/"K+$#')%+"6+,%/8# .<.4&"#1,$+),4(+,%/$#A./1#6")+.,/#1""-"1#1,$+),4(+,%/$B#.)"#$(4@"6+#+%#%)1,/.)3#,/6%-"#+.<#./10#,*#+.D"/#'),%)#+%#.;"#fht0#-.3#4"#$(4@"6+#+%#.#\^k#*"1").&#
,/6%-"#+.<#'"/.&+38#G.)&3#2,+!1).2.&$#2,&&#)"1(6"#+!"#1".+!#4"/"K+#./1#6.$!#$())"/1")#7.&("8
U`</(+&0*=<"/(/*0#-.3#[(6+(.+"#,/#)"$'%/$"#+%#/"2$#%/#6%-'./,"$0#,/1($+),"$0#-.)D"+#6%/1,+,%/$#./1#;"/").&#"6%/%-,6#"/7,)%/-"/+8#:)("$0-!"(9(*".&ZT*1&/%=!.*#.$$"+#6&.$$#,$#6%-'),$"1#%*#K<"1#
,/6%-"#$"6(),+,"$#2,+!#!,;!#J(.&,+30#7")3#$!%)+#-.+(),+,"$8# !"3#.)"#+!")"*%)"#$(4@"6+#+%#+!"#),$D$#.$$%6,.+"1#2,+!#1"4+#$"6(),+,"$#$(6!#.$#6)"1,+#./1#,/+")"$+#).+"#),$D 8
$0(*"&4/./(*1&J$"(%*"0-/F0&C 4J0D#.)"#&,-,+"1#'.)+/")$!,'$#%)#&,-,+"1#&,.4,&,+3#6%-'./,"$#+!.+#.)"#+.<"1#.$#'.)+/")$!,'$#./1#2!%$"#,/+")"$+$#A&,-,+"1#'.)+/")$!,'#(/,+$#%)#&,-,+"1#&,.4,&,+3#6%-'./3#
(/,+$B#.)"#+).1"1#%/#$"6(),+,"$#"<6!./;"$#&,D"#$!.)"$#%*#6%--%/#$+%6D8#F())"/+&30#-%$+#=EL$#%'").+"#,/#+!"#"/");30#/.+().&#)"$%()6"$#%)#)".&#"$+.+"#$"6+%)$8#9/7"$+-"/+$#,/#=EL#,/+")"$+$#.)"#$(4@"6+#+%#
+!"#),$D$#;"/").&&3#.''&,6.4&"#+%#6%-'./,"$#,/#+!"#"/");3#./1#/.+().&#)"$%()6"$#$"6+%)$0#,/6&(1,/;#6%--%1,+3#'),6,/;#),$D0#$(''&3#./1#1"-./1#),$D0#1"'&"+,%/#),$D#./1#"<'&%).+,%/#),$D8#9/1,7,1(.&#=EL$#
.)"#'(4&,6&3#+).1"1#'.)+/")$!,'$#+!.+#!.7"#(/,J("#),$D$#)"&.+"1#+%#+!",)#$+)(6+()"8# !"$"#,/6&(1"0#4(+#.)"#/%+#&,-,+"1#+%0#+!",)#)"&,./6"#%/#+!"#6.',+.&#-.)D"+$#+%#*(/1#;)%2+!0#.17")$"#)(&,/;#%/#+!"#6())"/+#
+.<#+)".+-"/+#%*#1,$+),4(+,%/$#A+3',6.&&3#-%$+&3#+.<#1"*"))"1B0#./1#6%--%1,+3#7%&(-"#),$D8# !"#'%+"/+,.&#+.<#4"/"K+$#*)%-#,/7"$+,/;#,/#=EL$#1"'"/1#%/#+!",)#4",/;#+)".+"1#.$#'.)+/")$!,'$#*%)#*"1").&#
,/6%-"#+.<#'()'%$"$#./10#,*#+!"#=EL#,$#1""-"1#+%#4"#.#6%)'%).+,%/0#+!"/#,+$#,/6%-"#2%(&1#4"#$(4@"6+#+%#*"1").&#+.<.+,%/#.+#+!"#"/+,+3#&"7"&0#)"1(6,/;#+!"#.-%(/+#%*#6.$!#.7.,&.4&"#*%)#1,$+),4(+,%/#+%#+!"#
*(/1#2!,6!#6%(&1#)"$(&+#,/#.#)"1(6+,%/#%*#+!"#*(/1I$#7.&("8#=EL$#6.))3#,/+")"$+#).+"#),$D#./1#-.3#(/1")'")*%)-#,/#.#),$,/;#,/+")"$+#).+"#"/7,)%/-"/+8#=EL#*(/1$#.66)("#1"*"))"1#,/6%-"#+.<"$#*%)#*(+()"#
+.<#&,.4,&,+,"$#.$$%6,.+"1#2,+!#+!"#'%)+,%/#%*#=EL#1,$+),4(+,%/$#6%/$,1")"1#+%#4"#.#+.<R1"*"))"1#)"+()/#%*#6.',+.&#./1#*%)#./3#/"+#%'").+,/;#;.,/$#.$#2"&&#.$#6.',+.&#.'')"6,.+,%/#%*#,+$#,/7"$+-"/+$H#+!,$#
1"*"))"1#+.<#&,.4,&,+3#,$#)"["6+"1#,/#+!"#1.,&3#W:O0#./10#.$#.#)"$(&+0#+!"#=EL#*(/1I$#.*+")R+.<#'")*%)-./6"#6%(&1#1,5")#$,;/,K6./+&3#*)%-#+!"#(/1")&3,/;#.$$"+$#"7"/#,*#+!"#')"R+.<#'")*%)-./6"#,$#6&%$"&3#
!"#$%"&'("

+).6D"18
@%A*0(/%#&/%&=!..!1/(/*0#"/+.,&$#$,;/,K6./+#),$D$8#F%--%1,+3#'),6"$#-.3#4"#.5"6+"1#43#.#7.),"+3#%*#*.6+%)$#.+#./3#+,-"0#,/6&(1,/;#4(+#/%+#&,-,+"1#+%0#A,B#6!./;"$#,/#$(''&3#./1#1"-./1#)"&.+,%/$!,'$0#A,,B#
;%7")/-"/+.&#')%;).-$#./1#'%&,6,"$0#A,,,B#/.+,%/.&#./1#,/+")/.+,%/.&#'%&,+,6.&#./1#"6%/%-,6#"7"/+$0#2.)#./1#+"))%),$+#"7"/+$0#A,7B#6!./;"$#,/#,/+")"$+#./1#"<6!./;"#).+"$0#A7B#+).1,/;#.6+,7,+,"$#,/#
6%--%1,+,"$#./1#)"&.+"1#6%/+).6+$0#A7,B#'"$+,&"/6"0#+"6!/%&%;,6.!./;"#./1#2".+!")0#./1#A7,,B#+!"#'),6"#7%&.+,&,+3#%*#.#6%--%1,+38#9/#.11,+,%/0#+!"#6%--%1,+,"$#-.)D"+$#.)"#$(4@"6+#+%#+"-'%).)3#
1,$+%)+,%/$#%)#%+!")#1,$)('+,%/$#1("#+%#7.),%($#*.6+%)$0#,/6&(1,/;#&.6D#%*#&,J(,1,+30#'.)+,6,'.+,%/#%*#$'"6(&.+%)$#./1#;%7")/-"/+#,/+")7"/+,%/8#J-+0/=$)&F"*=/!<0&.*($)0#.)"#/%/R)";(&.+"1#')%1(6+$8#
L)"6,%($#-"+.&$#.)"#$'"6(&.+,7"#,/7"$+-"/+$0#2!,6!#-.3#"<'"),"/6"#$!%)+R+")-#./1#&%/;#+")-#'),6"#7%&.+,&,+38# !"#7.&("#%*#')"6,%($#-"+.&$#,/7"$+-"/+$#-.3#[(6+(.+"#./1#-.3#.'')"6,.+"#%)#1"6&,/"0#
1"'"/1,/;#%/#-.)D"+#6%/1,+,%/$8#c/&,D"#4%/1$#./1#$+%6D$0#')"6,%($#-"+.&$#1%#/%+#-.D"#,/+")"$+#%)#1,7,1"/1#'.3-"/+$8# !")"*%)"0#')"6,%($#-"+.&$#-.3#/%+#4"#.'')%'),.+"#*%)#,/7"$+%)$#2!%#)"J(,)"#
6())"/+#,/6%-"8#L)"6,%($#-"+.&$#.)"#6%--%1,+,"$#+!.+#$!%(&1#4"#$.*"&3#$+%)"10#2!,6!#-.3#,-'%$"#.11,+,%/.%$+$#%/#+!"#,/7"$+%)8
WU@G0#,/7"$+,/;#),$D$#.)"#$,-,&.)#+%#+!%$"#.$$%6,.+"1#2,+!#1,)"6+#,/7"$+-"/+$#,/#)".&#"$+.+"V#')%'")+3#7.&("#[(6+(.+,%/$0#&.6D#%*#&,J(,1,+30#&,-,+"1#1,7")$,K6.+,%/#./1#$"/$,+,7,+3#+%#"6%/%-,6#*.6+%)$#$(6!#.$#
,/+")"$+#).+"#6!./;"$#./1#-.)D"+#)"6"$$,%/$8#`,$D$#%*#F"/A$(*&"*$)&*0($(*#,/6&(1"V#,&&,J(,1,+3H#.#&%/;R+")-#,/7"$+-"/+#!%),l%/#2,+!#.#&,-,+"1#%)#/%/"<,$+"/+#$"6%/1.)3#-.)D"+H#&.6D#%*#+)./$'.)"/63H#
7%&.+,&,+3#A),$D#%*#&%$$BH#./1#&"7").;"8#L),/6,'.&#,$#)"+()/"1#%/#.#-%/+!&3#4.$,$#%7")#+!"#&,*"#%*#.#.!"(#$#*97$=8*1&0*=<"/(+;#L),/6,'.&#')"'.3-"/+#6./#$,;/,K6./+&3#.5"6+#+!"#-%/+!&3#,/6%-"#$+)".-#./1#
+!"#-.+(),+3#%*#./3#+3'"#%*#=C>0#,/6&(1,/;#$+./1.)1#=C>0#F=Y$#./1#E%++")3#C%/1$8#B00*(97$=8*1&0*=<"/(/*0#;"/").&&3#1"6)".$"#,/#7.&("#.$#.#)"$(&+#%*#,/+")"$+#).+"#,/6)".$"$0#4(+#-.3#4"/"K+#&"$$#+!./#
%+!")#K<"1R,/6%-"#$"6(),+,"$#*)%-#1"6&,/,/;#,/+")"$+#).+"$0#'),/6,'.&&3#4"6.($"#%*#')"'.3-"/+$8
P/*)10#.)"#$(4@"6+#+%#6!./;"#2,+!#"6%/%-,6#6%/1,+,%/$8#Z,"&1#,$#%/&3#%/"#*.6+%)#+!.+#$!%(&1#4"#6%/$,1")"1#2!"/#-.D,/;#./#,/7"$+-"/+#1"6,$,%/8#5"*1/(&"$(/%#0#.)"#$(4@"6+#+%#6!./;"8#><"$(/!%0#+!"#
-%$+#6%--%/&3#($"1#-".$()"#%*#4%/1#),$D0#J(./+,K"$#+!"#"5"6+#%*#6!./;"$#,/#,/+")"$+#).+"$#%/#+!"#'),6"#%*#.#4%/1#%)#4%/1#'%)+*%&,%8# !"#&%/;")#+!"#1().+,%/0#+!"#-%)"#$"/$,+,7"#+!"#4%/1#%)#'%)+*%&,%#
2%(&1#4"#+%#6!./;"$#,/#,/+")"$+#).+"$8# !"#-.@%),+3#%*#u_f#./1#u\^^^#'.)#F"*2*""*1&0*=<"/(/*0#.)"#M6.&&.4&"P#-"./,/;#+!.+#+!"#,$$(")#-.3#)"+,)"#+!"#$"6(),+,"$#.+#$'"6,K6#'),6"$#./1#1.+"$#'),%)#+%#
-.+(),+38#9/+")"$+Q1,7,1"/1#'.3-"/+$#%/#6")+.,/#')"*"))"1#,$$("$#-.3#4"#1"*"))"1#43#+!"#,$$(")#*%)#'"),%1$#%*#('#+%#f#+%#\^#3".)$0#1"'"/1,/;#%/#+!"#'.)+,6(&.)#,$$("8# !"#,/7"$+%)#2%(&1#$+,&&#!.7"#,/6%-"#
+.<#&,.4,&,+3#"7"/#+!%(;!#'.3-"/+$#2%(&1#/%+#!.7"#4""/#)"6",7"18#L),6"#J(%+"1#,$#'")#u_f#%)#u\0^^^#$!.)"0#(/&"$$#%+!")2,$"#$'"6,K"18#F())"/+#3,"&1#,$#6.&6(&.+"1#43#-(&+,'&3,/;#+!"#6%('%/#43#'.)#7.&("#
1,7,1"1#43#+!"#-.)D"+#'),6"8# !"#,/,+,.&#,/+")"$+#).+"#%/#.#N!$(/%#9"$(*&0*=<"/(+#-.3#4"#&%2")#+!./#+!.+#%*#.#K<"1R).+"#$"6(),+3#%*#+!"#$.-"#-.+(),+3#4"6.($"#,/7"$+%)$#"<'"6+#+%#)"6",7"#.11,+,%/.&#
,/6%-"#1("#+%#*(+()"#,/6)".$"$#,/#+!"#[%.+,/;#$"6(),+3I$#(/1")&3,/;#)"*")"/6"#).+"8# !"#)"*")"/6"#).+"#6%(&1#4"#./#,/1"<#%)#./#,/+")"$+#).+"8#a%2"7")0#+!")"#6./#4"#/%#.$$()./6"#+!.+#+!"#)"*")"/6"#).+"#
2,&&#,/6)".$"8#>%-"#[%.+,/;R).+"#$"6(),+,"$#-.3#4"#$(4@"6+#+%#6.&&#),$D8# !"#-.)D"+#7.&("#%*#=!%A*"(/7)*&7!%10#./1#+!"#(/1")&3,/;#6%--%/#$+%6DA$B#2,&&#[(6+(.+"#./1#.*+")#'()6!.$"#-.3#4"#2%)+!#-%)"#
%)#&"$$#+!./#%),;,/.%$+8#9*#$%&1#'),%)#+%#-.+(),+30#,/7"$+%)$#-.3#)"6",7"#-%)"#%)#&"$$#+!./#+!",)#%),;,/.&#'()6!.$"#'),6"#%)#-.+(),+3#7.&("0#1"'"/1,/;#%/#-.)D"+#6%/1,+,%/$8#F.&&.4&"#4%/1$#-.3#4"#
)"1""-"1#43#+!"#,$$(")#'),%)#+%#-.+(),+38#:11,+,%/..&&#*".+()"$#-.3#"<,$+#+!.+#6%(&1#.5"6+#3,"&18#>%-"#u_f#%)#u\^^^#F$"&F"*2*""*1&0*=<"/(/*0#.)"#vN9#Av(.&,K"1#N,7,1"/1#9/6%-"B#"&,;,4&"8#9/*%)-.+,%/#
%/#vN9#"&,;,4,&,+3#,$#%4+.,/"1#*)%-#+!,)1#'.)+3#$%()6"$8# !"#1,7,1"/1#,/6%-"#%/#vN9#"&,;,4&"#')"*"))"1$#J(.&,K"$#*%)#.#)"1(6"1#+.<#).+"8#=./3#+).1,+,%/.,7,1"/1#'.3,/;I#'")'"+(.&#')"*"))"1#$"6(),+,"$#
A+).1,+,%/.&#')"*"))"1$#2,+!#/%#-.+(),+3#1.+"B#.)"#vN9#"&,;,4&"8#9/#%)1")#+%#J(.&,*3#*%)#+!"#')"*")"/+,.&#+.<#+)".+-"/+#.&&#J(.&,*3,/;#')"*"))"1#$"6(),+,"$#-($+#4"#!"&1#43#,/7"$+%)$#*%)#.#-,/,-(-#'"),%1#i#h\#
1.3$#1(),/;#.#\d^#1.3#2,/1%2#'"),%10#4";,//,/;#h^#1.3$#4"*%)"#+!"#"<R1,7,1"/1#1.+"8
F%-'./,"$#'.3,/;#1/A/1*%10#6./#)"1(6"#%)#6(+#'.3%(+$#.+#./3#+,-"8
R!%1/A*"0/Z=$(/!%O#S%)#.#'%)+*%&,%#+!.+#!%&1$#.#6%/6"/+).+"1#%)#&,-,+"1#/(-4")#%*#$"6(),+,"$0#.#1"6&,/"#,/#+!"#7.&("#%*#+!"$"#,/7"$+-"/+$#2%(&1#6.($"#+!"#'%)+*%&,%I$#%7").&.&("#+%#1"6&,/"#+%#.#;)".+")#
1";)""#+!./#.#&"$$#6%/6"/+).+"1#'%)+*%&,%8# !"#/%1/=*0&0*)*=(*1&7+& !"#$%&'($%)*+&,*$)(-& $%$#*.*%(#+%#-".$()"#'")*%)-./6"#.)"#)"')"$"/+.+,7"#%*#4)%.1#.$$"+#6&.$$"$8#=%);./#>+./&"3#?".&+!#
=./.;"-"/+#)"+.,/$#+!"#),;!+#+%#6!./;"#)"')"$"/+.+,7"#,/1,6"$#.+#./3#+,-"8#C"6.($"#%*#+!",)#/.))%2#*%6($0#0*=(!"&/%A*0(.*%(0#+"/1#+%#4"#-%)"#7%&.+,&"#+!./#,/7"$+-"/+$#+!.+#1,7")$,*3#.6)%$$#-./3#
$"6+%)$#./1#6%-'./,"$8
?"!Q(-&/%A*0(/%##1%"$#/%+#;(.)./+""#.#')%K+#%)#"&,-,/.+"#),$D8# !"#$+%6D$#%*#+!"$"#6%-'./,"$#6./#!.7"#)"&.+,7"&3#!,;!#7.&(.+,%/$8#C"6.($"#%*#+!"$"#!,;!#7.&(.+,%/$0#./#,/7"$+-"/+#,/#.#;)%2+!#$+%6D#
6./#4"#-%)"#),$D3#+!./#./#,/7"$+-"/+#,/#.#6%-'./3#2,+!#-%)"#-%1"$+#;)%2+!#"<'"6+.+,%/$8#M$)<*&/%A*0(/%##1%"$#/%+#;(.)./+""#.#')%K+#%)#"&,-,/.+"#),$D8#W%+#.&%-'./,"$#2!%$"#$+%6D$#.)"#
6%/$,1")"1#+%#4"#7.&("#$+%6D$#.)"#.4&"#+%#+()/#+!",)#4($,/"$$#.)%(/1#%)#$(66"$$*(&&3#"-'&%3#6%))"6+,7"#$+).+";,"$#2!,6!#2%(&1#)"$(&+#,/#$+%6D#'),6"$#+!.+#1%#/%+#),$"#.$#,/,+,.&&3#"<'"6+"1 8
:/3#+3'"#%*#=!%(/%<!<0&!"&F*"/!1/=&/%A*0(.*%(&F)$%#1%"$#/%+#.$$()"#.#')%K+#./1#1%"$#/%+#')%+"6+#.;.,/$+#&%$$#,/#1"6&,/,/;#-.)D"+$8#>,/6"#$(6!#.#'&./#,/7%&7"$#6%/+,/(%($#,/7"$+-"/+#,/#$"6(),+,"$#
)";.)1&"$$#%*#[(6+(.+,/;#'),6"#&"7"&$#%*#$(6!#$"6(),+,"$0#+!"#,/7"$+%)#$!%(&1#6%/$,1")#!,$#K/./6,.&#.4,&,+3#+%#6%/+,/("#!,$#'()6!.$"$#+!)%(;!#'"),%1$#%*#&%2#'),6"#&"7"&$ 8
!,$#-.+"),.&#,$#1,$$"-,/.+"1#,/#+!"#c/,+"1#>+.+"$#%*#:-"),6.#43#=%);./#>+./&"3#>-,+!#C.)/"3#EEF8#=%);./#>+./&"3#?".&+!#=./.;"-"/+#,$#/%+#.6+,/;#.$#.#-(/,6,'.&#.17,$%)#+%#./3#-(/,6,'.&#"/+,+3#%)#
%4&,;.+"1#'")$%/#2,+!,/#+!"#-"./,/;#%*#>"6+,%/#\fC#%*#+!"#>"6(),+,"$#G<6!./;"#:6+#A+!"#M=(/,6,'.&#:17,$%)#`(&"PB#./1#+!"#%',/,%/$#%)#7,"2$#6%/+.,/"1#!")",/#.)"#/%+#,/+"/1"1#+%#4" 0#./1#1%#/%+#
6%/$+,+(+"0#.17,6"#2,+!,/#+!"#-"./,/;#%*#+!"#=(/,6,'.&#:17,$%)#`(&"8# !,$#-.+"),.&0#%)#./3#'%)+,%/#+!")"%*0#-.3#/%+#4"#)"'),/+"10#$%&1#%)#)"1,$+),4(+"1#2,+!%(+#+!"#2),++"/#6%/$"/+#%*#=%);./#>+./&"3#
>-,+!#C.)/"3#EEF8
w#_^_^#=%);./#>+./&"3#>-,+!#C.)/"3#EEF8#="-4")#>9LF8
!"#$%"&'("

Wilmette Fire Pension FundQuarterly Performance Report
September 30, 2020

TargetAllocation
(%)
AssetAllocation
(%)
Differences(%)
AssetAllocation
($)
TargetRebalance
($)
Fixed Income 35.00 31.75 -3.25 15,913,910.31 1,628,312.67
Equity 65.00 68.25 3.25 34,206,726.78 -1,628,312.67
Wilmette Firemens Pension Fund 100.00 100.00 0.00 50,120,637.09 -
TargetAllocation
(%)
AssetAllocation
(%)
Differences(%)
AssetAllocation
($)
TargetRebalance
($)
Real Estate 3.00 2.65 -0.35 1,327,582.02 176,037.09
Small Cap Equity 7.00 7.42 0.42 3,716,970.51 -208,525.91
Emerging Markets 8.00 6.59 -1.41 3,301,217.92 708,433.05
Mid Cap Equity 10.00 10.17 0.17 5,097,902.67 -85,838.96
International Equity 12.00 12.61 0.61 6,321,882.71 -307,406.26
Large Cap Equity 25.00 28.81 3.81 14,441,170.95 -1,911,011.68
Fixed Income 35.00 31.75 -3.25 15,913,910.31 1,628,312.67
Wilmette Firemens Pension Fund 100.00 100.00 0.00 50,120,637.09 -
Wilmette Fire Pension Fund
Page 1

Total Fund Domestic EquityInternational
EquityREITS
Domestic FixedIncome
AlternativeInvestment
Cash Equivalent
($) % ($) % ($) % ($) % ($) % ($) % ($) %
Wilmette Firemens Pension Fund 50,120,637 100.00 22,538,324 44.97 9,955,949 19.86 1,327,582 2.65 15,110,968 30.15 299,859 0.60 887,955 1.77
Large Cap Equity 14,441,171 28.81 14,441,171 100.00 - - - - - - - - - -
Vanguard - S&P 500 Inst. Index(02/23/2015) 14,441,171 28.81 14,441,171 100.00 - - - - - - - - - -
Mid Cap Equity 5,097,903 10.17 5,097,903 100.00 - - - - - - - - - -
iShares Core S&P Mid-Cap ETF 090765 2,330,088 4.65 2,330,088 100.00 - - - - - - - - - -
Columbia Acorn Fund 090764 2,767,815 5.52 2,767,815 100.00 - - - - - - - - - -
Small Cap Equity 3,716,971 7.42 2,999,250 80.69 332,849 8.95 - - - - 299,859 8.07 85,012 2.29
London - Small Cap Core - 150666 3,184,627 6.35 2,466,907 77.46 332,849 10.45 - - - - 299,859 9.42 85,012 2.67
Small Cap 600 ETF - 077128 532,343 1.06 532,343 100.00 - - - - - - - - - -
Real Estate 1,327,582 2.65 - - - - 1,327,582 100.00 - - - - - -
Vanguard REIT Index Fund 1,327,582 2.65 - - - - 1,327,582 100.00 - - - - - -
International Equity 6,321,883 12.61 - - 6,321,883 100.00 - - - - - - - -
Amerifunds - International Equity - 150605 3,276,463 6.54 - - 3,276,463 100.00 - - - - - - - -
iShares Core MSCI EAFE 087512 984,493 1.96 - - 984,493 100.00 - - - - - - - -
Tweedy Browne Global Value 087515 874,038 1.74 - - 874,038 100.00 - - - - - - - -
JOHCM International 087513 1,186,889 2.37 - - 1,186,889 100.00 - - - - - - - -
Emerging Markets 3,301,218 6.59 - - 3,301,218 100.00 - - - - - - - -
American New World -087508 1,295,980 2.59 - - 1,295,980 100.00 - - - - - - - -
Lazard - Emerging Markets Equity - 150647 2,005,238 4.00 - - 2,005,238 100.00 - - - - - - - -
Fixed Income 15,913,910 31.75 - - - - - - 15,110,968 94.95 - - 802,942 5.05
Spare - Max Flex Fixed Income - 150603 2,394,277 4.78 - - - - - - 2,259,827 94.38 - - 134,450 5.62
Spare - Flex Fixed Income - 150602 4,713,236 9.40 - - - - - - 4,575,613 97.08 - - 137,623 2.92
Weaver - Fixed Income - 150676 8,297,989 16.56 - - - - - - 8,275,209 99.73 - - 22,780 0.27
Vanguard Money Market 500,481 1.00 - - - - - - - - - - 500,481 100.00
Self Managed - Fixed Income - 150523 7,928 0.02 - - - - - - 320 4.03 - - 7,608 95.97
Wilmette Fire Pension Fund
As of September 30, 2020
Page 2

1Month
QuarterTo
DateYTD
1Year
3Years
5Years
7Years
10Years
SinceInception
InceptionDate
Wilmette Firemens Pension Fund -2.03 5.20 2.20 7.84 5.64 7.59 6.17 6.72 6.61 01/01/2003
Custom Benchmark -2.03 4.91 2.13 7.89 6.44 8.57 7.12 7.24 6.71
US Equity -3.34 7.53 0.47 8.23 8.07 10.75 9.73 - 9.98 05/01/2013
Custom Benchmark - US Equity -3.53 6.87 -1.04 7.00 8.07 11.46 10.38 - 10.71
International Equity -1.53 7.60 1.37 9.66 2.48 6.47 3.94 - 4.44 05/01/2013
MSCI AC World ex US Net -2.46 6.25 -5.44 3.00 1.16 6.23 3.18 - 3.39
Emerging Markets -2.05 4.70 -11.29 -2.02 -2.14 6.28 0.82 - 0.42 05/01/2013
MSCI EM Net -1.60 9.56 -1.16 10.54 2.42 8.97 3.74 - 3.03
Fixed Income -0.10 0.95 7.04 7.44 5.14 3.99 3.66 - 3.08 05/01/2013
Barclays Govt/Credit Bond -0.05 0.78 8.04 8.03 5.86 4.66 4.30 - 3.57
Wilmette Fire Pension Fund Time Weighted Returns
As of September 30, 2020
Returns for periods greater than one year are annualized.Returns are expressed as percentages.
Page 3

1Month
QuarterTo
DateYTD
1Year
3Years
5Years
7Years
10Years
SinceInception
InceptionDate
Wilmette Firemens Pension Fund -2.03 5.20 2.20 7.84 5.64 7.59 6.17 6.72 6.61 01/01/2003
Custom Benchmark -2.03 4.91 2.13 7.89 6.44 8.57 7.12 7.24 6.71
Vanguard - S&P 500 Inst. Index(02/23/2015) -3.80 8.97 6.15 16.05 12.57 14.37 12.81 13.77 10.27 01/01/2003
S&P 500 Total Return -3.80 8.93 5.57 15.15 12.28 14.15 12.68 13.74 10.06
iShares Core S&P Mid-Cap ETF 090765 -3.34 4.68 -8.72 -2.37 - - - - 3.79 06/01/2019
S&P 400 MidCap Net -3.29 4.65 -8.97 -2.66 - - - - 3.34
Columbia Acorn Fund 090764 0.72 9.40 10.51 19.90 - - - - 16.23 06/01/2019
Russell 2500 GR -0.77 9.37 11.58 23.38 - - - - 20.80
London - Small Cap Core - 150666 -4.69 5.20 -11.86 -7.53 2.05 4.08 3.34 - 7.26 01/01/2011
Russell 2000 -3.34 4.93 -8.69 0.39 1.77 8.00 6.43 - 8.42
Small Cap 600 ETF - 077128 -4.67 3.26 -15.23 -8.24 -0.35 - - - 1.88 05/04/2017
S&P 600 SC -4.70 3.17 -15.25 -8.29 -0.33 - - - 1.82
Vanguard REIT Index Fund -2.64 1.33 -12.73 -12.19 2.37 5.21 - - 5.81 05/01/2014
FTSE Nareit All Equity REIT Index -2.66 1.19 -12.38 -11.81 2.37 4.71 - - 4.90
Amerifunds - International Equity - 150605 -1.71 9.66 4.43 14.97 5.66 9.05 6.63 6.76 7.52 04/01/2004
MSCI AC World ex US Net -2.46 6.25 -5.44 3.00 1.16 6.23 3.18 4.00 5.32
iShares Core MSCI EAFE 087512 -1.87 5.46 -6.48 1.26 - - - - 4.48 12/01/2018
MSCI EAFE IMI NT -2.29 5.64 -6.32 1.81 - - - - 5.04
JOHCM International 087513 0.22 9.81 14.61 23.30 - - - - 15.53 12/01/2018
MSCI EAFE -2.60 4.80 -7.09 0.49 - - - - 4.21
Tweedy Browne Global Value 087515 -2.77 0.08 -13.50 -10.85 - - - - -2.91 12/01/2018
MSCI EAFE -2.60 4.80 -7.09 0.49 - - - - 4.21
American New World -087508 -2.72 8.19 4.97 14.50 - - - - 15.15 12/01/2018
MSCI ACWI -3.19 8.25 1.77 11.00 - - - - 10.70
Lazard - Emerging Markets Equity - 150647 -1.61 2.55 -19.37 -10.38 -6.11 3.68 -0.95 -0.54 0.28 05/01/2010
MSCI EM Net -1.60 9.56 -1.16 10.54 2.42 8.97 3.74 2.51 3.05
Wilmette Fire Pension Fund Time Weighted Returns
As of September 30, 2020
Returns for periods greater than one year are annualized.Returns are expressed as percentages.
Page 4

Wilmette Fire Pension Fund Time Weighted Returns
As of September 30, 2020
1Month
QuarterTo
DateYTD
1Year
3Years
5Years
7Years
10Years
SinceInception
InceptionDate
Spare - Max Flex Fixed Income - 150603 0.13 1.11 5.29 5.71 3.46 2.43 2.23 1.98 2.52 08/01/2009
BC Gov 1-3 Yr 0.02 0.10 3.09 3.62 2.66 1.82 1.54 1.30 1.46
Spare - Flex Fixed Income - 150602 -0.17 0.59 7.29 7.41 5.33 4.02 3.87 3.57 4.24 01/01/2003
Custom Benchmark - SKBA Flex -0.05 0.78 8.04 8.03 5.86 4.66 4.30 3.81 4.29
Weaver - Fixed Income - 150676 -0.12 1.25 7.76 8.32 6.00 4.94 4.45 - 4.44 06/01/2011
Weaver Custom Benchmark -0.08 0.88 5.85 6.56 4.74 3.86 3.56 - 3.51
Self Managed - Fixed Income - 150523 0.02 0.08 0.53 0.97 1.77 2.12 2.48 1.83 2.82 01/01/2003
BC Gov Intm 0.07 0.20 5.96 5.98 4.04 2.76 2.56 2.32 3.27
Returns for periods greater than one year are annualized.Returns are expressed as percentages.
Page 5

Performance(%)
2019 2018 2017 2016 2015 2014 2013 2012 2011 2010 2003
Wilmette Firemens Pension Fund 20.47 -7.63 14.11 8.34 -2.12 5.06 13.18 10.08 2.54 10.18 14.28
Custom Benchmark 20.69 -5.89 15.65 9.48 -1.69 7.04 11.76 11.00 1.10 10.61 14.97
Wilmette Fire - Acturial Assumptions 7.25 7.25 7.25 7.25 7.25 7.25 7.25 7.25 7.30 7.35 7.50
Wilmette Firemens Pension Fund Custom Benchmark
$0.0
$600.0
$1,200.0
$1,800.0
$2,400.0
$3,000.0
$3,600.0
$4,200.0
12/02 12/03 12/04 12/05 12/06 12/07 12/08 12/09 12/10 12/11 12/12 12/13 12/14 12/15 12/16 12/17 12/18 12/19 9/20
$3,166.5$3,113.2
Wilmette Fire Pension Fund Time Weighted Returns
As of September 30, 2020
Please refer to definitions page at the back of this book for benchmar descriptions
Page 6

1Month
CurrentQuarter
YTD1
Year3
Years5
Years7
YearsSince
InceptionInception
Date
Wilmette Firemens Pension Fund -2.03 5.18 2.23 7.98 5.67 7.63 6.15 6.61 12/31/2002
2019 2018 2017 2016 2015 2014 2013 2012 2011 2010
Wilmette Firemens Pension Fund 20.45 -7.63 14.11 8.23 -2.13 5.06 13.18 10.04 2.52 10.18
Wilmette Fire Pension Fund Dollar Weighted Returns
As of September 30, 2020
Please refer to definitions page at the back of this book for benchmar descriptions
Page 7

Sep-2020 Aug-2020 Jul-2020 Jun-2020 May-2020 Apr-2020 Mar-2020 Feb-2020 Jan-2020 Dec-2019 Nov-2019 Oct-2019
Wilmette Firemens Pension Fund
Beginning Market Value 51,153,662 49,134,892 47,655,341 46,776,870 45,067,935 41,677,795 46,479,230 48,791,600 49,017,027 50,043,842 49,121,981 48,860,363
Net Contributions - 500,000 -506,444 105 -1,451 -7,070 -818 -866 -7,980 -1,999,746 119 -506,876
Income 120,594 82,614 27,966 250,622 61,263 14,160 176,948 56,937 37,361 595,989 73,564 15,539
Gain/Loss -1,153,619 1,436,157 1,958,028 627,744 1,649,123 3,383,050 -4,977,565 -2,368,440 -254,808 376,943 848,177 752,955
Ending Market Value 50,120,637 51,153,662 49,134,892 47,655,341 46,776,870 45,067,935 41,677,795 46,479,230 48,791,600 49,017,027 50,043,842 49,121,981
Vanguard - S&P 500 Inst. Index(02/23/2015)
Beginning Market Value 15,012,266 14,005,790 13,739,869 13,472,235 12,555,318 10,613,618 11,252,857 12,262,664 12,267,736 13,856,735 13,371,796 13,576,480
Net Contributions - - -500,000 - 300,000 550,000 750,000 - - -2,000,000 - -500,000
Income 60,197 - - 66,832 - - 114,274 - - 147,214 - -
Gain/Loss -631,291 1,006,476 765,921 200,801 616,917 1,391,700 -1,503,513 -1,009,807 -5,072 263,787 484,940 295,315
Ending Market Value 14,441,171 15,012,266 14,005,790 13,739,869 13,472,235 12,555,318 10,613,618 11,252,857 12,262,664 12,267,736 13,856,735 13,371,796
iShares Core S&P Mid-Cap ETF 090765
Beginning Market Value 2,410,591 2,327,782 2,226,261 2,197,053 2,048,113 1,794,642 2,250,887 2,486,707 2,553,284 2,483,967 2,412,754 2,387,162
Net Contributions -68 -310 - - - - - -1 -87 1 1 1
Income 10,429 - - 8,100 - - 9,935 - 1 11,203 12 14
Gain/Loss -90,864 83,120 101,521 21,108 148,940 253,472 -466,181 -235,819 -66,491 58,112 71,200 25,578
Ending Market Value 2,330,088 2,410,591 2,327,782 2,226,261 2,197,053 2,048,113 1,794,642 2,250,887 2,486,707 2,553,284 2,483,967 2,412,754
Columbia Acorn Fund 090764
Beginning Market Value 2,748,147 2,673,051 2,530,012 2,504,660 2,242,267 1,971,355 2,308,717 2,499,549 2,504,660 2,480,428 2,333,864 2,308,539
Net Contributions - - - - - - - - - - - -164
Income - - - 119,736 - - - - - 161,169 - -
Gain/Loss 19,668 75,096 143,040 -94,385 262,393 270,912 -337,362 -190,831 -5,112 -136,937 146,563 25,489
Ending Market Value 2,767,815 2,748,147 2,673,051 2,530,012 2,504,660 2,242,267 1,971,355 2,308,717 2,499,549 2,504,660 2,480,428 2,333,864
London - Small Cap Core - 150666
Beginning Market Value 3,341,386 3,188,715 3,027,237 3,000,251 2,875,836 2,598,128 3,176,856 3,493,737 3,618,104 3,594,688 3,511,624 3,448,579
Net Contributions - - 9 10 -1,587 15 -927 -955 -1,058 58 22 10
Income 2,474 3,030 3,432 3,604 1,832 3,435 9,010 2,534 6,852 5,834 2,355 2,696
Gain/Loss -159,233 149,641 158,037 23,372 124,170 274,258 -586,811 -318,460 -130,161 17,524 80,686 60,339
Ending Market Value 3,184,627 3,341,386 3,188,715 3,027,237 3,000,251 2,875,836 2,598,128 3,176,856 3,493,737 3,618,104 3,594,688 3,511,624
Wilmette Fire Pension Fund Month-to Month Report
As of September 30, 2020
Page 8

Wilmette Fire Pension Fund Month-to Month Report
As of September 30, 2020Sep-2020 Aug-2020 Jul-2020 Jun-2020 May-2020 Apr-2020 Mar-2020 Feb-2020 Jan-2020 Dec-2019 Nov-2019 Oct-2019
Small Cap 600 ETF - 077128
Beginning Market Value 558,400 537,620 515,577 497,644 476,652 422,178 545,197 602,795 628,037 609,812 591,997 580,586
Net Contributions -3 -56 - - - - - - - -53 - -367
Income 2,182 - - 1,767 - - 1,886 - - 3,067 - -
Gain/Loss -28,235 20,835 22,043 16,166 20,992 54,474 -124,906 -57,598 -25,241 15,211 17,815 11,777
Ending Market Value 532,343 558,400 537,620 515,577 497,644 476,652 422,178 545,197 602,795 628,037 609,812 591,997
Vanguard REIT Index Fund
Beginning Market Value 1,363,617 1,357,028 1,310,193 1,278,951 1,257,045 1,154,738 1,430,223 1,539,138 1,521,332 1,509,072 1,528,175 1,511,932
Net Contributions - - - - - - - - - - - -
Income 9,842 - - 12,527 - - 10,615 - - 15,515 - -
Gain/Loss -45,878 6,590 46,835 18,715 21,906 102,307 -286,100 -108,914 17,806 -3,255 -19,104 16,244
Ending Market Value 1,327,582 1,363,617 1,357,028 1,310,193 1,278,951 1,257,045 1,154,738 1,430,223 1,539,138 1,521,332 1,509,072 1,528,175
Amerifunds - International Equity - 150605
Beginning Market Value 3,333,509 3,158,982 2,987,845 2,829,133 2,653,477 2,433,766 2,854,550 3,042,067 3,137,519 3,008,312 2,948,004 2,849,865
Net Contributions - - - - - - - - - - - -
Income - - - - - - - - - 91,313 - -
Gain/Loss -57,046 174,526 171,137 158,712 175,656 219,711 -420,783 -187,517 -95,453 37,894 60,309 98,139
Ending Market Value 3,276,463 3,333,509 3,158,982 2,987,845 2,829,133 2,653,477 2,433,766 2,854,550 3,042,067 3,137,519 3,008,312 2,948,004
Tweedy Browne Global Value 087515
Beginning Market Value 898,949 872,233 873,316 858,875 842,629 794,613 916,639 990,649 1,010,505 997,024 986,040 980,373
Net Contributions - - - - - - - - - - - -2
Income - - - - - - - - - 18,601 - -
Gain/Loss -24,911 26,716 -1,083 14,441 16,246 48,016 -122,026 -74,010 -19,856 -5,120 10,984 5,669
Ending Market Value 874,038 898,949 872,233 873,316 858,875 842,629 794,613 916,639 990,649 1,010,505 997,024 986,040
iShares Core MSCI EAFE 087512
Beginning Market Value 1,003,275 953,181 933,582 904,156 855,745 805,075 943,046 1,023,893 1,052,778 1,016,078 1,006,685 972,381
Net Contributions - -45 - - - - - - - -32 - -85
Income - - - 11,295 - - - - - 14,015 - -
Gain/Loss -18,782 50,139 19,598 18,132 48,411 50,670 -137,971 -80,846 -28,885 22,716 9,393 34,389
Ending Market Value 984,493 1,003,275 953,181 933,582 904,156 855,745 805,075 943,046 1,023,893 1,052,778 1,016,078 1,006,685
Page 9

Wilmette Fire Pension Fund Month-to Month Report
As of September 30, 2020Sep-2020 Aug-2020 Jul-2020 Jun-2020 May-2020 Apr-2020 Mar-2020 Feb-2020 Jan-2020 Dec-2019 Nov-2019 Oct-2019
JOHCM International 087513
Beginning Market Value 1,184,302 1,145,070 1,080,832 1,041,600 964,428 875,616 955,806 1,038,151 1,035,564 1,013,403 980,520 962,584
Net Contributions - - - - - - - - - - - -1
Income - - - - - - - - - 9,727 - -
Gain/Loss 2,587 39,232 64,238 39,232 77,171 88,812 -80,189 -82,345 2,587 12,433 32,883 17,936
Ending Market Value 1,186,889 1,184,302 1,145,070 1,080,832 1,041,600 964,428 875,616 955,806 1,038,151 1,035,564 1,013,403 980,520
American New World -087508
Beginning Market Value 1,332,247 1,271,627 1,197,866 1,123,580 1,055,951 961,692 1,137,421 1,207,327 1,234,659 1,186,949 1,166,240 1,131,895
Net Contributions - - - - - - - - - - - -
Income - - - - - - - - - 48,023 - -
Gain/Loss -36,267 60,620 73,761 74,286 67,629 94,259 -175,729 -69,906 -27,332 -314 20,708 34,346
Ending Market Value 1,295,980 1,332,247 1,271,627 1,197,866 1,123,580 1,055,951 961,692 1,137,421 1,207,327 1,234,659 1,186,949 1,166,240
Lazard - Emerging Markets Equity - 150647
Beginning Market Value 2,037,999 2,058,967 1,955,346 1,898,825 1,862,490 1,738,683 2,174,700 2,333,496 2,486,909 2,319,537 2,320,861 2,237,459
Net Contributions - - - - - - - - - - - -6
Income - 29,171 - - - - - - - 39,903 - -
Gain/Loss -32,761 -50,140 103,621 56,521 36,335 123,807 -436,017 -158,796 -153,413 127,468 -1,324 83,408
Ending Market Value 2,005,238 2,037,999 2,058,967 1,955,346 1,898,825 1,862,490 1,738,683 2,174,700 2,333,496 2,486,909 2,319,537 2,320,861
Spare - Max Flex Fixed Income - 150603
Beginning Market Value 2,391,260 2,392,061 2,369,274 2,361,706 2,361,746 3,185,399 4,400,107 4,348,144 4,307,218 4,304,281 4,302,221 4,292,394
Net Contributions - - -1,286 19 29 -852,187 -1,249,983 29 -2,115 25 25 -2,114
Income 2,439 13,181 1,852 2,196 1,761 804 2,492 19,885 2,016 8,005 14,409 960
Gain/Loss 579 -13,982 22,222 5,353 -1,830 27,730 32,784 32,049 41,023 -5,093 -12,374 10,981
Ending Market Value 2,394,277 2,391,260 2,392,061 2,369,274 2,361,706 2,361,746 3,185,399 4,400,107 4,348,144 4,307,218 4,304,281 4,302,221
Spare - Flex Fixed Income - 150602
Beginning Market Value 4,721,086 4,756,472 4,687,716 4,652,766 4,622,621 4,511,939 4,575,360 4,491,002 4,399,170 4,402,268 4,406,123 4,396,465
Net Contributions - - -2,306 47 59 -2,199 54 53 -2,145 34 34 -2,152
Income 8,326 21,615 5,914 8,527 16,117 4,742 8,488 18,647 8,401 8,755 14,826 4,935
Gain/Loss -16,176 -57,001 65,148 26,376 13,968 108,139 -71,963 65,659 85,576 -11,887 -18,715 6,876
Ending Market Value 4,713,236 4,721,086 4,756,472 4,687,716 4,652,766 4,622,621 4,511,939 4,575,360 4,491,002 4,399,170 4,402,268 4,406,123
Page 10

Wilmette Fire Pension Fund Month-to Month Report
As of September 30, 2020Sep-2020 Aug-2020 Jul-2020 Jun-2020 May-2020 Apr-2020 Mar-2020 Feb-2020 Jan-2020 Dec-2019 Nov-2019 Oct-2019
Weaver - Fixed Income - 150676
Beginning Market Value 8,308,322 7,928,457 7,712,603 7,647,672 7,586,007 7,308,914 7,549,445 7,424,876 7,252,244 7,254,131 7,247,930 7,217,199
Net Contributions - 500,000 -2,861 27 47 -2,701 37 5 -2,665 79 36 -2,661
Income 24,676 15,577 16,725 15,989 41,400 5,009 20,231 15,862 20,081 13,631 41,952 6,923
Gain/Loss -35,009 -135,712 201,990 48,914 20,219 274,784 -260,798 108,702 155,216 -15,597 -35,788 26,468
Ending Market Value 8,297,989 8,308,322 7,928,457 7,712,603 7,647,672 7,586,007 7,308,914 7,549,445 7,424,876 7,252,244 7,254,131 7,247,930
Vanguard Money Market
Beginning Market Value 500,453 500,415 500,374 500,328 800,177 500,010 10 - - - - -
Net Contributions - - - - -300,000 300,000 499,990 - - - - -
Income 28 37 42 46 150 167 10 - - - - -
Gain/Loss - - - - - - - - - - - -
Ending Market Value 500,481 500,453 500,415 500,374 500,328 800,177 500,010 - - - - -
Self Managed - Fixed Income - 150523
Beginning Market Value 7,855 7,442 7,439 7,436 7,432 7,428 7,419 7,408 7,309 7,157 7,145 6,471
Net Contributions 71 411 1 1 1 1 1 2 89 141 1 664
Income 2 2 2 2 2 3 7 9 10 11 10 11
Gain/Loss - - - - - - - - - - - -
Ending Market Value 7,928 7,855 7,442 7,439 7,436 7,432 7,428 7,419 7,408 7,309 7,157 7,145
Page 11

Portfolio Performance (%)
Risk/Return Analysis Since 01/03
Asset Allocation ($000)
Portfolio Characteristics vs. Custom Benchmark Since Inception
Wilmette Firemens Pension Fund Custom Benchmark
0.0
4.0
8.0
12.0
16.0
Ret
urn
(%)
Current Quarter
YTD 1Year
3Years
5Years
SinceInception
September 30, 2020 : $50,121
SegmentsMarket Value
($000)Allocation
(%)
Domestic Equity 22,538.32 44.97¢£
International Equity 9,955.95 19.86¢£
REITS 1,327.58 2.65¢£
Domestic Fixed Income 15,110.97 30.15¢£
Alternative Investment 299.86 0.60¢£
Cash Equivalent 887.95 1.77¢£
CurrentQuarter
YTD1
Year3
Years5
YearsSince
InceptionInception
Date
Wilmette Firemens Pension Fund 5.20 2.20 7.84 5.64 7.59 6.61 01/01/2003
Custom Benchmark 4.91 2.13 7.89 6.44 8.57 6.71 01/01/2003
CurrentQuarter
YTD1
Year3
Years5
YearsSince
InceptionInception
Date
Wilmette Firemens Pension Fund 01/01/2003
Beginning Market Value 47,655 49,017 48,860 45,573 39,193 20,281
Net Contributions 7 11 -2,482 -3,384 -5,410 -8,135
Fees/Expenses -13 -35 -49 -251 -384 -768
Income 231 828 1,514 4,093 6,148 17,125
Gain/Loss 2,241 300 2,278 4,089 10,573 21,616
Ending Market Value 50,121 50,121 50,121 50,121 50,121 50,121
Beta Alpha R-SquaredSharpeRatio
InceptionDate
Wilmette Firemens Pension Fund 1.00 -0.07 0.97 0.68 01/01/2003
Custom Benchmark 1.00 0.00 1.00 0.69 01/01/2003
90-Day T-Bills 0.00 1.29 0.00 N/A 01/01/2003
Wilmette Firemens Pension Fund Custom Benchmark
6.5
6.6
6.7
6.8
Ret
urn
(%)
7.9 8.0 8.1 8.2
Risk (Standard Deviation %)
Wilmette Firemens Pension Fund Custom Benchmark
$0
$1,500
$3,000
$4,500
12/02 6/04 12/05 6/07 12/08 6/10 12/11 6/13 12/14 6/16 12/17 6/19 9/20
$3,166$3,113
Wilmette Firemens Pension Fund As of 09/30/20
Page 12

Risk/Return Analysis Since 08/09
Asset Allocation ($000)
Portfolio Characteristics vs. BC Gov 1-3 Yr Since Inception
Portfolio Performance (%)
Spare - Max Flex Fixed Income - 150603 BC Gov 1-3 Yr
0.0
3.0
6.0
9.0
Ret
urn
(%)
Current Quarter
YTD 1Year
3Years
5Years
SinceInception
September 30, 2020 : $2,394
SegmentsMarket Value
($000)Allocation
(%)
Domestic Fixed Income 2,259.83 94.38¢£
Cash Equivalent 134.45 5.62¢£
CurrentQuarter
YTD1
Year3
Years5
YearsSince
InceptionInception
Date
Spare - Max Flex Fixed Income - 150603 1.11 5.29 5.71 3.46 2.43 2.52 08/01/2009
BC Gov 1-3 Yr 0.10 3.09 3.62 2.66 1.82 1.46 08/01/2009
CurrentQuarter
YTD1
Year3
Years5
YearsSince
InceptionInception
Date
Spare - Max Flex Fixed Income - 150603 08/01/2009
Beginning Market Value 2,369 4,307 4,292 4,113 4,553 4,460
Net Contributions 1 -2,099 -2,098 -2,096 -2,595 -3,171
Fees/Expenses -2 -7 -9 -28 -50 -174
Income 17 47 70 266 461 1,409
Gain/Loss 9 146 139 139 25 -130
Ending Market Value 2,394 2,394 2,394 2,394 2,394 2,394
Beta Alpha R-SquaredSharpeRatio
InceptionDate
Spare - Max Flex Fixed Income - 150603 1.66 0.09 0.67 1.04 08/01/2009
BC Gov 1-3 Yr 1.00 0.00 1.00 1.02 08/01/2009
90-Day T-Bills 0.07 0.45 0.09 N/A 08/01/2009
Spare - Max Flex Fixed Income - 150603
BC Gov 1-3 Yr
1.0
1.5
2.0
2.5
3.0
Ret
urn
(%)
0.4 0.6 0.8 1.0 1.2 1.4 1.6 1.8 2.0 2.2 2.4
Risk (Standard Deviation %)
Spare - Max Flex Fixed Income - 150603 BC Gov 1-3 Yr
Net Cash Flow
($2,000)
$0
$2,000
$4,000
$6,000
$8,000
7/09 7/10 7/11 7/12 7/13 7/14 7/15 7/16 7/17 7/18 7/19 9/20
$1,115$1,782$2,394
Spare - Max Flex Fixed Income - 150603 As of 09/30/20
Page 13

Risk/Return Analysis Since 01/03
Asset Allocation ($000)
Portfolio Characteristics vs. Custom Benchmark - SKBA Flex SinceInception
Portfolio Performance (%)
Spare - Flex Fixed Income - 150602 Custom Benchmark - SKBA Flex
0.0
3.0
6.0
9.0
12.0
Ret
urn
(%)
Current Quarter
YTD 1Year
3Years
5Years
SinceInception
September 30, 2020 : $4,713
SegmentsMarket Value
($000)Allocation
(%)
Domestic Fixed Income 4,575.61 97.08¢£
Cash Equivalent 137.62 2.92¢£
CurrentQuarter
YTD1
Year3
Years5
YearsSince
InceptionInception
Date
Spare - Flex Fixed Income - 150602 0.59 7.29 7.41 5.33 4.02 4.24 01/01/2003
Custom Benchmark - SKBA Flex 0.78 8.04 8.03 5.86 4.66 4.29 01/01/2003
CurrentQuarter
YTD1
Year3
Years5
YearsSince
InceptionInception
Date
Spare - Flex Fixed Income - 150602 01/01/2003
Beginning Market Value 4,688 4,399 4,396 4,059 3,618 7,245
Net Contributions 1 2 2 6 307 -6,723
Fees/Expenses -3 -8 -11 -32 -52 -151
Income 36 101 129 388 666 4,087
Gain/Loss -8 220 196 293 174 255
Ending Market Value 4,713 4,713 4,713 4,713 4,713 4,713
Beta Alpha R-SquaredSharpeRatio
InceptionDate
Spare - Flex Fixed Income - 150602 0.96 0.11 0.96 0.76 01/01/2003
Custom Benchmark - SKBA Flex 1.00 0.00 1.00 0.76 01/01/2003
90-Day T-Bills 0.01 1.25 0.01 N/A 01/01/2003
Spare - Flex Fixed Income - 150602
Custom Benchmark - SKBA Flex
4.2
4.3
4.4
Ret
urn
(%)
3.8 3.9 4.0
Risk (Standard Deviation %)
Spare - Flex Fixed Income - 150602 Custom Benchmark - SKBA Flex
Net Cash Flow
($4,000)
$0
$4,000
$8,000
$12,000
$16,000
12/02 6/04 12/05 6/07 12/08 6/10 12/11 6/13 12/14 6/16 12/17 6/19 9/20
$371
$4,677$4,713
Spare - Flex Fixed Income - 150602 As of 09/30/20
Page 14

Risk/Return Analysis Since 06/11
Asset Allocation ($000)
Portfolio Characteristics vs. Weaver Custom Benchmark Since Inception
Portfolio Performance (%)
Weaver - Fixed Income - 150676 Weaver Custom Benchmark
0.0
4.0
8.0
12.0
16.0
Ret
urn
(%)
Current Quarter
YTD 1Year
3Years
5Years
SinceInception
September 30, 2020 : $8,298
SegmentsMarket Value
($000)Allocation
(%)
Domestic Fixed Income 8,275.21 99.73¢£
Cash Equivalent 22.78 0.27¢£
CurrentQuarter
YTD1
Year3
Years5
YearsSince
InceptionInception
Date
Weaver - Fixed Income - 150676 1.25 7.76 8.32 6.00 4.94 4.44 06/01/2011
Weaver Custom Benchmark 0.88 5.85 6.56 4.74 3.86 3.51 06/01/2011
CurrentQuarter
YTD1
Year3
Years5
YearsSince
InceptionInception
Date
Weaver - Fixed Income - 150676 06/01/2011
Beginning Market Value 7,713 7,252 7,217 6,583 5,891 5,049
Net Contributions 502 503 503 509 811 819
Fees/Expenses -5 -11 -14 -39 -63 -127
Income 57 176 238 678 1,032 1,708
Gain/Loss 31 378 353 568 627 849
Ending Market Value 8,298 8,298 8,298 8,298 8,298 8,298
Beta Alpha R-SquaredSharpeRatio
InceptionDate
Weaver - Fixed Income - 150676 1.29 -0.06 0.88 1.00 06/01/2011
Weaver Custom Benchmark 1.00 0.00 1.00 1.03 06/01/2011
90-Day T-Bills 0.01 0.61 0.01 N/A 06/01/2011
Weaver - Fixed Income - 150676 Weaver Custom Benchmark
3.0
3.5
4.0
4.5
5.0
Ret
urn
(%)
2.2 2.4 2.6 2.8 3.0 3.2 3.4 3.6 3.8 4.0 4.2
Risk (Standard Deviation %)Weaver - Fixed Income - 150676 Weaver Custom Benchmark
Net Cash Flow
$3,000
$4,500
$6,000
$7,500
$9,000
$10,500
5/11 2/12 11/12 8/13 5/14 2/15 11/15 8/16 5/17 2/18 11/18 8/19 9/20
$5,741
$7,688$8,298
Weaver - Fixed Income - 150676 As of 09/30/20
Page 15

Risk/Return Analysis Since 01/03
Asset Allocation ($000)
Portfolio Characteristics vs. S&P 500 Total Return Since Inception
Portfolio Performance (%)
Vanguard - S&P 500 Inst. Index(02/23/2015) S&P 500 Total Return
0.0
6.0
12.0
18.0
24.0
Ret
urn
(%)
Current Quarter
YTD 1Year
3Years
5Years
SinceInception
September 30, 2020 : $14,441
SegmentsMarket Value
($000)Allocation
(%)
Domestic Equity 14,441.17 100.00¢£
CurrentQuarter
YTD1
Year3
Years5
Years
SinceInceptio
n
InceptionDate
Vanguard - S&P 500 Inst. Index(02/23/2015) 8.97 6.15 16.05 12.57 14.37 10.27 01/01/2003
S&P 500 Total Return 8.93 5.57 15.15 12.28 14.15 10.06 01/01/2003
CurrentQuarter
YTD1
Year3
Years5
YearsSince
InceptionInception
Date
Vanguard - S&P 500 Inst. Index(02/23/2015) 01/01/2003
Beginning Market Value 13,740 12,268 13,576 12,034 10,094 3,624
Net Contributions -500 1,100 -1,400 -2,450 -4,050 -4,990
Fees/Expenses - - - - - -
Income 60 241 389 920 1,397 3,005
Gain/Loss 1,141 832 1,876 3,938 7,000 12,803
Ending Market Value 14,441 14,441 14,441 14,441 14,441 14,441
Beta Alpha R-SquaredSharpeRatio
InceptionDate
Vanguard - S&P 500 Inst. Index(02/23/2015) 1.00 0.26 0.97 0.67 01/01/2003
S&P 500 Total Return 1.00 0.00 1.00 0.66 01/01/2003
90-Day T-Bills 0.00 1.30 0.00 N/A 01/01/2003
Vanguard - S&P 500 Inst. Index(02/23/2015)
S&P 500 Total Return
9.8
10.0
10.2
10.4
Ret
urn
(%)
14.0 14.1 14.2 14.3 14.4
Risk (Standard Deviation %)
Vanguard - S&P 500 Inst. Index(02/23/2015) S&P 500 Total Return
Net Cash Flow
($8,000)
$0
$8,000
$16,000
$24,000
12/02 6/04 12/05 6/07 12/08 6/10 12/11 6/13 12/14 6/16 12/17 6/19 9/20
($1,367)
$14,463$14,441
Vanguard - S&P 500 Inst. Index(02/23/2015) As of 09/30/20
Page 16

Risk/Return Analysis Since 06/19
Asset Allocation ($000)
Portfolio Characteristics vs. S&P 400 MidCap Net Since Inception
Portfolio Performance (%)
iShares Core S&P Mid-Cap ETF 090765 S&P 400 MidCap Net
0.0
8.0
16.0
-8.0
-16.0
Ret
urn
(%)
Current Quarter
YTD 1Year
3Years
5Years
SinceInception
September 30, 2020 : $2,330
SegmentsMarket Value
($000)Allocation
(%)
Domestic Equity 2,330.09 100.00¢£
CurrentQuarter
YTD1
Year3
Years5
YearsSince
InceptionInception
Date
iShares Core S&P Mid-Cap ETF 090765 4.68 -8.72 -2.37 N/A N/A 3.79 06/01/2019
S&P 400 MidCap Net 4.65 -8.97 -2.66 2.39 7.57 3.34 06/01/2019
CurrentQuarter
YTD1
Year3
Years5
YearsSince
InceptionInception
Date
iShares Core S&P Mid-Cap ETF 090765 06/01/2019
Beginning Market Value 2,226 2,553 2,387 - - 2,218
Net Contributions - - 1 - - 1
Fees/Expenses - -1 -1 - - -1
Income 10 28 40 - - 61
Gain/Loss 94 -251 -96 - - 52
Ending Market Value 2,330 2,330 2,330 - - 2,330
Beta Alpha R-SquaredSharpeRatio
InceptionDate
iShares Core S&P Mid-Cap ETF 090765 1.00 0.42 1.00 0.23 06/01/2019
S&P 400 MidCap Net 1.00 0.00 1.00 0.21 06/01/2019
90-Day T-Bills 0.00 1.35 0.02 N/A 06/01/2019
iShares Core S&P Mid-Cap ETF 090765
S&P 400 MidCap Net
3.0
3.3
3.6
3.9
4.2
Ret
urn
(%)
26.0 26.1
Risk (Standard Deviation %)
iShares Core S&P Mid-Cap ETF 090765 S&P 400 MidCap Net
Net Cash Flow
$1,500
$1,800
$2,100
$2,400
$2,700
$3,000
5/19 8/19 11/19 2/20 5/20 8/20 9/20
$2,217$2,317$2,330
iShares Core S&P Mid-Cap ETF 090765 As of 09/30/20
Page 17

Risk/Return Analysis Since 06/19
Asset Allocation ($000)
Portfolio Characteristics vs. Russell 2500 GR Since Inception
Portfolio Performance (%)
Columbia Acorn Fund 090764 Russell 2500 GR
0.0
10.0
20.0
30.0
40.0
Ret
urn
(%)
Current Quarter
YTD 1Year
3Years
5Years
SinceInception
September 30, 2020 : $2,768
SegmentsMarket Value
($000)Allocation
(%)
Domestic Equity 2,767.81 100.00¢£
CurrentQuarter
YTD1
Year3
Years5
YearsSince
InceptionInception
Date
Columbia Acorn Fund 090764 9.40 10.51 19.90 N/A N/A 16.23 06/01/2019
Russell 2500 GR 9.37 11.58 23.38 13.36 14.19 20.80 06/01/2019
CurrentQuarter
YTD1
Year3
Years5
YearsSince
InceptionInception
Date
Columbia Acorn Fund 090764 06/01/2019
Beginning Market Value 2,530 2,505 2,309 - - 2,265
Net Contributions 1 1 1 - - 1
Fees/Expenses -1 -1 -1 - - -1
Income - 120 281 - - 383
Gain/Loss 238 143 179 - - 120
Ending Market Value 2,768 2,768 2,768 - - 2,768
Beta Alpha R-SquaredSharpeRatio
InceptionDate
Columbia Acorn Fund 090764 0.89 -2.06 0.97 0.72 06/01/2019
Russell 2500 GR 1.00 0.00 1.00 0.83 06/01/2019
90-Day T-Bills 0.00 1.39 0.05 N/A 06/01/2019
Columbia Acorn Fund 090764 Russell 2500 GR
12.0
15.0
18.0
21.0
24.0
Ret
urn
(%)
21.6 22.2 22.8 23.4 24.0 24.6 25.2 25.8 26.4 27.0
Risk (Standard Deviation %)Columbia Acorn Fund 090764 Russell 2500 GR
Net Cash Flow
$1,600
$2,000
$2,400
$2,800
$3,200
5/19 8/19 11/19 2/20 5/20 8/20 9/20
$2,265
$2,916$2,768
Columbia Acorn Fund 090764 As of 09/30/20
Page 18

Risk/Return Analysis Since 01/11
Asset Allocation ($000)
Portfolio Characteristics vs. Russell 2000 Since Inception
Portfolio Performance (%)
London - Small Cap Core - 150666 Russell 2000
0.0
10.0
20.0
-10.0
-20.0
Ret
urn
(%)
Current Quarter
YTD 1Year
3Years
5Years
SinceInception
September 30, 2020 : $3,185
SegmentsMarket Value
($000)Allocation
(%)
Domestic Equity 2,466.91 77.46¢£
International Equity 332.85 10.45¢£
Alternative Investment 299.86 9.42¢£
Cash Equivalent 85.01 2.67¢£
CurrentQuarter
YTD1
Year3
Years5
YearsSince
InceptionInception
Date
London - Small Cap Core - 150666 5.20 -11.86 -7.53 2.05 4.08 7.26 01/01/2011
Russell 2000 4.93 -8.69 0.39 1.77 8.00 8.42 01/01/2011
CurrentQuarter
YTD1
Year3
Years5
YearsSince
InceptionInception
Date
London - Small Cap Core - 150666 01/01/2011
Beginning Market Value 3,027 3,618 3,449 3,001 2,702 322
Net Contributions 1 1 5 60 -14 1,646
Fees/Expenses -1 -6 -9 -64 -90 -137
Income 9 36 47 184 266 441
Gain/Loss 148 -465 -307 4 321 912
Ending Market Value 3,185 3,185 3,185 3,185 3,185 3,185
Beta Alpha R-SquaredSharpeRatio
InceptionDate
London - Small Cap Core - 150666 0.86 0.04 0.85 0.46 01/01/2011
Russell 2000 1.00 0.00 1.00 0.51 01/01/2011
90-Day T-Bills 0.00 0.63 0.01 N/A 01/01/2011
London - Small Cap Core - 150666 Russell 2000
6.6
7.2
7.8
8.4
9.0
Ret
urn
(%)
16.2 16.5 16.8 17.1 17.4 17.7 18.0 18.3 18.6
Risk (Standard Deviation %)London - Small Cap Core - 150666 Russell 2000
Net Cash Flow
($1,500)
$0
$1,500
$3,000
$4,500
$6,000
12/10 12/11 12/12 12/13 12/14 12/15 12/16 12/17 12/18 12/19 9/20
$1,832
$3,693$3,185
London - Small Cap Core - 150666 As of 09/30/20
Page 19

Risk/Return Analysis Since 05/17
Asset Allocation ($000)
Portfolio Characteristics vs. S&P 600 SC Since Inception
Portfolio Performance (%)
Small Cap 600 ETF - 077128 S&P 600 SC
0.0
10.0
20.0
-10.0
-20.0
-30.0
Ret
urn
(%)
Current Quarter
YTD 1Year
3Years
5Years
SinceInception
September 30, 2020 : $532
SegmentsMarket Value
($000)Allocation
(%)
Domestic Equity 532.34 100.00¢£
CurrentQuarter
YTD1
Year3
Years5
YearsSince
InceptionInception
Date
Small Cap 600 ETF - 077128 3.26 -15.23 -8.24 -0.35 N/A 1.88 05/04/2017
S&P 600 SC 3.17 -15.25 -8.29 -0.33 7.20 1.82 05/04/2017
CurrentQuarter
YTD1
Year3
Years5
YearsSince
InceptionInception
Date
Small Cap 600 ETF - 077128 05/04/2017
Beginning Market Value 516 628 581 538 - 500
Net Contributions - - - - - -
Fees/Expenses - - - -1 - -1
Income 2 6 9 25 - 28
Gain/Loss 15 -101 -57 -30 - 5
Ending Market Value 532 532 532 532 - 532
Beta Alpha R-SquaredSharpeRatio
InceptionDate
Small Cap 600 ETF - 077128 1.00 0.23 1.00 0.13 05/04/2017
S&P 600 SC 1.00 0.00 1.00 0.12 05/04/2017
90-Day T-Bills 0.00 1.57 0.02 N/A 05/04/2017
Small Cap 600 ETF - 077128 S&P 600 SC
1.4
1.6
1.8
2.0
Ret
urn
(%)
22.0 22.1 22.2 22.3
Risk (Standard Deviation %)
Small Cap 600 ETF - 077128 S&P 600 SC Net Cash Flow
$300
$400
$500
$600
$700
$800
4/17 10/17 4/18 10/18 4/19 10/19 4/20 9/20
$500$528$532
Small Cap 600 ETF - 077128 As of 09/30/20
Page 20

Risk/Return Analysis Since 03/04
Asset Allocation ($000)
Portfolio Characteristics vs. MSCI AC World ex US Net Since Inception
Portfolio Performance (%)
Amerifunds - International Equity - 150605 MSCI AC World ex US Net
0.0
10.0
20.0
30.0
-10.0
-20.0
Ret
urn
(%)
Current Quarter
YTD 1Year
3Years
5Years
SinceInception
September 30, 2020 : $3,276
SegmentsMarket Value
($000)Allocation
(%)
International Equity 3,276.46 100.00¢£
CurrentQuarter
YTD1
Year3
Years5
YearsSince
InceptionInception
Date
Amerifunds - International Equity - 150605 9.66 4.43 14.97 5.66 9.05 7.62 03/01/2004
MSCI AC World ex US Net 6.25 -5.44 3.00 1.16 6.23 5.32 03/01/2004
CurrentQuarter
YTD1
Year3
Years5
YearsSince
InceptionInception
Date
Amerifunds - International Equity - 150605 03/01/2004
Beginning Market Value 2,988 3,138 2,850 2,778 2,124 250
Net Contributions 1 1 1 4 5 1,155
Fees/Expenses -1 -1 -1 -4 -5 -5
Income - - 91 337 498 941
Gain/Loss 289 139 335 161 654 936
Ending Market Value 3,276 3,276 3,276 3,276 3,276 3,276
Beta Alpha R-SquaredSharpeRatio
InceptionDate
Amerifunds - International Equity - 150605 0.93 2.53 0.96 0.46 03/01/2004
MSCI AC World ex US Net 1.00 0.00 1.00 0.32 03/01/2004
90-Day T-Bills 0.00 1.29 0.00 N/A 03/01/2004
Amerifunds - International Equity - 150605
MSCI AC World ex US Net
4.0
6.0
8.0
10.0
Ret
urn
(%)
15.6 15.9 16.2 16.5 16.8 17.1 17.4
Risk (Standard Deviation %)
Amerifunds - International Equity - 150605 MSCI AC World ex US Net
Net Cash Flow
($1,500)
$0
$1,500
$3,000
$4,500
2/04 8/05 2/07 8/08 2/10 8/11 2/13 8/14 2/16 8/17 2/19 9/20
$1,400
$2,352
$3,276
Amerifunds - International Equity - 150605 As of 09/30/20
Page 21

Risk/Return Analysis Since 05/10
Asset Allocation ($000)
Portfolio Characteristics vs. MSCI EM Net Since Inception
Portfolio Performance (%)
Lazard - Emerging Markets Equity - 150647 MSCI EM Net
0.0
15.0
30.0
-15.0
-30.0
-45.0
Ret
urn
(%)
Current Quarter
YTD 1Year
3Years
5Years
SinceInception
September 30, 2020 : $2,005
SegmentsMarket Value
($000)Allocation
(%)
International Equity 2,005.24 100.00¢£
CurrentQuarter
YTD1
Year3
Years5
Years
SinceInceptio
n
InceptionDate
Lazard - Emerging Markets Equity - 150647 2.55 -19.37 -10.38 -6.11 3.68 0.28 05/01/2010
MSCI EM Net 9.56 -1.16 10.54 2.42 8.97 3.05 05/01/2010
CurrentQuarter
YTD1
Year3
Years5
YearsSince
InceptionInception
Date
Lazard - Emerging Markets Equity - 150647 05/01/2010
Beginning Market Value 1,955 2,487 2,237 3,531 2,439 296
Net Contributions - 1 1 -966 -964 1,721
Fees/Expenses - -1 -1 -4 -5 -5
Income 29 29 69 192 293 788
Gain/Loss 21 -511 -301 -749 242 -795
Ending Market Value 2,005 2,005 2,005 2,005 2,005 2,005
Beta Alpha R-SquaredSharpeRatio
InceptionDate
Lazard - Emerging Markets Equity - 150647 1.00 -2.53 0.91 0.08 05/01/2010
MSCI EM Net 1.00 0.00 1.00 0.23 05/01/2010
90-Day T-Bills 0.00 0.59 0.00 N/A 05/01/2010
Lazard - Emerging Markets Equity - 150647
MSCI EM Net
-1.5
0.0
1.5
3.0
4.5
Ret
urn
(%)
17.4 17.6 17.8 18.0 18.2 18.4 18.6 18.8 19.0 19.2
Risk (Standard Deviation %)
Lazard - Emerging Markets Equity - 150647 MSCI EM Net
Net Cash Flow
($1,500)
$0
$1,500
$3,000
$4,500
$6,000
4/10 4/11 4/12 4/13 4/14 4/15 4/16 4/17 4/18 4/19 9/20
$2,012$2,742$2,005
Lazard - Emerging Markets Equity - 150647 As of 09/30/20
Page 22

Risk/Return Analysis Since 05/14
Asset Allocation ($000)
Portfolio Characteristics vs. FTSE Nareit All Equity REIT Index SinceInception
Portfolio Performance (%)
Vanguard REIT Index Fund FTSE Nareit All Equity REIT Index
0.0
8.0
16.0
-8.0
-16.0
-24.0
Ret
urn
(%)
Current Quarter
YTD 1Year
3Years
5Years
SinceInception
September 30, 2020 : $1,328
SegmentsMarket Value
($000)Allocation
(%)
REITS 1,327.58 100.00¢£
CurrentQuarter
YTD1
Year3
Years5
YearsSince
InceptionInception
Date
Vanguard REIT Index Fund 1.33 -12.73 -12.19 2.37 5.21 5.81 05/01/2014
FTSE Nareit All Equity REIT Index 1.19 -12.38 -11.81 2.37 4.71 4.90 05/01/2014
CurrentQuarter
YTD1
Year3
Years5
YearsSince
InceptionInception
Date
Vanguard REIT Index Fund 05/01/2014
Beginning Market Value 1,310 1,521 1,512 1,237 1,202 600
Net Contributions - - - - -200 350
Fees/Expenses - - - - - -
Income 10 33 48 157 272 330
Gain/Loss 8 -227 -233 -66 54 48
Ending Market Value 1,328 1,328 1,328 1,328 1,328 1,328
Beta Alpha R-SquaredSharpeRatio
InceptionDate
Vanguard REIT Index Fund 1.02 0.82 0.99 0.38 05/01/2014
FTSE Nareit All Equity REIT Index 1.00 0.00 1.00 0.33 05/01/2014
90-Day T-Bills 0.00 0.91 0.00 N/A 05/01/2014
Vanguard REIT Index Fund
FTSE Nareit All Equity REIT Index
4.5
5.0
5.5
6.0
6.5
Ret
urn
(%)
15.5 15.6 15.7 15.8 15.9 16.0 16.1 16.2 16.3
Risk (Standard Deviation %)
Vanguard REIT Index Fund FTSE Nareit All Equity REIT Index
Net Cash Flow
$0
$400
$800
$1,200
$1,600
$2,000
4/14 10/14 4/15 10/15 4/16 10/16 4/17 10/17 4/18 10/18 4/19 10/19 4/20 9/20
$950
$1,257$1,328
Vanguard REIT Index Fund As of 09/30/20
Page 23

Risk/Return Analysis Since 12/18
Asset Allocation ($000)
Portfolio Characteristics vs. MSCI ACWI Since Inception
Portfolio Performance (%)
American New World -087508 MSCI ACWI
0.0
6.0
12.0
18.0
24.0
Ret
urn
(%)
Current Quarter
YTD 1Year
3Years
5Years
SinceInception
September 30, 2020 : $1,296
SegmentsMarket Value
($000)Allocation
(%)
International Equity 1,295.98 100.00¢£
CurrentQuarter
YTD1
Year3
Years5
YearsSince
InceptionInception
Date
American New World -087508 8.19 4.97 14.50 N/A N/A 15.15 12/01/2018
MSCI ACWI 8.25 1.77 11.00 7.68 10.90 10.70 12/01/2018
CurrentQuarter
YTD1
Year3
Years5
YearsSince
InceptionInception
Date
American New World -087508 12/01/2018
Beginning Market Value 1,198 1,235 1,132 - - 1,001
Net Contributions - - 1 - - 1
Fees/Expenses - - -1 - - -1
Income - - 48 - - 73
Gain/Loss 98 61 116 - - 222
Ending Market Value 1,296 1,296 1,296 - - 1,296
Beta Alpha R-SquaredSharpeRatio
InceptionDate
American New World -087508 0.97 4.47 0.94 0.74 12/01/2018
MSCI ACWI 1.00 0.00 1.00 0.54 12/01/2018
90-Day T-Bills 0.00 1.67 0.03 N/A 12/01/2018
American New World -087508 MSCI ACWI
6.0
9.0
12.0
15.0
18.0
Ret
urn
(%)
19.4 19.5
Risk (Standard Deviation %)American New World -087508 MSCI ACWI
Net Cash Flow
$800
$1,000
$1,200
$1,400
$1,600
11/18 2/19 5/19 8/19 11/19 2/20 5/20 9/20
$1,001
$1,206$1,296
American New World -087508 As of 09/30/20
Page 24

Risk/Return Analysis Since 12/18
Asset Allocation ($000)
Portfolio Characteristics vs. MSCI EAFE Since Inception
Portfolio Performance (%)
JOHCM International 087513 MSCI EAFE
0.0
15.0
30.0
45.0
-15.0
-30.0
Ret
urn
(%)
Current Quarter
YTD 1Year
3Years
5Years
SinceInception
September 30, 2020 : $1,187
SegmentsMarket Value
($000)Allocation
(%)
International Equity 1,186.89 100.00¢£
CurrentQuarter
YTD1
Year3
Years5
YearsSince
InceptionInception
Date
JOHCM International 087513 9.81 14.61 23.30 N/A N/A 15.53 12/01/2018
MSCI EAFE 4.80 -7.09 0.49 0.62 5.26 4.21 12/01/2018
CurrentQuarter
YTD1
Year3
Years5
YearsSince
InceptionInception
Date
JOHCM International 087513 12/01/2018
Beginning Market Value 1,081 1,036 963 - - 911
Net Contributions - - - - - 1
Fees/Expenses - - - - - -1
Income - - 10 - - 23
Gain/Loss 106 151 215 - - 253
Ending Market Value 1,187 1,187 1,187 - - 1,187
Beta Alpha R-SquaredSharpeRatio
InceptionDate
JOHCM International 087513 0.83 11.63 0.82 0.88 12/01/2018
MSCI EAFE 1.00 0.00 1.00 0.23 12/01/2018
90-Day T-Bills 0.00 1.65 0.02 N/A 12/01/2018
JOHCM International 087513 MSCI EAFE
-10.0
0.0
10.0
20.0
30.0
Ret
urn
(%)
15.2 15.6 16.0 16.4 16.8 17.2 17.6 18.0
Risk (Standard Deviation %)JOHCM International 087513 MSCI EAFE
Net Cash Flow
$600
$750
$900
$1,050
$1,200
$1,350
11/18 2/19 5/19 8/19 11/19 2/20 5/20 9/20
$911$983
$1,187
JOHCM International 087513 As of 09/30/20
Page 25

Risk/Return Analysis Since 12/18
Asset Allocation ($000)
Portfolio Characteristics vs. MSCI EAFE IMI NT Since Inception
Portfolio Performance (%)
iShares Core MSCI EAFE 087512 MSCI EAFE IMI NT
0.0
6.0
12.0
-6.0
-12.0
Ret
urn
(%)
Current Quarter
YTD 1Year
3Years
5Years
SinceInception
September 30, 2020 : $984
SegmentsMarket Value
($000)Allocation
(%)
International Equity 984.49 100.00¢£
CurrentQuarter
YTD1
Year3
Years5
YearsSince
InceptionInception
Date
iShares Core MSCI EAFE 087512 5.46 -6.48 1.26 N/A N/A 4.48 12/01/2018
MSCI EAFE IMI NT 5.64 -6.32 1.81 1.20 6.05 5.04 12/01/2018
CurrentQuarter
YTD1
Year3
Years5
YearsSince
InceptionInception
Date
iShares Core MSCI EAFE 087512 12/01/2018
Beginning Market Value 934 1,053 972 - - 909
Net Contributions - - - - - 1
Fees/Expenses - - - - - -1
Income - 11 25 - - 56
Gain/Loss 51 -80 -13 - - 20
Ending Market Value 984 984 984 - - 984
Beta Alpha R-SquaredSharpeRatio
InceptionDate
iShares Core MSCI EAFE 087512 0.99 -0.49 0.99 0.25 12/01/2018
MSCI EAFE IMI NT 1.00 0.00 1.00 0.28 12/01/2018
90-Day T-Bills 0.00 1.65 0.02 N/A 12/01/2018
iShares Core MSCI EAFE 087512 MSCI EAFE IMI NT
4.5
4.8
5.1
5.4
Ret
urn
(%)
17.8 17.9 18.0
Risk (Standard Deviation %)iShares Core MSCI EAFE 087512 MSCI EAFE IMI NT
Net Cash Flow
$600
$750
$900
$1,050
$1,200
11/18 2/19 5/19 8/19 11/19 2/20 5/20 9/20
$908$994$984
iShares Core MSCI EAFE 087512 As of 09/30/20
Page 26

Risk/Return Analysis Since 12/18
Asset Allocation ($000)
Portfolio Characteristics vs. MSCI EAFE Since Inception
Portfolio Performance (%)
Tweedy Browne Global Value 087515 MSCI EAFE
0.0
10.0
20.0
-10.0
-20.0
-30.0
Ret
urn
(%)
Current Quarter
YTD 1Year
3Years
5Years
SinceInception
September 30, 2020 : $874
SegmentsMarket Value
($000)Allocation
(%)
International Equity 874.04 100.00¢£
CurrentQuarter
YTD1
Year3
Years5
YearsSince
InceptionInception
Date
Tweedy Browne Global Value 087515 0.08 -13.50 -10.85 N/A N/A -2.91 12/01/2018
MSCI EAFE 4.80 -7.09 0.49 0.62 5.26 4.21 12/01/2018
CurrentQuarter
YTD1
Year3
Years5
YearsSince
InceptionInception
Date
Tweedy Browne Global Value 087515 12/01/2018
Beginning Market Value 873 1,011 980 - - 923
Net Contributions - - - - - 1
Fees/Expenses - - - - - -1
Income - - 19 - - 74
Gain/Loss 1 -136 -125 - - -123
Ending Market Value 874 874 874 - - 874
Beta Alpha R-SquaredSharpeRatio
InceptionDate
Tweedy Browne Global Value 087515 0.86 -6.42 0.95 -0.22 12/01/2018
MSCI EAFE 1.00 0.00 1.00 0.23 12/01/2018
90-Day T-Bills 0.00 1.65 0.02 N/A 12/01/2018
Tweedy Browne Global Value 087515
MSCI EAFE
-8.0
-4.0
0.0
4.0
8.0
Ret
urn
(%)
14.0 14.5 15.0 15.5 16.0 16.5 17.0 17.5 18.0 18.5
Risk (Standard Deviation %)
Tweedy Browne Global Value 087515 MSCI EAFE
Net Cash Flow
$600
$750
$900
$1,050
$1,200
11/18 2/19 5/19 8/19 11/19 2/20 5/20 9/20
$923$995
$874
Tweedy Browne Global Value 087515 As of 09/30/20
Page 27

Risk/Return Analysis Since 01/03
Asset Allocation ($000)
Portfolio Characteristics vs. BC Gov Intm Since Inception
Portfolio Performance (%)
Self Managed - Fixed Income - 150523 BC Gov Intm
0.0
3.0
6.0
9.0
Ret
urn
(%)
Current Quarter
YTD 1Year
3Years
5Years
SinceInception
September 30, 2020 : $8
SegmentsMarket Value
($000)Allocation
(%)
Domestic Fixed Income 0.32 4.03¢£
Cash Equivalent 7.61 95.97¢£
CurrentQuarter
YTD1
Year3
Years5
YearsSince
InceptionInception
Date
Self Managed - Fixed Income - 150523 0.08 0.53 0.97 1.77 2.12 2.82 01/01/2003
BC Gov Intm 0.20 5.96 5.98 4.04 2.76 3.27 01/01/2003
CurrentQuarter
YTD1
Year3
Years5
YearsSince
InceptionInception
Date
Self Managed - Fixed Income - 150523 01/01/2003
Beginning Market Value 7 7 6 6 6 1,441
Net Contributions - 1 1 1 1 -1,496
Fees/Expenses - - - - - -
Income - - - - 1 161
Gain/Loss - - - - - -98
Ending Market Value 8 8 8 8 8 8
Beta Alpha R-SquaredSharpeRatio
InceptionDate
Self Managed - Fixed Income - 150523 0.05 2.65 0.01 0.87 01/01/2003
BC Gov Intm 1.00 0.00 1.00 0.73 01/01/2003
90-Day T-Bills 0.02 1.21 0.02 N/A 01/01/2003
Self Managed - Fixed Income - 150523
BC Gov Intm
2.4
2.7
3.0
3.3
3.6
Ret
urn
(%)
1.4 1.6 1.8 2.0 2.2 2.4 2.6 2.8 3.0 3.2
Risk (Standard Deviation %)
Self Managed - Fixed Income - 150523 BC Gov Intm
Net Cash Flow
($600)
$0
$600
$1,200
$1,800
$2,400
12/02 6/04 12/05 6/07 12/08 6/10 12/11 6/13 12/14 6/16 12/17 6/19 9/20
($55)$59$8
Self Managed - Fixed Income - 150523 As of 09/30/20
Page 28

January February March April May June July August September October November December Year
2003 -1.03 0.43 0.22 3.53 3.74 0.34 -1.05 1.26 0.91 2.00 0.58 2.63 14.28
2004 1.35 1.28 -0.20 -2.30 0.54 1.16 -1.35 1.09 0.83 1.22 1.78 2.20 7.78
2005 -0.98 0.68 -0.89 -0.33 1.84 0.83 1.45 0.02 0.47 -1.27 1.68 1.14 4.66
2006 1.70 -0.51 1.08 0.78 -2.74 0.84 0.74 1.11 2.34 1.97 0.73 1.31 9.66
2007 0.81 -0.03 0.70 2.47 1.43 -0.28 -0.91 1.37 2.27 1.56 -0.50 -0.17 9.01
2008 -1.59 -0.51 0.08 1.28 0.07 -3.35 -0.21 0.85 -4.37 -8.74 0.05 3.13 -13.01
2009 -4.86 -4.61 5.28 3.42 2.84 -0.17 4.54 2.04 2.55 -0.81 3.78 -0.10 14.11
2010 -1.42 1.50 2.93 1.09 -3.90 -1.20 4.11 -1.23 4.46 2.02 -0.84 2.57 10.18
2011 0.82 1.61 0.56 2.42 -0.33 -0.82 -0.22 -2.20 -4.18 5.19 -0.38 0.35 2.54
2012 3.26 2.35 0.41 0.28 -3.57 2.20 1.36 0.82 1.55 -0.30 0.69 0.78 10.08
2013 2.06 0.61 1.41 1.46 -0.05 -2.02 2.92 -1.98 3.10 2.67 1.30 1.13 13.18
2014 -2.50 2.83 0.87 0.35 1.84 1.43 -1.26 2.37 -2.55 1.35 1.56 -1.16 5.06
2015 -0.44 3.33 -0.30 0.74 0.02 -1.55 0.28 -4.45 -2.05 4.81 -0.34 -1.86 -2.12
2016 -2.83 0.02 5.61 0.76 0.51 0.63 3.16 -0.12 0.00 -1.88 1.03 1.41 8.34
2017 1.74 2.16 0.55 0.86 0.59 0.88 1.40 0.14 1.36 0.87 1.64 1.10 14.11
2018 3.46 -3.50 -0.54 -0.40 0.82 -0.15 1.94 0.49 -0.50 -5.26 1.37 -5.23 -7.63
2019 6.34 1.92 1.08 2.35 -3.66 4.78 0.61 -0.87 1.14 1.57 1.86 1.98 20.47
2020 -0.47 -4.74 -10.38 8.13 3.79 1.88 4.18 3.07 -2.03 N/A N/A N/A N/A
Wilmette Fire Pension FundWilmette Firemens Pension Fund
Since Inception Ending September 30, 2020
Page 29

Passive Portfolios Weight (%)
Custom Benchmark : Dec-2001
BC Gov 50.00
90-Day T-Bills 5.00
Russell 3000 40.00
MSCI EAFE Net 5.00
Custom Benchmark : Apr-2004
BC Gov 50.00
90-Day T-Bills 5.00
Russell 3000 40.00
MSCI AC World ex US Net 5.00
Custom Benchmark : Jul-2011
Barclays Govt/Credit Bond 48.00
90-Day T-Bills 2.00
S&P 500 Total Return 17.00
S&P 400 Midcap TR 3.00
Russell 2000 3.00
FTSE NAREIT All Equity REITS 3.00
MSCI AC World ex US Net 16.00
MSCI EM Net 8.00
Custom Benchmark : Apr-2013
Barclays Govt/Credit Bond 35.00
S&P 500 Total Return 25.00
S&P 400 Midcap TR 10.00
Russell 2000 7.00
FTSE NAREIT All Equity REITS 3.00
MSCI AC World ex US Net 12.00
MSCI EM Net 8.00
Passive Portfolios Weight (%)
Custom Benchmark - SKBA Flex : Dec-2002
BC Gov 100.00
Custom Benchmark - SKBA Flex : Jul-2011
Barclays Govt/Credit Bond 100.00
Wilmette Fire Pension Fund Custom Benchmark - Total Fund
As of September 30, 2020
Page 30

Passive Portfolios Weight (%)
Apr-2013
S&P 500 Total Return 56.00
S&P 400 Midcap TR 22.00
Russell 2000 15.00
FTSE NAREIT All Equity REITS 7.00
Wilmette Fire Pension Fund Custom Benchmark - US Equity
As of September 30, 2020
Page 31

Passive Portfolios Weight (%)
Weaver Custom Benchmark : Jun-2011
60 BC CORP GOV 40 BC GOV 100.00
Weaver Custom Benchmark : Jul-2013
BC Corp Intm 60.00
BC Gov Intm 40.00
Passive Portfolios Weight (%)
Custom Benchmark - SKBA Flex : Dec-2002
BC Gov 100.00
Custom Benchmark - SKBA Flex : Jul-2011
Barclays Govt/Credit Bond 100.00
Wilmette Fire Pension Fund Custom Benchmark - Weaver
As of September 30, 2020
Page 32

Account Name YTD1
Year3
Years5
Years10
YearsSince
InceptionInception
Date
Performance Appendix
QTD
Performance Data below is net of fees. Please see the Morgan Stanley Smith Barney LLC Form ADV Part 2 Brochure for advisory accounts and/or any applicable brokerage account trade confirmation statements fora full disclosure of the applicable charges, fees and expenses. Your Financial Advisor will provide those documents to you upon request.
American New World -087508 4.94 14.45 -- -- -- 15.10 12/01/20188.17
Amerifunds - International Equity - 150605 4.40 14.93 5.61 9.02 6.74 7.51 04/01/20049.64
Columbia Acorn Fund 090764 10.47 19.85 -- -- -- 16.18 06/01/20199.38
JOHCM International 087513 14.58 23.25 -- -- -- 15.48 12/01/20189.79
Lazard - Emerging Markets Equity - 150647 -19.39 -10.42 -6.16 3.64 -0.55 0.27 05/01/20102.53
London - Small Cap Core - 150666 -12.01 -7.77 1.38 3.47 -- 6.73 01/01/20115.18
Self Managed - Fixed Income - 150523 0.62 1.12 1.94 2.21 1.88 2.84 01/01/20030.07
Small Cap 600 ETF - 077128 -15.25 -8.27 -0.40 -- -- 1.83 05/04/20173.24
Spare - Flex Fixed Income - 150602 7.10 7.16 5.06 3.75 3.23 4.05 01/01/20030.52
Spare - Max Flex Fixed Income - 150603 5.08 5.43 3.21 2.17 1.64 2.18 08/01/20091.03
Tweedy Browne Global Value 087515 -13.53 -10.88 -- -- -- -2.95 12/01/20180.06
Vanguard - S&P 500 Inst. Index(02/23/2015) 6.15 16.05 12.57 14.37 13.77 10.27 01/01/20038.97
Vanguard Money Market -- -- -- -- -- 0.08 03/01/20200.02
Vanguard REIT Index Fund -12.73 -12.19 2.37 5.21 -- 5.81 05/01/20141.33
Weaver - Fixed Income - 150676 7.61 8.12 5.80 4.75 -- 4.21 06/01/20111.20
iShares Core MSCI EAFE 087512 -6.51 1.22 -- -- -- 4.44 12/01/20185.44
iShares Core S&P Mid-Cap ETF 090765 -8.75 -2.42 -- -- -- 3.74 06/01/20194.66
All performance above are Time Weighted(TWR) performance
Glossary of Terms
Active Contribution Return: The gain or loss percentage of an investment relative to the performance of
the investment benchmark.
Active Exposure: The percentage difference in weight of the portfolio compared to its policy benchmark.
Active Return: Arithmetic difference between the manager’s return and the benchmark’s return over a
specified time period.
Actual Correlation: A measure of the correlation (linear dependence) between two variables X and Y, with
a value between +1 and -1 inclusive. This is also referred to as coefficient of correlation.
Alpha: A measure of a portfolio's time weighted return in excess of the market’s return, both adjusted for
risk. A positive alpha indicates that the portfolio outperformed the market on a risk-adjusted basis, and a
negative alpha indicates the portfolio did worse than the market.
Best Quarter: The highest quarterly return for a certain time period.
Best Quarter: The highest quarterly return for a certain time period.
Beta: A measure of the sensitivity of a portfolio’s time weighted return (net of fees) against that of the
market. A beta greater than 1.00 indicates volatility greater than the market.
Consistency: The percentage of quarters that a product achieved a rate of return higher than that of its
benchmark. The higher the consistency figure, the more value a manager has contributed to the product’s
performance.
Core: Refers to an investment strategy mandate that is blend of growth and value styles without a
pronounced tilt toward either style.
Cumulative Selection Return (Cumulative Return): Cumulative investment performance over a specified
period of time.
Distribution Rate: The most recent distribution paid, annualized, and then divided by the current market
price. Distribution rate may consist of investment income, short-term capital gains, long-term capital gains,
and/or return of capital.

and/or return of capital.
Down Market Capture: The ratio of average portfolio returns over the benchmark during periods of
negative benchmark return. Lower values indicate better product performance.
Downside Risk: A measure similar to standard deviation, but focuses only on the negative movements of
the return series. It is calculated by taking the standard deviation of the negative quarterly set of returns. The
higher the value, the more risk the product has.
Downside Semi Deviation: A statistical calculation that measures the volatility of returns below a
minimum acceptable return. This return measure isolates the negative portion of volatility: the larger the
number, the greater the volatility.
Drawdown: A drawdown is the peak-to-trough decline during a specific period of an investment, fund or
commodity.
Excess over Benchmark: The percentage gain or loss of an investment relative to the investment's
benchmark.
Excess Return: Arithmetic difference between the manager’s return and the risk-free return over a specified
time period.
Growth: A diversified investment strategy which includes investment selections that have capital
appreciation as the primary goal, with little or no dividend payouts. These strategies can include
reinvestment in expansion, acquisitions, and/or research and development opportunities.
Growth of Dollar: The aggregate amount an investment has gained or lost over a certain time period, also
referred to as Cumulative Return, stated in terms of the amount to which an initial dollar investment would
have grown over the given time period.
Investment Decision Process (IDP): A model for structuring the investment process and implementing the
correct attribution methodologies. The IDP includes every decision made concerning the division of the
assets under management over the various asset categories. To analyze each decision‘s contribution to the
total return, a modeling approach must measure the marginal value of every individual decision. In this
respect, the hierarchy of the decisions becomes very important. We therefore use the IDP model, which
serves as a proper foundation for registering the decisions and relating them to each other.
Information Ratio: Measured by dividing the active rate of return by the tracking error. The higher the
Information Ratio, the more value-added contribution by the manager.
Jensen’s Alpha: The Jensen's alpha measure is a risk-adjusted performance measure that represents theaverage return on a portfolio or investment above or below that predicted by the capital asset pricing model(CAPM) given the portfolio's or investment's beta and the average market return. This metric is alsocommonly referred to as alpha..
Kurtosis: A statistical measure that is used to describe the distribution, or skewness, of observed dataaround the mean, sometimes referred to as the volatility of volatility.
Maximum Drawdown: The drawdown is defined as the percent retrenchment from a fund's peak to thefund's trough value. It is in effect from the time the fund's retrenchment begins until a new fund high isreached. The maximum drawdown encompasses both the period from the fund's peak to the fund's valley(length), and the time from the fund's valley to a new fund high (recovery). It measures the largest
(length), and the time from the fund's valley to a new fund high (recovery). It measures the largestpercentage drawdown that has occurred in any fund's data record.
Modern Portfolio Theory (MPT): An investment analysis theory on how risk-averse investors canconstruct portfolios to optimize or maximize expected return based on a given level of market risk,emphasizing that risk is an inherent part of higher reward.
Mutual Fund (MF): An investment program funded by shareholders that trade in diversified holdings andis professionally managed.
Peer Group: A combination of funds that share the same investment style combined as a group forcomparison purposes.
Peer/ Plan Sponsor Universe: A combination of asset pools of total plan investments by specific sponsorand plan types for comparison purposes.
Performance Ineligible Assets: Performance returns are not calculated for certain assets because accuratevaluations and transaction data for these assets are not processed or maintained by us. Common examples ofthese include life insurance, some annuities and some assets held externally.
Performance Statistics: A generic term for various measures of investment performance measurementterms.
Portfolio Characteristics: A generic term for various measures of investment portfolio characteristics.
Preferred Return: A term used in the private equity (PE) world, and also referred to as a “Hurdle Rate.” Itrefers to the threshold return that the limited partners of a private equity fund must receive, prior to the PEfirm receiving its carried interest or "carry."
Ratio of Cumulative Wealth: A defined ratio of the Cumulative Return of the portfolio divided by theCumulative Return of the benchmark for a certain time period.
Regression Based Analysis: A statistical process for estimating the relationships among variables. Itincludes many techniques for modeling and analyzing several variables, when the focus is on therelationship between a dependent variable and one or more independent variables
Residual Correlation: Within returns-based style analysis, residual correlation refers to the portion of astrategy’s return pattern that cannot be explained by its correlation to the asset-class benchmarks to which itis being compared.
Return: A rate of investment performance for the specified period.
Rolling Percentile Ranking: A measure of an investment portfolio’s ranking versus a peer group for aspecific rolling time period (i.e. Last 3 Years, Last 5 years, etc.).
R-Squared: The percentage of a portfolio's performance explained by the behavior of the appropriatebenchmark. High R-Squared means a higher correlation of the portfolio's performance to the appropriatebenchmark.
SA/CF (Separate Account/Comingled Fund): Represents an acronym for Separate Account andCommingled Fund investment vehicles.
Sector Benchmark: A market index that serves as a proxy for a sector within an asset class.
Sharpe Ratio: Represents the excess rate of return over the risk free return divided by the standarddeviation of the excess return. The result is the absolute rate of return per unit of risk. The higher the value,the better the product’s historical risk-adjusted performance results in.
Standard Deviation: A statistical measure of the range of a portfolio's performance; the variability of a

Standard Deviation: A statistical measure of the range of a portfolio's performance; the variability of areturn around its average return over a specified time period.
Total Fund Benchmark: The policy benchmark for a complete asset pool that could consist of multipleinvestment mandates.
Total Fund Composite: The aggregate of multiple portfolios within an asset pool or household.
Tracking Error: A measure of standard deviation for a portfolio's investment performance, relative to theperformance of an appropriate market benchmark.
Treynor Ratio: A ratio that divides the excess return (above the risk free rate) by the portfolio’s beta toarrive at a unified measure of risk adjusted return. It is generally used to rank portfolios, funds andbenchmarks. A higher ratio is indicative of higher returns per unit of market risk. This measurement canhelp determine if the portfolio is reaching its goal of increasing returns while managing market risk.
Up Market Capture: The ratio of average portfolio returns over the benchmark during periods of positivebenchmark return. Higher values indicate better product performance.
Upside Semi Deviation: A statistical calculation that measures the volatility of returns above an acceptablereturn. This return measure isolates the positive portion of volatility: the larger the number, the greater thevolatility.
Value: A diversified investment strategy that includes investment selections which tend to trade at a lowerprice relative to its dividends, earnings, and sales. Common attributes are stocks that include high dividend,low price-to-book ratio, and/or low price-to-earnings ratio.
Worst Quarter: The lowest rolling quarterly return for a certain time period.
Information Disclosures
Performance results are annualized for time periods greater than one year and include all cash and cash
equivalents, realized and unrealized capital gains and losses, and dividends, interest and income. The
investment results depicted herein represent historical performance. As a result of recent market activity,
current performance may vary from the figures shown. Past performance is not a guarantee of future
results.
Please see the Morgan Stanley Smith Barney LLC Form ADV Part 2 Brochure for advisory accounts
and/or any applicable brokerage account trade confirmation statements for a full disclosure of the
applicable charges, fees and expenses. Your Financial Advisor will provide those documents to you upon
request.
Benchmark indices and blends included in this material are for informational purposes only, are
provided solely as a comparison tool and may not reflect the underlying composition and/or investment
objective(s) associated with the account(s). Indices are unmanaged and not available for direct
investment. Index returns do not take into account fees or other charges. Such fees and charges would
reduce performance.
The performance data shown reflects past performance, which does not guarantee future results.
Investment return and principal will fluctuate so that an investor’s shares when redeemed may be worth
more or less than original cost. Please note, current performance may be higher or lower than the
performance data shown. For up to date month-end performance information, please contact your
Financial Advisor or visit the funds’ company website.
Financial Advisor or visit the funds’ company website.
Investors should carefully consider the fund’s investment objectives, risks, charges and expenses before
investing. The prospectus and, if available the summary prospectus, contains this and other information
that should be read carefully before investing. Investors should review the information in the prospectus
carefully. To obtain a prospectus, please contact your Financial Advisor or visit the funds’ company
website.
Past performance is no guarantee of future results.
Investing involves market risk, including possible loss of principal. Growth investing does not guarantee a
profit or eliminate risk. The stocks of these companies can have relatively high valuations. Because of these
high valuations, an investment in a growth stock can be more risky than an investment in a company with
more modest growth expectations. Value investing involves the risk that the market may not recognize that
securities are undervalued and they may not appreciate as anticipated. Small and mid-capitalization
companies may lack the financial resources, product diversification and competitive strengths of larger
companies. The securities of small capitalization companies may not trade as readily as, and be subject to
higher volatility than those of larger, more established companies. Bond funds and bond holdings have the
same interest rate, inflation and credit risks that are associated with the underlying bonds owned by the
funds. The return of principal in bond funds, and in funds with significant bond holdings, is not guaranteed.
International securities’ prices may carry additional risks, including foreign economic, political, monetary
and/or legal factors, changing currency exchange rates, foreign taxes and differences in financial and
accounting standards. International investing may not be for everyone. These risks may be magnified in
emerging markets. Alternative investments, including private equity funds, real estate funds, hedge funds,
managed futures funds, and funds of hedge funds, private equity, and managed futures funds, are
speculative and entail significant risks that can include losses due to leveraging or\other speculative
investment practices, lack of liquidity, volatility of returns, restrictions on transferring interests in a fund,
potential lack of diversification, absence and/or delay of information regarding valuations and pricing,
complex tax structures and delays in tax reporting, less regulation and higher fees than mutual funds and
risks associated with the operations, personnel and processes of the advisor. Master Limited Partnerships
(MLPs) are limited partnerships or limited liability companies that are taxed as partnerships and whose
interests (limited partnership units or limited liability company units) are traded on securities exchanges like
shares of common stock. Currently, most MLPs operate in the energy, natural resources or real estate
sectors. Investments in MLP interests are subject to the risks generally applicable to companies in the
energy and natural resources sectors, including commodity pricing risk, supply and demand risk, depletion
risk and exploration risk; and MLP interests in the real estate sector are subject to special risks, including
interest rate and property value fluctuations, as well as risks related to general and economic conditions.
Because of their narrow focus, MLPs maintain exposure to price volatility of commodities and/or
underlying assets and tend to be more volatile than investments that diversify across many sectors and
companies. MLPs are also subject to additional risks including: investors having limited control and rights
to vote on matters affecting the MLP, limited access to capital, cash flow risk, lack of liquidity, dilution risk,
conflict of interests, and limited call rights related to acquisitions.
Mortgage backed securities also involve prepayment risk, in that faster or slower prepayments than
expected on underlying mortgage loans can dramatically alter the yield-to-maturity of a mortgage-backed
security and prepayment risk includes the possibility that a fund may invest the proceeds at generally lower
interest rates.
Tax managed funds may not meet their objective of being tax-efficient.
Real estate investments are subject to special risks, including interest rate and property value fluctuations,
as well as risks related to general and economic conditions. High yield fixed income securities, also known

as well as risks related to general and economic conditions. High yield fixed income securities, also known
as “junk bonds”, are considered speculative, involve greater risk of default and tend to be more volatile than
investment grade fixed income securities.
Credit quality is a measure of a bond issuer’s creditworthiness, or ability to repay interest and principal to
bondholders in a timely manner. The credit ratings shown are based on security rating as provided by
Standard & Poor’s, Moody’s and/or Fitch, as applicable. Credit ratings are issued by the rating agencies for
the underlying securities in the fund and not the fund itself, and the credit quality of the securities in the
fund does not represent the stability or safety of the fund. Credit ratings shown range from AAA, being the
highest, to D, being the lowest based on S&P and Fitch’s classification (the equivalent of Aaa and C,
respectively, by Moody(s). Ratings of BBB or higher by S&P and Fitch (Baa or higher by Moody’s) are
considered to be investment grade-quality securities. If two or more of the agencies have assigned different
ratings to a security, the highest rating is applied. Securities that are not rated by all three agencies are listed
as “NR”.
“Alpha tilt strategies comprise a core holding of stocks that mimic a benchmark type index such as theS&P 500 to which additional securities are added to help tilt the fund toward potentially outperforming themarket in an effort to enhance overall investment returns. Tilt strategies are subject to significant timingrisk and could potentially expose investors to extended periods of underperformance.”
Custom Account Index: The Custom Account Index is an investment benchmark based on your historical
target allocations and/or manager selection that you may use to evaluate the performance of your account.
The Custom Account index does take into consideration certain changes that may have occurred in your
portfolio since the inception of your account, i.e., asset class and/or manager changes. However, in some
circumstances, it may not be an appropriate benchmark for use with your specific account composition. For
detailed report of the historical composition of this blend please contact your Financial Advisor.
Peer Groups
Peer Groups are a collection of similar investment strategies that essentially group investment products that
share the same investment approach. Peer Groups are used for comparison purposes to compare and
illustrate a clients investment portfolio versus its peer across various quantitative metrics like performance
and risk. Peer Group comparison is conceptually another form of benchmark comparison whereby the
actual investment can be ranked versus its peer across various quantitative metrics.
All Peer Group data are provided by Investment Metrics, LLC.
The URL below provides all the definitions and methodology about the various Peer Groups
https://www.invmetrics.com/style-peer-groups
Peer Group Ranking Methodology
A percentile rank denotes the value of a product in which a certain percent of observations fall within a peer
group. The range of percentile rankings is between 1 and 100, where 1 represents a high statistical value and
100 represents a low statistical value.
The 30th percentile, for example, is the value in which 30% of the highest observations may be found, the
65th percentile is the value in which 65% of the highest observations may be found, and so on.
Percentile rankings are calculated based on a normalized distribution ranging from 1 to 100 for all products
in each peer group, where a ranking of 1 denotes a high statistical value and a ranking of 100 denotes a low
statistical value. It is important to note that the same ranking methodology applies to all statistics, implying
statistical value. It is important to note that the same ranking methodology applies to all statistics, implying
that a ranking of 1 will always mean highest value across all statistics.
For example, consider a risk/return assessment using standard deviation as a measure of risk. A percentile
ranking equal to 1 for return denotes highest return, whereas a percentile ranking of 1 for standard deviation
denotes highest risk among peers.
In addition, values may be used to demonstrate quartile rankings. For example, the third quartile is also
known as the 75th percentile, and the median is the 50th percentile.
Alternatives
Graystone Consulting is a business of Morgan Stanley Smith Barney LLC. (“Morgan Stanley”) Thismaterial is not to be reproduced or distributed to any other persons (other than professional advisors of theinvestors) and is intended solely for the use of the persons to whom it has been delivered. This material isnot for distribution to the general public.
The sole purpose of this material is to inform, and it in no way is intended to be an offer or solicitation topurchase or sell any security, other investment or service, or to attract any funds or deposits. Investmentsmentioned may not be suitable for all clients. Any product discussed herein may be purchased only after aclient has carefully reviewed the offering memorandum and executed the subscription documents. MorganStanley has not considered the actual or desired investment objectives, goals, strategies, guidelines, orfactual circumstances of any investor in any fund(s). Before making any investment, each investor shouldcarefully consider the risks associated with the investment, as discussed in the applicable offeringmemorandum, and make a determination based upon their own particular circumstances, that the investmentis consistent with their investment objectives and risk tolerance.
This information is being provided as a service of your Graystone Institutional Consultant and does notsupersede or replace your Morgan Stanley customer statement. The information is as of the date(s) notedand subject to daily market fluctuation. Your interests in Alternative Investments, which may have beenpurchased through us, are generally not held here, and are generally not covered by SIPC. The informationprovided to you: 1) is included as a service to you, valuations for certain products may not be available; 2)is derived from you or another external source for which we are not responsible, and may have beenmodified to take into consideration capital calls or distributions to the extent applicable; 3) may not reflectactual shares, share prices or values; 4) may include invested or distributed amounts in addition to a fairvalue estimate; and 5) should not be relied upon for tax reporting purposes. Notwithstanding the foregoing,1) to the extent this report displays Alternative Investment positions within a Morgan Stanley IndividualRetirement Account (“IRA”), such positions are held by Morgan Stanley Smith Barney LLC as thecustodian of your Morgan Stanley IRA; and 2) if your Alternative Investment positon(s) is held by us and isregistered pursuant to the Securities Act of 1933, as amended, your Alternative Investment position(s) iscovered by SIPC.
Alternatives may be either traditional alternative investment vehicles or non-traditional alternative strategyvehicles. Traditional alternative investment vehicles may include, but are not limited to, Hedge Funds,Fund of Funds (both registered and unregistered), Exchange Funds, Private Equity Funds, Private CreditFunds, Real Estate Funds, and Managed Futures Funds. Non-traditional alternative strategy vehicles mayinclude, but are not limited to, Open or Closed End Mutual Funds, Exchange-Traded and Closed-EndFunds, Unit Investment Trusts, exchange listed Real Estate Investment Trusts (REITs), and Master LimitedPartnerships (MLPs). These non-traditional alternative strategy vehicles also seek alternative-like exposurebut have significant differences from traditional alternative investment vehicles. Non-traditional alternativestrategy vehicles may behave like, have characteristics of, or employ various investment strategies andtechniques for both hedging and more speculative purposes such as short-selling, leverage, derivatives, andoptions, which can increase volatility and the risk of investment loss. Characteristics such as correlation totraditional markets, investment strategy, and market sector exposure can play a role in the classification of atraditional security being classified as alternative.
Traditional alternative investment vehicles are illiquid and usually are not valued daily. The estimatedvaluation provided will be as of the most recent date available and will be included in summaries of your

valuation provided will be as of the most recent date available and will be included in summaries of yourassets. Such valuation may not be the most recent provided by the fund in which you are invested. Norepresentation is made that the valuation is a market value or that the interest could be liquidated at thisvalue. We are not required to take any action with respect to your investment unless valid instructions arereceived from you in a timely manner. Some positions reflected herein may not represent interests in thefund, but rather redemption proceeds withheld by the issuer pending final valuations which are not subjectto the investment performance of the fund and may or may not accrue interest for the length of thewithholding. Morgan Stanley does not engage in an independent valuation of your alternative investmentassets. Morgan Stanley provides periodic information to you including the market value of an alternativeinvestment vehicle based on information received from the management entity of the alternative investmentvehicle or another service provider.
Traditional alternative investment vehicles often are speculative and include a high degree of risk. .Investors should carefully review and consider potential risks before investing. Certain of these risks mayinclude but are not limited to:• Loss of all or a substantial portion of the investment due to leveraging, short-selling, or other speculative practices;• Lack of liquidity in that there may be no secondary market for afund;• Volatility of returns;• Restrictions on transferring interests in a fund;• Potential lack of diversificationand resulting higher risk due to concentration of trading authority when a single advisor is utilized;•Absence of information regarding valuations and pricing;• Complex tax structures and delays in taxreporting;• Less regulation and higher fees than mutual funds; and• Risks associated with the operations,personnel, and processes of the manager. As a diversified global financial services firm, Morgan StanleyWealth Management engages in a broad spectrum of activities including financial advisory services,investment management activities, sponsoring and managing private investment funds, engaging in broker-dealer transactions and principal securities, commodities and foreign exchange transactions, researchpublication, and other activities. In the ordinary course of its business, Morgan Stanley Wealth Managementtherefore engages in activities where Morgan Stanley Wealth Management’s interests may conflict with theinterests of its clients, including the private investment funds it manages. Morgan Stanley WealthManagement can give no assurance that conflicts of interest will be resolved in favor of its clients or anysuch fund.
Indices are unmanaged and investors cannot directly invest in them. Composite index results are shown forillustrative purposes and do not represent the performance of a specific investment. Past performance is noguarantee of future results. Actual results may vary. Diversification does not assure a profit or protectagainst loss in a declining market. Any performance or related information presented has not been adjustedto reflect the impact of the additional fees paid to a placement agent by an investor (for Morgan Stanleyplacement clients, a one-time upfront Placement Fee of up to 3%, and for Morgan Stanley investmentadvisory clients, an annual advisory fee of up to 2.5%), which would result in a substantial reduction in thereturns if such fees were incorporated.
For most investment advisory clients, the program account will be charged an asset-based wrap fee everyquarter (“the Fee”). In general, the Fee covers investment advisory services and reporting. In addition to theFee, clients will pay the fees and expenses of any funds in which their account is invested. Fund fees andexpenses are charged directly to the pool of assets the fund invests in and impact the valuations. Clientsmust understand that these fees and expenses are an additional cost and will not be included in the Feeamount in the account statements.
As fees are deducted quarterly, the compounding effect will be to increase the impact of the fees by anamount directly related to the gross account performance. For example, for an account with an initial valueof $100,000 and a 2.5% annual fee, if the gross performance is 5% per year over a three year period, thecompounding effect of the fees will result in a net annual compound rate of return of approximately 2.40%per year over a three year period, and the total value of the client’s portfolio at the end of the three yearperiod would be approximately $115,762.50 without the fees and $107,372.63 with the fees. Please see theapplicable Morgan Stanley Smith Barney LLC Form ADV Part 2A for more information including adescription of the fee schedule. It is available at www.morganstanley.com/ADV<http://www.morganstanley.com/ADV> <http://www.morganstanley.com/ADV> or from your FinancialAdvisor/Private Wealth Advisor.
Alternative investments involve complex tax structures, tax inefficient investing, and delays in distributingimportant tax information. Individual funds have specific risks related to their investment programs that will
important tax information. Individual funds have specific risks related to their investment programs that willvary from fund to fund. Clients should consult their own tax and legal advisors as Morgan Stanley does notprovide tax or legal advice. Interests in alternative investment products are offered pursuant to the terms ofthe applicable offering memorandum, are distributed by Morgan Stanley Smith Barney LLC and certain ofits affiliates, and (1) are not FDIC-insured, (2) are not deposits or other obligations of Morgan Stanley orany of its affiliates, (3) are not guaranteed by Morgan Stanley and its affiliates, and (4) involve investmentrisks, including possible loss of principal. Morgan Stanley Smith Barney LLC is a registered broker-dealer,not a bank.
SIPC insurance does not apply to precious metals, other commodities, or traditional alternative investments.
© 2018 Morgan Stanley Smith Barney LLC. Member SIPC.
Money Market Funds
You could lose money in Money Market Funds. Although MMFs classified as government funds (i.e.,MMFs that invest 99.5% of total assets in cash and/or securities backed by the U.S government) and retailfunds (i.e., MMFs open to natural person investors only) seek to preserve value at $1.00 per share, theycannot guarantee they will do so. The price of other MMFs will fluctuate and when you sell shares they maybe worth more or less than originally paid. MMFs may impose a fee upon sale or temporarily suspend salesif liquidity falls below required minimums. During suspensions, shares would not be available forpurchases, withdrawals, check writing or ATM debits. A MMF investment is not insured or guaranteed bythe Federal Deposit Insurance Corporation or other government agency.

Wilmette Police Pension FundQuarterly Performance Report
September 30, 2020

TargetAllocation
(%)
AssetAllocation
(%)
Differences(%)
AssetAllocation
($)
TargetRebalance
($)
Fixed Income 35.00 32.31 -2.69 16,543,749.80 1,379,600.13
Equity 65.00 67.69 2.69 34,665,821.44 -1,379,600.13
Wilmette Police Pension Fund 100.00 100.00 0.00 51,209,571.24 -
TargetAllocation
(%)
AssetAllocation
(%)
Differences(%)
AssetAllocation
($)
TargetRebalance
($)
Real Estate 3.00 2.38 -0.62 1,216,334.29 319,952.85
Small Cap Equity 7.00 6.37 -0.63 3,261,548.39 323,121.60
Emerging Markets 8.00 6.19 -1.81 3,167,754.42 929,011.28
Mid Cap Equity 10.00 11.10 1.10 5,686,126.06 -565,168.94
International Equity 12.00 12.50 0.50 6,400,901.77 -255,753.22
Large Cap Equity 25.00 29.16 4.16 14,933,156.51 -2,130,763.70
Fixed Income 35.00 32.31 -2.69 16,543,749.80 1,379,600.13
Wilmette Police Pension Fund 100.00 100.00 0.00 51,209,571.24 -
Wilmette Police Pension Fund
Page 1

Total Fund Domestic EquityInternational
EquityREITS
Domestic FixedIncome
AlternativeInvestment
Cash Equivalent
($) % ($) % ($) % ($) % ($) % ($) % ($) %Wilmette Police Pension Fund 51,209,571 100.00 23,145,768 45.20 9,909,746 19.35 1,216,334 2.38 15,787,675 30.83 307,095 0.60 842,953 1.65
Large Cap Equity 14,933,157 29.16 14,933,157 100.00 - - - - - - - - - -
Vanguard - S&P 500 Inst. Index(02/23/2015) 14,933,157 29.16 14,933,157 100.00 - - - - - - - - - -
Mid Cap Equity 5,686,126 11.10 5,686,044 100.00 - - - - - - - - 83 0.00
iShares S&P MidCap 090767 1,713,273 3.35 1,713,191 100.00 - - - - - - - - 83 0.00
Columbia Acorn 090766 3,972,853 7.76 3,972,853 100.00 - - - - - - - - - -
Small Cap Equity 3,261,548 6.37 2,526,568 77.47 341,090 10.46 - - - - 307,095 9.42 86,796 2.66
London - Small Cap Core - 150665 3,261,548 6.37 2,526,568 77.47 341,090 10.46 - - - - 307,095 9.42 86,796 2.66
Real Estate 1,216,334 2.38 - - - - 1,216,334 100.00 - - - - - -
Vanguard REIT Index Fund Admiral Shares 1,216,334 2.38 - - - - 1,216,334 100.00 - - - - - -
International Equity 6,400,902 12.50 - - 6,400,902 100.00 - - - - - - - -
Amerifunds - International Equity - 150607 3,169,228 6.19 - - 3,169,228 100.00 - - - - - - - -
iShares Core MSCI EAFE 087516 935,124 1.83 - - 935,124 100.00 - - - - - - - -
Tweedy Browne Global Value 087517 1,167,305 2.28 - - 1,167,305 100.00 - - - - - - - -
JOHCM International 087514 1,129,246 2.21 - - 1,129,246 100.00 - - - - - - - -
Emerging Markets 3,167,754 6.19 - - 3,167,754 100.00 - - - - - - - -
American New World 087509 1,295,980 2.53 - - 1,295,980 100.00 - - - - - - - -
Lazard - Emerging Markets Equity - 150648 1,871,774 3.66 - - 1,871,774 100.00 - - - - - - - -
Fixed Income 16,543,750 32.31 - - - - - - 15,787,675 95.43 - - 756,075 4.57
Spare - Max Flex Fixed Income - 150601 2,549,027 4.98 - - - - - - 2,422,550 95.04 - - 126,477 4.96
Spare - Flex Fixed Income - 150604 4,941,151 9.65 - - - - - - 4,830,087 97.75 - - 111,064 2.25
Weaver - Fixed Income - 150677 8,541,036 16.68 - - - - - - 8,533,898 99.92 - - 7,139 0.08
Vanguard Money Market 500,481 0.98 - - - - - - - - - - 500,481 100.00
Self Managed - Fixed Income - 150522 12,055 0.02 - - - - - - 1,141 9.46 - - 10,914 90.54
Wilmette Police Pension Fund
As of September 30, 2020
Page 2

1Month
QuarterTo
DateYTD
1Year
3Years
5Years
7Years
10Years
SinceInception
InceptionDate
Wilmette Police Pension Fund -1.93 5.26 2.82 8.38 5.82 7.65 6.24 6.79 6.65 01/01/2003
Custom Benchmark -2.03 4.91 2.13 7.89 6.44 8.57 7.12 7.24 6.67
US Equity -3.15 7.84 1.72 9.63 8.51 11.01 9.83 - 10.06 05/01/2013
Custom Benchmark - US Equity -3.53 6.87 -1.04 7.00 8.07 11.46 10.38 - 10.71
International Equity -1.60 7.19 0.49 8.39 2.06 6.21 3.76 - 4.28 05/01/2013
MSCI AC World ex US Net -2.46 6.25 -5.44 3.00 1.16 6.23 3.18 - 3.39
Emerging Markets -2.07 4.79 -10.92 -1.63 -1.96 6.40 0.90 - 0.50 05/01/2013
MSCI EM Net -1.60 9.56 -1.16 10.54 2.42 8.97 3.74 - 3.03
Fixed Income -0.08 0.93 7.05 7.42 5.15 4.01 3.69 - 3.09 05/01/2013
Barclays Govt/Credit Bond -0.05 0.78 8.04 8.03 5.86 4.66 4.30 - 3.57
Wilmette Police Pension Fund Time Weighted Returns
As of September 30, 2020
Returns for periods greater than one year are annualized.Returns are expressed as percentages.
Page 3

1Month
QuarterTo
DateYTD
1Year
3Years
5Years
7Years
10Years
SinceInception
InceptionDate
Wilmette Police Pension Fund -1.93 5.26 2.82 8.38 5.82 7.65 6.24 6.79 6.65 01/01/2003
Custom Benchmark -2.03 4.91 2.13 7.89 6.44 8.57 7.12 7.24 6.67
Vanguard - S&P 500 Inst. Index(02/23/2015) -3.80 8.97 6.13 15.99 12.54 14.36 12.79 13.76 10.38 01/01/2003
S&P 500 Total Return -3.80 8.93 5.57 15.15 12.28 14.15 12.68 13.74 10.06
iShares S&P MidCap 090767 -3.34 4.68 -8.72 -2.34 - - - - 3.81 06/01/2019
S&P 400 MidCap Net -3.29 4.65 -8.97 -2.66 - - - - 3.34
Columbia Acorn 090766 0.72 9.40 10.51 19.90 - - - - 16.23 06/01/2019
Russell 2500 GR -0.77 9.37 11.58 23.38 - - - - 20.80
London - Small Cap Core - 150665 -4.69 5.20 -11.86 -7.53 2.04 4.11 3.38 - 7.29 01/01/2011
Russell 2000 -3.34 4.93 -8.69 0.39 1.77 8.00 6.43 - 8.42
Vanguard REIT Index Fund Admiral Shares -2.64 1.33 -12.73 -12.19 2.37 5.21 - - 5.80 05/01/2014
FTSE Nareit All Equity REIT Index -2.66 1.19 -12.38 -11.81 2.37 4.71 - - 4.90
Amerifunds - International Equity - 150607 -1.71 9.66 4.43 14.97 5.66 9.05 6.63 6.76 7.51 04/01/2004
MSCI AC World ex US Net -2.46 6.25 -5.44 3.00 1.16 6.23 3.18 4.00 5.32
iShares Core MSCI EAFE 087516 -1.87 5.46 -6.48 1.26 - - - - 4.48 12/01/2018
MSCI EAFE IMI NT -2.29 5.64 -6.32 1.81 - - - - 5.04
Tweedy Browne Global Value 087517 -2.77 0.08 -13.50 -10.85 - - - - -2.83 12/01/2018
MSCI EAFE -2.60 4.80 -7.09 0.49 - - - - 4.21
JOHCM International 087514 0.22 9.81 14.61 23.30 - - - - 15.53 12/01/2018
MSCI EAFE -2.60 4.80 -7.09 0.49 - - - - 4.21
American New World 087509 -2.72 8.19 4.97 14.50 - - - - 15.15 12/01/2018
MSCI ACWI -3.19 8.25 1.77 11.00 - - - - 10.70
Lazard - Emerging Markets Equity - 150648 -1.61 2.55 -19.37 -10.38 -6.11 3.68 -0.95 -0.54 0.28 05/01/2010
MSCI EM Net -1.60 9.56 -1.16 10.54 2.42 8.97 3.74 2.51 3.05
Spare - Max Flex Fixed Income - 150601 0.13 1.06 5.14 5.56 3.42 2.41 2.22 1.98 2.53 08/01/2009
BC Gov 1-3 Yr 0.02 0.10 3.09 3.62 2.66 1.82 1.54 1.30 1.46
Wilmette Police Pension Fund Time Weighted Returns
As of September 30, 2020
Returns for periods greater than one year are annualized.Returns are expressed as percentages.
Page 4

Wilmette Police Pension Fund Time Weighted Returns
As of September 30, 2020
1Month
QuarterTo
DateYTD
1Year
3Years
5Years
7Years
10Years
SinceInception
InceptionDate
Spare - Flex Fixed Income - 150604 -0.14 0.58 7.47 7.58 5.42 4.09 3.96 3.62 4.26 01/01/2003
Custom Benchmark - SKBA Flex -0.05 0.78 8.04 8.03 5.86 4.66 4.30 3.81 4.29
Weaver - Fixed Income - 150677 -0.11 1.22 7.75 8.26 5.98 4.94 4.45 - 4.44 06/01/2011
Weaver Custom Benchmark -0.08 0.88 5.85 6.56 4.74 3.86 3.56 - 3.51
Self Managed - Fixed Income - 150522 0.05 0.17 0.87 1.45 2.09 2.61 2.83 2.20 3.34 01/01/2003
BC Gov Intm 0.07 0.20 5.96 5.98 4.04 2.76 2.56 2.32 3.27
Returns for periods greater than one year are annualized.Returns are expressed as percentages.
Page 5

Performance(%)
2019 2018 2017 2016 2015 2014 2013 2012 2011 2010 2003
Wilmette Police Pension Fund 20.21 -7.46 13.77 8.33 -2.03 5.12 13.34 10.08 2.61 10.20 14.09
Custom Benchmark 20.69 -5.89 15.65 9.48 -1.69 7.04 11.76 11.00 1.16 10.44 14.97
Wilmette Police - Acturial Assumption 7.25 7.25 7.25 7.25 7.25 7.25 7.25 7.25 7.30 7.35 7.50
Wilmette Police Pension Fund Custom Benchmark
$0.0
$600.0
$1,200.0
$1,800.0
$2,400.0
$3,000.0
$3,600.0
$4,200.0
12/02 12/03 12/04 12/05 12/06 12/07 12/08 12/09 12/10 12/11 12/12 12/13 12/14 12/15 12/16 12/17 12/18 12/19 9/20
$3,144.5$3,137.6
Wilmette Police Pension Fund Time Weighted Returns
As of September 30, 2020
Please refer to definitions page at the back of this book for benchmar descriptions
Page 6

1Month
CurrentQuarter
YTD1
Year3
Years5
Years7
YearsSince
InceptionInception
Date
Wilmette Police Pension Fund -1.93 5.24 2.84 8.49 5.82 7.67 6.21 6.64 12/31/2002
2019 2018 2017 2016 2015 2014 2013 2012 2011 2010
Wilmette Police Pension Fund 20.22 -7.47 13.77 8.24 -2.03 5.13 13.33 10.08 2.56 10.19
Wilmette Police Pension Fund Dollar Weighted Returns
As of September 30, 2020
Please refer to definitions page at the back of this book for benchmar descriptions
Page 7

Sep-2020 Aug-2020 Jul-2020 Jun-2020 May-2020 Apr-2020 Mar-2020 Feb-2020 Jan-2020 Dec-2019 Nov-2019 Oct-2019
Wilmette Police Pension Fund
Beginning Market Value 52,208,376 50,165,754 48,660,613 47,799,849 46,016,846 42,594,453 47,318,459 49,617,827 49,784,622 50,352,235 49,401,702 49,352,679
Net Contributions - 500,000 -506,741 93 -1,495 -7,380 -871 -901 -8,269 -1,499,810 117 -707,181
Income 114,767 82,163 30,659 302,991 63,426 15,230 173,823 57,070 39,539 667,499 77,803 16,603
Gain/Loss -1,113,571 1,460,458 1,981,224 557,679 1,721,073 3,414,542 -4,896,957 -2,355,536 -198,064 264,699 872,613 739,600
Ending Market Value 51,209,571 52,208,376 50,165,754 48,660,613 47,799,849 46,016,846 42,594,453 47,318,459 49,617,827 49,784,622 50,352,235 49,401,702
Vanguard - S&P 500 Inst. Index(02/23/2015)
Beginning Market Value 15,523,707 14,482,943 14,191,554 13,915,123 12,978,051 10,988,321 11,680,334 12,728,501 12,733,766 13,822,161 13,338,432 13,739,012
Net Contributions - - -500,000 - 300,000 550,000 750,000 - - -1,500,000 - -700,000
Income 62,248 - - 69,029 - - 118,615 - - 152,807 - -
Gain/Loss -652,798 1,040,765 791,389 207,402 637,072 1,439,730 -1,560,629 -1,048,168 -5,265 258,798 483,730 299,420
Ending Market Value 14,933,157 15,523,707 14,482,943 14,191,554 13,915,123 12,978,051 10,988,321 11,680,334 12,728,501 12,733,766 13,822,161 13,338,432
iShares S&P MidCap 090767
Beginning Market Value 1,772,414 1,711,300 1,636,655 1,615,255 1,505,753 1,319,399 1,654,824 1,828,195 1,877,171 1,825,988 1,773,415 1,754,839
Net Contributions - - - -72 - - - - -92 - - -311
Income 7,668 - - 5,955 - - 7,304 - - 8,264 - -
Gain/Loss -66,809 61,115 74,644 15,517 109,502 186,355 -342,730 -173,371 -48,883 42,919 52,573 18,886
Ending Market Value 1,713,273 1,772,414 1,711,300 1,636,655 1,615,255 1,505,753 1,319,399 1,654,824 1,828,195 1,877,171 1,825,988 1,773,415
Columbia Acorn 090766
Beginning Market Value 3,944,622 3,836,831 3,631,516 3,595,127 3,218,495 2,829,634 3,313,875 3,587,790 3,595,127 3,560,345 3,349,971 3,313,524
Net Contributions - - - - - - - - - - - -140
Income - - - 171,867 - - - - - 231,338 - -
Gain/Loss 28,231 107,791 205,315 -135,478 376,632 388,861 -484,242 -273,914 -7,337 -196,555 210,374 36,587
Ending Market Value 3,972,853 3,944,622 3,836,831 3,631,516 3,595,127 3,218,495 2,829,634 3,313,875 3,587,790 3,595,127 3,560,345 3,349,971
London - Small Cap Core - 150665
Beginning Market Value 3,422,119 3,265,731 3,100,332 3,072,688 2,945,279 2,660,846 3,253,598 3,578,095 3,705,458 3,681,475 3,596,408 3,531,855
Net Contributions - - 9 11 -1,625 15 -949 -978 -1,084 60 23 11
Income 2,533 3,104 3,514 3,692 1,876 3,517 9,227 2,595 7,018 5,976 2,412 2,760
Gain/Loss -163,104 153,284 161,876 23,942 127,158 280,901 -601,031 -326,114 -133,297 17,948 82,632 61,783
Ending Market Value 3,261,548 3,422,119 3,265,731 3,100,332 3,072,688 2,945,279 2,660,846 3,253,598 3,578,095 3,705,458 3,681,475 3,596,408
Wilmette Police Pension Fund Month-to Month Report
As of September 30, 2020
Page 8

Wilmette Police Pension Fund Month-to Month Report
As of September 30, 2020Sep-2020 Aug-2020 Jul-2020 Jun-2020 May-2020 Apr-2020 Mar-2020 Feb-2020 Jan-2020 Dec-2019 Nov-2019 Oct-2019
Vanguard REIT Index Fund Admiral Shares
Beginning Market Value 1,249,350 1,243,312 1,200,402 1,171,778 1,151,708 1,057,974 1,310,374 1,410,162 1,393,849 1,382,616 1,400,118 1,385,236
Net Contributions - - - - - - - - - - - -
Income 9,018 - - 11,478 - - 9,726 - - 14,215 - -
Gain/Loss -42,033 6,038 42,910 17,147 20,071 93,734 -262,126 -99,788 16,313 -2,982 -17,503 14,883
Ending Market Value 1,216,334 1,249,350 1,243,312 1,200,402 1,171,778 1,151,708 1,057,974 1,310,374 1,410,162 1,393,849 1,382,616 1,400,118
Amerifunds - International Equity - 150607
Beginning Market Value 3,224,406 3,055,592 2,890,056 2,736,539 2,566,632 2,354,112 2,761,123 2,942,503 3,034,832 2,909,854 2,851,519 2,756,592
Net Contributions - - - - - - - - - - - -
Income - - - - - - - - - 88,324 - -
Gain/Loss -55,179 168,814 165,536 153,517 169,907 212,520 -407,012 -181,380 -92,329 36,654 58,335 94,927
Ending Market Value 3,169,228 3,224,406 3,055,592 2,890,056 2,736,539 2,566,632 2,354,112 2,761,123 2,942,503 3,034,832 2,909,854 2,851,519
Tweedy Browne Global Value 087517
Beginning Market Value 1,200,574 1,164,894 1,166,340 1,147,054 1,125,357 1,061,230 1,224,199 1,323,042 1,349,560 1,331,556 1,316,887 1,309,320
Net Contributions - - - - - - - - - - - -4
Income - - - - - - - - - 24,842 - -
Gain/Loss -33,269 35,680 -1,446 19,286 21,697 64,127 -162,969 -98,842 -26,519 -6,838 14,669 7,571
Ending Market Value 1,167,305 1,200,574 1,164,894 1,166,340 1,147,054 1,125,357 1,061,230 1,224,199 1,323,042 1,349,560 1,331,556 1,316,887
iShares Core MSCI EAFE 087516
Beginning Market Value 952,964 905,395 886,779 858,828 812,844 764,714 895,768 972,562 999,999 965,150 956,227 923,593
Net Contributions - -56 - - - - - - - -41 - -31
Income - - - 10,728 - - - - - 13,313 - -
Gain/Loss -17,840 47,625 18,616 17,223 45,984 48,130 -131,054 -76,793 -27,437 21,577 8,923 32,666
Ending Market Value 935,124 952,964 905,395 886,779 858,828 812,844 764,714 895,768 972,562 999,999 965,150 956,227
JOHCM International 087514
Beginning Market Value 1,126,785 1,089,458 1,028,340 991,013 917,589 833,090 909,385 987,731 985,270 964,186 932,899 915,835
Net Contributions - - - - - - - - - - - -
Income - - - - - - - - - 9,255 - -
Gain/Loss 2,461 37,327 61,118 37,327 73,424 84,499 -76,295 -78,346 2,461 11,830 31,286 17,065
Ending Market Value 1,129,246 1,126,785 1,089,458 1,028,340 991,013 917,589 833,090 909,385 987,731 985,270 964,186 932,899
Page 9

Wilmette Police Pension Fund Month-to Month Report
As of September 30, 2020Sep-2020 Aug-2020 Jul-2020 Jun-2020 May-2020 Apr-2020 Mar-2020 Feb-2020 Jan-2020 Dec-2019 Nov-2019 Oct-2019
Lazard - Emerging Markets Equity - 150648
Beginning Market Value 1,902,355 1,921,927 1,825,203 1,772,444 1,738,528 1,622,961 2,029,957 2,178,184 2,321,387 2,165,155 2,166,391 2,088,585
Net Contributions - - - - - - - - - - - -51
Income - 27,230 - - - - - - - 37,248 - -
Gain/Loss -30,580 -46,802 96,724 52,759 33,916 115,567 -406,996 -148,227 -143,202 118,984 -1,236 77,857
Ending Market Value 1,871,774 1,902,355 1,921,927 1,825,203 1,772,444 1,738,528 1,622,961 2,029,957 2,178,184 2,321,387 2,165,155 2,166,391
American New World 087509
Beginning Market Value 1,332,247 1,271,627 1,197,866 1,123,580 1,055,951 961,692 1,137,421 1,207,327 1,234,659 1,186,949 1,166,240 1,131,895
Net Contributions - - - - - - - - - - - -
Income - - - - - - - - - 48,023 - -
Gain/Loss -36,267 60,620 73,761 74,286 67,629 94,259 -175,729 -69,906 -27,332 -314 20,708 34,346
Ending Market Value 1,295,980 1,332,247 1,271,627 1,197,866 1,123,580 1,055,951 961,692 1,137,421 1,207,327 1,234,659 1,186,949 1,166,240
Spare - Max Flex Fixed Income - 150601
Beginning Market Value 2,545,779 2,547,147 2,523,622 2,515,972 2,515,598 3,339,333 4,553,197 4,500,806 4,459,663 4,456,473 4,454,305 4,444,080
Net Contributions - - -1,364 29 50 -852,262 -1,249,983 30 -2,190 25 25 -2,189
Income 2,438 14,587 1,852 2,196 1,762 814 2,493 20,167 2,018 8,007 16,160 960
Gain/Loss 809 -15,955 23,037 5,425 -1,437 27,713 33,626 32,194 41,315 -4,842 -14,016 11,455
Ending Market Value 2,549,027 2,545,779 2,547,147 2,523,622 2,515,972 2,515,598 3,339,333 4,553,197 4,500,806 4,459,663 4,456,473 4,454,305
Spare - Flex Fixed Income - 150604
Beginning Market Value 4,947,861 4,984,492 4,915,279 4,881,012 4,847,857 4,739,294 4,793,726 4,703,426 4,604,336 4,607,495 4,611,393 4,601,908
Net Contributions - - -2,435 25 32 -2,341 27 39 -2,253 28 27 -2,264
Income 9,638 21,870 5,633 10,961 16,753 4,764 9,714 18,768 8,059 11,151 15,727 4,923
Gain/Loss -16,348 -58,502 66,015 23,282 16,369 106,140 -64,173 71,492 93,285 -14,338 -19,652 6,825
Ending Market Value 4,941,151 4,947,861 4,984,492 4,915,279 4,881,012 4,847,857 4,739,294 4,793,726 4,703,426 4,604,336 4,607,495 4,611,393
Weaver - Fixed Income - 150677
Beginning Market Value 8,550,692 8,172,705 7,954,317 7,891,214 7,825,142 7,549,971 7,788,821 7,657,670 7,477,829 7,481,185 7,475,869 7,445,343
Net Contributions - 500,000 -2,952 27 46 -2,795 32 6 -2,744 73 41 -2,740
Income 21,188 15,327 19,610 17,031 42,875 5,959 16,717 15,519 22,423 14,713 43,482 7,936
Gain/Loss -30,844 -137,340 201,730 46,045 23,151 272,007 -255,599 115,627 160,162 -18,142 -38,209 25,330
Ending Market Value 8,541,036 8,550,692 8,172,705 7,954,317 7,891,214 7,825,142 7,549,971 7,788,821 7,657,670 7,477,829 7,481,185 7,475,869
Page 10

Wilmette Police Pension Fund Month-to Month Report
As of September 30, 2020Sep-2020 Aug-2020 Jul-2020 Jun-2020 May-2020 Apr-2020 Mar-2020 Feb-2020 Jan-2020 Dec-2019 Nov-2019 Oct-2019
Vanguard Money Market
Beginning Market Value 500,453 500,415 500,374 500,328 800,177 500,010 10 - - - - -
Net Contributions - - - - -300,000 300,000 499,990 - - - - -
Income 28 37 42 46 150 167 10 - - - - -
Gain/Loss - - - - - - - - - - - -
Ending Market Value 500,481 500,453 500,415 500,374 500,328 800,177 500,010 - - - - -
Self Managed - Fixed Income - 150522
Beginning Market Value 12,048 11,985 11,977 11,896 11,886 11,874 11,854 11,832 11,717 11,649 11,626 11,064
Net Contributions - 56 1 74 2 2 2 2 94 47 2 539
Income 7 8 8 8 9 10 16 20 21 23 21 24
Gain/Loss -1 -1 -1 -2 - -1 2 - - -1 -1 -
Ending Market Value 12,055 12,048 11,985 11,977 11,896 11,886 11,874 11,854 11,832 11,717 11,649 11,626
Page 11

Portfolio Performance (%)
Asset Growth ($000)
Risk/Return Analysis Since 01/01/03
Asset Allocation ($000)
Growth of a Dollar ($000)
Portfolio Characteristics vs. Custom Benchmark Since Inception
Wilmette Police Pension Fund Custom Benchmark
0.0
4.0
8.0
12.0
16.0
Ret
urn
(%)
Current Quarter
YTD 1Year
3Years
5Years
SinceInception
September 30, 2020 : $51,210
SegmentsMarket Value
($000)Allocation
(%)
Domestic Equity 23,145.77 45.20¢£
International Equity 9,909.75 19.35¢£
REITS 1,216.33 2.38¢£
Domestic Fixed Income 15,787.67 30.83¢£
Alternative Investment 307.09 0.60¢£
Cash Equivalent 842.95 1.65¢£
CurrentQuarter
YTD1
Year3
Years5
YearsSince
InceptionInception
Date
Wilmette Police Pension Fund 5.26 2.82 8.38 5.82 7.65 6.65 01/01/2003
Custom Benchmark 4.91 2.13 7.89 6.44 8.57 6.67 01/01/2003
CurrentQuarter
YTD1
Year3
Years5
YearsSince
InceptionInception
Date
Wilmette Police Pension Fund 01/01/2003
Beginning Market Value 48,661 49,785 49,353 45,789 38,881 19,649
Net Contributions 7 11 -2,182 -2,846 -4,272 -6,514
Fees/Expenses -14 -37 -51 -263 -398 -830
Income 228 880 1,642 4,275 6,401 17,248
Gain/Loss 2,328 571 2,448 4,254 10,596 21,657
Ending Market Value 51,210 51,210 51,210 51,210 51,210 51,210
Beta Alpha R-SquaredSharpeRatio
InceptionDate
Wilmette Police Pension Fund 0.99 0.08 0.98 0.69 01/01/2003
Custom Benchmark 1.00 0.00 1.00 0.69 01/01/2003
90-Day T-Bills 0.00 1.29 0.00 N/A 01/01/2003
Wilmette Police Pension Fund Custom Benchmark
6.6
6.7
Ret
urn
(%)
7.9 8.0
Risk (Standard Deviation %)
Wilmette Police Pension Fund Custom Benchmark
$0
$1,500
$3,000
$4,500
12/02 6/04 12/05 6/07 12/08 6/10 12/11 6/13 12/14 6/16 12/17 6/19 9/20
$3,144$3,138
Wilmette Police Pension Fund As of 09/30/20
Page 12

Risk/Return Analysis Since 08/09
Asset Allocation ($000)
Portfolio Characteristics vs. BC Gov 1-3 Yr Since Inception
Portfolio Performance (%)
Spare - Max Flex Fixed Income - 150601 BC Gov 1-3 Yr
0.0
3.0
6.0
9.0
Ret
urn
(%)
Current Quarter
YTD 1Year
3Years
5Years
SinceInception
September 30, 2020 : $2,549
SegmentsMarket Value
($000)Allocation
(%)
Domestic Fixed Income 2,422.55 95.04¢£
Cash Equivalent 126.48 4.96¢£
CurrentQuarter
YTD1
Year3
Years5
YearsSince
InceptionInception
Date
Spare - Max Flex Fixed Income - 150601 1.06 5.14 5.56 3.42 2.41 2.53 08/01/2009
BC Gov 1-3 Yr 0.10 3.09 3.62 2.66 1.82 1.46 08/01/2009
CurrentQuarter
YTD1
Year3
Years5
YearsSince
InceptionInception
Date
Spare - Max Flex Fixed Income - 150601 08/01/2009
Beginning Market Value 2,524 4,460 4,444 4,259 4,297 4,579
Net Contributions 1 -2,099 -2,098 -2,096 -2,195 -3,155
Fees/Expenses -2 -7 -9 -29 -50 -173
Income 19 48 73 277 467 1,394
Gain/Loss 8 147 139 139 30 -95
Ending Market Value 2,549 2,549 2,549 2,549 2,549 2,549
Beta Alpha R-SquaredSharpeRatio
InceptionDate
Spare - Max Flex Fixed Income - 150601 1.65 0.11 0.66 1.05 08/01/2009
BC Gov 1-3 Yr 1.00 0.00 1.00 1.02 08/01/2009
90-Day T-Bills 0.07 0.45 0.09 N/A 08/01/2009
Spare - Max Flex Fixed Income - 150601
BC Gov 1-3 Yr
1.0
1.5
2.0
2.5
3.0
Ret
urn
(%)
0.4 0.6 0.8 1.0 1.2 1.4 1.6 1.8 2.0 2.2 2.4
Risk (Standard Deviation %)
Spare - Max Flex Fixed Income - 150601 BC Gov 1-3 Yr
Net Cash Flow
($2,000)
$0
$2,000
$4,000
$6,000
$8,000
7/09 7/10 7/11 7/12 7/13 7/14 7/15 7/16 7/17 7/18 7/19 9/20
$1,251$1,925$2,549
Spare - Max Flex Fixed Income - 150601 As of 09/30/20
Page 13

Risk/Return Analysis Since 01/03
Asset Allocation ($000)
Portfolio Characteristics vs. Custom Benchmark - SKBA Flex SinceInception
Portfolio Performance (%)
Spare - Flex Fixed Income - 150604 Custom Benchmark - SKBA Flex
0.0
3.0
6.0
9.0
12.0
Ret
urn
(%)
Current Quarter
YTD 1Year
3Years
5Years
SinceInception
September 30, 2020 : $4,941
SegmentsMarket Value
($000)Allocation
(%)
Domestic Fixed Income 4,830.09 97.75¢£
Cash Equivalent 111.06 2.25¢£
CurrentQuarter
YTD1
Year3
Years5
YearsSince
InceptionInception
Date
Spare - Flex Fixed Income - 150604 0.58 7.47 7.58 5.42 4.09 4.26 01/01/2003
Custom Benchmark - SKBA Flex 0.78 8.04 8.03 5.86 4.66 4.29 01/01/2003
CurrentQuarter
YTD1
Year3
Years5
YearsSince
InceptionInception
Date
Spare - Flex Fixed Income - 150604 01/01/2003
Beginning Market Value 4,915 4,604 4,602 4,491 3,833 7,312
Net Contributions 1 2 2 -244 257 -6,588
Fees/Expenses -4 -9 -11 -34 -56 -209
Income 37 106 138 423 730 4,268
Gain/Loss -9 238 210 305 177 158
Ending Market Value 4,941 4,941 4,941 4,941 4,941 4,941
Beta Alpha R-SquaredSharpeRatio
InceptionDate
Spare - Flex Fixed Income - 150604 0.96 0.14 0.96 0.77 01/01/2003
Custom Benchmark - SKBA Flex 1.00 0.00 1.00 0.76 01/01/2003
90-Day T-Bills 0.01 1.25 0.01 N/A 01/01/2003
Spare - Flex Fixed Income - 150604
Custom Benchmark - SKBA Flex
4.2
4.3
4.4
Ret
urn
(%)
3.8 3.9 4.0
Risk (Standard Deviation %)
Spare - Flex Fixed Income - 150604 Custom Benchmark - SKBA Flex
Net Cash Flow
($3,500)
$0
$3,500
$7,000
$10,500
$14,000
12/02 6/04 12/05 6/07 12/08 6/10 12/11 6/13 12/14 6/16 12/17 6/19 9/20
$514
$4,903$4,941
Spare - Flex Fixed Income - 150604 As of 09/30/20
Page 14

Risk/Return Analysis Since 06/11
Asset Allocation ($000)
Portfolio Characteristics vs. Weaver Custom Benchmark Since Inception
Portfolio Performance (%)
Weaver - Fixed Income - 150677 Weaver Custom Benchmark
0.0
4.0
8.0
12.0
16.0
Ret
urn
(%)
Current Quarter
YTD 1Year
3Years
5Years
SinceInception
September 30, 2020 : $8,541
SegmentsMarket Value
($000)Allocation
(%)
Domestic Fixed Income 8,533.90 99.92¢£
Cash Equivalent 7.14 0.08¢£
CurrentQuarter
YTD1
Year3
Years5
YearsSince
InceptionInception
Date
Weaver - Fixed Income - 150677 1.22 7.75 8.26 5.98 4.94 4.44 06/01/2011
Weaver Custom Benchmark 0.88 5.85 6.56 4.74 3.86 3.51 06/01/2011
CurrentQuarter
YTD1
Year3
Years5
YearsSince
InceptionInception
Date
Weaver - Fixed Income - 150677 06/01/2011
Beginning Market Value 7,954 7,478 7,445 6,791 5,890 5,049
Net Contributions 502 503 503 509 1,012 1,020
Fees/Expenses -5 -11 -14 -41 -64 -129
Income 56 177 243 690 1,046 1,723
Gain/Loss 34 395 364 591 657 879
Ending Market Value 8,541 8,541 8,541 8,541 8,541 8,541
Beta Alpha R-SquaredSharpeRatio
InceptionDate
Weaver - Fixed Income - 150677 1.28 -0.04 0.88 1.00 06/01/2011
Weaver Custom Benchmark 1.00 0.00 1.00 1.03 06/01/2011
90-Day T-Bills 0.01 0.61 0.01 N/A 06/01/2011
Weaver - Fixed Income - 150677 Weaver Custom Benchmark
3.0
3.5
4.0
4.5
5.0
Ret
urn
(%)
2.2 2.4 2.6 2.8 3.0 3.2 3.4 3.6 3.8 4.0 4.2
Risk (Standard Deviation %)Weaver - Fixed Income - 150677 Weaver Custom Benchmark
Net Cash Flow
$3,000
$4,500
$6,000
$7,500
$9,000
$10,500
5/11 2/12 11/12 8/13 5/14 2/15 11/15 8/16 5/17 2/18 11/18 8/19 9/20
$5,940
$7,925$8,541
Weaver - Fixed Income - 150677 As of 09/30/20
Page 15

Risk/Return Analysis Since 01/03
Asset Allocation ($000)
Portfolio Characteristics vs. S&P 500 Total Return Since Inception
Portfolio Performance (%)
Vanguard - S&P 500 Inst. Index(02/23/2015) S&P 500 Total Return
0.0
6.0
12.0
18.0
24.0
Ret
urn
(%)
Current Quarter
YTD 1Year
3Years
5Years
SinceInception
September 30, 2020 : $14,933
SegmentsMarket Value
($000)Allocation
(%)
Domestic Equity 14,933.16 100.00¢£
CurrentQuarter
YTD1
Year3
Years5
Years
SinceInceptio
n
InceptionDate
Vanguard - S&P 500 Inst. Index(02/23/2015) 8.97 6.13 15.99 12.54 14.36 10.38 01/01/2003
S&P 500 Total Return 8.93 5.57 15.15 12.28 14.15 10.06 01/01/2003
CurrentQuarter
YTD1
Year3
Years5
YearsSince
InceptionInception
Date
Vanguard - S&P 500 Inst. Index(02/23/2015) 01/01/2003
Beginning Market Value 14,192 12,734 13,739 12,040 10,179 3,438
Net Contributions -500 1,100 -1,100 -2,020 -3,720 -4,336
Fees/Expenses - - - - - -
Income 62 250 403 949 1,494 2,930
Gain/Loss 1,179 849 1,891 3,965 6,980 12,901
Ending Market Value 14,933 14,933 14,933 14,933 14,933 14,933
Beta Alpha R-SquaredSharpeRatio
InceptionDate
Vanguard - S&P 500 Inst. Index(02/23/2015) 0.99 0.40 1.00 0.69 01/01/2003
S&P 500 Total Return 1.00 0.00 1.00 0.66 01/01/2003
90-Day T-Bills 0.00 1.30 0.00 N/A 01/01/2003
Vanguard - S&P 500 Inst. Index(02/23/2015)
S&P 500 Total Return
9.8
10.0
10.2
10.4
10.6
Ret
urn
(%)
13.8 13.9 14.0 14.1 14.2
Risk (Standard Deviation %)
Vanguard - S&P 500 Inst. Index(02/23/2015) S&P 500 Total Return
Net Cash Flow
($7,000)
$0
$7,000
$14,000
$21,000
12/02 6/04 12/05 6/07 12/08 6/10 12/11 6/13 12/14 6/16 12/17 6/19 9/20
($898)
$14,636$14,933
Vanguard - S&P 500 Inst. Index(02/23/2015) As of 09/30/20
Page 16

Risk/Return Analysis Since 06/19
Asset Allocation ($000)
Portfolio Characteristics vs. Russell 2500 GR Since Inception
Portfolio Performance (%)
Columbia Acorn 090766 Russell 2500 GR
0.0
10.0
20.0
30.0
40.0
Ret
urn
(%)
Current Quarter
YTD 1Year
3Years
5Years
SinceInception
September 30, 2020 : $3,973
SegmentsMarket Value
($000)Allocation
(%)
Domestic Equity 3,972.85 100.00¢£
CurrentQuarter
YTD1
Year3
Years5
YearsSince
InceptionInception
Date
Columbia Acorn 090766 9.40 10.51 19.90 N/A N/A 16.23 06/01/2019
Russell 2500 GR 9.37 11.58 23.38 13.36 14.19 20.80 06/01/2019
CurrentQuarter
YTD1
Year3
Years5
YearsSince
InceptionInception
Date
Columbia Acorn 090766 06/01/2019
Beginning Market Value 3,632 3,595 3,314 - - 3,251
Net Contributions 1 1 2 - - 2
Fees/Expenses -1 -1 -2 - - -2
Income - 172 403 - - 549
Gain/Loss 341 206 256 - - 172
Ending Market Value 3,973 3,973 3,973 - - 3,973
Beta Alpha R-SquaredSharpeRatio
InceptionDate
Columbia Acorn 090766 0.89 -2.06 0.97 0.72 06/01/2019
Russell 2500 GR 1.00 0.00 1.00 0.83 06/01/2019
90-Day T-Bills 0.00 1.39 0.05 N/A 06/01/2019
Columbia Acorn 090766 Russell 2500 GR
12.0
15.0
18.0
21.0
24.0
Ret
urn
(%)
21.6 22.2 22.8 23.4 24.0 24.6 25.2 25.8 26.4 27.0
Risk (Standard Deviation %)
Columbia Acorn 090766 Russell 2500 GR Net Cash Flow
$2,400
$3,000
$3,600
$4,200
$4,800
5/19 8/19 11/19 2/20 5/20 8/20 9/20
$3,251
$4,185$3,973
Columbia Acorn 090766 As of 09/30/20
Page 17

Risk/Return Analysis Since 06/19
Asset Allocation ($000)
Portfolio Characteristics vs. S&P 400 MidCap Net Since Inception
Portfolio Performance (%)
iShares S&P MidCap 090767 S&P 400 MidCap Net
0.0
8.0
16.0
-8.0
-16.0
Ret
urn
(%)
Current Quarter
YTD 1Year
3Years
5Years
SinceInception
September 30, 2020 : $1,713
SegmentsMarket Value
($000)Allocation
(%)
Domestic Equity 1,713.19 100.00¢£
Cash Equivalent 0.08 0.00¢£
CurrentQuarter
YTD1
Year3
Years5
YearsSince
InceptionInception
Date
iShares S&P MidCap 090767 4.68 -8.72 -2.34 N/A N/A 3.81 06/01/2019
S&P 400 MidCap Net 4.65 -8.97 -2.66 2.39 7.57 3.34 06/01/2019
CurrentQuarter
YTD1
Year3
Years5
YearsSince
InceptionInception
Date
iShares S&P MidCap 090767 06/01/2019
Beginning Market Value 1,637 1,877 1,755 - - 1,630
Net Contributions - - - - - 1
Fees/Expenses - -1 -1 - - -1
Income 8 21 29 - - 45
Gain/Loss 69 -185 -70 - - 39
Ending Market Value 1,713 1,713 1,713 - - 1,713
Beta Alpha R-SquaredSharpeRatio
InceptionDate
iShares S&P MidCap 090767 1.00 0.44 1.00 0.23 06/01/2019
S&P 400 MidCap Net 1.00 0.00 1.00 0.21 06/01/2019
90-Day T-Bills 0.00 1.35 0.02 N/A 06/01/2019
iShares S&P MidCap 090767 S&P 400 MidCap Net
3.0
3.3
3.6
3.9
4.2
Ret
urn
(%)
26.0 26.1
Risk (Standard Deviation %)
iShares S&P MidCap 090767 S&P 400 MidCap Net Net Cash Flow
$1,000
$1,250
$1,500
$1,750
$2,000
$2,250
5/19 8/19 11/19 2/20 5/20 8/20 9/20
$1,630$1,703$1,713
iShares S&P MidCap 090767 As of 09/30/20
Page 18

Risk/Return Analysis Since 01/11
Asset Allocation ($000)
Portfolio Characteristics vs. Russell 2000 Since Inception
Portfolio Performance (%)
London - Small Cap Core - 150665 Russell 2000
0.0
10.0
20.0
-10.0
-20.0
Ret
urn
(%)
Current Quarter
YTD 1Year
3Years
5Years
SinceInception
September 30, 2020 : $3,262
SegmentsMarket Value
($000)Allocation
(%)
Domestic Equity 2,526.57 77.47¢£
International Equity 341.09 10.46¢£
Alternative Investment 307.09 9.42¢£
Cash Equivalent 86.80 2.66¢£
CurrentQuarter
YTD1
Year3
Years5
YearsSince
InceptionInception
Date
London - Small Cap Core - 150665 5.20 -11.86 -7.53 2.04 4.11 7.29 01/01/2011
Russell 2000 4.93 -8.69 0.39 1.77 8.00 8.42 01/01/2011
CurrentQuarter
YTD1
Year3
Years5
YearsSince
InceptionInception
Date
London - Small Cap Core - 150665 01/01/2011
Beginning Market Value 3,100 3,705 3,532 3,074 2,671 314
Net Contributions 1 1 5 61 88 1,730
Fees/Expenses -1 -6 -9 -66 -92 -134
Income 9 37 48 189 270 443
Gain/Loss 152 -476 -314 3 325 908
Ending Market Value 3,262 3,262 3,262 3,262 3,262 3,262
Beta Alpha R-SquaredSharpeRatio
InceptionDate
London - Small Cap Core - 150665 0.86 0.07 0.85 0.47 01/01/2011
Russell 2000 1.00 0.00 1.00 0.51 01/01/2011
90-Day T-Bills 0.00 0.63 0.01 N/A 01/01/2011
London - Small Cap Core - 150665 Russell 2000
6.6
7.2
7.8
8.4
9.0
Ret
urn
(%)
16.2 16.5 16.8 17.1 17.4 17.7 18.0 18.3 18.6
Risk (Standard Deviation %)London - Small Cap Core - 150665 Russell 2000
Net Cash Flow
($1,500)
$0
$1,500
$3,000
$4,500
$6,000
12/10 12/11 12/12 12/13 12/14 12/15 12/16 12/17 12/18 12/19 9/20
$1,910
$3,762$3,262
London - Small Cap Core - 150665 As of 09/30/20
Page 19

Risk/Return Analysis Since 04/04
Asset Allocation ($000)
Portfolio Characteristics vs. MSCI AC World ex US Net Since Inception
Portfolio Performance (%)
Amerifunds - International Equity - 150607 MSCI AC World ex US Net
0.0
10.0
20.0
30.0
-10.0
-20.0
Ret
urn
(%)
Current Quarter
YTD 1Year
3Years
5Years
SinceInception
September 30, 2020 : $3,169
SegmentsMarket Value
($000)Allocation
(%)
International Equity 3,169.23 100.00¢£
CurrentQuarter
YTD1
Year3
Years5
YearsSince
InceptionInception
Date
Amerifunds - International Equity - 150607 9.66 4.43 14.97 5.66 9.05 7.51 04/01/2004
MSCI AC World ex US Net 6.25 -5.44 3.00 1.16 6.23 5.32 04/01/2004
CurrentQuarter
YTD1
Year3
Years5
YearsSince
InceptionInception
Date
Amerifunds - International Equity - 150607 04/01/2004
Beginning Market Value 2,890 3,035 2,757 2,687 2,055 255
Net Contributions 1 1 1 4 4 1,094
Fees/Expenses -1 -1 -1 -4 -4 -4
Income - - 88 326 482 910
Gain/Loss 279 134 324 156 633 914
Ending Market Value 3,169 3,169 3,169 3,169 3,169 3,169
Beta Alpha R-SquaredSharpeRatio
InceptionDate
Amerifunds - International Equity - 150607 0.93 2.43 0.96 0.45 04/01/2004
MSCI AC World ex US Net 1.00 0.00 1.00 0.32 04/01/2004
90-Day T-Bills 0.00 1.30 0.00 N/A 04/01/2004
Amerifunds - International Equity - 150607
MSCI AC World ex US Net
4.0
6.0
8.0
10.0
Ret
urn
(%)
15.6 15.9 16.2 16.5 16.8 17.1 17.4
Risk (Standard Deviation %)
Amerifunds - International Equity - 150607 MSCI AC World ex US Net
Net Cash Flow
($1,500)
$0
$1,500
$3,000
$4,500
3/04 9/05 3/07 9/08 3/10 9/11 3/13 9/14 3/16 9/17 3/19 9/20
$1,345
$2,291
$3,169
Amerifunds - International Equity - 150607 As of 09/30/20
Page 20

Risk/Return Analysis Since 05/14
Asset Allocation ($000)
Portfolio Characteristics vs. FTSE Nareit All Equity REIT Index SinceInception
Portfolio Performance (%)
Vanguard REIT Index Fund Admiral Shares FTSE Nareit All Equity REIT Index
0.0
8.0
16.0
-8.0
-16.0
-24.0
Ret
urn
(%)
Current Quarter
YTD 1Year
3Years
5Years
SinceInception
September 30, 2020 : $1,216
SegmentsMarket Value
($000)Allocation
(%)
REITS 1,216.33 100.00¢£
CurrentQuarter
YTD1
Year3
Years5
Years
SinceInceptio
n
InceptionDate
Vanguard REIT Index Fund Admiral Shares 1.33 -12.73 -12.19 2.37 5.21 5.80 05/01/2014
FTSE Nareit All Equity REIT Index 1.19 -12.38 -11.81 2.37 4.71 4.90 05/01/2014
CurrentQuarter
YTD1
Year3
Years5
YearsSince
InceptionInception
Date
Vanguard REIT Index Fund Admiral Shares 05/01/2014
Beginning Market Value 1,200 1,394 1,385 1,134 1,202 600
Net Contributions - - - - -300 250
Fees/Expenses - - - - - -
Income 9 30 44 143 256 306
Gain/Loss 7 -208 -213 -61 58 60
Ending Market Value 1,216 1,216 1,216 1,216 1,216 1,216
Beta Alpha R-SquaredSharpeRatio
InceptionDate
Vanguard REIT Index Fund Admiral Shares 1.01 0.82 1.00 0.38 05/01/2014
FTSE Nareit All Equity REIT Index 1.00 0.00 1.00 0.33 05/01/2014
90-Day T-Bills 0.00 0.91 0.00 N/A 05/01/2014
Vanguard REIT Index Fund Admiral Shares
FTSE Nareit All Equity REIT Index
4.5
5.0
5.5
6.0
6.5
Ret
urn
(%)
15.5 15.6 15.7 15.8 15.9 16.0 16.1
Risk (Standard Deviation %)
Vanguard REIT Index Fund Admiral Shares FTSE Nareit All Equity REIT Index
Net Cash Flow
$0
$400
$800
$1,200
$1,600
$2,000
4/14 10/14 4/15 10/15 4/16 10/16 4/17 10/17 4/18 10/18 4/19 10/19 4/20 9/20
$850
$1,146$1,216
Vanguard REIT Index Fund Admiral Shares As of 09/30/20
Page 21

Risk/Return Analysis Since 05/10
Asset Allocation ($000)
Portfolio Characteristics vs. MSCI EM Net Since Inception
Portfolio Performance (%)
Lazard - Emerging Markets Equity - 150648 MSCI EM Net
0.0
15.0
30.0
-15.0
-30.0
-45.0
Ret
urn
(%)
Current Quarter
YTD 1Year
3Years
5Years
SinceInception
September 30, 2020 : $1,872
SegmentsMarket Value
($000)Allocation
(%)
International Equity 1,871.77 100.00¢£
CurrentQuarter
YTD1
Year3
Years5
Years
SinceInceptio
n
InceptionDate
Lazard - Emerging Markets Equity - 150648 2.55 -19.37 -10.38 -6.11 3.68 0.28 05/01/2010
MSCI EM Net 9.56 -1.16 10.54 2.42 8.97 3.05 05/01/2010
CurrentQuarter
YTD1
Year3
Years5
YearsSince
InceptionInception
Date
Lazard - Emerging Markets Equity - 150648 05/01/2010
Beginning Market Value 1,825 2,321 2,089 3,370 2,328 296
Net Contributions - 1 1 -966 -965 1,574
Fees/Expenses - -1 -1 -3 -5 -5
Income 27 27 64 181 277 758
Gain/Loss 19 -477 -281 -710 236 -752
Ending Market Value 1,872 1,872 1,872 1,872 1,872 1,872
Beta Alpha R-SquaredSharpeRatio
InceptionDate
Lazard - Emerging Markets Equity - 150648 1.00 -2.53 0.91 0.08 05/01/2010
MSCI EM Net 1.00 0.00 1.00 0.23 05/01/2010
90-Day T-Bills 0.00 0.59 0.00 N/A 05/01/2010
Lazard - Emerging Markets Equity - 150648
MSCI EM Net
-1.5
0.0
1.5
3.0
4.5
Ret
urn
(%)
17.4 17.6 17.8 18.0 18.2 18.4 18.6 18.8 19.0 19.2
Risk (Standard Deviation %)
Lazard - Emerging Markets Equity - 150648 MSCI EM Net
Net Cash Flow
($1,500)
$0
$1,500
$3,000
$4,500
$6,000
4/10 4/11 4/12 4/13 4/14 4/15 4/16 4/17 4/18 4/19 9/20
$1,866$2,564$1,872
Lazard - Emerging Markets Equity - 150648 As of 09/30/20
Page 22

Risk/Return Analysis Since 12/18
Asset Allocation ($000)
Portfolio Characteristics vs. MSCI ACWI Since Inception
Portfolio Performance (%)
American New World 087509 MSCI ACWI
0.0
6.0
12.0
18.0
24.0
Ret
urn
(%)
Current Quarter
YTD 1Year
3Years
5Years
SinceInception
September 30, 2020 : $1,296
SegmentsMarket Value
($000)Allocation
(%)
International Equity 1,295.98 100.00¢£
CurrentQuarter
YTD1
Year3
Years5
YearsSince
InceptionInception
Date
American New World 087509 8.19 4.97 14.50 N/A N/A 15.15 12/01/2018
MSCI ACWI 8.25 1.77 11.00 7.68 10.90 10.70 12/01/2018
CurrentQuarter
YTD1
Year3
Years5
YearsSince
InceptionInception
Date
American New World 087509 12/01/2018
Beginning Market Value 1,198 1,235 1,132 - - 1,001
Net Contributions - - 1 - - 1
Fees/Expenses - - -1 - - -1
Income - - 48 - - 73
Gain/Loss 98 61 116 - - 222
Ending Market Value 1,296 1,296 1,296 - - 1,296
Beta Alpha R-SquaredSharpeRatio
InceptionDate
American New World 087509 0.97 4.47 0.94 0.74 12/01/2018
MSCI ACWI 1.00 0.00 1.00 0.54 12/01/2018
90-Day T-Bills 0.00 1.67 0.03 N/A 12/01/2018
American New World 087509 MSCI ACWI
6.0
9.0
12.0
15.0
18.0
Ret
urn
(%)
19.4 19.5
Risk (Standard Deviation %)American New World 087509 MSCI ACWI
Net Cash Flow
$800
$1,000
$1,200
$1,400
$1,600
11/18 2/19 5/19 8/19 11/19 2/20 5/20 9/20
$1,001
$1,206$1,296
American New World 087509 As of 09/30/20
Page 23

Risk/Return Analysis Since 12/18
Asset Allocation ($000)
Portfolio Characteristics vs. MSCI EAFE Since Inception
Portfolio Performance (%)
JOHCM International 087514 MSCI EAFE
0.0
15.0
30.0
45.0
-15.0
-30.0
Ret
urn
(%)
Current Quarter
YTD 1Year
3Years
5Years
SinceInception
September 30, 2020 : $1,129
SegmentsMarket Value
($000)Allocation
(%)
International Equity 1,129.25 100.00¢£
CurrentQuarter
YTD1
Year3
Years5
YearsSince
InceptionInception
Date
JOHCM International 087514 9.81 14.61 23.30 N/A N/A 15.53 12/01/2018
MSCI EAFE 4.80 -7.09 0.49 0.62 5.26 4.21 12/01/2018
CurrentQuarter
YTD1
Year3
Years5
YearsSince
InceptionInception
Date
JOHCM International 087514 12/01/2018
Beginning Market Value 1,028 985 916 - - 867
Net Contributions - - - - - 1
Fees/Expenses - - - - - -1
Income - - 9 - - 22
Gain/Loss 101 144 204 - - 241
Ending Market Value 1,129 1,129 1,129 - - 1,129
Beta Alpha R-SquaredSharpeRatio
InceptionDate
JOHCM International 087514 0.83 11.63 0.82 0.88 12/01/2018
MSCI EAFE 1.00 0.00 1.00 0.23 12/01/2018
90-Day T-Bills 0.00 1.65 0.02 N/A 12/01/2018
JOHCM International 087514 MSCI EAFE
-10.0
0.0
10.0
20.0
30.0
Ret
urn
(%)
15.2 15.6 16.0 16.4 16.8 17.2 17.6 18.0
Risk (Standard Deviation %)JOHCM International 087514 MSCI EAFE
Net Cash Flow
$600
$750
$900
$1,050
$1,200
$1,350
11/18 2/19 5/19 8/19 11/19 2/20 5/20 9/20
$867$935
$1,129
JOHCM International 087514 As of 09/30/20
Page 24

Risk/Return Analysis Since 12/18
Asset Allocation ($000)
Portfolio Characteristics vs. MSCI EAFE IMI NT Since Inception
Portfolio Performance (%)
iShares Core MSCI EAFE 087516 MSCI EAFE IMI NT
0.0
6.0
12.0
-6.0
-12.0
Ret
urn
(%)
Current Quarter
YTD 1Year
3Years
5Years
SinceInception
September 30, 2020 : $935
SegmentsMarket Value
($000)Allocation
(%)
International Equity 935.12 100.00¢£
CurrentQuarter
YTD1
Year3
Years5
YearsSince
InceptionInception
Date
iShares Core MSCI EAFE 087516 5.46 -6.48 1.26 N/A N/A 4.48 12/01/2018
MSCI EAFE IMI NT 5.64 -6.32 1.81 1.20 6.05 5.04 12/01/2018
CurrentQuarter
YTD1
Year3
Years5
YearsSince
InceptionInception
Date
iShares Core MSCI EAFE 087516 12/01/2018
Beginning Market Value 887 1,000 924 - - 863
Net Contributions - - - - - 1
Fees/Expenses - - - - - -1
Income - 11 24 - - 53
Gain/Loss 48 -76 -12 - - 19
Ending Market Value 935 935 935 - - 935
Beta Alpha R-SquaredSharpeRatio
InceptionDate
iShares Core MSCI EAFE 087516 0.99 -0.49 0.99 0.25 12/01/2018
MSCI EAFE IMI NT 1.00 0.00 1.00 0.28 12/01/2018
90-Day T-Bills 0.00 1.65 0.02 N/A 12/01/2018
iShares Core MSCI EAFE 087516 MSCI EAFE IMI NT
4.5
4.8
5.1
5.4
Ret
urn
(%)
17.8 17.9 18.0
Risk (Standard Deviation %)iShares Core MSCI EAFE 087516 MSCI EAFE IMI NT
Net Cash Flow
$600
$700
$800
$900
$1,000
$1,100
11/18 2/19 5/19 8/19 11/19 2/20 5/20 9/20
$863
$944$935
iShares Core MSCI EAFE 087516 As of 09/30/20
Page 25

Risk/Return Analysis Since 12/18
Asset Allocation ($000)
Portfolio Characteristics vs. MSCI EAFE Since Inception
Portfolio Performance (%)
Tweedy Browne Global Value 087517 MSCI EAFE
0.0
10.0
20.0
-10.0
-20.0
-30.0
Ret
urn
(%)
Current Quarter
YTD 1Year
3Years
5Years
SinceInception
September 30, 2020 : $1,167
SegmentsMarket Value
($000)Allocation
(%)
International Equity 1,167.30 100.00¢£
CurrentQuarter
YTD1
Year3
Years5
YearsSince
InceptionInception
Date
Tweedy Browne Global Value 087517 0.08 -13.50 -10.85 N/A N/A -2.83 12/01/2018
MSCI EAFE 4.80 -7.09 0.49 0.62 5.26 4.21 12/01/2018
CurrentQuarter
YTD1
Year3
Years5
YearsSince
InceptionInception
Date
Tweedy Browne Global Value 087517 12/01/2018
Beginning Market Value 1,166 1,350 1,309 - - 878
Net Contributions - - 1 - - 351
Fees/Expenses - - -1 - - -1
Income - - 25 - - 78
Gain/Loss 1 -182 -167 - - -138
Ending Market Value 1,167 1,167 1,167 - - 1,167
Beta Alpha R-SquaredSharpeRatio
InceptionDate
Tweedy Browne Global Value 087517 0.86 -6.35 0.95 -0.22 12/01/2018
MSCI EAFE 1.00 0.00 1.00 0.23 12/01/2018
90-Day T-Bills 0.00 1.65 0.02 N/A 12/01/2018
Tweedy Browne Global Value 087517
MSCI EAFE
-8.0
-4.0
0.0
4.0
8.0
Ret
urn
(%)
14.0 14.5 15.0 15.5 16.0 16.5 17.0 17.5 18.0 18.5
Risk (Standard Deviation %)
Tweedy Browne Global Value 087517 MSCI EAFE
Net Cash Flow
$500
$750
$1,000
$1,250
$1,500
$1,750
11/18 2/19 5/19 8/19 11/19 2/20 5/20 9/20
$1,228$1,319$1,167
Tweedy Browne Global Value 087517 As of 09/30/20
Page 26

Risk/Return Analysis Since 01/03
Asset Allocation ($000)
Portfolio Characteristics vs. BC Gov Intm Since Inception
Portfolio Performance (%)
Self Managed - Fixed Income - 150522 BC Gov Intm
0.0
3.0
6.0
9.0
Ret
urn
(%)
Current Quarter
YTD 1Year
3Years
5Years
SinceInception
September 30, 2020 : $12
SegmentsMarket Value
($000)Allocation
(%)
Domestic Fixed Income 1.14 9.46¢£
Cash Equivalent 10.91 90.54¢£
CurrentQuarter
YTD1
Year3
Years5
YearsSince
InceptionInception
Date
Self Managed - Fixed Income - 150522 0.17 0.87 1.45 2.09 2.61 3.34 01/01/2003
BC Gov Intm 0.20 5.96 5.98 4.04 2.76 3.27 01/01/2003
CurrentQuarter
YTD1
Year3
Years5
YearsSince
InceptionInception
Date
Self Managed - Fixed Income - 150522 01/01/2003
Beginning Market Value 12 12 11 10 10 1,113
Net Contributions - - 1 1 1 -1,185
Fees/Expenses - - - - - -
Income - - - 1 2 157
Gain/Loss - - - - - -73
Ending Market Value 12 12 12 12 12 12
Beta Alpha R-SquaredSharpeRatio
InceptionDate
Self Managed - Fixed Income - 150522 0.05 3.20 0.00 1.07 01/01/2003
BC Gov Intm 1.00 0.00 1.00 0.73 01/01/2003
90-Day T-Bills 0.02 1.21 0.02 N/A 01/01/2003
Self Managed - Fixed Income - 150522
BC Gov Intm
3.2
3.3
3.4
Ret
urn
(%)
1.4 1.6 1.8 2.0 2.2 2.4 2.6 2.8 3.0 3.2
Risk (Standard Deviation %)
Self Managed - Fixed Income - 150522 BC Gov Intm
Net Cash Flow
($500)
$0
$500
$1,000
$1,500
$2,000
12/02 6/04 12/05 6/07 12/08 6/10 12/11 6/13 12/14 6/16 12/17 6/19 9/20
($72)$20$12
Self Managed - Fixed Income - 150522 As of 09/30/20
Page 27

January February March April May June July August September October November December Year
2003 -1.00 0.48 0.20 3.49 3.76 0.30 -1.17 1.27 0.92 1.95 0.59 2.61 14.09
2004 1.35 1.29 -0.18 -2.34 0.54 1.13 -1.31 1.12 0.80 1.23 1.72 2.16 7.67
2005 -0.96 0.84 -1.08 -0.31 2.09 0.56 1.41 0.39 0.08 -1.26 2.14 0.67 4.60
2006 1.68 0.08 0.46 0.77 -1.99 0.16 0.75 1.89 1.53 1.95 1.64 0.38 9.65
2007 0.80 0.00 0.70 2.44 1.40 -0.60 -0.55 1.36 2.24 1.54 -0.44 -0.16 9.01
2008 -1.52 -0.48 0.09 1.23 0.05 -3.27 -0.14 0.82 -4.36 -8.49 0.03 3.11 -12.66
2009 -4.83 -4.63 5.28 3.44 2.84 -0.17 4.59 2.02 2.55 -0.83 3.80 -0.08 14.23
2010 -1.43 1.51 2.94 1.09 -3.91 -1.21 4.11 -1.24 4.47 2.03 -0.84 2.58 10.20
2011 0.83 1.61 0.56 2.42 -0.32 -0.82 -0.22 -2.18 -4.15 5.16 -0.37 0.35 2.61
2012 3.24 2.33 0.41 0.28 -3.55 2.19 1.36 0.82 1.54 -0.31 0.69 0.81 10.08
2013 2.14 0.62 1.43 1.47 -0.04 -2.02 2.94 -1.65 2.72 2.67 1.32 1.14 13.34
2014 -2.49 2.83 0.87 0.35 1.83 1.44 -1.26 2.39 -2.54 1.36 1.57 -1.14 5.12
2015 -0.47 3.33 -0.29 0.70 0.03 -1.53 0.31 -4.43 -2.03 4.80 -0.32 -1.84 -2.03
2016 -2.82 0.03 5.56 0.75 0.53 0.64 3.13 -0.12 0.01 -1.88 1.04 1.41 8.33
2017 1.69 2.15 0.52 0.83 0.57 0.86 1.36 0.15 1.29 0.85 1.62 1.09 13.77
2018 3.43 -3.45 -0.57 -0.42 0.81 -0.17 1.95 0.50 -0.47 -5.14 1.34 -5.15 -7.46
2019 6.23 1.90 1.11 2.35 -3.57 4.71 0.63 -0.81 1.00 1.53 1.91 1.88 20.21
2020 -0.34 -4.63 -10.03 8.03 3.87 1.80 4.14 3.06 -1.93 N/A N/A N/A N/A
Wilmette Police Pension FundWilmette Police Pension Fund
Since Inception Ending September 30, 2020
Page 28

Passive Portfolios Weight (%)
Dec-2001
BC Gov 50.00
90-Day T-Bills 5.00
Russell 3000 40.00
MSCI EAFE Net 5.00
Apr-2004
BC Gov 50.00
90-Day T-Bills 5.00
Russell 3000 40.00
MSCI EAFE Net 5.00
Jul-2011
Barclays Govt/Credit Bond 48.00
90-Day T-Bills 2.00
S&P 500 Total Return 17.00
S&P 400 Midcap TR 3.00
Russell 2000 3.00
FTSE NAREIT All Equity REITS 3.00
MSCI AC World ex US Net 16.00
MSCI EM Net 8.00
Apr-2013
Barclays Govt/Credit Bond 35.00
S&P 500 Total Return 25.00
S&P 400 Midcap TR 10.00
Russell 2000 7.00
FTSE NAREIT All Equity REITS 3.00
MSCI AC World ex US Net 12.00
MSCI EM Net 8.00
Wilmette Police Pension Fund Custom Benchmark - Total Fund
As of September 30, 2020
Page 29

Passive Portfolios Weight (%)
Mar-2013
S&P 500 Total Return 56.00
S&P 400 Midcap TR 22.00
Russell 2000 15.00
FTSE NAREIT All Equity REITS 7.00
Wilmette Police Pension Fund Custom Benchmark - US Equity
As of September 30, 2020
Page 30

Passive Portfolios Weight (%)
Dec-2002
BC Gov 100.00
Jul-2011
Barclays Govt/Credit Bond 100.00
Wilmette Police Pension Fund Custom Benchmarks - SKBA
As of September 30, 2020
Page 31

Passive Portfolios Weight (%)
Jun-2011
60 BC CORP GOV 40 BC GOV 100.00
Jul-2013
BC Corp Intm 60.00
BC Gov Intm 40.00
Wilmette Police Pension Fund Custom Benchmark - Weaver
As of September 30, 2020
Page 32

Account Name YTD1
Year3
Years5
Years10
YearsSince
InceptionInception
Date
Performance Appendix
QTD
Performance Data below is net of fees. Please see the Morgan Stanley Smith Barney LLC Form ADV Part 2 Brochure for advisory accounts and/or any applicable brokerage account trade confirmation statements fora full disclosure of the applicable charges, fees and expenses. Your Financial Advisor will provide those documents to you upon request.
American New World 087509 4.94 14.45 -- -- -- 15.10 12/01/20188.17
Amerifunds - International Equity - 150607 4.40 14.93 5.61 9.02 6.74 7.50 04/01/20049.64
Columbia Acorn 090766 10.47 19.85 -- -- -- 16.18 06/01/20199.38
JOHCM International 087514 14.58 23.25 -- -- -- 15.48 12/01/20189.79
Lazard - Emerging Markets Equity - 150648 -19.39 -10.42 -6.16 3.64 -0.55 0.27 05/01/20102.53
London - Small Cap Core - 150665 -12.01 -7.77 1.37 3.51 -- 6.77 01/01/20115.18
Self Managed - Fixed Income - 150522 0.96 1.58 2.23 2.69 2.23 3.36 01/01/20030.16
Spare - Flex Fixed Income - 150604 7.28 7.33 5.15 3.83 3.28 4.02 01/01/20030.50
Spare - Max Flex Fixed Income - 150601 4.93 5.28 3.17 2.15 1.63 2.19 08/01/20090.98
Tweedy Browne Global Value 087517 -13.53 -10.88 -- -- -- -2.87 12/01/20180.06
Vanguard - S&P 500 Inst. Index(02/23/2015) 6.13 15.99 12.54 14.36 13.76 10.38 01/01/20038.97
Vanguard Money Market -- -- -- -- -- 0.08 03/01/20200.02
Vanguard REIT Index Fund Admiral Shares -12.73 -12.19 2.37 5.21 -- 5.80 05/01/20141.33
Weaver - Fixed Income - 150677 7.60 8.06 5.78 4.74 -- 4.20 06/01/20111.17
iShares Core MSCI EAFE 087516 -6.51 1.22 -- -- -- 4.44 12/01/20185.44
iShares S&P MidCap 090767 -8.75 -2.39 -- -- -- 3.76 06/01/20194.66
All performance above are Time Weighted(TWR) performance
Glossary of Terms
Active Contribution Return: The gain or loss percentage of an investment relative to the performance of
the investment benchmark.
Active Exposure: The percentage difference in weight of the portfolio compared to its policy benchmark.
Active Return: Arithmetic difference between the manager’s return and the benchmark’s return over a
specified time period.
Actual Correlation: A measure of the correlation (linear dependence) between two variables X and Y, with
a value between +1 and -1 inclusive. This is also referred to as coefficient of correlation.
Alpha: A measure of a portfolio's time weighted return in excess of the market’s return, both adjusted for
risk. A positive alpha indicates that the portfolio outperformed the market on a risk-adjusted basis, and a
negative alpha indicates the portfolio did worse than the market.
Best Quarter: The highest quarterly return for a certain time period.
Beta: A measure of the sensitivity of a portfolio’s time weighted return (net of fees) against that of the
Beta: A measure of the sensitivity of a portfolio’s time weighted return (net of fees) against that of the
market. A beta greater than 1.00 indicates volatility greater than the market.
Consistency: The percentage of quarters that a product achieved a rate of return higher than that of its
benchmark. The higher the consistency figure, the more value a manager has contributed to the product’s
performance.
Core: Refers to an investment strategy mandate that is blend of growth and value styles without a
pronounced tilt toward either style.
Cumulative Selection Return (Cumulative Return): Cumulative investment performance over a specified
period of time.
Distribution Rate: The most recent distribution paid, annualized, and then divided by the current market
price. Distribution rate may consist of investment income, short-term capital gains, long-term capital gains,
and/or return of capital.
Down Market Capture: The ratio of average portfolio returns over the benchmark during periods of
negative benchmark return. Lower values indicate better product performance.

negative benchmark return. Lower values indicate better product performance.
Downside Risk: A measure similar to standard deviation, but focuses only on the negative movements of
the return series. It is calculated by taking the standard deviation of the negative quarterly set of returns. The
higher the value, the more risk the product has.
Downside Semi Deviation: A statistical calculation that measures the volatility of returns below a
minimum acceptable return. This return measure isolates the negative portion of volatility: the larger the
number, the greater the volatility.
Drawdown: A drawdown is the peak-to-trough decline during a specific period of an investment, fund or
commodity.
Excess over Benchmark: The percentage gain or loss of an investment relative to the investment's
benchmark.
Excess Return: Arithmetic difference between the manager’s return and the risk-free return over a specified
time period.
Growth: A diversified investment strategy which includes investment selections that have capital
appreciation as the primary goal, with little or no dividend payouts. These strategies can include
reinvestment in expansion, acquisitions, and/or research and development opportunities.
Growth of Dollar: The aggregate amount an investment has gained or lost over a certain time period, also
referred to as Cumulative Return, stated in terms of the amount to which an initial dollar investment would
have grown over the given time period.
Investment Decision Process (IDP): A model for structuring the investment process and implementing the
correct attribution methodologies. The IDP includes every decision made concerning the division of the
assets under management over the various asset categories. To analyze each decision‘s contribution to the
total return, a modeling approach must measure the marginal value of every individual decision. In this
respect, the hierarchy of the decisions becomes very important. We therefore use the IDP model, which
serves as a proper foundation for registering the decisions and relating them to each other.
Information Ratio: Measured by dividing the active rate of return by the tracking error. The higher the
Information Ratio, the more value-added contribution by the manager.
Jensen’s Alpha: The Jensen's alpha measure is a risk-adjusted performance measure that represents theaverage return on a portfolio or investment above or below that predicted by the capital asset pricing model(CAPM) given the portfolio's or investment's beta and the average market return. This metric is alsocommonly referred to as alpha..
Kurtosis: A statistical measure that is used to describe the distribution, or skewness, of observed dataaround the mean, sometimes referred to as the volatility of volatility.
Maximum Drawdown: The drawdown is defined as the percent retrenchment from a fund's peak to thefund's trough value. It is in effect from the time the fund's retrenchment begins until a new fund high isreached. The maximum drawdown encompasses both the period from the fund's peak to the fund's valley(length), and the time from the fund's valley to a new fund high (recovery). It measures the largestpercentage drawdown that has occurred in any fund's data record.
Modern Portfolio Theory (MPT): An investment analysis theory on how risk-averse investors can
Modern Portfolio Theory (MPT): An investment analysis theory on how risk-averse investors canconstruct portfolios to optimize or maximize expected return based on a given level of market risk,emphasizing that risk is an inherent part of higher reward.
Mutual Fund (MF): An investment program funded by shareholders that trade in diversified holdings andis professionally managed.
Peer Group: A combination of funds that share the same investment style combined as a group forcomparison purposes.
Peer/ Plan Sponsor Universe: A combination of asset pools of total plan investments by specific sponsorand plan types for comparison purposes.
Performance Ineligible Assets: Performance returns are not calculated for certain assets because accuratevaluations and transaction data for these assets are not processed or maintained by us. Common examples ofthese include life insurance, some annuities and some assets held externally.
Performance Statistics: A generic term for various measures of investment performance measurementterms.
Portfolio Characteristics: A generic term for various measures of investment portfolio characteristics.
Preferred Return: A term used in the private equity (PE) world, and also referred to as a “Hurdle Rate.” Itrefers to the threshold return that the limited partners of a private equity fund must receive, prior to the PEfirm receiving its carried interest or "carry."
Ratio of Cumulative Wealth: A defined ratio of the Cumulative Return of the portfolio divided by theCumulative Return of the benchmark for a certain time period.
Regression Based Analysis: A statistical process for estimating the relationships among variables. Itincludes many techniques for modeling and analyzing several variables, when the focus is on therelationship between a dependent variable and one or more independent variables
Residual Correlation: Within returns-based style analysis, residual correlation refers to the portion of astrategy’s return pattern that cannot be explained by its correlation to the asset-class benchmarks to which itis being compared.
Return: A rate of investment performance for the specified period.
Rolling Percentile Ranking: A measure of an investment portfolio’s ranking versus a peer group for aspecific rolling time period (i.e. Last 3 Years, Last 5 years, etc.).
R-Squared: The percentage of a portfolio's performance explained by the behavior of the appropriatebenchmark. High R-Squared means a higher correlation of the portfolio's performance to the appropriatebenchmark.
SA/CF (Separate Account/Comingled Fund): Represents an acronym for Separate Account andCommingled Fund investment vehicles.
Sector Benchmark: A market index that serves as a proxy for a sector within an asset class.
Sharpe Ratio: Represents the excess rate of return over the risk free return divided by the standarddeviation of the excess return. The result is the absolute rate of return per unit of risk. The higher the value,the better the product’s historical risk-adjusted performance results in.
Standard Deviation: A statistical measure of the range of a portfolio's performance; the variability of areturn around its average return over a specified time period.
Total Fund Benchmark: The policy benchmark for a complete asset pool that could consist of multiple

Total Fund Benchmark: The policy benchmark for a complete asset pool that could consist of multipleinvestment mandates.
Total Fund Composite: The aggregate of multiple portfolios within an asset pool or household.
Tracking Error: A measure of standard deviation for a portfolio's investment performance, relative to theperformance of an appropriate market benchmark.
Treynor Ratio: A ratio that divides the excess return (above the risk free rate) by the portfolio’s beta toarrive at a unified measure of risk adjusted return. It is generally used to rank portfolios, funds andbenchmarks. A higher ratio is indicative of higher returns per unit of market risk. This measurement canhelp determine if the portfolio is reaching its goal of increasing returns while managing market risk.
Up Market Capture: The ratio of average portfolio returns over the benchmark during periods of positivebenchmark return. Higher values indicate better product performance.
Upside Semi Deviation: A statistical calculation that measures the volatility of returns above an acceptablereturn. This return measure isolates the positive portion of volatility: the larger the number, the greater thevolatility.
Value: A diversified investment strategy that includes investment selections which tend to trade at a lowerprice relative to its dividends, earnings, and sales. Common attributes are stocks that include high dividend,low price-to-book ratio, and/or low price-to-earnings ratio.
Worst Quarter: The lowest rolling quarterly return for a certain time period.
Information Disclosures
Performance results are annualized for time periods greater than one year and include all cash and cash
equivalents, realized and unrealized capital gains and losses, and dividends, interest and income. The
investment results depicted herein represent historical performance. As a result of recent market activity,
current performance may vary from the figures shown. Past performance is not a guarantee of future
results.
Please see the Morgan Stanley Smith Barney LLC Form ADV Part 2 Brochure for advisory accounts
and/or any applicable brokerage account trade confirmation statements for a full disclosure of the
applicable charges, fees and expenses. Your Financial Advisor will provide those documents to you upon
request.
Benchmark indices and blends included in this material are for informational purposes only, are
provided solely as a comparison tool and may not reflect the underlying composition and/or investment
objective(s) associated with the account(s). Indices are unmanaged and not available for direct
investment. Index returns do not take into account fees or other charges. Such fees and charges would
reduce performance.
The performance data shown reflects past performance, which does not guarantee future results.
Investment return and principal will fluctuate so that an investor’s shares when redeemed may be worth
more or less than original cost. Please note, current performance may be higher or lower than the
performance data shown. For up to date month-end performance information, please contact your
Financial Advisor or visit the funds’ company website.
Investors should carefully consider the fund’s investment objectives, risks, charges and expenses before
investing. The prospectus and, if available the summary prospectus, contains this and other information
investing. The prospectus and, if available the summary prospectus, contains this and other information
that should be read carefully before investing. Investors should review the information in the prospectus
carefully. To obtain a prospectus, please contact your Financial Advisor or visit the funds’ company
website.
Past performance is no guarantee of future results.
Investing involves market risk, including possible loss of principal. Growth investing does not guarantee a
profit or eliminate risk. The stocks of these companies can have relatively high valuations. Because of these
high valuations, an investment in a growth stock can be more risky than an investment in a company with
more modest growth expectations. Value investing involves the risk that the market may not recognize that
securities are undervalued and they may not appreciate as anticipated. Small and mid-capitalization
companies may lack the financial resources, product diversification and competitive strengths of larger
companies. The securities of small capitalization companies may not trade as readily as, and be subject to
higher volatility than those of larger, more established companies. Bond funds and bond holdings have the
same interest rate, inflation and credit risks that are associated with the underlying bonds owned by the
funds. The return of principal in bond funds, and in funds with significant bond holdings, is not guaranteed.
International securities’ prices may carry additional risks, including foreign economic, political, monetary
and/or legal factors, changing currency exchange rates, foreign taxes and differences in financial and
accounting standards. International investing may not be for everyone. These risks may be magnified in
emerging markets. Alternative investments, including private equity funds, real estate funds, hedge funds,
managed futures funds, and funds of hedge funds, private equity, and managed futures funds, are
speculative and entail significant risks that can include losses due to leveraging or\other speculative
investment practices, lack of liquidity, volatility of returns, restrictions on transferring interests in a fund,
potential lack of diversification, absence and/or delay of information regarding valuations and pricing,
complex tax structures and delays in tax reporting, less regulation and higher fees than mutual funds and
risks associated with the operations, personnel and processes of the advisor. Master Limited Partnerships
(MLPs) are limited partnerships or limited liability companies that are taxed as partnerships and whose
interests (limited partnership units or limited liability company units) are traded on securities exchanges like
shares of common stock. Currently, most MLPs operate in the energy, natural resources or real estate
sectors. Investments in MLP interests are subject to the risks generally applicable to companies in the
energy and natural resources sectors, including commodity pricing risk, supply and demand risk, depletion
risk and exploration risk; and MLP interests in the real estate sector are subject to special risks, including
interest rate and property value fluctuations, as well as risks related to general and economic conditions.
Because of their narrow focus, MLPs maintain exposure to price volatility of commodities and/or
underlying assets and tend to be more volatile than investments that diversify across many sectors and
companies. MLPs are also subject to additional risks including: investors having limited control and rights
to vote on matters affecting the MLP, limited access to capital, cash flow risk, lack of liquidity, dilution risk,
conflict of interests, and limited call rights related to acquisitions.
Mortgage backed securities also involve prepayment risk, in that faster or slower prepayments than
expected on underlying mortgage loans can dramatically alter the yield-to-maturity of a mortgage-backed
security and prepayment risk includes the possibility that a fund may invest the proceeds at generally lower
interest rates.
Tax managed funds may not meet their objective of being tax-efficient.
Real estate investments are subject to special risks, including interest rate and property value fluctuations,
as well as risks related to general and economic conditions. High yield fixed income securities, also known
as “junk bonds”, are considered speculative, involve greater risk of default and tend to be more volatile than
investment grade fixed income securities.

investment grade fixed income securities.
Credit quality is a measure of a bond issuer’s creditworthiness, or ability to repay interest and principal to
bondholders in a timely manner. The credit ratings shown are based on security rating as provided by
Standard & Poor’s, Moody’s and/or Fitch, as applicable. Credit ratings are issued by the rating agencies for
the underlying securities in the fund and not the fund itself, and the credit quality of the securities in the
fund does not represent the stability or safety of the fund. Credit ratings shown range from AAA, being the
highest, to D, being the lowest based on S&P and Fitch’s classification (the equivalent of Aaa and C,
respectively, by Moody(s). Ratings of BBB or higher by S&P and Fitch (Baa or higher by Moody’s) are
considered to be investment grade-quality securities. If two or more of the agencies have assigned different
ratings to a security, the highest rating is applied. Securities that are not rated by all three agencies are listed
as “NR”.
“Alpha tilt strategies comprise a core holding of stocks that mimic a benchmark type index such as theS&P 500 to which additional securities are added to help tilt the fund toward potentially outperforming themarket in an effort to enhance overall investment returns. Tilt strategies are subject to significant timingrisk and could potentially expose investors to extended periods of underperformance.”
Custom Account Index: The Custom Account Index is an investment benchmark based on your historical
target allocations and/or manager selection that you may use to evaluate the performance of your account.
The Custom Account index does take into consideration certain changes that may have occurred in your
portfolio since the inception of your account, i.e., asset class and/or manager changes. However, in some
circumstances, it may not be an appropriate benchmark for use with your specific account composition. For
detailed report of the historical composition of this blend please contact your Financial Advisor.
Peer Groups
Peer Groups are a collection of similar investment strategies that essentially group investment products that
share the same investment approach. Peer Groups are used for comparison purposes to compare and
illustrate a clients investment portfolio versus its peer across various quantitative metrics like performance
and risk. Peer Group comparison is conceptually another form of benchmark comparison whereby the
actual investment can be ranked versus its peer across various quantitative metrics.
All Peer Group data are provided by Investment Metrics, LLC.
The URL below provides all the definitions and methodology about the various Peer Groups
https://www.invmetrics.com/style-peer-groups
Peer Group Ranking Methodology
A percentile rank denotes the value of a product in which a certain percent of observations fall within a peer
group. The range of percentile rankings is between 1 and 100, where 1 represents a high statistical value and
100 represents a low statistical value.
The 30th percentile, for example, is the value in which 30% of the highest observations may be found, the
65th percentile is the value in which 65% of the highest observations may be found, and so on.
Percentile rankings are calculated based on a normalized distribution ranging from 1 to 100 for all products
in each peer group, where a ranking of 1 denotes a high statistical value and a ranking of 100 denotes a low
statistical value. It is important to note that the same ranking methodology applies to all statistics, implying
that a ranking of 1 will always mean highest value across all statistics.
that a ranking of 1 will always mean highest value across all statistics.
For example, consider a risk/return assessment using standard deviation as a measure of risk. A percentile
ranking equal to 1 for return denotes highest return, whereas a percentile ranking of 1 for standard deviation
denotes highest risk among peers.
In addition, values may be used to demonstrate quartile rankings. For example, the third quartile is also
known as the 75th percentile, and the median is the 50th percentile.
Alternatives
Graystone Consulting is a business of Morgan Stanley Smith Barney LLC. (“Morgan Stanley”) Thismaterial is not to be reproduced or distributed to any other persons (other than professional advisors of theinvestors) and is intended solely for the use of the persons to whom it has been delivered. This material isnot for distribution to the general public.
The sole purpose of this material is to inform, and it in no way is intended to be an offer or solicitation topurchase or sell any security, other investment or service, or to attract any funds or deposits. Investmentsmentioned may not be suitable for all clients. Any product discussed herein may be purchased only after aclient has carefully reviewed the offering memorandum and executed the subscription documents. MorganStanley has not considered the actual or desired investment objectives, goals, strategies, guidelines, orfactual circumstances of any investor in any fund(s). Before making any investment, each investor shouldcarefully consider the risks associated with the investment, as discussed in the applicable offeringmemorandum, and make a determination based upon their own particular circumstances, that the investmentis consistent with their investment objectives and risk tolerance.
This information is being provided as a service of your Graystone Institutional Consultant and does notsupersede or replace your Morgan Stanley customer statement. The information is as of the date(s) notedand subject to daily market fluctuation. Your interests in Alternative Investments, which may have beenpurchased through us, are generally not held here, and are generally not covered by SIPC. The informationprovided to you: 1) is included as a service to you, valuations for certain products may not be available; 2)is derived from you or another external source for which we are not responsible, and may have beenmodified to take into consideration capital calls or distributions to the extent applicable; 3) may not reflectactual shares, share prices or values; 4) may include invested or distributed amounts in addition to a fairvalue estimate; and 5) should not be relied upon for tax reporting purposes. Notwithstanding the foregoing,1) to the extent this report displays Alternative Investment positions within a Morgan Stanley IndividualRetirement Account (“IRA”), such positions are held by Morgan Stanley Smith Barney LLC as thecustodian of your Morgan Stanley IRA; and 2) if your Alternative Investment positon(s) is held by us and isregistered pursuant to the Securities Act of 1933, as amended, your Alternative Investment position(s) iscovered by SIPC.
Alternatives may be either traditional alternative investment vehicles or non-traditional alternative strategyvehicles. Traditional alternative investment vehicles may include, but are not limited to, Hedge Funds,Fund of Funds (both registered and unregistered), Exchange Funds, Private Equity Funds, Private CreditFunds, Real Estate Funds, and Managed Futures Funds. Non-traditional alternative strategy vehicles mayinclude, but are not limited to, Open or Closed End Mutual Funds, Exchange-Traded and Closed-EndFunds, Unit Investment Trusts, exchange listed Real Estate Investment Trusts (REITs), and Master LimitedPartnerships (MLPs). These non-traditional alternative strategy vehicles also seek alternative-like exposurebut have significant differences from traditional alternative investment vehicles. Non-traditional alternativestrategy vehicles may behave like, have characteristics of, or employ various investment strategies andtechniques for both hedging and more speculative purposes such as short-selling, leverage, derivatives, andoptions, which can increase volatility and the risk of investment loss. Characteristics such as correlation totraditional markets, investment strategy, and market sector exposure can play a role in the classification of atraditional security being classified as alternative.
Traditional alternative investment vehicles are illiquid and usually are not valued daily. The estimatedvaluation provided will be as of the most recent date available and will be included in summaries of yourassets. Such valuation may not be the most recent provided by the fund in which you are invested. No

assets. Such valuation may not be the most recent provided by the fund in which you are invested. Norepresentation is made that the valuation is a market value or that the interest could be liquidated at thisvalue. We are not required to take any action with respect to your investment unless valid instructions arereceived from you in a timely manner. Some positions reflected herein may not represent interests in thefund, but rather redemption proceeds withheld by the issuer pending final valuations which are not subjectto the investment performance of the fund and may or may not accrue interest for the length of thewithholding. Morgan Stanley does not engage in an independent valuation of your alternative investmentassets. Morgan Stanley provides periodic information to you including the market value of an alternativeinvestment vehicle based on information received from the management entity of the alternative investmentvehicle or another service provider.
Traditional alternative investment vehicles often are speculative and include a high degree of risk. .Investors should carefully review and consider potential risks before investing. Certain of these risks mayinclude but are not limited to:• Loss of all or a substantial portion of the investment due to leveraging, short-selling, or other speculative practices;• Lack of liquidity in that there may be no secondary market for afund;• Volatility of returns;• Restrictions on transferring interests in a fund;• Potential lack of diversificationand resulting higher risk due to concentration of trading authority when a single advisor is utilized;•Absence of information regarding valuations and pricing;• Complex tax structures and delays in taxreporting;• Less regulation and higher fees than mutual funds; and• Risks associated with the operations,personnel, and processes of the manager. As a diversified global financial services firm, Morgan StanleyWealth Management engages in a broad spectrum of activities including financial advisory services,investment management activities, sponsoring and managing private investment funds, engaging in broker-dealer transactions and principal securities, commodities and foreign exchange transactions, researchpublication, and other activities. In the ordinary course of its business, Morgan Stanley Wealth Managementtherefore engages in activities where Morgan Stanley Wealth Management’s interests may conflict with theinterests of its clients, including the private investment funds it manages. Morgan Stanley WealthManagement can give no assurance that conflicts of interest will be resolved in favor of its clients or anysuch fund.
Indices are unmanaged and investors cannot directly invest in them. Composite index results are shown forillustrative purposes and do not represent the performance of a specific investment. Past performance is noguarantee of future results. Actual results may vary. Diversification does not assure a profit or protectagainst loss in a declining market. Any performance or related information presented has not been adjustedto reflect the impact of the additional fees paid to a placement agent by an investor (for Morgan Stanleyplacement clients, a one-time upfront Placement Fee of up to 3%, and for Morgan Stanley investmentadvisory clients, an annual advisory fee of up to 2.5%), which would result in a substantial reduction in thereturns if such fees were incorporated.
For most investment advisory clients, the program account will be charged an asset-based wrap fee everyquarter (“the Fee”). In general, the Fee covers investment advisory services and reporting. In addition to theFee, clients will pay the fees and expenses of any funds in which their account is invested. Fund fees andexpenses are charged directly to the pool of assets the fund invests in and impact the valuations. Clientsmust understand that these fees and expenses are an additional cost and will not be included in the Feeamount in the account statements.
As fees are deducted quarterly, the compounding effect will be to increase the impact of the fees by anamount directly related to the gross account performance. For example, for an account with an initial valueof $100,000 and a 2.5% annual fee, if the gross performance is 5% per year over a three year period, thecompounding effect of the fees will result in a net annual compound rate of return of approximately 2.40%per year over a three year period, and the total value of the client’s portfolio at the end of the three yearperiod would be approximately $115,762.50 without the fees and $107,372.63 with the fees. Please see theapplicable Morgan Stanley Smith Barney LLC Form ADV Part 2A for more information including adescription of the fee schedule. It is available at www.morganstanley.com/ADV<http://www.morganstanley.com/ADV> <http://www.morganstanley.com/ADV> or from your FinancialAdvisor/Private Wealth Advisor.
Alternative investments involve complex tax structures, tax inefficient investing, and delays in distributingimportant tax information. Individual funds have specific risks related to their investment programs that willvary from fund to fund. Clients should consult their own tax and legal advisors as Morgan Stanley does not
vary from fund to fund. Clients should consult their own tax and legal advisors as Morgan Stanley does notprovide tax or legal advice. Interests in alternative investment products are offered pursuant to the terms ofthe applicable offering memorandum, are distributed by Morgan Stanley Smith Barney LLC and certain ofits affiliates, and (1) are not FDIC-insured, (2) are not deposits or other obligations of Morgan Stanley orany of its affiliates, (3) are not guaranteed by Morgan Stanley and its affiliates, and (4) involve investmentrisks, including possible loss of principal. Morgan Stanley Smith Barney LLC is a registered broker-dealer,not a bank.
SIPC insurance does not apply to precious metals, other commodities, or traditional alternative investments.
© 2018 Morgan Stanley Smith Barney LLC. Member SIPC.
Money Market Funds
You could lose money in Money Market Funds. Although MMFs classified as government funds (i.e.,MMFs that invest 99.5% of total assets in cash and/or securities backed by the U.S government) and retailfunds (i.e., MMFs open to natural person investors only) seek to preserve value at $1.00 per share, theycannot guarantee they will do so. The price of other MMFs will fluctuate and when you sell shares they maybe worth more or less than originally paid. MMFs may impose a fee upon sale or temporarily suspend salesif liquidity falls below required minimums. During suspensions, shares would not be available forpurchases, withdrawals, check writing or ATM debits. A MMF investment is not insured or guaranteed bythe Federal Deposit Insurance Corporation or other government agency.

WWIILLMMEETTTTEE FFIIRREE FFIIRREEFFIIGGHHTTEERRSS AANNDD PPOOLLIICCEE PPEENNSSIIOONN FFUUNNDD
BBOOAARRDD OOFF TTRRUUSSTTEEEESS MMEEEETTIINNGG
PPeerrffoorrmmaannccee UUppddaattee ffoorr tthhee PPeerriioodd EEnnddiinngg SSeepptteemmbbeerr 3300,, 22002200
OOccttoobbeerr 2222,, 22002200
Thomas J. McShane, CIMA® Patrick R. Donnelly, CIMA® Senior Vice President Senior Vice President Institutional Consultant & Director Institutional Consultant & Director Phone: (312) 917-7541 Phone: (309) 671-2899 Fax: (312) 917-7515 Fax: (312) 267-0228
E-mail: [email protected] [email protected]

Wilmette Police and Fire Pension Funds
Summary of Recent Actions:
July 23rd 2020 iConference Board Meeting:
1. Cash Review – Sufficient
2. Sell $500,000 S&P 500 Vanguard – move proceeds to Northshore Bank – Done 7/24/2020
3. Wire to MS Weaver Barksdale account for reinvestment – Done 7/27/2020
4. Investment Committee (Dave from Fire, Jeff from Police) to review Lazard EMM, London and Small Cap
May 21st 2020 iConference Board Meeting:
1. Added two new additional buy orders to the S&P 500 if it pulls back to the following levels:
(Funds will come from Vanguard Money Market (VUSXX))
a. @ 2800 - $100,000 to VINIX (Added)
b. @ 2700 - $100,000 to VINIX (Added)
c. @ 2600 - $150,000 to VINIX (Added May 7th)
d. @ 2500 - $150,000 to VINIX (Added May 7th)
2. Tabled Large Cap Value Review to next in person Board Meeting
May 7th 2020 iConference Board Meeting:
1. Suspend the Dollar Cost Averaging Program if we close above 2950 on the S&P 500 (Suspended on May 19th)
2. Canceled the Previous trigger order of purchasing $300,000 at 2400 on the S&P 500
3. Updated S&P 500 buys if it pulls back to the following levels: (Funds will come from Vanguard Money Market (VUSXX))
a. @ 2600 - $150,000 to VINIX
b. @ 2500 - $150,000 to VINIX

Wilmette Police and Fire Pension Funds
April 23rd 2020 iConference Board Meeting:
1. Raise $850,000 for both Fire and Police from SKBA Max Flex to be transferred Vanguard
2. Wire Transfer of $850,000 to Vanguard’s Treasury Money Market Fund (VUSXX) (Transferred on April 27th)
March 27th 2020 iConference Board Meeting:
1. Raise $1,250,0000 for both Fire and Police from SKBA Max Flex to be sent to Vanguard
2. Wire Transfer $1,250,000 to Vanguard for distributions for Police & Fire:
a. $750,000 to Vanguard S&P 500 VINIX (Moved March 31st)
b. $500,000 to Vanguard Money Market VUSXX (Moved March 31st)
3. Exchange $25,000 a day from VUSXX to VINIX –daily (Starting April 1st)
4. Buy S&P 500 if it pulls back to the following level :
a. @ 2400 - $300,000 to VINIX (Nothing Done)
5. Reviewed Asset Allocation
6. Reviewed Outlook
7. Reviewed Global Briefing
January 27th 2020 Board Meeting:
1. Reviewed Asset Allocation
2. Reviewed Capital Markets
3. Reviewed Outlook
October 24th 2019 Board Meeting:
1. Fire: Reinvest $500,000 from Vanguard S&P 500 to Northshore Cash
2. Police: Reinvest $700,000 from Vanguard S&P 500 to Northshore Cash
3. Reviewed Asset Allocation
4. Reviewed Capital Markets

Daily
2200.00
2250.00
2300.00
2350.00
2400.00
2450.00
2500.00
2550.00
2600.00
2650.00
2700.00
2750.00
2800.00
2850.00
2900.00
2950.00
3000.00
3050.00
3100.00
3150.00
3200.00
3250.00
3300.00
3350.00
3400.00
3450.00
3500.00
3550.00
3600.00
> .SPX-UT S&P 500 Index O: 0.0 H: 3527.94 L: 3480.55 C: 3488.67 Chg -23.26 V: > ema50: 3365.0 > ema200: 3176.3
11/01/18 12/25/18 02/15/19 04/10/19 06/03/19 07/25/19 09/17/19 11/08/19 01/01/20 02/24/20 04/16/20 06/09/20 07/31/20 09/23/20

Past performance is no guarantee of future results. Estimates of future performance are based on assumptions that may not be realized. This material is not a solicitation of any offer to buy or sell any security or other financial instrument or to participate in any trading strategy. Please refer to important information, disclosures and qualifications at the end of this material. This slide sourced from Market Performance section.
WEALTH MANAGEMENT INVESTMENT RESOURCES | CHARTBOOK | MARKET PERFORMANCE
ASSET CLASS INDEX IN USD 1-MONTH YTD 1-YR 3-YR ANN 5-YR ANN
Global Equity
Global Equity MSCI All Country World -3.2% 1.8% 11.0% 7.7% 10.8%
US Equity S&P 500 -3.8% 5.6% 15.1% 12.2% 14.1%
International Equity MSCI All Country World ex US -2.4% -5.1% 3.4% 1.6% 6.6%
Emerging Markets Equity MSCI Emerging Markets -1.6% -0.9% 10.9% 2.8% 9.2%
Global Fixed Income
Investment Grade Fixed Income Barclays US Aggregate -0.1% 6.8% 7.0% 5.2% 4.2%
Inflation-Linked Securities Barclays Universal Govt Inflation-Linked 0.4% 7.5% 4.6% 6.1% 5.5%
High Yield Barclays Global High Yield (H) -1.5% -1.0% 2.0% 3.2% 6.4%
Emerging Markets Fixed Income JP Morgan EM Bonds (UH in USD) -2.0% -6.3% -1.4% 0.8% 1.9%
Alternative Investments
Global REITs FTSE EPRA/NAREIT Global REITs -3.0% -19.5% -16.6% -0.8% 3.3%
Commodities Bloomberg Commodities -3.4% -12.1% -8.2% -4.4% -3.1%
MLPs Alerian MLP -13.6% -46.2% -48.4% -20.7% -12.3%
Hedged Strategies HFRX Global Hedge Fund Index -0.2% 1.6% 4.2% 1.5% 2.1%
Managed Futures HFRX Macro/CTA Index -1.3% 0.0% -0.2% 1.4% 0.1%
Private Real Estate NCREIF Private Real Estate - -0.3% 2.7% 5.4% 6.8%
Global Cash
Cash Citigroup 3-month Treasury Bill 0.0% 0.6% 1.0% 1.6% 1.2%
Other Fixed Income
Municipal Fixed Income Barclays Municipal Bond 0.0% 3.3% 4.1% 4.3% 3.8%
Asset Class Index Performance
Source: FactSet, Morgan Stanley Wealth Management GIC. For more information about the risks to Master Limited Partnerships (MLPs), please refer to the Risk Considerations section at the end of this material.
Capital Market Returns As of October 1, 2020; Private Real Estate as of June 30, 2020

INVESTMENT STRATEGY
US Treasuries and equities seem to be discounting different electionoutcomes. As the Fed represses the short end of the yield curve, long-term yields have barely budged and volatility as measured by theMOVE Index is at a historic low. It’s unusual for the yield curve to bethis shallow halfway through a recession, which suggests skepticismabout the recovery. Also, the anchoring of long yields this close to anelection discounts a status quo result. In contrast, stocks have been ina wide range, marked by the elevated VIX. Equity investors are tiltingtoward a “blue wave,” with discounts applied to the presumed victimsof policy shifts—financials, energy, health care and tech. Forinvestors, history shows that policy and the business cycle mattermore than elections. Fiscal and monetary accommodation is apt toremain outsized over the next 12 to 18 months. We expect higherinterest rates and a steeper yield curve next year, so bond bullsbeware. CCoonnssiiddeerr repositioning for a reflation. Opportunities remain inUS financials, small-caps and value cyclicals, and in non-US equities.Take profits in long-duration Treasuries.
September was a wild month for US investors. While stock markets initiallyextended August’s exuberance with the S&P 500 Index hitting an all-time high of3,581 on Sept. 2, the uncertainty and disappointment surrounding policymakerskicked in (see The GIC Weekly, Sept. 28). By the end of the month, the S&P 500was down 3.9% and the tech-heavy Nasdaq Composite lost 5.2%, its worst month since 2008. As the month ended, volatility as measured by the VIX was 26, roughlytwice the average since the financial crisis. As equities sold off, US Treasuriesremained anchored; yields ended the month essentially unchanged as the MOVEIndex, a measure of bond market volatility, fell to an all-time low. Although theFederal Reserve’s extraordinary policies kept short-term rates pinned, the behaviorof long-term rates has been confounding, showing no sensitivity to shifts ineconomic news, vaccine-related headlines or the changing narrative on further fiscalstimulus. As we illustrate in the Chart of the Week (see page 3), at this point in atypical recession, the two-year/10-year yield curve has already steepened by 150 to250 basis points, which happened even during the financial crisis and recession,when the Fed was engaged in financial repression as it is today. Even so, currentsteepening has been closer to 60 basis points. Equally distressing is that the
Election Uncertainty and Steeper Yield Curves Lisa ShalettChief Investment Officer, Morgan StanleyWealth ManagementHead of Wealth Management [email protected]+1 212 296-0335
UUppccoommiinngg CCaattaallyyssttss
October 05ISM Services SurveyEuro Zone retail salesChina Caixin Manufacturing PMI
October 06US JOLTS SurveyUS trade balance
October 07FOMC September meeting minutesJapan Leading Index
October 08US initial jobless claimsUS continuing claims
Global Investment Committee | October 05, 2020
The GIC Weekly
Morgan Stanley Wealth Management is the trade name of Morgan Stanley Smith Barney LLC, a registered broker-dealer in the United States.This material has been prepared for informational purposes only and is not an offer to buy or sell or a solicitation of any offer to buy or sell anysecurity or other financial instrument or to participate in any trading strategy.Past performance is not necessarily a guide to future performance.

freezing of the yield curve has left traditional stock/bondportfolios without diversification protection.
Under normal circumstances, with roughly one month leftuntil the US presidential election, one might wonder if thefrozen yield curve reflects a market discounting the statusquo or gridlocked outcome. This is not obvious. Polling data,as summarized by independent agents SuperforecasterAnalytics and FiveThirtyEight.com, has been quite stable sincemid-August, and both currently cite an 80% probability thatformer Vice President Joe Biden wins the White House. Inaddition, Superforecaster places a 66% probability thatDemocrats control both houses of Congress. Stock investorsappear to be discounting a “blue wave” scenario. Sectorspresumed to be negatively affected by regime change—financials, energy, health care and tech—have beenunderperformers of late.
If the polls are wrong, it wouldn’t be the first time, nor wouldit be the first time that stocks and bonds disagreed. What dobond investors “know” that stocks investors don’t? Furthercomplicating matters is that the shift toward ail-in ballotsraises questions about how long it will be before we getdefinitive results. Morgan Stanley & Co.'s public policy teamnotes that the key factor determining whether results arefinalized in days, weeks or months is the margin between votetotals on Nov. 3. The team believes a margin less than 3%suggests results in weeks, and under 1% means it could becloser to the Dec. 8 deadline for election certification.Alternatively, perhaps bond investors are discounting the bluewave, but see it as delayed. What’s more, they see rates asanchored by skepticism about the sustainability of theeconomic recovery or temporary technical factors. Either way,the Global Investment Committee believes that the currentyield curve is not sustainable and that risks are nowincreasingly asymmetric. Under most election scenarios, weexpect steepening.
For starters, we believe that policy and the business cycleultimately inform the yield curve and the stock market, notpolitics or election outcomes. In every election cycle, we findourselves fighting investor biases and preconceived notionsabout what government configuration is best for markets andalways come back to the data. Analyzing elections back to1928 confirms that there is no consistent predictivecorrelation between political affiliations in Washington andstock and bond returns in the subsequent six or 12 months—or the entire presidential term (see US Policy Pulse, Sept. 21)Rather, focusing on the business cycle and policy already inthe pipeline, we maintain high confidence in the momentumaround a V-shaped economic recovery. Recent manufacturingdata suggests September ISM readings will continue tosurprise on the upside; the labor market, while slowing, is stillpositive; and the housing market remains robust. True, it isdisappointing that COVID-19 unemployment benefits have
expired and the CARES 2.0 fiscal aid package is stuck.However, Ellen Zentner, MS & Co.’s chief US economist, notesthat excess savings is plentiful at an estimated $12.5 trillion,which should sustain consumption into 2021 when passage ofa stimulus bill is highly likely.
In the same vein, should a second wave of COVID-19 occur,current models suggest that the national economic impactwill be muted because individuals and businesses have grownadept at "working through" the health crisis. Protectivemeasures, increased testing and better treatments havematerially reduced mortality rates. Importantly, MS & Co.analysts say vaccine-availability timelines are on track and they expect herd immunity by 2021's second quarter. Furtherclarity on economic growth, the fiscal stimulus bill and thevaccine will each be catalysts for a steeper yield curve andhave a high probability of dominating the headlines once theelection is settled. That inflation breakeven rates have fallenand gold has sold off suggest that real yields are signaling areflationary narrative.
A second set of asymmetric risk factors anchoring long yieldshas to do with technical conditions that are unlikely to last.As MS & Co.’s global rates team notes, the 10-year/30-yearpart of the yield curve could easily have seen lower yieldsdue to disappointments from Congress, hawkish Fed rhetoricon that point and the stock market sell-off. They see yields'stickiness as indicating that buying appetite is waning. Theynote foreigners have been sellers of Treasuries, with foreignownership plummeting to 46% from 52% a year ago as supplyhas soared to $13 trillion from $11 trillion. With fiscal deficitslikely to grow, issuance of long-duration bonds is bound toincrease, creating an adverse supply/demand dynamic—whichalso points to eventual steepening of the yield curve.
BoBottttoomm LLiinnee:: Now is not a good time to take cues from the
US Treasury market on the outcome of the election. There
are reasons to doubt the polls, to hedge against adverse
virus outcomes and to be disappointed by fiscal policy.
However, long yields having remained anchored against a
stock market sell-off looks telling. In separating signal from
noise, the takeaway is that long yields may be hard-pressed
to go lower. Alternatively, the case for a steeper curve
remains solid with economic momentum, eventual fiscal
stimulus and the instability around technical factors like
supply/demand likely to come to the fore once we have an
election outcome. Who actually wins may be less important
than knowing quickly who the winner is. WWaattcchh for polling
margins heading into the election, with wider margins
suggesting a quicker resolution. CCoonnssiiddeerr repositioning for a
reflation. Opportunities remain in US financials, small-caps
and value cyclicals, and in non-US equities. Take profits in
long-duration Treasuries.
THE GIC WEEKLY
Please refer to important information, disclosures and qualifications at the end of this material. Morgan Stanley Wealth Management 2

Source: Bloomberg as of Oct. 1, 2020
Source: Morgan Stanley & Co. as of Oct. 1, 2020
Chart of the Week: A Muted Yield Curve
Most recession playbook indicators have held up during theCOVID-19 downturn. The one that hasn’t behaved by thebook is the yield curve. As we illustrate in the chart, the 10-year/two-year curve has typically anticipated a recovery andsteepened between 150 and 250 basis points before arecession has ended. This was true during the financial crisisand ensuing recession. This time, negative real interest ratesand strong technical factors have kept nominal ratesuncharacteristically anchored. This suggests to us thepotential for a loaded-spring sell-off in long-durationTreasuries when the technicals lift and election outcomesare clarified.
Fixed Income Insight: Bond Correlations Challenging Diversification Benefits
Modern portfolio theory, the heart of most portfolioconstruction, is based on the idea that most of the time,bond prices are negatively correlated with stock prices.While there have been instances when correlations havebeen positive, it has usually been in times of surging marketliquidity. It is rare for correlations to hover near zero as theyhave for the past two months (see chart). Furthermore, USdollar-stock market correlations have typically mirrored theshift in bond correlations, but that has broken down, too,suggesting portfolio risk management is difficult. While thedistortions are likely the result of nontraditional monetarypolicy, the breakdown makes downside hedging difficult andexplains recent dollar strength.
Market Factor Data Points (for the week ending Oct. 2, 2020)
Color coding shows how actual data compares with consensus estimates. Green implies better than expected, red implies worse than expected. Trend shows theone period change between actual and prior reports. Source: Morgan Stanley Wealth Management GIC
THE GIC WEEKLY
Please refer to important information, disclosures and qualifications at the end of this material. Morgan Stanley Wealth Management 3

Positive Economic Surprise Begins to Taper
Source: Bloomberg as of Oct. 1, 2020
Consumer Sentiment Has Yet to Recover
Source: Bloomberg as of Oct. 1, 2020
Macro Factor Heat Map (as of Oct. 2, 2020)
Note: Text in a factor box denotes a color; for further explanation of the chart, see page 10. Source: Morgan Stanley Wealth Management GIC
Charts in Focus: Reflation Takes a Policy Pause
Breakeven Inflation Hits Resistance
Source: Strategas as of Oct. 1, 2020
Nasdaq Appears Stretched Relative to Recent Averages
Source: Bloomberg as of Oct. 1, 2020
THE GIC WEEKLY
Please refer to important information, disclosures and qualifications at the end of this material. Morgan Stanley Wealth Management 4

Asset Class Performance (as of Oct. 2, 2020)
Note: Performance values calculated using USD. 1. As of Aug. 31, 2020. 2. 20-year average as of Aug. 31, 2020. 3. Volatility and Correlation: June 30, 2006 –Present. 4. Volatility and Correlation: Jan 31, 1998 – Present Hedged strategies consist of hedge funds and managed futures 5. Volatility and Correlation: February28, 1998 – Present. Standard deviation (volatility) is a measure of the dispersion of a set of data from its mean. Source: Factset, Bloomberg, Morgan Stanley Wealth Management GIC
THE GIC WEEKLY
Please refer to important information, disclosures and qualifications at the end of this material. Morgan Stanley Wealth Management 6

S&P 500 Earnings Estimates
Note: 2022 consensus is as of June 14, 2020 Source: Refinitiv, S&P, MS & Co. Research as of Oct. 2, 2020
MS & Co. S&P 500 Price Target: Midyear 2021
Note: Price targets are based on estimated June 2021 earnings. Source: MS & Co. Research as of Oct. 2, 2020
S&P 500 Sector Performance and Valuation (as of Oct. 2, 2020)
Source: Morgan Stanley & Co. Research
Equity Market Relative Valuation (as of Oct. 2, 2020)
Note: Dark blue, light blue and gray fill denotes whether the group is relatively attractive, neutral or unattractive to other groups under the same metric.Source: Bloomberg
THE GIC WEEKLY
Please refer to important information, disclosures and qualifications at the end of this material. Morgan Stanley Wealth Management 7

Government Debt Monitor & Fixed Income Spread Dashboard
Unless stated, indexes utilized are FTSE Broad Investment Grade, FTSE High Yield, and FTSE Global Indexes †Interest Rate Volatility measured by Merrill LynchOption Volatility Estimate (MOVE) Index *MBS distills high grade agency-rated mortgage-backed securities, a substantial subsector of investment grade indexes.**OAS stands for Option-Adjusted Spread or spread over the Treasury. Grey diamond denotes current OAS; blue circle denotes two-year average.Source: Bloomberg, The Yield Book® Software and Services. © 2020 FTSE Index LLC. All rights reserved. Data as of Oct. 2, 2020
Government Debt Monitor & Benchmark Returns
*Global total returns reflect Citigroup 7- to 10-year bond indexes and Muni total returns reflect Bloomberg Barclays Municipal Bond Index Total ReturnSource: Bloomberg, Thomson Reuters Municipal Market Data (MMD) as of Oct. 2, 2020
Morgan Stanley & Co. Forecasts (as of Oct. 2, 2020)
Source: Morgan Stanley & Co. Research
THE GIC WEEKLY
Please refer to important information, disclosures and qualifications at the end of this material. Morgan Stanley Wealth Management 8

As of August 31, 2020, there have been
163,735 total U.S. business closureson Yelp since March 1, 2020.
97,966 of these businesses, or 60%,
have permanently closed, never
to open their doors again.1
COVID-19 TRACKER
Percent of PopulationPercent of Total COVID-19 Deaths (2/1/20 - 9/12/20)
1.2%
4.9%
12.6% 13.1%14.0%
12.6% 12.7%12.9%
9.3%
4.7%
2.0%0% 0.2% 0.8%
2.0%
5.3%
12.7%
21.5%
0% 0%
26.4%
31.0%
Age: Under 1 1-4 5-14 15-24 25-34 35-44 45-54 55-64 65-74 75-84 85 and Over
Deaths by Age vs. Share of Population in the U.S.As of September 12, 2020
Sources: CDC.gov, National Center for Health Statistics
Daily Reported New Positive COVID-19 TestsDaily Reported Deaths from COVID-19Daily New Positives 7-Day Moving AverageDaily Deaths 7-Day Moving Average
0
1,000
2,000
3,000
4,000
0
20,000
40,000
60,000
80,000
2/20 3/20 4/20 5/20 6/20 7/20 8/20
Daily Reported New Positive COVID-19 Tests vs. Daily Reported Deaths from COVID-19 in the U.S.February 26, 2020 - September 15, 2020
Source: Covidtracking.com
Total Deaths and COVID-19 Deaths in the U.S. by Age Group
February 1, 2020 - September 12, 2020
0%
25%
50%
75%
100%
0
100,000
200,000
300,000
400,000
500,000
600,000
700,000Total Deaths From All Causes (left)COVID-19 Deaths (left)COVID-19 Deaths as a % of Total Deaths by Age Group (right)
10,876 2,083 20,786 42,919 60,673 111,610
255,771
387,801
473,523
588,498
20
3,22614 30 333 1,405
3,675 9,694 23,134 39,129 48,136 56,525
Age: Under 1 1-4 5-14 15-24 25-34 35-44 45-54 55-64 65-74 75-84 85 and Over
0.2% 0.7% 1.6% 3.3% 6.1% 8.7% 9.0% 10.1% 10.2% 9.6%0.9%
Sources: CDC.gov, National Center for Health Statistics
1yelpeconomicaverage.com; 2CDC.gov (August 25, 2020) 9.17.20 | www.ftportfolios.com
-40%
-30%
-20%
-10%
0%
10%
0
10,000
20,000
30000
40,000
50,000
60,000
70,000
3/20 4/20 5/20 6/20 7/20 8/20 9/20
U.S. Daily New COVID-19 CasesDaily New Cases 7-Day Moving Average Google Mobility Data 7-Day Moving Average(data through 9/11/20)
U.S. Daily Cases Versus MobilityMarch 5, 2020 - September 16, 2020
Sources: Google LLC “Google COVID-19 Community Mobility Reports”, Covidtracking.com, Mobility data represents an average of activity at Retail & Recreation, Grocery & Pharmacy, Parks, Transit Stations, and Workplaces.
COVID-19 vs. 1918 Spanish FluAs of September 12, 2020
0
500
1,000
1,500
2,000
2,500
All Ages85+75-8465-7455-6445-5435-4425-3415-245-141-4Under 1 YearAge:
1918 Pneumonia & Influenza Death Rate Per 100,0002020 COVID-19 Death Rate Per 100,000
Sources: CDC.gov, nber.org
State Representative Estimates for Hospital Bed Occupancy As of September 16, 2020
10% - 14.9%5% - 9.9%0% - 4.9%
State Representative
Estimates for % of
Inpatient Beds Occupied
by COVID-19 Patients
Source: hhs.gov
A recent CDC study that looked at more than 80,000 U.S. adults hospitalized with flu over 8 flu seasons (2010-11 through 2017-18) found that sudden, serious heart
complications were common and occurred in 1 out of every 8 patients.2
27 14 9 5 0
Phase 1 Phase 2 Phase 3 Limited Approved
Vaccines testing safety and
dosage
Vaccines in expanded safety
trials
Vaccines in large-scale
efficacy tests
Vaccines approved for
early or limited use
Vaccinesapproved for
full use
Source: The New York Times. Data as of September 17, 2020.

Wilmette Fire Pension Fund $ % Wilmette Police Pension Fund $ %
Large Cap Equity 14,441,171 27.59% Large Cap Equity 14,933,157 28.15%
Mid Cap Equity 5,097,903 9.74% Mid Cap Equity 5,686,043 10.72%
Small Cap Equity 3,631,959 6.94% Small Cap Equity 3,174,752 5.98%
REITs 1,327,582 2.54% REITs 1,216,334 2.29%
International 6,321,883 12.08% International 6,400,902 12.07%
Emerging 3,301,218 6.31% Emerging 3,167,754 5.97%
Total Equity 34,121,716 65.19% Total Equity 34,578,942 65.18%
Target Equity at 65% 34,020,187 65% Target Equity at 65% 34,482,381 65%
Difference -101,529 -0.19% Difference -96,561 -0.18%
Fixed Income 14,610,486 27.92% Fixed Income 15,287,194 28.82%
Cash in Fixed Income 802,942 1.53% Cash in Fixed Income 756,075 1.43%
Cash at North Shore Bank (Sept) 2,218,112 4.24% Cash at North Shore Bank (Sept) 1,840,246 3.47%
Vanguard Money Market 500,481 0.96% Vanguard Money Market 500,481 0.94%
Cash in Equity Accounts 85,012 0.16% Cash in Equity Accounts 86,879 0.16%
Total Fixed Income 18,217,033 34.81% Total Fixed Income 18,470,875 34.82%
Target Fixed Income & Cash at 35% 18,318,562 35% Target Fixed Income & Cash at 35% 18,567,436 35%
Difference 101,529 0.19% Difference 96,561 0.18%
Total Portfolio 52,338,749 100.00% Total Portfolio 53,049,817 100.00%
Asset Allocation for Wilmette Fire & Police Pension FundsListed below is your current Equity Allocation. It excludes the Cash held in your Equity Manager’s Portfolio.
*Market Values as of Sept 30th 2020

Wilmette Fire Pension FundQuarterly Performance Report
September 30, 2020

TargetAllocation
(%)
AssetAllocation
(%)
Differences(%)
AssetAllocation
($)
TargetRebalance
($)
Fixed Income 35.00 31.75 -3.25 15,913,910.31 1,628,312.67
Equity 65.00 68.25 3.25 34,206,726.78 -1,628,312.67
Wilmette Firemens Pension Fund 100.00 100.00 0.00 50,120,637.09 -
TargetAllocation
(%)
AssetAllocation
(%)
Differences(%)
AssetAllocation
($)
TargetRebalance
($)
Real Estate 3.00 2.65 -0.35 1,327,582.02 176,037.09
Small Cap Equity 7.00 7.42 0.42 3,716,970.51 -208,525.91
Emerging Markets 8.00 6.59 -1.41 3,301,217.92 708,433.05
Mid Cap Equity 10.00 10.17 0.17 5,097,902.67 -85,838.96
International Equity 12.00 12.61 0.61 6,321,882.71 -307,406.26
Large Cap Equity 25.00 28.81 3.81 14,441,170.95 -1,911,011.68
Fixed Income 35.00 31.75 -3.25 15,913,910.31 1,628,312.67
Wilmette Firemens Pension Fund 100.00 100.00 0.00 50,120,637.09 -
Wilmette Fire Pension Fund
Page 1

Total Fund Domestic EquityInternational
EquityREITS
Domestic FixedIncome
AlternativeInvestment
Cash Equivalent
($) % ($) % ($) % ($) % ($) % ($) % ($) %
Wilmette Firemens Pension Fund 50,120,637 100.00 22,538,324 44.97 9,955,949 19.86 1,327,582 2.65 15,110,968 30.15 299,859 0.60 887,955 1.77
Large Cap Equity 14,441,171 28.81 14,441,171 100.00 - - - - - - - - - -
Vanguard - S&P 500 Inst. Index(02/23/2015) 14,441,171 28.81 14,441,171 100.00 - - - - - - - - - -
Mid Cap Equity 5,097,903 10.17 5,097,903 100.00 - - - - - - - - - -
iShares Core S&P Mid-Cap ETF 090765 2,330,088 4.65 2,330,088 100.00 - - - - - - - - - -
Columbia Acorn Fund 090764 2,767,815 5.52 2,767,815 100.00 - - - - - - - - - -
Small Cap Equity 3,716,971 7.42 2,999,250 80.69 332,849 8.95 - - - - 299,859 8.07 85,012 2.29
London - Small Cap Core - 150666 3,184,627 6.35 2,466,907 77.46 332,849 10.45 - - - - 299,859 9.42 85,012 2.67
Small Cap 600 ETF - 077128 532,343 1.06 532,343 100.00 - - - - - - - - - -
Real Estate 1,327,582 2.65 - - - - 1,327,582 100.00 - - - - - -
Vanguard REIT Index Fund 1,327,582 2.65 - - - - 1,327,582 100.00 - - - - - -
International Equity 6,321,883 12.61 - - 6,321,883 100.00 - - - - - - - -
Amerifunds - International Equity - 150605 3,276,463 6.54 - - 3,276,463 100.00 - - - - - - - -
iShares Core MSCI EAFE 087512 984,493 1.96 - - 984,493 100.00 - - - - - - - -
Tweedy Browne Global Value 087515 874,038 1.74 - - 874,038 100.00 - - - - - - - -
JOHCM International 087513 1,186,889 2.37 - - 1,186,889 100.00 - - - - - - - -
Emerging Markets 3,301,218 6.59 - - 3,301,218 100.00 - - - - - - - -
American New World -087508 1,295,980 2.59 - - 1,295,980 100.00 - - - - - - - -
Lazard - Emerging Markets Equity - 150647 2,005,238 4.00 - - 2,005,238 100.00 - - - - - - - -
Fixed Income 15,913,910 31.75 - - - - - - 15,110,968 94.95 - - 802,942 5.05
Spare - Max Flex Fixed Income - 150603 2,394,277 4.78 - - - - - - 2,259,827 94.38 - - 134,450 5.62
Spare - Flex Fixed Income - 150602 4,713,236 9.40 - - - - - - 4,575,613 97.08 - - 137,623 2.92
Weaver - Fixed Income - 150676 8,297,989 16.56 - - - - - - 8,275,209 99.73 - - 22,780 0.27
Vanguard Money Market 500,481 1.00 - - - - - - - - - - 500,481 100.00
Self Managed - Fixed Income - 150523 7,928 0.02 - - - - - - 320 4.03 - - 7,608 95.97
Wilmette Fire Pension Fund
As of September 30, 2020
Page 2

1Month
QuarterTo
DateYTD
1Year
3Years
5Years
7Years
10Years
SinceInception
InceptionDate
Wilmette Firemens Pension Fund -2.03 5.20 2.20 7.84 5.64 7.59 6.17 6.72 6.61 01/01/2003
Custom Benchmark -2.03 4.91 2.13 7.89 6.44 8.57 7.12 7.24 6.71
US Equity -3.34 7.53 0.47 8.23 8.07 10.75 9.73 - 9.98 05/01/2013
Custom Benchmark - US Equity -3.53 6.87 -1.04 7.00 8.07 11.46 10.38 - 10.71
International Equity -1.53 7.60 1.37 9.66 2.48 6.47 3.94 - 4.44 05/01/2013
MSCI AC World ex US Net -2.46 6.25 -5.44 3.00 1.16 6.23 3.18 - 3.39
Emerging Markets -2.05 4.70 -11.29 -2.02 -2.14 6.28 0.82 - 0.42 05/01/2013
MSCI EM Net -1.60 9.56 -1.16 10.54 2.42 8.97 3.74 - 3.03
Fixed Income -0.10 0.95 7.04 7.44 5.14 3.99 3.66 - 3.08 05/01/2013
Barclays Govt/Credit Bond -0.05 0.78 8.04 8.03 5.86 4.66 4.30 - 3.57
Wilmette Fire Pension Fund Time Weighted Returns
As of September 30, 2020
Returns for periods greater than one year are annualized.Returns are expressed as percentages.
Page 3

1Month
QuarterTo
DateYTD
1Year
3Years
5Years
7Years
10Years
SinceInception
InceptionDate
Wilmette Firemens Pension Fund -2.03 5.20 2.20 7.84 5.64 7.59 6.17 6.72 6.61 01/01/2003
Custom Benchmark -2.03 4.91 2.13 7.89 6.44 8.57 7.12 7.24 6.71
Vanguard - S&P 500 Inst. Index(02/23/2015) -3.80 8.97 6.15 16.05 12.57 14.37 12.81 13.77 10.27 01/01/2003
S&P 500 Total Return -3.80 8.93 5.57 15.15 12.28 14.15 12.68 13.74 10.06
iShares Core S&P Mid-Cap ETF 090765 -3.34 4.68 -8.72 -2.37 - - - - 3.79 06/01/2019
S&P 400 MidCap Net -3.29 4.65 -8.97 -2.66 - - - - 3.34
Columbia Acorn Fund 090764 0.72 9.40 10.51 19.90 - - - - 16.23 06/01/2019
Russell 2500 GR -0.77 9.37 11.58 23.38 - - - - 20.80
London - Small Cap Core - 150666 -4.69 5.20 -11.86 -7.53 2.05 4.08 3.34 - 7.26 01/01/2011
Russell 2000 -3.34 4.93 -8.69 0.39 1.77 8.00 6.43 - 8.42
Small Cap 600 ETF - 077128 -4.67 3.26 -15.23 -8.24 -0.35 - - - 1.88 05/04/2017
S&P 600 SC -4.70 3.17 -15.25 -8.29 -0.33 - - - 1.82
Vanguard REIT Index Fund -2.64 1.33 -12.73 -12.19 2.37 5.21 - - 5.81 05/01/2014
FTSE Nareit All Equity REIT Index -2.66 1.19 -12.38 -11.81 2.37 4.71 - - 4.90
Amerifunds - International Equity - 150605 -1.71 9.66 4.43 14.97 5.66 9.05 6.63 6.76 7.52 04/01/2004
MSCI AC World ex US Net -2.46 6.25 -5.44 3.00 1.16 6.23 3.18 4.00 5.32
iShares Core MSCI EAFE 087512 -1.87 5.46 -6.48 1.26 - - - - 4.48 12/01/2018
MSCI EAFE IMI NT -2.29 5.64 -6.32 1.81 - - - - 5.04
JOHCM International 087513 0.22 9.81 14.61 23.30 - - - - 15.53 12/01/2018
MSCI EAFE -2.60 4.80 -7.09 0.49 - - - - 4.21
Tweedy Browne Global Value 087515 -2.77 0.08 -13.50 -10.85 - - - - -2.91 12/01/2018
MSCI EAFE -2.60 4.80 -7.09 0.49 - - - - 4.21
American New World -087508 -2.72 8.19 4.97 14.50 - - - - 15.15 12/01/2018
MSCI ACWI -3.19 8.25 1.77 11.00 - - - - 10.70
Lazard - Emerging Markets Equity - 150647 -1.61 2.55 -19.37 -10.38 -6.11 3.68 -0.95 -0.54 0.28 05/01/2010
MSCI EM Net -1.60 9.56 -1.16 10.54 2.42 8.97 3.74 2.51 3.05
Wilmette Fire Pension Fund Time Weighted Returns
As of September 30, 2020
Returns for periods greater than one year are annualized.Returns are expressed as percentages.
Page 4

Wilmette Fire Pension Fund Time Weighted Returns
As of September 30, 2020
1Month
QuarterTo
DateYTD
1Year
3Years
5Years
7Years
10Years
SinceInception
InceptionDate
Spare - Max Flex Fixed Income - 150603 0.13 1.11 5.29 5.71 3.46 2.43 2.23 1.98 2.52 08/01/2009
BC Gov 1-3 Yr 0.02 0.10 3.09 3.62 2.66 1.82 1.54 1.30 1.46
Spare - Flex Fixed Income - 150602 -0.17 0.59 7.29 7.41 5.33 4.02 3.87 3.57 4.24 01/01/2003
Custom Benchmark - SKBA Flex -0.05 0.78 8.04 8.03 5.86 4.66 4.30 3.81 4.29
Weaver - Fixed Income - 150676 -0.12 1.25 7.76 8.32 6.00 4.94 4.45 - 4.44 06/01/2011
Weaver Custom Benchmark -0.08 0.88 5.85 6.56 4.74 3.86 3.56 - 3.51
Self Managed - Fixed Income - 150523 0.02 0.08 0.53 0.97 1.77 2.12 2.48 1.83 2.82 01/01/2003
BC Gov Intm 0.07 0.20 5.96 5.98 4.04 2.76 2.56 2.32 3.27
Returns for periods greater than one year are annualized.Returns are expressed as percentages.
Page 5

Performance(%)
2019 2018 2017 2016 2015 2014 2013 2012 2011 2010 2003
Wilmette Firemens Pension Fund 20.47 -7.63 14.11 8.34 -2.12 5.06 13.18 10.08 2.54 10.18 14.28
Custom Benchmark 20.69 -5.89 15.65 9.48 -1.69 7.04 11.76 11.00 1.10 10.61 14.97
Wilmette Fire - Acturial Assumptions 7.25 7.25 7.25 7.25 7.25 7.25 7.25 7.25 7.30 7.35 7.50
Wilmette Firemens Pension Fund Custom Benchmark
$0.0
$600.0
$1,200.0
$1,800.0
$2,400.0
$3,000.0
$3,600.0
$4,200.0
12/02 12/03 12/04 12/05 12/06 12/07 12/08 12/09 12/10 12/11 12/12 12/13 12/14 12/15 12/16 12/17 12/18 12/19 9/20
$3,166.5$3,113.2
Wilmette Fire Pension Fund Time Weighted Returns
As of September 30, 2020
Please refer to definitions page at the back of this book for benchmar descriptions
Page 6

1Month
CurrentQuarter
YTD1
Year3
Years5
Years7
YearsSince
InceptionInception
Date
Wilmette Firemens Pension Fund -2.03 5.18 2.23 7.98 5.67 7.63 6.15 6.61 12/31/2002
2019 2018 2017 2016 2015 2014 2013 2012 2011 2010
Wilmette Firemens Pension Fund 20.45 -7.63 14.11 8.23 -2.13 5.06 13.18 10.04 2.52 10.18
Wilmette Fire Pension Fund Dollar Weighted Returns
As of September 30, 2020
Please refer to definitions page at the back of this book for benchmar descriptions
Page 7

Sep-2020 Aug-2020 Jul-2020 Jun-2020 May-2020 Apr-2020 Mar-2020 Feb-2020 Jan-2020 Dec-2019 Nov-2019 Oct-2019
Wilmette Firemens Pension Fund
Beginning Market Value 51,153,662 49,134,892 47,655,341 46,776,870 45,067,935 41,677,795 46,479,230 48,791,600 49,017,027 50,043,842 49,121,981 48,860,363
Net Contributions - 500,000 -506,444 105 -1,451 -7,070 -818 -866 -7,980 -1,999,746 119 -506,876
Income 120,594 82,614 27,966 250,622 61,263 14,160 176,948 56,937 37,361 595,989 73,564 15,539
Gain/Loss -1,153,619 1,436,157 1,958,028 627,744 1,649,123 3,383,050 -4,977,565 -2,368,440 -254,808 376,943 848,177 752,955
Ending Market Value 50,120,637 51,153,662 49,134,892 47,655,341 46,776,870 45,067,935 41,677,795 46,479,230 48,791,600 49,017,027 50,043,842 49,121,981
Vanguard - S&P 500 Inst. Index(02/23/2015)
Beginning Market Value 15,012,266 14,005,790 13,739,869 13,472,235 12,555,318 10,613,618 11,252,857 12,262,664 12,267,736 13,856,735 13,371,796 13,576,480
Net Contributions - - -500,000 - 300,000 550,000 750,000 - - -2,000,000 - -500,000
Income 60,197 - - 66,832 - - 114,274 - - 147,214 - -
Gain/Loss -631,291 1,006,476 765,921 200,801 616,917 1,391,700 -1,503,513 -1,009,807 -5,072 263,787 484,940 295,315
Ending Market Value 14,441,171 15,012,266 14,005,790 13,739,869 13,472,235 12,555,318 10,613,618 11,252,857 12,262,664 12,267,736 13,856,735 13,371,796
iShares Core S&P Mid-Cap ETF 090765
Beginning Market Value 2,410,591 2,327,782 2,226,261 2,197,053 2,048,113 1,794,642 2,250,887 2,486,707 2,553,284 2,483,967 2,412,754 2,387,162
Net Contributions -68 -310 - - - - - -1 -87 1 1 1
Income 10,429 - - 8,100 - - 9,935 - 1 11,203 12 14
Gain/Loss -90,864 83,120 101,521 21,108 148,940 253,472 -466,181 -235,819 -66,491 58,112 71,200 25,578
Ending Market Value 2,330,088 2,410,591 2,327,782 2,226,261 2,197,053 2,048,113 1,794,642 2,250,887 2,486,707 2,553,284 2,483,967 2,412,754
Columbia Acorn Fund 090764
Beginning Market Value 2,748,147 2,673,051 2,530,012 2,504,660 2,242,267 1,971,355 2,308,717 2,499,549 2,504,660 2,480,428 2,333,864 2,308,539
Net Contributions - - - - - - - - - - - -164
Income - - - 119,736 - - - - - 161,169 - -
Gain/Loss 19,668 75,096 143,040 -94,385 262,393 270,912 -337,362 -190,831 -5,112 -136,937 146,563 25,489
Ending Market Value 2,767,815 2,748,147 2,673,051 2,530,012 2,504,660 2,242,267 1,971,355 2,308,717 2,499,549 2,504,660 2,480,428 2,333,864
London - Small Cap Core - 150666
Beginning Market Value 3,341,386 3,188,715 3,027,237 3,000,251 2,875,836 2,598,128 3,176,856 3,493,737 3,618,104 3,594,688 3,511,624 3,448,579
Net Contributions - - 9 10 -1,587 15 -927 -955 -1,058 58 22 10
Income 2,474 3,030 3,432 3,604 1,832 3,435 9,010 2,534 6,852 5,834 2,355 2,696
Gain/Loss -159,233 149,641 158,037 23,372 124,170 274,258 -586,811 -318,460 -130,161 17,524 80,686 60,339
Ending Market Value 3,184,627 3,341,386 3,188,715 3,027,237 3,000,251 2,875,836 2,598,128 3,176,856 3,493,737 3,618,104 3,594,688 3,511,624
Wilmette Fire Pension Fund Month-to Month Report
As of September 30, 2020
Page 8

Wilmette Fire Pension Fund Month-to Month Report
As of September 30, 2020Sep-2020 Aug-2020 Jul-2020 Jun-2020 May-2020 Apr-2020 Mar-2020 Feb-2020 Jan-2020 Dec-2019 Nov-2019 Oct-2019
Small Cap 600 ETF - 077128
Beginning Market Value 558,400 537,620 515,577 497,644 476,652 422,178 545,197 602,795 628,037 609,812 591,997 580,586
Net Contributions -3 -56 - - - - - - - -53 - -367
Income 2,182 - - 1,767 - - 1,886 - - 3,067 - -
Gain/Loss -28,235 20,835 22,043 16,166 20,992 54,474 -124,906 -57,598 -25,241 15,211 17,815 11,777
Ending Market Value 532,343 558,400 537,620 515,577 497,644 476,652 422,178 545,197 602,795 628,037 609,812 591,997
Vanguard REIT Index Fund
Beginning Market Value 1,363,617 1,357,028 1,310,193 1,278,951 1,257,045 1,154,738 1,430,223 1,539,138 1,521,332 1,509,072 1,528,175 1,511,932
Net Contributions - - - - - - - - - - - -
Income 9,842 - - 12,527 - - 10,615 - - 15,515 - -
Gain/Loss -45,878 6,590 46,835 18,715 21,906 102,307 -286,100 -108,914 17,806 -3,255 -19,104 16,244
Ending Market Value 1,327,582 1,363,617 1,357,028 1,310,193 1,278,951 1,257,045 1,154,738 1,430,223 1,539,138 1,521,332 1,509,072 1,528,175
Amerifunds - International Equity - 150605
Beginning Market Value 3,333,509 3,158,982 2,987,845 2,829,133 2,653,477 2,433,766 2,854,550 3,042,067 3,137,519 3,008,312 2,948,004 2,849,865
Net Contributions - - - - - - - - - - - -
Income - - - - - - - - - 91,313 - -
Gain/Loss -57,046 174,526 171,137 158,712 175,656 219,711 -420,783 -187,517 -95,453 37,894 60,309 98,139
Ending Market Value 3,276,463 3,333,509 3,158,982 2,987,845 2,829,133 2,653,477 2,433,766 2,854,550 3,042,067 3,137,519 3,008,312 2,948,004
Tweedy Browne Global Value 087515
Beginning Market Value 898,949 872,233 873,316 858,875 842,629 794,613 916,639 990,649 1,010,505 997,024 986,040 980,373
Net Contributions - - - - - - - - - - - -2
Income - - - - - - - - - 18,601 - -
Gain/Loss -24,911 26,716 -1,083 14,441 16,246 48,016 -122,026 -74,010 -19,856 -5,120 10,984 5,669
Ending Market Value 874,038 898,949 872,233 873,316 858,875 842,629 794,613 916,639 990,649 1,010,505 997,024 986,040
iShares Core MSCI EAFE 087512
Beginning Market Value 1,003,275 953,181 933,582 904,156 855,745 805,075 943,046 1,023,893 1,052,778 1,016,078 1,006,685 972,381
Net Contributions - -45 - - - - - - - -32 - -85
Income - - - 11,295 - - - - - 14,015 - -
Gain/Loss -18,782 50,139 19,598 18,132 48,411 50,670 -137,971 -80,846 -28,885 22,716 9,393 34,389
Ending Market Value 984,493 1,003,275 953,181 933,582 904,156 855,745 805,075 943,046 1,023,893 1,052,778 1,016,078 1,006,685
Page 9

Wilmette Fire Pension Fund Month-to Month Report
As of September 30, 2020Sep-2020 Aug-2020 Jul-2020 Jun-2020 May-2020 Apr-2020 Mar-2020 Feb-2020 Jan-2020 Dec-2019 Nov-2019 Oct-2019
JOHCM International 087513
Beginning Market Value 1,184,302 1,145,070 1,080,832 1,041,600 964,428 875,616 955,806 1,038,151 1,035,564 1,013,403 980,520 962,584
Net Contributions - - - - - - - - - - - -1
Income - - - - - - - - - 9,727 - -
Gain/Loss 2,587 39,232 64,238 39,232 77,171 88,812 -80,189 -82,345 2,587 12,433 32,883 17,936
Ending Market Value 1,186,889 1,184,302 1,145,070 1,080,832 1,041,600 964,428 875,616 955,806 1,038,151 1,035,564 1,013,403 980,520
American New World -087508
Beginning Market Value 1,332,247 1,271,627 1,197,866 1,123,580 1,055,951 961,692 1,137,421 1,207,327 1,234,659 1,186,949 1,166,240 1,131,895
Net Contributions - - - - - - - - - - - -
Income - - - - - - - - - 48,023 - -
Gain/Loss -36,267 60,620 73,761 74,286 67,629 94,259 -175,729 -69,906 -27,332 -314 20,708 34,346
Ending Market Value 1,295,980 1,332,247 1,271,627 1,197,866 1,123,580 1,055,951 961,692 1,137,421 1,207,327 1,234,659 1,186,949 1,166,240
Lazard - Emerging Markets Equity - 150647
Beginning Market Value 2,037,999 2,058,967 1,955,346 1,898,825 1,862,490 1,738,683 2,174,700 2,333,496 2,486,909 2,319,537 2,320,861 2,237,459
Net Contributions - - - - - - - - - - - -6
Income - 29,171 - - - - - - - 39,903 - -
Gain/Loss -32,761 -50,140 103,621 56,521 36,335 123,807 -436,017 -158,796 -153,413 127,468 -1,324 83,408
Ending Market Value 2,005,238 2,037,999 2,058,967 1,955,346 1,898,825 1,862,490 1,738,683 2,174,700 2,333,496 2,486,909 2,319,537 2,320,861
Spare - Max Flex Fixed Income - 150603
Beginning Market Value 2,391,260 2,392,061 2,369,274 2,361,706 2,361,746 3,185,399 4,400,107 4,348,144 4,307,218 4,304,281 4,302,221 4,292,394
Net Contributions - - -1,286 19 29 -852,187 -1,249,983 29 -2,115 25 25 -2,114
Income 2,439 13,181 1,852 2,196 1,761 804 2,492 19,885 2,016 8,005 14,409 960
Gain/Loss 579 -13,982 22,222 5,353 -1,830 27,730 32,784 32,049 41,023 -5,093 -12,374 10,981
Ending Market Value 2,394,277 2,391,260 2,392,061 2,369,274 2,361,706 2,361,746 3,185,399 4,400,107 4,348,144 4,307,218 4,304,281 4,302,221
Spare - Flex Fixed Income - 150602
Beginning Market Value 4,721,086 4,756,472 4,687,716 4,652,766 4,622,621 4,511,939 4,575,360 4,491,002 4,399,170 4,402,268 4,406,123 4,396,465
Net Contributions - - -2,306 47 59 -2,199 54 53 -2,145 34 34 -2,152
Income 8,326 21,615 5,914 8,527 16,117 4,742 8,488 18,647 8,401 8,755 14,826 4,935
Gain/Loss -16,176 -57,001 65,148 26,376 13,968 108,139 -71,963 65,659 85,576 -11,887 -18,715 6,876
Ending Market Value 4,713,236 4,721,086 4,756,472 4,687,716 4,652,766 4,622,621 4,511,939 4,575,360 4,491,002 4,399,170 4,402,268 4,406,123
Page 10

Wilmette Fire Pension Fund Month-to Month Report
As of September 30, 2020Sep-2020 Aug-2020 Jul-2020 Jun-2020 May-2020 Apr-2020 Mar-2020 Feb-2020 Jan-2020 Dec-2019 Nov-2019 Oct-2019
Weaver - Fixed Income - 150676
Beginning Market Value 8,308,322 7,928,457 7,712,603 7,647,672 7,586,007 7,308,914 7,549,445 7,424,876 7,252,244 7,254,131 7,247,930 7,217,199
Net Contributions - 500,000 -2,861 27 47 -2,701 37 5 -2,665 79 36 -2,661
Income 24,676 15,577 16,725 15,989 41,400 5,009 20,231 15,862 20,081 13,631 41,952 6,923
Gain/Loss -35,009 -135,712 201,990 48,914 20,219 274,784 -260,798 108,702 155,216 -15,597 -35,788 26,468
Ending Market Value 8,297,989 8,308,322 7,928,457 7,712,603 7,647,672 7,586,007 7,308,914 7,549,445 7,424,876 7,252,244 7,254,131 7,247,930
Vanguard Money Market
Beginning Market Value 500,453 500,415 500,374 500,328 800,177 500,010 10 - - - - -
Net Contributions - - - - -300,000 300,000 499,990 - - - - -
Income 28 37 42 46 150 167 10 - - - - -
Gain/Loss - - - - - - - - - - - -
Ending Market Value 500,481 500,453 500,415 500,374 500,328 800,177 500,010 - - - - -
Self Managed - Fixed Income - 150523
Beginning Market Value 7,855 7,442 7,439 7,436 7,432 7,428 7,419 7,408 7,309 7,157 7,145 6,471
Net Contributions 71 411 1 1 1 1 1 2 89 141 1 664
Income 2 2 2 2 2 3 7 9 10 11 10 11
Gain/Loss - - - - - - - - - - - -
Ending Market Value 7,928 7,855 7,442 7,439 7,436 7,432 7,428 7,419 7,408 7,309 7,157 7,145
Page 11

Portfolio Performance (%)
Risk/Return Analysis Since 01/03
Asset Allocation ($000)
Portfolio Characteristics vs. Custom Benchmark Since Inception
Wilmette Firemens Pension Fund Custom Benchmark
0.0
4.0
8.0
12.0
16.0
Retu
rn (%
)
Current Quarter
YTD 1Year
3Years
5Years
SinceInception
September 30, 2020 : $50,121
SegmentsMarket Value
($000)Allocation
(%)
Domestic Equity 22,538.32 44.97
International Equity 9,955.95 19.86
REITS 1,327.58 2.65
Domestic Fixed Income 15,110.97 30.15
Alternative Investment 299.86 0.60
Cash Equivalent 887.95 1.77
CurrentQuarter
YTD1
Year3
Years5
YearsSince
InceptionInception
Date
Wilmette Firemens Pension Fund 5.20 2.20 7.84 5.64 7.59 6.61 01/01/2003
Custom Benchmark 4.91 2.13 7.89 6.44 8.57 6.71 01/01/2003
CurrentQuarter
YTD1
Year3
Years5
YearsSince
InceptionInception
Date
Wilmette Firemens Pension Fund 01/01/2003
Beginning Market Value 47,655 49,017 48,860 45,573 39,193 20,281
Net Contributions 7 11 -2,482 -3,384 -5,410 -8,135
Fees/Expenses -13 -35 -49 -251 -384 -768
Income 231 828 1,514 4,093 6,148 17,125
Gain/Loss 2,241 300 2,278 4,089 10,573 21,616
Ending Market Value 50,121 50,121 50,121 50,121 50,121 50,121
Beta Alpha R-SquaredSharpeRatio
InceptionDate
Wilmette Firemens Pension Fund 1.00 -0.07 0.97 0.68 01/01/2003
Custom Benchmark 1.00 0.00 1.00 0.69 01/01/2003
Wilmette Firemens Pension Fund Custom Benchmark
6.5
6.6
6.7
6.8
Retu
rn (%
)
7.9 8.0 8.1 8.2
Risk (Standard Deviation %)
Wilmette Firemens Pension Fund Custom Benchmark
$0
$1,500
$3,000
$4,500
12/02 6/04 12/05 6/07 12/08 6/10 12/11 6/13 12/14 6/16 12/17 6/19 9/20
$3,166$3,113
Wilmette Firemens Pension Fund As of 09/30/20
Page 12

Wilmette Police Pension FundQuarterly Performance Report
September 30, 2020

TargetAllocation
(%)
AssetAllocation
(%)
Differences(%)
AssetAllocation
($)
TargetRebalance
($)
Fixed Income 35.00 32.31 -2.69 16,543,749.80 1,379,600.13
Equity 65.00 67.69 2.69 34,665,821.44 -1,379,600.13
Wilmette Police Pension Fund 100.00 100.00 0.00 51,209,571.24 -
TargetAllocation
(%)
AssetAllocation
(%)
Differences(%)
AssetAllocation
($)
TargetRebalance
($)
Real Estate 3.00 2.38 -0.62 1,216,334.29 319,952.85
Small Cap Equity 7.00 6.37 -0.63 3,261,548.39 323,121.60
Emerging Markets 8.00 6.19 -1.81 3,167,754.42 929,011.28
Mid Cap Equity 10.00 11.10 1.10 5,686,126.06 -565,168.94
International Equity 12.00 12.50 0.50 6,400,901.77 -255,753.22
Large Cap Equity 25.00 29.16 4.16 14,933,156.51 -2,130,763.70
Fixed Income 35.00 32.31 -2.69 16,543,749.80 1,379,600.13
Wilmette Police Pension Fund 100.00 100.00 0.00 51,209,571.24 -
Wilmette Police Pension Fund
Page 1

Total Fund Domestic EquityInternational
EquityREITS
Domestic FixedIncome
AlternativeInvestment
Cash Equivalent
($) % ($) % ($) % ($) % ($) % ($) % ($) %
Wilmette Police Pension Fund 51,209,571 100.00 23,145,768 45.20 9,909,746 19.35 1,216,334 2.38 15,787,675 30.83 307,095 0.60 842,953 1.65
Large Cap Equity 14,933,157 29.16 14,933,157 100.00 - - - - - - - - - -
Vanguard - S&P 500 Inst. Index(02/23/2015) 14,933,157 29.16 14,933,157 100.00 - - - - - - - - - -
Mid Cap Equity 5,686,126 11.10 5,686,044 100.00 - - - - - - - - 83 0.00
iShares S&P MidCap 090767 1,713,273 3.35 1,713,191 100.00 - - - - - - - - 83 0.00
Columbia Acorn 090766 3,972,853 7.76 3,972,853 100.00 - - - - - - - - - -
Small Cap Equity 3,261,548 6.37 2,526,568 77.47 341,090 10.46 - - - - 307,095 9.42 86,796 2.66
London - Small Cap Core - 150665 3,261,548 6.37 2,526,568 77.47 341,090 10.46 - - - - 307,095 9.42 86,796 2.66
Real Estate 1,216,334 2.38 - - - - 1,216,334 100.00 - - - - - -
Vanguard REIT Index Fund Admiral Shares 1,216,334 2.38 - - - - 1,216,334 100.00 - - - - - -
International Equity 6,400,902 12.50 - - 6,400,902 100.00 - - - - - - - -
Amerifunds - International Equity - 150607 3,169,228 6.19 - - 3,169,228 100.00 - - - - - - - -
iShares Core MSCI EAFE 087516 935,124 1.83 - - 935,124 100.00 - - - - - - - -
Tweedy Browne Global Value 087517 1,167,305 2.28 - - 1,167,305 100.00 - - - - - - - -
JOHCM International 087514 1,129,246 2.21 - - 1,129,246 100.00 - - - - - - - -
Emerging Markets 3,167,754 6.19 - - 3,167,754 100.00 - - - - - - - -
American New World 087509 1,295,980 2.53 - - 1,295,980 100.00 - - - - - - - -
Lazard - Emerging Markets Equity - 150648 1,871,774 3.66 - - 1,871,774 100.00 - - - - - - - -
Fixed Income 16,543,750 32.31 - - - - - - 15,787,675 95.43 - - 756,075 4.57
Spare - Max Flex Fixed Income - 150601 2,549,027 4.98 - - - - - - 2,422,550 95.04 - - 126,477 4.96
Spare - Flex Fixed Income - 150604 4,941,151 9.65 - - - - - - 4,830,087 97.75 - - 111,064 2.25
Weaver - Fixed Income - 150677 8,541,036 16.68 - - - - - - 8,533,898 99.92 - - 7,139 0.08
Vanguard Money Market 500,481 0.98 - - - - - - - - - - 500,481 100.00
Self Managed - Fixed Income - 150522 12,055 0.02 - - - - - - 1,141 9.46 - - 10,914 90.54
Wilmette Police Pension Fund
As of September 30, 2020
Page 2

1Month
QuarterTo
DateYTD
1Year
3Years
5Years
7Years
10Years
SinceInception
InceptionDate
Wilmette Police Pension Fund -1.93 5.26 2.82 8.38 5.82 7.65 6.24 6.79 6.65 01/01/2003
Custom Benchmark -2.03 4.91 2.13 7.89 6.44 8.57 7.12 7.24 6.67
US Equity -3.15 7.84 1.72 9.63 8.51 11.01 9.83 - 10.06 05/01/2013
Custom Benchmark - US Equity -3.53 6.87 -1.04 7.00 8.07 11.46 10.38 - 10.71
International Equity -1.60 7.19 0.49 8.39 2.06 6.21 3.76 - 4.28 05/01/2013
MSCI AC World ex US Net -2.46 6.25 -5.44 3.00 1.16 6.23 3.18 - 3.39
Emerging Markets -2.07 4.79 -10.92 -1.63 -1.96 6.40 0.90 - 0.50 05/01/2013
MSCI EM Net -1.60 9.56 -1.16 10.54 2.42 8.97 3.74 - 3.03
Fixed Income -0.08 0.93 7.05 7.42 5.15 4.01 3.69 - 3.09 05/01/2013
Barclays Govt/Credit Bond -0.05 0.78 8.04 8.03 5.86 4.66 4.30 - 3.57
Wilmette Police Pension Fund Time Weighted Returns
As of September 30, 2020
Returns for periods greater than one year are annualized.Returns are expressed as percentages.
Page 3

1Month
QuarterTo
DateYTD
1Year
3Years
5Years
7Years
10Years
SinceInception
InceptionDate
Wilmette Police Pension Fund -1.93 5.26 2.82 8.38 5.82 7.65 6.24 6.79 6.65 01/01/2003
Custom Benchmark -2.03 4.91 2.13 7.89 6.44 8.57 7.12 7.24 6.67
Vanguard - S&P 500 Inst. Index(02/23/2015) -3.80 8.97 6.13 15.99 12.54 14.36 12.79 13.76 10.38 01/01/2003
S&P 500 Total Return -3.80 8.93 5.57 15.15 12.28 14.15 12.68 13.74 10.06
iShares S&P MidCap 090767 -3.34 4.68 -8.72 -2.34 - - - - 3.81 06/01/2019
S&P 400 MidCap Net -3.29 4.65 -8.97 -2.66 - - - - 3.34
Columbia Acorn 090766 0.72 9.40 10.51 19.90 - - - - 16.23 06/01/2019
Russell 2500 GR -0.77 9.37 11.58 23.38 - - - - 20.80
London - Small Cap Core - 150665 -4.69 5.20 -11.86 -7.53 2.04 4.11 3.38 - 7.29 01/01/2011
Russell 2000 -3.34 4.93 -8.69 0.39 1.77 8.00 6.43 - 8.42
Vanguard REIT Index Fund Admiral Shares -2.64 1.33 -12.73 -12.19 2.37 5.21 - - 5.80 05/01/2014
FTSE Nareit All Equity REIT Index -2.66 1.19 -12.38 -11.81 2.37 4.71 - - 4.90
Amerifunds - International Equity - 150607 -1.71 9.66 4.43 14.97 5.66 9.05 6.63 6.76 7.51 04/01/2004
MSCI AC World ex US Net -2.46 6.25 -5.44 3.00 1.16 6.23 3.18 4.00 5.32
iShares Core MSCI EAFE 087516 -1.87 5.46 -6.48 1.26 - - - - 4.48 12/01/2018
MSCI EAFE IMI NT -2.29 5.64 -6.32 1.81 - - - - 5.04
Tweedy Browne Global Value 087517 -2.77 0.08 -13.50 -10.85 - - - - -2.83 12/01/2018
MSCI EAFE -2.60 4.80 -7.09 0.49 - - - - 4.21
JOHCM International 087514 0.22 9.81 14.61 23.30 - - - - 15.53 12/01/2018
MSCI EAFE -2.60 4.80 -7.09 0.49 - - - - 4.21
American New World 087509 -2.72 8.19 4.97 14.50 - - - - 15.15 12/01/2018
MSCI ACWI -3.19 8.25 1.77 11.00 - - - - 10.70
Lazard - Emerging Markets Equity - 150648 -1.61 2.55 -19.37 -10.38 -6.11 3.68 -0.95 -0.54 0.28 05/01/2010
MSCI EM Net -1.60 9.56 -1.16 10.54 2.42 8.97 3.74 2.51 3.05
Spare - Max Flex Fixed Income - 150601 0.13 1.06 5.14 5.56 3.42 2.41 2.22 1.98 2.53 08/01/2009
BC Gov 1-3 Yr 0.02 0.10 3.09 3.62 2.66 1.82 1.54 1.30 1.46
Wilmette Police Pension Fund Time Weighted Returns
As of September 30, 2020
Returns for periods greater than one year are annualized.Returns are expressed as percentages.
Page 4

Wilmette Police Pension Fund Time Weighted Returns
As of September 30, 2020
1Month
QuarterTo
DateYTD
1Year
3Years
5Years
7Years
10Years
SinceInception
InceptionDate
Spare - Flex Fixed Income - 150604 -0.14 0.58 7.47 7.58 5.42 4.09 3.96 3.62 4.26 01/01/2003
Custom Benchmark - SKBA Flex -0.05 0.78 8.04 8.03 5.86 4.66 4.30 3.81 4.29
Weaver - Fixed Income - 150677 -0.11 1.22 7.75 8.26 5.98 4.94 4.45 - 4.44 06/01/2011
Weaver Custom Benchmark -0.08 0.88 5.85 6.56 4.74 3.86 3.56 - 3.51
Self Managed - Fixed Income - 150522 0.05 0.17 0.87 1.45 2.09 2.61 2.83 2.20 3.34 01/01/2003
BC Gov Intm 0.07 0.20 5.96 5.98 4.04 2.76 2.56 2.32 3.27
Returns for periods greater than one year are annualized.Returns are expressed as percentages.
Page 5

Performance(%)
2019 2018 2017 2016 2015 2014 2013 2012 2011 2010 2003
Wilmette Police Pension Fund 20.21 -7.46 13.77 8.33 -2.03 5.12 13.34 10.08 2.61 10.20 14.09
Custom Benchmark 20.69 -5.89 15.65 9.48 -1.69 7.04 11.76 11.00 1.16 10.44 14.97
Wilmette Police - Acturial Assumption 7.25 7.25 7.25 7.25 7.25 7.25 7.25 7.25 7.30 7.35 7.50
Wilmette Police Pension Fund Custom Benchmark
$0.0
$600.0
$1,200.0
$1,800.0
$2,400.0
$3,000.0
$3,600.0
$4,200.0
12/02 12/03 12/04 12/05 12/06 12/07 12/08 12/09 12/10 12/11 12/12 12/13 12/14 12/15 12/16 12/17 12/18 12/19 9/20
$3,144.5$3,137.6
Wilmette Police Pension Fund Time Weighted Returns
As of September 30, 2020
Please refer to definitions page at the back of this book for benchmar descriptions
Page 6

1Month
CurrentQuarter
YTD1
Year3
Years5
Years7
YearsSince
InceptionInception
Date
Wilmette Police Pension Fund -1.93 5.24 2.84 8.49 5.82 7.67 6.21 6.64 12/31/2002
2019 2018 2017 2016 2015 2014 2013 2012 2011 2010
Wilmette Police Pension Fund 20.22 -7.47 13.77 8.24 -2.03 5.13 13.33 10.08 2.56 10.19
Wilmette Police Pension Fund Dollar Weighted Returns
As of September 30, 2020
Please refer to definitions page at the back of this book for benchmar descriptions
Page 7

Sep-2020 Aug-2020 Jul-2020 Jun-2020 May-2020 Apr-2020 Mar-2020 Feb-2020 Jan-2020 Dec-2019 Nov-2019 Oct-2019
Wilmette Police Pension Fund
Beginning Market Value 52,208,376 50,165,754 48,660,613 47,799,849 46,016,846 42,594,453 47,318,459 49,617,827 49,784,622 50,352,235 49,401,702 49,352,679
Net Contributions - 500,000 -506,741 93 -1,495 -7,380 -871 -901 -8,269 -1,499,810 117 -707,181
Income 114,767 82,163 30,659 302,991 63,426 15,230 173,823 57,070 39,539 667,499 77,803 16,603
Gain/Loss -1,113,571 1,460,458 1,981,224 557,679 1,721,073 3,414,542 -4,896,957 -2,355,536 -198,064 264,699 872,613 739,600
Ending Market Value 51,209,571 52,208,376 50,165,754 48,660,613 47,799,849 46,016,846 42,594,453 47,318,459 49,617,827 49,784,622 50,352,235 49,401,702
Vanguard - S&P 500 Inst. Index(02/23/2015)
Beginning Market Value 15,523,707 14,482,943 14,191,554 13,915,123 12,978,051 10,988,321 11,680,334 12,728,501 12,733,766 13,822,161 13,338,432 13,739,012
Net Contributions - - -500,000 - 300,000 550,000 750,000 - - -1,500,000 - -700,000
Income 62,248 - - 69,029 - - 118,615 - - 152,807 - -
Gain/Loss -652,798 1,040,765 791,389 207,402 637,072 1,439,730 -1,560,629 -1,048,168 -5,265 258,798 483,730 299,420
Ending Market Value 14,933,157 15,523,707 14,482,943 14,191,554 13,915,123 12,978,051 10,988,321 11,680,334 12,728,501 12,733,766 13,822,161 13,338,432
iShares S&P MidCap 090767
Beginning Market Value 1,772,414 1,711,300 1,636,655 1,615,255 1,505,753 1,319,399 1,654,824 1,828,195 1,877,171 1,825,988 1,773,415 1,754,839
Net Contributions - - - -72 - - - - -92 - - -311
Income 7,668 - - 5,955 - - 7,304 - - 8,264 - -
Gain/Loss -66,809 61,115 74,644 15,517 109,502 186,355 -342,730 -173,371 -48,883 42,919 52,573 18,886
Ending Market Value 1,713,273 1,772,414 1,711,300 1,636,655 1,615,255 1,505,753 1,319,399 1,654,824 1,828,195 1,877,171 1,825,988 1,773,415
Columbia Acorn 090766
Beginning Market Value 3,944,622 3,836,831 3,631,516 3,595,127 3,218,495 2,829,634 3,313,875 3,587,790 3,595,127 3,560,345 3,349,971 3,313,524
Net Contributions - - - - - - - - - - - -140
Income - - - 171,867 - - - - - 231,338 - -
Gain/Loss 28,231 107,791 205,315 -135,478 376,632 388,861 -484,242 -273,914 -7,337 -196,555 210,374 36,587
Ending Market Value 3,972,853 3,944,622 3,836,831 3,631,516 3,595,127 3,218,495 2,829,634 3,313,875 3,587,790 3,595,127 3,560,345 3,349,971
London - Small Cap Core - 150665
Beginning Market Value 3,422,119 3,265,731 3,100,332 3,072,688 2,945,279 2,660,846 3,253,598 3,578,095 3,705,458 3,681,475 3,596,408 3,531,855
Net Contributions - - 9 11 -1,625 15 -949 -978 -1,084 60 23 11
Income 2,533 3,104 3,514 3,692 1,876 3,517 9,227 2,595 7,018 5,976 2,412 2,760
Gain/Loss -163,104 153,284 161,876 23,942 127,158 280,901 -601,031 -326,114 -133,297 17,948 82,632 61,783
Ending Market Value 3,261,548 3,422,119 3,265,731 3,100,332 3,072,688 2,945,279 2,660,846 3,253,598 3,578,095 3,705,458 3,681,475 3,596,408
Wilmette Police Pension Fund Month-to Month Report
As of September 30, 2020
Page 8

Wilmette Police Pension Fund Month-to Month Report
As of September 30, 2020Sep-2020 Aug-2020 Jul-2020 Jun-2020 May-2020 Apr-2020 Mar-2020 Feb-2020 Jan-2020 Dec-2019 Nov-2019 Oct-2019
Vanguard REIT Index Fund Admiral Shares
Beginning Market Value 1,249,350 1,243,312 1,200,402 1,171,778 1,151,708 1,057,974 1,310,374 1,410,162 1,393,849 1,382,616 1,400,118 1,385,236
Net Contributions - - - - - - - - - - - -
Income 9,018 - - 11,478 - - 9,726 - - 14,215 - -
Gain/Loss -42,033 6,038 42,910 17,147 20,071 93,734 -262,126 -99,788 16,313 -2,982 -17,503 14,883
Ending Market Value 1,216,334 1,249,350 1,243,312 1,200,402 1,171,778 1,151,708 1,057,974 1,310,374 1,410,162 1,393,849 1,382,616 1,400,118
Amerifunds - International Equity - 150607
Beginning Market Value 3,224,406 3,055,592 2,890,056 2,736,539 2,566,632 2,354,112 2,761,123 2,942,503 3,034,832 2,909,854 2,851,519 2,756,592
Net Contributions - - - - - - - - - - - -
Income - - - - - - - - - 88,324 - -
Gain/Loss -55,179 168,814 165,536 153,517 169,907 212,520 -407,012 -181,380 -92,329 36,654 58,335 94,927
Ending Market Value 3,169,228 3,224,406 3,055,592 2,890,056 2,736,539 2,566,632 2,354,112 2,761,123 2,942,503 3,034,832 2,909,854 2,851,519
Tweedy Browne Global Value 087517
Beginning Market Value 1,200,574 1,164,894 1,166,340 1,147,054 1,125,357 1,061,230 1,224,199 1,323,042 1,349,560 1,331,556 1,316,887 1,309,320
Net Contributions - - - - - - - - - - - -4
Income - - - - - - - - - 24,842 - -
Gain/Loss -33,269 35,680 -1,446 19,286 21,697 64,127 -162,969 -98,842 -26,519 -6,838 14,669 7,571
Ending Market Value 1,167,305 1,200,574 1,164,894 1,166,340 1,147,054 1,125,357 1,061,230 1,224,199 1,323,042 1,349,560 1,331,556 1,316,887
iShares Core MSCI EAFE 087516
Beginning Market Value 952,964 905,395 886,779 858,828 812,844 764,714 895,768 972,562 999,999 965,150 956,227 923,593
Net Contributions - -56 - - - - - - - -41 - -31
Income - - - 10,728 - - - - - 13,313 - -
Gain/Loss -17,840 47,625 18,616 17,223 45,984 48,130 -131,054 -76,793 -27,437 21,577 8,923 32,666
Ending Market Value 935,124 952,964 905,395 886,779 858,828 812,844 764,714 895,768 972,562 999,999 965,150 956,227
JOHCM International 087514
Beginning Market Value 1,126,785 1,089,458 1,028,340 991,013 917,589 833,090 909,385 987,731 985,270 964,186 932,899 915,835
Net Contributions - - - - - - - - - - - -
Income - - - - - - - - - 9,255 - -
Gain/Loss 2,461 37,327 61,118 37,327 73,424 84,499 -76,295 -78,346 2,461 11,830 31,286 17,065
Ending Market Value 1,129,246 1,126,785 1,089,458 1,028,340 991,013 917,589 833,090 909,385 987,731 985,270 964,186 932,899
Page 9

Wilmette Police Pension Fund Month-to Month Report
As of September 30, 2020Sep-2020 Aug-2020 Jul-2020 Jun-2020 May-2020 Apr-2020 Mar-2020 Feb-2020 Jan-2020 Dec-2019 Nov-2019 Oct-2019
Lazard - Emerging Markets Equity - 150648
Beginning Market Value 1,902,355 1,921,927 1,825,203 1,772,444 1,738,528 1,622,961 2,029,957 2,178,184 2,321,387 2,165,155 2,166,391 2,088,585
Net Contributions - - - - - - - - - - - -51
Income - 27,230 - - - - - - - 37,248 - -
Gain/Loss -30,580 -46,802 96,724 52,759 33,916 115,567 -406,996 -148,227 -143,202 118,984 -1,236 77,857
Ending Market Value 1,871,774 1,902,355 1,921,927 1,825,203 1,772,444 1,738,528 1,622,961 2,029,957 2,178,184 2,321,387 2,165,155 2,166,391
American New World 087509
Beginning Market Value 1,332,247 1,271,627 1,197,866 1,123,580 1,055,951 961,692 1,137,421 1,207,327 1,234,659 1,186,949 1,166,240 1,131,895
Net Contributions - - - - - - - - - - - -
Income - - - - - - - - - 48,023 - -
Gain/Loss -36,267 60,620 73,761 74,286 67,629 94,259 -175,729 -69,906 -27,332 -314 20,708 34,346
Ending Market Value 1,295,980 1,332,247 1,271,627 1,197,866 1,123,580 1,055,951 961,692 1,137,421 1,207,327 1,234,659 1,186,949 1,166,240
Spare - Max Flex Fixed Income - 150601
Beginning Market Value 2,545,779 2,547,147 2,523,622 2,515,972 2,515,598 3,339,333 4,553,197 4,500,806 4,459,663 4,456,473 4,454,305 4,444,080
Net Contributions - - -1,364 29 50 -852,262 -1,249,983 30 -2,190 25 25 -2,189
Income 2,438 14,587 1,852 2,196 1,762 814 2,493 20,167 2,018 8,007 16,160 960
Gain/Loss 809 -15,955 23,037 5,425 -1,437 27,713 33,626 32,194 41,315 -4,842 -14,016 11,455
Ending Market Value 2,549,027 2,545,779 2,547,147 2,523,622 2,515,972 2,515,598 3,339,333 4,553,197 4,500,806 4,459,663 4,456,473 4,454,305
Spare - Flex Fixed Income - 150604
Beginning Market Value 4,947,861 4,984,492 4,915,279 4,881,012 4,847,857 4,739,294 4,793,726 4,703,426 4,604,336 4,607,495 4,611,393 4,601,908
Net Contributions - - -2,435 25 32 -2,341 27 39 -2,253 28 27 -2,264
Income 9,638 21,870 5,633 10,961 16,753 4,764 9,714 18,768 8,059 11,151 15,727 4,923
Gain/Loss -16,348 -58,502 66,015 23,282 16,369 106,140 -64,173 71,492 93,285 -14,338 -19,652 6,825
Ending Market Value 4,941,151 4,947,861 4,984,492 4,915,279 4,881,012 4,847,857 4,739,294 4,793,726 4,703,426 4,604,336 4,607,495 4,611,393
Weaver - Fixed Income - 150677
Beginning Market Value 8,550,692 8,172,705 7,954,317 7,891,214 7,825,142 7,549,971 7,788,821 7,657,670 7,477,829 7,481,185 7,475,869 7,445,343
Net Contributions - 500,000 -2,952 27 46 -2,795 32 6 -2,744 73 41 -2,740
Income 21,188 15,327 19,610 17,031 42,875 5,959 16,717 15,519 22,423 14,713 43,482 7,936
Gain/Loss -30,844 -137,340 201,730 46,045 23,151 272,007 -255,599 115,627 160,162 -18,142 -38,209 25,330
Ending Market Value 8,541,036 8,550,692 8,172,705 7,954,317 7,891,214 7,825,142 7,549,971 7,788,821 7,657,670 7,477,829 7,481,185 7,475,869
Page 10

Wilmette Police Pension Fund Month-to Month Report
As of September 30, 2020Sep-2020 Aug-2020 Jul-2020 Jun-2020 May-2020 Apr-2020 Mar-2020 Feb-2020 Jan-2020 Dec-2019 Nov-2019 Oct-2019
Vanguard Money Market
Beginning Market Value 500,453 500,415 500,374 500,328 800,177 500,010 10 - - - - -
Net Contributions - - - - -300,000 300,000 499,990 - - - - -
Income 28 37 42 46 150 167 10 - - - - -
Gain/Loss - - - - - - - - - - - -
Ending Market Value 500,481 500,453 500,415 500,374 500,328 800,177 500,010 - - - - -
Self Managed - Fixed Income - 150522
Beginning Market Value 12,048 11,985 11,977 11,896 11,886 11,874 11,854 11,832 11,717 11,649 11,626 11,064
Net Contributions - 56 1 74 2 2 2 2 94 47 2 539
Income 7 8 8 8 9 10 16 20 21 23 21 24
Gain/Loss -1 -1 -1 -2 - -1 2 - - -1 -1 -
Ending Market Value 12,055 12,048 11,985 11,977 11,896 11,886 11,874 11,854 11,832 11,717 11,649 11,626
Page 11

Portfolio Performance (%)
Asset Growth ($000)
Risk/Return Analysis Since 01/01/03
Asset Allocation ($000)
Growth of a Dollar ($000)
Portfolio Characteristics vs. Custom Benchmark Since Inception
Wilmette Police Pension Fund Custom Benchmark
0.0
4.0
8.0
12.0
16.0
Retu
rn (%
)
Current Quarter
YTD 1Year
3Years
5Years
SinceInception
September 30, 2020 : $51,210
SegmentsMarket Value
($000)Allocation
(%)
Domestic Equity 23,145.77 45.20
International Equity 9,909.75 19.35
REITS 1,216.33 2.38
Domestic Fixed Income 15,787.67 30.83
Alternative Investment 307.09 0.60
Cash Equivalent 842.95 1.65
CurrentQuarter
YTD1
Year3
Years5
YearsSince
InceptionInception
Date
Wilmette Police Pension Fund 5.26 2.82 8.38 5.82 7.65 6.65 01/01/2003
Custom Benchmark 4.91 2.13 7.89 6.44 8.57 6.67 01/01/2003
CurrentQuarter
YTD1
Year3
Years5
YearsSince
InceptionInception
Date
Wilmette Police Pension Fund 01/01/2003
Beginning Market Value 48,661 49,785 49,353 45,789 38,881 19,649
Net Contributions 7 11 -2,182 -2,846 -4,272 -6,514
Fees/Expenses -14 -37 -51 -263 -398 -830
Income 228 880 1,642 4,275 6,401 17,248
Gain/Loss 2,328 571 2,448 4,254 10,596 21,657
Ending Market Value 51,210 51,210 51,210 51,210 51,210 51,210
Beta Alpha R-SquaredSharpeRatio
InceptionDate
Wilmette Police Pension Fund 0.99 0.08 0.98 0.69 01/01/2003
Custom Benchmark 1.00 0.00 1.00 0.69 01/01/2003
Wilmette Police Pension Fund Custom Benchmark
6.6
6.7
Retu
rn (%
)
7.9 8.0
Risk (Standard Deviation %)
Wilmette Police Pension Fund Custom Benchmark
$0
$1,500
$3,000
$4,500
12/02 6/04 12/05 6/07 12/08 6/10 12/11 6/13 12/14 6/16 12/17 6/19 9/20
$3,144
$3,138
Wilmette Police Pension Fund As of 09/30/20
Page 12

1
In regards to our upcoming meeting, Graystone Consulting will assist in the search and selection of an Small Cap Equity Manager.
The search began with a list of over 70 investment managers that were filtered using the following criteria:
Qualitative Criteria-Qualifications, depth, and stability of personnel.-Construction of the investment philosophy and process.-Consistency of the investment process implementation.-Well-defined business plan. To arrive at a conclusion about a firm’s business plan, we assess the dedication to investment resources and evaluatekey growth plans and strategies.-Capacity to accommodate new relationships.
Quantitative Criteria-Magnitude and consistency of value-added performance.-Amount of risk assumed in relation to an appropriate benchmark.-Performance in adverse market conditions.-Likelihood of significantly under performing a given market index.
We have reduced the full list of manager down to a manageable size.
London Co. Small Cap Aberdeen US Small Cap Equity Inst ClearBridge Small Cap I Eaton Vance Small-Cap I
Goldman Sachs Small Cap Eq Insghts Instl JPMorgan Small Cap Blend A Russell 2000 Value Russell 2000

Calendar-Year ReturnsPSN Small Cap Core
Year To Date 2019 2018 2017 2016 2015 2014 2013 2012 2011 2010 HIGH (0.00) 5.72 40.89 1.66 36.61 36.25 10.28 18.97 56.43 44.90 13.32 65.20 FIRST QUARTILE -9.43 27.92 -7.38 17.65 24.03 1.64 9.04 44.54 19.24 2.49 31.55 MEDIAN -14.06 24.72 -10.64 14.98 20.71 -1.15 6.84 40.97 16.67 -0.57 27.89 THIRD QUARTILE -16.75 21.28 -13.10 12.03 18.31 -3.32 3.82 37.94 14.15 -3.49 24.93 LOW (1.00) -34.55 9.24 -23.94 -5.72 8.81 -33.60 -9.23 17.05 3.70 -12.20 16.03 MEAN -13.01 24.65 -10.13 15.39 20.91 -1.34 6.04 40.83 16.83 -0.34 28.60 VALID COUNT 148 153 157 155 155 154 150 146 143 137 130
London Co. Small CapAberdeen US Small Cap Equity InstClearBridge Small Cap IEaton Vance Small-Cap IGoldman Sachs Small Cap Eq Insghts InstlJPMorgan Small Cap Blend ARussell 2000 ValueRussell 2000
Year To Date 2019 2018 2017 2016 2015 2014 2013 2012 2011 2010VALUE RANK VALUE RANK VALUE RANK VALUE RANK VALUE RANK VALUE RANK VALUE RANK VALUE RANK VALUE RANK VALUE RANK VALUE RANK-15.64 64 27.98 24 -8.65 33 7.31 99 12.82 92 -6.64 91 -0.38 92 34.16 89 21.64 9 6.97 5 24.40 81-1.25 4 25.09 47 -13.13 75 11.36 81 23.68 27 8.64 1 7.10 47 42.52 41 14.49 72 -6.02 88 28.07 46
-24.33 98 30.94 11 -8.88 33 12.10 74 27.72 8 -4.18 78 8.10 34 36.40 82 19.45 21 -16.45 99 20.28 98-11.67 35 27.81 24 -5.57 17 15.17 47 19.70 57 -2.57 66 3.98 73 35.63 84 12.08 88 -5.58 86 25.15 72-16.70 73 25.43 46 -8.81 33 11.82 80 22.52 36 -1.37 53 6.86 49 35.04 85 13.05 83 -0.94 56 30.74 27-7.73 20 30.15 13 -3.67 9 41.45 1 7.86 99 -2.26 63 -0.45 92 47.26 12 11.87 89 -3.87 78 33.38 15
-23.50 98 22.39 67 -12.86 73 7.84 96 31.74 3 -7.47 94 4.22 72 34.52 87 18.05 37 -5.50 86 24.50 80-12.98 43 25.52 45 -11.01 56 14.65 56 21.31 45 -4.41 81 4.89 68 38.82 67 16.35 53 -4.18 81 26.85 60
Annualized Returns June 2020PSN Small Cap Core
Year To Date 1 Year 3 Years 5 Years 7 Years 10 Years HIGH (0.00) 5.72 12.05 18.17 17.08 16.22 17.38 FIRST QUARTILE -9.43 -2.81 4.84 6.72 9.40 12.81 MEDIAN -14.06 -7.95 1.98 4.98 8.11 11.40 THIRD QUARTILE -16.75 -11.25 -0.81 2.68 6.40 10.47 LOW (1.00) -34.55 -40.11 -15.19 -12.09 -6.82 0.88 MEAN -13.01 -7.00 2.22 4.79 7.94 11.53 VALID COUNT 148 148 147 144 139 122
London Co. Small CapAberdeen US Small Cap Equity InstClearBridge Small Cap IEaton Vance Small-Cap IGoldman Sachs Small Cap Eq Insghts InstlJPMorgan Small Cap Blend ARussell 2000 ValueRussell 2000
Year To Date 1 Year 3 Years 5 Years 7 Years 10 YearsVALUE RANK VALUE RANK VALUE RANK VALUE RANK VALUE RANK VALUE RANK-15.64 64 -9.92 64 2.24 45 0.51 95 3.53 97 9.68 90-1.25 4 6.21 4 5.57 19 8.48 9 11.07 11 12.98 20
-24.33 98 -17.51 97 -1.74 83 3.69 66 6.70 72 8.52 95-11.67 35 -8.26 52 5.17 22 5.81 36 8.99 30 10.63 68-16.70 73 -10.34 68 1.62 55 4.28 61 7.21 64 10.47 75-7.73 20 -0.24 16 10.84 3 9.48 6 11.24 7 13.89 9
-23.50 98 -17.48 97 -4.35 97 1.26 88 3.98 95 7.82 96-12.98 43 -6.63 41 2.01 49 4.29 61 7.17 64 10.50 72
2

Style QuadrantsCurrent Vs. 10 Year
-1 0 1
-1
0
1
STYLE SUMMARY
RUS 2000 Value
RUS 1000 Value RUS 1000 Growth
RUS 2000 Growth
-1 0 1
-1
0
1
STYLE HISTORY
RUS 2000 Value
RUS 1000 Value RUS 1000 Growth
RUS 2000 Growth
London Co. Small Cap Aberdeen US Small Cap Equity Inst ClearBridge Small Cap I Eaton Vance Small-Cap IGoldman Sachs Small Cap Eq Insghts Instl JPMorgan Small Cap Blend A Russell 2000 Value Russell 2000

3 Year Capture Ratios June 2020
-4 21 46 71 96 121DOWNSIDE CAPTURE RATIO
-21
4
29
54
79
104
129
UPS
IDE
CAP
TUR
E R
ATIO
90 Day U.S. Treasury Bill
Russell 2000
Outperforms inPos. & Neg. Qtrs.
Underperforms in Pos. Qtrs.Outperforms in Neg. Qtrs.
Underperforms in Neg. Qtrs.Outperforms in Pos. Qtrs.
Underperforms inPos. & Neg. Qtrs.
London Co. Small CapAberdeen US Small Cap Equity InstClearBridge Small Cap IEaton Vance Small-Cap IGoldman Sachs Small Cap Eq Insghts InstlJPMorgan Small Cap Blend ARussell 2000 ValueRussell 2000
Up Mkt Capt Retrn Up Cap Ratio Dnside Cap Return Dnside Cap Ratio R-Squared31.27 77.77 -37.97 82.54 0.9639.90 99.22 -39.88 86.68 0.9542.48 105.64 -53.26 115.77 0.9735.97 89.47 -37.09 80.62 0.9639.77 98.92 -46.29 100.62 0.9947.94 119.22 -37.78 82.13 0.9831.44 78.19 -49.34 107.26 0.9740.21 100.00 -46.01 100.00 1.00
Risk Benchmark Used for this Analysis: Russell 2000
Capture Ratio is the ratio of the manager’s overall performance relative to the overall performance of the benchmark. Up Capture Ratio considers onlythose time periods that are zero or positive for the benchmark. In evaluating Up Capture Ratio, higher values are more favorable. Down Capture Ratioconsiders only those time periods that are negative for the benchmark. Lower values are more favorable in assessing Down Capture Ratio.
4

5 Year Capture Ratios June 2020
-28 -3 22 47 72 97 122DOWNSIDE CAPTURE RATIO
3
28
53
78
103
128
UPS
IDE
CAP
TUR
E R
ATIO
90 Day U.S. Treasury Bill
Russell 2000
Outperforms inPos. & Neg. Qtrs.
Underperforms in Pos. Qtrs.Outperforms in Neg. Qtrs.
Underperforms in Neg. Qtrs.Outperforms in Pos. Qtrs.
Underperforms inPos. & Neg. Qtrs.
London Co. Small CapAberdeen US Small Cap Equity InstClearBridge Small Cap IEaton Vance Small-Cap IGoldman Sachs Small Cap Eq Insghts InstlJPMorgan Small Cap Blend ARussell 2000 ValueRussell 2000
Up Mkt Capt Retrn Up Cap Ratio Dnside Cap Return Dnside Cap Ratio R-Squared19.08 59.87 -32.34 81.47 0.8930.39 95.35 -29.39 74.05 0.8934.04 106.80 -43.03 108.42 0.9626.66 83.63 -30.45 76.71 0.9430.60 96.00 -38.32 96.54 0.9940.72 127.75 -39.05 98.39 0.8827.10 85.01 -40.42 101.84 0.9531.88 100.00 -39.69 100.00 1.00
Risk Benchmark Used for this Analysis: Russell 2000
Capture Ratio is the ratio of the manager’s overall performance relative to the overall performance of the benchmark. Up Capture Ratio considers onlythose time periods that are zero or positive for the benchmark. In evaluating Up Capture Ratio, higher values are more favorable. Down Capture Ratioconsiders only those time periods that are negative for the benchmark. Lower values are more favorable in assessing Down Capture Ratio.
5

7- Year Market Capture Ratios June 2020
-3 22 47 72 97 122DOWNSIDE CAPTURE RATIO
-22
3
28
53
78
103
128
UPS
IDE
CAP
TUR
E R
ATIO
90 Day U.S. Treasury Bill
Russell 2000
Outperforms inPos. & Neg. Qtrs.
Underperforms in Pos. Qtrs.Outperforms in Neg. Qtrs.
Underperforms in Neg. Qtrs.Outperforms in Pos. Qtrs.
Underperforms inPos. & Neg. Qtrs.
London Co. Small CapAberdeen US Small Cap Equity InstClearBridge Small Cap IEaton Vance Small-Cap IGoldman Sachs Small Cap Eq Insghts InstlJPMorgan Small Cap Blend ARussell 2000 ValueRussell 2000
Up Mkt Capt Retrn Up Cap Ratio Dnside Cap Return Dnside Cap Ratio R-Squared17.81 62.30 -29.73 78.36 0.8328.38 99.27 -28.06 73.95 0.9029.50 103.22 -40.32 106.26 0.9525.90 90.60 -29.28 77.16 0.9327.75 97.09 -36.63 96.54 0.9834.29 119.96 -36.77 96.91 0.8724.25 84.84 -39.05 102.92 0.9528.58 100.00 -37.94 100.00 1.00
Risk Benchmark Used for this Analysis: Russell 2000
Capture Ratio is the ratio of the manager’s overall performance relative to the overall performance of the benchmark. Up Capture Ratio considers onlythose time periods that are zero or positive for the benchmark. In evaluating Up Capture Ratio, higher values are more favorable. Down Capture Ratioconsiders only those time periods that are negative for the benchmark. Lower values are more favorable in assessing Down Capture Ratio.
6

10- Year Market Capture Ratios June 2020
-27 -2 23 48 73 98 123DOWNSIDE CAPTURE RATIO
-23
2
27
52
77
102
127
UPS
IDE
CAP
TUR
E R
ATIO
90 Day U.S. Treasury Bill
Russell 2000
Outperforms inPos. & Neg. Qtrs.
Underperforms in Pos. Qtrs.Outperforms in Neg. Qtrs.
Underperforms in Neg. Qtrs.Outperforms in Pos. Qtrs.
Underperforms inPos. & Neg. Qtrs.
London Co. Small CapAberdeen US Small Cap Equity InstClearBridge Small Cap IEaton Vance Small-Cap IGoldman Sachs Small Cap Eq Insghts InstlJPMorgan Small Cap Blend ARussell 2000 ValueRussell 2000
Up Mkt Capt Retrn Up Cap Ratio Dnside Cap Return Dnside Cap Ratio R-Squared25.75 78.32 -27.23 74.72 0.8533.28 101.24 -31.19 85.57 0.9232.27 98.16 -40.06 109.92 0.9429.80 90.65 -31.50 86.43 0.9331.61 96.15 -34.67 95.13 0.9839.02 118.69 -37.37 102.53 0.9029.15 88.68 -37.27 102.25 0.9632.87 100.00 -36.45 100.00 1.00
Risk Benchmark Used for this Analysis: Russell 2000
Capture Ratio is the ratio of the manager’s overall performance relative to the overall performance of the benchmark. Up Capture Ratio considers onlythose time periods that are zero or positive for the benchmark. In evaluating Up Capture Ratio, higher values are more favorable. Down Capture Ratioconsiders only those time periods that are negative for the benchmark. Lower values are more favorable in assessing Down Capture Ratio.
7

3-Year Risk/Return Analysis June 2020
0 5 10 15 20 25 30 35STANDARD DEVIATION
-9
-4
1
6
11
RAT
E O
F R
ETU
RN
90 Day U.S. Treasury BillRussell 2000
More ReturnLess Risk
Less ReturnLess Risk
More ReturnMore Risk
Less ReturnMore Risk
London Co. Small CapAberdeen US Small Cap Equity InstClearBridge Small Cap IEaton Vance Small-Cap IGoldman Sachs Small Cap Eq Insghts InstlJPMorgan Small Cap Blend ARussell 2000 ValueRussell 2000
ROR Std Dev Pop Alpha Beta R-Squared2.24 23.40 -0.20 0.81 0.965.57 26.43 3.10 0.91 0.95-1.74 31.83 -2.69 1.11 0.975.17 22.65 2.54 0.78 0.961.62 28.79 -0.17 1.01 0.99
10.84 26.89 8.45 0.94 0.98-4.35 27.71 -5.98 0.97 0.972.01 28.28 0.00 1.00 1.00
Risk Benchmark Used for this Analysis: Russell 2000
Modern Portfolio Theory (MPT) attempts to quantify the relationship between risk and return and operates under the assumption that an investor must becompensated for assuming risk. The measure of Alpha, Beta, and R-Squared are used to describe the value-added (Alpha), the volatility (Beta), and thepredictability (R-Squared) of the manager’s performance to a stated index’s performance.
8

5-Year Risk/Return Analysis June 2020
0 5 10 15 20 25 30STANDARD DEVIATION
0
5
10
RAT
E O
F R
ETU
RN
90 Day U.S. Treasury Bill
Russell 2000
More ReturnLess Risk
Less ReturnLess Risk
More ReturnMore Risk
Less ReturnMore Risk
London Co. Small CapAberdeen US Small Cap Equity InstClearBridge Small Cap IEaton Vance Small-Cap IGoldman Sachs Small Cap Eq Insghts InstlJPMorgan Small Cap Blend ARussell 2000 ValueRussell 2000
ROR Std Dev Pop Alpha Beta R-Squared0.51 19.65 -3.25 0.79 0.898.48 21.37 4.23 0.87 0.893.69 25.66 -0.16 1.08 0.965.81 18.70 1.76 0.78 0.944.28 23.42 0.10 1.00 0.999.48 24.03 5.36 0.96 0.881.26 23.24 -2.61 0.97 0.954.29 23.28 0.00 1.00 1.00
Risk Benchmark Used for this Analysis: Russell 2000
Modern Portfolio Theory (MPT) attempts to quantify the relationship between risk and return and operates under the assumption that an investor must becompensated for assuming risk. The measure of Alpha, Beta, and R-Squared are used to describe the value-added (Alpha), the volatility (Beta), and thepredictability (R-Squared) of the manager’s performance to a stated index’s performance.
9

7-Year Risk Return Analysis June 2020
0 5 10 15 20 25STANDARD DEVIATION
-4
1
6
11
16
RAT
E O
F R
ETU
RN
90 Day U.S. Treasury Bill
Russell 2000
More ReturnLess Risk
Less ReturnLess Risk
More ReturnMore Risk
Less ReturnMore Risk
London Co. Small CapAberdeen US Small Cap Equity InstClearBridge Small Cap IEaton Vance Small-Cap IGoldman Sachs Small Cap Eq Insghts InstlJPMorgan Small Cap Blend ARussell 2000 ValueRussell 2000
ROR Std Dev Pop Alpha Beta R-Squared3.53 17.51 -2.19 0.77 0.83
11.07 18.97 4.32 0.87 0.906.70 22.36 -0.32 1.05 0.958.99 16.99 2.74 0.79 0.937.21 20.84 0.12 1.00 0.98
11.24 21.36 4.27 0.96 0.873.98 20.61 -2.69 0.98 0.957.17 20.62 0.00 1.00 1.00
Risk Benchmark Used for this Analysis: Russell 2000
Modern Portfolio Theory (MPT) attempts to quantify the relationship between risk and return and operates under the assumption that an investor must becompensated for assuming risk. The measure of Alpha, Beta, and R-Squared are used to describe the value-added (Alpha), the volatility (Beta), and thepredictability (R-Squared) of the manager’s performance to a stated index’s performance.
10

10-Year Risk/Return Analysis June 2020
0 5 10 15 20 25STANDARD DEVIATION
-4
1
6
11
16
RAT
E O
F R
ETU
RN
90 Day U.S. Treasury Bill
Russell 2000
More ReturnLess Risk
Less ReturnLess Risk
More ReturnMore Risk
Less ReturnMore Risk
London Co. Small CapAberdeen US Small Cap Equity InstClearBridge Small Cap IEaton Vance Small-Cap IGoldman Sachs Small Cap Eq Insghts InstlJPMorgan Small Cap Blend ARussell 2000 ValueRussell 2000
ROR Std Dev Pop Alpha Beta R-Squared9.68 18.24 0.89 0.81 0.85
12.98 20.11 2.88 0.93 0.928.52 22.15 -1.77 1.04 0.94
10.63 18.22 1.36 0.85 0.9310.47 20.68 0.10 0.99 0.9813.89 22.18 3.26 1.02 0.907.82 20.55 -2.14 0.98 0.96
10.50 20.68 0.00 1.00 1.00
Risk Benchmark Used for this Analysis: Russell 2000
Modern Portfolio Theory (MPT) attempts to quantify the relationship between risk and return and operates under the assumption that an investor must becompensated for assuming risk. The measure of Alpha, Beta, and R-Squared are used to describe the value-added (Alpha), the volatility (Beta), and thepredictability (R-Squared) of the manager’s performance to a stated index’s performance.
11

Annualized Alpha
2019 2018 2017 2016 2015 2014 2013 2012 2011 2010-20
0
20
40
ALPH
A
London Co. Small CapAberdeen US Small Cap Equity InstClearBridge Small Cap IEaton Vance Small-Cap IGoldman Sachs Small Cap Eq Insghts InstlJPMorgan Small Cap Blend ARussell 2000 ValueRussell 2000
2019 2018 2017 2016 2015 2014 2013 2012 2011 20103.49 1.02 -7.09 -2.16 -1.92 -2.84 -6.21 8.48 11.22 1.120.35 -3.36 -4.44 8.19 12.52 2.94 3.14 -0.59 -1.51 1.783.57 1.96 -0.38 7.28 -0.13 3.72 2.83 3.43 -12.89 -2.737.01 4.35 3.88 3.60 1.35 -0.23 1.72 -1.66 -1.94 2.240.46 1.72 -3.01 1.35 2.90 2.06 -4.91 -2.94 3.56 2.694.69 8.87 31.80 -13.01 3.90 -5.25 14.31 -4.58 1.43 5.55-2.39 -3.25 -8.82 9.54 -3.82 -0.51 -2.67 2.46 -1.64 -2.020.00 0.00 0.00 0.00 0.00 0.00 0.00 0.00 0.00 0.00
PERIODS ENDING DECEMBER 31, 2019
Rolling 3-Year Alpha
6/2017-6/2020 6/2016-6/2019 6/2015-6/2018 6/2014-6/2017 6/2013-6/2016 6/2012-6/2015 6/2011-6/2014 6/2010-6/2013-12
-6
0
6
12
ALPH
A
London Co. Small CapAberdeen US Small Cap Equity InstClearBridge Small Cap IEaton Vance Small-Cap IGoldman Sachs Small Cap Eq Insghts InstlJPMorgan Small Cap Blend ARussell 2000 ValueRussell 2000
6/2017-6/2020 6/2016-6/2019 6/2015-6/2018 6/2014-6/2017 6/2013-6/2016 6/2012-6/2015 6/2011-6/2014 6/2010-6/20130.07 -3.55 -5.71 -4.82 -0.62 4.84 4.98 8.003.41 -3.28 3.07 6.40 9.55 4.43 0.31 -0.71-3.20 1.29 1.93 3.24 3.15 1.74 -1.61 -4.402.78 4.77 1.60 1.07 2.62 2.16 -0.75 -1.87-0.34 0.16 1.67 0.93 1.81 -0.56 -1.17 -0.408.58 10.14 4.47 1.62 -2.91 0.77 -3.39 0.24-6.07 -2.17 0.36 -0.13 -0.26 -1.37 0.71 -0.330.00 0.00 0.00 0.00 0.00 0.00 0.00 0.00
PERIODS ENDING JUNE 30, 2020
Alpha is a risk-adjusted measure of the active return on an investment manager. It is the additional return for taking on more or less risk relative to abenchmark index.
This graph illustrates the consistency of the investment managers' risk-adjusted outperformance/underperformance relative to the assigned benchmarkindex.
12

Growth of an Investment
6/2010 12/2010 6/2011 12/2011 6/2012 12/2012 6/2013 12/2013 6/2014 12/2014 6/2015 12/2015 6/2016 12/2016 6/2017 12/2017 6/2018 12/2018 6/2019 12/2019 6/2020500
1,0001,5002,0002,5003,0003,5004,000
DO
LLAR
S ($
)
London Co. Small CapAberdeen US Small Cap Equity InstClearBridge Small Cap IEaton Vance Small-Cap IGoldman Sachs Small Cap Eq Insghts InstlJPMorgan Small Cap Blend ARussell 2000 ValueRussell 2000
Year To Date 1 Year 3 Years 5 Years 7 Years 10 Years844 901 1,069 1,026 1,275 2,518988 1,062 1,177 1,502 2,086 3,388757 825 949 1,199 1,575 2,266883 917 1,163 1,326 1,827 2,747833 897 1,049 1,233 1,628 2,706923 998 1,362 1,573 2,108 3,673765 825 875 1,064 1,315 2,123870 934 1,061 1,234 1,624 2,714
JUNE 30, 2010 TO JUNE 30, 2020
Rolling 3-Year Returns
6/2017-6/2020 6/2016-6/2019 6/2015-6/2018 6/2014-6/2017 6/2013-6/2016 6/2012-6/2015 6/2011-6/2014 6/2010-6/2013-10
0
10
20
30
RAT
E O
F R
ETU
RN
London Co. Small CapAberdeen US Small Cap Equity InstClearBridge Small Cap IEaton Vance Small-Cap IGoldman Sachs Small Cap Eq Insghts InstlJPMorgan Small Cap Blend ARussell 2000 ValueRussell 2000
6/2017-6/2020 6/2016-6/2019 6/2015-6/2018 6/2014-6/2017 6/2013-6/2016 6/2012-6/2015 6/2011-6/2014 6/2010-6/20132.24 7.04 3.54 0.60 4.89 17.09 18.23 25.475.57 8.21 11.80 12.42 15.72 20.45 15.05 17.55-1.74 13.17 11.91 10.12 9.62 18.06 12.11 12.895.17 15.55 10.33 7.16 8.88 18.19 12.11 14.551.62 12.22 12.74 8.15 8.72 16.22 13.34 18.45
10.84 22.59 16.11 9.31 4.67 19.58 12.13 20.33-4.35 9.81 11.22 7.02 6.36 15.50 14.65 17.332.01 12.30 10.96 7.36 7.09 17.81 14.57 18.67
PERIODS ENDING JUNE 30, 2020
This chart illustrates the hypothetical value of a $1,000 investment in the investment managers' portfolio through various periods of time.
This chart depicts the trailing 3-year returns of the investment managers. The 36-month window is rolled back by 12 months in each column. This charthelps determine the consistency of the investment managers' returns.
13

Multi-Statistic Quartile Ranking Bar PSN Small Cap Core
-15
-10
-5
0
5
10
15
20
25
0.5
0.6
0.7
0.8
0.9
1.0
1.1
-20
-15
-10
-5
0
5
10
15
20 5
10
15
20
25
30
35
-10
-5
0
5
10
15
20
25 -0.5
0.5
HIGH (1.00)FIRST QUARTMEDIANTHIRD QUARTLOW (0.00)MEANVALID COUNT
ROR16.229.408.116.40-6.827.94139
R-Squared1.000.970.960.930.670.95139
Alpha10.152.441.23-0.45-11.981.01139
Std Dev Pop14.5419.2220.6221.6328.0220.46139
Tracking Error Pop0.023.514.435.79
16.304.85139
Batting Avg1.000.610.540.460.290.54139
London Co. Small CapAberdeen US Small Cap EquiClearBridge Small Cap IEaton Vance Small-Cap IGoldman Sachs Small Cap EJPMorgan Small Cap Blend ARussell 2000 ValueRussell 2000
VALUE RANK3.53 97
11.07 116.70 728.99 307.21 64
11.24 73.98 957.17 64
VALUE RANK0.83 970.90 890.95 610.93 790.98 70.87 920.95 571.00 1
VALUE RANK-2.19 934.32 9-0.32 742.74 190.12 644.27 10-2.69 940.00 67
VALUE RANK17.51 1118.97 2322.36 8816.99 820.84 5421.36 7020.61 5020.62 50
VALUE RANK8.64 956.67 865.28 686.30 812.67 67.80 914.60 530.00 1
VALUE RANK0.43 810.71 50.57 330.61 200.50 590.71 50.36 970.00 99
JUNE 30, 2013 TO JUNE 30, 2020
Modern Portfolio Theory (MPT) attempts to quantify the relationship between risk and return and operates under the assumption that an investor must becompensated for assuming risk. The measure of Alpha, Beta, and R-Squared are used to describe the value-added (Alpha), the volatility (Beta), and thepredictability (R-Squared) of the manager’s performance to a stated index’s performance.
Note: If the R-Squared is less than 0.80, the relationship between the manager and the index is less reliable.
14

Product Comparison
Thomas McShane
Institutional Consulting Director
Morgan Stanley
Wilmette Fire & Police
Pension Funds
LZEMX TWMIX RNWGX CEMIX JEMSX
10/14/20
PREPAPP RED BY:YY PREPAPP RED FOR:
PRODUCTS:
REPORT DATAA E:
The Compare Products Tool universe includes all open-end mutual funds and exchange traded funds (ETF’s) only. Closed-end mutual funds andmoney market funds are not re!ected with in the products universe.
The comparisons and other information generated by the Compare Products Tool while based on historical performance are hypothetical innature, and do not re!ect actual investment results, as the information does not take into account fees and expenses, such as commissions,exchange fees, and other non-recurring charges. Nor do investment results take into account an investor’s actual taxes. Had these costs beenincluded, actual investment results would have been lower. Investment results also do not re!ect the opportunity for fee waivers and discounts.The results shown should not be considered a recommendation to invest in any particular security. Before making an investment, "nancialprofessionals should make a suitability determination, and consider such factors such as a client’s investment objectives, risk tolerance,circumstances, and the impact of taxes. Past performance is no guarantee of future results. Results of the tool may vary with each use and overtime. Investing involves risk and the value of every investment will !uctuate over time. Investors may lose money.
All data supplied through the Compare Products tool is provided by Morningstar. While Vanguard believes that the data supplied byMorningstar is reliable, it does not review the information and cannot guarantee or warrant it to be accurate, complete, or timely. Vanguard isnot responsible for any damages or losses arising from the use of any Morningstar or third party information.
For more information regarding risks, benchmarks, and other important disclosures please read Footnotes, Calculation Methodology,Disclosures, and Glossary sections at the end of this report.

Compare Products | 1Overview
Key facts
GrossExpenseRatio*
MorningstarCategory Benchmark SEC Yield1 Total Net
Assets**InvestmentStyle Inception Date
1.08%
Diversi"ed
Emerging
Mkts
MSCI EM NR USD — $4.1 B Active 7/15/1994
1.25%
Diversi"ed
Emerging
Mkts
MSCI EM NR USD — $2.7 B Active 9/30/1997
0.60%
Diversi"ed
Emerging
Mkts
MSCI ACWI NR
USD0.61% $47.5 B Active 5/1/2009
1.16%
Diversi"ed
Emerging
Mkts
MSCI EM GR USD — $3.4 B Active 3/29/2007
1.09%
Diversi"ed
Emerging
Mkts
MSCI EM NR USD — $11.4 B Active 9/10/2001
* Gross expense ratio as of each product's most recent prospectus date.
** Total net assets as of previous month end.
All data supplied through the Compare Products tool is provided by Morningstar. While Vanguard believes that the data supplied by Morningstar is reliable, it does not review the information and cannot guarantee or warrant it to be accurate, complete, ortimely. Vanguard is not responsible for any damages or losses arising from the use of any Morningstar or third party information.
For more information regarding risks, benchmarks, and other important disclosures please read Footnotes, Calculation Methodology, Disclosures, and Glossary sections at the end of this report.
Product
Lazard Emerging Markets
Equity Instl (LZEMX)
American Century Emerging
Markets Inv (TWMIX)
American Funds New World
R6 (RNWGX)
Causeway Emerging Markets
Instl (CEMIX)
JPMorgan Emerging Markets
Equity I (JEMSX)

Compare Products | 2Composition
Asset allocation2
as of 9/30/2020
Stock Bond Short-TermReserves
98.66% 0.00% 1.34%
99.95% 0.0% 0.05%
91.85% 3.37% 4.78%
94.86% 1.52% 3.62%
98.84% 0.0% 1.16%
Global exposure3
as of 9/30/2020
U.S. Markets Non-U.S.Markets
EmergingMarkets
0.84% 29.49% 69.67%
1.46% 24.07% 74.47%
23.53% 32.77% 43.70%
0.71% 30.67% 68.62%
3.89% 25.65% 70.46%
Asset Allocation and Diversi"cation cannot guarantee a pro"t or prevent against a loss.
All data supplied through the Compare Products tool is provided by Morningstar. While Vanguard believes that the data supplied by Morningstar is reliable, it does not review the information and cannot guarantee or warrant it to be accurate, complete, ortimely. Vanguard is not responsible for any damages or losses arising from the use of any Morningstar or third party information.
For more information regarding risks, benchmarks, and other important disclosures please read Footnotes, Calculation Methodology, Disclosures, and Glossary sections at the end of this report.
Product
Lazard Emerging Markets Equity Instl
(LZEMX) (Portfolio date 9/30/2020)
American Century Emerging Markets Inv
(TWMIX) (Portfolio date 6/30/2020)
American Funds New World R6 (RNWGX)
(Portfolio date 6/30/2020)
Causeway Emerging Markets Instl (CEMIX)
(Portfolio date 6/30/2020)
JPMorgan Emerging Markets Equity I
(JEMSX) (Portfolio date 8/31/2020)
Product
Lazard Emerging Markets Equity Instl (LZEMX)
(Portfolio date 9/30/2020)
American Century Emerging Markets Inv
(TWMIX) (Portfolio date 6/30/2020)
American Funds New World R6 (RNWGX)
(Portfolio date 6/30/2020)
Causeway Emerging Markets Instl (CEMIX)
(Portfolio date 6/30/2020)
JPMorgan Emerging Markets Equity I (JEMSX)
(Portfolio date 8/31/2020)

Compare Products | 3Composition
Regional exposure3
as of 9/30/2020
LZEMX TWMIX RNWGX CEMIX JEMSX
0.84% 1.46% 23.53% 0.71% 3.89%
6.70% 4.62% 2.05% 1.52% 1.90%
24.63% 24.07% 6.92% 28.91% 24.39%
43.05% 55.89% 27.99% 50.65% 54.47%
0.00% 0.00% 0.50% 0.00% 0.00%
0.00% 0.00% 0.80% 0.00% 0.00%
10.37% 5.38% 1.69% 7.00% 2.16%
0.00% 0.00% 4.57% 0.00% 0.00%
3.12% 0.00% 12.09% 1.72% 1.26%
0.00% 0.00% 4.48% 0.00% 0.00%
9.40% 8.58% 11.97% 8.55% 11.94%
0.24% 0.00% 0.32% 0.94% 0.00%
0.00% 0.00% 0.00% 0.00% 0.00%
1.65% 0.00% 3.08% 0.00% 0.00%
9/30/2020 6/30/2020 6/30/2020 6/30/2020 8/31/2020
Asset Allocation and Diversi"cation cannot guarantee a pro"t or prevent against a loss.
All data supplied through the Compare Products tool is provided by Morningstar. While Vanguard believes that the data supplied by Morningstar is reliable, it does not review the information and cannot guarantee or warrant it to be accurate, complete, ortimely. Vanguard is not responsible for any damages or losses arising from the use of any Morningstar or third party information.
For more information regarding risks, benchmarks, and other important disclosures please read Footnotes, Calculation Methodology, Disclosures, and Glossary sections at the end of this report.
Region
United States
Africa
Asia - Developed
Asia - Emerging
Australasia
Canada
Europe - Emerging
Europe - Ex Euro
Eurozone
Japan
Latin America
Middle East
Not Classi"ed
United Kingdom
Portfolio date

Composition
Country exposure3
as of 9/30/2020
Compare Products | 4
China 22.36% China 44.43% United States 22.71% China 39.02% China 35.84%
South Korea 15.77% Taiwan 12.62% China 18.09% South Korea 13.77% India 16.63%
India 15.18% South Korea 11.45% Brazil 10.68% Taiwan 13.70% Brazil 9.94%
Russia 8.59% Brazil 6.47% India 7.59% India 7.67% Hong Kong 8.13%
Taiwan 7.65% India 6.30% France 4.92% Brazil 6.13% Taiwan 7.04%
South Africa 5.45% South Africa 4.04% Japan 4.32% Russia 5.78% South Korea 4.96%
Mexico 5.03% Russia 3.16% United Kingdom 2.97% United States 2.28% United States 3.89%
Brazil 4.32% Thailand 1.84% Hong Kong 2.75% Mexico 1.75% Singapore 3.17%
Indonesia 3.98% Mexico 1.68% Switzerland 2.70% Ireland 1.69% Indonesia 2.00%
Netherlands 2.18% United States 1.46% Netherlands 2.37% South Africa 1.49% Mexico 1.60%
% of total net assets 100.00% % of total net assets 100.00% % of total net assets 100.00% % of total net assets 100.00% % of total net assets 100.00%
Portfolio date 9/30/2020 Portfolio date 6/30/2020 Portfolio date 6/30/2020 Portfolio date 6/30/2020 Portfolio date 8/31/2020
LZEMX TWMIX RNWGX CEMIX JEMSX
Asset Allocation and Diversi"cation cannot guarantee a pro"t or prevent against a loss.
All data supplied through the Compare Products tool is provided by Morningstar. While Vanguard believes that the data supplied by Morningstar is reliable, it does not review the information and cannot guarantee or warrant it to be accurate, complete, ortimely. Vanguard is not responsible for any damages or losses arising from the use of any Morningstar or third party information.
For more information regarding risks, benchmarks, and other important disclosures please read Footnotes, Calculation Methodology, Disclosures, and Glossary sections at the end of this report.
Rank
1
2
3
4
5
6
7
8
9
10

Composition
Style analysis
LZEMX
Value Blend Growth
As of 9/30/2020
TWMIX
Value Blend Growth
As of 6/30/2020
RNWGX
Value Blend Growth
As of 6/30/2020
CEMIX
Value Blend Growth
As of 6/30/2020
JEMSX
Value Blend Growth
As of 8/31/2020
Compare Products | 5
Equity style 0—10% 10—25% 25—50% >50%S
ma
ll
Mid
L
arg
e
50 31 1
8 5 2
2 1 0S
ma
ll
Mid
L
arg
e
13 33 41
1 5 7
0 0 0
Sm
all
Mid
L
arg
e
10 28 49
3 2 7
0 0 0
Sm
all
Mid
L
arg
e
37 26 26
7 1 2
0 1 0
Sm
all
Mid
L
arg
e
8 33 49
0 2 7
1 0 0
Equity Style Box: The vertical axis of the Equity Style Box de"nes three size categories, or capitalization bands-small, mid-size, and large. The horizontal axis de"nes three style categories. Two of these categories, “value” and “growth,” are common toboth stocks and funds. However, for stocks, the central column of the style box represents the core style (those stocks for which neither value nor growth characteristics dominate); for funds, it represents the blend style (a mixture of growth and valuestocks or mostly core stocks).
Fixed Income Style Box: The Fixed Income style box is based on the two pillars of "xed-income performance: interest-rate sensitivity and credit quality. As depicted in the image below, the three interest sensitivity groups are limited, moderate andextensive and the three credit quality groups are high, medium and low. These groupings display a portfolio’s effective duration and third party credit ratings to provide an overall representation of the fund’s risk orientation given the sensitivity to interestrate and credit rating of bonds in the portfolio.
Asset Allocation and Diversi"cation cannot guarantee a pro"t or prevent against a loss.
All data supplied through the Compare Products tool is provided by Morningstar. While Vanguard believes that the data supplied by Morningstar is reliable, it does not review the information and cannot guarantee or warrant it to be accurate, complete, ortimely. Vanguard is not responsible for any damages or losses arising from the use of any Morningstar or third party information.
For more information regarding risks, benchmarks, and other important disclosures please read Footnotes, Calculation Methodology, Disclosures, and Glossary sections at the end of this report.

Compare Products | 6Composition
Equity characteristicsas of 9/30/2020
SEC Yield1 AverageMarket Cap
P/B P/E # of Securities % Top 10
— $25.4 B 1.2x 11.5x 71 29.62
— $45.0 B 2.3x 18.9x 83 40.11
0.61% $50.3 B 2.5x 25.5x 384 18.17
— $51.2 B 1.1x 11.8x 112 37.99
— $67.3 B 3.7x 26.6x 65 38.53
All data supplied through the Compare Products tool is provided by Morningstar. While Vanguard believes that the data supplied by Morningstar is reliable, it does not review the information and cannot guarantee or warrant it to be accurate, complete, ortimely. Vanguard is not responsible for any damages or losses arising from the use of any Morningstar or third party information.
For more information regarding risks, benchmarks, and other important disclosures please read Footnotes, Calculation Methodology, Disclosures, and Glossary sections at the end of this report.
Product
Lazard Emerging Markets Equity Instl
(LZEMX) (Portfolio date 9/30/2020)
American Century Emerging Markets
Inv (TWMIX) (Portfolio date 6/30/2020)
American Funds New World R6
(RNWGX) (Portfolio date 6/30/2020)
Causeway Emerging Markets Instl
(CEMIX) (Portfolio date 6/30/2020)
JPMorgan Emerging Markets Equity I
(JEMSX) (Portfolio date 8/31/2020)

Compare Products | 7Composition
Equity sector exposureas of 9/30/2020
LZEMX TWMIX RNWGX CEMIX JEMSX
9.44% 3.09% 6.00% 6.44% 0.43%
10.51% 14.00% 12.71% 16.69% 11.41%
7.54% 15.87% 12.68% 13.97% 21.72%
6.21% 10.33% 6.81% 6.48% 13.57%
7.41% 2.16% 4.29% 6.53% 2.03%
25.19% 15.91% 16.19% 18.73% 23.09%
1.86% 2.54% 14.04% 2.87% 3.74%
4.99% 4.88% 6.21% 3.36% 3.76%
1.04% 4.69% 2.08% 2.22% —
24.26% 25.40% 16.86% 22.29% 19.48%
1.54% 1.12% 2.12% 0.42% 0.77%
9/30/2020 6/30/2020 6/30/2020 6/30/2020 8/31/2020
Asset Allocation and Diversi"cation cannot guarantee a pro"t or prevent against a loss.
All data supplied through the Compare Products tool is provided by Morningstar. While Vanguard believes that the data supplied by Morningstar is reliable, it does not review the information and cannot guarantee or warrant it to be accurate, complete, ortimely. Vanguard is not responsible for any damages or losses arising from the use of any Morningstar or third party information.
For more information regarding risks, benchmarks, and other important disclosures please read Footnotes, Calculation Methodology, Disclosures, and Glossary sections at the end of this report.
Sector (as of 9/30/2020)
Basic Materials
Communication Services
Consumer Cyclical
Consumer Defensive
Energy
Financial Services
Health Care
Industrials
Real Estate
Technology
Utilities
Portfolio date

Overview
Top 10 holdingsas of 9/30/2020
Compare Products | 11
Samsung Electronics Co Ltd 4.76% Tencent Holdings Ltd 8.43% Microsoft Corp 2.67% Tencent Holdings Ltd 8.05%Alibaba Group Holding Ltd ADR
6.91%
SK Hynix Inc 3.57%Alibaba Group Holding Ltd ADR
7.30%Tencent Holdings Ltd 2.40%
Alibaba Group Holding Ltd ADR
6.77%
Taiwan Semiconductor
Manufacturing Co Ltd ADR
6.57%
China Construction Bank Corp Class
H
3.38%
Taiwan Semiconductor
Manufacturing Co Ltd
6.68%
Reliance Industries Ltd 2.00% Samsung Electronics Co Ltd 5.42% Tencent Holdings Ltd 4.33%
Taiwan Semiconductor
Manufacturing Co Ltd
3.01%
Samsung Electronics Co Ltd 4.77%
Alibaba Group Holding Ltd Ordinary
Shares
1.89%
Taiwan Semiconductor
Manufacturing Co Ltd ADR
4.89%
Samsung Electronics Co Ltd 3.58%
Sberbank of Russia PJSC 2.82% Naspers Ltd Class N 2.99% MercadoLibre Inc 1.84%
China Construction Bank Corp Class
H
3.11%
EPAM Systems Inc 3.39%
iShares Core MSCI Emerging
Markets ETF
2.57%
GDS Holdings Ltd ADR 2.23% Kweichow Moutai Co Ltd 1.66%
MSCI Emerging Markets Index
Future Sept 20
2.77%
Sea Ltd ADR 3.13%
Vanguard FTSE Emerging Markets
ETF
2.54%
HDFC Bank Ltd 2.19% Kotak Mahindra Bank Ltd 1.64% JD.com Inc ADR 1.85% Meituan Dianping 2.87%
Infosys Ltd ADR 2.47% Chailease Holding Co Ltd 1.92% Facebook Inc A 1.48% Future on MSCI China A 1.82%
WuXi Biologics (Cayman) Inc
Registered Shs Unitary 144A/Reg S
2.67%
HCL Technologies Ltd 2.34%
China Construction Bank Corp Class
H
1.90%
Taiwan Semiconductor
Manufacturing Co Ltd
1.33%
Ping An Insurance (Group) Co. of
China Ltd Class H
1.65%
AIA Group Ltd 2.56%
Unilever NV 2.15% TAL Education Group ADR 1.71% AIA Group Ltd 1.26% Reliance Industries Ltd 1.65% MercadoLibre Inc 2.51%
% of total net assets 29.62% % of total net assets 40.11% % of total net assets 18.17% % of total net assets 37.99% % of total net assets 38.53%
Portfolio date 9/30/2020 Portfolio date 6/30/2020 Portfolio date 6/30/2020 Portfolio date 6/30/2020 Portfolio date 8/31/2020
LZEMX TWMIX RNWGX CEMIX JEMSX
Asset Allocation and Diversi"cation cannot guarantee a pro"t or prevent against a loss.
All data supplied through the Compare Products tool is provided by Morningstar. While Vanguard believes that the data supplied by Morningstar is reliable, it does not review the information and cannot guarantee or warrant it to be accurate, complete, ortimely. Vanguard is not responsible for any damages or losses arising from the use of any Morningstar or third party information.
For more information regarding risks, benchmarks, and other important disclosures please read Footnotes, Calculation Methodology, Disclosures, and Glossary sections at the end of this report.
Rank
1
2
3
4
5
6
7
8
9
10

1
In regards to our upcoming meeting, Graystone Consulting will assist in the search and selection of an Emerging Market Equity Manager.
The search began with a list of over 70 investment managers that were filtered using the following criteria:
Qualitative Criteria
-Qualifications, depth, and stability of personnel.
-Construction of the investment philosophy and process.
-Consistency of the investment process implementation.
-Well-defined business plan. To arrive at a conclusion about a firm’s business plan, we assess the dedication to investment resources and evaluate
key growth plans and strategies.
-Capacity to accommodate new relationships.
Quantitative Criteria
-Magnitude and consistency of value-added performance.
-Amount of risk assumed in relation to an appropriate benchmark.
-Performance in adverse market conditions.
-Likelihood of significantly under performing a given market index.
We have reduced the full list of manager down to a manageable size.
Lazard Emerging Markets Equity Instl American Century Emerging Markets Inv American Funds New World R6 Causeway Emerging Markets Instl
JPMorgan Emerging Markets Equity I MSCI Emerging Markets Net

Calendar-Year Returns
PSN Intl Emerging MarketsYear To Date 2019 2018 2017 2016 2015 2014 2013 2012 2011 2010
HIGH (0.00) 46.89 49.51 -3.83 78.80 51.34 18.69 59.27 61.61 53.11 -1.72 96.27
FIRST QUARTILE -5.39 25.43 -12.88 43.28 14.39 -8.38 3.52 7.70 24.82 -14.64 27.22
MEDIAN -10.25 20.66 -15.30 37.26 10.28 -11.70 0.04 1.49 21.37 -17.29 22.79
THIRD QUARTILE -14.45 16.11 -18.00 31.65 5.65 -15.02 -2.52 -2.06 18.23 -20.59 19.33
LOW (1.00) -41.84 -7.06 -35.19 17.41 -17.18 -30.76 -34.32 -15.16 5.52 -42.17 -8.61
MEAN -9.82 20.55 -15.51 37.62 10.57 -11.45 1.08 4.03 21.99 -17.45 23.34
VALID COUNT 282 288 280 269 263 254 240 220 193 167 146
Lazard Emerging Markets Equity Instl
American Century Emerging Markets Inv
American Funds New World R6
Causeway Emerging Markets Instl
JPMorgan Emerging Markets Equity I
MSCI Emerging Markets Net
Year To Date 2019 2018 2017 2016 2015 2014 2013 2012 2011 2010
VALUE RANK VALUE RANK VALUE RANK VALUE RANK VALUE RANK VALUE RANK VALUE RANK VALUE RANK VALUE RANK VALUE RANK VALUE RANK
-21.37 92 18.04 64 -18.09 76 28.02 85 20.52 11 -20.16 94 -4.16 82 -0.80 66 22.36 40 -17.75 55 22.81 49
-6.85 28 21.94 43 -19.14 82 45.86 14 7.63 64 -8.29 24 -1.57 67 0.25 58 24.86 24 -21.60 82 17.85 82
-2.98 15 28.03 15 -11.97 18 33.06 70 4.31 80 -5.62 13 -3.29 79 10.46 14 20.22 62 -13.82 20 17.73 82
-10.43 51 16.73 71 -17.91 72 39.78 37 9.21 55 -16.05 84 2.07 34 -2.57 78 25.80 20 -18.11 59 26.29 25
-2.99 15 31.96 6 -16.02 56 42.49 27 13.24 31 -16.06 84 0.21 47 -5.35 91 18.83 73 -17.11 44 18.10 81
-9.78 46 18.44 63 -14.58 41 37.28 49 11.19 44 -14.92 73 -2.19 72 -2.60 80 18.22 75 -18.42 62 18.88 77
Annualized Returns June 2020
PSN Intl Emerging MarketsYear To Date 1 Year 3 Years 5 Years 7 Years 10 Years
HIGH (0.00) 46.89 73.98 20.90 16.42 19.58 12.00
FIRST QUARTILE -5.39 2.19 4.51 5.53 5.81 5.91
MEDIAN -10.25 -4.28 1.28 2.97 3.56 4.71
THIRD QUARTILE -14.45 -11.02 -1.60 1.09 2.30 3.45
LOW (1.00) -41.84 -44.90 -14.74 -7.33 -5.95 -3.10
MEAN -9.82 -3.63 1.51 3.30 4.10 4.61
VALID COUNT 282 281 263 244 220 145
Lazard Emerging Markets Equity Instl
American Century Emerging Markets Inv
American Funds New World R6
Causeway Emerging Markets Instl
JPMorgan Emerging Markets Equity I
MSCI Emerging Markets Net
Year To Date 1 Year 3 Years 5 Years 7 Years 10 Years
VALUE RANK VALUE RANK VALUE RANK VALUE RANK VALUE RANK VALUE RANK
-21.37 92 -15.93 88 -4.80 91 -1.10 93 -0.40 95 1.32 94
-6.85 28 0.51 28 3.08 32 4.20 35 5.07 34 5.20 36
-2.98 15 5.03 18 7.42 11 6.85 13 6.49 18 6.94 11
-10.43 51 -4.11 49 0.16 61 1.20 73 2.74 70 4.18 56
-2.99 15 5.51 17 7.83 10 8.03 7 6.04 22 5.50 31
-9.78 46 -3.39 45 1.90 43 2.86 51 3.22 57 3.27 77
2

Style Quadrants
Current Vs. 10 Year
-1 0 1
-1
0
1
STYLE SUMMARY
S&P Dev X US SCV
S&P Dev X US LMCV S&P Dev X US LMCG
S&P Dev X US SCG
-1 0 1
-1
0
1
STYLE HISTORY
S&P Dev X US SCV
S&P Dev X US LMCV S&P Dev X US LMCG
S&P Dev X US SCG
Lazard Emerging Markets Equity Instl American Century Emerging Markets Inv American Funds New World R6 Causeway Emerging Markets Instl
JPMorgan Emerging Markets Equity I MSCI Emerging Markets Net

3 Year Capture Ratios
June 2020
-6 19 44 69 94 119 144
DOWNSIDE CAPTURE RATIO
4
29
54
79
104
129
154
UP
SID
E C
AP
TU
RE
RA
TIO
90 Day U.S. Treasury Bill
MSCI Emerging Markets Net
Outperforms inPos. & Neg. Qtrs.
Underperforms in Pos. Qtrs.Outperforms in Neg. Qtrs.
Underperforms in Neg. Qtrs.Outperforms in Pos. Qtrs.
Underperforms inPos. & Neg. Qtrs.
Lazard Emerging Markets Equity Instl
American Century Emerging Markets Inv
American Funds New World R6
Causeway Emerging Markets Instl
JPMorgan Emerging Markets Equity I
MSCI Emerging Markets Net
Up Mkt Capt Retrn Up Cap Ratio Dnside Cap Return Dnside Cap Ratio R-Squared
30.74 84.93 -38.93 121.23 0.94
42.26 116.78 -34.34 106.94 0.96
41.94 115.89 -27.28 84.96 0.94
35.41 97.84 -34.34 106.92 0.99
47.20 130.41 -30.26 94.22 0.96
36.19 100.00 -32.11 100.00 1.00
Risk Benchmark Used for this Analysis: MSCI Emerging Markets Net
Capture Ratio is the ratio of the manager’s overall performance relative to the overall performance of the benchmark. Up Capture Ratio considers onlythose time periods that are zero or positive for the benchmark. In evaluating Up Capture Ratio, higher values are more favorable. Down Capture Ratioconsiders only those time periods that are negative for the benchmark. Lower values are more favorable in assessing Down Capture Ratio.
4

5 Year Capture Ratios
June 2020
-29 -4 21 46 71 96 121
DOWNSIDE CAPTURE RATIO
3
28
53
78
103
128
UP
SID
E C
AP
TU
RE
RA
TIO
90 Day U.S. Treasury Bill
MSCI Emerging Markets Net
Outperforms inPos. & Neg. Qtrs.
Underperforms in Pos. Qtrs.Outperforms in Neg. Qtrs.
Underperforms in Neg. Qtrs.Outperforms in Pos. Qtrs.
Underperforms inPos. & Neg. Qtrs.
Lazard Emerging Markets Equity Instl
American Century Emerging Markets Inv
American Funds New World R6
Causeway Emerging Markets Instl
JPMorgan Emerging Markets Equity I
MSCI Emerging Markets Net
Up Mkt Capt Retrn Up Cap Ratio Dnside Cap Return Dnside Cap Ratio R-Squared
27.96 91.72 -38.70 114.24 0.93
35.09 115.09 -35.66 105.26 0.96
31.99 104.92 -27.84 82.17 0.91
28.29 92.78 -34.85 102.87 0.98
38.89 127.55 -32.25 95.20 0.96
30.49 100.00 -33.88 100.00 1.00
Risk Benchmark Used for this Analysis: MSCI Emerging Markets Net
Capture Ratio is the ratio of the manager’s overall performance relative to the overall performance of the benchmark. Up Capture Ratio considers onlythose time periods that are zero or positive for the benchmark. In evaluating Up Capture Ratio, higher values are more favorable. Down Capture Ratioconsiders only those time periods that are negative for the benchmark. Lower values are more favorable in assessing Down Capture Ratio.
5

7- Year Market Capture Ratios
June 2020
-4 21 46 71 96 121
DOWNSIDE CAPTURE RATIO
-22
3
28
53
78
103
128
UP
SID
E C
AP
TU
RE
RA
TIO
90 Day U.S. Treasury Bill
MSCI Emerging Markets Net
Outperforms inPos. & Neg. Qtrs.
Underperforms in Pos. Qtrs.Outperforms in Neg. Qtrs.
Underperforms in Neg. Qtrs.Outperforms in Pos. Qtrs.
Underperforms inPos. & Neg. Qtrs.
Lazard Emerging Markets Equity Instl
American Century Emerging Markets Inv
American Funds New World R6
Causeway Emerging Markets Instl
JPMorgan Emerging Markets Equity I
MSCI Emerging Markets Net
Up Mkt Capt Retrn Up Cap Ratio Dnside Cap Return Dnside Cap Ratio R-Squared
23.86 92.58 -32.73 118.26 0.92
30.68 119.00 -29.03 104.92 0.95
27.49 106.66 -22.98 83.06 0.90
24.77 96.08 -27.58 99.67 0.98
29.07 112.76 -25.56 92.36 0.93
25.78 100.00 -27.67 100.00 1.00
Risk Benchmark Used for this Analysis: MSCI Emerging Markets Net
Capture Ratio is the ratio of the manager’s overall performance relative to the overall performance of the benchmark. Up Capture Ratio considers onlythose time periods that are zero or positive for the benchmark. In evaluating Up Capture Ratio, higher values are more favorable. Down Capture Ratioconsiders only those time periods that are negative for the benchmark. Lower values are more favorable in assessing Down Capture Ratio.
6

10- Year Market Capture Ratios
June 2020
-27 -2 23 48 73 98 123
DOWNSIDE CAPTURE RATIO
-23
2
27
52
77
102
127
UP
SID
E C
AP
TU
RE
RA
TIO
90 Day U.S. Treasury Bill
MSCI Emerging Markets Net
Outperforms inPos. & Neg. Qtrs.
Underperforms in Pos. Qtrs.Outperforms in Neg. Qtrs.
Underperforms in Neg. Qtrs.Outperforms in Pos. Qtrs.
Underperforms inPos. & Neg. Qtrs.
Lazard Emerging Markets Equity Instl
American Century Emerging Markets Inv
American Funds New World R6
Causeway Emerging Markets Instl
JPMorgan Emerging Markets Equity I
MSCI Emerging Markets Net
Up Mkt Capt Retrn Up Cap Ratio Dnside Cap Return Dnside Cap Ratio R-Squared
27.45 94.57 -30.89 107.45 0.94
33.85 116.63 -29.59 102.95 0.96
29.18 100.54 -21.95 76.37 0.92
30.76 105.97 -28.66 99.72 0.97
30.77 106.03 -26.24 91.28 0.95
29.02 100.00 -28.74 100.00 1.00
Risk Benchmark Used for this Analysis: MSCI Emerging Markets Net
Capture Ratio is the ratio of the manager’s overall performance relative to the overall performance of the benchmark. Up Capture Ratio considers onlythose time periods that are zero or positive for the benchmark. In evaluating Up Capture Ratio, higher values are more favorable. Down Capture Ratioconsiders only those time periods that are negative for the benchmark. Lower values are more favorable in assessing Down Capture Ratio.
7

3-Year Risk/Return Analysis
June 2020
0 5 10 15 20 25
STANDARD DEVIATION
-5
0
5
10
RA
TE
OF
RE
TU
RN
90 Day U.S. Treasury Bill
MSCI Emerging Markets Net
More ReturnLess Risk
Less ReturnLess Risk
More ReturnMore Risk
Less ReturnMore Risk
Lazard Emerging Markets Equity Instl
American Century Emerging Markets Inv
American Funds New World R6
Causeway Emerging Markets Instl
JPMorgan Emerging Markets Equity I
MSCI Emerging Markets Net
ROR Std Dev Pop Alpha Beta R-Squared
-4.80 22.87 -6.14 1.04 0.94
3.08 22.93 1.34 1.05 0.96
7.42 22.22 5.52 1.01 0.94
0.16 21.34 -1.70 0.99 0.99
7.83 23.53 6.04 1.08 0.96
1.90 21.35 0.00 1.00 1.00
Risk Benchmark Used for this Analysis: MSCI Emerging Markets Net
Modern Portfolio Theory (MPT) attempts to quantify the relationship between risk and return and operates under the assumption that an investor must becompensated for assuming risk. The measure of Alpha, Beta, and R-Squared are used to describe the value-added (Alpha), the volatility (Beta), and thepredictability (R-Squared) of the manager’s performance to a stated index’s performance.
8

5-Year Risk/Return Analysis
June 2020
0 5 10 15 20 25
STANDARD DEVIATION
-2
3
8
RA
TE
OF
RE
TU
RN
90 Day U.S. Treasury Bill
MSCI Emerging Markets Net
More ReturnLess Risk
Less ReturnLess Risk
More ReturnMore Risk
Less ReturnMore Risk
Lazard Emerging Markets Equity Instl
American Century Emerging Markets Inv
American Funds New World R6
Causeway Emerging Markets Instl
JPMorgan Emerging Markets Equity I
MSCI Emerging Markets Net
ROR Std Dev Pop Alpha Beta R-Squared
-1.10 21.12 -3.56 1.03 0.93
4.20 20.91 1.38 1.03 0.96
6.85 19.19 3.99 0.92 0.91
1.20 19.85 -1.60 0.99 0.98
8.03 21.28 5.10 1.05 0.96
2.86 19.87 0.00 1.00 1.00
Risk Benchmark Used for this Analysis: MSCI Emerging Markets Net
Modern Portfolio Theory (MPT) attempts to quantify the relationship between risk and return and operates under the assumption that an investor must becompensated for assuming risk. The measure of Alpha, Beta, and R-Squared are used to describe the value-added (Alpha), the volatility (Beta), and thepredictability (R-Squared) of the manager’s performance to a stated index’s performance.
9

7-Year Risk Return Analysis
June 2020
0 5 10 15 20
STANDARD DEVIATION
-1
0
1
2
3
4
5
6
7
RA
TE
OF
RE
TU
RN
90 Day U.S. Treasury Bill
MSCI Emerging Markets Net
More ReturnLess Risk
Less ReturnLess Risk
More ReturnMore Risk
Less ReturnMore Risk
Lazard Emerging Markets Equity Instl
American Century Emerging Markets Inv
American Funds New World R6
Causeway Emerging Markets Instl
JPMorgan Emerging Markets Equity I
MSCI Emerging Markets Net
ROR Std Dev Pop Alpha Beta R-Squared
-0.40 18.71 -3.33 1.04 0.92
5.07 18.14 1.85 1.02 0.95
6.49 16.80 3.35 0.93 0.90
2.74 17.28 -0.44 0.99 0.98
6.04 18.44 2.77 1.03 0.93
3.22 17.25 0.00 1.00 1.00
Risk Benchmark Used for this Analysis: MSCI Emerging Markets Net
Modern Portfolio Theory (MPT) attempts to quantify the relationship between risk and return and operates under the assumption that an investor must becompensated for assuming risk. The measure of Alpha, Beta, and R-Squared are used to describe the value-added (Alpha), the volatility (Beta), and thepredictability (R-Squared) of the manager’s performance to a stated index’s performance.
10

10-Year Risk/Return Analysis
June 2020
0 5 10 15 20
STANDARD DEVIATION
0
1
2
3
4
5
6
7
RA
TE
OF
RE
TU
RN
90 Day U.S. Treasury Bill
MSCI Emerging Markets Net
More ReturnLess Risk
Less ReturnLess Risk
More ReturnMore Risk
Less ReturnMore Risk
Lazard Emerging Markets Equity Instl
American Century Emerging Markets Inv
American Funds New World R6
Causeway Emerging Markets Instl
JPMorgan Emerging Markets Equity I
MSCI Emerging Markets Net
ROR Std Dev Pop Alpha Beta R-Squared
1.32 19.56 -1.76 1.03 0.94
5.20 19.79 1.91 1.05 0.96
6.94 17.08 3.77 0.89 0.92
4.18 19.36 0.91 1.04 0.97
5.50 19.02 2.23 1.00 0.95
3.27 18.46 0.00 1.00 1.00
Risk Benchmark Used for this Analysis: MSCI Emerging Markets Net
Modern Portfolio Theory (MPT) attempts to quantify the relationship between risk and return and operates under the assumption that an investor must becompensated for assuming risk. The measure of Alpha, Beta, and R-Squared are used to describe the value-added (Alpha), the volatility (Beta), and thepredictability (R-Squared) of the manager’s performance to a stated index’s performance.
11

Annualized Alpha
2019 2018 2017 2016 2015 2014 2013 2012 2011 2010-8
-4
0
4
8
12
16
AL
PH
A
Lazard Emerging Markets Equity Instl
American Century Emerging Markets Inv
American Funds New World R6
Causeway Emerging Markets Instl
JPMorgan Emerging Markets Equity I
MSCI Emerging Markets Net
2019 2018 2017 2016 2015 2014 2013 2012 2011 2010
-0.11 -5.32 -7.49 8.99 -6.81 -0.98 2.12 3.35 -1.69 2.43
4.20 -6.91 9.09 -1.67 5.90 0.74 3.19 7.34 -0.10 -2.49
12.81 -1.87 11.42 -3.13 3.77 -1.95 12.78 6.52 1.04 1.27
-1.37 -3.85 -2.81 -1.67 -1.87 4.18 0.41 6.24 -0.02 5.65
12.92 -1.60 15.78 2.45 -5.53 3.04 -2.78 2.10 -0.46 -1.48
0.00 0.00 0.00 0.00 0.00 0.00 0.00 0.00 0.00 0.00
PERIODS ENDING DECEMBER 31, 2019
Rolling 3-Year Alpha
6/2017-6/2020 6/2016-6/2019 6/2015-6/2018 6/2014-6/2017 6/2013-6/2016 6/2012-6/2015 6/2011-6/2014 6/2010-6/2013-8
-6
-4
-2
0
2
4
6
AL
PH
A
Lazard Emerging Markets Equity Instl
American Century Emerging Markets Inv
American Funds New World R6
Causeway Emerging Markets Instl
JPMorgan Emerging Markets Equity I
MSCI Emerging Markets Net
6/2017-6/2020 6/2016-6/2019 6/2015-6/2018 6/2014-6/2017 6/2013-6/2016 6/2012-6/2015 6/2011-6/2014 6/2010-6/2013
-6.31 -2.90 -2.19 -2.52 0.00 -1.81 3.49 2.15
1.27 0.12 2.34 3.13 2.78 3.27 1.31 2.15
5.40 3.15 3.18 0.97 2.44 4.98 5.85 4.91
-1.72 -1.55 -1.38 -0.10 0.50 2.92 2.55 4.22
5.98 3.22 2.89 1.46 0.01 -1.28 0.85 1.05
0.00 0.00 0.00 0.00 0.00 0.00 0.00 0.00
PERIODS ENDING JUNE 30, 2020
Alpha is a risk-adjusted measure of the active return on an investment manager. It is the additional return for taking on more or less risk relative to abenchmark index.
This graph illustrates the consistency of the investment managers' risk-adjusted outperformance/underperformance relative to the assigned benchmarkindex.
12

Growth of an Investment
6/2010 12/2010 6/2011 12/2011 6/2012 12/2012 6/2013 12/2013 6/2014 12/2014 6/2015 12/2015 6/2016 12/2016 6/2017 12/2017 6/2018 12/2018 6/2019 12/2019 6/2020750
1,000
1,250
1,500
1,750
2,000
2,250D
OL
LA
RS
($
)
Lazard Emerging Markets Equity Instl
American Century Emerging Markets Inv
American Funds New World R6
Causeway Emerging Markets Instl
JPMorgan Emerging Markets Equity I
MSCI Emerging Markets Net
Year To Date 1 Year 3 Years 5 Years 7 Years 10 Years
786 841 863 946 972 1,140
932 1,005 1,095 1,228 1,414 1,660
970 1,050 1,239 1,393 1,553 1,956
896 959 1,005 1,062 1,208 1,506
970 1,055 1,254 1,471 1,507 1,709
902 966 1,058 1,151 1,249 1,380
JUNE 30, 2010 TO JUNE 30, 2020
Rolling 3-Year Returns
6/2017-6/2020 6/2016-6/2019 6/2015-6/2018 6/2014-6/2017 6/2013-6/2016 6/2012-6/2015 6/2011-6/2014 6/2010-6/2013-8
-4
0
4
8
12
16
RA
TE
OF
RE
TU
RN
Lazard Emerging Markets Equity Instl
American Century Emerging Markets Inv
American Funds New World R6
Causeway Emerging Markets Instl
JPMorgan Emerging Markets Equity I
MSCI Emerging Markets Net
6/2017-6/2020 6/2016-6/2019 6/2015-6/2018 6/2014-6/2017 6/2013-6/2016 6/2012-6/2015 6/2011-6/2014 6/2010-6/2013
-4.80 6.99 3.15 -1.60 -1.89 2.06 3.00 5.43
3.08 10.53 7.53 4.19 1.38 6.86 0.57 5.48
7.42 12.16 7.46 1.92 1.58 7.54 5.79 7.99
0.16 9.14 4.11 0.96 -1.04 6.73 1.99 7.63
7.83 14.33 8.23 2.42 -1.49 2.04 0.50 4.27
1.90 10.66 5.60 1.07 -1.56 3.71 -0.39 3.38
PERIODS ENDING JUNE 30, 2020
This chart illustrates the hypothetical value of a $1,000 investment in the investment managers' portfolio through various periods of time.
This chart depicts the trailing 3-year returns of the investment managers. The 36-month window is rolled back by 12 months in each column. This charthelps determine the consistency of the investment managers' returns.
13

Multi-Statistic Quartile Ranking Bar
PSN Intl Emerging Markets
-15
-10
-5
0
5
10
15
20
25
0.1
0.2
0.3
0.4
0.5
0.6
0.7
0.8
0.9
1.0
1.1
-15
-10
-5
0
5
10
15
20
25 5
10
15
20
25
30
35
-10
-5
0
5
10
15
20
25
30
35 -0.2
-0.1
0.0
0.1
0.2
0.3
0.4
0.5
0.6
0.7
0.8
0.9
1.0
1.1
HIGH (1.00)
FIRST QUART
MEDIAN
THIRD QUART
LOW (0.00)
MEAN
VALID COUNT
ROR
19.58
5.81
3.56
2.30
-5.95
4.10
220
R-Squared
1.00
0.96
0.93
0.87
0.26
0.89
220
Alpha
17.07
2.62
0.55
-0.67
-7.75
1.12
220
Std Dev Pop
12.28
17.39
18.29
19.79
29.62
18.72
220
Tracking Error Pop
0.18
3.59
5.26
7.42
25.62
6.08
220
Batting Avg
0.93
0.64
0.54
0.46
0.29
0.55
220
Lazard Emerging Markets Eq
American Century Emerging
American Funds New World
Causeway Emerging Markets
JPMorgan Emerging Markets
MSCI Emerging Markets Net
VALUE RANK
-0.40 95
5.07 34
6.49 18
2.74 70
6.04 22
3.22 57
VALUE RANK
0.92 55
0.95 36
0.90 65
0.98 12
0.93 47
1.00 1
VALUE RANK
-3.33 95
1.85 35
3.35 15
-0.44 73
2.77 23
0.00 63
VALUE RANK
18.71 60
18.14 46
16.80 14
17.28 22
18.44 54
17.25 20
VALUE RANK
5.22 50
4.22 38
5.34 53
2.67 9
4.80 47
0.00 1
VALUE RANK
0.39 93
0.61 28
0.50 60
0.50 60
0.57 38
0.00 99
JUNE 30, 2013 TO JUNE 30, 2020
Modern Portfolio Theory (MPT) attempts to quantify the relationship between risk and return and operates under the assumption that an investor must becompensated for assuming risk. The measure of Alpha, Beta, and R-Squared are used to describe the value-added (Alpha), the volatility (Beta), and thepredictability (R-Squared) of the manager’s performance to a stated index’s performance.
Note: If the R-Squared is less than 0.80, the relationship between the manager and the index is less reliable.
14

���������������� ������������������� �����������������������������������������
�� !"#$%&' %()!*&+� !,"%,&-$!. (/&0%1 2"#. !345�6
7" 89:��;
2<($8&�// (/=��>?@����
-/($!&'$( ,<!*��A���B�C�D������5E��
F %#G�$!.&HI&5J��D5����K�F %#G�$!.&LI&5J���J4��DM�K�����K�
-<!%"%,/($!&�%$8*/(&N$("%,���OP��P��
Q
-<!%"%,/($!&R"88$!/
S��T�� �A���
S�B�����T U
S��� �A���
S���� �A���
S��T U
-<!%"%,/($!&�%$8*/(&N$("%,
5�����������A��������������B��C�� ��C����B�A�E�����������V��T�������������� ��A���C����B��C����������������E�����������B�����A���������������������EP�CW���C� �����
�%$8*/(&N$("%,&XY #(!)�
Z [ \ Q ]
R"88$!&XY #(!)�
�V _��V��A��� �A��� � �A��A��� ���
:���
:���
:a��
:O��
b"/(<!"#$8&R!<c"8 N ()!%N"/.N$("%,
� �A��A�� �A��A�dddd� �A��A�
e e e e e e e e0%1 /(� %(&X(*8 Df����
g!<h(G&<c&iHjkjjj
��A������l������B���C��A������l������B_�T����E�:
m m n o o n m n p o nR !c<!�$%# &q)$!("8 rV������J������s
��:� ��:: ��:� ��:� ��:a ��:> ��:O ��:@ ��:t ��:? �?P�� b"/(<!*
t�?t @��a t�@? t�@t t�O: @�t? t�at :���� ?�?� :���: :��aa ��l:@�t> P�:�O� �a�tO ���> P:�>@ Pt��? @�O� a>�tO P:?�:a �:�?a a�?O 3�����������;P:��� P��:t O�O� ��t> ��O: O�O� P��>O t�>@ Pa�>@ ��>� O�:� uvP�_���E�:O�@� P@�?� t��� P:>��a ���? P��O� ��:� :t�OO Pa�?> ��a� :��a� uvP�_���E��
���� ���� ���� ���> ���> ���@ ��:� ���> ���a ��>t :�:? ��T���������;:@�t> P�:�O� �a�tO P��:: P:�?� Pt��@ @�a? a>�>: P:?��? �:��O ��@@ J�������������;
>t O> :� �> �O :a >> > @? �� �� 3���������;����E�J��
���� ���� ���� ���� ���� ���: ���: ���� ���� ���O ��:a ��T���=���� ���� ���� ���� ���� ���� ���� ���� ���O ���� ���� J�������w�����=
:�@� :�@: :�@a :�@� :�@� :�Ot :�O� :�>� :��? :��> :��O DM����������;P���� ��:@ ���? ��:@ ���? ���� ���� ��:? ��@: :�>? P���O ��T���������;t@ @: t> Ot @a >t >? a@ �O �? x 3����A������;
O:> a:t a@� a:: �@? a�� a@t ?O: ?�@ Oa� >at ���������=���
R !c<!�$%# ���?P��P��
:���y�� ��C�y�� ��C�y�� a���y�� 3����
��:O ��>O ��>@ t�ta PO�?� @�O���:@ :���t t�ta :��tO >�OO a>�tO��:t ��>� P?��� P>�>a P@�?: P:?�:a��:? ?�?@ ��@@ P��a� :��>t �:�?a���� P����� �:��� :��Ot U U
2!$"8"%, 3���������;
uvP�_���E:uvP�_���E
�;���EJ��w��V����B=:�����
��5� :��Ot ��:� O�a� :� ::��OtO�5� �O�@� @��� :���� �> :��O@�:�z� :O��@ >�>� :���@ �� ::�O�@��z���A� ���� ��O� :�tO �� :��?�>>�z���A� :��>� :�>� a��@ �� :O�a@O:��z���A� a�>� ���� ��>� :> :>�>Ot:>�z���A� O�>t ��@@ ��>� �@ �O����
2${&�%$8*/"/ 3�M��CW����; ;���E�J��3�MPJ�������;���E�J��
��z��r������Cs ��@� �@ ���� :@>�z��r������Cs :���> �� ���� :a:��z��r������Cs a��t ? ��:a O
S��������J�������w����DM�������:;��B������
N$("%,&$%9&N"/.
3��S���C
��CP�CW������;
5��������������A��J��
5�������������E�A��J��
5�������������EP�CW�������
:�z� :O��@��z� ���� u�A� �A�dddd>�z� :��>� u�A� �A�dddd:��z� a�>� u�A� u�A�dddd��T�� O�O�
|(G !&- $/)! / ���C��C���CM _���������CM
����� ��� ��@_�� :��? :����Pf���C t� ?>
���C��C��A������ :?��a5�� �������������� ��:@
R<!(c<8"<&�%$8*/"/���OP��P��2<($8&X(<#./I&}~����T��������T���P�:P�� T��� J������ ;������
�3�T�����C������C J����AT�J���� t�a����� � ��w�������C�����C J�����J�T J���� @����3��V�����T��C�T����5��� 3T������� 3��V�� O�Ot��������D�T�����T��J��� 3T������� ��������� a�@@��������C�J������ J����AT�������B��T� ��??
�w����C������C���� 3T������� J���� ������J�_��E��C ������AT� ��C�� ��:?
�J���������C����J���C ������AT� 3��V�� :�?�J�����J������T�����_��E�J ������AT� J���� :�?�
�3��DC�T������w�������� J������B J���� :�@:
� �M�����S�T��������C��� 3T������� J���� :�O:S��������������T�rw����s ������AT� J���� :�>t�������D�T���P5T����T� 3T������� ��������� :�>�_����P�_������_�����_��T ������AT� _����� :�>�
���C����������C�J����T��� ������AT� J���� :�a?�V�T��V�5������J���C J������B J���� :�a?
�6������������C������C 3T������� J���� :�at�z��CM��l����J����P�P J����AT������� :�at�J�������w��C���A�T�� ����D�� J���� :��@J���J��C D���� J���� :��a
')!! %(&0%1 /(� %(&X(*8
���5�C����
l���_��Cw��V�� 5��E��J�� ;
w���� O:�>��� �O�a5�C :������� ��:5�T�� ���
�A��=����a>���?
l����5����� ���J������
S��TvD������� :t�?a :���S��Tv_��E ���: :��OS��Tv��� ��:@ :�:tS��TvJ�������V t�OO :�::��A�C�C�z��C�; ��:t ��@O
w��V���5����� ;���J������
���P3���D���� ::�O> ��?t_��E�l��� :��@@ :������ t��? ��?OJ�������V t�@t ��??������T���D���� :��:O :��>
'<�Y</"("<%&�&� (
J��� ��: _��C� �����TE� :���� ���� ���
�������r;��B���TEs ?t�>
X #(<!� ",G("%,/
;��B��TE�
��_���E�:
��J�T��T�� �?�>O ��tt
��_���T5�� ���? ��aa
��J����J�T :>�t@ ��tt
�������AT� :>�?: ��?�
������D�� a�O? :�t�
�������A aO�aa :�:�
��J����A� :a��� :���
��D���� ��:O ��a�
����C����� a�tt :�:@
��3T����� �>�a� :��O
���B���A :��?? :��t
��J�����B :���� :�>a
�����T�� ��>a ��>?
��K������� :�:� ��>t
N ,"<%$8&+{Y</)! ;���TE
K�v4��D���� ��������T� :����� � ��������T� ?�����6������ t����� :�
'<)%(!*&+{Y</)! ;���TE
J���� aa3��V�� :���������� ::
_����� O��C�� O
-<!%"%,/($!�/&2$. � ����T������w����E����OP��P��
����T���J������D�������5��E����������������C��C�BB������C����T���V���������5��������������������������B��������B������������T������DM����TC���C��S����T����� ������C�������
����������������V��EC���������������� ���� T����C������������T� �����t���������C��������B5��E�����V������V������ T���T������������:O�r�� �����������B�����CT�����P��E�������������s�4�����������������C���������A�����T���:@��B�����B���B�A����������������������� ������C����W���C��������B�����:>�����BV���A�T����� ��C��������������������P�����T��C��D�T����������T�A����V���������V�����A������������������A��������V������� ���T�A����������w�A�������T���������V��E���C����V��������������A��V���� �E��B�������������������TT���������B��V��C�3����������T����TE����T�������A�C����� ���
���E��B���T��������V����T���������B������V����A�����M��BV������� ����������������������������������B����T�����������������C�A���B�C�������P���E��5�����������J�������������E�����T�����������M� ���T���C�M�������������V���C�������������
��B�T�������A����V��T���B�����C������V�������C�����������������TE��A����������A�����T������B�����E��T�T���4�������������������C���A������� ����������P���P�����C���� �����V�EC�������T�������:>�����������V�P�������P�������C��������C����T�������������B�������������������A���������T�A���C�����C����at;�3������������������P��A������B������BB��
��A�����������V���������������������5J��D5���CM �T����E��5����������������E���C�����V���������������������E��������������������E�������� �T����E���������������T���C���C���������A������������C�������B�����T��������B�A��� �����E�����������T������������������M��������������5J��D5w��V�����CM���� ����T����������C���������� �����T������������V���������4������������������BB�������f������B��������A������V���C� � ������AC���E������V���B���������P���E���M������
�CC���� ����T���J������4���C�5���������C����T 5�������S��T���� =�>�� �CC��=>� �����U�������J�����5��Oa::: 5����������A�S���� U �CC��=>�t��P�a>P���: ������� ��P���C
4 ��CC���� VVV�����T��T������T�� 5���������� :��>;��T������ �?P��P?@ �T�������� 5���:��>;�����U�CA����� ����T���J��������A������5��������
��TDM����S��WT������ �z��=�?@ >z��=Ot@ :�z��=:>::
� �CA����� ��� ��T��������� ������ ��������
������5��������������������������AC��3��C������C��������������C�������T�����������A�������CA�T��������A�CC�������B�����B������������������������������BB����� ��v�������T���������C��������V������C���� �T���T���T����������TT������5������������������������� ��B���������C����CT��������C������������������������B������������C��������C������C��������������������
�� -)()$8&�)%9/ �

���������������� ������������������� �����������������������������������������
�� !"#$%&'(%)*&+ ,&-.!/)&01 2"#3 !��456
7" /)8��9
2.:$/&�** :*;<=�<�8����
>*:$!&?$: @.!A��B���C�D�E������FG��
H %#I�$!3&JK&FL��EF����M�H %#I�$!3&NK&FL���L4��EO�M�����M�
>.!%"%@*:$!&�%$/A*:&0$:"%@���8P�QP��
R
>.!%"%@*:$!&S"//$!*
T��U�� � �B��B���
T�C�����U V
T��� W���
T���� W���
T��U V
>.!%"%@*:$!&�%$/A*:&0$:"%@
F�����������B��������������C��D�� ��D����C�B�G�����������X��U�������������� ��B���D����C��D����������������G�����������C�����B���������������������GP�DY���D� �����
�%$/A*:&0$:"%@&Z[ #:!(�
R \ ] ^ _
S"//$!&Z[ #:!(�
�X a��X��B��� �B��� � �B��B��� W���
8���
8��=
8=��
8b�=
����
c"*:.!"#$/&S!.d"/ 0 :(!%0"*30$:"%@
W����XeeeeeW�����
f f f f f f f fg%h *:� %:&Z:A/ Ei����
j!.,:I&.d&kJlmlll
��B������n������C���D��B������n������Ca�U����G�8
o p q p o p o o p p pS !d.!�$%# &r($!:"/ sX������L������t
��8� ��88 ��8� ��8� ��8< ��8= ��8u ��8b ��8Q ��8v �vP�� c"*:.!A
=<�u� <u�88 =<�<v =Q�bu =��<v <v�vb =8�<8 uu�QQ =b��Q b��<b b��vb ��n8b�b� P8��Q� ����� 8��<u P���v P=�u� <��8 ����u P88�vb �Q��� <�vb w�����������9P8�8= <�u8 ���� 8���u P8�8� v��� Pu�QQ P<��� ��u� v�u8 u�8� xyP�a���G�8u�=Q P��88 ���v P<�Q� ��=Q ���< P��8v =�Qb ���� u�=� 8��<� xyP�a���G��
���8 8�bb ���� 8�<b 8��< ��vb 8�<8 8�b8 8��u 8�bb ���� ��U���������98=�b� P8=�=Q 8Q��� Q�vv P<�=� Pu�=v ��v� �8��u P8���� �u��u <�vb L�������������9
u� Q �v v =� < b< =v 8< v �� w���������9����G�L��
��v= ��vb ��v� ��Q� ��b� ��=� ��b8 ��QQ ��Q< 8��8 ���� ��U���;���� ���� ���� ��u8 ��u� ���� ���� ��u< ��b8 8�Q< ���� L�������5�����;
��uQ ��uu ��uu ��u= ��u= ��u= ��u= ��u< ��u� ��u8 ��=v EO����������98�vu 8�b� 8�Qv 8�u� 8�u< 8��v 8�<Q 8��< 8��v 8�<Q ��Q� ��U���������9�� �= �= �u �� <8 �� �b �u �b z w����B������9
�=v <8b uQb 8�8�Q 8�uuv 8�Q=< ��bb8 <�uuQ <�vbu b�u�8 Q��Q= ���������;���
S !d.!�$%# ���vP��P��
8���{�� ��D�{�� ��D�{�� <���{�� w����
��8u ���u ��8u u�<� P<��8 <��8��8b 8��uQ u��u b��< =�u� ����u��8Q 8��= P��Q= P8�b� PQ��v P88�vb��8v 8��Qu ��Qu P��b= v��Q �Q������� P���88 �<�=u Q�8v V V
2!$"/"%@ w���������9
xyP�a���G8xyP�a���G
�9���GL��5��X����C;8�����
��F� Q�8v P8��b 8�v< u< 8��Q8vu�F� �<�bu =��v 88��Q �� 8��<bu8�|� 8<�=� ��vu 88�<v �b 88�<=���|���B� b�b� =��Q u�=< Q 8��<v�=�|���B� 88��b ��<� =�8< 8u 8b�8�<8��|���B� u��u ��=u ���u 8 8Q��8=8=�|���B� V V V V V
2$}&�%$/A*"* w�O��DY����9 9���G�L��w�OPL�������9���G�L��
��|��s������Dt u�v� v ��b8 <==�|��s������Dt 8��bQ 8u ��=� <88��|��s������Dt =��u � ��uu =Q
T��������L�������5����EO��������9��C������
0$:"%@&$%)&0"*3
w��T���D
��DP�DY������9
F��������������B��L��
F�������������G�B��L��
F�������������GP�DY�������
8�|� 8<�=���|� b�b� W��� �X eeeee=�|� 88��b x�B� �X eeeee8��|� u��u W��� �X eeeee��U�� v�=v
~:I !&> $*(! * ���D��D���DO a���������DO
����� u�< =�ba�� 8��� 8����Pi���D v= v=
���D��D��B������ 8b��bF�� b�b����������� ��<�
S.!:d./".&�%$/A*"*���uP��P��2.:$/&Z:.#3*K&�������U��������U���P�8P�� U��� L������ 9������
�F�U����C��L��� wU������� M���D����� ��ub�w�U���W��D������D L����BU�L���� ��<�������U���D��������D E���� ��D�� �������� � ��5�����W��D�����D L�����L�U L���� 8�Qv�F�U�D�� ����U L�����L�U a����� 8�Q<
��X�U��X�F������L���D L������C L���� 8�uu�����G�F����D���a��G��D ������BU� ��D�� 8�u<���U ��G���U�� L����BU�M���D����� 8�<Q�w��X�����U��D�U����F��� wU������� w��X�� 8��������5������D ������BU� W�������� 8��u
�F����U��D���U�� ������BU� M���D����� 8��=�T����������������D�L�� wU������� a����� 8��������� ����U�L�����L L����BU�M���D����� 8�������D���� L����BU�������� 8�8<�T��T���W��D�������U ������BU� M���D����� 8��=
�W��L�a��G��D ������BU� ��D�� 8����T������a�����������T E���� a����� 8����a����P�a������a�����a��U ������BU� a����� ��vu�D� ���U wU������� M���D����� ��v=
�w�����������U����C�U W����L�� M���D����� ��v<
?(!! %:&g%h *:� %:&Z:A/
���F�D����
n���a��D5��X�� F��G��L�� 9
5���� =u�<��� �8�8F�D 88�Q���� ��bF�U�� ���
�B��;����=����=
n����F����� ���L������
T��UyE������� �=�=< 8��QT��Uya��G ��=< 8�8uT��Uy��� ��<< 8���T��UyL�������X 8���Q 8�����B�D�D�|��D�9 8�QQ ��uu
5��X���F����� 9���L������
���Pw���E���� 88�Q� 8���a��G�n��� u�<< ��ub��� ��u� ��<�L�������X <�ub ��=�W������U���E���� ��=< ��<�
?.�[.*":".%&�&+ :
L��� <�Q a��D� ��<��UG� v8�v ���� ���
�������s9��C���UGt bu�=
Z #:.!- "@I:"%@*
9��C��UG�
��a���G�8
��L�U��U�� �u�v= ��Q�
��a���UF�� u��� ��Qu
��L����L�U 8��uQ ��b�
�������BU� 8u�8v ��v=
������E�� ���Q ��Q8
�������B <���b ��v=
��L����B� 8��b8 ��v8
��E���� <��v ��Q�
����D����� u��8 8�<v
��wU����� 8u�Qu ��v�
���C���B ���vb 8�bb
��L�����C u�Q8 8���
��W���U�� 8<��< ���<
��M������� ��8� 8�8�
0 @".%$/&�}[.*(! 9���UG
M�y4��E�������������U� �<����� < ��������U�8������6������ �=���� <
?.(%:!A&�}[.*(! 9���UG
M���D�������L���� 8Qa����� 88
��D�� Q����U =
>.!%"%@*:$!�*&2$3 � ��w�������������8P�QP��
����U������D���X�4���D��� ���D���D������D������U��CCU��B���D������������P���G��B����������������������U�����������U�������F���������������������������C�5��D���D��������U���C����B��w������������������C�U�D��E�B���������������
�������������;<<� ������������ ����X����B��������B������������U�����D����D������������������U�������������������C�U������i���������������� ����UD�������U�����D��������������C��D���C�ODP��U�����B������������������U����������DX��D�D�a��D��� ��� D�8�9��C�������Y����C�B���������� �������G������=9��C��������U�������������������O��C��D��D����������D�����C����������� �������D��B�������C������� ���D���D�B���C�D�����C�����w����������������������P���G�������������������
�C��U� ����8v�����C��D�������8�����D�������U��DD����M��P ��D�C������F�U����C��F�w��F����U��DF�����D���U ��G��a����DD��DB���DP���G������������������U������ ��� D�<v9��C��������w����� U���������������U�����B������DB���DP���G��C���������B�DD�����D��B�����������9��C�����
�B���C�����������U���������D�����B�����C��DU���������������=9��C����������������P���G��PD���U��D�C�����������������i���������������U�������D�����������=�9y=�9� ��D��C����FL�E�������F��G�����D�FL�����PL�������4���D���DO�������U�����B�����������D�U����D�����C��D������������B����������D�B���C�D�����C�����w��������������������������B�D� ���������
D�X���������D� ��������U����U������U�B��������������U����X����������P���G�����B�������w��C��D��������D�����X������D��D�DB��������������� ��DD �U����G����B���C�BP����������������D����U������������U� ���������U������������������C��D���������C���D����������������������P���G�����G��U�U�������G�������������D�X���D�����U�����w�� ���������C��D����������������P���G��O��������������X�����������C����������G����|��������������D��� ��������D� ��D�����G���������������C����B������X����B����������G���������
�DD���� �X�4���D����D���U F�������T��U���� ;�=� �DD��;=� �����V����������L��v��b8P8<<b F����������B�T���� ;�=� �DD��VQ��P<�8P<��= ������� ��P���D
4 ��DD���� XXX�����U��C��D��U�� F���������� ��Q=9��O�y��<v9���������=9���U������ �=P�8P�v �U�������� F�����=�9�����V�DB����� L�����������U����D�F��������L������ EO����T��YU������ �|��;8v� =|��;��= 8�|��;b=�� �DB����� ��� ��U��������� ������ ��������
������F��������������������������BD��w��D������D��������������D�������U�����������B�������DB�U��������B�DD�������C�����C������������������������������CC����� ��y�������U���������D��������X������D���� �U���U���U����������UU������F������������������������� ��C���������D����DU��������D������������������������C������������D��������D������D��������������������
�� >(:($/&'(%)* �

���������������� ������������������� �����������������������������������������
�� !"#�$%&'"()*+)%,�(-".!%/+!.0 1*2-"(345�6
7*"08��9:
1;.�0%<!!".!=����>����
,!.�(%��.");($��?���@�A�4������5B��
C"+2D'�(-%EF%53��45����G�C"+2D'�(-%HF%53���3I��4J�G�����G�
,;(+*+)!.�(%<+�0$!.%K�.*+)����L�ML��
N
,;(+*+)!.�(%O*00�(!
P��Q�� � �?��?���
P�@�����Q R
P��� � �?��?���
P���� � �?��?���
P��Q R
,;(+*+)!.�(%<+�0$!.%K�.*+)
5�����������?��������������@��A�� ��A����@�?�B�����������S��Q�������������� ��?���A����@��A����������������B�����������@�����?���������������������BL�AT���A� �����
<+�0$!.%K�.*+)%UV"2.( '
W X N Y Z
O*00�(%UV"2.( '
[�S \��S��?��� �?��� � �?��?��� ]���
9���
9���
9>��
9��
9_��
*!.;(*2�0%O(;a*0"K". (+K*!-K�.*+)
� �?��?��?���bbbb� �?��?�
c c c c c c c d/+e"!.'"+.%U.$0"4f����
g(;#.D%;a%hEijiii
��?������k������@���A��?������k������@\�Q����B�9
l m l n l n m l n n mO"(a;('�+2"%o �(.*0"pS������3������q
��9� ��99 ��9� ��9� ��9> ��9M ��9 ��9r ��9_ ��9s �sL�� *!.;($
9��9� s�_9 9��� 99�> 99�� s�M_ 9���� 9>�9r 99�>� 9���> 9��rr ��k���s L9_�99 �M�_� L��Mr ���r L9��M s��9 �s�r_ L9r�s9 9�r� L���r t�����������:r�>9 ���9 r�M_ ���> >��M L9�9� L9�s_ ��M� L���> L9�s L��s9 uvL�\���B�99M�9� L>�>9 _�sr L9r�_M M�s� L9���s >�r9 9��Ms L��r9 L>�r_ ���r uvL�\���B��
��9 ��_� ��_� ��s9 ���_ 9�>� 9�r ��9r 9�� ���� ���� ��Q���������:���r L9_�s� ���s_ L��>_ L���� L9r�>M r�M> �r�9 L9s�M� 9>�>9 L���r 3�������������:
99 �� _ M _ r >M �� ^ s M� t���������:����B�3��
��� ��9� ���_ ��99 ���_ ��9 ��9 ���� ���� ���r ���� ��Q���=���� ���� ���� ���� ���� ���� ���� ���� ���� ���� ���� 3�������w�����=
9�s 9�Ms 9�>� 9��� 9��� 9�9s 9�9_ 9�9M 9�9M 9�9 9�9� 4J����������:9�rM ���M ��9 ���s ���9 ��� 9�_s 9�_� 9�_s ���M ��� ��Q���������:_� sM r> sM 99� 9�� r� M� >s �s x t����?������:
�� _s 9�� >�M sss 9�>�9 ���r >��M9 ��r>> ��r�s ��s ���������=���
O"(a;('�+2"���sL��L��
9���y�� ��A�y�� ��A�y�� >���y�� t����
��9 >��r 9��� _�9> L��s� s��9��9r 9>��r >�M� s��� r�� �s�r_��9_ ��9� L9��> L9��> L_�s9 L9r�s9��9s _�� ��>� L>�M9 9��99 9�r����� L����9 9��� s��� R R
1(�*0*+) t���������:
uvL�\���B9uvL�\���B
�:���B3��w��S����@=9�����
��5� s��� L���� ���_ >r 9��s���5� �r�9s L��9_ ��_9 rM 9��r9s9�z� s�rs L��rM �rs >r 9��srs��z���?� ���M L��9r L��s9 > 9���rMM�z���?� �_s L���_ ��M r 9��sM99��z���?� ���> ��r> L��r �� 9��r�9M�z���?� R R R R R
1�{%<+�0$!*! t�J��AT����: :���B�3��t�JL3�������:���B�3��
��z��p������Aq L��M� � ��rr M�M�z��p������Aq ��s � ��r> M_9��z��p������Aq ��M� � ��r� 9
P��������3�������w����4J��������:��@������
K�.*+)%�+8%K*!-
t��P���A
[��AL�AT������:
5��������������?��3��
5�������������B�?��3��
5�������������BL�AT�������
9�z� s�rs��z� ���M �?� L�?�bbbM�z� �_s �?� L�?�bbb9��z� ���> u�?� �?�bbbb��Q�� ��s
|.D"(%,"�! ("! ���A��A���AJ \���������AJ
����� L�� L��9\�� 9�� ��sr�Lf���A _ s_
���A��A��?������ 9_�Mr5�� ���M���������� ����
O;(.a;0*;%<+�0$!*!���L��L��1;.�0%U.;2-!F%EEE����Q��������Q���L�9L�� Q��� 3������ :������
}t�Q���]��A�����[�A 3����?Q�3���� _��M}��� � ��w�����]��A����[�A 3�����3�Q 3���� �rr}�������4�Q�����Q��3��[� tQ������� �����~��� M�>�}t��S�����Q��A�Q����5��� tQ������� t��S�� >�_s}3�����3������Q�����\��B�3 ������?Q� 3���� ��99
�53��4�������5��B�����A R G���A����� ��rr���?�Q�����Lt�����?�w�?� R G���A����� ��>s}���Q�����Q���� 3�����3�Q 3���� 9�_M���������53��3������ R 3���� 9�_�
}P��������������Q�pw����q ������?Q� 3���� 9�M
}�����Q���A�������[�A 4���� ��A�� 9�M53��3]�����_v9rv�� R �����A 9��
�\��A����Q���� 3����?Q�3���� 9�>�}P�3�[�B������� 4���� ������ 9��s}5A��tB���Q tQ������� t��S�� 9��
}������3��Q��3����3��[�A \���Q�5�� 3���� 9��9}w�������P�3���� 4���� ������ 9�9}]���]���P�Q��������A���� tQ������� t��S�� 9�9�}~�]���J���Q tQ������� �����~��� 9�9�}k�������� \���Q�5�� \����� 9�9�
� (("+.%/+e"!.'"+.%U.$0"
[���5�A����
k���\��Aw��S�� 5��B��3�� :
w���� ��>[��� ��r5�A 9��9���� ��_5�Q�� ���
�?��=����M9�9_�
k����5����� ���3������
P��Qv4������� 99�_� ��>P��Qv\��B 9�9> ��M�P��Qv��� ��rs ��>�P��Qv3�������S >��� ��M��?�A�A�z��A�: >��� 9�>9
w��S���5����� :���3������
[���Lt���4���� s��s ��r_\��B�k��� M�r_ ������ _�s� 9��>3�������S >�r ��M�]������Q���4���� M�r� ��r�
�;'V;!*.*;+%�%�".
3��� �� \��A� 9�M��QB� s>�s ���� ���
�������p:��@���QBq ss��
U"2.;(�"*)D.*+)!
:��@��QB�
��\���B�9
��3�Q��Q�� >9�� ��s�
��\���Q5�� �>> ��s�
��3����3�Q 9��sr ��rr
�������?Q� 9_�r� 9��s
������4�� ���� ��_
�������? >_�_r 9�9
��3����?� 9�s 9�9s
��4���� �M� 9��9
����A����� ��� ��_9
��tQ����� ����s 9�9s
���@���? s�rr ��rM
��3�����@ �>_ ��sr
��]���Q�� ��_r ��
��G������� ��>� ����
K")*;+�0%&{V;! (" :���QB
G~vI��4���� ��������Q� 9����� �[��������Q� s�����6������ _����� s
�; +.($%&{V;! (" :���QB
3���� �s�����~��� 9>t��S�� 9>
��A�� _\����� ^
,;(+*+)!.�(�!%1�-"� ��3������z��������L�ML��
�������A�������A�@@Q��?�f���������?�������Q�����3���S���4�������5��B�����5��������������������������@�\�����@��� ���������Q��������T���������������A�5�Q��@@�~��������?
Q��� ������AA�����������������Q��������r���Q������S�������w� ����S������� ��S�������@�������Q���M��T���A������Q�������������9>��t��J����QA���������Q�?���������������Q�������������f���������?�����Q�����������@����������������@�?��@�����������������������A������?������������A�����f���������?���A�������Q�� �������QBL��Q�@�Q
��A���Q��Q�����Q�@�Q��������������������A�����������A�S�������������������QBL��Q�@�Q�@�Q������Q��A�?��������S������A������������A�����Q�?������?����S����������������A����������������?�����������?���������@�����������Q� �?��������������?�������53��4�������5��B�����AJ� ������S�����A���������@�Q�������������?��A�?�����������A������������S��A����������L���S������QB�S���������� ��?�����������t�����������A�������������������A���?�������AJ�?��A��������
���������AQ�A��S���?�������QB��������@������A���@���A���������S���Q�����������5�Q��Q�����Q�@�Q����������������������?��������B���������������������B����S�����Q��Q�����Q�������@����?�S�������QBL��Q�@�Q�@�Q������t�����A��������B�J�������LA�S�� ���� ���� �A���� ���?��������@�����Q���������������@���������@�������S��A�Q����������A��Q�������������B�����?��������Q��?��t�������������������@������S��L����AA�@��A����������������������B������f���������?���A��������?����B����Q�����������Q������@@L ����QL�������B��4?��S�����������B�Q����������������S�����������?�������Q����A���������������Q���������B��� �����B���������A�A�������������t���������������A�������Q����@
��A���@�����Q���������A������AJ�A��������������������L���A�@�?L�������������� ������������ ���������A��?�A�����A���������A����BL�AT���A���������?����������������������A�Q�������������QQ���
�AA���� 3���S���3�������5��������t���� 5�������P��Q���� =9�������AA��R �����=M���[���������3��s���M 5����������?�P���� =9�������AA��=9��_ Ls>rLr��� ������� ��L���A
I ��AA���� SSS�Q���S��@��A��Q�� 5���������� 9���:��Q������ ��L�sL�r �Q�������� 5���9���:�����R�A?����� 3���S���3�������5��������[[3 4J����P��TQ������ �z��=�Ms Mz��=�s 9�z��=9>�9� �A?����� ��� ��Q��������� ������ ��������
������5��������������������������?A��t��A������A��������������A�������Q�����������?�������A?�Q��������?�AA�������@�����@������������������������������@@����� ��v�������Q���������A��������S������A���� �Q���Q���Q����������QQ������5������������������������� ��@���������A����AQ��������A������������������������@������������A��������A������A��������������������
�� , . �0%� +8! �

���������������� ������������������� �����������������������������������������
�� !"#$%&'()"#*%#& $"+),-&'./*,0&1 2*3+)"4567
8*)9:��;<
2!,$9&=--),->?��@A�����
-,$"&B$,)#!"0��C���D�E�5������6F��
G)%3H($"+&IJ&6K��56����L�G)%3H($"+&MJ&6K���KN��5O�L�����L�
!"%*%#-,$"&=%$90-,&P$,*%#���QR�SR��
T
!"%*%#-,$"&�*99$"-
U��V�� � �C��C���
U�D�����V W
U��� � �C��C���
U���� � �C��C���
U��V W
!"%*%#-,$"&=%$90-,&P$,*%#
6�����������C��������������D��E�� ��E����D�C�F�����������X��V�������������� ��C���E����D��E����������������F�����������D�����C���������������������FR�EY���E� �����
=%$90-,&P$,*%#&Z[)3,"/(
\ ] T ^ _
�*99$"&Z[)3,"/(
�X a��X��C��� �C��� � �C��C��� b���
?���
?���
?Q��
?c��
?S��
d*-,!"*3$9&�"!e*9)P),/"%P*-+P$,*%#
b����C���fffffb�����
g g g g g g g g1%h)-,()%,&Z,09)5i����
j"!k,H&!e&lImnmmm
��C������o������D���E��C������o������Da�V����F�?
p q r s q p q q p q q�)"e!"($%3)&t/$",*9)uX������K������v
��?� ��?? ��?� ��?� ��?Q ��?@ ��?c ��?; ��?S ��?A �AR�� d*-,!"0
�Q�Q? ����� ���A� ���@; ����S ?S�cc ���AA �A�;A �Q�S� ���QS �@�AQ ��o?S�?� R?;�?? ?S�S� R@��@ ���? R?c��c ?���Q Q��QA R?c��� �?�Ac ?��c@ w�����������<R��;; ?��� ��c? R��;@ ��Q� R?�?Q ���@ @��? R?�Q@ ?��@Q ??�S? xyR�a���F�?c�A@ R��Q� ���� R���cQ Q��S R?��Q� S�;Q ?@��� R?�S� ?��Q@ ?c��A xyR�a���F��
��c� ���c ��c� ���? ?��@ ��@c ��;Q ��@c ��;� ��AA ���� ��V���������<?;�QA R?;�?c ?S��? R@�@c R��SQ R?c�c� ?��@� Q?�AQ R?c�;Q ���A; ?��c@ K�������������<
@Q �� QS S� �� cS ?c ?� @? � ?� w���������<����F�K��
��?� ���? ��?� ���@ ���Q ��?� ��?Q ��?� ���� ���@ ���� ��V���>���� ���� ���� ���� ���� ���� ���� ���� ���� ���� ���� K�������z�����>
?�@S ?�@c ?�@; ?�@Q ?�@c ?�QS ?�Q� ?��� ?��c ?��? ��AA 5O����������<���� ��@c ��c� ��;Q ��;S ��SS ��cc ��c� ��SQ ��AQ ��?; ��V���������<?Q A �� �Q �� �@ �� �� ?� �Q { w����C������<
?���� ?�?Q@ ?�Q�� c�S @Q� �;A �AQ ;�c ;@Q ���;c ��;@� ���������>���
�)"e!"($%3)���AR��R��
?���|�� ��E�|�� ��E�|�� Q���|�� w����
��?c c��� ��@S A�cQ Rc�?� ?���Q��?; ?���Q S�S; S�c� ;��@ Q��QA��?S ��@; R;�SS R��?A Rc��; R?c�����?A ?c�Q? Q��� R���c ??��@ �?�Ac���� R����S �Q�@� ?Q��c W W
2"$*9*%# w���������<
xyR�a���F?xyR�a���F
�<���FK��z��X����D>?�����
��6� ?Q��c Q�@� ;�S? ; ??�Q�cc�6� Q���� ?��c� ?S�c� ?� ?Q����?�}� ���SS ?���Q ?A�SS ?? ?���SS��}���C� A�c� ;�?S S�QQ @ ?��?c@@�}���C� ?Q�cA @�;� S�Qc Q ?A�SQc?��}���C� @��Q ��@Q ?��� A ?c��QQ?@�}���C� ;�c� ?�;A ��@? ; �A�ASS
2$~&=%$90-*- w�O��EY����< <���F�K��w�ORK�������<���F�K��
��}��u������Ev A��� @ ���@ ?�@�}��u������Ev ?Q�QQ � ���� ?�?��}��u������Ev Q�S� Q ���� ??
U��������K�������z����5O��������<��D������
P$,*%#&$%:&P*-+
w��U���E
��ER�EY������<
6��������������C��K��
6�������������F�C��K��
6�������������FR�EY�������
?�}� ���SS��}� A�c� b��� x�C�fffff@�}� ?Q�cA b��� �C�fffff?��}� @��Q b��� �C�fffff��V�� ??��@
�,H)"& )$-/")- ���E��E���EO a���������EO
����� S�c ;��a�� ?�?@ ?����Ri���E SS A�
���E��E��C������ ?A�Ac6�� A�c����������� ��QS
�!",e!9*!&=%$90-*-���SR�?R��2!,$9&Z,!3+-J&������V��������V��;R�?R�� V��� K������ <������
��� � ��z�����b��E�����E K�����K�V K���� c�A?w��X�����V��E�V����6��� wV������� w��X�� c�@;w�V���b��E������E K����CV�K���� Q���
��������5�V�����V��K��� wV������� ��������� ��@S5U�6���������V wV������� L���E����� ���A���E���� K����CV�������� ��?�
�6�������������� K�����K�V K���� ��S;�N�7��a������V��uK�����v�� b����K�� K���� ��c;����z������E ������CV� b�������� ��@c6�V�E�� ����V K�����K�V a����� ��@?��5�����V���� K����CV�K���� ��QSwV������V���E�������K� ��E����� b�������� ��Q@b��������C������������ ������CV� ��E�� ���c4��V�����V���� K�����K�V K���� ���Sw����K��������V���C�V� wV������� ��E�� ���Q�����V���E��������E 5���� ��E�� ���?�������b����������C������ K������D K���� ?�SSa�EX����a�X����K���U�K K������D b�������� ?�S�U����������������E�K�� wV������� a����� ?�ccb��K�a��F��E ������CV� ��E�� ?�c@
B/"")%,&1%h)-,()%,&Z,09)
���6�E����
o���a��Ez��X�� 6��F��K�� <
z���� S��?��� ?��;6�E S�@���� ��;6�V�� ���
�C��>����c;���Q
o����6����� ���K������
U��Vy5������� �c�@; ?�QQU��Vya��F ��cA ?�cAU��Vy��� ���? ?�cQU��VyK�������X ?��?? ?�cA��C�E�E�}��E�< ?�@? ��@�
z��X���6����� <���K������
���Rw���5���� ?��cA ?�?ca��F�o��� ?@�c; ?�c���� ?Q�@@ ?�cAK�������X A�?c ?���b������V���5���� ?��A; ?��@
B!([!-*,*!%&�&�),
K��� ?�� a��E� �����VF� AS�S ���� ���
�������u<��D���VFv Ac�?
Z)3,!"�)*#H,*%#-
<��D��VF�
��a���F�?
��K�V��V�� Q@��Q ?��?
��a���V6�� ��Q� ���c
��K����K�V �?�;� ?���
�������CV� ����A ?��@
������5�� ���� ����
�������C �c�cS ��S;
��K����C� ??�Q? ��S?
��5���� ���� ���S
����E����� ��;c ��A�
��wV����� ?A�QS ?��Q
���D���C ?S��S ?�Q�
��K�����D ?��@; ����
��b���V�� ��;Q ��Sc
��L������� ��;; ��Q�
P)#*!%$9&'~[!-/") <���VF
L�yN��5���� ?�������V� Q4���� � ��������V�?������7�4���� ;A���� Q
B!/%,"0&'~[!-/") <���VF
K���� �c��E�� ?;a����� ?�
b�������� Sw��X�� ;
!"%*%#-,$"�-&2$+)� ��N��������������VV����QR�SR��
4U6������5�������6��F���5i�������������������E������EC��������C�����V�������������E��������V�����������V������������6���������������������������D���C���X����������O����V���������V������V�C�a�������������w���������������������E����E������5�E����
Y���E�������������V�������������?��� V��������������EV�����R��F���������������D���?@����E�X��D���������V�����E���������E��������?S�������������b�������������X��EV�E���D���C���O����V��C��������V��E������������V��E��D���VV����������������RV���������R���F������������������������X���Y���E����������������E�������������@���E������E�������������������5�E��������FV��������X���C�������V��������������6������� ����� ���E������V�����������V���?���w���������������C������� ����E���������i��E��D�������R���F�����V�����������������������5�E�������E����V���������������D�����X���
i�������D���V������V���������������������������E����E�����������i��������������V����������E�C�E�����V��C����E��������������E�����V�� �VF��RR
��������i����������E����E���RR�������E���������� ������D����������D������w�����C������������������D�������������������E�i�������������X��V���������������V��C���E�������X���������E�O���������F����E�������������� ����V����������E�����������������E�����E�V���RD��XR��������������V����w����������������D������D�c�����S�����VF��X����D�����E�����V��C�V���������E��V����O�������5�E�������E����V�����������C�OV��E�����
i������R���X������V���ED�����w��������������E��������������������V������������E���Q��<���������E�����D����4����?����?@�����������������Q�����������D�V��X�����������V���E�C���D�E�������R���F���D��E����6K��5�������6��F�����EO�u���V������ �V����Fv���E����6K��5�������6��F���z��X����EO��������<����S<���E���;<���������E����V��C����w�������������E������������X����������C����C������������������������������FR�EY���E�������X������������V��C�E�������������E�
�EE���� 4U6������w������ 6�������U��V���� >?�������EE��W �����WK���� ����b�Q��Q� 6����������C�U���� W �EE��WS��RQS�RQ??? ������� ��R���E
N ��EE���� XXX�Y�������D��E��V�� 6���������� ��cS<�����S<���V������ �AR?�R�? �V�������� 6�����cS<�����W�EC����� 4�U��6��������C������6�����������V� 5O����U��YV������ �}��>��; @}��>@A? ?�}��>?���� �EC����� ��� ��V��������� ������ ��������
������6��������������������������CE��w��E������E��������������E�������V�����������C�������EC�V��������C�EE�������D�����D������������������������������DD����� ��y�������V���������E��������X������E���� �V���V���V����������VV������6������������������������� ��D���������E����EV��������E������������������������D������������E��������E������E��������������������
�� /,/$9&�/%:-

���������������� ������������������� �����������������������������������������
�� �!"#$%&!'()'#*�!+&,-#$./(,0#1)-,2 3(4+&!56789
:(&2"��;<
3=,�2#>--&,-?@��AB����
*-,�!#C�,&'=!0��D���E�F�7������8G��
H&)4I%�!+#JK#8L��78����M�H&)4I%�!+#NK#8L���LO��7P�M�����M�
*=!)()'-,�!#>)�20-,#Q�,()'���RSRTS��
U
*=!)()'-,�!#V(22�!-
W��X�� � �D��D���
W�E�����X Y
W��� � �D��D���
W���� � �D��D���
W��X Y
*=!)()'-,�!#>)�20-,#Q�,()'
8�����������D��������������E��F�� ��F����E�D�G�����������Z��X�������������� ��D���F����E��F����������������G�����������E�����D���������������������GS�F[���F� �����
>)�20-,#Q�,()'#\]&4,!/%
^ _ U ` a
V(22�!#\]&4,!/%
5�Z b��Z��D��� �D��� � �D��D��� c���
R���
R���
R@��
RT��
d(-,=!(4�2#V!=e(2&Q&,/!)Q(-+Q�,()'
5�Z�D���f5�Z��
g g h g h h h h1)i&-,%&),#\,02&7j����
k!=l,I#=e#mJnonnn
��D������p������E���F��D������p������Eb�X����G�R
q r q r s t q t s s tV&!e=!%�)4&#u/�!,(2&vZ������L������w
��R� ��RR ��R� ��R� ��R@ ��R; ��RT ��RA ��RB ��Rx �xS�� d(-,=!0
�R�AB RT�B� Rx�;@ RB�TA RA�Rx R��@@ R;�xT ����� RT��T RB�@B R@�Tx ��p���BR SRA�A; ����T S��B� S@�RT S���RT ���;� �B��� SRB��x RB��@ SRx��A y�����������<��x� ��TA @�R@ R�BR SR�xB S;��@ x��� Sx��A S��;� S���B SRB��R z{S�b���G�RRR�TT S@��; ;�;� SRT��B S���� SR@�@x RT��� ��B� S��Bx S��@A SR��x� z{S�b���G��
R�B� ��x� ��R� R�B� ���� R��; R�AT ��;� R�Tx ��B� R�RA ��X���������<�R��R S���T; ����@ S��T� ST�Rx S�R�;R RB�A; �;�;� SRx�AB R;��R S���;@ L�������������<
�� �B RA @� T@ x� @ AB TB ;x xT y���������<����G�L��
���� ��T� ���T ���T ���A ���� ���@ ��@� ���@ ��@; ���� ��X���?���� ��@B ��T@ ���; ���; ���T ���� ���� ���� ���� ���� L�������|�����?
R�R@ R�R� R�R� R��x R��x R�R� R��x R��B R��A R��B R�R� 7P����������<R�xT ��@@ R�B; R�B� R�xA R�B� R�;x R�B� ��R� ��@� ��@� ��X���������<�� �� �� RT R� R@ R� R@ RT �� } y����D������<
R@�;@� R��x�� R����� R��TxB R��RAx B��;� x��x; RR��xB A�;B� T�T;x ��TA; ���������?���
V&!e=!%�)4&���xS��S��
R���~�� ��F�~�� ��F�~�� @���~�� y����
��RT B�AR @�Ax B�B; S��B� ���;���RA R��@� ��RT T�BR T��A �B�����RB ���; SR��TR SR�T� S;�;; SRB��x��Rx A�;� ��TT S��B� RR�R; RB��@���� S����x R��@T ��;; Y Y
3!�(2()' y���������<
z{S�b���GRz{S�b���G
�<���GL��|��Z����E?R�����
��8� ��;; SA��R S��A� x; R���;;T�8� R;��� SR@��@ SB��; xA RR�;��R��� SR���B S���x� SR���B x; B�xT�������D� ST��B SB�;� SA��@ xB B��B;;�����D� ��A� S;��A S��;� x� RR�xx�R������D� S���� S��B� S@��� xT x�TATR;�����D� @�RA SR�T@ ���B B� RB�@TR
3��#>)�20-(- y�P��F[����< <���G�L��y�PSL�������<���G�L��
�����v������Fw ST�B; xA ��B� ;�;����v������Fw ���R Bx ��TA ;�R�����v������Fw SR��� x@ ��BB AA
W��������L�������|����7P��������<��E������
Q�,()'#�)"#Q(-+
y��W���F
5��FS�F[������<
8��������������D��L��
8�������������G�D��L��
8�������������GS�F[�������
R��� SR���B���� ST��B 5�Z �D�f;��� ��A� S�D� �D�fR���� S���� 5�Z �D�f��X�� ;�;B
�,I&!#*&�-/!&- ���F��F���FP b���������FP
����� ST�B Sx�Rb�� R�RR ��xx�Sj���F B� Bx
���F��F��D������ Rx�x�8�� ST��B���������� S���x
V=!,e=2(=#>)�20-(-���TS��S��3=,�2#\,=4+-K#������X��������X���S�RS�� X��� L������ <������
�L�����L������X�����b��G�L ������DX� L���� @��@��������7�X�����X��L��5� yX������� ��������� @������c���P���X yX������� ��������� ��;x� � ��G��E��������W�L ������DX� ������ ��AB�������L���8L��7����� Y M���F����� ��;A
�p������F��y7�7�������8� Y M���F����� ��;;�y��Z�����X��F�X����8��� yX������� y��Z�� ��@x���������������y���� Y M���F����� ��@B�����X��8�D����b�F�Lp�� L����DX�8P�X� ���x�W�L�5�G������� 7���� ������ ���x
�L�����8� ���5�F���� L����DX�L���� �����b��X��F��b��������bb�b�� ������DX� b����� R�xx��yW�b��G�W5L ������DX� c������ R�xx�M���D���p L������E �������F� R�x��������L��X��L����L��5�F b���X�8�� L���� R�BA
�L�����8�X������b��G�L��5 ������DX� L���� R�AA���E�����5�F���� yX������� ��F�� R�A@�Wy�y�G�����G������F��� L����DX���F����� R�TB�8� ���y�������W�L�� L����DX������� R�T;�cL5�yX���������5�F yX������� ��F�� R�;x
C/!!&),#1)i&-,%&),#\,02&
5���8�F����
p���b��F|��Z�� 8��G��L�� <
|���� @��A5��� �A�;8�F RT�B���� ���8�X�� ���
�D��?�����@�T@�
p����8����� ���L������
W��X{7������� RR��x ��TRW��X{b��G R��� ��;TW��X{��� ��BB ��@BW��X{L�������Z ��A@ ��@B��D�F�F����F�< ;�@� R�Bx
|��Z���8����� <���L������
5���Sy���7���� B�RA ��Txb��G�p��� T�xB ��A���� x�;@ R�RRL�������Z ;�T� ��T�c������X���7���� ��R� ���B
C=%]=-(,(=)#�#�&,
L��� ��T b��F� �����XG� xA�@ ���� ���
�������v<��E���XGw xx��
\&4,=!�&('I,()'-
<��E��XG�
��b���G�R
��L�X��X�� @���x ��x@
��b���X8�� x��� R��x
��L����L�X T�@; ���T
�������DX� �;�;T R�@x
������7�� R��; ��@R
�������D @x��� R�RT
��L����D� R��@R ��Bx
��7���� x��; R�A�
����F����� T��R R�@@
��yX����� �R��; R�R@
���E���D B�Bx ��Tx
��L�����E ;�xx ��Bx
��c���X�� ���T ��@A
��M������� ��B@ ��@@
Q&'(=)�2#$�]=-/!& <���XG
M�{O��7���� ;�������X� R����� �5��������X�RR�����9������ T;���� Rx
C=/),!0#$�]=-/!& <���XG
L���� �@��������� R@��F�� R�
������ xy��Z�� A
*=!)()'-,�!�-#3�+&� ����X������|����G����RSRTS��
5����F�7�������8��G��� ��������D�������F���� ���������������X�������F�F��X�����F����X������������F�����Z������������E�����c�ZD�����X�����������XG���X���������X��������X����� ��������F�Z����F��E����8�����������������������������b����E������D��E������������X������y���������������XX�������F���F��������F
P����XF������������X��������F������5�F�����������������F����G�X������E��������������������R�[���F��D������ ��X���������������L��������F8���G����������y������������������������F� �E�������������������E�Z���� ����������������������������F�������y����������������������������X����X��Z���E�D������������S���G�����������5����F�Z���E�X���������E�������Z��S�����F�j�����������X��SX����X��F �������F���F����������D�PX��F�����������D
D����� �����S������X���Z����F��X��������F������X�y������G�E���X��������Z����� �DS�D�������������j��������������� ��ZS�D�������X����������X�����������������X��������� ����XS������� ��������F�������������j����������XG������������E��F������
����X�SF��D�����X���X�����F�����������S�ESX������������X����������X���������D�Z������������������j������X�����F�Z���������8L�����������G��� �X����G�����X� ����Rx��y������E�����������D���������������� ��Z���<��������������������������D�����F������������������S��������������O���������F��� �X����GS�������X�������X�����
���FF����������������D���������������������� ������XX��E�������X���������y�������������������Z���Z�����������X��������F���������RA����RB����F��Rx��������E��X�����F�b�����������XG����D� ������X�������F�����������������������ZD�����D�������D� ���Z��FF�E������������������������������X��y������������F��������R;�Z���E����ZF� ������SFX���E�����������RT�����������F��������b��������F��������S�ESE�D��������� ���FF�E����������D���������XG��������E�����X��O�����X�����������D� ��F����������������������������������� ��D�����F���F���������X���F��D������E�����X�
�FF���� 5����F����F����X 8�������W��X���� ?R���� �FF��?;� �����?R�����Z����G�����R�RR� 8����������D�W���� Y �FF��YB��SB��ST��� ������� ��S���F
O ��FF���� ZZZ������F���X�� 8���������� R���<��X������ �ASR;Sx@ �X�������� 8���R���<�����Y�FD����� 5����F������8��������55L 7P����W��[X������ ����?�@� ;���?;x; R����?R�RA� �FD����� ��� ��X��������� ������ ��S��������
�����8��������������������������DF��y��F������F��������������F�������X�����������D�������FD�X��������D�FF�������E�����E������������������������������EE����� ��{�������X���������F��������Z������F���� �X���X���X����������XX������8������������������������� ��E���������F����FX��������F������������������������E������������F��������F������F��������������������
¡¢ */,/�2#£/)"- ¤

MeetingDate Business to conduct
01/21/21Routine quarterly business **Annual Pension Increases
Meeting with Investment Consultant Investment Performance - 2020 4th Q Review2021 Outlook
Meeting with Investment Manager Manager ReviewSub-committee Reports
04/19/21 Election 3rd Monday in April
04/22/21Routine quarterly business **Ratification of active trustee elections
Meeting with Investment Consultant Investment Performance - 2021 1st Q ReviewMeeting with Investment Manager Manager Review
Asset Allocation ReviewPresentation of Actuary ReportSub-committee Reports
07/22/21Routine quarterly business **Election of President & Secretary
Meeting with Investment Consultant Investment Performance - 2021 2nd Q ReviewMeeting with Investment Manager Manager Review
Presentation of IDOI ReportSub-committee Reports
10/21/21Routine quarterly business **Proposed Meeting schedule for next year
Meeting with Investment Consultant Investment Performance - 2021 3rd Q ReviewMeeting with Investment Manager Manager Review
Asset Allocation ReviewSub-committee Reports
** Routine quarterly business would consist of approvals of minutes, approvals of new members, approvals of service peacceptances of continuing disability reports, approvals of contribution refunds, approvals of surviving spouse pension
2021 Proposed Joint Pension Boards Quarterly Meeting Schedule

VILLAGE OF WILMETTE FIREFIGHTERS' PENSION FUND
ACTUARIAL VALUATION AS OF JANUARY 1, 2020
CONTRIBUTIONS APPLICABLE TO THE PLAN/FISCAL YEAR ENDING DECEMBER 31, 2020
GASB 67/68 DISCLOSURE INFORMATION AS OF DECEMBER 31, 2019

184 Shuman Blvd, Suite 305 Naperville, IL 60563 · (630) 620-0200 · Fax (239) 481-0634 · www.foster-foster.comꢀ
March 18, 2020
Board of Trustees c/o Ms. Melinda Molloy, Director of Finance Village of Wilmette 1200 Wilmette Avenue Wilmette, IL 60091
Re: Actuarial Valuation Report (including GASB Statements No. 67 and No. 68) – Village of Wilmette Firefighters' Pension Fund
Dear Board:
We are pleased to present to the Board this report of the annual actuarial valuation of the Village of Wilmette Firefighters' Pension Fund. Included are the related results for GASB Statements No. 67 and No. 68. The funding valuation was performed to determine whether the assets and contributions are sufficient to provide the prescribed benefits and to develop the appropriate funding requirements for the applicable plan year. The calculation of the liability for GASB results was performed for the purpose of satisfying the requirements of GASB Statements No. 67 and No. 68. Use of the results for other purposes may not be applicable and could produce significantly different results.
The valuations have been conducted in accordance with generally accepted actuarial principles and practices, including the applicable Actuarial Standards of Practice as issued by the Actuarial Standards Board, and reflects laws and regulations issued to date pursuant to the provisions of Article 4, Illinois Pension Code, as well as applicable federal laws and regulations. In our opinion, the assumptions used in this valuation, as adopted by the Board of Trustees, represent reasonable expectations of anticipated plan experience. Future actuarial measurements may differ significantly from the current measurements presented in this report for a variety of reasons including: changes in applicable laws, changes in plan provisions, changes in assumptions, or plan experience differing from expectations. Due to the limited scope of the valuation, we did not perform an analysis of the potential range of such future measurements.
In conducting the valuation, we have relied on personnel, plan design, and asset information supplied by the Board, financial reports prepared by the custodian bank and the actuarial assumptions and methods described in the Actuarial Assumptions section of this report. While we cannot verify the accuracy of all this information, the supplied information was reviewed for consistency and reasonableness. As a result of this review, we have no reason to doubt the substantial accuracy of the information and believe that it has produced appropriate results. This information, along with any adjustments or modifications, is summarized in various sections of this report.
The total pension liability, net pension liability, and certain sensitivity information shown in the GASB results are based on an actuarial valuation performed as of the valuation date.
The undersigned are familiar with the immediate and long-term aspects of pension valuations and meet the Qualification Standards of the American Academy of Actuaries necessary to render the actuarial opinions contained herein. All of the sections of this report are considered an integral part of the actuarial opinions.

To our knowledge, no associate of Foster & Foster, Inc. working on valuations of the program has any direct financial interest or indirect material interest in the Village of Wilmette, nor does anyone at Foster & Foster, Inc. act as a member of the Board of Trustees of the Village of Wilmette Firefighters' Pension Fund. Thus, there is no relationship existing that might affect our capacity to prepare and certify this actuarial report. If there are any questions, concerns, or comments about any of the items contained in this report, please contact us at 630-620-0200. Respectfully submitted, Foster & Foster, Inc. By: ______________________________
Jason L. Franken, FSA, EA, MAAA By: ______________________________
Heidi E. Andorfer, FSA, EA, MAAA By: ______________________________
Paul M. Baugher, FSA, EA, MAAA
JLF/lke Enclosures

TABLE OF CONTENTS
Section Title Page I Introduction
a. Summary of Report 5 b. Changes Since Prior Valuation 6
c. Comparative Summary of Principal
Valuation Results 7 II Valuation Information
a. Development of Amortization Payment 12
b. Detailed Actuarial (Gain)/Loss Analysis 13
c. Reconciliation of Changes in Contribution Requirement 14
d. Statutory Minimum Required Contribution 15
e. Projection of Benefit Payments 16 f. Actuarial Assumptions and Methods 17
g. Glossary 20
h. Discussion of Risk 21
III Trust Fund 24 IV Member Statistics
a. Statistical Data 28 b. Age and Service Distribution 29 c. Valuation Participant Reconciliation 30
V Summary of Current Plan 31 VI Governmental Accounting Standards Board Statements No. 67 and No. 68 Disclosure Information 34

SUMMARY OF REPORT
The regular annual actuarial valuation of the Village of Wilmette Firefighters' Pension Fund, performed
as of January 1, 2020, has been completed and the results are presented in this Report. The contribution
amounts set forth herein are applicable to the plan/fiscal year ended December 31, 2020.
The contribution requirements, compared with those set forth in the January 1, 2019 actuarial report, are
as follows:
Valuation Date 1/1/2020 1/1/2019 Applicable to Fiscal Year Ending 12/31/2020 12/31/2019
Total Recommended Contribution $3,381,175 $3,190,955 % of Projected Annual Payroll 71.6% 69.5%
Member Contributions (Est.) 446,201 434,121 % of Projected Annual Payroll 9.5% 9.5%
Village Recommended Contribution 2,934,974 2,756,834 % of Projected Annual Payroll 62.1% 60.0%
As you can see, the Total Recommended Contribution shows an increase when compared to the results
determined in the January 1, 2019 actuarial valuation report. The increase is attributable a change in the
amortization period, the benefit increases for Tier 2 participants, and the natural increase in the
amortization payment due to the payroll growth assumption.
Plan experience was favorable overall on the basis of the plan's actuarial assumptions. Sources of
favorable experience included higher than expected inactive mortality, an average salary increase of
3.61% which fell short of the 5.35% assumption, and an investment return of 7.68% (Actuarial Asset
Basis) which exceeded the 7.25% assumption. There were no significant sources of unfavorable
experience.
Village of Wilmette Firefighters' Pension Fund FOSTER & FOSTER | 5
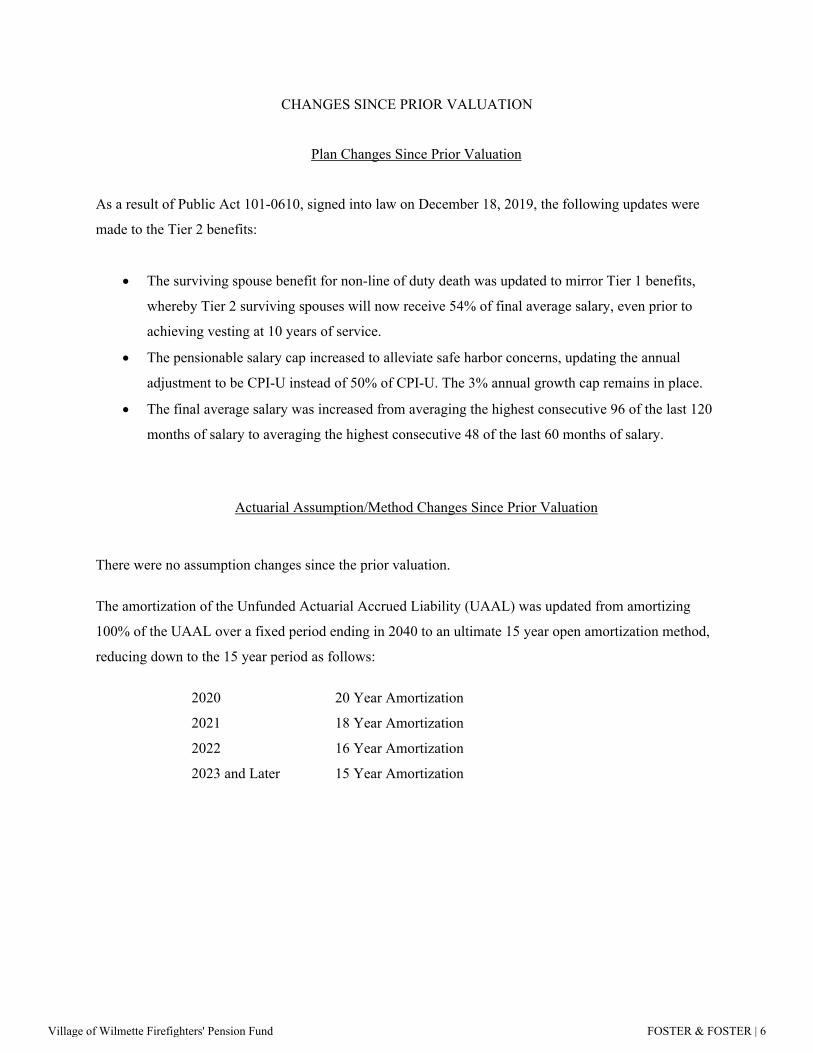
CHANGES SINCE PRIOR VALUATION
Plan Changes Since Prior Valuation
As a result of Public Act 101-0610, signed into law on December 18, 2019, the following updates were
made to the Tier 2 benefits:
The surviving spouse benefit for non-line of duty death was updated to mirror Tier 1 benefits,
whereby Tier 2 surviving spouses will now receive 54% of final average salary, even prior to
achieving vesting at 10 years of service.
The pensionable salary cap increased to alleviate safe harbor concerns, updating the annual
adjustment to be CPI-U instead of 50% of CPI-U. The 3% annual growth cap remains in place.
The final average salary was increased from averaging the highest consecutive 96 of the last 120
months of salary to averaging the highest consecutive 48 of the last 60 months of salary.
Actuarial Assumption/Method Changes Since Prior Valuation
There were no assumption changes since the prior valuation.
The amortization of the Unfunded Actuarial Accrued Liability (UAAL) was updated from amortizing
100% of the UAAL over a fixed period ending in 2040 to an ultimate 15 year open amortization method,
reducing down to the 15 year period as follows:
2020 20 Year Amortization
2021 18 Year Amortization
2022 16 Year Amortization
2023 and Later 15 Year Amortization
Village of Wilmette Firefighters' Pension Fund FOSTER & FOSTER | 6

COMPARATIVE SUMMARY OF PRINCIPAL VALUATION RESULTS
New Bfts/Mthd Old Bfts/Mthd1/1/2020 1/1/2020 1/1/2019
A. Participant Data
Number Included Actives 44 44 44 Service Retirees 47 47 47 Beneficiaries 6 6 7 Disability Retirees 5 5 5 Terminated Vested 1 1 1
Total 103 103 104
Total Annual Payroll $4,719,208 $4,719,208 $4,591,448 Payroll Under Assumed Ret. Age 4,719,208 4,719,208 4,591,448
Annual Rate of Payments to:
Service Retirees 3,627,829 3,627,829 3,466,465 Beneficiaries 246,670 246,670 301,500 Disability Retirees 263,529 263,529 261,579 Terminated Vested 5,648 5,648 5,648
B. Assets
Actuarial Value 49,904,343 49,904,343 47,212,256 Market Value 51,359,783 51,359,783 43,505,740
C. Liabilities
Present Value of Benefits Actives Retirement Benefits 30,874,091 29,785,874 28,957,074 Disability Benefits 2,661,905 2,503,538 2,458,913 Death Benefits 324,715 255,155 237,451 Vested Benefits 1,067,869 1,032,932 999,190 Service Retirees 49,873,800 49,873,800 48,442,997 Beneficiaries 1,529,799 1,529,799 2,108,557 Disability Retirees 3,853,533 3,853,533 3,834,227 Terminated Vested 50,857 50,857 47,439
Total 90,236,569 88,885,488 87,085,848
Village of Wilmette Firefighters' Pension Fund FOSTER & FOSTER | 7

New Bfts/Mthd Old Bfts/MthdC. Liabilities - (Continued) 1/1/2020 1/1/2020 1/1/2019
Present Value of Future Salaries 45,177,152 42,903,022 44,945,521
Present Value of Future Member Contributions 4,271,500 4,056,481 4,249,599
Normal Cost (Retirement) 935,887 889,693 871,246 Normal Cost (Disability) 171,187 166,670 158,920 Normal Cost (Death) 27,406 23,358 20,559 Normal Cost (Vesting) 66,529 65,144 64,156 Total Normal Cost 1,201,009 1,144,865 1,114,881
Present Value of Future Normal Costs 10,403,558 9,279,696 9,440,453
Accrued Liability (Retirement) 22,802,377 22,598,773 21,606,748 Accrued Liability (Disability) 1,082,175 1,063,490 1,011,659 Accrued Liability (Death) 57,460 58,318 55,163 Accrued Liability (Vesting) 583,010 577,222 538,605 Accrued Liability (Inactives) 55,307,989 55,307,989 54,433,220 Total Actuarial Accrued Liability 79,833,011 79,605,792 77,645,395
Unfunded Actuarial Accrued Liability (UAAL) 29,928,668 29,701,449 30,433,139
Funded Ratio (AVA / AL) 62.5% 62.7% 60.8%
Village of Wilmette Firefighters' Pension Fund FOSTER & FOSTER | 8

New Bfts/Mthd Old Bfts/Mthd1/1/2020 1/1/2020 1/1/2019
D. Actuarial Present Value of Accrued BenefitsVested Accrued Benefits
Inactives 55,307,989 55,307,989 54,433,220 Actives 10,443,715 10,420,757 9,380,667 Member Contributions 4,337,823 4,337,823 4,084,391 Total 70,089,527 70,066,569 67,898,278
Non-vested Accrued Benefits 1,129,907 1,123,690 1,544,126 Total Present Value Accrued Benefits 71,219,434 71,190,259 69,442,404
Funded Ratio (MVA / PVAB) 72.1% 72.1% 62.7%
Increase (Decrease) in Present Value of Accrued Benefits Attributable to: Plan Amendments 29,175 0 Assumption Changes 0 0 New Accrued Benefits 0 999,906 Benefits Paid 0 (4,136,671) Interest 0 4,884,620 Other 0 0 Total 29,175 1,747,855
Village of Wilmette Firefighters' Pension Fund FOSTER & FOSTER | 9

New Bfts/Mthd Old Bfts/MthdValuation Date 1/1/2020 1/1/2020 1/1/2019Applicable to Fiscal Year Ending 12/31/2020 12/31/2020 12/31/2019
E. Pension Cost
Normal Cost ¹ $1,237,289 $1,179,449 $1,148,560 % of Total Annual Payroll ¹ 26.2 25.0 25.0
Administrative Expenses ¹ 26,910 26,910 23,415 % of Total Annual Payroll ¹ 0.6 0.6 0.5
Payment Required to Amortize Unfunded Actuarial Accrued Liability over 20 years (as of 1/1/2020) ¹ 2,116,976 2,032,422 2,018,980 % of Total Annual Payroll ¹ 44.8 43.0 44.0
Total Recommended Contribution 3,381,175 3,238,781 3,190,955 % of Total Annual Payroll ¹ 71.6 68.6 69.5
Expected Member Contributions ¹ 446,201 446,201 434,121 % of Total Annual Payroll ¹ 9.5 9.5 9.5
Expected Village Contribution 2,934,974 2,792,580 2,756,834 % of Total Annual Payroll ¹ 62.1 59.1 60.0
F. Past Contributions
Plan Years Ending: 12/31/2019
Total Recommended Contribution 3,199,276 Village Requirement 2,756,834
Actual Contributions Made:
Members (excluding buyback) 442,442Village 2,823,000Total 3,265,442
G. Net Actuarial (Gain)/Loss (766,426)
¹ Contributions developed as of 1/1/2020 displayed above have been adjusted toaccount for assumed interest.
Village of Wilmette Firefighters' Pension Fund FOSTER & FOSTER | 10

H. Schedule Illustrating the Amortization of the Total Unfunded Actuarial Accrued Liability as of:
Projected UnfundedYear Accrued Liability
2020 29,928,6682021 29,894,6152022 29,692,1112032 24,829,5252042 20,673,1392052 17,212,5172062 14,331,193
I. (i) 3 Year Comparison of Actual and Assumed Salary Increases
Actual Assumed
Year Ended 12/31/2019 3.61% 5.35%Year Ended 12/31/2018 3.09% 5.50%Year Ended 12/31/2017 5.27% 5.50%
(ii) 3 Year Comparison of Investment Return on Actuarial Value
Actual Assumed
Year Ended 12/31/2019 7.68% 7.25%Year Ended 12/31/2018 4.70% 7.25%Year Ended 12/31/2017 6.39% 7.25%
Village of Wilmette Firefighters' Pension Fund FOSTER & FOSTER | 11

DEVELOPMENT OF JANUARY 1, 2020 AMORTIZATION PAYMENT
(1) Unfunded Actuarial Accrued Liability as of January 1, 2019 $30,433,139
(2) Sponsor Normal Cost developed as of January 1, 2019 680,760
(3) Expected administrative expenses for the year ended December 31, 2019 22,728
(4) Expected interest on (1), (2) and (3) 2,256,582
(5) Sponsor contributions to the System during the year ended December 31, 2019 2,823,000
(6) Expected interest on (5) 102,334
(7) Expected Unfunded Actuarial Accrued Liability as ofDecember 31, 2019, (1)+(2)+(3)+(4)-(5)-(6) 30,467,875
(8) Change to UAAL due to Benefits/Method Change 227,219
(9) Change to UAAL due to Actuarial (Gain)/Loss (766,426)
(10) Unfunded Accrued Liability as of January 1, 2020 29,928,668
(11) UAAL Subject to Amortization (100% AAL less Actuarial Assets) 29,928,668
Date Years 1/1/2020 AmortizationEstablished Remaining Amount Amount
1/1/2020 20 29,928,668 2,054,901
Village of Wilmette Firefighters' Pension Fund FOSTER & FOSTER | 12
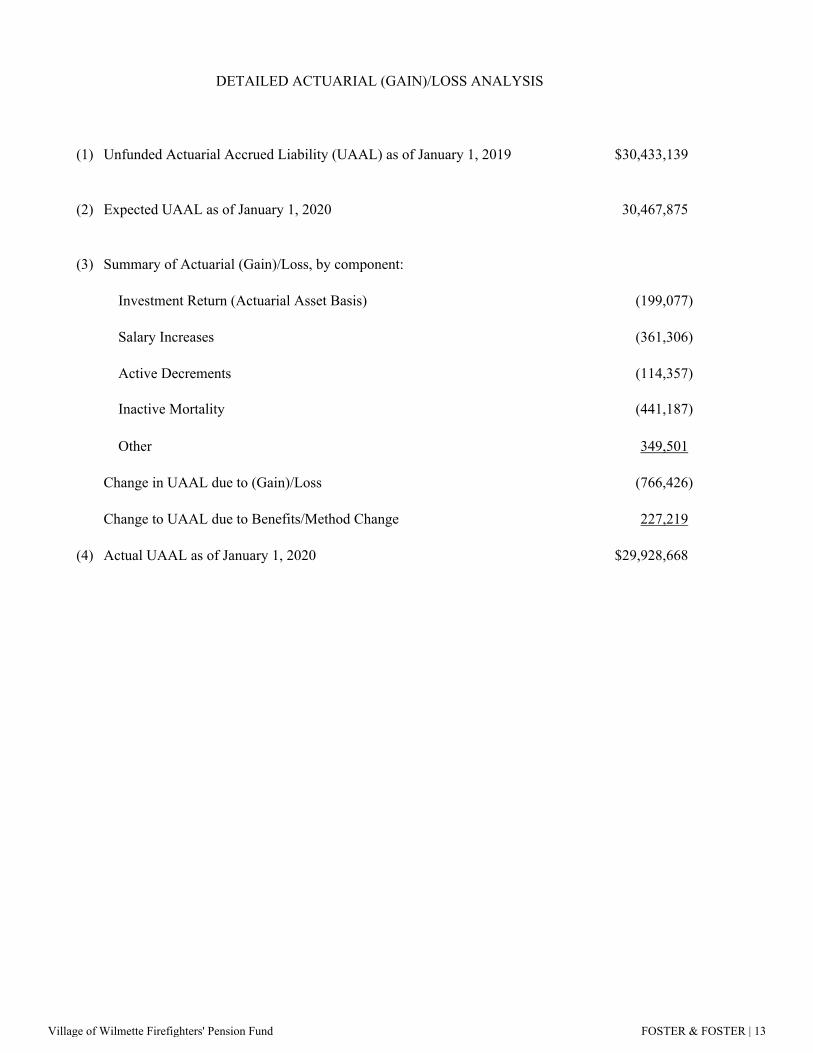
(1) Unfunded Actuarial Accrued Liability (UAAL) as of January 1, 2019 $30,433,139
(2) Expected UAAL as of January 1, 2020 30,467,875
(3) Summary of Actuarial (Gain)/Loss, by component:
Investment Return (Actuarial Asset Basis) (199,077)
Salary Increases (361,306)
Active Decrements (114,357)
Inactive Mortality (441,187)
Other 349,501
Change in UAAL due to (Gain)/Loss (766,426)
Change to UAAL due to Benefits/Method Change 227,219
(4) Actual UAAL as of January 1, 2020 $29,928,668
DETAILED ACTUARIAL (GAIN)/LOSS ANALYSIS
Village of Wilmette Firefighters' Pension Fund FOSTER & FOSTER | 13

(1) Contribution Determined as of January 1, 2019 $2,756,834
(2) Summary of Contribution Impact by component:
Change in Normal Cost 30,889
Change in Assumed Administrative Expense 3,495
Investment Return (Actuarial Asset Basis) (13,623)
Salary Increases (24,724)
New Entrants -
Active Decrements (7,825)
Inactive Mortality (30,190)
Contributions (More) or Less than Recommended (4,692)
Increase in Amortization Payment Due to Payroll Growth Assumption 70,664
Change in Expected Member Contributions (12,080)
Benefits/Method Change 142,394
Other 23,832
Total Change in Contribution 178,140
(3) Contribution Determined as of January 1, 2020 $2,934,974
RECONCILIATION OF CHANGES IN CONTRIBUTION REQUIREMENT
Village of Wilmette Firefighters' Pension Fund FOSTER & FOSTER | 14

New Bfts/Mthd Old Bfts/MthdValuation Date 1/1/2020 1/1/2020 1/1/2019Applicable to Fiscal Year Ending 12/31/2020 12/31/2020 12/31/2019
Actuarial Accrued Liability (PUC) 78,249,263 78,021,128 76,153,102Actuarial Value of Assets 49,904,343 49,904,343 47,212,256Unfunded Actuarial Accrued Liability (UAAL) 28,344,920 28,116,785 28,940,846
UAAL Subject to Amortization 20,519,994 20,314,672 21,325,536
Normal Cost ¹ $1,330,490 $1,272,494 $1,255,434 % of Total Annual Payroll ¹ 28.2 27.0 27.3
Administrative Expenses ¹ 26,910 26,910 23,415 % of Total Annual Payroll ¹ 0.6 0.6 0.5
Payment Required to Amortize Unfunded Actuarial Accrued Liability over 21 years (as of 1/1/2020) ¹ 1,404,150 1,390,100 1,414,768 % of Total Annual Payroll ¹ 29.7 29.4 30.8
Total Required Contribution 2,761,550 2,689,504 2,693,617 % of Total Annual Payroll ¹ 58.5 57.0 58.6
Expected Member Contributions ¹ 446,201 446,201 434,121 % of Total Annual Payroll ¹ 9.5 9.5 9.5
Expected Village Contribution 2,315,349 2,243,303 2,259,496 % of Total Annual Payroll ¹ 49.0 47.5 49.1
Assumptions and Methods: Actuarial Cost Method Projected Unit Credit Amortization Method 90% Funding by 2040
All other assumptions and methods are as described in the Actuarial Assumptions and Methods section.
¹ Contributions developed as of 1/1/2020 displayed above have been adjusted toaccount for assumed interest.
STATUTORY MINIMUM REQUIRED CONTRIBUTION
Contribution requirements shown on this page are calculated according to statutory minimum funding requirements of the Illinois Pension Code. We do not believe this
method is sufficient to fund future benefits; as such, we recommend funding according to the contributions developed in Section E of this report.
Village of Wilmette Firefighters' Pension Fund FOSTER & FOSTER | 15

PROJECTION OF BENEFIT PAYMENTS
Payments for Payments for TotalYear Current Actives Current Inactives Payments
2020 173,071 4,092,946 4,266,0172021 336,195 4,164,209 4,500,4042022 565,598 4,228,993 4,794,5912023 714,673 4,286,973 5,001,6462024 909,092 4,337,848 5,246,9402025 1,153,689 4,403,097 5,556,7862026 1,257,249 4,441,343 5,698,5922027 1,419,402 4,471,564 5,890,9662028 1,558,513 4,493,371 6,051,8842029 1,721,165 4,511,824 6,232,9892030 1,839,217 4,515,600 6,354,8172031 2,084,106 4,509,498 6,593,6042032 2,243,526 4,516,604 6,760,1302033 2,399,909 4,490,743 6,890,6522034 2,589,380 4,453,924 7,043,3042035 2,817,168 4,406,335 7,223,5032036 3,025,502 4,348,430 7,373,9322037 3,264,040 4,280,825 7,544,8652038 3,488,269 4,204,197 7,692,4662039 3,828,558 4,119,216 7,947,7742040 4,260,683 4,026,501 8,287,1842041 4,584,125 3,926,547 8,510,6722042 4,785,567 3,819,692 8,605,2592043 5,011,879 3,706,118 8,717,9972044 5,205,520 3,585,960 8,791,4802045 5,433,110 3,459,232 8,892,3422046 5,685,220 3,325,799 9,011,0192047 5,882,075 3,185,356 9,067,4312048 6,068,260 3,037,532 9,105,7922049 6,252,007 2,881,881 9,133,8882050 6,428,673 2,718,141 9,146,8142051 6,565,524 2,546,403 9,111,9272052 6,680,013 2,367,124 9,047,1372053 6,774,629 2,181,287 8,955,9162054 6,850,177 1,990,475 8,840,6522055 6,907,105 1,796,988 8,704,0932056 6,943,634 1,603,682 8,547,3162057 6,957,635 1,413,698 8,371,3332058 6,950,098 1,230,139 8,180,2372059 6,921,092 1,055,841 7,976,933
Village of Wilmette Firefighters' Pension Fund FOSTER & FOSTER | 16

ACTUARIAL ASSUMPTIONS AND METHODS
Interest Rate 7.25% per year compounded annually, net of investment related expenses.
Mortality Rate Active Lives: PubS-2010 Employee mortality, projected 5 years past the valuation date with Scale MP-2019. 20% of active deaths are assumed to be in the line of duty.
Inactive Lives: PubS-2010 Healthy Retiree mortality, projected 5 years past the valuation date with Scale MP-2019.
Beneficiaries: PubS-2010 Survivor mortality, projected 5 years past the valuation date with Scale MP-2019.
Disabled Lives: PubS-2010 Disabled mortality, projected 5 years past the valuation date with Scale MP-2019.
The mortality assumptions sufficiently accommodate anticipated future mortality improvements.
Retirement Age See table later in this section. Tier 1 Rates are based on an experience study performed in 2012, modified to better reflect the plan’s actual retirement experience. Tier 2 Rates are based on a 2017 experience study performed for the State of Illinois Department of Insurance..
Disability Rate See table later in this section. 80% of the disabilities are assumed to be in the line of duty. This is based on a 2017 experience study performed for the State of Illinois Department of Insurance.
Termination Rate See table later in this section. This is based on a 2017 experience study performed for the State of Illinois Department of Insurance.
Inflation 2.50%.
Cost-of-Living Adjustment Tier 1: 3.00% per year after age 55. Those that retire prior to age 55 receive an increase of 1/12 of 3.00% for each full month since benefit commencement upon reaching age 55.
Tier 2: 1.25% per year after the later of attainment of age 60 or first anniversary of retirement.
Village of Wilmette Firefighters' Pension Fund FOSTER & FOSTER | 17

Salary Increases See table below. This is based on a 2017 experience study performed for the State of Illinois Department of Insurance.
Marital Status 80% of Members are assumed to be married.
Spouse’s Age Males are assumed to be three years older than females.
Funding Method Entry Age Normal Cost Method.
Actuarial Asset Method Investment gains and losses are smoothed over a 3-year period.
Funding Policy Amortization Method The UAAL is amortized according to a Level Percentage of Payroll method. Ultimately, the amortization period will be a 15-year rolling methodology, with a phase in to 15 years as follows:
2020 20 Year Amortization 2021 18 Year Amortization 2022 16 Year Amortization 2023 and Later 15 Year Amortization
The initial amortization amount is 100% of the Accrued Liability less the Actuarial Value of Assets.
Payroll Growth 3.50% per year.
Administrative Expenses Expenses paid out of the fund other than investment-related expenses are assumed to be equal to those paid in the previous year.
Salary ScaleService Rate
0 12.50%1 12.00%2 10.00%3 8.50%4 7.50%5 6.00%6 4.50%
7-26 4.00%27-30 3.75%31+ 3.50%
Village of Wilmette Firefighters' Pension Fund FOSTER & FOSTER | 18

Decrement Tables
% Terminating % Becoming Disabled % Retiring % RetiringDuring the Year During the Year During the Year (Tier 1) ¹ During the Year (Tier 2)Age Rate Age Rate Age Rate Age Rate20 7.00% 20 0.010% 50 - 53 20% 50 - 54 3%25 5.80% 25 0.016% 54 - 59 25% 55 30%30 3.50% 30 0.068% 60 - 62 30% 56 - 59 20%35 1.75% 35 0.220% 63 - 64 33% 60 - 62 25%40 1.10% 40 0.420% 65 - 69 50% 63 - 64 33%45 1.00% 45 0.650% 70+ 100% 65 - 69 50%50 1.00% 50 0.900% 70+ 100%
55+ 0.00% 55 1.240%60 1.580%
¹ 100% at 30 years of service.
Village of Wilmette Firefighters' Pension Fund FOSTER & FOSTER | 19

GLOSSARY Total Annual Payroll is the projected annual rate of pay for the fiscal year following the valuation date of all covered members. Present Value of Benefits is the single sum value on the valuation date of all future benefits to be paid to current Members, Retirees, Beneficiaries, Disability Retirees and Vested Terminations. Normal (Current Year's) Cost is the current year's cost for benefits yet to be funded. Unfunded Accrued Liability is a liability which arises when a pension plan is initially established or improved and such establishment or improvement is applicable to all years of past service. Total Recommended Contribution is equal to the Normal Cost plus an amount sufficient to amortize the Unfunded Accrued Liability over a period of 20 years in the 2020 valuation. This amortization period will grade down to 18 years in the 2021 valuation, 16 years in the 2022 valuation and ultimately 15 years in the 2023 valuation, at which point the methodology will maintain a 15 year rolling amortization each year. The recommended amount is adjusted for interest according to the timing of contributions during the year. Entry Age Normal Cost Method - Under this method, the normal cost is the sum of the individual normal costs for all active participants. For an active participant, the normal cost is the participant’s normal cost accrual rate, multiplied by the participant’s current compensation.
(a) The normal cost accrual rate equals: (i) the present value of future benefits for the participant, determined as of the participant’s entry age, divided by
(ii) the present value of the compensation expected to be paid to the participant for each year of the participant’s anticipated future service, determined as of the participant’s entry age.
(b) In calculating the present value of future compensation, the salary scale is applied both retrospectively and prospectively to estimate compensation in years prior to and subsequent to the valuation year based on the compensation used for the valuation. (c) The accrued liability is the sum of the individual accrued liabilities for all participants and beneficiaries. A participant’s accrued liability equals the present value, at the participant’s attained age, of future benefits less the present value at the participant’s attained age of the individual normal costs payable in the future. A beneficiary’s accrued liability equals the present value, at the beneficiary’s attained age, of future benefits. The unfunded accrued liability equals the total accrued liability less the actuarial value of assets. (d) Under this method, the entry age used for each active participant is the participant’s age at the time he or she would have commenced participation if the plan had always been in existence under current terms, or the age as of which he or she first earns service credits for purposes of benefit accrual under the current terms of the plan.
Village of Wilmette Firefighters' Pension Fund FOSTER & FOSTER | 20

DISCUSSION OF RISK ASOP No. 51, Assessment and Disclosure of Risk Associated with Measuring Pension Obligations and Determining Pension Plan Contributions, states that the actuary should identify risks that, in the actuary’s professional judgment, may reasonably be anticipated to significantly affect the plan’s future financial condition. Throughout this report, actuarial results are determined under various assumption scenarios. These re-sults are based on the premise that all future plan experience will align with the plan’s actuarial assump-tions; however, there is no guarantee that actual plan experience will align with the plan’s assumptions. It is possible that actual plan experience will differ from anticipated experience in an unfavorable manner that will negatively impact the plan’s funded position. Below are examples of ways in which plan experience can deviate from assumptions and the potential im-pact of that deviation. Typically, this results in an actuarial gain or loss representing the current-year fi-nancial impact on the plan’s unfunded liability of the experience differing from assumptions; this gain or loss is amortized over a period of time determined by the plan’s amortization method. When assumptions are selected that adequately reflect plan experience, gains and losses typically offset one another in the long term, resulting in a relatively low impact on the plan’s contribution requirements associated with plan experience. When assumptions are too optimistic, losses can accumulate over time and the plan’s amortization payment could potentially grow to an unmanageable level.
Investment Return: When the rate of return on the Actuarial Value of Assets falls short of the as-sumption, this produces a loss representing assumed investment earnings that were not real-ized. Further, it is unlikely that the plan will experience a scenario that matches the assumed re-turn in each year as capital markets can be volatile from year to year. Therefore, contribution amounts can vary in the future.
Salary Increases: When a plan participant experiences a salary increase that was greater than as-sumed, this produces a loss representing the cost of an increase in anticipated plan benefits for the participant as compared to the previous year. The total gain or loss associated with salary in-creases for the plan is the sum of salary gains and losses for all active participants.
Payroll Growth: The plan’s payroll growth assumption, if one is used, causes a predictable annual
increase in the plan’s amortization payment in order to produce an amortization payment that re-mains constant as a percentage of payroll if all assumptions are realized. If payroll does not in-crease according to the plan’s payroll growth assumption, the plan’s amortization payment can increase significantly as a percentage of payroll even if all assumptions other than the payroll growth assumption are realized.
Demographic Assumptions: Actuarial results take into account various potential events that could
happen to a plan participant, such as retirement, termination, disability, and death. Each of these potential events is assigned a liability based on the likelihood of the event and the financial conse-quence of the event for the plan. Accordingly, actuarial liabilities reflect a blend of financial con-sequences associated with various possible outcomes (such as retirement at one of various possi-ble ages). Once the outcome is known (e.g. the participant retires) the liability is adjusted to re-flect the known outcome. This adjustment produces a gain or loss depending on whether the out-come was more or less favorable than other outcomes that could have occurred.
Contribution Risk: This risk results from the potential that actual employer contributions may deviate from actuarially determined contributions, which are determined in accordance with the
Village of Wilmette Firefighters' Pension Fund FOSTER & FOSTER | 21

Board’s funding policy. The funding policy is intended to result in contribution requirements that if paid when due, will result in a reasonable expectation that assets will accumulate to be suffi-cient to pay plan benefits when due. Contribution deficits, particularly large deficits and those that occur repeatedly, increase future contribution requirements and put the plan at risk for not being able to pay plan benefits when due.
Impact of Plan Maturity on Risk
For newer pension plans, most of the participants and associated liabilities are related to active members who have not yet reached retirement age. As pension plans continue in operation and active members reach retirement ages, liabilities begin to shift from being primarily related to active members to being shared amongst active and retired members. Plan maturity is a measure of the extent to which this shift has occurred. It is important to understand that plan maturity can have an impact on risk tolerance and the overall risk characteristics of the plan. For example, plans with a large amount of retired liability do not have as long of a time horizon to recover from losses (such as losses on investments due to lower than expected investment returns) as plans where the majority of the liability is attributable to active members. For this reason, less tolerance for investment risk may be warranted for highly mature plans with a substantial inactive liability. Similarly, mature plans paying substantial retirement benefits resulting in a small positive or net negative cash flow can be more sensitive to near term investment volatility, particularly if the size of the fund is shrinking, which can result in less assets being available for investment in the market. To assist with determining the maturity of the plan, we have provided some relevant metrics in the table following titled “Plan Maturity Measures and Other Risk Metrics”. Highlights of this information are discussed below:
The Support Ratio, determined as the ratio of active to inactive members, has stayed about the same from January 1, 2017 to January 1, 2020, indicating that the plan's maturity level has not significantly changed during the period.
The Accrued Liability Ratio, determined as the ratio of the Inactive Accrued Liability, which is the liability associated with members who are no longer employed but are due a benefit from the plan, to the Total Accrued Liability, is 69.3%. With a plan of this maturity, losses due to lower than expected investment returns or demographic factors will need to be made up for over a shorter time horizon than would be needed for a less mature plan.
The Funded Ratio, determined as the ratio of the Actuarial Value of Assets to the Total Accrued Liability, has stayed approximately the same from January 1, 2017 to January 1, 2020.
The Net Cash Flow Ratio, determined as the ratio of the Net Cash Flow (contributions minus benefit payments and administrative expenses) to the Market Value of Assets, stayed approximately the same from January 1, 2017 to January 1, 2020. The current Net Cash Flow Ratio of -1.7% indicates that contributions are not currently covering the plan's benefit payments and administrative expenses.
It is important to note that the actuary has identified the risks above as the most significant risks based on the characteristics of the plan and the nature of the project, however, it is not an exhaustive list of potential risks that could be considered. Additional advanced modeling, as well as the identification of additional risks, can be provided at the request of the audience addressed on page 2 of this report.
Village of Wilmette Firefighters' Pension Fund FOSTER & FOSTER | 22

PLAN MATURITY MEASURES AND OTHER RISK METRICS
1/1/2017 1/1/2018 1/1/2019 1/1/2020
Support Ratio
Total Actives 45 44 44 44Total Inactives 59 60 60 59Actives / Inactives 76.3% 73.3% 73.3% 74.6%
Asset Volatility Ratio
Market Value of Assets (MVA) 42,913,432 47,831,607 43,505,740 51,359,783Total Annual Payroll 4,481,012 4,488,651 4,591,448 4,719,208MVA / Total Annual Payroll 957.7% 1065.6% 947.5% 1088.3%
Accrued Liability (AL) Ratio
Inactive Accrued Liability 47,236,808 50,913,973 54,433,220 55,307,989Total Accrued Liability 70,971,377 73,725,005 77,645,395 79,833,011Inactive AL / Total AL 66.6% 69.1% 70.1% 69.3%
Funded Ratio
Actuarial Value of Assets (AVA) 43,986,459 45,941,999 47,212,256 49,904,343Total Accrued Liability 70,971,377 73,725,005 77,645,395 79,833,011AVA / Total Accrued Liability 62.0% 62.3% 60.8% 62.5%
Net Cash Flow RatioNet Cash Flow ¹ (808,176) (829,950) (868,970) (897,350)Market Value of Assets (MVA) 42,913,432 47,831,607 43,505,740 51,359,783Ratio -1.9% -1.7% -2.0% -1.7%
¹ Determined as total contributions minus benefit payments and administrative expenses.
² Average Annual Benefit for Terminated Vested members reflects the benefit for members entitled to a future annual benefit from the plan.
Village of Wilmette Firefighters' Pension Fund FOSTER & FOSTER | 23

STATEMENT OF FIDUCIARY NET POSITION December 31, 2019
ASSETS MARKET VALUECash and Cash Equivalents: Money Market 490,319 Cash 2,362,642
Total Cash and Equivalents 2,852,961
Receivables: Accrued Past Due Interest 107,345
Total Receivable 107,345
Investments: Corporate Bonds 7,059,758 U.S. Gov't and Agency Obligations 8,428,858 Mutual Funds 32,926,571
Total Investments 48,415,187
Total Assets 51,375,493
LIABILITIES
Liabilities: Payable: Accounts Payable 15,710
Total Liabilities 15,710
Net Assets: Active and Retired Members' Equity 51,359,783
NET POSITION RESTRICTED FOR PENSIONS 51,359,783
TOTAL LIABILITIES AND NET ASSETS 51,375,493
Village of Wilmette Firefighters' Pension Fund FOSTER & FOSTER | 24

STATEMENT OF CHANGES IN FIDUCIARY NET POSITION FOR THE YEAR ENDED December 31, 2019
Market Value Basis
ADDITIONSContributions: Member 442,442 Village 2,823,000
Total Contributions 3,265,442
Investment Income: Net Realized Gain (Loss) 2,579,954 Unrealized Gain (Loss) 4,700,291 Net Increase in Fair Value of Investments 7,280,245 Interest & Dividends 1,539,646 Less Investment Expense ¹ (68,498)
Net Investment Income 8,751,393
Total Additions 12,016,835
DEDUCTIONSDistributions to Members: Benefit Payments 4,136,671
Total Distributions 4,136,671
Administrative Expenses 26,121
Total Deductions 4,162,792
Net Increase in Net Position 7,854,043
NET POSITION RESTRICTED FOR PENSIONSBeginning of the Year 43,505,742 Adjustment to beginning of year (2)
End of the Year 51,359,783
¹ Investment Related expenses include investment advisory, custodial and performance monitoring fees.
Village of Wilmette Firefighters' Pension Fund FOSTER & FOSTER | 25

Plan YearEnding Gain/(Loss) 2020 2021 2022
12/31/2017 2,666,842 0 0 012/31/2018 (6,893,194) (2,297,731) 0 012/31/2019 5,629,756 3,753,171 1,876,585 0
Total 1,455,440 1,876,585 0
Market Value of Assets, 12/31/2018 43,505,740Contributions Less Benefit Payments & Administrative Expenses (897,350)
Expected Investment Earnings¹ 3,121,637Actual Net Investment Earnings 8,751,3932019 Actuarial Investment Gain/(Loss) 5,629,756
¹ Expected Investment Earnings = 7.25% x (43,505,740 + 0.5 x -897,350)
Market Value of Assets, 12/31/2019 51,359,783(Gains)/Losses Not Yet Recognized (1,455,440)Actuarial Value of Assets, 12/31/2019 49,904,343
(A) 12/31/2018 Actuarial Assets: 47,212,256
(I) Net Investment Income: 1. Interest and Dividends 1,539,646 2. Realized Gains (Losses) 2,579,954 3. Change in Actuarial Value (461,665) 4. Investment Expenses (68,498) Total 3,589,437
(B) 12/31/2019 Actuarial Assets: 49,904,343
Actuarial Asset Rate of Return = (2 x I) / (A + B - I): 7.68%Market Value of Assets Rate of Return: 20.33%
12/31/2019 Limited Actuarial Assets: 49,904,343
Actuarial Gain/(Loss) due to Investment Return (Actuarial Asset Basis) 199,077
Amounts Not Yet Recognized by Valuation Year
Development of Investment Gain/Loss
Development of Actuarial Value of Assets
ACTUARIAL ASSET VALUATIONDecember 31, 2019
Actuarial Assets for funding purposes are developed by recognizing the total actuarial investment gain or loss for each Plan Year over a three year period. In the first year, one-third of the gain or loss is recognized. By the end of the second year, two-thirds of the gain or loss has been recognized; by the end of the third year, the full gain or loss has been recognized. The actuarial investment gain or loss is defined as the actual return on investments minus the actuarial assumed investment return. Actuarial Assets shall not be less than 80% nor greater than 120% of the Market Value of Assets.
Gains/(Losses) Not Yet Recognized
Village of Wilmette Firefighters' Pension Fund FOSTER & FOSTER | 26

CHANGES IN NET ASSETS AVAILABLE FOR BENEFITS December 31, 2019
Actuarial Asset Basis
INCOMEContributions: Member 442,442 Village 2,823,000
Total Contributions 3,265,442
Earnings from Investments Interest & Dividends 1,539,646 Net Realized Gain (Loss) 2,579,954 Change in Actuarial Value (461,665)
Total Earnings and Investment Gains 3,657,935
EXPENSES Administrative Expenses: Investment Related¹ 68,498 Other 26,121
Total Administrative Expenses 94,619
Distributions to Members: Benefit Payments 4,136,671
Total Distributions 4,136,671
Change in Net Assets for the Year 2,692,087
Net Assets Beginning of the Year 47,212,256
Net Assets End of the Year² 49,904,343
¹ Investment Related expenses include investment advisory, custodial and performance monitoring fees.² Net Assets may be limited for actuarial consideration.
Village of Wilmette Firefighters' Pension Fund FOSTER & FOSTER | 27

STATISTICAL DATA
1/1/2017 1/1/2018 1/1/2019 1/1/2020
Actives - Tier 1
Number 32 30 29 28Average Current Age 43.2 43.5 44.1 44.6Average Age at Employment 27.0 27.2 27.0 26.9Average Past Service 16.2 16.3 17.1 17.7Average Annual Salary $107,411 $109,963 $112,495 $115,559
Actives - Tier 2
Number 13 14 15 16Average Current Age 30.6 31.1 32.1 32.9Average Age at Employment 28.9 28.7 28.3 28.3Average Past Service 1.7 2.4 3.8 4.6Average Annual Salary $80,297 $84,983 $88,607 $92,722
Service Retirees
Number 48 47 47 47Average Current Age 68.5 68.1 68.5 69.0Average Annual Benefit $67,396 $71,834 $73,755 $77,188
Beneficiaries
Number 4 7 7 6Average Current Age 81.4 80.4 81.4 84.0Average Annual Benefit $34,615 $43,071 $43,071 $41,112
Disability Retirees
Number 5 5 5 5Average Current Age 60.8 61.8 62.8 63.8Average Annual Benefit $51,536 $51,926 $52,316 $52,706
Terminated Vested
Number 2 1 1 1Average Current Age 38.8 49.4 50.4 51.4Average Annual Benefit ¹ $5,648 $5,648 $5,648 $5,648
¹ Average Annual Benefit for Terminated Vested members reflects the benefit for members entitled to afuture annual benefit from the plan.
Village of Wilmette Firefighters' Pension Fund FOSTER & FOSTER | 28

AGE AND SERVICE DISTRIBUTION
PAST SERVICE
AGE 0 1 2 3 4 5-9 10-14 15-19 20-24 25-29 30+ Total
15 - 19 0 0 0 0 0 0 0 0 0 0 0 0
20 - 24 0 0 0 0 0 0 0 0 0 0 0 0
25 - 29 0 0 2 1 1 0 0 0 0 0 0 4
30 - 34 2 0 0 0 3 5 0 0 0 0 0 10
35 - 39 0 0 0 1 1 4 3 1 0 0 0 10
40 - 44 0 0 0 0 0 2 2 3 0 0 0 7
45 - 49 0 0 0 0 0 0 0 0 4 0 0 4
50 - 54 0 0 0 0 0 0 0 1 3 2 0 6
55 - 59 0 0 0 0 0 0 0 0 2 1 0 3
60 - 64 0 0 0 0 0 0 0 0 0 0 0 0
65+ 0 0 0 0 0 0 0 0 0 0 0 0
Total 2 0 2 2 5 11 5 5 9 3 0 44
Village of Wilmette Firefighters' Pension Fund FOSTER & FOSTER | 29

VALUATION PARTICIPANT RECONCILIATION
1. Active lives
a. Number in prior valuation 1/1/2019 44
b. Terminations i. Vested (partial or full) with deferred benefits 0 ii. Non-vested or full lump sum distribution received 0 iii. Transferred service to other fund 0 c. Deaths i. Beneficiary receiving benefits 0 ii. No future benefits payable 0 d. Disabled 0 e. Retired (1) f. Continuing participants 43 g. New entrants 1 h. Total active life participants in valuation 44
2. Non-Active lives (including beneficiaries receiving benefits)
ServiceRetirees,Vested Receiving Receiving
Receiving Death Disability VestedBenefits Benefits Benefits Deferred Total
a. Number prior valuation 47 7 5 1 60
Retired 1 0 0 0 1Vested Deferred 0 0 0 0 0Death, With Survivor 0 0 0 0 0Death, No Survivor (1) (1) 0 0 (2)Disabled 0 0 0 0 0Refund of Contributions 0 0 0 0 0Rehires 0 0 0 0 0Expired Annuities 0 0 0 0 0Data Corrections 0 0 0 0 0Hired/Termed in Same Year 0 0 0 0 0
b. Number current valuation 47 6 5 1 59
Village of Wilmette Firefighters' Pension Fund FOSTER & FOSTER | 30

SUMMARY OF CURRENT PLAN
Article 4 Pension Fund The Plan is established and administered as prescribed by “Article 4. Firefighters’ Pension Fund – Municipalities 500,000 and Under” of the Illinois Pension Code.
Plan Administration The Plan is a single employer defined benefit pension plan
administered by a Board of Trustees comprised of:
a.) Two members appointed by the Municipality, b.) Two active Members of the Fire Department elected by the
Membership, and c.) One retired Member of the Fire Department elected by the
Membership.
Credited Service Years and fractional parts of years of service (except as noted below) as a sworn Firefighter employed by the Municipality.
Salary Annual salary, including longevity, attached to firefighter’s rank,
as established by the municipality appropriation ordinance, excluding overtime pay, bonus pay and holiday pay except for the base 8 hours of the 10 pensionable holidays which is included.
For Tier 2 participants, the salary is capped at a rate of $106,800
as of 2011, indexed annually at a rate of CPI-U, but not to exceed 3.00%.
Normal Retirement
Date Tier 1: Age 50 and 20 years of Credited Service. Tier 2: Age 55 and 10 years of Credited Service.
Benefit Tier 1: 50% of annual salary attached to rank on last day of service plus 2.50% of annual salary for each year of service over 20 years, up to a maximum of 75% of salary. The minimum monthly benefit is $1,159.27 per month.
Tier 2: 2.50% per year of service times the average salary for the 48 consecutive months of service within the last 60 months of service in which the total salary was the highest prior to retirement times the number of years of service, up to a maximum of 75% of average salary. The minimum monthly benefit is $1,159.27 per month.
Form of Benefit Tier 1: For married retirees, an annuity payable for the life of the
Member; upon the death of the member, 100% of the Member’s benefit payable to the spouse until death. For unmarried retirees, the normal form is a Single Life Annuity.
Tier 2: Same as above, but with 66 2/3% of benefit continued to
spouse.
Village of Wilmette Firefighters' Pension Fund FOSTER & FOSTER | 31

Early Retirement
Date Tier 1: Age 60 and 10 years of Credited Service. Tier 2: Age 50 and 10 years of Credited Service.
Benefit Tier 1: 1.50% plus 0.10% for each year of service in excess of 10 years, times salary x service (complete years).
Tier 2: Normal Retirement Benefit, reduced 6.00% for each year before age 55, with no minimum benefit.
Form of Benefit Same as Normal Retirement.
Disability Benefit
Eligibility Total and permanent as determined by the Board of Trustees. Seven years of service required for non-service connected disability.
Benefit Amount A maximum of:
a.) 65% of salary attached to the rank held by Member on
last day of service, and; b.) The monthly retirement pension that the Member is
entitled to receive if he or she retired immediately. For non-service connected disabilities, a benefit of 50% of salary attached to rank held by Member on last day of service.
Cost-of-Living Adjustment Tier 1:
Retirees: An annual increase equal to 3.00% per year after age 55. Those that retire prior to age 55 receive an increase of 1/12 of 3.00% for each full month since benefit commencement upon reaching age 55. Disabled Retirees: An annual increase equal to 3.00% per year of the original benefit amount beginning at age 60. Those that become disabled prior to age 60 receive an increase of 3.00% of the original benefit amount for each year since benefit commencement upon reaching age 60.
Tier 2: An annual increase each January 1 equal to 3.00% per
year or one-half of the annual unadjusted percentage increase in the consumer price index-u for the 12 months ending with the September preceding each November 1, whichever is less, of the original pension after the attainment of age 60 or first anniversary of pension start date whichever is later.
Village of Wilmette Firefighters' Pension Fund FOSTER & FOSTER | 32

Pre-Retirement Death Benefit
Service Incurred 100% of salary attached to rank held by Member on last day of service.
Non-Service Incurred A maximum of:
a.) 54% of salary attached to the rank held by Member on last day of service, and;
b.) The monthly retirement pension earned by the deceased Member at the time of death, regardless of whether death occurs before or after age 50.
Vesting (Termination)
Vesting Service Requirement 10 years. Non-Vested Benefit Refund of Member Contributions.
Vested Benefit Either the termination benefit, payable upon reaching age 60 (55
for Tier 2), provided contributions are not withdrawn, or a refund of member contributions.
Termination Benefit Based on the monthly salary attached to the Member’s rank at
separation from service and equals: Tier 1: 1.50% plus 0.10% for each year of service in excess of 10
years, times salary x service (based on complete years). Tier 2: 2.50% of 8-year final average salary times creditable
service. Contributions Employee 9.455% of Salary.
Municipality Remaining amount necessary for payment of Normal (current
year’s) Cost and amortization of the accrued past service liability.
Village of Wilmette Firefighters' Pension Fund FOSTER & FOSTER | 33

GASB 67/68
SUMMARY OF PARTICIPANT DATA
Plan Membership:
1/1/2020 1/1/2019 Inactive Plan Members or Beneficiaries Currently Receiving Benefits 58 59
Inactive Plan Members Entitled to But Not Yet Receiving Benefits 1 1
Active Plan Members 44 44 Total 103 104 Covered Payroll $4,719,208 $4,591,448
Village of Wilmette Firefighters' Pension Fund FOSTER & FOSTER | 34

GASB 67/68
SCHEDULE OF CHANGES IN NET PENSION LIABILITY
GASB 68 Reporting Period Ending 12/31/2019 12/31/2018Measurement Date 12/31/2019 12/31/2018Total Pension LiabilityService Cost 1,118,682 1,246,034 Interest 5,543,639 5,271,850 Changes of Benefit Terms 218,888 - Differences Between Expected and Actual Experience (586,615) (871,854) Changes of Assumptions - 2,309,222 Benefit Payments, Including Refunds of Employee Contributions (4,136,671) (4,023,616) Net Change in Total Pension Liability 2,157,923 3,931,636 Total Pension Liability - Beginning 77,413,633 73,481,997 Total Pension Liability - Ending (a) 79,571,556$ 77,413,633$
Plan Fiduciary Net PositionContributions - Employer 2,823,000 2,750,000 Contributions - Employee 442,442 427,374 Net Investment Income 8,751,393 (3,466,296) Benefit Payments, Including Refunds of Employee Contributions (4,136,671) (4,023,616) Administrative Expense (26,121) (13,400) Net Change in Plan Fiduciary Net Position 7,854,043 (4,325,938) Plan Fiduciary Net Position - Beginning 43,505,742 47,831,680 Adjustment to beginning of year (2) - Plan Fiduciary Net Position - Ending (b) 51,359,783$ 43,505,742$
Net Pension Liability - Ending (a) - (b) 28,211,773$ 33,907,891$
Plan Fiduciary Net Position as a Percentage of the Total Pension Liability 64.55% 56.20%
Covered Payroll 4,719,208$ 4,591,448$ Net Pension Liability as a Percentage of Covered Payroll 597.81% 738.50%
Changes reflected in December 31, 2019 results:
Village of Wilmette Firefighters' Pension Fund FOSTER & FOSTER | 35

GASB 68
STATEMENT OF CHANGES IN NET PENSION LIABILITY
Sensitivity of Net Pension Liability to changes in the Discount Rate:
Pension Plan Fiduciary Net Position Detailed information about the Pension Plan's Fiduciary Net Position is available in a separately issued Plan financial report.
Total Pension Liability
Plan Fiduciary Net Position
Net Pension Liability
(a) (b) (a)-(b)Balances at December 31, 2018 $ 77,413,633 $ 43,505,742 $ 33,907,891 Adjustment to beginning of year - (2) 2 Changes for a Year:
Service Cost 1,118,682 - 1,118,682 Interest 5,543,639 - 5,543,639 Differences Between Expected and Actual Experience (586,615) - (586,615)Changes of Assumptions - - - Changes of Benefit Terms 218,888 - 218,888 Contributions - Employer - 2,823,000 (2,823,000)Contributions - Employee - 442,442 (442,442)Net Investment Income - 8,751,393 (8,751,393)Benefit Payments, Including Refunds of Employee Contributions (4,136,671) (4,136,671) - Administrative Expense - (26,121) 26,121
Net Changes 2,157,923 7,854,043 (5,696,120)Balances at December 31, 2019 $ 79,571,556 $ 51,359,783 $ 28,211,773
Increase (Decrease)
1% Decrease Current Discount
Rate 1% Increase 6.25% 7.25% 8.25%
Sponsor's Net Pension Liability 38,785,297$ 28,211,773$ 19,550,268$
Village of Wilmette Firefighters' Pension Fund FOSTER & FOSTER | 36

GASB 68
PENSION EXPENSE AND DEFERRED OUTFLOWS OF RESOURCES AND DEFERRED INFLOWS OF RESOURCES RELATED TO PENSIONS
YEAR-END DECEMBER 31, 2019
For the year ended December 31, 2019, the Sponsor will recognize a pension expense of $4,009,913. On December 31, 2019, the Sponsor reported deferred outflows of resources and deferred inflows of resources related to pensions from the following sources:
Deferred Outflows of Resources
Deferred Inflows of Resources
Differences between actual and expected experience 95,578 1,360,607
Changes of assumptions 1,539,480 0
Net difference between projected and actual earnings on pension plan investments 0 1,502,403
Total $1,635,058 $2,863,010
Amounts reported as deferred outflows of resources and deferred inflows of resources related to pensions will be recognized in pension expense as follows:
Year-ended December 31:
2020 ($449,029)
2021 ($91,475)
2022 $394,480
2023 ($984,159)
2024 ($97,769)
Thereafter $0
Village of Wilmette Firefighters' Pension Fund FOSTER & FOSTER | 37

GASB 68
COMPONENTS OF PENSION EXPENSE YEAR-END DECEMBER 31, 2019
Net Pension Liability
Deferred Inflows
Deferred Outflows
Pension Expense
Beginning Balance $ 33,907,891 $ 3,042,885 $ 8,697,966
Total Pension Liability Factors:Service Cost 1,118,682 - - 1,118,682 Interest 5,543,639 - - 5,543,639 Changes in Benefit Terms 218,888 - - 218,888 Differences Between Expected and Actual Experience With Regard to Economic or Demographic Assumptions (586,615) 586,615 - -
Current Year Amortization - (533,605) (320,934) (212,671) Changes in Assumptions About Future Economic or Demographic Factors or Other Inputs - - - -
Current Year Amortization - - (449,546) 449,546 Benefit Payments, Including Refunds of Employee Contributions (4,136,671) - - -
Net Change 2,157,923 53,010 (770,480) 7,118,084
Plan Fiduciary Net Position:Contributions - Employer 2,823,000 - - - Contributions - Employee 442,442 - - (442,442) Projected Net Investment Income 3,121,637 - - (3,121,637) Difference Between Projected and Actual Earnings on Pension Plan Investments 5,629,756 5,629,756 - -
Current Year Amortization - (1,726,724) (2,156,511) 429,787 Benefit Payments, Including Refunds of Employee Contributions (4,136,671) - - - Administrative Expenses (26,121) - - 26,121
Net Change 7,854,043 3,903,032 (2,156,511) (3,108,171) Adjustment to beginning of year (2) - - -
Ending Balance $ 28,211,773 $ 6,998,927 $ 5,770,975 $ 4,009,913
Village of Wilmette Firefighters' Pension Fund FOSTER & FOSTER | 38

GASB 68
AMORTIZATION SCHEDULE – EXPERIENCE
Year Base Established
Differences Between Expected and Actual
ExperienceRecognition
Period (Years) 2019 2020 2021 2022 2023 2024 20252019 (586,615)$ 6 (97,770)$ (97,769)$ (97,769)$ (97,769)$ (97,769)$ (97,769)$ -$ 2018 (871,854)$ 6 (145,309)$ (145,309)$ (145,309)$ (145,309)$ (145,309)$ -$ -$ 2017 238,945$ 5 47,789$ 47,789$ 47,789$ -$ -$ -$ -$ 2016 (1,452,630)$ 5 (290,526)$ (290,526)$ -$ -$ -$ -$ -$ 2015 1,365,723$ 5 273,145$ -$ -$ -$ -$ -$ -$
Net Increase (Decrease) in Pension Expense (212,671) (485,815) (195,289) (243,078) (243,078) (97,769) -
Increase (Decrease) in Pension Expense Arising from the Recognition of the Effects of Differences between Expected and Actual Experience
Village of Wilmette Firefighters' Pension Fund FOSTER & FOSTER | 39

GASB 68
AMORTIZATION SCHEDULE – CHANGES OF ASSUMPTIONS
Year Base Established
Effects of Changes in Assumptions
Recognition Period (Years) 2019 2020 2021 2022 2023 2024 2025
2018 2,309,222$ 6 384,870$ 384,870$ 384,870$ 384,870$ 384,870$ -$ -$ 2015 323,382$ 5 64,676$ -$ -$ -$ -$ -$ -$
Net Increase (Decrease) in Pension Expense 449,546$ 384,870$ 384,870$ 384,870$ 384,870$ -$ -$
Increase (Decrease) in Pension Expense Arising from the Recognition of the Effects of Changes of Assumptions
Village of Wilmette Firefighters' Pension Fund FOSTER & FOSTER | 40

GASB 68
AMORTIZATION SCHEDULE – INVESTMENTS
Year Base Established
Differences Between Projected and Actual
EarningsRecognition
Period (Years) 2019 2020 2021 2022 2023 20242019 (5,629,756)$ 5 (1,125,952)$ (1,125,951)$ (1,125,951)$ (1,125,951)$ (1,125,951)$ -$ 2018 6,893,194$ 5 1,378,639$ 1,378,639$ 1,378,639$ 1,378,639$ -$ -$ 2017 (2,668,721)$ 5 (533,744)$ (533,744)$ (533,744)$ -$ -$ -$ 2016 (335,139)$ 5 (67,028)$ (67,028)$ -$ -$ -$ -$ 2015 3,889,360$ 5 777,872$ -$ -$ -$ -$ -$
Net Increase (Decrease) in Pension Expense 429,787$ (348,084)$ (281,056)$ 252,688$ (1,125,951)$ -$
Increase (Decrease) in Pension Expense Arising from the Recognition of the Differences Between Projected and Actual Earnings on Pension Plan Investments
Village of Wilmette Firefighters' Pension Fund FOSTER & FOSTER | 41

GASB 67/68
SCHEDULE OF CONTRIBUTIONS
The following assumptions were used to determine the Actuarially Determined Contribution: Calculation Timing The Actuarially Determined Contribution is calculated using a January 1,
2019 valuation date. Interest Rate 7.25% Mortality Rate Active Lives:
PubS-2010 Employee mortality, projected 5 years past the valuation date with Scale MP-2018. 20% of active deaths are assumed to be in the line of duty.
Inactive Lives:
PubS-2010 Healthy Retiree mortality, projected 5 years past the valuation date with Scale MP-2018.
Beneficiaries: PubS-2010 Survivor mortality, projected 5 years past the valuation date with Scale MP-2018. Disabled Lives: PubS-2010 Disabled mortality, projected 5 years past the valuation date with Scale MP-2018.
Assumptions All other assumptions and methods used for determining the
Actuarially Determined Contribution can be found in the January 1, 2019 Actuarial Valuation Report for the Village of Wilmette Firefighters' Pension Fund prepared by Foster & Foster.
Plan Year-End
Actuarially Determined
Contribution
Contributions in Relation to
the Actuarially Determined
Contributions
Contribution Deficiency
(Excess)Covered
Payroll
Contributions as a Percentage
of Covered Payroll
12/31/2019 2,756,834 2,823,000 (66,166) 4,719,208 59.82%12/31/2018 2,633,068 2,750,000 (116,932) 4,591,448 59.89%
Village of Wilmette Firefighters' Pension Fund FOSTER & FOSTER | 42

GASB 67
SCHEDULE OF INVESTMENT RETURNS For the year ended December 31, 2019, the annual money-weighted return on Pension Plan investments, net of pension plan investment expense, was 20.47 percent. The money-weighted rate of return expresses investment performance, net of investment expense, adjusted for the changing amounts actually invested.
Plan Year-End
Annual Money-Weighted Rate of Return Net of Investment Expense
12/31/2019 20.47%12/31/2018 -7.63%
Village of Wilmette Firefighters' Pension Fund FOSTER & FOSTER | 43

GASB 67/68
ASSUMPTIONS – TOTAL PENSION LIABILITY
The following assumptions were used to determine the Net Pension Liability: Valuation Date January 1, 2020
Measurement Date December 31, 2019
GASB 68 Expense Measurement Period January 1, 2019 - December 31, 2019
Reporting Period January 1, 2019 - December 31, 2019
Discount Rate 7.25% Mortality Rate Active Lives:
PubS-2010 Employee mortality, projected 5 years past the valuation date with Scale MP-2019. 20% of active deaths are assumed to be in the line of duty.
Inactive Lives:
PubS-2010 Healthy Retiree mortality, projected 5 years past the valuation date with Scale MP-2019.
Beneficiaries: PubS-2010 Survivor mortality, projected 5 years past the valuation date with Scale MP-2019. Disabled Lives: PubS-2010 Disabled mortality, projected 5 years past the valuation date with Scale MP-2019.
The mortality assumptions sufficiently accommodate anticipated future
mortality improvements. Retirement Age See table later in this section. Tier 1 Rates are based on an experience
study performed in 2012, modified to better reflect the plan’s actual retirement experience. Tier 2 Rates are based on a 2017 experience study performed for the State of Illinois Department of Insurance.
Disability Rate See table later in this section. 80% of the disabilities are assumed to be in
the line of duty. This is based on a 2017 experience study performed for the State of Illinois Department of Insurance.
Termination Rate See table later in this section. This is based on a 2017 experience study
performed for the State of Illinois Department of Insurance. Inflation 2.50%.
Village of Wilmette Firefighters' Pension Fund FOSTER & FOSTER | 44

GASB 67/68
Cost-of-Living Adjustment Tier 1: 3.00% per year after age 55. Those that retire prior to age 55 receive an increase of 1/12 of 3.00% for each full month since benefit commencement upon reaching age 55.
Tier 2: 1.25% per year after the later of attainment of age 60 or first anniversary of retirement.
Salary Increases See table below. This is based on a 2017 experience study performed for
the State of Illinois Department of Insurance.
Marital Status 80% of Members are assumed to be married. Spouse’s Age Males are assumed to be three years older than females. Method Entry Age Normal Cost Method.
Decrement Tables
Salary ScaleService Rate
0 12.50%1 12.00%2 10.00%3 8.50%4 7.50%5 6.00%6 4.50%
7-26 4.00%27-30 3.75%31+ 3.50%
% Terminating % Becoming Disabled % Retiring % RetiringDuring the Year During the Year During the Year (Tier 1) ¹ During the Year (Tier 2)Age Rate Age Rate Age Rate Age Rate20 7.00% 20 0.010% 50 - 53 20% 50 - 54 3%25 5.80% 25 0.016% 54 - 59 25% 55 30%30 3.50% 30 0.068% 60 - 62 30% 56 - 59 20%35 1.75% 35 0.220% 63 - 64 33% 60 - 62 25%40 1.10% 40 0.420% 65 - 69 50% 63 - 64 33%45 1.00% 45 0.650% 70+ 100% 65 - 69 50%50 1.00% 50 0.900% 70+ 100%
55+ 0.00% 55 1.240%60 1.580%
¹ 100% at 30 years of service.
Village of Wilmette Firefighters' Pension Fund FOSTER & FOSTER | 45

GASB 67/68
NOTES TO THE FINANCIAL STATEMENTS Support for Long-Term Expected Rate of Return The Long-Term Expected Rate of Return on Pension Plan investments can be determined using a building-block method in which best-estimate ranges of expected future real rates of return (expected returns, net of Pension Plan investment expenses and inflation) are developed for each major asset class. These ranges are combined to produce the Long-Term Expected Rate of Return by weighting the expected future real rates of return by target asset allocation percentage and by adding expected inflation. Best estimates of geometric real rates of return for each major asset class included in the Pension Plan’s target asset allocation adopted as of December 31, 2019, as provided by Morgan Stanley, are summarized in the following table:
Inflation rate of investment advisor 1.90% Concentrations The Plan did not hold investments in any one organization that represent 5 percent or more of the Pension Plan’s fiduciary net position. Discount Rate The Discount Rate used to measure the Total Pension Liability was 7.25 percent. The projection of cash flows used to determine the Discount Rate assumed that Plan Member contributions will be made at the current contribution rate and that Sponsor contributions will be made at rates equal to the difference between actuarially determined contribution rates and the Member rate. Based on those assumptions, the Pension Plan’s Fiduciary Net Position was projected to be available to make all projected future benefit payments of current plan members. Therefore, the Long-Term Expected Rate of Return on Pension Plan investments (7.25 percent) was applied to all periods of projected benefit payments to determine the Total Pension Liability. For the purpose of this valuation, the expected rate of return on pension plan investments is 7.25 percent. The municipal bond rate is 3.26 percent (based on the daily rate closest to, but not later than the measurement date of the S&P Municipal Bond 20 Year High Grade Rate Index). The resulting single discount rate is 7.25 percent.
Asset Class Target Allocation
Long Term Expected Real Rate of Return¹
US Large Cap Equity 25.00% 5.72%US Mid Cap Equity 10.00% 6.40%US Small Cap Equity 7.00% 5.46%REITs 3.00% 4.97%Non US Developed Equity 12.00% 5.22%Emerging Markets 8.00% 6.85%Fixed Income 35.00% 1.80%Total 100.00%
Village of Wilmette Firefighters' Pension Fund FOSTER & FOSTER | 46

GASB 67/68
SUMMARY OF CURRENT PLAN
Article 4 Pension Fund The Plan is established and administered as prescribed by “Article 4. Firefighters’ Pension Fund – Municipalities 500,000 and Under” of the Illinois Pension Code.
Plan Administration The Plan is a single employer defined benefit pension plan administered
by a Board of Trustees comprised of:
a.) Two members appointed by the Municipality, b.) Two active Members of the Fire Department elected by the
Membership, and c.) One retired Member of the Fire Department elected by the
Membership.
Benefits Provided: The Plan provides retirement, termination, disability and death benefits. A summary of the benefit provisions can be found in the Actuarial
Valuation as of January 1, 2020 for the Village of Wilmette Firefighters’ Pension Fund prepared by Foster & Foster Actuaries and Consultants.
Incorporated are the benefit changes as noted on the page “Changes Since
Prior Valuation”.
Village of Wilmette Firefighters' Pension Fund FOSTER & FOSTER | 47

VILLAGE OF WILMETTE POLICE PENSION FUND
ACTUARIAL VALUATION AS OF JANUARY 1, 2020
CONTRIBUTIONS APPLICABLE TO THE PLAN/FISCAL YEAR ENDING DECEMBER 31, 2020
GASB 67/68 DISCLOSURE INFORMATION AS OF DECEMBER 31, 2019

184 Shuman Blvd, Suite 305 Naperville, IL 60563 · (630) 620-0200 · Fax (239) 481-0634 · www.foster-foster.comꢀ
March 18, 2020
Board of Trustees c/o Ms. Melinda Molloy, Director of Finance Village of Wilmette 1200 Wilmette Avenue Wilmette, IL 60091
Re: Actuarial Valuation Report (including GASB Statements No. 67 and No. 68) – Village of Wilmette Police Pension Fund
Dear Board:
We are pleased to present to the Board this report of the annual actuarial valuation of the Village of Wilmette Police Pension Fund. Included are the related results for GASB Statements No. 67 and No. 68. The funding valuation was performed to determine whether the assets and contributions are sufficient to provide the prescribed benefits and to develop the appropriate funding requirements for the applicable plan year. The calculation of the liability for GASB results was performed for the purpose of satisfying the requirements of GASB Statements No. 67 and No. 68. Use of the results for other purposes may not be applicable and could produce significantly different results.
The valuations have been conducted in accordance with generally accepted actuarial principles and practices, including the applicable Actuarial Standards of Practice as issued by the Actuarial Standards Board, and reflects laws and regulations issued to date pursuant to the provisions of Article 3, Illinois Pension Code, as well as applicable federal laws and regulations. In our opinion, the assumptions used in this valuation, as adopted by the Board of Trustees, represent reasonable expectations of anticipated plan experience. Future actuarial measurements may differ significantly from the current measurements presented in this report for a variety of reasons including: changes in applicable laws, changes in plan provisions, changes in assumptions, or plan experience differing from expectations. Due to the limited scope of the valuation, we did not perform an analysis of the potential range of such future measurements.
In conducting the valuation, we have relied on personnel, plan design, and asset information supplied by the Board, financial reports prepared by the custodian bank and the actuarial assumptions and methods described in the Actuarial Assumptions section of this report. While we cannot verify the accuracy of all this information, the supplied information was reviewed for consistency and reasonableness. As a result of this review, we have no reason to doubt the substantial accuracy of the information and believe that it has produced appropriate results. This information, along with any adjustments or modifications, is summarized in various sections of this report.
The total pension liability, net pension liability, and certain sensitivity information shown in the GASB results are based on an actuarial valuation performed as of the valuation date.
The undersigned are familiar with the immediate and long-term aspects of pension valuations and meet the Qualification Standards of the American Academy of Actuaries necessary to render the actuarial opinions contained herein. All of the sections of this report are considered an integral part of the actuarial opinions.

To our knowledge, no associate of Foster & Foster, Inc. working on valuations of the program has any direct financial interest or indirect material interest in the Village of Wilmette, nor does anyone at Foster & Foster, Inc. act as a member of the Board of Trustees of the Village of Wilmette Police Pension Fund. Thus, there is no relationship existing that might affect our capacity to prepare and certify this actuarial report. If there are any questions, concerns, or comments about any of the items contained in this report, please contact us at 630-620-0200. Respectfully submitted, Foster & Foster, Inc. By: ______________________________
Jason L. Franken, FSA, EA, MAAA By: ______________________________
Heidi E. Andorfer, FSA, EA, MAAA By: ______________________________
Paul M. Baugher, FSA, EA, MAAA
HEA/lke Enclosures

TABLE OF CONTENTS
Section Title Page I Introduction
a. Summary of Report 5 b. Changes Since Prior Valuation 6
c. Comparative Summary of Principal
Valuation Results 7 II Valuation Information
a. Development of Amortization Payment 12
b. Detailed Actuarial (Gain)/Loss Analysis 13
c. Reconciliation of Changes in Contribution Requirement 14
d. Statutory Minimum Required Contribution 15
e. Projection of Benefit Payments 16 f. Actuarial Assumptions and Methods 17
g. Glossary 20
h. Discussion of Risk 21
III Trust Fund 24 IV Member Statistics
a. Statistical Data 28 b. Age and Service Distribution 29 c. Valuation Participant Reconciliation 30
V Summary of Current Plan 31 VI Governmental Accounting Standards Board Statements No. 67 and No. 68 Disclosure Information 34

SUMMARY OF REPORT
The regular annual actuarial valuation of the Village of Wilmette Police Pension Fund, performed as of
January 1, 2020, has been completed and the results are presented in this Report. The contribution
amounts set forth herein are applicable to the plan/fiscal year ended December 31, 2020.
The contribution requirements, compared with those set forth in the January 1, 2019 actuarial report, are
as follows:
Valuation Date 1/1/2020 1/1/2019 Applicable to Fiscal Year Ending 12/31/2020 12/31/2019
Total Recommended Contribution $2,967,607 $2,687,584 % of Projected Annual Payroll 62.0% 59.2%
Member Contributions (Est.) 474,707 449,999 % of Projected Annual Payroll 9.9% 9.9%
Village Recommended Contribution 2,492,900 2,237,585 % of Projected Annual Payroll 52.1% 49.3%
As you can see, the Total Recommended Contribution shows an increase when compared to the results
determined in the January 1, 2019 actuarial valuation report. The increase is attributable to a change in
the amortization period, the benefit increases for Tier 2 participants, and the natural increase in the
amortization payment due to the payroll growth assumption.
Plan experience was unfavorable overall on the basis of the plan's actuarial assumptions. Sources of
unfavorable experience included the disablement of 1 active employee and lower than expected inactive
mortality. These losses were offset in part by a gain associated with an investment return of 7.71%
(Actuarial Asset Basis) which exceeded the 7.25% assumption.
Village of Wilmette Police Pension Fund FOSTER & FOSTER | 5

CHANGES SINCE PRIOR VALUATION
Plan Changes Since Prior Valuation
As a result of Public Act 101-0610, signed into law on December 18, 2019, the following updates were
made to the Tier 2 benefits:
The surviving spouse benefit for non-line of duty death was updated to mirror Tier 1 benefits,
whereby Tier 2 surviving spouses will now receive 54% of final average salary, even prior to
achieving vesting at 10 years of service.
The pensionable salary cap increased to alleviate safe harbor concerns, updating the annual
adjustment to be CPI-U instead of 50% of CPI-U. The 3% annual growth cap remains in place.
The final average salary was increased from averaging the highest consecutive 96 of the last 120
months of salary to averaging the highest consecutive 48 of the last 60 months of salary.
Actuarial Assumption/Method Changes Since Prior Valuation
There were no assumption changes since the prior valuation.
The amortization of the Unfunded Actuarial Accrued Liability (UAAL) was updated from amortizing
100% of the UAAL over a fixed period ending in 2040 to an ultimate 15 year open amortization method,
reducing down to the 15 year period as follows:
2020 20 Year Amortization
2021 18 Year Amortization
2022 16 Year Amortization
2023 and Later 15 Year Amortization
Village of Wilmette Police Pension Fund FOSTER & FOSTER | 6

COMPARATIVE SUMMARY OF PRINCIPAL VALUATION RESULTS
New Bfts/Mthd Old Bfts/Mthd1/1/2020 1/1/2020 1/1/2019
A. Participant Data
Number Included Actives 44 44 44 Service Retirees 40 40 40 Beneficiaries 8 8 9 Disability Retirees 2 2 1 Terminated Vested 1 1 1
Total 95 95 95
Total Annual Payroll $4,790,179 $4,790,179 $4,540,859 Payroll Under Assumed Ret. Age 4,790,179 4,790,179 4,540,859
Annual Rate of Payments to:
Service Retirees 3,232,426 3,232,426 3,153,152 Beneficiaries 317,504 317,504 341,748 Disability Retirees 77,107 77,107 32,358 Terminated Vested 18,246 18,246 18,246
B. Assets
Actuarial Value 50,193,590 50,193,590 47,457,222 Market Value 51,676,882 51,676,882 43,819,341
C. Liabilities
Present Value of Benefits Actives Retirement Benefits 29,460,661 28,646,312 26,276,918 Disability Benefits 1,740,328 1,641,700 1,627,073 Death Benefits 239,172 180,748 169,696 Vested Benefits 1,495,017 1,441,725 1,465,103 Service Retirees 47,991,686 47,991,686 47,760,099 Beneficiaries 2,352,416 2,352,416 2,505,913 Disability Retirees 1,002,694 1,002,694 388,059 Terminated Vested 137,403 137,403 128,186
Total 84,419,377 83,394,684 80,321,047
Village of Wilmette Police Pension Fund FOSTER & FOSTER | 7

New Bfts/Mthd Old Bfts/MthdC. Liabilities - (Continued) 1/1/2020 1/1/2020 1/1/2019
Present Value of Future Salaries 39,243,181 37,146,548 39,135,260
Present Value of Future Member Contributions 3,888,999 3,681,223 3,878,304
Normal Cost (Retirement) 765,941 728,307 684,564 Normal Cost (Disability) 133,376 130,218 120,818 Normal Cost (Death) 15,206 11,207 9,752 Normal Cost (Vesting) 98,273 96,522 94,749 Total Normal Cost 1,012,796 966,254 909,883
Present Value of Future Normal Costs 7,435,549 6,635,570 6,810,124
Accrued Liability (Retirement) 23,842,801 23,642,927 21,152,554 Accrued Liability (Disability) 714,028 698,922 668,994 Accrued Liability (Death) 102,971 102,493 95,334 Accrued Liability (Vesting) 839,829 830,573 811,784 Accrued Liability (Inactives) 51,484,199 51,484,199 50,782,257 Total Actuarial Accrued Liability 76,983,828 76,759,114 73,510,923
Unfunded Actuarial Accrued Liability (UAAL) 26,790,238 26,565,524 26,053,701
Funded Ratio (AVA / AL) 65.2% 65.4% 64.6%
Village of Wilmette Police Pension Fund FOSTER & FOSTER | 8

New Bfts/Mthd Old Bfts/Mthd1/1/2020 1/1/2020 1/1/2019
D. Actuarial Present Value of Accrued Benefits Vested Accrued Benefits Inactives 51,484,199 51,484,199 50,782,257 Actives 10,479,491 10,358,374 8,769,246 Member Contributions 4,811,487 4,811,487 4,433,994 Total 66,775,177 66,654,060 63,985,497
Non-vested Accrued Benefits 1,579,175 1,601,392 1,274,510 Total Present Value Accrued Benefits 68,354,352 68,255,452 65,260,007
Funded Ratio (MVA / PVAB) 75.6% 75.7% 67.1%
Increase (Decrease) in Present Value of Accrued Benefits Attributable to: Plan Amendments 98,900 0 Assumption Changes 0 0 New Accrued Benefits 0 1,995,762 Benefits Paid 0 (3,601,127) Interest 0 4,600,810 Other 0 0 Total 98,900 2,995,445
Village of Wilmette Police Pension Fund FOSTER & FOSTER | 9

New Bfts/Mthd Old Bfts/MthdValuation Date 1/1/2020 1/1/2020 1/1/2019Applicable to Fiscal Year Ending 12/31/2020 12/31/2020 12/31/2019
E. Pension Cost
Normal Cost ¹ $1,043,391 $995,443 $937,369 % of Total Annual Payroll ¹ 21.8 20.8 20.6
Administrative Expenses ¹ 29,233 29,233 21,774 % of Total Annual Payroll ¹ 0.6 0.6 0.5
Payment Required to Amortize Unfunded Actuarial Accrued Liability over 20 years (as of 1/1/2020) ¹ 1,894,983 1,817,836 1,728,441 % of Total Annual Payroll ¹ 39.6 37.9 38.1
Total Recommended Contribution 2,967,607 2,842,512 2,687,584 % of Total Annual Payroll ¹ 62.0 59.3 59.2
Expected Member Contributions ¹ 474,707 474,707 449,999 % of Total Annual Payroll ¹ 9.9 9.9 9.9
Expected Village Contribution 2,492,900 2,367,805 2,237,585 % of Total Annual Payroll ¹ 52.1 49.4 49.3
F. Past Contributions
Plan Years Ending: 12/31/2019
Total Recommended Contribution 2,707,685 Village Requirement 2,237,585
Actual Contributions Made:
Members (excluding buyback) 470,100Village 2,273,000Total 2,743,100
G. Net Actuarial (Gain)/Loss 463,198
¹ Contributions developed as of 1/1/2020 displayed above have been adjusted toaccount for assumed interest.
Village of Wilmette Police Pension Fund FOSTER & FOSTER | 10

H. Schedule Illustrating the Amortization of the Total Unfunded Actuarial Accrued Liability as of:
Projected UnfundedYear Accrued Liability
2020 26,790,2382021 26,759,7562022 26,578,4882032 22,225,8092042 18,505,2762052 15,407,5502062 12,828,372
I. (i) 3 Year Comparison of Actual and Assumed Salary Increases
Actual Assumed
Year Ended 12/31/2019 5.83% 5.06%Year Ended 12/31/2018 5.84% 5.50%Year Ended 12/31/2017 2.92% 5.50%
(ii) 3 Year Comparison of Investment Return on Actuarial Value
Actual Assumed
Year Ended 12/31/2019 7.71% 7.25%Year Ended 12/31/2018 4.73% 7.25%Year Ended 12/31/2017 6.38% 7.25%
Village of Wilmette Police Pension Fund FOSTER & FOSTER | 11

DEVELOPMENT OF JANUARY 1, 2020 AMORTIZATION PAYMENT
(1) Unfunded Actuarial Accrued Liability as of January 1, 2019 $26,053,701
(2) Sponsor Normal Cost developed as of January 1, 2019 459,884
(3) Expected administrative expenses for the year ended December 31, 2019 21,136
(4) Expected interest on (1), (2) and (3) 1,923,001
(5) Sponsor contributions to the System during the year ended December 31, 2019 2,273,000
(6) Expected interest on (5) 82,396
(7) Expected Unfunded Actuarial Accrued Liability as ofDecember 31, 2019, (1)+(2)+(3)+(4)-(5)-(6) 26,102,326
(8) Change to UAAL due to Benefit Change 224,714
(9) Change to UAAL due to Actuarial (Gain)/Loss 463,198
(10) Unfunded Accrued Liability as of January 1, 2020 26,790,238
(11) UAAL Subject to Amortization (100% AAL less Actuarial Assets) 26,790,238
Date Years 1/1/2020 AmortizationEstablished Remaining Amount Amount
1/1/2020 20 26,790,238 1,839,417
Village of Wilmette Police Pension Fund FOSTER & FOSTER | 12

(1) Unfunded Actuarial Accrued Liability (UAAL) as of January 1, 2019 $26,053,701
(2) Expected UAAL as of January 1, 2020 26,102,326
(3) Summary of Actuarial (Gain)/Loss, by component:
Investment Return (Actuarial Asset Basis) (214,255)
Salary Increases 15,395
Active Decrements 563,701
Inactive Mortality 283,551
Other (185,194)
Change in UAAL due to (Gain)/Loss 463,198
Benefit Changes 224,714
(4) Actual UAAL as of January 1, 2020 $26,790,238
DETAILED ACTUARIAL (GAIN)/LOSS ANALYSIS
Village of Wilmette Police Pension Fund FOSTER & FOSTER | 13

(1) Contribution Determined as of January 1, 2019 $2,237,585
(2) Summary of Contribution Impact by component:
Change in Normal Cost 58,074
Change in Assumed Administrative Expense 7,459
Investment Return (Actuarial Asset Basis) (14,661)
Salary Increases 1,053
New Entrants -
Active Decrements 38,573
Inactive Mortality 19,403
Contributions (More) or Less than Recommended (2,511)
Increase in Amortization Payment Due to Payroll Growth Assumption 60,495
Change in Expected Member Contributions (24,708)
Benefit and Method Change 125,095
Other (12,957)
Total Change in Contribution 255,315
(3) Contribution Determined as of January 1, 2020 $2,492,900
RECONCILIATION OF CHANGES IN CONTRIBUTION REQUIREMENT
Village of Wilmette Police Pension Fund FOSTER & FOSTER | 14

New Bfts/Mthd Old Bfts/MthdValuation Date 1/1/2020 1/1/2020 1/1/2019Applicable to Fiscal Year Ending 12/31/2020 12/31/2020 12/31/2019
Actuarial Accrued Liability (PUC) 75,022,829 74,849,996 71,659,005Actuarial Value of Assets 50,193,590 50,193,590 47,457,222Unfunded Actuarial Accrued Liability (UAAL) 24,829,239 24,656,406 24,201,783
UAAL Subject to Amortization 17,326,956 17,171,406 17,035,883
Normal Cost ¹ $1,227,759 $1,190,721 $1,140,918 % of Total Annual Payroll ¹ 25.6 24.9 25.1
Administrative Expenses ¹ 29,233 29,233 21,774 % of Total Annual Payroll ¹ 0.6 0.6 0.5
Payment Required to Amortize Unfunded Actuarial Accrued Liability over 21 years (as of 1/1/2020) ¹ 1,185,656 1,175,011 1,130,186 % of Total Annual Payroll ¹ 24.8 24.5 24.9
Total Required Contribution 2,442,648 2,394,965 2,292,878 % of Total Annual Payroll ¹ 51.0 50.0 50.5
Expected Member Contributions ¹ 474,707 474,707 449,999 % of Total Annual Payroll ¹ 9.9 9.9 9.9
Expected Village Contribution 1,967,941 1,920,258 1,842,879 % of Total Annual Payroll ¹ 41.1 40.1 40.6
Assumptions and Methods: Actuarial Cost Method Projected Unit Credit Amortization Method 90% Funding by 2040
All other assumptions and methods are as described in the Actuarial Assumptions and Methods section.
¹ Contributions developed as of 1/1/2020 displayed above have been adjusted toaccount for assumed interest.
STATUTORY MINIMUM REQUIRED CONTRIBUTION
Contribution requirements shown on this page are calculated according to statutory minimum funding requirements of the Illinois Pension Code. We do not believe this
method is sufficient to fund future benefits; as such, we recommend funding according to the contributions developed in Section E of this report.
Village of Wilmette Police Pension Fund FOSTER & FOSTER | 15

PROJECTION OF BENEFIT PAYMENTS
Payments for Payments for TotalYear Current Actives Current Inactives Payments
2020 225,834 3,598,903 3,824,7372021 432,808 3,663,348 4,096,1562022 637,221 3,738,686 4,375,9072023 908,643 3,820,284 4,728,9272024 1,045,867 3,881,635 4,927,5022025 1,185,063 3,939,950 5,125,0132026 1,340,736 3,994,913 5,335,6492027 1,448,844 4,046,091 5,494,9352028 1,629,408 4,092,878 5,722,2862029 1,819,345 4,134,568 5,953,9132030 2,018,101 4,170,353 6,188,4542031 2,257,759 4,217,070 6,474,8292032 2,441,063 4,238,840 6,679,9032033 2,729,985 4,252,031 6,982,0162034 2,914,320 4,255,768 7,170,0882035 3,060,749 4,249,162 7,309,9112036 3,230,383 4,231,370 7,461,7532037 3,403,666 4,201,655 7,605,3212038 3,561,532 4,159,476 7,721,0082039 3,689,836 4,104,469 7,794,3052040 3,819,362 4,036,479 7,855,8412041 3,990,359 3,955,689 7,946,0482042 4,131,269 3,862,626 7,993,8952043 4,339,058 3,758,022 8,097,0802044 4,505,548 3,642,727 8,148,2752045 4,707,905 3,517,530 8,225,4352046 4,873,050 3,383,079 8,256,1292047 5,032,940 3,239,922 8,272,8622048 5,145,452 3,088,734 8,234,1862049 5,270,238 2,930,729 8,200,9672050 5,412,723 2,766,199 8,178,9222051 5,569,773 2,596,112 8,165,8852052 5,664,453 2,421,557 8,086,0102053 5,716,342 2,243,615 7,959,9572054 5,743,267 2,063,454 7,806,7212055 5,748,132 1,882,444 7,630,5762056 5,732,261 1,702,159 7,434,4202057 5,696,268 1,524,374 7,220,6422058 5,640,109 1,351,069 6,991,1782059 5,563,886 1,184,341 6,748,227
Village of Wilmette Police Pension Fund FOSTER & FOSTER | 16

ACTUARIAL ASSUMPTIONS AND METHODS
Interest Rate 7.25% per year compounded annually, net of investment related expenses.
Mortality Rate Active Lives: PubS-2010 Employee mortality, projected 5 years past the valuation date with Scale MP-2019. 10% of active deaths are assumed to be in the line of duty.
Inactive Lives: PubS-2010 Healthy Retiree mortality, projected 5 years past the valuation date with Scale MP-2019.
Beneficiaries: PubS-2010 Survivor mortality, projected 5 years past the valuation date with Scale MP-2019.
Disabled Lives: PubS-2010 Disabled mortality, projected 5 years past the valuation date with Scale MP-2019.
The mortality assumptions sufficiently accommodate anticipated future mortality improvements.
Retirement Age See table later in this section.
Tier 1 Rates are based on an experience study performed in 2012, modified to better reflect the plan’s actual retirement experience.
Tier 2 Rates are based on a 2017 experience study performed for the State of Illinois Department of Insurance.
Disability Rate See table later in this section. 60% of the disabilities are assumed to be in the line of duty. This is based on a 2017 experience study performed for the State of Illinois Department of Insurance.
Termination Rate See table later in this section. This is based on a 2017 experience study performed for the State of Illinois Department of Insurance.
Inflation 2.50%.
Cost-of-Living Adjustment Tier 1: 3.00% per year after age 55. Those that retire prior to age 55 receive an increase of 1/12 of 3.00% for each full month since benefit commencement upon reaching age 55.
Tier 2: 1.25% per year after the later of attainment of age 60 or first anniversary of retirement.
Village of Wilmette Police Pension Fund FOSTER & FOSTER | 17

Salary Increases See table below. This is based on a 2017 experience study performed for the State of Illinois Department of Insurance.
Marital Status 80% of Members are assumed to be married. Spouse’s Age Males are assumed to be three years older than females. Funding Method Entry Age Normal Cost Method. Actuarial Asset Method Investment gains and losses are smoothed over a 3-year period. Funding Policy Amortization Method The UAAL is amortized according to a Level Percentage of
Payroll method. Ultimately, the amortization period will be a 15-year rolling methodology, with a phase in to 15 years as follows: 2020 20 Year Amortization 2021 18 Year Amortization 2022 16 Year Amortization 2023 and Later 15 Year Amortization The initial amortization amount is 100% of the Accrued Liability less the Actuarial Value of Assets.
Payroll Growth 3.50% per year. Administrative Expenses Expenses paid out of the fund other than investment-related
expenses are assumed to be equal to those paid in the previous year.
Salary ScaleService Rate
0 11.00%1 10.75%2 8.75%3 8.50%4 7.00%5 6.25%6 5.25%7 4.25%
8 - 16 4.00%17 - 32 3.75%
32+ 3.50%
Village of Wilmette Police Pension Fund FOSTER & FOSTER | 18

Decrement Tables
% Terminating % Becoming Disabled % Retiring % RetiringDuring the Year During the Year During the Year (Tier 1) During the Year (Tier 2)Age Rate Age Rate Age Rate Age Rate20 14.00% 20 0.000% 50 - 54 25% 50 - 54 5%25 10.40% 25 0.030% 55 - 59 25% 55 40%30 5.60% 30 0.140% 60 - 62 30% 56 - 64 25%35 3.10% 35 0.260% 63 - 69 50% 65 - 69 40%40 1.90% 40 0.420% 70+ 100% 70+ 100%45 1.50% 45 0.590%50 1.50% 50 0.710%
56+ 0.00% 55 0.900%60 1.150%
Village of Wilmette Police Pension Fund FOSTER & FOSTER | 19

GLOSSARY Total Annual Payroll is the projected annual rate of pay for the fiscal year following the valuation date of all covered members. Present Value of Benefits is the single sum value on the valuation date of all future benefits to be paid to current Members, Retirees, Beneficiaries, Disability Retirees and Vested Terminations. Normal (Current Year's) Cost is the current year's cost for benefits yet to be funded. Unfunded Accrued Liability is a liability which arises when a pension plan is initially established or improved and such establishment or improvement is applicable to all years of past service. Total Recommended Contribution is equal to the Normal Cost plus an amount sufficient to amortize the Unfunded Accrued Liability over a period of 20 years in the 2020 valuation. This amortization period will grade down to 18 years in the 2021 valuation, 16 years in the 2022 valuation and ultimately 15 years in the 2023 valuation, at which point the methodology will maintain a 15 year rolling amortization each year. The recommended amount is adjusted for interest according to the timing of contributions during the year. Entry Age Normal Cost Method - Under this method, the normal cost is the sum of the individual normal costs for all active participants. For an active participant, the normal cost is the participant’s normal cost accrual rate, multiplied by the participant’s current compensation.
(a) The normal cost accrual rate equals: (i) the present value of future benefits for the participant, determined as of the participant’s entry age, divided by
(ii) the present value of the compensation expected to be paid to the participant for each year of the participant’s anticipated future service, determined as of the participant’s entry age.
(b) In calculating the present value of future compensation, the salary scale is applied both retrospectively and prospectively to estimate compensation in years prior to and subsequent to the valuation year based on the compensation used for the valuation. (c) The accrued liability is the sum of the individual accrued liabilities for all participants and beneficiaries. A participant’s accrued liability equals the present value, at the participant’s attained age, of future benefits less the present value at the participant’s attained age of the individual normal costs payable in the future. A beneficiary’s accrued liability equals the present value, at the beneficiary’s attained age, of future benefits. The unfunded accrued liability equals the total accrued liability less the actuarial value of assets. (d) Under this method, the entry age used for each active participant is the participant’s age at the time he or she would have commenced participation if the plan had always been in existence under current terms, or the age as of which he or she first earns service credits for purposes of benefit accrual under the current terms of the plan.
Village of Wilmette Police Pension Fund FOSTER & FOSTER | 20

DISCUSSION OF RISK
ASOP No. 51, Assessment and Disclosure of Risk Associated with Measuring Pension Obligations and Determining Pension Plan Contributions, states that the actuary should identify risks that, in the actuary’s professional judgment, may reasonably be anticipated to significantly affect the plan’s future financial condition.
Throughout this report, actuarial results are determined under various assumption scenarios. These re-sults are based on the premise that all future plan experience will align with the plan’s actuarial assump-tions; however, there is no guarantee that actual plan experience will align with the plan’s assumptions. It is possible that actual plan experience will differ from anticipated experience in an unfavorable manner that will negatively impact the plan’s funded position.
Below are examples of ways in which plan experience can deviate from assumptions and the potential im-pact of that deviation. Typically, this results in an actuarial gain or loss representing the current-year fi-nancial impact on the plan’s unfunded liability of the experience differing from assumptions; this gain or loss is amortized over a period of time determined by the plan’s amortization method. When assumptions are selected that adequately reflect plan experience, gains and losses typically offset one another in the long term, resulting in a relatively low impact on the plan’s contribution requirements associated with plan experience. When assumptions are too optimistic, losses can accumulate over time and the plan’s amortization payment could potentially grow to an unmanageable level.
Investment Return: When the rate of return on the Actuarial Value of Assets falls short of the as-sumption, this produces a loss representing assumed investment earnings that were not real-ized. Further, it is unlikely that the plan will experience a scenario that matches the assumed re-turn in each year as capital markets can be volatile from year to year. Therefore, contributionamounts can vary in the future.
Salary Increases: When a plan participant experiences a salary increase that was greater than as-sumed, this produces a loss representing the cost of an increase in anticipated plan benefits for theparticipant as compared to the previous year. The total gain or loss associated with salary in-creases for the plan is the sum of salary gains and losses for all active participants.
Payroll Growth: The plan’s payroll growth assumption, if one is used, causes a predictable annualincrease in the plan’s amortization payment in order to produce an amortization payment that re-mains constant as a percentage of payroll if all assumptions are realized. If payroll does not in-crease according to the plan’s payroll growth assumption, the plan’s amortization payment canincrease significantly as a percentage of payroll even if all assumptions other than the payrollgrowth assumption are realized.
Demographic Assumptions: Actuarial results take into account various potential events that couldhappen to a plan participant, such as retirement, termination, disability, and death. Each of thesepotential events is assigned a liability based on the likelihood of the event and the financial conse-quence of the event for the plan. Accordingly, actuarial liabilities reflect a blend of financial con-sequences associated with various possible outcomes (such as retirement at one of various possi-ble ages). Once the outcome is known (e.g. the participant retires) the liability is adjusted to re-flect the known outcome. This adjustment produces a gain or loss depending on whether the out-come was more or less favorable than other outcomes that could have occurred.
Contribution Risk: This risk results from the potential that actual employer contributions maydeviate from actuarially determined contributions, which are determined in accordance with the
Village of Wilmette Police Pension Fund FOSTER & FOSTER | 21

Board’s funding policy. The funding policy is intended to result in contribution requirements that if paid when due, will result in a reasonable expectation that assets will accumulate to be suffi-cient to pay plan benefits when due. Contribution deficits, particularly large deficits and those that occur repeatedly, increase future contribution requirements and put the plan at risk for not being able to pay plan benefits when due.
Impact of Plan Maturity on Risk
For newer pension plans, most of the participants and associated liabilities are related to active members who have not yet reached retirement age. As pension plans continue in operation and active members reach retirement ages, liabilities begin to shift from being primarily related to active members to being shared amongst active and retired members. Plan maturity is a measure of the extent to which this shift has occurred. It is important to understand that plan maturity can have an impact on risk tolerance and the overall risk characteristics of the plan. For example, plans with a large amount of retired liability do not have as long of a time horizon to recover from losses (such as losses on investments due to lower than expected investment returns) as plans where the majority of the liability is attributable to active members. For this reason, less tolerance for investment risk may be warranted for highly mature plans with a substantial inactive liability. Similarly, mature plans paying substantial retirement benefits resulting in a small positive or net negative cash flow can be more sensitive to near term investment volatility, particularly if the size of the fund is shrinking, which can result in less assets being available for investment in the market. To assist with determining the maturity of the plan, we have provided some relevant metrics in the table following titled “Plan Maturity Measures and Other Risk Metrics”. Highlights of this information are discussed below:
The Support Ratio, determined as the ratio of active to inactive members, has decreased from 97.8% on January 1, 2017 to 86.3% on January 1, 2020, indicating that the plan has been maturing.
The Accrued Liability Ratio, determined as the ratio of the Inactive Accrued Liability, which is the liability associated with members who are no longer employed but are due a benefit from the plan, to the Total Accrued Liability, is 66.9%. With a plan of this maturity, losses due to lower than expected investment returns or demographic factors will need to be made up for over a shorter time horizon than would be needed for a less mature plan.
The Funded Ratio, determined as the ratio of the Actuarial Value of Assets to the Total Accrued Liability, has stayed approximately the same from January 1, 2017 to January 1, 2020.
The Net Cash Flow Ratio, determined as the ratio of the Net Cash Flow (contributions minus benefit payments and administrative expenses) to the Market Value of Assets, stayed approximately the same from January 1, 2017 to January 1, 2020. The current Net Cash Flow Ratio of -1.7% indicates that contributions are not currently covering the plan's benefit payments and administrative expenses.
It is important to note that the actuary has identified the risks above as the most significant risks based on the characteristics of the plan and the nature of the project, however, it is not an exhaustive list of potential risks that could be considered. Additional advanced modeling, as well as the identification of additional risks, can be provided at the request of the audience addressed on page 2 of this report.
Village of Wilmette Police Pension Fund FOSTER & FOSTER | 22

PLAN MATURITY MEASURES AND OTHER RISK METRICS
1/1/2017 1/1/2018 1/1/2019 1/1/2020
Support Ratio
Total Actives 44 43 44 44Total Inactives 45 49 51 51Actives / Inactives 97.8% 87.8% 86.3% 86.3%
Asset Volatility Ratio
Market Value of Assets (MVA) 42,905,231 47,940,632 43,819,341 51,676,882Total Annual Payroll 4,539,433 4,260,793 4,540,859 4,790,179MVA / Total Annual Payroll 945.2% 1125.2% 965.0% 1078.8%
Accrued Liability (AL) Ratio
Inactive Accrued Liability 36,806,332 43,944,789 50,782,257 51,484,199Total Accrued Liability 65,652,493 68,551,980 73,510,923 76,983,828Inactive AL / Total AL 56.1% 64.1% 69.1% 66.9%
Funded Ratio
Actuarial Value of Assets (AVA) 43,964,723 46,112,905 47,457,222 50,193,590Total Accrued Liability 65,652,493 68,551,980 73,510,923 76,983,828AVA / Total Accrued Liability 67.0% 67.3% 64.6% 65.2%
Net Cash Flow RatioNet Cash Flow ¹ (398,561) (634,500) (818,832) (886,403)Market Value of Assets (MVA) 42,905,231 47,940,632 43,819,341 51,676,882Ratio -0.9% -1.3% -1.9% -1.7%
¹ Determined as total contributions minus benefit payments and administrative expenses.
² Average Annual Benefit for Terminated Vested members reflects the benefit for members entitled to a future annual benefit from the plan.
Village of Wilmette Police Pension Fund FOSTER & FOSTER | 23

STATEMENT OF FIDUCIARY NET POSITION December 31, 2019
ASSETS MARKET VALUECash and Cash Equivalents: Money Market 470,901 Cash 1,915,025
Total Cash and Equivalents 2,385,926
Receivables: Accrued Past Due Interest 110,090
Total Receivable 110,090
Investments: Corporate Bonds 7,329,230 U.S. Gov't and Agency Obligations 8,767,125 Mutual Funds 33,103,011
Total Investments 49,199,366
Total Assets 51,695,382
LIABILITIES
Liabilities: Payable: Accounts Payable 18,500
Total Liabilities 18,500
Net Assets: Active and Retired Members' Equity 51,676,882
NET POSITION RESTRICTED FOR PENSIONS 51,676,882
TOTAL LIABILITIES AND NET ASSETS 51,695,382
Village of Wilmette Police Pension Fund FOSTER & FOSTER | 24

STATEMENT OF CHANGES IN FIDUCIARY NET POSITION FOR THE YEAR ENDED December 31, 2019
Market Value Basis
ADDITIONSContributions: Member 470,100 Village 2,273,000
Total Contributions 2,743,100
Investment Income: Net Realized Gain (Loss) 2,580,564 Unrealized Gain (Loss) 4,582,452 Net Increase in Fair Value of Investments 7,163,016 Interest & Dividends 1,651,741 Less Investment Expense ¹ (70,813)
Net Investment Income 8,743,944
Total Additions 11,487,044
DEDUCTIONSDistributions to Members: Benefit Payments 3,587,366 Refund of Contributions/Transfers 13,761
Total Distributions 3,601,127
Administrative Expenses 28,376
Total Deductions 3,629,503
Net Increase in Net Position 7,857,541
NET POSITION RESTRICTED FOR PENSIONSBeginning of the Year 43,819,341
End of the Year 51,676,882
¹ Investment Related expenses include investment advisory, custodial and performance monitoring fees.
Village of Wilmette Police Pension Fund FOSTER & FOSTER | 25

Plan YearEnding Gain/(Loss) 2020 2021 2022
12/31/2017 2,583,300 0 0 012/31/2018 (6,748,472) (2,249,491) 0 012/31/2019 5,599,174 3,732,783 1,866,391 0
Total 1,483,292 1,866,391 0
Market Value of Assets, 12/31/2018 43,819,341Contributions Less Benefit Payments & Administrative Expenses (886,403)
Expected Investment Earnings¹ 3,144,770Actual Net Investment Earnings 8,743,9442019 Actuarial Investment Gain/(Loss) 5,599,174
¹ Expected Investment Earnings = 7.25% x (43,819,341 + 0.5 x -886,403)
Market Value of Assets, 12/31/2019 51,676,882(Gains)/Losses Not Yet Recognized (1,483,292)Actuarial Value of Assets, 12/31/2019 50,193,590
(A) 12/31/2018 Actuarial Assets: 47,457,222
(I) Net Investment Income: 1. Interest and Dividends 1,651,741 2. Realized Gains (Losses) 2,580,564 3. Change in Actuarial Value (538,721) 4. Investment Expenses (70,813) Total 3,622,771
(B) 12/31/2019 Actuarial Assets: 50,193,590
Actuarial Asset Rate of Return = (2 x I) / (A + B - I): 7.71%Market Value of Assets Rate of Return: 20.16%
12/31/2019 Limited Actuarial Assets: 50,193,590
Actuarial Gain/(Loss) due to Investment Return (Actuarial Asset Basis) 214,255
Amounts Not Yet Recognized by Valuation Year
Development of Investment Gain/Loss
Development of Actuarial Value of Assets
ACTUARIAL ASSET VALUATIONDecember 31, 2019
Actuarial Assets for funding purposes are developed by recognizing the total actuarial investment gain or loss for each Plan Year over a three year period. In the first year, one-third of the gain or loss is recognized. By the end of the second year, two-thirds of the gain or loss has been recognized; by the end of the third year, the full gain or loss has been recognized. The actuarial investment gain or loss is defined as the actual return on investments minus the actuarial assumed investment return. Actuarial Assets shall not be less than 80% nor greater than 120% of the Market Value of Assets.
Gains/(Losses) Not Yet Recognized
Village of Wilmette Police Pension Fund FOSTER & FOSTER | 26

CHANGES IN NET ASSETS AVAILABLE FOR BENEFITS December 31, 2019
Actuarial Asset Basis
INCOMEContributions: Member 470,100 Village 2,273,000
Total Contributions 2,743,100
Earnings from Investments Interest & Dividends 1,651,741 Net Realized Gain (Loss) 2,580,564 Change in Actuarial Value (538,721)
Total Earnings and Investment Gains 3,693,584
EXPENSES Administrative Expenses: Investment Related¹ 70,813 Other 28,376
Total Administrative Expenses 99,189
Distributions to Members: Benefit Payments 3,587,366 Refund of Contributions/Transfers 13,761
Total Distributions 3,601,127
Change in Net Assets for the Year 2,736,368
Net Assets Beginning of the Year 47,457,222
Net Assets End of the Year² 50,193,590
¹ Investment Related expenses include investment advisory, custodial and performance monitoring fees.² Net Assets may be limited for actuarial consideration.
Village of Wilmette Police Pension Fund FOSTER & FOSTER | 27

STATISTICAL DATA
1/1/2017 1/1/2018 1/1/2019 1/1/2020
Actives - Tier 1
Number 34 30 27 27Average Current Age 45.8 46.1 46.4 47.4Average Age at Employment 27.5 28.1 28.5 28.1Average Past Service 18.3 18.0 17.9 19.3Average Annual Salary $108,554 $105,353 $115,874 $120,388
Actives - Tier 2
Number 10 13 17 17Average Current Age 28.7 28.2 28.5 28.9Average Age at Employment 25.7 25.1 25.6 24.8Average Past Service 3.0 3.1 2.9 4.1Average Annual Salary $84,861 $84,630 $83,075 $90,571
Service Retirees
Number 33 37 40 40Average Current Age 67.0 66.2 65.2 66.2Average Annual Benefit $71,309 $76,139 $78,829 $80,811
Beneficiaries
Number 9 9 9 8Average Current Age 77.8 78.8 79.8 78.9Average Annual Benefit $37,972 $37,972 $37,972 $39,688
Disability Retirees
Number 1 2 1 2Average Current Age 66.8 58.8 68.8 50.9Average Annual Benefit $30,920 $40,533 $32,358 $38,554
Terminated Vested
Number 2 1 1 1Average Current Age 47.7 47.4 48.4 49.4Average Annual Benefit ¹ $35,189 $18,246 $18,246 $18,246
¹ Average Annual Benefit for Terminated Vested members reflects the benefit for members entitled to afuture annual benefit from the plan.
Village of Wilmette Police Pension Fund FOSTER & FOSTER | 28

AGE AND SERVICE DISTRIBUTION
PAST SERVICE
AGE 0 1 2 3 4 5-9 10-14 15-19 20-24 25-29 30+ Total
15 - 19 0 0 0 0 0 0 0 0 0 0 0 0
20 - 24 2 2 0 0 0 0 0 0 0 0 0 4
25 - 29 0 1 2 0 0 2 0 0 0 0 0 5
30 - 34 0 1 0 0 0 6 0 0 0 0 0 7
35 - 39 0 0 0 0 0 1 4 0 0 0 0 5
40 - 44 0 0 0 0 0 0 2 6 0 0 0 8
45 - 49 0 0 0 0 0 0 0 2 2 0 0 4
50 - 54 0 0 0 0 0 0 0 1 3 4 0 8
55 - 59 0 0 0 0 0 0 0 1 0 0 0 1
60 - 64 0 0 0 0 0 0 0 0 0 1 0 1
65+ 0 0 0 0 0 0 0 0 1 0 0 1
Total 2 4 2 0 0 9 6 10 6 5 0 44
Village of Wilmette Police Pension Fund FOSTER & FOSTER | 29

VALUATION PARTICIPANT RECONCILIATION
1. Active lives
a. Number in prior valuation 1/1/2019 44
b. Terminations i. Vested (partial or full) with deferred benefits 0 ii. Non-vested or full lump sum distribution received (1) iii. Transferred service to other fund 0 c. Deaths i. Beneficiary receiving benefits 0 ii. No future benefits payable 0 d. Disabled (1) e. Retired 0 f. Continuing participants 42 g. New entrants 2 h. Total active life participants in valuation 44
2. Non-Active lives (including beneficiaries receiving benefits)
ServiceRetirees,Vested Receiving Receiving
Receiving Death Disability VestedBenefits Benefits Benefits Deferred Total
a. Number prior valuation 40 9 1 1 51
Retired 0 0 0 0 0Vested Deferred 0 0 0 0 0Death, With Survivor 0 0 0 0 0Death, No Survivor 0 (1) 0 0 (1)Disabled 0 0 1 0 1Refund of Contributions 0 0 0 0 0Rehires 0 0 0 0 0Expired Annuities 0 0 0 0 0Data Corrections 0 0 0 0 0Hired/Termed in Same Year 0 0 0 0 0
b. Number current valuation 40 8 2 1 51
Village of Wilmette Police Pension Fund FOSTER & FOSTER | 30

SUMMARY OF CURRENT PLAN
Article 3 Pension Fund The Plan is established and administered as prescribed by “Article 3. Police Pension Fund – Municipalities 500,000 and Under” ofthe Illinois Pension Code.
Plan Administration The Plan is a single employer defined benefit pension plan administered by a Board of Trustees comprised of:
a.) Two members appointed by the Municipality, b.) Two active Members of the Police Department elected
by the Membership, and c.) One retired Member of the Police Department elected
by the Membership.
Credited Service Complete years of service as a sworn police officer employed by the Municipality.
Normal Retirement
Date Tier 1: Age 50 and 20 years of Credited Service.
Tier 2: Age 55 with 10 years of Credited Service.
Benefit Tier 1: 50% of annual salary attached to rank on last day of service plus 2.50% of annual salary for each year of service over 20 years, up to a maximum of 75% of salary. The minimum monthly benefit is $1,000 per month.
Tier 2: 2.50% per year of service times the average salary for the 48 consecutive months of service within the last 60 months of service in which the total salary was the highest prior to retirement times the number of years of service, up to a maximum of 75% of average salary. The minimum monthly benefit is $1,000 per month.
For Tier 2 participants, the salary is capped at a rate of $106,800 as of 2011, indexed annually at a rate of CPI-U, but not to exceed 3.00%.
Form of Benefit Tier 1: For married retirees, an annuity payable for the life of the Member; upon the death of the member, 100% of the Member’s benefit payable to the spouse until death. For unmarried retirees, the normal form is a Single Life Annuity.
Tier 2: Same as above, but with 66 2/3% of benefit continued to spouse.
Village of Wilmette Police Pension Fund FOSTER & FOSTER | 31

Early Retirement
Date Tier 1: Age 60 and 8 years of Credited Service.
Tier 2: Age 50 with 10 years of Credited Service.
Benefit Tier 1: Normal Retirement benefit with no minimum.
Tier 2: Normal Retirement benefit, reduced 6.00% each year before age 55, with no minimum benefit.
Form of Benefit Same as Normal Retirement.
Disability Benefit
Eligibility Total and permanent as determined by the Board of Trustees.
Benefit Amount A maximum of:
a.) 65% of salary attached to the rank held by Member on last day of service, and;
b.) The monthly retirement pension that the Member is entitled to receive if he or she retired immediately.
For non-service connected disabilities, a benefit of 50% of salary attached to rank held by Member on last day of service.
Cost-of-Living Adjustment Tier 1:
Retirees: An annual increase equal to 3.00% per year after age 55. Those that retire prior to age 55 receive an increase of 1/12 of 3.00% for each full month since benefit commencement upon reaching age 55. Disabled Retirees: An annual increase equal to 3.00% per year of the original benefit amount beginning at age 60. Those that become disabled prior to age 60 receive an increase of 3.00% of the original benefit amount for each year since benefit commencement upon reaching age 60.
Tier 2: An annual increase each January 1 equal to 3.00% per
year or one-half of the annual unadjusted percentage increase in the consumer price index-u for the 12 months ending with the September preceding each November 1, whichever is less, of the original pension after the attainment of age 60 or first anniversary of pension start date whichever is later.
Village of Wilmette Police Pension Fund FOSTER & FOSTER | 32

Pre-Retirement Death Benefit
Service Incurred 100% of salary attached to rank held by Member on last day of service.
Non-Service Incurred A maximum of:
a.) 50% of salary attached to the rank held by Member on last day of service, and;
b.) The monthly retirement pension earned by the deceased Member at the time of death, regardless of whether death occurs before or after age 50.
For non-service deaths with less than 10 years of service, a re-fund of member contributions is provided.
Vesting (Termination)
Vesting Service Requirement Tier 1: 8 years.
Tier 2: 10 years.
Non-Vested Benefit Refund of Member Contributions.
Vested Benefit Either the termination benefit, payable upon reaching age 60 (55 for Tier 2), provided contributions are not withdrawn, or a refund of member contributions. The termination benefit is 2.50% of annual salary held in the year prior to termination (8-year final average salary for Tier 2) times creditable service.
Contributions
Employee 9.91% of Salary.
Municipality Remaining amount necessary for payment of Normal (current year’s) Cost and amortization of the accrued past service liability.
Village of Wilmette Police Pension Fund FOSTER & FOSTER | 33

GASB 67/68
SUMMARY OF PARTICIPANT DATA
Plan Membership:
1/1/2020 1/1/2019 Inactive Plan Members or Beneficiaries Currently Receiving Benefits 50 50
Inactive Plan Members Entitled to But Not Yet Receiving Benefits 1 1
Active Plan Members 44 44 Total 95 95 Covered Payroll $4,790,179 $4,540,859
Village of Wilmette Police Pension Fund FOSTER & FOSTER | 34

GASB 67/68
SCHEDULE OF CHANGES IN NET PENSION LIABILITY
GASB 68 Reporting Period Ending 12/31/2019 12/31/2018Measurement Date 12/31/2019 12/31/2018Total Pension LiabilityService Cost 972,492 1,043,688 Interest 5,235,690 4,889,912 Changes of Benefit Terms 213,461 -Differences Between Expected and Actual Experience 630,014 744,635 Changes of Assumptions - 1,653,451Benefit Payments, Including Refunds of Employee Contributions (3,601,127) (3,381,115)Net Change in Total Pension Liability 3,450,530 4,950,571 Total Pension Liability - Beginning 73,044,492 68,093,921 Total Pension Liability - Ending (a) 76,495,022$ 73,044,492$
Plan Fiduciary Net PositionContributions - Employer 2,273,000 2,127,000 Contributions - Employee 470,100 456,418 Net Investment Income 8,743,944 (3,311,013) Benefit Payments, Including Refunds of Employee Contributions (3,601,127) (3,381,115) Administrative Expense (28,376) (12,569) Net Change in Plan Fiduciary Net Position 7,857,541 (4,121,279) Plan Fiduciary Net Position - Beginning 43,819,341 47,940,620 Plan Fiduciary Net Position - Ending (b) 51,676,882$ 43,819,341$
Net Pension Liability - Ending (a) - (b) 24,818,140$ 29,225,151$
Plan Fiduciary Net Position as a Percentage of the Total Pension Liability 67.56% 59.99%
Covered Payroll 4,790,179$ 4,540,859$ Net Pension Liability as a Percentage of Covered Payroll 518.10% 643.60%
Village of Wilmette Police Pension Fund FOSTER & FOSTER | 35

GASB 68
STATEMENT OF CHANGES IN NET PENSION LIABILITY
Sensitivity of Net Pension Liability to changes in the Discount Rate:
Pension Plan Fiduciary Net Position Detailed information about the Pension Plan's Fiduciary Net Position is available in a separately issued Plan financial report.
Total Pension Liability
Plan Fiduciary Net Position
Net Pension Liability
(a) (b) (a)-(b)Balances at December 31, 2018 $ 73,044,492 $ 43,819,341 $ 29,225,151 Changes for a Year:
Service Cost 972,492 - 972,492 Interest 5,235,690 - 5,235,690 Differences Between Expected and Actual Experience 630,014 - 630,014 Changes of Assumptions - - - Changes of Benefit Terms 213,461 - 213,461 Contributions - Employer - 2,273,000 (2,273,000)Contributions - Employee - 470,100 (470,100)Net Investment Income - 8,743,944 (8,743,944)Benefit Payments, Including Refunds of Employee Contributions (3,601,127) (3,601,127) - Administrative Expense - (28,376) 28,376
Net Changes 3,450,530 7,857,541 (4,407,011)Balances at December 31, 2019 $ 76,495,022 $ 51,676,882 $ 24,818,140
Increase (Decrease)
1% Decrease Current Discount
Rate 1% Increase 6.25% 7.25% 8.25%
Sponsor's Net Pension Liability 35,150,765$ 24,818,140$ 16,342,965$
Village of Wilmette Police Pension Fund FOSTER & FOSTER | 36

GASB 68
PENSION EXPENSE AND DEFERRED OUTFLOWS OF RESOURCES AND DEFERRED INFLOWS OF RESOURCES RELATED TO PENSIONS
YEAR-END DECEMBER 31, 2019
For the year ended December 31, 2019, the Sponsor will recognize a pension expense of $3,867,079. On December 31, 2019, the Sponsor reported deferred outflows of resources and deferred inflows of resources related to pensions from the following sources:
Deferred Outflows of Resources
Deferred Inflows of Resources
Differences between actual and expected experience 1,005,649 90,655
Changes of assumptions 992,070 0
Net difference between projected and actual earnings on pension plan investments 0 1,526,924
Total $1,997,719 $1,617,579
Amounts reported as deferred outflows of resources and deferred inflows of resources related to pensions will be recognized in pension expense as follows:
Year-ended December 31:
2020 $192,261
2021 $346,232
2022 $835,479
2023 ($993,832)
2024 $0
Thereafter $0
Village of Wilmette Police Pension Fund FOSTER & FOSTER | 37

GASB 68
COMPONENTS OF PENSION EXPENSE1 YEAR-END DECEMBER 31, 2019
Net Pension Liability
Deferred Inflows
Deferred Outflows
Pension Expense
Beginning Balance $ 29,225,151 $ 1,857,967 $ 8,239,197
Total Pension Liability Factors:Service Cost 972,492 - - 972,492 Interest 5,235,690 - - 5,235,690 Changes in Benefit Terms 213,461 - - 213,461 Differences Between Expected and Actual Experience With Regard to Economic or Demographic Assumptions 630,014 - 630,014 -
Current Year Amortization - (90,655) (325,487) 234,832 Changes in Assumptions About Future Economic or Demographic Factors or Other Inputs - - - -
Current Year Amortization - - (384,902) 384,902 Benefit Payments, Including Refunds of Employee Contributions (3,601,127) - - -
Net Change 3,450,530 (90,655) (80,375) 7,041,377
Plan Fiduciary Net Position:Contributions - Employer 2,273,000 - - - Contributions - Employee 470,100 - - (470,100) Projected Net Investment Income 3,144,770 - - (3,144,770) Difference Between Projected and Actual Earnings on Pension Plan Investments 5,599,174 5,599,174 - -
Current Year Amortization - (1,699,825) (2,112,021) 412,196 Benefit Payments, Including Refunds of Employee Contributions (3,601,127) - - - Administrative Expenses (28,376) - - 28,376
Net Change 7,857,541 3,899,349 (2,112,021) (3,174,298)
Ending Balance $ 24,818,140 $ 5,666,661 $ 6,046,801 $ 3,867,079
Village of Wilmette Police Pension Fund FOSTER & FOSTER | 38

GASB 68
AMORTIZATION SCHEDULE – EXPERIENCE
Year Base Established
Differences Between Expected and Actual
ExperienceRecognition
Period (Years) 2019 2020 2021 2022 2023 2024 20252019 630,014$ 5 126,002$ 126,003$ 126,003$ 126,003$ 126,003$ -$ -$ 2018 744,635$ 5 148,927$ 148,927$ 148,927$ 148,927$ -$ -$ -$ 2017 137,141$ 5 27,428$ 27,428$ 27,428$ -$ -$ -$ -$ 2016 (453,275)$ 5 (90,655)$ (90,655)$ -$ -$ -$ -$ -$ 2015 115,649$ 5 23,130$ -$ -$ -$ -$ -$ -$
Net Increase (Decrease) in Pension Expense 234,832 211,703 302,358 274,930 126,003 - -
Increase (Decrease) in Pension Expense Arising from the Recognition of the Effects of Differences between Expected and Actual Experience
Village of Wilmette Police Pension Fund FOSTER & FOSTER | 39

GASB 68
AMORTIZATION SCHEDULE – CHANGES OF ASSUMPTIONS
Year Base Established
Effects of Changes in Assumptions
Recognition Period (Years) 2019 2020 2021 2022 2023 2024 2025
2018 1,653,451$ 5 330,690$ 330,690$ 330,690$ 330,690$ -$ -$ -$ 2015 271,061$ 5 54,212$ -$ -$ -$ -$ -$ -$
Net Increase (Decrease) in Pension Expense 384,902$ 330,690$ 330,690$ 330,690$ -$ -$ -$
Increase (Decrease) in Pension Expense Arising from the Recognition of the Effects of Changes of Assumptions
Village of Wilmette Police Pension Fund FOSTER & FOSTER | 40

GASB 68
AMORTIZATION SCHEDULE – INVESTMENTS
Year Base Established
Differences Between Projected and Actual
EarningsRecognition
Period (Years) 2019 2020 2021 2022 2023 20242019 (5,599,174)$ 5 (1,119,834)$ (1,119,835)$ (1,119,835)$ (1,119,835)$ (1,119,835)$ -$ 2018 6,748,471$ 5 1,349,694$ 1,349,694$ 1,349,694$ 1,349,694$ -$ -$ 2017 (2,583,375)$ 5 (516,675)$ (516,675)$ (516,675)$ -$ -$ -$ 2016 (316,580)$ 5 (63,316)$ (63,316)$ -$ -$ -$ -$ 2015 3,811,637$ 5 762,327$ -$ -$ -$ -$ -$
Net Increase (Decrease) in Pension Expense 412,196$ (350,132)$ (286,816)$ 229,859$ (1,119,835)$ -$
Increase (Decrease) in Pension Expense Arising from the Recognition of the Differences Between Projected and Actual Earnings on Pension Plan Investments
Village of Wilmette Police Pension Fund FOSTER & FOSTER | 41

GASB 67/68
SCHEDULE OF CONTRIBUTIONS
The following assumptions were used to develop the Actuarially Determined Contribution: Calculation Timing The Actuarially Determined Contribution is calculated using a January 1,
2019 valuation date. Interest Rate 7.25% Mortality Rate Active Lives:
PubS-2010 Employee mortality, projected 5 years past the valuation date with Scale MP-2018. 10% of active deaths are assumed to be in the line of duty.
Inactive Lives:
PubS-2010 Healthy Retiree mortality, projected 5 years past the valuation date with Scale MP-2018.
Beneficiaries: PubS-2010 Survivor mortality, projected 5 years past the valuation date with Scale MP-2018. Disabled Lives: PubS-2010 Disabled mortality, projected 5 years past the valuation date with Scale MP-2018.
Assumptions All other assumptions and methods used for determining the
Actuarially Determined Contribution can be found in the January 1, 2019 Actuarial Valuation Report for the Village of Wilmette Police Pension Fund prepared by Foster & Foster.
Plan Year-End
Actuarially Determined
Contribution
Contributions in Relation to
the Actuarially Determined
Contributions
Contribution Deficiency
(Excess)Covered
Payroll
Contributions as a Percentage
of Covered Payroll
12/31/2019 2,237,585 2,273,000 (35,415) 4,790,179 47.45%12/31/2018 2,062,486 2,127,000 (64,514) 4,540,859 46.84%
Village of Wilmette Police Pension Fund FOSTER & FOSTER | 42

GASB 67
SCHEDULE OF INVESTMENT RETURNS For the year ended December 31, 2019, the annual money-weighted return on Pension Plan investments, net of pension plan investment expense, was 20.22 percent. The money-weighted rate of return expresses investment performance, net of investment expense, adjusted for the changing amounts actually invested.
Plan Year-End
Annual Money-Weighted Rate of Return Net of Investment Expense
12/31/2019 20.22%12/31/2018 -7.47%
Village of Wilmette Police Pension Fund FOSTER & FOSTER | 43

GASB 67/68
ASSUMPTIONS – TOTAL PENSION LIABILITY
The following assumptions were used to determine the Net Pension Liability: Valuation Date January 1, 2020
Measurement Date December 31, 2019
GASB 68 Expense Measurement Period January 1, 2019 - December 31, 2019
Reporting Period January 1, 2019 - December 31, 2019
Discount Rate 7.25% Mortality Rate Active Lives:
PubS-2010 Employee mortality, projected 5 years past the valuation date with Scale MP-2019. 10% of active deaths are assumed to be in the line of duty.
Inactive Lives:
PubS-2010 Healthy Retiree mortality, projected 5 years past the valuation date with Scale MP-2019.
Beneficiaries: PubS-2010 Survivor mortality, projected 5 years past the valuation date with Scale MP-2019. Disabled Lives: PubS-2010 Disabled mortality, projected 5 years past the valuation date with Scale MP-2019.
The mortality assumptions sufficiently accommodate anticipated future
mortality improvements. Retirement Age See table later in this section.
Tier 1 Rates are based on an experience study performed in 2012, modified to better reflect the plan’s actual retirement experience. Tier 2 Rates are based on a 2017 experience study performed for the State of Illinois Department of Insurance.
Disability Rate See table later in this section. 60% of the disabilities are assumed to be in
the line of duty. This is based on a 2017 experience study performed for the State of Illinois Department of Insurance.
Termination Rate See table later in this section. This is based on a 2017 experience study
performed for the State of Illinois Department of Insurance. Inflation 2.50%.
Village of Wilmette Police Pension Fund FOSTER & FOSTER | 44

GASB 67/68
Cost-of-Living Adjustment Tier 1: 3.00% per year after age 55. Those that retire prior to age 55
receive an increase of 1/12 of 3.00% for each full month since benefit commencement upon reaching age 55.
Tier 2: 1.25% per year after the later of attainment of age 60 or first anniversary of retirement.
Salary Increases See table below. This is based on a 2017 experience study performed for
the State of Illinois Department of Insurance.
Marital Status 80% of Members are assumed to be married. Spouse’s Age Males are assumed to be three years older than females. Method Entry Age Normal Cost Method.
Decrement Tables
Salary ScaleService Rate
0 11.00%1 10.75%2 8.75%3 8.50%4 7.00%5 6.25%6 5.25%7 4.25%
8 - 16 4.00%17 - 32 3.75%
32+ 3.50%
% Terminating % Becoming Disabled % Retiring % RetiringDuring the Year During the Year During the Year (Tier 1) During the Year (Tier 2)Age Rate Age Rate Age Rate Age Rate20 14.00% 20 0.000% 50 - 54 25% 50 - 54 5%25 10.40% 25 0.030% 55 - 59 25% 55 40%30 5.60% 30 0.140% 60 - 62 30% 56 - 64 25%35 3.10% 35 0.260% 63 - 69 50% 65 - 69 40%40 1.90% 40 0.420% 70+ 100% 70+ 100%45 1.50% 45 0.590%50 1.50% 50 0.710%
56+ 0.00% 55 0.900%60 1.150%
Village of Wilmette Police Pension Fund FOSTER & FOSTER | 45

GASB 67/68
NOTES TO THE FINANCIAL STATEMENTS Support for Long-Term Expected Rate of Return The Long-Term Expected Rate of Return on Pension Plan investments can be determined using a building-block method in which best-estimate ranges of expected future real rates of return (expected returns, net of Pension Plan investment expenses and inflation) are developed for each major asset class. These ranges are combined to produce the Long-Term Expected Rate of Return by weighting the expected future real rates of return by target asset allocation percentage and by adding expected inflation. Best estimates of geometric real rates of return for each major asset class included in the Pension Plan’s target asset allocation adopted as of December 31, 2019, as provided by Morgan Stanley, are summarized in the following table:
Inflation rate of investment advisor 1.90% Concentrations The Plan did not hold investments in any one organization that represent 5 percent or more of the Pension Plan’s fiduciary net position. Discount Rate The Discount Rate used to measure the Total Pension Liability was 7.25 percent. The projection of cash flows used to determine the Discount Rate assumed that Plan Member contributions will be made at the current contribution rate and that Sponsor contributions will be made at rates equal to the difference between actuarially determined contribution rates and the Member rate. Based on those assumptions, the Pension Plan’s Fiduciary Net Position was projected to be available to make all projected future benefit payments of current plan members. Therefore, the Long-Term Expected Rate of Return on Pension Plan investments (7.25 percent) was applied to all periods of projected benefit payments to determine the Total Pension Liability. For the purpose of this valuation, the expected rate of return on pension plan investments is 7.25 percent. The municipal bond rate is 3.26 percent (based on the daily rate closest to, but not later than the measurement date of the S&P Municipal Bond 20 Year High Grade Rate Index). The resulting single discount rate is 7.25 percent.
Asset Class Target Allocation
Long Term Expected Real Rate of Return¹
US Large Cap Equity 25.00% 5.72%US Mid Cap Equity 10.00% 6.40%US Small Cap Equity 7.00% 5.46%REITs 3.00% 4.97%Non US Developed Equity 12.00% 5.22%Emerging Markets 8.00% 6.85%Fixed Income 35.00% 1.80%Total 100.00%
Village of Wilmette Police Pension Fund FOSTER & FOSTER | 46

GASB 67/68
SUMMARY OF CURRENT PLAN
Article 3 Pension Fund The Plan is established and administered as prescribed by “Article 3. Police Pension Fund – Municipalities 500,000 and Under” of the Illinois Pension Code.
Plan Administration The Plan is a single employer defined benefit pension plan administered by a Board of Trustees comprised of:
a.) Two members appointed by the Municipality, b.) Two active Members of the Police Department elected by the
Membership, and c.) One retired Member of the Police Department elected by the
Benefits Provided
Membership.
The Plan provides retirement, termination, disability and death benefits.
A summary of the benefit provisions can be found in the Actuarial Valuation as of January 1, 2020 for the Village of Wilmette Police Pension Fund prepared by Foster & Foster Actuaries and Consultants.
Incorporated are the benefit changes as noted on the page “Changes Since Prior Valuation”.
Village of Wilmette Police Pension Fund FOSTER & FOSTER | 47

Statement of Investment Policy, Guidelines and Investment Objectives
Wilmette Police IPS October 2020
1
leted: Wilmette Police IPS
leted: October 2013
leted: January
leted: 19
INVESTMENT POLICY STATEMENT VILLAGE OF WILMETTE POLICE PENSION FUND
The Village of Wilmette Police Pension Fund is a defined benefit, single employer pension plan. Although a single employer pension plan, the defined benefits, as well as the employee and employer contribution levels are mandated by Illinois State Statutes and may be amended only by the Illinois State Legislature. The Plan provides retirement, death and disability benefits for its participants.
I. STATEMENT OF PURPOSE
The purpose of this statement is to establish a clear understanding between the trustees of the Wilmette Police Pension Fund and investment consultants, advisors and brokers regarding investment objectives, goals and guidelines for the portfolio.
This statement is intended to provide a road map for the implementation of an investment strategy for the Fund's assets and is not meant to be overly restrictive given the changing economic, business, political and investment market conditions.
This document should be reviewed on an annual basis by the Board and all modifications should be conveyed to the investment related advisors working with the Plan, i.e., consultants, investment advisors, brokers.
II. INVESTMENT OBJECTIVES
The foremost purpose of the Fund is to provide for the payment of pension benefits to current eligible beneficiaries and future beneficiaries over an infinite period of time.
In this context, the Fund should be managed in a prudent manner as it relates to such issues as expected long-term rates of return, return volatility, investment vehicles, and diversification among individual securities.
Within this framework the primary objective is:
PRESERVATION OF CAPITAL
It is important that over the long-term, the assets of the plan and their purchasing power should be preserved. To preserve the Plan's assets we need to take into account the significant eroding effect that inflation has on all financial assets.
This objective does not exclude the possibility of short-term losses in individual securities but rather embraces preservation of asset valuation on a long-term basis. Asset growth, exclusive of contributions and withdrawals, should be positive and will come from interest, dividend income or capital gains. Within this framework, the plan's objective is to

Statement of Investment Policy, Guidelines and Investment Objectives
Wilmette Police IPS October 2020
2
leted: Wilmette Police IPS
leted: October 2013
leted: January
leted: 19
maximize its return, while minimizing its risk. III. INVESTMENT GOALS
Based on the investment objectives stated above, the primary goal of the Fund is:
A total return over a 5-year investment horizon that exceeds the assumed actuarially rate of return
The secondary goal of the Fund is:
To achieve a rate of return that best represents the asset allocations of the Fund. The indices to be used will include (but are not limited to) the S&P 500 index, Barclays Capital Government/Corporate Index, and the 90-day Treasury Bill Index.
The Fund shall generally display an overall level of risk (volatility) in the aggregate portfolio which is comparable to the risk (volatility) associated with the benchmarks specified above. Risk will be measured by the annualized standard deviation of monthly returns.
The Board of Trustees understands that in order to achieve its objectives for the Plan's assets, the Plan will experience volatility of returns and fluctuations of market value as well as periods of negative total return. Negative total return will be reviewed in relation to the appropriate market indices.
Performance will be reviewed for the following periods: The most current quarter, year-to-date, one, three, and five years, and since inception.
These goals are expected to be achieved over a 3 to 5 year time horizon.
These investment goals are not meant to be imposed on each investment advisor. Each investment advisor shall receive a written set of manager guidelines outlining their specific goals and constraints as they may differ from those of the overall plan.
IV. INVESTMENT INSTRUMENTS
As a unit of local government in the State of Illinois, the Wilmette Police Pension Fund is restricted by 40 ILCS 5/1-113.2 through 5/1-113.4 "to draw and invest funds" to the following types of securities:
1. Interest bearing direct obligations of the United States of America. 2. Interest bearing obligations to the extent that they are fully guaranteed or insured as to
payment of principal and interest by the United States of America.
Formatted: Indent: Left: 0.5", First line: 0"
Deleted: rate of inflation plus 3% (300 basis points) as measured by the Consumer Price Index (CPI).
Deleted: set
Deleted: (7.25%).
Formatted: Indent: Left: 0.5", First line: 0"Deleted: Russell 3000

Statement of Investment Policy, Guidelines and Investment Objectives
Wilmette Police IPS October 2020
3
leted: Wilmette Police IPS
leted: October 2013
leted: January
leted: 19
3. Interest bearing bonds, notes, debentures, or other similar obligations of agencies of the United States of America. For the purposes of this Section, “agencies of the United States of America” includes: (i) the Federal National Mortgage Association and the Student Loan Marketing Association; (ii) federal land banks, federal intermediate credit banks, federal farm credit banks, and any other entity authorized to issue direct debt obligations of the United States of America under the Farm Credit Act of 1971 or amendments to that Act; (iii) federal home loan banks and the Federal Home Loan Mortgage Corporation; and (iv) any agency created by Act of Congress that is authorized to issue direct debt obligations of the United States of America.
4. Interest bearing savings accounts or certificates of deposit, issued by federally
chartered banks or savings and loan associations, to the extent that the deposits are insured by agencies or instrumentalities of the federal government
5. Interest bearing savings accounts or certificates of deposit, issued by State of Illinois
chartered banks or savings and loan associations, to the extent that the deposits are insured by agencies or instrumentalities of the federal government.
6. Investments in credit unions, to the extent that the investments are insured by agencies
or instrumentalities of the federal government. 7. Interest bearing bonds of the State of Illinois. 8. Pooled interest bearing accounts managed by the Illinois Public Treasurer’s Investment
Pool in accordance with the Deposit of State Moneys Act, interest bearing funds or pooled accounts of the Illinois Metropolitan Investment Funds, and interest bearing funds or pooled accounts managed, operated, and administered by banks, subsidiaries of banks, or subsidiaries of bank holding companies in accordance with the laws of the State of Illinois.
9. Interest bearing bonds or tax anticipation warrants of any county, township, or
municipal corporation of the State of Illinois. 10. Direct obligations of the State of Israel, subject to the conditions and limitations of item
(5.1) of Section 1-113. 11. Money market mutual funds managed by investment companies that are registered
under the federal Investment Company Act of 1940 and the Illinois Securities Law of 1953 and are diversified, open-ended management investment companies; provided that the portfolio of the money market mutual fund is limited to the following:
i. bonds, notes, certificates of indebtedness, treasury bills, or other securities that are
guaranteed by the full faith and credit of the United States of America as to principal and interest;

Statement of Investment Policy, Guidelines and Investment Objectives
Wilmette Police IPS October 2020
4
leted: Wilmette Police IPS
leted: October 2013
leted: January
leted: 19
ii. bonds, notes, debentures, or other similar obligations of the United States of
America or its agencies; and iii. short term obligations of corporations organized in the United States with assets
exceeding $400,000,000, provided that (A) the obligations mature no later than 180 days from the date of purchase, (B) at the time of purchase, the obligations are rated by at least 2 standard national rating services at one of their 3 highest classifications, and (C) the obligations held by the mutual fund do not exceed 10% of the corporation’s outstanding obligations.
12. Corporate bonds managed through an investment advisor must meet all of the following
requirements:
i. The bonds must be rated as investment grade by one of the 2 largest rating services at the time of purchase
ii. If subsequently downgraded below investment grade, the bonds must be liquidated
by the manager from the portfolio within 90 days after being downgraded by one of the 2 largest rating services. (Source: P.A. 96-1495, eff. 1-1-11.)
In addition to the preceding investments as stated in 40 ILCS 5/1-113.2 through 5/1-113.4, the following investments will be allowed as of January 1st, 1998:
A. Separate accounts that are managed by life insurance companies authorized to
transact business in Illinois. These accounts are comprised of diversified portfolio consisting of common, preferred, or convertible preferred stocks, bonds or money market instruments.
B. Mutual funds that meet the following criteria:
(i) the mutual fund is managed by an investment company as defined and
registered under the Illinois Securities Law of 1953;
(ii) The mutual fund has been in operation for at least 5 years.
(iii) The mutual fund has total net assets of $250 million or more; and
(iv) The mutual fund is comprised of a diversified portfolio of common, preferred or convertible preferred stocks, bonds, or money market instruments.
C. Through an investment advisor the purchase of common, preferred or convertible

Statement of Investment Policy, Guidelines and Investment Objectives
Wilmette Police IPS October 2020
5
leted: Wilmette Police IPS
leted: October 2013
leted: January
leted: 19
preferred stocks will be allowed contingent upon meeting the following requirements:
i. the common stocks are listed on a national securities exchange or board of
trade or quoted in the National Association of Securities Dealers Automated Quotation System National Market System (NASDAQ NMS).
ii. the straight preferred stocks or convertible preferred stocks are issued or
guaranteed by a corporation whose common stock qualifies for investment by the board.
iii. the pension fund may not own more than 5% of the outstanding stock of
any one company.
iv. the market value of any one stock in a pension fund portfolio may not exceed 5% of the cash and invested assets of the pension fund
V. SUSTAINABLE INVESTING ACT
The Board will consider any material, relevant, and decision-useful sustainability factors, within the bounds of financial and fiduciary prudence, in evaluating investment decisions. Such factors include, but are not limited to: A. Corporate governance and leadership factors.
B. Environmental factors.
C. Social capital factors.
D. Human capital factors.
E. Business model and innovation factors, as provided under the Illinois Sustainable
Investing Act.
VI. INVESTMENT PERFORMANCE REVIEW
The Fund and the Investment Manager's performance results will be measured on a quarterly basis by a third-party, independent consultant. The Fund's performance will be measured against commonly accepted market comparisons (Indexes). This review should answer the following five basic questions:
1. Did the Fund's results meet the stated objectives?
Formatted: Indent: Left: 0.5", No bullets or numbering
Formatted: Indent: Left: 0.5", First line: 0"

Statement of Investment Policy, Guidelines and Investment Objectives
Wilmette Police IPS October 2020
6
leted: Wilmette Police IPS
leted: October 2013
leted: January
leted: 19
2. What market conditions existed during the review period?
3. How much risk did the Fund's manager take in achieving results?
4. Did the manager add real value to the Fund?
5. How did other similarly managed funds perform during the same period?
This review will verify if the investment results are consistent with the objectives and goals set forth in the Investment Policy Statement.
VII. INVESTMENT PARAMETERS
1. The Board of Trustees has adopted the asset allocation policy shown below for Plan assets. Target percentages have been determined for each asset class along with allocation ranges. Percentage allocations are intended to serve as guidelines; the Board will not be required to remain strictly within the designated ranges. Market conditions or an investment transition may require an imbalance in asset mix.
MINIMUM MAXIMUM
Equities 20% 65% Fixed Income 20% 78% Cash 2% 20%
2. Cash investments shall be defined as funds which can be quickly liquidated without loss of principal (normally, maturities of 3 months or less). A 20% cash position is allowed only under the assumption of extreme market conditions and should be limited to a 6-month time period. Before or at that point, the investment advisor is obligated to address the Board concerning the cash position. Please note that a 2% cash position will be held outside of the investable funds subject to cash flow needs.
3. Fixed Income investments shall be defined as bonds, certificates of deposit, fixed
annuities or guaranteed investment contracts of an insurance company and commingled trust accounts which only invest in the above described investment vehicles.
The fixed income portfolio should be structured allowing for duration between 3 and 8 years.
4. Equity investments shall be defined as investments in common, preferred, or
convertible preferred stocks, mutual funds or separate accounts of a life insurance
Deleted: (separate account)
Deleted: 55
Deleted: Equities/Mutual Funds only 0% 10%¶
Deleted: 33
Deleted: 68

Statement of Investment Policy, Guidelines and Investment Objectives
Wilmette Police IPS October 2020
7
leted: Wilmette Police IPS
leted: October 2013
leted: January
leted: 19
company.
As of July 1st 2012, pursuant to 40 ILCS 5/1-113.2 through 5/1-113.4 of the Illinois Compiled Statutes, the total allowable equity allocation is limited to 65% of the net assets of the portfolio. The net asset value is based on the most current Annual Report to the Department of Insurance. The first 55% of the equity portfolio can be invested in individual common stocks or mutual funds. Any investments in equities over 55% can only be invested in mutual funds to reach the allowable maximum of 65% allocation in equities.
VIII. ALLOCATION AND DELEGATION OF INVESTMENT DUTIES
Pursuant to the Illinois Pension Code, the trustees of the Wilmette Police Pension Fund may appoint one or more investment advisors as fiduciaries to manage any assets of the Pension Fund only after expressed written direction by the trustees. The delegation of authority may be allowed only after a diligent review of the investment advisor's background as it relates to: depth of the organization, investment management style, client service, communication, investment performance and risk. The manager will be obligated to provide reports monthly of all transactions and valuations to the Finance Officer. The performance of managers will be reviewed and monitored by an independent, third-party consultant as indicated in the investment performance review section.
A. No contract for consulting services may exceed five (5) years with any consultant, nor may a contract for consulting services be renewed or extended. The foregoing restrictions do not, however, prohibit a contracting consultant to compete for a new contract at the end of the term of a consulting contract.
B. No person other than a trustee or employee of the Fund may act as a consultant or investment adviser to the Board unless that person is at least one of the following:
1. Registered as an investment adviser under the federal Investment Advisers Act of 1940 (15 U.S.C. § 80b-1, et seq.);
2. Registered as an investment adviser under the Illinois Securities Act of 1953;
3. A bank, as defined in the Investment Advisers Act of 1940; or
4. An insurance company authorized to transact business in Illinois.
C. Appointment of Investment Advisors and Consultants
Formatted: No bullets or numbering
Formatted: Indent: Left: 0.5"
Deleted: Pursuant to 40 ILCS/Individual 5/1-113.2 through 5/1-113.4 of the Illinois State Statutes, effective July 1, 2011 the total allowable investments in equities is limited to 50%(will be 55% effective July 1, 2012) of the net asset of the pension fund at the most current Department of Insurance annual report, with an additional 10% (maximum) allowed to be invested in equities through a mutual fund or separate account of a life insurance company to do business in the State of Illinois. Please note, as of July 1, 2012, the maximum allowable equity investment is 65% of the portfolio.¶.
Formatted: Indent: Left: 1", First line: 0"

Statement of Investment Policy, Guidelines and Investment Objectives
Wilmette Police IPS October 2020
8
leted: Wilmette Police IPS
leted: October 2013
leted: January
leted: 19
The Board may appoint one or more investment advisors and/ or consultant to manage assets of the Police Pension Fund.
All investment advice and services provided to the Board by an investment adviser or consultant shall only be rendered pursuant to a written contract between the adviser or consultant and the Board. All offers from an investment adviser or consultant who submits an offer to provide such services shall be accompanied by a disclosure of the names and addresses of the offeror, any entity that is a parent of, or owns a controlling interest in, the offeror, or any entity that is a subsidiary of, or in which a controlling interest is owned by, the offeror. Any contract between the Board and an investment adviser or consultant shall include all of the following:
1. An acknowledgment in writing by the investment adviser that he or she is a fiduciary with respect to the Fund. [Applicable to investment adviser contract only].
2. An acknowledgement of the Board’s investment policy.
3. Full written disclosure of direct and indirect fees, commissions, penalties, and any other compensation that may be received, including reimbursement for expenses.
4. A requirement that the investment adviser submit periodic written reports on at least a quarterly basis for the Board’s review at its regularly scheduled meetings.
5. A requirement that the adviser or consultant provide the Board a full written disclosure of the direct and indirect fees that may be paid by or on behalf of the investment adviser or consultant in connection with the provision of services to the Fund, including the date and amount of each payment and the name and address of each recipient of a payment, and a requirement that the adviser or consultant update the disclosure promptly after modification of those payments or an additional payment.
The Board shall provide a copy of any contract entered into pursuant to this subsection 503(5) to the Division of Insurance of the Department of Financial and Professional Regulation within 30 days after appointing an investment adviser or consultant.
It shall be noted that the ultimate authority and responsibility for all investments of the Wilmette Police Pension Fund belongs solely to the trustees. Any other person acting without the Board's approval would be violating the Illinois State Statutes.
These procedures should be established to avoid fraud, error and any breach of fiduciary duties by individuals, trustees or any entity associated with the investment of the Fund's

Statement of Investment Policy, Guidelines and Investment Objectives
Wilmette Police IPS October 2020
9
leted: Wilmette Police IPS
leted: October 2013
leted: January
leted: 19
assets.
IX. COMMUNICATIONS
Listed below are the reports required and the appropriate individuals who will receive copies of these reports.
A. Trade confirmation Village Finance Director and Investment Consultant
B. Monthly Statements Village Finance Director
C. Quarterly Performance All Trustees
D. Investment Advisor Village Finance Director, Board President and Quarterly Reports Investment Consultant
E. Determination of Village Finance Director Benefits
The Pension Board, at a minimum, expects to meet with the investment consultant and the investment advisor quarterly.
It is the Pension Board's responsibility to relate to the Investment Consultant and Investment Advisor any changes that might affect the investment of the Fund's assets.
X. SAFEKEEPING OF INVESTMENT
As stated in Illinois State Statutes, all investments shall be clearly held and accounted for to indicate ownership by such Board. The Board may direct the registration of securities in their own name or in nominee name for the expressed purpose of registration of securities by a national or state bank or trust company authorized to conduct a trust business in the State of Illinois.
A Broker/Dealer may maintain possession of or control over securities of a pension if it is registered as a broker dealer with the U.S. Securities and Exchange Commission and is a member in good standing with Financial Industry Regulatory Authority (FINRA) or its successor and is compliant with the provisions of (40 ILCS 5/1 113.7) Sec. 1 113.7., regarding registration of investments; custody and safekeeping. The broker//dealer would be required to have Excess Security Investor Protection Corp. (SIPC) insurance to protect the assets of the Pension Fund.
Formatted: Indent: Left: 1", First line: 0"
Deleted: In addition to the reports set forth above, the Board shall, on an annual basis, and no later than as required by statute, certify and provide the following information about the Fund to the Village Board:¶The total assets of the Fund at the end of the fiscal year and the current market value of those assets.¶The estimated receipts during the next succeeding fiscal year from deductions from the salaries of Police officers, and from all other sources;¶The estimated amount required during the succeeding fiscal year to pay all pensions and other Fund obligations, and to meet the annual requirements of the fund as required by the Pension Code; ¶The total net income received from investment of assets along with the assumed investment return and actual investment return received by the fund during its most recently completed fiscal year compared to the total net income, assumed investment return, and actual investment return received during the preceding year; ¶The total number of active employees who are financially contributing to the fund; ¶The total amount that was disbursed in benefits during the fiscal year, including the number of and total amount disbursed to annuitants in receipt of a regular retirement pension, recipients being paid a disability pension, and survivors and children in receipt of benefits; ¶The funded ratio of the Fund;¶The unfunded liability carried by the Fund, along with an actuarial explanation of the unfunded liability; and¶The investment policy of the Board under the statutory investment restrictions imposed on the Fund. ¶¶
Deleted:
Deleted: ¶¶

Statement of Investment Policy, Guidelines and Investment Objectives
Wilmette Police IPS October 2020
10
leted: Wilmette Police IPS
leted: October 2013
leted: January
leted: 19
XI. PARTIES ASSOCIATED WITH THE PLAN
A. Board of Trustees for the Wilmette Police Pension Fund:
1. Holds ultimate responsibility for the Fund and the appropriateness of its investment policy and its execution.
2. Retains consultants, money managers, and other advisors to implement and
execute investment policy as it relates to the Fund. Trustees shall not engage in any investment transaction with any advisor with which he or she has any direct interest in the income, gains or profits of that advisor through which the investment transaction is made or has a business relationship with that advisor that would result in a pecuniary benefit to the trustee as a result of the investment transaction.
3. Reviews the adequacy or need for change of this statement.
4. Meets quarterly and reviews reports concerning the Fund's asset
management.
5. Engages a custodian.
6. Defines investment policy, objectives and guidelines for the Fund including risk tolerance.
7. Administers the Fund in accordance with the Illinois Pension Code, Illinois
Compiled Statutes Chapter 40, Act 5, Articles 1, 3, and 4, and the Public Investment Act, Illinois Compiled Statutes, Chapter 30, Act 235.
8. The signature of the president and secretary will be required in all
documents related to the engagement of investment contracts. All administrative documents may be signed by the Finance Director (i.e., bank custody, brokerage, wire transfer).
B. Custodian
1. Accepts possession of securities for safekeeping; collects and disburses income; collects principal of sold, matured or called items; and provides accurate, timely market value pricing, including accrued interest, for all securities under their care.
2. Provides timely monthly statements which accurately detail all transactions in the
accounts, as well as accurately describe all of the securities owned.
Deleted: ¶

Statement of Investment Policy, Guidelines and Investment Objectives
Wilmette Police IPS October 2020
11
leted: Wilmette Police IPS
leted: October 2013
leted: January
leted: 19
3. Effects receipt and delivery following purchases and sales of securities on a timely basis.
4. Ensures that all cash is productively employed at all times.
5. Meets as required with the Board of Trustees and provides reports relative to the
status of the Plan. C. Investment Consultant
1. Assists the Board of Trustees in developing investment policy guidelines, including asset class choices, asset allocation targets and risk diversification.
2. Conducts money manager searches when requested by the Board of Trustees.
3. Provides the Board of Trustees with objective information on a broad spectrum of
investment decisions, and assists in evaluating the merits of each particular investment product and money manager as to the track records, management styles and quality.
4. Monitors the performance of the Aggregate Plan Investment Managers and
provides regular quarterly reports to the Board of Trustees, which aids them in determining the progress toward the Fund's investment objectives.
D. Investment Advisors
1. Has full discretion of the management of the assets allocated to the Investment Managers, subject to overall investment guidelines set by the Board of Trustees.
2. Serves as fiduciaries responsible for specific securities decisions.
3. Abides by the Illinois Pension Code which governs the Illinois Downstate Police
and Police Pension Funds, and will abide by duties, responsibilities and guidelines detailed in any specific investment manager agreement entered into by the manager and Board of Trustees.
4. Reports at least quarterly, the current investments held in their account, their current
market value and all transactions within the account.
5. Communicates any major changes in economic outlook, investment strategy, or any other factors which affect implementation of their investment process, or the investment objective of the Plan.
Statement of Investment Policy, Guidelines and Investment Objectives
Wilmette Police IPS October 2020
12
leted: Wilmette Police IPS
leted: October 2013
leted: January
leted: 19
6. Informs the Board in regards to any qualitative change in the investment management
organization. Examples include: changes in portfolio management, personnel, ownership structure, investment philosophy, etc.
XII. APPROVED INVESTMENTS
The following is a list of approved investments as reflected in the Illinois Pension Code. This list may not be all inclusive and may change as directed by the Department of Insurance. The purpose of this list is to be used as a guideline to what are permissible investments for the Wilmette Police Pension Fund. When in doubt, review with your consultant, advisor or the Department of Insurance.
PERMISSIBLE INVESTMENTS
1. U.S. Treasury bills, notes and bonds 2. Federal Housing Authority bonds 3. Government National Mortgage Association (GNMA) 4. Federal Home Loan Mortgage Corp. 5. Farmers Home Administration bonds 6. General Services Administration bonds (GSA) 7. Federal Farm Credit Corp. 8. Federal Intermediate Credit Banks 9. Tennessee Valley Authority 10. Federal Land Banks 11. Certificates of Deposit 12. Zero Coupon U.S. Treasury Bonds - Strips Only 13. Guaranteed Investment Accounts of an insurance company 14. Credit Unions, if insured 15. Federal National Mortgage Associates bonds (Fannie Mae) 16. Federal Home Loan Bank bond (FHLB) 17. Student Loan Marketing Association (Sallie Mae) 18. Common stocks through a mutual fund or an investment advisor 19. State Investment Pools 20. Bank Pool Funds - must follow state statutes regarding approved investments 21. Money Market Mutual Funds - U.S. Government Securities only 22. Mutual Funds 23. Preferred stock (through a registered investment advisor) 24. Separate accounts of life insurance companies (stocks, bonds, and real estate) 25. Convertible preferred stock (through a registered investment advisor) 26. Corporate Bonds 27. Exchange Trades Funds (ETFs)
Deleted: ¶
Formatted: Indent: Left: 0.75"
Formatted: Indent: Left: 0.5", First line: 0"

Statement of Investment Policy, Guidelines and Investment Objectives
Wilmette Police IPS October 2020
13
leted: Wilmette Police IPS
leted: October 2013
leted: January
leted: 19
Through separate accounts with an insurance company registered to do business in the state of Illinois:
1. Common stocks 2. Preferred stocks 3. Bonds including corporate issues 4. Real Estate 5. Real Estate loans secured by first and second mortgages Please note that the Fund is not obligated to use all of the above listed investment
instruments. They are listed only as a reference.
XIII. INVESTMENT RESTRICTIONS
The trustees of the Wilmette Police Pension Fund have determined the following actions to be inappropriate and totally prohibited:
1. Any margin (borrowing) of securities
2. Purchase or sale of commodities or options
3. Purchase of individual common stock without the use of a registered Investment
Advisor. 4. Purchase of American Depository Receipts (ADRs)
5. Any investment made without the express written approval of the trustees of the
Wilmette Police Pension Fund. XIV. PROHIBITION ON GIFTS
No trustee shall intentionally solicit or accept any gift from any prohibited source as prescribed in Article 10 of the State Officials and Employees Ethics Act.
For purposes of this policy, “gift” shall be defined in the same manner set forth in Section 1-5 of the State Officials and Employees Ethics Act, but shall not include the solicitation or acceptance of educational materials by a trustee.
A “prohibited source” is any person or entity who”
1. Is seeking official action by the Board or an individual trustee;
2. Does business or seeks to do business with the Board or an individual trustee;
Deleted: ¶
Deleted: Fire
Formatted: List Paragraph, Left, No bullets or numbering

Statement of Investment Policy, Guidelines and Investment Objectives
Wilmette Police IPS October 2020
14
leted: Wilmette Police IPS
leted: October 2013
leted: January
leted: 19
3. Has interests that may be substantially affected by the performance or non-performance of the official duties of a trustee; or
4. Is registered or required to be registered with the Secretary of State under the Lobbyist Registration Act.
An entity that is not otherwise a prohibited source does not become a prohibited source merely because a registered lobbyist is one of its members or serves on its board of directors.
XV. SUMMARY
All investments are to be made in a prudent manner. That is with the same care, skill, prudence, and diligence under the circumstances then prevailing that a prudent person would use considering the primary objective of preserving one's capital.
The trustees are required to conduct themselves faithfully and exercise sound direction and
to perform those duties in the same fashion as other persons of like intelligence and discretion. Moreover, no trustee or employee of the Board shall knowingly make any false statement, falsify or permit to be falsified any record of the Fund in an attempt to defraud the Fund, nor shall any trustee or employee of the Board knowingly defraud the Fund in any manner.
It is expected that all assets will be managed so that the results will meet the objectives and goals set forth in this statement.
This statement is intended to he used as a guideline rather than a rigid statement of policy from which there can be no deviations. This statement should be reviewed annually and changes made only after review by the Board, consultants, and investment managers. It is the sole responsibility of the Board to establish and maintain this written policy.
We the trustees of the Wilmette Police Pension Fund affirm that the information contained in this Investment Policy Statement accurately reflects our Fund's investment profile and our investment objective and goals.
We adopt this statement as our investment policy this ______ day of __ 2020. President Secretary Trustee Trustee Trustee Trustee
Formatted: Indent: Left: 0"Deleted: ¶
Deleted: ¶
Deleted: 19
Deleted: 3

Statement of Investment Policy, Guidelines and Investment Objectives
Wilmette Police IPS October 2020
15
leted: Wilmette Police IPS
leted: October 2013
leted: January
leted: 19
Trustee Trustee


WILMETTE FPF / General / Resolution to Amend Rules /389568
STATE OF ILLINOIS )
) SS COUNTY OF COOK ) SECRETARY'S CERTIFICATE
I, ______________________, the duly qualified and acting Secretary of the Board of
Trustees of the Wilmette Firefighters' Pension Fund, Cook County, Illinois, do hereby certify that
attached hereto is a true and correct copy of a Resolution entitled:
RESOLUTION NO. ________________
A RESOLUTION AMENDING THE RULES OF THE BOARD OF TRUSTEES OF THE WILMETTE FIREFIGHTERS' PENSION FUND which Resolution was duly adopted by said Board of Trustees at a meeting held on the 22nd day
of October, 2020.
I do further certify that a quorum of said Board of Trustees was present at said meeting,
and that the Board of Trustees complied with all the requirements of the Illinois Open Meetings
Act.
IN WITNESS WHEREOF, I have hereunto set my hand this 22nd day of October, 2020.
Secretary, Board of Trustees Wilmette Firefighters' Pension Fund

WILMETTE FPF / General / Resolution to Amend Rules /389568
RESOLUTION NO. ______________ A RESOLUTION AMENDING THE RULES OF THE BOARD OF TRUSTEES OF THE WILMETTE FIREFIGHTERS' PENSION FUND
WHEREAS, the Wilmette Firefighters' Pension Fund (the “Fund") is a pension fund duly
organized under the laws of the State of Illinois; and
WHEREAS, the Board of Trustees of the Fund (the “Board”) has the power to make all
rules and regulations necessary for the discharge of its duties pursuant to Section 4-126 of the
Illinois Pension Code (40 ILCS 5/4-126); and
WHEREAS, the Board has determined that there is a need to amend its rules.
NOW, THEREFORE, BE IT RESOLVED by the Board of Trustees of the Wilmette
Firefighters' Pension Fund as follows:
Section One: That the Board hereby amends its rules as fully set forth in EXHIBIT A,
attached hereto and made a part hereof.
Section Two: The rules shall be in full force and effect immediately upon adoption.
Section Three: This Resolution shall supersede any resolution or motions, or parts of
resolutions or motions, in conflict with any part herein, and any such resolutions or motions, or
part thereof, are hereby repealed.
Section Four: If any section, paragraph or provision of this Resolution shall be held to
be invalid or unenforceable for any reason, such invalidity or unenforceability shall not affect any
of the remaining provisions of this Resolution.
ADOPTED this 22nd day of October, 2020, by a roll call vote as follows:
AYES:
NAYS:
ABSENT:
President, Board of Trustees Wilmette Firefighters' Pension Fund
ATTEST: Secretary, Board of Trustees Wilmette Firefighters' Pension Fund

Ottosen DiNolfo Hasenbalg & Castaldo, Ltd. © 2020
WILMETTE FIREFIGHTERS’ PENSION FUND – BOARD OF TRUSTEES 1.01
Page 1 of 1
CHAPTER ONE – BOARD OF TRUSTEES 1.01 MEMBERSHIP OF THE BOARD The Board of Trustees of the Wilmette Firefighters' Pension Fund (the "Board") shall consist of the following five (5) members: two members appointed by the Village of Wilmette’s President; two (2) active firefighters of the fire department; and one (1) person who has retired under the Firemen’s Pension Fund Act of 1919 (former Ill.Rev.Stat. ch. 24, par. 918 et seq.) or Article 4 of the Illinois Pension Code (40 ILCS 5/4-101 et seq.) A firefighter receiving a disability pension shall be considered a retired firefighter for purposes of membership on the Board. A deferred pensioner shall be considered a retired firefighter for purposes of membership on the Board. In the event there are no retired firefighters under the Fund or if none are willing to serve on the Board, then an additional active firefighter shall be elected to the Board in lieu of the retired firefighter who would otherwise be elected. LEGAL REF.: 40 ILCS 5/4-105a and 4-121; Illinois Department of Insurance Advisory Opinion
(March 27, 2012) ADOPTED: October 22, 2020

Ottosen DiNolfo Hasenbalg & Castaldo, Ltd. © 2020
WILMETTE FIREFIGHTERS’ PENSION FUND – BOARD OF TRUSTEES 1.02
Page 1 of 1
CHAPTER ONE – BOARD OF TRUSTEES 1.02 ELECTION OF BOARD MEMBERS/TERMS OF OFFICE/VACANCIES The members of the Board chosen from the active and retired firefighters shall be elected by ballot at elections to be held near the third Monday in April as practical of the applicable years under the Australian ballot system. No person shall cast more than one (1) vote for each candidate for whom he or she is eligible to vote. The Board shall only accept self-nominations for candidates prior to the election in the applicable years. In the elections for Board members to be chosen from the active firefighters, only active firefighters may vote. In the elections for Board members to be chosen from retired firefighters, only retired firefighters may vote. In the event there are no retired members, or none are willing to serve, another Board member shall be elected from among the active firefighters. In this instance active members may vote for the substitute retired member. If no retired firefighters are serving on the Board and a newly retired firefighter becomes available and is willing to serve on the Board, the next active firefighter seat that becomes available for election shall be returned to a retired member seat for election by retired firefighters. The Board or at least two designees who are not candidates in the election shall canvass the ballots and declare which persons have been elected and for what term or terms respectively. The Board President shall release the results of the election and contact all candidates immediately of the election results. The results of the election shall be sent to all active members and retired members. In case of a tie vote between two (2) or more candidates, the Board shall determine by lot which candidate or candidates have been elected and for what term or terms, respectively. In the event that there are only as many nominated as there are vacancies on the Board, the Board shall declare those nominated are elected by acclamation and dispense with an election by ballot. The elected Board members shall take office on May 1st of the applicable year. Each elected and appointed member of the Board shall hold office for a term of three (3) years and until his or her successor has been duly elected or appointed and qualified. In the event of the failure, resignation, or inability to act of any elected Board member, a successor shall be elected for the unexpired term at a special election called by the Board and conducted in the same manner as a regular election. In the event of the failure, resignation or inability to act of any appointed Board member, a successor shall be appointed for the unexpired term by the Village of Wilmette’s President. LEGAL REF.: 40 ILCS 5/4-121 ADOPTED: October 22, 2020

Ottosen DiNolfo Hasenbalg & Castaldo, Ltd. © 2020
WILMETTE FIREFIGHTERS’ PENSION FUND – BOARD OF TRUSTEES 1.03
Page 1 of 2
CHAPTER ONE – BOARD OF TRUSTEES 1.03 BOARD OFFICERS, DESIGNEES AND COMMITTEES
A. President and Secretary
A President and Secretary shall be elected annually for a one-year term. All elections shall be conducted in open session of the Board. Candidates for President and Secretary must be nominated, seconded, and voted upon either as a slate or individually. A candidate receiving a majority of the votes shall be elected.
If the President or Secretary is unable to complete his or her term, a permanent replacement shall be
elected by the Board to complete the term. If the President or Secretary is absent from a meeting or is temporarily incapacitated, an officer pro tempore shall be appointed by the Board.
B. Treasurer The Village of Wilmette’s Treasurer shall serve as Treasurer of the Board and the custodian of the
Fund, and shall secure and safely keep the Fund's assets, subject to the control and direction of the Board. The Treasurer or designee shall keep books and accounts concerning the Fund in such manner as may be prescribed by the Board. The books and accounts shall be subject to the inspection of the Board or any member thereof.
Within ten (10) days after his or her appointment, the Treasurer shall execute a bond to the Village,
with good and sufficient securities, in such penal sums as the Board shall direct, or as may be set by statute and/or ordinance, to be approved by the Board, conditioned for the faithful performance of the duties of the office, and for the safekeeping and proper accounting of all monies and property which come to the Treasurer. The bond shall be filed in the office of the Village of Wilmette’s Clerk. On the expiration of the Treasurer's term, all monies and property of the Fund shall be turned over to his or her successor.
C. DOI Security Administrator
The Board shall appoint a Security Administrator who shall be responsible for assigning roles for the completion and/or viewing of the Fund’s Annual Statement filing and for granting access to previously filed Annual Statement information with the Illinois Department of Insurance. The Board shall file the Pension Fund Security Administrator Authorization Form with Illinois Department of Insurance upon appointment of its Security Administrator or upon any change in its Security Administrator appointment.
D. Open Meetings Act Designee
The Board shall designate one or more individuals to receive training on compliance with the Illinois Open Meetings Act. The Board shall submit a list of its Open Meetings Act Designees to the Public Access Counselor of the Illinois Attorney General’s Office. The Open Meetings Act Designees must successfully complete an electronic training curriculum, developed and administered by the Public Access Counselor, and thereafter must successfully complete an annual training program. Whenever the Board designates an additional individual to receive this training, that individual must successfully complete the electronic training curriculum within 30 days after that designation. (5 ILCS 120/1.05)

Ottosen DiNolfo Hasenbalg & Castaldo, Ltd. © 2020
WILMETTE FIREFIGHTERS’ PENSION FUND – BOARD OF TRUSTEES 1.03
Page 2 of 2
CHAPTER ONE – BOARD OF TRUSTEES 1.03 BOARD OFFICERS, DESIGNEES AND COMMITTEES (CONT.)
E. Freedom of Information Officer
The Board shall appoint one or more individuals to act as its Freedom of Information Officer, who shall ensure the Fund complies with the Act through execution of the Board’s policy. The Freedom of Information Officer shall comply with the annual training required by the Act. Whenever the Board designates an additional individual to receive this training, that individual must successfully complete the electronic training curriculum within 30 days after that designation.
F. Committees
The President may appoint committees to study and evaluate specific issues and to report their recommendations to the Board. All committees of the Board shall comply with the provisions of the Open Meetings Act. No committee recommendations shall be implemented without approval by the Board.
LEGAL REF.: 5 ILCS 120/1.05; 5 ILCS 140/3.5; 40 ILCS 5/4-121 and 4-130 RELATED FORMS: Illinois DOI Security Administrator Authorization Form ADOPTED: October 22, 2020

Ottosen DiNolfo Hasenbalg & Castaldo, Ltd. © 2020
WILMETTE FIREFIGHTERS’ PENSION FUND – BOARD OF TRUSTEES 1.04
Page 1 of 1
CHAPTER ONE – BOARD OF TRUSTEES 1.04 POWERS AND DUTIES OF THE BOARD The powers and duties of the Board shall generally include, but are not limited to, the following: A. To control and manage the Fund, exclusively, and all money donated, paid, assessed or provided by
law for the pensioning of disabled and retired firefighters, their surviving spouses, minor children, and dependent parents.
B. To assess each firefighter for the contributions required by law, and to have the contributions
deducted from salaries, together with all interest accruing thereon, placed by the Treasurer to the credit of the Fund, subject to the order of the Board.
C. To hear and decide all applications for pensions and other benefits under Article 4 of the Illinois
Pension Code and to order and direct the payment of pensions and other benefits. D. To invest the money of the Fund in accordance with the Illinois Pension Code. E. To accept by gift, grant, transfer or bequest, any money, real estate or personal property, and to place
such money and proceeds from the sale of or income from such real estate or personal property into the Fund.
F. To make all rules and regulations necessary for the discharge of its duties and to make amendments,
by a majority vote, to those rules and regulations as the Board deems necessary from time to time. G. To keep a record of all its meetings and proceedings. H. To provide for the payment from the Fund of all necessary expenses of the Board.
I. To compel witnesses to attend and testify before it upon all matters connected with the administration of Article 4, in the manner provided by law for the taking of testimony before the circuit court.
The Board may act only in a properly convened meeting, and no member shall have the authority to act for the Board or under the title of his or her Board position unless specifically authorized by statute or by the Board. Any act delegated to a member by the Board must be ratified by the Board. LEGAL REF.: 40 ILCS 5/4-122, 4-123, 4-123.1, 4-124, 4-125, 4-126, 4-127, 4-128, 4-129, and 4-129.1 ADOPTED: October 22, 2020

Ottosen DiNolfo Hasenbalg & Castaldo, Ltd. © 2020
WILMETTE FIREFIGHTERS’ PENSION FUND – BOARD OF TRUSTEES 1.05
Page 1 of 2
CHAPTER ONE – BOARD OF TRUSTEES 1.05 MEETINGS A. Regular Meetings All meetings shall be conducted in accordance with the Open Meetings Act. Regular meetings of the
Board shall be held not less than quarterly pursuant to the schedule adopted by the Board. Public notice of the schedule of regular meetings shall be provided by the Board at the beginning of the calendar or fiscal year, and shall include the dates, times, and places of the regular meetings.
B. Special Meetings
Special meetings may be called by the President of the Board or any two (2) members upon at least forty-eight (48) hours’ notice to all Board members. Such call shall set the time and place of holding the special meeting and the purpose for which it is called. A special meeting may also be called for a future date at any meeting of the Board by a majority vote of the members attending the meeting.
C. Remote Meetings During Disasters
The Board may conduct a remote meeting by audio or video conference without a quorum physically present when the Governor of the State of Illinois or the Director of the Illinois Department of Public Health has issued a disaster declaration related to public health concerns. In order to conduct a remote meeting, the Board President must make a determination that an in-person meeting is not practical or prudent. If feasible, one member of the Board or a designee shall be physically available at the regular meeting location. Board members on the remote meeting audio or video conference shall be verified and capable of hearing all discussion and/or testimony. All votes shall be conducted by roll call. The public shall be provided access to hear all discussion, testimony, and votes of the Board members, and the posted meeting notice and agenda shall include instructions for public access. A verbatim recording of the open session of the remote meeting shall be made and maintained as a public record in accordance with applicable law. (5 ILCS 120/7(e))
D. Notice and Agenda of Meetings
The notice and agenda of all regular and special meetings shall be posted at the principal office of the Fund and at the location where the meeting is to be held at least forty-eight (48) hours in advance of the holding of the meeting. At least one copy of the notice and agenda will be continuously available for public review for the entire forty-eight (48) hour period preceding the meeting. This requirement may be met by posting the notice and agenda on a website that is maintained by the Fund or the Village. Notices of remote meetings under Section 7(e) of the Open Meetings Act shall be posted on the Fund’s or Village’s website. (5 ILCS 120/7(e))
E. Quorum Three (3) members of the Board shall constitute a quorum to do business. No meeting shall be held
unless a quorum of the Board is physically present, unless such meeting is being held remotely under Section 7(e) of the Open Meetings Act, as the result of a disaster declaration related to public health concerns. (5 ILCS 120/7(e))

Ottosen DiNolfo Hasenbalg & Castaldo, Ltd. © 2020
WILMETTE FIREFIGHTERS’ PENSION FUND – BOARD OF TRUSTEES 1.05
Page 2 of 2
CHAPTER ONE – BOARD OF TRUSTEES 1.05 MEETINGS (CONT.) F. Closed Sessions All meetings of the Board shall be open, unless a motion is made, seconded, and carried, to go to
closed session pursuant to an exception set forth under the Open Meetings Act. The motion to go to closed session shall set forth the specific exception pursuant to which the closed session will be held. (5 ILCS 120/2 and 2a)
LEGAL REF.: 5 ILCS 120/1.02, 2, 2.01, 2.02, 2.03, 2a, and 7(e) ADOPTED: October 22, 2020

Ottosen DiNolfo Hasenbalg & Castaldo, Ltd. © 2020
WILMETTE FIREFIGHTERS’ PENSION FUND – BOARD OF TRUSTEES 1.06
Page 1 of 2
CHAPTER ONE – BOARD OF TRUSTEES 1.06 MINUTES
A. Generally
The Secretary of the Board shall keep a true and correct copy of all transactions of the Board in regular and special meetings, open or closed, and committee meetings. The minutes shall include the date, time, and place of the meeting; the members of the Board as either present or absent; a summary of discussion on all matters proposed, deliberated, or decided; and a record of any votes taken, including the member making the motion, the second, and the results of the voting. The minutes of the proceedings of the Board at regular or special meetings shall be prepared in draft form and copies shall be mailed or delivered to all Board members with the notice of the meeting at least three (3) days in advance of the meeting. The minutes of the preceding meeting, with any changes made by a motion properly made and carried or as directed by the President without objections, shall be approved by the Board and signed by the Secretary no later than 30 days after that meeting or the Board’s second subsequent regular meeting, whichever is later. The official minutes of the Board shall be kept in the Board's files and shall be made available for inspection upon request during regular business hours within ten (10) days of approval.
B. Verbatim Record of Closed Meetings
In addition to preparing written minutes, the Secretary shall audio record all closed meetings. After the closed meeting, the Secretary shall label the recording with the date and store it in a secure location in the Fund’s files. After eighteen (18) months have passed since being made, the audio recording of a closed meeting may be destroyed, provided the Board has approved its destruction and approved written minutes of that particular closed meeting. Requests for access to a recording of a closed meeting will be denied unless the Board has found that the recording no longer needs confidential treatment. Individual Board members may listen to verbatim recordings when that action is germane to their responsibilities, e.g., in order to check the accuracy of minutes or to determine whether the recordings no longer require confidential treatment.
C. Semi-Annual Review of Closed Meeting Minutes
The Board shall periodically, but no less than semi-annually, meet to review the written minutes of all closed meetings. At such meetings, a determination shall be made, and reported in open session, that the need for confidentiality still exists as to all or part of those minutes or that the minutes or portions thereof no longer require confidential treatment and are available for public inspection.
During the Board’s semi-annual meetings to review the closed session minutes, the Board will also review the audio recordings of closed meetings in order to determine whether (1) there continues to be a need for confidentiality, or (2) the recordings no longer require confidential treatment and are available for public inspection. At no time will an audio recording be released that would violate state or federal privacy or confidentiality requirements, including, but not limited to, any matter concerning (1) communications between the Board and an attorney representing the Board; and (2) all information exempted from disclosure under the Illinois Freedom of Information Act.

Ottosen DiNolfo Hasenbalg & Castaldo, Ltd. © 2020
WILMETTE FIREFIGHTERS’ PENSION FUND – BOARD OF TRUSTEES 1.06
Page 2 of 2
CHAPTER ONE – BOARD OF TRUSTEES
1.06 MINUTES (CONT.)
LEGAL REF.: 5 ILCS 120/2.02, 2.03, 2.06, and 2a; 5 ILCS 140/1 et seq. RELATED FORMS: Closed Session Minutes Inventory ADOPTED: October 22, 2020

Ottosen DiNolfo Hasenbalg & Castaldo, Ltd. © 2020
WILMETTE FIREFIGHTERS’ PENSION FUND – BOARD OF TRUSTEES 1.07
Page 1 of 3
CHAPTER ONE – BOARD OF TRUSTEES 1.07 RULES OF ORDER A. Rule 1. Agenda All regular meeting agendas shall generally be prepared pursuant to the following outline:
I. Call to Order II. Roll Call III. Public Comment IV. Approval of Minutes V. Treasurer’s/Investment Report VI. Communications and Special Reports/Presentations VII. Consideration of and Action Upon Applicants for Admissions to and/or Benefits or
Withdraw of Members from Fund VIII. Unfinished Business IX. New Business X. Closed Session XI. Training XII. Adjournment
Prior to each regular meeting, the President or his or her designee shall prepare an agenda. Any
Board member may place items on the regular meeting agenda by submitting a written or electronic request to the President or his or her designee prior to the posting of the final agenda, which can in no case occur less than 48 hours before the meeting.
Agendas and other information for all meetings shall be electronically mailed or delivered to each
Board member no less than 48 hours prior to the beginning of the meeting. B. Rule 2. Presiding Officer The President of the Board shall serve as presiding officer at all meetings. If the President is absent,
the members present at the meeting shall elect a President pro tempore or temporary chairperson who shall act in the President's stead. The President may call on any member to perform the duties of presiding officer during any meeting. A pro tempore appointment shall not extend beyond the adjournment of that particular meeting.
The President shall preserve order and decorum, may speak to points of order in preference to other
members, vote on all issues before the Board, and shall decide all questions of order subject to an appeal of any three (3) members.
C. Rule 3. Voting A roll call vote shall be taken upon the passage of all resolutions, all propositions to create any liability
against the Fund, for the expenditure or appropriation of its money, on the question of granting or denying a disability pension, and in all other cases at the request of any member. All aye/nay votes shall be taken in the following order: the motioner shall vote first, the seconder second, and the remaining members in rotating order. All ayes and nays taken shall be recorded in the meeting's minutes. An affirmative vote of at least three (3) members shall be necessary to the passage of any such proposition unless otherwise provided by law.

Ottosen DiNolfo Hasenbalg & Castaldo, Ltd. © 2020
WILMETTE FIREFIGHTERS’ PENSION FUND – BOARD OF TRUSTEES 1.07
Page 2 of 3
CHAPTER ONE – BOARD OF TRUSTEES 1.07 RULES OF ORDER (CONT.) D. Rule 4. Questions Before the Board Every question before the Board shall be distinctly stated by the President before it is open for debate.
A motion shall be reduced to writing before a vote if requested by any Board member. Board members discussing a question shall address the President, and no member shall be deemed to have the floor until recognized by the President. If any question under consideration contains several distinct propositions, the Board may, by a majority of the members present, divide such questions.
E. Rule 5. Resolutions All resolutions, as well as amendments thereto, shall be reduced to writing before action shall be
taken on them. The title of resolutions shall be read aloud before a vote is taken, except when any member present requests it be read in its entirety. All resolutions shall be recorded in a sequential manner referencing the year (Ex. “Resolution YR-XX”).
F. Rule 6. Addressing the Board Except during the public comment portion of the Board agenda, or as stated in this rule, no person
other than the Board's attorney or members of the Fund may address the Board of Trustees. A portion of every Board meeting shall be provided for public comment. The person wishing to speak
must sign the Board’s public comment sign-in form prior to the beginning of the meeting. The speaker must be designated and authorized to speak by the President. Each speaker shall limit his or her public participation to a period of three (3) minutes or less so all persons shall have an adequate opportunity to make their statements to the Board.
The purpose of public participation is to allow the public the opportunity to make a statement to the
Board. The purpose of public participation is not to provoke a debate with the Board. Once an individual has spoken, that individual may not speak on the same issue again. Any limitation regarding addressing the Board may be waived by a majority vote of the Board of Trustees.
G. Rule 7. Attendance by Other Means Board Members may attend meetings by video or audio conference subject to the following
conditions:
1. A quorum of Board members must be physically present at the meeting location. 2. The Board member requesting to attend by audio or video conference must be unable to
physically attend the meeting because of: (a) personal illness or disability; (b) employment purposes or the business of the Board; or (c) a family or other emergency.
3. The Board member requesting to attend by audio or video conference must notify the Secretary before the meeting, if practicable.
4. A majority of the Board members must approve the Board member’s request to attend by audio or video conference.

Ottosen DiNolfo Hasenbalg & Castaldo, Ltd. © 2020
WILMETTE FIREFIGHTERS’ PENSION FUND – BOARD OF TRUSTEES 1.07
Page 3 of 3
CHAPTER ONE – BOARD OF TRUSTEES
1.07 RULES OF ORDER (CONT.)
5. Equipment must be available that will permit the Board member to participate in the meeting so the Board member can hear and/or see the other Board members and the other Board members can hear and/or see the Board member attending by audio or video conference.
If a Board member attends a meeting by audio or video conference, the minutes of that meeting shall reflect the member was present via audio or video conference. Board members attending by audio or video conference shall be permitted to participate in the meeting as if they were physically present to the extent permitted by the equipment used, including the right to vote on any matters that come before the Board.
H. Rule 8. Recording of Open Meetings
Members of the public attending an open meeting of the Board may record the proceedings of the open meeting as long as the method of recording does not interfere with the meeting. Members of the public who wish to record the proceedings of an open meeting should, prior to the commencement of the meeting, advise the Board President that the meeting will be recorded. The Board members and the Board’s recording secretary shall not record open meetings unless the open meeting is being conducted remotely under Section 7(e) of the Open Meetings Act or authorized by a majority of the Board. If a witness in a hearing before the Board refuses to testify on the grounds that he or she may not be compelled to testify if any portion of his or her testimony is to be broadcast or televised or if motion pictures are to be taken of him or her while he or she is testifying, the Board shall prohibit such recording during the testimony of the witness.
I. Rule 9. Written Communications
Written communications to the Board may be submitted to any Trustee of the Board at any time. Such communications shall be brought to the attention of the members of the Board at their next meeting and will be acknowledged in the minutes as having been received. A copy of all written communications made on behalf of the Board shall be provided to each Trustee.
J. Rule 10. Temporary Suspension of Rules
These rules may be temporarily suspended by an affirmative vote of three (3) Board members, as
long as the suspension of the rule does not otherwise violate applicable state or federal law. LEGAL REF.: 5 ILCS 120/1.02, 2.05 and 7 RELATED FORMS: Public Comment Sign-In and Notification of Intent to Record Meeting ADOPTED: October 22, 2020

Ottosen DiNolfo Hasenbalg & Castaldo, Ltd. © 2020
WILMETTE FIREFIGHTERS’ PENSION FUND – BOARD OF TRUSTEES 1.08
Page 1 of 1
CHAPTER ONE – BOARD OF TRUSTEES
1.08 BOARD MEMBER ETHICS Each Board member shall agree as a member of the Board of Trustees that he or she shall do his or her utmost to represent the Fund by adhering to the following commitments in addition to any other ethics ordinances that are or may hereafter be adopted or amended by the Village: A. He or she will represent the Fund members honestly and equally and refuse to surrender his or her
responsibilities to special interest or partisan political groups. B. He or she will avoid any conflict of interest or any appearance of impropriety which could result from
his or her position and shall not use his or her Board membership for personal gain or publiVillage. C. He or she will recognize a Board member has no legal authority as an individual and that decisions
can be made only by a majority vote at a Board of Trustees’ meeting. D. He or she will take no private action which might compromise the Board or administration of the Fund
and will respect the confidentiality of privileged information. E. He or she will abide by majority decisions of the Board while retaining the right to seek changes
through ethical and constructive channels. F. He or she will encourage and respect the free expression of opinion of fellow Board members and
others who seek to be heard before the Board of Trustees. G. He or she shall faithfully and diligently perform the duties of the Board of Trustees, including
attendance at all Board of Trustees meetings and other functions where Trustee attendance is required.
H. He or she shall not intentionally solicit or accept any gift from any prohibited source as prescribed in
Article 10 of the State Officials and Employees Ethics Act. However, Board members may accept gifts from prohibited sources under the limited exceptions set forth in Section 10-15 of the Act, except for educational missions and travel expenses. If the Village adopts or maintains a more restrictive policy on the acceptance of gifts, the Board members shall adhere to the Village’s policy.
I. By May 1st of each year, he or she shall annually file a Statement of Economic Interest with the
County Clerk as required by Article 4A of the Illinois Governmental Ethics Act, either by mail or online. The Statement of Economic Interest must include all information required by Section 4A-102 and shall be in the form required by Section 4A-103 of the Act.
LEGAL REF.: 5 ILCS 420/4A-102 and 4A-103; 5 ILCS 430/10-10 and 10-15; 40 ILCS 5/1-125 RELATED FORMS: Statement of Economic Interest (online) ADOPTED: October 22, 2020

Ottosen DiNolfo Hasenbalg & Castaldo, Ltd. © 2020
WILMETTE FIREFIGHTERS’ PENSION FUND – BOARD OF TRUSTEES 1.09
Page 1 of 1
CHAPTER ONE – BOARD OF TRUSTEES 1.09 FIDUCIARY RESPONSIBILITIES OF BOARD MEMBERS AND INDEMNIFICATION Board members, as fiduciaries with respect to the Fund, shall discharge their duties with respect to the Fund solely in the interest of the participants and beneficiaries and:
A. For the exclusive purpose of providing benefits to participants and their beneficiaries and defraying
reasonable expenses of administering the retirement system or pension fund;
B. With the care, skill, prudence and diligence under the circumstances then prevailing that a prudent man acting in a like capaVillage and familiar with such matters would use in the conduct of an enterprise of a like character with like aims;
C. By diversifying the investments of the Fund so as to minimize the risk of large losses, unless under
the circumstances it is clearly prudent not to do so;
D. In accordance with the provisions of Article 4 of the Illinois Pension Code governing the Fund.
The Board may indemnify and protect the trustees, staff, and consultants against all damage claims and suits, including defense thereof, when damages are sought for negligent or wrongful acts have been alleged to have been committed in the scope of employment or under the direction of the trustees. However, the trustees, staff, and consultants shall not be indemnified for willful misconduct and gross negligence. The Board is authorized to insure against loss or liability of the trustees, staff, and consultants which may result from these damage claims. This fiduciary and other liability insurance shall be carried by a company authorized to provide such coverage in the State of Illinois. LEGAL REF.: 40 ILCS 5/1-101.2, 1-107 and 1-109 ADOPTED: October 22, 2020

Ottosen DiNolfo Hasenbalg & Castaldo, Ltd. © 2020
WILMETTE FIREFIGHTERS’ PENSION FUND – BOARD OF TRUSTEES 1.10
Page 1 of 2
CHAPTER ONE – BOARD OF TRUSTEES 1.10 BOARD MEMBER TRAINING
A. Initial Certification Requirement
All newly appointed or newly elected Board members must participate in a mandatory trustee certification training seminar that consists of at least 16 hours of initial trustee certification at a training facility that is accredited and affiliated with a State of Illinois certified college or university. This training must include all of the following topics:
1. Duties and liabilities of a fiduciary with respect to the administration and payment of
benefits; 2. Adjudication of pension claims; 3. Trustee ethics; 4. The Illinois Open Meetings Act; and 5. The Illinois Freedom of Information Act.
B. Open Meetings Act Training
New Board members must complete the electronic training curriculum developed and administered by the Public Access Counselor and file a copy of the certificate of completion with the Fund. New Board members must complete this training within 90 days of election or appointment to the Board.
C. Annual Training Requirements
All elected and appointed Board members must annually complete a minimum of 8 hours of educational training after the first year the trustee is elected or appointed. This annual requirement shall include training on ethics, fiduciary duty, investment issues, and any other curriculum the Board establishes as being important for the administration of the Fund. The Board shall annually certify its members’ compliance and submit an annual certification to the Illinois Department of Insurance.
D. Eligibility; Replacing Board Members
Any Board member who does not complete the required training is not eligible to serve on the Board unless he or she completes the missed training within six months after the date the Board member failed to complete the required training. If a Board member fails to complete the required training, a successor shall be appointed or elected to complete the Board member’s unexpired term.
E. Attendance at Conferences and Continuing Education
All Board members may attend pension-related conferences or continuing education classes in person or online. Board members do not require pre-approval from the Board unless the conference or continuing education class requires overnight accommodations.

Ottosen DiNolfo Hasenbalg & Castaldo, Ltd. © 2020
WILMETTE FIREFIGHTERS’ PENSION FUND – BOARD OF TRUSTEES 1.10
Page 2 of 2
CHAPTER ONE – BOARD OF TRUSTEES 1.10 BOARD MEMBER TRAINING (CONT.)
The Fund shall cover the cost for registration and the actual and necessary expenses incurred while attending a conference or continuing education classes, as determined by the Board in accordance with the Board’s policy on travel expenses. The Board member shall be responsible for completing the necessary registration forms and forwarding them to the Secretary of the Board. The registration shall be reviewed by the Board at the next scheduled Board meeting. Any Board member who attends a conference or continuing education class may be requested to present the material that was covered at the conference or continuing education class at the next scheduled Board meeting. This will be added to the “Training” section of the agenda.
For the 16 hours of initial trustee certification training, Board members who are firefighters or who are employed by the Village shall be allowed time away from their duties to attend the training required under Section 1-109.3 of the Illinois Pension Code without reduction of accrued leave or benefit time.
LEGAL REF.: 5 ILCS 120/1.05; 40 ILCS 5/1-109.3 and 1-113.18 RELATED FORMS: Annual Board Member Training Record ADOPTED: October 22, 2020

Ottosen DiNolfo Hasenbalg & Castaldo, Ltd. © 2020
WILMETTE FIREFIGHTERS’ PENSION FUND – BOARD OF TRUSTEES 1.11
Page 1 of 1
CHAPTER ONE – BOARD OF TRUSTEES 1.11 FRAUDULENT STATEMENTS OR RECORDS No person, member, trustee, or employee of the Board shall knowingly make any false statement or falsify or permit to be falsified any Fund record in any attempt to defraud the Fund as a result of such act, or intentionally or knowingly defraud the Fund in any manner. Any reasonable suspicion by any member of the Board of a false statement or falsified record being submitted or permitted by a person under the Illinois Pension Code shall be immediately referred to the Board. “Reasonable suspicion” means a belief, based upon specific and articulable facts, taken together with rational inferences from those facts that would lead a reasonable person to believe that fraud has been, or will be, committed. A mere inconsistency, standing alone, does not give rise to a reasonable suspicion. The Board shall immediately notify the State’s Attorney about the alleged fraudulent activity so an investigation may be performed. LEGAL REF.: 40 ILCS 5/1-135 and 4-138.5 ADOPTED: October 22, 2020

Ottosen DiNolfo Hasenbalg & Castaldo, Ltd. © 2020
WILMETTE FIREFIGHTERS’ PENSION FUND – BOARD OF TRUSTEES 1.12
Page 1 of 1
CHAPTER ONE – BOARD OF TRUSTEES 1.12 RECORDS MAINTENANCE, RETENTION AND DISPOSAL The Board shall maintain the Fund’s records in accordance with applicable state and federal law. The Fund’s records or information contained therein may be released, transferred, disclosed or otherwise disseminated, only as provided by applicable law and Board rules. All applications and records produced on behalf of and transmitted to the Board by any individual or entity shall become the property of the Fund and shall be retained as required by law. The Secretary shall be responsible for the storage, maintenance and destruction of the Fund’s records, in accordance with applicable law. The Fund’s records shall include, but not be limited to:
Financial and Investment Records -- Data and documentation regarding the Fund’s financial condition and assets, including financial statements, contributions, benefit payments, audits, warrant lists, actuarial valuations, and investment reports.
Corporate Records -- Data and documentation regarding the activities of the Board of Trustees, including
correspondence, agendas, minutes, resolutions, policies, rules and forms, election and appointments records of Board members, agreements and contracts, and other related documentation of the operations of the Board required to comply with state and federal law.
Membership Records – Applications for membership and benefits, documentation of creditable service and breaks in service, birth certificates, marriage and civil union certificates, adoption orders, divorce decrees/QILDROs, powers of attorney, dependent adult child and parent records, disability determinations, death certificates, military records, and other related records.
All public records made or received by, or under the authority of, or coming into the custody, control or possession of the Fund shall not be mutilated, destroyed, transferred, removed or otherwise damaged or disposed of, in whole or in part, except as provided by law. The Secretary shall maintain an inventory of all public records kept by the Fund, which shall be updated annually. The inventory should include the classification of the records, as well as the dates of the records, the volume of the physical records in cubic feet, annual accumulation, and the arrangement in which they are filed. The Board shall apply to the Local Records Commission for authority to dispose of any unneeded public records. All documents considered public records that are not approved through the application for disposal shall be kept indefinitely or as determined by subsequent application to the Local Records Commission.
LEGAL REF.: 5 ILCS 140/1 et seq.; 5 ILCS 179/1 et seq.; 40 ILCS 5/4-129; 50 ILCS 205/1 et seq.;
815 ILCS 530/1 et seq. RELATED FORMS: Local Records Disposal Certificate (online) ADOPTED: October 22, 2020

Ottosen DiNolfo Hasenbalg & Castaldo, Ltd. © 2020
WILMETTE FIREFIGHTERS’ PENSION FUND – BOARD OF TRUSTEES 1.13
Page 1 of 7
CHAPTER ONE – BOARD OF TRUSTEES 1.13 FREEDOM OF INFORMATION It is the policy of the Fund to permit access to and copying of public records in accordance with the Illinois Freedom of Information Act, balanced, however, by the limited exceptions recognized in the Act to safeguard individual privacy and the efficient operation of the Fund. The Fund shall appoint a Freedom of Information Officer, who shall ensure the Fund complies with the Act through execution of this policy. The Freedom of Information Officer shall comply with the training curriculum required by the Act. (5 ILCS 140/3.5) A. Introduction 1. Brief Description of the Fund The Wilmette Firefighters’ Pension Fund is an Article 4 pension fund organized pursuant to
the Illinois Pension Code (40 ILCS 4-101 et seq.) for the benefit of its members and of their surviving spouses, children and certain other dependents. The Fund’s administrative office is located at Village of Wilmette, 1200 Wilmette Avenue, Wilmette, Illinois 60091.
2. Brief Description of the Method to Request Information All public requests for information and/or records will be processed through the
administrative offices of the Fund. Requests shall be directed in writing to the Freedom of Information Officer at the address noted above. The first 50 black and white copies are free. Thereafter, each page will be charged $ .15 per page. Electronic, color or oversized copies will be charged at the actual cost to the Fund of reproduction. (5 ILCS 140/4; 5 ILCS 140/6)
B. Public Access to Records 1. Generally The Fund shall make available its public records to any person requesting access pursuant
to the provisions of the Illinois Freedom of Information Act (the "Act"), as well as other applicable law. The Fund shall not provide access to public records or portions thereof that are exempt from disclosure under the Act or as provided by other applicable law. Denials of requests for records will contain a detailed factual basis for the denial. (5 ILCS 140/3; 5 ILCS 140/7; 5 ILCS 140/7.5; 5 ILCS 140/9)
2. Nonexempt Materials Contained in Exempt Records The Fund shall delete any information which is exempt from disclosure under the Act from a
public document which contains nonexempt material and make the remaining information available for inspection and copying. (5 ILCS 140/7)
3. Denial of Request for Public Records; Appeal Any person denied access to inspect or copy any public record may appeal the denial to the
Office of the Public Access Counselor at Illinois Attorney General, 500 S. Second Street, Springfield, Illinois 62701; telephone number 877-299-3642. (5 ILCS 140/9.5)

Ottosen DiNolfo Hasenbalg & Castaldo, Ltd. © 2020
WILMETTE FIREFIGHTERS’ PENSION FUND – BOARD OF TRUSTEES 1.13
Page 2 of 7
CHAPTER ONE – BOARD OF TRUSTEES
1.13 FREEDOM OF INFORMATION (CONT.) C. List of all Types or Categories of Records Under the Fund's Control
Financial and Investment Records -- Data and documentation regarding the Fund’s financial condition and assets, including financial statements, contributions, benefit payments, audits, warrant lists, actuarial valuations, and investment reports.
Corporate Records -- Data and documentation regarding the activities of the Board of Trustees, including correspondence, agendas, minutes, resolutions, policies, rules and forms, election and appointments records of Board members, agreements and contracts, and other related documentation of the operations of the Board required to comply with state and federal law.
Membership Records – Applications for membership and benefits, documentation of creditable service and breaks in service, birth certificates, marriage and civil union certificates, adoption orders, divorce decrees/QILDROs, powers of attorney, dependent adult child and parent records, disability determinations, death certificates, military records, and other related records.
D. Request Procedures 1. Initiation of Request Any person wishing to inspect or copy a Fund’s public record shall submit a written request
to the Freedom of Information Officer. While the use of a specific form is not required, the Fund will provide a form upon request. Requests are accepted via personal delivery, mail, facsimile or email. Requests must specify Fund records with reasonable particularity to avoid inefficient use of staff time in retrieving and preparing records for inspection. (5 ILCS 140/4)
2. Response to Request
a. Upon receipt, the Freedom of Information Officer shall: i. note the date the Fund received the written request; ii. compute the day on which the period for response will expire and make
a notation of that date on the written request; iii. maintain an electronic or paper copy of a written request, including all
documents submitted with the request until the request has been complied with or denied; and
iv. create a file for the retention of the original request, a copy of the
response, a record of written communications with the requester, and a copy of other communications.

Ottosen DiNolfo Hasenbalg & Castaldo, Ltd. © 2020
WILMETTE FIREFIGHTERS’ PENSION FUND – BOARD OF TRUSTEES 1.13
Page 3 of 7
CHAPTER ONE – BOARD OF TRUSTEES
1.13 FREEDOM OF INFORMATION (CONT.)
b. The Fund shall either comply with or deny the written request for public records
within five (5) working days after its receipt. Denial shall be in writing as provided below and contain a detailed factual basis for the denial. Failure to respond to a written request within five (5) working days after its receipt shall be considered a denial of the request. (5 ILCS 140/3)
c. The Fund's time for response may be extended for not more than five (5)
additional working days from the original due date for any of the following reasons: i. The requested records are stored in whole or in part at other locations
than the office having charge of the requested records; ii. The request requires the collection of a substantial number of specified
records; iii. The request is couched in categorical terms and requires an extensive
search for the records responsive to it; iv. The requested records have not been located in the course of routine
search and additional efforts are being made to locate them; v. The requested records require examination and evaluation by
personnel having the necessary competence and discretion to determine if they are exempt from disclosure under the Act or should be revealed only with appropriate deletions;
vi. The request for records cannot be complied with by the Fund within
five (5) working days without unduly burdening or interfering with the operations of the public body;
vii. There is a need for consultation, which shall be conducted with all
practicable speed, with another public body or among two or more components of the Fund having a substantial interest in the determination or in the subject matter of the request. (5 ILCS 140/3)
d. When additional time is required for any of the reasons listed, the Fund shall
notify in writing the person making the written request within five (5) working days of receipt of request.
e. The response times contained in this Section may be extended with the written
agreement of the requestor.

Ottosen DiNolfo Hasenbalg & Castaldo, Ltd. © 2020
WILMETTE FIREFIGHTERS’ PENSION FUND – BOARD OF TRUSTEES 1.13
Page 4 of 7
CHAPTER ONE – BOARD OF TRUSTEES 1.13 FREEDOM OF INFORMATION (CONT.)
f. The Freedom of Information Officer shall:
i. maintain an electronic or paper copy of a written request, including all documents submitted with the request until the request has been complied with or denied; and
ii. create a file for the retention of the original request, a copy of the
response, a record of written communications with the requester, and a copy of other communications.
3. Procedure for Inspection or Copying a. Inspection of Fund public records not excluded from inspection under the Act
shall be permitted on days the Fund’s office is open for business. b. Inspection must be made at the Fund’s office, and records are not to be removed
from the Fund’s office. c. The Freedom of Information Officer or his/her designee shall be present during
inspection of Fund records. d. Inspection will not be allowed when records are in immediate use by persons
exercising official duties which require use of the records. e. Copies of requested records will be provided by the Fund within the limitations of
the Fund’s copying equipment.
f. When requested information is available online, the Freedom of Information Officer shall direct the requestor to the website where the records can be accessed. If the requestor cannot reasonably access the records on the website where the records are available, the Freedom of Information Officer shall allow the requestor to physically inspect the records or provide copies to the requestor. (5 ILCS 140/8.5)
4. Fees a. Letter-sized, black and white copies are charged at $ .15 per page after the first
50 copies. Each color copy will be charged at $ .25 per page. Persons requesting electronic or oversized copies of Fund public records shall reimburse the Fund for its actual cost for reproducing public records, as determined by the Freedom of Information Officer or his designee. Each record certified shall cost $1.00.

Ottosen DiNolfo Hasenbalg & Castaldo, Ltd. © 2020
WILMETTE FIREFIGHTERS’ PENSION FUND – BOARD OF TRUSTEES 1.13
Page 5 of 7
CHAPTER ONE – BOARD OF TRUSTEES 1.13 FREEDOM OF INFORMATION (CONT.) b. Documents shall be furnished without charge or at a reduced charge, as
determined by the Freedom of Information Officer, if the person requesting the documents states the specific purpose for the request and indicates that a "waiver or reduction of the fee is in the public interest" pursuant to Section 6(b) of the Act (5 ILCS 140/6(b)). In setting the amount of the waiver or reduction, the Fund shall take into consideration the amount of materials requested and the cost of copying them.
c. Records may be produced electronically, if requested. The Fund will email
records where practicable. When requests are unable to be sent via email or the requestor does not desire emailed copies, the Fund shall purchase appropriate electronic media and copy the documents to the electronic media. The requestor will pay the actual cost of the media. In no event may the Fund accept electronic media from a requestor. (5 ILCS 140/6)
d. For a voluminous request (as defined below) for electronic records that are not in
a portable document format (“PDF”), the Fund may charge up to $20 if the file is less than two megabytes; $40 if the file is between two and four megabytes; and $100 if the file is larger than four megabytes. If an electronic document is available as a PDF, the Fund may charge up to $20 if the file is less than eighty megabytes; $40 if the file is between eighty and 160 megabytes; and $100 if the file is larger than 160 megabytes. (5 ILCS 140/3.6)
e. With respect to a commercial request, the Fund may charge up to $10 for each
hour, in excess of eight (8) hours, spent by personnel in searching for and retrieving a requested record or examining the record for necessary redactions. An accounting of all fees, costs, and personnel hours will be provided to the requestor. (5 ILCS 140/6(f))
f. With respect to a commercial request, the Fund may charge the actual cost of
receiving and transporting public records from an off-site storage facility when the public records are maintained by a third-party storage company under contract with the Fund. An accounting of all costs will be provided to the requestor. (5 ILCS 140/6(f))
5. Unduly Burdensome Request Exemption a. Requests calling for all records falling within a category shall be complied with
unless compliance with the request would be unduly burdensome for the Fund and there is no way to narrow the request, and the burden on the Fund outweighs the public interest in the information.

Ottosen DiNolfo Hasenbalg & Castaldo, Ltd. © 2020
WILMETTE FIREFIGHTERS’ PENSION FUND – BOARD OF TRUSTEES 1.13
Page 6 of 7
CHAPTER ONE – BOARD OF TRUSTEES
1.13 FREEDOM OF INFORMATION (CONT.) b. Before invoking this exemption, the Fund shall extend to the person making the
request an opportunity to confer with it in an attempt to reduce the request to manageable proportions.
c. The Fund shall invoke this exemption in writing to the person making the request
specifying the reasons why it would unduly burden the Fund and the extent to which compliance would so burden the operations of the Fund.
d. Repeated requests for the same public records by the same person shall be
deemed unduly burdensome under this provision. (5 ILCS 140/3) 6. Commercial Requests
a. Prior to responding to a request for records, the Freedom of Information Officer shall determine whether the requested records will be used in any sale, resale, solicitation or advertisements for sales or services. If the Freedom of Information Officer determines that the request is for one of these purposes, it shall be deemed a commercial request and response shall be governed by this section. Requests received from news media, non-profit, scientific or academic organizations shall not be considered commercial requests.
b. When a request is for a commercial purpose, the Freedom of Information Officer shall respond to the requestor within five (5) business days, informing the requestor that the request is considered commercial.
c. Within twenty-one (21) business days after the receipt of the commercial purpose request, the Freedom of Information Officer shall respond to the requestor. Such response shall either:
i. provide an estimate of the time required to provide the records,
including a requirement that the requestor pay for the copies; ii. deny the request pursuant to one or more exemptions found in the
Freedom of Information Act; iii. notify the requestor the request is unduly burdensome and extend an
opportunity to the requestor to reduce the request to manageable proportions; or
iv. provide the requested records.

Ottosen DiNolfo Hasenbalg & Castaldo, Ltd. © 2020
WILMETTE FIREFIGHTERS’ PENSION FUND – BOARD OF TRUSTEES 1.13
Page 7 of 7
CHAPTER ONE – BOARD OF TRUSTEES
1.13 FREEDOM OF INFORMATION (CONT.)
d. When estimating the time required for responding to a commercial records request, the Freedom of Information Officer should consider the size and complexity of the request. Priority shall be given to non-commercial requests. (5 ILCS 140/3.1)
7. Voluminous Requests a. There are three types of voluminous requests:
i. Requests that require the compilation of more than 500 pages, unless the
request only targets a single record that happens to be over 500 pages; ii. Requests that contain more than five (5) individual sub-requests for more
than five (5) different kinds of records; and iii. Five (5) separate FOIA requests for five (5) different types of records made
in a twenty (20) day period by a single requester.
b. When a request is a voluminous request, the Freedom of Information Officer shall respond to the requestor within five (5) business days informing the requestor the request is considered voluminous. The requestor shall have ten (10) business days to amend his or her request. If the requestor does not amend his or her request, the Freedom of Information Officer must again respond within five (5) business days. The Freedom of Information Officer shall estimate the fees to be charged and respond in one of three ways:
i. Deny the request under an applicable FOIA exemption; ii. Notify the requester his or her request is unduly burdensome; or
iii. Provide the records as requested. (5 ILCS 140/3.6)
LEGAL REF.: 5 ILCS 140/1 et seq. RELATED FORMS: Written Request for Records Approval for Request for Public Records
Denial of Request for Public Records Partial Approval of Request for Public Records Deferral of Response to Request for Public Records
ADOPTED: October 22, 2020

Ottosen DiNolfo Hasenbalg & Castaldo, Ltd. © 2020
WILMETTE FIREFIGHTERS’ PENSION FUND – BOARD OF TRUSTEES 1.14
Page 1 of 3
CHAPTER ONE – BOARD OF TRUSTEES 1.14 IDENTITY AND PERSONAL PRIVACY PROTECTION
A. Generally
The Board shall protect the identity and personal privacy of all Fund officials, officers, members, agents, and members of the public. The Fund shall comply with the Illinois Identity Protection Act (5 ILCS 179/1 et seq.) and Personal Privacy Information Act (815 ILCS 530/1 et seq.), as well as related state and federal laws protecting the privacy of medical records, through implementation of this policy.
Except where required or authorized by law or regulation, the Fund, its Board and its agents shall not
collect, use, or disclose a person’s Social Security Number (“SSN”). The Fund shall not request SSNs except when it falls under a delineated exception permitted under state law. Persons not serving on the Fund shall generally have no access to documents or information containing individuals’ SSNs. Any more restrictive law, rule, or regulation regarding the collection, use or disclosure of an SSN shall control over Board’s rules.
Medical records in the Board’s possession shall not be released to anyone other than the member
concerned. In the event a member applies for a disability pension, the member’s medical records will become part of the record for the member’s disability hearing, and may be provided to Board members, evaluating physicians, witnesses, the member’s attorney, any intervening party’s attorney, and the Board’s attorney for that purpose. Notwithstanding the foregoing, if any federal or state law mandates disclosure of a member’s medical records, the Board will comply with the requirements of the law.
The Fund shall implement and maintain reasonable security measures to protect records containing
personal information from unauthorized access, acquisition, destruction, use, modification, or disclosure.
B. Identity and Privacy Protections
1. The Board’s Freedom of Information Officer(s) or designee shall redact SSNs and private information from documents, including all or any portion of an individual's SSN requested for public inspection and copying of information pursuant to federal or state law, such as the Freedom of Information Act. (5 ILCS 179/15; 5 ILCS 140/2(c-5)). The Board shall provide a means to ensure SSNs collected on Fund documents may be readily redacted in the event of a FOIA request.
2. Except where expressly permitted, the following actions are prohibited by the Fund, the Board, and
its officials, officers, members, agents, and employees. (5 ILCS 179/10)
a. To publicly post or publicly display in any manner an individual's SSN.
b. To print an individual's SSN on any card required for the individual to access products or services provided by the Fund, unless otherwise required by law. This limitation includes encoding or embedding a SSN in any identification scheme, including, but not limited to, using a bar code, chip, magnetic strip, RFID technology, or other technology, in place of the SSN.
c. To require an individual to transmit his or her SSN over the internet, unless the
connection is secure or the SSN is encrypted.

Ottosen DiNolfo Hasenbalg & Castaldo, Ltd. © 2020
WILMETTE FIREFIGHTERS’ PENSION FUND – BOARD OF TRUSTEES 1.14
Page 2 of 3
CHAPTER ONE – BOARD OF TRUSTEES 1.14 IDENTITY AND PERSONAL PRIVACY PROTECTION (CONT).
d. To print an individual's SSN on any materials mailed to the individual through the U.S. Postal Service, any private mail service, electronic mail, or any similar method of delivery, unless state or federal law requires the SSN to be on the document to be mailed. The limitation of this sub-paragraph shall not apply to applications and forms sent by mail including, but not limited to:
i. material mailed in connection with the administration of the
Unemployment Act;
ii. material mailed in connection with any tax administered by the Illinois Department of Revenue; and
iii. documents sent as part of an application or enrollment process or to
establish, amend, or terminate an account, contract, or policy or to confirm the accuracy of the SSN, as long as the SSN is not printed, in whole or in part, on a postcard or other mailer that does not require an envelope, or is visible without opening the envelope.
e. To collect, use or disclose an individual's SSN unless:
i. required by federal or state law or regulation;
ii. the need and purpose are documented prior to the collection, use or
disclosure; and
iii. the collection, use or disclosure is relevant to the documented need and purpose.
C. Exceptions 1. SSN may be disclosed under the following circumstances:
a. Disclosure to another local government when required by law or regulation, and if documented protections are provided.
b. Disclosure pursuant to court order, warrant or subpoena.
2. SSN may be collected, used, or disclosed under the following circumstances:
a. When collection, use or disclosure is required to ensure the safety of state and local government employees; persons committed to correctional facilities, local jails, and other law-enforcement facilities or retention centers; wards of the

Ottosen DiNolfo Hasenbalg & Castaldo, Ltd. © 2020
WILMETTE FIREFIGHTERS’ PENSION FUND – BOARD OF TRUSTEES 1.14
Page 3 of 3
CHAPTER ONE – BOARD OF TRUSTEES 1.14 IDENTITY AND PERSONAL PRIVACY PROTECTION (CONT).
state; and all persons working in or visiting a state or local government agency facility.
b. When collection, use or disclosure is required for internal verification or
administrative purposes.
c. Collection or use to investigate or prevent fraud, to conduct background checks, to collect a debt, to obtain a credit report from a consumer reporting agency under the federal Fair Credit Reporting Act, to undertake any permissible purpose enumerated under the federal Gramm Leach Bliley Act, or to locate a missing person, a lost relative, or a person who is due a benefit, such as a pension benefit or an unclaimed property benefit.
D. Notice of Breach; Violations
The Board shall provide notice to affected individuals in the event of an unauthorized disclosure of their personal information. (815 ILCS 530/10) The Board shall cooperate with affected individuals in the case of such security breach, by:
Informing the affected individuals of the breach, including giving notice of the date or approximate date of the breach and the nature of the breach; and
Informing those individuals of any steps the Pension Fund has taken or plans to take
relating to the breach. Anyone violating this policy may be subject to disciplinary action up to termination and/or criminal prosecution as provided by applicable law. (5 ILCS 179/45)
E. Training
All Board members, employees, and officials who have access to SSNs and other personal information in the course of their position with the Fund shall undergo approved training on the handling and safeguarding of the confidentiality of SSNs and other personal information.
LEGAL REF.: 5 ILCS 179/1 et seq.; 815 ILCS 530/1 et seq. ADOPTED: October 22, 2020

Ottosen DiNolfo Hasenbalg & Castaldo, Ltd. © 2020
WILMETTE FIREFIGHTERS’ PENSION FUND – BOARD OF TRUSTEES 1.15
Page 1 of 1
CHAPTER ONE – BOARD OF TRUSTEES 1.15 CODE OF CONDUCT FOR FUND SERVICE PROVIDERS Any public or private individual or entity who provides goods or services to the Fund shall adhere to the following commitments:
A. Act in a professional and ethical manner at all times in dealings with the Fund. B. Act for the benefit of the Fund C. Act with independence and objectivity. D. Fully disclose to the Fund any conflicts of interest that arise that may impair the ability to act
independently or objectively. E. Act with reasonable care, skill, competence, and diligence when engaging in professional activities,
and in accordance with all applicable professional codes and standards for the individual’s or entity’s profession.
F. Communicate with the Fund in a timely, accurate, and transparent manner. G. Uphold the applicable law, rules and regulations governing the individual’s or entity’s profession. H. Refrain from advocating for the diminishment of public pension defined benefit plans.
Public and private individuals and entities who provide goods or services to the Fund shall sign and submit to the Fund an acknowledgement they have received a copy of the Fund’s Code of Conduct and certify they agree to abide by its provisions. LEGAL REF.: 40 ILCS 5/1-109 and 1-110 RELATED FORMS: Certification of Fund Service Provider ADOPTED: October 22, 2020

Ottosen DiNolfo Hasenbalg & Castaldo, Ltd. © 2020
WILMETTE FIREFIGHTERS’ PENSION FUND – BOARD OF TRUSTEES 2.01
Page 1 of 1
CHAPTER TWO – MEMBERSHIP IN FUND 2.01 APPLICATION FOR MEMBERSHIP Any person appointed as a firefighter in the City of Wilmette shall, within three (3) months after receiving his or her first appointment and within three (3) months after any reappointment, make written application for membership to the Board under the provisions of Article 4 of the Illinois Pension Code. The eligibility of all applicants shall be determined by the Board in accordance with all applicable laws. Application and Background Information Forms -- Application to the Fund shall be made in writing on the Board’s standard and submitted with a completed background information form, as well as with copies of the following documents:
Applicant’s Birth Certificate Spouse’s Birth Certificate Minor or Adult Dependent Children’s Birth Certificates Certified Copy of Children’s Adoption Orders Marriage Certificate or Certificate of Civil Union U.S. Military Service Records and/or Discharge Records, DD-214 Member-4 Copy Relevant Dependent Adult Children Records (such as Social Security Administration Determination of
Disability) Relevant Dependent Parent Records
Physician Certification of Entry-Level Physical Condition -- As part of the City’s examination given after a conditional offer of hire, the applicant shall be evaluated to determine whether he or she currently suffers from heart disease, stroke, tuberculosis, or any disease of the lungs or respiratory tract, or cancer. The results of that examination shall be submitted on the Board's standard physician's certification. The Board may elect to accept the results of the pre-employment physical examination administered to the applicant at the direction of the City as long as all concerns included above have been addressed as part of that physical examination.
LEGAL REF.: 40 ILCS 5/4-107 and 4-110.1 RELATED FORMS: Application for Membership Background Information Form Combined Creditable Service – Notice and Application Form Physician’s Certification Regarding Entry-Level Physical Condition ADOPTED: October 22, 2020

Ottosen DiNolfo Hasenbalg & Castaldo, Ltd. © 2020
WILMETTE FIREFIGHTERS’ PENSION FUND – BOARD OF TRUSTEES 2.02
Page 1 of 2
CHAPTER TWO – MEMBERSHIP IN FUND 2.02 COMBINED CREDITABLE SERVICE RECIPROCITY/IMRF TRANSFER OF SERVICE Any person appointed as a firefighter in the City of Wilmette who has previously served or currently serves as a firefighter for at least one (1) year in any other Illinois fire department or fire protection district and has been a member in another Article 4 pension fund may combine creditable service between Article 4 pension funds under Section 4-109.3 of the Illinois Pension Code (40 ILCS 5/4-109.3). Current firefighters shall make application to combine creditable service on the Fund’s notice and application form. Former members of the Fund who wish to combine creditable service with their current Article 4 pension fund shall complete the Fund’s application for combined creditable service for former members. Notice Requirements -- To combine creditable service with other Article 4 pension funds, any firefighter hired on or after July 1, 2004, must notify the following of his or her intent to combine creditable service from multiple Article 4 pension funds within 21 months of being hired by his or her current fire department or fire protection district:
Current Article 4 pension fund and current fire department or fire protection district All previous Article 4 pension funds and previous fire departments or fire protection districts at which he or
she was employed as a member of the Article 4 pension fund Public Pension Division of the Illinois Department of Insurance
Current Firefighters Additional Contribution -- Current firefighters who combine creditable service from multiples Article 4 funds shall authorize an additional pension contribution of one percent (1%) of his or her salary to the Fund pursuant to Section 4-118.1(c) of the Illinois Pension Code (40 ILCS 5/4-118.1(c)). This authorization must be submitted to the City’s payroll department. Any catch-up contributions shall be subject to interest at a rate of six percent (6%) per annum, compounded annually. Former Members Repayment of Contributions -- Former members shall repay any refund they received from the Fund with interest thereon at the rate of six percent (6%) per annum, compounded annually, from the first day of employment with their current fire department or fire protection district or the last day of the fiscal year of the Fund that immediately precedes the former member’s first day of employment, whichever is earlier. Former members shall also pay the Fund a contribution equal to one percent (1%) of monthly salary for each month of service credit that they have in the Fund, together with interest as set forth above. The former member’s contribution must be paid in full prior to any pension being paid to him or her and may be repaid pursuant to an installment plan not to exceed ten (10) years. IMRF Exclusion -- Any firefighter who was excluded from participation in the Fund because he or she earned credit for that service under Article 7 of the Illinois Pension Code (Illinois Municipal Retirement Fund (IMRF)) (40 ILCS 5/7-101 et seq.) and who is a participant in IMRF may become an active participant in the Fund by making a written application on the Board’s standard form. Participation in the Fund shall begin on the first day of the month following the month in which the application is received by the Board. IMRF Transfer -- Any firefighter who was excluded from participation in the Fund because he or she earned credit for service under IMRF and who is a participant in IMRF may also elect to establish creditable service for those periods of employment as a firefighter during which he or she was excluded from participation in an Article 4 fund. To establish this credit, the firefighter shall pay into the Fund the amount the firefighter would have contributed had deductions from salary been made for this purpose at the time the service was rendered, together with interest thereon at 6% per annum, compounded annually, from the time the service was rendered until the date of payment, less any amounts transferred from IMRF under Section 7-139.10 of the Illinois Pension Code (40 ILCS 5/7-139.10).

Ottosen DiNolfo Hasenbalg & Castaldo, Ltd. © 2020
WILMETTE FIREFIGHTERS’ PENSION FUND – BOARD OF TRUSTEES 2.02
Page 2 of 2
CHAPTER TWO – MEMBERSHIP IN FUND
2.02 COMBINED CREDITABLE SERVICE RECIPROCITY/IMRF TRANSFER OF SERVICE (CONT). LEGAL REF.: 40 ILCS 5/4-109.3, 4-118.1(c) and 7-139.10 RELATED FORMS: Combined Creditable Service – Notice and Application Form (Current Member) Application for Combined Creditable Service (Former Member) Maintenance of Pension after Separation from Service
Illinois DOI Notification of Intent to Receive Benefits Provided under 40 ILCS 5/4-109.3 (Employee Creditable Service/Benefit – Reciprocity) Authorization of Combined Creditable Service Additional 1% Contribution
Application for Repayment of Refund or Payment to IMRF
ADOPTED: October 22, 2020

Ottosen DiNolfo Hasenbalg & Castaldo, Ltd. © 2020
WILMETTE FIREFIGHTERS’ PENSION FUND – BOARD OF TRUSTEES 2.03
Page 1 of 2
CHAPTER TWO – MEMBERSHIP IN FUND 2.03 DETERMINATION OF CONTINUING ELIGIBILITY FOR BENEFITS All members and beneficiaries drawing benefits from the Fund shall annually complete an Affidavit of Eligibility to verify the member or beneficiary is still living and to ensure the members and their beneficiaries meet eligibility requirements. The affidavit shall be mailed every year to the member or beneficiary with his or her monthly advice of payment or by other means. The affidavit must be completed, notarized, and returned to the Board by the deadline set by the Board. The affidavit may not be notarized by the member nor any potential beneficiary of that member.
If a member or beneficiary is unable to sign the annual affidavit due to disability or incompetence, the member or beneficiary’s agent, acting under a durable power of attorney, may sign the affidavit. A copy of the durable power of attorney must be submitted to the Fund with the Affidavit of Eligibility.
The Board may initiate an investigation regarding the continued validity of any eligibility for pension benefits by
any member or beneficiary. At its discretion, the Board may require additional proof of continued eligibility from any member or beneficiary drawing benefits.
Failure to submit an annual affidavit in a timely manner may result in benefits being held by the Board until the affidavit has been received and the Board has confirmed continued eligibility.
Medical examination of disabled members -- Medical examination of a member receiving a disability pension shall be made at least once each year prior to attainment of age 50 in order to verify continuance of disability. However, if the member is receiving a disability pension for post-traumatic stress disorder (PTSD) related to his or her service as a firefighter, a medical examination shall not be conducted if:
The firefighter has attained the age of 45; The firefighter has provided to the Board documentation approving the discontinuance of the medical
examination from at least two (2) physicians; and At least four (4) members of the Board have voted in the affirmative to allow the firefighter to discontinue the
medical examination. Annual medical examinations may include a functional capacity evaluation and any other testing deemed relevant by the Board or the reviewing physician. No examination shall be required after age 50. All members receiving disability benefits under the age of 50 shall annually sign an authorization for release of medical records and submit it to the Board. The physician who examined the member shall complete and forward to the Board a certification of continuance of disability (indicating whether the member continues to suffer from the disability), along with copies of all pertinent medical records with the Board's standard certification form. Notification of termination of benefits -- The Board shall review the completed forms to determine future eligibility. If the Board determines the individual pensioner's or beneficiary's status has changed to render him or her ineligible to receive benefits, the Board shall notify the pensioner or beneficiary by certified mail of its decision to cease payment of benefits, indicating the reasons for ineligibility. In the case of a member receiving disability benefits, the member shall be entitled to ten (10) days’ notice before any meeting or hearing of the Board at which the question of his or her disability is to be considered, and shall have the right to be present and represented by counsel at his or her expense.

Ottosen DiNolfo Hasenbalg & Castaldo, Ltd. © 2020
WILMETTE FIREFIGHTERS’ PENSION FUND – BOARD OF TRUSTEES 2.03
Page 2 of 2
CHAPTER TWO – MEMBERSHIP IN FUND
2.03 DETERMINATION OF CONTINUING ELIGIBILITY FOR BENEFITS (CONT.) LEGAL REF.: 40 ILCS 5/4-112
RELATED FORMS: Information on Annual Affidavits of Eligibility
Affidavit of Eligibility - Retirement Affidavit of Eligibility - Survivor’s Benefits Affidavit of Eligibility - Disability Pension
Authorization for Release of Records Physician’s Certification of Continuance of Disability Certification of Medical Records
ADOPTED: October 22, 2020

Ottosen DiNolfo Hasenbalg & Castaldo, Ltd. © 2020
WILMETTE FIREFIGHTERS’ PENSION FUND – BOARD OF TRUSTEES 2.04
Page 1 of 1
CHAPTER TWO – MEMBERSHIP IN FUND 2.04 CHANGE OF RECORDS AND SECONDARY EMPLOYER REPORTING All members and beneficiaries shall immediately notify the Board of any changes in address, dependent status or marital status, and any other changes in circumstances that may affect their membership in the Fund or entitlement to benefits. Changes shall be submitted to the Board in writing on the Board's standard change of records form, and any relevant supporting documentation will be submitted to the Fund. All members and anyone receiving benefits shall annually respond to the Board’s request for confirmation of current record information and provide any updates as requested by the Board. Secondary employer reporting – To ensure the Board is aware of additional liabilities and risks to which the Fund’s members are exposed when performing work as firefighters for secondary employers, the Board shall receive and maintain on file any reports of injury, illness, or exposure incurred by a member during his or her employment in the fire service of a secondary employer. Such reports must be received within 96 hours from the date of the injury, illness, or exposure occurrence, and consistent with reporting requirements set forth in Chapters 4,13, and 14 of NFPA 1500. Furthermore, the Board shall annually receive and maintain on file secondary employers’ certified reports accounting for all hours worked by, and wages and salaries paid to, the members by secondary employers during the fiscal year. Such certified reports shall be received no later than 30 days after the end of the secondary employers’ fiscal year. LEGAL REF.: 40 ILCS 5/4-110.2, 4-118(a-2) and 4-126 RELATED FORMS: Change of Records Form
Information Update Form – Active Members Information Update Form – Retired/Disabled/Beneficiary
ADOPTED: October 22, 2020

Ottosen DiNolfo Hasenbalg & Castaldo, Ltd. © 2020
WILMETTE FIREFIGHTERS’ PENSION FUND – BOARD OF TRUSTEES 2.05
Page 1 of 1
CHAPTER TWO – MEMBERSHIP IN FUND 2.05 REFUND OF CONTRIBUTIONS A firefighter with less than twenty (20) years of service is entitled to a refund of his or her total contributions during such service if:
He or she resigns or is discharged, or has been involuntarily laid off for other than disciplinary reasons for more than 180 calendar days; and
He or she has not received any disability pension payments.
The firefighter shall make application for refund on the Board's standard form and shall include a copy of his or her letter of resignation or discharge. Any firefighter receiving a refund forfeits and relinquishes all accrued rights in the Fund, including accumulated creditable service. Re-employment -- In the event of reemployment in the service, the firefighter shall, prior to commencing service repay to the Fund, to the extent the municipality has not made such contribution on his or her behalf, the amount of any refund which he or she received upon resigning or being discharged. Upon repayment of this refund, the firefighter shall receive credit for the previous years of service for which he or she had received the refund. Excess contributions from combined service -- In the event a firefighter who had previously made additional contributions to the Fund with the intention to receive a combined creditable service pension under Section 4-109.3 of the Illinois Pension Code and who later does not elect to receive a combined creditable service benefit from one or more of the pension funds in which the firefighter has credit, he or she shall, upon withdrawal from the last pension fund, be entitled to receive a refund of any additional contributions he or she made to the Fund without interest. Death of firefighter without eligible survivors -- If a firefighter dies without eligible survivors, the Board shall refund to the firefighter’s estate the amount of his or her accumulated contributions, less the amount of pension payments, if any, made to the firefighter while living. LEGAL REF.: 40 ILCS 5/4-109.3, 4-144(e), 4-116 and 4-118.1 RELATED FORMS: Application for Refund Application for Refund – Deceased Firefighter
ADOPTED: October 22, 2020

Ottosen DiNolfo Hasenbalg & Castaldo, Ltd. © 2020
WILMETTE FIREFIGHTERS’ PENSION FUND – BOARD OF TRUSTEES 2.06
Page 1 of 1
CHAPTER TWO – MEMBERSHIP IN FUND 2.06 MAINTENANCE OF PENSION AFTER SEPARATION FROM SERVICE A firefighter with less than twenty (20) years who is terminating employment with the City of Wilmette Fire Department may request that the total deductions made from his or her salary during the employment period be left in the Fund. The firefighter shall submit an application for the maintenance of contributions in the Fund with a copy of his or her letter of resignation or termination. Contributions may be left in the Fund for purposes of combined creditable service with another Article 4 fund, or for purposes of a deferred retirement pension upon reaching the age of 60. LEGAL REF.: 40 ILCS 5/4-105a, 4-109 and 4-109.3 RELATED FORMS: Maintenance of Pension after Separation from Service
Application for Combined Creditable Service (Former Member) Illinois DOI Notification of Intent to Receive Benefits Provided under 40 ILCS 5/4-109.3 (Employee Creditable Service/Benefit – Reciprocity)
ADOPTED: October 22, 2020

Ottosen DiNolfo Hasenbalg & Castaldo, Ltd. © 2020
WILMETTE FIREFIGHTERS’ PENSION FUND – BOARD OF TRUSTEES 2.07
Page 1 of 1
CHAPTER TWO – MEMBERSHIP IN FUND 2.07 ABANDONED PROPERTY If a pension benefit or contributions held by the Fund on behalf of member, retiree or beneficiary in excess of $50 are presumed to be abandoned and unclaimed by the apparent owner, the Board shall engage in the following due diligence:
Use first-class U.S. mail, telephone, and electronic mail to contact the apparent owner, using the most current contact information available for the apparent owner, known to be valid.
Use certified mail to contact the apparent owner, if he or she does not respond or otherwise indicate interest
in the benefit or contributions.
Contact other pension plans and employers to request a search of their records for more current contact information for the apparent owner as well as for more current contact information for any beneficiaries.
Attempt to identify and contact any individual that the apparent owner has designated as a beneficiary to find updated contact information for the apparent owner, using first-class U.S. mail, telephone, and electronic mail, where relevant contact information is available.
Use free electronic search tools through the internet to search for an apparent owner, including internet search engines, public record databases, obituaries, and social media.
If the property exceeds $1,000, the Board shall take additional due diligence steps, including the use of internet search tools, commercial locator services, credit reporting agencies, information brokers, investigation databases, and analogous services that may involve charges.
By November 1st of each year, the Board shall report to the State Treasurer via the internet in a format approved by the State Treasurer by providing information regarding property presumed abandoned in the Fund for the preceding period of July 1st to June 30th:
Name of the owner and names of any beneficiaries Last known address, if known Social Security number or taxpayer identification number, if known or readily ascertainable Dollar amount
LEGAL REF.: 765 ILCS 1026/15-1505 and 15-1506 RELATED FORMS: Illinois State Treasurer Annual Report of Unclaimed Property (online)
ADOPTED: October 22, 2020

Ottosen DiNolfo Hasenbalg & Castaldo, Ltd. © 2020
WILMETTE FIREFIGHTERS’ PENSION FUND – BOARD OF TRUSTEES 2.08
Page 1 of 1
CHAPTER TWO – MEMBERSHIP IN FUND 2.08 CREDIT FOR MILITARY SERVICE Firefighters with military service are eligible to obtain creditable service for (i) military service performed prior to employment as an active firefighter; and (ii) military service performed while serving as an active firefighter. A member shall be entitled to credit for military service only if the member’s military service entitles him or her to eligibility pursuant to Section 4304 of the Federal Uniform Services Employment and Re-Employment Rights Act (38 U.S.C. §4304). A member seeking to claim credit for military service shall provide written notification to the Board of the intent to do so, and make the corresponding contributions required by law, no later than the time prior to actual receipt of pension benefits. The member shall submit to the Board, along with a written request identifying the period for which credit is sought, a copy of the active-participant’s Member-4 copy of the Department of Defense form 214 (Certificate of Release of Discharge from Active Duty) for the relevant period for which creditable service for pension purposes has been requested.
To receive credit for military service, the member must pay into the Fund the required contributions set forth by statute. Payment may be made in equal installments over a period of the military service for which credit is sought, not to exceed five (5) years. Credit for military service cannot be awarded if the member does not make this mandatory contribution.
The actuarially assumed rate of interest during an installment repayment shall be determined based on the
Illinois Department of Insurance actuarially assumed interest rate for the years in which repayment remains ongoing. This interest shall continue be locked in as to any unpaid balance during the payment period.
Credit for military service performed prior to employment -- Firefighters in service on or after April 10, 2009, may obtain up to two (2) years of creditable service for pension purposes for service in the military, naval, or air forces of the United States that was served prior to employment as a firefighter. To receive this credit for military service, the firefighter must apply in writing to the Fund and make contributions to the Fund equal to:
the employee contributions that would have been required had the service been rendered as a member; and
an amount determined by the Fund to be equal to the employer’s normal cost of the benefits accrued for that
military service; and
interest at the actuarially assumed rate applicable to the years for which creditable service is sought, provided by the Illinois Department of Insurance, compounded annually from the first date of membership in the Fund to the date of payment on items i and ii.
Credit for military service performed while active firefighter -- Firefighters may obtain up to five (5) years of creditable service for pension purposes for service in the military, naval, or air forces of the United States in the period during which the firefighter was an active firefighter of a municipality. To receive credit for this military service, the firefighter must pay into the fund the amount the firefighter would have contributed if he or she had been a regular contributor during such period, and to the extent that the municipality which the firefighter served has not made such contributions in the firefighter's behalf. (40 ILCS 5/4-108(c)(1))
LEGAL REF.: 40 ILCS 5/4-108(c)(1) and 4-108(c)(1.5) RELATED FORMS: Application for Military Service Credit
ADOPTED: October 22, 2020

Ottosen DiNolfo Hasenbalg & Castaldo, Ltd. © 2020
WILMETTE FIREFIGHTERS’ PENSION FUND – BOARD OF TRUSTEES 3.01
Page 1 of 1
CHAPTER THREE – APPLICATION FOR BENEFITS AND HEARING PROCEDURES
3.01 APPLICATION FOR BENEFITS Disability Pension -- An application for a disability pension may be filed with the Board by or on behalf of any member who is qualified or who has allegedly become physically or mentally permanently disabled for service in the Wilmette Fire Department. Application for a disability pension shall be made on the Board's standard application for disability benefits, accompanied by an Authorization for Release of Medical Records. Applications must be signed by the member, or in the event he or she is unable to sign the application, by an appropriate representative as determined by the Board. An application for disability pension shall be submitted as soon as the applicant is aware of the need. Applications for disability benefits shall include a clear and concise statement of the nature of the disability, including the relevant section under which the disability pension is sought, a description of the sickness, accident or injury giving rise to the disability, and the times and places of occurrence of each accident or injury involved. Applications that are incomplete will be returned to the applicant, and the applicant will be required to completely fill out the form within twenty-one (21) days, or the application will be considered withdrawn. Retirement Pension -- Application for a retirement pension shall be made on the Board's standard application for retirement benefits. An application for a retirement pension shall be filed at least ninety (90) days before the requested effective date of the pension. Surviving Spouse and/or Dependent Minor Child Benefits -- Application for survivor and/or dependent minor child benefits shall be made on the Board's standard form for such benefits. A copy of the death certificate of the member shall be filed with the application for survivor benefits. Additional records may be requested where a line-of-duty surviving spouse benefit is sought. Adult Disabled Child Benefits -- Adult disabled children may be eligible for survivor benefits upon the death of a retiree or surviving spouse. Application for adult disabled child benefits shall be made on the Board’s standard form for such benefits. To be eligible for survivor benefits from the Fund, an adult disabled child must establish the following:
Dependency -- The child must be dependent upon the retiree or surviving spouse at the time of death for at
least one-half of the child’s support. This may be evidenced by the most recent tax returns submitted to the Internal Revenue Service, showing the child as a dependent for tax purposes.
Disability -- The child must be dependent because of a physical or mental disability which may be evidenced
by a court order under the Probate Act (755 ILCS 5/11a-1 et seq.). The Fund may also accept a finding of disability by the Social Security Administration.
LEGAL REF.: 40 ILCS 5/4-110, 4-110.1, 4-111, and 4-114; 755 ILCS 5/11a-1 et seq. RELATED FORMS: Application for Disability Benefits
Authorization for Release of Medical Records Application for Retirement Benefits
Application for Surviving Spouse and/or Dependent Benefits ADOPTED: October 22, 2020

Ottosen DiNolfo Hasenbalg & Castaldo, Ltd. © 2020
WILMETTE FIREFIGHTERS’ PENSION FUND – BOARD OF TRUSTEES 3.02
Page 1 of 1
CHAPTER THREE – APPLICATION FOR BENEFITS AND HEARING PROCEDURES
3.02 PROCESSING AN INVESTIGATION OF APPLICATION FOR BENEFITS Upon receipt of an application for benefits, the Secretary shall acknowledge receipt of the application and forward a copy to the Board's attorney. At the next regular meeting of the Board or any special meeting called for such purpose, the Board shall take official notice of the receipt of the application. The Board shall request any information pertaining to the application as it may deem necessary and may designate an appropriate non-Board person or persons to investigate the application. An application for a line-of-duty disability pension will also be automatically considered as an application for a non-duty disability pension unless the applicant specifically requests otherwise. If the application is for a disability pension, the Board shall designate three (3) physicians who shall thoroughly examine the applicant and who shall prepare and transmit written certified reports of their medical examinations and copies of all medical records to the Board with the Board's standard certification form. The physicians shall submit their conclusions regarding the applicant's condition on the Board's standard physician's certification of disability. In the event any designated physician is, for any reason, unable to make such an examination, the Board shall designate another physician to do so. The Board may designate one or more of its members, its attorney, or an outside agency to select the physicians. LEGAL REF.: 40 ILCS 5/4-110, 4-110.1, 4-111, 4-112 and 4-114(i) and (j) RELATED FORMS: Certification of Medical Records Physician’s Certification of Disability – Line-of-Duty Physician’s Certification of Disability -- Occupational Disease Physician’s Certification of Disability – Non-Duty Physician’s Certification of Line-of-Duty Death ADOPTED: October 22, 2020

Ottosen DiNolfo Hasenbalg & Castaldo, Ltd. © 2020
WILMETTE FIREFIGHTERS’ PENSION FUND – BOARD OF TRUSTEES 3.03
Page 1 of 1
CHAPTER THREE – APPLICATION FOR BENEFITS AND HEARING PROCEDURES
3.03 HEARINGS The Board shall cause the applicant to receive at least ten (10) days’ notice by certified mail or personal service of the time and date of any preliminary hearing or hearings at which the question of the applicant's application is to be considered. An applicant shall have the right to be present at any such preliminary hearing or hearings; the right to be represented by counsel; the right to present witnesses, evidence or information relevant to the issues involved; and the right to cross-examine all witnesses who testify at the hearing. However, the Board shall not have any obligation to provide the applicant with counsel. All hearings shall be held subject to the Open Meetings Act. The Board’s attorney shall preside as the hearing officer at all hearings. All hearings shall be transcribed by a court reporter and a copy of such transcript shall be placed in the applicant’s pension file. Continuances may be requested by the applicant or a Board member from time to time upon motion to the Board. The granting of or refusal to grant a continuance of a hearing is within the discretion of the Board. The technical rules of evidence shall not apply to hearings conducted hereunder. Interim award of benefits -- In situations where an applicant is seeking a line-of-duty disability, occupational disease disability, or line-of-duty death surviving spouse benefits, the Board, at its discretion, may consider an interim award of the lesser benefit of a non-duty disability or a regular surviving spouse benefit while a hearing is pending. The interim award may only occur in those circumstances of a line-of-duty or occupational disease disability application where the Board has received three written independent medical evaluations from its appointed physicians, all agreeing that the applicant is permanently disabled. If an interim award of a non-duty benefit is awarded by the Board, it may not reconsider its determination on the issues of disability or permanency before determining whether the disability was the result of sickness, accident or injury incurred in or resulting from an act of duty or the cumulative effects of acts of duty, or the occupational disease resulted from service as a firefighter. Intervention -- At the discretion of the Board, interested parties other than the applicant may seek permission to intervene. Intervention may be granted in the sole discretion of the Board. If granted, the intervenor shall be considered a party to the case, and depending on the circumstances, the hearing may be treated as an adversarial one with the intervenor and applicant acting as opposing parties.
Such intervening parties shall have the right to representation, the right to present evidence or information relevant to the issues involved, and the right to cross-examine all witnesses who testify at the hearing at the Board’s discretion. However, the Board shall not have any obligation to provide any intervening party with counsel. If the applicant or any intervening parties seek to provide information in support of or in objection to the pension application, they shall direct such information either orally at the hearing or in writing to the Board.
Any petition to intervene must be received by the Board no later than twenty-five (25) days prior to hearing. The Board shall inquire into all matters at issue, and no disability pension shall be given unless the Board establishes and determines a disability exists based upon the examinations of the three (3) physicians and such other evidence as the Board may deem necessary. The Board shall cause to be prepared a written finding of fact, conclusions of law and a written order after the conclusion of the hearing. The Board shall send the applicant a copy of this finding, along with its written decision on the application, by certified mail or personal service. LEGAL REF.: 5 ILCS 120/2(c)(4); 40 ILCS 5/4-110, 4-110.1, 4-111, 4-112 and 4-114(i) and (j), 4-139;
735 ILCS 5/3-103 ADOPTED: October 22, 2020

Ottosen DiNolfo Hasenbalg & Castaldo, Ltd. © 2020
WILMETTE FIREFIGHTERS’ PENSION FUND – BOARD OF TRUSTEES 3.04
Page 1 of 1
CHAPTER THREE – APPLICATION FOR BENEFITS AND HEARING PROCEDURES
3.04 WORKER’S COMPENSATION OFFSET/EFFECTIVE DATE OF DISABILITY BENEFITS Whenever a person is entitled to disability or survivor benefits and to benefits under the Workers’ Compensation Act or Workers’ Occupational Diseases Act, for the same injury or disease, the benefits payable by the Fund shall be reduced by an amount computed in accordance with Section 4-114.2 of the Illinois Pension Code (40 ILCS 5/4-114.2). If the applicant is granted a disability pension by the Board, the pension shall be retroactive to whichever date is later:
The date the application was filed with the Board; or
The day following the end of the applicant’s receipt of salary – including salary received under the Public Employee Disability Act (PEDA) (5 ILCS 345/0.01 et seq.) – and any applicable paid time off (such as vacation time, sick leave or personal time) from the City of Wilmette payroll, for which employee contributions have been made and creditable service earned.
For purposes of the Board’s rule, salary does not include monthly worker’s compensation (TTD) benefits. An applicant is no longer on the City of Wilmette’s payroll when he or she no longer receives salary, even if the applicant continues to be an employee of the City in an unpaid status, on an unpaid leave, or receiving monthly worker’s compensation (TTD) benefits. LEGAL REF.: 5 ILCS 345/0.01 et seq.; 40 ILCS 5/4-114.2 ADOPTED: October 22, 2020

Ottosen DiNolfo Hasenbalg & Castaldo, Ltd. © 2020
WILMETTE FIREFIGHTERS’ PENSION FUND – BOARD OF TRUSTEES 3.05
Page 1 of 8
CHAPTER THREE – APPLICATION FOR BENEFITS AND HEARING PROCEDURES
3.05 QUALIFIED ILLINOIS DOMESTIC RELATIONS ORDERS (QILDRO)
A. Generally
1. Compliance with QILDROs
The Fund shall comply with any Qualified Illinois Domestic Relations Order (QILDRO) properly issued by an Illinois court pursuant to Section 1-119 of the Illinois Pension Code (40 ILCS 5/1-119). The Fund shall promptly notify the firefighter and the “alternate payee” (as defined in 40 ILCS 5/1-119(a)(1)) by first class mail of the receipt of the order. (40 ILCS 5/1-119(d)(1)) The Board has made available a QILDRO information form for use by Fund members and attorneys inquiring about QILDROs. Fund members and attorneys seeking information from the Fund about QILDROs will be referred to the information form.
2. Responding to subpoenas
Within forty-five (45) days after receiving a subpoena from any party to a proceeding for declaration of invalidity of marriage, legal separation, or dissolution of marriage in which a QILDRO may be issued, or after receiving a request from the firefighter, the Fund shall issue a statement of a firefighter’s accumulated contributions, accrued benefits, and other interests in the Fund based on the data on file with the Fund on the date the subpoena is received, and of any relevant procedures, rules, or modifications to the model QILDRO form that have been adopted by the Fund.
In no event shall the Fund be required to furnish to any person an actuarial opinion as to the present value of the firefighter’s benefits or other interests. The papers, entries, and records, or parts thereof, of the Fund may be proved by a copy thereof, certified under the signature of the Secretary of the Fund or other duly appointed keeper of the records of the Fund and the corporate seal, if any. (40 ILCS 5/1-119(h)(1), (2) and (3))
3. Valid QILDROs
For a court order to be a valid QILDRO (40 ILCS 5/1-119(n)), it must satisfy all of the following criteria:
a. The order must be accompanied by a $50.00 processing fee, payable to the
Fund. (40 ILCS 5/1-119(d)(3)) b. If the order applies to a firefighter who became a member of the Fund before
July 1, 1999, an original “Consent of Issuance of QILDRO” must accompany it, signed by the firefighter. (40 ILCS 5/1-119(m)(1))
c. The order must be a certified copy of the original. (40 ILCS 5/1-119(d)(1)) d. The order must have been issued by an Illinois court of competent jurisdiction
in a proceeding for declaration of invalidity of marriage, legal separation, or dissolution of marriage that provides for support or the distribution of property, or any proceeding to amend or enforce such support or property distribution. (40 ILCS 5/1-119(b)(1))
e. The order must contain the name, mailing address, and last four digits of the Social Security number of the firefighter. (40 ILCS 5/1-119(c)(1))

Ottosen DiNolfo Hasenbalg & Castaldo, Ltd. © 2020
WILMETTE FIREFIGHTERS’ PENSION FUND – BOARD OF TRUSTEES 3.05
Page 2 of 8
CHAPTER THREE – APPLICATION FOR BENEFITS AND HEARING PROCEDURES
3.05 QUALIFIED ILLINOIS DOMESTIC RELATIONS ORDERS (QILDRO) (CONT.)
f. The order must contain the name, residence address, and last four digits of the Social Security number of the alternate payee. (40 ILCS 5/1-119(c)(1))
g. The order must identify the Fund as the retirement system to which it is directed. (40 ILCS 5/1-119(c)(1))
h. The order must identify the court that issued it. (40 ILCS 5/1-119(c)(1)) i. The order must specify either the dollar amount or percentage of the benefit
and/or refund payable to the alternate payee. (40 ILCS 5/1-119(c)(2)) j. If the QILDRO indicates that the alternate payee is to receive a percentage of
any Fund benefit, the calculations required shall be provided to the Fund via a QILDRO Calculation Court Order issued by an Illinois court of competent jurisdiction in a proceeding for declaration of invalidity of marriage, legal separation, or dissolution of marriage. (40 ILCS 5/1-119(c)(5))
k. The order must apply only to benefits that are statutorily subject to QILDROs. (40 ILCS 5/1-119(c)(2))
l. The order must be in the form adopted by the Fund. Any alterations to the form will invalidate the order. (40 ILCS 5/1-119(p)(2))
m. The effective date of the order must be on or after July 1, 1999. (40 ILCS 5/1-119(l)(2))
B. Deficiencies in order; cure period
Certain minor deficiencies in the court order may be corrected during the sixty (60) day period following the date the Fund sends notice of the deficiency or deficiencies. This sixty (60) day period is called the “cure period.”
1. Deficiencies that may be “cured”
Only the following deficiencies may be corrected during the cure period: a. The order is not accompanied by a $50.00 processing fee payable to the Fund,
or the check does not clear. b. The order is not a certified copy of the original. c. The order omits the mailing address or Social Security number of the firefighter
or alternate payee. d. The order contains an inaccurate Social Security number of the firefighter or
alternate payee. e. The order contains a misspelled name of the firefighter or alternate payee. f. Any other deficiency deemed by the Fund to be of a minor nature. g. The order applies to a firefighter who became a Fund member before July 1,
1999, and is not accompanied by an original valid “Consent to Issuance of QILDRO” signed by the firefighter.
h. The order specifies a percentage of the benefit and/or refund payable to the alternate payee and is not accompanied by a valid QILDRO Calculation Court Order.

Ottosen DiNolfo Hasenbalg & Castaldo, Ltd. © 2020
WILMETTE FIREFIGHTERS’ PENSION FUND – BOARD OF TRUSTEES 3.05
Page 3 of 8
CHAPTER THREE – APPLICATION FOR BENEFITS AND HEARING PROCEDURES
3.05 QUALIFIED ILLINOIS DOMESTIC RELATIONS ORDERS (QILDRO) (CONT.)
2. Holding of benefits during cure period
If the firefighter is receiving monthly benefits or has a refund application pending when the court order is received, the Fund will hold the portion of the benefit payable to the alternate payee during the cure period until: a. The order is resubmitted during the cure period and the Fund determines that
all deficiencies have been corrected; or b. The cure period expires.
If the order is rejected, any amounts held during the cure period will be paid to the firefighter.
3. Deficiencies that cannot be “cured”
All other deficiencies will invalidate the order and cannot be cured during the cure period. An order that has one or more of the following deficiencies is invalid:
a. The order is not issued by an Illinois court of competent jurisdiction. b. The order identifies a different retirement system. c. The order does not identify the court that issued it. d. The order does not specify the dollar amount or percentage of each benefit to
be paid to the alternate payee. e. The order applies to a benefit that is not statutorily subject to QILDROs. f. The order is not in the form adopted by the Fund. g. The effective date of the order is prior to July 1, 1999.
C. QILDRO Calculation Court Orders
If any QILDRO specifies a percentage of the benefit and/or refund payable to the alternate payee, a QILDRO Calculation Court Order issued by an Illinois Court of competent jurisdiction must also be provided to the Fund. The calculations required shall be performed by the firefighter, the alternate payee, their designated representatives or their designated experts. The Fund shall have no duty or obligation to assist in such calculations for the completion of the QILDRO Calculation Court Order, other than to provide the following information to the firefighter and to the alternate payee, or to one designated representative of each: 1. If the Fund receives the QILDRO before the firefighter’s effective date of retirement, then,
within 45 days after the Fund receives the QILDRO, the Fund shall provide all of the following information:
a. The date of the firefighter’s initial membership in the Fund, expressed as
month, day, and year, if available, or the most exact date that is available to the Fund.

Ottosen DiNolfo Hasenbalg & Castaldo, Ltd. © 2020
WILMETTE FIREFIGHTERS’ PENSION FUND – BOARD OF TRUSTEES 3.05
Page 4 of 8
CHAPTER THREE – APPLICATION FOR BENEFITS AND HEARING PROCEDURES
3.05 QUALIFIED ILLINOIS DOMESTIC RELATIONS ORDERS (QILDRO) (CONT). b. The amount of permissive and regular service the member accumulated in the
Fund from the time of initial membership through the most recent date available prior to the Fund receiving the QILDRO (the dates used by the Fund shall also be provided). Service amounts shall be expressed using the most exact time increments available to the Fund (e.g. months or fractions of years).
c. The gross amount of the firefighter’s non-reduced monthly annuity benefit earned, calculated as of the most recent date available prior to the Fund receiving the QILDRO, the date used by the Fund, and the earliest date the firefighter may be eligible to commence the benefit. This amount shall include any permissive service and upgrades purchased by the member, and those amounts shall be noted separately.
d. The gross amount of the firefighter’s refund or partial refund, including any interest payable on those amounts, calculated as of the most recent date available prior to the Fund receiving the QILDRO (the date used by the Fund shall also be provided).
e. The gross amount of the death benefits that would be payable to the member’s death benefit beneficiaries or estate, assuming the member dies on the date or a date as close as possible to the date the QILDRO was received by the Fund, including any interest payable on the amounts, calculated as of the most recent date available prior to the Fund receiving the QILDRO (the date used by the Fund shall also be provided).
f. Whether the firefighter has notified the Fund of the date the firefighter intends to retire, and if so, that date.
g. If the firefighter has provided a date that he or she intends to retire, the date, if available, that the Fund reasonably believes will be the firefighter’s effective date of retirement.
2. If the Fund receives the QILDRO after the effective date of retirement, then, within 45
days after the Fund receives the QILDRO, or if the Fund receives the QILDRO before the firefighter’s already scheduled effective date of retirement, then as soon as administratively possible before or after the firefighter’s effective date of retirement (but not later than 45 days after the firefighter’s effective date of retirement), the Fund shall provide all of the following information: a. The firefighter’s effective date of retirement. b. The date the firefighter commenced benefits or, if not yet commenced, the date
the Fund has scheduled the firefighter’s benefits to commence. c. The amount of permissive and regular service the firefighter accumulated in the
Fund from the time of initial membership through the member’s effective date of retirement. Service amounts shall be expressed using the most exact time increments available to the Fund (e.g., months or fractions of years).
d. The gross amount of the firefighter’s monthly retirement benefit, calculated as of the firefighter’s effective date of retirement. This amount shall include any permissive service and upgrades purchased by the firefighter, and those amounts shall be noted separately.
e. The gross amount of the firefighter’s refund or partial refund, including any interest payable on those amounts, calculated as of the firefighter’s effective date of retirement.

Ottosen DiNolfo Hasenbalg & Castaldo, Ltd. © 2020
WILMETTE FIREFIGHTERS’ PENSION FUND – BOARD OF TRUSTEES 3.05
Page 5 of 8
CHAPTER THREE – APPLICATION FOR BENEFITS AND HEARING PROCEDURES
3.05 QUALIFIED ILLINOIS DOMESTIC RELATIONS ORDERS (QILDRO)(CONT).
f. The gross amount of death benefits that would be payable to the firefighter’s
death benefit beneficiaries or estate, assuming the firefighter dies on the firefighter’s effective date of retirement, including any interest payable on those amounts.
3. If, and only if, the alternate payee is entitled to benefits under Section VII of the QILDRO,
then, within 45 days after the Fund receives notice of the firefighter’s death, the Fund shall provide the gross amount of death benefits payable, including any interest payable on those amounts, calculated as of the firefighter’s date of death.
In no event shall the Fund be required to furnish to any person an actuarial opinion as to the present value of the firefighter’s benefits or other interests.
D. Processing a valid QILDRO
The Board shall review each QILDRO it receives to ensure compliance with the Illinois Pension Code and its rules. Once the Board has determined that a QILDRO is valid, one of the two following scenarios will occur:
1. If the firefighter has not yet started receiving benefits, the QILDRO will be placed in the
firefighter’s pension file and will be implemented when the first affected benefit payment begins unless some later date is specified in the QILDRO.
2. If the firefighter is already receiving benefits, payment to the alternate payee will begin
with the first payment occurring at least thirty (30) days after the QILDRO was received by the Fund.
E. Current address of alternate payee
Each alternate payee is responsible for keeping the Fund informed of his or her current address. The Fund must have the alternate payee’s current address in order for him or her to receive payment. The law does not require the Fund to search for a missing alternate payee, other than sending notice to the last known address. (40 ILCS 5/1-119(e)(1))
When a firefighter becomes eligible to receive a retirement benefit or refund, the Fund will send notice to the alternate payee’s last known address. If the notice is returned undelivered, the Fund will hold the amount payable to the alternate payee for 180 days from the date that the notice is returned or the date the benefit becomes payable, whichever is later. The amount held will not bear interest. If the Fund is notified of the alternate payee’s current address within 180 days, the Fund will pay that amount held to the alternate payee. (40 ILCS 5/1-119(e)(2)) If the Fund does not learn of the alternate payee’s current address within 180 days, the Fund will pay that amount to the firefighter. If the fund later becomes aware of the alternate payee’s current address, the Fund will implement the QILDRO, but the alternate payee will have no right to any amounts already paid to the firefighter. (40 ILCS 5/1-119(e)(2))

Ottosen DiNolfo Hasenbalg & Castaldo, Ltd. © 2020
WILMETTE FIREFIGHTERS’ PENSION FUND – BOARD OF TRUSTEES 3.05
Page 6 of 8
CHAPTER THREE – APPLICATION FOR BENEFITS AND HEARING PROCEDURES
3.05 QUALIFIED ILLINOIS DOMESTIC RELATIONS ORDERS (QILDRO)(CONT).
F. Rights of the alternate payee
An alternate payee’s rights are no greater than the firefighter’s rights. An alternate payee is only eligible to receive payment if and when the firefighter becomes eligible to receive the benefit or refund. A QILDRO cannot order payment to an alternate payee that will not otherwise have been payable to the firefighter.
Any required application for benefits may be made by an alternate payee who is entitled to all of a termination refund or retirement benefit or part of a death benefit that is payable under a QILDRO, provided that all other qualifications and requirements have been met. However, the alternate payee may not make the required application for death benefits while the firefighter is alive or for a firefighter’s refund or a retirement benefit if the firefighter is in active service or below the minimum age for receiving an undiscounted retirement annuity in the Fund that has received the QILDRO or in another retirement system in which the firefighter has regular or permissive service and in which the firefighter’s rights under the Retirement Systems Reciprocal Act (40 ILCS 5/20-101 et seq.) would be affected as a result of the alternate payee’s application for a firefighter’s refund or retirement benefit. (40 ILCS 5/1-119(i))
G. “Amount payable” exceeding benefits; multiple QILDROs
If the amount payable to an alternate payee exceeds the actual amount of the benefit payable to the
firefighter, the excess shall be disregarded. If there are multiple QILDROs against a firefighter, the Fund will honor all of them to the extent possible. If the total amount payable to all alternate payees exceeds the actual amount of the benefit, the QILDROs will be satisfied in the order that the Fund received them. Amounts payable to multiple alternate payees will not be adjusted pro rata. Amounts that cannot be paid because the benefit is not large enough to cover all amounts payable shall be disregarded. The Fund is not responsible to an alternate payee or any other person for amounts that remain unpaid because the benefit is not large enough. (40 ILCS 5/1-119(f)(1) and (2))
If a benefit subject to a QILDRO subsequently becomes subject to a tax lien or withholding order, the
amount due will be deducted from the portion of the benefit payable to the person who is subject to the tax lien or withholding order. The remainder of the benefit will be payable to the recipient who is not affected by the tax lien or withholding order. The Fund is not required to make up any amounts not paid due to recoupment of an overpayment, tax lien, or withholding order.
H. Increases in benefits
The QILDRO form approved by the Fund includes a place to indicate whether the alternate payee is to receive a portion of any automatic annual increase in the firefighter’s retirement benefit. If the “WILL NOT” box is checked, then the amount of the firefighter’s retirement benefit that the alternate payee is receiving will remain constant, unless a modified QILDRO is received.

Ottosen DiNolfo Hasenbalg & Castaldo, Ltd. © 2020
WILMETTE FIREFIGHTERS’ PENSION FUND – BOARD OF TRUSTEES 3.05
Page 7 of 8
CHAPTER THREE – APPLICATION FOR BENEFITS AND HEARING PROCEDURES
3.05 QUALIFIED ILLINOIS DOMESTIC RELATIONS ORDERS (QILDRO)(CONT).
If the “WILL” box is checked, then the alternate payee will receive a portion of any increase in the firefighter’s retirement benefit. Thus, for example, if the “WILL” box is checked, and the firefighter’s total retirement benefit increases 3%, the portion going to the alternate payee will increase by 3%.
I. Modified QILDROs
A modified QILDRO must be sent to the Fund in the same manner as a new one. A separate $50.00 processing fee payable to the Fund must be paid each time a modified QILDRO is submitted.
A modified QILDRO will hold the same priority of payment that the original one held, as long as the modified QILDRO does not increase the amount of any benefit payable to the alternate payee as that amount was designated in the QUILDRO or affect a different benefit.
If a modified QILDRO increases the amount or affects different benefits, it will lose the priority held by the original QILDRO. Priority of payment will then be based on the date the Fund received the modified QILDRO. If the benefit is subject to multiple QILDROs, losing the original QILDRO’s priority could actually result in a reduced payment to the alternate payee. If the benefit is not large enough to pay the total due under all QILDROs, only the amount remaining after all other QILDROs have been paid will be available. (40 ILCS 5/1-119(f)(3))
J. Election of benefit payment; Recoupment of overpayments
As long as there is in effect a QILDRO relating to a firefighter’s retirement benefit, the firefighter may not elect a form of payment that has the effect of diminishing the amount of the payment to which any alternate payee is entitled, unless the alternate payee has consented to the election in a writing that includes the alternate payee’s notarized signature, and this written and notarized consent has been filed with the Fund. If the firefighter attempts to make such an election, the Fund shall reject the election and advise the firefighter of the need to obtain the alternate payee’s consent. (40 ILCS 5/1-119(j)(1) and (2))
If the Fund discovers that it has mistakenly allowed such election, it shall thereupon disallow that election and recalculate any benefits affected thereby. If the Fund determines that an amount paid to a regular payee should have been paid to an alternate payee, the Fund shall, if possible, recoup the amounts by deducting the overpayment from future payments and making payment to the alternate payee. (40 ILCS 5/1-119(j)(3) and (k))
The Fund may make deductions for recoupment over a period of time in the same manner as is provided by law or rule for the recoupment of other amounts incorrectly disbursed by the Fund in instances not involving a QILDRO. The Fund shall incur no liability to either the alternate payee or the regular payee as a result of any payment made in good faith, regardless of whether the Fund is able to accomplish recoupment. (40 ILCS 5/1-119(k))

Ottosen DiNolfo Hasenbalg & Castaldo, Ltd. © 2020
WILMETTE FIREFIGHTERS’ PENSION FUND – BOARD OF TRUSTEES 3.05
Page 8 of 8
CHAPTER THREE – APPLICATION FOR BENEFITS AND HEARING PROCEDURES
3.05 QUALIFIED ILLINOIS DOMESTIC RELATIONS ORDERS (QILDRO)(CONT).
K. Expiration of a QILDRO
A QILDRO expires upon the death of the alternate payee. The right to receive the affected benefit will then revert to the firefighter. A QILDRO will also expire upon the death of the firefighter or when the firefighter takes a refund that terminates his or her participation in the Fund. This is true even if the firefighter’s refund is paid to an alternate payee. (40 ILCS 5/1-119(g)(1) and (2))
LEGAL REF.: 40 ILCS 5/1-119 RELATED FORMS: Information for Members in Divorce Proceedings Qualified Illinois Domestic Relations Order Consent to Issuance of QILDRO
QILDRO Calculation Court Order QILDRO Verification Checklist
ADOPTED: October 22, 2020

Ottosen DiNolfo Hasenbalg & Castaldo, Ltd. © 2020
WILMETTE FIREFIGHTERS’ PENSION FUND – BOARD OF TRUSTEES 3.06
Page 1 of 1
CHAPTER THREE – APPLICATION FOR BENEFITS AND HEARING PROCEDURES
3.06 TERMINATION OF PENSION BENEFITS – APPLICATION OF PENSIONER A pensioner receiving a disability pension may file an application with the Board to terminate the pension benefits in order to seek reinstatement to active service. Upon satisfactory proof to the Board that a firefighter on a disability pension has recovered from disability, the Board shall terminate the disability pension. The Board shall conduct a hearing on the termination application in generally the same manner as hearings for disability pension applications. The pensioner shall be responsible for all medical and physician costs in excess of those associated with an independent medical evaluation regarding the pensioner’s original disability.
A firefighter may establish creditable service for a period up to three (3) years of time during which the firefighter received a disability pension. In order to establish such creditable service, the firefighter must have returned to active service after the disability for which credit is to be established. The firefighter shall make contributions with interest to the Fund based upon the salary upon which the disability pension was based prior to commencement of a retirement pension in accordance with Section 4-108(c)(7) of the Illinois Pension Code. LEGAL REF.: 40 ILCS 5/4-108(c)(7) and 4-112 RELATED FORMS: Application for Termination of Benefits
Application for Establishment of Creditable Service after Return to Active Service ADOPTED: October 22, 2020

Ottosen DiNolfo Hasenbalg & Castaldo, Ltd. © 2020
WILMETTE FIREFIGHTERS’ PENSION FUND – BOARD OF TRUSTEES 3.07
Page 1 of 1
CHAPTER THREE – APPLICATION FOR BENEFITS AND HEARING PROCEDURES
3.07 CONVERSION OF DISABILITY PENSION TO RETIREMENT PENSION A pensioner receiving a disability pension who is 50 years old or older and who has not completed 20 years of creditable service whose disability continues for a period which when added to his or her period of active service equals 20 years may elect to retire by submitting a written application to the Board. (40 ILCS 5/4-113(a)) A pensioner receiving a disability pension who is 50 years old or older and who has sufficient creditable service to qualify for a retirement pension may elect to retire at any time by submitting a written application to the Board. (40 ILCS 5/4-113(b)) LEGAL REF.: 40 ILCS 5/4-113 RELATED FORMS: Application for Conversion of Disability Pension to Retirement Pension ADOPTED: October 22, 2020

Ottosen DiNolfo Hasenbalg & Castaldo, Ltd. © 2020
WILMETTE FIREFIGHTERS’ PENSION FUND – BOARD OF TRUSTEES 3.08
Page 1 of 3
CHAPTER THREE – APPLICATION FOR BENEFITS AND HEARING PROCEDURES
3.08 BENEFITS FOR FIREFIGHTERS WITH COMBINED CREDITABLE SERVICE
A. Retirement Pension 1. Qualifications
A firefighter who seeks a combined creditable service retirement benefit from multiple Article 4 pension funds must:
a. Be a firefighter at the time of withdrawal from the last pension fund and for at
least the final three (3) years of employment prior to that withdrawal;
b. Establish service credit with at least two (2) Article 4 pension funds under the Illinois Pension Code;
c. Have a total of at least twenty (20) years of service under the various Article 4
firefighter pension funds;
d. Be at least 50 years of age; and
e. Be an active firefighter after July 1, 2004. (40 ILCS 5/4-109.3(b)) 2. Retirement Benefits A current City of Wilmette firefighter who is eligible for retirement benefits from the Fund
and at least one other Article 4 pension fund may elect to receive a retirement pension from the Fund and any other Article 4 pension fund in which he or she has at least one (1) year of service credit but has not received a refund under Section 4-116 of the Illinois Pension Code (40 ILCS 5/4-116) or has repaid any such refund in accordance with Section 4-109.3(g) of the Illinois Pension Code (40 ILCS 5/4-109.3(g)).
In such cases, the Fund shall calculate the retirement pension that would be payable to
the firefighter as if he or she had participated in the Fund during his or her entire period of service under all Article 4 pension funds (the “hypothetical pension”).
Any period of service for which the firefighter has received a refund under Section 4-116
of the Illinois Pension Code (40 ILCS 5/4-116) shall be excluded from this calculation unless the firefighter repays that refund to the applicable pension fund as required in Section 4-109.3(g) of the Illinois Pension Code (40 ILCS 5/4-109.3(g)). Proof of such creditable service and any refunds to other Article 4 pension funds must be provided to the Fund by the firefighter and confirmed by the applicable pension fund, and the firefighter must authorize that an additional 1.0% pension contribution be made to the Fund in accordance with statute.
The Fund shall subtract the original amounts of the retirement pensions payable to the firefighter by all other pension funds as provided in Section 4-109.3(d) of the Illinois Pension Code (40 ILCS 5/4-109.3(d)) from the firefighter’s hypothetical pension, and the remainder shall be the retirement pension payable to the firefighter by the Fund. (40 ILCS 5/4-109.3)

Ottosen DiNolfo Hasenbalg & Castaldo, Ltd. © 2020
WILMETTE FIREFIGHTERS’ PENSION FUND – BOARD OF TRUSTEES 3.08
Page 2 of 3
CHAPTER THREE – APPLICATION FOR BENEFITS AND HEARING PROCEDURES
3.08 BENEFITS FOR FIREFIGHTERS WITH COMBINED CREDITABLE SERVICE (CONT.)
3. Former City of Wilmette Firefighters seeking Retirement Benefits
A former City of Wilmette firefighter who is eligible for retirement benefits from another Article 4 pension fund may elect to also receive a pension from the Fund and any other Article 4 pension fund in which he or she has at least one (1) year of creditable service but has not received a refund under Section 4-116 of the Illinois Pension Code (40 ILCS 5/4-116).
If the former firefighter had received a refund from the Fund, he or she may reinstate
creditable service in the Fund by payment to the Fund of the amount of the refund together with interest thereon at the rate of 6% per year, compounded annually, from the date of the refund to the date of payment. This repayment may be made in installments over a period of up to ten (10) years but must be paid in full prior to retirement.
Upon retirement, the former firefighter shall receive a monthly retirement pension from
the Fund as provided in Section 4-104.3(d) of the Illinois Pension Code. (40 ILCS 5/4-109.3(d))
B. Duty-Related Disability Pension If a firefighter who is a participant in the Fund and who has creditable service in other Article 4
pension funds becomes entitled to a disability pension under Section 4-110 of the Illinois Pension Code (40 ILCS 5/4-110), the Fund shall pay the disability pension based only on the firefighter’s service with the Fund. (40 ILCS 5/4-109.3(l))
C. Occupational Disease Disability Pension If a firefighter who is a participant in the Fund and who has creditable service in other Article 4
pension funds becomes entitled to an occupational disease pension under Section 4-110.1 (40 ILCS 5/4-110.1), the Fund shall only pay a portion of that occupational disease disability pension equal to the proportion that the firefighter’s service credit with the Fund bears to the firefighter’s total service credit with all of the Article 4 pension funds to which he or she has made contributions.
A firefighter who has contributed to Article 4 pension funds for at least five (5) years of creditable service shall be deemed to have met the five (5) year creditable service requirement under Section 4-110.1 regardless of whether the firefighter has five (5) years of creditable service with the Fund. (40 ILCS 5/4-110.1)
D. Non-Duty Disability Pension
If a firefighter who is a participant in the Fund and who has creditable service in other Article 4
pension funds becomes entitled to a non-duty disability pension under Section 4-111 of the Illinois Pension Code (40 ILCS 5/4-111), the Fund shall pay the entire disability pension, provided that the firefighter has at least seven (7) years of creditable service with the Fund. (40 ILCS 5/4-109.3(n))

Ottosen DiNolfo Hasenbalg & Castaldo, Ltd. © 2020
WILMETTE FIREFIGHTERS’ PENSION FUND – BOARD OF TRUSTEES 3.08
Page 3 of 3
CHAPTER THREE – APPLICATION FOR BENEFITS AND HEARING PROCEDURES
3.08 BENEFITS FOR FIREFIGHTERS WITH COMBINED CREDITABLE SERVICE (CONT.) LEGAL REF.: 40 ILCS 5/4-109.3, 4-110. 4-110.1, 4-111, and 4-116 RELATED FORMS: Creditable Service Claim Form and Affidavit, and Notice and Verification of
Request for Creditable Service Application for Retirement Benefits - Former Employee Application for Repayment of Refund or Payment for IMRF Service Credit Application for Disability Benefits Authorization for Release of Medical Records ADOPTED: October 22, 2020

Ottosen DiNolfo Hasenbalg & Castaldo, Ltd. © 2020
WILMETTE FIREFIGHTERS’ PENSION FUND – BOARD OF TRUSTEES 3.09
Page 1 of 1
CHAPTER THREE – APPLICATION FOR BENEFITS AND HEARING PROCEDURES
3.09 CORRECTING BENEFIT MISTAKES If the Fund commits a mistake by setting any benefit at an incorrect amount, it shall adjust the benefit to the correct level as soon as may be practical. (40 ILCS 5/4-138.10) A mistake includes clerical or administrative errors executed by the Fund or the participant. However, a “mistake” does not include the reasonable calculation of the benefit or aspects of the benefit based on salary, service credit, calculation or determination of a disability, date of retirement, or other factors significant to the calculation of the benefit that were reasonably understood or agreed to by the Fund at the time of retirement. (40 ILCS 5/4-138.10(a))
Underpayment -- If a pension benefit is mistakenly set too low, the Fund shall make a lump sum payment to
the recipient in an amount equal to the difference between the benefits that should have been paid and the benefits that actually were paid, plus annual interest from the date that the unpaid amounts accrued to the date of payment. (40 ILCS 5/4-138.10(b); 50 Ill. Admin. Code §4450.20)
Overpayment -- If a pension benefit is mistakenly set too high, the Fund may recover the amount overpaid.
The Fund may do so either by directly seeking a lump sum repayment or it may deduct such amount from the participants remaining benefits as is indicated by the recipient. If the overpayment is recovered by deductions from the remaining benefits payable to the recipient, the monthly deduction shall not exceed 10% of the corrected monthly benefit, unless otherwise indicated by the recipient.
If, however, the mistaken overpayment was undiscovered for three (3) years or longer and was not the result of fraud committed by the affected participant or beneficiary, then the mistake shall be adjusted to the correct benefit level but the Fund shall not seek repayment of excess benefits received. (40 ILCS 5/4-138.10(c))
The Board may hold a meeting or conduct a hearing to receive evidence, deliberate, and determine whether a mistake was made with regard to the amount of a benefit. Any affected pensioner shall be given notice of the meeting or hearing and shall be given an opportunity to be heard and present evidence to the Board. Upon the discovery and adjustment of any benefit, the Board shall notify the Public Pension Division of the Illinois Department of Insurance by mail of that adjustment of benefit with 45 days after making the lump sum payment or adjustment. LEGAL REF.: 40 ILCS 5/4-138.10 and 4-139; 50 Ill. Admin. Code §4450.10 et seq. ADOPTED: October 22, 2020

Ottosen DiNolfo Hasenbalg & Castaldo, Ltd. © 2020
WILMETTE FIREFIGHTERS’ PENSION FUND – BOARD OF TRUSTEES 4.01
Page 1 of 1
CHAPTER FOUR – CONTRIBUTIONS, EXPENDITURES AND INVESTMENTS
4.01 ANNUAL TAX LEVY REQUEST AND REPORT (MUNICIPAL COMPLIANCE REPORT) The Board shall annually review an actuarial valuation prepared by an enrolled actuary (as defined by 40 ILCS 5/4-118(e)) to determine the annual actuarial requirements of the Fund and the recommended contribution to be made by the City. The Board shall make a request in writing to the City for the annual employer contribution prior to the City Council meeting held for appropriating and levying taxes for the year which the report is made. The Board shall report to the City Council of the City of Wilmette on the condition of the pension fund as requested by the City, or as required by statute. The Board shall provide this report in writing prior to City Council meeting held for appropriating and levying taxes for the year which the report is made. In the report the Board shall certify and provide the following information: The total assets of the Fund and their current market value; The estimated receipts during the next succeeding fiscal year from deductions from the salaries or wages of
firefighters, and from all other sources; The total net income estimated received from investment of assets compared to such income received during the
preceding fiscal year; The estimated amount necessary during the fiscal year to meet the annual actuarial requirements of the Fund as
provided in Sections 4-118 and 4-120 of the Illinois Pension Code (40 ILCS 5/4-118 and 4-120); The increase in employer pension contributions that result from the implementation of the provisions of P.A. 93-689
(effective July 1, 2004); The total number of active employees who are financially contributing to the Fund; The total amount that was disbursed in benefits during the fiscal year, including the number of and total amount
disbursed to (i) annuitants in receipt of a regular retirement pension, (ii) recipients being paid a disability pension, and (iii) survivors and children in receipt of benefits;
The funded ratio of the Fund; The unfunded liability carried by the Fund, along with an actuarial explanation of the unfunded liability; and The investment policy of the Board. LEGAL REF.: 40 ILCS 5/4-118 and 4-120 RELATED FORMS: Annual Tax Levy Report (Municipal Compliance Report) ADOPTED: October 22, 2020

Ottosen DiNolfo Hasenbalg & Castaldo, Ltd. © 2020
WILMETTE FIREFIGHTERS’ PENSION FUND – BOARD OF TRUSTEES 4.02
Page 1 of 1
CHAPTER FOUR – CONTRIBUTIONS, EXPENDITURES AND INVESTMENTS
4.02 ANNUAL STATEMENT AND AUDIT OF THE FUND The Board shall file electronically an Annual Statement with the Public Pension Division of the Illinois Department of Insurance within six (6) months of the close of the Fund’s fiscal year. The Board hereby recognizes the City’s obligation under the Governmental Account Audit Act to have the assets of the Fund and their current market value, as well as all financial transactions, verified by an independent certified public accountant each year. The Board shall obtain a copy of the accountant’s report as soon as is reasonably possible at the end of each fiscal year, for use in making its annual tax levy report to the City. The Board reserves the right to have an independent audit prepared of the Fund by a certified public accountant independent of or in lieu of the City’s audit of the Fund. The Board shall file with the Public Pension Division of the Illinois Department of Insurance a copy of the audit of the Fund within six (6) months after close of the fiscal year-end of the Fund. LEGAL REF.: 40 ILCS 5/1A-104, 1A-109, 4-118 and 4-134; 40 ILCS 310/0.01 et seq.; 50 Ill. Admin. Code
§4405.10 et seq. RELATED FORMS: Illinois Department of Insurance Annual Statement (online)
Annual Tax Levy Report (Municipal Compliance Report) ADOPTED: October 22, 2020

Ottosen DiNolfo Hasenbalg & Castaldo, Ltd. © 2020
WILMETTE FIREFIGHTERS’ PENSION FUND – BOARD OF TRUSTEES 4.03
Page 1 of 1
CHAPTER FOUR – CONTRIBUTIONS, EXPENDITURES AND INVESTMENTS 4.03 DELINQUENT EMPLOYER CONTRIBUTIONS AND INTERCEPT HEARINGS
A. Generally
Whenever the City fails to transmit to the Fund the contributions required under Section 4-118 of the Illinois Pension Code (40 ILCS 5/4-118) for more than 90 days after payment of the contributions is due, the Fund may certify to the State Comptroller the amounts of the delinquent contributions, and the Comptroller shall deduct and remit to the Fund the certified amounts, or a portion of those amounts, from grants of State funds to the City.
B. Notice to City
The Fund shall provide the City with written notice and an opportunity to be heard before the Board with respect to any delinquent employer contributions prior to certification to the Comptroller. The notice shall include the amount of contributions believed to be delinquent, beginning with fiscal year 2016. The notice shall state that unless the City requests a hearing within 21 days from the date that the notice was served upon the City, the Fund will certify the amounts due to the Comptroller. The notice to the City shall be mailed to the City’s Treasurer by certified mail or served upon the City Treasurer by personal service.
C. Hearing and Determination by the Board
If the City requests a hearing, it shall commence within 30 days from the date of the City’s request. The hearing shall be limited to evidence concerning the amount due the Fund. The burden of going forward, as well as the burden of proof, shall rest with the City. The technical rules of evidence shall not apply to hearings conducted hereunder. Continuances may be requested; however, the granting or refusal to grant a continuance is within the discretion of the Board. At the conclusion of the hearing, the Board shall make a final determination as to the amount, if any, to be certified to the State Comptroller as delinquent, and prepare a statement of notification, in accordance with the State Comptroller’s rules, which shall be certified by the Board President.
LEGAL REF.: 40 ILCS 5/4-118; 74 Ill. Adm. Code §295.100 et seq. RELATED FORMS: State Comptroller Intercept Forms ADOPTED: October 22, 2020

Ottosen DiNolfo Hasenbalg & Castaldo, Ltd. © 2020
WILMETTE FIREFIGHTERS’ PENSION FUND – BOARD OF TRUSTEES 4.04
Page 1 of 1
CHAPTER FOUR – CONTRIBUTIONS, EXPENDITURES AND INVESTMENTS 4.04 BENEFITS AND EXPENDITURES The Treasurer or designee shall provide the Board with a detailed financial statements and expenditure analysis prior to Board meetings. The Treasurer or designee shall provide a warrant setting forth the payments to be made from the Fund. The Board shall review this analysis to determine if expenditures have been made in accordance with the Illinois Pension Code. The warrant shall be signed by the President and Secretary of the Board upon approval by the Board. All disbursements by check shall require two (2) signatures, one of which shall be the Board’s Treasurer, if available. Only individuals who have been delegated signatory authority by the Treasurer in writing may sign disbursement checks on behalf of the Fund. The President shall review any expenditures between meetings. If it is determined a debt needs immediate payment and that the debt is a reasonable and customary expense, the President shall direct the debt be paid. At the next meeting, the debt shall be discussed and voted on by the Board. All benefit calculations shall be made by the Treasurer or designee and verified prior to presentation to the Board for approval. In preparing and reviewing benefit calculations, the Treasurer or designee shall review and confirm all applicable data for the benefit calculation based on the applicable provisions of the Illinois Pension Code and the Illinois Administrative Code, and from following original source documents:
Payroll records Components of pensionable salary Contributions made on pensionable salary by the member Labor contracts Municipal salary appropriation ordinance
All benefit calculations and supporting documentation shall be examined by the Board at a Board meeting to verify and confirm benefit amounts for accuracy prior to approval. The Board shall also periodically review the benefit status of all pensioners and beneficiaries (i.e. eligibility requirements, automatic increases or decreases), and the current medical status of disabled members in accordance with the Illinois Pension Code. Benefit checks shall be mailed directly to the recipient, as opposed to a third party, or deposited in a direct deposit account as directed by the member. Any benefit to be received by or paid to a dependent beneficiary may be received by or paid to a trust established for such dependent beneficiary if the dependent beneficiary is living at the time such benefit would be received by or paid to such trust. Except for child support and federal tax liens, no portion of the pension fund either before or after the Board’s order of distribution to any retired firefighter or beneficiary, shall be held, seized, taken subject to, or detained or levied on by virtue of any process, injunctions interlocutory or other order of judgment, or any process or proceeding whatever issued by any court of this State, for the payment or satisfaction in whole or in part of any debt, damages, claim, demand or judgment against any firefighter or beneficiaries, but the Fund shall be secured and distributed for the purposes of pension such firefighter and beneficiaries and for no other purposes whatsoever. LEGAL REF.: 40 ILCS 5/4-115.2, 4-124, 4-130, 4-131, 4-132, and 4-135; 50 Ill. Admin. Code §4402.10 et seq. RELATED FORMS: Warrant Approval Signature Page Delegation of Signatory Authority by Treasurer ADOPTED: October 22, 2020

Ottosen DiNolfo Hasenbalg & Castaldo, Ltd. © 2020
WILMETTE FIREFIGHTERS’ PENSION FUND – BOARD OF TRUSTEES 4.05
Page 1 of 1
CHAPTER FOUR – CONTRIBUTIONS, EXPENDITURES AND INVESTMENTS 4.05 INVESTMENTS The Board shall adopt an investment policy consistent with the requirements of the Illinois Pension Code, including the Illinois Sustainable Investment Act. The policy shall be reviewed periodically by the Board. The Treasurer or designee shall be responsible for implementation of the investment policy and for filing a copy of the policy with the Illinois Department of Insurance within thirty (30) days after its adoption or amendment. The Board shall review and approve the Fund’s investment activity. The Board shall authorize the purchase, transfer or sale of any investment instrument or security owned by the Fund. All investment decisions shall be reviewed and approved by the Board. The Board recognizes that that material, relevant, and decision-useful sustainability factors have been or are regularly considered by the Board, within the bounds of financial and fiduciary prudence, in evaluating investment decisions. Such factors include, but are not limited to: (1) corporate governance and leadership factors; (2) environmental factors; (3) social capital factors; (4) human capital factors; and (5) business model and innovation factors, as provided under the Illinois Sustainable Investing Act. The Board shall make available for inspection by the public information concerning the investment of its funds and update the information at least quarterly. The President may appoint an investment committee consisting of three members of the Board. The committee shall comply with the Open Meetings Act. The committee shall review the investments of the Board and make written findings and recommendations to the Board for approval. LEGAL REF.: 5 ILCS 120/1 et seq.; 40 ILCS 5/1-113.1, 1-113.2, 1-113.3, 1-113.4, 1-113.4a, 1-113.6, 1-113.16,
and 1-113.17 RELATED DOCUMENT: Investment Policy of the Board ADOPTED: October 22, 2020

Ottosen DiNolfo Hasenbalg & Castaldo, Ltd. © 2020
WILMETTE FIREFIGHTERS’ PENSION FUND – BOARD OF TRUSTEES 4.06
Page 1 of 2
CHAPTER FOUR – CONTRIBUTIONS, EXPENDITURES AND INVESTMENTS 4.06 INVESTMENT ADVISORS/CONSULTANTS
A. Appointment of Advisors and/or Consultants
The Board may appoint one or more investment advisors and/or consultants to assist the Board in investing the assets of the Fund. Such appointments shall be made pursuant to a written contract between the investment advisor/consultant and the Board and shall comply with the Board’s investment policy and the requirements of Section 1-113.5(b) of the Illinois Pension Code. All investment advisors and/or consultants appointed by the Board shall acknowledge in writing that they are fiduciaries with respect to the Fund. (40 ILCS 5/1-113.5(b)) No contact for investment services shall be awarded by the Fund unless the investment advisor or consultant first discloses:
The number of its investment and senior staff and the percentage of its investment and senior staff who are a minority person, a woman, and a person with a disability.
The number of contracts, oral or written, for investment services, consulting services, and
professional and artistic services that the investment advisor or consultant has with a minority-owned business, a women-owned business, or a business owned by a person with a disability.
The number of contracts, oral or written, for investment services, consulting services, and
professional or artistic services the investment advisor or consultant has with a business other than a minority-owned business, a women-owned business, or a business owned by a person with a disability, if more than 50% of services performed pursuant to that contract are performed by a minority person, a woman, and a person with a disability. (40 ILCS 5/1-113.21)
These disclosures shall be considered, within the bounds of financial and fiduciary prudence, prior to the awarding of a contract, oral or written, for consulting services. The terms “minority person,” “female,” “person with a disability,” “minority owned business,” “female owned business,” and “business owned by a person with a disability” have the same meaning as those terms have in the Business Enterprise for Minorities, Females, and Persons with Disabilities Act (30 ILCS 575/2). (40 ILCS 5/1-113.22)
B. Investing with Investment Advisors/Consultants
No Board member or other fiduciary of the Fund shall knowingly cause or advise the Fund to engage in an investment transaction with an investment advisor when the Board member or other fiduciary (i) has any direct interest in the income, gains, or profits of the investment advisor through which the investment transaction is made or (ii) has a business relationship with that investment advisor would result in a pecuniary benefit to the Board member or other fiduciary as a result of the investment transaction. (40 ILCS 4/1-110(d))
C. Five-Year Limitation on Consultants’ Agreements
All contracts to provide consulting services to the Fund with respect to the selection of fiduciaries shall be limited in term to a maximum of five (5) years. No contract to provide consulting services to the Fund may be renewed or extended. At the end of the term of a consulting services contract, however, the contractor is eligible to compete for a new contract. (40 ILCS 5/1-113.5(a-5))

Ottosen DiNolfo Hasenbalg & Castaldo, Ltd. © 2020
WILMETTE FIREFIGHTERS’ PENSION FUND – BOARD OF TRUSTEES 4.06
Page 2 of 2
CHAPTER FOUR – CONTRIBUTIONS, EXPENDITURES AND INVESTMENTS
4.06 INVESTMENT ADVISORS/CONSULTANTS (CONT.) D. Required Disclosures from Consultants
No later than January 1st of each year, any investment consultant retained by the Board shall disclose to the Board:
1. the total number of searches for investment services made by the consultant in the prior calendar
year; 2. the total number of searches for investment services made by the consultant in the prior calendar
year that included (i) a minority owned business, (ii) a female owned business, or (iii) a business owned by a person with a disability;
3. the total number of searches for investment services made by the consultant in the prior calendar year in which the consultant recommended for selection (i) a minority owned business, (ii) a female owned business, or (iii) a business owned by a person with a disability;
4. the total number of searches for investment services made by the consultant in the prior calendar year that resulted in the selection of (i) a minority owned business, (ii) a female owned business, or (iii) a business owned by a person with a disability; and
5. the total dollar amount of investment made in the previous calendar year with (i) a minority owned business, (ii) a female owned business, or (iii) a business owned by a person with a disability that was selected after a search for investment services performed by the consultant.
These disclosures shall be considered, within the bounds of financial and fiduciary prudence, prior to the awarding of a contract, oral or written, for consulting services. The terms “minority person,” “female,” “person with a disability,” “minority owned business,” “female owned business,” and “business owned by a person with a disability” have the same meaning as those terms have in the Business Enterprise for Minorities, Females, and Persons with Disabilities Act (30 ILCS 575/2). (40 ILCS 5/1-113.22) No later than January 1st of each year, any investment consultant retained by the Board shall disclose to the Board all compensation and economic opportunity received in the last 24 months from investment advisors retained by the Board. (40 ILCS 5/1-113.23)
LEGAL REF.: 30 ILCS 575/2; 40 ILCS 5/1-110(d), 1-113.5, 1-113.21, 1-113.22, and 1-113.23 ADOPTED: October 22, 2020

Ottosen DiNolfo Hasenbalg & Castaldo, Ltd. © 2020
WILMETTE FIREFIGHTERS’ PENSION FUND – BOARD OF TRUSTEES 4.07
Page 1 of 1
CHAPTER FOUR – CONTRIBUTIONS, EXPENDITURES AND INVESTMENTS 4.07 SERVICER CERTIFICATION All Illinois finance entities (as defined by Section 1-110.10 of the Illinois Pension Code) with which the Fund invests or deposits Fund assets must certify they comply with the requirements of the High-Risk Home Loan Act and the applicable rules adopted pursuant to that Act, prior to the investment or deposit of Fund assets. The Fund shall annually submit the certifications of each Illinois finance entity with which the Fund invests or deposits fund assets to the Illinois Department of Insurance no later than February 28th. LEGAL REF.: 40 ILCS 5/1-110.10 RELATED FORM: Illinois DOI Servicer Certification Form ADOPTED: October 22, 2020

Ottosen DiNolfo Hasenbalg & Castaldo, Ltd. © 2020
WILMETTE FIREFIGHTERS’ PENSION FUND – BOARD OF TRUSTEES 4.08
Page 1 of 1
CHAPTER FOUR – CONTRIBUTIONS, EXPENDITURES AND INVESTMENTS 4.08 TRAVEL EXPENSES The Board shall regulate the reimbursement of all travel, meal, and lodging expenses of its Board members, including, but not limited to:
The types of official business for which travel, meal, and lodging expenses are allowed; and The maximum allowable reimbursement for such expenses.
All requests for the payment of such expenses shall be made using a standardized form and shall be supported, at a minimum, by the following documentation:
The name of the individual who received or is requesting the travel, meal, or lodging expense; The title or office of the individual who received or is requesting the travel, meal or lodging expense; The date or dates and the nature of the official business in which the travel, meal, or lodging expense was or will be
incurred; and An estimate of the cost of the travel, meal, or lodging expenses if the expenses have not been incurred or a receipt(s)
for such expenses if the expenses have already been incurred.
All travel, meal and lodging expenses shall be approved by a roll call vote at an open meeting of the Board. No Board member may be reimbursed for any entertainment expense, including but not limited to, shows, amusements, theaters, circuses, sporting events, or any other place of public or private entertainment or amusement, unless ancillary to the purpose of the program or event. LEGAL REF.: 40 ILCS 5/4-127; 50 ILCS 150/1 et seq. RELATED FORM: Application for Travel Expense/Reimbursement ADOPTED: October 22, 2020

Illinois Association of Fire Protection Districts IAFPD Fire Call Magazine – Pension Trustee Column – Fall 2020
Frequently Asked Questions About Employer Intervention in Disability Matters
by John E. Motylinski
Ottosen DiNolfo Hasenbalg & Castaldo, Ltd.
Municipalities and fire protection districts seeking to intervene in disability proceedings has become commonplace. Spurred in part by Illinois Supreme Court rulings, employers seek to defend their interests in workers’ compensation and Public Safety Employee Benefits Act (PSEBA) claims by intervening in the related disability matter. Yet, the law governing intervention has been slow to catch up, leading to conflicts. Below are answers to frequently asked questions about intervention by a city, village or fire protection district in a disability proceeding before a pension fund. Q: Does a municipality have an absolute right to intervene in a disability hearing? No. Municipalities do not have an absolute right to intervene in a disability pension hearing. (Village of Stickney v. Board of Trustees of the Police Pension Fund of the Village of Stickney, 347 Ill.App.3d 845 (1st Dist. 2004)) A pension board, however, has the discretion to allow such intervention, provided that its decision is not arbitrary or capricious. This discretion stems from the Board’s fiduciary duty owed its participants and beneficiaries to properly screen disability claims (40 ILCS 5/1-109). Q: Can a municipality intervene in any disability hearing? No. Municipalities can only intervene when their interests are impacted. These interests may include a generalized desire to ensure that pension funds are properly expended, the potential award of health benefits under PSEBA, possible impact on pending workers’ compensation cases, and in some cases, the development of a full evidentiary record. Q: What has been the main reason municipalities seek to intervene in disability matters? PSEBA is one of the main reasons why municipalities intervene in disability matters. When a public safety employee suffers a “catastrophic injury” in emergency situations, PSEBA requires the employer to pay “the entire premium of the employer’s health insurance plan for the injured employee, the injured employee’s spouse, and for each dependent child of the injured employee until the child reaches the age of majority.” (820 ILCS 320/10) These costs can be significant. A “catastrophic injury” under PSEBA is synonymous with an injury giving rise to a line-of-duty disability pension. (Krohe v. City of Bloomington, 204 Ill. 2d 392, 400 (2003)). Illinois courts have further held that, if a municipality wishes to contest whether the applicant

has experienced a “catastrophic injury,” it must do so before the pension fund during the disability proceedings. (Village of Vernon Hills v. Heelan, 2015 IL 118170). That means that, if a municipality does not intervene in the pension board proceeding, it will never have another chance to dispute whether the applicant suffered a catastrophic injury. Thus, municipalities often seek to intervene to make sure they can “have their say” on whether an applicant has suffered a line-of-duty—or “catastrophic”—injury. Furthermore, some municipalities use the petition to intervene as leverage to obtain a concession from the employee to “waive” any entitlement to PSEBA benefits. In these instances, the municipality will agree to withdraw its petition to intervene if the employee agrees to waive PSEBA benefits. Q: How can a pension fund’s decision on a disability application impact a workers’ compensation case? Both workers’ compensation cases and pension fund disability proceedings seek to answer essentially the same question: whether the employee’s injury was work-related. If one administrative agency resolves that issue before the other, the outcome is sometimes imputed to the remaining proceeding. In legalese, this concept is called “collateral estoppel.” For collateral estoppel to apply: (1) the issue decided in the prior adjudication must be identical with the one presented in another matter; (2) there was a final judgment on the merits in the prior adjudication; and (3) the party against whom estoppel is asserted was a party or in privity with a party to the prior adjudication. (See, e.g., Village of Alsip v. Portincaso and Board of Trustees of the Alsip Police Pension Fund, 2017 IL App (1st) 153167). Applied in this context, collateral estoppel can mean that, if a pension fund finds a line-of-duty injury, the workers’ compensation adjudicators potentially cannot later arrive to the opposite conclusion. Similarly, if an employee’s injury is finally decreed to be non-compensable under workers’ compensation, the pension board might not be able to find there was a line-of-duty injury. (See, e.g., id.). Since one employee injury proceeding could impact the other, municipalities sometimes feel obligated to intervene in disability pension matters. Q: Under what circumstances can a municipality’s interest in ensuring a fully developed record sustain intervention? Municipalities also cite “ensuring a fully developed factual record” as an interest that may sustain intervention. (See, Portincaso, supra (municipality had interest in supplementing the pension board’s record with a freshly decided workers’ compensation decision)). However, recent caselaw suggests that a municipality cannot make a mere promise to help augment the record. Instead, the municipality must have evidence the pension board does not have. (See, e.g., Stickney, 347 Ill. App. 3d at 852 (denial of intervention request was proper, in part, because municipality failed to make an offer of proof of new evidence); City of Peoria v. Firefighters' Pension Fund of City of Peoria, 2019 IL App (3d) 190069, ¶ 29 (same)).

Q: Can a pension board impose reasonable restrictions on intervention? Yes. Even if a pension board allows intervention, it may impose reasonable restrictions on the extent of the intervenor’s participation. (Stickney, 347 Ill. App. 3d at 852; see also City of Peoria, 2019 IL App (3d) 190069, at ¶ 31; Portincaso, 2017 IL App (1st) 153167, at ¶ 16). However, a pension board must exercise its discretion to limit participation with care. (Portincaso, 2017 IL App (1st) 153167, at ¶ 16). Whether a restriction on intervention is reasonable usually depends on the needs of the matter. For instance, if a municipality offer 20 witnesses to testify in a “simple” disability matter, then the pension board would be within its rights to limit the municipality to 3 witnesses. Similarly, if the municipality’s cross-examination of a witness becomes excessive, the pension board could properly impose a time limit. Q: What happens if a court determines the pension board abused its discretion in allowing or denying a petition on intervention? Pension boards should take care in deciding intervention issues, as arriving at the wrong answer may result in a costly “do over.” If a reviewing court determines that there was a defect in the disability hearing (e.g., a municipality was allowed intervention when it should not have been or, conversely, the municipality was denied intervention but should not have been), the matter could be remanded back to the board for a new hearing to allow the municipality to participate.
Conclusion Intervention in disability pension matters are complex. To make matters worse, Illinois courts have not fully developed this area of law. Therefore, pension boards should partner with counsel in tackling intervention issues.


© 2020 REIMER & DOBROVOLNY PC
1
Volume 18, Issue 3, July 2020
Legal and Legislative UpdateAmendments to the Open Meetings
Act Allowing for Remote Attendance
P.A. 101-640
Due to the ongoing Coronavirus pandemic, the lastseveral months have seen a series of adjustments tothe Open Meetings Act. These modificationsbegan with Governor Pritzker issuing successiveExecutive Orders and cumulated with a permanentamendment to the Open Meetings Act effectiveJune 12, 2020.
Under the Act as amended, a public body may holdmeetings via phone, video, or other electronicattendance without the physical presence of aquorum under the following conditions:
1) The Governor or Illinois Department ofPublic Health has issued a disasterdeclaration covering all or part of thejurisdiction of the public body.
2) The head of the public body determines anin-person meeting is not practical orprudent because of a disaster.
3) All members of the public bodyparticipating in the meeting must verifythey can hear one another and all discussionor testimony.
4) Members of the public present at the regularmeeting location can hear all discussion ortestimony and all votes taken unless
attendance at the regular meeting location isnot feasible due to the disaster. If in-personattendance by the public is not feasible, thepublic body must provide alternative meansfor the public to hear the meeting such asusing a telephone or web-based link.
5) At least one member of the public body,chief legal counsel, or chief administrativeofficer is physically present at the regularmeeting location, unless not feasiblebecause of the disaster.
6) All votes must be conducted by roll call ofeach member.
7) Notice must continue to be posted at least48 hours’ in advance of the meeting.
8) The public body must keep a verbatimrecord in the form of an audio or videorecording of meetings held in this manner.
I N T H I S I S S U E
1 Amendments to the Open Meetings Act Allowing forRemote Attendance
2Appellate Court Signals Departure of Sole CausationTheory for Mental Disability Claims of Police Officers
42016 Legislation Conflicting with the Pension ProtectionClause Held Unconstitutional
5Pension Protection Clause Protects Beneficiary from LaterCode Changes
6Supreme Court Finds CPD Police Records Must BeMaintained Despite CBA Provision for Destruction
8 Reimer & Dobrovolny PC News

© 2020 REIMER & DOBROVOLNY PC
2
On June 26, 2020, the Governor issued his mostrecent disaster declaration. Most significantly, thedisaster declaration finds, “in person attendance ofmore than fifty people at the regular meetinglocation not feasible.” In conjunction with theupdated disaster declaration, Executive Order2020-43 finds, “Indoor venues and meeting spacescan operate with the lesser of fifty attendees or fiftypercent of room capacity.” However, it is unclearwhether the fifty percent requirement applies topublic bodies inasmuch as the order also exemptsmost local governmental bodies. Finally,Executive Order 2020-44 suggests public bodies,“are encouraged to ensure that at least one memberis physically present at the location of the meetingif others are attending telephonically orelectronically.” Public bodies exercising atelephonic or electronic attendance option mustprovide notice and allow members of the public tomonitor the meeting. The updated disasterdeclaration and Executive Orders expire on July26, 2020.
What does this mean for upcoming third quarterpension board meetings or hearings? Boardscontinue to have the option of phone/videoconference meetings in lieu of an in-personmeeting. Pension boards wishing to have in-personmeetings must ensure less than fifty people will bepresent. The Governor’s orders continue to requireface coverings and 6 foot distancing in publicplaces.
Pension boards wishing to hold remote attendancemeetings may continue to hold meetings viaphone/video conference. In order to do so, anagenda/notice must be posted announcing themeeting will be held remotely and giving the publicremote attendance options. The pension boardpresident must make a finding an in-personmeeting is not practical or prudent due to thepandemic. At least one member of the pensionboard must be present at the regular meetinglocation unless not feasible.
We will continue to issue updates as developmentswarrant. Gubernatorial disaster declarations andexecutive orders are valid for 30 days. As a result,the Governor has been issuing them in 30 days
successive increments. As such, I would expect anew declaration/executive order to be issued at theend of July. Stay tuned for further developments.
Appellate Court Signals Departureof Sole Causation Theory
for Mental Disability Claims ofPolice Officers
Nelson v. Retirement Bd. of the Policemen’sAnnuity and Benefit Fund of Chicago, 2020 IL App(1st) 192032-U
The First District Appellate Court reversed thedecision of the pension board (“Board”) and circuitcourt granting an ordinary disability benefit whereofficer-plaintiff developed PTSD following herresponse to an armed robbery call. The AppellateCourt ordered plaintiff be awarded a line-of-dutydisability benefit.
By way of background, plaintiff applied for a line-of-duty disability benefit after she was no longerable to work following an incident where sheresponded to an armed robbery. On December 8,2016, plaintiff was assigned to a patrol car andresponded to a “possible kidnapping of a FedExdriver.” Eventually, the call was amended to an“armed robbery” of a FedEx driver. Plaintiff wasnearby and responded to the call. After locating theFedEx truck, plaintiff called dispatch three to fourtimes; however, her dispatcher never responded.Plaintiff testified, “I just didn’t know what wasgoing on” and said she “felt abandoned during aheightened sense of danger.”
Plaintiff returned to work the following day, and,as she passed the area of the robbery on patrol, she“experienced nausea” and “tightness in [her]chest.” Subsequently, she was taken to the hospitaland never returned to full duty.
Plaintiff underwent a course of therapy followingthe incident and was prescribed Lexapro (anantidepressant) daily. Plaintiff applied for a dutydisability based upon her inability to return to full,unrestricted duty.

© 2020 REIMER & DOBROVOLNY PC
3
Following her application, plaintiff was evaluatedby a plethora of physicians. The recorddemonstrates plaintiff had long standingpsychological issues. After a hearing before theboard, she was awarded an ordinary disability, nota duty disability. In its written decisionn the boardnoted, “[A]t no point in time ever came upon thealleged offender. Rather, the only individual [she]had [an] interaction with during the incident wasthe FedEx employee. As such, [plaintiff] was not,as she claims, in any real or reasonably perceiveddanger during the incident, and therefore was notinvolved in any act of police duty inherentlyinvolving special risk.”
Because of [plaintiff’s] repeated issues withcoworkers, the board finally concluded that her“disabling condition is not the result of anidentifiable act of duty incident” but rather: “is aresult of her perceived unconfirmed mishandlingby the [Department] of the events surrounding theDecember 8, 2016, incident, which was furtherexasperated by her longstanding and documentedhistory of issues with emotional and psychologicaldistress associated with her perception andconjecture of how she was being treated andviewed by others within the [Department].”
With respect to her award of an ordinary disabilitybenefit, rather than a duty disability benefit, theboard specifically stated: “[Plaintiff’s] medicalcondition is disabling which entitles her to adisability benefit. The board further finds that[Plaintiff], by her self-serving testimony, has notmet her burden of proving her disability is the resultof an identifiable act of duty incident, but rather isthe result of a long-standing and continuing issueconcerning her perception of the [Department]’sfailure to respond in a manner she feels isappropriate and how others within the[Department] view her. [Plaintiff’s] application fora duty disability benefit is therefore denied, and[Plaintiff] is granted an ordinary disabilitybenefit[.]”
Plaintiff filed a complaint for administrative reviewof the Board’s decision in the circuit court and, onJuly 15, 2019, the circuit court affirmed the Board’sdecision. Plaintiff filed a motion to reconsider the
Court’s ruling, arguing, for the first time, theadministrative record was incomplete because itdid not include an arbitration award from April 30,2018. The arbitration was filed by the FraternalOrder of Police on behalf of Plaintiff.
The filing asserted Plaintiff should be granted an“injury on duty” disability, which the ChicagoCommittee on Finance originally denied her. Thearbitrator found Plaintiff’s “injury arose out of heremployment as a police officer” and ordered theDepartment to certify [her] injury as an ‘injury onduty’” for the purpose of granting her disabilityincome. The Circuit Court denied the motion toreconsider on September 11, 2019.
On Appeal, Plaintiff argued (1) the Board wasbound by the arbitration award, and (2) the Boarderred in only awarding an ordinary disabilitybenefit.
The Court concluded the Board is not bound by thearbitration award. Without addressing the merits ofthis claim, the Court held the argument was neverraised before the Board, accordingly, it will not beconsidered for the first time on administrativereview. Further, the issue was raised for the firsttime in a motion for reconsideration. As such,Plaintiff forfeited any collateral estoppel argument.
Turning to the merits of the disability claim, theCourt held Plaintiff’s injury was in the performanceof an act of duty. Moreover, the mere fact Plaintiffmay have been particularly susceptible to PTSD“does not change the fact that the cause of hercondition was the events of December 8, 2016.”An entitlement to a duty disability turns on“whether the officer’s injury leading to a disabilityoccurred during an “act of duty” as defined undersection 5-113 of the Pension Code.” Plaintiff’sdisability was linked to an identifiable incident thata civilian would not experience, namely,responding to a report of an armed robbery.
Pension boards should take note of a possible shiftin how courts are evaluating mental disabilityclaims for police officers. The First District seemsto be signaling a departure from the recentPrawdzik decision. There, the Third District

© 2020 REIMER & DOBROVOLNY PC
4
Appellate Court held a police officer’s disabilitymust “entirely” come from a specific, identifiableact of duty. Here, the Court appears to suggest the“act of duty” need not be the sole or exclusivecause, even in mental disability matters for policeofficers.
2016 Legislation Conflicting withthe Pension Protection Clause Held
Unconstitutional
2020 IL 125330
In Williamson County Board of Commissioners v.Board of Trustees of the IMRF, the IllinoisSupreme Court held amendments in 2016 to theIllinois Pension Code (section 40 ILCS 5/7-137.2(a)), unconstitutional under the IllinoisConstitution’s pension protection clause articleXIII, section 5, of the Illinois Constitution (Ill.Const. 1970, art. XIII, § 5).
The Pension Code initially allowed elected countyboard members to take part in the IllinoisMunicipal Retirement Fund (IMRF) if theparticipant occupied a position requiring 1000hours of service annually, and the public employeefiled an election to participate. The 1968administrative rule necessitated the governing bodyof a participating employer to adopt a resolutioncertifying the position of elected governing bodymembers required the hourly standard. WilliamsonCounty and the board members complied with the1968 rule. The board members satisfied theoriginal requirements for IMRF participation,electing to participate in 2004, 2008, and 2012.
In 2016, Public Act 99-900, amended parts of thePension Code (40 ILCS 5/7-137.2(a)), requiring,for the first time, all county boards certify within90 days of each general election their boardmembers had to work sufficient hours to meet thehourly standard for participation and that memberswho take part in IMRF submit monthly timesheets.IMRF issued “Special Memorandum #334” to theauthorized agent in every county, explaining thechange: “If the County Board fails to adopt therequired IMRF participation resolution within 90
days after an election, the entire Board will becomeineligible and IMRF participation will end forthose Board members.” (emphasis added). TheFund also sent a direct mailing to individual countyboard members participating in IMRF.Subsequently, one of the board members were re-elected, triggering the new requirement in §7-137.2(a) to adopt a resolution with the newprovisions in the statute. However, the WilliamsonCounty Board did not timely adopt the requiredresolution.
Even though the County Board adopted theresolution seventeen (17) days late, IMRF notifiedthe plaintiffs they were not eligible for continuedIMRF participation. The board members appealedto IMRF, and at the hearing, they argued Public Act99-900 was unconstitutional under the pensionprotection clause. IMRF issued a decision andorder terminating the board members' benefits butfailing to address the constitutional argument. In2019, board members again made this argument atAdministrative Review, and the circuit court issueda judgment in favor of the board members holdingPublic Act 99-900 unconstitutional, directingIMRF to reinstate the board members with “fullrights, membership, and participation.”
IMRF appealed directly to the Illinois SupremeCourt according to Rule 302 (a), and the sole issuebefore the Court was whether §7-137.2(a) of thePension Code violates the pension protectionclause. The Court cited the well-developed caselaw regarding the pension protection clauseholding, “the original requirements for the [boardmember’s] IMRF participation cannot be changedunilaterally by the legislature.” The Courtemphasized the “newly created requirement in thePension Code [§7-137.2(a)] did not exist when [theboard members] began their employment andparticipation in IMRF. Thus, it cannot beconstitutionally applied to [these board members].”
Since a public employee’s membership in apension system is an enforceable contractualrelationship, the Court protected continued IMRFparticipation from unilateral legislativediminishment or impairment when the boardmembers became IMRF participants and accrued

© 2020 REIMER & DOBROVOLNY PC
5
the service credits. Ultimately, the Illinois SupremeCourt affirmed the circuit court’s judgment andfound §7-137.2 of the Pension Code invalid underthe pension protection clause.
Pension Protection Clause ProtectsBeneficiary from Later Code
Changes
Piccioli v. Board of Trustees of Teachers’Retirement System, 2019 IL 122905 (2019)
In Piccioli, the Illinois Supreme Court reviewed theconstitutionality of a 2007 statutory amendmentthat permitted teacher union employees, whobecame certified teachers prior to the enactment ofthe statute, to establish credible service in theTeachers Retirement System (“TRS”) by applyingin writing to the TRS within 6 months of theeffective date and paying into the system both theemployee and employer contributions plus interestfor prior union service.
Piccioli, a union lobbyist who obtained a substituteteaching certificate in 2007 and worked one day asa substitute teacher prior to the statute’s enactment,took advantage of the amendment’s benefits andpurchased ten (10) years of service credit.
In 2011, the Chicago Tribune published an articlenaming Piccioli and criticizing the amendment thatallowed him to become a member of the TRSeligible for a teacher’s pension. In response, thelegislature enacted a law in 2012 which repealedthe 2007 amendment, forced a refund of Piccioli’scontributions and eliminated his service credit.
Piccioli sought injunctive relief in circuit courtarguing the repeal of the 2007 amendment violatedthe pension protection clause. The circuit courtentered summary judgment for the defendant.Piccioli appealed directly to the Supreme Court.
At the Supreme Court, the Defendant argued the2007 amendment was special legislation expresslyprohibited by the State Constitution. TheConstitution’s special legislation clause preventsthe legislature from making classifications that
arbitrarily discriminate in favor of a select group.To determine whether a law constitutes speciallegislation, courts apply a two-part test. First,courts must decide whether the statutoryclassification discriminates in favor of a selectgroup and against a similarly situated group. Next,if the classification does discriminate, courts mustdecide whether the classification is arbitrary. Todetermine whether a classification is arbitrary,courts apply the rationale basis test. Under therational basis test, courts hypothesize reasons forthe legislation, even if the reasoning advanced wasnot contemplated by the legislature.
Here, the Court analyzed whether the statutoryclassification discriminated for or against a selectgroup and found the amendment discriminated infavor of employees who began working for thestatewide teacher’s union prior to the amendment.Next, the Court weighed whether the classificationwas arbitrary. The Defendant argued the cutoff datewas arbitrary, thus rendering the amendmentunconstitutional. The Court held the inclusion of acutoff date in a statute that confers governmentbenefits reliant on public funding is rational as stateand local governments operate with limitedresources and budgets and as such, limiting benefitsto a finite number of participants is both reasonableand necessary (i.e. Tier 1 v Tier 2). Further, theCourt found there is no constitutional requirementa government program must continue in perpetuity.As such, the Court found a rational basis for theamendment and determined it was not speciallegislation.
Next, the Defendant argued numerous unionemployees were unaware of the amendment. TheCourt held ignorance of the law had no bearing onwhether it was special legislation and the fact otherunion employees did not opt in does not render thestatutory benefit special legislation. Further, theCourt found the amendment applied generally to alleligible employees and not a specific individual.
Finding the 2007 amendment was not speciallegislation, the Court held the amendmentconferred a pension benefit protected by thePension Protection Clause. By following theamendment’s provisions, Piccioli established an

© 2020 REIMER & DOBROVOLNY PC
6
enforceable contractual relationship. While nothingprevented the legislature from eliminating thisbenefit for future employees, there was nojustification for reducing or eliminating the pensionbenefits Piccioli was awarded by the 2007amendment.
The takeaway: Once a person commences to workand becomes a member of a public retirementsystem, any subsequent changes to Pension Codethat would diminish the benefits conferred bymembership in the retirement system cannot beapplied to that person. Hence, once Tier 1, alwaysTier 1.
Supreme Court Finds CPD PoliceRecords Must Be Maintained
Despite CBA Provision forDestruction
City of Chicago v. Fraternal Order of Police,Chicago Lodge 7, 2020 IL 124831
This case presents the sole issue of whether aprovision in a collective bargaining agreement(“CBA”) requiring destruction of disciplinary filesafter five years violates public policy.
This case had a lengthy procedural history. SinceJanuary 1981, the City of Chicago (“City”) andFraternal Order of Police, Chicago Lodge 7(“FOP”) were parties to a CBA, including §8.4,mandating the destruction of disciplinaryinvestigation records, such as complaint registerfiles prepared by COPA and Chicago PoliceDepartment (“CPD”) Internal Affairs Divisioninvolving allegations of alleged misconduct bymembers of the CPD. The provisions of §8.4 haveremained substantially unchanged since the 1981CBA, despite numerous attempts by the City toeliminate or modify the provision. Section 8.4requires destruction of those records after “fiveyears from the date of incident or the date uponwhich the violation is discovered, whichever islonger.”In 2011 and 2012 FOP filed two grievances overthe City’s failure to destroy complaint register files
in extending beyond the five year period. InOctober 2014, the City notified FOP it intended tocomply with FOIA request from the ChicagoTribune and Chicago Sun Times for informationrelated to complaint register files dating back to1967. What followed was a lengthy history of courtchallenges and entry of a preliminary injunctionenjoining the City from releasing files more thanfour years old.
Enter the United States Department of Justice(“DOJ”), which opened a civil pattern and practiceinvestigation of the CPD focusing on allegations ofexcessive force and discriminatory policing. DOJsent the City a document preservation request,requesting the City and CPD preserve all existingdocuments “related to all complaints of misconductagainst CPD officers.” In January 2016, thearbitrator issued an interim award finding the Cityviolated §8.4 of the CBA and directed the parties toattempt to negotiate a procedure for compliance. InFebruary 2016, the DOJ sent letters to the Cityrequiring the City to preserve all documentsrelating to complaints of misconduct for theduration of the pattern and practice investigation.
What followed was a series of supplementalarbitration awards and court proceedings. InOctober 2017, the Circuit Court granted the City’sPetition to Vacate the Final Arbitration Award anddenied FOP’s counter petition to enforce the award,ruling enforcement of the arbitrator’s award“violated a well-defined and dominant publicpolicy to preserve government records.” The FOPappealed and the Appellate Court affirmed holdingthe Local Records Act, the State Records Act, andFOIA established the well-defined public policyrequiring retention of important public records foraccess to the public. FOP filed a Petition for Leaveto Appeal with the Illinois Supreme Court.
The majority of the Illinois Supreme Courtanalyzed this case under the “public policy”exception to arbitration awards under the IllinoisPublic Labor Relations Act. Under the publicpolicy exception, a Court may set aside anarbitration award if it is “repugnant to establishingnorms of public policy.” This exception is a narrowone and is invoked only when a party clearly shows

© 2020 REIMER & DOBROVOLNY PC
7
enforcement of the contract, as interpreted by anarbitrator, contravenes some explicit public policy.
The Court applied a two-step analysis. The firstinquiry is whether a well-defined and dominantpublic policy can be identified through a review ofthe Constitution, statutes and relevant judicialopinions. If the Court is satisfied as to the existenceof the well-defined and dominant public policy, theCourt must then determine whether the arbitrator’saward, as reflected in his interpretation of theagreement, violated public policy.
As the first step of the analysis, the Court reviewedthe provisions of the Local Records Act and theState Records Act. A review of the State RecordsCommission’s duties and responsibilities under theState Records Act persuaded the majority toconclude there is a “well-defined and dominantpublic policy rooted in state law concerning theprocedures for the “proper retention anddestruction of governmental records.” In thisanalysis, the majority apparently did not need toconsider the provisions of FOIA.
Having found a “well-defined and dominant publicpolicy,” the Court then turned to the question ofwhether the arbitrator’s award violated that publicpolicy by enforcing compliance with §8.4 of theCBA. The Court noted, as written §8.4 onlyrequires disciplinary documents will be destroyedafter a finite period of time. Section 8.4 does nottake into consideration “whether the records do nothave sufficient administrative, legal or physicalvalue to warrant their further preservation” asrequired under the Local Records Act. In addition,the Court found §8.4 of the CBA did not require theparties to be bound by the decision from the recordscommission. Moreover, §8.4 makes no reference toany of the mandatory review procedures as set forthin the Local Records Act.
Accordingly, the majority held as follows:
“The arbitrator erred in finding that §8.4 isconsistent with state law and not contrary to statepublic policy, thereby mandating the parties tocomply with the destruction of all discipline records
covered under this provision. Consequently, theaward is void and not enforceable.”
The Court held the arbitration award violated anexplicit well-defined and dominant public policyand affirmed the judgment of the Circuit Courtvacating that award, affirming the judgment of theAppellate Court.
Justice Kilbride authored a dissenting opinion.Justice Kilbride prefaced his dissent byrecognizing, “the issue of police misconduct is aserious issue that must be confronted by society.”Justice Kilbride seemed to weight the competingpublic policy of the State to enforce collectivebargaining agreements and labor arbitration awardsagainst the public policy relied upon by themajority. Justice Kilbride believes the two publicpolicies can “coexist harmoniously and that thisarbitrator’s decision may be construed so as not tocreate a conflict between those policies.”
Justice Kilbride believed the arbitrator’s awardsimply directed the parties to negotiate the methodand procedure for the possible future destruction ofeligible records in compliance with §8.4 of theCBA. Justice Kilbride pointed out that thearbitrator did not mandate destruction of allrecords. Justice Kilbride also placed emphasis onprovisions of §15 of the Illinois Public LaborRelations Act, establishing a public policysupporting collective bargaining and and theenforcement of labor arbitration awards.
Justice Kilbride concluded:
“Based upon the parties’ briefs and commentsduring oral argument, it is readily apparent that theparties are fully aware of the requirements of theLocal Records Act, other applicable statutes, andthe consent decree. Thus we can safely assumethat negotiations for the possible futuredestruction of any eligible discipline recordswould have been done in full compliance with theconsent decree and any other requirements by law.I believe the parties should be allowed to meet andnegotiate in accordance with the arbitrator’sdirective.”

© 2020 REIMER & DOBROVOLNY PC
8
REIMER & DOBROVOLNY PC NEWS
RD is pleased to announce it has been retained as general counsel for the Illinois Police Officers PensionInvestment Fund.Training Seminar Updates
IPFA will be offering a four hour training course on the changes implemented by P.A. 101-0610 viaremote attendance on July 2, 2020.
The IPPFA fall conference remains set for September 30-October 2 in Naperville. Both in-person andvirtual attendance will be offered. The seminar will include training required under P.A.101-0610.
Legal and Legislative Update
Volume 18, Issue 3, July 2020This publication constitutes advertising material. Information contained herein should not be considered legal advice.
Legal and Legislative Update is published periodically. Questions may be directed to:REIMER & DOBROVOLNY PC
A Public Safety Law Firm15 Spinning Wheel Road, Suite 310, Hinsdale, IL 60521
(630) 654-9547 Fax (630) 654-9676www.rdlaborlawpc.com
Unauthorized reproduction prohibited. All rights reserved.
Suggested Agenda Items for October (or 4th Quarter)
Adoption of recommended tax levy from actuarial valuation and forward request toMunicipality.
Adoption of municipal compliance report and forward to Municipality. Schedule next calendar year quarterly meeting dates/times. Deadline for filing independent audit report with DOI. Deadline for filing of DOI annual report. Begin RFP process on investment consultants, if necessary.

© 2020 REIMER DOBROVOLNY & LABARDI PC
1
Volume 18, Issue 4, October 2020
Legal and Legislative UpdateLine-of-Duty Disability Awarded
Despite Pre-Existing Mental HealthCondition
Village of Franklin Park v. Sardo, 2020 IL App(1st) 191161 (2020)
The Appellate Court in this matter determined apolice officer with a preexisting mental conditionis not disqualified from a line-of-duty pension. TheCourt further held that a preexisting physicaldisability and a preexisting mental condition aretreated alike and confirmed that an act of duty neednot be the sole cause of disability.
The facts underlying the case were not in dispute.Prior to becoming a Roselle police officer in 1996,Detective Christopher Sardo served in the UnitedStates Marine Corps from 1987 to 1991, includinga tour of duty in Desert Storm. During his tour ofduty, Sardo was exposed to several traumaticincidents including the deaths of fellow Marines.Post-discharge, Sardo was diagnosed with PTSDby the Department of Veteran Affairs and receiveda 90% disability rating, 70% of which was relatedto PTSD. Sardo received outpatient treatmentincluding counseling, anger management and
medication. During his course of treatment, Sardocontinued to work full time.
During his time as a police officer, Sardoexperienced numerous traumatic events includingdeaths of firefighters and police officers, none ofwhich rendered him unable to perform his job.Sardo was an exemplary employee with excellentperformance reviews including his last review onDecember 31, 2013.
I N T H I S I S S U E
1 Line-of-Duty Disability Awarded Despite Pre-Existing Mentalhealth Condition
2 Governor Extends Remote Attendance Options
3 Reimer Dobrovolny & LaBardi PC
4John Gaw Joins Reimer Dobrovolny & LaBardi as anAssociate Attorney
4 FOIA Applies to Personal Email and Texts of Public Officials
4Chicago City Council Violated Open Meetings Act DuringCOVID Conference Calls
5Mistaken Approval of Service Credit Not FinalAdministrative Decision
6Pension Reform in California State Supreme Court RulesPension Modifications are Constitutional
7Pension Reform in Oregon State Supreme Court RulesAgainst Employees
7 Legislation Proposed to Extend Municipal Funding Deadline
8 Reimer Dobrovolny & LaBardi PC News

© 2020 REIMER DOBROVOLNY & LABARDI PC
2
On February 6, 2014, Sardo responded to a fatalMetra train versus pedestrian accident. Sardo,arrived to disintegrated body parts all over the area.As lead investigator, Sargo collected evidence,interviewed witnesses, reviewed video and notifiednext of kin.When Sardo showed the victim’shusband a photo of a tattooed body part foridentification, the husband began screaming andrunning. Sardo was unable to forget the screaming.Soon after the accident, Sardo began outpatienttherapy for depression, PTSD and thoughts ofsuicide. Sardo stopped working on May 9, 2014and applied for a line of duty pension on June 22,2015, asserting a disability due to repetitive workexposure to life threatening and gruesomesituations culminating in the Metra accident.
Sardo was examined by three independent medicalexaminers. In summary, the physicians determined(i) Sardo had PTSD and Major Depressive from hismilitary service but was able to serve as a policeofficer, (ii) the train accident led to his trauma andtriggered his preexisting PTSD, and (iii) he waspermanently disabled as a result of the accident.
The pension board concluded the train accident wasnot the predominate cause but awarded Sardo aline-of-duty disability as the accident contributed tohis disability. The Village filed a complaint foradministrative seeking administrative review. TheVillage argued (i) an act of duty must be the solecause of an officer’s disability and (ii) Sardo’spolice work cumulatively aggravated his PTSD.The Village further argued caselaw supportstreating mental and physical disabilities differentlyand, unlike a physical disability, an officer may notreceive a line-of-duty pension for a mentaldisability when the mental condition preexisted.The circuit court affirmed the pension board’sdecision and held an act of duty need not be the solecause of the police officer’s mental disability andthe board may award a line of duty pension to anofficer for a mental disability despite an officer’spreexisting mental condition.
The Appellate Court affirmed the circuit court’sdecision. The Appellate Court reasoned that thewords “solely” and “entirely” do not appear undersection 3-144.1(a) of the Pension Code. To support
their position, the Village cited a firefighterdisability case. The Appellate Court noted they donot rely on cases involving a firefighter as authorityfor determining a line-of-duty disability pensionfor a police officer and under the Code’s plainlanguage, an officer may receive a line-of-dutypension even if the disability is not “solely” causedby an act of duty. Countering the Village’s positionthat the board should treat preexisting mentalconditions differently than preexisting physicalconditions, the Appellate Court held that theprovisions of 3-114.1(a) neither requires norsuggests that the board apply a different standard.To be clear, the Appellate Court confirmed that inorder to receive a line-of-duty pension based on amental disability, the officer needs to establish thedisability is a result of a specific, identifiable act ofduty unique to police but clarified that a physicaldisability and mental disability are to be treatedalike.
Governor Extends RemoteAttendance Options
As noted in our last newsletter, permanentamendments to the Open Meetings Act have beenenacted in response to the necessity to hold publicmeetings during the ongoing Coronaviruspandemic.
On September 18, 2020, Governor Pritzker signedthe most recent Gubernatorial DisasterProclamation which remains in effect throughOctober 17, 2020. Those who have been followingthis issue will note the Governor has been issuing30 day disaster proclamations in succession sinceMarch. It is likely the current proclamation will beextended beyond the current expiration date ofOctober 17, 2020.
As a refresher, the recent amendments to the OpenMeetings Act allow a public body the option tohold meetings via phone, video, or other electronicmeans without the physical presence of a quorumunder the following conditions:
1) The Governor or Illinois Department ofPublic health has issued a disaster

© 2020 REIMER DOBROVOLNY & LABARDI PC
3
declaration covering all or part of thejurisdiction of the public body.
2) The head of the public body determines anin-person meeting is not practical orprudent because of a disaster.
3) All members of the public bodyparticipating in the meeting must verifythey can hear one another and all discussionor testimony.
4) Members of the public present at the regularmeeting location can hear all discussion ortestimony and all votes taken unlessattendance at the regular meeting location isnot feasible due to the disaster. If in-personattendance by the public is not feasible, thepublic body must provide alternative meansfor the public to hear the meetings such asusing a telephone or web-based link.
5) At least one member of the public body,chief legal counsel, or chief administrativeofficer is physically present at the regularmeeting location, unless not feasiblebecause of the disaster.
6) All votes must be conducted by roll call ofeach member.
7) Notice must continue to be posted at least48 hours’ in advance of the meeting.
8) The public body must keep a verbatimrecord in the form of an audio or videorecording of meetings held in this manner.
Like prior declarations, the September 18, 2020,declaration finds “in person attendance of morethan fifty people at the regular meeting location notfeasible.” Public bodies exercising a telephonic orelectronic attendance option must provide noticeand allow members of the public to monitor themeeting.
In short, holding pension board meetings solely viaphone, video, or other electronic attendancecontinues to be permissible and likely will remainan option for the foreseeable future.
Reimer Dobrovolny & LaBardi PC
Friends and clients, we are excited to announce theformation of Reimer Dobrovolny & LaBardi PC.Effective October 1, 2020, Brian LaBardi will joinRick Reimer and Jim Dobrovolny as a namedpartner with the firm. Brian has been with the firmsince 2012 and a partner since 2018, focusing onpublic sector pension law, civil/appellate litigation,and employment/labor issues for police officersand firefighters. You may have seen Brianpresenting at an IPPFA or IPFA conference.
Prior to joining the firm, Brian was an AssistantState’s Attorney with the Kendall County State’sAttorney’s Office heading its civil division. Whileat the State’s Attorney’s Office, Brian wasresponsible for advising governmental entities onopen government regulations such as the OpenMeetings Act and the Freedom of Information Act.Handling a variety of defense claims on behalf ofCounty entities and employees, Brian litigated civiland quasi-criminal claims in both the Circuit Courtand before administrative bodies.
Brian also has an extensive background in privatepractice civil litigation. He has defendedprofessional malpractice claims, commerciallitigation claims, business litigations claims andserious injury claims. In addition, Brian haspresented arguments before numerous Stateappellate courts, the 7th Circuit Court of Appeals,and the United States Supreme Court.
Mr. LaBardi received his undergraduate degreefrom Valparaiso University and his law degreefrom The John Marshall Law School in 2006 wherehe was on the Dean’s List. He is licensed to practicelaw in Illinois, the United States District Court forthe Northern District of Illinois, and the 7th CircuitCourt of Appeals. He is a member of the IllinoisState and DuPage County Bar Associations.
All of us at RDL look forward to providing Illinois’police and fire pension funds with the excellentrepresentation you demand and deserve. Please donot hesitate to contact us if we can be of anyassistance!

© 2020 REIMER DOBROVOLNY & LABARDI PC
4
John Gaw Joins Reimer Dobrovolny& Labardi PC as an Associate
Attorney
John recently retired from the Lisle policedepartment after 27 years of service. He started hiscareer in law enforcement in 1993, following 4years in the United States Marine Corp and servicein Desert Storm. As a police officer, he served inmany different roles from firearms instructor andSRT, to crash reconstruction and evidencetechnician. He moved through the ranks and retiredas Deputy Chief in September of 2020. In additionto department roles, John served 12 years asPresident of his local Union and 8 years as aPension Board Trustee. These assignments gavehim a desire to pursue a career in Law. Whileworking patrol shift on midnights he completed hiseducation, receiving his Juris Doctor degree fromthe NIU College of Law. John is a licensedattorney in both Illinois and Indiana and admittedto practice in Federal Courts for both states. Johnis passionate about the rights of public safetyofficers; he looks forward to serving his brothersand sisters in this new role.
FOIA Applies to Personal Email andTexts of Public Officials
Better Government Ass'n v. City of Chicago Officeof Mayor, 2020 IL App (1st) 190038
The main issue in this case was whether textmessages and e-mails sent from public officials'personal accounts qualify as public records underFOIA. Back in 2016, the BGA made two FOIArequests seeking “any and all communication”between the Chicago Department of Public Healthand the Mayor’s office related to lead in thedrinking water at Chicago Public Schools.
The City did not comply with the request and madeno effort to ask its officials if they had anyresponsive records within their personal emails ortext messages. At the trial level, the Circuit Courtordered the City to make inquiries of their officialsconcerning their personal emails and text
messages, and supply affidavits from them. TheCity appealed but lost again. The Appellate Courtheld that “communications pertaining to publicbusiness within public officials' personal textmessages and e-mail accounts are public recordssubject to FOIA … Accordingly, we affirm theorder of the circuit court directing defendants toinquire whether the relevant officials used theirpersonal accounts for public business.”
The Court’s ruling was consistent with a prioropinion from the Public Access Counselor, (PAC16-006; Request for Review 2016 PAC 41657).This underscores the need to use caution withpersonal phones and emails. If a communicationpertains to public business, and comes to you inyour public capacity, it is probably subject toFOIA. Following a FOIA request, you could berequired to search your personal accounts, turn overany responsive information, and provide anaffidavit as to the presence or absence of anyresponsive information.
Chicago City Council Violated OpenMeetings Act During COVID
Conference Calls
2020 PAC 62981
In a non-binding opinion, the Public AccessCounselor (PAC) at the Attorney General’s Officehas found the Chicago City Council violated theOpen Meetings Act (OMA) by gathering viavideo/phone conference on several occasions withMayor Lightfoot to discuss issues related to theCity’s COVID response.
At issue were four meetings held via video orconference call wherein the Mayor’s office sharedCOVID information with the aldermen. A majorityof a quorum of the city council was present at threeof the four meetings in question. While no citycouncil action was taken during these meetings,discussion was held regarding the City’s COVIDresponse. No agendas were posted, the public wasnot able to participate, and no minutes were taken.The City council later took action related to severalof the matters discussed.

© 2020 REIMER DOBROVOLNY & LABARDI PC
5
In response to the OMA complaint filed by a newsorganization, the City referred to these gatheringsas “briefings” as opposed to meetings. It furtheraverred the OMA did not apply because thealderman did not attend in their legislative capacitybut rather only in their capacity as “community-based first responders”. It argued no deliberationoccurred and the matters discussed were not“public business”. Rather, the aldermenparticipating in the call were there to receive themost current information on the City’s COVIDresponse to share with their constituents. As such,no “meeting” was held as defined by the OMA.
In finding the City violated the OMA, the PAC firstfound, “when a majority of a quorum of aldermengather to participate in a discussion about the City’sresponse to a crisis such as the current pandemic,they do so as the legislative body of the City ofChicago even if they do not vote or otherwise takefinal action on how to respond.”
As to the City’s argument no “meeting” occurredinasmuch as no deliberation was held, the PACnoted prior opinions and case law holding“discussing public business” under the OMA isbroadly construed and includes discussion andexchange of facts prior to making a decision. ThePAC held, “Thus, ‘public business’ includes notonly those subjects on which public bodies takeaction during a gathering, but also the informationexchanged relating to matters that public bodieswould potentially act upon in the future, regardlessof whether action concerning the information isultimately taken.” In short, whether formal actionis taken is not determinative of whether a“meeting” occurred under the OMA inasmuch asdiscussion of public business is sufficient in and ofitself to trigger the requirements of the Act.
Ultimately, the PAC concluded the City violatedthe OMA requirements to post an agenda, hold themeeting at a time and place open to the public,allow for public comment, and keep minutes of allmeetings.
Mistaken Approval of Service CreditNot Final Administrative Decision
Chappell v. The Board of Trustees of IMRF, 2020IL App (1st) 1922255 (2020)
The First District Appellate Court determined thatan IMRF grant of service credits based upon anIMRF designated agent’s erroneous pensioneligibility certification was a not a “finaladministrative decision” pursuant to Section 3-101of the Administrative Review Law subject to the 35day rule.
Chappell was the executive director of a not-for-profit community center contracted by River ForestTownship (“Township”) to provide youth andrecreational services from 1986-2002. Chappell, asthe executive director, was aware that communitycenter employees were ineligible for IMRFparticipation as Chappell previously declinedparticipation for community center employees as itwas too cost prohibitive. Chappell was paid directlyby the community center, not the Township.
In 2002, Chappell was employed by Township as afacilities manager and received salaries from theTownship and the community center. Upon hisemployment with the Township, Chappellcompleted an enrollment form from IMRF and an“omitted service application” seeking to purchasecredit from his years at the community center.Chappell used the Township IMRF employer IDnumber when listing the community center. TheTownship’s supervisor and designated IMRF agentsigned the “omitted service credit application”incorrectly certifying Chappell was a Townshipemployee from 1986 to 2002. Chappell receivedconfirmation from IMRF’s “Past Service Unit”indicating he was eligible to purchase 198 monthsof service credit. Chappell purchased the servicecredit and retired in 2015.
In 2017, an internal staff audit revealed that theTownship certified Chappell’s pension eligibilityin error as he was not a Township employeebetween 1986 and 2002. IMRF notified Chappellthat his pension would be recalculated. At an

© 2020 REIMER DOBROVOLNY & LABARDI PC
6
administrative hearing, the hearing officerrecommended to the board of trustees of IMRF thatChappell’s benefits be recalculated. IMRFaccepted the recommendation and the circuit courton administrative review reversed finding IMRFlacked jurisdiction to reconsider the approval of theomitted service application, IMRF didn’t havestatutory authority to recover the benefits paid inerror and last, IMRF was equitably estopped fromrecalculating the benefits. IMRF and the Townshipappealed.
Focusing on whether IMRF’s approval ofChappell’s omitted service credit application was afinal administrative decision subject to the 35-dayrule, the Appellate Court concluded instead, IMRFmade an “interlocutory administrativedetermination” not subject to the 35-day limitation.IMRF’s initial approval was a “rubber stampapproval” highlighted by the fact IMRF did nothold a hearing or listen to testimony. Theautomated approval process was a statutory processcreated by the legislature to facilitate the efficientadministration of a sizable public pension fund andits reliance on pension eligibility certificates of itsparticipating employers is statutory and practicalcommonplace. As the approval was not subject tothe 35-day limitation, IMRF had jurisdiction toreconsider the initial approval long after the 35days expired.
Further, the Appellate Court found the Townshipand IMRF did not have the statutory authority togrant Chappell the omitted service credits becausehe did not meet the statutory definition ofemployee. The terms of the Pension Code controlwho is a qualified employee and no act by amunicipality can make an ineligible employeeeligible. A decision by an agency that lacksstatutory power to enter the decision lacks personaland subject matter and as such, all decisions arevoid. As such, IMRF’s approval was void for wantof Pension Code authorization.
Regarding IMRF’s authority to recover benefitspaid in error, the Court interpreted “error” asdefined by Black’s Law Dictionary to mean “anassertion or belief that does not conform toobjective reality.” Specifically, the Court noted that
had the legislature intended to limit IMRF’sauthority to recalculate a pension and recoup theoverpayment of benefits to cases involvingarithmetical errors, it could have done so. TheCourt held that neither the Township’scertification, nor IMRF’s approval conformed toobjective reality and since Chappell was ineligiblefor pension benefits as the employee of a non-participating employer from 1986 to 2002, IMRFwas duty bound to retain overpayment amounts.
Last, regarding equitable estoppel, the Court deniedChappell’s claim and he knew full well that he didnot qualify for IMRF participation from 1986 to2002 and as such his reliance on the actions takenby the Township and IMRF was not reasonable.Accordingly, the decision of the circuit court wasreversed, the decision of IMRF affirmed and thecase was remanded for further proceedings notinconsistent with Court’s decision.
Pension Reform in California-StateSupreme Court Rules Pension
Modifications are Constitutional
Alameda Co. Deputy Sheriffs’ Assn. v. AlamedaCo.Employees Retirement Assn., (2020), 9 Cal.5th1032
In 2013, the California Legislature enacted anumber of pension reforms, resulting in severallegal challenges.
This case addressed provisions of the new pensionlaw that would exclude certain types of pay whencalculating the amount of a pension. Previously,retirement boards had included various forms ofadditional pay and cash outs, which would inflatethe pensions. Unions representing affected publicemployees challenged whether the new exclusionscould be constitutionally applied to people whowere hired before the new law.
The California Supreme Court considered theirprior decisions applying the “California Rule”. TheCalifornia Rule is the theory that a public employeeis vested in the pension benefit that existed at thestart of their employment, in such a manner that the

© 2020 REIMER DOBROVOLNY & LABARDI PC
7
benefits cannot be reduced, even for future years ofservice, except under exceptionally limitedcircumstances. To be legal under the CaliforniaRule, any changes “must bear some materialrelation to the theory of a pension system and itssuccessful operation” and changes creating adisadvantage must be offset by a comparableadvantage.
In its decision, the Court found the changes wereconstitutionally permissible because their purposewas to “close loopholes” and prevent potentiallyabusive practices, such as pension spiking. TheCourt reasoned that the changes did not need toprovide an offsetting new advantage because thatwould defeat the purpose of closing loopholes thatshould not have existed originally.
Pension Reform in Oregon StateSupreme Court Rules Against
Employees
Jennifer James, et al. v. State of Oregon, et al.,(SC S066933)
The pension system in Oregon has two tiers ofdefined benefit employees, and a third tier ofdefined contribution employees. In 2019, the Stateof Oregon enacted some new pension reformlegislation, which was challenged by its publicemployees. The Oregon Supreme Court denied theclaims brought by public employees, whichchallenged two amendments to the Oregon PublicEmployee Retirement System (PERS).
The first challenged amendment redirects amember's PERS contributions from the member'sindividual account program (the defined-contribution component of the member's retirementplan) to a newly created employee pension stabilityaccount, used to help fund the defined benefitcomponent of the member's retirement plan. Thesecond challenged amendment imposes a cap onthe salary used to calculate a member's benefits.
Public employees primarily argued that theredirection and salary-cap provisions of the newlegislation unconstitutionally impaired their
employment contracts in violation of the stateContract Clause of the Oregon Constitution. In thealternative, they argued that the amendmentsviolated the Federal Contract Clause, breachedtheir contracts, and constituted an unconstitutionaltaking of their property without just compensationin violation of the Oregon Constitution, and theFifth and Fourteenth Amendments to the UnitedStates Constitution.
In a unanimous opinion, the Oregon Supreme Courtdenied the challenges. The Court held that thechallenged amendments did not impair contractrights under the state Contract Clause, because theamendments do not operate retrospectively todecrease the retirement benefits attributable towork that the member performed before theeffective date of the amendments. The court furtherexplained that, although the amendments operateprospectively to change the offer for futureretirement benefits, the pre-amendment statutes didnot include a promise that the retirement benefitswould not be changed prospectively.
Legislation Proposed to ExtendMunicipal Funding Deadline
H.B. 5799
As you may recall, along with a change in benefitsnow known as “tier 2”, an amendment to Articles 3and 4 of the Pension Code in 2011, requires fundingof police and fire pension funds using a formula toinclude “an amount sufficient to bring the totalassets of the pension fund up to 90% of the totalactuarial liabilities of the pension fund by the endof municipal fiscal year 2040.”
Legislation has been introduced to amend thiscalculation by moving the date 10 years furtherdown the road to 90% funded by 2050. While itis unclear whether the legislation will be called fora vote during the November veto session, it is apriority of municipal organizations who argue thechange is needed to accommodate municipalitiesexperiencing budget deficits stemming from theCOVID-19 pandemic. Stay tuned.

© 2020 REIMER DOBROVOLNY & LABARDI PC
8
REIMER DOBROVOLNY & LABARDI PC NEWS
RDL partner Brian LaBardi presented at the IPFA virtual four hour training course on the changesimplemented by P.A. 101-0610 on July 2, 2020.RDL partner Rick Reimer presented at the IPPFA certified new trustee training at NIU in Napervilleon September 23, 2020.RDL partner Brian LaBardi presented at the IPPFA MidAmerican Pension Conference held bothvirtually and in person in Naperville from September 30-October 2, 2020.RDL partner Rick Reimer will present at the IPPFA certified new trustee training at NIU in HoffmanEstates on October 19, 2020.RDL partner Brian LaBardi will present at the IPFA fall seminar to be held virtually on November 6,2020.
Legal and Legislative Update
Volume 18, Issue 4, October 2020This publication constitutes advertising material. Information contained herein should not be considered legal advice.
Legal and Legislative Update is published periodically. Questions may be directed to:REIMER DOBROVOLNY & LABARDI PC
A Public Safety Law Firm15 Spinning Wheel Road, Suite 310, Hinsdale, IL 60521
(630) 654-9547 Fax (630) 654-9676www.rdlaborlawpc.com
Unauthorized reproduction prohibited. All rights reserved.
Suggested Agenda Items forJanuary (or 1st Quarter)
Approval of annual COLA increases.Semi-annual review of closed executive session minutes to determine if it needs toremain confidential.Determine need for election of beneficiary and active Trustees and/or re-appointmentof appointed Trustees – request for re-appointment of appointed Trustees.Schedule annual examinations for disabled firefighters/police officers under age 50.Annual verifications of eligibility for beneficiaries.Review/update contracts with vendors (accountants, actuaries, attorneys, investment


TRANSITION BOARD MEMBERS
Shawn Curry Participant Representative Peoria, IL
Andrea DiGiacinto Participant Representative Libertyville, IL
Brian Prochaska Participant Representative Joliet, IL
Daniel Hopkins Beneficiary Representative Collinsville, IL
Mark Poulos Beneficiary Representative Rock Island, IL
Elizabeth Holleb Municipal Representative Lake Forest, IL
Michael Inman Municipal Representative Macomb, IL
Phil Suess Municipal Representative Wheaton, IL
Brad Cole Illinois Municipal League Representative Carbondale, IL
Message from Board Chairperson:
“As Chairperson of the IPOPIF, I find that in person committee and board meetings are not practical or prudent due to the current pandemic. In addition, I find that I do not have to physically be present at the IPOPIF office because it is not feasible due to the Governor’s August 21, 2020 disaster proclamation. These findings shall remain in effect until September 19, 2020.” – Shawn Curry
IPOPIF
ILLINOIS POLICE OFFICERS’ PENSION INVESTMENT FUND 184 SHUMAN BOULEVARD, SUITE 305, NAPERVILLE, IL 60563 I (331) 472-1080
Page 1 of 2
Notice is hereby given that the Board of Trustees of the Illinois Police Officers’ Pension Investment Fund will conduct a meeting on Friday, September 11, 2020 at 9:00 a.m. via the Zoom digital platform in accordance with Executive Order 2020-52 issued by Governor Pritzker and Public Act 100-640. By entering this meeting, participants agree to be audio and video recorded.
Zoom Invite: Public Invited via teleconference Dial by your location
+1 312 626 6799 US (Chicago) +1 929 205 6099 US (New York)
+1 301 715 8592 US (Germantown) +1 669 900 6833 US (San Jose) +1 253 215 8782 US (Tacoma) +1 346 248 7799 US (Houston)
Meeting ID: 924 5725 1172
Passcode: 277548
AGENDA
1. Call to Order 2. Roll Call 3. Meeting Minutes
a. Review/Approve – August 14, 2020 Meeting Minutes
4. Fiduciary Counsel a. Interview Candidates
i. 9:00-9:15 a.m. – Asher, Gittler & D’Alba, Ltd. ii. 9:15-9:30 a.m. – Jacobs, Burns, Orlove & Hernandez, LLP
iii. 9:30-9:45 a.m. – Reinhart Boerner Van Deuren s.c.
b. Discussion/Selection of Fiduciary Counsel
i. Motion to hire Fiduciary Counsel, subject to Attorney review and Board
approval of the Contract Agreement
ii. Motion to Approve Fiduciary Counsel as a Vendor
5. Governmental Liaison a. Status Update/Recommendation(s) from Legislative Committee
b. Review/Adopt – Legislative Policy
c. Discussion/Selection of Governmental Liaison
i. Motion to hire a Governmental Liaison, subject to Attorney review and
Board approval of the Contract Agreement
ii. Motion to Approve the Governmental Liaison as a Vendor

TRANSITION BOARD MEMBERS
Shawn Curry Participant Representative Peoria, IL
Andrea DiGiacinto Participant Representative Libertyville, IL
Brian Prochaska Participant Representative Joliet, IL
Daniel Hopkins Beneficiary Representative Collinsville, IL
Mark Poulos Beneficiary Representative Rock Island, IL
Elizabeth Holleb Municipal Representative Lake Forest, IL
Michael Inman Municipal Representative Macomb, IL
Phil Suess Municipal Representative Wheaton, IL
Brad Cole Illinois Municipal League Representative Carbondale, IL
Message from Board Chairperson:
“As Chairperson of the IPOPIF, I find that in person committee and board meetings are not practical or prudent due to the current pandemic. In addition, I find that I do not have to physically be present at the IPOPIF office because it is not feasible due to the Governor’s August 21, 2020 disaster proclamation. These findings shall remain in effect until September 19, 2020.” – Shawn Curry
IPOPIF
ILLINOIS POLICE OFFICERS’ PENSION INVESTMENT FUND 184 SHUMAN BOULEVARD, SUITE 305, NAPERVILLE, IL 60563 I (331) 472-1080
Page 2 of 2
6. Treasurer’s Report a. Monthly Financial Report
b. Review/Approve – Warrants Summary
c. Review/Approve – Budget Amendments (If Needed)
d. Approval of Vendors and Purchases (If Needed)
e. Review Loan Activity
f. Other i. Status Update – Request for Proposal for Auditing Services
ii. Review – Recommendations for Audit Committee
iii. Status Update – Chief Financial Officer (CFO) Engagement Letter
7. Election of Permanent Board of Trustees a. Review/Adopt – Revised Election Policy (Rules)
b. Review/Approve – Contract Agreement for Election Services with Survey &
Ballot Systems
c. Status Update – Candidate Nomination and Challenge Period
d. Status Update – Voter Database
8. Special Orders a. Appointment of Audit Committee and Committee Chairperson
9. Executive Director’s Report a. Review/Adopt – Municipal Reimbursement Policy b. August Update c. Strategic Plan
i. Discussion – Board of Trustees Meeting Agenda Item Plan ii. Discussion/Approval – Asset Transition Planning Group
10. General Counsel’s Report a. Review/Adopt – Ethics Policy
b. Selection of Ethics Officer Position
11. Old Business 12. New Business 13. Closed Session (If Needed) 14. Public Comment 15. Adjournment

TRANSITION BOARD MEMBERS
Shawn Curry Participant Representative Peoria, IL
Andrea DiGiacinto Participant Representative Libertyville, IL
Brian Prochaska Participant Representative Joliet, IL
Daniel Hopkins Beneficiary Representative Collinsville, IL
Mark Poulos Beneficiary Representative Rock Island, IL
Elizabeth Holleb Municipal Representative Lake Forest, IL
Michael Inman Municipal Representative Macomb, IL
Phil Suess Municipal Representative Wheaton, IL
Brad Cole Illinois Municipal League Representative Carbondale, IL
Message from Board Chairperson:
“As Chairperson of the IPOPIF, I find that in person committee and board meetings are not practical or prudent due to the current pandemic. In addition, I find that I do not have to physically be present at the IPOPIF office because it is not feasible due to the Governor’s September 18, 2020 disaster proclamation. These findings shall remain in effect until October 17, 2020.” – Shawn Curry
IPOPIF
ILLINOIS POLICE OFFICERS’ PENSION INVESTMENT FUND 184 SHUMAN BOULEVARD, SUITE 305, NAPERVILLE, IL 60563 I (331) 472-1080
Page 1 of 2
Notice is hereby given that the Board of Trustees of the Illinois Police Officers’ Pension Investment Fund will conduct a meeting on Friday, October 9, 2020 at 9:00 a.m. via the Zoom digital platform in accordance with Executive Order 2020-55 issued by Governor Pritzker and Public Act 100-640. By entering this meeting, participants agree to be audio and video recorded.
Zoom Invite: Public Invited via teleconference Dial by your location
+1 312 626 6799 US (Chicago) +1 929 205 6099 US (New York)
+1 301 715 8592 US (Germantown) +1 669 900 6833 US (San Jose) +1 253 215 8782 US (Tacoma) +1 346 248 7799 US (Houston)
Meeting ID: 992 0200 1971
Passcode: 821821
AGENDA
1. Call to Order 2. Roll Call 3. Meeting Minutes
a. Review/Approve – August 28, 2020 Special Board Meeting Minutes
b. Review/Approve – September 8, 2020 Legislative Committee Meeting Minutes
c. Review/Approve – September 11, 2020 Board Meeting Minutes
4. Fiduciary Counsel a. Closed Session – Review Responses to Request for Proposal
b. Open Session
i. Approval of Fiduciary Counsel Firm (Subject to Attorney review and Board
approval of the Contract Agreement)
ii. Approval of Fiduciary Counsel as a Vendor
5. Treasurer’s Report a. Monthly Financial Report
b. Review/Approve – Warrants Summary
c. Review/Approve – Budget Amendments (If Needed)
d. Approval of Vendors and Purchases (If Needed)
e. Review Loan Activity
f. Other
6. Audit Committee Report a. Status Update/Recommendations from Audit Committee
b. Review/Adopt – Audit Committee Policy (PP-2020-09)
c. Discussion/Selection – Audit Services Firm

TRANSITION BOARD MEMBERS
Shawn Curry Participant Representative Peoria, IL
Andrea DiGiacinto Participant Representative Libertyville, IL
Brian Prochaska Participant Representative Joliet, IL
Daniel Hopkins Beneficiary Representative Collinsville, IL
Mark Poulos Beneficiary Representative Rock Island, IL
Elizabeth Holleb Municipal Representative Lake Forest, IL
Michael Inman Municipal Representative Macomb, IL
Phil Suess Municipal Representative Wheaton, IL
Brad Cole Illinois Municipal League Representative Carbondale, IL
Message from Board Chairperson:
“As Chairperson of the IPOPIF, I find that in person committee and board meetings are not practical or prudent due to the current pandemic. In addition, I find that I do not have to physically be present at the IPOPIF office because it is not feasible due to the Governor’s September 18, 2020 disaster proclamation. These findings shall remain in effect until October 17, 2020.” – Shawn Curry
IPOPIF
ILLINOIS POLICE OFFICERS’ PENSION INVESTMENT FUND 184 SHUMAN BOULEVARD, SUITE 305, NAPERVILLE, IL 60563 I (331) 472-1080
Page 2 of 2
i. Approval of Audit Firm (Subject to Attorney review and Board approval of the
Contract Agreement)
ii. Approval of Audit Firm as a Vendor
7. Election of Permanent Board of Trustees a. Approval of Candidates and Authorize Election Process
b. Status Update on the Election Process
8. Website Design and Development Provider a. Review Responses to Request for Proposal
b. Approval of Website Design and Development Firm (Subject to Attorney review and
Board approval of the Contract Agreement)
c. Approval of Website Design and Development Firm as a Vendor
9. Governmental Liaison a. Review/Approve – Engagement Letter with Vision M.A.I. Consulting
10. Chief Financial Officer a. Review/Approve – Engagement Letter with Lauterbach & Amen, LLP
11. Secondary Banking Services Provider a. Review Responses to Request for Updated Proposals
b. Approval of Banking Services Provider (Subject to Attorney review and Board approval
of the Contract Agreement)
c. Approval of Banking Services Provider as a Vendor
d. Approval to Add Authorized Signers to Secondary Bank Account
12. Executive Director’s Report a. Strategic Plan
i. Approval of Transition Advisory Workshop ii. Review Mission Statement, Vision Statement, and Values Statement
b. Communications
i. Status Update Memorandum
ii. IPPFA Conference Presentation
iii. Executive Director Introduction Article
iv. Non-Disclosure and Non-Solicitation Agreement – Foster & Foster, Inc.
13. General Counsel’s Report a. Review/Adopt – Ethics Policy
b. Selection of Ethics Officer Position
14. Old Business 15. New Business 16. Public Comment
17. Adjournment
Copyright © 2022 FDOKUMEN