
AGENDA - Dallas Police & Fire Pension System
351
1 of 5 AGENDA Date: June 3, 2016 The regular meeting of the Dallas Police and Fire Pension System Board of Trustees will be held at 8:30 a.m. on Thursday, June 9, 2016, in the Second Floor Board Room at 4100 Harry Hines Boulevard, Dallas, Texas. Items of the following agenda will be presented to the Board: A. MOMENT OF SILENCE B. BOARD OF TRUSTEES 1. Welcome of newly-appointed Trustee 2. Election of officers of the Board of Trustees to fill vacant position(s) 3. Authorized signatories for the Board of Trustees 4. Committee appointments
-
Upload
khangminh22 -
Category
Documents
-
view
0 -
download
0
Transcript of AGENDA - Dallas Police & Fire Pension System

1 of 5
AGENDA
Date: June 3, 2016 The regular meeting of the Dallas Police and Fire Pension System Board of Trustees will be held at 8:30 a.m. on Thursday, June 9, 2016, in the Second Floor Board Room at 4100 Harry Hines Boulevard, Dallas, Texas. Items of the following agenda will be presented to the Board: A. MOMENT OF SILENCE B. BOARD OF TRUSTEES
1. Welcome of newly-appointed Trustee 2. Election of officers of the Board of Trustees to fill vacant position(s) 3. Authorized signatories for the Board of Trustees 4. Committee appointments

2 of 5
C. CONSENT AGENDA 1. Approval of Minutes
Regular meeting of May 12, 2016
2. Approval of Refunds of Contributions for the Month of May 2016 3. Approval of Activity in the Deferred Retirement Option Plan (DROP) for June
2016 4. Approval of Estate Settlements 5. Approval of Survivor Benefits 6. Approval of Service Retirements 7. Approval of Alternate Payee Benefits 8. Approval of Earnings Test 9. Approval of Payment of DROP Revocation Contributions

3 of 5
D. DISCUSSION AND POSSIBLE ACTION REGARDING ITEMS FOR INDIVIDUAL CONSIDERATION
1. Equity structure study 2. Boston Partners 3. Manulife Asset Management 4. Ashmore Global Special Situations IV extension 5. NEPC: First Quarter 2016 Investment Performance Analysis and Fourth
Quarter 2015 Private Markets Review 6. Investment reports 7. Hearthstone: Idaho and Colorado properties update
Portions of the discussion under this topic may be closed to the public under the terms of Section 551.072 of the Texas Government Code.
8. Plan amendment – retiree voting

4 of 5
9. Ad hoc committee reports 10. Board Members’ reports on meetings, seminars and/or conferences attended
a. NCPERS Accredited Fiduciary (NAF) Program b. NCPERS Annual Conference c. TEXPERS Basic Trustee Training Class d. Pharos Annual Investor Conference
11. 2016 Board/staff workshop 12. Spouse Wed After Retirement (SWAR)
Portions of the discussion under this topic may be closed to the public under the terms of Section 551.071 of the Texas Government Code.
13. Legal issues
Portions of the discussion under this topic may be closed to the public under the terms of Section 551.071 of the Texas Government Code. a. Police Officer and Firefighter pay lawsuits b. Potential claims involving fiduciaries and advisors c. 2014 Plan amendment election and litigation
5 of 5
14. Mid-year 2016 budget adjustment
15. Audit status
16. Emerging Managers E. BRIEFING ITEMS
1. Reports and concerns of active members and pensioners of the Dallas Police and
Fire Pension System
2. Executive Director’s report
a. Future Education and Business Related Travel b. Future Investment Related Travel c. Associations’ newsletters
TEXPERS Pension Observer (Spring 2016) d. CalPERS to study possible reinvestment in tobacco (Reuters)
The term “possible action” in the wording of any Agenda item contained herein serves as notice that the Board may, as permitted by the Texas Government Code, Section 551, in its discretion, dispose of any item by any action in the following non-exclusive list: approval, disapproval, deferral, table, take no action, and receive and file. At the discretion of the Board, items on this agenda may be considered at times other than in the order indicated in this agenda.
At any point during the consideration of the above items, the Board may go into Closed Executive Session as per Texas Government Code, Section 551.071 for consultation with attorneys, Section 551.072 for real estate matters, Section 551.074 for personnel matters, and Section 551.078 for review of medical records.

Regular Board Meeting – Thursday, June 9, 2016
ITEM #A
MOMENT OF SILENCE
In memory of our Members and Pensioners who recently passed away
(April 28, 2016 – June 1, 2016)
FIRE ACTIVE/ RETIRED
DATE OF DEATH
POLICE ACTIVE/ RETIRED
DATE OF DEATH
Clifford C. Gladney Roger J. Murphy James F. Roberts Sylvester Thomas, Jr.
Retired Retired Retired Retired
May 26, 2016 May 24, 2016 May 21, 2016 May 7, 2016
Charley L. Daniel Paul D. Jarrell William R. Jordan Jerry W. Smiddy
Retired Retired Retired Retired
May 25, 2016 May 30, 2016 Apr. 28, 2016 May 22, 2016

DISCUSSION SHEET
Regular Board Meeting – Thursday, June 9, 2016
ITEM #B1
Topic: Welcome of newly-appointed Trustee
Discussion: On Wednesday, May 25, 2016, the City Council approved the following appointment to the Dallas Police & Fire Pension System Board: Position 1 – Councilmember Jennifer S. Gates The updated DPFP Board appointment list from the City Secretary’s office is attached.

Staff Support: KELLY GOTTSCHALK, EXECUTIVE DIRECTOR
POLICE AND FIRE PENSION FUND
4100 HARRY HINES SUITE100 DALLAS, TEXAS 75219
Phone: 214-638-3863
Fax: 214-638-6403
Position 01 JENNIFER S GATESNominated by RAWLINGS Terms served: 0Member since: 5/25/2016
W F 13 C Appointed 05/25/2016CITY COUNCILMEMBER
Position 02 SCOTT GRIGGSNominated by RAWLINGS Terms served: 2Member since: 1/11/2012
W M 03 C Reappointed 08/05/2015CITY COUNCILMEMBER
Position 03 PHILIP T KINGSTONNominated by RAWLINGS Terms served: 1Member since: 8/7/2013
W M 14 C Reappointed 08/05/2015CITY COUNCILMEMBER
Position 04 ERIK WILSONNominated by RAWLINGS Terms served: 0Member since: 8/5/2015
B M 08 C Appointed 08/05/2015CITY COUNCILMEMBER
This board requires that nominees for positions on this board have one of the following qualifications:The City Council shall name from among its members, four (4) Council members who shall serve as Trustees of the Board. The places of those named by the Council shall be designated as Council Places numbered 1 through 4. The Council Place to be filled by each Council Member.Trustee shall be designated at the time of appointment. The Council member Trustees shall be named as soon as possible after the first Monday after the final election of Council members and shall serve for the term of office to which they were elected as Council members. In the event the City Council fails to select a Council member as Trustee within the prescribed period of time, the person who has been filling the Council Member Trustee position shall continue to serve as Trustee until such time as said selection is made. If there is a vacancy in any of the Council member Trustees’ seats on the Board, for any reason other than the failure of the City to select a Council member as a Trustee, the City Council shall name another Council member to serve out the remainder of the unexpired term.
4 members appointed by the full City Council; 8 members elected by other jurisdictions.
ALL TERMS END: 06/26/2017
Membership:
PFP - POLICE AND FIRE PENSION BOARD*Quasi-Judicial
49CITY OF DALLASOFFICE OF THE CITY SECRETARY
Public Member List5/27/2016

DISCUSSION SHEET
Regular Board Meeting – Thursday, June 9, 2016
ITEM #B2
Topic: Election of officers of the Board of Trustees to fill vacant position(s)
Discussion: In accordance with Section 3.01(f) of the Plan Document, the Board will elect from among its Trustees a Vice Chairman to fill the vacancy created by the resignation of Lee Kleinman, for the period from June 9, 2016, through May 31, 2017. Current officers are as follows: Chairman – Sam Friar Vice Chairman – vacant Deputy Vice Chairman – Joe Schutz

DISCUSSION SHEET
Regular Board Meeting – Thursday, June 9, 2016
ITEM #B3
Topic: Authorized signatories for the Board of Trustees
Discussion: Certain signature authorizations are necessary to facilitate the day-to-day operations of the System. In the past, the Board has authorized the Chairman to sign all documents (including any necessary payments) for the Board and System. If the Chairman is not available, then the Vice-Chairman may sign in the Chairman’s place. If both the Chairman and Vice-Chairman are unavailable, then the Deputy Vice-Chairman is authorized to sign for the System.
Current procedures provide that the Chairman’s and Executive Director’s signatures are digitized and may be placed on all checks to the retirees and vendors.

DISCUSSION SHEET
Regular Board Meeting – Thursday, June 9, 2016
ITEM #B4
Topic: Committee appointments
Discussion: The Chairman will provide his nominations to the Audit Committee and the Professional
Services Committee for the Board’s consideration. Upon the Board’s approval of committee
members, the Chairman will designate a committee chair for each of these committees.

1 of 11
Dallas Police and Fire Pension System
Thursday, May 12, 2016
8:30 a.m.
4100 Harry Hines Blvd., Suite 100
Second Floor Board Room
Dallas, TX
Regular meeting, Samuel L. Friar, Chairman, presiding:
ROLL CALL
Board Members
Present at 8:30 Samuel L. Friar, Joseph P. Schutz, Brian Hass, Kenneth S. Haben, Erik
Wilson, Tho T. Ho, Gerald D. Brown, Clint Conway, John M. Mays
Present at 8:37 Lee M. Kleinman
Present at 8:39 Philip T. Kingston
Absent: Scott Griggs
Staff Kelly Gottschalk, Joshua Mond, James Perry, Summer Loveland, John
Holt, Corina Terrazas, Damion Hervey, Kelly Dean, Pat McGennis,
Ryan Wagner, Milissa Romero, Christina Wu, Greg Irlbeck, Linda
Rickley, Kevin Killingsworth
Others Ron Pastore, Mark Morrison, Marty Kane, John Kolb, Stuart Turner, Eric
Grossman, John Philips, Rick Bodio, Oliver Williams, Kate Harkness,
Courtney Cahill Phelps, Stacey Magee, Dennis Bush (by telephone),
Rhett Humphreys, Michael Yang, Andrea Kim, Darrell Jordan, Mark
Sales, Greg Taylor, John Turner, Jason Jordan, Ken Sprecher, Sherman
Evans, A. D. Donald, Robert Sharp, Harold Holland, Dan Wojcik, W.
Robison, Brad Dirks, Jerry M. Rhodes, Octavio Saldana, Rick Salinas,
Esteban Maldonado, Kalon Cohen, Bill Ingram, Edward D. Davis, Diana
S. Salinas, Jacqueline L. Webb, Sal Morales, Margaret Morales, Paul
Sharp, Alexis Bushong
* * * * * * * *
The meeting was called to order at 8:30 a.m.
* * * * * * * *
A. MOMENT OF SILENCE
The Board observed a moment of silence in memory of retired police officers, Ronald E. Bardin,
Vernon C. Campbell, and Eddie C. Carlan, and retired firefighters, Buddy K. Chambers and
Phillip J. Foley.
* * * * * * * *

Regular Board Meeting
Thursday, May 12, 2016
2 of 11
B. CONSENT AGENDA
1. Approval of Minutes
a. Special meeting of April 1, 2016
b. Regular meeting of April 14, 2016
2. Approval of Refunds of Contributions for the Month of April 2016
3. Approval of Activity in the Deferred Retirement Option Plan (DROP) for May
2016
4. Approval of Estate Settlements
5. Approval of Survivor Benefits
6. Approval of Service Retirements
7. Approval of Alternate Payee Benefits
8. Approval of Five-Year Certificates for the First Quarter 2016
9. Approval of Payment of DROP Revocation Contributions
After discussion, Mr. Brown made a motion to approve the items on the Consent Agenda,
subject to the final review of the staff. Mr. Mays seconded the motion, which was unanimously
approved by the Board. Messrs. Kingston and Kleinman were absent when the vote was taken.
* * * * * * * *
C. DISCUSSION AND POSSIBLE ACTION REGARDING ITEMS FOR
INDIVIDUAL CONSIDERATION
1. AEW portfolio review
Ron Pastore, Senior Portfolio Manager, and Mark Morrison, Assistant Portfolio
Manager, representatives of AEW, gave an update to the Board on the status and
plans for DPFP’s investments in RED Consolidated Holdings, Creative Attractions,
and Camel Square.

Regular Board Meeting
Thursday, May 12, 2016
3 of 11
1. AEW portfolio review (continued)
The Board went into a closed executive session – real estate at 8:39 a.m.
The meeting was reopened at 9:52 a.m.
No motion was made.
* * * * * * * *
The meeting was recessed at 9:53 a.m.
The meeting was reconvened at 9:58 a.m.
* * * * * * * *
2. Cornerstone strategic review
Marty Kane, Portfolio Manager, John Kolb, Portfolio Manager, Stuart Turner, Vice
President – Hotel Acquisitions, Eric Grossman, Assistant Vice President – Asset
Manager, and John Philips, Vice President & Associate General Counsel,
representatives of Cornerstone, provided the Board the results of their review of
DPFP’s investments in the Aetna Springs and Lake Luciana projects located in Napa
County, California (“Napa Portfolio”) and provided a recommended course of
action.
The Board went into a closed executive session – real estate at 10:04 a.m.
The meeting was reopened at 10:55 a.m.
After discussion, Mr. Kingston made a motion to authorize Cornerstone to engage a
broker to market the Napa Portfolio for sale. Mr. Haben seconded the motion, which
was unanimously approved by the Board.
* * * * * * * *
3. Hancock portfolio review
Hancock Agricultural Investment Group (Hancock), represented by Rick Bodio,
Portfolio Manager, Oliver Williams, President, and Kate Harkness, Investment
Analyst, reviewed DPFP’s portfolio and discussed their hold-sell recommendations
on certain portions of the portfolio with the Board.

Regular Board Meeting
Thursday, May 12, 2016
4 of 11
3. Hancock portfolio review (continued)
The Board went into a closed executive session – real estate at 11:09 a.m.
The meeting was reopened at 12:11 p.m.
After discussion, Mr. Brown made a motion to authorize Hancock to sell portfolio
properties, subject to the approval of the Executive Director. Mr. Kingston seconded
the motion, which was unanimously approved by the Board.
* * * * * * * *
The meeting was recessed at 12:27 p.m.
The meeting was reconvened at 12:57 p.m.
* * * * * * * *
4. Clarion: Four Leaf
Clarion, represented by Courtney Cahill Phelps, Senior Associate, and Stacey
Magee, Director, discussed with the Board a potential sale of Four Leaf, a 110-acre
acre site located in Glendale, AZ. Clarion discussed the marketing process to date
and provided a recommended course of action.
The Board went into a closed executive session – real estate at 12:57 p.m.
The meeting was reopened at 1:11 p.m.
After discussion, Mr. Brown made a motion to authorize Clarion to consummate the
sale of the Four Leaf property, subject to the final approval of terms by the Executive
Director. Mr. Conway seconded the motion, which was unanimously approved by
the Board. Messrs. Haben, Kleinman, and Wilson were absent when the vote was
taken.
* * * * * * * *
5. Hearthstone: Dry Creek
Dennis Bush – Vice President, Investment Management, of Hearthstone,
participated by telephone and briefed the Board on the status of the property.
The Board went into a closed executive session – real estate at 12:57 p.m.

Regular Board Meeting
Thursday, May 12, 2016
5 of 11
5. Hearthstone: Dry Creek (continued)
The meeting was reopened at 1:11 p.m.
No motion was made.
* * * * * * * *
6. Recognition of outgoing Trustee
The Chairman and Executive Director, on behalf of the Board, presented a plaque
of appreciation to Lee Kleinman for his dedicated service on the Board of Trustees
as a Council Trustee. Mr. Kleinman was appointed to the Board on August 7, 2013.
His last day of service will be May 24, 2016.
No motion was made.
* * * * * * * *
Regular Board Meeting
Thursday, May 12, 2016
6 of 11
7. Global Asset Allocation structure study
The Global Asset Allocation (GAA) portfolio’s target allocation decreased from
20% to 10% when the asset allocation was approved at the March 10, 2016 Board
meeting. NEPC and Staff presented the GAA structure study, which explained the
build out of the GAA portfolio and discussed each of the sub-asset classes in detail,
such as which managers to retain or eliminate, the reasonable number of managers
in each sub-asset class and the expected timeline to complete the build out.
After discussion, Mr. Kingston made a motion to close the position in PanAgora and
AQR, as well as to stop automatic rebalancing between Bridgewater’s All Weather
Fund and their Pure Alpha Major Markets Fund. Mr. Brown seconded the motion,
which was unanimously approved by the Board. Messrs. Kleinman and Wilson were
absent when the vote was taken.
* * * * * * * *
8. Bank of America loan
Ms. Gottschalk briefed the Board on the status of the Bank of America loan.
No motion was made.
* * * * * * * *
9. Investment and financial reports
Mr. Perry reviewed the investment performance and rebalancing reports for the
period ending April 30, 2016 with the Board. Ms. Loveland briefed the Board on
the financial reports for the periods ending December 31, 2015 and March 31, 2016.
No motion was made.
* * * * * * * *
10. Board policies
a. Committee Policy and Procedure
b. Executive Director’s Performance Evaluation Policy
c. Investment Policy Statement – Investment Advisory Committee Formation
Process

Regular Board Meeting
Thursday, May 12, 2016
7 of 11
10. Board policies (continued)
a. Based on recommendations received from Cortex Applied Research, prior
discussions with the Board and input from the Governance Committee, staff
proposed revisions to the Committee Policy and Procedure. The key changes
included the formation of an Audit Committee and a Professional Services
Committee and termination of the Administrative and Audit Advisory
Committee (AAAC) and the Actuarial Funding Advisory Committee (AFC).
In conjunction with the termination of the AAAC and AFC, the final minutes
from each of these committees required approval as follows:
AAAC – September 24, 2015
AFC – February 19, 2015
After discussion, Mr. Brown made a motion to approve the Committee Policy
and Procedure, as amended. Mr. Hass seconded the motion, which was
unanimously approved by the Board. Messrs. Kingston, Kleinman and Wilson
were absent when the vote was taken.
Mr. Brown made a motion to approve the termination of the Administrative and
Audit Advisory Committee and Actuarial Funding Advisory Committee. Mr.
Ho seconded the motion, which was unanimously approved by the Board.
Messrs. Kingston, Kleinman and Wilson were absent when the vote was taken.
Mr. Brown made a motion to approve the minutes of the final meetings of the
Administrative and Audit Advisory Committee and the Actuarial Funding
Advisory Committee. Mr. Hass seconded the motion, which was unanimously
approved by the Board. Messrs. Kingston, Kleinman and Wilson were absent
when the vote was taken.
b. Staff presented a draft of the Executive Director’s Performance Evaluation
Policy for the Board’s consideration. The draft was reviewed by the Governance
Committee at the April 26, 2016 committee meeting.
Mr. Schutz made a motion to approve the Executive Director’s Performance
Evaluation Policy, as amended, adding that there will be a written
acknowledgement of goals and the evaluation form shall be attached to the
policy. Mr. Mays seconded the motion, which was unanimously approved by
the Board. Messrs. Kingston, Kleinman and Wilson were absent when the vote
was taken.

Regular Board Meeting
Thursday, May 12, 2016
8 of 11
10. Board policies (continued)
c. Staff discussed a possible process for selection of members and formation of the
Investment Advisory Committee, including the level of compensation for
outside investment professionals, and requested feedback from the Board.
Mr. Mays made a motion to amend the Investment Policy Statement to allow
individuals who live or work in any county that contains a portion of the City of
Dallas to be eligible to be appointed to the Investment Advisory Committee. Mr.
Brown seconded the motion, which was passed by the following vote:
For: Brown, Mays, Ho, Schutz, Friar, Hass, Conway
Against: Haben
Absent: Kingston, Kleinman, Wilson
* * * * * * * *
11. Ad hoc committee reports
Mr. Hass, Chair of the Long-Term Financial Stability Sub-committee, and Mr.
Schutz, Chair of the Governance Sub-committee, gave updates on the ad hoc sub-
committees. Mr. Mond reported on the Legal Search Sub-committee.
No motion was made.
* * * * * * * *
12. Board Members’ reports on meetings, seminars and/or conferences attended
Reports were given on the following meetings. Those who attended are listed.
a. State Pension Committee Meeting
Mr. Schutz
b. Society of Pension Professionals
Ms. Wu
c. TEXPERS Secure Retirement for All
Messrs. Friar, Conway, Hass

Regular Board Meeting
Thursday, May 12, 2016
9 of 11
12. Board Members’ reports on meetings, seminars and/or conferences attended
d. Commerce Street Capital: Bank Conference
Messrs. Brown, Haben
e. Wharton: Portfolio Concepts and Management
Messrs. Hass, Conway
f. PRB Meeting
Messrs. Friar, Schutz, Mond, Ms. Gottschalk
No motion was made.
* * * * * * * *
The meeting was recessed at 2:06 p.m.
The meeting was reconvened at 2:11 a.m.
* * * * * * * *
13. Determination of Handicap Status of Dependent Child
The Board went into a closed executive session – medical at 2:11 p.m.
The meeting was reopened at 2:17 p.m.
After discussion, Mr. Brown made a motion to grant survivor benefits under the
provisions of Plan Section 6.06(p). Mr. Mays seconded the motion, which was
unanimously approved by the Board. Messrs. Kingston, Kleinman and Wilson were
absent when the vote was taken.
* * * * * * * *
14. Legal issues
a. Police Officer and Firefighter pay lawsuits
b. Potential claims involving fiduciaries and advisors
c. DROP amendment
The Board went into a closed executive session – legal at 2:19 p.m.

Regular Board Meeting
Thursday, May 12, 2016
10 of 11
14. Legal issues (continued)
Erik Wilson returned at 3:25 p.m.
The meeting was reopened and recessed at 3:55 p.m.
The meeting was reconvened and then went into closed session at 4:01 p.m.
Erik Wilson left at 4:50 p.m.
The meeting was reopened at 5:03 p.m.
No motion was made.
* * * * * * * *
The meeting was recessed at 5:03 p.m.
The meeting was reconvened at 5:09 p.m.
* * * * * * * *
15. Public relations consultant
Mr. Friar discussed public relations services.
After discussion, Mr. Brown made a motion to conduct a search for a public relations
consultant. Mr. Haben seconded the motion, which was unanimously approved by
the Board. Messrs. Kingston, Kleinman and Wilson were absent when the vote was
taken.
* * * * * * * *
D. BRIEFING ITEMS
1. Reports and concerns of active members and pensioners of the Dallas Police
and Fire Pension System
The Board received comments during the open forum.
No motion was made.
* * * * * * * *

Regular Board Meeting
Thursday, May 12, 2016
11 of 11
2. Executive Director’s report
a. Future Education and Business Related Travel
b. Future Investment Related Travel
c. Associations’ newsletters
NCPERS Monitor (May 2016)
TEXPERS Outlook (May 2016)
TEXPERS Pension Observer (Spring 2016)
The Executive Director’s report was presented. No motion was made.
* * * * * * * *
Ms. Gottschalk stated that there was no further business to come before the Board. On a motion
by Mr. Conway and a second by Mr. Brown, the meeting was adjourned at 5:57 p.m.
_______________________ Samuel L. Friar
Chairman
ATTEST:
_____________________ Kelly Gottschalk
Secretary

DISCUSSION SHEET
Regular Board Meeting – Thursday, June 9, 2016
ITEM #D1
Topic: Equity structure study
Attendees: Rhett Humphreys, CFA, Partner Keith Stronkowsky, CFA, Senior Consultant
Discussion: The strategic asset allocation approved at the March 10, 2016 Board meeting established a 20% target allocation to global equity and a 5% target allocation to emerging markets equity. Staff and NEPC will present the equity structure study, which will explain the build out of the global equity and emerging markets portfolios. Discussion will include rationale, recommendations of managers to retain or liquidate, and expected timeline to complete.
Staff Recommendation: Approve liquidating the Pyramis investment and allocating the proceeds as set forth in the
equity structure study.

Dallas Police & Fire Pension System Global Equity Structure Study & Recommendations
May 12, 2016
Rhett Humphreys, CFAPartner
Keith Stronkowsky, CFASenior Consultant
Jeff MarkarianSenior Research Consultant – Global Equity Markets

• DPFP recently adopted a new long-term strategic Asset Allocation at the March 10th, 2016 meeting
• Within the liquid Equity portfolio the new Asset Allocation includes:– Changes to existing asset classes and their target weights– Introduction of targets for new asset classes
• Objectives include increased diversification and plan liquidity
Overview
Asset ClassNew Target Current
Weight* ~Current $* ~Target $*
Global Equity 20.0% 15.4% $421m $546m
Emerging Markets Equity 5.0% 0.0% $0m $136m
Total Public Equity 25.0% 15.4% $421m $682m
*Estimated values as of 4/15/16 provided by DPFP staff and after proposed rebalancing in the month of April. Current weight and target $ based on NAV of DPFP.Target $ will depend on market movements and timing of implementation.Ranges established around new target weights (e.g., range for Global Equity is 10% - 23%).
1
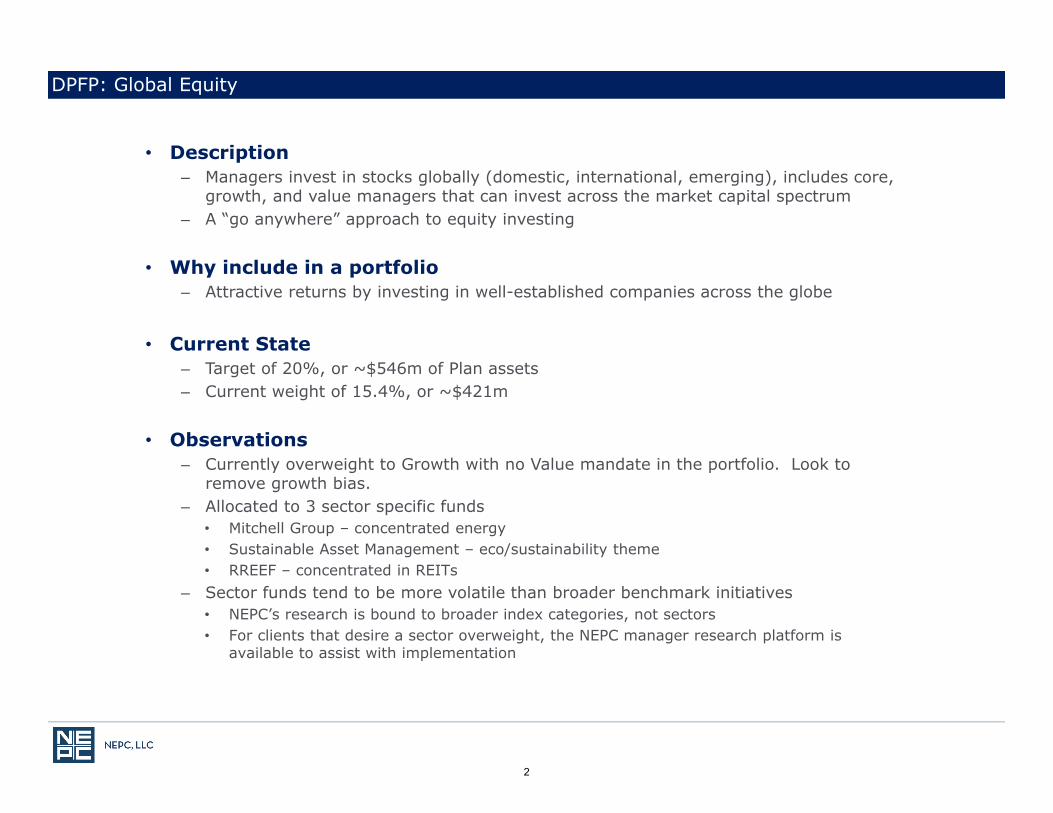
• Description– Managers invest in stocks globally (domestic, international, emerging), includes core,
growth, and value managers that can invest across the market capital spectrum– A “go anywhere” approach to equity investing
• Why include in a portfolio– Attractive returns by investing in well-established companies across the globe
• Current State– Target of 20%, or ~$546m of Plan assets– Current weight of 15.4%, or ~$421m
• Observations– Currently overweight to Growth with no Value mandate in the portfolio. Look to
remove growth bias.– Allocated to 3 sector specific funds
• Mitchell Group – concentrated energy • Sustainable Asset Management – eco/sustainability theme• RREEF – concentrated in REITs
– Sector funds tend to be more volatile than broader benchmark initiatives • NEPC’s research is bound to broader index categories, not sectors• For clients that desire a sector overweight, the NEPC manager research platform is
available to assist with implementation
DPFP: Global Equity
2

• Implementation– Currently underweight relative to target allocation
– Implement a Core-Satellite approach
– Core Holdings:• Build out a stable of managers with broad and balanced exposure across Value and Growth• Maintain mandates with existing two Global Growth managers (OFI & Walter Scott)• Retain two new Global Value managers – Boston Partners & Manulife• NEPC’s recommendation to the Board to retain the two new managers is supported by
NEPC’s research, a Global Equity Search Book, and discussions with the Investment Staff• Structural balance across the four managers of roughly 25% to each
– Satellite Positions:• These holdings could include investments in areas such as specific themes (e.g., consumer
discretionary, energy, small cap)• We will revisit this portion of the portfolio at a later time
– Utilize funds from Illiquid assets (e.g., Private Equity, Real Estate) as a funding source as they become available
• NEPC’s assumed return: 7.23%• NEPC’s assumed risk: 17.95%
DPFP: Global Equity (con’t)
*Based on NEPC ‘s 2016 Capital Market outlook and assumptions. Risk and return assumptions are 5-7 year annualized forecasts.
3

• Description– Invest in stocks of developing countries (classified by economic development,
size/liquidity, and market accessibility criteria)– Characteristics typically include markets that are experiencing rapid economic growth,
developing legal and professional infrastructure, and increased consumer spending– Managers add value through superior stock, sector and country selections, avoiding
submerging countries (i.e. political risk), managing trading costs and liquidity
• Why include in a portfolio– Highest expected return of any public equity class– Low(er) correlation to a diversified portfolio
• Current State– Target of 5%, or ~$136m of Plan assets– No assets currently invested
• Implementation– Recommend hiring 2-3 managers in the space, with a dual mandate of broad core
exposure, and dedicated exposure to smaller cap and/or consumer focused equity mandates
• NEPC’s assumed return: 9.75%• NEPC’s assumed risk: 27.00%
DPFP: Emerging Markets Equity
*Based on NEPC ‘s 2016 Capital Market outlook and assumptions. Risk and return assumptions are 5-7 year annualized forecasts.
4

1
MEMORANDUM
Date: June9,2016 To: DPFPBoardFrom: DPFPInvestmentsStaff Subject: GlobalEquityStructure Recommendation
A. Staff recommends approving allocations to Boston Partners and Manulife Asset Management global equity strategies.
B. Staff recommends liquidating the Pyramis position and allocating the proceeds according to the equity structure below.
SummaryofProposedGlobalEquityPortfolioStructure

2
Background AttheMarch10,2016Boardmeeting,theBoardapprovedastrategicassetallocationpolicywithatargetallocationtoPublicEquityof25%,comprisedofa20%targettoglobalequityand5%toemergingmarkets.
DPFPhasemployedaglobalapproachtopublicequitymarketsformanyyears,withthegoalofoutperformingtheMSCIACWIindexonarisk‐adjustedbasis.Thegeneralconsultant,NEPC,stillviewsthisglobalimplementationfavorablygoingforward.However,NEPChasalsomadethefollowingobservationsaboutthecurrentpublicequityportfolio:
OverweighttoGlobalGrowth UnderweighttoEmergingMarketsandnodedicatedEmergingMarketsEquitymandate
Thesestructuralbiaseshavebenefittedperformanceduringthelastsixyearsinamarketenvironmentthatfavoredgrowthstocksandwhereemergingmarketsunderperformeddevelopedmarkets.However,inconsiderationoflongtermforwardexpectedreturnprojections,theglobalequityportfolioshouldbere‐structured.
CurrentAllocationAnalysis:
ComparedtotheglobalstockmarketindexMSCIACWIbenchmark,thecurrentpublicequityallocationhasthesecharacteristics(asof03‐31‐2016):
o UnderweighttoEmergingMarkets:1.8%allocationvs.9.8%allocationo GrowthBias:
P/E(PricetoEarnings)23.6vs.20.2 P/B(PricetoBook)4.2vs.3.2 P/S(PricetoSales)3.8vs.2.7
Growthvs.Value
Growthandvaluearetwodifferentfundamentalapproachesinstockselection.Growthinvestorstypicallylookforstocksofcompaniesthatofferstrongearningsgrowthpotential,whilevalueinvestorslookforstocksthatappearundervaluedbythemarketplace.Valuestocksarepricedlowerthanthebroadermarketandbelowsimilarcompaniesintheirindustries.ThisisprimarilymeasuredbythePricetoEarnings(P/E)ratio,thePricetoBook(P/B)ratio,andthePricetoSales(P/S)ratio.

3
Despitetherecentperiodofgrowthstocksoutperformingvaluestocks,thereissubstantialresearchshowingthatvalueoutperformsgrowthovertime.Asshowninthechartsbelow,valuehashistoricallyoutperformedgrowthovertrailing10‐yearperiods,andgrowthhasonlybeatenvaluesixtimessince1945.
20%GlobalEquityStructure–core/satelliteapproach
Theglobalequitystructurewouldconsistofaglobalequitycoreallocationcomprisingaround60%oftheallocationandabout40%dedicatedtofivesatelliteinvestmentmanagers(8‐10%each).
TheglobalequitycoreallocationseekstooutperformtheMSCIACWIindexonarisk‐adjustedbasis,achievingriskequaltoorslightlylowerthantheMSCIACWIwithhigherreturns.Thesatellitemanagerswouldbefocusedonachievingcomparablereturnswithlowercorrelationstotheindex.Thisstructureshouldconstructaglobalequityportfoliothatoutperformstheindexwithlowerriskthantheindex.
GlobalEquityCore
ThecurrentallocationperformancecanbeimprovedbycombiningvaluemanagerswithOFI,asolid‐performinggrowthmanager,andWalterScott,aconcentrated,qualityfocused

4
growthmanager.ThisisconsistentwithNEPC’srecommendationtocorrecttheoverweighttoglobalgrowth.GlobalEquityCoreStructureStaff,inconsultationwithNEPC,hasinterviewed,researched,andmodelledanumberofinvestmentmanagersandbelievesanequallyweightedcombinationofOFI(Growthmanager),WalterScott(Growthmanager),BostonPartners(Valuemanager),andManulifeGlobal(Valuemanager)tobetheoptimalcombinationtoachievetheportfoliogoals.TheexistingcoreglobalequitymanagerPyramiswasalsoevaluated,butdetractedfromtheoptimalprofileachievedbytheabovecombination.Thiscombinationproducesadiversifiedportfoliothatshouldperformwellindifferentmarketenvironmentsbycapitalizingondifferentriskpremiums.OFIisfocusedonthegrowthpremium,WalterScottcapturesthequalitypremium,BostonPartnerscapturesthevalueandmarketcappremiumsbyprovidingexposuretosmallandmid‐capvaluestocks,andManulifeisfocusedonthevaluepremiuminlargecapstocks.
CorrectingthegrowthbiasThebelowchartshowstheequalweightportfolio,throughadditionofvaluemanagers,mostlyeliminatesthegrowthbiasforabetterbalanceofgrowthandvalue,andproducesamarketcapitalizationandstyleweightingthatissimilartotheMSCIACWI.
MSCIACWI EqualWt.Portfolio(25%OFI,25%WalterScott,25%BostonPartners,25%Manulife)

5
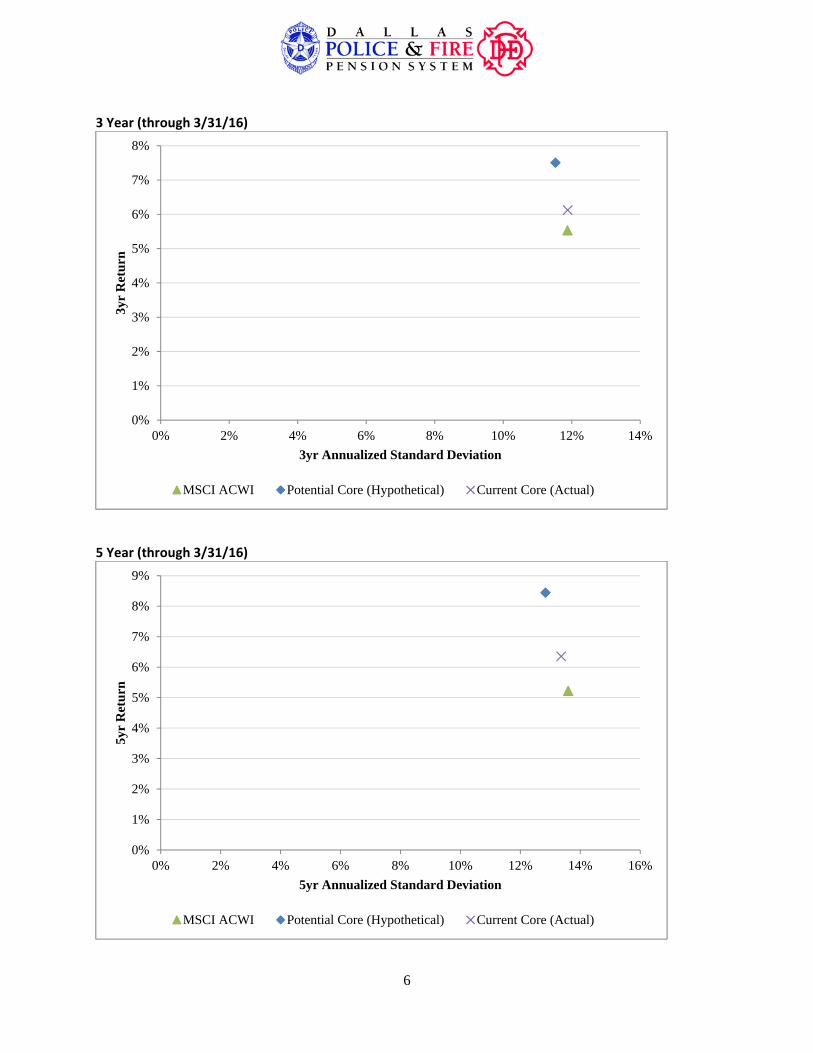
Improvedrisk‐adjustedperformanceThefollowingchartsillustratetheimprovedrisk/returnprofileoftheproposedcombination.Historically,theequalweightportfolioachievessubstantiallyhigherreturnswithlowerriskthanboththecurrentcoreequitymanagerallocationandtheMSCIACWIbenchmark.
Legend:
CurrentCore(Actual)=Existingcoremanagers[OFI,WalterScott,Pyramis]combinedperformanceusingactualweightallocationsoverthetimeperiodPotentialCore(Hypothetical)=Proposedcoremanagers[OFI,WalterScott,BostonPartners,Manulife]usingequalweightallocationsovertimeperiodMSCIACWI=MSCIAllCountryWorldIndex
1 Year (through 3/31/16)
-6%
-5%
-4%
-3%
-2%
-1%
0%0% 2% 4% 6% 8% 10% 12% 14% 16% 18%
1yr
Ret
urn
1yr Annualized Standard Deviation
MSCI ACWI Potential Core (Hypothetical) Current Core (Actual)
6
3 Year (through 3/31/16)
5 Year (through 3/31/16)
0%
1%
2%
3%
4%
5%
6%
7%
8%
0% 2% 4% 6% 8% 10% 12% 14%
3yr
Ret
urn
3yr Annualized Standard Deviation
MSCI ACWI Potential Core (Hypothetical) Current Core (Actual)
0%
1%
2%
3%
4%
5%
6%
7%
8%
9%
0% 2% 4% 6% 8% 10% 12% 14% 16%
5yr
Ret
urn
5yr Annualized Standard Deviation
MSCI ACWI Potential Core (Hypothetical) Current Core (Actual)

7
Performance
Thischartshowstheannualizedreturnsovermultipletimeperiods.Theequalweightportfoliooutperformsacrosstimeperiods,andhasabattingaverage(percentageofmonthsbeatingtheindex)of69.3%,whichdemonstratesconsistentoutperformancevs.theindex.
MSCIACWI EqualWt.Portfolio(25%OFI,25%WalterScott,25%BostonPartners,25%Manulife)
ReducedDrawdowns
Onekeytoachievingbetterportfolioperformanceovertimeisreducingthelengthandseverityofdrawdowns,orperiodsofnegativereturns.Thebelowanalysisshowstheequalweightportfolioprovideddownsideprotectionbyreducingthisdrawdownrisk.
MSCIACWI EqualWt.Portfolio(25%OFI,25%WalterScott,25%BostonPartners,25%Manulife)
[Chartfollowsonnextpage]

8
Cumulativeexcessreturns
Theresultoftheimprovedrisk/returnprofile,consistentperformance,andreduceddrawdownsiscumulativeexcessreturnsabovethebenchmarkovertime.

9
GlobalEquitySatelliteManagersThecurrentequitysatellitemanagers(EagleAssetManagement,MitchellGroup,SustainableAssetManagement,RREEF)aimtocontributetotherisk/returnprofileoftheequityportfoliobyprovidinglesscorrelatedreturnsbasedonconcentratedsectorexposures.Eagleisadomesticsmallcapmanager,RREEFinvestsinglobalREITS,andSustainableAssetManagementfocusesonawater‐relatedequitystrategy.MitchellGroup,anenergymanager,hasconsistentlybeatenitsenergy‐focusedbenchmarkovertime,andshouldcontributetoreturnsastheenergysectorrecovers.
Thecurrentequitysatellitemanagerswillbeanalyzedandevaluatedalongwithpotentialnewinvestmentmanagersinordertoachieveanoptimalstructureoverthenextseveralmonths.
5%EmergingMarketsStructure–core/satelliteapproach
Emergingeconomiesareexpectedtogrowtwotothreetimesfasterthandevelopednations,accordingtoInternationalMonetaryFundestimates.Economicgrowthispredominantlyafunctionoftwofactors:populationgrowthandproductivity.Emergingmarketcountriesarefavorablypositioneddemographically,withgrowingworkingagepopulationsmakinguplargerandlargerpercentagesoftotalpopulation.Thisleadstoagrowingconsumerbase,asmoreofthepopulationisearningandspending.Emergingeconomieshavealsobenefitedfromrapidproductivitygainsthroughimplementationofnewtechnologies.Asimportersoftechnology,itismuchfasterforemergingmarketstoadoptnewtechnologiesthanfordevelopedcountriestoinventthem.Finally,emergingcountrieshavelowerpublicdebtburdensthandevelopedeconomies.Duetotheseunderlyingfundamentals,emergingmarketequitiesareprojectedtoprovidehigherexpectedreturnsinthefuturethandomesticandglobalmarkets.ThebelowgraphisbasedonGMO’sfuturereturnprojections,butvariousdatasourcesincludingJPMorganandNEPCareconsistentinexpectinghigherexpectedreturnsinthefuturefromemergingmarketsequitiesvs.domesticandinternationalequities.
[Chartonnextpage]

10
EmergingMarketsEquityStructure
DPFPcurrentlyhasnodedicatedEmergingMarketsinvestmentmanagers,andisunderweightemergingmarkets.AsofMarch31,2016,thecurrentpublicequityportfoliohadanallocationofonly1.8%toemergingmarkets,comparedtoanMSCIACWIallocationof9.8%emergingmarkets.ConsistentwiththerecentlyapprovedassetallocationandNEPCrecommendation,StaffisevaluatingdedicatedEmergingMarketsequityinvestmentmanagers.Theanticipatedstructurewouldalsobeacore‐satelliteapproach,withacoreEmergingMarketsequitymanagercomprisingthemajorityoftheallocation(approximately3%),pairedwithasatelliteemergingmarketsmanagerthatspecializesinthesmallercapitalizationemergingmarketsstockstogeneratehigher,lesscorrelatedreturns(approximately2%).Staffwillbringproposedinvestmentmanagersforthisstructureinthenextfewmonths.
Summary
Restructuringthepublicequityportfolioasdescribedshouldcreateamorebalancedequityportfoliothatisbetterpositionedforvariousfuturemarketscenarios.Thegrowthbiasislargelyeliminated,andexposuretoemergingmarketsisbeingincreased.Furthermore,thedifferentinvestmentmanagerstyles,portfolios,andrelativelylowcorrelationsincombinationproduceacoreglobalequityportfoliothatprovidesreturnsinexcessoftheMSCIACWIindexbenchmarkwithlowerlevelsofrisk.

11
Theproposedglobalequityportfoliostructure,showingcurrentandanticipatedallocations,isrepeatedbelowforconvenience.
SummaryofProposedGlobalEquityPortfolioStructure
Process
Staffconductedthefollowingactivitiesinpreparationforthisrecommendation:
Analysisofcurrentequityportfolioriskandperformance Analysisofapproximately20potentialinvestmentmanagerssourcedviaNEPCandStaff On‐sitemeetingswithpotentialequitymanagersinNewYorkandBoston FollowupandintroductorymeetingsinDPFPoffices ReviewandanalysisofNEPCGlobalEquitysearchbook ModellingofpotentialandcurrentmanagerportfoliosusingMaplesmodels ModellingandanalysisofpotentialandcurrentmanagerportfoliosusingZephyr Modellingandanalysisincluded,butwasnotlimitedtothefollowing:
o StyleMapanalysiso Returnsrankingo Variousmarketenvironmentperformancerankings

12
o QuartilerankingsineVestmentuniverseo Alphacorrelationso CorrelationsbetweenmanagersandACWIo Statisticalanalysisandcomparisonso Holdingsoverlapanalysis
MultipleconsultationswithNEPC MultipleconsultationswithBostonPartnersandManulife

DISCUSSION SHEET
Regular Board Meeting – Thursday, June 9, 2016
ITEM #D2
Topic: Boston Partners
Attendees: Chris Hart, CFA, Senior Portfolio Manager David Gullen, CFA, CAIA, Relationship Manager
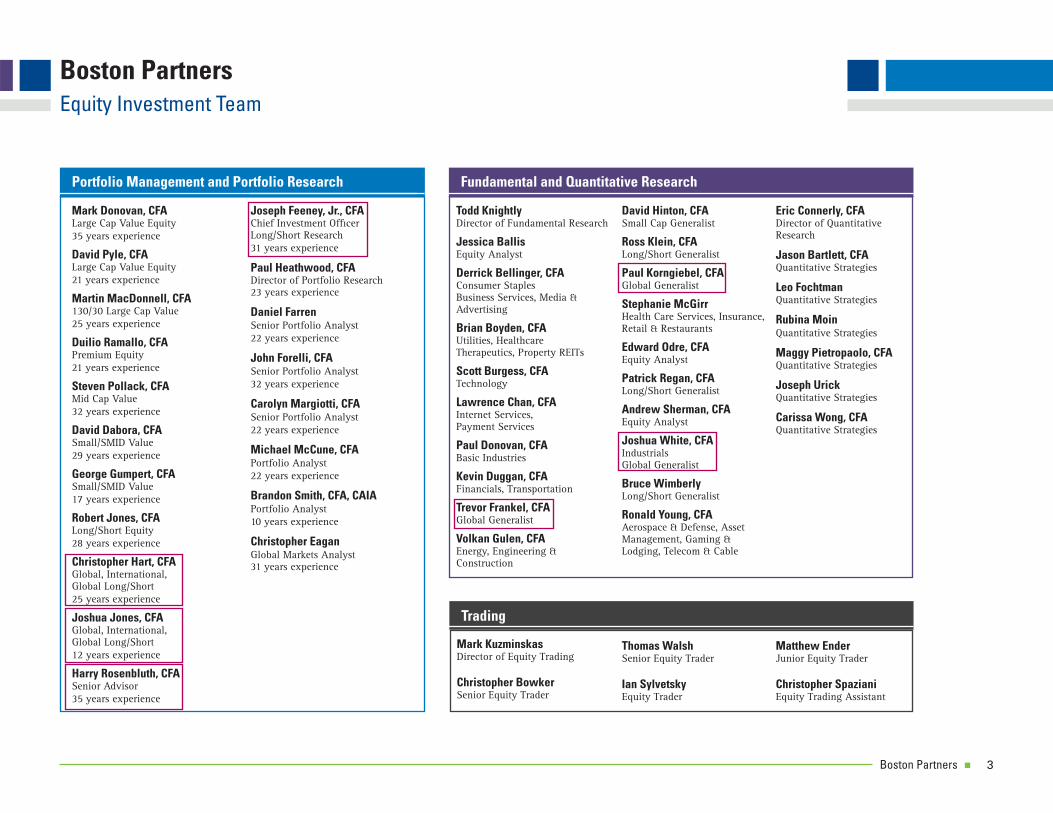
Discussion: As part of the equity structure study, Staff and NEPC presented the rationale for adding a value oriented investment manager to the global equity portfolio. Boston Partners will present an overview of their firm and global equity product. Boston Partners, a wholly owned subsidiary of the Robeco Groep, N.V., was established in 1995 by a group of key investment professionals who follow an investment approach they developed working together in the 1980’s. Boston Partners has $75.6 billion in assets under management, with 146 employees, of which 50 are investment professionals. The firm operates out of offices in Boston, New York, and California.
Staff Recommendation: Approve an initial investment of $80 million in the Boston Partners global equity strategy,
and authorize the Executive Director to negotiate and execute documentation, and perform all necessary acts and exercise all appropriate discretion to facilitate this investment.

1
INVESTMENT RECOMMENDATION
Date: June9,2016 To: DPFPBoardFrom: InvestmentStaff Subject: BostonPartnersGlobalEquityRecommendation
Staffrecommendsapprovinganinvestmentof$80milliontoBostonPartnersGlobalEquityaspartoftheequitycoreallocation.
ExecutiveSummary
Aspartof theGlobalEquitystructurestudy,Staff recommendshiringBostonPartnersasavaluemanagerintheequitycoreallocation.
Personnel
BostonPartnerskeyinvestmentprofessionalshaveworkedtogethersincethefoundingofthefirmin1995.Theglobalinvestmentteamhastwoportfoliomanagers,threededicatedanalysts,andasenioradvisor.Theteamalsohasaccesstothefirm’steamofover20analysts,whoarespecializedbysector.ChrisHart,portfoliomanager,hasmanagedGlobalEquitysince2008.
PortfolioandInvestmentStrategy
BostonPartnersfollowsafundamental,bottom‐upapproachthatanalyzesstocksonvaluation,fundamentals,andmomentumusingbothqualitativeandquantitativeinputs.Investmentsarebased on attractive value characteristics, strong business fundamentals, and a catalyst forchange. Selldecisionsarebasedonappreciationtopricetarget,weakeningfundamentals,orreverse of momentum. This results in a flexible, all capitalization portfolio of best ideasdiversifiedacrossmarketcapitalization,region,andindustrysector.
70‐135positions Minimummarketcap$250millionUSD Unhedgedlocalcurrency
RiskControls
5%maximumpositionlimit 35%sectorlimit

2
Notrackingerrorlimit Currency/sector/regionexposuredrivenbysecurityselection
Process
QuantitativeAnalysis: Sorts the10,000+ investmentuniverseona statistical ranking thatconsiders valuationmultiples of earnings, cash flow, book value,momentummetrics likeearningssurprisesorestimaterevisions,andfundamentalmetricslikeoperatingreturnonassets.QualitativeFundamentalAnalysis:Validationofpositivecharacteristicsbasedonhistoricalfinancialstatements. Identificationofcatalyst throughresearchfilings,pressreleases,andcompanyvisits.Targetpricedeterminationthroughreal‐timemodels.
Performance
Pricing
Proposedpricingstructure:
0‐$25 million 0.75% $25 ‐ $50 million 0.65% $50‐$100 million 0.55% over $100 million 0.50%

3
FitforDPFPPortfolio
Asdiscussedintheequitystructurestudy,BostonPartnersisanall‐capvalueglobalequitymanager.The investmentwouldbeweightedequallywithOFI,WalterScott, andManulife to comprise theequitycore.

The following pages were extracted for convenience from the NEPC Global Equity Manager Search
March 2016

Investment Firm/Product Profile
Jeff Markarian, Sr. Research ConsultantSource: NEPC and eVestment
May 2015
Boston PartnersBoston Partners Global Equity
Firm DescriptionBoston Partners Asset Management, LLC (BPAM) was founded in 1995 by a group of senior professionals who left their predecessor firm. In 2002, the firm was acquired by Robeco Investment Management (Robeco), and managed assets under the Robeco name as Robeco Boston Partners. Robeco is the U.S. asset management arm of global fund manager Robeco Groep, N.V. (Robeco Group). In 2013, Robeco Group’s parent, Rabobank Group, sold 90.01% of Robeco Group to ORIX Corporation, a Japanese financial services company; Rabobank retained 9.99% of the equity. In 2015, Robeco Boston Partners was rebranded back to Boston Partners.
NEPC Investment ThesisBoston Partners’ value-added is attributable to their well-established and disciplined process that balances valuation, business fundamentals, and catalyst for change. The strategy is flexible in assessing the presence of the three investment criteria in each idea under review. For instance, they will forego positive momentum if valuation and/or business fundamentals are deemed extremely compelling to compensate for lack of positive momentum. Unlike many of their peers, their approach is stock investing and not buying companies as owners; this allows them to be objective in evaluating opportunities and sell holdings more readily.
PeopleThe global investment team at Boston Partners comprises 2 portfolio managers and 3 dedicated analysts. In addition the team has access to over 20 centralized analysts. Portfolio managers, almost all of whom started out as analysts on the team, are assigned to individual strategies, where they have decision-making authority. Chris Hart has been the sole portfolio manager for Global Equity since June of 2008; his backup is Josh Jones. Industry analysts are responsible for idea generation and research maintenance for all strategies. They operate out of three locations: Boston, Los Angeles, and Greenbrae, CA. The team meets regularly to discuss existing holdings and new ideas.
73

Investment Firm/Product Profile
Boston PartnersBoston Partners Global Equity
PhilosophyRobeco Boston Partners describes three fundamental truths to their investment philosophy: 1) Low valuation stocks outperform high valuation stocks. 2) Companies with strong fundamentals, e.g., high and sustainable returns on invested capital, outperform companies with weak fundamentals. 3) Stocks with positive business momentum, e.g., rising earnings estimates, outperform stocks with negative business momentum. They believe that investing in stocks that exhibit these characteristics should limit downside risk, preserve capital, and maximize the power of compounding.
Investment StrategyRobeco Boston Partners employs a fundamental, bottom-up approach to equity investing. The process is driven by internal fundamental research streamlined by quantitative screening. The investment goal is to seek opportunities that exhibit attractive valuations, strong fundamentals, and improving business momentum. Holdings and ideas are discussed and viewed against these criteria.
Quantitative screening (10% of the research process) identifies companies within the universe that are attractively valued and demonstrate a quantifiable measure of business momentum (e.g. rising earnings estimates).
The investment process begins with quantitative scoring and screening of a broad universe of approximately 8, 000 companies worldwide to cull a target-rich subset universe based on their three criteria. The eligible market capitalization range for Global Equity is all securities greater than $1 billion in market cap. On a weekly basis, a proprietary, multi-factor model ranks each company according to valuation (40%), earnings momentum (40%), and fundamental profitability(20%) characteristics. The output of the model accomplishes two main goals: monitor existing holdings for new data on valuation, profitability and earnings momentum, and identify new ideas. Each candidate’s screening score is validated using customized reporting tools to help them evaluate the company’s financial history. This enables them to efficiently identify bona fide research candidates. Screening results are discussed in team meetings and analysts are assigned fundamental research responsibilities on companies that are held in portfolios as well as new ideas.
74

Investment Firm/Product Profile
Boston PartnersBoston Partners Global Equity
Fundamental research looks beyond the quantitative scores and make informed assessments of a company's valuation, financial condition, and earnings momentum. The analyst is charged with conducting a detailed analysis of the business dynamics supporting a company's current value and prospects for future growth. Valuation analysis includes traditional metrics like P/E and P/B, as well as non-traditional metrics line P/CF, EV/Sales (cyclical stocks); assessment is considered versus the company’s own history and peers and a discount is required. In addition, the analysis seeks strong business fundamentals and improving business trends; operating return on operating assets (OROA) is particularly important to understanding business growth and profitability. Finally, the analyst determines whether the business is improving and there is an identifiable catalyst that will drive the stock price toward fair value.
The analyst is responsible for recommending buy ideas along with respective target prices to portfolio managers on appropriate strategies. Merits of each of the investment criteria are discussed and debated. The portfolio manager makes the ultimate investment decision based on his comfort level with the analyst’s investment case as well as portfolio diversification.
Once in the portfolio analysts continue to monitor holdings and reassess target prices as necessary. If the covering analyst determines that a change in the company's business dynamics warrants a revision, the target price will be adjusted. In addition, the portfolio manager monitors the characteristics of the holdings and overall portfolio to ensure that the portfolio is more attractively valued and fundamentally stronger versus the MSCI World Index. The sell discipline is triggered when a stock reaches fair value or due to an adverse change in fundamentals or business momentum.
75

Investment Firm/Product Profile
Boston PartnersBoston Partners Global Equity
PortfolioThe strategy is a developed market portfolio, but has ranged from 07% invested within the emerging markets. Boston Partners would prefer to be benchmarked to the MSCI World Index. Since the strategy is supported by the centralized research platform, there will be roughly 30% overlap with the US All Cap portfolio run at Boston Partners. The portfolio is truly all cap in nature and has been as high as 18% in small cap as defined by below $2 billion in market cap. Active share in the portfolio will typically be above 90% and the final portfolio will consist of roughly 100 names.
Performance ExpectationsThe strategy should outperform in most fundamental markets. Their flexible valuation approach should mitigate significant shortfalls due to any one metric being punished by the market. Conversely, in markets focused on a narrow number of valuation criteria (e.g., traditional value), they could struggle to keep up. Given the strategy’s bias to high-quality companies with strong fundamentals, they should protect well in down markets. Relative to the other downside capture managers in the book Boston Partners has shown the ability to better capture upside.
76

Biographies of Key Professionals
Boston PartnersBoston Partners Global Equity
Chris Hart, Portfolio ManagerChris Hart, who has managed the Robeco Boston Partners Global Premium Equities Fund since July 2008, has 22 years of experience in asset management, research and finance. Based in Boston, he is a portfolio manager for the global and international equity products. Prior to this he was an assistant portfolio manager for the firm’s small cap value products for three years. He joined Robeco from Fidelity Investments, where he was a research analyst specializing in conglomerates, engineering and construction, building, machinery, aerospace and defense, and real estate investment trusts (REITs). He holds a bachelor’s degree in finance, focusing on corporate finance, from Clemson University in South Carolina. He also holds the Chartered Financial Analyst (CFA) designation.
77

June 9, 2016
Boston Partners Global Equity
Prepared for Dallas Police & Fire Pension System
Christopher K. Hart, CFASenior Portfolio [email protected](617) 832-8211
David J. Gullen, CFA, CAIARelationship [email protected](415) 464-2893

Boston Partners 1
Boston PartnersProfi le: March 31, 2016
* Key investment professionals have worked together since the founding of Boston Partners in 1995 and years before at a prior fi rm, where the investment philosophy was established.
Disciplines Assets ($ Millions)
Large Cap Value $29,774
Premium Equity (All Cap Value) $10,271
Mid Cap Value $18,401
Small Cap/Small Cap II/Small-Mid Cap $3,306
Domestic Long/Short $8,919
Global/International Equity $3,476
Global Long/Short $1,452
Value equity expertise founded in the early 1980s*
Consistent and repeatable investment philosophy across all disciplines
Integrated bottom-up, fundamental and quantitative research
Expertise of a boutique with the depth of aglobal fi rm
Investment Profi le $75.6 Billion Assets Under Management

Boston Partners 2
Boston PartnersRelative Performance through March 31, 2016
1 Inception dates are as follows: Large Cap Value is June 1, 1995; Premium Equity is June 1, 1995; Mid Cap Value is May 1, 1995; Small/Mid Cap Value is April 1, 1999; Small Cap Value II is July 1, 1998; Global Equity USA is July 1, 2008; International Equity is July 1, 2008; and Long/Short Research is April 1, 2002.2 The Exposure-Adjusted S&P 500 Index is not an actual index. It is a hypothetical index created with the benefi t of hindsight by multiplying the average monthly net exposure of the BP Long/Short Research by the actual S&P 500 Index return for the same period. Average Exposure is as follows: 1 Year at 48.80%; 3 Year at 48.78%; 5 Year at 50.41% 7 Year at 49.59%; 10 Year at 46.53%; and Since Inception at 43.15%.Performance is supplemental to the GIPS® compliant presentation herein. Relative performance refl ects composite results versus noted benchmark and individual portfolio results will vary. Past performance is not an indication of future results. Please refer to the appendix for other important disclosures.
Relative Performance - Gross of Fees (%)
1Year
5Year
3Year
7Year
10Year
SinceInception
Large Cap Value vs. Russell 1000® Value Index 1.44-2.76 0.29 0.69 0.43 1.91
Premium Equity vs. Russell 3000® Value Index 3.790.42 3.38 1.64 1.46 3.45
Mid Cap Value vs. Russell Midcap® Value Index 2.271.79 3.91 2.52 1.85 3.99
Small/Mid Cap Value vs. Russell 2500™ Value Index 1.33-0.37 1.18 1.41 1.54 1.54
Small Cap Value Equity II vs. Russell 2000® Value Index 4.833.09 2.98 3.21 4.44 3.36
Global Equity USA vs. MSCI World Index 2.301.14 2.23 2.39 2.34 -
International Equity vs. MSCI EAFE Index 2.142.92 2.87 3.58 3.08 -
Long/Short Research vs. S&P 500 Index (Exposure Adjusted) 0.74 2.55 3.18 3.19 5.04 5.31
1
2
Global Equity USA vs. MSCI ACWI Index 2.05 3.54 3.72 2.94 2.94
Boston Partners 3
Boston PartnersEquity Investment Team
Mark Donovan, CFALarge Cap Value Equity35 years experience
David Pyle, CFALarge Cap Value Equity21 years experience
Martin MacDonnell, CFA130/30 Large Cap Value25 years experience
Duilio Ramallo, CFAPremium Equity21 years experience
Steven Pollack, CFAMid Cap Value32 years experience
David Dabora, CFASmall/SMID Value29 years experience
George Gumpert, CFASmall/SMID Value17 years experience
Robert Jones, CFALong/Short Equity28 years experience
Christopher Hart, CFAGlobal, International, Global Long/Short25 years experience
Joshua Jones, CFAGlobal, International, Global Long/Short12 years experience
Harry Rosenbluth, CFASenior Advisor 35 years experience
Portfolio Management and Portfolio Research
Todd KnightlyDirector of Fundamental Research
Jessica BallisEquity Analyst
Derrick Bellinger, CFAConsumer StaplesBusiness Services, Media & Advertising
Brian Boyden, CFAUtilities, Healthcare Therapeutics, Property REITs
Scott Burgess, CFATechnology
Lawrence Chan, CFAInternet Services,Payment Services
Paul Donovan, CFABasic Industries
Kevin Duggan, CFAFinancials, Transportation
Trevor Frankel, CFAGlobal Generalist
Volkan Gulen, CFAEnergy, Engineering & Construction
David Hinton, CFASmall Cap Generalist
Ross Klein, CFALong/Short Generalist
Paul Korngiebel, CFAGlobal Generalist
Stephanie McGirrHealth Care Services, Insurance, Retail & Restaurants
Edward Odre, CFAEquity Analyst
Patrick Regan, CFALong/Short Generalist
Andrew Sherman, CFAEquity Analyst
Joshua White, CFAIndustrialsGlobal Generalist
Bruce WimberlyLong/Short Generalist
Ronald Young, CFAAerospace & Defense, Asset Management, Gaming & Lodging, Telecom & Cable
Fundamental and Quantitative Research
Mark KuzminskasDirector of Equity Trading
Christopher BowkerSenior Equity Trader
Trading
Joseph Feeney, Jr., CFAChief Investment Offi cerLong/Short Research 31 years experience
Paul Heathwood, CFADirector of Portfolio Research23 years experience
Daniel FarrenSenior Portfolio Analyst22 years experience
John Forelli, CFASenior Portfolio Analyst32 years experience
Carolyn Margiotti, CFASenior Portfolio Analyst22 years experience
Michael McCune, CFAPortfolio Analyst22 years experience
Brandon Smith, CFA, CAIAPortfolio Analyst10 years experience
Christopher EaganGlobal Markets Analyst31 years experience
Eric Connerly, CFADirector of QuantitativeResearch
Jason Bartlett, CFAQuantitative Strategies
Leo FochtmanQuantitative Strategies
Rubina MoinQuantitative Strategies
Maggy Pietropaolo, CFAQuantitative Strategies
Joseph UrickQuantitative Strategies
Carissa Wong, CFAQuantitative Strategies
Thomas WalshSenior Equity Trader
Ian SylvetskyEquity Trader
Matthew EnderJunior Equity Trader
Christopher SpazianiEquity Trading Assistant

Boston Partners 4
Boston PartnersValue Equity Investment Philosophy: Three Core Principles
Value Discipline anchored in Three "Fundamental Truths":
• Low valuation stocks outperform high valuation stocks
• Companies with strong fundamentals (high returns on invested capital) outperform companies with poor fundamentals
• Stocks with positive business momentum (improving trends/rising earnings)outperform stocks with negative momentum
"Characteristics-Based" Investment Approach:
• Valuation, fundamentals and momentum are analyzed using a bottom-upblend of qualitative and quantitative inputs
Preservation of Capital:
• Laws of compounding mathematically dictate that protecting capitalis the only risk that matters
• “Win by not losing": Keep pace in rising markets, outperform in fallingmarkets and diversify your exposure

Boston Partners 5
Boston Partners"Three Circle" Stock Selection Criteria
We buy stocks that exhibit:
• Attractive value characteristics
and,
• Strong business fundamentals
and,
• Catalyst for change
We sell stocks based on:
• Valuation: Appreciation to price target
or
• Weakening business fundamentals
or
• Reversal of momentum
Portfolios with all three characteristics tend to outperform over time
BUSINESSFUNDAMENTALS
What are webuying?
VALUATIONHow much are
we paying?
BUSINESS MOMENTUMIs the business getting
better, staying the same,or getting worse?

Boston Partners 6Boston Partners 6
Boston Partners Global EquityPortfolio Construction and Guidelines
Global Equity:
• Highly fl exible all-cap portfolio of best ideas diversifi ed across market capitalization, region, industry sector.
- 70-135 names
- Minimum Market Cap = U.S. $250 mm
- Unhedged local currency
• Bottom-up construction based on "characteristics that work":
- Value
- Fundamentals
- Positive business momentum
Guideline Parameters:
• No holding shall represent more than 5% of the market value of the account
• No more than 35% in any one sector (internal control)
• Currency/sector/region exposure driven by security selection
• Tracking error driven by security selection. No set tracking error limit
Boston Partners 7
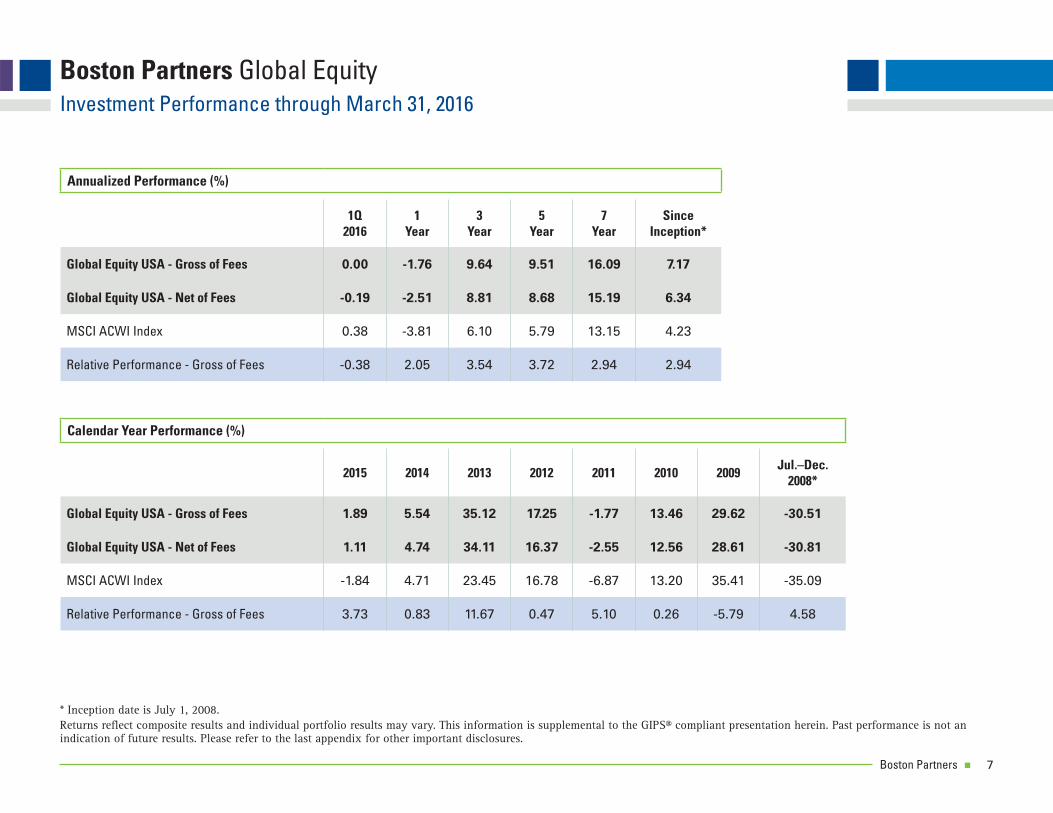
Boston Partners Global EquityInvestment Performance through March 31, 2016
Calendar Year Performance (%)
2015 2014 2013 2012 2011 2010 2009 Jul.–Dec.2008*
Global Equity USA - Gross of Fees 1.89 5.54 35.12 17.25 -1.77 13.46 29.62 -30.51
Global Equity USA - Net of Fees 1.11 4.74 34.11 16.37 -2.55 12.56 28.61 -30.81
MSCI ACWI Index -1.84 4.71 23.45 16.78 -6.87 13.20 35.41 -35.09
Relative Performance - Gross of Fees 3.73 0.83 11.67 0.47 5.10 0.26 -5.79 4.58
Annualized Performance (%)
1Q2016
1Year
3Year
5Year
7Year
Since Inception*
Global Equity USA - Gross of Fees 0.00 -1.76 9.64 9.51 16.09 7.17
Global Equity USA - Net of Fees -0.19 -2.51 8.81 8.68 15.19 6.34
MSCI ACWI Index 0.38 -3.81 6.10 5.79 13.15 4.23
Relative Performance - Gross of Fees -0.38 2.05 3.54 3.72 2.94 2.94
* Inception date is July 1, 2008.Returns refl ect composite results and individual portfolio results may vary. This information is supplemental to the GIPS® compliant presentation herein. Past performance is not an indication of future results. Please refer to the last appendix for other important disclosures.

Boston Partners 8
Boston Partners Global EquityPerformance Traits throughout the Market's Cycles: as of March 31, 2016
1 Inception Date is July 1, 2008.2 Average wins applies to the months of out performance. Returns refl ect composite results and individual portfolio results may vary. This information is supplemental to the GIPS® compliant presentation herein. Past performance is not an indication of future results. Please refer to the last appendix for other important disclosures.
Global Equity Has Preserved Capital and Compounded Returns for Favorable Since Inception1 Performance
Percentage of time that the Global Equity Composite has outperformed the MSCI All Country World Index
• There have been 42 months in which the market has produced a negative return.
• Composite has outperformed the Index 64% of the time.
• There have been 51 months in which the market has produced a positive return.
• Composite has outperformed the Index 65% of the time.
• The entire period is 93 months.
• Composite has outperformed the Index 65% of the time.
"Down" Markets "Up" Markets Entire Period
Risk Measures
CurrentActive Share
5 Year Risk Measures
Beta Std Dev Sharpe Ratio Up Capture Down Capture
Global Equity 85% 1.0 13.6 0.7 108% 88%
MSCI All Country World Index — — 13.7 0.4 100% 100%
64% 65% 65%
Avg. Win2
41 bp/month
Avg. Win2
7 bp/month
Avg. Win2
23 bp/month

Boston Partners 9
Boston Partners Global EquitySteadfast Investment Characteristics: March 31, 2016
Data from December 2011 through March 2016. The inception date of BP Global Equity is July 1, 2008.OROA: Operating Return on Operating Assets. Portfolio characteristics are from a representative account in the composite and are subject to change. Individual portfolio characteristics may vary. Please refer to the last appendix for other important disclosures.
8
10
12
14
16
2011 2012 2013 2014 2015 YTD 2016
Pric
e/Ea
rnin
gs F
Y1 (x
)
Global Equity MSCI ACWI Index
18
22
26
30
34
38
2011 2012 2013 2014 2015 YTD 2016
5 Ye
ar O
ROA
(%)
Global Equity MSCI ACWI Index
Price Discipline: Price/Earnings
Bias for Quality: OROA (5-Year Median)

Boston Partners 10
Boston Partners Global EquityRegional Weightings Through Time – Result of the Bottom-up Process
Regional weightings are based upon a representative account in the composite and are subject to change. Individual portfolio results may vary.This information is supplemental to the GIPS® compliant presentation herein. Please refer to the last appendix for other important disclosures.
Historical Market Weight Range
March 2011 – March 2016
MSCI ACWI Index Positioning as of March 31, 2016
Global Equity Positioning as of March 31, 2016
44%—62%
7%—9%
48%—57%
1%—9%
13%—25%
6%—8%
8%—20%
15%—18%
4%—13%
1%—5%
7%—11%
7%—9%
2%
4%
18%
8%
56%
6%
7%
2%
16%
62%
8%
8%

Boston Partners 11
Boston Partners Global EquityPortfolio Characteristics: March 31, 2016
5
1 FCF Yield is reported as median excluding fi nancials.2 Asset Turnover.3 Operating Return on Operating Assets.4 Weighted average momentum score for the portfolio as scored by the Boston Partners Quantitative Research Team.Portfolio characteristics are based upon a representative account in the composite and are subject to change. Individual portfolio characteristics may vary. Please refer to the last appendix for other important disclosures.
Wtd.Average Median
Global Equity $77.4 B $21.8 B
MSCI ACWI Index $87.2 B $8.3 B
Market Capitalization
"Three Circles"
An attractive valuation, strong business
fundamentals, and positive business momentum.
Portfolios with all three characteristics tend to
outperform over time.
BUSINESS
FUNDAMENTALS
BUSINESS MOMENTUM
VALUATION
Global Equity
MSCIACWI
Asset TO2 0.8x 0.6x
ROE (5 Yr) 11.6% 12.6%
OROA3 (5 Yr) 34.7% 27.4
FundamentalsValuation
Global Equity
MSCIACWI
FCF Yield1 5.3% 5.0%
P/E (FY1) 13.4x 14.1x
EV/S 1.4x 1.7x
Global Equity
Momentum Score4 36th Percentile
Business Momentum

Boston Partners 12
Boston Partners Global EquityPortfolio Characteristics (Percent of Portfolio): March 31, 2016
12.0
7.6
5.7
15.8
11.6
15.9
17.2
7.7
1.3
0.0
12.9
10.7
6.5
20.4
11.7
10.5
15.0
4.8
4.0
3.5
Cons. Discretionary
Cons. Staples
Energy
Financials
Health Care
Industrials
Info. Technology
Materials
Telecom. Services
Utilities
Global Equity MSCI ACWI Index
Mega31%
Large40%
Mid22%
Small2%
Mega42%
Large48%
Mid10% Small
0%
Portfolio characteristics are based upon a representative account in the composite and are subject to change. Individual portfolio characteristics may vary. Please refer to the last appendix for other important disclosures.
2015: Small < $1.7 B; Mid $1.7 B - $8.0 B; Large $8.0 B - $57.3 B; Mega > $57.3 B
62.0
17.9
4.1
2.0
7.5
1.7
56.3
15.5
7.5
6.2
6.5
7.8
NorthAmerica
ContinentalEurope
Japan
Pacific(ex-Japan)
UnitedKingdom
EmergingMarkets
Global Equity MSCI ACWI Index
Regional Weightings (%)
Market Capitalization
Sector Weightings (%)
Global Equity MSCI World Index
Wtd. Average Median
Global Equity $77.4 B $21.8 B
MSCI ACWI Index $87.2 B $8.3 B

Boston Partners 13
Boston Partners Global EquityTen Largest HoldingsOne-at-a-Time Decisions, Shared Characteristics: March 31, 2016
Top ten holdings and portfolio characteristics are based upon a representative account in the composite and are subject to change. Individual portfolio characteristics may vary.The specifi c securities identifi ed and described do not represent all of the securities purchased, sold or recommended for advisory clients. It should not be assumed that investmentsin these sectors or securities were or will be profi table. This information is supplemental to the GIPS® compliant presentation herein. Please refer to the last appendix for otherimportant disclosures.
Largest Stock Holdings
Company % of Portfolio
Valuation FundamentalsMomentum
ScoreP/EFY1 P/B FCF Yield OROA
5 YearROE
5 Year
Alphabet Inc. 3.9 18.5x 4.3x 3.2% 72.8% 15.9% 5
Apple Inc. 2.8 10.9 4.7 10.2 424.7 39.0 67
Comcast Corporation 2.5 15.7 2.9 6.8 53.2 13.5 24
Berkshire Hathaway Inc. 2.2 16.9 1.4 n/a 23.5 8.5 38
CVS Health Corporation 2.0 15.8 3.1 5.2 38.0 11.6 21
Raytheon Company 1.7 15.5 3.6 5.2 54.8 21.3 5
Johnson & Johnson 1.7 15.7 4.2 5.3 70.6 19.9 13
Imperial Brands PLC 1.6 15.3 6.9 5.7 49.0 34.2 11
Safran SA 1.5 15.5 4.6 6.4 20.3 14.8 44
Berry Plastics Group, Inc. 1.5 15.3 -53.1 11.3 23.4 n/a 56

Boston Partners
Boston Partners Global EquityAppendix
i. Biographical Information
ii. Supplemental Information
iii. Global Equity Investment Performance and Fee Schedule
iv. Global Equity Performance Disclosures
v. Investment Strategies Performance and Performance Disclosures

Boston Partners 15
Boston Partners Global EquityPresenters' Biographical Information
Christopher K. Hart, CFAMr. Hart is a senior portfolio manager for Boston Partners Global Equity and International Equity products. Prior to this, he was the portfolio manager for the Boston Partners International Small Cap Value product and before that, an assistant portfolio manager for the Boston Partners Small Cap Value products for three years. Previously, he was a research analyst and specialized in conglomerates, engineering and construction, building, machinery, aerospace & defense, and REITs sectors of the equity market. He joined the fi rm from Fidelity Investments where he was a research analyst. Mr. Hart holds a B.S. degree in fi nance, with a concentration in corporate fi nance from Clemson University. He holds the Chartered Financial Analyst® designation. He has twenty-fi ve years of investment experience.
David J. Gullen, CFA, CAIAMr. Gullen is a senior member of Boston Partners’ Relationship Management and Business Development teams, managing a number of the fi rm’s key relationships. David has extensive experience with all of the fi rm’s Value Equity disciplines and served as senior portfolio analyst for the Boston Partners Value Equity strategies. He joined the fi rm from Decision Analytics, a registered investment advisor consulting institutions on investing balance sheet cash. Prior to this, he had been a risk management consultant for Wells Fargo Bank. Mr. Gullen holds a B.A. degree in history from Georgetown University, where he also received a Master’s Degree in public policy. He holds the Chartered Financial Analyst® and the Chartered Alternative Investment Analyst designations as well as FINRA licenses 7 and 63. He is in his fi fteenth year with the fi rm and has eighteen years of industry experience.

Boston Partners 16
Boston PartnersBiographical Information
Christopher K. Hart, CFAMr. Hart is a senior portfolio manager for Boston Partners Global Equity and International Equity products. Prior to this, he was the portfolio manager for the Boston Partners International Small Cap Value product and before that, an assistant portfolio manager for the Boston Partners Small Cap Value products for three years. Previously, he was a research analyst and specialized in conglomerates, engineering and construction, building, machinery, aerospace & defense, and REITs sectors of the equity market. He joined the fi rm from Fidelity Investments where he was a research analyst. Mr. Hart holds a B.S. degree in fi nance, with a concentration in corporate fi nance from Clemson University. He holds the Chartered Financial Analyst® designation. He has twenty-fi ve years of investment experience.
Joshua Jones, CFAMr. Jones is a portfolio manager on Boston Partners Global and International products. Prior to this role, he was a research analyst specializing in the energy, metals and mining sectors of the equity market and was a global generalist. He joined the fi rm from Cambridge Associates where he was a consulting associate specializing in hedge fund clients. Mr. Jones holds a B.A. degree in economics from Bowdoin College. He holds the Chartered Financial Analyst® designation. He has twelve years of investment experience.
Harry J. Rosenbluth, CFAMr. Rosenbluth is a senior advisor for Boston Partners Global Equity and International Equity products. Prior to this, he was the portfolio manager for Boston Partners Premium Equity Product and co-manager for our Mid Cap Value Equity product. Mr. Rosenbluth holds a B.A. degree in Economics from George Washington University and an M.B.A. from The Amos Tuck School of Business Administration at Dartmouth College. He holds the Chartered Financial Analyst® designation. He has thirty-fi ve years of investment experience.
Trevor Frankel, CFAMr. Frankel is an equity analyst with Boston Partners and is a global generalist. Prior to joining the fi rm, he worked as a research analyst at Highfi elds Capital specializing in the energy and materials sectors. He began his career doing quantitative research for Federated Investors – MDT Advisers. Mr. Frankel holds an A.B. in economics with a secondary fi eld in mathematical sciences from Harvard University and an M.B.A degree from the MIT Sloan School of Management. He holds the Chartered Financial Analyst® designation and has six years of industry experience.
Paul Korngiebel, CFAMr. Korngiebel is an equity analyst with Boston Partners dedicated to the Global Team. He focuses on non-U.S. opportunities. Mr. Korngiebel joined the fi rm from Deccan Value Advisors, which he co-founded, and prior to that he worked at Brandes Investment Partners. Both fi rms are dedicated to global value investing. Mr. Korngiebel holds a B.A. from Bowdoin (Phi Beta Kappa), M.A. degrees from Harvard and St. Johns College, and an M.B.A. degree from Northwestern (Beta Gamma Sigma). He holds the Chartered Financial Analyst® designation and has sixteen years of investment experience.
Joshua White, CFAMr. White is a research analyst with Boston Partners specializing in consumer durables, industrials, capital equipment and general manufacturing sectors of the equity market and is a global generalist. Mr. White holds a B.A. degree in mathematics from Middlebury College. He holds the Chartered Financial Analyst® designation and has ten years of experience.
Joseph F. Feeney, Jr., CFAMr. Feeney is Co-Chief Executive Offi cer and Chief Investment Offi cer for Boston Partners. He is responsible for the fi rm’s strategic, fi nancial and operating decisions, and all aspects of investment management including the fi rm’s fundamental and quantitative research groups. He was one of the original partners of Boston Partners Asset Management in 1995. Prior to assuming these roles, he was director of research. Mr. Feeney joined the fi rm upon its inception in 1995 from Putnam Investments where he managed mortgage-backed securities portfolios. He began his career at the Bank of Boston where he was a loan offi cer specializing on highly leveraged loan portfolios. Mr. Feeney holds a B.S. degree in fi nance (Summa Cum Laude, Phi Beta Kappa) from the University of New Hampshire and an M.B.A. with High Honors from the University of Chicago. He holds the Chartered Financial Analyst® designation and is past President of the Fixed Income Management Society of Boston. He has thirty-one years of investment experience.

Boston Partners 17
Boston Partners Global EquityPortfolio Holdings (Percent of Portfolio): As of March 31, 2016
Alpine Electronics Inc 0.2
Brunswick Corp 1.0
Comcast Corp Cl A 2.5
Havas SA 0.6
ITV Plc 0.4
Liberty Global Plc Cl C 1.0
Liberty LiLAC Group Cl C 0.1
Michael Kors Holdings Ltd 0.5
Michaels Cos Inc 0.8
Nippon TV Holdings Inc NPV 0.4
Priceline Group Inc 0.8
PulteGroup Inc 0.8
Shenzhou Intl Group Hldgs Ltd 0.6
Tenneco Inc 0.7
WH Smith Plc 0.6
WPP Plc 1.0
Consumer Discretionary 111.9
Coca-Cola West Co NPV 0.5
CVS Health Corp 2.0
Greencore Group Plc 0.4
Henkel AG & Co KGAA NPV(BR) 0.7
Imperial Tobacco Group Plc 1.6
Koninklijke Ahold NV 1.5
WH Group Ltd 0.8
Consumer Staples 7.6
Anadarko Petroleum Corp 0.7
Anadarko Petroleum Corp -0.2
Canadian Natural Resources Ltd 0.6
Diamondback Energy Inc 0.8
EOG Resources Inc 0.4
EQT Corp 0.5
INPEX Corporation NPV 0.4
Marathon Petroleum Corp 0.5
Energy 5.8
Energy (cont...)
Occidental Petroleum Corp 0.0
Occidental Petroleum Corp 0.7
Parsley Energy Inc 0.9
Phillips 66 0.5
RSP Permian Inc 0.2
Financials 15.8
Allianz SE NPV 0.7
Allstate Corporation 0.6
American International Group Inc 0.5
Aurelius AG 1.1
Aust & NZ Bank Group NPV 0.6
Bank Of America Corp 0.5
Berkshire Hathaway Inc Cl B 2.2
Capital One Financial Corp 1.1
Chubb Ltd 1.4
Credit Suisse Group AG 0.3
Fifth Third Bancorp 0.7
HSBC Holdings Plc 0.4
Huntington Bancshares Inc 0.5
Muenchener Rueckversicherungs 0.8
Standard Chartered Plc 0.3
SunTrust Banks Inc 0.7
Tokio Marine Holdings NPV 0.5
Unum Group 0.4
Validus Holdings Ltd 0.6
W.R. Berkley Corp 0.8
Wells Fargo & Co 1.0
Health Care 11.6
Amgen Inc 0.9
Bayer AG NPV 1.1
Cigna Corporation 0.7
Johnson & Johnson 1.7
Laboratory Corp of America Hldgs 1.3
Health Care (cont...)
McKesson Corp 0.6
Medtronic Plc 1.1
Merck & Co Inc 1.4
Merck KGAA NPV 0.8
Pfizer Inc 0.7
Roche Holding AG 1.1
Teva Pharmaceutical Industries Inc 0.4
Industrials 16.0
BAE Systems Plc 0.9
Berendsen Plc 0.6
Bollore SA 0.4
Builders FirstSource Inc 0.3
Eaton Corp Plc 0.4
Eaton Corp Plc 0.0
FedEx Corp 0.5
Georg Fischer AG 1.1
Honeywell International Inc 1.1
Ingersoll-Rand Plc 1.3
Kennametal Inc 0.2
Kion Group AG 1.0
Norma Group SE 0.4
Northrop Grumman Corp 0.6
Prysmian SpA 0.4
Randstad Holding NV 0.9
Raytheon Co 1.7
Raytheon Co 0.0
Safran SA 1.5
Teleperformance 1.0
United Parcel Service Inc 1.4
United Technologies Corp 0.6
Information Technology 17.2
Activision Blizzard Inc 0.8
Alphabet Inc 3.9
Information Technology (cont...)
Apple Inc 2.8
Cap Gemini SA 1.0
Casetek Holdings Ltd 0.6
Cisco Systems Inc 0.7
Citizen Holdings Co Ltd 0.5
Dialog Semiconductor Plc 0.1
eBay Inc 0.7
Flextronics International Ltd 1.0
Hewlett Packard Enterprise Co 1.5
ON Semiconductor Corp 0.6
Oracle Corp 0.7
PayPal Holdings Inc 0.9
Rightmove Plc 0.4
Samsung Electronics Co Ltd 0.6
Samsung Electronics Co Ltd 0.6
Materials 7.7
Barrick Gold Corp 0.3
Berry Plastics Group Inc 1.5
CRH Plc 1.0
Dow Chemical Co 0.5
Graphic Packaging Holding Co 0.5
HudBay Minerals Inc 0.1
Lintec Corp 0.7
LyondellBasell Industries NV 0.6
Minerals Technologies Inc 0.4
Nitto Denko Corp 0.5
PPG Industries Inc 0.8
WestRock Co 0.8
Telecommunication Services 1.4
Nippon Telegraph & Tel Corp NPV 0.4
Vodafone Group Plc 0.9
Security holdings as of March 31, 2016 are based upon a representative account in the composite and are subject to change. Values are percent of portfolio and are rounded to one decimal place. It should not be assumed that an investment in these securities was or will be profi table. This information is supplemental to the GIPS® compliant presentation herein.
12.0
5.7
15.9
1.3
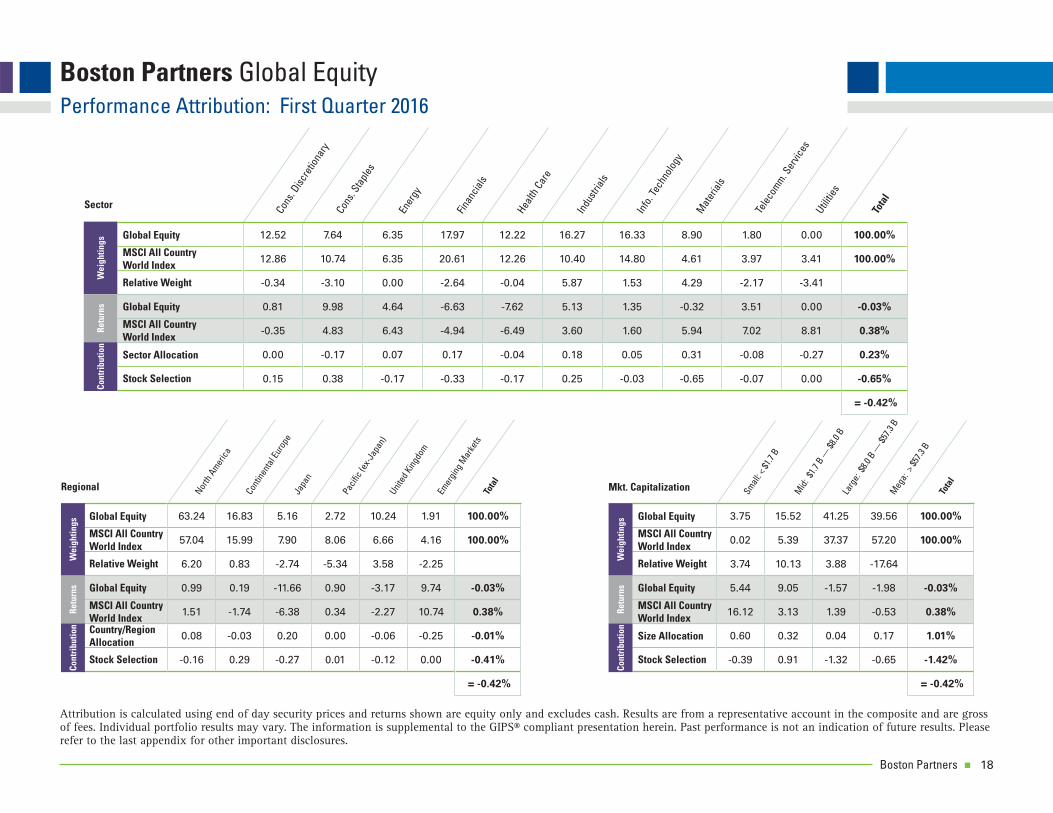
Boston Partners 18
Boston Partners Global EquityPerformance Attribution: First Quarter 2016
Attribution is calculated using end of day security prices and returns shown are equity only and excludes cash. Results are from a representative account in the composite and are gross of fees. Individual portfolio results may vary. The information is supplemental to the GIPS® compliant presentation herein. Past performance is not an indication of future results. Please refer to the last appendix for other important disclosures.
Cont
ribu
tion
Global Equity 12.52 7.64 6.35 17.97 12.22 16.27 16.33 8.90 1.80 0.00 100.00%
MSCI All Country World Index 12.86 10.74 6.35 20.61 12.26 10.40 14.80 4.61 3.97 3.41 100.00%
Relative Weight -0.34 -3.10 0.00 -2.64 -0.04 5.87 1.53 4.29 -2.17 -3.41
Global Equity 0.81 9.98 4.64 -6.63 -7.62 5.13 1.35 -0.32 3.51 0.00 -0.03%
MSCI All Country World Index -0.35 4.83 6.43 -4.94 -6.49 3.60 1.60 5.94 7.02 8.81 0.38%
Sector Allocation 0.00 -0.17 0.07 0.17 -0.04 0.18 0.05 0.31 -0.08 -0.27 0.23%
Stock Selection 0.15 0.38 -0.17 -0.33 -0.17 0.25 -0.03 -0.65 -0.07 0.00 -0.65%
= -0.42%
Wei
ghtin
gsRe
turn
s
Cons
. Sta
ples
Cons
. Disc
retio
nary
Ener
gy
Finan
cials
Health
Car
e
Indu
strial
s
Info
. Tec
hnolo
gy
Mat
erial
s
Telec
omm. S
ervic
esUtili
ties
Tota
l
Sector
Cont
inent
al Eu
rope
North
Amer
ica
Japa
n
Pacifi
c (e
x-Ja
pan)
United
King
dom
Emer
ging M
arke
tsTo
tal
Global Equity 63.24 16.83 5.16 2.72 10.24 1.91 100.00%
MSCI All Country World Index 57.04 15.99 7.90 8.06 6.66 4.16 100.00%
Relative Weight 6.20 0.83 -2.74 -5.34 3.58 -2.25
Global Equity 0.99 0.19 -11.66 0.90 -3.17 9.74 -0.03%
MSCI All Country World Index 1.51 -1.74 -6.38 0.34 -2.27 10.74 0.38%
Country/Region Allocation
0.08 -0.03 0.20 0.00 -0.06 -0.25 -0.01%
Stock Selection -0.16 0.29 -0.27 0.01 -0.12 0.00 -0.41%
= -0.42%
Regional
Retu
rns
Cont
ribu
tion
Wei
ghtin
gs
Global Equity 3.75 15.52 41.25 39.56 100.00%
MSCI All Country World Index 0.02 5.39 37.37 57.20 100.00%
Relative Weight 3.74 10.13 3.88 -17.64
Global Equity 5.44 9.05 -1.57 -1.98 -0.03%
MSCI All Country World Index 16.12 3.13 1.39 -0.53 0.38%
Size Allocation 0.60 0.32 0.04 0.17 1.01%
Stock Selection -0.39 0.91 -1.32 -0.65 -1.42%
= -0.42%
Mkt. Capitalization
Retu
rns
Cont
ribu
tion
Wei
ghtin
gs
Mid:
$1.7
B —
$8.0
B
Small
: < $1
.7 B
Larg
e: $8
.0 B —
$57.3
B
Tota
l
Meg
a: >
$57.3
B

Boston Partners 19
Boston Partners Global EquityPerformance Attribution: Calendar Year 2015
Attribution is calculated using end of day security prices and returns shown are equity only and excludes cash. Results are from a representative account in the composite and are gross of fees. Individual portfolio results may vary. The information is supplemental to the GIPS® compliant presentation herein. Past performance is not an indication of future results. Please refer to the last appendix for other important disclosures.
Cont
ribu
tion
Global Equity 14.64 6.06 7.16 19.00 13.51 13.82 13.87 9.12 2.83 0.00 100.00%
MSCI All Country World Index 12.65 9.83 7.22 21.58 12.24 10.45 14.04 5.09 3.73 3.17 100.00%
Relative Weight 1.99 -3.77 -0.06 -2.58 1.26 3.38 -0.18 4.03 -0.90 -3.17
Global Equity 2.75 2.39 -2.78 -3.13 5.48 8.34 3.47 3.57 8.02 0.00 2.21%
MSCI All Country World Index 4.53 5.72 -21.61 -5.08 6.80 -2.74 3.70 -15.84 -1.23 -7.47 -1.85%
Sector Allocation 0.15 -0.23 0.10 0.04 -0.01 0.01 -0.04 -0.52 -0.02 0.21 -0.31%
Stock Selection -0.38 -0.21 1.42 0.40 -0.25 1.47 -0.12 1.86 0.17 0.00 4.36%
= 4.06%
Wei
ghtin
gsRe
turn
s
Cons
. Sta
ples
Cons
. Disc
retio
nary
Ener
gy
Finan
cials
Health
Car
e
Indu
strial
s
Info
. Tec
hnolo
gy
Mat
erial
s
Telec
omm. S
ervic
esUtili
ties
Tota
l
Sector
Cont
inent
al Eu
rope
North
Amer
ica
Japa
n
Pacifi
c (e
x-Ja
pan)
United
King
dom
Emer
ging M
arke
tsTo
tal
Global Equity 58.12 15.54 7.12 4.56 13.30 1.36 100.00%
MSCI All Country World Index 55.81 16.30 7.78 8.36 7.07 4.50 100.00%
Relative Weight 2.30 -0.76 -0.66 -3.80 6.22 -3.14
Global Equity 0.11 13.42 6.66 11.29 2.24 -27.76 2.21%
MSCI All Country World Index -0.45 -0.60 9.90 -8.97 -7.48 -18.32 -1.85%
Country/Region Allocation
-0.03 0.15 -0.09 0.05 -0.40 0.57 0.29%
Stock Selection 0.25 2.01 -0.20 0.79 1.21 -0.29 3.77%
= 4.06%
Regional
Retu
rns
Cont
ribu
tion
Wei
ghtin
gs
Global Equity 7.83 15.46 35.98 40.22 100.00%
MSCI All Country World Index 0.13 5.43 37.14 57.11 100.00%
Relative Weight 7.70 10.03 -1.17 -16.89
Global Equity 12.51 -1.87 4.60 0.46 2.21%
MSCI All Country World Index 38.64 -3.76 -4.96 0.33 -1.85%
Size Allocation 3.33 -0.17 0.04 -0.35 2.63%
Stock Selection -2.15 0.31 3.29 0.03 1.42%
= 4.06%
Mkt. Capitalization
Retu
rns
Cont
ribu
tion
Wei
ghtin
gs
Mid:
$1.7
B —
$8.0
B
Small
: < $1
.7 B
Larg
e: $8
.0 B —
$57.3
B
Tota
l
Meg
a: >
$57.3
B

Boston Partners 20
58Frequency 0
25
24
23 Mar-16
22 Jan-16
21 Oct-15
20 Apr-15
19 Mar-15
18 Jan-15
17 Dec-14 Dec-15
16 Nov-14 Nov-15
15 Oct-14 Sep-15
14 Feb-16 Sep-14 Aug-15
13 Jan-13 Jun-14 Jul-15
12 Dec-12 May-14 Jun-15
11 Nov-12 Apr-14 May-15
10 Oct-12 May-13 Feb-15
9 Sep-12 Apr-13 Aug-14
8 Aug-12 Mar-13 Jul-14
7 Jun-12 Feb-13 Mar-14
6 Feb-12 Jul-12 Dec-13
5 Jan-12 May-12 Oct-13
4 Dec-11 Apr-12 Sep-13
3 Nov-11 Mar-12 Aug-13 Feb-14
2 Oct-11 Jul-11 Jul-13 Jan-14
1 Sep-11 Aug-11 Jun-11 Jun-13 Nov-13
(<5%) (4-5%) (3-4%) (2-3%) (1-2%) (0-1%) 0-1% 1-2% 2-3% 3-4% 4-5% >5%
Relative Performance in basis points
Periods Ahead of BenchmarkPeriods Behind Benchmark
Boston Partners Global Equity Distribution of Monthly Rolling Three-Year Excess Returns as of March 31, 2016
The chart refl ects a since inception time period. Inception for BP Global Equity is July 1, 2008.Relative performance of the BP Global Equity is versus the MSCI World Index. This information is supplemental to the GIPS® compliant presentation herein. Past performance is not an indication of future results. Please refer to the last appendix for other important disclosures.
Boston Partners Global Equity

Boston Partners 21
Boston Partners Global EquityInvestment Performance through March 31, 2016
Calendar Year Performance (%)
2015 2014 2013 2012 2011 2010 2009 Jul.–Dec.2008*
Global Equity USA - Gross of Fees 1.89 5.54 35.12 17.25 -1.77 13.46 29.62 -30.51
Global Equity USA - Net of Fees 1.11 4.74 34.11 16.37 -2.55 12.56 28.61 -30.80
MSCI World Index -0.32 5.50 27.37 16.53 -5.01 12.34 30.79 -33.52
Relative Performance - Gross of Fees 2.21 0.04 7.75 0.72 3.24 1.12 -1.17 3.01
Annualized Performance (%)
1Q2016
1Year
3Year
5Year
7Year
Since Inception*
Global Equity USA - Gross of Fees 0.00 -1.76 9.64 9.51 16.09 7.17
Global Equity USA - Net of Fees -0.19 -2.51 8.81 8.68 15.19 6.34
MSCI World Index -0.19 -2.90 7.41 7.12 13.75 4.87
Relative Performance - Gross of Fees 0.19 1.14 2.23 2.39 2.34 2.30
* Inception date is July 1, 2008.Boston Partners has prepared and presented this report in compliance with GIPS®. Returns refl ect composite results and individual portfolio results may vary. Past performance is not anindication of future results. Please refer to the last appendix for other important disclosures.

Boston Partners 22
Boston Partners Annual Fee Schedule
Global Equity - Separate Account
0.75% First $25 million of assets0.65% Next $25 million0.55% Next $50 million0.50% Thereafter

Boston Partners 23
Boston Partners Global EquityPerformance Disclosures
Boston Partners ("BP") is a dba of Robeco Investment Management (“RIM” or the “Firm”), an Investment Adviser registered with the Securities and Exchange Commission under the Investment Advisers Act of 1940. RIM is a subsidiary of Robeco Groep N.V. (“Robeco”), a Dutch investment management fi rm headquartered in Rotterdam, the Netherlands. RIM updated its fi rm description as of January 1, 2015 to refl ect changes in its divisional structure. RIM is comprised of three divisions, Boston Partners, Weiss, Peck & Greer Partners ("WPG"), and Redwood Equity ("Redwood"). RIM claims compliance with the Global Investment Performance Standards (GIPS®) and has prepared and presented this report in compliance with the GIPS® standards. RIM has been independently verifi ed for the periods 2007 through 2013. Verifi cation assesses whether (1) the fi rm has complied with all the composite construction requirements of the GIPS® standards on a fi rm-wide basis and (2) the fi rm’s policies and procedures are designed to calculate and present performance in compliance with the GIPS® standards. The RIM Global Equity II composite has been examined for the annual periods 2012 to 2013. The verifi cation and performance examination reports are available upon request. BPAM and WPG were verifi ed by an independent verifi er on an annual basis from 1995 through 2006 and 1993 through 2006, respectively. Past performance is not indicative of future results. This document is not an offering of securities nor is it intended to provide investment advice. It is intended for informational purposes only. The inception and creation date of the RIM Global Equity II composite is July 1, 2008. This strategy is unconstrained and primarily invests in equity securities in the global market without using hedges on currency. The benchmark of this composite is the MSCI World Index. The composite includes all fully discretionary, fee-paying accounts under management, both separately managed and commingled, with a similar investment mandate and an account market value greater than $1 million.Account returns are market value weighted and calculated on a total return basis using trade date valuations. Returns refl ect the reinvestment of dividends and other earnings, and are net of commissions and transaction costs. Performance is expressed in U.S. Dollars. Additional information regarding policies for valuing portfolios, calculating performance, and
presenting compliant presentations is available upon request.Composite returns are provided on a gross and net of fees basis. Account gross returns will be reduced by any fees and expenses incurred in the management of the account. In general, actual fees may vary depending on the applicable fee schedule and portfolio size. Net of fees returns for commingled vehicles that are members of a composite are calculated using a model fee that is the highest tier in the separate account fee schedule for the strategy. Fees are applied to gross returns at month end.Benchmark The MSCI World Index covers the full range of developed, emerging and All Country MSCI International Equity Indices across all size segmentations. MSCI uses a two-dimensional framework for style segmentation in which value securities are categorized using a multi-factor approach, which uses three variables to defi ne the value investment style characteristics and fi ve variables to defi ne the growth investment style characteristics including forward looking variables. The objective of the index design is to divide constituents of an underlying MSCI Equity Index into respective value and growth indices, each targeting 50% of the free fl oat adjusted market capitalization of the underlying market index. Index returns are provided for comparison purposes only to show how the composite's returns compare to a broad-based index of securities, as the index does not have costs, fees, or other expenses associated with its performance. In addition, securities held in the index may not be similar to securities held in the composite's accounts.
2005 through 2006 fi rm assets represents BP assets under management prior to merger into RIM. * Data are preliminary and unaudited.** Performance period is from July 1.Composite Dispersion The measurement of composite dispersion is calculated by the weighted average standard deviation of the annual account returns within the composite. Dispersion in composites with less than fi ve accounts included for the entire year is not considered meaningful and is denoted with “N/A”. Prior to January 1, 2007, the measurement of composite dispersion was calculated by determining the difference between the highest and lowest annual account returns within the composite. The three-year annualized standard deviation measures the variability of the composite and the benchmark returns over the preceding 36-month period. Other DisclosuresRIM has adjusted the S&P and Russell sector classifi cations to group stocks according to similar business product lines and correlation of stock returns. RIM’s classifi cations are similar to the major market indices in terms of breadth but may differ in terms of composition. All product characteristics and sector weightings are calculated using a representative portfolio. Risk statistics are calculated using composite data. Portfolio composition is subject to change and information contained in this publication may not be representative of the current portfolio. Effective January 1, 2011; RIM adopted a signifi cant cash fl ow policy for this composite in accordance with the Global Investment Performance Standards. If an external cash fl ow is greater than or equal to 10.0% of the beginning market value of the portfolio on the day of the fl ow, and greater than or equal to 10.0% of the beginning market value of the composite for that month then the portfolio is removed from the composite for the month that the fl ow occurred. The portfolio is then placed back into the composite in accordance with Firm’s inclusion policies and procedures.
Global Equity:# of Portfolios
in Composite
Total Assets in
Composite
% of Firm
AUM
Composite
Dispersion*2015: 3 $432 mm 1% N/A2014: 1 $27 mm 0% N/A2013: 2 $66 mm 0% N/A2012: 2 $18 mm 0% N/A2011: 1 $8 mm 0% N/A2010: 1 $9 mm 0% N/A2009: 1 $8 mm 0% N/A
**2008: 1 $6mm 0% N/A
Firm Assets:Year Assets (mm) Year Assets (mm)*2015: $78,363 2010: $18,4182014: $73,250 2009: $17,2072013: $52,333 2008: $11,5402012: $29,023 2007: $26,5542011: $21,098 2006: $12,456
Boston Partners 24
Boston Partners Global EquityPerformance Disclosures (continued)
RIM participates in Initial Public Offerings (IPOs) as described in its Form ADV, Part II. IPO contributions to performance vary from year to year depending on availability and prevailing market conditions. IPO contributions may have a signifi cant positive effect on performance when initially purchased. Such positive performance should not be expected for future performance periods. Annual Fee ScheduleInvestment advisory fees, which are more fully described in RIM’s Form ADV Part II, are: 75 basis points (“bp”) on the fi rst $25 million; 65 bp on the next $25 million; 55 bp on the next $50 million; 50 bp thereafter.Corporate InformationRobeco Investment Management affi liated with listed corporations though common ownership. Robeco Investments services may be offered in the U.S. through Robeco Institutional Asset Management, U.S., SAM investment services may be offered in the U.S. by RobecoSAM USA, Inc., each an SEC Registered Investment Adviser registered under the Investment Advisers Act of 1940. Transtrend products, Robeco Investments and SAM products may be offered in the U.S. through Robeco Securities, LLC, member FINRA, SiPC. Harbor Capital Advisers products are distributed by Harbor Funds Distributors, Inc.

Boston Partners 25
Boston PartnersEquity Investment Performance through March 31, 2016
Performance (%)
1Q2016
1Year
3Year
5Year
7Year
10Year
Since Inception* 2015 2014 2013 2012 2011 2010 2009 2008 2007 2006
Large Cap Value - Gross of Fees -0.25 -4.30 9.67 10.94 16.74 7.63 10.54 -4.08 11.85 37.14 21.27 1.28 13.75 26.75 -32.95 5.14 19.97
Large Cap Value - Net of Fees -0.33 -4.59 9.32 10.52 16.31 7.24 10.15 -4.37 11.49 36.64 20.66 0.82 13.36 26.30 -33.17 4.80 19.60
Russell 1000® Value Index 1.64 -1.54 9.38 10.25 16.31 5.72 9.10 -3.83 13.45 32.53 17.51 0.39 15.51 19.69 -36.85 -0.17 22.25
S&P 500 Index 1.35 1.78 11.82 11.58 16.97 7.01 8.74 1.38 13.69 32.39 16.00 2.11 15.06 26.46 -37.00 5.49 15.79
130/30 Large Cap Value- Gross of Fees -0.41 -3.48 10.95 12.35 17.43 — 7.67 -3.69 14.52 38.71 21.67 2.06 12.90 25.46 -29.44 3.51* —
130/30 Large Cap Value - Net of Fees -0.47 -3.69 10.73 12.11 17.05 — 7.15 -3.90 14.31 38.46 21.40 1.82 12.37 24.24 -30.16 2.66* —
Russell 1000® Value Index 1.64 -1.54 9.38 10.25 16.31 — 4.68 -3.83 13.45 32.53 17.51 0.39 15.51 19.69 -36.85 0.13* —
Premium Equity - Gross of Fees -1.04 -1.63 12.46 11.59 17.71 9.05 12.90 1.71 13.22 39.73 16.27 -1.01 14.78 33.16 -26.62 2.49 18.62
Premium Equity - Net of Fees -1.17 -2.18 11.88 11.02 17.10 8.49 12.35 1.15 12.65 39.04 15.72 -1.55 14.18 32.45 -27.05 2.01 18.11
Russell 3000® Value Index 1.64 -2.05 9.08 9.95 16.25 5.60 9.11 -4.13 12.70 32.69 17.55 -0.10 16.23 19.76 -36.25 -1.01 22.34
S&P 500 Index 1.35 1.78 11.82 11.58 16.97 7.01 8.74 1.38 13.69 32.39 16.00 2.11 15.06 26.46 -37.00 5.49 15.79
Mid Cap Value - Gross of Fees 0.17 -1.60 13.79 13.04 21.33 11.22 13.54 2.84 14.37 41.04 19.78 1.68 24.79 42.04 -31.84 6.24 18.78
Mid Cap Value - Net of Fees 0.08 -1.94 13.41 12.47 20.66 10.57 12.83 2.49 14.00 40.48 18.90 0.88 23.93 41.13 -32.36 5.57 18.06
Russell Midcap® Value Index 3.92 -3.39 9.88 10.52 19.48 7.23 11.27 -4.78 14.75 33.46 18.51 -1.38 24.75 34.21 -38.45 -1.42 20.22
Small/Mid Cap Value -Gross of Fees 2.54 -5.57 8.33 9.74 18.86 7.34 11.07 -3.06 5.34 35.33 23.97 -1.57 18.07 43.89 -30.65 -6.69 15.58
Small/Mid Cap Value - Net of Fees 2.36 -6.20 7.59 8.98 17.99 6.50 10.25 -3.71 4.65 34.37 23.08 -2.31 17.05 42.69 -31.31 -7.53 14.54
Russell 2500™ Value Index 3.33 -5.20 7.15 8.33 17.32 5.80 9.74 -5.49 7.11 33.32 19.21 -3.36 24.82 27.67 -31.99 -7.27 20.18
Russell 2500™ Index 0.39 -7.31 8.16 8.58 17.84 6.47 9.07 -2.90 7.07 36.80 17.88 -2.51 26.71 34.38 -36.79 1.38 16.17
* Inception dates are as follows: Large Cap Value is June 1, 1995; 130/30 Large Cap Value is March 1, 2007; Premium Equity is June 1, 1995; Mid Cap Value is May 1, 1995;and Small/Mid Cap Value is April 1, 1999.Boston Partners has prepared and presented this report in compliance with the GIPS®. Returns refl ect composite results and individual portfolio results will vary.Past performance is not an indication of future results. Please refer to the last appendix for other important disclosures.

Boston Partners 26
Boston PartnersEquity Investment Performance through March 31, 2016 (continued)
Performance (%)
1Q2016
1Year
3Year
5Year
7Year
10Year
Since Inception* 2015 2014 2013 2012 2011 2010 2009 2008 2007 2006
Small Cap Value - Gross of Fees 2.73 -5.21 8.18 9.24 19.42 7.71 13.13 -3.77 4.76 35.27 22.85 -2.13 22.50 44.74 -30.18 -5.18 14.00
Small Cap Value - Net of Fees 2.54 -5.96 7.32 8.37 18.45 6.81 12.22 -4.53 3.93 34.21 21.85 -2.93 21.45 43.49 -30.82 -6.00 13.07
Russell 2000® Value Index 1.70 -7.72 5.73 6.67 15.54 4.42 9.57 -7.47 4.22 34.52 18.05 -5.50 24.50 20.56 -28.92 -9.78 23.48
Russell 2000® Index -1.52 -9.76 6.84 7.20 16.42 5.26 8.25 -4.41 4.89 38.82 16.35 -4.18 26.85 27.16 -33.79 -1.56 18.37
Small Cap Value Equity II- Gross of Fees 2.19 -4.63 8.71 9.88 19.98 7.78 12.28 -3.27 5.35 36.53 24.54 -2.29 20.32 49.82 -33.80 -5.71 17.88
Small Cap Value Equity II- Net of Fees 1.95 -5.54 7.70 8.81 18.80 6.68 11.10 -4.19 4.37 35.28 23.42 -3.45 19.09 48.31 -34.53 -6.77 16.52
Russell 2000® Value Index 1.70 -7.72 5.73 6.67 15.54 4.42 7.45 -7.47 4.22 34.52 18.05 -5.50 24.50 20.56 -28.92 -9.78 23.48
Long/Short Equity - Gross of Fees 9.08 14.48 6.98 9.81 21.46 14.59 13.78 1.15 7.16 10.37 15.40 8.68 29.54 85.95 -20.03 -1.71 19.20
Long/Short Equity - Net of Fees 8.63 13.19 5.84 8.61 19.71 12.67 11.03 0.17 6.04 9.17 14.06 7.39 26.55 81.74 -21.71 -3.77 15.61
S&P 500 Index 1.35 1.78 11.82 11.58 16.97 7.01 6.16 1.38 13.69 32.39 16.00 2.11 15.06 26.46 -37.00 5.49 15.79
Long/Short Research- Gross of Fees -0.27 1.61 8.32 9.02 11.61 8.30 8.08 3.02 8.68 19.70 14.73 5.35 9.33 18.67 -8.46 9.85 7.00
Long/Short Research- Net of Fees -0.58 0.35 6.98 7.68 10.24 6.96 6.75 1.74 7.34 18.23 13.32 4.05 7.98 17.22 -9.60 8.49 5.68
S&P 500 Index 1.35 1.78 11.82 11.58 16.97 7.01 6.41 1.38 13.69 32.39 16.00 2.11 15.06 26.46 -37.00 5.49 15.79
* Inception dates are as follows: Inception dates are as follows: Small Cap Value is July 1, 1995; Small Cap Value Equity II is July 1, 1998; Long/Short Equity is August 1, 1997; and Long/Short Research is April 1, 2002. Boston Partners has prepared and presented this report in compliance with the GIPS®. Returns refl ect composite results and individual portfolio results will vary.Past performance is not an indication of future results. Please refer to the last appendix for other important disclosures.

Boston Partners 27
Boston PartnersEquity Investment Performance through March 31, 2016 (continued)
Performance (%)
1Q2016
1Year
3Year
5Year
7Year
Since Inception* 2015 2014 2013 2012 2011 2010 2009 2008
Global Equity USA- Gross of Fees 0.00 -1.76 9.64 9.51 16.09 7.17 1.89 5.54 35.12 17.25 -1.77 13.46 29.62 -30.51*
Global Equity USA- Net of Fees -0.19 -2.51 8.81 8.68 15.19 6.34 1.11 4.74 34.11 16.37 -2.55 12.56 28.61 -30.80*
MSCI World Index -0.19 -2.90 7.41 7.12 13.75 4.87 -0.32 5.50 27.37 16.53 -5.01 12.34 30.79 -33.52*
International Equity- Gross of Fees -2.91 -4.95 5.55 6.34 13.27 3.16 3.54 -3.65 31.47 18.67 -6.20 10.63 27.87 -36.51*
International Equity- Net of Fees -3.09 -5.66 4.77 5.56 12.42 2.38 2.77 -4.37 30.51 17.79 -6.90 9.75 26.87 -36.79*
MSCI EAFE Index -2.88 -7.87 2.68 2.76 10.19 1.02 -0.39 -4.49 23.29 17.90 -11.75 8.21 32.46 -36.32*
Global Long/Short- Gross of Fees -0.75 6.39 — — — 7.73 8.73 4.36 8.96* — — — — —
Global Long/Short- Net of Fees -1.25 4.30 — — — 5.75 6.59 2.70 8.02* — — — — —
MSCI World Index -0.19 -2.90 — — — 7.78 -0.32 5.50 17.08* — — — — —
* Inception dates are as follows: Inception dates are as follows: Global Equity USA is July 1, 2008; International Equity is July 1, 2008 (Formerly known as International Value Equity) and Global Long/Short Equity is July 1, 2013. Boston Partners has prepared and presented this report in compliance with the GIPS®. Returns refl ect composite results and individual portfolio results will vary.Returns are shown in USD. Past performance is not an indication of future results. Please refer to the last appendix for other important disclosures.

Boston Partners 28
Boston PartnersPerformance Disclosures
Boston Partners ("BP") is a dba of Robeco Investment Management (“RIM” or the “Firm”), an Investment Adviser registered with the Securities and Exchange Commission under the Investment Advisers Act of 1940. RIM is a subsidiary of Robeco Groep N.V. (“Robeco”), a Dutch investment management fi rm headquartered in Rotterdam, the Netherlands. RIM updated its fi rm description as of January 1, 2015 to refl ect changes in its divisional structure. RIM is comprised of three divisions, Boston Partners, Weiss, Peck & Greer Partners ("WPG"), and Redwood Equity ("Redwood"). RIM claims compliance with the Global Investment Performance Standards (GIPS®) and has prepared and presented this report in compliance with the GIPS® standards. RIM has been independently verifi ed for the periods 2007 through 2014. Verifi cation assesses whether (1) the Firm has complied with all the composite construction requirements of the GIPS® standards on a fi rm-wide basis and (2) the Firm’s policies and procedures are designed to calculate and present performance in compliance with the GIPS® standards. The composites have been examined per the following periods: RIM Large Cap Value Equity,1995 to 2014; RIM Alpha Extension Large Cap Value Equity, 2012 to 2014; RIM Premium Equity, 1995 to 2014; RIM Mid Cap Value Equity, 1995 to 2006 and 2010 to 2014; RIM Small/Mid Cap Value Equity, 1999 to 2014; RIM Small Cap Value Equity, 1995 to 2014; RIM Small Cap Value II Equity, 1998 to 2014; RIM Long/Short Research, 2011 to 2014; RIM Global Equity II, 2012 to 2014; RIM International Equity II, 2008 to 2014; RIM Global Long/Short, 2013 to 2014. The verifi cation and performance examination reports are available upon request.Past performance is not indicative of future results. This document is not an offering of securities nor is it intended to provide investment advice. It is intended for information purposes only.
Composite Construction(s)Performance results attained at BPAM have been linked to the results achieved at RIM beginning on January 1, 2007 in compliance with the GIPS® standards on performance record portability. Composites include all separately managed and commingled vehicles, fully discretionary, fee-paying accounts under management with a similar investment mandate and an account market value greater than $1 million with the exception of RIM Small Cap Value Equity and Small Cap Value II Equity which have an account market value greater than $5 million. Prior to January 1, 2007 the minimum account size for inclusion in the composite was $5 million. The composites contain proprietary assets.
The inception and creation date of the RIM Large Cap Value Equity composite is June 1, 1995. The strategy is composed of securities with market capitalizations primarily greater than $3 billion and is benchmarked against the S&P 500 Index and the Russell 1000® Value Index. Prior to December 1, 1995, there was no minimum market value requirement for inclusion in the RIM Large Cap Value Equity composite. Accounts that did not meet the newly established minimum balance requirement were removed on that date. The inception date and creation date of the RIM Alpha Extension Large Cap Value Equity composite is March 1, 2007. The strategy is an actively managed Large Cap Value strategy that utilized long and short equity position to generate alpha. The strategy is permitted to short 30% of the portfolio and reinvests the proceeds of those shorts into the securities that the manager fi nds attractive, creating a 130% long portfolio and a 30% short portfolio. The strategy is benchmarked against the Russell 1000® Value Index. The inception and creation date of the RIM Premium Equity composite is June 1, 1995. The strategy is a hybrid of RIM’s other equity products. It has the fl exibility to invest across the capitalization spectrum and to invest in securities with equity-like return and risk profi les. RIM Premium Equity is benchmarked against the S&P 500 Index and the Russell 3000® Value Index. The inception and creation date of the RIM Mid Cap Value Equity composite is May 1, 1995. Effective March 1, 2006, the Mid Cap Value Equity strategy is composed of securities primarily in the same market capitalization range, at time of purchase, as the Russell Midcap® Value Index. Effective January 1, 2005 the RIM Mid Cap Value composite revised its benchmark from the Russell 2500™ Value Index to the Russell Midcap® Value Index. The Russell Midcap® Value Index has less of a bias toward smaller capitalization stocks and thus more accurately refl ects the composition of RIM holdings. The inception and creation date of the RIM Small/Mid Cap Value Equity composite is April 1, 1999. The strategy is composed of securities primarily in the $100 million to $10 billion market capitalization range and is benchmarked against the Russell 2500™ Value Index. The inception and creation date of the RIM Small Cap Value Equity composite is July 1, 1995. The strategy is composed of securities primarily in the $100 million to $1.5 billion market capitalization range and is benchmarked against the Russell 2000® Value Index.The inception date of the RIM Small Cap Value II Equity composite is July 1, 1998. The composite was created in 2000. The strategy is composed of securities primarily in the
$10 million to $1 billion market capitalization range and is benchmarked against the Russell 2000® Value Index. The inception date and creation date of the RIM Long/Short Equity composite is August 1, 1997. The strategy is an absolute return product that balances long and short portfolio strategies and seeks to achieve stable absolute returns with approximately half the risk of the S&P 500. However, this product is not risk neutral. It is exposed to style, capitalization, sector and short-implementation risks. Use of the S&P 500 Index is for comparative purposes only since investment returns are not correlated to equity market returns. Prior to October 1, 1998, the composite was managed on a non-fee paying basis. Participant results would have been substantially different if fee waivers were not applied. Commencing on October 1, 1998 and continuing each quarter thereafter, the net of fee calculation includes a model fee for each commingled account included in the composite, and when applicable, the actual fees assessed for each separately managed portfolio included in the composite. The model fee, which is comprised of an investment management fee and performance fee, represents the deduction of the highest fee that could have been earned based on actual results during the performance period. In addition, other expenses typically borne by the commingled accounts, as defi ned in the applicable offering documents, have been applied. However, from time-to-time the commingled accounts may have placed a ceiling on the amount of expenses it had incurred. Although performance fees are paid annually when earned, for presentation of net returns, performance fees, similar to management fees and expenses, are accrued for on a monthly basis. Actual fees may vary. The composite is benchmarked against the S&P 500 Index and the Russell 3000® Value/Russell 3000® Growth for comparative purposes only since the strategy is not correlated to equity market returns. The inception and creation date of the RIM Research Equity composite is April 1, 2002. This strategy is an absolute return product that balances long and short portfolio strategies and seeks to achieve stable absolute returns with approximately half the risk of the S&P 500 Index. The strategy is benchmarked against the S&P 500 Index. The inception and creation date of the RIM Global Equity II composite is July 1, 2008. This strategy is unconstrained and primarily invests in equity securities in the global market without using hedges on currency. The inception date and creation date of the RIM International Equity II composite is July 1, 2008. This strategy is unconstrained and primarily invests in non-us markets without using currency hedges. The strategy is benchmarked against the MSCI EAFE Index. From July 1, 2008 to June 30, 2010 the

Boston Partners 29
Boston PartnersPerformance Disclosures (continued)
primary benchmarks was MSCI EAFE Value Index and on July 1, 2010 the primary benchmark change to the MSCI EAFE.This change to the MSCI EAFE Index was made retroactively to July 1, 2008. The inception and creation date of the RIM Global Long/Short Equity composite is July 1, 2013. The strategy is composed of securities with market capitalizations primarily greater than $50 million and is benchmarked against the MSCI World Index.The inception and creation date of the RIM Europe Equity composite is May 1, 2015. This strategy is unconstrained and primarily invests in equity securities in the European market without using hedges on currency.BenchmarksIndex returns are provided for comparison purposes only to show how the composite’s returns compare to a broad-based index of securities, as the indices do not have costs, fees, or other expenses associated with their performance.In addition, securities held in either index may not be similar to securities held in the composite’s accounts. The S&P 500 Index is an unmanaged index of the common stocks of 500 widely held U.S. companies. All Russell® Indices are registered trademarks of the Frank Russell Company. The Russell® Value Indices typically measure the performance of universes of stocks displaying low price-to-book ratios and low forecasted growth values. The Russell® Growth Indices typically measure the performance of universes of stocks displaying high price-to-book ratios and high forecasted growth values. The Russell 1000® Index measures the performance of the 1,000 largest companies in the Russell 3000® Index. The Russell 3000® Index measures performance of the 3,000 largest U.S. companies based on total market capitalization. The Russell 2500™, and 2000® Indices measure performance of the 2,500 and 2,000 smallest companies in the Russell 3000® Index respectively. The Russell Midcap® Index measures the performance of the 800 smallest companies in the Russell 1000® Index. The MSCI World Index covers the full range of developed, emerging and All Country MSCI International Equity Indices across all size segmentations. MSCI uses a two-dimensional framework for style segmentation in which value securities are categorized using a multi-factor approach, which uses three variables to defi ne the value investment style characteristics and fi ve variables to defi ne the growth investment style characteristics including forward looking variables. The objective of the index design is to divide constituents of an underlying MSCI Equity Index into respective value and growth indices, each targeting 50% of the free fl oat adjusted market capitalization of the underlying market index. The MSCI EAFE Index is a free fl oat-adjusted market capitalization index that is designed to measure developed market equity performance, excluding the US & Canada. As of April 2002, the MSCI EAFE
Index consisted of the following 21 developed market country indices: Australia, Austria, Belgium, Denmark, Finland, France, Germany, Greece, Hong Kong, Ireland, Italy, Japan, Netherlands, New Zealand, Norway, Portugal, Singapore, Spain, Sweden, Switzerland and United Kingdom. The MSCI Europe Index is a free fl oat‐adjusted market capitalization weighted index that is designed to measure the equity market performance of the developed markets in Europe. The MSCI Europe Index consists of the following 15 developed market country indexes: Austria, Belgium, Denmark, Finland, France, Germany, Ireland, Italy, the Netherlands, Norway, Portugal, Spain, Sweden, Switzerland, and the United Kingdom.
Calculation MethodologyAccount returns are market value weighted and calculated on a total return basis using trade date valuations. Returns refl ect the reinvestment of dividends and other earnings, and are net of commissions and transaction costs. Performance is expressed in U.S. Dollars. Short sales are an integral part of the investment strategy and constitute the use of leverage. Accounts are temporarily removed from the composite when a signifi cant cash fl ow occurs, which is typically defi ned as a fl ow that is greater than 10% of the account value that exceeds a threshold of +/- 20 basis points from daily performance of the representative account and a similar account of the same strategy. An account is generally added back to the composite as of the fi rst full month following the signifi cant cash fl ow. Additional information regarding policies for valuing portfolios, calculating performance, and presenting compliant presentations is available upon request.
Fees and ExpensesComposite returns are provided on a gross and net of fees basis. Account returns will be reduced by any fees and expenses incurred in the management of the account. In general, actual fees may vary depending on the applicable fee schedule and portfolio size. Net of fees returns for commingled vehicles that are members of a composite are calculated using a model fee that is the highest tier in the separate account fee schedule for the strategy. Fees are applied to gross returns at month end.Returns refl ect the reinvestment of dividends and other earnings, and are net of commissions and transaction costs. Performance is expressed in U.S. Dollars. Additional information regarding policies for valuing portfolios, calculating performance, and presenting compliant presentations is available upon request. Investment advisory fees are listed herein and are fully described in RIM’s Form ADV, Part II.
130/30 Large Cap Equity:# of Portfolios
in Composite
Total Assets in
Composite
% of Firm
AUM
Composite
Dispersion*2015: 2 $933 mm 1% N/A2014: 2 $1.2 bn 2% N/A2013: 1 $845 mm 2% N/A2012: 3 $636 mm 2% N/A2011: 3 $463 mm 2% N/A2010: 1 $17 mm 0% N/A2009: 1 $6 mm 0% N/A2008: 1 $5 mm 0% N/A2007: 1 $7 mm 0% N/A
Large Cap Value Equity:# of Portfolios
in Composite
Total Assets in
Composite
% of Firm
AUM
Composite
Dispersion*2015: 167 $24.6 bn 31% 0.16%2014: 151 $25.2 bn 34% 0.11%2013: 129 $16.5 bn 32% 0.62%2012: 105 $8.6 bn 30% 0.24%2011: 99 $5.1 bn 24% 0.23%2010: 89 $4.8 bn 26% 0.15%2009: 83 $3.5 bn 20% 0.38%2008: 70 $2.1 bn 18% 0.21%2007: 68 $3.4 bn 13% 0.14%2006: 45 $3.4 bn 27% 0.83%
Mid Cap Value Equity:# of Portfolios
in Composite
Total Assets in
Composite
% of Firm
AUM
Composite
Dispersion*2015: 37 $15.3 b 20% 0.01%2014: 29 $11.6 b 16% 0.12%2013: 16 $7.6 b 15% 0.24%2012: 9 $2.9 b 10% 0.01%2011: 4 $1.0 b 5% N/A2010: 3 $306 mm 2% N/A2009: 3 $127 mm 1% N/A2008: 3 $85 mm 1% N/A2007: 2 $86 mm 0% N/A2006: 1 $35 mm 0% N/A
Premium Equity:# of Portfolios
in Composite
Total Assets in
Composite
% of Firm
AUM
Composite
Dispersion*2015: 35 $3.3 bn 4% 0.09%2014: 29 $3.1 bn 4% 0.14%2013: 29 $2.7 bn 5% 0.53%2012: 26 $2.2 bn 7% 0.17%2011: 24 $2.0 bn 9% 0.19%2010: 27 $2.1 bn 12% 0.43%2009: 26 $2.1 bn 12% 0.49%2008: 23 $1.3 bn 11% 0.30%2007: 15 $677 mm 3% 0.12%2006: 11 $1.7 bn 14% 0.37%
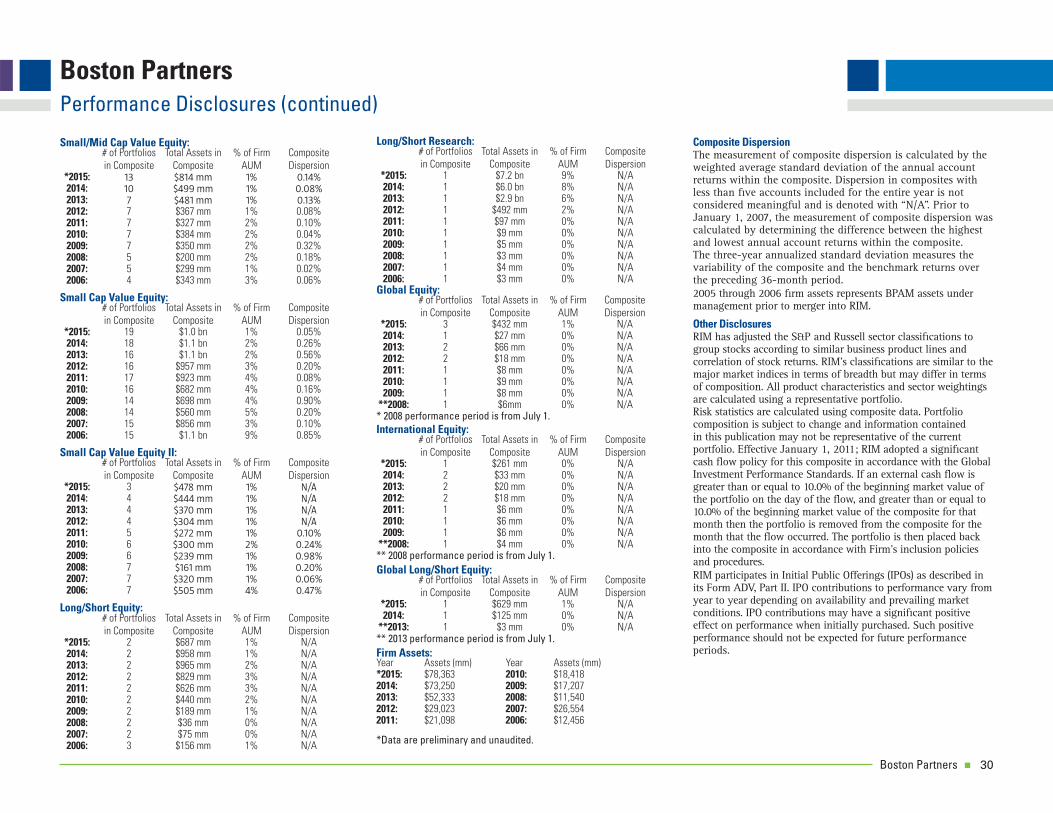
Boston Partners 30
Boston PartnersPerformance Disclosures (continued)
Small Cap Value Equity:# of Portfolios
in Composite
Total Assets in
Composite
% of Firm
AUM
Composite
Dispersion*2015: 19 $1.0 bn 1% 0.05%2014: 18 $1.1 bn 2% 0.26%2013: 16 $1.1 bn 2% 0.56%2012: 16 $957 mm 3% 0.20%2011: 17 $923 mm 4% 0.08%2010: 16 $682 mm 4% 0.16%2009: 14 $698 mm 4% 0.90%2008: 14 $560 mm 5% 0.20%2007: 15 $856 mm 3% 0.10%2006: 15 $1.1 bn 9% 0.85%
Small Cap Value Equity II:# of Portfolios
in Composite
Total Assets in
Composite
% of Firm
AUM
Composite
Dispersion*2015: 3 $478 mm 1% N/A2014: 4 $444 mm 1% N/A2013: 4 $370 mm 1% N/A2012: 4 $304 mm 1% N/A2011: 5 $272 mm 1% 0.10%2010: 6 $300 mm 2% 0.24%2009: 6 $239 mm 1% 0.98%2008: 7 $161 mm 1% 0.20%2007: 7 $320 mm 1% 0.06%2006: 7 $505 mm 4% 0.47%
Long/Short Equity:# of Portfolios
in Composite
Total Assets in
Composite
% of Firm
AUM
Composite
Dispersion*2015: 2 $687 mm 1% N/A2014: 2 $958 mm 1% N/A2013: 2 $965 mm 2% N/A2012: 2 $829 mm 3% N/A2011: 2 $626 mm 3% N/A2010: 2 $440 mm 2% N/A2009: 2 $189 mm 1% N/A2008: 2 $36 mm 0% N/A2007: 2 $75 mm 0% N/A2006: 3 $156 mm 1% N/A
Small/Mid Cap Value Equity:# of Portfolios
in Composite
Total Assets in
Composite
% of Firm
AUM
Composite
Dispersion*2015: 13 $814 mm 1% 0.14%2014: 10 $499 mm 1% 0.08%2013: 7 $481 mm 1% 0.13%2012: 7 $367 mm 1% 0.08%2011: 7 $327 mm 2% 0.10%2010: 7 $384 mm 2% 0.04%2009: 7 $350 mm 2% 0.32%2008: 5 $200 mm 2% 0.18%2007: 5 $299 mm 1% 0.02%2006: 4 $343 mm 3% 0.06%
Long/Short Research:# of Portfolios
in Composite
Total Assets in
Composite
% of Firm
AUM
Composite
Dispersion*2015: 1 $7.2 bn 9% N/A2014: 1 $6.0 bn 8% N/A2013: 1 $2.9 bn 6% N/A2012: 1 $492 mm 2% N/A2011: 1 $97 mm 0% N/A2010: 1 $9 mm 0% N/A2009: 1 $5 mm 0% N/A2008: 1 $3 mm 0% N/A2007: 1 $4 mm 0% N/A2006: 1 $3 mm 0% N/A
Global Equity:# of Portfolios
in Composite
Total Assets in
Composite
% of Firm
AUM
Composite
Dispersion*2015: 3 $432 mm 1% N/A2014: 1 $27 mm 0% N/A2013: 2 $66 mm 0% N/A2012: 2 $18 mm 0% N/A2011: 1 $8 mm 0% N/A2010: 1 $9 mm 0% N/A2009: 1 $8 mm 0% N/A
**2008: 1 $6mm 0% N/A* 2008 performance period is from July 1.International Equity:
# of Portfolios
in Composite
Total Assets in
Composite
% of Firm
AUM
Composite
Dispersion*2015: 1 $261 mm 0% N/A2014: 2 $33 mm 0% N/A2013: 2 $20 mm 0% N/A2012: 2 $18 mm 0% N/A2011: 1 $6 mm 0% N/A2010: 1 $6 mm 0% N/A2009: 1 $6 mm 0% N/A
**2008: 1 $4 mm 0% N/A** 2008 performance period is from July 1.
Firm Assets:Year Assets (mm) Year Assets (mm)*2015: $78,363 2010: $18,4182014: $73,250 2009: $17,2072013: $52,333 2008: $11,5402012: $29,023 2007: $26,5542011: $21,098 2006: $12,456
*Data are preliminary and unaudited.
Composite DispersionThe measurement of composite dispersion is calculated by the weighted average standard deviation of the annual account returns within the composite. Dispersion in composites with less than fi ve accounts included for the entire year is not considered meaningful and is denoted with “N/A”. Prior to January 1, 2007, the measurement of composite dispersion was calculated by determining the difference between the highest and lowest annual account returns within the composite. The three-year annualized standard deviation measures the variability of the composite and the benchmark returns over the preceding 36-month period. 2005 through 2006 fi rm assets represents BPAM assets under management prior to merger into RIM.
Other DisclosuresRIM has adjusted the S&P and Russell sector classifi cations to group stocks according to similar business product lines and correlation of stock returns. RIM’s classifi cations are similar to the major market indices in terms of breadth but may differ in terms of composition. All product characteristics and sector weightings are calculated using a representative portfolio. Risk statistics are calculated using composite data. Portfolio composition is subject to change and information contained in this publication may not be representative of the current portfolio. Effective January 1, 2011; RIM adopted a signifi cant cash fl ow policy for this composite in accordance with the Global Investment Performance Standards. If an external cash fl ow is greater than or equal to 10.0% of the beginning market value of the portfolio on the day of the fl ow, and greater than or equal to 10.0% of the beginning market value of the composite for that month then the portfolio is removed from the composite for the month that the fl ow occurred. The portfolio is then placed back into the composite in accordance with Firm’s inclusion policies and procedures.RIM participates in Initial Public Offerings (IPOs) as described in its Form ADV, Part II. IPO contributions to performance vary from year to year depending on availability and prevailing market conditions. IPO contributions may have a signifi cant positive effect on performance when initially purchased. Such positive performance should not be expected for future performance periods.
Global Long/Short Equity:# of Portfolios
in Composite
Total Assets in
Composite
% of Firm
AUM
Composite
Dispersion*2015: 1 $629 mm 1% N/A2014: 1 $125 mm 0% N/A
**2013: 1 $3 mm 0% N/A** 2013 performance period is from July 1.

Boston Partners 31
Boston PartnersPerformance Disclosures (continued)
Annual Fee SchedulesLarge Cap: 70 basis points ("bp") on the fi rst $10 million in assets; 50 bp on the next $40 million; 40 bp on the next $50 million; 30 bp thereafter. 130/30 Large Cap: 100 basis points ("bp") on the fi rst $10 million in assets; 80 bp on the next $40 million; 70 bp on the next $50 million; 60 bp thereafter. Premium Equity: 80 bp on the fi rst $25 million of assets; 60 bp on the next $25 million; 50 bp on the next $50 million; 40 bp thereafter. Mid Cap: 80 bp on the fi rst $25 million of assets; 60 bp thereafter. Small/Mid Cap, Small Cap, and Small Cap II: 100 bp on the fi rst $25 million of assets; 80 bp thereafter. Long/Short: 100 bp on total assets under management; plus 20% profi t participation. Long/Short Research: 150 basis points.
Global Equity and International Equity are: 75 basis points ("bp") on the fi rst $25 million in assets; 65 bp on the next $25 million; 55 bp on the next $50 million; 50 bp thereafter. Global Long/Short: 200 bp on total assets under management. Europe Equity: 75 basis points ("bp") on the fi rst $25 million in assets; 65 bp on the next $25 million; 55 bp on the next $50 million; 50 bp thereafter.
Corporate InformationRobeco Investment Management affi liated with listed corporations though common ownership. Robeco Investments services may be offered in the U.S. through Robeco Institutional Asset Management, U.S., SAM investment services may be offered in the U.S. by RobecoSAM USA, Inc., each an SEC Registered Investment Adviser registered under the Investment Advisers Act of 1940. Transtrend products, Robeco Investments and SAM products may be offered in the U.S. through Robeco Securities, LLC, member FINRA, SiPC. Harbor Capital Advisers products are distributed by Harbor Funds Distributors, Inc.
Additional BenchmarksThe MSCI World Index is a free fl oat-adjusted market capitalization weighted index that is designed to measure the equity market performance of developed markets. The MSCI World Index consists of the following 23 developed market country indexes: Australia, Austria, Belgium, Canada, Denmark, Finland, France, Germany, Hong Kong, Ireland, Israel, Italy, Japan, Netherlands, New Zealand, Norway, Portugal, Singapore, Spain, Sweden, Switzerland, the United Kingdom, and the United States (as of April 30, 2015).
MSCI Emerging Markets Standard Index (net return): The MSCI Emerging Markets indices are designed to measure the type of returns foreign portfolio investors might receive from investing in emerging market stocks that are legally and practically available to them. Constituents for the MSCI series are drawn from the MSCI stock universe based on size, liquidity, and their legal and practical availability to foreign institutional investors.
The MSCI World Small Cap Value Index captures small cap securities exhibiting overall value style characteristics across 23 Developed Markets countries. The value investment style characteristics for index construction are defi ned using three variables: book value to price, 12-month forward earnings to price and dividend yield. With 2,582 constituents, the index targets 14% coverage of the free fl oat-adjusted market capitalization in each country. Australia, Austria, Belgium, Canada, Denmark, Finland, France, Germany, Hong Kong, Ireland, Israel, Italy, Japan, Netherlands, New Zealand, Norway, Portugal, Singapore, Spain, Sweden, Switzerland, the UK and the U.S. (As of June 30, 2013.)
Additional Annual Fee SchedulesEmerging Markets Long/Short: 210 bp on total assets under management.

DISCUSSION SHEET
Regular Board Meeting – Thursday, June 9, 2016
ITEM #D3
Topic: Manulife Asset Management
Attendees: Scott Eversole, Managing Director, Institutional Sales Paul Boyne, Senior Managing Director, Senior Portfolio Manager
Discussion: As part of the equity structure study, Staff and NEPC presented the rationale for adding a value oriented investment manager to the global equity portfolio. Manulife Asset Management will present an overview of the firm and global equity product. Manulife Asset Management is the global asset management arm of Manulife Financial Corporation. Each investment team runs its own investment process, from research to implementation, but are able to leverage the broad resources of the larger firm. Manulife Asset Management has approximately $325 billion in assets under management, with more than 425 investment professionals operating out of offices in 16 countries.
Staff Recommendation: Approve an initial investment of $80 million in the Manulife Asset Management global equity
strategy, and authorize the Executive Director to negotiate and execute documentation, and perform all necessary acts and exercise all appropriate discretion to facilitate this investment.
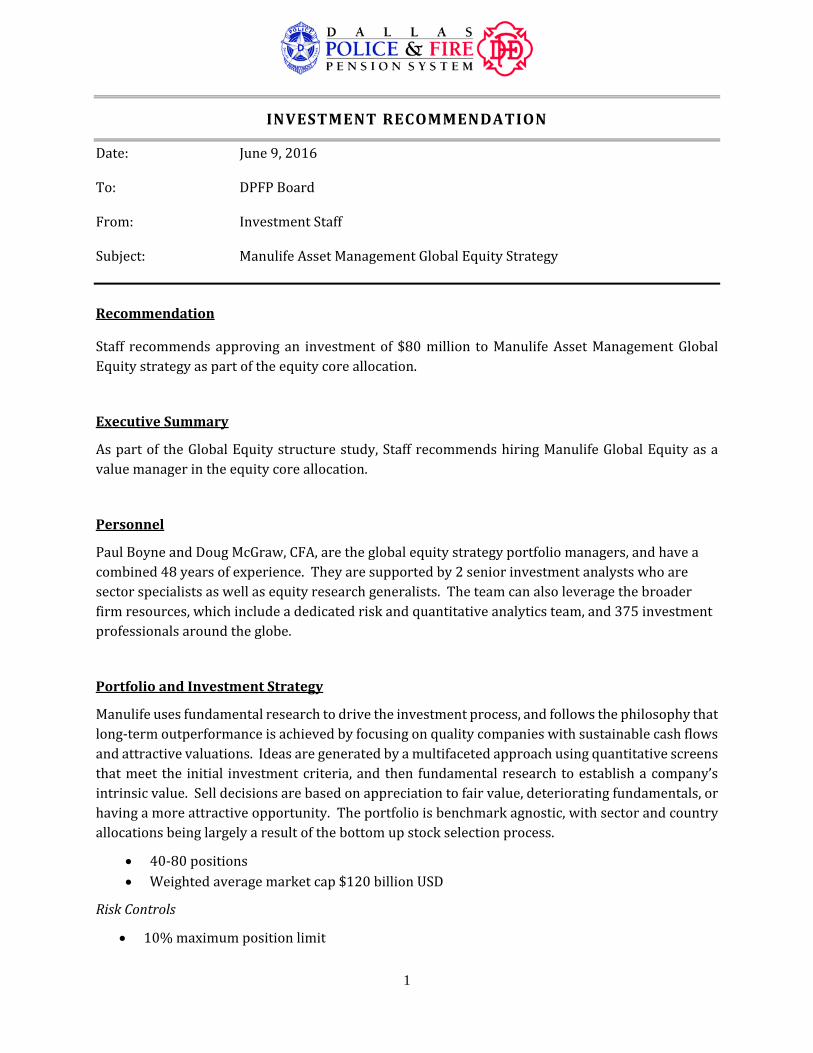
1
INVESTMENT RECOMMENDATION
Date: June9,2016 To: DPFPBoardFrom: InvestmentStaff Subject: ManulifeAssetManagementGlobalEquityStrategyRecommendation
Staff recommends approvingan investmentof $80million toManulifeAssetManagementGlobalEquitystrategyaspartoftheequitycoreallocation.
ExecutiveSummary
AspartoftheGlobalEquitystructurestudy,StaffrecommendshiringManulifeGlobalEquityasavaluemanagerintheequitycoreallocation.
Personnel
PaulBoyneandDougMcGraw,CFA,aretheglobalequitystrategyportfoliomanagers,andhaveacombined48yearsofexperience.Theyaresupportedby2seniorinvestmentanalystswhoaresectorspecialistsaswellasequityresearchgeneralists.Theteamcanalsoleveragethebroaderfirmresources,whichincludeadedicatedriskandquantitativeanalyticsteam,and375investmentprofessionalsaroundtheglobe.
PortfolioandInvestmentStrategy
Manulifeusesfundamentalresearchtodrivetheinvestmentprocess,andfollowsthephilosophythatlong‐termoutperformanceisachievedbyfocusingonqualitycompanieswithsustainablecashflowsandattractivevaluations.Ideasaregeneratedbyamultifacetedapproachusingquantitativescreensthatmeet the initial investmentcriteria,andthen fundamentalresearchtoestablishacompany’sintrinsicvalue.Selldecisionsarebasedonappreciationtofairvalue,deterioratingfundamentals,orhavingamoreattractiveopportunity.Theportfolioisbenchmarkagnostic,withsectorandcountryallocationsbeinglargelyaresultofthebottomupstockselectionprocess.
40‐80positions Weightedaveragemarketcap$120billionUSD
RiskControls
10%maximumpositionlimit

2
50%sectorlimit 4‐7%trackingerrorannually Riskmonitoringfortrackingerror,systematicrisk,scenarioanalysis
Process
QuantitativeScreensbasedonqualityincome(sustainablecashflowswithhighdividend),aPiotroskiScore(nineoperatingandbalancesheetmetrics),valuationwithinpeerindustrygroups,andbestideasfromacrosstheManulifeglobalnetwork.
FundamentalAnalysisoffranchiseandbusinessquality,financialposition,managementquality,operatingandfreecashflowsustainability,inordertoderiveafairvalueassessment.
Performance

3
Pricing
Proposedpricingstructure:
0‐$35 million 0.60% $35 ‐ $60 million 0.55% over $60 million 0.45%
FitforDPFPPortfolio
Asdescribedintheglobalequitystructurestudy,Manulifeisamostlylargecapvalueorientedglobalequitymanager.TheinvestmentwouldbeweightedequallywithOFI,WalterScott,andManulifetocomprisetheequitycore.

The following pages were extracted for convenience from the NEPC Global Equity Manager Search
March 2016

Investment Firm/Product Profile
Jeff Markarian, Sr. Research ConsultantSource: NEPC and eVestment
April 2015
Manulife Asset ManagementGlobal Equity
Firm DescriptionManulife Asset Management is the global asset management arm of Manulife Financial Corporation. Manulife Asset Management and its affiliates provide asset management solutions for institutional investors and investment funds in key markets around the world across a broad range of asset classes. These include equity, fixed income and alternative investments such as real estate, timber, farmland, as well as asset allocation strategies. Manulife Asset Management has offices in 17 countries, with more than 300 investment professionals. Particularly, the firm employs large investment teams in Canada and Asia and smaller teams in Europe and Japan. Manulife prides itself on harboring a boutique-like environment at the investment team level, but with the support of a broader global organization.
NEPC Investment ThesisThe value creation within the Manulife global equity strategy stems from the teams long term benchmark agnostic approach that focuses on the identification of companies that are cheap from an intrinsic value approach. Through the identification of quality companies that are both cheap and have strong franchise business that generate high free cash flow the strategy should produce value above and beyond the MSCI World Index.
PeopleThe key individuals associated with the management of the Global Equity Strategy are portfolio managers Paul Boyne and Doug McGraw, CFA. In addition to portfolio management, the team also consists of senior investment analyst, Uday Chatterjee, CFA. Together Paul, Doug, and Uday perform research, generate ideas and uncover opportunities. Each team member on the team is a generalist and can research stocks based in any region or industry around the globe. In addition to being generalists each team member has a sector specialization based off of prior industry experience. The global equity team at Manulife has the ability to leverage research conducted by all other investment teams at the firm.
PhilosophyThe investment team believes that long-term outperformance can be achieved by purchasing quality companies with attractive valuations and sustainable cash flows and taking advantage of the market's focus on short-term factors. The process is unconstrained, bottom up stock selection based.
94

Investment Firm/Product Profile
Manulife Asset ManagementGlobal Equity
Investment StrategyThe investment team's process begins by identifying stocks through a series of screening metrics or the teams experience and prior research. The team will leverage three external screens to identify potential companies: a screen of traditional valuation measures for global industry groups, a screen of cash flow returns on invested capital and a screen of dividend yield and low financial leverage combined with improving fundamentals. The last source of idea generation is composed of ideas from Manulife Asset Management portfolio managers and analysts, globally.
Stocks identified as potential investment candidates will then undergo comprehensive fundamental research by the investment team. Research comprises of a detailed fundamental analysis of the business, including strengths, weaknesses, opportunities and risks together with the construction of a full financial model including the team’s forecasts for future years. The team will look to find the appropriate combination of the following metrics: Franchise and Business quality, Analysis of the company’s financial position, Analysis of management quality, and Operating and free cash flow sustainability.
Approximately 80% of research for the Strategy is performed internally by the investment team. The team spends considerable time conducting comprehensive fundamental analysis of companies. They research and analyze relevant data through such channels as research analysts, consultants, industry contacts and industry competitors.
The remaining 20% of the research for the Strategy is sourced externally. The investment team uses external sources to help validate or complement its research. External sources include broker/dealers, Bloomberg, Deustche Bank’s Piotroski screen, Societe Generale’s Quality Income screen, Empirical Partners’ valuation screen, Credit Suisse Holt, Gartner and street contacts, among others. Use of external research enables team members to diversify information sources, evaluate investment perspectives that are contrary to their own investment thesis and provide additional guidance in industries that merit further consideration. Analysts and portfolio managers never rely exclusively on such sources without performing their own due diligence.
95

Investment Firm/Product Profile
Manulife Asset ManagementGlobal Equity
PortfolioThe final portfolio is benchmark agnostic and does not have relative risk controls surrounding country and sector weightings, but they tend to stay near benchmark allocations from an overall sector basis. At the sub industry level they are willing to take large bets relative to the index, for example the portfolio has been as much as 17% invested in media companies while the index was 2%. The final portfolio will be a concentrated 40-80 names.
Performance ExpectationsThe portfolio will typically do well in down markets. In high growth and or momentum markets the strategy should tend to underperform. In addition a rapidly rising bull market is likely a head wind for the strategy. Positive performance should be tied to the extent that free cash flow yield is being rewarded in the market.
96
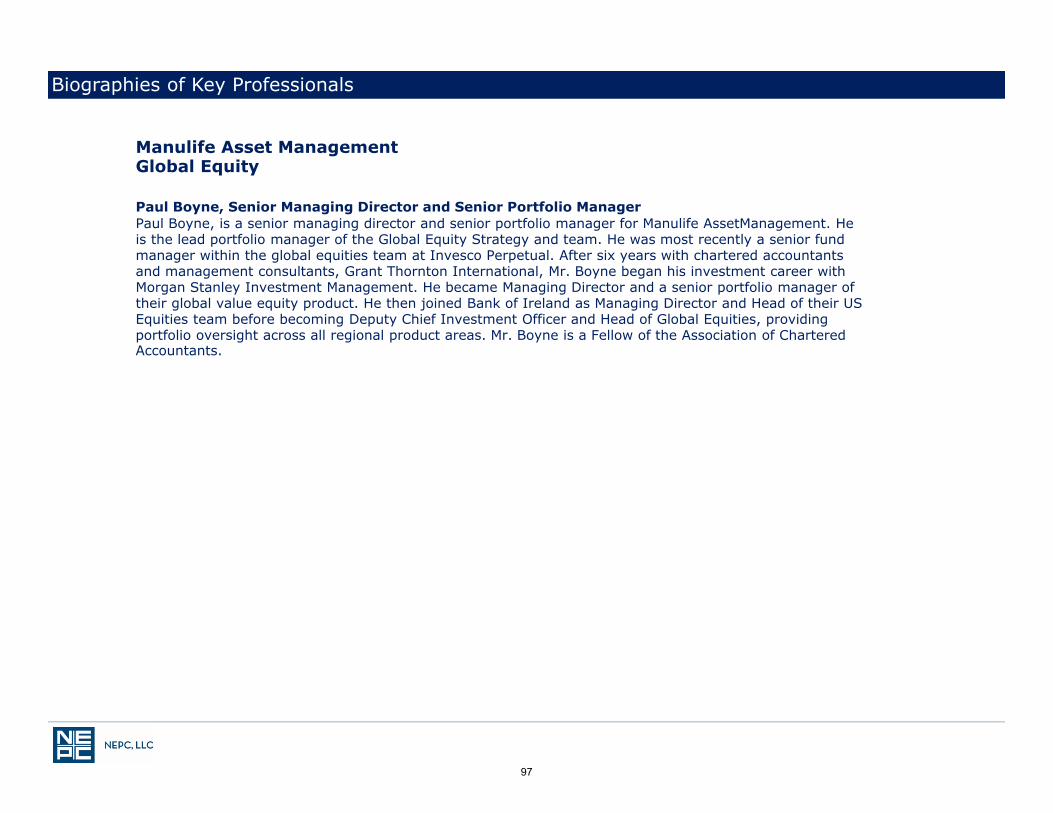
Biographies of Key Professionals
Manulife Asset ManagementGlobal Equity
Paul Boyne, Senior Managing Director and Senior Portfolio ManagerPaul Boyne, is a senior managing director and senior portfolio manager for Manulife AssetManagement. He is the lead portfolio manager of the Global Equity Strategy and team. He was most recently a senior fund manager within the global equities team at Invesco Perpetual. After six years with chartered accountants and management consultants, Grant Thornton International, Mr. Boyne began his investment career with Morgan Stanley Investment Management. He became Managing Director and a senior portfolio manager of their global value equity product. He then joined Bank of Ireland as Managing Director and Head of their US Equities team before becoming Deputy Chief Investment Officer and Head of Global Equities, providing portfolio oversight across all regional product areas. Mr. Boyne is a Fellow of the Association of Chartered Accountants.
97

For Institutional Use Only. Not for distribution to the public.
Global Equity Strategy
Prepared for Dallas Police & Fire Pension System
For a discussion of the risks associated with this strategy, please see the Investment Considerations page at the end of the presentation.
Paul BoyneSenior Managing Director, Senior Portfolio Manager
Scott EversoleManaging Director, Institutional Sales and Business Development2121 N. California Blvd., Suite 290Walnut Creek, CA 94596Office: (925) 974-3315 Cell: (857) 265-6715Email: [email protected]
June 9, 2016

For Institutional Use Only. Not for distribution to the public.
A Long Tenure in Global Equity Investing
As of March 31, 2016
Investment Management Team
Additional Resources
Over 425 Equity and Fixed IncomeInvestment Professionals located in
16 countries and territories
Dedicated Investment Risk and Quantitative Analytics Team
Global PortfolioSpecialists
RoleYears’ Industry
Experience Oversight
Paul Boyne Lead Portfolio Manager 29 Energy, Materials, Consumer Staples
Doug McGraw, CFA Portfolio Manager 21 Health Care, Telecom
Uday Chatterjee, CFA Senior Investment Analyst 11Consumer Discretionary, Information Technology, Consumer Staples
Stephen Hermsdorf Senior Investment Analyst 20 Financials, Industrials, Utilities
Marcia Irwin, CFA Global Portfolio Specialist 25Communications and strategic positioning of the strategy with clients, prospects and consultants
2PRS.297994
The investment team members are all global generalists in addition to having designated sector oversight.

For Institutional Use Only. Not for distribution to the public.
Seek High Quality Companies at Attractive Valuations
Philosophy:
We believe long-term outperformance can be achieved by taking advantage of the market’s
disproportionate focus on short-term factors.
Franchise Management Team
Balance Sheet
Valuation Discount
We seek quality companiesthat have a strong:
3PRS.297994

For Institutional Use Only. Not for distribution to the public.
0
5
10
15
20
25
0 5 10 15 20
MAM Global Equity Composite (Net)Outperformance vs. MSCI ACWI-ND Over Monthly Rolling Three Year Periods (Jan 2010–Mar 2016)
Consistent Long-Term Risk-Adjusted PerformanceeVestment Performance as of March 31, 2016
Top quintile risk-adjusted performance Strong downside market protection
Consistent outperformance
4
Composite inception date: January 2010Universe: eVestment Global All Cap Core
PRS.297994
Average 3yr Excess Return: 4.56%Periods Outperformed: 100%
Results displayed in US Dollar (USD) 1 MSCI ACWI-ND; 2 1/2010-3/2016
Since Inception Performance Risk Stats
MA
M G
loba
l Equ
ity C
ompo
site
Net
of F
ees
3 Ye
ar R
etur
ns (%
)
MSCI ACWI-ND 3 Year Returns (%)The chart line represents a 0% outperformance, an illustrative scenario in which the composite returned the same as the benchmark. Above the line is overperformance and below the line is underperformance. Scatter plots are the three year annualized rolling returns in US$, shown monthly with periods ending January 2010 through March 2016.

For Institutional Use Only. Not for distribution to the public.
High Conviction Portfolio
40-80 NamesWatchlist
Fundamental Research Drives the Investment Process
5
For illustrative purposes only.
FundamentalResearchUnderstand the Quality of the
Business
Build the Model
Conduct Multi-Scenario
ValuationAnalysis
High return on investment
Sustainable Cash Flow
Reasonable Leverage
Solid Management
Quality Upside to Fair Value
Scenario Analysis
Multiple Valuation Methods
Valuation
Idea Generation
PRS.297994
ScreeningQualitative

For Institutional Use Only. Not for distribution to the public.
Strong balance sheetwith a AAA debt rating
Shareholder value focused
Consistent dividend increases
Disciplined product philosophy focused on
category dominance
Returns on capital are well in excess of their cost of capital
Fundamental ResearchUnderstand the Quality of the Business
6
For illustrative purposes only.
High Return on Investments
Cash Flow Generation
Management Quality
AppropriateLeverage
Investment Example: Company J
PRS.297994

For Institutional Use Only. Not for distribution to the public.
Rigorous common format
In-depth full historical detail
Robust five years of proprietary divisional forecasts
Continually updated
Fundamental ResearchBuild the Model
7
For illustrative purposes only.
PRS.297994

For Institutional Use Only. Not for distribution to the public.
Portfolio ConstructionInvesting in the Best Risk-Adjusted Upside Opportunities
8
For illustrative purposes only.
Stock A Stock B Stock C Stock D Stock E
Portfolio40-80 Names
Stock Z Stock Y Stock X Stock W Stock V
Watchlist
Position sizing iscommensurate to upside to Fair Value and Upside/Downside Ratio
Stocks are researchedand ready to go whenvaluation is attractive
Sell Discipline Reach Fair Value Deteriorating fundamentals More attractive opportunity
Buy Discipline Confirmed quality Attractive valuation
PRS.297994
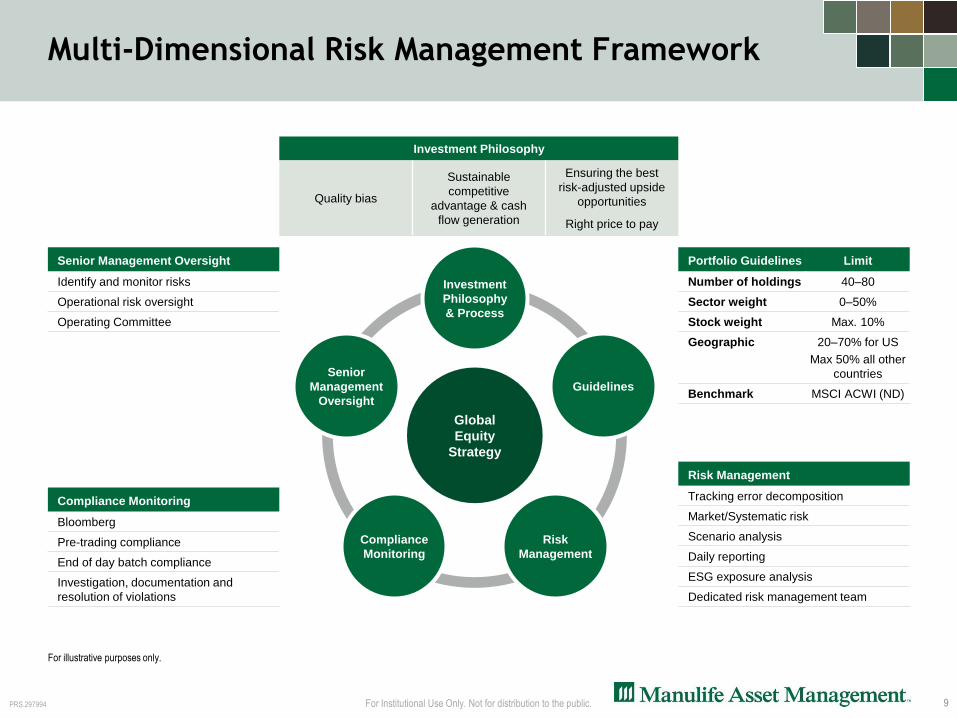
For Institutional Use Only. Not for distribution to the public.
Multi-Dimensional Risk Management Framework
For illustrative purposes only.
Investment Philosophy
Quality bias
Sustainable competitive
advantage & cash flow generation
Ensuring the best risk-adjusted upside
opportunities
Right price to pay
Senior Management Oversight
Identify and monitor risks
Operational risk oversight
Operating Committee
Compliance Monitoring
Bloomberg
Pre-trading compliance
End of day batch compliance
Investigation, documentation and resolution of violations
Portfolio Guidelines Limit
Number of holdings 40–80
Sector weight 0–50%
Stock weight Max. 10%
Geographic 20–70% for USMax 50% all other
countries
Benchmark MSCI ACWI (ND)
Global Equity
Strategy
Investment Philosophy & Process
Senior Management
OversightGuidelines
Risk Management
Compliance Monitoring
Risk Management
Tracking error decomposition
Market/Systematic risk
Scenario analysis
Daily reporting
ESG exposure analysis
Dedicated risk management team
PRS.297994 9

For Institutional Use Only. Not for distribution to the public.
Consistent Quality Characteristics Over Timeas of March 31, 2016
Source: Manulife Asset Management
10PRS.297994
Top Ten Holdings (%) Country Global Equity Strategy
Johnson & Johnson United States 4.01 Arthur J. Gallagher & Co. United States 3.62 Microsoft United States 3.61 British American Tobacco United Kingdom 3.52 Royal Philips Netherlands 3.16 Wells Fargo United States 3.04 Apple United States 3.04 SES SA FDR Luxembourg 3.01 Verizon United States 3.00 Novartis Switzerland 2.99 Total 33.03
CharacteristicsGlobal Equity
Strategy MSCI All Country World (Net) Index
Wtd. Avg. Market Cap ($M) 120,437 92,132
Number of Holdings 48 2,479
Number of Countries 10 45
Price/Book Ratio (x) 2.32 1.97
P/E Ratio (1 yr forward) (x) 14.88 15.11
Debt/Capital (%) 38.70 52.70
Dividend Yield (%) 3.18 2.67
ROE (%) 13.80 10.77
10
11
12
13
14
15
16
17
12/31/2009 12/31/2010 12/30/2011 12/31/2012 12/31/2013 12/31/2014 12/31/2015
Return on Equity
MAM Global Equity MSCI ACWI
30
35
40
45
50
55
60
12/31/2009 12/31/2010 12/30/2011 12/31/2012 12/31/2013 12/31/2014 12/31/2015
Debt/Capital
MAM Global Equity MSCI ACWI
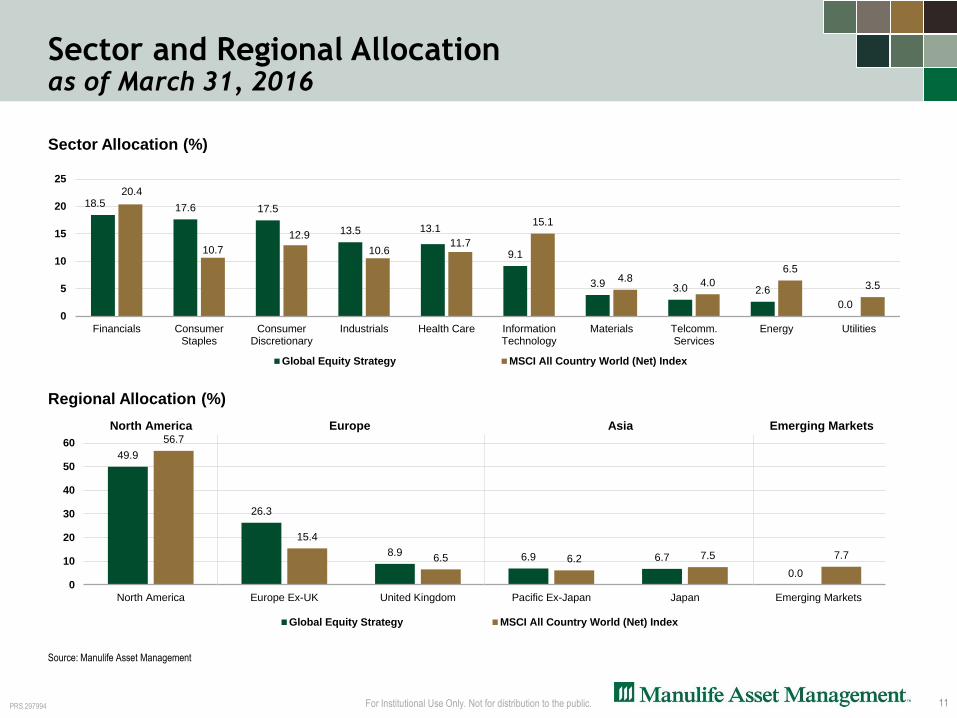
For Institutional Use Only. Not for distribution to the public.
Sector and Regional Allocationas of March 31, 2016
Source: Manulife Asset Management
49.9
26.3
8.9 6.9 6.70.0
56.7
15.4
6.5 6.2 7.5 7.7
0
10
20
30
40
50
60
North America Europe Ex-UK United Kingdom Pacific Ex-Japan Japan Emerging Markets
Global Equity Strategy MSCI All Country World (Net) Index
North America Europe Asia Emerging Markets
18.5 17.6 17.5
13.5 13.1
9.1
3.9 3.0 2.60.0
20.4
10.712.9
10.611.7
15.1
4.8 4.06.5
3.5
0
5
10
15
20
25
Financials ConsumerStaples
ConsumerDiscretionary
Industrials Health Care InformationTechnology
Materials Telcomm.Services
Energy Utilities
Global Equity Strategy MSCI All Country World (Net) Index
Sector Allocation (%)
Regional Allocation (%)
11PRS.297994
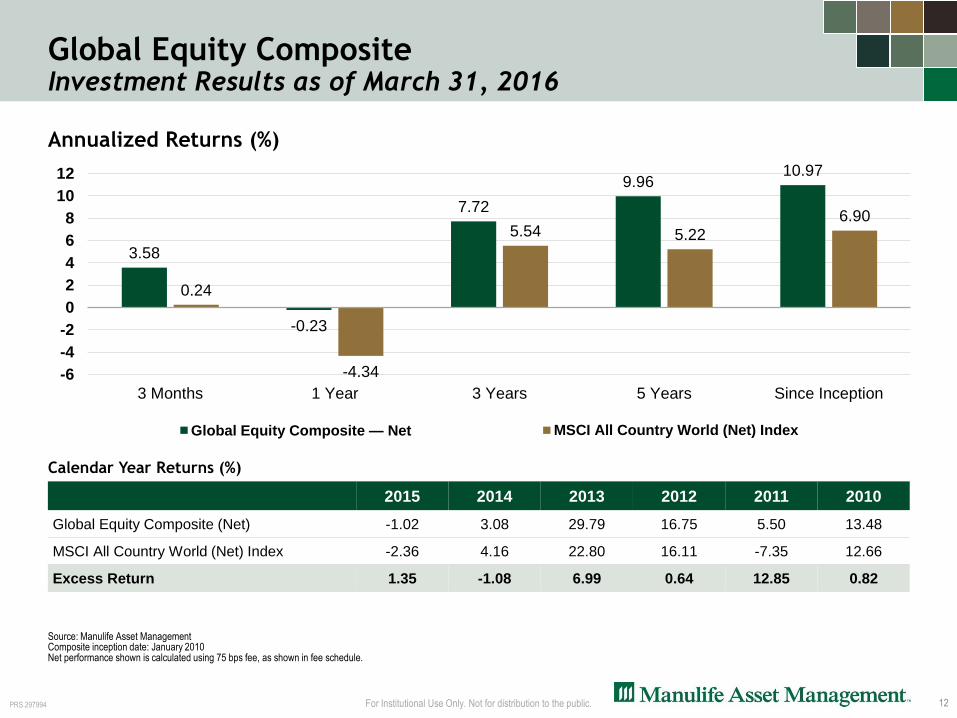
For Institutional Use Only. Not for distribution to the public.
Calendar Year Returns (%)
2015 2014 2013 2012 2011 2010 Global Equity Composite (Net) -1.02 3.08 29.79 16.75 5.50 13.48
MSCI All Country World (Net) Index -2.36 4.16 22.80 16.11 -7.35 12.66
Excess Return 1.35 -1.08 6.99 0.64 12.85 0.82
Global Equity CompositeInvestment Results as of March 31, 2016
Source: Manulife Asset ManagementComposite inception date: January 2010Net performance shown is calculated using 75 bps fee, as shown in fee schedule.
12
Annualized Returns (%)
PRS.297994
3.58
-0.23
7.729.96
10.97
0.24
-4.34
5.54 5.226.90
-6-4-202468
1012
3 Months 1 Year 3 Years 5 Years Since Inception
Global Equity Composite — Net MSCI All Country World (Net) Index

For Institutional Use Only. Not for distribution to the public.
Institutional Investment Management Fee Schedule
Minimum account sizes may apply.
Standard Global Equity Strategy
Basis Points AUM
75 bps on the first $25 million
65 bps on the next $75 million
50 bps thereafter
PRS.297994 13
Negotiated Global Equity Fee Schedule for Dallas Police & Fire Pension System*
Basis Points AUM
60 bps on the first $35 million
55 bps on the next $25 million
45 bps thereafter
*10% discount off of the effective negotiated fee should Dallas Police and Fire award a second mandate with Manulife Asset Management.
For Institutional Use Only. Not for distribution to the public.
Appendix
PRS.297994 14

For Institutional Use Only. Not for distribution to the public.
Biographies
Paul Boyne is a senior managing director and senior portfolio manager for Manulife Asset Management. He is the lead portfolio manager of Global Equity strategy and team. He was most recently a senior fund manager within the global equities team at Invesco Perpetual. After six years with chartered accountants and management consultants, Grant Thornton International, Paul began his investment career with Morgan Stanley Investment Management and became Managing Director and a senior portfolio manager of their global value equity product. He then joined Bank of Ireland as Managing Director and Head of their US Equities team before becoming Deputy Chief Investment Officer and Head of Global Equities, providing portfolio oversight across all regional product areas. Paul is a Fellow of the Association of Chartered Accountants.
Education: Michael Smurfit Graduate School of Business, University College, Dublin, MBS, 2002
Joined Company: 2013
Began Career: 1987
Doug McGraw, CFA, is a managing director and portfolio manager for Manulife Asset Management. He was most recently a portfolio manager within the global equities team at Invesco Perpetual. Doug began his investment career as an investment analyst for the First National Bank of SW Ohio before joining the US Peace Corps, where he was based in Ukraine as a volunteer, and then in Washington D.C. as a recruiter. Doug resumed his investment career with Morgan Stanley Investment Management as an investment analyst before becoming a portfolio manager within their Global Value Equity team. He is a CFA charterholder.
Education: Miami University, BS in Finance, 1994; University of Notre Dame, MBA, 2001
Joined Company: 2013
Began Career: 1995
Stephen Hermsdorf, is a managing director, senior investment analyst at Manulife Asset Management, responsible for identifying and researching global investment opportunities for the Global Equity strategy and team. Most recently, Stephen was a portfolio manager at Hermes Global Equities where he provided fundamental research and portfolio management with a focus on the global financial services sector. Previously, he worked at Fidelity Management & Research as an equity analyst covering the insurance and food & beverage industries. Prior to that, he was a private equity analyst at HabourVest Partners and a technology investment banking analyst at Robertson Stephens & Company.
Education: Harvard University, BA in Economics, 1995; University of Chicago Booth School of Business, MBA in Accounting,
Strategy and Finance, 2004
Joined Company: 2015
Began Career: 1996
PRS.297994 15

For Institutional Use Only. Not for distribution to the public.
Biographies
Uday Chatterjee, CFA, is a director and senior investment analyst at Manulife Asset Management working on the Global Equity team. Previously he was an investment analyst on Manulife’s Intrinsic Value team. Prior to joining the company, he was a vice president for Silver Lane Advisors, advising financial services firm clients on merger and acquisition transactions. He began his career in 2005 as an analyst at Berkshire Capital Securities, supporting merger, acquisition and valuation advisory activities in the financial services sector. He is a CFA charterholder, and a member of the Boston Security Analysts Society.
Education: Duke University, BSE in Biomedical Engineering, BSE in Electrical Engineering, BS Economics, 2004; Master of Engineering
Management, 2005; Kellogg School of Management, Northwestern University, MBA 2011
Joined Company: 2011
Began Career: 2005
Scott Eversole is managing director at Manulife Asset Management, responsible for institutional sales and business development in the western half of the US. Scott joined the company from McKinley Capital where he was responsible for direct sales and client service to the western US institutional marketplace. Prior to that, Scott has spent a number of years at Turner Investments where he was responsible for establishing relationships with institutional investors and investment consultants in the US. Scott’s previous industry experience was as vice president for large plan sales at mPower Investment Advisors, regional manager at Transamerica Asset Management and sales and marketing director with CPIC International. Scott started his career with Aetna Life Insurance Company departing as regional director for Retirement Plan Services.
Education: Tulane University, BS in Economics
Joined Company: 2013
Began Career: 1986
PRS.297994 16

For Institutional Use Only. Not for distribution to the public.
Manulife Asset Management (US) Global Equity Composite
17
Creation Date: 03/18/2013 Inception Date: 01/01/2010 Reporting Currency: USD
Schedule of Calendar Year Returns and Assets
Year EndGross of Fees
Return (%) Net of FeesReturn (%)
Benchmark Return (%)
Composite 3-Yr Std. Dev. (%)
Benchmark 3-Yr Std. Dev. (%)
Number of Portfolios End
of PeriodComposite
Dispersion (%)
Total Assets End of Period
($Thousands)
Total Firm AssetsEnd of Period ($Thousands)
2015 -0.27 -1.02 -0.87 10.65 10.80 <=5 N/A 707,621 206,551,496 2014 3.86 3.08 4.94 9.95 10.23 <=5 N/A 634,716 205,333,492 2013 30.77 29.79 26.68 11.93 13.54 <=5 N/A 579,230 193,266,946 2012 17.63 16.75 15.84 14.93 16.74 <=5 N/A 101 141,020,851 2011 6.30 5.50 -5.55 N/A N/A <=5 N/A 309,534 127,138,709 2010 14.33 13.48 11.76 N/A N/A <=5 N/A 246,007 126,491,016
Firm Definition
Manulife Asset Management (US) ("the Firm”) comprises Manulife Asset Management (US) LLC (“MAM US”), Manulife Asset Management (North America) Limited (“MAM NA”) and Manulife Asset Management Trust Company-(“MAM TC”). Effective January 1, 2011 the Firm was redefined to include MAM NA to reflect the alignment of the underlying businesses of the two firms. Effective June 22, 2011 the Firm was redefined to include the MAM TC, the then newly formed institutional investment management company, and now an affiliate of MAM US. Total Firm Assets reported prior to 1/1/2011 are the combination of assets from both MAM US and MAM NA.
Compliance Statement
Manulife Asset Management (US) claims compliance with the Global Investment Performance Standards (GIPS®) and has prepared and presented this report in compliance with the GIPS standards. Manulife Asset Management (US) or predecessor firms have been independently verified for periods 1/1/1993 to 12/31/2014. The verification reports are available upon request. Verification assesses whether (1) the firm has complied with all the composite construction requirements of the GIPS standards on a firm-wide basis and (2) the firm’s policies and procedures are designed to calculate and present performance in compliance with the GIPS standards. Verification does not ensure the accuracy of any specific composite presentation.
General Disclosure
A complete list of the Firm’s composite descriptions and policies regarding valuing portfolios, calculating performance, and preparing GIPS compliant presentations are available upon request. All returns reflect the reinvestment of dividends and other earnings. Gross performance results do not reflect the deduction of investment management fees, and are net of commissions and foreign withholding tax. Net performance results reflect the application of the highest incremental rate of the standard investment advisory fee schedule to gross performance results. Actual fees may vary depending on, among other things, the applicable fee schedule and portfolio size. Advisory fees are available upon request. Dispersion of annual returns is measured by an asset-weighted standard deviation calculation of gross of fee returns. Past performance is not a guarantee of future results.
Composite Description
The Global Equity strategy seeks long-term capital appreciation by employing an unconstrained, bottom-up stock selection process based on disciplined fundamental research with the aim to create a diversified portfolio of quality global equities of any size from around the world that demonstrate compelling value and generate sustainable cash flows. The composite consists of accounts managed at a prior firm prior to 3/19/2013. Performance results from the prior firm have been linked to results achieved at Manulife Asset Management (US). The reduction in composite assets as of 12/18/2012 is a result of the lift-out of the investment team from another firm. Portfolios have been sub-advised by an affiliated company since 3/1/2013.
Fee Schedule
This presentation is intended for institutional investors and the standard investment advisory fee is 0.75% on the first $25 million 0.65% on the next $75 million and 0.50% thereafter.
Benchmark Description
MSCI World (Net) Total Return Index is a free float-adjusted market capitalization weighted index that is designed to measure the equity market performance of developed markets, where dividends are reinvested after the removal of withholding taxes.

For Institutional Use Only. Not for distribution to the public.
Investment Considerations
Any performance information shown is the strategy composite gross of fees, including advisory fees and other expenses an investor would incur, but net of transaction costs, unless otherwise noted. Past performance is not
indicative of future results. Net performance results reflect the application of the highest incremental rate of the standard investment advisory fee schedule to gross performance results, unless otherwise indicated. Actual
fees may vary depending on, among other things, the applicable fee schedule, portfolio size and/or investment management agreement. For example, if $100,000 were invested and experienced a 10% annual return
compounded monthly for 10 years, its ending value, without giving effect to the deduction of advisory fees, would be $270,704 with annualized compounded return of 10.47%. If an advisory fee of 0.95% of the average
market value of the account were deducted monthly for the 10-year period, the annualized compounded return would be 9.43% and the ending dollar value would be $246,355.
Any performance information shown is supplemental to the GIPS-compliant presentation. If performance information is shown, the GIPS-compliant presentation is included as a part of this information.
Any characteristics, guidelines, constraints or other information provided for the material above is representative of the investment strategy and is provided for illustrative purpose only. They may change at any time and may
differ for a specific account. The account presented was selected by the firm as a representative account that is deemed to best represent this management style. Each client account is individually managed; actual holdings
will vary for each client and there is no guarantee that a particular client’s account will have the same characteristics as described herein. Any information about the holdings, asset allocation, or sector diversification is
historical and is not an indication of future performance or any future portfolio composition, which will vary. Portfolio holdings are representative of the strategy, are subject to change at any time and are not a
recommendation to buy or sell a security. The securities identified and described do not represent all of the securities purchased, sold or recommended for the portfolio. It should not be assumed that an investment in these
securities or sectors was or will be profitable.
No investment strategy or risk management technique can guarantee returns or eliminate risk in any market environment.
Diversification or asset allocation does not guarantee a profit nor protect against loss in any market. The indices referenced herein are broad-based securities market indices and used for illustrative purposes only. They have
been selected as they are well known and are easily recognizable. Broad-based securities indices are not subject to fees and expenses typically associated with managed accounts or investment funds. Investments cannot
be made directly into an index. The performance of the indices represents unmanaged, passive buy-and-hold strategies, investment characteristics and risk/return profiles that differ materially from managed accounts or
investment funds, and an investment in a managed account or investment fund is not comparable to an investment in such indices or in the securities that comprise the indices. Investments of the managed account or
investment fund may be illiquid, making, at times, fair market valuation impossible or impracticable. As a result, valuation of the managed account or investment fund may be volatile, reducing the utility of comparison to any
index whose underlying securities are priced according to market value, such as the indices. Investors should be aware that the managed account or investment fund may incur losses both when major indices are rising and
when they are falling.
MSTR.271514 18
For Institutional Use Only. Not for distribution to the public.
Important Information
© 2016 Manulife Asset Management. All rights reserved. Manulife Asset Management, Manulife and the block design are trademarks of The Manufacturers Life Insurance Company and are used by it, and by its affiliates
under licence.
This confidential document is for the exclusive use of the intended institutional investor or their agents and may not be transmitted, reproduced or used in whole or in part for any other purpose, nor may it be disclosed or
made available, directly or indirectly, in whole or in part, to any other person without our prior written consent.
Manulife Asset Management is the asset management arm of Manulife Financial Corporation ("Manulife"), a global organization that operates in many different jurisdictions worldwide. Manulife Asset Management’s
diversified group of companies and affiliates provide comprehensive asset management solutions for institutional investors, investment funds and individuals in key markets around the world. Manulife Asset Management has
investment offices in the United States, Canada, the United Kingdom, Japan, Hong Kong, and throughout Asia. Any private asset management activities described herein are conducted by various entities within the Manulife
group of companies, including regulated insurance companies, investment advisors and other entities in the U.S., Canada and other jurisdictions. Capabilities may be aggregated across entities for illustrative purposes.
These materials have not been reviewed by, are not registered with any securities or other regulatory authority, and may, where appropriate, be distributed by the following Manulife entities in their respective jurisdictions.
Additional information about Manulife Asset Management may be found at www.manulifeam.com.
Canada: Manulife Asset Management Limited, Manulife Asset Management Investments Inc., Manulife Asset Management (North America) Limited and Manulife Asset Management Private Markets (Canada) Corp.
Australia and Hong Kong: Manulife Asset Management (Hong Kong) Limited. Indonesia: Pt Manulife Asset Manajmen Indonesia. Japan: Manulife Asset Management (Japan) Limited. Malaysia: Manulife Asset Management
Services Berhad. Thailand: Manulife Asset Management (Thailand) Company Limited. Singapore: Manulife Asset Management (Singapore) Pte. Ltd. Taiwan: Manulife Asset Management (Taiwan) Co. Ltd. United Kingdom:
Manulife Asset Management (Europe) Limited which is authorised and regulated by the Financial Conduct Authority. United States: Manulife Asset Management (US) LLC, Declaration Management & Research LLC,
Hancock Capital Investment Management, LLC and Hancock Natural Resource Group, Inc. Vietnam: Manulife Vietnam Fund Management Company Ltd.
No Manulife entity makes any representation that the contents of this presentation are appropriate for use in all locations, or that the transactions, securities, products, instruments or services discussed in this presentation
are available or appropriate for sale or use in all jurisdictions or countries, or by all investors or counterparties. All recipients of this presentation are responsible for compliance with applicable laws and regulations.
Any general discussions or opinions contained within this document regarding securities or market conditions represent the view of either the source cited or Manulife Asset Management as of the day of writing and are
subject to change. There can be no assurance that actual outcomes will match the assumptions or that actual returns will match any expected returns. The information and/or analysis contained in this material have been
compiled or arrived at from sources believed to be reliable but Manulife Asset Management does not make any representation as to their accuracy, correctness, usefulness or completeness and does not accept liability for
any loss arising from the use hereof or the information and/or analysis contained herein. Information about the portfolio’s holdings, asset allocation, or country diversification is historical and will be subject to future change.
Neither Manulife Asset Management or its affiliates, nor any of their directors, officers or employees shall assume any liability or responsibility for any direct or indirect loss or damage or any other consequence of any person
acting or not acting in reliance on the information contained herein.
The information in this material may contain projections or other forward-looking statements regarding future events, targets, management discipline or other expectations, and is only as current as of the date indicated. The
information in this material including statements concerning financial market trends, are based on current market conditions, which will fluctuate and may be superseded by subsequent market events or for other reasons.
This material was prepared solely for informational purposes and does not constitute, and is not intended to constitute, a recommendation, professional advice, an offer, solicitation or an invitation by or on behalf of Manulife
Asset Management to any person to buy or sell any security or to adopt any investment strategy, and shall not form the basis of, nor may it accompany nor form part of, any right or contract to buy or sell any security or to
adopt any investment strategy. Nothing in this material constitutes investment, legal, accounting, tax or other advice, or a representation that any investment or strategy is suitable or appropriate to your individual
circumstances, or otherwise constitutes a personal recommendation to you. Prospective investors should take appropriate professional advice before making any investment decision. In all cases where historical
performance is presented, note that past performance is not indicative of future results and you should not rely upon it as the basis for making an investment decision.
In the United Kingdom and in the European Community the data and information presented is directed solely at persons who would be constituted as Professional Investors in accordance with the Markets in Financial
Instruments Directive (2004/39/EC) as transposed into the relevant jurisdiction. In Switzerland, this presentation may be made available only to Qualified Investors as defined in the Swiss Collective Investment Schemes Act
of 23 June 2006 (as amended). Further, the information and data presented does not constitute, and is not intended to constitute, "marketing" as defined in the Alternative Investment Fund Managers Directive.
Hong Kong: This material is intended for Professional Investors within the meaning of the Securities and Futures Ordinance.
MSTR.271514 19

For Institutional Use Only. Not for distribution to the public.
Important Information (continued)
China: No invitation to offer, or offer for, or sale of any security will be made to the public in China (which, for such purposes, does not include the Hong Kong or Macau Special Administrative Regions or Taiwan) or by any
means that would be deemed public under the laws of China. The offering document of the subject fund(s) has not been submitted to or approved by the China Securities Regulatory Commission or other relevant
governmental authorities in China. Securities may only be offered or sold to Chinese investors that are authorized to buy and sell securities denominated in foreign exchange. Prospective investors resident in China are
responsible for obtaining all relevant approvals from the Chinese government authorities, including but not limited to the State Administration of Foreign Exchange, before purchasing an interest in the subject fund(s).
Korea: This material is intended for Designated Professional Investors under the Financial Investment Services and Capital Market Act ("FSCMA"). Manulife Asset Management does not make any representation with
respect to the eligibility of any recipient of these materials to acquire any interest in any security under the laws of Korea, including, without limitation, the Foreign Exchange Transaction Act and Regulations thereunder. An
interest may not be offered, sold or delivered directly or indirectly, or offered, sold or delivered to any person for re-offering or resale, directly or indirectly, in Korea or to any resident of Korea, except in compliance with the
FSCMA and any other applicable laws and regulations. The term “resident of Korea” means any natural person having his place of domicile or residence in Korea, or any corporation or other entity organized under the laws
of Korea or having its main office in Korea.
Singapore: This material is intended for Institutional Investors as defined in Securities and Futures Act.
United States: Manulife Asset Management (US) LLC (“MAM US”) and Manulife Asset Management (North America) Limited (“MAM NA”) are indirect wholly owned subsidiaries of Manulife. They may provide advisory
services, and may market such services, under the brand name “John Hancock Asset Management”, and MAM US may also use “Sovereign Asset Management.” These brand names may, as applicable, be described as “a
division of” MAM US or MAM NA, but are not separate legal entities.
MSTR.271514 20

DISCUSSION SHEET
Regular Board Meeting – Thursday, June 9, 2016
ITEM #D4
Topic: Ashmore Global Special Situations IV extension
Discussion: The Ashmore Global Special Situation Fund 4, LP commenced in 2007 and is approaching the expiration of the Fund on July 31, 2016. The General Manager has requested that limited partners consent to a one-year extension in order to wind down the remaining assets in the fund and maximize return. This extension is the second extension of the Fund and requires approval of 50% of the limited partner interest. The manager will continue to manage the wind down process without charging a management fee. DPFP represents 5.07% of total limited partners’ interest. DPFP committed and funded $70 million to the Fund, and has received approximately $37 million in distributions with DPFP’s remaining interest in the Fund valued at approximately $5.3 million. Since inception the Fund has generated an IRR of -8.77%.
Staff Recommendation: Approve the one year extension of the Ashmore Global Special Situation Fund 4 as requested
by the General Partner.

1
INVESTMENT RECOMMENDATION
Date: June9,2016 To: DPFPBoardFrom: InvestmentsStaff Subject: AshmoreGlobalSpecialSituationsFund4LPExtensionRecommendation
StaffrecommendsapprovingtheAshmoreGlobalSpecialSituationsFund4LP(“GSSF4”,the“Fund”)extension,whichextendsthedurationofthefundbyoneyearfromJuly31,2016toJuly31,2017.
ExecutiveSummary
TheGeneralPartnerofGSSF4isrequestingaoneyearextensionoftheFundtermfromJuly31,2016toJuly31,2017inordertofacilitateanorderlyrealizationoftheremainingassets.AsofDecember31,2015GSSF4hasanetassetvalueofapproximately$103million,representedbythreeremainingholdingsinthefundwhichareinvarioussaleor liquidationstages.DPFP’s interest inthefundisvaluedatapproximately$5.3million.
GSSF4wasoriginallyscheduledtoterminateonJuly31,2015.OnJune12,2015theGeneralPartnerelected to extend the life of the Fund by one year through July 31, 2016 to permit the orderlyliquidationoftheFund.PursuanttothetermsoftheLimitedPartnershipAgreement,theFundcanbeextendedforuptotwoadditionalone‐yearextensionssubjecttoreceivingconsent frommorethan50%ininterestoftheLimitedPartnersoftheFund.TheGeneralPartnerhasagreedtocontinuetomanage the assetsduring the extension according to the termsof theAgreement butwithoutcharginganymanagementfeeorincentivefee.
Staff recommends approving the extension request to allow theGeneral Partner to continue theorderlywinddownprocessalreadystarted inordertomaximizetherealizationof theremainingassetsintheFund.
Performance
GSSF4isa2007vintageyearfund.Sinceinception,DPFPfundedthefull$70millioncommitmenttothe Fund and has received accumulative distributions in the amount of $37,357,681 with theremaininginterestvaluedat$5.3million. AsofDecember31,2015,theFundhasa‐8.77%annualizedreturnsinceinception.
Process
Staffreviewedthecontract,performance,history,andholdingsofGSSF4,aswellasconductedphoneandemailcommunicationswiththeGeneralPartner.StaffalsonotifiedandconsultedwithNEPConthismatter.StaffandNEPCconcurontherecommendationtoapprovetheoneyearextension.

255 State Street | Boston, MA 02109 | TEL: 617.374.1300 | WWW.NEPC.COM
BOSTON | ATLANTA | CHARLOTTE | CHICAGO | DETROIT | LAS VEGAS | SAN FRANCISCO
To: Trustees & Staff
Dallas Police and Fire Pension System
From: NEPC Private Markets
Date: May 20, 2016
Subject: Ashmore Global Special Situations Fund 4 – Extension Request
Issue Ashmore Global Special Situations Fund 4 Limited Partnership was originally scheduled to terminate on June 12, 2015. Since then, the General Partner has requested one 1-year extension and has now requested a second extension. The Fund is in the liquidating stage, but due to the illiquid nature of the remaining assets, Ashmore is requesting additional time to orderly wind down the remaining assets by July 31, 2017. The General Partner explored the option to put the Fund into automatic dissolution; however, by doing so, it would prevent Ashmore from distributing interim payments until all remaining assets were to be sold. There are approximately ten investments remaining in the Fund with a total value of $101.3M, two of which represent 88% of the portfolio. With the approved extension, Ashmore will be able to periodically distribute proceeds as assets are sold. Per the terms of the Limited Partnership Agreement, the Fund can be extended for one additional year through July 31, 2017 if the General Partner receives consent from 50% of Limited Partners interest. DPFP represents 5.07% of total LP interests. Recommendation NEPC recommends that DPFP agrees to the extension as presented by the General Partner. The acceptance of the extension will allow the manager to continue the orderly liquidation of the remaining assets, which NEPC believes is in the best interest of the Limited Partners. DPFP’s portions of the remaining net assets held in the portfolio are valued at $5.2M as of December 31, 2015. Additionally, Ashmore is no longer charging a management fee, so the only fees associated with the extension will be Administrative and Custodian in nature. Foundation for the Recommendation In forming our recommendation, NEPC performed the following activities:
1. Reviewed the Wind Down Extension Letter dated May 9, 2016 2. Reviewed the Limited Partner Consent to the Wind Down Extension of
Ashmore Global Special Situations Fund 4 Limited Partnership

DISCUSSION SHEET
Regular Board Meeting – Thursday, June 9, 2016
ITEM #D5
Topic: NEPC: First Quarter 2016 Investment Performance Analysis and Fourth Quarter 2015 Private Markets Review
Attendees: Rhett Humphreys, Partner Keith Stronkowsky, Senior Consultant
Discussion: NEPC, DPFP’s investment consultant, will present the above reports. NEPC will also discuss their reporting responsibilities for Investment Monitoring, as outlined in Section VII of the recently adopted Investment Policy Statement, which will be included in the second quarter performance reports.
Dallas Police & Fire Pension System Investment SummaryQuarter Ending March 31, 2016
June 9, 2016
Rhett Humphreys, CFA Partner
Keith Stronkowsky, CFASenior Consultant
NEPC Updates 2
Executive Summary 4
Market Update 12
Performance & Asset Allocation 33
Portfolio Review 52
Page
Table of ContentsDallas Police & Fire Pension
1

NEPC Updates
2
NEPC Client RecognitionsWe are excited to announce that three of NEPC’s clients were nominated for the 2016 “Chief Investment Officer of the Year” Investor Intelligence Award. The winners will be announced at Institutional Investor’s annual Roundtable for Public Funds, taking place April 27-29, 2016 in Los Angeles, CA. We wish them luck!• Arn Andrews, CIO, City of San Jose Department of Retirement Services• Ryan Parham, CIO, Arizona Public Safety Personnel Retirement
Systems• Girard Miller, CIO, Orange County Employees Retirement System
NEPC Client Recognitions (continued)A number of NEPC clients were named on TrustedInsight’s list of Top 30 Pension Fund Chief Investment Officers. According to the January 2016 issue, “these 30 chief investment officers manage more than $1.3 trillion in assets for millions of retirees in the United States. These professionals are at the forefront of an industry that’s slow to evolve, under constant scrutiny and vital to the wellbeing of many average Americans. Nonetheless, they operate at the top of their field to prudently protect the benefits of their constituency.” NEPC clients that made the list include:• Scott Evans, CIO, New York Employees Retirement System -
$78.5B AUM• David Villa, CIO, State of Wisconsin Investment Board -
$102B AUM• Gary Dokes, CIO, Arizona State Retirement System - $31B
AUM• Michael Trotsky, Executive Director, CIO, Massachusetts
PRIM Board - $62B AUM • Robert Beale, CIO, Louisiana State Employees’ Retirement
System - $5.2B AUM• Richard Shafer, CIO, Ohio Public Employees’ Retirement
System - $91.5B AUM• James Perry, CIO, Dallas Police and Fire Pension System -
$3B AUM• William Coaker, CIO, San Francisco Employees Retirement
System - $20.3B AUM• Bob Jacksha, CIO, New Mexico Education Retirement Fund -
$11B AUM• Girard Miller, CIO, Orange County Employees Retirement
System - $12.1B AUM• Sam Masoudi, CFA, CAIA, CIO, Wyoming Retirement System
- $7.8B AUM
NEPC ResearchRecent White Papers 2016 First Quarter Market Thoughts Market Chatter: Is it really
All About China? (January 2016) Market Chatter: Monetary Policy
Divergence and Developed Currency (April 2016)
Highlights of First Quarter Happenings at NEPC
NEPC UpdatesMarch 31, 2016
Upcoming Events ‘Opportunities for Future Investments’ is
the theme for NEPC’s 21st Annual Investment Conference – May 10-11, 2016 at the Hynes Convention Center in Boston, MA. Keynote Speakers are: Michael Cembalest, Chairman of Market and Investment Strategy,
J.P. Morgan Asset Management
Dr. Dambisa Moyo, Global Economist and Author
Register at www.NEPC.com
3

Executive Summary
4

• US economic expansion continues as Federal Reserve begins policy shift– Economic conditions and health of US consumers remain supportive for growth– US Corporate earnings quality has deteriorated under pressure from profit margin
weakness and a relatively strong dollar
• Central Banks continue to dictate the global investment outlook– Market expectations of Fed action extremely muted over next 36 months; a surprise Fed
rate increase poses risk to both US equities and fixed income– ECB and BoJ likely to maintain and expand accommodative monetary policies– Easing in China is broadly stimulative in the near term but currency policy is unpredictable
• Large currency adjustments across most emerging countries have provided a foundation to support improved capital market returns
– Continued political and economic reform is needed across EM to stimulate economic growth– Chinese Yuan (RMB) depreciation has been incremental relative to other EM FX adjustments
and fears of further adjustment remain a near-term concern
• Embrace illiquidity in opportunistic credit and private credit strategies – Stressed credit liquidity magnifies the scale of price movements in traditional credit assets– Credit markets ability to absorb an exodus from crowded positions is challenged
First Quarter 2016 Market Observations
5

• Prospects of low US core bond returns warrant a more positive tilt to US equity, especially following sell-offs
– Macro policy remains supportive but corporate earnings quality is deteriorating– Lower returns expected but pockets of opportunity can be found in US equity and credit
• Overweight non-US developed market equities – Central bank support and dollar strength provide a positive economic backdrop– Small-cap equities offer purest opportunity to benefit from local earnings recovery– EAFE equity markets offer the potential for strong returns relative to US equities
• Overweight emerging market small-cap and consumer focused strategies relative to broad equity mandates
– Valuations and long-term fundamentals suggest a strategic overweight– China uncertainty, dollar pressure and idiosyncratic country risks temper excitement
• Seek tactical fixed income strategies but preserve duration exposure– US duration continues to have a role in a diversified and risk-aware portfolio– TIPS offer an attractive duration profile with inflation expectations at secular lows– Credit selection is critical as credit cycle matures and spreads contract in recent rally
• Private market opportunities are the preferred access point as energy market distress continues to evolve
– Return opportunities of private strategies are compelling but suggest patience
General Actions for Clients
6

2009 2010 2011 2012 2013 2014 2015 JAN FEB MAR YTD
Barclays US Strips 20+ Yr -36.0% 10.9% 58.5% 3.0% -21.0% 46.4% -3.7% 6.9% 4.6% -0.3% 11.4%
JPM GBI-EM Global Diversified 22.0% 15.7% -1.8% 16.8% -9.0% -5.7% -14.9% 0.4% 1.4% 9.1% 11.0%
Barclays US Govt/Credit Long 1.9% 10.2% 22.5% 8.8% -8.8% 19.3% -3.3% 2.1% 2.2% 2.8% 7.3%
Citi WGBI 2.6% 5.2% 6.4% 1.7% -4.0% -0.5% -3.6% 1.4% 2.9% 2.7% 7.1%
Barclays US Long Credit 16.8% 10.7% 17.1% 12.7% -6.6% 16.4% -4.6% 0.3% 1.7% 4.8% 6.8%
FTSE NAREIT Equity REITs 28.0% 28.0% 8.3% 18.1% 2.5% 30.1% 3.2% -3.4% -0.4% 10.1% 6.0%
MSCI EM 78.5% 18.9% -18.4% 18.2% -2.6% -2.2% -14.9% -6.5% -0.2% 13.2% 5.7%
JPM EMBI Global Diversified 29.8% 12.2% 7.4% 17.4% -5.3% 7.4% 1.2% -0.2% 1.9% 3.3% 5.0%
Barclays US Corporate HY 58.2% 15.1% 5.0% 15.8% 7.4% 2.5% -4.5% -1.6% 0.6% 4.4% 3.4%
Barclays US Agg Bond 5.9% 6.5% 7.8% 4.2% -2.0% 6.0% 0.6% 1.4% 0.7% 0.9% 3.0%
Barclays US Agg Interm 6.5% 6.2% 6.0% 3.6% -1.0% 4.1% 1.2% 1.3% 0.5% 0.6% 2.3%
Barclays Municipal 12.9% 2.4% 10.7% 6.8% -2.6% 9.1% 3.3% 1.2% 0.2% 0.3% 1.7%
S&P 500 26.5% 15.1% 2.1% 16.0% 32.4% 13.7% 1.4% -5.0% -0.1% 6.8% 1.4%
Credit Suisse Leveraged Loan 44.9% 10.0% 1.8% 9.4% 6.2% 2.1% -0.4% -0.7% -0.6% 2.6% 1.3%
Russell 1000 28.4% 16.1% 1.5% 16.4% 33.1% 13.2% 0.9% -5.4% 0.0% 7.0% 1.2%
Barclays US Govt/Credit 1-3 Yr 3.8% 2.8% 1.6% 1.3% 0.6% 0.8% 0.7% 0.5% 0.1% 0.4% 1.0%
Bloomberg Commodity 18.9% 16.8% -13.3% -1.1% -9.5% -17.0% -24.7% -1.7% -1.6% 3.8% 0.4%
Russell 2500 34.4% 26.7% -2.5% 17.9% 36.8% 7.1% -2.9% -8.0% 0.7% 8.3% 0.4%
MSCI ACWI 34.6% 12.7% -7.4% 16.1% 22.8% 4.2% -2.4% -6.0% -0.7% 7.4% 0.2%
Russell 2000 27.2% 26.9% -4.2% 16.4% 38.8% 4.9% -4.4% -8.8% 0.0% 8.0% -1.5%
Credit Suisse Hedge Fund 18.6% 11.0% -2.5% 7.7% 9.7% 4.1% -0.7% -1.4% -1.1% N/A -2.5%
MSCI EAFE 31.8% 7.8% -12.1% 17.3% 22.8% -4.9% -0.8% -7.2% -1.8% 6.5% -3.0%
Alerian MLP 76.4% 35.9% 13.9% 4.8% 27.6% 4.8% -32.6% -11.1% -0.5% 8.3% -4.2%
Index Performance Summary as of 3/31/2016
Source: Morningstar Direct
7
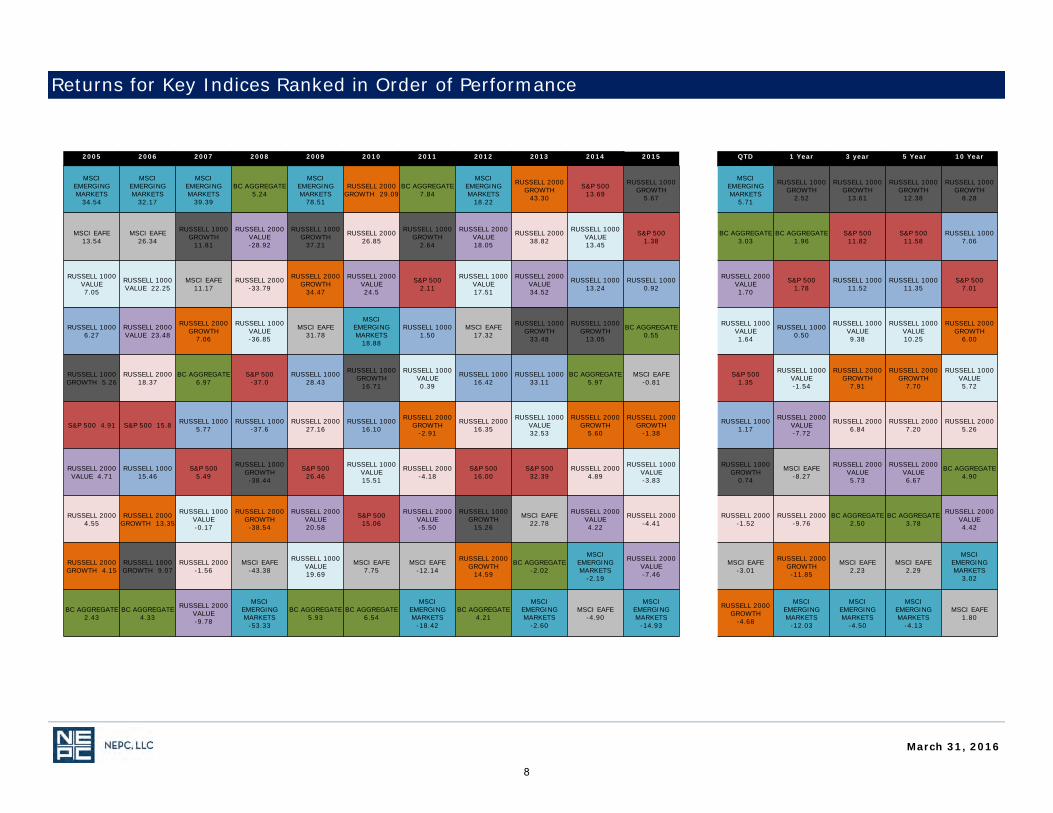
Returns for Key Indices Ranked in Order of Performance
March 31, 2016
2005 2006 2007 2008 2009 2010 2011 2012 2013 2014 2015 QTD 1 Year 3 year 5 Year 10 Year
MSCI EMERGING MARKETS
34.54
MSCI EMERGING MARKETS
32.17
MSCI EMERGING MARKETS
39.39
BC AGGREGATE 5.24
MSCI EMERGING MARKETS
78.51
RUSSELL 2000 GROWTH 29.09
BC AGGREGATE 7.84
MSCI EMERGING MARKETS
18.22
RUSSELL 2000 GROWTH
43.30
S&P 500 13.69
RUSSELL 1000 GROWTH
5.67
MSCI EMERGING MARKETS
5.71
RUSSELL 1000 GROWTH
2.52
RUSSELL 1000 GROWTH
13.61
RUSSELL 1000 GROWTH
12.38
RUSSELL 1000 GROWTH
8.28
MSCI EAFE 13.54
MSCI EAFE 26.34
RUSSELL 1000 GROWTH
11.81
RUSSELL 2000 VALUE -28.92
RUSSELL 1000 GROWTH
37.21
RUSSELL 2000 26.85
RUSSELL 1000 GROWTH
2.64
RUSSELL 2000 VALUE 18.05
RUSSELL 2000 38.82
RUSSELL 1000 VALUE 13.45
S&P 500 1.38
BC AGGREGATE 3.03
BC AGGREGATE 1.96
S&P 500 11.82
S&P 500 11.58
RUSSELL 1000 7.06
RUSSELL 1000 VALUE 7.05
RUSSELL 1000 VALUE 22.25
MSCI EAFE 11.17
RUSSELL 2000 -33.79
RUSSELL 2000 GROWTH
34.47
RUSSELL 2000 VALUE 24.5
S&P 500 2.11
RUSSELL 1000 VALUE 17.51
RUSSELL 2000 VALUE 34.52
RUSSELL 1000 13.24
RUSSELL 1000 0.92
RUSSELL 2000 VALUE 1.70
S&P 500 1.78
RUSSELL 1000 11.52
RUSSELL 1000 11.35
S&P 500 7.01
RUSSELL 1000 6.27
RUSSELL 2000 VALUE 23.48
RUSSELL 2000 GROWTH
7.06
RUSSELL 1000 VALUE -36.85
MSCI EAFE 31.78
MSCI EMERGING MARKETS
18.88
RUSSELL 1000 1.50
MSCI EAFE 17.32
RUSSELL 1000 GROWTH
33.48
RUSSELL 1000 GROWTH
13.05
BC AGGREGATE 0.55
RUSSELL 1000 VALUE 1.64
RUSSELL 1000 0.50
RUSSELL 1000 VALUE 9.38
RUSSELL 1000 VALUE 10.25
RUSSELL 2000 GROWTH
6.00
RUSSELL 1000 GROWTH 5.26
RUSSELL 2000 18.37
BC AGGREGATE 6.97
S&P 500 -37.0
RUSSELL 1000 28.43
RUSSELL 1000 GROWTH
16.71
RUSSELL 1000 VALUE 0.39
RUSSELL 1000 16.42
RUSSELL 1000 33.11
BC AGGREGATE 5.97
MSCI EAFE -0.81
S&P 500 1.35
RUSSELL 1000 VALUE -1.54
RUSSELL 2000 GROWTH
7.91
RUSSELL 2000 GROWTH
7.70
RUSSELL 1000 VALUE 5.72
S&P 500 4.91 S&P 500 15.8 RUSSELL 1000 5.77
RUSSELL 1000 -37.6
RUSSELL 2000 27.16
RUSSELL 1000 16.10
RUSSELL 2000 GROWTH
-2.91
RUSSELL 2000 16.35
RUSSELL 1000 VALUE 32.53
RUSSELL 2000 GROWTH
5.60
RUSSELL 2000 GROWTH
-1.38
RUSSELL 1000 1.17
RUSSELL 2000 VALUE -7.72
RUSSELL 2000 6.84
RUSSELL 2000 7.20
RUSSELL 2000 5.26
RUSSELL 2000 VALUE 4.71
RUSSELL 1000 15.46
S&P 500 5.49
RUSSELL 1000 GROWTH -38.44
S&P 500 26.46
RUSSELL 1000 VALUE 15.51
RUSSELL 2000 -4.18
S&P 500 16.00
S&P 500 32.39
RUSSELL 2000 4.89
RUSSELL 1000 VALUE -3.83
RUSSELL 1000 GROWTH
0.74
MSCI EAFE -8.27
RUSSELL 2000 VALUE 5.73
RUSSELL 2000 VALUE 6.67
BC AGGREGATE 4.90
RUSSELL 2000 4.55
RUSSELL 2000 GROWTH 13.35
RUSSELL 1000 VALUE -0.17
RUSSELL 2000 GROWTH -38.54
RUSSELL 2000 VALUE 20.58
S&P 500 15.06
RUSSELL 2000 VALUE -5.50
RUSSELL 1000 GROWTH
15.26
MSCI EAFE 22.78
RUSSELL 2000 VALUE 4.22
RUSSELL 2000 -4.41
RUSSELL 2000 -1.52
RUSSELL 2000 -9.76
BC AGGREGATE 2.50
BC AGGREGATE 3.78
RUSSELL 2000 VALUE 4.42
RUSSELL 2000 GROWTH 4.15
RUSSELL 1000 GROWTH 9.07
RUSSELL 2000 -1.56
MSCI EAFE -43.38
RUSSELL 1000 VALUE 19.69
MSCI EAFE 7.75
MSCI EAFE -12.14
RUSSELL 2000 GROWTH
14.59
BC AGGREGATE -2.02
MSCI EMERGING MARKETS
-2.19
RUSSELL 2000 VALUE -7.46
MSCI EAFE -3.01
RUSSELL 2000 GROWTH -11.85
MSCI EAFE 2.23
MSCI EAFE 2.29
MSCI EMERGING MARKETS
3.02
BC AGGREGATE 2.43
BC AGGREGATE 4.33
RUSSELL 2000 VALUE -9.78
MSCI EMERGING MARKETS
-53.33
BC AGGREGATE 5.93
BC AGGREGATE 6.54
MSCI EMERGING MARKETS
-18.42
BC AGGREGATE 4.21
MSCI EMERGING MARKETS
-2.60
MSCI EAFE -4.90
MSCI EMERGING MARKETS
-14.93
RUSSELL 2000 GROWTH
-4.68
MSCI EMERGING MARKETS
-12.03
MSCI EMERGING MARKETS
-4.50
MSCI EMERGING MARKETS
-4.13
MSCI EAFE 1.80
8

• Plan Assets and Allocation– As of March 31, 2016, DPFP’s assets totaled $2.71 billion, a decrease of approximately $66.4
million during the quarter. • Net cash outflows of $73.5 million during the quarter• Net investment gains of $6.93 million during the quarter
• Performance– DPFP posted a 0.2% return during the quarter, ranking in the 86th percentile of public funds.
• 1-year annualized returns through March 31, 2016, were -6.6%, ranking in the 99th percentile.• 3-year annualized returns through March 31, 2016, were -2.4%, ranking in the 99th percentile.• 5-year annualized returns through March 31, 2016, were 0.4%, ranking in the 99th percentile.• 10-year annualized returns through March 31, 2016, were 2.0%, ranking in the 99th percentile.
Executive Summary
9

March 31, 2016
Market Value 3 Mo Rank 1 Yr Rank 3 Yrs Rank 5 Yrs Rank 7 Yrs Rank 10 Yrs Rank_
DPFP $2,654,819,256 -1.7% 99 -8.5% 99 -3.1% 99 0.0% 99 4.4% 99 1.8% 99Allocation Index 3.0% 1 4.5% 1 8.6% 1 7.3% 8 9.9% 50 5.3% 40Policy Index 2.4% 2 5.4% 1 7.8% 1 7.4% 7 11.3% 17 6.1% 5
InvestorForce Public DB Net Median 1.2% -1.5% 5.4% 5.8% 9.8% 5.1% XXXXX
Returns are net of fees
Dallas Police & Fire PensionTotal Fund Performance Summary
10

March 31, 2016
Dallas Police & Fire PensionTotal Fund Perfromance Detail
Returns shown on report are time weighted.Financial Composite date is 10/1/2005 and excludes all funds that are lagged.
Market Value($)
% ofPortfolio
3 Mo(%) Rank 1 Yr
(%) Rank 3 Yrs(%) Rank 5 Yrs
(%) Rank 7 Yrs(%) Rank 10 Yrs
(%) Rank Return(%) Since
_
DPFP 2,654,819,256 100.0 -1.7 99 -8.5 99 -3.1 99 0.0 99 4.4 99 1.8 99 6.1 Jun-96Allocation Index 3.0 1 4.5 1 8.6 1 7.3 8 9.9 50 5.3 40 7.2 Jun-96Policy Index 2.4 2 5.4 1 7.8 1 7.4 7 11.3 17 6.1 5 -- Jun-96
InvestorForce Public DB Net Median 1.2 -1.5 5.4 5.8 9.8 5.1 6.6 Jun-96DPFP Ex Debt 2,858,270,769 107.7 -1.7 99 -8.1 99 -2.9 99 0.1 99 4.5 99 1.8 99 6.1 Jun-96
Allocation Index Ex Debt 2.8 1 4.3 1 8.6 1 7.2 9 9.8 50 5.3 40 7.1 Jun-96DPFP Financial Composite 1,665,653,983 62.7 0.4 84 -6.5 99 2.2 99 3.7 96 11.0 24 4.3 84 4.9 Oct-05
InvestorForce Public DB Net Median 1.2 -1.5 5.4 5.8 9.8 5.1 5.4 Oct-05Global Equity 443,478,737 16.7 -0.9 61 -5.6 65 6.0 61 5.7 65 13.2 55 4.2 62 4.5 Jul-06
MSCI ACWI Gross 0.4 44 -3.8 52 6.1 60 5.8 63 13.2 56 4.6 52 4.8 Jul-06eA All Global Equity Net Median -0.2 -3.7 6.7 6.7 13.5 4.7 4.9 Jul-06
Private Equity 380,843,309 14.3 -4.2 -- -2.8 -- -9.2 -- -2.2 -- 0.3 -- 1.1 -- 2.0 Oct-05Russell 3000 + 3% 1.7 -- 2.7 -- 14.5 -- 14.3 -- 20.6 -- 10.1 -- 10.5 Oct-05
Global Bonds 134,223,263 5.1 7.2 -- 2.4 -- 0.8 -- 2.7 -- -- -- -- -- 2.9 Dec-10Barclays Global Aggregate 5.9 -- 4.6 -- 0.9 -- 1.8 -- 3.7 -- 4.3 -- 2.0 Dec-10
HIgh Yield 157,023,336 5.9 2.9 -- -10.3 -- -1.2 -- 3.2 -- -- -- -- -- 4.3 Dec-10Barclays Global High Yield 4.1 -- 0.6 -- 2.4 -- 5.1 -- 12.8 -- 7.4 -- 5.7 Dec-10
Bank Loans 50,529,116 1.9 0.6 -- -3.4 -- -- -- -- -- -- -- -- -- -- Dec-10S&P/LSTA Leveraged Loan Index 1.5 -- -1.3 -- 1.9 -- 3.2 -- 9.0 -- 4.3 -- 3.5 Dec-10
Private Credit 86,262,132 3.2 2.4 -- -- -- -- -- -- -- -- -- -- -- 2.4 Jan-16Barclays Global High Yield +2% 4.6 -- -- -- -- -- -- -- -- -- -- -- 4.6 Jan-16
Total Asset Allocation 354,455,179 13.4 2.0 38 -6.9 99 1.0 96 3.8 86 6.9 92 -- -- 2.8 Jul-07Total Asset Allocation Policy Index 2.0 39 -- -- -- -- -- -- -- -- -- -- -- Jul-07
eA Global Balanced Net Median 1.4 -1.7 4.2 5.7 10.1 4.8 3.8 Jul-07Natural Resources 285,859,684 10.8 0.2 -- 4.4 -- 7.4 -- 6.1 -- -- -- -- -- 4.4 Apr-15
Natural Resources Benchmark 9.1 -- 15.6 -- 13.9 -- 9.8 -- -- -- -- -- 15.6 Apr-15Global Infrastructure Composite 204,521,625 7.7 -2.3 -- -5.1 -- 0.2 -- -- -- -- -- -- -- 1.4 Jul-12
Global Infrastructure Benchmark 8.7 -- 13.7 -- 8.4 -- -- -- -- -- -- -- 8.1 Jul-12Real Estate Composite 644,657,934 24.3 -7.3 -- -18.8 -- -14.4 -- -9.5 -- -7.9 -- -4.1 -- 3.6 Mar-85
NCREIF Property Index 2.2 -- 11.8 -- 11.9 -- 11.9 -- 9.1 -- 7.6 -- 8.1 Mar-85Cash Equivalents 57,577,543 2.2 0.7 -- 1.4 -- 2.3 -- -- -- -- -- -- -- 1.4 Apr-15
91 Day T-Bills 0.1 -- 0.1 -- 0.1 -- 0.1 -- 0.1 -- 1.0 -- 0.1 Apr-15XXXXX
11
Q1 2016 Market Update
12

Broad Market Performance Summary as of 3/31/2016
/2015
Source: Bloomberg, Standard and Poors, Russell, MSCI, Barclays, Citigroup, JP Morgan *1 Yr Range: Represents range of cumulative high/low daily index returns for an investment made one year ago
‐35%
‐30%
‐25%
‐20%
‐15%
‐10%
‐5%
0%
5%
10%
15%
1 Yr Range
1 Yr Return
3 Month Return
13

Inflation has increased off lows Unemployment steadily improving
Corporate profits lower off secular highs Manufacturing trending higher after dip
US Economic Indicators
Source: Bloomberg, Federal Reserve, Bureau of Labor Statistics Source: Bloomberg, Bureau of Labor Statistics
Source: Bloomberg, Institute for Supply ManagementSource: Bloomberg, Bureau of Economic Analysis
60%
65%
70%
75%
80%
85%
90%
‐3%‐2%‐1%0%1%2%3%4%5%6%
1996
1997
1998
1999
2000
2001
2002
2003
2004
2005
2006
2007
2008
2009
2010
2011
2012
2013
2014
2015
CPI (LHS)Capacity Utilization (RHS)
0%2%4%6%8%
10%12%14%16%18%
1996
1997
1998
1999
2000
2001
2002
2003
2004
2005
2006
2007
2008
2009
2010
2011
2012
2013
2014
2015
US UnemploymentU‐6 Unemployment
6%
7%
8%
9%
10%
11%
12%
13%
1966
1968
1970
1972
1974
1976
1978
1980
1982
1984
1986
1988
1990
1992
1994
1996
1998
2000
2002
2004
2006
2008
2010
2012
2014
Corporate Profits (% of GDP)
35
40
45
50
55
60
65
1996
1997
1998
1999
2000
2001
2002
2003
2004
2005
2006
2007
2008
2009
2010
2011
2012
2013
2014
2015
US ISM PMI
14

Inflation remains muted Europe employment recovery lagging
Manufacturing in developed economies has lagged Leading indicators mostly neutral
International Economic Indicators
Source: Bloomberg, Japan Ministry of Internal Affairs and Communications, Eurostat Source: Bloomberg, Japan Ministry of Internal Affairs and Communications, Eurostat
Source: Bloomberg, OECDSource: Bloomberg, OECD, Eurostat
‐3%
‐2%
‐1%
0%
1%
2%
3%
4%
5%
Jan‐04
Oct‐04
Jul‐0
5
Apr‐06
Jan‐07
Oct‐07
Jul‐0
8
Apr‐09
Jan‐10
Oct‐10
Jul‐1
1
Apr‐12
Jan‐13
Oct‐13
Jul‐1
4
Apr‐15
Jan‐16
Japan CPI
Euro CPI0%
2%
4%
6%
8%
10%
12%
14%
Apr‐01
Mar‐02
Feb‐03
Jan‐04
Dec‐04
Nov‐05
Oct‐06
Sep‐07
Aug‐08
Jul‐0
9
Jun‐10
May‐11
Apr‐12
Mar‐13
Feb‐14
Jan‐15
Dec‐15
Europe UnemploymentJapan Unemployment
‐10%‐8%‐6%‐4%‐2%0%2%4%6%8%
10%
Mar‐06
Nov‐06
Jul‐0
7
Mar‐08
Nov‐08
Jul‐0
9
Mar‐10
Nov‐10
Jul‐1
1
Mar‐12
Nov‐12
Jul‐1
3
Mar‐14
Nov‐14
Jul‐1
5YoY % Chan
ge in
Man
ufacturing
GermanyFranceItalyJapan
97.0
98.0
99.0
100.0
101.0
102.0
103.0
Feb‐06
Oct‐06
Jun‐07
Feb‐08
Oct‐08
Jun‐09
Feb‐10
Oct‐10
Jun‐11
Feb‐12
Oct‐12
Jun‐13
Feb‐14
Oct‐14
Jun‐15
OECD Lead
ing Indicator SA
Euro AreaJapanUKCanada
15

EM inflation is varied by country Relatively healthy Debt/GDP ratios
Marginal improvement in account balance challenged countries
Emerging economies make up >50% of global output
Emerging Market Economic Indicators
Source: Bloomberg Source: Bloomberg, IMF
Source: Bloomberg, IMFSource: Bloomberg
‐2.0%
0.0%
2.0%
4.0%
6.0%
8.0%
10.0%
12.0%
Brazil China Mexico SouthAfrica
SouthKorea
Taiwan Turkey
CPI
Most Recent
1 Yr Previous
0%
20%
40%
60%
80%
100%
120%
Gross Gov't Debt as % of GDP
‐20%
‐15%
‐10%
‐5%
0%
5%
10%
15%
20%
Jun‐06
Jan‐07
Aug‐07
Mar‐08
Oct‐08
May‐09
Dec‐09
Jul‐1
0Feb‐11
Sep‐11
Apr‐12
Nov‐12
Jun‐13
Jan‐14
Aug‐14
Mar‐15
Oct‐15
Account Balan
ce (% of GDP)
Mexico Brazil South AfricaTurkey Malaysia Indonesia
0%10%20%30%40%50%60%70%80%90%
100%
1996
1997
1998
1999
2000
2001
2002
2003
2004
2005
2006
2007
2008
2009
2010
2011
2012
2013
2014
2015
2016
2017
2018
2019
GDP PPP as % of World
Developed
Emerging
16

Equity volatility decreasing off early year highs
Treasury rates experiencing periods of higher volatility
Sustained uptick in currency volatilities Commodity pricing volatility has increased
Volatility
Source: Bloomberg, CBOE Source: Bloomberg, Merrill Lynch
Source: Bloomberg, Merrill LynchSource: Bloomberg, Deutsche Bank
05
101520253035404550
Mar‐11
Jun‐11
Sep‐11
Dec‐11
Mar‐12
Jun‐12
Sep‐12
Dec‐12
Mar‐13
Jun‐13
Sep‐13
Dec‐13
Mar‐14
Jun‐14
Sep‐14
Dec‐14
Mar‐15
Jun‐15
Sep‐15
Dec‐15
Mar‐16
VIX Index
405060708090
100110120130
Apr‐11
Jul‐1
1Oct‐11
Jan‐12
Apr‐12
Jul‐1
2Oct‐12
Jan‐13
Apr‐13
Jul‐1
3Oct‐13
Jan‐14
Apr‐14
Jul‐1
4Oct‐14
Jan‐15
Apr‐15
Jul‐1
5Oct‐15
Jan‐16
MOVE Index
4
6
8
10
12
14
16
18
Mar‐11
Jun‐11
Sep‐11
Dec‐11
Mar‐12
Jun‐12
Sep‐12
Dec‐12
Mar‐13
Jun‐13
Sep‐13
Dec‐13
Mar‐14
Jun‐14
Sep‐14
Dec‐14
Mar‐15
Jun‐15
Sep‐15
Dec‐15
Mar‐16
CVIX Index579
11131517192123
May‐11
Aug‐11
Nov‐11
Feb‐12
May‐12
Aug‐12
Nov‐12
Feb‐13
May‐13
Aug‐13
Nov‐13
Feb‐14
May‐14
Aug‐14
Nov‐14
Feb‐15
May‐15
Aug‐15
Nov‐15
Feb‐16
Bloomberg Commodity 90D Vol
17

Major central bank policy divergence Fed’s ideal rate of policy firming above market expectations
Many developed central banks have maintained low interest rates
EM central bank policies have varied by circumstance
Central Banks
Source: Bloomberg, Federal Reserve, Bank of Japan, ECB, NEPC Source: Bloomberg, Federal Reserve, NEPC
Source: BloombergSource: Bloomberg
$0.00$0.50$1.00$1.50$2.00$2.50$3.00$3.50$4.00$4.50$5.00
2007 2008 2009 2010 2011 2012 2013 2014 2015 2016
Trillions (balan
ce sheet assets) Fed
ECB
BoJ
‐0.5%0.0%0.5%1.0%1.5%2.0%2.5%3.0%3.5%4.0%4.5%
2015 2016 2017 2018 2019 2020 2021
FOMC ParticipantsFOMC MedianFed Funds Futures
Long Term
‐1.0% 0.0% 1.0% 2.0% 3.0% 4.0%
AustraliaCanada
ECBJapan
New ZealandNorway
SingaporeSwitzerland
UKUS
Target central bank rate
1 Yr Previous
Current
0.0% 2.0% 4.0% 6.0% 8.0% 10.0% 12.0% 14.0% 16.0%
BrazilChinaIndia
IndonesiaMalaysiaMexicoPolandRussia
South AfricaSouth Korea
Turkey
Target central bank rate
1 Yr Previous
Current
18

Global valuations are mixed Earnings growth trending lower
Margins declining outside of EM Global equity returns have been negative over one year
Global Equity
Source: Bloomberg, Standard and Poors, MSCI *MSCI EAFE is ex UK Telecom Source: Bloomberg, Standard and Poors, MSCI
Source: Bloomberg, MSCISource: Bloomberg, MSCI
0
5
10
15
20
25
30
35
40
MSCI ACWI MSCI EAFE MSCI EM S&P 500
PE Ratio
+1 Std Dev ‐1 St Dev3/31/2015 3/31/2016
‐50%‐40%‐30%‐20%‐10%0%
10%20%30%40%50%
Apr‐06
Dec‐06
Aug‐07
Apr‐08
Dec‐08
Aug‐09
Apr‐10
Dec‐10
Aug‐11
Apr‐12
Dec‐12
Aug‐13
Apr‐14
Dec‐14
Aug‐15
Rolling 12‐M
o Chan
ge in
EBIT
S&P 500MSCI EAFEMSCI EM
0%
2%
4%
6%
8%
10%
12%
14%
1995
1996
1997
1998
1999
2000
2001
2002
2003
2004
2005
2006
2007
2008
2009
2010
2011
2012
2013
2014
2015
2016
Profit Margins
MSCI ACWIMSCI EAFEMSCI EMS&P 500
‐14%‐12%‐10%‐8%‐6%‐4%‐2%0%2%4%6%8%
MSCI ACWI MSCI ACWIIMI
MSCI EAFE MSCI EM SP 500
3 Month Return
1 Yr Return
19

Valuations near or above historical norms Growth recovery marked by inconsistency
Profit margins lower off highs Trailing performance has been mixed
US Equity
Source: Bloomberg, Standard and Poors, Russell *Russell 2000 PE is index adjusted positive Source: Bloomberg, Bureau of Economic Analysis
Source: Bloomberg, Standard and Poors, RussellSource: Bloomberg, Standard and Poors, Russell
0
5
10
15
20
25
30
35
S&P 500 Russell 2000 Russell 1000Growth
Russell 1000Value
PE Ratio
+1 Std Dev ‐1 St Dev3/31/2015 3/31/2016
‐10%
‐8%
‐6%
‐4%
‐2%
0%
2%
4%
6%
20152014201320122011201020092008200720062005
US Real GDP Growth
‐8%‐6%‐4%‐2%0%2%4%6%8%
10%12%
1991
1993
1995
1997
1999
2001
2003
2005
2007
2009
2011
2013
2015
Profit Margins
S&P 500Russell 2000
‐12%
‐10%
‐8%
‐6%
‐4%
‐2%
0%
2%
4%
SP 500 Russell 2500Russell 2000Russell 1000Growth
Russell 1000Value
3 Month Return
1 Yr Return
20
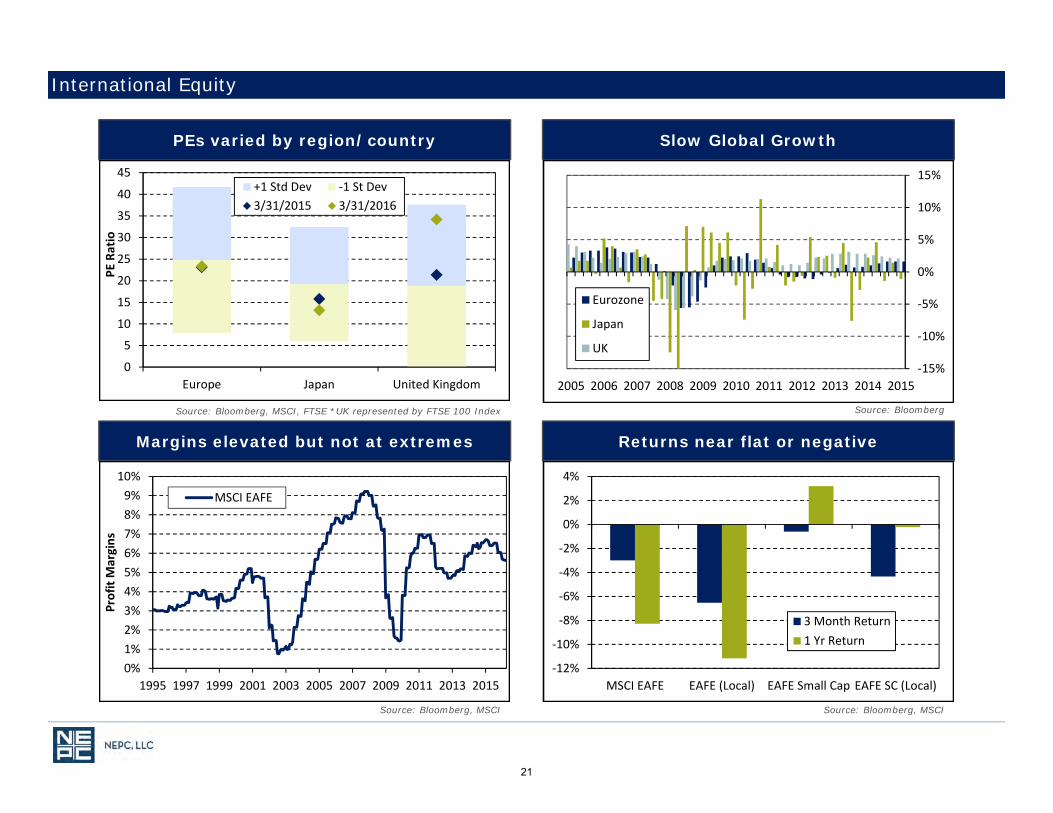
PEs varied by region/country Slow Global Growth
Margins elevated but not at extremes Returns near flat or negative
International Equity
Source: Bloomberg, MSCI, FTSE *UK represented by FTSE 100 Index Source: Bloomberg
Source: Bloomberg, MSCISource: Bloomberg, MSCI
0
5
10
15
20
25
30
35
40
45
Europe Japan United Kingdom
PE Ratio
+1 Std Dev ‐1 St Dev3/31/2015 3/31/2016
‐15%
‐10%
‐5%
0%
5%
10%
15%
20152014201320122011201020092008200720062005
Eurozone
Japan
UK
0%1%2%3%4%5%6%7%8%9%
10%
1995 1997 1999 2001 2003 2005 2007 2009 2011 2013 2015
Profit Margins
MSCI EAFE
‐12%
‐10%
‐8%
‐6%
‐4%
‐2%
0%
2%
4%
MSCI EAFE EAFE (Local) EAFE Small Cap EAFE SC (Local)
3 Month Return1 Yr Return
21

Regional valuations show divergence Slowing growth in major economies
Profit margins in line with history Recent rally in EM but one year returns mostly negative
Emerging Markets Equity
Source: Bloomberg, MSCI Source: Bloomberg
Source: Bloomberg, MSCISource: Bloomberg, MSCI
0
10
20
30
40
50
60
China Brazil South Africa India Russia South Korea
PE Ratio
+1 Std Dev ‐1 St Dev3/31/2015 3/31/2016
‐15%
‐10%
‐5%
0%
5%
10%
15%
20%
20152014201320122011201020092008200720062005
Brazil RussiaIndia China
0%
2%
4%
6%
8%
10%
12%
14%
Profit Margins
MSCI EM‐15%
‐10%
‐5%
0%
5%
10%
MSCI EM EM (Local) EM SmallCap
EM SC(Local)
Frontier
3 Month Return1 Yr Return
22

ACWI Financials and Health Care returns negative in short term
S&P 500 sectors mostly positive in short term
Returns mostly positive across EM sectors in short term Global energy sector weight has fallen
Global Equity by Sector
Source: Bloomberg, MSCI Source: Bloomberg, Standard and Poors
Source: Bloomberg, MSCISource: Bloomberg, MSCI
‐20%
‐15%
‐10%
‐5%
0%
5%
10%
3‐Mo Return1 Yr Return
‐20%‐15%‐10%‐5%0%5%
10%15%20%25%
3‐Mo Return1 Yr Return
‐20%‐15%‐10%‐5%0%5%
10%15%20%
3‐Mo Return1 Yr Return
0%
5%
10%
15%
20%
25%
Sector Weight of ACWI
3/31/2016
3/31/2015
23

Developed currencies mostly positive versus the dollar recently
EM currencies suffered in unique fashions over the past year
Yen expected to decline versus USD Recent dollar strength pronounced
Currencies
Source: Bloomberg Source: Bloomberg
Source: Bloomberg, Federal ReserveSource: Bloomberg
60
70
80
90
100
110
120
1991
1992
1993
1994
1995
1996
1997
1998
1999
2000
2001
2002
2003
2004
2005
2006
2007
2008
2009
2010
2011
2012
2013
2014
2015
USD Trade Weighted Index
‐4%
‐2%
0%
2%
4%
6%
8%
JapaneseYen
PoundSterling
Euro SwissFranc
CanadianDollar
AustralianDollar
3 Month Spot Change1 Yr Spot Change
‐25%‐20%‐15%‐10%‐5%0%5%
10%15%
3 Month Spot Change1 Yr Spot Change
‐2.5%‐2.0%‐1.5%‐1.0%‐0.5%0.0%0.5%1.0%1.5%2.0%2.5%
Euro Yen BritishPound
SwissFranc
Aus Dollar Yuan(O/S)
Chan
ge versus USD
3M Currency Fwd12M Currency Fwd
24

Spread levels above historical medians Yields have mostly declined
Similar yield/duration tradeoff among major US indices Returns marked by recent credit rally
US Fixed Income
Source: Bloomberg, Barclays Source: Bloomberg, Barclays
Source: Bloomberg, BarclaysSource: Bloomberg, Barclays
0
200
400
600
800
1000
1200
1400
1600
1800
Aaa Aa A Baa Ba B Caa
Spread
(bps)
+2 Std Dev+1 Std Dev‐1 St Dev3/31/20153/31/2016
0%1%2%3%4%5%6%7%8%9%10%
Month End Yield3‐Mo Previous Yield
0%1%2%3%4%5%6%7%8%9%
0 1 2 3 4 5 6 7 8
Yield
Duration
BC AggBC US TreasuryBC CreditBC MBSBC High YieldBC MunicipalBC TIPS
‐5.0%‐4.0%‐3.0%‐2.0%‐1.0%0.0%1.0%2.0%3.0%4.0%5.0%
3 Month Return1 Yr Return
25
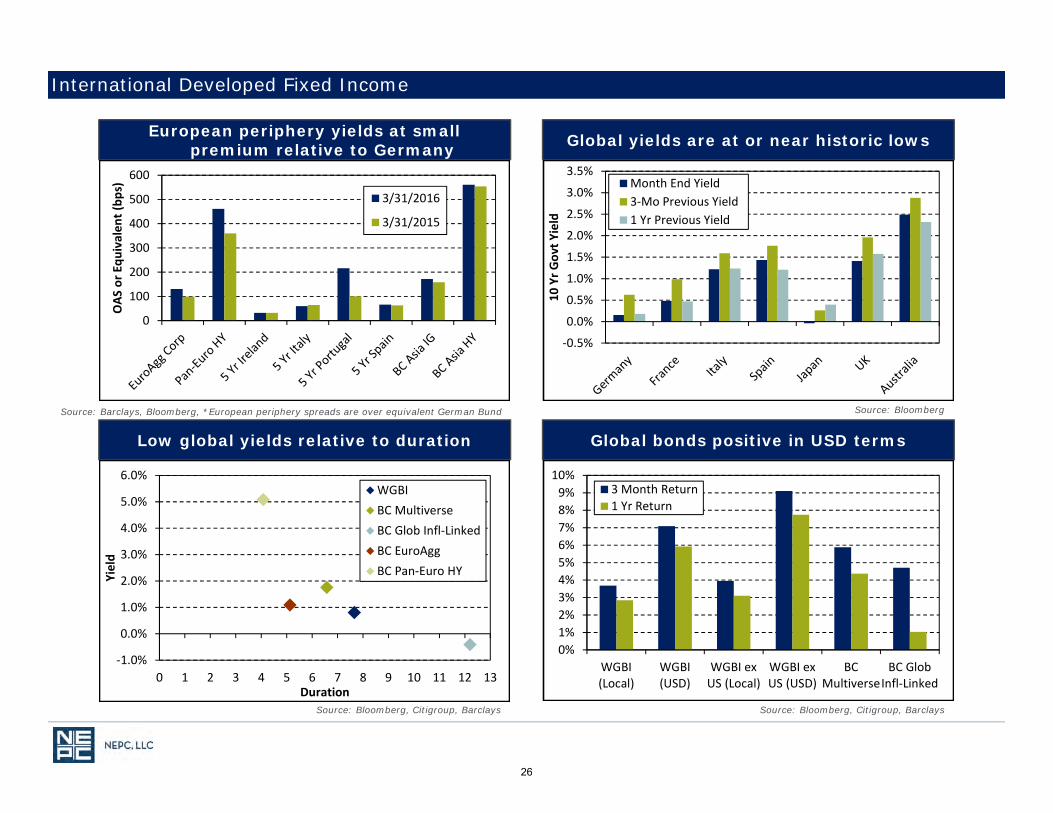
European periphery yields at small premium relative to Germany Global yields are at or near historic lows
Low global yields relative to duration Global bonds positive in USD terms
International Developed Fixed Income
Source: Barclays, Bloomberg, *European periphery spreads are over equivalent German Bund Source: Bloomberg
Source: Bloomberg, Citigroup, BarclaysSource: Bloomberg, Citigroup, Barclays
0
100
200
300
400
500
600
OAS or Eq
uivalent (bps)
3/31/2016
3/31/2015
‐0.5%
0.0%
0.5%
1.0%
1.5%
2.0%
2.5%
3.0%
3.5%
10 Yr Govt Yield
Month End Yield3‐Mo Previous Yield1 Yr Previous Yield
‐1.0%
0.0%
1.0%
2.0%
3.0%
4.0%
5.0%
6.0%
0 1 2 3 4 5 6 7 8 9 10 11 12 13
Yield
Duration
WGBIBC MultiverseBC Glob Infl‐LinkedBC EuroAggBC Pan‐Euro HY
0%1%2%3%4%5%6%7%8%9%
10%
WGBI(Local)
WGBI(USD)
WGBI exUS (Local)
WGBI exUS (USD)
BCMultiverse
BC GlobInfl‐Linked
3 Month Return1 Yr Return
26
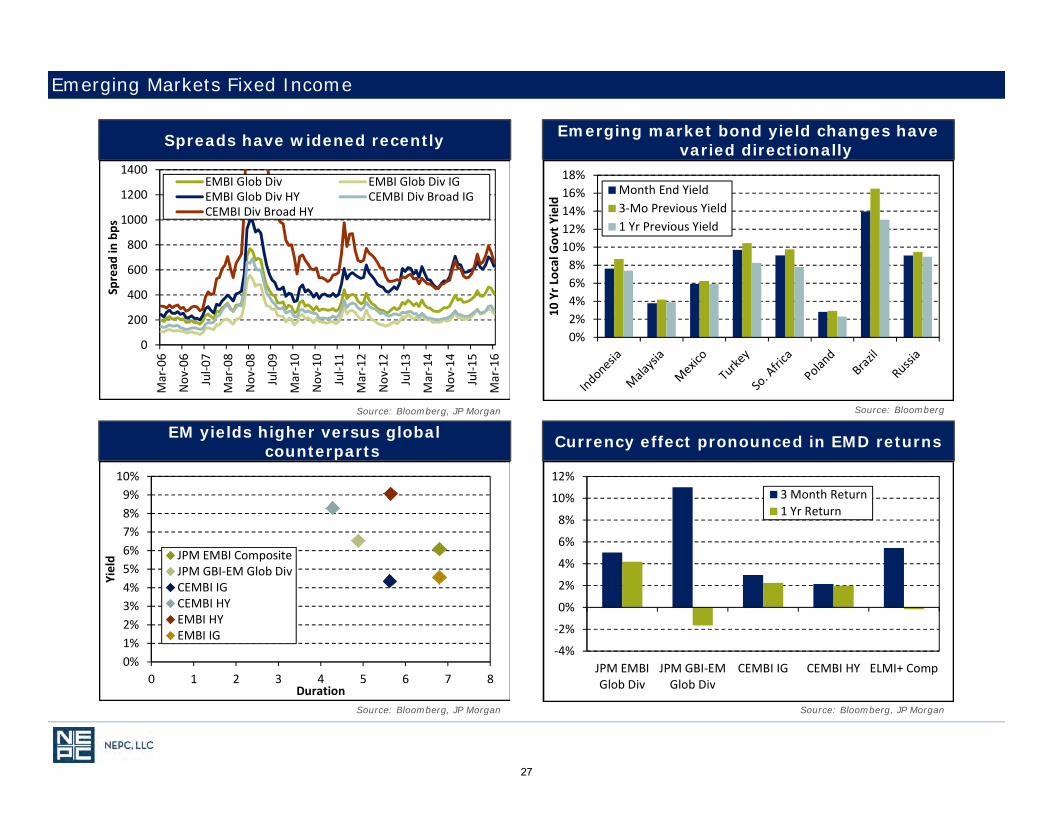
Spreads have widened recently Emerging market bond yield changes have varied directionally
EM yields higher versus global counterparts Currency effect pronounced in EMD returns
Emerging Markets Fixed Income
Source: Bloomberg, JP Morgan Source: Bloomberg
Source: Bloomberg, JP MorganSource: Bloomberg, JP Morgan
0
200
400
600
800
1000
1200
1400Mar‐06
Nov‐06
Jul‐0
7
Mar‐08
Nov‐08
Jul‐0
9
Mar‐10
Nov‐10
Jul‐1
1
Mar‐12
Nov‐12
Jul‐1
3
Mar‐14
Nov‐14
Jul‐1
5
Mar‐16
Spread
in bps
EMBI Glob Div EMBI Glob Div IGEMBI Glob Div HY CEMBI Div Broad IGCEMBI Div Broad HY
0%2%4%6%8%
10%12%14%16%18%
10 Yr Local G
ovt Yield
Month End Yield3‐Mo Previous Yield1 Yr Previous Yield
0%1%2%3%4%5%6%7%8%9%
10%
0 1 2 3 4 5 6 7 8
Yield
Duration
JPM EMBI CompositeJPM GBI‐EM Glob DivCEMBI IGCEMBI HYEMBI HYEMBI IG
‐4%
‐2%
0%
2%
4%
6%
8%
10%
12%
JPM EMBIGlob Div
JPM GBI‐EMGlob Div
CEMBI IG CEMBI HY ELMI+ Comp
3 Month Return1 Yr Return
27

Treasury yield curve has declined since year end
Global yield curves have shifted downwards
Global yield curves trending lower Global yields have trended lower over long term
Rates
Source: Bloomberg Source: Bloomberg
Source: BloombergSource: Bloomberg
0.0%
0.5%
1.0%
1.5%
2.0%
2.5%
3.0%
3.5%
4.0%
1Y 3Y 5Y 7Y 10Y
15Y
20Y
25Y
30Y
3/31/201612/31/20153/31/20153/31/2014
‐1.0%‐0.5%0.0%0.5%1.0%1.5%2.0%2.5%3.0%3.5%4.0%
1Y 3Y 5Y 7Y 10Y
15Y
20Y
25Y
30Y
UK Month End UK 3M PreviousJapan Month End Japan 3M PreviousGerm Month End Germ 3M Previous
‐0.5%
0.0%
0.5%
1.0%
1.5%
2.0%
2.5%
3.0%
2001
2002
2003
2004
2005
2006
2007
2008
2009
2010
2011
2012
2013
2014
2015
US 10 Yr ‐ 2 YrJapan 10 Yr ‐ 2 YrGermany 10 Yr ‐ 2 Yr
‐1%
0%
1%
2%
3%
4%
5%
6%
7%
1996
1997
1998
1999
2000
2001
2002
2003
2004
2005
2006
2007
2008
2009
2010
2011
2012
2013
2014
2015
Japan 10 YrJapan 2 YrGermany 10 YrGermany 2 Year
28

Long duration yields have fallen over last few years even with recent uptick
Lower yields driven by low inflation expectations and real rates
Yields are low but spreads above historic averages Returns recently positive
Long Rates and Liability
Source: Bloomberg, Citigroup, Barclays Source: Bloomberg, US Treasury, Barclays, NEPC
Source: Bloomberg, BarclaysSource: Bloomberg, BofA Merrill Lynch, Barclays *No index for 20+ year corporate
1%
2%
3%
4%
5%
6%
7%
Jan‐11
May‐11
Sep‐11
Jan‐12
May‐12
Sep‐12
Jan‐13
May‐13
Sep‐13
Jan‐14
May‐14
Sep‐14
Jan‐15
May‐15
Sep‐15
Jan‐16
Citigroup Pension Liability IndexBC Long CreditBC 20‐30 Yr STRIPS
‐1%0%1%2%3%4%5%6%7%8%9%
10%
Long credit yield (by component) Spread (BC Long Cred OAS)
Inflation (LT Yield ‐ LT Real Yield)Real Rate (LT Real Yield)
0.0%0.5%1.0%1.5%2.0%2.5%3.0%3.5%4.0%4.5%5.0%
0‐5 Years 5‐10 Years 10‐15 Years 15+ Years 20+ Years
US Corp Spread
US Gov't Yield
‐2.0%
0.0%
2.0%
4.0%
6.0%
8.0%
10.0%
12.0%
20‐30 YrSTRIPS
US AggLong Treas
US LongCredit
US LongGovt/Credit
US LongCredit A+
Long CorpA+
3‐Month Return
1 Year Return
29

US real yields have decreased slightly Global real yields mostly negative
US inflation expectations very low Global inflation expectations have seen recent uptick
Inflation and Real Rates
Source: Bloomberg *3-Mo data not available for Germany 4 year rate Source: Bloomberg
Source: BloombergSource: Bloomberg
‐0.6%
‐0.4%
‐0.2%
0.0%
0.2%
0.4%
0.6%
0.8%
1.0%
US 5 Yr US 10 Yr
Real Yields
3M Previous Month End3M Forward 1 Yr Fwd ‐1.4%
‐1.2%‐1.0%‐0.8%‐0.6%‐0.4%‐0.2%0.0%0.2%0.4%0.6%
US 5 Yr Germany 4Yr
Britain 5 Yr France 5 Yr Australia 5Yr
Month End3‐Mo Previous
1.50%
1.70%
1.90%
2.10%
2.30%
2.50%
2.70%
2.90%
5y5y US Breakeven
0.0%
0.5%
1.0%
1.5%
2.0%
2.5%
3.0%
3.5%
4.0%
Mar‐11
Jul‐1
1
Nov
‐11
Mar‐12
Jul‐1
2
Nov
‐12
Mar‐13
Jul‐1
3
Nov
‐13
Mar‐14
Jul‐1
4
Nov
‐14
Mar‐15
Jul‐1
5
Nov
‐15
Mar‐16
Inflation Breakeven
US 10 Yr UK 10 YrGermany 10 Yr France 10 YrAustralia 10 Yr
30

Yields higher relative to last year Gradual recovery in occupancy rates
PE Ratios near or above averages Recent MLP selloff and energy pressure
Inflation Sensitive Growth Assets
0
500
1000
1500
2000
2500
1985
1986
1988
1990
1992
1994
1996
1997
1999
2001
2003
2005
2007
2008
2010
2012
2014
Thousands
US Housing Starts SA
Source: Bloomberg, Alerian, Nareit, Standard and Poors Source: Bloomberg, CB Richard Ellis
Source: Bloomberg, US Census Bureau Source: Bloomberg, Alerian, Nareit, Standard and Poors
0%1%2%3%4%5%6%7%8%9%
Alerian MLP NAREIT Global NAREIT US S&P Glob NatRes
Dividend Yield
Month End Yield
1 Yr Previous Yield
75%
80%
85%
90%
95%
100%
2000
2001
2002
2003
2004
2005
2006
2007
2008
2009
2010
2011
2012
2013
2014
US Occupan
cy Rate
Office IndustrialRetail Multi‐Family
0
5
10
15
20
25
30
PE Ratio
Alerian MLPNAREIT GlobalNAREIT USS&P Glob Nat Res
‐35%‐30%‐25%‐20%‐15%‐10%‐5%0%5%
10%15%20%
Alerian MLP NAREIT Glob NAREIT US NCREIFProperty
S&P GlobNat Res
3 Mo Return1 Yr Return
31

Contango in major commodity futures Precipitous fall in oil prices
US fuel production closing gap with consumption
Commodity indices negative over one year after oil-induced decline
Commodities
Source: Bloomberg Source: Bloomberg
Source: Bloomberg, Standard and PoorsSource: Bloomberg, US Department of Energy *Crude oil and liquid fuels
‐5% ‐4% ‐3% ‐2% ‐1% 0% 1% 2%
Copper
Corn
Gold
Natural Gas
Oil
Soybeans
3‐Mo Future Roll Yield
0200400600800100012001400160018002000
0
20
40
60
80
100
120
140
160
2000
2001
2002
2003
2004
2005
2006
2007
2008
2009
2010
2011
2012
2013
2014
2015
$/Troy Ounce
$/Barrel
Crude Oil Spot (LHS)Gold Spot (RHS)
75
80
85
90
95
100
0
5
10
15
20
25
US ProductionUS ConsumptionWorld Production (RHS)World Consumption (RHS)
Crude oil and liquid fuels
‐35%
‐30%
‐25%
‐20%
‐15%
‐10%
‐5%
0%
5%
BloombergCommodity
GSCI GSCI Non‐Energy
3‐Month Return
1 Yr Return
32
Q1 2016 Performance & Asset Allocation
33
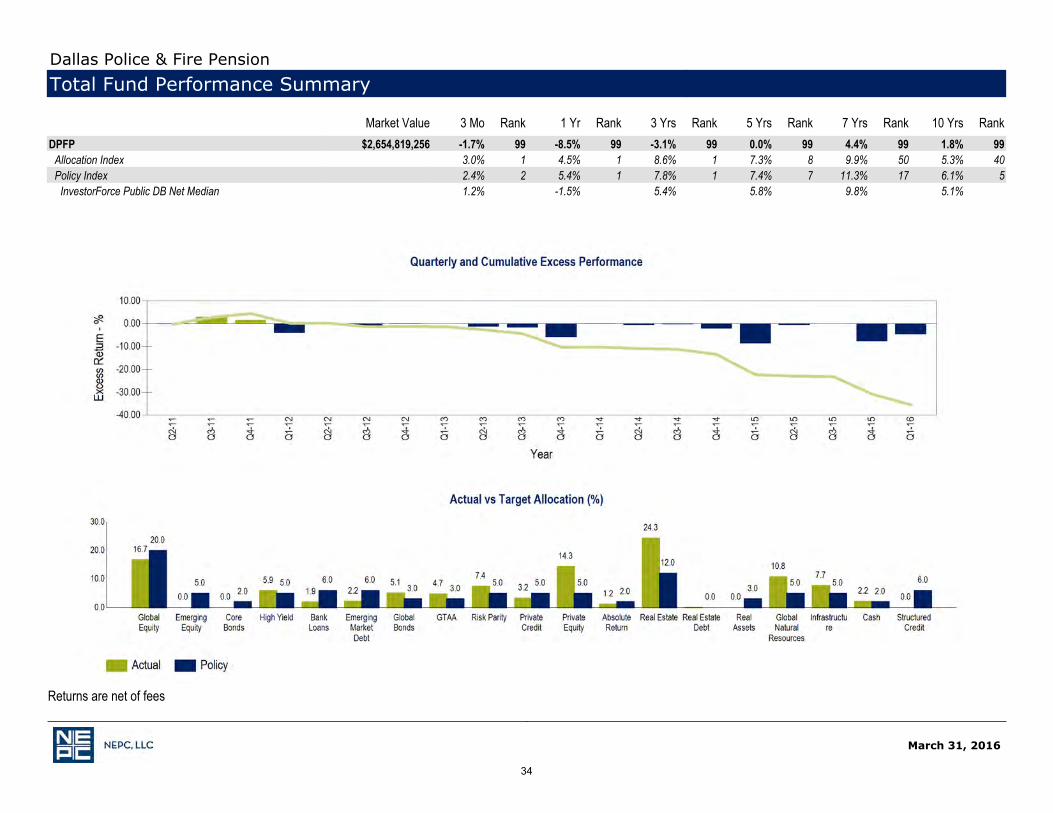
March 31, 2016
Market Value 3 Mo Rank 1 Yr Rank 3 Yrs Rank 5 Yrs Rank 7 Yrs Rank 10 Yrs Rank_
DPFP $2,654,819,256 -1.7% 99 -8.5% 99 -3.1% 99 0.0% 99 4.4% 99 1.8% 99Allocation Index 3.0% 1 4.5% 1 8.6% 1 7.3% 8 9.9% 50 5.3% 40Policy Index 2.4% 2 5.4% 1 7.8% 1 7.4% 7 11.3% 17 6.1% 5
InvestorForce Public DB Net Median 1.2% -1.5% 5.4% 5.8% 9.8% 5.1% XXXXX
Returns are net of fees
Dallas Police & Fire PensionTotal Fund Performance Summary
34
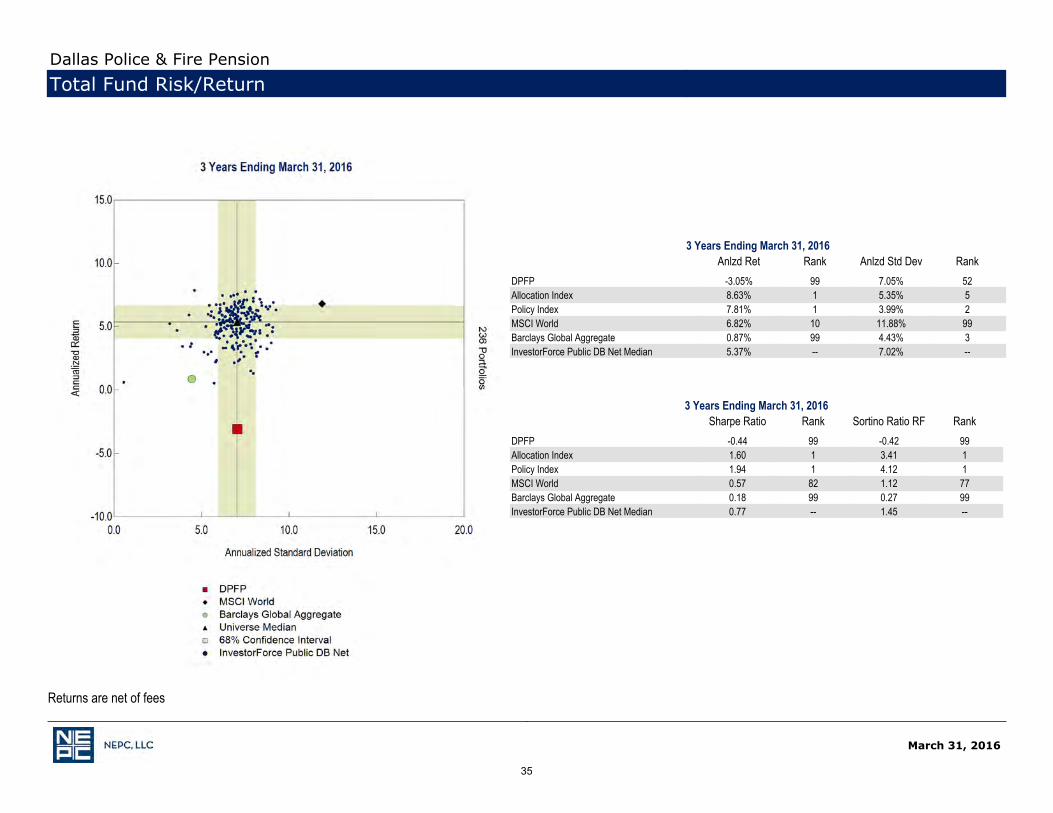
March 31, 2016
Returns are net of fees
3 Years Ending March 31, 2016 Sharpe Ratio Rank Sortino Ratio RF Rank
_
DPFP -0.44 99 -0.42 99Allocation Index 1.60 1 3.41 1Policy Index 1.94 1 4.12 1MSCI World 0.57 82 1.12 77Barclays Global Aggregate 0.18 99 0.27 99InvestorForce Public DB Net Median 0.77 -- 1.45 --
XXXXX
3 Years Ending March 31, 2016 Anlzd Ret Rank Anlzd Std Dev Rank
_
DPFP -3.05% 99 7.05% 52Allocation Index 8.63% 1 5.35% 5Policy Index 7.81% 1 3.99% 2MSCI World 6.82% 10 11.88% 99Barclays Global Aggregate 0.87% 99 4.43% 3InvestorForce Public DB Net Median 5.37% -- 7.02% --
XXXXX
Dallas Police & Fire PensionTotal Fund Risk/Return
35
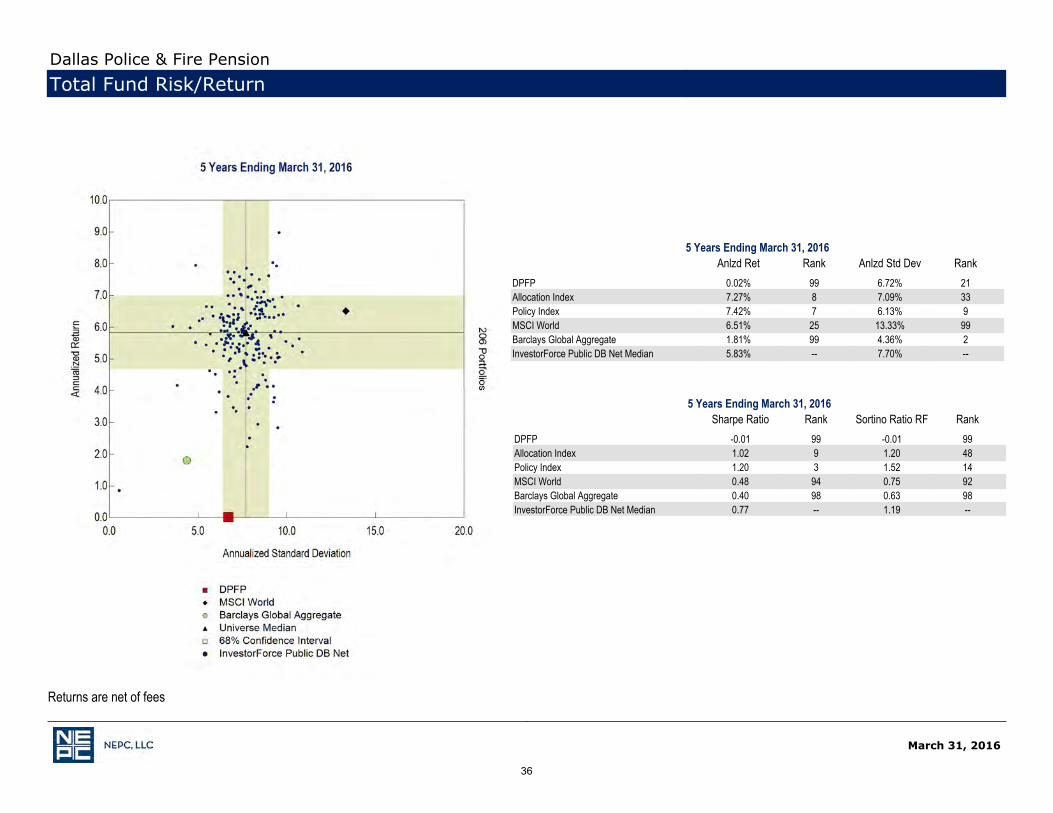
March 31, 2016
Returns are net of fees
5 Years Ending March 31, 2016 Anlzd Ret Rank Anlzd Std Dev Rank
_
DPFP 0.02% 99 6.72% 21Allocation Index 7.27% 8 7.09% 33Policy Index 7.42% 7 6.13% 9MSCI World 6.51% 25 13.33% 99Barclays Global Aggregate 1.81% 99 4.36% 2InvestorForce Public DB Net Median 5.83% -- 7.70% --
Dallas Police & Fire PensionTotal Fund Risk/Return
5 Years Ending March 31, 2016 Sharpe Ratio Rank Sortino Ratio RF Rank
_
DPFP -0.01 99 -0.01 99Allocation Index 1.02 9 1.20 48Policy Index 1.20 3 1.52 14MSCI World 0.48 94 0.75 92Barclays Global Aggregate 0.40 98 0.63 98InvestorForce Public DB Net Median 0.77 -- 1.19 --
XXXXX
36
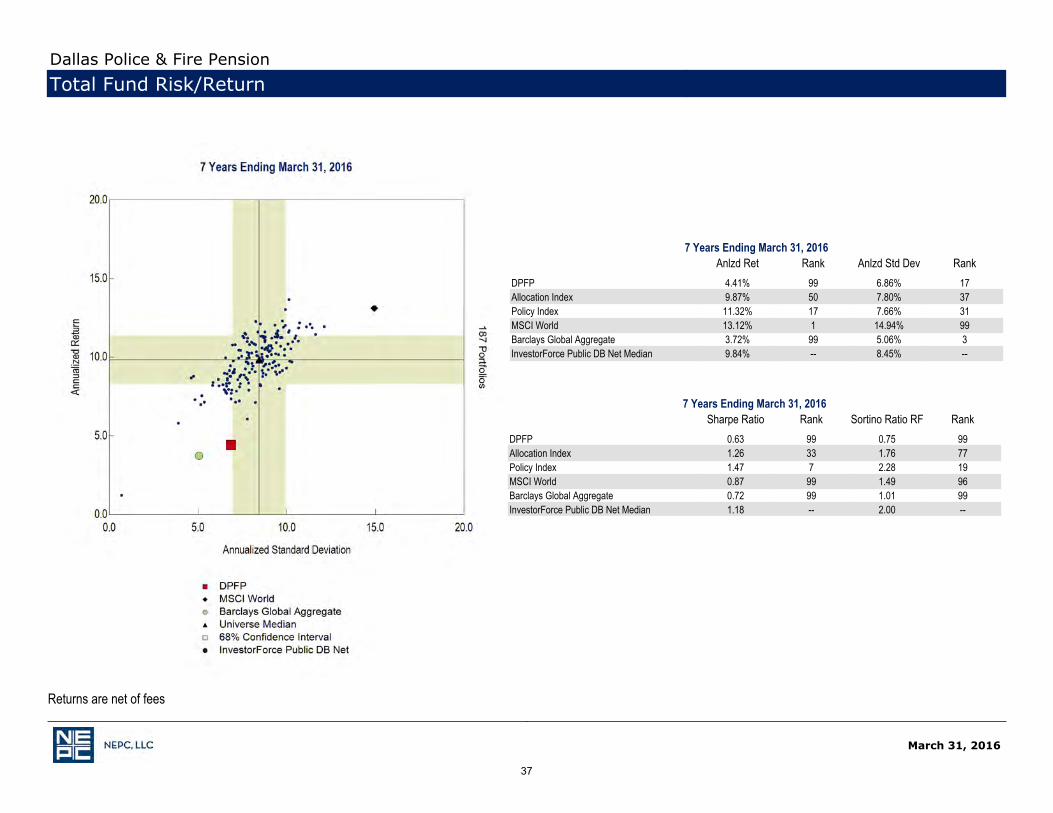
March 31, 2016
Returns are net of fees
Dallas Police & Fire PensionTotal Fund Risk/Return
7 Years Ending March 31, 2016 Anlzd Ret Rank Anlzd Std Dev Rank
_
DPFP 4.41% 99 6.86% 17Allocation Index 9.87% 50 7.80% 37Policy Index 11.32% 17 7.66% 31MSCI World 13.12% 1 14.94% 99Barclays Global Aggregate 3.72% 99 5.06% 3InvestorForce Public DB Net Median 9.84% -- 8.45% --
7 Years Ending March 31, 2016 Sharpe Ratio Rank Sortino Ratio RF Rank
_
DPFP 0.63 99 0.75 99Allocation Index 1.26 33 1.76 77Policy Index 1.47 7 2.28 19MSCI World 0.87 99 1.49 96Barclays Global Aggregate 0.72 99 1.01 99InvestorForce Public DB Net Median 1.18 -- 2.00 --
XXXXX
37
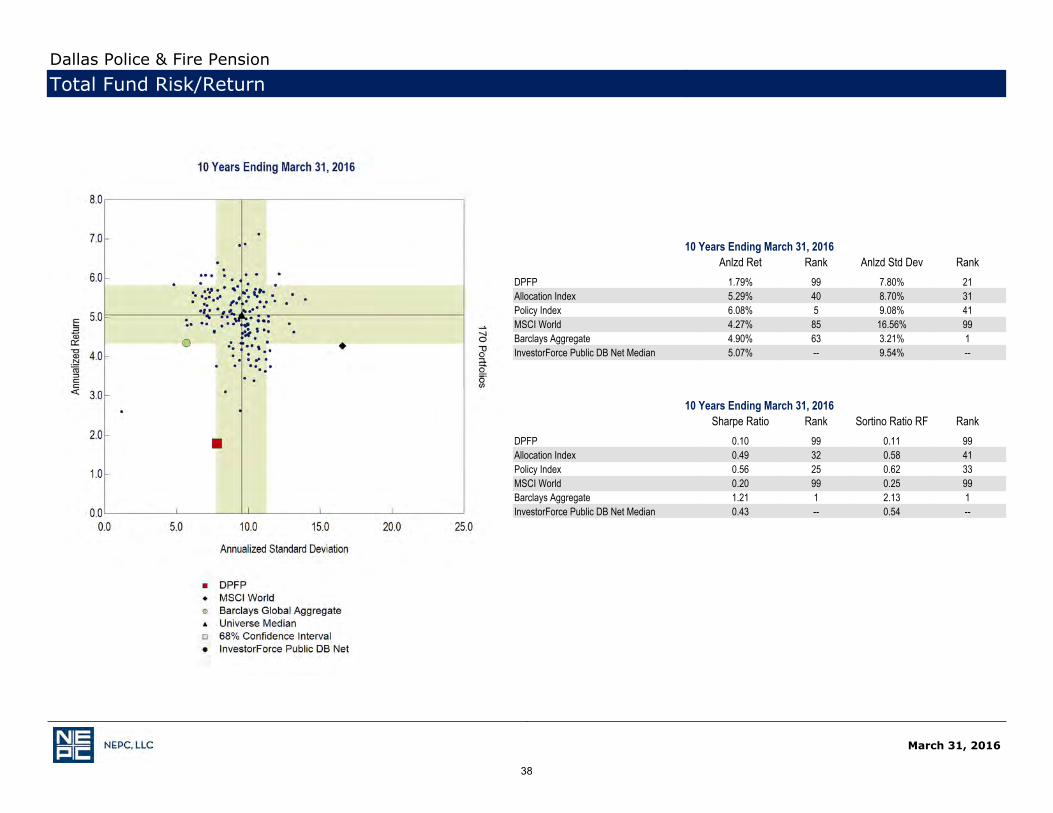
March 31, 2016
Dallas Police & Fire PensionTotal Fund Risk/Return
10 Years Ending March 31, 2016 Sharpe Ratio Rank Sortino Ratio RF Rank
_
DPFP 0.10 99 0.11 99Allocation Index 0.49 32 0.58 41Policy Index 0.56 25 0.62 33MSCI World 0.20 99 0.25 99Barclays Aggregate 1.21 1 2.13 1InvestorForce Public DB Net Median 0.43 -- 0.54 --
XXXXX
10 Years Ending March 31, 2016 Anlzd Ret Rank Anlzd Std Dev Rank
_
DPFP 1.79% 99 7.80% 21Allocation Index 5.29% 40 8.70% 31Policy Index 6.08% 5 9.08% 41MSCI World 4.27% 85 16.56% 99Barclays Aggregate 4.90% 63 3.21% 1InvestorForce Public DB Net Median 5.07% -- 9.54% --
38

Total Fund Asset Allocation History
March 31, 2016
Dallas Police & Fire Pension
39
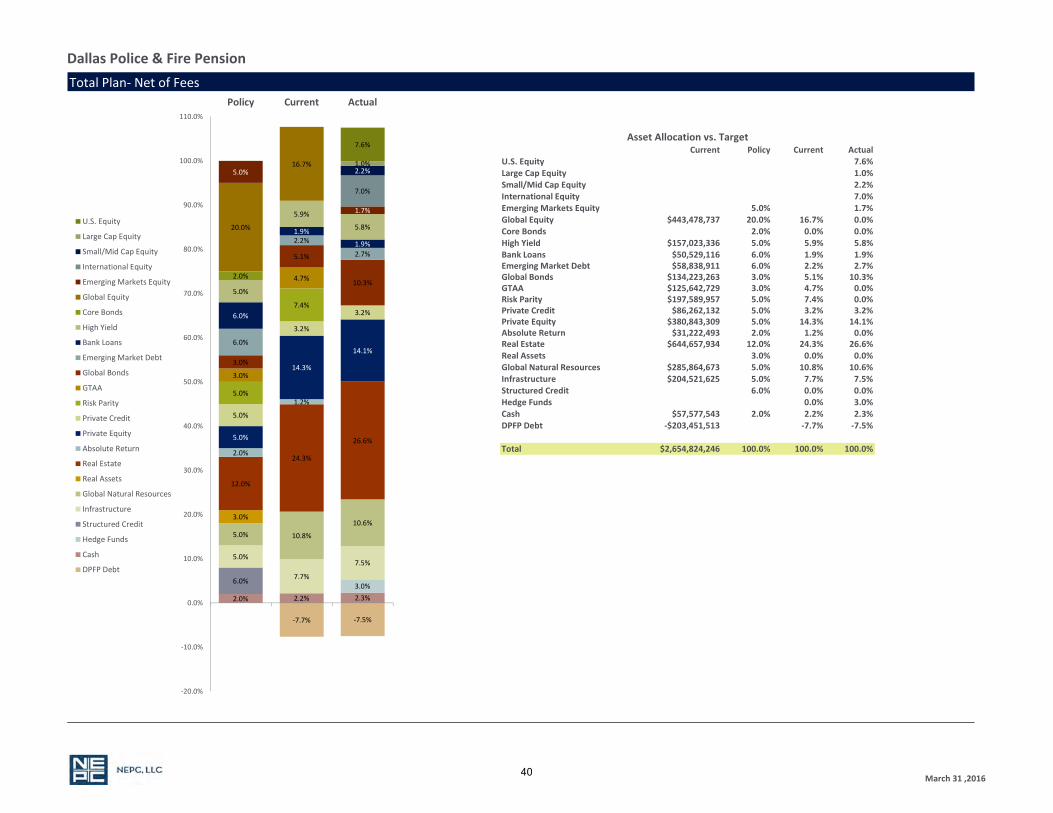
Dallas Police & Fire Pension
Total Plan‐ Net of Fees
Current Policy Current ActualU.S. Equity 7.6%Large Cap Equity 1.0%Small/Mid Cap Equity 2.2%International Equity 7.0%Emerging Markets Equity 5.0% 1.7%Global Equity $443,478,737 20.0% 16.7% 0.0%Core Bonds 2.0% 0.0% 0.0%High Yield $157,023,336 5.0% 5.9% 5.8%Bank Loans $50,529,116 6.0% 1.9% 1.9%Emerging Market Debt $58,838,911 6.0% 2.2% 2.7%Global Bonds $134,223,263 3.0% 5.1% 10.3%GTAA $125,642,729 3.0% 4.7% 0.0%Risk Parity $197,589,957 5.0% 7.4% 0.0%Private Credit $86,262,132 5.0% 3.2% 3.2%Private Equity $380,843,309 5.0% 14.3% 14.1%Absolute Return $31,222,493 2.0% 1.2% 0.0%Real Estate $644,657,934 12.0% 24.3% 26.6%Real Assets 3.0% 0.0% 0.0%Global Natural Resources $285,864,673 5.0% 10.8% 10.6%Infrastructure $204,521,625 5.0% 7.7% 7.5%Structured Credit 6.0% 0.0% 0.0%Hedge Funds 0.0% 3.0%Cash $57,577,543 2.0% 2.2% 2.3%DPFP Debt ‐$203,451,513 ‐7.7% ‐7.5%
Total $2,654,824,246 100.0% 100.0% 100.0%
Asset Allocation vs. Target
0.0%
‐7.7% ‐7.5%
2.0% 2.2% 2.3%3.0%
6.0%
0.0%0.0%
5.0%
7.7%
7.5%
5.0% 10.8%
10.6%3.0%
0.0%0.0%
12.0%
24.3%
26.6%2.0%
1.2%
0.0%
5.0%
14.3%
14.1%
5.0%
3.2%
3.2%
5.0%
7.4%
0.0%
3.0%
4.7%
0.0%
3.0%
5.1%
10.3%
6.0%
2.2%
2.7%
6.0%
1.9%
1.9%
5.0%
5.9%
5.8%
2.0%
0.0%0.0%
20.0%
16.7%
0.0%
5.0%
0.0%
1.7%
0.0%0.0%
7.0%
0.0%0.0%
2.2%
0.0%0.0%
1.0%
0.0%0.0%
7.6%
‐20.0%
‐10.0%
0.0%
10.0%
20.0%
30.0%
40.0%
50.0%
60.0%
70.0%
80.0%
90.0%
100.0%
110.0%
Policy Current Actual
U.S. Equity
Large Cap Equity
Small/Mid Cap Equity
International Equity
Emerging Markets Equity
Global Equity
Core Bonds
High Yield
Bank Loans
Emerging Market Debt
Global Bonds
GTAA
Risk Parity
Private Credit
Private Equity
Absolute Return
Real Estate
Real Assets
Global Natural Resources
Infrastructure
Structured Credit
Hedge Funds
Cash
DPFP Debt
March 31 ,201640

March 31, 2016
Cash Flows3 Months Ending March 31, 2016
MonthEnding
BeginningMarket Value Withdrawals Contributions Net Cash Flow Net Investment
ChangeEnding
Market Value_
Jan-16 -$1,248,515,219.32 $1,218,364,967.75 -$30,150,251.57 -$37,540,962.96 $2,707,732,700.53Feb-16 -$59,667,001.79 $40,072,257.03 -$19,594,744.76 -$615,393.85 $2,687,522,561.92Mar-16
$2,775,717,659.91$2,707,732,700.53$2,687,936,260.85 -$141,294,354.28 $117,579,847.99 -$23,714,506.29 -$9,402,498.43 $2,654,819,256.13
Dallas Police & Fire PensionDPFP
41

March 31, 2016
Dallas Police & Fire PensionDallas Police & Fire Pension
Net of fees returns shown on report are time weighted.
Market Value($)
% ofPortfolio
3 Mo(%) Rank 1 Yr
(%) Rank 3 Yrs(%) Rank 5 Yrs
(%) Rank 7 Yrs(%) Rank 10 Yrs
(%) Rank Return(%) Since
_
DPFP 2,654,819,256 100.0 -1.7 99 -8.5 99 -3.1 99 0.0 99 4.4 99 1.8 99 6.1 Jun-96Allocation Index 3.0 1 4.5 1 8.6 1 7.3 8 9.9 50 5.3 40 7.2 Jun-96Policy Index 2.4 2 5.4 1 7.8 1 7.4 7 11.3 17 6.1 5 -- Jun-96
InvestorForce Public DB Net Median 1.2 -1.5 5.4 5.8 9.8 5.1 6.6 Jun-96DPFP Debt -203,451,513 -7.7 0.5 -- -- -- -- -- -- -- -- -- -- -- 1.0 Oct-15DPFP Ex Debt 2,858,270,769 107.7 -1.7 99 -8.1 99 -2.9 99 0.1 99 4.5 99 1.8 99 6.1 Jun-96
Allocation Index Ex Debt 2.8 1 4.3 1 8.6 1 7.2 9 9.8 50 5.3 40 7.1 Jun-96DPFP Financial Composite 1,665,653,983 62.7 0.4 84 -6.5 99 2.2 99 3.7 96 11.0 24 4.3 84 4.9 Oct-05
InvestorForce Public DB Net Median 1.2 -1.5 5.4 5.8 9.8 5.1 5.4 Oct-05Total Equity 824,322,046 31.1 -2.5 -- -7.0 -- 5.6 -- 5.7 -- -- -- -- -- 6.4 Dec-10
Total Equity Policy Index 1.5 -- -- -- -- -- -- -- -- -- -- -- -- Dec-10Global Equity 443,478,737 16.7 -0.9 61 -5.6 65 6.0 61 5.7 65 13.2 55 4.2 62 4.5 Jul-06
MSCI ACWI Gross 0.4 44 -3.8 52 6.1 60 5.8 63 13.2 56 4.6 52 4.8 Jul-06eA All Global Equity Net Median -0.2 -3.7 6.7 6.7 13.5 4.7 4.9 Jul-06
Eagle Asset 51,768,252 1.9 0.3 46 -4.6 25 8.8 31 7.9 52 16.0 71 7.3 19 8.7 Feb-05Russell 2000 -1.5 65 -9.8 70 6.8 61 7.2 63 16.4 65 5.3 69 6.8 Feb-05
eA US Small Cap Equity Net Median -0.2 -7.2 7.6 8.0 17.3 6.0 7.5 Feb-05Pyramis 114,286,611 4.3 -1.2 65 -5.1 62 6.6 52 5.8 63 12.8 59 4.3 61 7.8 Mar-02
MSCI ACWI 0.2 47 -4.3 55 5.5 68 5.2 72 12.6 62 4.1 65 6.0 Mar-02eA All Global Equity Net Median -0.2 -3.7 6.7 6.7 13.5 4.7 7.6 Mar-02
Walter Scott 84,679,456 3.2 2.0 33 2.0 14 6.4 57 7.5 35 -- -- -- -- 8.0 Dec-09MSCI ACWI 0.2 47 -4.3 55 5.5 68 5.2 72 12.6 62 4.1 65 7.2 Dec-09
eA All Global Equity Net Median -0.2 -3.7 6.7 6.7 13.5 4.7 8.7 Dec-09OFI 118,060,374 4.4 -6.4 98 -9.3 85 5.9 62 6.0 60 14.1 43 -- -- 3.3 Oct-07
MSCI World -0.3 52 -3.5 48 6.8 49 6.5 53 13.1 56 4.3 62 2.2 Oct-07eA All Global Equity Net Median -0.2 -3.7 6.7 6.7 13.5 4.7 2.8 Oct-07
RREEF Global REIT 22,764,103 0.9 5.3 32 2.2 25 6.6 60 9.4 37 14.2 99 3.6 99 12.9 Feb-99FTSE EPRA/NAREIT Global 5.2 33 0.4 62 5.7 83 8.1 75 18.3 77 4.4 99 9.8 Feb-99
eA Global REIT Net Median 4.6 0.8 7.2 9.2 18.7 4.7 -- Feb-99Mitchell Group 25,420,375 1.0 6.0 7 -19.9 99 -8.4 97 -6.0 96 5.8 95 3.9 70 9.0 Oct-01
Dow Jones Equal Wtd. Oil & Gas 0.2 46 -33.9 99 -15.9 99 -12.3 98 1.5 98 -6.0 99 3.3 Oct-01eA All Global Equity Net Median -0.2 -3.7 6.7 6.7 13.5 4.7 7.9 Oct-01
42

Market Value($)
% ofPortfolio
3 Mo(%) Rank 1 Yr
(%) Rank 3 Yrs(%) Rank 5 Yrs
(%) Rank 7 Yrs(%) Rank 10 Yrs
(%) Rank Return(%) Since
_
Allianz Global 16,079 0.0 -1.5 68 -8.8 84 1.8 89 0.4 92 6.1 95 -- -- 3.0 Nov-08FTSE ET50 0.0 49 -7.5 79 9.5 12 -0.3 93 6.0 95 1.0 93 4.1 Nov-08
eA All Global Equity Net Median -0.2 -3.7 6.7 6.7 13.5 4.7 10.7 Nov-08Sustainable Asset Management 26,483,488 1.0 3.5 22 2.6 12 8.9 18 6.9 47 13.6 50 -- -- 10.7 Nov-08
MSCI World -0.3 52 -3.5 48 6.8 49 6.5 53 13.1 56 4.3 62 9.9 Nov-08eA All Global Equity Net Median -0.2 -3.7 6.7 6.7 13.5 4.7 10.7 Nov-08
Private Equity 380,843,309 14.3 -4.2 -- -2.8 -- -9.2 -- -2.2 -- 0.3 -- 1.1 -- 2.0 Oct-05Russell 3000 + 3% 1.7 -- 2.7 -- 14.5 -- 14.3 -- 20.6 -- 10.1 -- 10.5 Oct-05
Total Fixed Income 486,876,758 18.3 4.1 39 -4.3 92 0.9 54 4.3 28 11.0 11 5.6 34 5.6 Jul-06Total Fixed Income Policy Index 3.3 54 -- -- -- -- -- -- -- -- -- -- -- Jul-06Global Fixed Income Allocation Index 4.7 33 1.0 38 2.6 22 4.8 16 9.7 19 -- -- 6.4 Jul-06
eA All Global Fixed Inc Net Median 3.4 0.2 1.1 3.0 6.3 4.9 4.9 Jul-06Public Fixed Income 400,614,626 15.1 4.5 -- -4.2 -- -0.6 -- 2.7 -- -- -- -- -- --
Global Bonds 134,223,263 5.1 7.2 -- 2.4 -- 0.8 -- 2.7 -- -- -- -- -- 2.9 Dec-10Barclays Global Aggregate 5.9 -- 4.6 -- 0.9 -- 1.8 -- 3.7 -- 4.3 -- 2.0 Dec-10Brandywine 91,489,731 3.4 7.6 8 0.0 55 0.4 67 3.9 39 8.3 31 6.3 18 5.2 Oct-04
Barclays Global Aggregate 5.9 18 4.6 5 0.9 54 1.8 72 3.7 89 4.3 76 3.9 Oct-04eA All Global Fixed Inc Net Median 3.4 0.2 1.1 3.0 6.3 4.9 4.9 Oct-04
Mondrian 42,733,532 1.6 6.4 14 5.3 3 1.2 50 1.6 76 4.9 65 4.7 60 3.7 Oct-03Barclays Global Aggregate 5.9 18 4.6 5 0.9 54 1.8 72 3.7 89 4.3 76 4.1 Oct-03
eA All Global Fixed Inc Net Median 3.4 0.2 1.1 3.0 6.3 4.9 5.0 Oct-03HIgh Yield 157,023,336 5.9 2.9 -- -10.3 -- -1.2 -- 3.2 -- -- -- -- -- 4.3 Dec-10
Barclays Global High Yield 4.1 -- 0.6 -- 2.4 -- 5.1 -- 12.8 -- 7.4 -- 5.7 Dec-10Loomis Sayles 112,986,454 4.3 2.4 79 -10.4 99 0.0 80 3.0 83 13.3 4 6.8 1 9.2 Oct-98
70% ML HIGH YIELD / 30% JPM EMBIPLUS 4.1 23 -1.1 36 2.1 47 5.2 35 11.4 41 6.9 1 7.9 Oct-98
eA Global High Yield Fixed Inc NetMedian 2.9 -1.8 2.0 4.8 10.9 6.4 8.7 Oct-98
W.R. Huff High Yield 44,036,882 1.7 4.1 1 -9.5 98 -3.0 99 3.8 81 9.9 80 5.7 79 6.2 Jun-96Citi High Yield Market Index 3.4 11 -4.7 72 1.2 70 4.5 54 11.8 21 6.6 36 6.7 Jun-96
eA US High Yield Fixed Inc Net Median 2.3 -3.2 1.9 4.6 10.9 6.3 6.6 Jun-96
March 31, 2016
Dallas Police & Fire PensionDPFP
43

March 31, 2016
Dallas Police & Fire PensionDPFP
Market Value($)
% ofPortfolio
3 Mo(%) Rank 1 Yr
(%) Rank 3 Yrs(%) Rank 5 Yrs
(%) Rank 7 Yrs(%) Rank 10 Yrs
(%) Rank Return(%) Since
_
Bank Loans 50,529,116 1.9 0.6 -- -3.4 -- -- -- -- -- -- -- -- -- -- Dec-10S&P/LSTA Leveraged Loan Index 1.5 -- -1.3 -- 1.9 -- 3.2 -- 9.0 -- 4.3 -- 3.5 Dec-10Loomis Sayles Senior Rate and FixedIncome 50,529,116 1.9 0.6 86 -3.4 89 -- -- -- -- -- -- -- -- 0.3 Jan-14
S&P/LSTA Leveraged Loan Index 1.5 79 -1.3 70 1.9 38 3.2 48 9.0 24 4.3 79 1.1 Jan-14eA All Global Fixed Inc Net Median 3.4 0.2 1.1 3.0 6.3 4.9 1.3 Jan-14
Emerging Markets Debt 58,838,911 2.2 6.3 -- 0.6 -- -3.1 -- 0.9 -- -- -- -- -- 1.7 Dec-1050% JPM EMBI/50% JPM GBI-EM 8.1 -- 1.4 -- -2.2 -- 2.0 -- -- -- -- -- 2.3 Dec-10Ashmore AEMDF 41,229,780 1.6 4.3 82 2.5 22 -0.7 52 2.7 55 8.5 57 6.5 50 7.8 Feb-05
JP Morgan EMBI Global TR 5.2 52 4.4 5 2.4 11 6.0 9 9.4 45 7.1 37 7.4 Feb-05eA All Emg Mkts Fixed Inc Net Median 5.4 0.8 -0.6 3.2 8.8 6.5 7.3 Feb-05
Ashmore AEMLCB 17,609,131 0.7 11.3 1 -3.4 89 -7.9 92 -2.7 90 -- -- -- -- -2.1 Mar-11JP Morgan GBI EM Global Diversified TRUSD 11.0 1 -1.6 69 -6.7 82 -2.0 82 4.9 88 5.0 90 -1.4 Mar-11
eA All Emg Mkts Fixed Inc Net Median 5.4 0.8 -0.6 3.2 8.8 6.5 3.5 Mar-11Private Credit 86,262,132 3.2 2.4 -- -- -- -- -- -- -- -- -- -- -- 2.4 Jan-16
Barclays Global High Yield +2% 4.6 -- -- -- -- -- -- -- -- -- -- -- 4.6 Jan-16Total Asset Allocation 354,455,179 13.4 2.0 38 -6.9 99 1.0 96 3.8 86 6.9 92 -- -- 2.8 Jul-07
Total Asset Allocation Policy Index 2.0 39 -- -- -- -- -- -- -- -- -- -- -- Jul-07eA Global Balanced Net Median 1.4 -1.7 4.2 5.7 10.1 4.8 3.8 Jul-07
Risk Parity 197,589,957 7.4 4.0 -- -7.3 -- -0.1 -- 5.6 -- -- -- -- -- -- Jul-0760% MSCI ACWI/40% Barclays GlobalAggregate 2.6 -- -0.6 -- 3.8 -- 4.0 -- -- -- -- -- -- Jul-07
AQR 17,731,820 0.7 4.6 1 -7.8 99 -- -- -- -- -- -- -- -- 0.6 Oct-13CPI + 5% (Seasonally Adjusted) 1.2 57 5.9 1 5.8 8 6.3 23 6.7 92 6.8 1 5.7 Oct-13
eA Global Balanced Net Median 1.4 -1.7 4.2 5.7 10.1 4.8 3.8 Oct-13Bridgewater All Weather 96,378,016 3.6 2.8 11 -9.8 85 -1.1 98 5.9 3 8.8 47 -- -- 4.9 Sep-07
91 Day T-Bill + 6% 1.5 27 6.1 1 6.1 2 6.1 3 6.1 79 7.1 1 6.4 Sep-07eA Global TAA Net Median 1.0 -4.6 2.1 3.2 8.2 4.2 3.1 Sep-07
Panagora Risk Parity 22,878,240 0.9 8.5 1 -4.7 96 -- -- -- -- -- -- -- -- 6.1 Nov-13CPI + 5% (Seasonally Adjusted) 1.2 57 5.9 1 5.8 8 6.3 23 6.7 92 6.8 1 5.7 Nov-13
eA Global Balanced Net Median 1.4 -1.7 4.2 5.7 10.1 4.8 2.9 Nov-13Putnam 60,601,880 2.3 2.1 37 -5.5 99 0.0 99 2.9 91 -- -- -- -- 5.2 Dec-09
CPI + 5% (Seasonally Adjusted) 1.2 57 5.9 1 5.8 8 6.3 23 6.7 92 6.8 1 6.5 Dec-09eA Global Balanced Net Median 1.4 -1.7 4.2 5.7 10.1 4.8 6.7 Dec-09
44

March 31, 2016
Market Value($)
% ofPortfolio
3 Mo(%) Rank 1 Yr
(%) Rank 3 Yrs(%) Rank 5 Yrs
(%) Rank 7 Yrs(%) Rank 10 Yrs
(%) Rank Return(%) Since
_
GTAA 125,642,729 4.7 0.8 -- -3.3 -- 2.0 -- 4.7 -- -- -- -- -- 4.7 Dec-1060% MSCI ACWI/40% Barclays GlobalAggregate 2.6 -- -0.6 -- 3.8 -- 4.0 -- -- -- -- -- 4.5 Dec-10
GMO 125,642,729 4.7 0.8 59 -3.3 39 2.0 56 4.7 11 6.7 62 -- -- 3.9 Sep-07CPI + 5% (Seasonally Adjusted) 1.2 37 5.9 1 5.8 3 6.3 2 6.7 62 6.8 1 6.7 Sep-07
eA Global TAA Net Median 1.0 -4.6 2.1 3.2 8.2 4.2 3.1 Sep-07Absolute Return/Global Macro 31,222,493 1.2 -8.0 -- -16.8 -- 5.2 -- -- -- -- -- -- -- -- Dec-10
HFRX Absolute Return Index -0.6 -- 0.6 -- 2.0 -- 0.6 -- 0.1 -- -0.2 -- 0.7 Dec-10Bridgewater Pure Alpha 31,222,493 1.2 -8.0 99 -16.8 99 5.2 5 -- -- -- -- -- -- 4.9 Aug-11
91 Day T-Bill + 6% 1.5 27 6.1 1 6.1 2 6.1 3 6.1 79 7.1 1 6.1 Aug-11eA Global TAA Net Median 1.0 -4.6 2.1 3.2 8.2 4.2 3.3 Aug-11
Total Real Assets 1,135,039,243 42.8 -4.6 -- -11.8 -- -9.6 -- -6.5 -- -- -- -- -- -6.2 Dec-10Total Real Assets Policy Index 4.8 -- -- -- -- -- -- -- -- -- -- -- -- Dec-10Natural Resources 285,859,684 10.8 0.2 -- 4.4 -- 7.4 -- 6.1 -- -- -- -- -- 4.4 Apr-15
Natural Resources Benchmark 9.1 -- 15.6 -- 13.9 -- 9.8 -- -- -- -- -- 15.6 Apr-15Global Infrastructure Composite 204,521,625 7.7 -2.3 -- -5.1 -- 0.2 -- -- -- -- -- -- -- 1.4 Jul-12
Global Infrastructure Benchmark 8.7 -- 13.7 -- 8.4 -- -- -- -- -- -- -- 8.1 Jul-12Real Estate Composite 644,657,934 24.3 -7.3 -- -18.8 -- -14.4 -- -9.5 -- -7.9 -- -4.1 -- 3.6 Mar-85
NCREIF Property Index 2.2 -- 11.8 -- 11.9 -- 11.9 -- 9.1 -- 7.6 -- 8.1 Mar-85Cash Equivalents 57,577,543 2.2 0.7 -- 1.4 -- 2.3 -- -- -- -- -- -- -- 1.4 Apr-15
91 Day T-Bills 0.1 -- 0.1 -- 0.1 -- 0.1 -- 0.1 -- 1.0 -- 0.1 Apr-15XXXXX
Dallas Police & Fire PensionDPFP
45

FootnotesDallas Police & Fire Pension
March 31, 2016
1. Allianz Eco Trends was included in the Global Natural Resources composite from 11/1/2008 to 3/31/2015 and included in the Global Equity composite from 4/1/2015 to present.
2. Mitchell Group was included in the Global Natural Resources composite from 10/1/2001 to 3/31/2015 and included in the Global Equity composite from 4/1/2015 to present.
3. Sustainable Asset Management was included in the Global Natural Resources composite from 11/1/2008 to 3/31/2015 and included in the Global Equity composite from 4/1/2015 to present.
4. Hudson Clean Energy was included in the Global Natural Resources composite from 1/1/2010 to 3/31/2015 and included in the Private Markets composite from 4/1/2015 to 12/31/2015 and the Private Equity composite from 1/1/2016 to present.
5. RREEF was included in the Real Estate composite from 2/1/1999 to 12/31/2009 and included in the Global Equity composite from 1/1/2010 to present.6. Highland Crusader was included in the Global Fixed Income composite from 7/1/2003 to 12/31/2015 and included in the Private Credit composite from
1/1/2016 to present.7. Highland Capital Management was included in the Global Fixed Income composite from 1/1/2007 to 12/31/2015 and included in the Private Credit composite
from 1/1/2016 to present.8. Lone Star Fund VII, LP was included in the Global Fixed Income composite from 10/1/2011 to 3/31/2015 and included in the Private Markets composite from
4/1/2015 to 12/31/2015 and included in the Private Credit composite from 1/1/2016 to present.9. Lone Star Fund VIII, LP was included in the Global Fixed Income composite from 10/1/2013 to 3/31/2015 and included in the Private Markets composite from
4/1/2015 to 12/31/2015 and included in the Private Credit composite from 1/1/2016 to present.10. Lone Star Fund IX, LP was included in the Global Fixed Income composite from 10/1/2014 to 3/31/2015 and included in the Private Markets composite from
4/1/2015 to 12/31/2015 and included in the Private Credit composite from 1/1/2016 to present.11. Oaktree Fund IV & 2x Loan Fund was included in the Global Fixed Income composite from 1/1/2002 to 3/31/2015 and included in the Private Markets
composite from 4/1/2015 to 12/31/2015 and included in the Private Credit composite from 1/1/2016 to present.12. Ashmore Capital GSSF IV was included in the Private Markets composite from 10/1/2007 to 12/31/2015 and included in the Private Credit composite from
1/1/2016 to present.13. Global Infrastructure composite was included in the Private Markets composite history until 6/30/2012.14. Private Equity composite includes Private Credit managers until 12/31/2015. From 01/01/2016 to present the Private Equity and Credit managers are now in
separate composites.15. Certain managers in the Private Equity and Real Estate composites, the 12/31/15 audited financials have not been finalized. In this case the market value is
based on estimated 12/31/15 values, provided by the manager, and adjusted for cash flows.
46

March 31, 2016
Dallas Police & Fire PensionTotal Fund Return Summary
47
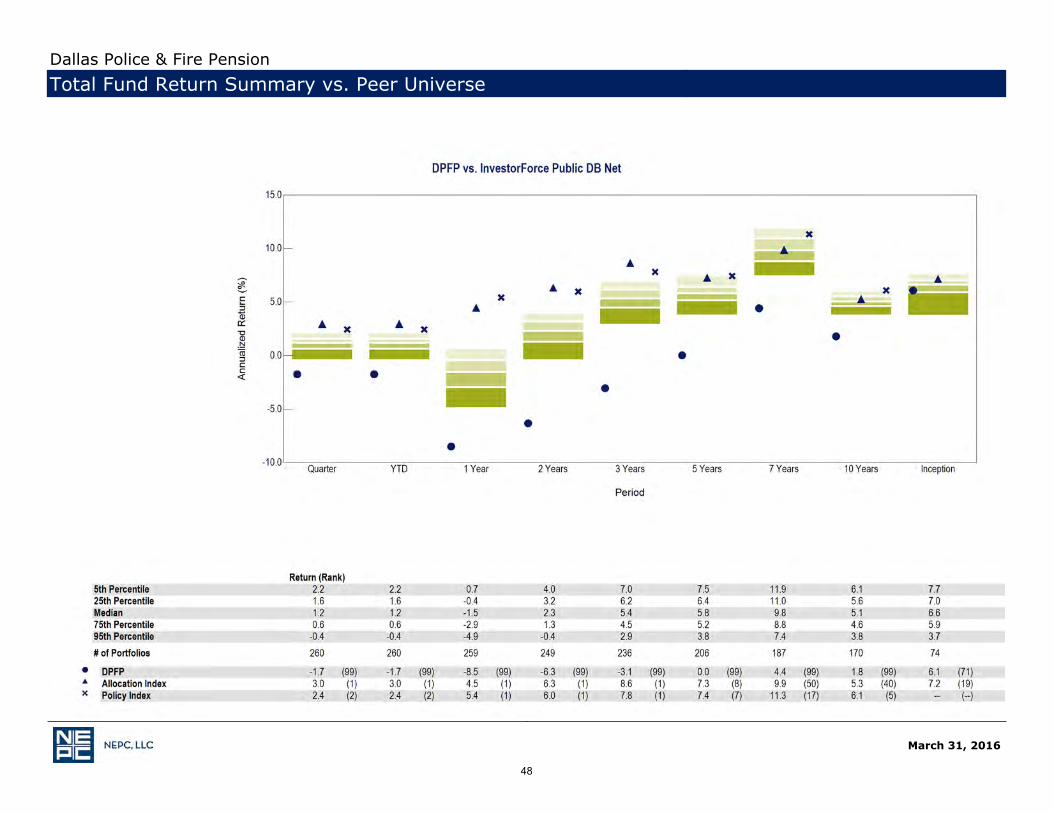
March 31, 2016
Dallas Police & Fire PensionTotal Fund Return Summary vs. Peer Universe
48

March 31, 2016
Dallas Police & Fire PensionTotal Fund Return Summary vs. Peer Universe
49

March 31, 2016
Dallas Police & Fire PensionTotal Fund Attribution Analysis
Attribution Summary3 Months Ending March 31, 2016
Wtd.ActualReturn
Wtd.Index
Return
ExcessReturn
SelectionEffect
AllocationEffect
InteractionEffects
TotalEffects
Global Equity -0.9% 0.4% -1.3% -0.2% -0.1% 0.1% -0.3%Emerging Markets Equity 0.0% 5.8% -5.8% -0.6% -0.4% 0.6% -0.4%Private Equity -4.2% 1.7% -5.9% -0.3% -0.2% -0.5% -1.0%Global Bonds 7.2% 5.9% 1.3% 0.0% 0.0% 0.0% 0.1%HIgh Yield 2.9% 4.1% -1.3% 0.0% 0.0% 0.0% 0.0%Bank Loans 0.6% 1.5% -0.9% 0.0% 0.2% 0.0% 0.2%Emerging Markets Debt 6.3% 8.1% -1.8% 0.0% -0.1% 0.0% -0.1%Short Term Core Bonds 0.0% 0.9% -0.9% 0.0% 0.1% 0.0% 0.1%Structured Credit &Absolute Return 0.0% -0.7% 0.7% 0.0% 0.3% 0.0% 0.3%
Private Credit 2.4% 4.6% -2.3% -0.2% 0.0% 0.1% -0.1%Risk Parity 4.0% 2.6% 1.5% -0.1% 0.0% 0.0% -0.1%GTAA 0.8% 2.6% -1.8% -0.1% 0.0% 0.0% -0.1%Absolute Return/GlobalMacro -8.0% -0.6% -7.4% -0.1% 0.1% 0.1% 0.0%
Natural Resources 0.2% 9.1% -9.0% -0.1% 0.5% -0.8% -0.4%Global InfrastructureComposite -2.3% 8.7% -11.0% -0.5% 0.0% -0.3% -0.7%
Real Estate Composite -7.3% 2.2% -9.5% -1.1% -0.3% -1.1% -2.5%Liquid Real Assets 0.0% 1.2% -1.2% 0.0% 0.2% 0.0% 0.2%Cash Equivalents 0.7% 0.1% 0.6% 0.0% -0.1% 0.0% 0.0%Total -1.7% 3.8% -5.5% -3.4% 0.4% -1.8% -4.9%
50

Portfolio Review
51

Dallas Police & Fire PensionPublic Equity
March 31, 2016
52

March 31, 2016
Regional AllocationMSCI ACWI
Region WeightingNorth America ex U.S. 3.08United States 53.24Europe Ex U.K. 15.56United Kingdom 6.29Pacific Basin Ex Japan 5.03Japan 7.54Emerging Markets 8.93Other 0.34
Dallas Police & Fire PensionPublic Equity
CharacteristicsPortfolio MSCI ACWI
Number of Holdings 844 2,482Weighted Avg. Market Cap. ($B) 60.5 87.3Median Market Cap. ($B) 10.4 8.3Price To Earnings 23.6 20.2Price To Book 4.2 3.2Price To Sales 3.8 2.7Return on Equity (%) 16.6 15.8Yield (%) 2.1 2.6Beta 1.0 1.0R-Squared 1.0 1.0
53
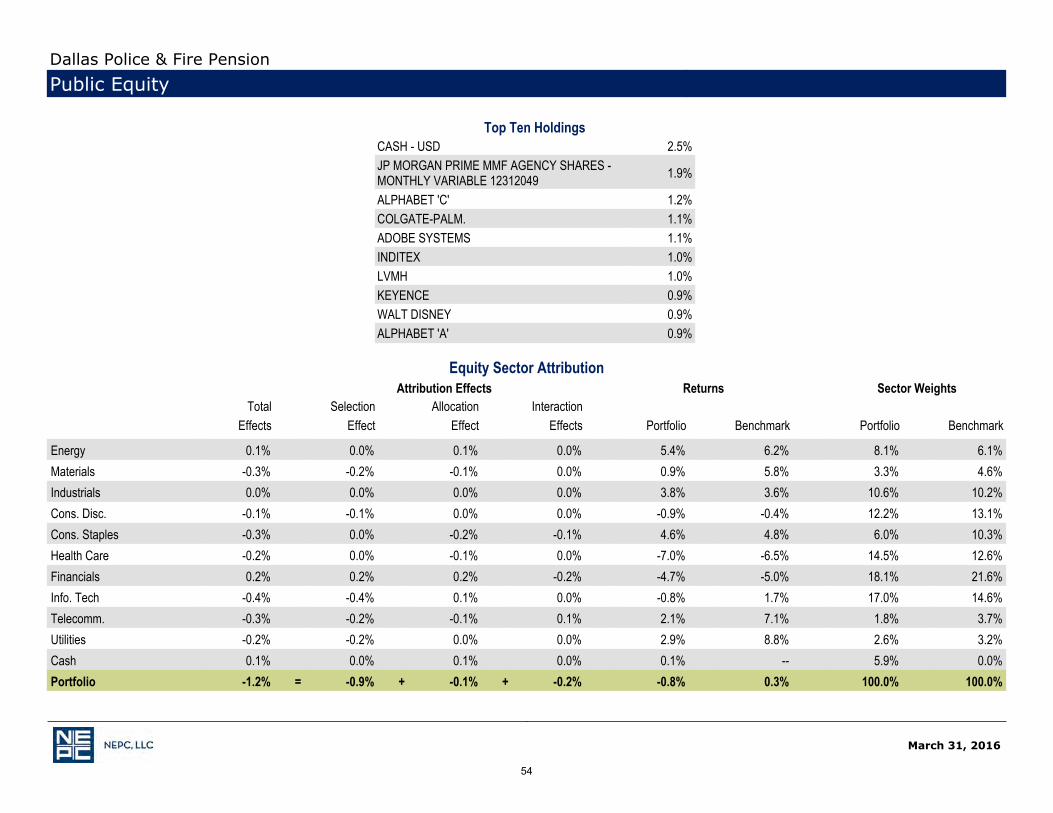
March 31, 2016
Dallas Police & Fire PensionPublic Equity
Equity Sector AttributionAttribution Effects Returns Sector Weights
Total Selection Allocation InteractionEffects Effect Effect Effects Portfolio Benchmark Portfolio Benchmark
_
Energy 0.1% 0.0% 0.1% 0.0% 5.4% 6.2% 8.1% 6.1%Materials -0.3% -0.2% -0.1% 0.0% 0.9% 5.8% 3.3% 4.6%Industrials 0.0% 0.0% 0.0% 0.0% 3.8% 3.6% 10.6% 10.2%Cons. Disc. -0.1% -0.1% 0.0% 0.0% -0.9% -0.4% 12.2% 13.1%Cons. Staples -0.3% 0.0% -0.2% -0.1% 4.6% 4.8% 6.0% 10.3%Health Care -0.2% 0.0% -0.1% 0.0% -7.0% -6.5% 14.5% 12.6%Financials 0.2% 0.2% 0.2% -0.2% -4.7% -5.0% 18.1% 21.6%Info. Tech -0.4% -0.4% 0.1% 0.0% -0.8% 1.7% 17.0% 14.6%Telecomm. -0.3% -0.2% -0.1% 0.1% 2.1% 7.1% 1.8% 3.7%Utilities -0.2% -0.2% 0.0% 0.0% 2.9% 8.8% 2.6% 3.2%Cash 0.1% 0.0% 0.1% 0.0% 0.1% -- 5.9% 0.0%Portfolio -1.2% = -0.9% + -0.1% + -0.2% -0.8% 0.3% 100.0% 100.0%
_
Top Ten HoldingsCASH - USD 2.5%JP MORGAN PRIME MMF AGENCY SHARES -MONTHLY VARIABLE 12312049 1.9%
ALPHABET 'C' 1.2%COLGATE-PALM. 1.1%ADOBE SYSTEMS 1.1%INDITEX 1.0%LVMH 1.0%KEYENCE 0.9%WALT DISNEY 0.9%ALPHABET 'A' 0.9%
54

March 31, 2016
Dallas Police & Fire PensionPublic Equity
Top Positive ContributorsRelative
Contribution% Return %
_
LVMH 0.1% 9.0%AMAZON.COM 0.1% -12.2%SGS 'N' 0.1% 14.9%HSBC HDG. (ORD $0.50) 0.1% -18.5%BANK OF AMERICA 0.1% -19.4%EQT 0.1% 29.1%VALEANT PHARMS.INTL. 0.1% -74.0%TAIWAN SEMICON.SPN.ADR 1:5 0.1% 15.2%COLGATE-PALM. 0.1% 6.7%TOYOTA MOTOR 0.1% -14.9%
_
Top Negative ContributorsRelative
Contribution% Return %
_
SUNEDISON -0.2% -89.4%CELLDEX THERAPEUTICS -0.2% -75.9%MURATA MANUFACTURING -0.1% -16.7%DAI-ICHI LIFE INSURANCE -0.1% -26.5%CREDIT SUISSE GROUP N -0.1% -34.4%DEUTSCHE BANK -0.1% -30.5%AT&T -0.1% 15.4%CITIGROUP -0.1% -19.2%BIOMARIN PHARM. -0.1% -21.3%JD.COM 'A' ADR 1:2 -0.1% -17.9%
_
55
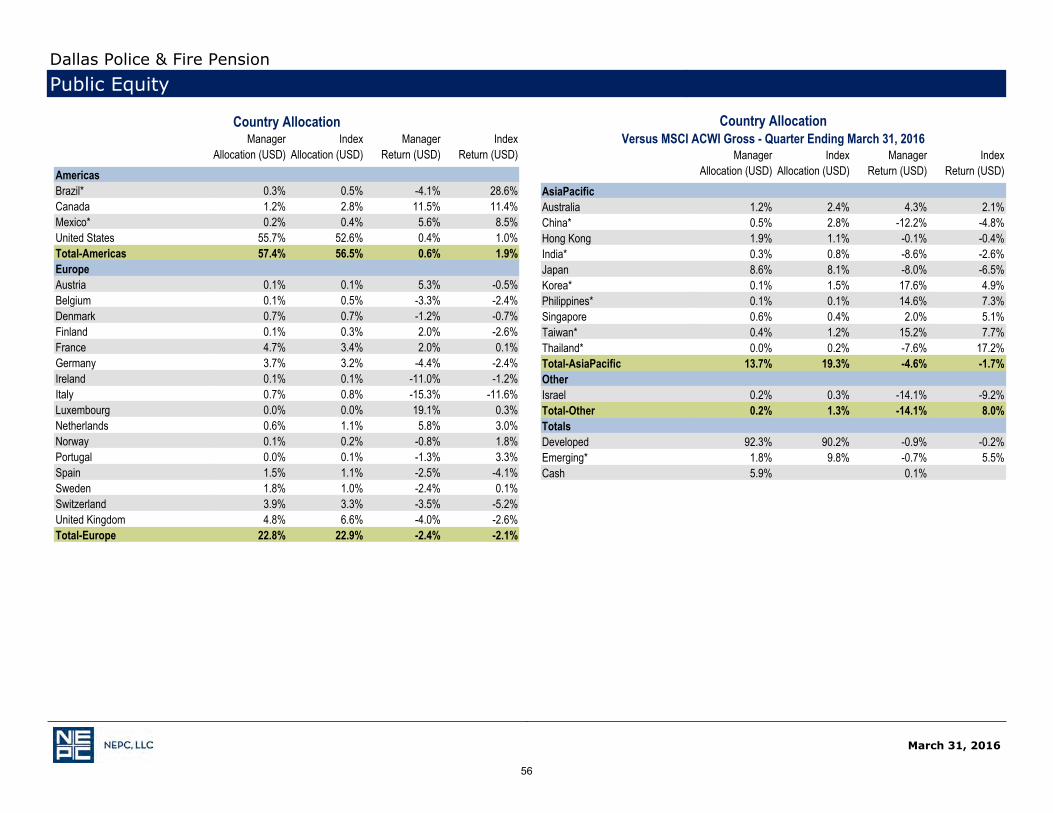
Country AllocationVersus MSCI ACWI Gross - Quarter Ending March 31, 2016
Manager Index Manager IndexAllocation (USD) Allocation (USD) Return (USD) Return (USD)
_
AsiaPacific Australia 1.2% 2.4% 4.3% 2.1%China* 0.5% 2.8% -12.2% -4.8%Hong Kong 1.9% 1.1% -0.1% -0.4%India* 0.3% 0.8% -8.6% -2.6%Japan 8.6% 8.1% -8.0% -6.5%Korea* 0.1% 1.5% 17.6% 4.9%Philippines* 0.1% 0.1% 14.6% 7.3%Singapore 0.6% 0.4% 2.0% 5.1%Taiwan* 0.4% 1.2% 15.2% 7.7%Thailand* 0.0% 0.2% -7.6% 17.2%Total-AsiaPacific 13.7% 19.3% -4.6% -1.7%Other Israel 0.2% 0.3% -14.1% -9.2%Total-Other 0.2% 1.3% -14.1% 8.0%Totals Developed 92.3% 90.2% -0.9% -0.2%Emerging* 1.8% 9.8% -0.7% 5.5%Cash 5.9% 0.1%
_
Country AllocationManager Index Manager Index
Allocation (USD) Allocation (USD) Return (USD) Return (USD)_
Americas Brazil* 0.3% 0.5% -4.1% 28.6%Canada 1.2% 2.8% 11.5% 11.4%Mexico* 0.2% 0.4% 5.6% 8.5%United States 55.7% 52.6% 0.4% 1.0%Total-Americas 57.4% 56.5% 0.6% 1.9%Europe Austria 0.1% 0.1% 5.3% -0.5%Belgium 0.1% 0.5% -3.3% -2.4%Denmark 0.7% 0.7% -1.2% -0.7%Finland 0.1% 0.3% 2.0% -2.6%France 4.7% 3.4% 2.0% 0.1%Germany 3.7% 3.2% -4.4% -2.4%Ireland 0.1% 0.1% -11.0% -1.2%Italy 0.7% 0.8% -15.3% -11.6%Luxembourg 0.0% 0.0% 19.1% 0.3%Netherlands 0.6% 1.1% 5.8% 3.0%Norway 0.1% 0.2% -0.8% 1.8%Portugal 0.0% 0.1% -1.3% 3.3%Spain 1.5% 1.1% -2.5% -4.1%Sweden 1.8% 1.0% -2.4% 0.1%Switzerland 3.9% 3.3% -3.5% -5.2%United Kingdom 4.8% 6.6% -4.0% -2.6%Total-Europe 22.8% 22.9% -2.4% -2.1%
_
March 31, 2016
Dallas Police & Fire PensionPublic Equity
56
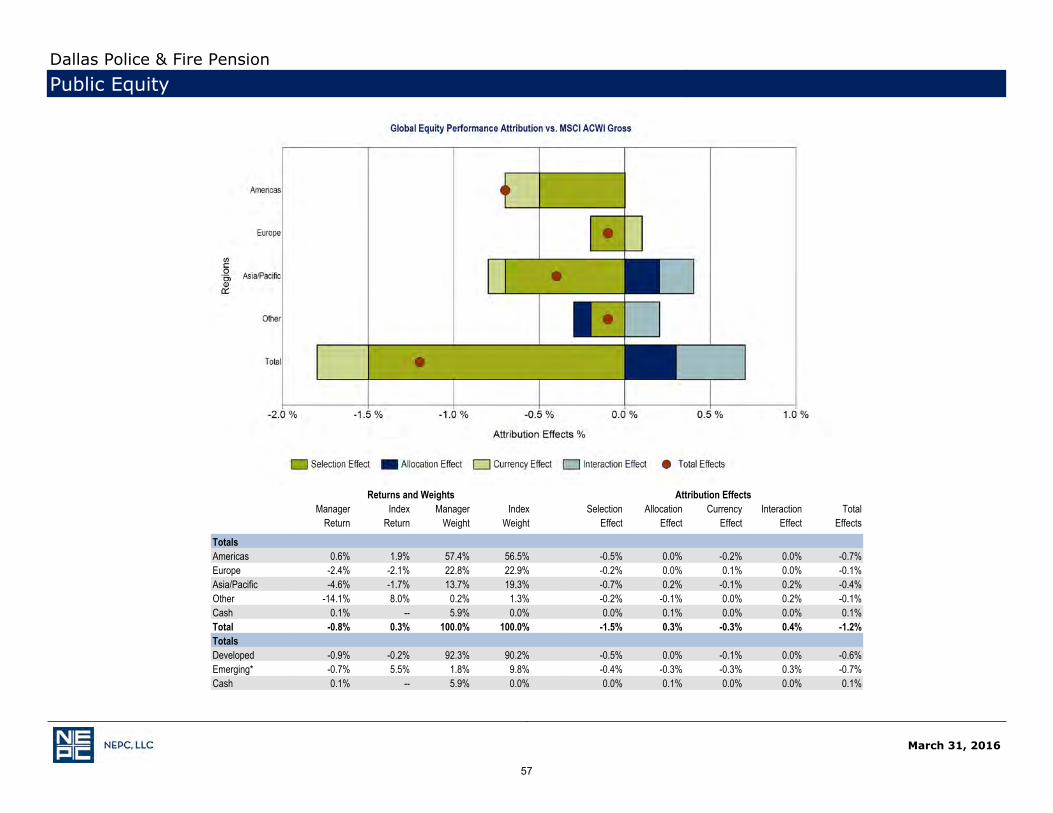
March 31, 2016
Dallas Police & Fire PensionPublic Equity
Returns and Weights Attribution EffectsManager Index Manager Index Selection Allocation Currency Interaction Total
Return Return Weight Weight Effect Effect Effect Effect Effects_
Totals Americas 0.6% 1.9% 57.4% 56.5% -0.5% 0.0% -0.2% 0.0% -0.7%Europe -2.4% -2.1% 22.8% 22.9% -0.2% 0.0% 0.1% 0.0% -0.1%Asia/Pacific -4.6% -1.7% 13.7% 19.3% -0.7% 0.2% -0.1% 0.2% -0.4%Other -14.1% 8.0% 0.2% 1.3% -0.2% -0.1% 0.0% 0.2% -0.1%Cash 0.1% -- 5.9% 0.0% 0.0% 0.1% 0.0% 0.0% 0.1%Total -0.8% 0.3% 100.0% 100.0% -1.5% 0.3% -0.3% 0.4% -1.2%Totals Developed -0.9% -0.2% 92.3% 90.2% -0.5% 0.0% -0.1% 0.0% -0.6%Emerging* -0.7% 5.5% 1.8% 9.8% -0.4% -0.3% -0.3% 0.3% -0.7%Cash 0.1% -- 5.9% 0.0% 0.0% 0.1% 0.0% 0.0% 0.1%
_
57

March 31, 2016
Dallas Police & Fire PensionGlobal Fixed Composite
58

March 31, 2016
Dallas Police & Fire PensionGlobal Fixed Composite
59

Eagle AssetDallas Police & Fire Pension
• Manager Role in Portfolio– Eagle manages the domestic small cap portfolio within Global Equity
bucket
• Organizational Profile– Eagle Asset Management was founded in 1976 and is a wholly owned
subsidiary of Raymond James Financial, Inc. Eagle became a Registered Investment Advisor in 1984.
– Retail products form the core of their business
• Investment Strategy Commentary– Fundamental, bottom-up approach– Seeks companies with sustainable competitive advantages– Favors companies that have strong management, conservative
accounting, low-cost relative production costs, and high barriers to entry
60

March 31, 2016
Dallas Police & Fire PensionEagle AssetDallas Police & Fire PensionEagle Asset
61
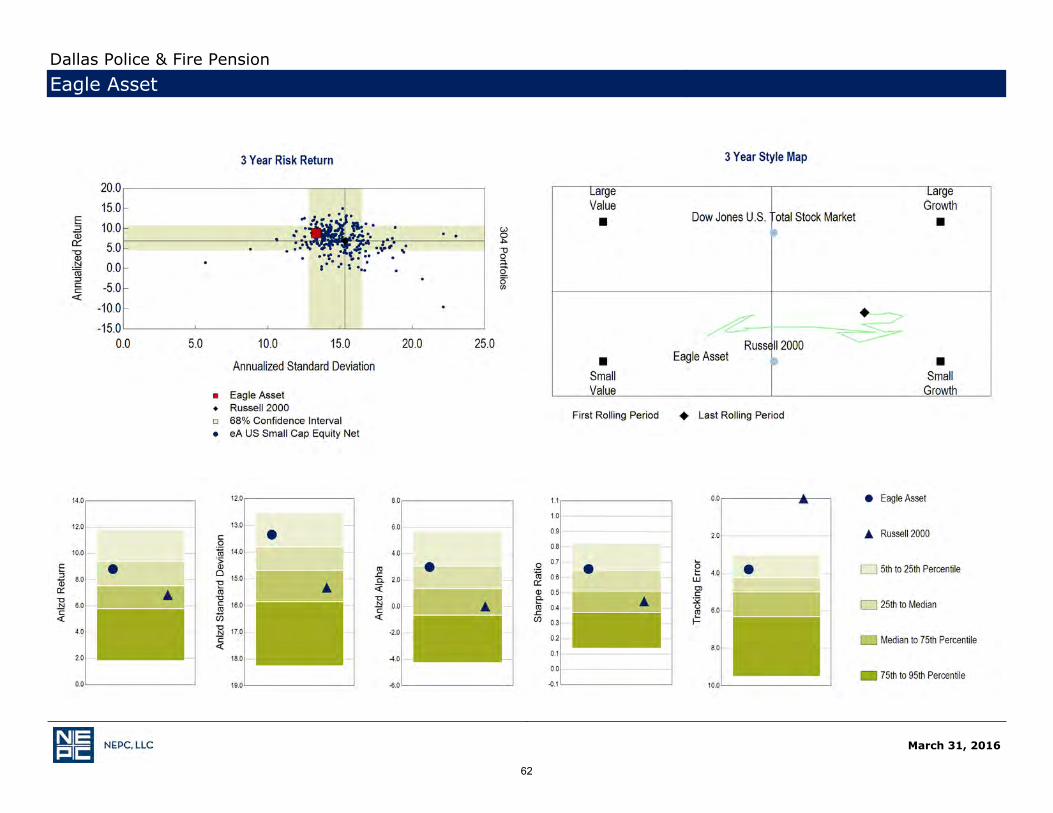
March 31, 2016
Dallas Police & Fire PensionEagle Asset
62

March 31, 2016
Dallas Police & Fire PensionEagle Asset
Equity Sector AttributionAttribution Effects Returns Sector Weights
Total Selection Allocation InteractionEffects Effect Effect Effects Portfolio Benchmark Portfolio Benchmark
_
Energy 0.6% 0.6% 0.0% 0.0% 13.1% -8.2% 2.5% 2.7%Materials -0.1% -0.1% 0.0% 0.0% 1.5% 5.0% 4.3% 3.6%Industrials 0.3% 0.3% 0.0% 0.0% 7.1% 4.5% 12.4% 12.2%Cons. Disc. 0.3% 0.3% 0.0% 0.0% 4.2% 2.3% 14.4% 13.6%Cons. Staples 0.2% 0.2% 0.0% 0.0% 9.1% 3.2% 3.5% 3.4%Health Care 1.7% 1.6% 0.3% -0.2% -7.6% -17.4% 14.2% 16.3%Financials 0.0% 0.0% 0.0% 0.0% 0.4% 0.3% 25.6% 25.7%Info. Tech 0.0% 0.0% 0.0% 0.0% -1.5% -1.7% 18.4% 17.9%Telecomm. -0.1% -- -0.1% -- -- 5.9% 0.0% 0.9%Utilities -0.4% 0.0% -0.4% 0.0% 11.4% 12.3% 1.0% 3.7%Cash 0.1% 0.0% 0.1% 0.0% 0.1% -- 3.5% 0.0%Portfolio 2.7% = 2.9% + 0.0% + -0.2% 1.1% -1.6% 100.0% 100.0%
_
Characteristics
Portfolio Russell2000
Number of Holdings 117 1,959Weighted Avg. Market Cap. ($B) 2.7 1.9Median Market Cap. ($B) 2.1 0.6Price To Earnings 23.6 24.1Price To Book 3.6 2.7Price To Sales 3.1 2.8Return on Equity (%) 14.2 10.6Yield (%) 1.7 1.4Beta 1.0R-Squared 1.0
63

March 31, 2016
Dallas Police & Fire PensionEagle Asset
Top Negative ContributorsRelative
Contribution% Return %
_
J2 GLOBAL -0.4% -24.9%LOGMEIN -0.3% -24.8%SAGENT PHARMACEUTICALS -0.3% -23.5%QIAGEN (NAS) -0.2% -19.2%NATUS MEDICAL -0.2% -20.0%LIBERTY VENTURES 'A' -0.2% -13.3%KORN FERRY INTERNATIONAL -0.1% -14.4%INC RESEARCH HOLDINGS CL.A -0.1% -15.0%MAIDEN HOLDINGS -0.1% -12.3%ICU MEDICAL -0.1% -7.7%
_
Top Positive ContributorsRelative
Contribution% Return %
_
BURLINGTON STORES 0.3% 31.1%VISTEON 0.3% 18.1%WESCO INTL. 0.3% 25.2%CYRUSONE 0.2% 23.0%INTER PARFUMS 0.2% 30.4%GEO GROUP 0.2% 22.9%DELUXE 0.2% 15.2%PATTERSON UTI ENERGY 0.2% 17.5%BROADRIDGE FINL.SLTN. 0.2% 11.0%SURGICAL CARE AFFILIATES 0.2% 16.3%
_
64

65

March 31, 2016
Dallas Police & Fire PensionPyramis
66

Returns are net of fees
March 31, 2016
Dallas Police & Fire PensionPyramis
67

March 31, 2016
Dallas Police & Fire PensionPyramis
Equity Sector AttributionAttribution Effects Returns Sector Weights
Total Selection Allocation InteractionEffects Effect Effect Effects Portfolio Benchmark Portfolio Benchmark
_
Energy -0.3% -0.2% -0.1% 0.0% 2.2% 6.2% 4.6% 6.1%Materials -0.3% -0.3% 0.0% 0.0% -1.8% 5.8% 4.3% 4.6%Industrials -0.2% -0.1% 0.0% -0.1% 1.8% 3.6% 8.6% 10.2%Cons. Disc. -0.1% -0.1% 0.0% 0.0% -1.0% -0.4% 11.4% 13.1%Cons. Staples -0.2% -0.1% -0.1% 0.0% 3.9% 4.8% 9.2% 10.3%Health Care -0.2% -0.2% 0.0% 0.0% -8.0% -6.5% 12.3% 12.6%Financials -0.1% -0.2% 0.2% -0.1% -6.4% -5.0% 17.8% 21.6%Info. Tech -0.3% -0.2% -0.1% 0.0% 0.1% 1.7% 11.5% 14.6%Telecomm. -0.2% -0.2% 0.0% 0.0% 2.8% 7.1% 3.8% 3.7%Utilities -0.2% 0.0% -0.1% 0.0% 7.7% 8.8% 1.9% 3.2%Cash 0.2% 0.0% 0.2% 0.0% 0.1% -- 14.6% 0.0%Portfolio -1.8% = -1.6% + 0.1% + -0.2% -1.4% 0.3% 100.0% 100.0%
_
Characteristics
Portfolio MSCIACWI
Number of Holdings 418 2,482Weighted Avg. Market Cap. ($B) 85.1 87.3Median Market Cap. ($B) 19.8 8.3Price To Earnings 23.5 20.2Price To Book 3.9 3.2Price To Sales 3.5 2.7Return on Equity (%) 16.7 15.8Yield (%) 2.4 2.6Beta 1.0R-Squared 1.0
68

March 31, 2016
Dallas Police & Fire PensionPyramis
Top Negative ContributorsRelative
Contribution% Return %
_
MARATHON PETROLEUM -0.1% -27.6%BIOMARIN PHARM. -0.1% -21.3%ACTIVISION BLIZZARD -0.1% -11.9%VERTEX PHARMS. -0.1% -36.8%ALLERGAN -0.1% -14.2%ENDO INTERNATIONAL -0.1% -54.0%SERES THERAPEUTICS -0.1% -24.3%TEVA PHARM.INDS.ADR 1:1 -0.1% -18.0%GLOBAL BLOOD THERP. -0.1% -50.9%ALLIANCE DATA SYSTEMS -0.1% -20.5%
_
Top Positive ContributorsRelative
Contribution% Return %
_
EATON 0.1% 21.4%EDISON INTL. 0.1% 22.2%XCEL ENERGY 0.1% 17.4%DILLARDS 'A' 0.0% 29.3%REYNOLDS AMERICAN 0.0% 9.9%PVH 0.0% 34.6%CMS ENERGY 0.0% 18.6%COGENT COMMS.HOLDINGS 0.0% 13.6%RANDGOLD RESOURCES 0.0% 51.0%ROCHE HOLDING 0.0% -7.6%
69

PyramisDallas Police & Fire Pension
March 31, 2016
Source: Pyramis
70

PyramisDallas Police & Fire Pension
March 31, 2016
Source: Pyramis
71

Dallas Police & Fire Pension
72
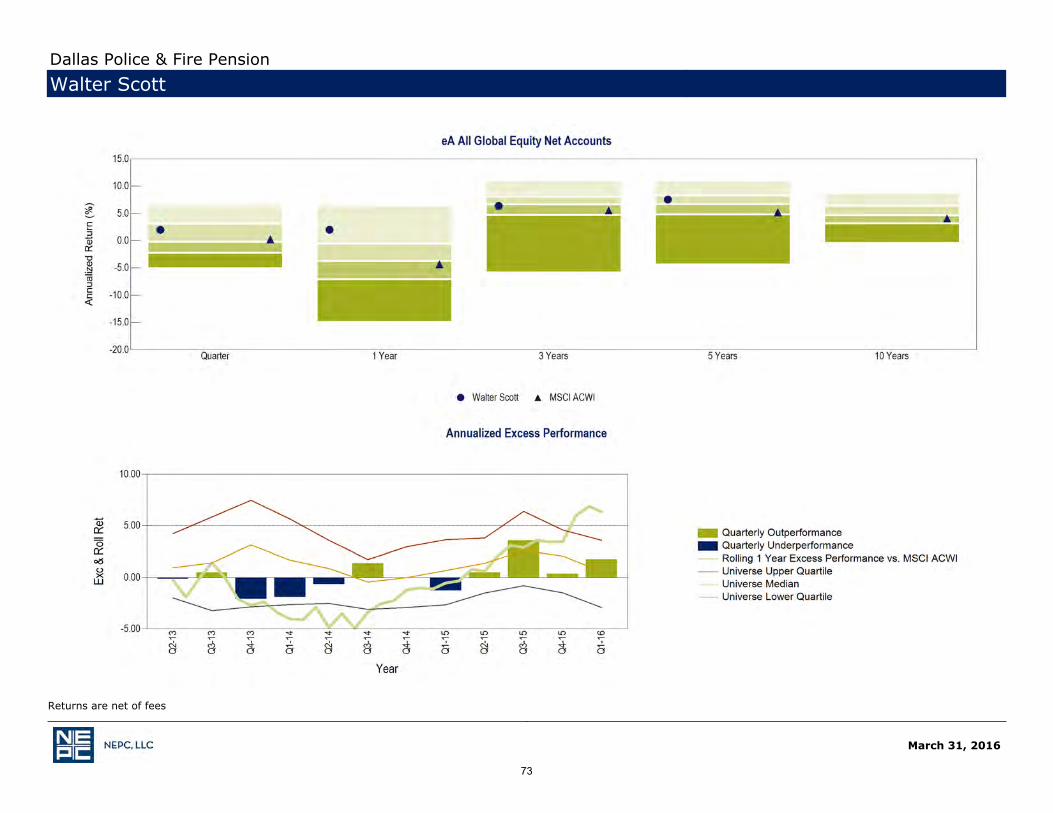
Returns are net of fees
March 31, 2016
Dallas Police & Fire PensionWalter Scott
73

Returns are net of fees
March 31, 2016
Dallas Police & Fire PensionWalter Scott
74
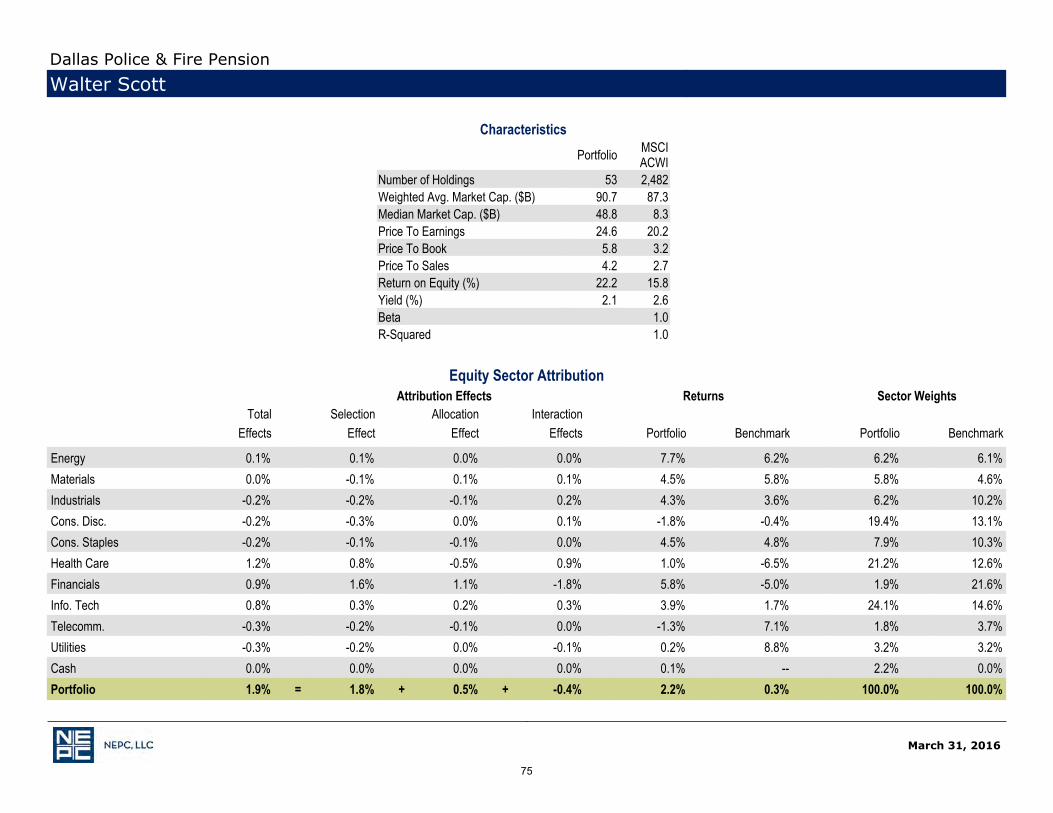
March 31, 2016
Dallas Police & Fire PensionWalter Scott
Characteristics
Portfolio MSCIACWI
Number of Holdings 53 2,482Weighted Avg. Market Cap. ($B) 90.7 87.3Median Market Cap. ($B) 48.8 8.3Price To Earnings 24.6 20.2Price To Book 5.8 3.2Price To Sales 4.2 2.7Return on Equity (%) 22.2 15.8Yield (%) 2.1 2.6Beta 1.0R-Squared 1.0
Equity Sector AttributionAttribution Effects Returns Sector Weights
Total Selection Allocation InteractionEffects Effect Effect Effects Portfolio Benchmark Portfolio Benchmark
_
Energy 0.1% 0.1% 0.0% 0.0% 7.7% 6.2% 6.2% 6.1%Materials 0.0% -0.1% 0.1% 0.1% 4.5% 5.8% 5.8% 4.6%Industrials -0.2% -0.2% -0.1% 0.2% 4.3% 3.6% 6.2% 10.2%Cons. Disc. -0.2% -0.3% 0.0% 0.1% -1.8% -0.4% 19.4% 13.1%Cons. Staples -0.2% -0.1% -0.1% 0.0% 4.5% 4.8% 7.9% 10.3%Health Care 1.2% 0.8% -0.5% 0.9% 1.0% -6.5% 21.2% 12.6%Financials 0.9% 1.6% 1.1% -1.8% 5.8% -5.0% 1.9% 21.6%Info. Tech 0.8% 0.3% 0.2% 0.3% 3.9% 1.7% 24.1% 14.6%Telecomm. -0.3% -0.2% -0.1% 0.0% -1.3% 7.1% 1.8% 3.7%Utilities -0.3% -0.2% 0.0% -0.1% 0.2% 8.8% 3.2% 3.2%Cash 0.0% 0.0% 0.0% 0.0% 0.1% -- 2.2% 0.0%Portfolio 1.9% = 1.8% + 0.5% + -0.4% 2.2% 0.3% 100.0% 100.0%
75

March 31, 2016
Dallas Police & Fire PensionWalter Scott
Top Negative ContributorsRelative
Contribution% Return %
_
DENSO -0.3% -15.7%HONDA MOTOR -0.2% -14.9%FANUC -0.2% -11.2%NOVARTIS 'R' -0.2% -12.9%GILEAD SCIENCES -0.1% -8.8%HENNES & MAURITZ 'B' -0.1% -6.8%ROCHE HOLDING -0.1% -7.6%SHIN-ETSU CHEMICAL -0.1% -4.9%HONG KONG AND CHINA GAS -0.1% -4.7%NOVO NORDISK 'B' -0.1% -5.0%
_
Top Positive ContributorsRelative
Contribution% Return %
_
STRYKER 0.3% 15.9%TAIWAN SEMICON.SPN.ADR 1:5 0.3% 15.2%SGS 'N' 0.3% 14.9%TJX 0.2% 10.8%INTUITIVE SURGICAL 0.2% 10.1%PRAXAIR 0.2% 12.6%AMPHENOL 'A' 0.2% 11.0%ORACLE 0.2% 12.5%CNOOC 0.2% 13.4%LVMH 0.2% 9.0%
_
76

March 31, 2016
Dallas Police & Fire PensionWalter Scott
Country AllocationManager Index Manager Index
Allocation (USD) Allocation (USD) Return (USD) Return (USD)_
Americas Canada 1.3% 2.8% 9.7% 11.4%United States 45.8% 52.6% 4.9% 1.0%Total-Americas 47.1% 56.5% 5.0% 1.9%Europe Denmark 2.1% 0.7% -5.0% -0.7%France 5.7% 3.4% 4.6% 0.1%Spain 2.3% 1.1% -2.1% -4.1%Sweden 2.0% 1.0% -6.8% 0.1%Switzerland 10.6% 3.3% -0.1% -5.2%United Kingdom 3.6% 6.6% 4.2% -2.6%Total-Europe 26.2% 22.9% 0.4% -2.1%
_
Country AllocationManager Index Manager Index
Allocation (USD) Allocation (USD) Return (USD) Return (USD)_
AsiaPacific Australia 2.4% 2.4% 2.7% 2.1%Hong Kong 6.4% 1.1% 2.7% -0.4%Japan 11.8% 8.1% -7.6% -6.5%Singapore 1.9% 0.4% 5.8% 5.1%Taiwan* 2.0% 1.2% 15.2% 7.7%Total-AsiaPacific 24.5% 19.3% -1.0% -1.7%Totals Developed 95.7% 90.2% 2.0% -0.2%Emerging* 2.0% 9.8% 15.2% 5.5%Cash 2.2% 0.1%
_
77

March 31, 2016
Dallas Police & Fire PensionWalter Scott
Returns and Weights Attribution EffectsManager Index Manager Index Selection Allocation Currency Interaction Total
Return Return Weight Weight Effect Effect Effect Effect Effects_
Totals Americas 5.0% 1.9% 47.1% 56.5% 2.0% -0.3% -0.2% -0.3% 1.2%Europe 0.4% -2.1% 26.2% 22.9% 0.4% -0.1% 0.3% 0.1% 0.6%Asia/Pacific -1.0% -1.7% 24.5% 19.3% 0.2% -0.2% 0.2% 0.0% 0.2%Other -- 8.0% 0.0% 1.3% -- -0.1% 0.0% -- -0.1%Cash 0.1% -- 2.2% 0.0% 0.0% 0.0% 0.0% 0.0% 0.0%Total 2.2% 0.3% 100.0% 100.0% 2.5% -0.6% 0.3% -0.2% 1.9%Totals Developed 2.0% -0.2% 95.7% 90.2% 1.6% 0.0% 0.5% 0.1% 2.2%Emerging* 15.2% 5.5% 2.0% 9.8% 1.2% -0.3% -0.3% -1.0% -0.3%Cash 0.1% -- 2.2% 0.0% 0.0% 0.0% 0.0% 0.0% 0.0%
_
78

79

Returns are net of fees
March 31, 2016
Dallas Police & Fire PensionOFI
80

Returns are net of fees
March 31, 2016
Dallas Police & Fire PensionOFI
81

March 31, 2016
Dallas Police & Fire PensionOFI
Equity Sector AttributionAttribution Effects Returns Sector Weights
Total Selection Allocation InteractionEffects Effect Effect Effects Portfolio Benchmark Portfolio Benchmark
_
Energy -0.3% 0.0% -0.3% 0.0% 8.2% 5.0% 1.2% 6.0%Materials -0.3% -0.3% -0.1% 0.1% 0.0% 4.5% 0.8% 4.4%Industrials -0.2% -0.4% 0.0% 0.1% 1.1% 3.6% 12.0% 10.7%Cons. Disc. -0.2% -0.4% 0.0% 0.2% -2.4% -0.6% 13.5% 13.4%Cons. Staples -0.3% 0.2% -0.2% -0.2% 5.1% 4.7% 5.7% 10.6%Health Care -1.4% -0.8% -0.2% -0.3% -13.3% -6.6% 17.7% 13.7%Financials -1.7% -1.9% 0.1% 0.0% -15.3% -6.2% 19.7% 20.9%Info. Tech -1.0% -0.9% 0.3% -0.4% -4.0% 1.3% 26.0% 13.7%Telecomm. -0.2% -0.3% -0.1% 0.2% 3.0% 7.1% 1.6% 3.4%Utilities -0.3% -0.4% -0.3% 0.3% 0.3% 8.8% 0.0% 3.2%Cash 0.0% 0.0% 0.0% 0.0% 0.1% -- 1.7% 0.0%Portfolio -6.0% = -5.2% + -0.9% + 0.1% -6.2% -0.2% 100.0% 100.0%
_
Characteristics
Portfolio MSCIWorld
Number of Holdings 92 1,647Weighted Avg. Market Cap. ($B) 64.8 92.8Median Market Cap. ($B) 26.5 10.4Price To Earnings 25.0 20.7Price To Book 3.9 3.2Price To Sales 3.7 2.7Return on Equity (%) 16.0 15.6Yield (%) 1.9 2.6Beta 1.0R-Squared 1.0
82

March 31, 2016
Dallas Police & Fire PensionOFI
Top Negative ContributorsRelative
Contribution% Return %
_
SUNEDISON -0.7% -89.4%CELLDEX THERAPEUTICS -0.6% -75.9%MURATA MANUFACTURING -0.4% -16.7%CREDIT SUISSE GROUP N -0.4% -34.4%DAI-ICHI LIFE INSURANCE -0.4% -26.5%CITIGROUP -0.3% -19.2%DEUTSCHE BANK -0.3% -30.5%PRUDENTIAL -0.2% -14.8%JD.COM 'A' ADR 1:2 -0.2% -17.9%BANCA MONTE DEI PASCHI -0.2% -57.2%
_
Top Positive ContributorsRelative
Contribution% Return %
_
LVMH 0.2% 9.0%INTUIT 0.1% 8.1%COLGATE-PALM. 0.1% 6.7%3M 0.1% 11.4%UNITED PARCEL SER.'B' 0.1% 10.5%FACEBOOK CLASS A 0.1% 9.0%AETNA 0.1% 4.2%UNILEVER (UK) 0.1% 5.9%PAYPAL HOLDINGS 0.1% 6.6%EMERSON ELECTRIC 0.1% 14.9%
_
83

March 31, 2016
Country AllocationManager Index Manager Index
Allocation (USD) Allocation (USD) Return (USD) Return (USD)_
AsiaPacific China* 1.8% 0.0% -12.2% -4.8%India* 1.3% 0.0% -8.6% -2.5%Japan 13.0% 9.0% -10.6% -6.5%Total-AsiaPacific 16.1% 13.4% -10.6% -3.7%Totals Developed 93.9% 100.0% -6.2% -0.2%Emerging* 4.5% 0.0% -8.8% --Cash 1.7% 0.1%
_
Dallas Police & Fire PensionOFI
Country AllocationManager Index Manager Index
Allocation (USD) Allocation (USD) Return (USD) Return (USD)_
Americas Brazil* 0.8% 0.0% -10.6% 28.5%Mexico* 0.6% 0.0% 4.3% 8.5%United States 46.7% 58.4% -5.7% 1.0%Total-Americas 48.1% 61.5% -5.7% 1.5%Europe Denmark 0.3% 0.7% 20.2% -0.7%Finland 0.0% 0.3% 0.3% -2.6%France 7.2% 3.8% 1.4% 0.1%Germany 9.8% 3.5% -5.7% -2.4%Italy 1.6% 0.9% -14.1% -11.6%Spain 3.3% 1.2% -2.9% -4.1%Sweden 3.4% 1.1% -2.1% 0.1%Switzerland 3.3% 3.7% -14.9% -5.2%United Kingdom 5.3% 7.4% -8.7% -2.6%Total-Europe 34.1% 24.9% -5.1% -2.4%
_
84

March 31, 2016
Dallas Police & Fire PensionOFI
Returns and Weights Attribution EffectsManager Index Manager Index Selection Allocation Currency Interaction Total
Return Return Weight Weight Effect Effect Effect Effect Effects_
Totals Americas -5.7% 1.5% 48.1% 61.5% -4.2% -0.4% -0.2% 0.9% -3.9%Europe -5.1% -2.4% 34.1% 24.9% -0.9% -0.3% 0.5% -0.3% -1.0%Asia/Pacific -10.6% -3.7% 16.1% 13.4% -0.8% -0.2% 0.0% -0.2% -1.2%Other -- -9.2% 0.0% 0.3% -- 0.0% 0.0% -- 0.0%Cash 0.1% -- 1.7% 0.0% 0.0% 0.0% 0.0% 0.0% 0.0%Total -6.2% -0.2% 100.0% 100.0% -5.9% -0.8% 0.3% 0.4% -6.0%Totals Developed -6.2% -0.2% 93.9% 100.0% -6.4% 0.0% 0.3% 0.4% -5.7%Emerging* -8.8% -- 4.5% 0.0% 0.0% 0.0% 0.0% -0.3% -0.3%Cash 0.1% -- 1.7% 0.0% 0.0% 0.0% 0.0% 0.0% 0.0%
_
85

Mitchell GroupDallas Police & Fire Pension
• Manager Role in Portfolio– Concentrated Energy sector portfolio within the Global Equity bucket– Potential bear market and inflation hedge within the equity portfolio
• Organizational Profile– Founded in 1989 and wholly-owned by its employees, this boutique investment firm is
solely focused on publicly traded energy stocks
• Investment Strategy Commentary– Combination top-down, bottom-up investment approach
• Top down focus: supply/demand forecasting, evaluate and anticipate political developments both domestically and overseas
• Bottom-up focus: detailed analysis of assets, cash flow, and financial strength
86
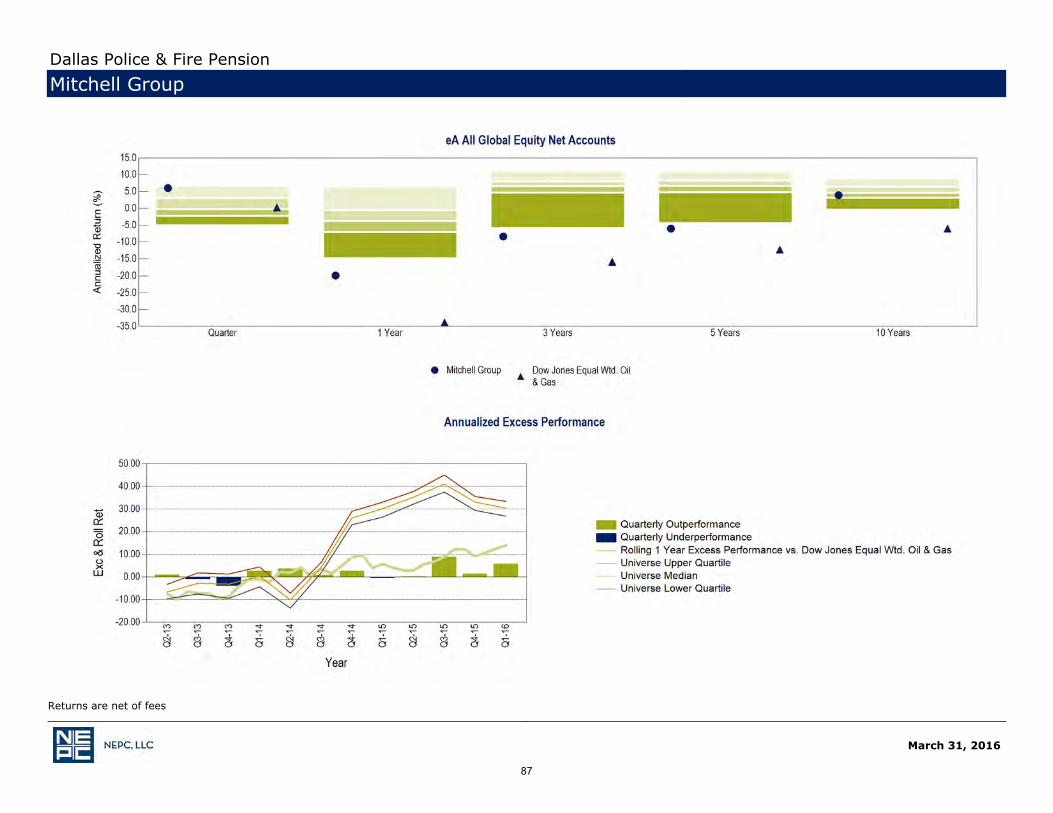
Returns are net of fees
March 31, 2016
Dallas Police & Fire PensionMitchell Group
87

Returns are net of fees
March 31, 2016
Dallas Police & Fire PensionMitchell Group
88
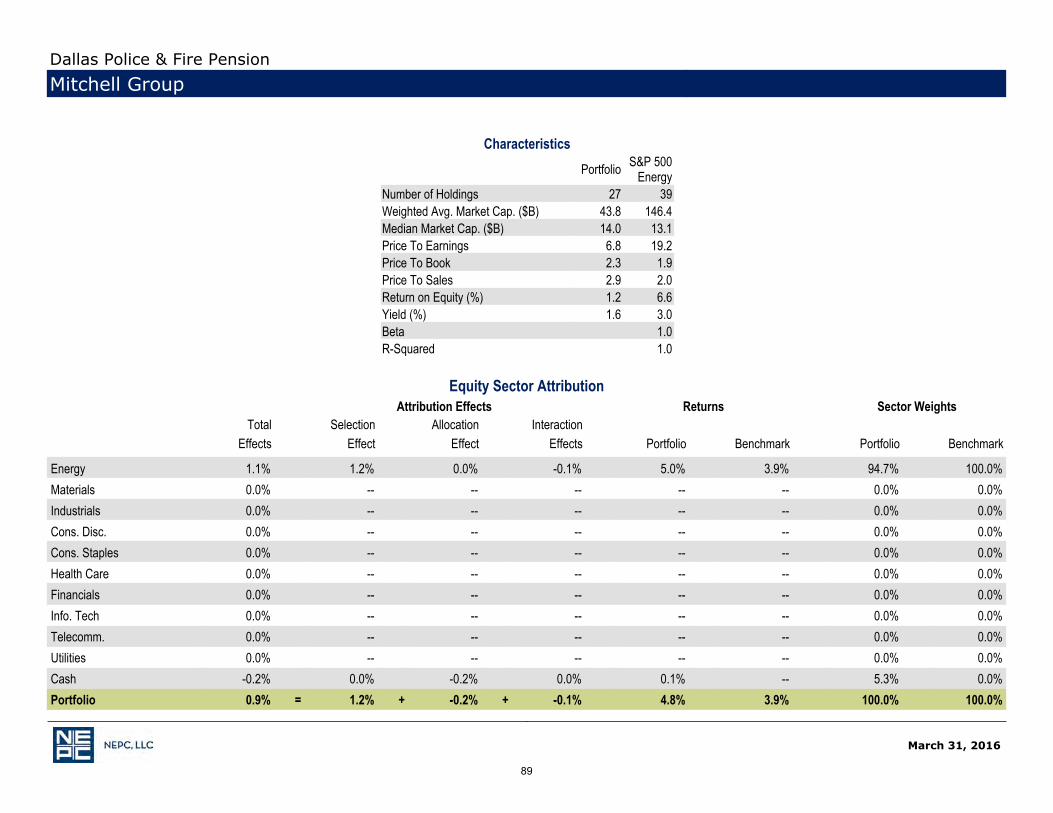
March 31, 2016
Dallas Police & Fire PensionMitchell Group
Characteristics
Portfolio S&P 500Energy
Number of Holdings 27 39Weighted Avg. Market Cap. ($B) 43.8 146.4Median Market Cap. ($B) 14.0 13.1Price To Earnings 6.8 19.2Price To Book 2.3 1.9Price To Sales 2.9 2.0Return on Equity (%) 1.2 6.6Yield (%) 1.6 3.0Beta 1.0R-Squared 1.0
Equity Sector AttributionAttribution Effects Returns Sector Weights
Total Selection Allocation InteractionEffects Effect Effect Effects Portfolio Benchmark Portfolio Benchmark
_
Energy 1.1% 1.2% 0.0% -0.1% 5.0% 3.9% 94.7% 100.0%Materials 0.0% -- -- -- -- -- 0.0% 0.0%Industrials 0.0% -- -- -- -- -- 0.0% 0.0%Cons. Disc. 0.0% -- -- -- -- -- 0.0% 0.0%Cons. Staples 0.0% -- -- -- -- -- 0.0% 0.0%Health Care 0.0% -- -- -- -- -- 0.0% 0.0%Financials 0.0% -- -- -- -- -- 0.0% 0.0%Info. Tech 0.0% -- -- -- -- -- 0.0% 0.0%Telecomm. 0.0% -- -- -- -- -- 0.0% 0.0%Utilities 0.0% -- -- -- -- -- 0.0% 0.0%Cash -0.2% 0.0% -0.2% 0.0% 0.1% -- 5.3% 0.0%Portfolio 0.9% = 1.2% + -0.2% + -0.1% 4.8% 3.9% 100.0% 100.0%
_
89

March 31, 2016
Dallas Police & Fire PensionMitchell Group
Top Negative ContributorsRelative
Contribution% Return %
_
EXXON MOBIL -1.9% 8.2%CHEVRON -0.7% 7.4%DEVON ENERGY -0.5% -13.4%ENERGEN -0.4% -10.7%MARATHON OIL -0.3% -10.9%WEATHERFORD INTL. -0.2% -7.3%SCHLUMBERGER -0.2% 6.5%NOBLE ENERGY -0.2% -4.3%BAKER HUGHES -0.1% -4.7%ANADARKO PETROLEUM -0.1% -4.0%
_
Top Positive ContributorsRelative
Contribution % Return %_
EQT 0.9% 29.1%RANGE RES. 0.8% 31.7%CANADIAN NTRL.RES. (NYS) 0.7% 24.5%PIONEER NTRL.RES. 0.4% 12.3%CIMAREX EN. 0.4% 9.0%PDC ENERGY 0.4% 11.4%ROYAL DUTCH SHELL A ADR 1:2 0.4% 8.0%HESS 0.3% 9.1%APACHE 0.3% 10.6%SOUTHWESTERN ENERGY 0.2% 13.5%
_
90

Sustainable Asset ManagementDallas Police & Fire Pension
• Manager Role in Portfolio– Concentrated eco/sustainability theme/sector portfolio within the Global Equity bucket
• Organizational Profile– SAM USA is an SEC registered Investment Adviser fully dedicated to global, regional and
thematic sustainable investing. – SAM USA's parent company, SAM was founded in 1995 as an independent asset management
company specializing in sustainability investments.– In February 2007, Robeco Group acquired a 64% stake in SAM, with the remaining 36% held
by SAM's management and employees. Since the alliance with Robeco, an employment participation plan has been created, leading to a 38% ownership of SAM by employees and management.
– On January 1, 2011, Michael Baldinger, former head of Global Clients & Marketing, replaced Sander Van Eijken as CEO, who stepped down in February of 2010. Neil Johnson was named the new head of Global Clients & Marketing.
– SAM is headquartered in New York, NY and has offices in Zurich, Switzerland, Sonoma, CA, and Boston, MA.
• Investment Strategy Commentary– A disciplined, well-structured process that strives for an optimal risk/return profile,
highlighting stock selection as the predominant return source.– The portfolio construction is bottom-up driven. Stocks are weighted within the portfolio
according to the results of the DCF valuation and their expected upside potential.– Portfolios are monitored and rebalanced on a continuous basis.– Even theme portfolios have strong biases in terms of sectors or risk factors (small caps), so
asset selection remains an important risk and performance source.– Risk management is executed with quantitative risk models on a monthly basis.
• Due Diligence Notes– On February 19, 2013, it was announced that ORIX Corporation, a publicly-traded, Tokyo-
based diversified financial services company, would be acquiring approximately 90.01% of Robeco from Rabobank. In this agreement, Rabobank will retain 9.99% of Robeco and will continue to maintain and expand Robeco’s business platform.
91

Returns are net of fees
March 31, 2016
Dallas Police & Fire PensionSustainable Asset Management
92

Returns are net of fees
March 31, 2016
Dallas Police & Fire PensionSustainable Asset Management
93

March 31, 2016
Dallas Police & Fire PensionSustainable Asset Management
Characteristics
Portfolio MSCIWorld
Number of Holdings 89 1,647Weighted Avg. Market Cap. ($B) 13.1 92.8Median Market Cap. ($B) 4.6 10.4Price To Earnings 25.0 20.7Price To Book 3.2 3.2Price To Sales 2.5 2.7Return on Equity (%) 14.0 15.6Yield (%) 2.0 2.6Beta 1.0R-Squared 1.0
Equity Sector AttributionAttribution Effects Returns Sector Weights
Total Selection Allocation InteractionEffects Effect Effect Effects Portfolio Benchmark Portfolio Benchmark
_
Energy -0.5% -2.9% -0.3% 2.7% -40.3% 5.0% 0.1% 6.0%Materials -0.3% -0.3% 0.0% -0.1% -2.0% 4.5% 5.6% 4.4%Industrials 3.3% 0.5% 1.0% 1.8% 7.3% 3.6% 42.2% 10.7%Cons. Disc. 0.1% 0.5% 0.0% -0.5% 6.3% -0.6% 2.7% 13.4%Cons. Staples -0.7% -1.1% -0.5% 0.9% -2.0% 4.7% 1.1% 10.6%Health Care 0.5% 0.7% 0.0% -0.2% -2.8% -6.6% 12.9% 13.7%Financials 1.0% 4.7% 1.3% -4.9% 16.6% -6.2% 0.5% 20.9%Info. Tech -0.2% 0.2% -0.2% -0.2% 2.9% 1.3% 4.6% 13.7%Telecomm. -0.3% -- -0.2% -- -- 7.1% 0.0% 3.4%Utilities 0.5% -0.2% 2.1% -1.3% 1.7% 8.8% 25.4% 3.2%Cash 0.1% 0.0% 0.1% 0.0% 0.1% -- 4.7% 0.0%Portfolio 3.6% = 2.2% + 3.3% + -1.9% 3.4% -0.2% 100.0% 100.0%
_
94

March 31, 2016
Dallas Police & Fire PensionSustainable Asset Management
Top Positive ContributorsRelative
Contribution % Return %_
XYLEM 0.5% 12.5%SGS 'N' 0.3% 14.9%AMERICAN WATER WORKS 0.3% 16.0%CPAD.SANMT.DE MINASGR.ON 0.2% 34.7%COWAY 0.2% 17.6%WASTE MANAGEMENT 0.2% 11.3%GEORG FISCHER 'R' 0.2% 22.4%ELIS 0.2% 17.3%CAL.WATER SER. 0.2% 15.7%TRIMBLE NAVIGATION 0.2% 15.6%
_
Top Negative ContributorsRelative
Contribution% Return %
_
GUANGDONG INVESTMENT -0.2% -10.7%PERKINELMER -0.2% -7.5%PENNON GROUP -0.1% -7.0%CHINA EVERBRIGHT INTL. -0.1% -13.1%AGILENT TECHS. -0.1% -4.7%UNITED UTILITIES GROUP -0.1% -3.8%KUBOTA -0.1% -12.9%CALGON CARBON -0.1% -18.4%EBARA -0.1% -12.0%NOVOZYMES -0.1% -5.3%
_
95
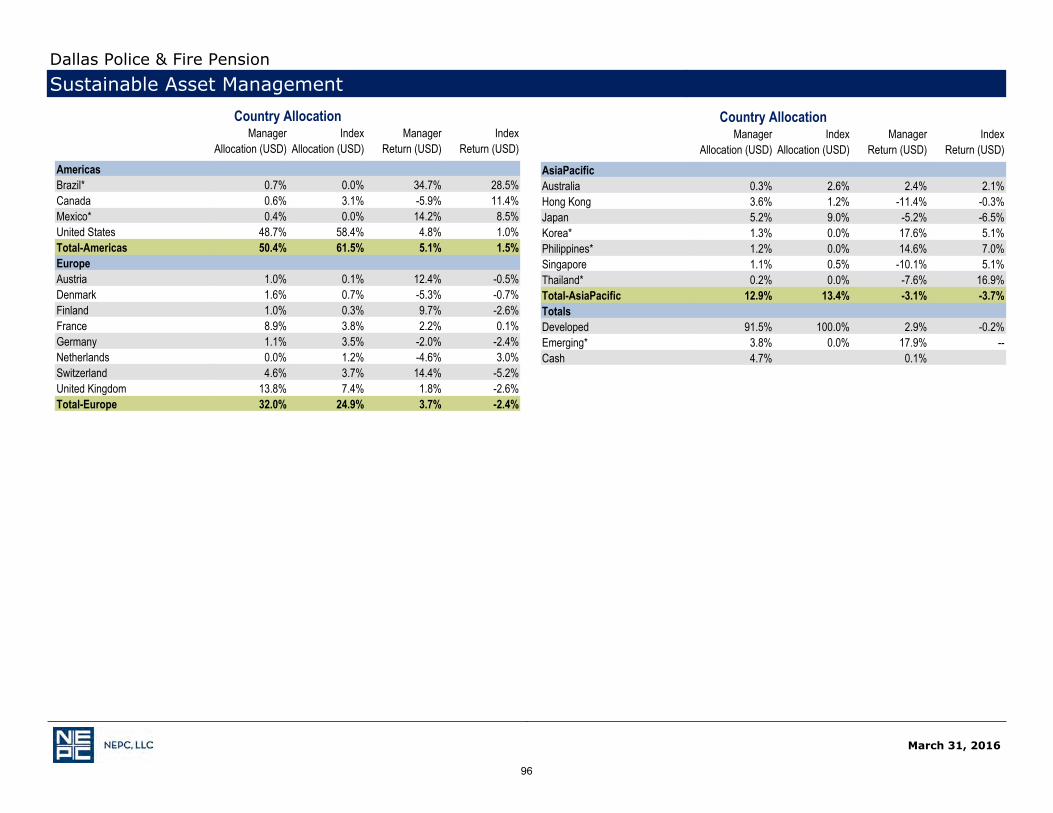
March 31, 2016
Dallas Police & Fire PensionSustainable Asset Management
Country AllocationManager Index Manager Index
Allocation (USD) Allocation (USD) Return (USD) Return (USD)_
Americas Brazil* 0.7% 0.0% 34.7% 28.5%Canada 0.6% 3.1% -5.9% 11.4%Mexico* 0.4% 0.0% 14.2% 8.5%United States 48.7% 58.4% 4.8% 1.0%Total-Americas 50.4% 61.5% 5.1% 1.5%Europe Austria 1.0% 0.1% 12.4% -0.5%Denmark 1.6% 0.7% -5.3% -0.7%Finland 1.0% 0.3% 9.7% -2.6%France 8.9% 3.8% 2.2% 0.1%Germany 1.1% 3.5% -2.0% -2.4%Netherlands 0.0% 1.2% -4.6% 3.0%Switzerland 4.6% 3.7% 14.4% -5.2%United Kingdom 13.8% 7.4% 1.8% -2.6%Total-Europe 32.0% 24.9% 3.7% -2.4%
_
Country AllocationManager Index Manager Index
Allocation (USD) Allocation (USD) Return (USD) Return (USD)_
AsiaPacific Australia 0.3% 2.6% 2.4% 2.1%Hong Kong 3.6% 1.2% -11.4% -0.3%Japan 5.2% 9.0% -5.2% -6.5%Korea* 1.3% 0.0% 17.6% 5.1%Philippines* 1.2% 0.0% 14.6% 7.0%Singapore 1.1% 0.5% -10.1% 5.1%Thailand* 0.2% 0.0% -7.6% 16.9%Total-AsiaPacific 12.9% 13.4% -3.1% -3.7%Totals Developed 91.5% 100.0% 2.9% -0.2%Emerging* 3.8% 0.0% 17.9% --Cash 4.7% 0.1%
_
96
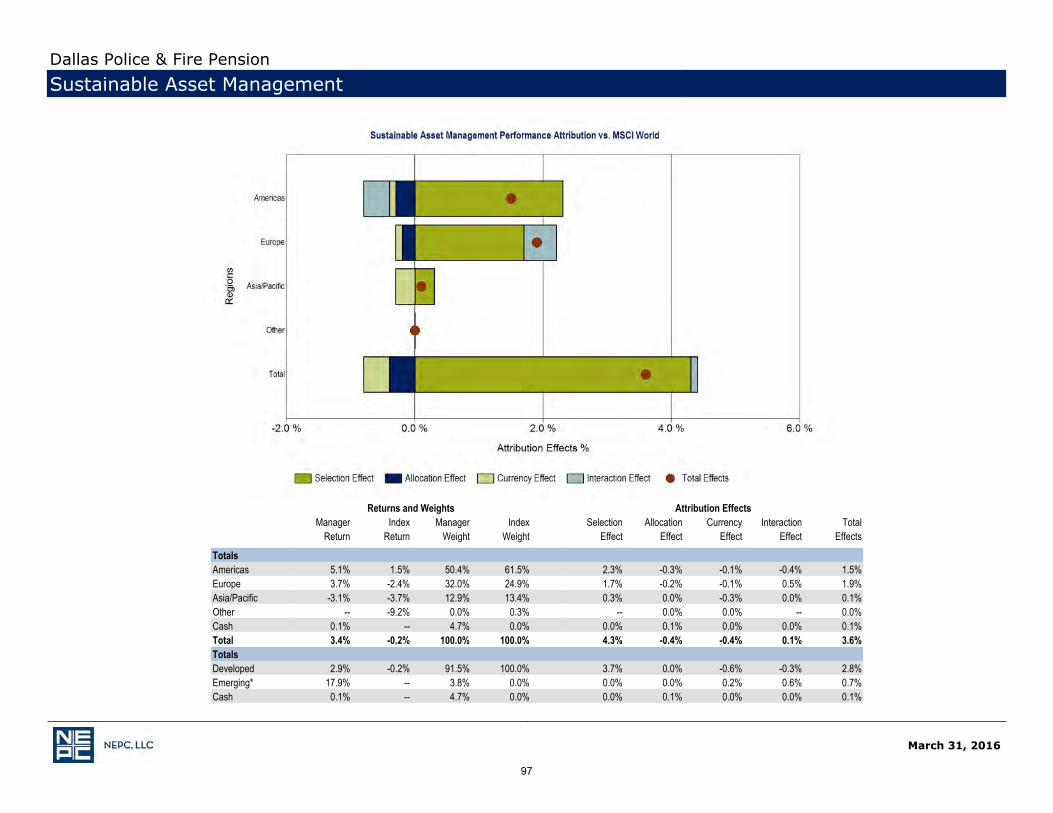
March 31, 2016
Dallas Police & Fire PensionSustainable Asset Management
Returns and Weights Attribution EffectsManager Index Manager Index Selection Allocation Currency Interaction Total
Return Return Weight Weight Effect Effect Effect Effect Effects_
Totals Americas 5.1% 1.5% 50.4% 61.5% 2.3% -0.3% -0.1% -0.4% 1.5%Europe 3.7% -2.4% 32.0% 24.9% 1.7% -0.2% -0.1% 0.5% 1.9%Asia/Pacific -3.1% -3.7% 12.9% 13.4% 0.3% 0.0% -0.3% 0.0% 0.1%Other -- -9.2% 0.0% 0.3% -- 0.0% 0.0% -- 0.0%Cash 0.1% -- 4.7% 0.0% 0.0% 0.1% 0.0% 0.0% 0.1%Total 3.4% -0.2% 100.0% 100.0% 4.3% -0.4% -0.4% 0.1% 3.6%Totals Developed 2.9% -0.2% 91.5% 100.0% 3.7% 0.0% -0.6% -0.3% 2.8%Emerging* 17.9% -- 3.8% 0.0% 0.0% 0.0% 0.2% 0.6% 0.7%Cash 0.1% -- 4.7% 0.0% 0.0% 0.1% 0.0% 0.0% 0.1%
_
97

98

Returns are net of fees
March 31, 2016
Dallas Police & Fire PensionAshmore AEMDF
99

Returns are net of fees
March 31, 2016
Dallas Police & Fire PensionAshmore AEMDF
100

Ashmore AEMDF
Characteristics AshmoreAEMDF
Average Modified Duration 7.3
Average Life (years) 12.8
Yield 8.6
Sharpe Ratio -0.2
Information Ratio -0.7
Beta 1.2
March 31,2016
Source: Ashmore, March 2016
101

Ashmore AEMDF
8.6
6.76.3
5.95.5
4.9 4.74.6 4.4 4.3
0.0
1.0
2.0
3.0
4.0
5.0
6.0
7.0
8.0
9.0
10.0
Ashmore AEMDF
Largest Country Positions
March 31,2016
Source: Ashmore, March 2016
102

Ashmore AEMDF
40.6
17.513.9
28.0
0.0
5.0
10.0
15.0
20.0
25.0
30.0
35.0
40.0
45.0
Ashmore AEMDF
Exposure by Region
March 31,2016
Source: Ashmore, March 2016
103

Ashmore AEMDF
2.3 2.24.6
17.1
96.8
0
20
40
60
80
100
120Ashmore AEMDF
Exposure by Theme
March 31,2016
Source: Ashmore, March 2016
104

105
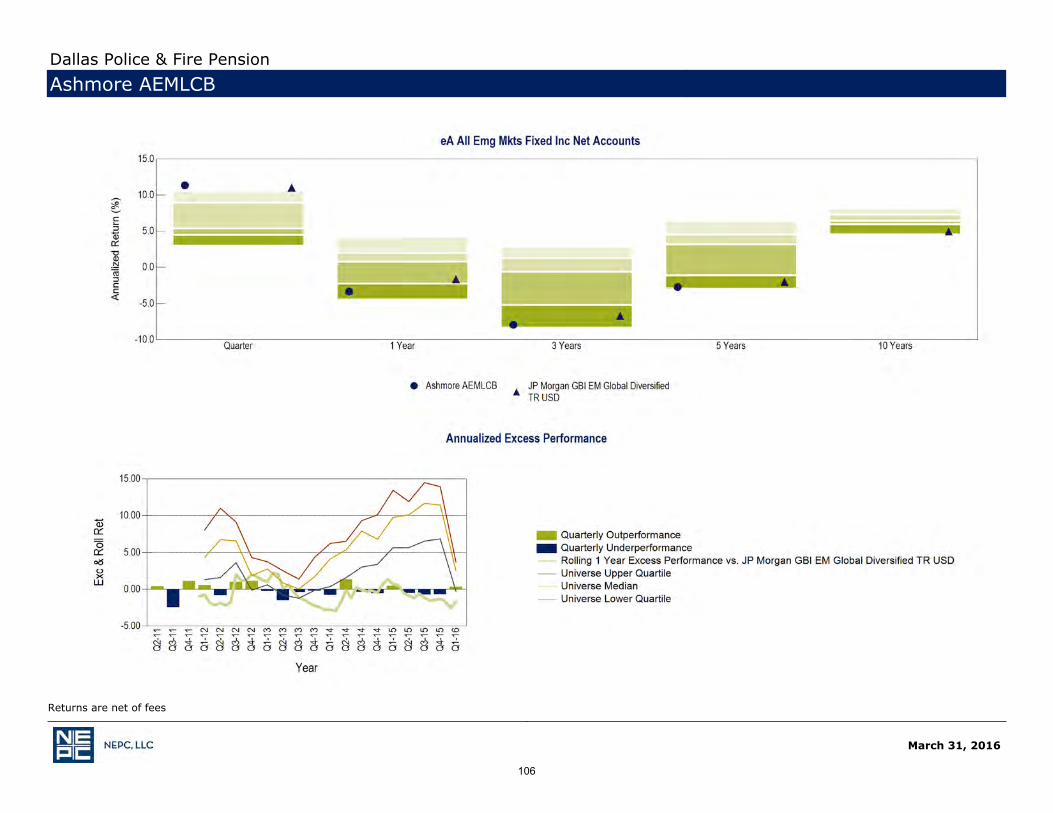
Returns are net of fees
March 31, 2016
Dallas Police & Fire PensionAshmore AEMLCB
106

Returns are net of fees
March 31, 2016
Dallas Police & Fire PensionAshmore AEMLCB
107

Ashmore AEMLCB
Source: Ashmore, March 2016
Dallas Police & Fire Pension
March 31, 2016
108

Ashmore AEMLCB
Source: Ashmore, March 2016
Dallas Police & Fire Pension
March 31, 2016
109

Ashmore AEMLCB
Characteristics AshmoreAEMLCB
Average Modified Duration 5.4
Average Life (years) 6.8
Yield to Maturity 5.9
March 31,2016
Source: Ashmore, March 2016
110

Ashmore AEMLCB
11.98 11.910.88 9.95 9.9 9.32 8.93
7.45 7.355.58
6.76
02468
101214
Ashmore AEMLCBTop 10 Currency Exposures (% of NAV)
0 0.2
24.4
59
15.4
0 0 10
10203040506070
Ashmore AEMLCB
Credit Rating of Debt Instruments (% of NAV)
March 31,2016
Source: Ashmore, March 2016
111
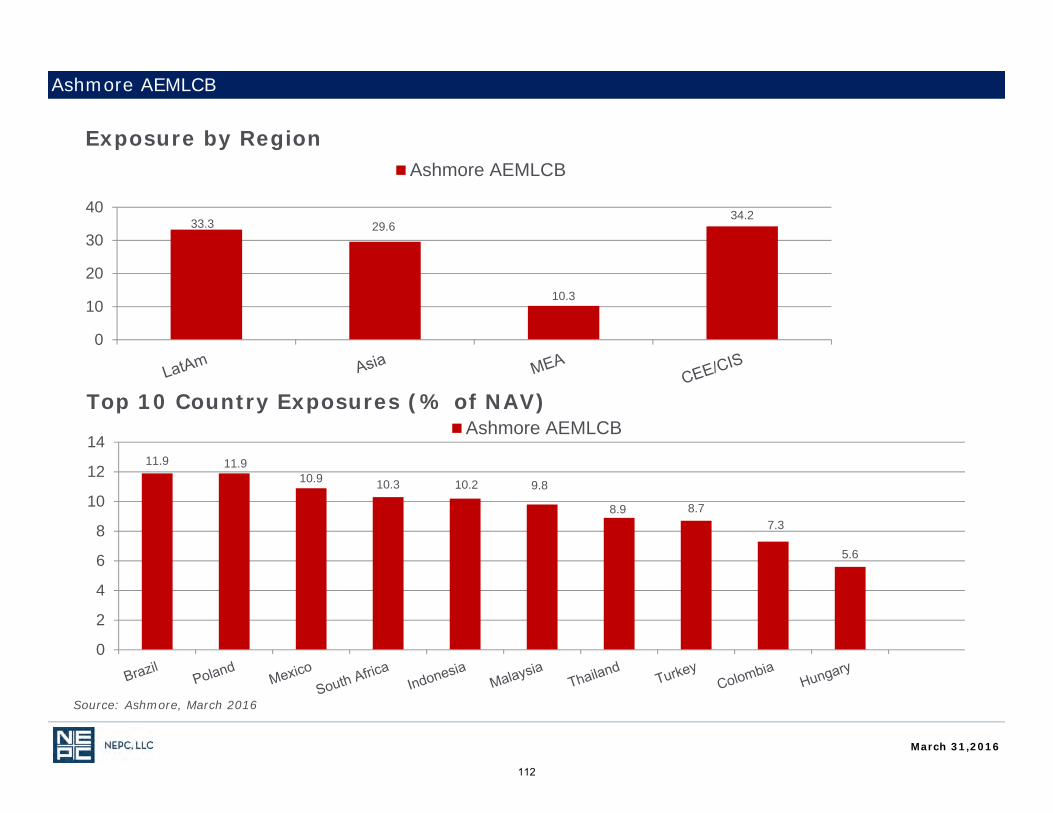
Ashmore AEMLCB
33.3 29.6
10.3
34.2
0
10
20
30
40
Ashmore AEMLCBExposure by Region
11.9 11.910.9 10.3 10.2 9.8
8.9 8.77.3
5.6
0
2
4
6
8
10
12
14Ashmore AEMLCB
Top 10 Country Exposures (% of NAV)
March 31,2016
Source: Ashmore, March 2016
112

113

Returns are net of fees
March 31, 2016
Dallas Police & Fire PensionBrandywine
114

Returns are net of fees
March 31, 2016
Dallas Police & Fire PensionBrandywine
115

March 31, 2016
Dallas Police & Fire PensionBrandywine
116

Brandywine
Average Coupon 4.1
Average Maturity 12.9
Modified Duration 7.4
Number of Issues 52
Yield to Maturity 3.5
Characteristics Brandywine
March 31,2016
Source: Brandywine, March 2016
117

Brandywine
62.2
10.5
0.9
5.91.9
13.2
0.5 0.8 3.4 0.70
10
20
30
40
50
60
70
Brandywine
Sector Allocation
March 31,2016
Source: Brandywine, March 2016
118

Brandywine
Country Allocation
-20
-15
-10
-5
0
5
10
15
20
OVER / UNDER
March 31,2016
Source: Brandywine, March 2016
119
March 31, 2016
Dallas Police & Fire PensionMondrian
120
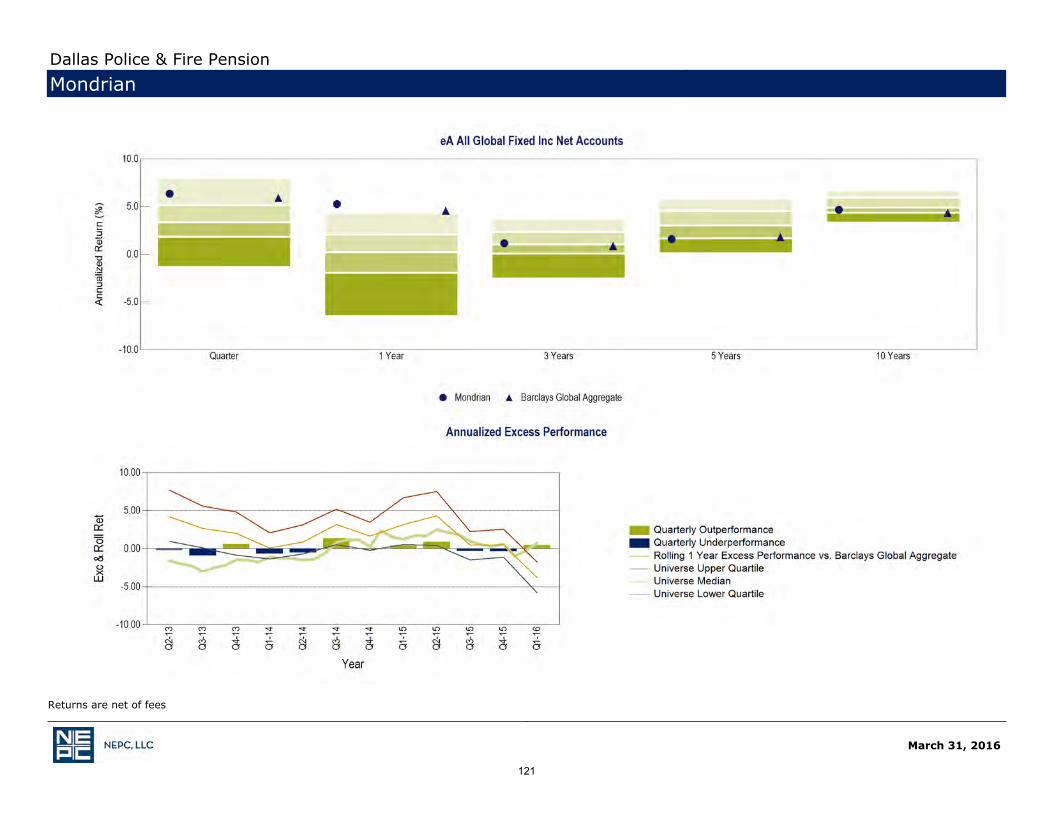
Returns are net of fees
March 31, 2016
Dallas Police & Fire PensionMondrian
121
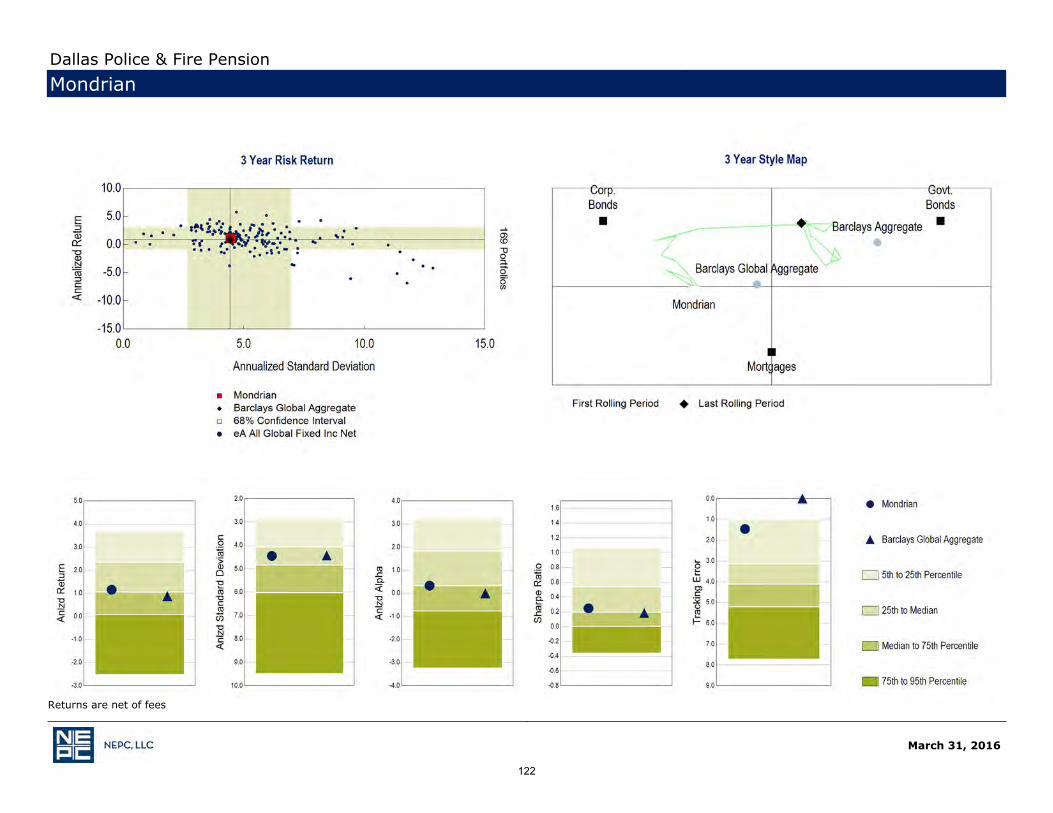
Returns are net of fees
March 31, 2016
Dallas Police & Fire PensionMondrian
122

March 31, 2016
Dallas Police & Fire PensionMondrian
123

Mondrian
Average Yield 2.1
Average Maturity 6.8
Modified Duration 5.6
Number of Issues 81
Average Quality AA-
Characteristics Mondrian
March 31,2016
Source: Mondrian, March 2016
124

Mondrian
Credit Distribution
18.1
22.9
1.6
4.2
12.0
16.8
6.9
11.2
2.81.8 1.9
0.0
5.0
10.0
15.0
20.0
25.0
Mondrian
March 31,2016
Source: Mondrian, March 2016
125

Mondrian
Country Allocation
0.0
36.7
8.1
0.0
29.126.2
0.18
32.6
0.37 0.12
46.2
20.53
0.00
5.00
10.00
15.00
20.00
25.00
30.00
35.00
40.00
45.00
50.00
Mondrian BC Global
March 31,2016
Source: Mondrian, March 2016
126

127

Returns are net of fees
March 31, 2016
Dallas Police & Fire PensionLoomis Sayles
128

March 31, 2016
Returns are net of fees
Dallas Police & Fire PensionLoomis Sayles
129

Loomis Sayles
Average Maturity (Yrs) 7.8
Duration(Yrs) 4.9
Average Quality B2
Yield to Maturity(%) 9.3
Characteristics Loomis
March 31,2016
Source: Loomis March 2016
130

Loomis Sayles
Sector Allocation
0.2
8.2
0.6
7.9
4.6
11.9
7.0
15.7
2.2
7.9
4.7
0.3
2.2
0.2
2.8
13.6
6.5
3.5
0
2
4
6
8
10
12
14
16
18LOOMIS
March 31,2016
Source: Loomis, March 2016
131
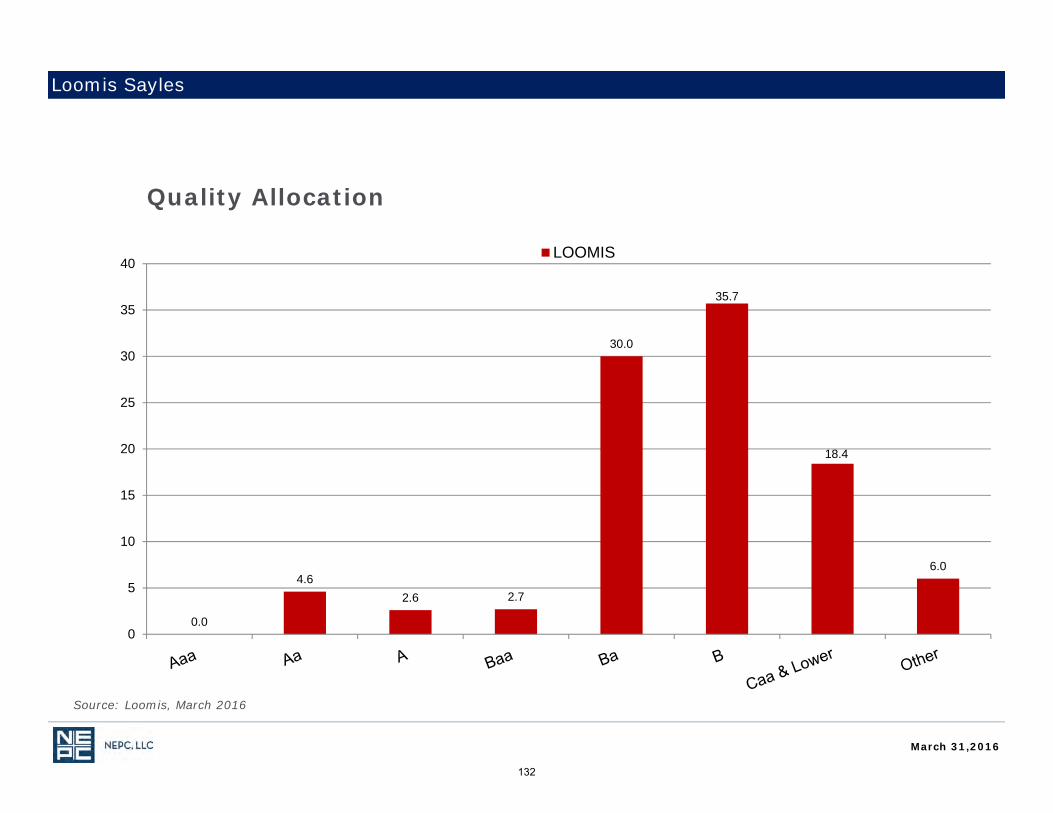
Loomis Sayles
Quality Allocation
0.0
4.62.6 2.7
30.0
35.7
18.4
6.0
0
5
10
15
20
25
30
35
40LOOMIS
March 31,2016
Source: Loomis, March 2016
132

Loomis Sayles Senior Floating Rate and Fixed IncomeDallas Police & Fire Pension
• Manager Role in Portfolio– Bank Loan manager within the Global Fixed Income bucket– Seeks to provide a high level of current income by using a value driven, opportunistic
approach and macro-guided portfolio construction– Provides some protection in a rising rate environment
• Organizational Profile– Originally founded in 1926, Loomis Sayles is now a wholly-owned subsidiary of Natixis
Global Asset Management– Loomis is highly regarded for its credit research skills
• Investment Strategy Commentary– Allocations to out of benchmark securities for offensive and defensive purposes– Must invest at least 65% in floating rate loans– May invest up to 35% of assets in other fixed income securities– May invest up to 20% of assets in non- US issuers, including 10% in emerging market
debt securities– May use leverage through borrowing up to 33.33% of the Fund’s total assets after
such borrowing
133

Returns are net of fees
March 31, 2016
Dallas Police & Fire PensionLoomis Sayles Senior Rate and Fixed Income
134

Returns are net of fees
March 31, 2016
Dallas Police & Fire PensionLoomis Sayles Senior Rate and Fixed Income
135

Loomis Sayles Senior Floating Rate and Fixed Income
Current Yield 7.0
Stated Maturity 4.8
Duration 0.4
Number of Issues 206
Average Quality B
Characteristics Loomis Sayles
March 31,2016
Source: Loomis Sayles, March 2016
136

Loomis Sayles Senior Floating Rate and Fixed Income
Credit Distribution
0.3
15.0
60.4
19.2
3.81.3
0.00
10.00
20.00
30.00
40.00
50.00
60.00
70.00
Loomis Sayles Senior Floating Rate and Fixed Income
March 31,2016
Source: Loomis Sayles, March 2016
137

Loomis Sayles Senior Floating Rate and Fixed Income
Sector Distribution
9.1
7.97.5 7.5
6.6
5.1 4.84.4 4.3
3.4
0.00
1.00
2.00
3.00
4.00
5.00
6.00
7.00
8.00
9.00
10.00
Loomis Sayles Senior Floating Rate and Fixed Income
March 31,2016
Source: Loomis Sayles, March 2016
138

139
140

141

Returns are net of fees
March 31, 2016
Dallas Police & Fire PensionAsset Allocation
142

Returns are net of fees
March 31, 2016
Dallas Police & Fire PensionGlobal Asset Allocation Composite
143

144
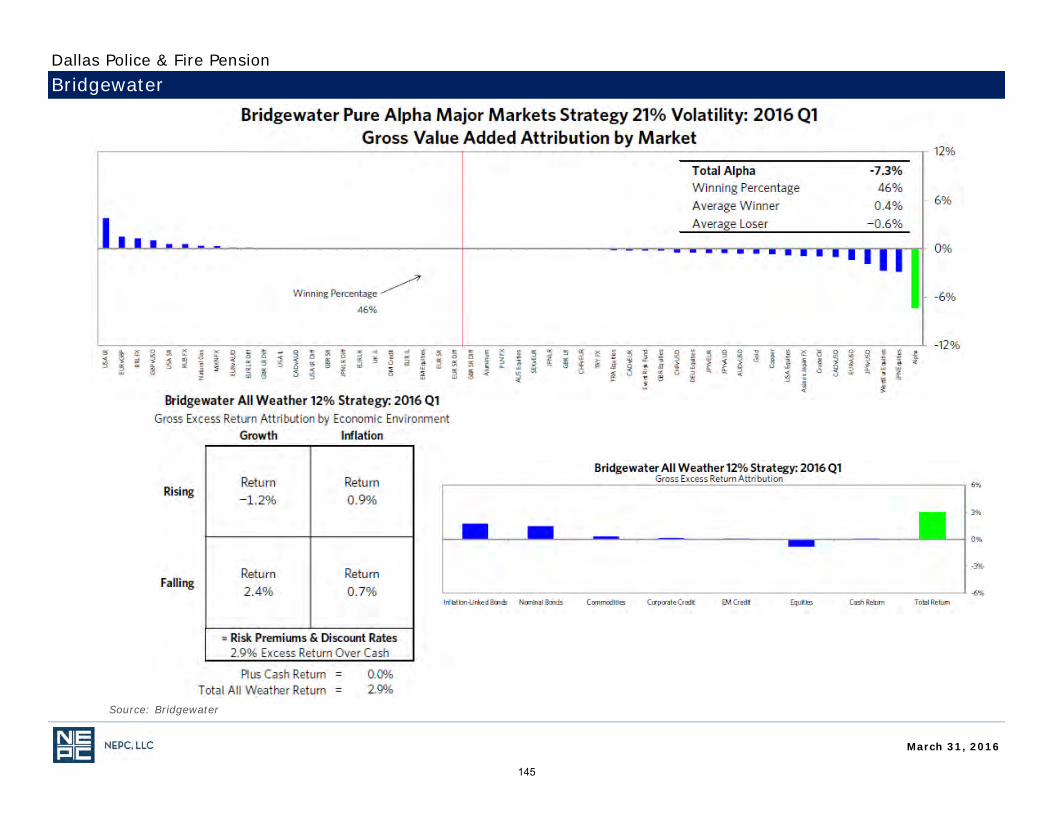
BridgewaterDallas Police & Fire Pension
March 31, 2016
Source: Bridgewater
145

Bridgewater All Weather FundDallas Police & Fire Pension
March 31, 2016
Source: Bridgewater
146

Dallas Police & Fire Pension
147

GMO (Global Allocation Absolute Return)
Historical AllocationAsset Allocation
March 31, 2016
Dallas Police & Fire Pension
Source: GMO
148

across marketplace
Dallas Police & Fire Pension
149
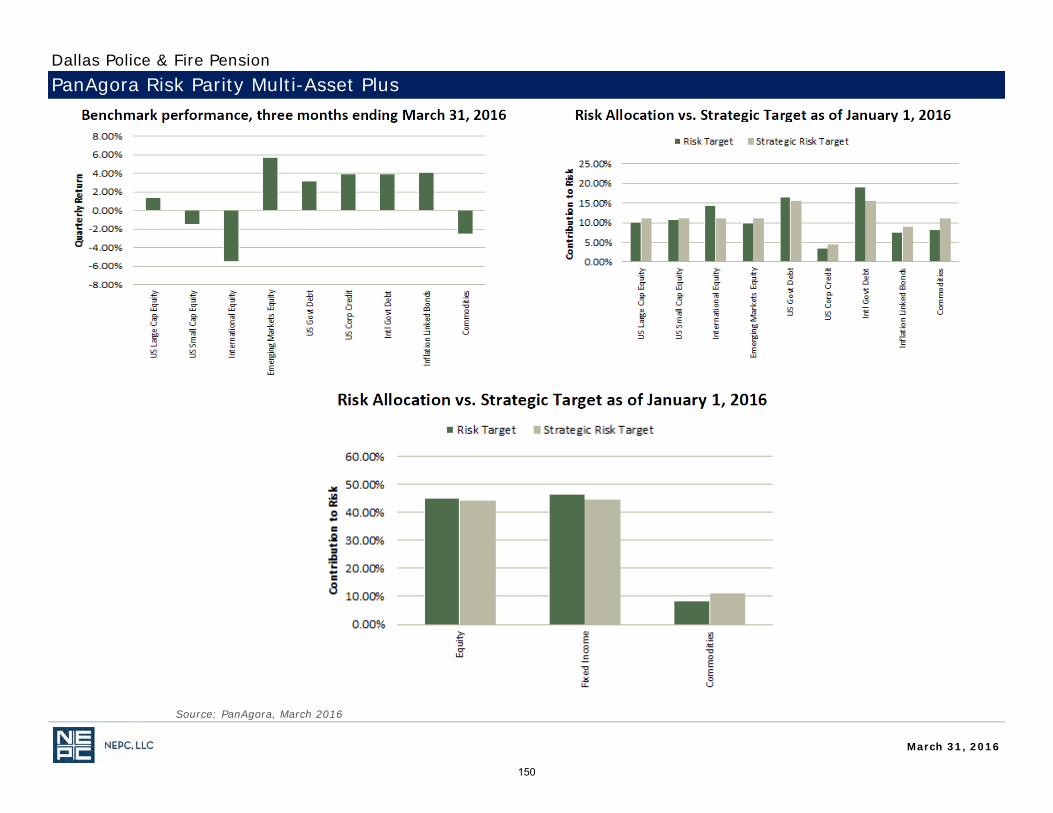
PanAgora Risk Parity Multi-Asset Plus
Source: PanAgora, March 2016
Dallas Police & Fire Pension
March 31, 2016
150
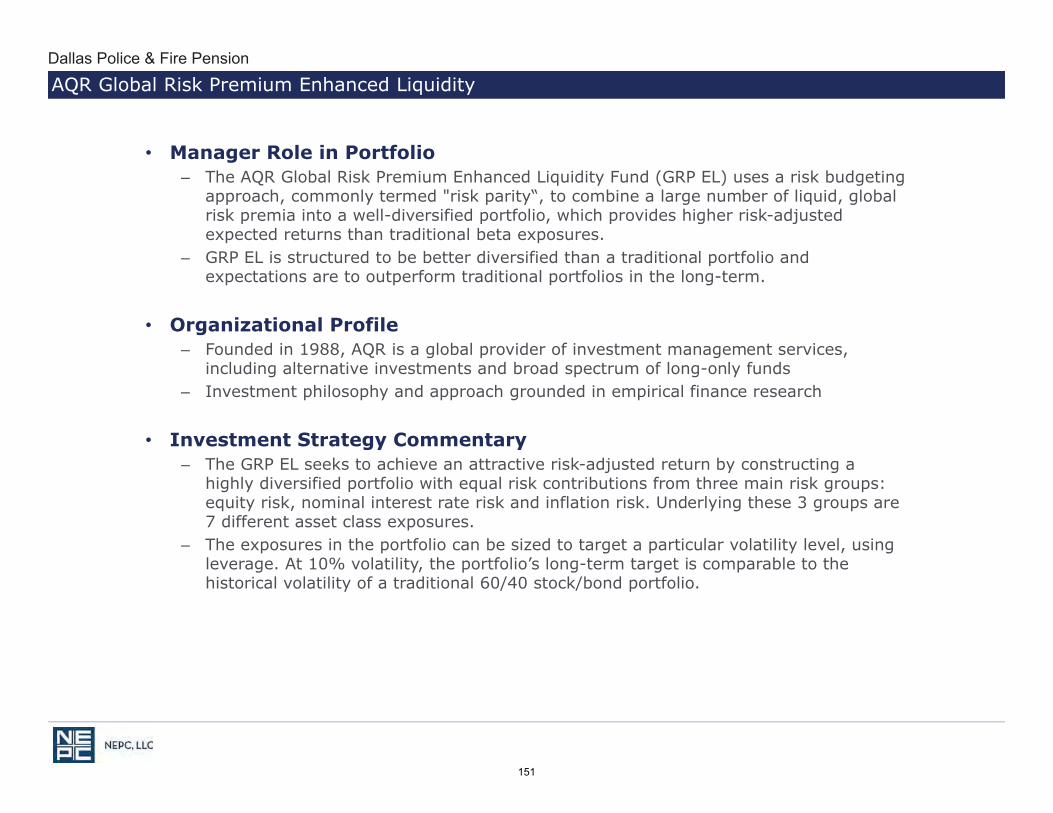
Dallas Police & Fire Pension
151
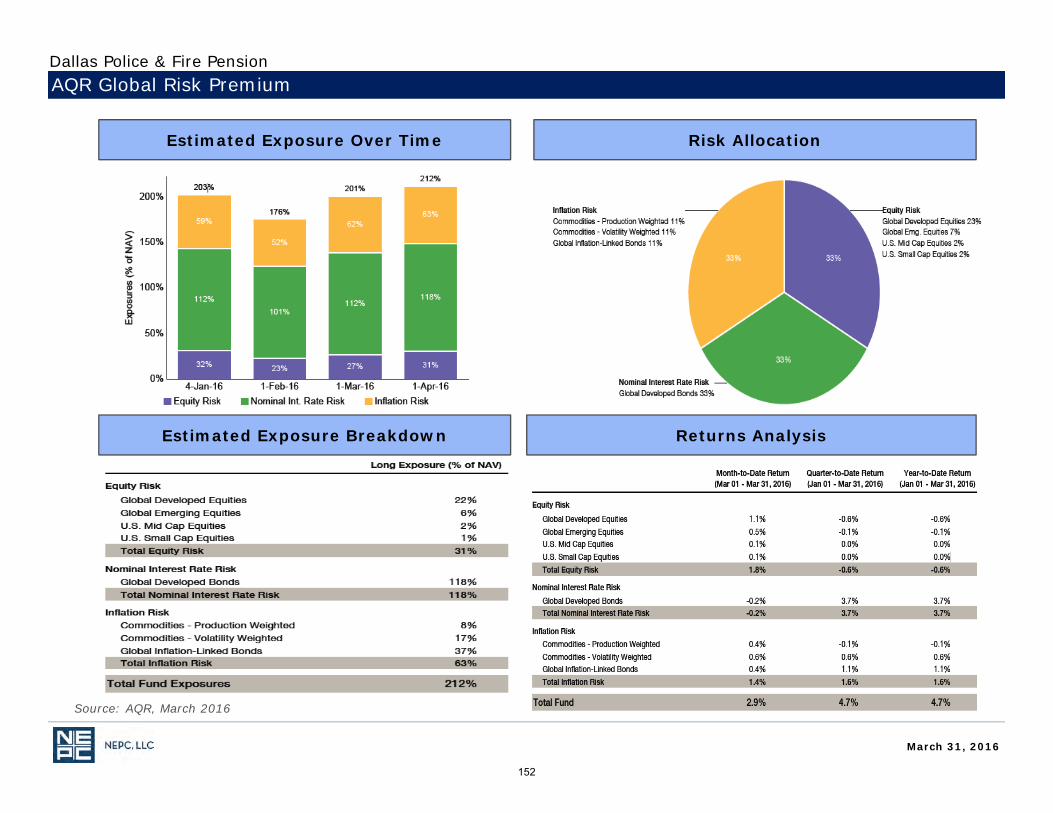
Estimated Exposure Over Time Risk Allocation
Estimated Exposure Breakdown Returns Analysis
AQR Global Risk Premium
March 31, 2016
Dallas Police & Fire Pension
Source: AQR, March 2016
152
153

PutnamDallas Police & Fire Pension
March 31, 2016
Source: Putnam, March 2016
154

PutnamDallas Police & Fire Pension
March 31, 2016
Source: Putnam, March 2016
155

Manager Due Diligence Updates
NEPC Due Diligence Status Key
No Action Informational items have surfaced; no action is recommended.
Watch Issues have surfaced to be concerned over; manager can participate in future searches, but current and prospective clients must be made aware of the issues.
Hold Serious issues have surfaced to be concerned over; manager cannot be in future searches unless a client specifically requests, but current and prospective clients must be made aware of the issues.
Client Review Very serious issues have surfaced with a manager; manager cannot be in future searches unless a client specifically requests. Current clients must be advised to review the manager.
TerminateWe have lost all confidence in the product; manager would not be recommended for searches and clients would be discouraged from using. The manager cannot be in future searches unless a client specifically requests. Current clients must be advised to replace the manager.
Manager Changes/ NEPC DueInvestment Options Announcements Diligence Committee
(Recent Quarter) Recommendations
Bridgewater Associates, LPOther: Jon Rubinstein Joining as a Co-
CEO No ActionBridgewater Pure Alpha Trading Company, Ltd.
3/2016
156

Manager Due Diligence Updates
NEPC Due Diligence Rating Key
Preferred A high conviction investment product. Product has a clear and economically-grounded investment thesis, and is managed byan investment team that is sufficiently resourced and incented to execute on the thesis.
Preferred Conditional A strategy that meets the definition of Preferred as described above, but may only be suitable for certain clients due to uniquecharacteristics of the strategy, e.g. higher risk attributes such as concentration, transparency, etc.
Neutral A satisfactory investment product. No major flaws, but may be lacking a compelling investment thesis, or NEPC’s conviction regarding the investment team’s ability to execute on the thesis may be less than that of Preferred products.
Not Recommended Serious issues have been identified with an investment manager or product. This rating is similar to the Client Review or Terminate rating for client-owned products.
Not Rated Due diligence has not been completed on the product or manager.
Investment Option Commentary NEPC Rating
Bridgewater Associates, LP
In March, NEPC was notified that Jon Rubenstein is now Co‐CEO alongside Eileen Murray. In addition, Greg Jensen, who holds the position of both Co‐CEO and Co‐CIO, will shift to focus exclusively on the investment side of the business. Mr. Jensen will remain Co‐CIO along with Bob Prince and Ray Dalio. NEPC recommends No Action.
Preferred ClosedBridgewater Pure Alpha Trading Company, Ltd.
157
Appendix
158

Glossary of Investment Terminology – Risk Statistics
Source: Investor Force
March 31,2016
159

Glossary of Investment Terminology
March 31,2016
160

Glossary of Investment Terminology
March 31,2016
161

Glossary of Investment Terminology
March 31,2016
162

• Past performance is no guarantee of future results.
• NEPC uses, as its data source, the plan’s custodian bank or fund servicecompany, and NEPC relies on those sources for security pricing, calculationof accruals, and all transactions, including income payments, splits, anddistributions. While NEPC has exercised reasonable professional care inpreparing this report, we cannot guarantee the accuracy of all sourceinformation contained within.
• The Investment Performance Analysis (IPA) is provided as a managementaid for the client’s internal use only. Portfolio performance reported in theIPA does not constitute a recommendation by NEPC.
• Information in this report on market indices and security characteristics isreceived from sources external to NEPC. While efforts are made to ensurethat this external data is accurate, NEPC cannot accept responsibility forerrors that may occur.
• This report may contain confidential or proprietary information and maynot be copied or redistributed.
Information Disclosure
March 31,2016
163

Dallas Police & Fire Pension System Fourth Quarter 2015
Private Markets Performance Review
May, 2015
Rhett Humphreys, CFA Partner
Keith Stronkowsky, CFA
Senior Consultant
Jeff Roberts
Senior Research Consultant

Q4 2015
Table of Contents Page
Summary Letter 1
Trailing Period Performance 6
Total Private Markets Portfolio 7
Portfolio by Lifecycle 8
Portfolio by Vintage Year 10
Portfolio by Investment Strategy 12
Transaction Summary 14
Information Disclosure
• NEPC, LLC uses, as its data source, the plan’s fund manager and custodian bank or fundservice company, and NEPC, LLC relies on those sources for all transactions, including capitalcalls, distributions, income/expense and reported values. While NEPC, LLC has exercisedreasonable professional care in preparing this report, we cannot guarantee the accuracy of allsource information contained within.
• The Investment Performance Analysis is provided as a management aid for the client’s internaluse only. Portfolio performance reported in the Investment Performance Analysis does notconstitute a recommendation by NEPC, LLC.
• Information in this report on market indices and security characteristics is received fromsources external to NEPC, LLC. While efforts are made to ensure that this external data isaccurate, NEPC, LLC cannot accept responsibility for errors that may occur.

255 State Street | Boston, MA 02109 | TEL: 617.374.1300 | www.nepc.com BOSTON | ATL ANTA | CHARL OTTE | CHICAGO | DETROIT | L AS VEGAS | SAN FRANCISCO
May, 2016 Trustees The Dallas Police & Fire Pension System 4100 Harry Hines Blvd – Suite 100 Dallas, TX 75219 RE: Private Markets Strategy – 4th Quarter 2015 Dear Trustees: We are pleased to present the December 31, 2015 Private Markets Report for Dallas Police & Fire Pension System, (“DPFPS”). The report provides a variety of performance analysis for the private markets portfolio. The reports include trailing performance, performance by investment stage and vintage year performance. The DPFPS experienced a negative quarter with a nominal IRR of (3.63%). The annualized IRR of the private markets portfolio since inception was 4.15% at quarter end. Since inception, the Total Value to Paid In multiple (current valuation plus cumulative distributions, divided by total capital calls) was 1.17. The following table presents the status of the DPFPS private markets portfolio as of December 31, 2015:
Since Terminated Amount Amount Reported Call Distribution Inception
CommitmentsCommitments Funded Distributed Value Ratio Ratio
$1,203,346,248 $3,372,161 $950,761,351 $695,322,225 $443,915,142 79.01% 73.13%
Total Fund Reported Market
Unfunded Composite Value Exposure
Commitment as of of Total as a %12/31/2015 Fund Total Fund
$255,957,058 $2,775,423,916 15% 15.99% 25.22%
Internal Rate of ReturnIRR, Since Inception(October 13, 1994)
4.15%
Total ValueTo
Capital Call Ratio
Private Markets Target
$1,139,237,367
$699,872,200
Market Exposure
(Reported Value +
Unfunded Commitment)
Total Value(Reported Value + Distributions)
1.17

As of December 31, 2015, the DPFPS has made commitments totaling $1,203.35 million to 34 private markets funds. Of the 34 funds in the DPFPS private markets portfolio, 9 funds are in the investing stage, 19 funds are in the harvesting stage, 1 fund is liquidating, 4 funds have been completed, and 1 fund has been terminated. The following charts illustrate the private markets program’s current life cycle:
The following chart illustrates the commitment history of the DPFPS private markets program through the quarter end:
Investing, $320,000,000
Harvesting, $698,046,248
Completed, $115,300,000
Terminated, $20,000,000
Liquidating, $50,000,000
Gross Committed Capital, $1,203,346,248
Harvesting, $81,799,245
Investing, $173,762,129
Capital to be Funded, $255,561,374
$0
$50,000,000
$100,000,000
$150,000,000
$200,000,000
$250,000,000
$300,000,000
1994 1995 1996 1997 1998 1999 2000 2001 2002 2003 2004 2005 2006 2007 2008 2009 2010 2011 2012 2013 2014
Commitment History
Growth Equity Buyouts Co-Investment Direct Investment Distressed Energy
2
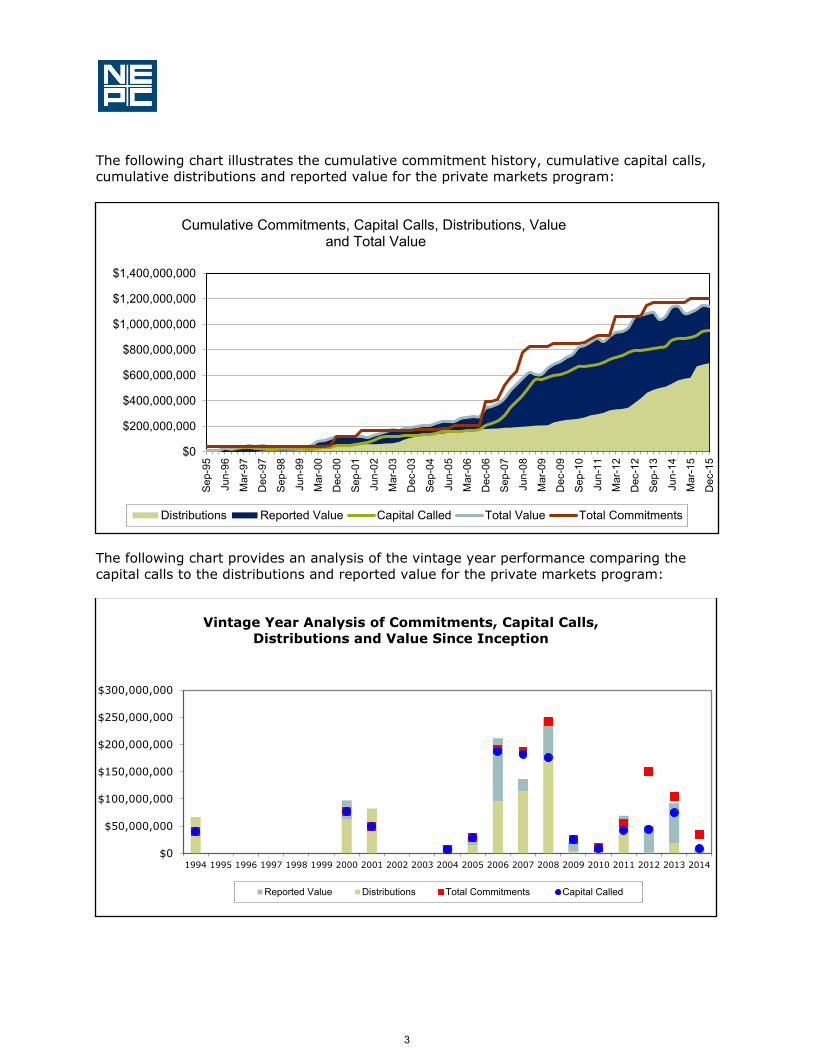
The following chart illustrates the cumulative commitment history, cumulative capital calls, cumulative distributions and reported value for the private markets program:
The following chart provides an analysis of the vintage year performance comparing the capital calls to the distributions and reported value for the private markets program:
$0
$200,000,000
$400,000,000
$600,000,000
$800,000,000
$1,000,000,000
$1,200,000,000
$1,400,000,000
Sep
-95
Jun-
96
Mar
-97
Dec
-97
Sep
-98
Jun-
99
Mar
-00
Dec
-00
Sep
-01
Jun-
02
Mar
-03
Dec
-03
Sep
-04
Jun-
05
Mar
-06
Dec
-06
Sep
-07
Jun-
08
Mar
-09
Dec
-09
Sep
-10
Jun-
11
Mar
-12
Dec
-12
Sep
-13
Jun-
14
Mar
-15
Dec
-15
Cumulative Commitments, Capital Calls, Distributions, Value and Total Value
Distributions Reported Value Capital Called Total Value Total Commitments
$0
$50,000,000
$100,000,000
$150,000,000
$200,000,000
$250,000,000
$300,000,000
1994 1995 1996 1997 1998 1999 2000 2001 2002 2003 2004 2005 2006 2007 2008 2009 2010 2011 2012 2013 2014
Vintage Year Analysis of Commitments, Capital Calls, Distributions and Value Since Inception
Reported Value Distributions Total Commitments Capital Called
3

During the quarter-ended December 31, 2015, the DPFPS private markets portfolio funded 9 investments and received 12 distributions from its funds. The summary of the cash flows follows: Amount Funded for the Quarter
Number of Funds Calling Capital
Distributions for the Quarter
Number of Funds Making
Distributions
Net Cash/Stock Flows for the
Quarter $7,207,771 9 $11,332,722 12 $4,124,951
Since inception the DPFPS private markets portfolio added $162.09 million in value to the DPFPS. Investment strategies adding value include growth equity $46.93 million, buyouts $76.49 million, distressed $43.5 million, and co-investments $20.27 million. Direct Investments lost ($14.37) million and Energy lost ($10.74) million.
-$20,000,000
-$10,000,000
$0
$10,000,000
$20,000,000
$30,000,000
$40,000,000
$50,000,000
$60,000,000
$70,000,000
$80,000,000
$90,000,000
Value Added (Loss) By Strategy
Growth Equity Buyouts Co-Investments Direct Investments Distressed Energy
4
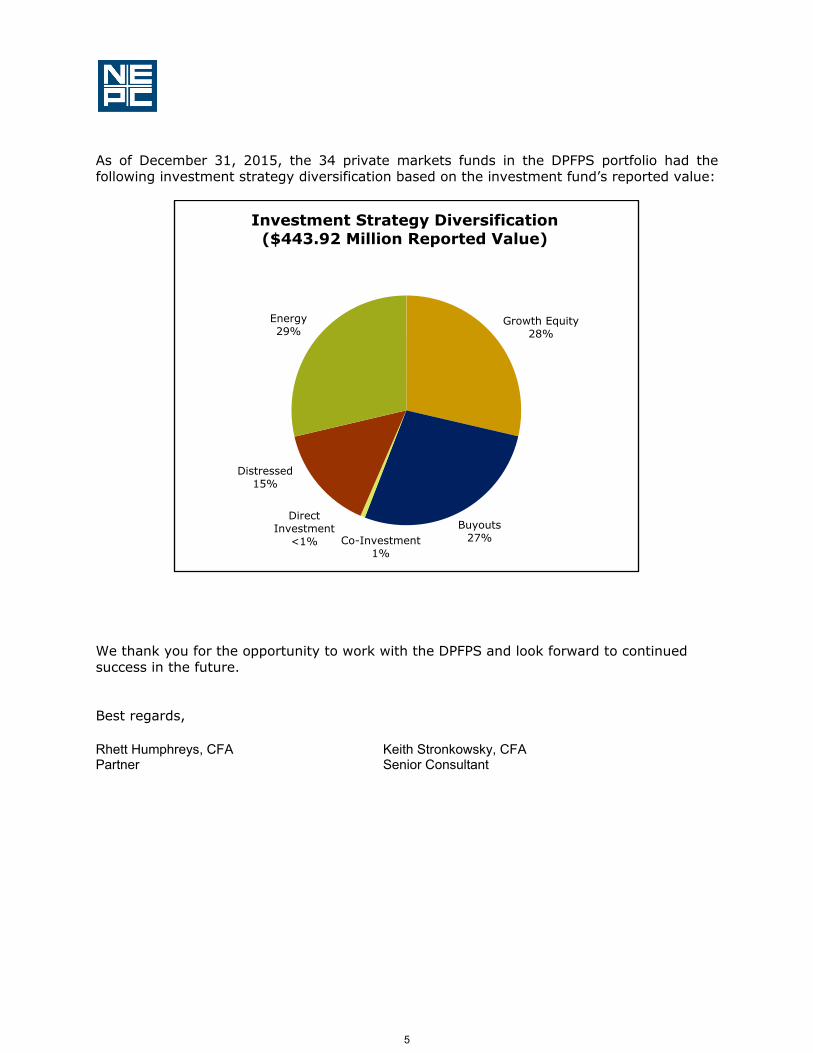
As of December 31, 2015, the 34 private markets funds in the DPFPS portfolio had the following investment strategy diversification based on the investment fund’s reported value:
We thank you for the opportunity to work with the DPFPS and look forward to continued success in the future. Best regards, Rhett Humphreys, CFA Keith Stronkowsky, CFA Partner Senior Consultant
Growth Equity 28%
Buyouts 27% Co-Investment
1%
Direct Investment
<1%
Distressed 15%
Energy 29%
Investment Strategy Diversification ($443.92 Million Reported Value)
5
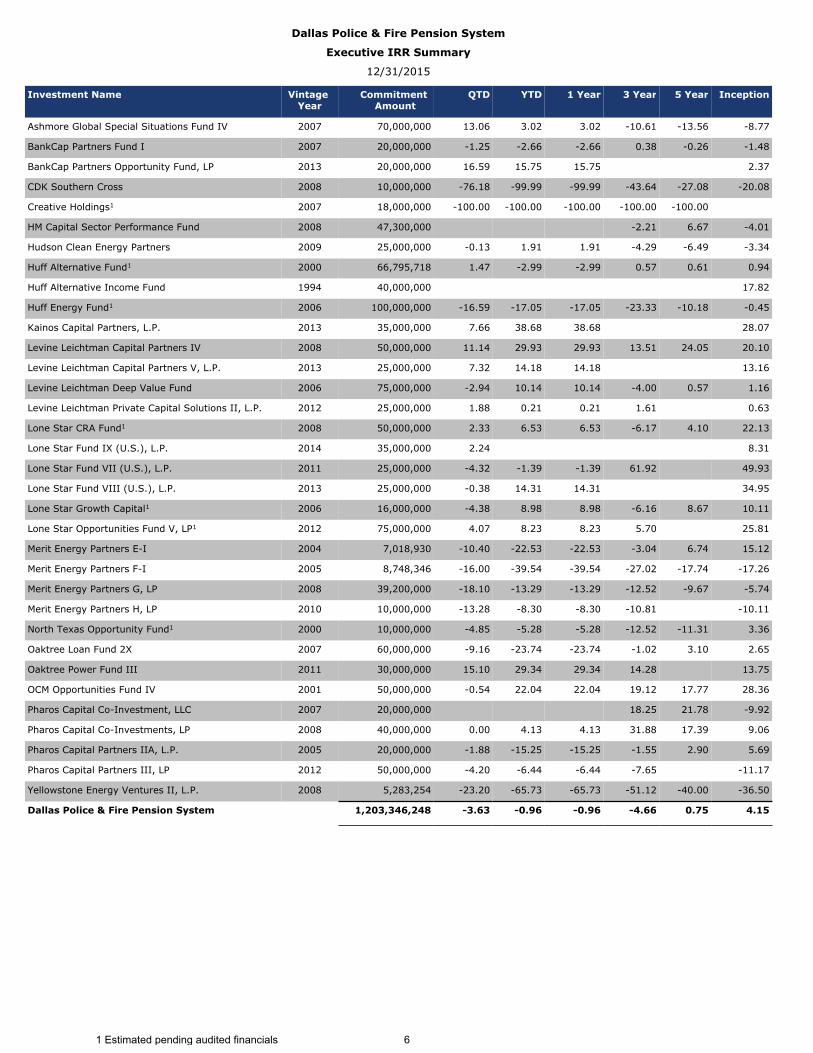
Dallas Police & Fire Pension System
Executive IRR Summary
12/31/2015
Investment Name Vintage Year
Commitment Amount
QTD YTD 1 Year 3 Year 5 Year Inception
2007 70,000,000 13.06 3.02 3.02 -10.61 -13.56 -8.77
2007 20,000,000 -1.25 -2.66 -2.66 0.38 -0.26 -1.48
2013 20,000,000 16.59 15.75 15.75 2.37
2008 10,000,000 -76.18 -99.99 -99.99 -43.64 -27.08 -20.08
2007 18,000,000 -100.00 -100.00 -100.00 -100.00 -100.00
2008 47,300,000 -2.21 6.67 -4.01
2009 25,000,000 -0.13 1.91 1.91 -4.29 -6.49 -3.34
2000 66,795,718 1.47 -2.99 -2.99 0.57 0.61 0.94
1994 40,000,000 17.82
2006 100,000,000 -16.59 -17.05 -17.05 -23.33 -10.18 -0.45
2013 35,000,000 7.66 38.68 38.68 28.07
2008 50,000,000 11.14 29.93 29.93 13.51 24.05 20.10
2013 25,000,000 7.32 14.18 14.18 13.16
2006 75,000,000 -2.94 10.14 10.14 -4.00 0.57 1.16
2012 25,000,000 1.88 0.21 0.21 1.61 0.63
2008 50,000,000 2.33 6.53 6.53 -6.17 4.10 22.13
2014 35,000,000 2.24 8.31
2011 25,000,000 -4.32 -1.39 -1.39 61.92 49.93
2013 25,000,000 -0.38 14.31 14.31 34.95
2006 16,000,000 -4.38 8.98 8.98 -6.16 8.67 10.11
2012 75,000,000 4.07 8.23 8.23 5.70 25.81
2004 7,018,930 -10.40 -22.53 -22.53 -3.04 6.74 15.12
2005 8,748,346 -16.00 -39.54 -39.54 -27.02 -17.74 -17.26
2008 39,200,000 -18.10 -13.29 -13.29 -12.52 -9.67 -5.74
2010 10,000,000 -13.28 -8.30 -8.30 -10.81 -10.11
2000 10,000,000 -4.85 -5.28 -5.28 -12.52 -11.31 3.36
2007 60,000,000 -9.16 -23.74 -23.74 -1.02 3.10 2.65
2011 30,000,000 15.10 29.34 29.34 14.28 13.75
2001 50,000,000 -0.54 22.04 22.04 19.12 17.77 28.36
2007 20,000,000 18.25 21.78 -9.92
2008 40,000,000 0.00 4.13 4.13 31.88 17.39 9.06
2005 20,000,000 -1.88 -15.25 -15.25 -1.55 2.90 5.69
2012 50,000,000 -4.20 -6.44 -6.44 -7.65 -11.17
2008 5,283,254 -23.20 -65.73 -65.73 -51.12 -40.00 -36.50
Ashmore Global Special Situations Fund IV
BankCap Partners Fund I
BankCap Partners Opportunity Fund, LP
CDK Southern Cross
Creative Holdings1
HM Capital Sector Performance Fund
Hudson Clean Energy Partners
Huff Alternative Fund1
Huff Alternative Income Fund
Huff Energy Fund1
Kainos Capital Partners, L.P.
Levine Leichtman Capital Partners IV
Levine Leichtman Capital Partners V, L.P.
Levine Leichtman Deep Value Fund
Levine Leichtman Private Capital Solutions II, L.P.
Lone Star CRA Fund1
Lone Star Fund IX (U.S.), L.P.
Lone Star Fund VII (U.S.), L.P.
Lone Star Fund VIII (U.S.), L.P.
Lone Star Growth Capital1
Lone Star Opportunities Fund V, LP1
Merit Energy Partners E-I
Merit Energy Partners F-I
Merit Energy Partners G, LP
Merit Energy Partners H, LP
North Texas Opportunity Fund1
Oaktree Loan Fund 2X
Oaktree Power Fund III
OCM Opportunities Fund IV
Pharos Capital Co-Investment, LLC
Pharos Capital Co-Investments, LP
Pharos Capital Partners IIA, L.P.
Pharos Capital Partners III, LP
Yellowstone Energy Ventures II, L.P.
Dallas Police & Fire Pension System 1,203,346,248 -3.63 -0.96 -0.96 -4.66 0.75 4.15
1 Estimated pending audited financials 6
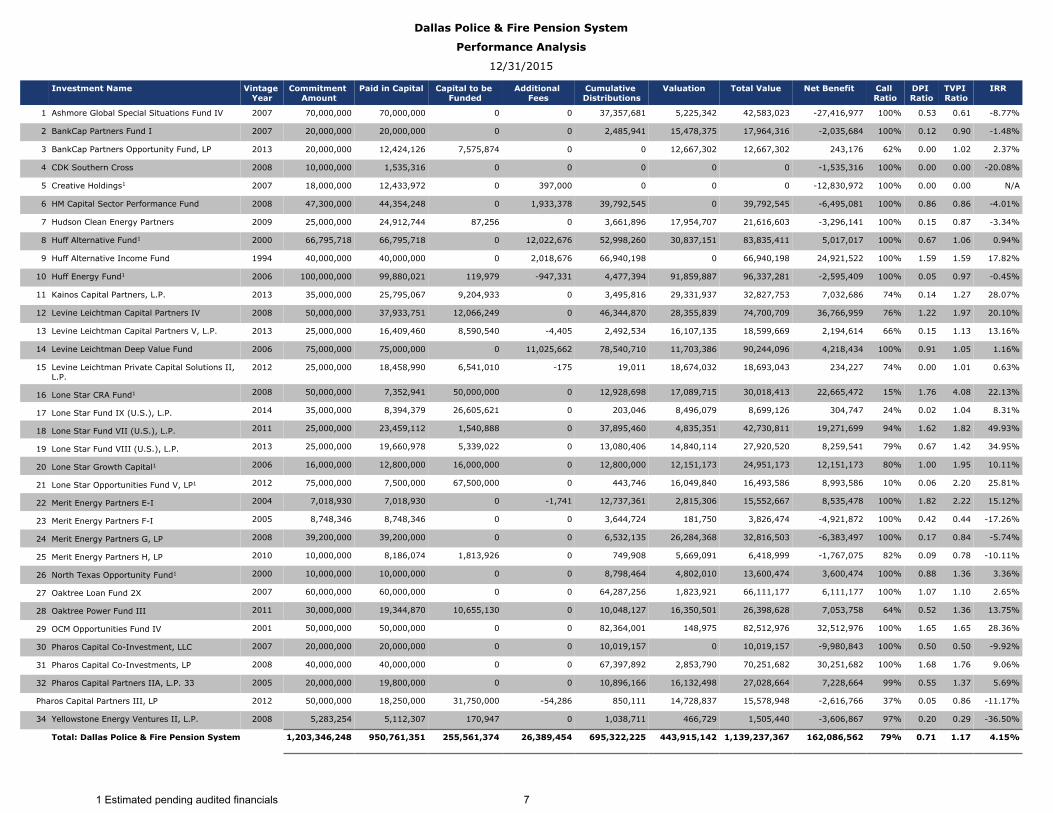
Dallas Police & Fire Pension System
Performance Analysis
12/31/2015
Investment Name Vintage Year
Commitment Amount
Paid in Capital Capital to be Funded
Additional Fees
Cumulative Distributions
Valuation Total Value Net Benefit Call Ratio
DPI Ratio
TVPI Ratio
IRR
2007 70,000,000 70,000,000 0 0 37,357,681 5,225,342 42,583,023 -27,416,977 100% 0.53 0.61 -8.77%
2007 20,000,000 20,000,000 0 0 2,485,941 15,478,375 17,964,316 -2,035,684 100% 0.12 0.90 -1.48%
2013 20,000,000 12,424,126 7,575,874 0 0 12,667,302 12,667,302 243,176 62% 0.00 1.02 2.37%
2008 10,000,000 1,535,316 0 0 0 0 0 -1,535,316 100% 0.00 0.00 -20.08%
2007 18,000,000 12,433,972 0 397,000 0 0 0 -12,830,972 100% 0.00 0.00 N/A
2008 47,300,000 44,354,248 0 1,933,378 39,792,545 0 39,792,545 -6,495,081 100% 0.86 0.86 -4.01%
2009 25,000,000 24,912,744 87,256 0 3,661,896 17,954,707 21,616,603 -3,296,141 100% 0.15 0.87 -3.34%
2000 66,795,718 66,795,718 0 12,022,676 52,998,260 30,837,151 83,835,411 5,017,017 100% 0.67 1.06 0.94%
1 Ashmore Global Special Situations Fund IV
2 BankCap Partners Fund I
3 BankCap Partners Opportunity Fund, LP
4 CDK Southern Cross
5 Creative Holdings1
6 HM Capital Sector Performance Fund
7 Hudson Clean Energy Partners
8 Huff Alternative Fund1
9 Huff Alternative Income Fund 1994 40,000,000 40,000,000 0 2,018,676 66,940,198 0 66,940,198 24,921,522 100% 1.59 1.59 17.82%
2006 100,000,000 99,880,021 119,979 -947,331 4,477,394 91,859,887 96,337,281 -2,595,409 100% 0.05 0.97 -0.45%
2013 35,000,000 25,795,067 9,204,933 0 3,495,816 29,331,937 32,827,753 7,032,686 74% 0.14 1.27 28.07%
2008 50,000,000 37,933,751 12,066,249 0 46,344,870 28,355,839 74,700,709 36,766,959 76% 1.22 1.97 20.10%
2013 25,000,000 16,409,460 8,590,540 -4,405 2,492,534 16,107,135 18,599,669 2,194,614 66% 0.15 1.13 13.16%
2006 75,000,000 75,000,000 0 11,025,662 78,540,710 11,703,386 90,244,096 4,218,434 100% 0.91 1.05 1.16%
10 Huff Energy Fund1
11 Kainos Capital Partners, L.P.
12 Levine Leichtman Capital Partners IV
13 Levine Leichtman Capital Partners V, L.P.
14 Levine Leichtman Deep Value Fund
15 Levine Leichtman Private Capital Solutions II, 2012 25,000,000 18,458,990 6,541,010 -175 19,011 18,674,032 18,693,043 234,227 74% 0.00 1.01 0.63%
2008 50,000,000 7,352,941 50,000,000 0 12,928,698 17,089,715 30,018,413 22,665,472 15% 1.76 4.08 22.13%
2014 35,000,000 8,394,379 26,605,621 0 203,046 8,496,079 8,699,126 304,747 24% 0.02 1.04 8.31%
2011 25,000,000 23,459,112 1,540,888 0 37,895,460 4,835,351 42,730,811 19,271,699 94% 1.62 1.82 49.93%
2013 25,000,000 19,660,978 5,339,022 0 13,080,406 14,840,114 27,920,520 8,259,541 79% 0.67 1.42 34.95%
2006 16,000,000 12,800,000 16,000,000 0 12,800,000 12,151,173 24,951,173 12,151,173 80% 1.00 1.95 10.11%
2012 75,000,000 7,500,000 67,500,000 0 443,746 16,049,840 16,493,586 8,993,586 10% 0.06 2.20 25.81%
2004 7,018,930 7,018,930 0 -1,741 12,737,361 2,815,306 15,552,667 8,535,478 100% 1.82 2.22 15.12%
2005 8,748,346 8,748,346 0 0 3,644,724 181,750 3,826,474 -4,921,872 100% 0.42 0.44 -17.26%
2008 39,200,000 39,200,000 0 0 6,532,135 26,284,368 32,816,503 -6,383,497 100% 0.17 0.84 -5.74%
2010 10,000,000 8,186,074 1,813,926 0 749,908 5,669,091 6,418,999 -1,767,075 82% 0.09 0.78 -10.11%
2000 10,000,000 10,000,000 0 0 8,798,464 4,802,010 13,600,474 3,600,474 100% 0.88 1.36 3.36%
2007 60,000,000 60,000,000 0 0 64,287,256 1,823,921 66,111,177 6,111,177 100% 1.07 1.10 2.65%
2011 30,000,000 19,344,870 10,655,130 0 10,048,127 16,350,501 26,398,628 7,053,758 64% 0.52 1.36 13.75%
2001 50,000,000 50,000,000 0 0 82,364,001 148,975 82,512,976 32,512,976 100% 1.65 1.65 28.36%
2007 20,000,000 20,000,000 0 0 10,019,157 0 10,019,157 -9,980,843 100% 0.50 0.50 -9.92%
2008 40,000,000 40,000,000 0 0 67,397,892 2,853,790 70,251,682 30,251,682 100% 1.68 1.76 9.06%
2005 20,000,000 19,800,000 0 0 10,896,166 16,132,498 27,028,664 7,228,664 99% 0.55 1.37 5.69%
2012 50,000,000 18,250,000 31,750,000 -54,286 850,111 14,728,837 15,578,948 -2,616,766 37% 0.05 0.86 -11.17%
L.P.
16 Lone Star CRA Fund1
17 Lone Star Fund IX (U.S.), L.P.
18 Lone Star Fund VII (U.S.), L.P.
19 Lone Star Fund VIII (U.S.), L.P.
20 Lone Star Growth Capital1
21 Lone Star Opportunities Fund V, LP1
22 Merit Energy Partners E-I
23 Merit Energy Partners F-I
24 Merit Energy Partners G, LP
25 Merit Energy Partners H, LP
26 North Texas Opportunity Fund1
27 Oaktree Loan Fund 2X
28 Oaktree Power Fund III
29 OCM Opportunities Fund IV
30 Pharos Capital Co-Investment, LLC
31 Pharos Capital Co-Investments, LP
32 Pharos Capital Partners IIA, L.P. 33
Pharos Capital Partners III, LP
34 Yellowstone Energy Ventures II, L.P. 2008 5,283,254 5,112,307 170,947 0 1,038,711 466,729 1,505,440 -3,606,867 97% 0.20 0.29 -36.50%
Total: Dallas Police & Fire Pension System 1,203,346,248 950,761,351 255,561,374 26,389,454 695,322,225 443,915,142 1,139,237,367 162,086,562 79% 0.71 1.17 4.15%
1 Estimated pending audited financials 7

Dallas Police & Fire Pension System
Lifecycle Performance Analysis
12/31/2015
Investment Name Vintage Year
Commitment Amount
Paid in Capital Capital to be Funded
Additional Fees
Cumulative Distributions
Valuation Total Value Net Benefit Call Ratio
DPI Ratio
TVPI Ratio
IRR
2 Investing
2013 20,000,000 12,424,126 7,575,874 0 0 12,667,302 12,667,302 243,176 62% 0.00 1.02 2.37%
2013 35,000,000 25,795,067 9,204,933 0 3,495,816 29,331,937 32,827,753 7,032,686 74% 0.14 1.27 28.07%
2013 25,000,000 16,409,460 8,590,540 -4,405 2,492,534 16,107,135 18,599,669 2,194,614 66% 0.15 1.13 13.16%
1 BankCap Partners Opportunity Fund, LP
2 Kainos Capital Partners, L.P.
3 Levine Leichtman Capital Partners V, L.P.
4 Levine Leichtman Private Capital Solutions II, 2012 25,000,000 18,458,990 6,541,010 -175 19,011 18,674,032 18,693,043 234,227 74% 0.00 1.01 0.63%
2014 35,000,000 8,394,379 26,605,621 0 203,046 8,496,079 8,699,126 304,747 24% 0.02 1.04 8.31%
2013 25,000,000 19,660,978 5,339,022 0 13,080,406 14,840,114 27,920,520 8,259,541 79% 0.67 1.42 34.95%
2012 75,000,000 7,500,000 67,500,000 0 443,746 16,049,840 16,493,586 8,993,586 10% 0.06 2.20 25.81%
2011 30,000,000 19,344,870 10,655,130 0 10,048,127 16,350,501 26,398,628 7,053,758 64% 0.52 1.36 13.75%
L.P.
5 Lone Star Fund IX (U.S.), L.P.
6 Lone Star Fund VIII (U.S.), L.P.
7 Lone Star Opportunities Fund V, LP1
8 Oaktree Power Fund III
9 Pharos Capital Partners III, LP 2012 50,000,000 18,250,000 31,750,000 -54,286 850,111 14,728,837 15,578,948 -2,616,766 37% 0.05 0.86 -11.17%
Subtotal: 2 Investing 320,000,000 146,237,871 173,762,129 -58,866 30,632,797 147,245,778 177,878,575 31,699,569 46% 0.21 1.22 14.05%
3 Harvesting
2007 70,000,000 70,000,000 0 0 37,357,681 5,225,342 42,583,023 -27,416,977 100% 0.53 0.61 -8.77%
2007 20,000,000 20,000,000 0 0 2,485,941 15,478,375 17,964,316 -2,035,684 100% 0.12 0.90 -1.48%
2009 25,000,000 24,912,744 87,256 0 3,661,896 17,954,707 21,616,603 -3,296,141 100% 0.15 0.87 -3.34%
2000 66,795,718 66,795,718 0 12,022,676 52,998,260 30,837,151 83,835,411 5,017,017 100% 0.67 1.06 0.94%
2006 100,000,000 99,880,021 119,979 -947,331 4,477,394 91,859,887 96,337,281 -2,595,409 100% 0.05 0.97 -0.45%
2008 50,000,000 37,933,751 12,066,249 0 46,344,870 28,355,839 74,700,709 36,766,959 76% 1.22 1.97 20.10%
2006 75,000,000 75,000,000 0 11,025,662 78,540,710 11,703,386 90,244,096 4,218,434 100% 0.91 1.05 1.16%
2008 50,000,000 7,352,941 50,000,000 0 12,928,698 17,089,715 30,018,413 22,665,472 15% 1.76 4.08 22.13%
1 Ashmore Global Special Situations Fund IV
2 BankCap Partners Fund I
3 Hudson Clean Energy Partners
4 Huff Alternative Fund1
5 Huff Energy Fund1
6 Levine Leichtman Capital Partners IV
7 Levine Leichtman Deep Value Fund
8 Lone Star CRA Fund1
9 Lone Star Fund VII (U.S.), L.P. 2011 25,000,000 23,459,112 1,540,888 0 37,895,460 4,835,351 42,730,811 19,271,699 94% 1.62 1.82 49.93%
2006 16,000,000 12,800,000 16,000,000 0 12,800,000 12,151,173 24,951,173 12,151,173 80% 1.00 1.95 10.11%
2004 7,018,930 7,018,930 0 -1,741 12,737,361 2,815,306 15,552,667 8,535,478 100% 1.82 2.22 15.12%
2005 8,748,346 8,748,346 0 0 3,644,724 181,750 3,826,474 -4,921,872 100% 0.42 0.44 -17.26%
2008 39,200,000 39,200,000 0 0 6,532,135 26,284,368 32,816,503 -6,383,497 100% 0.17 0.84 -5.74%
2010 10,000,000 8,186,074 1,813,926 0 749,908 5,669,091 6,418,999 -1,767,075 82% 0.09 0.78 -10.11%
2000 10,000,000 10,000,000 0 0 8,798,464 4,802,010 13,600,474 3,600,474 100% 0.88 1.36 3.36%
2007 60,000,000 60,000,000 0 0 64,287,256 1,823,921 66,111,177 6,111,177 100% 1.07 1.10 2.65%
2008 40,000,000 40,000,000 0 0 67,397,892 2,853,790 70,251,682 30,251,682 100% 1.68 1.76 9.06%
2005 20,000,000 19,800,000 0 0 10,896,166 16,132,498 27,028,664 7,228,664 99% 0.55 1.37 5.69%
10 Lone Star Growth Capital1
11 Merit Energy Partners E-I
12 Merit Energy Partners F-I
13 Merit Energy Partners G, LP
14 Merit Energy Partners H, LP
15 North Texas Opportunity Fund1
16 Oaktree Loan Fund 2X
17 Pharos Capital Co-Investments, LP
18 Pharos Capital Partners IIA, L.P.
19 Yellowstone Energy Ventures II, L.P. 2008 5,283,254 5,112,307 170,947 0 1,038,711 466,729 1,505,440 -3,606,867 97% 0.20 0.29 -36.50%
Subtotal: 3 Harvesting 698,046,248 636,199,944 81,799,245 22,099,266 465,573,528 296,520,389 762,093,917 103,794,707 89% 0.71 1.16 2.90%
4 Liquidating
2001 50,000,000 50,000,000 0 0 82,364,001 148,975 82,512,976 32,512,976 100% 1.65 1.65 28.36%1 OCM Opportunities Fund IV
Subtotal: 4 Liquidating 50,000,000 50,000,000 0 0 82,364,001 148,975 82,512,976 32,512,976 100% 1.65 1.65 28.36%
1 Estimated pending audited financials 8

Dallas Police & Fire Pension System
Lifecycle Performance Analysis
12/31/2015
Investment Name Vintage Year
Commitment Amount
Paid in Capital Capital to be Funded
Additional Fees
Cumulative Distributions
Valuation Total Value Net Benefit Call Ratio
DPI Ratio
TVPI Ratio
IRR
5 Completed
2008 10,000,000 1,535,316 0 0 0 0 0 -1,535,316 100% 0.00 0.00 -20.08%
2007 18,000,000 12,433,972 0 397,000 0 0 0 -12,830,972 100% 0.00 0.00 N/A
2008 47,300,000 44,354,248 0 1,933,378 39,792,545 0 39,792,545 -6,495,081 100% 0.86 0.86 -4.01%
1 CDK Southern Cross
2 Creative Holdings1
3 HM Capital Sector Performance Fund
4 Huff Alternative Income Fund 1994 40,000,000 40,000,000 0 2,018,676 66,940,198 0 66,940,198 24,921,522 100% 1.59 1.59 17.82%
Subtotal: 5 Completed 115,300,000 98,323,536 0 4,349,054 106,732,743 0 106,732,743 4,060,153 100% 1.04 1.04 6.81%
6 Terminated
1 Pharos Capital Co-Investment, LLC 2007 20,000,000 20,000,000 0 0 10,019,157 0 10,019,157 -9,980,843 100% 0.50 0.50 -9.92%
Subtotal: 6 Terminated 20,000,000 20,000,000 0 0 10,019,157 0 10,019,157 -9,980,843 100% 0.50 0.50 -9.92%
Total: Dallas Police & Fire Pension System 1,203,346,248 950,761,351 255,561,374 26,389,454 695,322,225 443,915,142 1,139,237,367 162,086,562 79% 0.71 1.17 4.15%
1 Estimated pending audited financials 9

Dallas Police & Fire Pension System
Vintage Year Performance Analysis
12/31/2015
Investment Name Vintage Year
Commitment Amount
Paid in Capital Capital to be Funded
Additional Fees
Cumulative Distributions
Valuation Total Value Net Benefit Call Ratio
DPI Ratio
TVPI Ratio
IRR
1994
1 Huff Alternative Income Fund 1994 40,000,000 40,000,000 0 2,018,676 66,940,198 0 66,940,198 24,921,522 100% 1.59 1.59 17.82%
Subtotal: 1994 40,000,000 40,000,000 0 2,018,676 66,940,198 0 66,940,198 24,921,522 100% 1.59 1.59 17.82%
2000
2000 66,795,718 66,795,718 0 12,022,676 52,998,260 30,837,151 83,835,411 5,017,017 100% 0.67 1.06 0.94%1 Huff Alternative Fund1
2 North Texas Opportunity Fund1 2000 10,000,000 10,000,000 0 0 8,798,464 4,802,010 13,600,474 3,600,474 100% 0.88 1.36 3.36%
Subtotal: 2000 76,795,718 76,795,718 0 12,022,676 61,796,724 35,639,161 97,435,885 8,617,491 100% 0.70 1.10 1.35%
2001
1 OCM Opportunities Fund IV 2001 50,000,000 50,000,000 0 0 82,364,001 148,975 82,512,976 32,512,976 100% 1.65 1.65 28.36%
Subtotal: 2001 50,000,000 50,000,000 0 0 82,364,001 148,975 82,512,976 32,512,976 100% 1.65 1.65 28.36%
2004
1 Merit Energy Partners E-I 2004 7,018,930 7,018,930 0 -1,741 12,737,361 2,815,306 15,552,667 8,535,478 100% 1.82 2.22 15.12%
Subtotal: 2004 7,018,930 7,018,930 0 -1,741 12,737,361 2,815,306 15,552,667 8,535,478 100% 1.82 2.22 15.12%
2005
1 Merit Energy Partners F-I 2005 8,748,346 8,748,346 0 0 3,644,724 181,750 3,826,474 -4,921,872 100% 0.42 0.44 -17.26%
2 Pharos Capital Partners IIA, L.P. 2005 20,000,000 19,800,000 0 0 10,896,166 16,132,498 27,028,664 7,228,664 99% 0.55 1.37 5.69%
Subtotal: 2005 28,748,346 28,548,346 0 0 14,540,890 16,314,248 30,855,138 2,306,792 100% 0.51 1.08 1.35%
2006
2006 100,000,000 99,880,021 119,979 -947,331 4,477,394 91,859,887 96,337,281 -2,595,409 100% 0.05 0.97 -0.45%
2006 75,000,000 75,000,000 0 11,025,662 78,540,710 11,703,386 90,244,096 4,218,434 100% 0.91 1.05 1.16%
1 Huff Energy Fund1
2 Levine Leichtman Deep Value Fund
3 Lone Star Growth Capital1 2006 16,000,000 12,800,000 16,000,000 0 12,800,000 12,151,173 24,951,173 12,151,173 80% 1.00 1.95 10.11%
Subtotal: 2006 191,000,000 187,680,021 16,119,979 10,078,331 95,818,104 115,714,446 211,532,550 13,774,198 92% 0.48 1.07 1.32%
2007
2007 70,000,000 70,000,000 0 0 37,357,681 5,225,342 42,583,023 -27,416,977 100% 0.53 0.61 -8.77%
2007 20,000,000 20,000,000 0 0 2,485,941 15,478,375 17,964,316 -2,035,684 100% 0.12 0.90 -1.48%
2007 18,000,000 12,433,972 0 397,000 0 0 0 -12,830,972 100% 0.00 0.00 N/A
2007 60,000,000 60,000,000 0 0 64,287,256 1,823,921 66,111,177 6,111,177 100% 1.07 1.10 2.65%
1 Ashmore Global Special Situations Fund IV
2 BankCap Partners Fund I
3 Creative Holdings1
4 Oaktree Loan Fund 2X
5 Pharos Capital Co-Investment, LLC 2007 20,000,000 20,000,000 0 0 10,019,157 0 10,019,157 -9,980,843 100% 0.50 0.50 -9.92%
Subtotal: 2007 188,000,000 182,433,972 0 397,000 114,150,035 22,527,638 136,677,673 -46,153,299 100% 0.62 0.75 -5.74%
2008
2008 10,000,000 1,535,316 0 0 0 0 0 -1,535,316 100% 0.00 0.00 -20.08%
2008 47,300,000 44,354,248 0 1,933,378 39,792,545 0 39,792,545 -6,495,081 100% 0.86 0.86 -4.01%
1 CDK Southern Cross
2 HM Capital Sector Performance Fund
3 Levine Leichtman Capital Partners IV 2008 50,000,000 37,933,751 12,066,249 0 46,344,870 28,355,839 74,700,709 36,766,959 76% 1.22 1.97 20.10%
1 Estimated pending audited financials 10
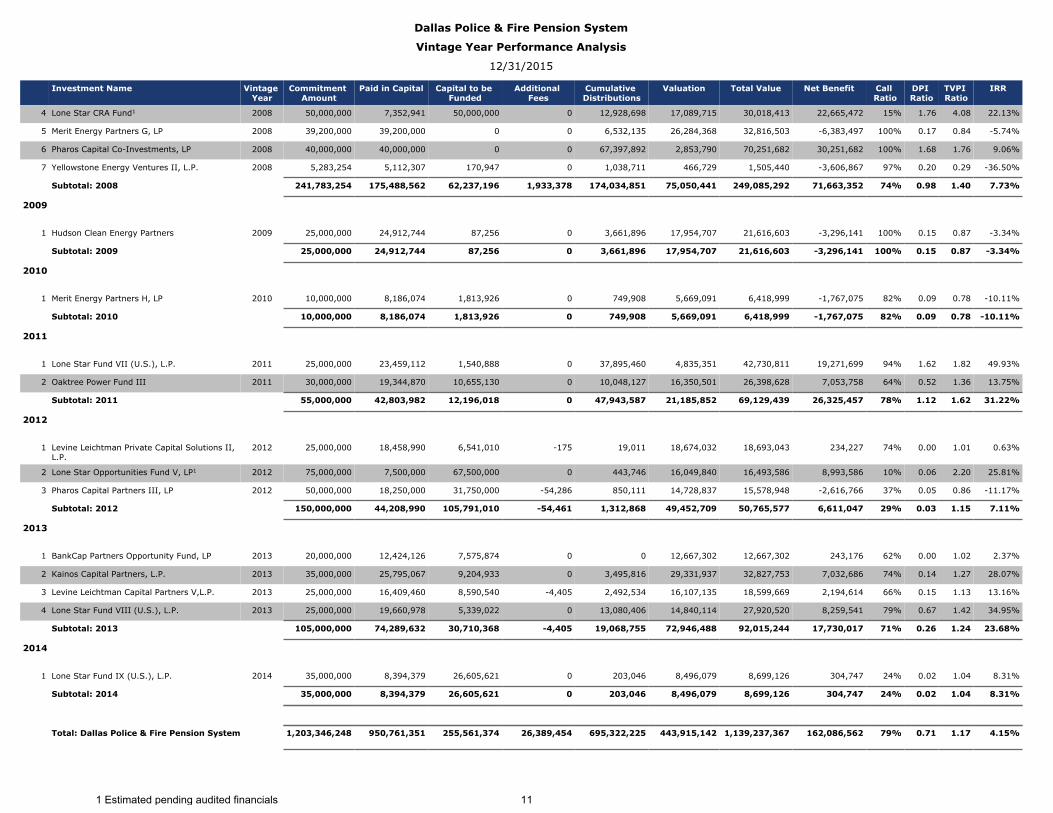
Dallas Police & Fire Pension System
Vintage Year Performance Analysis
12/31/2015
Investment Name Vintage Year
Commitment Amount
Paid in Capital Capital to be Funded
Additional Fees
Cumulative Distributions
Valuation Total Value Net Benefit Call Ratio
DPI Ratio
TVPI Ratio
IRR
2008 50,000,000 7,352,941 50,000,000 0 12,928,698 17,089,715 30,018,413 22,665,472 15% 1.76 4.08 22.13%
2008 39,200,000 39,200,000 0 0 6,532,135 26,284,368 32,816,503 -6,383,497 100% 0.17 0.84 -5.74%
2008 40,000,000 40,000,000 0 0 67,397,892 2,853,790 70,251,682 30,251,682 100% 1.68 1.76 9.06%
4 Lone Star CRA Fund1
5 Merit Energy Partners G, LP
6 Pharos Capital Co-Investments, LP
7 Yellowstone Energy Ventures II, L.P. 2008 5,283,254 5,112,307 170,947 0 1,038,711 466,729 1,505,440 -3,606,867 97% 0.20 0.29 -36.50%
Subtotal: 2008 241,783,254 175,488,562 62,237,196 1,933,378 174,034,851 75,050,441 249,085,292 71,663,352 74% 0.98 1.40 7.73%
2009
1 Hudson Clean Energy Partners 2009 25,000,000 24,912,744 87,256 0 3,661,896 17,954,707 21,616,603 -3,296,141 100% 0.15 0.87 -3.34%
Subtotal: 2009 25,000,000 24,912,744 87,256 0 3,661,896 17,954,707 21,616,603 -3,296,141 100% 0.15 0.87 -3.34%
2010
1 Merit Energy Partners H, LP 2010 10,000,000 8,186,074 1,813,926 0 749,908 5,669,091 6,418,999 -1,767,075 82% 0.09 0.78 -10.11%
Subtotal: 2010 10,000,000 8,186,074 1,813,926 0 749,908 5,669,091 6,418,999 -1,767,075 82% 0.09 0.78 -10.11%
2011
2011 25,000,000 23,459,112 1,540,888 0 37,895,460 4,835,351 42,730,811 19,271,699 94% 1.62 1.82 49.93%1 Lone Star Fund VII (U.S.), L.P.
2 Oaktree Power Fund III 2011 30,000,000 19,344,870 10,655,130 0 10,048,127 16,350,501 26,398,628 7,053,758 64% 0.52 1.36 13.75%
Subtotal: 2011 55,000,000 42,803,982 12,196,018 0 47,943,587 21,185,852 69,129,439 26,325,457 78% 1.12 1.62 31.22%
2012
1 Levine Leichtman Private Capital Solutions II, 2012 25,000,000 18,458,990 6,541,010 -175 19,011 18,674,032 18,693,043 234,227 74% 0.00 1.01 0.63%L.P.
2 Lone Star Opportunities Fund V, LP1 2012 75,000,000 7,500,000 67,500,000 0 443,746 16,049,840 16,493,586 8,993,586 10% 0.06 2.20 25.81%
3 Pharos Capital Partners III, LP 2012 50,000,000 18,250,000 31,750,000 -54,286 850,111 14,728,837 15,578,948 -2,616,766 37% 0.05 0.86 -11.17%
Subtotal: 2012 150,000,000 44,208,990 105,791,010 -54,461 1,312,868 49,452,709 50,765,577 6,611,047 29% 0.03 1.15 7.11%
2013
2013 20,000,000 12,424,126 7,575,874 0 0 12,667,302 12,667,302 243,176 62% 0.00 1.02 2.37%
2013 35,000,000 25,795,067 9,204,933 0 3,495,816 29,331,937 32,827,753 7,032,686 74% 0.14 1.27 28.07%
2013 25,000,000 16,409,460 8,590,540 -4,405 2,492,534 16,107,135 18,599,669 2,194,614 66% 0.15 1.13 13.16%
1 BankCap Partners Opportunity Fund, LP
2 Kainos Capital Partners, L.P.
3 Levine Leichtman Capital Partners V,L.P.
4 Lone Star Fund VIII (U.S.), L.P. 2013 25,000,000 19,660,978 5,339,022 0 13,080,406 14,840,114 27,920,520 8,259,541 79% 0.67 1.42 34.95%
Subtotal: 2013 105,000,000 74,289,632 30,710,368 -4,405 19,068,755 72,946,488 92,015,244 17,730,017 71% 0.26 1.24 23.68%
2014
1 Lone Star Fund IX (U.S.), L.P. 2014 35,000,000 8,394,379 26,605,621 0 203,046 8,496,079 8,699,126 304,747 24% 0.02 1.04 8.31%
Subtotal: 2014 35,000,000 8,394,379 26,605,621 0 203,046 8,496,079 8,699,126 304,747 24% 0.02 1.04 8.31%
Total: Dallas Police & Fire Pension System 1,203,346,248 950,761,351 255,561,374 26,389,454 695,322,225 443,915,142 1,139,237,367 162,086,562 79% 0.71 1.17 4.15%
1 Estimated pending audited financials 11

Dallas Police & Fire Pension System
Investment Strategy Performance Analysis
12/31/2015
Investment Name Vintage Year
Commitment Amount
Paid in Capital Capital to be Funded
Additional Fees
Cumulative Distributions
Valuation Total Value Net Benefit Call Ratio
DPI Ratio
TVPI Ratio
IRR
110 Growth Equity
2007 20,000,000 20,000,000 0 0 2,485,941 15,478,375 17,964,316 -2,035,684 100% 0.12 0.90 -1.48%
2013 20,000,000 12,424,126 7,575,874 0 0 12,667,302 12,667,302 243,176 62% 0.00 1.02 2.37%
2009 25,000,000 24,912,744 87,256 0 3,661,896 17,954,707 21,616,603 -3,296,141 100% 0.15 0.87 -3.34%
2008 50,000,000 7,352,941 50,000,000 0 12,928,698 17,089,715 30,018,413 22,665,472 15% 1.76 4.08 22.13%
2006 16,000,000 12,800,000 16,000,000 0 12,800,000 12,151,173 24,951,173 12,151,173 80% 1.00 1.95 10.11%
2012 75,000,000 7,500,000 67,500,000 0 443,746 16,049,840 16,493,586 8,993,586 10% 0.06 2.20 25.81%
2000 10,000,000 10,000,000 0 0 8,798,464 4,802,010 13,600,474 3,600,474 100% 0.88 1.36 3.36%
2005 20,000,000 19,800,000 0 0 10,896,166 16,132,498 27,028,664 7,228,664 99% 0.55 1.37 5.69%
1 BankCap Partners Fund I
2 BankCap Partners Opportunity Fund, LP
3 Hudson Clean Energy Partners
4 Lone Star CRA Fund1
5 Lone Star Growth Capital1
6 Lone Star Opportunities Fund V, LP1
7 North Texas Opportunity Fund1
8 Pharos Capital Partners IIA, L.P.
9 Pharos Capital Partners III, LP 2012 50,000,000 18,250,000 31,750,000 -54,286 850,111 14,728,837 15,578,948 -2,616,766 37% 0.05 0.86 -11.17%
Subtotal: 110 Growth Equity 286,000,000 133,039,811 172,913,130 -54,286 52,865,022 127,054,457 179,919,479 46,933,954 43% 0.40 1.35 6.13%
120 Buyouts
2008 47,300,000 44,354,248 0 1,933,378 39,792,545 0 39,792,545 -6,495,081 100% 0.86 0.86 -4.01%
2000 66,795,718 66,795,718 0 12,022,676 52,998,260 30,837,151 83,835,411 5,017,017 100% 0.67 1.06 0.94%
1994 40,000,000 40,000,000 0 2,018,676 66,940,198 0 66,940,198 24,921,522 100% 1.59 1.59 17.82%
2013 35,000,000 25,795,067 9,204,933 0 3,495,816 29,331,937 32,827,753 7,032,686 74% 0.14 1.27 28.07%
2008 50,000,000 37,933,751 12,066,249 0 46,344,870 28,355,839 74,700,709 36,766,959 76% 1.22 1.97 20.10%
2013 25,000,000 16,409,460 8,590,540 -4,405 2,492,534 16,107,135 18,599,669 2,194,614 66% 0.15 1.13 13.16%
1 HM Capital Sector Performance Fund
2 Huff Alternative Fund1
3 Huff Alternative Income Fund1
4 Kainos Capital Partners, L.P.
5 Levine Leichtman Capital Partners IV
6 Levine Leichtman Capital Partners V, L.P.
7 Oaktree Power Fund III 2011 30,000,000 19,344,870 10,655,130 0 10,048,127 16,350,501 26,398,628 7,053,758 64% 0.52 1.36 13.75%
Subtotal: 120 Buyouts 294,095,718 250,633,114 40,516,852 15,970,325 222,112,350 120,982,563 343,094,913 76,491,474 86% 0.83 1.29 7.79%
150 Distressed
1 Ashmore Global Special Situations Fund IV 2007 70,000,000 70,000,000 0 0 37,357,681 5,225,342 42,583,023 -27,416,977 100% 0.53 0.61 -8.77%
2 Levine Leichtman Deep Value Fund 2006 75,000,000 75,000,000 0 11,025,662 78,540,710 11,703,386 90,244,096 4,218,434 100% 0.91 1.05 1.16%
3 Levine Leichtman Private Capital Solutions II, 2012 25,000,000 18,458,990 6,541,010 -175 19,011 18,674,032 18,693,043 234,227 74% 0.00 1.01 0.63%L.P.
4 Lone Star Fund IX (U.S.), L.P. 2014 35,000,000 8,394,379 26,605,621 0 203,046 8,496,079 8,699,126 304,747 24% 0.02 1.04 8.31%
2011 25,000,000 23,459,112 1,540,888 0 37,895,460 4,835,351 42,730,811 19,271,699 94% 1.62 1.82 49.93%5 Lone Star Fund VII (U.S.), L.P.
6 Lone Star Fund VIII (U.S.), L.P. 2013 25,000,000 19,660,978 5,339,022 0 13,080,406 14,840,114 27,920,520 8,259,541 79% 0.67 1.42 34.95%
7 Oaktree Loan Fund 2X 2007 60,000,000 60,000,000 0 0 64,287,256 1,823,921 66,111,177 6,111,177 100% 1.07 1.10 2.65%
2001 50,000,000 50,000,000 0 0 82,364,001 148,975 82,512,976 32,512,976 100% 1.65 1.65 28.36%8 OCM Opportunities Fund IV
Subtotal: 150 Distressed 365,000,000 324,973,460 40,026,540 11,025,487 313,747,571 65,747,201 379,494,772 43,495,825 89% 0.93 1.13 4.52%
200 Co-Investment
1 Pharos Capital Co-Investment, LLC 2007 20,000,000 20,000,000 0 0 10,019,157 0 10,019,157 -9,980,843 100% 0.50 0.50 -9.92%
2 Pharos Capital Co-Investments, LP 2008 40,000,000 40,000,000 0 0 67,397,892 2,853,790 70,251,682 30,251,682 100% 1.68 1.76 9.06%
Subtotal: 200 Co-Investment 60,000,000 60,000,000 0 0 77,417,049 2,853,790 80,270,839 20,270,839 100% 1.29 1.34 4.41%
1 Estimated pending audited financials 12
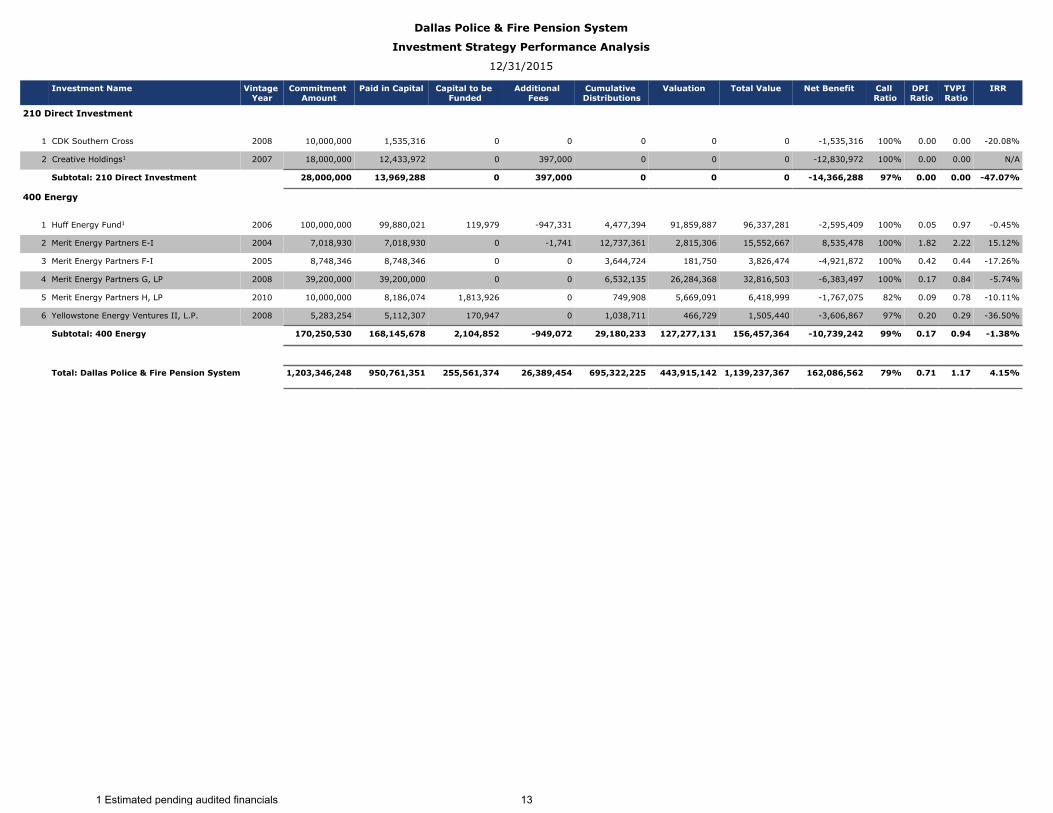
Dallas Police & Fire Pension System
Investment Strategy Performance Analysis
12/31/2015
Investment Name Vintage Year
Commitment Amount
Paid in Capital Capital to be Funded
Additional Fees
Cumulative Distributions
Valuation Total Value Net Benefit Call Ratio
DPI Ratio
TVPI Ratio
IRR
210 Direct Investment
1 CDK Southern Cross 2008 10,000,000 1,535,316 0 0 0 0 0 -1,535,316 100% 0.00 0.00 -20.08%
2 Creative Holdings1 2007 18,000,000 12,433,972 0 397,000 0 0 0 -12,830,972 100% 0.00 0.00 N/A
Subtotal: 210 Direct Investment 28,000,000 13,969,288 0 397,000 0 0 0 -14,366,288 97% 0.00 0.00 -47.07%
400 Energy
2006 100,000,000 99,880,021 119,979 -947,331 4,477,394 91,859,887 96,337,281 -2,595,409 100% 0.05 0.97 -0.45%
2004 7,018,930 7,018,930 0 -1,741 12,737,361 2,815,306 15,552,667 8,535,478 100% 1.82 2.22 15.12%
2005 8,748,346 8,748,346 0 0 3,644,724 181,750 3,826,474 -4,921,872 100% 0.42 0.44 -17.26%
2008 39,200,000 39,200,000 0 0 6,532,135 26,284,368 32,816,503 -6,383,497 100% 0.17 0.84 -5.74%
2010 10,000,000 8,186,074 1,813,926 0 749,908 5,669,091 6,418,999 -1,767,075 82% 0.09 0.78 -10.11%
1 Huff Energy Fund1
2 Merit Energy Partners E-I
3 Merit Energy Partners F-I
4 Merit Energy Partners G, LP
5 Merit Energy Partners H, LP
6 Yellowstone Energy Ventures II, L.P. 2008 5,283,254 5,112,307 170,947 0 1,038,711 466,729 1,505,440 -3,606,867 97% 0.20 0.29 -36.50%
Subtotal: 400 Energy 170,250,530 168,145,678 2,104,852 -949,072 29,180,233 127,277,131 156,457,364 -10,739,242 99% 0.17 0.94 -1.38%
Total: Dallas Police & Fire Pension System 1,203,346,248 950,761,351 255,561,374 26,389,454 695,322,225 443,915,142 1,139,237,367 162,086,562 79% 0.71 1.17 4.15%
1 Estimated pending audited financials 13

Dallas Police & Fire Pension System
Transaction Summary
10/1/2015 - 12/31/2015
Date Funding Additional Fees Cash Net Cash Flow
Dallas Police & Fire Pension System
Ashmore Global Special Situations Fund IV
12/23/2015 1,076,515.24 -1,076,515.24
Total: Ashmore Global Special Situations Fund IV
1,076,515.24 -1,076,515.24
BankCap Partners Opportunity Fund, LP
11/24/2015 2,844,000.00 2,844,000.00
Total: BankCap Partners Opportunity Fund, LP
2,844,000.00 2,844,000.00
CDK Southern Cross
10/01/2015 -110,000.00 -110,000.00
10/16/2015 50,000.00 -60,000.00
11/05/2015 -2,500.12 -62,500.12
11/09/2015 -48,167.07 -110,667.19
11/24/2015 -8,000.00 -118,667.19
11/24/2015 -17,745.72 -136,412.91
12/30/2015 40,728.77 -95,684.14
Total: CDK Southern Cross
-95,684.14 -95,684.14
Creative Holdings
12/15/2015 25,000.00 25,000.00
Total: Creative Holdings
25,000.00 25,000.00
Hudson Clean Energy Partners
10/01/2015 105,223.00 105,223.00
Total: Hudson Clean Energy Partners
105,223.00 105,223.00
Kainos Capital Partners, L.P.
11/13/2015 75,331.00 -75,331.00
11/13/2015 36,431.00 -111,762.00
Total: Kainos Capital Partners, L.P.
111,762.00 -111,762.00
Levine Leichtman Capital Partners IV
1 Estimated pending audited financials 14

Dallas Police & Fire Pension System
Transaction Summary
10/1/2015 - 12/31/2015
Date Funding Additional Fees Cash Net Cash Flow
Dallas Police & Fire Pension System
10/30/2015 85,589.19 -85,589.19
11/20/2015 549,163.13 -634,752.32
11/30/2015 80,166.53 -714,918.85
12/30/2015 81,877.67 -796,796.52
Total: Levine Leichtman Capital Partners IV
796,796.52 -796,796.52
Levine Leichtman Capital Partners V, L.P.
10/14/2015 -2,165,469.93 -2,165,469.93
10/30/2015 -60,626.10 -2,226,096.03
11/10/2015 705,775.37 -2,931,871.40
11/30/2015 63,013.69 -2,994,885.09
12/18/2015 1,658,687.02 -4,653,572.11
12/30/2015 65,057.80 -4,718,629.91
Total: Levine Leichtman Capital Partners V, L.P.
-2,226,096.03 2,492,533.88 -4,718,629.91
Levine Leichtman Deep Value Fund
11/10/2015 3,983,267.72 -3,983,267.72
12/01/2015 1,000,901.60 -4,984,169.32
12/30/2015 376,154.79 -5,360,324.11
Total: Levine Leichtman Deep Value Fund
5,360,324.11 -5,360,324.11
Levine Leichtman Private Capital Solutions II, L.P.
10/01/2015 -1,199,546.76 -1,199,546.76
10/30/2015 -62,839.92 -1,262,386.68
11/30/2015 -58,119.39 -1,320,506.07
12/30/2015 19,011.08 -1,339,517.15
12/30/2015 -43,023.41 -1,382,540.56
Total: Levine Leichtman Private Capital Solutions II, L.P.
-1,363,529.48 19,011.08 -1,382,540.56
1 Estimated pending audited financials 15
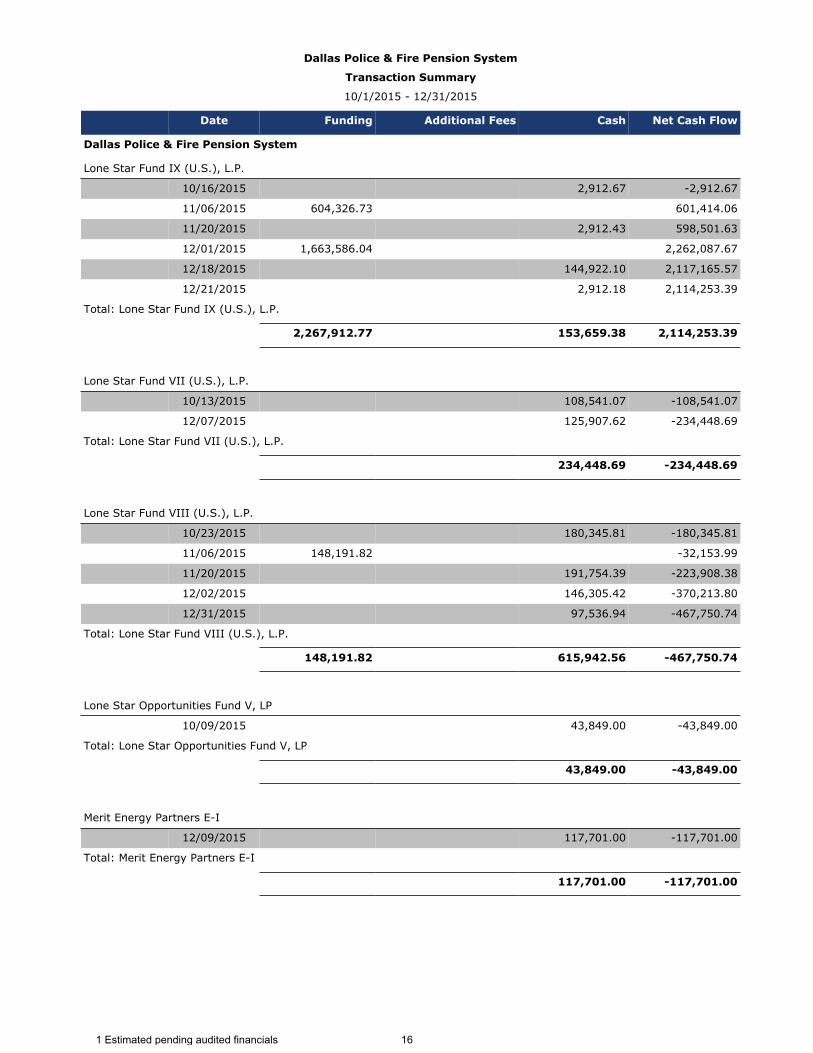
Dallas Police & Fire Pension System
Transaction Summary
10/1/2015 - 12/31/2015
Date Funding Additional Fees Cash Net Cash Flow
Dallas Police & Fire Pension System
Lone Star Fund IX (U.S.), L.P.
10/16/2015 2,912.67 -2,912.67
11/06/2015 604,326.73 601,414.06
11/20/2015 2,912.43 598,501.63
12/01/2015 1,663,586.04 2,262,087.67
12/18/2015 144,922.10 2,117,165.57
12/21/2015 2,912.18 2,114,253.39
Total: Lone Star Fund IX (U.S.), L.P.
2,267,912.77 153,659.38 2,114,253.39
Lone Star Fund VII (U.S.), L.P.
10/13/2015 108,541.07 -108,541.07
12/07/2015 125,907.62 -234,448.69
Total: Lone Star Fund VII (U.S.), L.P.
234,448.69 -234,448.69
Lone Star Fund VIII (U.S.), L.P.
10/23/2015 180,345.81 -180,345.81
11/06/2015 148,191.82 -32,153.99
11/20/2015 191,754.39 -223,908.38
12/02/2015 146,305.42 -370,213.80
12/31/2015 97,536.94 -467,750.74
Total: Lone Star Fund VIII (U.S.), L.P.
148,191.82 615,942.56 -467,750.74
Lone Star Opportunities Fund V, LP
10/09/2015 43,849.00 -43,849.00
Total: Lone Star Opportunities Fund V, LP
43,849.00 -43,849.00
Merit Energy Partners E-I
12/09/2015 117,701.00 -117,701.00
Total: Merit Energy Partners E-I
117,701.00 -117,701.00
1 Estimated pending audited financials 16

Dallas Police & Fire Pension System
Transaction Summary
10/1/2015 - 12/31/2015
Date Funding Additional Fees Cash Net Cash Flow
Dallas Police & Fire Pension System
Oaktree Power Fund III
12/14/2015 1,002,753.00 1,002,753.00
Total: Oaktree Power Fund III
1,002,753.00 1,002,753.00
Pharos Capital Partners III, LP
11/06/2015 1,500,000.00 1,500,000.00
11/17/2015 1,500,000.00 3,000,000.00
12/10/2015 310,178.33 2,689,821.67
12/29/2015 1,500,000.00 4,189,821.67
Total: Pharos Capital Partners III, LP
4,500,000.00 310,178.33 4,189,821.67
Total: 7,182,770.94 25,000.00 11,332,721.79 -4,124,950.85
1 Estimated pending audited financials 17
Dallas Police & Fire Pension System
Fourth Quarter 2015 Private Markets Performance Review
~Infrastructure~
May, 2015
Rhett Humphreys, CFA Partner
Keith Stronkowsky, CFA Senior Consultant
Jeff Roberts Senior Research Consultant

Q4 2015
Table of Contents Page
Summary Letter 1
Trailing Period Performance 6
Total Private Markets Portfolio 7
Portfolio by Lifecycle 8
Portfolio by Vintage Year 9
Portfolio by Investment Strategy 10
Transaction Summary 11
Information Disclosure
• NEPC, LLC uses, as its data source, the plan’s fund manager and custodian bank or fundservice company, and NEPC, LLC relies on those sources for all transactions, including capitalcalls, distributions, income/expense and reported values. While NEPC, LLC has exercisedreasonable professional care in preparing this report, we cannot guarantee the accuracy of allsource information contained within.
• The Investment Performance Analysis is provided as a management aid for the client’s internaluse only. Portfolio performance reported in the Investment Performance Analysis does notconstitute a recommendation by NEPC, LLC.
• Information in this report on market indices and security characteristics is received fromsources external to NEPC, LLC. While efforts are made to ensure that this external data isaccurate, NEPC, LLC cannot accept responsibility for errors that may occur.

255 State Street | Boston, MA 02109 | TEL: 617.374.1300 | www.nepc.com BOSTON | ATL ANTA | CHARL OTTE | CHICAGO | DETROIT | L AS VEGAS | SAN FRANCISCO
May, 2016
Trustees The Dallas Police & Fire Pension System 4100 Harry Hines Blvd – Suite 100 Dallas, TX 75219
RE: Infrastructure Strategy – 4th Quarter 2015
Dear Trustees:
We are pleased to present the December 31, 2015 Private Markets Report for the Infrastructure portion of the Dallas Police & Fire Pension System, (“DPFPS”). The report provides a variety of performance analysis for the infrastructure sector of the portfolio. The reports include trailing performance, performance by investment stage and vintage year performance.
The DPFPS infrastructure portfolio experienced a negative quarter with a nominal IRR of (2.34%). The annualized IRR of the infrastructure portfolio since inception was 0.52% at quarter end. Since inception, the Total Value to Paid In multiple (current valuation plus cumulative distributions, divided by total capital calls) was 1.01.
The following table presents the status of the DPFPS infrastructure portfolio as of December 31, 2015:
Since Terminated Amount Amount Reported Call Distribution Inception
CommitmentsCommitments Funded Distributed Value Ratio Ratio
$364,000,000 $0 $272,164,314 $78,584,442 $197,552,038 74.77% 28.87%
Total Fund Infrastructure Reported MarketUnfunded Composite Target Value Exposure
Commitment as of of Total as a %12/31/2015 Fund Total Fund
$91,835,686 $2,775,423,916 10% 7.12% 10.43%
$276,136,480
$289,387,724
Market Exposure (Reported Value +
Unfunded Commitment)
Total Value(Reported Value + Distributions)
1.01
Internal Rate of ReturnIRR, Since Inception
(October 9, 2007)0.52%
Total ValueTo
Capital Call Ratio

As of December 31, 2015, the DPFPS has made commitments totaling $364.0 million to 8 infrastructure funds. Of the 8 funds in the DPFPS infrastructure portfolio, 3 funds are in the investing stage, 4 funds are in the harvesting stage, and 1 fund has been completed. The following charts illustrate the program’s current life cycle:
The following chart illustrates the commitment history of the DPFPS infrastructure program through the quarter end:
Investing, $140,000,000
Completed, $50,000,000
Harvesting, $174,000,000
Gross Committed Capital, $364,000,000
Investing, $77,000,428
Harvesting, $14,835,258
Capital to be Funded, $91,835,686
$0
$20,000,000
$40,000,000
$60,000,000
$80,000,000
$100,000,000
$120,000,000
$140,000,000
$160,000,000
2007 2008 2009 2010 2011 2012 2013
Commitment History
Infrastructure
2

The following chart illustrates the cumulative commitment history, cumulative capital calls, cumulative distributions and reported value for the infrastructure program:
The following chart provides an analysis of the vintage year performance comparing the capital calls to the distributions and reported value for the infrastructure program:
$0
$50,000,000
$100,000,000
$150,000,000
$200,000,000
$250,000,000
$300,000,000
$350,000,000
$400,000,000
Mar
-08
Jun-
08Sep
-08
Dec
-08
Mar
-09
Jun-
09Sep
-09
Dec
-09
Mar
-10
Jun-
10Sep
-10
Dec
-10
Mar
-11
Jun-
11Sep
-11
Dec
-11
Mar
-12
Jun-
12Sep
-12
Dec
-12
Mar
-13
Jun-
13Sep
-13
Dec
-13
Mar
-14
Jun-
14Sep
-14
Dec
-14
Mar
-15
Jun-
15Sep
-15
Dec
-15
Cumulative Commitments, Capital Calls, Distributions, Value and Total Value
Distributions Reported Value Capital Called Total Value Total Commitments
$0
$20,000,000
$40,000,000
$60,000,000
$80,000,000
$100,000,000
$120,000,000
$140,000,000
$160,000,000
2007 2008 2009 2010 2011 2012 2013
Vintage Year Analysis of Commitments, Capital Calls, Distributions and Value Since Inception
Reported Value Distributions Total Commitments Capital Called
3
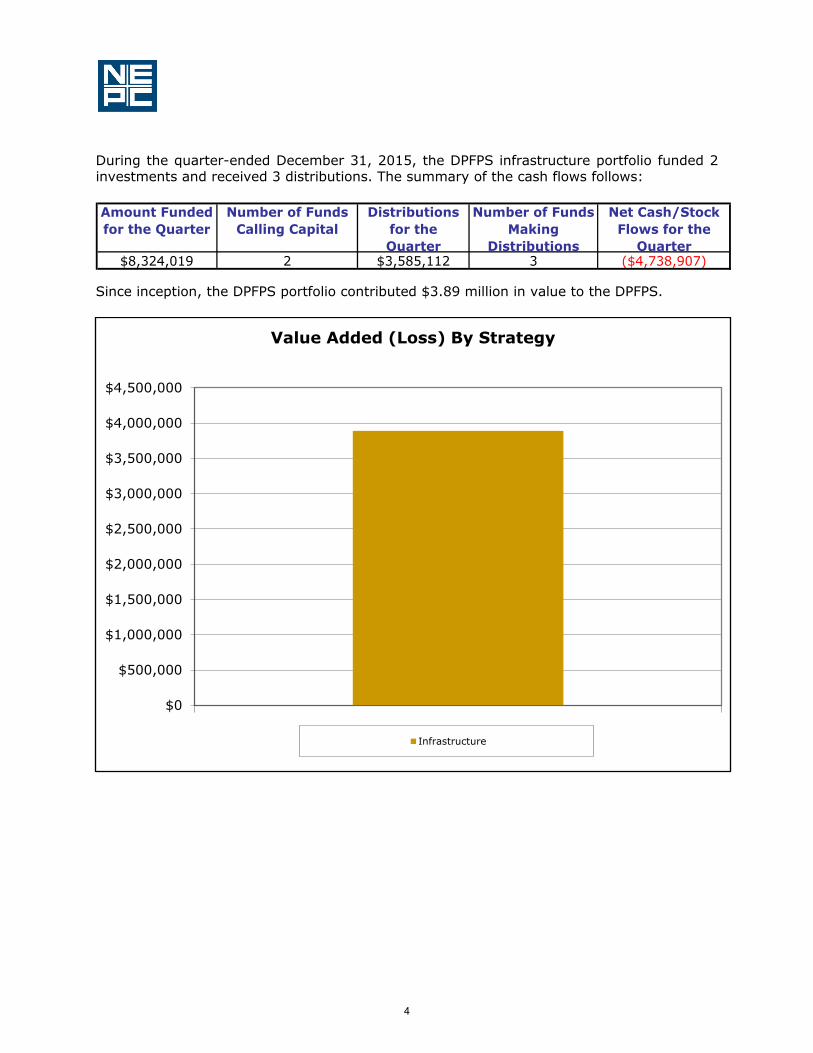
During the quarter-ended December 31, 2015, the DPFPS infrastructure portfolio funded 2 investments and received 3 distributions. The summary of the cash flows follows:
Amount Funded for the Quarter
Number of Funds Calling Capital
Distributions for the Quarter
Number of Funds Making
Distributions
Net Cash/Stock Flows for the
Quarter $8,324,019 2 $3,585,112 3 ($4,738,907)
Since inception, the DPFPS portfolio contributed $3.89 million in value to the DPFPS.
$0
$500,000
$1,000,000
$1,500,000
$2,000,000
$2,500,000
$3,000,000
$3,500,000
$4,000,000
$4,500,000
Value Added (Loss) By Strategy
Infrastructure
4
We thank you for the opportunity to work with the DPFPS and look forward to continued success in the future.
Best regards,
Rhett Humphreys, CFA Keith Stronkowsky, CFA Partner Senior Consultant
5
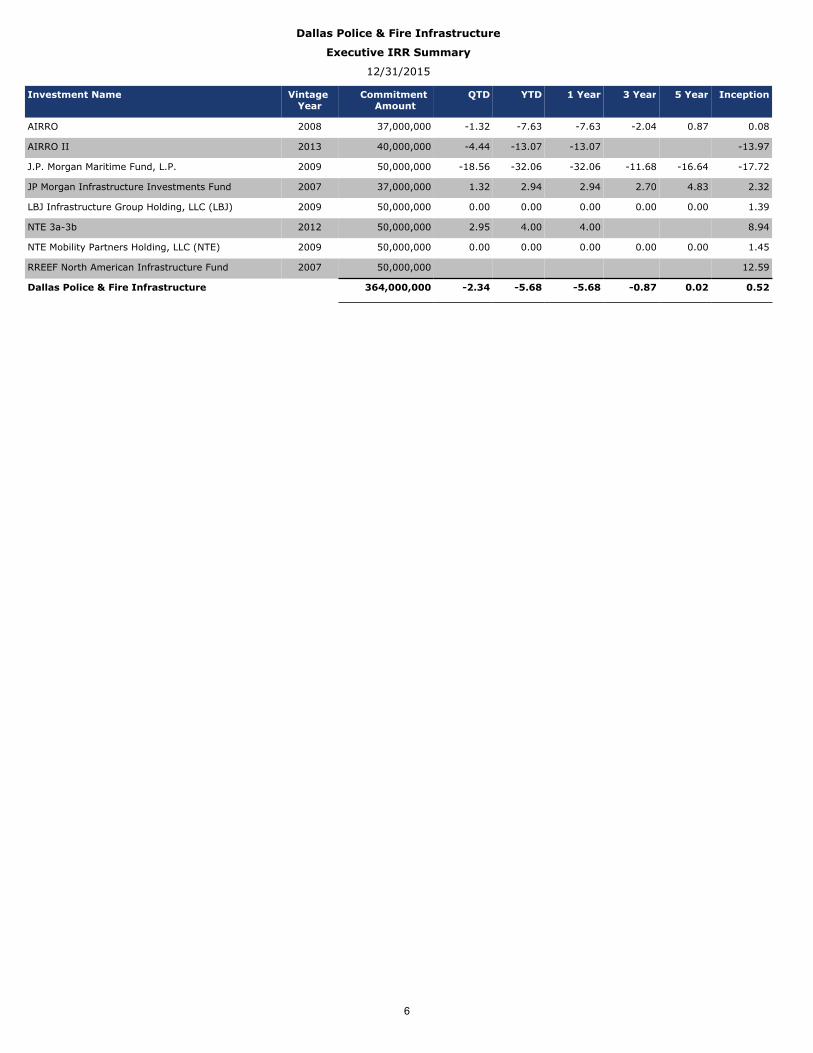
Dallas Police & Fire Infrastructure
Executive IRR Summary
12/31/2015
Investment Name Vintage Year
Commitment Amount
QTD YTD 1 Year 3 Year 5 Year Inception
AIRRO 2008 37,000,000 -1.32 -7.63 -7.63 -2.04 0.87 0.08
AIRRO II 2013 40,000,000 -4.44 -13.07 -13.07 -13.97
J.P. Morgan Maritime Fund, L.P. 2009 50,000,000 -18.56 -32.06 -32.06 -11.68 -16.64 -17.72
JP Morgan Infrastructure Investments Fund 2007 37,000,000 1.32 2.94 2.94 2.70 4.83 2.32
LBJ Infrastructure Group Holding, LLC (LBJ) 2009 50,000,000 0.00 0.00 0.00 0.00 0.00 1.39
NTE 3a-3b 2012 50,000,000 2.95 4.00 4.00 8.94
NTE Mobility Partners Holding, LLC (NTE) 2009 50,000,000 0.00 0.00 0.00 0.00 0.00 1.45
RREEF North American Infrastructure Fund 2007 50,000,000 12.59
Dallas Police & Fire Infrastructure 364,000,000 -2.34 -5.68 -5.68 -0.87 0.02 0.52
6
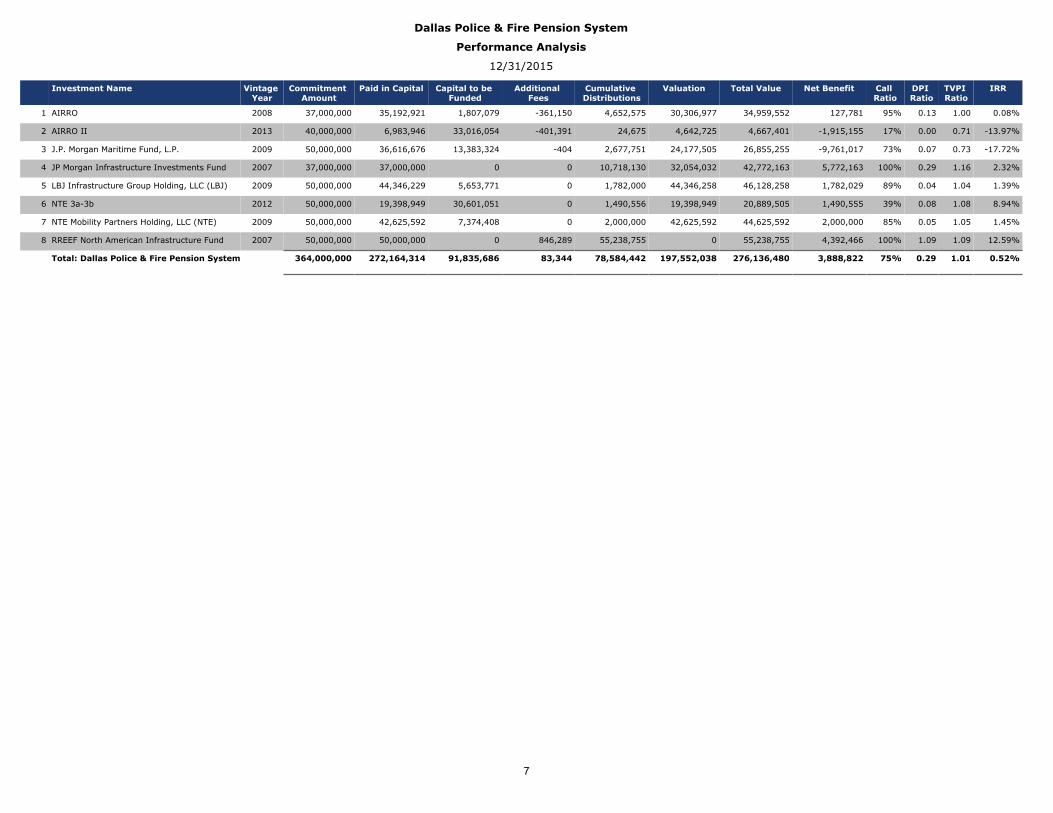
Dallas Police & Fire Pension System
Performance Analysis
12/31/2015
Investment Name Vintage Year
Commitment Amount
Paid in Capital Capital to be Funded
Additional Fees
Cumulative Distributions
Valuation Total Value Net Benefit Call Ratio
DPI Ratio
TVPI Ratio
IRR
1 AIRRO 2008 37,000,000 35,192,921 1,807,079 -361,150 4,652,575 30,306,977 34,959,552 127,781 95% 0.13 1.00 0.08%
2 AIRRO II 2013 40,000,000 6,983,946 33,016,054 -401,391 24,675 4,642,725 4,667,401 -1,915,155 17% 0.00 0.71 -13.97%
3 J.P. Morgan Maritime Fund, L.P. 2009 50,000,000 36,616,676 13,383,324 -404 2,677,751 24,177,505 26,855,255 -9,761,017 73% 0.07 0.73 -17.72%
4 JP Morgan Infrastructure Investments Fund 2007 37,000,000 37,000,000 0 0 10,718,130 32,054,032 42,772,163 5,772,163 100% 0.29 1.16 2.32%
5 LBJ Infrastructure Group Holding, LLC (LBJ) 2009 50,000,000 44,346,229 5,653,771 0 1,782,000 44,346,258 46,128,258 1,782,029 89% 0.04 1.04 1.39%
6 NTE 3a-3b 2012 50,000,000 19,398,949 30,601,051 0 1,490,556 19,398,949 20,889,505 1,490,555 39% 0.08 1.08 8.94%
7 NTE Mobility Partners Holding, LLC (NTE) 2009 50,000,000 42,625,592 7,374,408 0 2,000,000 42,625,592 44,625,592 2,000,000 85% 0.05 1.05 1.45%
8 RREEF North American Infrastructure Fund 2007 50,000,000 50,000,000 0 846,289 55,238,755 0 55,238,755 4,392,466 100% 1.09 1.09 12.59%
Total: Dallas Police & Fire Pension System 364,000,000 272,164,314 91,835,686 83,344 78,584,442 197,552,038 276,136,480 3,888,822 75% 0.29 1.01 0.52%
7
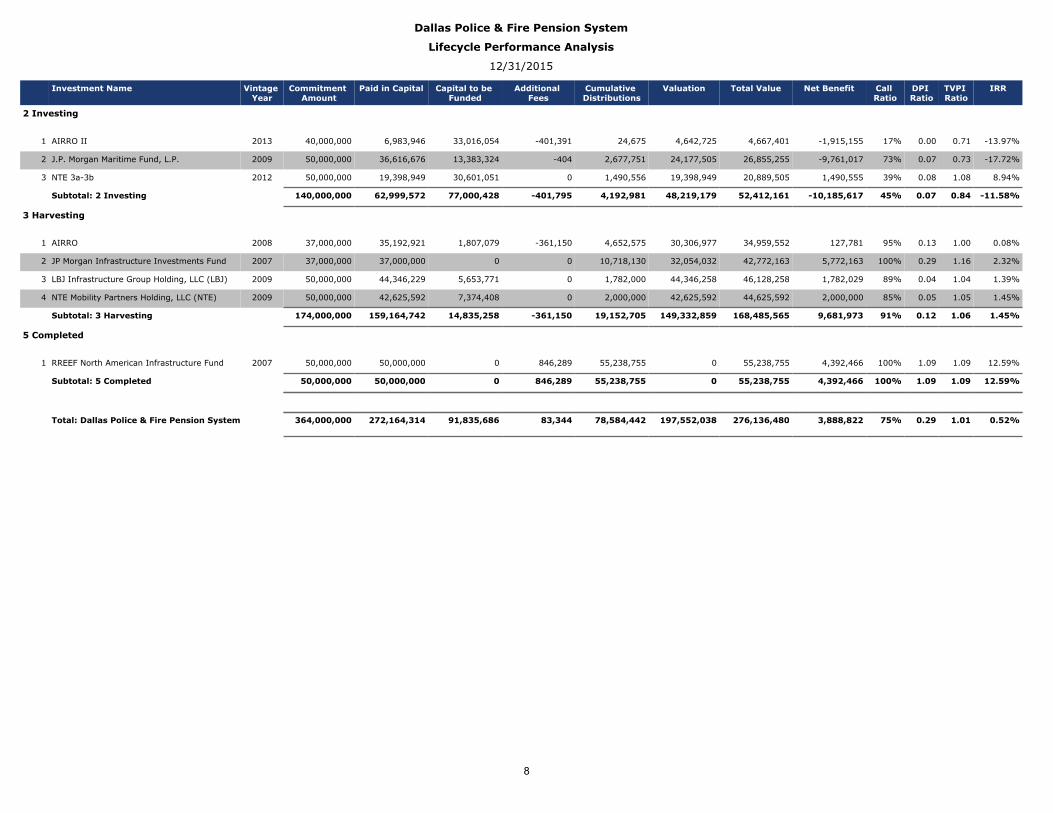
Dallas Police & Fire Pension System
Lifecycle Performance Analysis
12/31/2015
Investment Name Vintage Year
Commitment Amount
Paid in Capital Capital to be Funded
Additional Fees
Cumulative Distributions
Valuation Total Value Net Benefit Call Ratio
DPI Ratio
TVPI Ratio
IRR
2 Investing
1 AIRRO II 2013 40,000,000 6,983,946 33,016,054 -401,391 24,675 4,642,725 4,667,401 -1,915,155 17% 0.00 0.71 -13.97%
2 J.P. Morgan Maritime Fund, L.P. 2009 50,000,000 36,616,676 13,383,324 -404 2,677,751 24,177,505 26,855,255 -9,761,017 73% 0.07 0.73 -17.72%
3 NTE 3a-3b 2012 50,000,000 19,398,949 30,601,051 0 1,490,556 19,398,949 20,889,505 1,490,555 39% 0.08 1.08 8.94%
Subtotal: 2 Investing 140,000,000 62,999,572 77,000,428 -401,795 4,192,981 48,219,179 52,412,161 -10,185,617 45% 0.07 0.84 -11.58%
3 Harvesting
1 AIRRO 2008 37,000,000 35,192,921 1,807,079 -361,150 4,652,575 30,306,977 34,959,552 127,781 95% 0.13 1.00 0.08%
2 JP Morgan Infrastructure Investments Fund 2007 37,000,000 37,000,000 0 0 10,718,130 32,054,032 42,772,163 5,772,163 100% 0.29 1.16 2.32%
3 LBJ Infrastructure Group Holding, LLC (LBJ) 2009 50,000,000 44,346,229 5,653,771 0 1,782,000 44,346,258 46,128,258 1,782,029 89% 0.04 1.04 1.39%
4 NTE Mobility Partners Holding, LLC (NTE) 2009 50,000,000 42,625,592 7,374,408 0 2,000,000 42,625,592 44,625,592 2,000,000 85% 0.05 1.05 1.45%
Subtotal: 3 Harvesting 174,000,000 159,164,742 14,835,258 -361,150 19,152,705 149,332,859 168,485,565 9,681,973 91% 0.12 1.06 1.45%
5 Completed
1 RREEF North American Infrastructure Fund 2007 50,000,000 50,000,000 0 846,289 55,238,755 0 55,238,755 4,392,466 100% 1.09 1.09 12.59%
Subtotal: 5 Completed 50,000,000 50,000,000 0 846,289 55,238,755 0 55,238,755 4,392,466 100% 1.09 1.09 12.59%
Total: Dallas Police & Fire Pension System 364,000,000 272,164,314 91,835,686 83,344 78,584,442 197,552,038 276,136,480 3,888,822 75% 0.29 1.01 0.52%
8

Dallas Police & Fire Pension System
Vintage Year Performance Analysis
12/31/2015
Investment Name Vintage Year
Commitment Amount
Paid in Capital Capital to be Funded
Additional Fees
Cumulative Distributions
Valuation Total Value Net Benefit Call Ratio
DPI Ratio
TVPI Ratio
IRR
2007
1 JP Morgan Infrastructure Investments Fund 2007 37,000,000 37,000,000 0 0 10,718,130 32,054,032 42,772,163 5,772,163 100% 0.29 1.16 2.32%
2 RREEF North American Infrastructure Fund 2007 50,000,000 50,000,000 0 846,289 55,238,755 0 55,238,755 4,392,466 100% 1.09 1.09 12.59%
Subtotal: 2007 87,000,000 87,000,000 0 846,289 65,956,885 32,054,032 98,010,918 10,164,629 100% 0.75 1.12 3.76%
2008
1 AIRRO 2008 37,000,000 35,192,921 1,807,079 -361,150 4,652,575 30,306,977 34,959,552 127,781 95% 0.13 1.00 0.08%
Subtotal: 2008 37,000,000 35,192,921 1,807,079 -361,150 4,652,575 30,306,977 34,959,552 127,781 95% 0.13 1.00 0.08%
2009
1 J.P. Morgan Maritime Fund, L.P. 2009 50,000,000 36,616,676 13,383,324 -404 2,677,751 24,177,505 26,855,255 -9,761,017 73% 0.07 0.73 -17.72%
2 LBJ Infrastructure Group Holding, LLC (LBJ) 2009 50,000,000 44,346,229 5,653,771 0 1,782,000 44,346,258 46,128,258 1,782,029 89% 0.04 1.04 1.39%
3 NTE Mobility Partners Holding, LLC (NTE) 2009 50,000,000 42,625,592 7,374,408 0 2,000,000 42,625,592 44,625,592 2,000,000 85% 0.05 1.05 1.45%
Subtotal: 2009 150,000,000 123,588,497 26,411,503 -404 6,459,751 111,149,355 117,609,105 -5,978,988 82% 0.05 0.95 -1.88%
2012
1 NTE 3a-3b 2012 50,000,000 19,398,949 30,601,051 0 1,490,556 19,398,949 20,889,505 1,490,555 39% 0.08 1.08 8.94%
Subtotal: 2012 50,000,000 19,398,949 30,601,051 0 1,490,556 19,398,949 20,889,505 1,490,555 39% 0.08 1.08 8.94%
2013
1 AIRRO II 2013 40,000,000 6,983,946 33,016,054 -401,391 24,675 4,642,725 4,667,401 -1,915,155 17% 0.00 0.71 -13.97%
Subtotal: 2013 40,000,000 6,983,946 33,016,054 -401,391 24,675 4,642,725 4,667,401 -1,915,155 17% 0.00 0.71 -13.97%
Total: Dallas Police & Fire Pension System 364,000,000 272,164,314 91,835,686 83,344 78,584,442 197,552,038 276,136,480 3,888,822 75% 0.29 1.01 0.52%
9

Dallas Police & Fire Pension System
Investment Strategy Performance Analysis
12/31/2015
Investment Name Vintage Year
Commitment Amount
Paid in Capital Capital to be Funded
Additional Fees
Cumulative Distributions
Valuation Total Value Net Benefit Call Ratio
DPI Ratio
TVPI Ratio
IRR
410 Infrastructure
1 AIRRO 2008 37,000,000 35,192,921 1,807,079 -361,150 4,652,575 30,306,977 34,959,552 127,781 95% 0.13 1.00 0.08%
2 AIRRO II 2013 40,000,000 6,983,946 33,016,054 -401,391 24,675 4,642,725 4,667,401 -1,915,155 17% 0.00 0.71 -13.97%
3 J.P. Morgan Maritime Fund, L.P. 2009 50,000,000 36,616,676 13,383,324 -404 2,677,751 24,177,505 26,855,255 -9,761,017 73% 0.07 0.73 -17.72%
4 JP Morgan Infrastructure Investments Fund 2007 37,000,000 37,000,000 0 0 10,718,130 32,054,032 42,772,163 5,772,163 100% 0.29 1.16 2.32%
5 LBJ Infrastructure Group Holding, LLC (LBJ) 2009 50,000,000 44,346,229 5,653,771 0 1,782,000 44,346,258 46,128,258 1,782,029 89% 0.04 1.04 1.39%
6 NTE 3a-3b 2012 50,000,000 19,398,949 30,601,051 0 1,490,556 19,398,949 20,889,505 1,490,555 39% 0.08 1.08 8.94%
7 NTE Mobility Partners Holding, LLC (NTE) 2009 50,000,000 42,625,592 7,374,408 0 2,000,000 42,625,592 44,625,592 2,000,000 85% 0.05 1.05 1.45%
8 RREEF North American Infrastructure Fund 2007 50,000,000 50,000,000 0 846,289 55,238,755 0 55,238,755 4,392,466 100% 1.09 1.09 12.59%
Subtotal: 410 Infrastructure 364,000,000 272,164,314 91,835,686 83,344 78,584,442 197,552,038 276,136,480 3,888,822 75% 0.29 1.01 0.52%
Total: Dallas Police & Fire Pension System 364,000,000 272,164,314 91,835,686 83,344 78,584,442 197,552,038 276,136,480 3,888,822 75% 0.29 1.01 0.52%
10
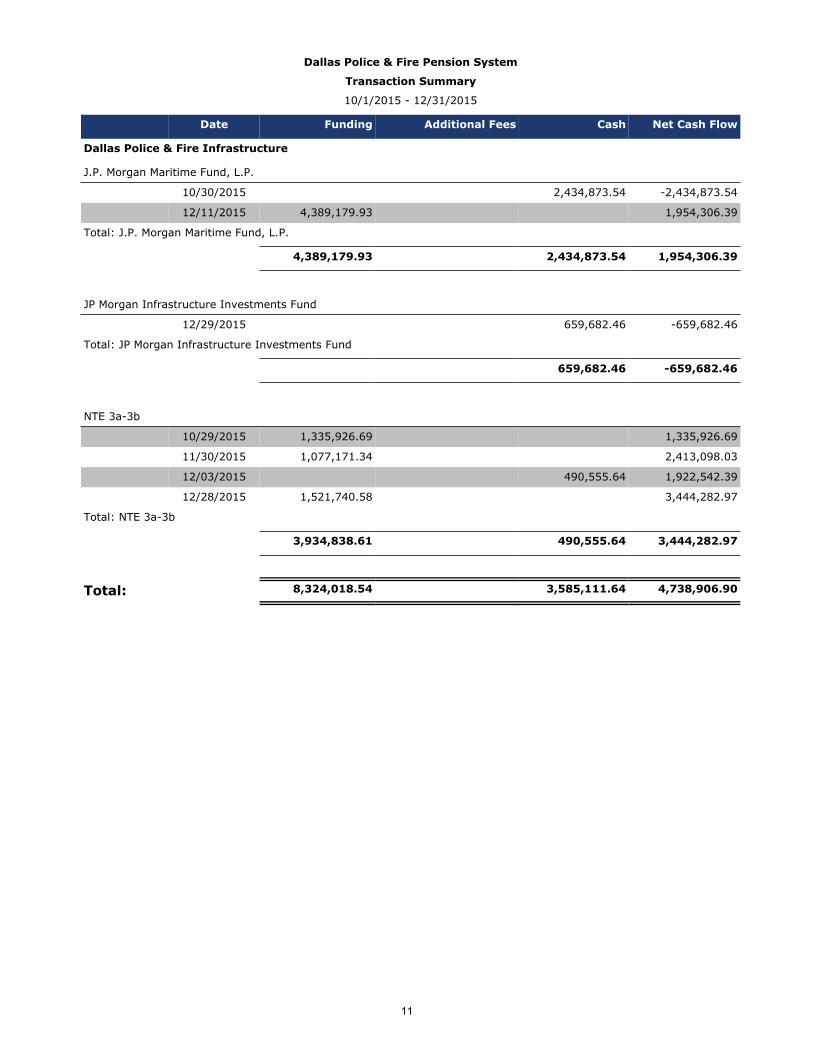
Dallas Police & Fire Pension System
Transaction Summary
10/1/2015 - 12/31/2015
Date Funding Additional Fees Cash Net Cash Flow
Dallas Police & Fire Infrastructure
J.P. Morgan Maritime Fund, L.P.
10/30/2015 2,434,873.54 -2,434,873.54
12/11/2015 4,389,179.93 1,954,306.39
Total: J.P. Morgan Maritime Fund, L.P.
4,389,179.93 2,434,873.54 1,954,306.39
JP Morgan Infrastructure Investments Fund
12/29/2015 659,682.46 -659,682.46
Total: JP Morgan Infrastructure Investments Fund
659,682.46 -659,682.46
NTE 3a-3b
10/29/2015 1,335,926.69 1,335,926.69
11/30/2015 1,077,171.34 2,413,098.03
12/03/2015 490,555.64 1,922,542.39
12/28/2015 1,521,740.58 3,444,282.97
Total: NTE 3a-3b
3,934,838.61 490,555.64 3,444,282.97
Total: 8,324,018.54 3,585,111.64 4,738,906.90
11

DISCUSSION SHEET
Regular Board Meeting – Thursday, June 9, 2016
ITEM #D6
Topic: Investment reports
Discussion: Review of investment reports.

DISCUSSION SHEET
Regular Board Meeting – Thursday, June 9, 2016
ITEM #D7
Topic: Hearthstone: Idaho and Colorado properties update Portions of the discussion under this topic may be closed to the public under the terms of Section 551.072 of the Texas Government Code.
Discussion: Staff will update the Board on the status of the Sandstone and Spring Valley investments, which are located in Douglas County, CO and Eagle, ID, respectively. Hearthstone was engaged as the investment manager for the properties in February 2015 and presented their asset review and recommendations at the August 27, 2015 Board meeting.

DISCUSSION SHEET
Regular Board Meeting – Thursday, June 9, 2016
ITEM #D8
Topic: Plan amendment – retiree voting
Discussion: The Chairman has asked that this item be placed on the agenda for an initial board discussion
as to whether a change should be proposed when the next plan amendment election occurs
which would allow retirees to vote in future elections.

DISCUSSION SHEET
Regular Board Meeting – Thursday, June 9, 2016
ITEM #D9
Topic: Ad hoc committee reports
Discussion: A brief update on the ad hoc committees will be provided.

DISCUSSION SHEET
Regular Board Meeting – Thursday, June 9, 2016
ITEM #D10
Topic: Board Members’ reports on meetings, seminars and/or conferences attended a. Conference: NCPERS Accredited Fiduciary (NAF) Program KH, SF, CC
Dates: May 14-15, 2016 JS, BH, KG Location: San Diego, CA
b. Conference: NCPERS Annual Conference KH, SF, JM, CC
Dates: May 15-19, 2016 JS, BH, KG, JMond Location: San Diego, CA
c. Conference: TEXPERS Basic Trustee Training Class (PRB rules for MET) EW
Dates: May 18, 2016 Location: Houston, TX
d. Conference: Pharos Annual Investor Conference KH, JB, GI
Dates: June 7-8, 2016 Location: Irving, TX

DISCUSSION SHEET
Regular Board Meeting – Thursday, June 9, 2016
ITEM #D11
Topic: 2016 Annual Board and Staff Workshop
Discussion: The Board and staff will discuss preliminary topics for the 2016 annual workshop. The annual workshop is held in October each year and gives the Trustees and staff an opportunity to hear speakers and topics on a greater range and depth than is possible at the regular monthly Board meetings. Educational sessions are provided which help the Trustees to keep abreast of current investment, actuarial, legislative and legal knowledge needed to fulfill their roles as fiduciaries of the Pension System. Speakers need to be booked well in advance of their requested dates; therefore, Staff is requesting input from the Board on topics to be addressed and speakers to be invited.
Staff Recommendation: Direct the staff regarding Board preferences for agenda topics and speakers.

DISCUSSION SHEET
Regular Board Meeting – Thursday, June 9, 2016
ITEM #D12
Topic: Spouse Wed After Retirement (SWAR) Portions of the discussion under this topic may be closed to the public under the terms of Section 551.071 of the Texas Government Code.
Discussion: Staff will brief the Board regarding a request by a member to make a SWAR election.

DISCUSSION SHEET
Regular Board Meeting – Thursday, June 9, 2016
ITEM #D13
Topic: Legal issues Portions of the discussion under this topic may be closed to the public under the terms of Section 551.071 of the Texas Government Code: a. Police Officer and Firefighter pay lawsuits b. Potential claims involving fiduciaries and advisors c. 2014 Plan amendment election and litigation
Discussion: Counsel will brief the Board on these issues.

DISCUSSION SHEET
Regular Board Meeting – Thursday, June 9, 2016
ITEM #D14
Topic: Mid-year 2016 budget adjustment
Discussion: Staff will brief the Board on actual legal fees incurred to date in 2016 and anticipated expenses for the remainder of the year, as compared to the budgeted expense of $750,000.
Staff Recommendation: Approve an increase to the budget line item for Legal fees to $2 million for the year ending
December 31, 2016.

DISCUSSION SHEET
Regular Board Meeting – Thursday, June 9, 2016
ITEM #D15
Topic: Audit status
Discussion: Staff will update the Board on the status and findings to date related to the 2015 financial statement audit.
DISCUSSION SHEET
Regular Board Meeting – Thursday, June 9, 2016
ITEM #D16
Topic: Emerging Managers
Discussion: The Chairman would like to discuss the Board’s position on Emerging Managers.

DISCUSSION SHEET
Regular Board Meeting – Thursday, June 9, 2016
ITEM #E1
Topic: Reports and concerns of active members and pensioners of the Dallas Police and Fire Pension System
Discussion: This is a Board-approved open forum for active members and pensioners to address their concerns to the Board and staff.

DISCUSSION SHEET
Regular Board Meeting – Thursday, June 9, 2016
ITEM #E2
Topic: Executive Director’s report
a. Future Education and Business Related Travel b. Future Investment Related Travel c. Associations’ newsletters
TEXPERS Pension Observer (Spring 2016) d. CalPERS to study possible reinvestment in tobacco (Reuters)
Discussion: The Executive Director will brief the Board regarding the attached information.

1 of 4 * New/No one has signed up
Future Education and Business Related Travel Regular Board Meeting – June 9, 2016
1. Conference: Society of Pension Professionals Dates: June 21, 2016 Location: Dallas, TX Est. Cost: $250.00 Per Person Annually
Regular Board Meeting July 14, 2016 2. Conference: Opal: Public Funds Summit East Dates: July 18-20, 2016 Location: Newport, RI Est. Cost: $1,850 3. Conference: Society of Pension Professionals Dates: July 19, 2016 Location: Dallas, TX Est. Cost: $250.00 Per Person Annually 4. Conference: Wharton: International and Emerging Market Investing Dates: July 25-27, 2016 Location: San Francisco, CA Est. Cost: $6,000
Regular Board Meeting August 11, 2016

2 of 4 * New/No one has signed up
5. Conference: TEXPERS Basic Trustee Training Class (PRB rules for MET) Dates: August 14, 2016 Location: San Antonio, TX Est. Cost: $100 6. Conference: TEXPERS Summer Educational Forum Dates: August 14-16, 2016 Location: San Antonio, TX Est. Cost: TBD 7. Conference: NCPERS Public Pensions Funding Forum Dates: August 21-23, 2016 Location: New Haven, CT Est. Cost: TBD
Regular Board Meeting September 8, 2016
8. Conference: Society of Pension Professionals Dates: September 20, 2016 Location: Dallas, TX Est. Cost: $250.00 Per Person Annually 9. Conference: TLFFRA Pension Conference Dates: October 2-4, 2016 Location: McAllen, TX Est. Cost: TBD
Regular Board Meeting October 13, 2016

3 of 4 * New/No one has signed up
Board and Staff Workshop October 17-19, 2016 10. Conference: NCPERS Public Safety Conference Dates: October 23-26, 2016 Location: Las Vegas, NV Est. Cost: TBD 11. Conference: Global ARC Annual Conference Dates: October 24-25, 2016 Location: Boston, MA Est. Cost: $1,775
12. Conference: TEXPERS Basic Trustee Training Class (PRB rules for MET) Dates: October 31, 2016 Location: Irving, TX Est. Cost: $100 13. Conference: Opal: Emerging Managers Summit South Dates: November 7-8, 2016 Location: Austin, TX Est. Cost: $1,000
Regular Board Meeting November 10, 2016
14. Conference: IFEBP: Annual Benefits Conference Dates: November 13-16, 2016 Location: Orlando, FL Est. Cost: $3,200

4 of 4 * New/No one has signed up
Regular Board Meeting December 8, 2016
15. Conference: Society of Pension Professionals Dates: December 20, 2016 Location: Dallas, TX Est. Cost: $250.00 Per Person Annually 16. Conference: PRB: MET Online Core Training: Benefits Administration Dates: Anytime on line Location: http://www.prb.state.tx.us/ 17. Conference: PRB: MET Online Core Training: Risk Management Dates: Anytime on line Location: http://www.prb.state.tx.us/

1 of 4 * New/No one has signed up
Future Education and Business Related Travel Regular Board Meeting – June 9, 2016
ATTENDING
1. Conference: Society of Pension Professionals JB, GI Dates: June 21, 2016 Location: Dallas, TX Est. Cost: $250.00 Per Person Annually
Regular Board Meeting July 14, 2016 2. Conference: Opal: Public Funds Summit East * Dates: July 18-20, 2016 Location: Newport, RI Est. Cost: $1,850 3. Conference: Society of Pension Professionals JS, JB, GI, CW Dates: July 19, 2016 Location: Dallas, TX Est. Cost: $250.00 Per Person Annually 4. Conference: Wharton: International and Emerging Market Investing TH, BH Dates: July 25-27, 2016 Location: San Francisco, CA Est. Cost: $6,000
Regular Board Meeting August 11, 2016

2 of 4 * New/No one has signed up
5. Conference: TEXPERS Basic Trustee Training Class (PRB rules for MET) * Dates: August 14, 2016 Location: San Antonio, TX Est. Cost: $100 6. Conference: TEXPERS Summer Educational Forum SF, KH Dates: August 14-16, 2016 Location: San Antonio, TX Est. Cost: TBD 7. Conference: NCPERS Public Pensions Funding Forum SF Dates: August 21-23, 2016 Location: New Haven, CT Est. Cost: TBD
Regular Board Meeting September 8, 2016
8. Conference: Society of Pension Professionals JS, JB, GI, CW Dates: September 20, 2016 Location: Dallas, TX Est. Cost: $250.00 Per Person Annually 9. Conference: TLFFRA Pension Conference * Dates: October 2-4, 2016 Location: McAllen, TX Est. Cost: TBD
Regular Board Meeting October 13, 2016

3 of 4 * New/No one has signed up
Board and Staff Workshop October 17-19, 2016 10. Conference: NCPERS Public Safety Conference SF Dates: October 23-26, 2016 Location: Las Vegas, NV Est. Cost: TBD 11. Conference: Global ARC Annual Conference * Dates: October 24-25, 2016 Location: Boston, MA Est. Cost: $1,775
12. Conference: TEXPERS Basic Trustee Training Class (PRB rules for MET) JB Dates: October 31, 2016 Location: Irving, TX Est. Cost: $100 13. Conference: Opal: Emerging Managers Summit South * Dates: November 7-8, 2016 Location: Austin, TX Est. Cost: $1,000
Regular Board Meeting November 10, 2016
14. Conference: IFEBP: Annual Benefits Conference * Dates: November 13-16, 2016 Location: Orlando, FL Est. Cost: $3,200

4 of 4 * New/No one has signed up
Regular Board Meeting December 8, 2016
15. Conference: Society of Pension Professionals JS, JB, GI, CW Dates: December 20, 2016 Location: Dallas, TX Est. Cost: $250.00 Per Person Annually 16. Conference: PRB: MET Online Core Training: Benefits Administration Dates: Anytime on line Location: http://www.prb.state.tx.us/ 17. Conference: PRB: MET Online Core Training: Risk Management Dates: Anytime on line Location: http://www.prb.state.tx.us/

1 of 1 * New/No one has signed up
Future Investment Related Travel Regular Board Meeting – June 9, 2016
NONE

SPRING 2016
(Continued on page 11)
(Continued on page 11)
Responsible Investing By Sandra Carlisle
esponsible investment is better investment –– but what does this mean? It strictly concerns the potential economic advantages and the belief that responsibly managed companies are better placed to achieve sustainable competitive
advantage. This is not just a theory. Academic research has found compelling evidence of the advantages to companies and their investors of pursuing environmental, social and governance
(ESG) policies. A study1 in 2012 by Harvard Business School of 180 US-based firms found that companies who are actively trying to improve their ESG credentials delivered above-market average returns some 4.8% higher than those of their less sustainability-focused counterparts. The identification and analysis of, and engagement with, companies on ESG factors are vital for investors in order to understand potential opportunities and risks. What are the key issues that my team is looking at in this area today, and how can investors help manage the risks associated with them? Case study 1: Environmental –– Stranded Assets What are the risks? In an environment where policymakers are increasingly becoming concerned about the effects of climate change, investors are beginning to ask if fossil fuel producers are investing shareholder capital
R
MARK YOUR CALENDAR
National Real Estate Investor: Shadow Tenancy By W. Stephen Hagenbuckle
eal estate gurus frequently talk about “shadow inventory” in residential markets. But there’s a similar phenomenon occurring in the commercial real estate markets that should be encouraging for nearly every commercial real estate investor, especially ones involved in distressed deals. This new phenomenon, which we call “shadow tenancy,” refers to pent up demand by prospective tenants for new available commercial space and it can be a significant return driver.
R
As general rule, commercial tenants are sensitive to basic customer service and they want responsive, well-capitalized landlords who are ready and willing to invest
substantially in their properties. When lenders or special servicers own a property (typically because they’ve acquired it during foreclosure) prospective tenants become concerned about how much the landlord is willing to invest in the property and respond to the tenants as a long-term owner. They also know banks
and special servicers are likely to sell the property in the short-term to an unknown buyer. Understandably, prospective tenants, even if they are keen on the property, are wary to commit to new space until they know the identity of their long-term landlord. This creates a “shadow tenancy” where
tenants are interested in specific properties and watch those properties with a willingness to commit to space once it’s sold to a stable owner. Properties with low occupancies owned by lenders often must be bought on a price-per-sq.-ft. basis rather
than a cap rate because they may be breaking even or losing money at acquisition.
What Does It Mean and Why Does It Matter?
August 14 - 16, 2016
Grand Hyatt HotelSan Antonio, Texas
•••Sunday, August 14, 2016
(Note Date Change)Basic Trustee Training
Plan Sponsors Only•••
Registration Opening Soon!
TEXPERS SUMMEREDUCATIONAL FORUM

WASHINGTON OUTLOOKBy Matthew Aukofer
2
U .S. Rep. Devin Nunes (R-Calif.) on March 21 reintroduced his “Public Employee Pension Transparency Act” (PEPTA) for the fourth time, despite seeing the legislation die on the vine during the three previous Congressional sessions.
Nunes Again Seeks Cosponsors for ‘PEPTA,’ the Public Pension Transparency Act that Would Not Die
(Continued on page 15)
BOARD O FDIRECTORS
The TEXPERS Pension Observer is the official publication of Texas Association of Public Em-ployee Retirement Systems, published quarterly for TEXPERS members. Contributions to The TEXPERS Pension Observer are welcome, but the right is reserved to select material to be published. Publication of any article or statement is not to be deemed an endorsement of the views expressed therein, nor shall publication of any advertisement be considered an endorsement of the product or service involved. © 2016, TEXPERS®
CONTACT INFORMATION
The TEXPERS ® Pension Observerc/o Texas Association of Public Employee Retirement Systems1225 N. Loop West, Suite 909Houston, Texas 77008Telephone (713) 622-8018E-Mail: [email protected]
• Max L. PattersonExecutive Director & Editor
• Matthew AukoferContributing Editor
According to Nunes, the legislation would require state and local government pension plans to disclose their liabilities “in a uniform and transparent manner based on widely accepted accounting principles.” The reason he feels the legislation is needed? “Many state and local pen-sion funds are hiding vast debts through accounting gimmicks,” Nunes said in a statement reintroducing the bill. Never mind the fact that the Gov-ernmental Accounting Standards Board (GASB) vetted and approved a host of accounting and financial reporting standards and guidance for public pension plans in the years since Nunes first introduced PEPTA in 2010, during the 111th Congress. The increased trans-parency that is being gleaned from the new GASB standards appar-ently is not enough for Nunes. It is now 2016 and the second session of the 114th Congress began Jan. 2. Nunes is once again trying to tie the pas-sage of PEPTA to current events –– specifically the Puerto Rican debt crisis –– in the hopes that it will spark more interest in his pet project. Apparently, he is going to need it. PEPTA’s high-water mark for co-sponsors came in 2013 during the 112th session of Congress, when it garnered 51 cospon-sors in the House and 8 cosponsors in the Senate. During the 113th Congress (2013-2015), PEPTA didn’t do so well, attracting just 10 cosponsors in the House and two in the Senate. (The latest version of PEPTA had not yet received a bill number as of press time, and hence, no cosponsors). Could Puerto Rico’s debt crisis tip the scales this time around?
“The fact that public pension debt helped spur the Puerto Rican debt crisis should serve as a warning of the devastating effects that can result from underfunded pension sys-tems,” Nunes claimed. At the end of last year, provisions from both PEPTA and the SAFE Act –– Sen. Or-rin Hatch’s (R-Utah) proposal to allow state and local governments to purchase deferred annuities for their employees –– were in-cluded as part of a relief package for Puerto Rico. But that bill did not move and died in December when the first session of the 114th Congress ended. But lawmakers may
consider legislation this spring to aide Puerto Rico and the PEPTA and SAFE Act provisions could be inserted once again. State and local gov-ernment organizations that make up the Public Pension Network have op-posed PEPTA in past ses-sions of Congress because the bill would introduce three new troublesome provisions impacting state and local governments: 1) a requirement for state and local governments to file annual reports with the U.S. Treasury Depart-ment disclosing how they calculate their unfunded pension liabilities; 2) a requirement to use a rate of
return pegged to the Treasury rate rather than rates widely used now; and 3) the loss of the ability to issue tax-exempt municipal bonds if a state or local government fails to comply with the requirements under the bill. On March 14, the Public Pension Network sent a letter to the U.S. House of Represen-tatives opposing the measure and asking lawmakers not to sign on as cosponsors. “Given the changes that public pensions have implemented in the years since the Great Recession, it remains unclear why the
The TEXPERS ® Pension Observer Spring 2016
Board Members
SecretaryJohn D. Jenkins Employees’ Retirement Fund of the City of Dallas
Second Vice President Tyler GrossmanEl Paso Firemen & Policemen’s Pension Fund
First Vice PresidentSherry MoseHouston Municipal Employees Pension System
TreasurerEyna Canales-ZarateCity of Austin Employees’ Retirement System
PresidentPaul R. BrownBig Spring Firemen’s Relief & Retirement Fund
• Jose CavazosDallas Area Rapid Transit Retirement Plan and Trust
• Denise CrandonDallas Area Rapid Transit Retirement Plan and Trust
• Larry A. ReedSan Antonio Fire & Police Pension Fund
• Jim SmithSan Antonio Fire & Police Pension Fund
• Billy SamuelFort Worth Employees’ Retirement Fund
• David StacyMidland Firemen’s Relief and Retirement Fund

3
F
EXECUTIVE DIRECTOR’S COLUMNBy Max L. Patterson
Robust Membership Growth We have 333 members... comprising 77 retirement systems, 9 associate advisors, 184 associate members, 33 consultants, 7 actuaries, and 23 employee groups. Healthy revenues support our efforts to provide more of the professional speakers our system members have grown to expect. In the future we will be expanding conference content with additional programming including pertinent non-investment related subjects in breakout sessions.Membership Feedback In order for us to be successful in this effort to meet your needs, we rely on your feedback for assistance. TEXPERS training and conference content should be focused on what you want; so speak up, let us know what you want.Publications TEXPERS publication content and method of delivery are also under review. The Outlook is primarily a compilation of pension stories from several outside sources that we gather for your convenience. For those of you who read many different pension publications, this may be old news, while others may find the information to be new and useful. We strive to find a balance to ensure that the information is relevant. Again, this is where your input helps. Is this publication of value to you, or is it just repetitive? Let us know.
Technology to Assist Members TEXPERS is leveraging technology to improve the member experience. Our association management platform enables us to streamline processes, facilitate renewals,
integrate registration into the member database, and provide a searchable online membership directory accessible by you from all your devices. The conference app allows members to have everything they need for our conferences right at their fingertips, whether on their phone, tablet or laptop.The 84th Texas Legislative Session I was pleased to report that the session concluded without the passage of any harmful pension-related bills and TEXPERS’ legislative committee is already
preparing for the next session.Member Support Last but not least, staff visits to TEXPERS member pension systems are ongoing with the goal of raising awareness of TEXPERS member benefits, responding to questions about the PRB Minimum Education and Training requirements, and helping members navigate the TEXPERS web site.Contact Us! TEXPERS leadership and staff wholeheartedly strive to improve TEXPERS for its members, as well as advance and protect Texas retirement funds. Any time you have feedback, please contact me via email [email protected] or call us at 713-622-8018. We are here for You, nothing else!
The TEXPERS ® Pension Observer Spring 2016
I
PRESIDENT’S CORNERBy Paul R. Brown
(Continued on page 7)
had the opportunity to attend a conference at which a Federal Legislative update was given. It is interesting that U.S. Senator Orrin Hatch is still being discussed concerning his attempt to exploit the financial hardships of Puerto Rico by slipping anti-pension legislation into a year-end spending bill. Senator Hatch, chair of the Senate Finance Committee, has been looking for opportunities to find traction on his SAFE Act legislation that would turn public pension plans into non-guaranteed annuity payouts while reducing benefits and increasing risks to the taxpayer. We expect the assault on defined benefit
pension plans in 2016 will be just as strong as ever and TEXPERS will continue its offensive on the SAFE Act and work to protect our members. With the primaries at an end in Texas, we move forward to the November elections. It is imperative that you interact with candidates and their staff, and raise issues important to you and your pension system. Decisions
made at the next legislative session can have a tremendous impact on your pension and retirement security. Don’t let these decisions transpire without your influence. TEXPERS is vocal on issues affecting pension systems in Texas. We continue the discussions at conferences, in committee meetings and in the media. We are currently watching an Attorney General Opinion requested by Rep. Jim Murphy of Houston, and have urged our system members to participate and provide input through their systems’ legal counsel.
or those who missed the recent TEXPERS 27th Annual Conference in Dallas I thought a recap of a few highlights from my Executive Director’s report at that event would be of interest. First of all, the State of the Association report let everyone know that TEXPERS is in very good shape. We had just received our annual audit report which confirmed TEXPERS’ excellent financial condition.

4 The TEXPERS ® Pension Observer Spring 2016
• • • • • • Patti Featherston, was named executive director/CEO of the Austin (Texas) Police Retirement System. She assumed the position in early February, 2016. She replaced Sampson Jordan, who retired December 18. Featherston previously served as Chief Operating Offi cer of the Teacher Retirement System of Texas (TRS) and as a Budget Analyst with the Texas Legislative Budget Board. Her background
spans many years involved with state government including work in a variety of subject areas. In her role as COO at TRS, her management oversight included the areas of fi nance, benefi ts delivery including retirement and health care, information technology, human resources, governmental relations and communications. Featherston holds a Bachelor of Business Administration from the University of Texas at Austin with a major in Management. She is a long-time resident of Austin, remaining in the city throughout her career following college graduation. Regarding her involvement with TEXPERS, she said, “I really enjoy
pension management, and it is a very special honor to work on behalf of police offi cers in a city I have loved for many years. TEXPERS is a valuable contributor to the state and national pension environment, offering great resources to its members, and I look forward to working more closely with the organization.”
“I really enjoy pension management, and it is a very special honor to work on behalf of police offi cers in a city I have loved for many years.”
People in Texas Public PensionsKeeping Up With Texas Public Pensions’ Newsmakers and Leadership
5 Houston Center 1401 McKinney, Suite 1600
Houston, TX 77010-4035www.GarciaHamiltonAssociates.com
Contact: Ruby Muñoz DangPhone: (713) 853-2359
*As of 3/21/16.
Managing $6.9 Billion in High Quality Fixed Income Assets
Thank You to Our 230 Clients!
Certified MBE Firm
*
Awards/rankings may not represent client experiences and are not indicative of future performance. Go to www.garciahamiltonassociates.com/awards/ for additional information on each award.
*
• • •
• • •
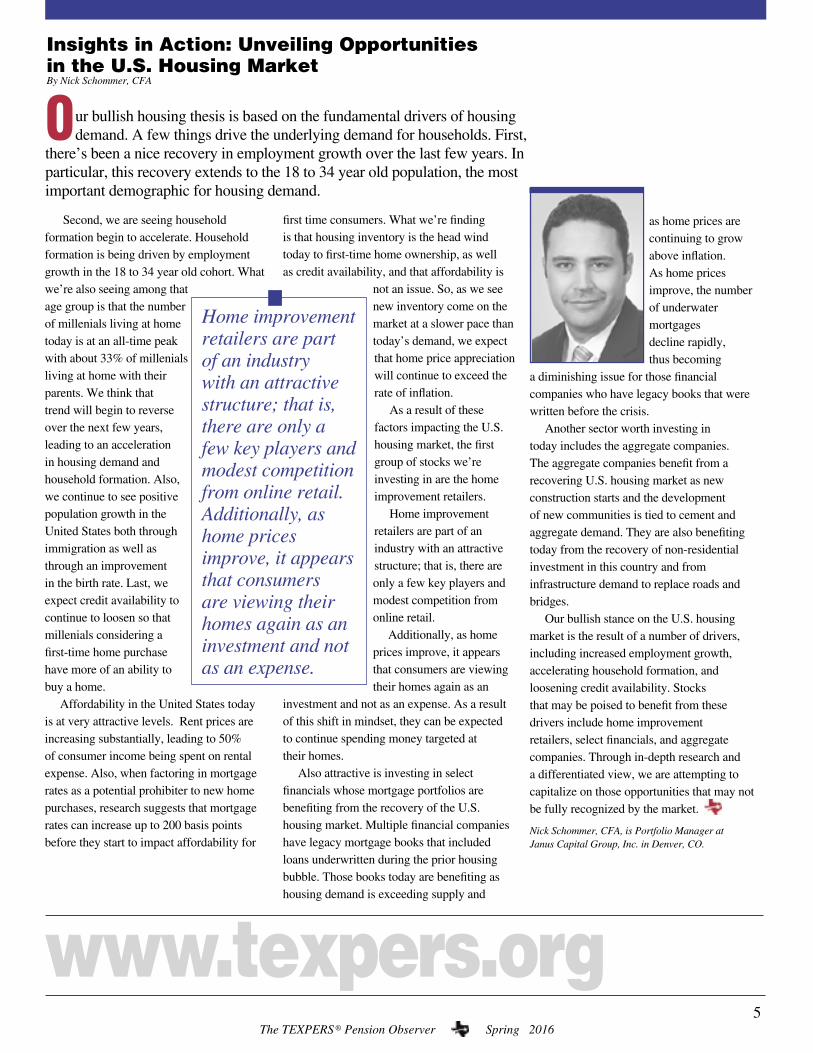
5
OInsights in Action: Unveiling Opportunities in the U.S. Housing Market By Nick Schommer, CFA
The TEXPERS ® Pension Observer Spring 2016
ur bullish housing thesis is based on the fundamental drivers of housing demand. A few things drive the underlying demand for households. First, there’s been a nice recovery in employment growth over the last few years. In particular, this recovery extends to the 18 to 34 year old population, the most important demographic for housing demand.
Second, we are seeing household formation begin to accelerate. Household formation is being driven by employment growth in the 18 to 34 year old cohort. What we’re also seeing among that age group is that the number of millenials living at home today is at an all-time peak with about 33% of millenials living at home with their parents. We think that trend will begin to reverse over the next few years, leading to an acceleration in housing demand and household formation. Also, we continue to see positive population growth in the United States both through immigration as well as through an improvement in the birth rate. Last, we expect credit availability to continue to loosen so that millenials considering a first-time home purchase have more of an ability to buy a home. Affordability in the United States today is at very attractive levels. Rent prices are increasing substantially, leading to 50% of consumer income being spent on rental expense. Also, when factoring in mortgage rates as a potential prohibiter to new home purchases, research suggests that mortgage rates can increase up to 200 basis points before they start to impact affordability for
as home prices are continuing to grow above inflation. As home prices improve, the number of underwater mortgages decline rapidly, thus becoming
a diminishing issue for those financial companies who have legacy books that were written before the crisis. Another sector worth investing in today includes the aggregate companies. The aggregate companies benefit from a recovering U.S. housing market as new construction starts and the development of new communities is tied to cement and aggregate demand. They are also benefiting today from the recovery of non-residential investment in this country and from infrastructure demand to replace roads and bridges. Our bullish stance on the U.S. housing market is the result of a number of drivers, including increased employment growth, accelerating household formation, and loosening credit availability. Stocks that may be poised to benefit from these drivers include home improvement retailers, select financials, and aggregate companies. Through in-depth research and a differentiated view, we are attempting to capitalize on those opportunities that may not be fully recognized by the market.
Nick Schommer, CFA, is Portfolio Manager at Janus Capital Group, Inc. in Denver, CO.
first time consumers. What we’re finding is that housing inventory is the head wind today to first-time home ownership, as well as credit availability, and that affordability is
not an issue. So, as we see new inventory come on the market at a slower pace than today’s demand, we expect that home price appreciation will continue to exceed the rate of inflation. As a result of these factors impacting the U.S. housing market, the first group of stocks we’re investing in are the home improvement retailers. Home improvement retailers are part of an industry with an attractive structure; that is, there are only a few key players and modest competition from online retail. Additionally, as home prices improve, it appears that consumers are viewing their homes again as an
investment and not as an expense. As a result of this shift in mindset, they can be expected to continue spending money targeted at their homes. Also attractive is investing in select financials whose mortgage portfolios are benefiting from the recovery of the U.S. housing market. Multiple financial companies have legacy mortgage books that included loans underwritten during the prior housing bubble. Those books today are benefiting as housing demand is exceeding supply and

6
FRisk Management During Volatile Fixed Income Environments By Robert G. Smith, III, CIMC, AIF
(Continued on page 7)
The TEXPERS ® Pension Observer Spring 2016
ixed income returns are derived from two sources, coupon payment and price change. While the foundation of fixed income is the predictability and practicality associated with receiving a consistent income stream, changes in interest rates and credit spreads cause the price of fixed income securities to fluctuate on a daily basis. Like any asset class, fixed income is vulnerable to periods of increased volatility and downward pressure on prices. Today, investors are struggling to digest the impact of a potential shift in the Federal Reserve’s interest rate policy and concerns associated with a maturing credit cycle. Rising Rate Environments Many investors only associate rising rate environments with periods when the Federal Reserve is increasing the Fed funds rate. While Federal Reserve monetary policy certainly sets the tone for rates, old fashion supply and demand is the primary influence on fixed income markets with inflation,
economic growth, and market sentiment being the key drivers. Here we analyze the four most significant rising rate environments over the past 20 years as defined by the change in 10-Year Treasury yield. The shaded areas on Chart A illustrate actual Federal Reserve tightening cycles. As shown, periods of significant rate volatility don’t
always alignwith the Federal Reserve raising interest rates and often occur when it isn’t introducing a tightening of monetary policy. Interestingly, historical performance results show that during these periods
a well diversified fixed income strategy, as represented by the Barclay’s Intermediate Gov’t/Credit Index, can often mute or offset the negative effects of rising rates commonly exhibited by just U.S. Treasury securities. As shown in Table B, ample diversification within fixed income portfolios is beneficial to investors during these periods of high interest rate volatility and an active management approach to diversification may help to amplify these positive outcomes.
B.
IG Spread at Start of Period
IG Spread at End of Period
Barclay’sUS Credit IndexReturn
Barclay’sIntermediate US Gov/CreditReturn
12/31/99 -
11/30/00 1.11% 1.98% 7.31% 8.11%
08/31/01 -
10/31/02 1.56% 2.47% 5.78% 7.87%
02/28/07 -
11/30/08 0.85% 6.07% -3.48% 4.54%
04/30/11 -
9/30/11 1.38% 2.38% 3.22% 3.39%
10 Year Treasuryat Start of Period
10 Year Treasuryat End of Period
Barclay’s 7-10 YrTreasury IndexReturn
Barclay’sIntermediate USGov/CreditReturn
9/30/98 - 01/31/00 4.42% 6.67% -1.06% 0.24%
5/30/03 - 6/30/06 3.38% 5.14% 0.62% 1.42%12/31/08 - 6/30/09 2.21% 3.54% -3.04% 1.62%
7/31/12 - 12/31/13 1.47% 3.03% -1.26% -0.06%
D.
A.
8
7
6
5
4
3
2
1
0
C.
6
5
4
3
2
1
0

7The TEXPERS ® Pension Observer Spring 2016
PRESIDENT’S CORNERBy Paul R. Brown(Continued from page 3)
Texas is, “just a little bit that way.” And Lone Star politics are a little bit that way, as well. I had the pleasure to meet a lady who had the experience of being on the receiving end of the political beast. I appreciate her comments that follow: “Chicago’s political chicanery, Louisiana’s Cajun-flavored voter fraud, New York’s Tammany Hall election tampering, and Florida’s hanging chad have little on Texas, where deep-seated political struggles last for generations, where candidates are often quickly elevated to the national level partly because of their proven ability to survive the trial-by-deep-fryer that is Texas politics. Texas offers a unique American voting and campaign experience: outrages, inelegant, hilarious, harrowing, and completely without written rules. Wild and wooly and no-holds-barred. That’s Texas and its sprawling, brawling political stage. Not to mention that the proceedings unfold in some of the country’s hottest weather, lending them a special sweaty-faced intensity”. Thank you Mary Mapes for your candor on Texas politics. A side note: Mark your calendar to attend the Summer Educational Forum, August 14-16 in San Antonio. Joe Gagen, Legislative Grassroots Trainer, will lead a workshop that will help you become more effective with communicating to and working with legislators. Joe did a workshop for TEXPERS last year, and those that attended gave the session very high marks.
periods compared to a more broadly diversified fixed income allocation, such as the Barclay’s Intermediate Gov’t/Credit index, which delivered greater and positive returns in each period. The Bottom Line Successful fixed income risk management requires one to recognize the key cyclical themes and trends at play in the market that will determine future investment performance outcomes. As we have shown, interest rate and credit cycles can and do operate independently. Active portfolio management can help investors mitigate the performance volatility that these cycles may bring. The key to the investment process is to recognize when they are in play and for how long.
Robert G. Smith, III, CIMC, AIF, is President and Chief Investment Officer at Sage Advisory Services, Ltd. in Austin, TX.
Spread Widening Environments Often times, investors place too much emphasis on managing interest rate risk and not enough emphasis on managing credit risk. Dramatic periods of credit spread widening, which are typically reflective of deteriorating risk market conditions and a change in market sentiment, can be extremely damaging to fixed income investors who have over-committed to higher risk fixed income in search of yield and higher returns. In Chart C we analyze the four most significant credit spread widening environments over the past
20 years as defined by the change in Investment Grade Credit Spreads. Often times periods of dramatic spread widening occur during equity market downturns. This can be particularly challenging for investors who are counting on their fixed income allocations to be a diversifier to equities and other risk assets. Unfortunately, for investors that have ignored these historical correlations, the results have generally been disappointing. This is illustrated in Table D which shows that the investment grade credit index had on average significantly lower total returns during these
Risk Management During Volatile Fixed Income EnvironmentsBy Robert G. Smith, III, CIMC, AIF (Continued from page 6)
“Chicago’s political chicanery, Louisiana’s Cajun-flavored voter fraud, New York’s Tammany Hall election tampering, and Florida’s hanging chad have little on Texas, where deep-seated political struggles last for generations, where candidates are often quickly elevated to the national level partly because of their proven ability to survive the trial-by-deep-fryer that is Texas politics.”

8 The TEXPERS ® Pension Observer Spring 2016
nfrastructure is an appealing asset class. When strictly defi ned, it delivers stable, infl ation-linked returns with risk below that of other equities. In recent times, focus has increased on public-market infrastructure assets owing to fi nancial market instability, the desire for liquidity and high premiums on private infrastructure transactions, driving growth in popularity.
Private vs Public Market infrastructure By Stephen Mentzines
In theory, private-market infrastructure assets should be priced at discounts to their publicly-traded equivalents, given their illiquidity. This discount should present an opportunity for pension plans with typically
longer investment horizons to trade off liquidity for superior long-term returns. However, the exact opposite has been the case in recent years. Demand and supply dynamics for private-market infrastructure
have shifted such that many of these assets are being acquired at valuation premiums to their publicly-traded alternatives. Within the UK utilities sector, valuation differences have been quite pronounced. Despite the country’s highly developed regulatory regime which permits utilities to earn a set, fair return on their Regulated Asset Base (RAB –– which can be thought of as net
tangible assets) and regardless of ownership, valuation premiums paid over the past decade have persisted. The chart below highlights the extent to which private-market transaction valuations have exceeded trading multiples of two major regulated listed water utilities, with premiums of 20%-50% to underlying RAB. Such a valuation premium is at odds with the fundamental operating structure of UK utilities. Asset owners are very limited in their ability to achieve returns above OFWAT’s (the Regulator) prescribed level and any effi ciency gains are passed to consumers. Consequently, the fair value of these
utilities revolves around a small premium to their RAB. Clearly, a supply and demand for UK water utilities is in sharp dislocation. Other issues worthy of consideration for institutional investors include:• The intrinsic value of any long-dated asset is simply a function of its future cash fl ows and associated risks. Infrastructure assets’ cash fl ows tend to be very stable over time, hence intrinsic value tends to be predictable. However, being somewhat linked to stock market fl uctuations means investors have an opportunity to capitalise on mis-priced assets.
(Continued on page 9)
Listed infrastructure reversing the tide
I
UK Regulated Utilities ––RAB Premiums for Transactions
Source: MFG Asset Management company data and Deutsche Bank. The premium to RAB is calculated from the Enterprise Value to RAB multiple.

9
Private vs. Public Market Infrastructure By Stephen Mentzines(Continued from page 8)
The TEXPERS ® Pension Observer Spring 2016
diversifi ed by sector and geography has the potential to deliver investors gross returns of infl ation plus 5% - 6%. Such a return can be generated from either public-market or private-market infrastructure, but historical data suggests the listed market offers investors higher post-fee return prospects, combined with potentially lower risk. Public markets offer a signifi cantly broader opportunity set and benefi t from greater transparency, given the strict disclosure conditions imposed on listed entities. We would expect the trend between public and private markets to continue given current and foreseeable market conditions. For the full report, please visit www.mfgam.com.au
Stephen Mentzines is a Portfolio Manager (Infrastructure) at MFG Asset Management in Sydney, Australia.•1 Preqin Infrastructure Spotlight, January 2016
• Unlisted infrastructure assets are valued infrequently and the accuracy of accounting valuations is likely to decrease with the length of valuation intervals. By nature, this gives rise to investment risks, whereas listed infrastructure is valued in real-time on recognized stock exchanges.• Management costs –– Ongoing management fee levels for private-market infrastructure need to be justifi ed, particularly when comparing highly regulated assets and their public-market alternatives. The higher risks associated with private-market infrastructure places additional responsibilities on fi duciaries who need to be suitably skilled in this area.• Asset allocation impacts –– The management of illiquid assets within an overall asset allocation framework can introduce issues with maintaining proportionate weightings. Acquiring private-market assets takes time and a signifi cant
public-market rally or downturn can upset the balance in an overall portfolio and potentially exacerbate the cyclicality of portfolio returns. • Regulatory impacts –– Diversifi cation is particularly important as infrastructure returns can be signifi cantly impacted by regulatory outcomes. Highly undesirable return asymmetry can result when investments are concentrated within few assets and regulatory jurisdictions. Latent demand for private infrastructure assets may cause prices to remain infl ated for a sustained period. Preqin1 recently reported that there are over 170 unlisted infrastructure funds seeking new capital commitments totalling US$120bn. This is in on top of the US$108bn of capital already committed but not yet invested. Public or Private markets? Analysis suggests that applying a strict defi nition to listed infrastructure that is
TEXAS-BASED TEXAS-PROUD• Expertly Designed U.S. Equity Strategies
• $5 Billion in Assets Under Management
• Statistically Driven, Evidence-Based
Bridgeway Capital Management, Inc. 20 Greenway Plaza, Suite 450 | Houston, Texas 77046 713.661.3500 | bridgeway.com
YOUR HOUSTON-BASED CLIENT SERVICE TEAM:
Cindy Griffin, [email protected]
Tammira Philippe, [email protected]
Tamla Wilson [email protected]
7.375x5-ad.indd 4 12/21/15 9:56 AM

10 The TEXPERS ® Pension Observer Spring 2016
Invesco is proud to be a TEXPERS supporterAs a TEXPERS Associate Advisor, Invesco is committed to the Lone Star State, with more than:– 1,600 employees in Dallas, Houston and Austin– 70 Texas pension, foundation and endowment clients– 20 years of being entrusted with Texas retirement portfolios
Delia Roges, Managing DirectorPublic Funds Sales & Service TeamPhone: 415 445 [email protected]
Max Swango, Managing DirectorInvesco Real EstatePhone: 972 715 [email protected]
This page is provided by Invesco. This is not to be construed as an offer to buy or sell any financial instruments.
invesco.com/us

11The TEXPERS ® Pension Observer Spring 2016
Responsible Investing By Sandra Carlisle(Continued from page 1)
corporate governance has become a key area of investor and regulatory focus. While several countries are adopting corporate governance codes and best practice, the U.S. remains a challenging market. Many U.S. companies still continue to award executive compensation packages with no performance conditions attached. This could promote dangerous short termism and incentivize risk-taking. The combination of CEO and chair roles is also a concern, as is the length of board tenure, with critics of the current system concerned about a lack of diversity of thought and ‘seat blocking.’ What can investors do? In the U.S. market, where director and shareholder dialogue is often lacking, analysis, engagement and monitoring of such governance factors as board diversity, tenure and management incentive packages are all-the-more vital in order to ensure compa-nies will be able to withstand the inevitable challenges they will face in the 21st century global market place.
Sandra Carlisle is the Head of Responsible Investment at Newton Investment Management, a BNY Mellon company, in London, United Kingdom.•1 “The Impact of Corporate Sustainability on Or-ganizational Processes and Performance, National Bureau of Economic Research, working paper 17950, April 2014. http://www.nber.org/papers/w17950
responsibly. More specifically, they want to know if their investments are at risk of becoming ‘stranded.’ Stranded assets are investments which have suffered from unanticipated or premature write-downs or devaluations. This can come about as a result of changes in the market, for example if renewable energies became cheaper than fossil fuels, or via changes in the regulatory environment –– perhaps if governments implemented carbon emissions penalties. What Can Investors Do? Active investors have the power to address the issue of stranded assets both directly in their active investment decisions and through effective policy and regulatory level engagement. For example, investors could ask companies to demonstrate how demand might be affected if carbon costs increased and prices rose, or whether potential future climate legislation is budgeted into their models. Case study 2: Social ––Supply Chain Management in Bangladesh What are the risks? Following a number of fatal disasters at garment factories in Bangladesh, most notably Rana Plaza in 2013, there has been increased focus on supply chain standards.
National Real Estate Investor: Shadow Tenancy By W. Stephen Hagenbuckle(Continued from page 1)
Bangladesh is one of the cheapest places to manufacture globally, with many western retailers sourcing basic garments from the country.
The key risk to businesses and their investors is supply chain disruption. Companies with complex, opaque supply chains that do not effectively manage the risks this entails are vulnerable to unantici-pated increases in the living wage, intervention from unions or strike action, all of which could increase costs and decrease productivity. What Can Investors Do? While most companies acknowledge supply chain risk, very few offer trans-parency across their supply chain; therefore, company engagement is vital. One thing to look for is whether a company has established a
local sourcing office or if it sources via third parties. Employing local sourcing staff can improve supply chain visibility and avoid unauthorized subcontracting to cheaper factories with weaker standards. Case study 3: Corporate ––Governance in the U.S.What are the risks? Once a niche area of specialist interest,
The phenomenon of “shadow tenancy” is occurring in many different markets across the country, especially in places where the economy and the residential market has already recovered significantly. For investors experienced in distressed commercial real estate situations, this means now is the time to be buying.
W. Stephen Hagenbuckle is Founder, Managing Partner at TerraCap Management in Naples, FL.
The equivalent potential cap rate basis can be deep into double digits. One of our recent acquisitions in Florida, for example, was bought on per square-foot basis that translated into a 19 percent cap rate on net rents being signed now. Currently, there are signs of “shadow tenancy” in nearly every deal we look at. We recently purchased a non-performing loan on a portfolio of 228,000 sq. ft. of office and distribution space from a special servicer at a basis of about 40 percent of replacement cost. Several tenants had left during 2008 and 2009
and the property was only 55 percent occupied at acquisition. Before negotiating for the building, we identified numerous businesses in the area that had expressed interest in moving into the property but were waiting for a new, financially stable, owner. These included credit tenants such as Nestle, Home Depot, Staples and Red Bull. Once the deal closed we were able to negotiate leases with those tenants-in-waiting and the property is now 85 percent occupied seven months after closing.

12
(Continued on page 13)
The TEXPERS ® Pension Observer Spring 2016
Happy New Year! Chinese New Year, That is!By Mark Anson
he Chinese New Year began in February and this year it is the “Year of the Monkey.” Now, monkeys are well known for being unpredictable and mischievous animals, full of playfulness and hijinks. In fact, it is their mischievous nature that is responsible for the saying “throwing a monkey wrench” into an otherwise smooth operating process. Indeed, it seems as if a monkey wrench has been thrown into the global equity markets in 2016. We are mindful of the increased market volatility that we have all experienced as well as the recent downward trend of the equity markets. Globally, equity markets have declined approximately 8 to 14% since the beginning of the year. It is the combination of higher volatility and downward momentum that has caught investors’ attention. Ours, too. Yet, let’s take a step back. The Great Financial Recession ended almost precisely on April 1st, 2009 (April Fool’s Day—go fi gure). Since then we have been in an economic growth cycle fueled by massive Quantitative Easing from Central Banks on a scale never witnessed before. Added to this
Below we have charted the growth of earnings for the S&P 500 vs. the value of the S&P 500. And, guess what? Earnings matter! Ok, that may seem like an obvious point but if you look back to the years 1998-2000 you can see what an
asset bubble looks like. During the “dot-com” craze/insanity, earnings were ignored and the price of the stock market reached valuation heights that simply were not supported by the underlying cash fl ows of the constituent companies. Eventually, investors recognized that stock market values could not be sustained without earnings and the bubble burst. To have sustainable valuation growth in the equity markets, earnings must grow as well. If we consider an individual stock—Apple, for example—the price of Apple today is the
were the large budget defi cits racked up by the U.S. Federal Government as it stepped into the shoes of weakened consumers to shore up the U.S. economy. Trillion dollar defi cits (and then some) were the order of the day from 2009 through 2012. Other governments—the UK, France, Germany, Italy, etc.—also joined the defi cit expansion party. The key point is that we have been in a prolonged growth cycle for almost 7 years, pushed along by central banks driving interest rates down to zero and national governments willing to incur large budget defi cits to keep their respective economies in positive territory. At this point of a growth cycle, we should expect some form of speed bump to hit our fi nancial markets. A correction is a natural consequence at this level of asset values
T
Characteristics of a Maturing Market Cycle:
If earnings go up, the markets go up and vice versa

13The TEXPERS ® Pension Observer Spring 2016
stable cash fl ows and high dividends, typically demonstrate better performance at this point in the cycle. More to the point, when there is more volatility in the fi nancial markets, active management can play a more signifi cant role. Coming out of the Great Financial Recession, there were such strong tailwinds from quantitative easing and government spending that riding this wave of economic prosperity was an easier bet for all managers. When stock market values begin to tumble, active management can help to salvage some excess return keeping us up to this challenge and ready to deal with whatever “Monkey Business” the markets throw at us.
Mark Anson is Chief Investment Offi cer at Commonfund, in Wilton, CT.
Happy New Year! Chinese New Year, That is! By Mark Anson(Continued from page 12)
discounted value of Apple’s future expected for example—the price of Apple today is the discounted value of Apple’s future expected earnings. The same applies for the broader stock market—the value of the S&P today is the discounted value of the future earnings from the S&P constituent companies. Therefore, earnings must lead stock market values, not the other way around—as was the case during the tech bubble years. When looking at the chart, this is indeed the case—since 2001 earnings growth leads stock market values. As you look to year 2015 in the chart,
you will see that earnings growth is slowing down. It is still positive but not accelerating
at the same pace as in recent years. As a result, stock market values have come down as the market has digested slower earnings growth. We pay close attention to the earnings cycle: Not only do we look at the overall size of earnings for the S&P 500 but also whether earnings growth has hit a plateau. If so, stock market values will follow suit. It is at this time that we look to add managers
to our portfolio that can manage through a slower earnings trajectory. As one example, value managers, who invest in companies with
TEXPERS Summer Educational Forum
Basic Trustee Training • All Day Sunday, August 14 Note new date.
Golf Networking Event• Top Golf, San Antonio!
Registration Opening Soon
Save the Date!
August 14 - 16, 2016 Sunday - Tuesday Grand Hyatt Hotel • San Antonio, TX
Login at www. texpers.org. Don’t know your login credentials? Click “Forgot Password”
•
Get ready for the 85th Session of the Texas Legislature with an interactive workshop conducted by Joe Gagen, Legislative Grass Roots Trainer. Joe conducted an Advocacy Workshop for TEXPERS in 2015, where 100% of attendees rated him good or excellent. If you are passionate about protecting pensions, you won’t want to miss this
Lieutenant Col. Don Houk will provide a “living history” presentation about General James “Jimmy” Doolittle and Doolittle’s World War II Raid Over Tokyo. Houk, a volunteer for the Frontiers of Flight Museum, provides an interesting, entertaining and educational presentation.
Events Include• Keynotes and interactive workshops• Returning: Round Table Discussions: Share ideas and best practices with your peers.
Summer Forum Featured Speakers

14 The TEXPERS ® Pension Observer Spring 2016
They’re committed to serving us, and we’re committed to serving them.
For more information, please contact:
Nicholas T. StanojevManaging DirectorHead of U.S. Public Funds(617) [email protected]
Kelley GallagherDirectorPublic Fund Sales – Central(617) [email protected]
Assets under management as of 9/30/2015. BNY Mellon is the corporate brand of The Bank of New York Mellon Corporation and may also be used as a generic term to reference the Corporation as a whole or its various subsidiaries generally. With the exception Siguler Guff & Company (20%) and The Boston Company Asset Management, LLC (90%) all entities are wholly owned by BNY Mellon. Investment advisory services in North America are provided through four different SEC-registered investment advisers using the brand Insight Investment: Cutwater Asset Management Corp, Cutwater Investor Services Corp, Pareto New York LLC and Pareto Investment Management Limited. Not all products and services are offered in all locations. This material is not intended, and should not be construed, to be an offer or solicitation of services or products or an endorsement thereof in any jurisdiction or in any circumstance that is contrary to local law or regulation. The investment products and services mentioned here are not insured by the FDIC (or any other state or federal agency), are not deposits of or guaranteed by any bank, and may lose value.
Firefighters, teachers, police officers and municipal employees spend
their lives looking after us, so they deserve someone invested in
managing their retirement assets. The Public Funds Group within BNY
Mellon Investment Management is dedicated to serving the needs of
Public Funds. With over $1.6 trillion in assets under management, BNY
Mellon offers a wide range of investment capabilities. Our autonomous
investment boutiques are a leader in their specializations, backed by the
scale of America’s longest running financial institution. BNY Mellon is not
only committed, but proud to work with Public Funds.
©2015 The Bank of New York Mellon Corporation. NM20150269CPKL10 Exp: 6/2016
15
MARK YOURCALENDARS
Upcoming TEXPERS Conferences
•••2016 Summer Educational Forum
Grand Hyatt HotelSan Antonio, TX
August 14 - 16, 2016
•••28th Annual Conference
Hilton Austin HotelAustin, TX
April 9 - April 12, 2017
•••2017 Summer Educational Forum
Grand Hyatt Hotel San Antonio, TX
August 13 - 16, 2017
•••29th Annual Conference
South Padre Island, TX April 15 - April 18, 2018
•••2018 Summer Educational Forum
Grand Hyatt Hotel San Antonio, TX
August 12 - 15, 2018
•••30th Annual Conference
Hilton Austin HotelAustin, TX
April 7 - April 10, 2019
•••
unnecessary, and should definitely not be added to any Puerto Rico relief legislation,” Williams added. Snell also criticized Nunes for relying so heavily on the “expertise” of Professor Joshua Rauh, a professor of finance at Stanford Univer-sity and a senior fellow at the Hoover Institu-tion, a right-leaning public policy think tank. Rauh advised Nunes when he was first de-veloping PEPTA, and many of the Nunes sup-porting materials for PEPTA contain Rauh’s projections of the dates when state pension funds will “run out of money” and “pension payments to retirees will have to come out of general revenues.” The only problem is that no state pension funds are actually going to run out of money,
nor will they have to dip into general fund revenues. In fact, the Government Ac-countability Office (GAO) –– the independent watch-dog of Congress –– said in a 2012 report that Rauh’s projected dates of demise for public funds were based on assumptions that it found to be “unsupported.” Snell wrote that he found this finding to be “particularly delightful.” Yet, Nunes apparently con-tinues to count Rauh among the so-called “experts” who believe that state and local governments continue to understate their pension liabili-ties and need something like
PEPTA to avoid insolvency or, worse, a federal bailout in the coming decades. A federal bailout is also something PEPTA would outlaw.
additional reporting requirements or intro-duction of this new method of calculating unfunded pension liabilities is still needed,” Mike Belarmino, associate legislative director for finance and intergovernmental affairs for the National Association of Counties (NACo), wrote in a blog post. “Further, tying the ability to issue tax-ex-empt municipal bonds to these new burden-some requirements will have a significant negative impact on how state and local govern-ments serve the needs of constituents through infrastructure investment.” PEPTA would require state and local governmental plan sponsors to provide specific plan funding information to the Treasury De-partment, including a “Supplementary Report” that would restate the funding status of a plan by valuing assets at fair market value and by using certain Treasury ob-ligation yield curves in place of the plan’s expected rate of return to determine liabilities. Failure to do so would cause the offending state or political subdivision to lose federal tax benefits with respect to any state or local bond issue. Even though PEPTA has gained little traction over the past several years, it should not be considered “dead.” Some lawmakers and policy wonks have very short memories. Nunes’ attempt to tie the legislation to the Puerto Rico debt crisis is just the latest tactic to try to bring the bill to the front burner. In the wake of the Detroit bankruptcy in 2014, Nunes and others claimed that PEPTA could “stabilize” the nation’s public retirement systems, while protecting taxpayers from a costly bailout of state and local public pension funds. “Current Congressional offices could be easily influenced to support a new PEPTA bill if Nunes’ propaganda goes unchallenged,” Meredith Williams, executive director of the National Council on Teacher Retirement (NCTR), was quoted as saying by Leigh Snell, NCTR’s director of federal relations, in his March 15 federal blog posting. “That is why it is so important for NCTR members to be sure that they contact their Congressional delegations now, making it clear that PEPTA is dangerous and completely
The TEXPERS ® Pension Observer Spring 2016
WASHINGTON OUTLOOK By Matthew Aukofer (Continued from page 2)
-------On the Web at: http://nunes.house.gov/news/documentsingle.aspx?DocumentID=398577, http://nunes.house.gov/uploadedfiles/pepta__bill_text_2016.pdf, http://nunes.house.gov/legislation/pepta.htm, https://www.govtrack.us/congress/bills/browse?congress=__ALL__&text=%22Public%20Employees%20Pension%20Transparency%20Act%20%22%20#sort=relevance, http://www.naco.org/blog/reintroduction-public-employee-pension-legislation-expected-soon and http://www.naco.org/sites/default/files/documents/PPN%20Letter%20PEPTA_March%202016.pdf.

The TEXPERS ® Pension Observer Spring 2016
thornburg.com | 800.276.3930
We Can Offer Unique Solutions that FitPursuing investment opportunities worldwide.At Thornburg, we believe investing should have no borders. That’s why our array of income and capital appreciation strategies is designed to uncover opportunities anywhere in the world. Call us at 800.276.3930 to discuss our investment solutions.
Thornburg Investment Management is proud to be a TEXPERS supporter.
Reuters Menu Search
Editions: United States Go
U.S Mon Apr 18, 2016 | 7:00 PM EDT
CalPERS to study possible reinvestment in tobacco
X
By Robin Respaut
SACRAMENTO, Calif. (Reuters) - The California Public Employees' Retirement
System decided on Monday to review the potential impact of reinvesting in tobacco,
16 years after the pension fund dropped the controversial asset from its portfolio.
The move to review tobacco divestment by the largest U.S. pension fund has caught
the attention of health groups, industry shareholders, institutional investors and many
of CalPERS' beneficiaries across California.
Tobacco is the leading preventable cause of death in the United States, according to
the U.S. Department of Health and Human Services.
In 2015, Wilshire Associates reported that the majority of CalPERS’ divestment
initiatives had reduced the pension fund’s portfolio returns.
Specifically, excluding tobacco had cost an estimated $2 billion to $3 billion, Wilshire
found, a considerably larger portfolio impact than CalPERS’ other divested assets,
such as Iran, Sudan and certain firearm-related companies.
ADVERTISEMENT
The question to review the tobacco divestment divided CalPERS’ board into two
camps - those who favored a review and those who preferred to drop the discussion
altogether and remain divested.
The majority favored a study that considered the broader financial and economic
impact of reinvesting in tobacco.
Board members said the decision would not necessarily result in CalPERS ultimately
reinvesting some of its roughly $293 billion portfolio back into tobacco. Instead, the
study would be performed as part of the board's fiduciary duty.
“No one should read into this any interest in reinvesting in tobacco,” CalPERS board
member Bill Slaton told a board meeting.
CalPERS will take the next 12 to 24 months to examine the issue before taking any
action on a possible tobacco reinvestment.
(Reporting by Robin Respaut; Editing by Peter Cooney)
X
SPONSORED STORIES
SPONSORED CONTENT Follow Us On TwitterFollow Us On FacebookFollow Us On LinkedInFollow Us On
Google+Follow Us Via RSS
Subscribe to Newsletters | Download our Apps
Feedback | Advertise with Us | Site Index | Terms of Use | Privacy Policy | Ad
Choices
News and Media Division of Thomson Reuters
Thomson Reuters is the world's largest international multimedia news agency, providing investing news, world news, business news, technology news, headline news, small business news, news alerts, personal finance, stock market, and mutual funds information available on Reuters.com, video, mobile, and interactive television platforms. Thomson Reuters journalists are subject to an Editorial Handbook which requires fair presentation and disclosure of relevant interests.
NYSE and AMEX quotes delayed by at least 20 minutes. Nasdaq delayed by at least 15 minutes. For a complete list of exchanges and delays, please click here.
© 2016 Reuters All Rights Reserved