Medizinische Hochschule
262
Medizinische Hochschule Hannover Klinik für Strahlentherapie und Spezielle Onkologie Arbeitsgruppe Experimentelle Radioonkologie Impact of the DNA damage response in clinical and cellular radiosensitivity of cancer patients INAUGURALDISSERTATION zur Erlangung des Grades einer Doktorin der Naturwissenschaften – Doctor rerum naturalium – (Dr. rer. nat.) vorgelegt von Katharina Neuhäuser geboren in Braunschweig Hannover 2017
-
Upload
khangminh22 -
Category
Documents
-
view
3 -
download
0
Transcript of Medizinische Hochschule
Medizinische Hochschule Hannover
Klinik für Strahlentherapie und Spezielle Onkologie
Arbeitsgruppe Experimentelle Radioonkologie
Impact of the DNA damage response
in clinical and cellular
radiosensitivity of cancer patients
INAUGURALDISSERTATION
zur Erlangung des Grades einer Doktorin der Naturwissenschaften
– Doctor rerum naturalium –
(Dr. rer. nat.)
vorgelegt von
Katharina Neuhäuser
geboren in Braunschweig
Hannover 2017

2
Angenommen durch den Senat: 12.04.2018
Präsident: Prof. Dr. med. Christopher Baum
Wissenschaftliche Betreuung: Prof. Dr. med. Hans Christiansen
Wissenschaftliche Zweitbetreuung: Prof.‘in Dr. med. vet. Teruko Tamura-Niemann
1. Referent: Prof. Dr. med. Hans Christiansen
2. Referent: Prof.‘in Dr. med. vet. Teruko Tamura-Niemann
3. Referent: Prof. Dr. rer. nat. Ulrich Lehmann-Mühlenhoff
Tag der mündlichen Prüfung: 12.04.2018
Prüfungsausschuss
Vorsitz: Prof. Dr. rer. nat. Immo Prinz
1. Prüfer: Prof. Dr. med. Hans Christiansen
2. Prüfer: Prof.‘in Dr. med. vet. Teruko Tamura-Niemann
3. Prüfer: Prof. Dr. rer. nat. Ulrich Lehmann-Mühlenhoff

3
Diese Arbeit ist meiner Familie und dem Anderen gewidmet

4
Table of contents Index of Figures and Tables ....................................................................................................... 8
Figures ........................................................................................................................................ 8
Tables ......................................................................................................................................... 9
Supplementary figures .............................................................................................................. 9
List of abbreviations ................................................................................................................. 12
Publications and contributions ................................................................................................ 15
Summary .................................................................................................................................. 16
Zusammenfassung .................................................................................................................... 18
1 Introduction part 1: The DNA damage response .............................................................. 20
1.1 Forms of DNA lesions and repair pathways .............................................................. 20
1.1.1 DNA single-strand break repair of replication-associated DNA damage ........... 22
1.1.2 DNA double-strand break repair ........................................................................ 24
1.2 The cell cycle and checkpoint control ....................................................................... 26
1.3 Apical kinases of the DNA damage response ............................................................ 28
1.3.1 ATR in DNA repair and checkpoint control ........................................................ 29
1.3.2 ATM in DNA repair and checkpoint control ....................................................... 29
1.3.3 Crosstalk of ATR and ATM in DNA repair and checkpoint control ..................... 33
1.4 The Fanconi anemia (FA) pathway ............................................................................ 34
1.4.1 Genetic heterogeneity of Fanconi anemia ......................................................... 34
1.4.2 The FA pathway in crosslink repair .................................................................... 34
1.4.3 Bridging of the FA pathway with other DNA repair mechanisms ...................... 35
1.5 The translationally controlled tumor protein as new player in DNA repair .............. 36
2 Introduction part 2: Individual radiosensitivity in cancer treatment ............................... 37
2.1 Cancer ........................................................................................................................ 37
2.2 Breast cancer ............................................................................................................. 38
2.2.1 Genetic predisposition and familial breast cancer ............................................ 38
2.2.2 Breast cancer subtypes and triple negative breast cancer ................................ 39
2.3 The relationship between cancer and radiosensitivity ............................................. 40
2.3.1 Benefits and drawbacks of irradiation treatment .............................................. 40
2.3.2 Molecular basis of radiation therapy ................................................................. 41
2.3.3 Adverse effects on healthy tissues ..................................................................... 41
2.3.4 Chemoradiosensitivity ........................................................................................ 43
2.3.5 Known radiosensitivity syndromes and inflicted genes ..................................... 44
2.3.6 Different forms of cell death following irradiation ............................................ 47
5
2.4 Related work on characterization of individual radiosensitivity ............................... 48
2.5 Previous and related work on TPT1 in breast cancer and ATM signaling ................. 52
2.5.1 TPT1 as a candidate BC susceptibility gene ....................................................... 52
2.5.2 The proposed role of TPT1 in ATM signaling ..................................................... 52
2.6 Hypothesis and aims of this project .......................................................................... 53
3 Material and methods ...................................................................................................... 56
3.1 Material ..................................................................................................................... 56
3.1.1 Cell lines .............................................................................................................. 56
3.1.2 Antibodies .......................................................................................................... 58
3.1.3 Plasmids and kits ................................................................................................ 59
3.1.4 Chemicals ........................................................................................................... 60
3.1.5 Enzymes and siRNAs ........................................................................................... 62
3.1.6 Medium and other materials ............................................................................. 62
3.1.7 Buffers and solutions .......................................................................................... 63
3.1.8 Devices and disposables ..................................................................................... 65
3.1.9 Software ............................................................................................................. 68
3.1.10 Gene Nomenclature ........................................................................................... 68
3.2 Cell culture methods.................................................................................................. 68
3.2.1 Culture, counting and cryopreservation of cells ................................................ 68
3.2.2 Telomerase reverse transcriptase immortalization ........................................... 70
3.2.3 Mycoplasm treatment ........................................................................................ 71
3.2.4 Reverse transfection and siRNA silencing .......................................................... 72
3.2.5 ATM inhibition .................................................................................................... 72
3.2.6 Irradiation ........................................................................................................... 72
3.2.7 Lysate preparation and immunoblotting ........................................................... 72
3.2.8 Sodium dodecyl sulfate polyacrylamide gel electrophoresis and western blot 73
3.2.9 Immunocytochemistry and pre-extraction ........................................................ 75
3.2.10 Image processing and foci analyses ................................................................... 76
3.2.11 Colony survival assay .......................................................................................... 77
3.2.12 Senescence assay ............................................................................................... 77
3.3 Other methods .......................................................................................................... 78
3.3.1 Statistics ............................................................................................................. 78
3.3.2 Patients ............................................................................................................... 79
3.3.3 DNA extraction ................................................................................................... 79
3.3.4 Exome sequencing .............................................................................................. 80
3.3.5 Primer design and polymerase chain reaction ................................................... 81
6
3.3.6 Agarose gel electrophoresis ............................................................................... 82
3.3.7 Sanger sequencing ............................................................................................. 82
3.3.8 Bioinformatics .................................................................................................... 83
4 Results ............................................................................................................................... 85
4.1 Assessment of TPT1 as candidate radiosensitivity marker in ATM signaling ............ 85
4.1.1 TPT1 does not affect early ATM signaling after irradiation ............................... 85
4.1.2 Intracellular distribution of TPT1 does not change after irradiation ................. 86
4.1.3 Limited colocalization of TPT1 with γH2AX foci after irradiation ...................... 87
4.1.4 Knockdown of TPT1 does not impair formation of γH2AX foci after irradiation 88
4.2 Assessment of the functional relationship between clinical and cellular radiosensitivity...................................................................................................................... 90
4.2.1 The genetic signature of radiosensitivity ........................................................... 90
4.2.2 Annotation of exome sequencing data by GeneCards ...................................... 90
4.2.3 Ingenuity Pathway Analysis ................................................................................ 92
4.2.4 Reactome Pathway Analysis and comparison of annotation tools ................. 102
4.2.5 Validation of exome sequencing data .............................................................. 104
4.3 Generation of cell cultures and functional assays ................................................... 105
4.3.1 Immortalization of primary skin fibroblasts from RS BC patients .................... 105
4.4 Functional studies in TERT immortalized cells of RS BC patients ............................ 107
4.4.1 ATM signaling after irradiation ........................................................................ 107
4.4.2 Kinetics of DNA damage recognition and repair in TERT immortalized cells of RS BC patients ...................................................................................................................... 108
4.4.3 Previous studies on RAD51 foci formation in primary RS cells and comparison to results obtained with TERT RS cells ............................................................................ 110
4.4.4 Colony survival after irradiation as functional endpoint ................................. 111
4.4.5 Irradiation-associated senescence as functional endpoint.............................. 114
5 Discussion ........................................................................................................................ 117
5.1 TPT1 as candidate marker for individual radiosensitivity ....................................... 117
5.1.1 No evidence for a role of TPT1 in early ATM signaling .................................... 117
5.1.2 No evidence for nuclear translocation or chromatin binding of TPT1 upon irradiation ........................................................................................................................ 118
5.1.3 No evidence for an effect of TPT1 on foci formation and resolution after irradiation ........................................................................................................................ 119
5.1.4 No evidence for elevation of TPT1 levels in breast cancer cell lines ............... 120
5.1.5 The effect of TPT1 on DNA damage sensing and repair might depend on cell type 121
5.2 Exome sequencing as tool to identify the genetic background of RS ..................... 122
7
5.2.1 Annotation by GeneCards reveals strong inter-individual variability in RS patients 123
5.2.2 Mutations in Cancer and DNA repair genes correlate with individual RS ....... 124
5.2.3 Association of cancer and DNA damage response genes in RS patients by IPA 126
5.2.4 Cancer and DNA damage response genes associate to clinical RS and not solely to cancer malady ............................................................................................................. 127
5.3 Functional studies in cells from radiosensitive patients ......................................... 132
5.3.1 Early ATM signaling is functional in TERT immortalized fibroblasts of RS BC patients 133
5.3.2 Repair up to 48 h after IR is efficient in TERT immortalized fibroblasts of RS BC patients 135
5.3.3 Mutational background of MC3 and MC7 correlates with RAD51 foci formation defects 136
5.3.4 Cellular RS is associated with clinical RS according to colony survival ............ 138
5.3.5 RS may manifest downstream of DSB recognition through cellular senescence
140
5.4 Impact of the DNA damage response on clinical and cellular RS ............................ 145
6 Conclusions and perspectives ......................................................................................... 147
7 References ...................................................................................................................... 152
8 Supplementary information ............................................................................................ 200
9 Acknowledgement .......................................................................................................... 259
10 Curriculum Vitae .......................................................................................................... 260
Electronic appendix ................................................................................................................ 263

8
Index of Figures and Tables
Figures
Figure 1 Overview showing forms of DNA lesions and the corresponding DNA damage
responses.................................................................................................................................. 21
Figure 2 Cell cycle phases and checkpoints ............................................................................. 28
Figure 3 ATM signaling after ionizing radiation shown as intracellular pathway by Ingenuity
Pathway Analysis ...................................................................................................................... 32
Figure 4 Distinct roles for ATR and ATM in checkpoint control ............................................... 33
Figure 5 Estimated new cancer cases and deaths in the USA in 2017, adapted from Siegel et
al.288 .......................................................................................................................................... 38
Figure 6 The relationship between cancer and radiosensitivity .............................................. 40
Figure 7 The toxicity of radiotherapy ....................................................................................... 43
Figure 8 Forms of cell death in cancer or healthy cells triggered by irradiation ..................... 48
Figure 9 TPT1 in DNA repair modified from Zhang et al, 2012264 and elevated levels in A-T
LCLs ........................................................................................................................................... 53
Figure 10 Cellular mechanisms following irradiation-induced DNA damage .......................... 54
Figure 11 Structure of this project ........................................................................................... 55
Figure 12 P-value of overlap calculation in Ingenuity Pathway Analysis by Fisher’s Exact Test .................................................................................................................................................. 79
Figure 13 Knockdown of TPT1 does not influence ATM signaling by means of KAP1 (Ser824)
phosphorylation ....................................................................................................................... 85
Figure 14 No evidence for colocalization of TPT1 and γH2AX in ADP and MCF10A cells ........ 87
Figure 15 γH2AX foci numbers in TPT1 knockdown cells after irradiation .............................. 89
Figure 16 Workflow for characterization of individual radiosensitivity using patient material
.................................................................................................................................................. 90
Figure 17 GeneCards annotation of genes with truncating mutations in RS patients ............ 91
Figure 18 Comparative IPA analyses between RS cancer patients .......................................... 92
Figure 19 IPA upstream analysis results of RS patients ........................................................... 93
Figure 20 Overlapping genes of datasets for comparison between cancer patients .............. 95
Figure 21 Comparative IPA analyses between cancer patients ............................................... 96
Figure 22 Pathways of interest in comparison analyses of RS BC, BC and Fam BC patient
groups in IPA ............................................................................................................................. 97
Figure 23 Subcelluar view of genes associated with DNA repair sub-pathways by comparative
IPA analyses .............................................................................................................................. 98
Figure 24 Canonical pathways in comparative analyses of RS BC, BC and Fam BC groups ... 100
Figure 25 Comparative IPA analyses with single patients in RS BC, BC and Fam BC groups . 102
Figure 26 Comparison of annotation methods: DNA repair pathway ................................... 103
Figure 27 Comparison of annotation tools for DNA repair, cancer and immune system genes
................................................................................................................................................ 104
Figure 28 Immortalization of MC1, MC3 and MC7 primary fibroblasts with TERT................ 106
Figure 29 Mutations in DNA repair genes in RS BC patients MC1, MC3 and MC7 ................ 106
Figure 30 ATM targets CHEK2 and KAP1 after irradiation in RS BC TERT cells ...................... 108
Figure 31 γH2AX and 53BP1 foci kinetics in TERT immortalized RS BC cells after irradiation
................................................................................................................................................ 109
Figure 32 Colony survival of TERT immortalized MC1, MC3 and MC7 cells after irradiation
compared to BJ5TA ................................................................................................................ 111

9
Figure 33 Time course of colony formation assay in TERT immortalized MC1, MC3 and MC7
cells ......................................................................................................................................... 113
Figure 34 Pilot experiment to determine senescence after irradiation in TERT immortalized
RS BC cell lines ........................................................................................................................ 114
Figure 35 Irradiation-associated senescence in MC3 TERT cells compared to BJ5TA ........... 115
Figure 36 Network for genes that were identified or further characterized in this breast
cancer study ........................................................................................................................... 129
Figure 37 Proposed model of RS as consequence of DNA repair defects and senescence ... 142
Figure 38 Possible impact of HERC2, RAD51C and ABL1 mutations on RS related to ATM
signaling .................................................................................................................................. 144
Figure 39 Possible mechanism of DNA repair defects leading to radiosensitivity ................ 148
Figure 40 Early and late forms of cell death leading to failure of clonogenic survival after
irradiation ............................................................................................................................... 149
Figure 41 Conclusions and suggestions on follow-up studies ................................................ 151
Tables
Table 1 Examples of cancers treated with radiation therapy (modified from Baskar et al.275)
.................................................................................................................................................. 41
Table 2 Chromosome breakage and radiosensitivity syndroms .............................................. 44
Table 3 Cell lines used in this project as described in this thesis ............................................. 56
Table 4 Cell lines used in this project as previously published ................................................ 57
Table 5 Primary antibodies ....................................................................................................... 58
Table 6 Secondary antibodies .................................................................................................. 59
Table 7 Plasmids and kits ......................................................................................................... 59
Table 8 Chemicals ..................................................................................................................... 60
Table 9 Enzymes and siRNAs .................................................................................................... 62
Table 10 Medium and other materials used in this work ........................................................ 62
Table 11 Buffers and solutions prepared and used in this project .......................................... 63
Table 12 Devices and disposables ............................................................................................ 65
Table 13 Software used in this project ..................................................................................... 68
Table 14 Culture and cryopreservation conditions of cell cultures ......................................... 70
Table 15 Composition of western blot gels .............................................................................. 74
Table 16 Fluorescence microscopy devices and parameters ................................................... 76
Table 17 Microscope settings used for foci images ................................................................. 76
Table 18 PCR protocol for primer optimization and validation sequencing ............................ 82
Table 19 Cycling conditions for sequencing reaction .............................................................. 83
Table 20 P-values of senescence analysis in radiosensitive cell cultures after irradiation
compared to BJ5TA ................................................................................................................ 115
Table 21 P-values of senescence analysis in MC3 TERT cells compared to BJ5TA control .... 116
Table 22 Clinical data on RS BC patients showing variability of side-effect manifestation ... 124
Supplementary figures
Supplementary figure S-1 No alterations in TPT1 levels after IR in different cell systems and
no effect of TPT1 knockdown on p-CHEK2 Ser19 levels after IR ........................................... 201
Supplementary figure S-2 No changes in TPT1 levels after ATM inhibition and no chromatin
binding after IR ....................................................................................................................... 202

10
Supplementary figure S-3 No evidence for colocalization of TPT1 and γH2AX or decreased
γH2AX foci numbers after TPT1 knockdown .......................................................................... 203
Supplementary figure S-4 No evidence for nuclear translocation of TPT1 in ADP or
colocalization with γH2AX after IR in HCC1937 cells ............................................................. 204
Supplementary figure S-5 Immunostainings of TPT1 and RAD51 in BJ5TA and MC3 TERT cells
after irradiation ...................................................................................................................... 205
Supplementary figure S-6 Secondary antibody controls for immunostainings ..................... 206
Supplementary figure S-7 No changes in 53BP1 foci numbers after IR in TPT1 knockdown
cells compared to controls ..................................................................................................... 211
Supplementary figure S-8 Complete IPA core analysis results of all RS patients .................. 230
Supplementary figure S-9 Complete IPA core analysis results of RS BC patients .................. 231
Supplementary figure S-10 Complete IPA core analysis results of RS patients with other
cancers .................................................................................................................................... 232
Supplementary figure S-11 Complete IPA core analysis results of all Chemo RS patients .... 233
Supplementary figure S-12 Mechanistic networks found in RS patients by Ingenuity Pathway
Analysis ................................................................................................................................... 234
Supplementary figure S-13 Complete IPA core analysis results of BC patients ..................... 235
Supplementary figure S-14 Complete IPA core analysis results of Fam BC patients ............. 236
Supplementary figure S-15 IPA heatmaps of “Cancer” and “Organismal Injury and
Abnormalities” in RS patients ................................................................................................ 237
Supplementary figure S-16 “Neurological disease”, “Reproductive system disease” and “Dermatological diseases and conditions” IPA hits in RS patients ........................................ 238
Supplementary figure S-17 IPA heatmaps of “Cancer” and “Organismal Injury and
Abnormalities” in RS BC patients ........................................................................................... 239
Supplementary figure S-18 IPA heatmaps of “Cancer” and “Organismal Injury and
Abnormalities” in BC patients ................................................................................................ 240
Supplementary figure S-19 IPA heatmaps of “Cancer” and “Organismal Injury and
Abnormalities” in Fam BC patients ........................................................................................ 241
Supplementary figure S-20 IPA heatmaps of “Reproductive system disease” and “Neurological Disease” in RS BC patients............................................................................... 242
Supplementary figure S-21 IPA heatmap of “Hereditary Disorder” in Fam BC patients ....... 242
Supplementary figure S-22 IPA comparison analyses between groups with unique genes .. 244
Supplementary figure S-23 Canonical pathways in comparative analyses of unique genes
from RS BC, BC and Fam BC groups........................................................................................ 245
Supplementary figure S-24 Predicted effects of the mutations in ABL1 and FANCL of patient
MC7 on protein sequence ...................................................................................................... 252
Supplementary figure S-25 Predicted effects of the mutations in RAD51C and RBBP6 of
patient MC3 on protein sequence or intronic ....................................................................... 253
Supplementary figure S-26 Predicted effects of the mutations in HERC2 of patient MC1 and
NPAT of patient MC7 on protein sequence or splice site ...................................................... 253
Supplementary figure S-27 RAD51 foci analysis in primary and immortalized RS cells ........ 254
Supplementary figure S-28 CSA in 6well plates with different coating ................................. 255
Supplementary figure S-29 No colony growth in 6-well plates and change of morphology of
MC3 TERT cells ....................................................................................................................... 256
Supplementary figure S-30 Senescence assay results analyzed by Mann-Whitney test and
fitted for exponential decay ................................................................................................... 257
Supplementary figure S-31 Comparison of aging genes with exome sequencing results of
cancer patients ....................................................................................................................... 258

11
Supplementary tables
Supplementary table S-1 Clinical data of radiosensitive patients and two matched pairs ... 200
Supplementary table S-2 Raw data of γH2AX foci after TPT1 knockdown and irradiation ... 207
Supplementary table S-3 Raw data of 53BP1 foci countings in ADP and MCF10A after TPT1
knockdown ............................................................................................................................. 211
Supplementary table S-4 Mutations that occurred in the same genes in more than one
patient .................................................................................................................................... 212
Supplementary table S-5 Identical mutations that occurred in at least two patients .......... 213
Supplementary table S-6 Mutations identified by exome sequencing and subjected to
validation sequencing............................................................................................................. 214
Supplementary table S-7 Mutations identified by exome sequencing that failed validation 221
Supplementary table S-8 Mutations identified by exome sequencing that were not subjected
to validation sequencing ........................................................................................................ 223
Supplementary table S-9 Genes identified in DNA replication, recombination and repair by
IPA........................................................................................................................................... 243
Supplementary table S-10 IPA definitions of DNA repair subpathways and underlying
references ............................................................................................................................... 243
Supplementary table S-11 Canonical pathway p-values of comparative IPA analysis .......... 246
Supplementary table S-12 Canonical pathway p-values of comparative IPA analysis after DNA
repair filtering ......................................................................................................................... 246
Supplementary table S-13 First 40 Hits of Diseases and Biofunctions p-values of comparative
IPA analyses after DNA repair filtering ................................................................................... 247
Supplementary table S-14 Comparison of annotation methods: cancer .............................. 248
Supplementary table S-15 Comparison of annotation methods: immune system ............... 249
Supplementary table S-16 P-values of densitometric analyses performed for results
discussed in 4.4.1 ................................................................................................................... 249
Supplementary table S-17 P-values of γH2AX foci corresponding to Figure 31 .................... 251
Supplementary table S-18 P-values of 53BP1 foci corresponding to Figure 31 .................... 252
Supplementary table S-19 Raw data pilot experiment senescence after irradiation ............ 256
Supplementary table S-20 Raw data senescence after irradiation in BJ5TA and MC3 TERT
cells ......................................................................................................................................... 256

12
List of abbreviations
Abbreviation Explanation
10H 10 µg/ml hygromycin B
5FU 5 Fluorouracil
9-1-1 Heterotrimeric complex
composed of RAD1, RAD9
and HUS1
A Adenine
AP Apurinic-apyrimidinic
ATCC American Type Culture
Collection
ATLD Ataxia-telangiectasia-like
disorder
ATM Ataxia Telangiectasia
Mutated
BC Breast cancer
BER Base excision repair
bp Base pair
BSA Bovine serum albumine
C Cytosine
CB Cajal body
CDK(s) Cyclin-dependent
kinase(s)
CFS Common fragile sites
cGy Centigray
cm² Square centimeter
CML Chronic myeloid
leukemia
CS Cockayne syndrome
CSA Colony survival assay
CT Computed tomography
CTCAE v3.0 Common Terminology
Criteria for Adverse
Effects version 3.0
DAPI Diamidino-2-
phenylindole
ddH2O Double-distilled water
ddNTP di-desoxyribonucleoside
triphosphates
DDR DNA damage response
DMEM Dulbecco's modified
Eagle‘s medium DMSO Dimethyl sulfoxide
DNA Deoxyribonucleic acid
dNTP desoxyribonucleoside
triphosphates
DSB Double-strand break
Abbreviation Explanation
dsDNA Double-stranded DNA
DTT Dithiothreitol
e.g. exempli gratia
EBV Epstein–Barr virus
ECL Enhanced
chemiluminescence
EDTA Ethylenediaminetetraace
tate
EGTA Ethyleneglycoltetraacetat
e
FA Fanconi anemia
Fam Familial
Fam BC Familial breast cancer
FCS Fetal calf serum
FITC Fluorescein
isothiocyanate
g Gram
G Guanine
G1 Gap1
G2 Gap2
GFP Green fluorescent
protein
GGR Global genome repair
Gln L-glutamine
GWAS Genome-wide
association study
gy Gray
h Hour/hours
HCl Hydrochloric acid
HeLa (cells) Henrietta Lacks
HLA Human leukocyte antigen
(cluster)
HPLC High-performance liquid
chromatography
A-T Ataxia-telangiectasia
HR Homologous
recombination
ICC Immunocytochemistry
ICL Inter-strand crosslinks
IgG Immunoglobulin G
IPA Ingenuity Pathway
Analysis
IR Irradiation
KCl Potassium chloride
kDa Kilodalton
13
Abbreviation Explanation
kg Kilogram
l Liter
LCL Lymphoblastoid cell line
LENT SOMA Late Effects Normal
Tissues: Subjective,
Objective, Management
and Analytic
M Mole
M (cell cycle) Mitosis
M1 Mortality stage 1
M2 Mortality stage 2
MAF Minor allele frequency
MC Mamma carcinoma
MEGM Mammary Epithelial Cell
Growth Medium
mg Milligram
mGy Milligray
min Minute/minutes
ml Milliliter
mm Millimeter
mM Millimole
MMC Mitomycin C
MMS Methyl-methane
sulfonate
MR Mismatch repair
MRN MRE11A-RAD50-NBN
MU Monitor unit
(radiotherapy)
MVX Energy of X-radiation
N Number of experiments
Na Sodium
NaCl Sodium chloride
NaF Sodium fluoride
NBS Nijmegen breakage
syndrome
NCI National Cancer Institute
NER Nucleotide excision
repair
NGS Normal goat serum
NHEJ Non-homologous end
joining
nm Nanometer
OMICS Biological studies ending
in omics, e.g. proteomics
OR Human olfactory cluster
P Phosphor
PAGE Polyacrylamide gel
Abbreviation Explanation
electrophoresis
PBS Phosphate-buffered
saline
PCR Polymerase chain
reaction
PEG Polyethylene glycol
pen Penicillin
pH pondus Hydrogenii
(potential of hydrogen)
pmol Picomole
PMSF Phenylmethansulphanylfl
uoride
RAPADILINO Radial ray defect, both
patellae hypoplasia or
aplasia and cleft or highly
arched palate, diarrhea
and dislocated joints,
little size and limb
malformations, long,
slender nose and normal
intelligence
RIDDLE Radiosensitivity,
immunodeficiency,
dysmorphic features and
learning difficulties
RNA Ribonucleic acid
ROS Reactive oxygen species
rpm Rounds per minute
RPMI Roswell Park Memorial
Institute
RS Radiosensitivity/radiosen
sitive/radiation
sensitivity
RS BC Radiosensitivity, breast
cancer
Rs-number Reference SNP ID
number
RT Radiotherapy
RTOG Radiation Therapy
Oncology Group
S (phase) Synthesis (phase)
SASP Senescence-associated
secretory phenotype
SCC Squamous cell carcinoma
Scr Scrambled
SD Standard deviation
SDS Sodium dodecylsulfate

14
Abbreviation Explanation
Ser serine
SIFT Sorting Intolerant From
Tolerant
siRNA Short interfering RNA
SNP Single-nucleotide
polymorphism
SSB Single-strand break
ssDNA Single-stranded DNA
Strep Streptomycin
SV40 Simian virus 40
T Thymine
TBE Tris/Borate/EDTA
TCR Transcription-coupled
repair
TDD Trichothiodystrophy
(group A)
TE Tris/EDTA
TEMED Tetramethylethylenedia
mine
TERT Telomerase Reverse
Transcriptase
Abbreviation Explanation
Thr Threonine
TNBC (cell
lines)
Triple negative breast
cancer
TTD Trichothiodystrophy
U Units
U/ml Units per milliliter
UV Ultraviolet
V(D)J
(recombinatio
n)
variable (V), diversity (D)
joining (J), gene
segments.
v/v Volume per volume
w/v Weight per volume
WB Western blot
WT Wildtype
Xg Multiple of gravitational
acceleration
XP Xeroderma pigmentosum
β-Gal β-Galactosidase
γ IR Gamma irradiation
λ Wavelength (Lamda)

15
Publications and contributions
Journal article:
Pfeifer K, Schürmann P, Bogdanova N, Neuhäuser K, Kostovska IM, Plaseska-Karanfilska D, Park-Simon TW, Schindler D, Dörk T Frameshift variant FANCL*c.1096_1099dupATTA is not
associated with high breast cancer risk. Clinical Genetics 2016:n/a-n/a. doi:
10.1111/cge.12837.
Conference paper and oral presentation:
Neuhäuser K, Bogdanova N, Bhuju S, Geffers R, Christiansen H, Dörk T, Rave-Fränk M
Mutation in FANCO/RAD51C, but not FANCL, is Associated with Clinical and Chromosomal
Radiosensitivity. Experimentelle Strahlentherapie und Klinische Strahlenbiologie, 2016:31-37.
Conference paper and poster presentation:
Neuhäuser K, Bogdanova N, Borgmann K, Dahm-Daphi J, Schindler D, Christiansen H, Dörk T
Evidence for elevated basal levels of TPT1, but no induction after irradiation, in
lymphoblastoid cells from individuals with increased clinical radiosensitivity.
Experimentelle Strahlentherapie und Klinische Strahlenbiologie, 2017:24-30.
Bogdanova N, Jguburia N, Neuhäuser K, Wieland B, Stamm G, Wacker F, Christiansen H,
Dörk T Chromosomal radiosensitivity of breast epithelial cells and lymphocytes in repeated
diagnostic CT scans. International Wolfsberg Meeting on Molecular Radiation
Biology/Oncology, Ermatingen, Switzerland, 2017:36.
Manuscripts:
Neuhäuser K, Küper L, Bogdanova N, Willers M, Wieland B, Christiansen H, Dörk T.
Assessment of the role of TPT1 in ATM signaling and breast cancer susceptibility. Radiation
research (accepted with major revision requirements)
Bogdanova N, Jguburia N, Neuhäuser K, Wieland B, Stamm G, Wacker F, Christiansen H,
Dörk T. Chromosomal radiosensitivity of breast epithelial cells and lymphocytes in
repeated diagnostic CT scans. International Journal of Radiation Oncology* Biology* Physics
(in review)

16
Summary
Katharina Neuhäuser
Impact of the DNA damage response in clinical and cellular radiosensitivity of cancer patients
Adverse effects of radiotherapy occur in 5–10 % of cancer patients ranging from acute
effects like skin burns and inflammation to late effects of vascular tissue damage or
infertility. These reactions are not predictable at present which limits effective treatment of
non-responders due to uniform application of insufficiently low doses. The aim of this thesis
was to investigate genetic and cellular mechanisms underlying normal tissue toxicity. Three
different objectives were followed in order to identify biomarkers of radiation sensitivity
(RS), which all focused on the role of the DNA damage response.
Firstly, the impact of the translationally controlled tumor protein 1 (TPT1), a new player in
DNA repair, on Ataxia-Telangiectasia mutated (ATM) signaling was investigated in breast
epithelial cells (MCF10A) and SV40 immortalized human fibroblasts (ADP). Silencing of TPT1
had no significant effect on early ATM signaling 30 min after irradiation (IR) by
phosphorylation of CHEK2 (Ser19) and KAP1 (Ser824) as investigated by western blot (WB).
Consistently, no nuclear translocation of TPT1 or foci formation of TPT1 after IR was
observed in several cell lines by immunocytochemistry (ICC) or cellular fractionization.
Moreover, ATM inhibition prior to IR neither affected the TPT1 level nor the intracellular
distribution of TPT1 and no significant colocalization of TPT1 with γH2AX foci or chromatin
binding after IR was observed. The formation and resolution of γH2AX and 53BP1 foci after
IR revealed little differences after TPT1 silencing, although ADP, but not MCF10A, cells
showed a marginally significant effect of TPT1 on residual γH2AX foci numbers at 24 h after
IR. Altogether, TPT1 does not play an essential role in the recognition and repair of radiation-
induced chromosome breaks and therefore was not further considered as RS biomarker
candidate in the context of the DNA damage response.
Secondly, unraveling the genetic fingerprint of RS cancer patients was addressed by exome
sequencing. 19 patients with adverse reactions, a majority graded 3 by RTOG (Radiation
Therapy Oncology Group) classification, and two BC control patients were analyzed and
results filtered for genes with truncating mutations. 587 genes were identified and subjected
to annotation by GeneCards, Ingenuity Pathway Analysis (IPA) and Reactome browser.
Remarkable inter-individual variability regarding assignment to functional categories was
detected. Findings included enrichment of DNA repair, cancer and immune system-related
genes. Prioritization of candidates for validation sequencing was performed on the basis of
classification to either of these pathways and with regard to genes involved in cell cycle, cell
death and skin diseases. 223 out of 315 mutations could be validated and 70 constituted
false positives. After removal of the latter genes from the dataset, comparative IPA analyses
were performed between truncating mutations in 11 RS BC, 11 BC and 11 Fam (familial) BC
patients. Strikingly, the RS BC group was strongly associated with cancer and with DNA
damage response pathways, closely followed by Fam BC patients. This pointed to an
enrichment of germline DNA repair gene mutations in radiosensitive BC patients.
The third part of this project comprised generation of four TERT immortalized cell lines from
primary skin fibroblasts of RS BC patients and two matched non-RS pairs. Establishment of
immortalized cell lines was successful for RS BC patients MC (mamma carcinoma) 1, MC3
and MC7, who all suffered from severe side-effects affecting different parts of the body
(RTOG 3). Heterozygosity for mutations in either HERC2 in MC1, RAD51C in MC3 or FANCL

17
and ABL1 in MC7 could be confirmed by sanger sequencing in these cells. Functional
consequences on ATM signaling were analyzed by p-CHEK2 (Ser19) and p-KAP1 (Ser824)
formation by immunoblotting, and γH2AX, 53BP1 and RAD51 (RAD51 Recombinase) foci
formation by ICC. By WB, ABL1 levels were shown to be reduced by approximately 50 % in
MC7 cells compared to the wildtype TERT immortalized control BJ5TA. Early ATM signaling
as assessed by p-CHEK2 (Ser19) and p-KAP1 (Ser824) 30 min after 1.5 and 6 Gy IR was
functional in all cultures despite subtle differences. Consistently, repair kinetics as assessed
by γH2AX and 53BP1 foci formation 1 h, 6 h, 24 h and 48 h were clearly detectable in all
cultures. MC1 TERT showed a delay in resolution of foci between 6 h and 24 h, which may be
attributed to impaired HERC2 function. MC3 and MC7 cells showed strong reduction of foci
levels already after 24 h- and almost no residual foci after 48 h. Prominent impair of RAD51
foci formation was observed only in primary (MC3) and immortalized (MC7) cells and not in
MC1 TERT cells, indicating differential effects of the mutational background of these cells on
DNA repair through homologous recombination. To address the cellular survival capacity in
the TERT immortalized RS BC patient cells, the colony survival assay (CSA, or clonogenic
assay) was performed after IR ranging from 2– 8 Gy. Results after 4 Gy are presented here
and indicate strong impairment of clonogenic survival after IR in all RS cultures compared to
the control, however, especially in MC3 and MC7 cells. In the latter cell lines, hardly any
colony formation could be observed. Microscopic inspection of these cells indicated
development of a senescence phenotype after IR. In order to determine IR-associated
senescence, cells were counted according to senescence-associated β-galactosidase staining
after 4 Gy of IR. Senescence without and after IR was detected in all cultures including the
control but normalization to background levels in unirradiated cells revealed significant
differences at 7 d after IR only in MC3 TERT and MC7 TERT compared to the control,
respectively. As MC3 TERT showed the steepest decline in non-senescent cells already at
24 h after IR, this cell line was chosen for further experiments. Comparison between MC3
TERT and BJ5TA showed significant development of IR-associated senescence in the RAD51C
carrier. These results suggest a possible mechanism of induction of RS involving defective
DNA repair that leads to accumulation of lesions in cells followed by initiation of senescence,
which finally may account for immunological implications in RS cancer patients.

18
Zusammenfassung
Katharina Neuhäuser
Impact of the DNA damage response in clinical and cellular radiosensitivity of cancer patients
Bei 5-10 % der Krebspatienten treten bei der Strahlentherapie Nebenwirkungen auf, die
akute Effekte wie Hautverbrennungen und Entzündungen und/oder Spätfolgen wie
beispielsweise Gefäßgewebeschäden oder Unfruchtbarkeit verursachen. Diese Reaktionen
sind derzeit nicht vorhersehbar, was die wirksame Behandlung der übrigen nicht betroffenen
Patienten aufgrund generalisierter Anwendung unzureichender Dosen limitiert. Das Ziel
dieser Arbeit war die Untersuchung von genetischen und zellulären Mechanismen der
Normalgewebstoxizität strahlensensitiver Krebspatienten. Drei Ansätze wurden verfolgt, um
die Rolle der DNA-Reparatur in der Strahlentoxizität im Hinblick auf mögliche Biomarker zu
erforschen.
Zunächst wurde der Einfluss des neuen DNA-Reparatur Kandidaten TPT1 auf das ATM-
Signaling in Brustepithelzellen (MCF10A) und SV40-immortalisierten humanen Fibroblasten
(ADP) untersucht. Das Silencing von TPT1 hatte keinen signifikanten Effekt auf die frühe ATM
Signaltransduktion 30 Minuten nach der Bestrahlung, was durch Western Blot
Untersuchungen der Phosphorylierung von CHEK2 (Ser19) und KAP1 (Ser824) bestätigt
wurde. Zudem wurde nach Bestrahlung mehrerer Zelllinien weder eine nukleäre
Translokation von TPT1, noch eine Foci-Bildung durch Immunzytochemie (ICC) oder zelluläre
Fraktionierung beobachtet. Darüber hinaus beeinflusste eine ATM-Inhibition vor der
Bestrahlung weder das TPT1-Level, noch die intrazelluläre Verteilung von TPT1. Weiterhin
wurde keine signifikante Kolokalisation von TPT1 mit γH2AX-Foci oder Chromatinbindung
nach Bestrahlung beobachtet. Das TPT1-Silencing zeigte kaum Auswirkungen auf die Bildung
und Auflösung von γH2AX- und 53BP1-Foci nach Bestrahlung, es wurde jedoch ein
marginaler Effekt auf γH2AX 24 h nach Bestrahlung in ADP Zellen beobachtet. Insgesamt
scheint TPT1 keine wesentliche Rolle bei der Erkennung und Reparatur von
strahlungsinduzierten Chromosomenbrüchen zu spielen und wurde daher im
Zusammenhang mit der DNA-Schadensreaktion nicht als Biomarker-Kandidat für
Stahlensensibilität betrachtet.
Ein zweites Ziel der Arbeit war die Analyse von möglichen Mutationen, welche die
Stahlensensibilität verursachen könnten, durch Exom-Sequenzierung. 19 Patienten mit
Nebenwirkungen, die zum großen Teil als RTOG (Radiation Therapy Oncology Group) Grad 3
klassifiziert wurden, sowie zwei Brustkrebs-Kontrollpatienten wurden analysiert. Es wurde
nach proteinverkürzenden Mutationen gefiltert, was zu 587 identifizierten Genen führte, die
durch GeneCards, Ingenuity Pathway Analysis (IPA) und den Reactome Browser annotiert
wurden. Es wurde eine große Variabilität zwischen individuellen Exomen bezüglich der
Zuordnung der Gene zu funktionalen Kategorien festgestellt. Die Ergebnisse zeigten eine
Anreicherung von Genen, die bekanntermaßen eine Rolle in der DNA-Reparatur und/oder
der Krebsentstehung aufweisen oder in Zusammenhang mit dem Immunsystem stehen. Die
Priorisierung von Kandidaten für die Validierungssequenzierung wurde auf der Grundlage
der Zuordnung zu einem dieser Pathways und im Hinblick auf Gene durchgeführt, die an
Zellzyklus, Zelltod, oder Hauterkrankungen beteiligt sind. 223 von 315 Mutationen konnten
bestätigt werden, für 22 Mutationen gelang kein adäquates Primerdesign und 70
Mutationen stellten sich als falsch-positive Treffer heraus. Nach der Entfernung der letzteren
Gene aus dem Datensatz wurden vergleichende IPA-Analysen zwischen trunkierenden

19
Mutationen von 11 RS-Brustkrebs (breast cancer, BC), 11 BC und 11 Fam (familiärer) BC-
Patienten durchgeführt. Auffallend war, dass die RS BC-Gruppe besonders stark mit Krebs-
und DNA-Schadensreaktionswegen assoziiert war, dicht gefolgt von Fam BC-Patienten.
Der dritte Teil dieses Projekts umfasste die Erzeugung von vier TERT immortalisierten
Zelllinien aus primären Hautfibroblasten von RS-BC-Patienten und zwei in Krankheitsbild und
Alter vergleichbaren Brustkrebspatienten. Die Etablierung von immortalisierten Zelllinien
war erfolgreich für die RS-BC-Patienten MC (Mamma Carcinom) 1, MC3 und MC7, die alle an
schweren Nebenwirkungen in verschiedenen Körperregionen litten (RTOG 3). Heterozygotie
für Mutationen in entweder HERC2 in MC1, RAD51C in MC3 oder FANCL sowie ABL1 in MC7
konnte durch Sanger-Sequenzierung bestätigt werden. Funktionelle Auswirkungen auf den
ATM-Signalweg wurden durch Bildung von p-CHEK2 (Ser19) und p-KAP1 (Ser824) über
Immunoblots und Bildung von RAD51, γH2AX und 53BP1 Foci mittels Immunzytochemie analysiert. Durch Western Blot wurde gezeigt, dass das ABL1-Proteinniveau in den
heterozygoten MC7-Zellen im Vergleich mit den Wildtyp-TERT immortalisierten
Kontrollzellen BJ5TA um etwa 50 % reduziert vorlag. Die frühe ATM-Signaltransduktion, die
durch p-CHEK2 (Ser19) und p-KAP1 (Ser824) 30 min nach Bestrahlung mit 1.5 und 6 Gy
bestimmt wurde, war trotz subtiler Unterschiede in allen Kulturen funktional. Entsprechend
war die Reparaturkinetik, wie sie durch γH2AX- und 53BP1-Foci-Bildung nach 1 h, 6 h, 24 h
und 48 h bestimmt wurde, in allen Kulturen eindeutig nachweisbar. MC1 TERT zeigte eine
verzögerte Foci-Auflösung zwischen 6 und 24 h, was auf eine beeinträchtigte HERC2-
Funktion zurückgeführt werden könnte. MC3- und MC7-Zellen zeigten bereits nach 24 h eine
starke Reduktion der Foci-Werte, und wiesen nach 48 h kaum noch nachweisbare Foci auf.
Eine ausgeprägte Beeinträchtigung der RAD51-Foci-Bildung wurde nur in primären MC3 und
immortalisierten MC7 Zellen, nicht aber in MC1-TERT-Zellen, beobachtet, was auf
unterschiedliche Effekte des Mutationshintergrunds dieser Zellen auf die DNA-Reparatur
hindeutet. Um die zelluläre Überlebensfähigkeit in den TERT immortalisierten RS-BC-
Patientenzellen zu untersuchen, wurde der Colony Survival Assay (CSA, clonogenic assay)
nach einer Bestrahlung mit 2–8 Gy durchgeführt. Die Ergebnisse der Bestrahlung mit 4 Gy
werden hier präsentiert. Sie weisen eine starke Beeinträchtigung des klonogenen
Überlebens nach Bestrahlung in allen RS-Kulturen im Vergleich zur Kontrolle auf.
Insbesondere die MC7 TERT Fibroblasten stachen hierbei hervor, da sie nach Bestrahlung
keinerlei Koloniebildung aufwiesen. Sehr ähnliche Beeinträchtigung zeigte auch die MC3
TERT. Durch mikroskopische Untersuchung der Zellen zeigte sich ein hoher Anteil von sehr
großen Zellen, die starke Granulierung aufwiesen und Ähnlichkeiten zu seneszenten Zellen
zeigten. Um die strahlenassoziierte Seneszenz zu bestimmen, wurden die Zellen gemäß der
mit Seneszenz assoziierten β-Galactosidase-Färbung nach Bestrahlung mit 4 Gy ausgezählt.
Seneszenz wurde in allen Kulturen mit und ohne Bestrahlung, einschließlich der Kontrolle,
nachgewiesen. Nach Normalisierung auf Hintergrundwerte in unbestrahlten Zellen zeigten
sich 7 Tage nach Bestrahlung signifikante Unterschiede in den MC3-TERT- und MC7-TERT
Zellen im Vergleich zur Kontrolle. Da MC3-TERT bereits 24 Stunden nach Bestrahlung den
stärksten Abfall in nicht-seneszenten Zellen zeigte, wurde diese Zelllinie für weitere
Experimente ausgewählt. Ein Vergleich zwischen MC3-TERT und BJ5TA zeigte eine
signifikante Entwicklung von IR-assoziierter Seneszenz in den Zellen der RAD51C-
Mutationsträgerin. Diese Ergebnisse lassen einen möglichen Mechanismus der Induktion von
Strahlensensibilität mittels defekter DNA-Reparatur vermuten, die zur Akkumulation von
Läsionen in Zellen führen könnte, gefolgt von Seneszenz, die letztendlich immunologische
Implikationen bei strahlensensiblen Krebspatienten auslösen könnte.

20
1 Introduction part 1: The DNA damage response
1.1 Forms of DNA lesions and repair pathways
The survival of organisms is dependent on the correct transmission of intact genetic material
from one cell to its offspring. Lesions of the genome by DNA damage can occur at various
points of the life cycles of cells in the body, and organisms have developed several defense
mechanisms to ensure the integrity of the genetic information, collectively termed the DNA
damage response (DDR). An interactive network of repair pathways, which share several
components, has evolved, and is initiated upon DNA damage by various exogenous and
endogenous sources. Such can be physiological stress, failure of enzymatic reactions,
replication errors and free radical species as by-product of metabolism or ionizing radiation,
chemical compounds, cigarette smoke, alcohol consumption, UV light and several more1-4.
Estimations have been made that every cell can undergo 105 spontaneous DNA lesions in
one day5. Upon sensing of the damage, the decision needs to be made whether the repair
machinery is capable of managing the insult, or else, cell death must be initiated to ensure
protection of the surrounding cells and the lineage by elimination of the damaged cell. If this
fails and damaged cells manage to escape the repair processes, various disorders and tumor
development can be the consequence2 6. Defects in surveillance and repair of the genome
can contribute to progression, appearance as well as heterogeneity of cancer7.
The DDR is also involved in several other processes like DNA replication, chromatin folding
and packing, regulation of the epigenetic environment, gene expression, protein synthesis
and immune system2 8. As several cancers are associated with defects in the DDR, they are
dependent on the remaining repair functions for survival and provide a well established
target in cancer therapy9. It is crucial that proper interaction of the DDR components with
the cell-cycle-checkpoint and chromosome-segregation machinery is guaranteed, to allow
DNA repair prior to mitosis in order to prevent the spreading of the damaged genetic
material to the daughter cells10. As the DNA damage response is a very complex mechanism
that involves hundreds of proteins, an overview of different forms of DNA lesions, the
subsequently initiated repair mechanisms and some of the major proteins involved in these
processes is given in Figure 1. Gene products that will be of further interest in this project
are shown in crosstalk with other components of the DDR and will be introduced in this
chapter.


22
homologous end joining (NHEJ) and homologous recombination (HR) will be discussed in this
section.
Base-excision repair (BER) belongs to the frequently utilized pathways, which are specialized
for dealing with smaller lesions arising from endogenous stress, while nucleotide excision
repair (NER) corrects helix-distorting damage that can arise from environmental mutagens14
15. Reactive cellular catabolites can endogenously create miscoding alkylation lesions, which
can be rapidly and efficiently removed by methyltransferases in a direct reversal action16-19.
If the cell faces a DNA lesion that blocks the replication machinery, a bypass through
specialized DNA polymerases can be initiated in an emergency situation15. Intra-strand
crosslinks can successfully be bypassed during replication, while inter-strand crosslinks (ICLs)
present a greater threat to the integrity of the genome as they prevent DNA strand
separation during transcription and replication and need to be corrected by homologous
recombination (HR) repair and the Fanconi Anemia (FA) pathway20 (section 1.4). ICLs can
form during endogenous release of metabolic by-products or arise from exogenous agents
like UV irradiation (IR) or cancer drugs like cisplatin and mitomycin C21. Convergence of
replication forks at the localization of ICLs initiates repair that operates during replication in
the S (synthesis) phase of the cell cycle22. Stalled replication forks are temporarily arrested
but can resume replication (termed replication fork restart) once the repair has been
successfully executed, for example by RAD51-dependent homologous recombination
repair23 (subsection 1.1.2). A collapsed replication fork, however, is inactivated in the course
of dissociation of the replication machinery and can account for genome rearrangements if it
cannot be stabilized or persists over a longer time period3.
1.1.1 DNA single-strand break repair of replication-associated DNA damage
DNA is particularly vulnerable during replication and transcription processes, especially
through attack by reactive oxygen species (ROS). These can be endogenously created during
immunological responses, as byproducts of metabolism especially in the course of cellular
respiration or by exogenous agents such as chemicals or IR. ROS can cause oxidized bases,
abasic or apurinic-apyrimidinic (AP) sites and single-strand breaks. It is estimated that over
105 base lesions are caused by endogenous ROS in an aerobic cell genome per day3.
Unwinding of the duplex genome to create transient single-stranded DNA renders it
particularly sensitive to the formation of oxidized bases, which could lead to mispairings and
subsequently to cancer-causing mutations if replication proceeds. Furthermore, bulky
adducts, which stall replicative polymerases, can lead either to repair or fork collapse24. It is
vital that replication is restarted each time after it encounters an impairment of replication
fork progression, to ensure physiological cell functions and complete reproduction.
Different options to repair replication-associated DNA damage have evolved, either in the
template strand or in a post-replication repair mechanism in the progeny strand. The
majority of mutagenic base lesions are repaired in a pre-replicative manner through base-
excision repair-initiating enzymes.
1.1.1.1 Base excision repair and mismatch repair pathways
Loss of a whole base due to cleavage of the N-glycosidic bond between the phosphate-sugar-
backbone and the nucleotide creates an AP site which initiates the base excision repair
pathway (BER)25. This repair mechanism removes toxic and non-bulky base lesions and
strand breaks from genomic and mitochondrial DNA14 and is basically mediated by an

23
enzyme complex containing DNA polymerase β (POLB) and DNA ligase I (LIG1)25. BER is
triggered by DNA glycosylases and AP lyases, that hydrolytically cleave the base-deoxyribose
glycosyl bond of the affected nucleotide, for example Endonuclease VIII-like 1 (NEIL1) or
Thymine DNA Glycosylase (TDG). NEIL1 is involved in replication-associated repair of
oxidized bases during the S-phase (synthesis) of the cell cycle, has a preference for oxidized
pyrimidines, and removes the altered bases through its AP lyase activity26. It binds to the
single-stranded DNA to mediate fork regression and acts as hub protein by interacting with
distal repair proteins presumably to enhance efficiency of damaged-base recognition and
repair24. These encompass DNA ligases or the heterotrimeric 9-1-1 complex composed of
RAD1, RAD9 and HUS1.
An important post-replication DNA repair mechanism that is implicated in several cancers is
mismatch repair (MR), which operates to compensate dNTP-misincorporations. These can
result from escaping the proofreading machinery during DNA replication and will eventually
be interpreted as DNA lesions10 27. Furthermore, “insertion and deletion” loops, which might
form during replication and recombination of DNA, are corrected by MR10 27. This form of DNA
repair mechanism is capable of initiating cell cycle arrest as well as apoptosis in case of
intensive damage and has been proposed as general DNA damage sensor due to its broad
recognition and repair capacity of diverse base pair anomalies, including conventional
mismatches28-30. Key players are MutL homolog 1 (MLH1) and MutS homolog 2 (MSH2)
which are involved in the recognition of the mismatch together with several other proteins
including MutS Homolog 6 (MSH6), followed by nicking to enable the removal of the
mispaired nucleotide. Excision of the nicked strand by exonucleases, resynthesis and ligation
of the corrected stretch of DNA are subsequently performed to complete repair31.
Given that excision could start either at the 5’ or 3’ terminus, depending on the localization
of the base that needs to be exchanged, exonucleases with different polarities were
identified. One of the major exonucleases in mammalian cells is the MSH2 interactor EXO1
(Exonuclease 1), which possesses 5'→3' dsDNA exonuclease activity as well as an RNase H
activity32 33. MRE11A has been described as 3′→5′ direction exonuclease34, whereas the
ssDNA-specific exonuclease EXO5 (Exonuclease 5) is bidirectional with a strong preference
for 5’-ends. Its directionality is enforced by the hub protein complex RPA (Replication protein
A), which binds and stabilizes ssDNA intermediates and is important for nucleotide excision
and double-strand break repair (subsection 1.1.2) in addition to BER35 36. EXO5 has been
associated with resolution of stalled DNA replication forks and defects in this gene result in
increase of DNA damage in the form of ICLs, spontaneous and damage-induced chromosome
abnormalities36.
MR and BER share some components, for example NEIL1 and TDG. In addition to BER, NEIL1
functions in MR by correcting mismatched uracil and thymine pairings and, in contrast to
TDG, exhibits a broad substrate specificity24. TDG can correct G-T mispairings which can be
generated by deamination of 5-methylcysteine37, and initiates BER through removing
thymine from guanine-thymine mispairs. This results in an AP site that can subsequently be
targeted by AP endonucleases, and refilled by DNA polymerases and ligases to restore the
original guanine-cytosine interaction according to Watson-Crick base pairing10 38 39. Through
its interplay with Tet-(ten eleven translocation) proteins, TDG also functions in active DNA
demethylation of cytosine residues, an important form of epigenetic regulation by
transcriptional activation of silenced genes40-43. Moreover, TDG lacks glycosylase activity
24
towards the prevalent cytosine modification 5-methylcytosine44 45, which is oxidized by Tet-
proteins like the tumor suppressor TET2. This results in formation of 5-carboxylcytosine,
which can be used as substrate by TDG leading to BER42 46.
1.1.1.2 Nucleotide-excision repair
Helix-distorting DNA lesions such as pyrimidine dimers and photoproducts caused by UV
light, demand repair by removing the whole nucleotide, not only the base, and are
recognized by the nucleotide excision repair pathway (NER). It consists of several elements,
including the Xeroderma pigmentosum (XP) family proteins A-G and V, which are associated
with severe cutaneous implications including a dramatically increased risk of skin cancer, the
Cockayne syndrome (CS) proteins A and B as well as trichothiodystrophy (TTD) group A47.
NER can be divided into two sub-pathways and is initiated at stalled replication forks, but
can also be coupled to transcription and proceed genome-wide, resolving a wide spectrum
of damage48 49. The NER sub-pathways global genome repair (GGR) and transcription-
coupled repair (TCR) are initiated by unique damage recognition systems but share some
common core factors of NER49. XPC (Xeroderma pigmentosum, Complementation Group C) is
important in the early steps of GGR and damage sensing, binds to the undamaged
complementary strand and mediates repair complex formation50-53.
Moreover, XPC is able to stimulate the activity of TDG, providing a connection with BER
initiation54 and is associated with MMS19 via the core-TFIIH basal transcription factor
complex55 56 that has been shown to be implicated in chemotherapy response57. The core
reaction of both NER sub-pathways involves excision of the fragment containing the
photoproduct exclusively on the damaged strand and using the intact sister strand as
template for resynthesis by the DNA polymerase and ligase network. While GGR covers the
damage in the entire genome, TCR proceeds much faster as only the actively transcribed
regions of the genome are repaired58-60. It has been shown that this form of DNA repair is
subject to regulation by the COP9 signalosome (CSN) complex which plays a key role in
degradation of its components by ubiquitination60. Furthermore, several regulatory proteins
have been identified that serve as scaffolds or are involved in maturation of repair key
components. MMS19, for example, provides iron-sulfur cluster insertion into apoproteins via
the cytosolic iron-sulfur protein assembly (CIA) machinery61.
BER, MR and NER all rely on the same repair protocol, in which the damage is sensed by poly
(ADP-ribose) polymerases (PARP) 1 and 2 that associate to single-strand lesions62-64.
Subsequently, a signal transduction cascade that hydrolytically removes the affected base or
nucleotide is initiated. Afterwards, the complementary sequence is restored via the single-
strand template and DNA ends are ligated together65. More challenging and unusual forms
of DNA damage such as distortions of the sugar-phosphate backbone can only be repaired
by a complex network of proteins, involving cell cycle control and a strong signal
transduction and amplification capability.
1.1.2 DNA double-strand break repair
While all forms of DNA lesions can be a potential threat to the cell, DNA double-strand
breaks are considered the most harmful, as only one DSB is sufficient to result in persistent
growth arrest by senescence or even cell death if left unrepaired10. Further consequences
can be chromosomal aberrations in the form of translocations and deletions, which can
trigger loss of heterozygozity and promote carcinogenesis through genomic instability66. It is
25
believed that the ratio in which double- and single-strand breaks are created, for example by
free radical species, determines the cell fate67 68. The molecular mechanisms of dealing with
the highly toxic DSBs are homologous recombination69 (HR) and non-homologous end joining
(NHEJ).
1.1.2.1 Non-homologous end joining repair
NHEJ presumably is the most important form of DSB repair in humans, as it operates
throughout the cell cycle and does not rely on a template to restore the original base-
pairing10 70 71. It simply religates the ends of a DSB in a “quick-and-dirty” manner, which is
highly flexible and can readily safe the cell from consequences of the DSB on the one hand,
but can lead to mutations itself on the other hand10. Defects in NHEJ render cells sensitive to
ionizing radiation (IR) and result in immunological defects, as this pathway also operates at
physiological DSBs resulting from V(D)J recombination and immunoglobulin class switch
recombination in the context of antigen diversity promotion4 70.
Furthermore, failures of nuclear enzymes of lymphoid cells are associated with about half of
the chromosomal translocations that account for human lymphomas4. NHEJ has a
remarkable variety of substrates that it can accept to produce joined products. The Ku-
Proteins, which constitute the DNA-binding subunit of the DNA-Dependent Protein Kinase
(DNA-PK), directly bind the two DNA ends at the DSB and provide a scaffold for nucleases,
polymerases and ligases that can be recruited in a flexible order4. One of the interactors of
the DNA-PK complex is the NIMA (Never In Mitosis Gene A)-Related Kinase 4 (NEK4), which
plays a role in recruitment of the complex to DNA DSBs, in activation of TP53 (Tumor Protein
P53), cell cycle arrest and phosphorylation of H2AX (Histone H2AX)72. Although H2AX is
phosphorylated at S139 by several kinases, including ATM (ATM Serine/Threonine Kinase)
and ATR (ATR Serine/Threonine Kinase), see section 1.3, DNA-PK has been shown to be the
major kinase in charge of activation of H2AX in the DNA DSB repair and cell cycle context73.
The Artemis DNA-PKcs complex is the enzymatic core of DNA-PK, has a range of nuclease
activities, and is capable of cutting a variety of DNA overhangs. The polymerase lambda
(POLλ) is more flexible than replicative polymerases4. DNA ligase IV also inhabits outstanding
flexibility by the ability to ligate ssDNA and proceed across gaps and incompatible DNA ends.
This demonstrates the versatility of several components involved in the NHEJ response to
DSBs.
1.1.2.2 Homologous recombination repair
In contrast to the error-prone NHEJ, which is activated by DNA-PK, HR is a high fidelity
mechanism with low mutation rate. It mainly operates during the S and G2 (Gap2) phases of
the cell cycle as it requires the presence of a DNA template to restore the DNA in its original
base sequence11. HR is utilized in repair of DNA as well as collapsed replication forks and
mainly triggered by the apical kinases ATM (ATM Serine/Threonine Kinase) and ATR (ATR
Serine/Threonine Kinase). However, crosstalk between DNA-PK, ATR and ATM has been
reported to facilitate HR74 75. Upon DSB induction, the MRN complex assembles CTBP-
interacting protein (CtIP) and BRCA1/PALB2/BRCA2 to initiate HR. In parallel, it serves as
origin of downstream signaling events and recruits ATM76.
HR is conceptually divided into three stages known as presynapsis, followed by synapsis and
postsynapsis77. ATM triggers resection of the nucleotides adjacent to the break by
stimulating the nucleolytic activity of exonucleases like CtIP, MRE11A or EXD278, which

26
generate 3′-ssDNA overhangs, that are extended by nucleases in cooperation with the
Bloom's syndrome helicase BLM (Bloom Syndrome RecQ Like Helicase)77 79. The Werner
syndrome protein WRN (Werner Syndrome RecQ Like Helicase) is a homologue of BLM and is
associated with ATM, MRE11A, RAD50, EXO1 and the DNA-PK subunits KU70/80. It
possesses helicase as well as 3'5' DNA exonuclease activity and is believed to repair stalled
or collapsed replication forks80-88. Resection is terminated by the translocase activity of DNA
Helicase B (HELB) which inhibits the activity of exonucleases upon S-phase entry and
stimulates RAD51-mediated heteroduplex extension in 5'-3' direction75 89. During the
presynapsis phase, the ssDNA-binding protein RPA coats the DNA strand and is subsequently
exchanged by RAD51, which forms nucleoprotein filaments. It is believed that BRCA2 is
involved is mediating this step together with other proteins90. The RAD51 nucleofilaments
are essential for homology search and strand exchange, which are subsequently performed
during synapsis91 and RAD51 association with ssDNA likely reflects nuclear RAD51 foci76.
RAD51 dissociates in the course of postsynapsis, and the homologous sister chromatid is
used as reference for insertion of the missing nucleotides into the break and completion of
repair77 92 93. The RAD51-binding protein fidgetin-like 1 (FIGNL1) also interacts with the
RAD51 recombinase and plays an important role in HR, as evidence that it can associate to
DNA lesions independently of BRCA2 or the RAD51 paralogs like RAD51C, has been
reported76.
The severity of DNA lesions in the form of DSBs requires the collective action of proteins
which sense the damage, initiate cell cycle arrest and finally repair the DNA. HR is initiated
upon degradation of the 5’-DNA strand of the DSB and a complex interplay of DNA damage
sensors like the MRE11A-RAD50-NBN (MRN) complex, the 9-1-1 complex and apical kinases
like ATM and ATR follows. Subsequently, several downstream mediators like 53BP1, γH2AX
and BRCA1, kinases like CHEK2 and CHEK1, and effectors like TP53 or CDC25 that can
determine cell fate like apoptosis, checkpoint arrest or DNA repair, are activated94. The
complex interplay of these factors will be further discussed in the following subsections.
1.2 The cell cycle and checkpoint control
As described in the previous subsections, cells are under continuous threat by endogenous
and exogenous agents that cause DNA damage. In order to be able to fully replicate, a cell
needs to sophistically undergo cell cycle progression. In order to allow completion of the cell
cycle, a series of surveillance pathways have evolved, which are called cell cycle
checkpoints95 and allow suspension of the whole process until the prerequisites for reaching
the next phase are fully given. Major players in checkpoint control, cell cycle progression and
cell death are the inhibitors and activators of cyclin-dependent kinases (CDKs), the E2F-
family of transcription factors and the retinoblastoma tumor suppressor (RB). RB prevents
unscheduled cell cycle entry and is implicated in several sporadic cancers96. It is suggested
that a majority of human cancer cells miss the proliferation-associated regulatory functions
of RB, have lost G1 (Gap 1) checkpoint control and show differential response to wide-
ranging therapeutic agents, making this protein an important factor in cancer treatment96-98.
Stimulation by mitogens activates CDK-cyclin complexes that attenuate the suspending
effects of RB by phosphorylation98. It can be reactivated by phosphatases until completion of
mitosis or in response to cellular stress like DNA lesions that induce cell cycle arrest99,100. The
normal cell cycle progress includes 4 cell cycle phases and at least 3 cell cycle checkpoints, as
schematically depicted in Figure 2. The G1 phase is characterized by bridging the time
between nuclear division and DNA synthesis101, during which the cell prepares for DNA
27
duplication in the next cell cycle phase. If the DNA is intact and the environment is
favourable, as determined by the G1/S checkpoint, the cell can enter S phase. During S
phase, the synthesis of DNA is accomplished102, followed by preparation for mitosis in the
subsequent G2 phase. Entry into mitosis is prevented by the G2/M checkpoint if DNA
replication has not been properly performed. Mitosis can only be completed if chromosomes
are correctly attached to the mitotic spindle, which is supervised by the metaphase
checkpoint103. Progression through G1 and G2 phases is only possible if the DNA has not
been damaged; otherwise the cell cycle checkpoint executers need to coordinate cell cycle
progression with DNA repair95. ATM and ATR are two of the major checkpoint kinases in
mammalian cells and manage a series of signal transduction events. Whether ATM or ATR
are activated in the course of cell cycle control depends on the nature of the DNA damage,
however, signal transduction pathways converge in TP53 induction and catalytic inhibition of
CDC25 phosphatase95. The precise functions of ATM and ATR in checkpoint signaling will be
discussed in section 1.3.
The tumor suppressor BRCA1 is targeted by ATM and CHEK2 after ionizing radiation and
phosphorylated by ATR during genotoxic stress arising from UV damage104. Upon activation,
BRCA1 induces cell cycle arrest in G1, which has been shown to depend on RB function105.
Several interactors of RB are known, among them RBBP6 (RB Binding Protein 6, Ubiquitin
Ligase), which is part of a protein network that enables genome-wide DNA replication and
chromosomal stability106. Replication abnormalities are often found within common fragile
sites (CFSs), which have been associated with a variety of oncogenes and tumor
suppressors107-109. The RBBP6/ZBTB38 (Zinc Finger And BTB Domain Containing 38)/MCM10
(Minichromosome Maintenance 10 Replication Initiation Factor) axis, with RBBP6 as
upstream member, has been shown to counteract CFS rearrangement and replication stress.
The multifunctional protein RBBP6 is implicated in several cancers, associated with DNA
repair through interaction with Y-box binding protein 1 and probably exerts its checkpoint
control via interaction with RB (G2/M phase) and TP53 (control of G1/S)110 111. TP53, the
most intensively studied tumor suppressor up to date, is both targeted by ATR and ATM
through CHEK1 and CHEK2 and acts as a transcription factor to alter gene expression and
promote senescence or apoptosis in response to intensive damage of DNA112. It is suggested
that the guarding functions of TP53 might be activated by DNA damage in early-stage
tumors, stressing its potential role in bridging the DNA damage response and
tumorigenesis112.
Several interactors of TP53 are related to cell cycle control and/or apoptosis. One example is
pituitary tumor-transforming gene 2 (PTTG2), a member of the securin family of proteins,
which has been shown to be responsible for cell adhesion and apoptosis in a TP53-, and
CDKN1A (TP21)-dependent manner113. TP53 is reversibly modified by a range of different
post-translational modifications, which regulate its stability as well as its tumor-suppressive
functions114. Numerous modifications occur upon stressors like DNA lesions after IR. One of
the many enzymes that target TP53, apart from ATM and ATR, is the protein kinase CK2
(Casein Kinase 2). It phosphorylates TP53 at Ser392 that is related to the IR response and
tumorigenesis functions of TP53114. It has been demonstrated that UV-induced TP53 levels,
site-specific DNA binding, and transcription regulation of hundreds of TP53-target genes can
be influenced via this mechanism114-117. CK2 is furthermore associated with the COP9-
signalosome complex of proteins that mediates ubiquitination and proteasomal degradation
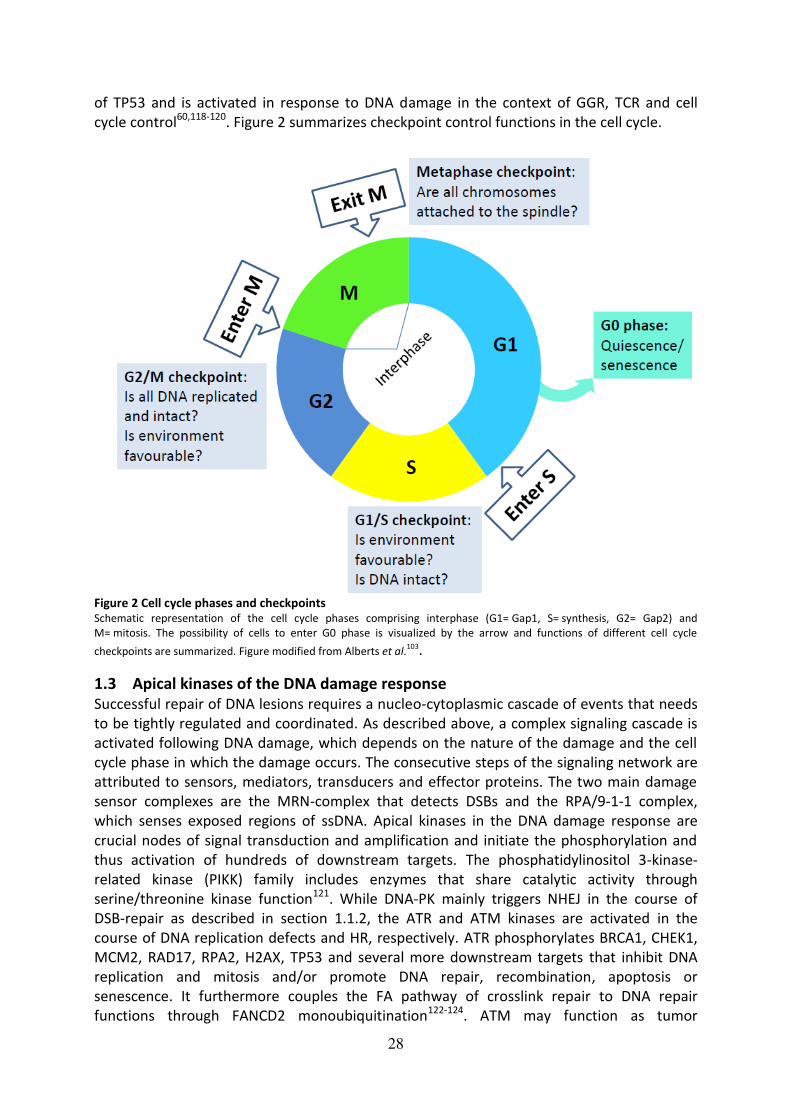
28
of TP53 and is activated in response to DNA damage in the context of GGR, TCR and cell
cycle control60,118-120. Figure 2 summarizes checkpoint control functions in the cell cycle.
Figure 2 Cell cycle phases and checkpoints Schematic representation of the cell cycle phases comprising interphase (G1= Gap1, S= synthesis, G2= Gap2) and
M= mitosis. The possibility of cells to enter G0 phase is visualized by the arrow and functions of different cell cycle
checkpoints are summarized. Figure modified from Alberts et al.103.
1.3 Apical kinases of the DNA damage response
Successful repair of DNA lesions requires a nucleo-cytoplasmic cascade of events that needs
to be tightly regulated and coordinated. As described above, a complex signaling cascade is
activated following DNA damage, which depends on the nature of the damage and the cell
cycle phase in which the damage occurs. The consecutive steps of the signaling network are
attributed to sensors, mediators, transducers and effector proteins. The two main damage
sensor complexes are the MRN-complex that detects DSBs and the RPA/9-1-1 complex,
which senses exposed regions of ssDNA. Apical kinases in the DNA damage response are
crucial nodes of signal transduction and amplification and initiate the phosphorylation and
thus activation of hundreds of downstream targets. The phosphatidylinositol 3-kinase-
related kinase (PIKK) family includes enzymes that share catalytic activity through
serine/threonine kinase function121. While DNA-PK mainly triggers NHEJ in the course of
DSB-repair as described in section 1.1.2, the ATR and ATM kinases are activated in the
course of DNA replication defects and HR, respectively. ATR phosphorylates BRCA1, CHEK1,
MCM2, RAD17, RPA2, H2AX, TP53 and several more downstream targets that inhibit DNA
replication and mitosis and/or promote DNA repair, recombination, apoptosis or
senescence. It furthermore couples the FA pathway of crosslink repair to DNA repair
functions through FANCD2 monoubiquitination122-124. ATM may function as tumor
29
suppressor and phosphorylates and activates CHEK2, FANCD2, BRCA1, HERC2, EXO1, NBN,
TERF1, RAD9, H2AX, 53BP1, TP53 and many more downstream targets. These include the
kinase ABL1 that is activated in the course of checkpoint signaling upon DSB repair,
apoptosis induction and genotoxic stress management125 126. Furthermore, association
between ATM and NPAT (Nuclear Protein, Coactivator Of Histone Transcription) is known,
which is essential for cell cycle progression127, is implicated in S-phase entry promotion128,
and links cell cycle control to replication-dependent histone gene transcription129.
Although they share a certain number of components and downstream functions, the nature
of the DNA damage that triggers activation of these latter two kinases is distinct130. There is
strong evidence that the ATM/CHEK2 module primarily responds to DSBs, whereas the
ATR/CHEK1 pathway is activated by SSBs and bulky lesions. However, both pathways
converge on CDC25, thereby regulating cell cycle progression131 (subsection 1.3.3.).
1.3.1 ATR in DNA repair and checkpoint control
ATR is indispensable for cellular survival and controls responses to a broad spectrum of DNA
lesions. These include damage arising from malfunctional DNA replication that leads to an
excess of ssDNA122. RPA encloses the single-stranded DNA and interacts with a separately
formed heterodimer of ATR and the ATR interacting protein (ATRIP), which subsequently
attaches to the SSB122 132-134. Sensors of DNA damage and mediators of ATR signaling are the
RAD family checkpoint proteins, for example the checkpoint DNA exonuclease RAD1 that
interacts with RAD9 and HUS1 in the heterotrimeric 9-1-1 complex, which is recruited to the
DNA after damage together with DNA polymerases135. It has been suggested that the 9-1-1
complex has a positive impact on DNA polymerase beta (POLB) affinity to its template as
well as on its activity, thereby connecting checkpoint control with the early steps in DNA
repair135. ATR activation is supported by the action of the two adaptor proteins
Topoisomerase II Binding Protein 1 (TOPBP1) and claspin (CLSPN). The interaction of claspin
with phosphorylated RAD17 (a component of the 9-1-1 clamp loader) initiates and maintains
the phosphorylation of CHEK1 by ATR122 136. Following activation, CHEK1 dissociates from the
DNA damage site and fulfills its role as major downstream kinase through phosphorylating
and activating its many substrates, including proteins involved in cell cycle checkpoint
control137.
1.3.2 ATM in DNA repair and checkpoint control
The apical kinase ATM plays a crucial role in DNA DSB repair and was initially described in
the context of the genetic disorder and chromosome breakage syndrome Ataxia-
Telangiectasia (A-T), in which both ATM genes were found to be inactivated or missing,
hence named ataxia-telangiectasia mutated138-140 (subsection 2.3.5). It can be targeted
through the DSB-sensing MRN-complex141, direct interaction with the DSB142, or
conformational changes of chromatin143. Furthermore, there is evidence that ssDNA oligos,
which are generated by the MRN-complex and signal ongoing repair, also stimulate ATM
function144. The MRN-complex consists of proteins that are associated with genome-
instability syndromes, see section 2.3.5, and is one of the first DNA-binding platforms
localizing to the site of the DSB145. It unwinds DNA ends, activates inactive ATM dimers and
serves as scaffold for ATM and large macromolecular complexes, which are known as
“foci”145-146. Upon monomerization, ATM molecules are able to undergo
autophosphorylation, which extends their signaling capacity to hundreds of substrates147,148.
Several studies have pointed out that there is strong association between the proteins

30
involved in DSB repair and checkpoint control, one of them being the RAD50 interactor
RINT1 (RAD50 Interactor 1), which binds RAD50 only during late S and G2/M phases and may
be needed for the integrity of the radiation-induced G2/M checkpoint149.
Furthermore, RINT1 has been reported to be implicated in telomere length control via
interaction with RB family members independent from telomerase action150. Telomere
regulation and checkpoint control are tightly associated and oncogenic transformation is
often related to loss of telomere regulation by alteration of telomerase activity. Telomere
regulation is important in extending the replicative life span of cells and protection of
chromosome ends from degradation151. The 3’ single-stranded overhang of nucleotides at
the end of each telomere provides a similar target for ATM and ATR action as a DNA lesion,
which amplifies the function of the DDR in telomere integrity152,153. In mammalian germline
cells and the majority of cancers, telomere length is preserved by the ribonucleoprotein
telomerase154-155. It is recruited to telomeres by assistance of ATM and ATR156. Human
telomerase consists of TERC (telomerase RNA), TERT (catalytic subunit), dyskerin and TCAB1
(telomerase cajal body protein 1), also known as WRAP53157. WRAP53 (WD repeat
containing antisense to TP53) is an essential component of the telomerase holoenzyme
complex and also regulates TP53 expression and its induction after DNA damage158,159. It is
responsible for the association of the TERC subunit with cajal bodies (CB), where it can
interact with the catalytic subunit TERT158. Furthermore, TERC-containing CBs associate with
telomeres depending on the cell cycle phase160 161, which links WRAP53 to cell cycle
regulation.
In order to gain access to DNA breaks within tightly packed chromatin, core histones are the
initial targets of DNA-PK and ATM162. One of the primary targets of ATM is the histone H2AX,
an isotype of histone H2A, which is part of the histone octamere structure of nucleosomes
forming chromatin163 164. ATM phosphorylates H2AX on serine 139, which is then termed
γH2AX, within minutes after ionizing radiation and triggers γH2AX spreading along a
megabase of chromatin away from the lesion, further amplifying the signal165 166. γH2AX
mediates association of 53BP1 (p53-binding protein 1), NBN (Nibrin) and MDC1 (mediator of
DNA damage checkpoint protein 1)167-169, is associated with formation of RAD50, RAD51, and
BRCA1 foci formation during the damage recovery phase170 and can be targeted by ATR in
response to replication stress171. Although it greatly enhances localization of several repair
proteins in the vicinity of DNA lesions, it has been proposed that it is actually expendable for
their initial recognition169. H2AX phosphorylation by ATM is further intensified through
positive feedback by the damage sensor protein MDC1 until RNF8 (ring finger protein 8)-
mediated ubiquitination (in crosstalk with other proteins) terminates the initial signaling
cascade of γH2AX172 173. This results in chromatin relaxation, rendering it accessible for the
repair machinery and promotes local accumulation of 53BP1 and BRCA1 and their
localization at DSBs174-176. The timing of γH2AX and 53BP1 foci formation is regulated by the
RNF20–RNF40 heterodimer, which itself is another ATM target177.
The DNA repair protein 53BP1 was initially described as an interactor of the tumor
suppressor TP53178 and functions as mediator as well as effector of DSB repair. Similar to
γH2AX, it serves as landing platform for several other DSB repair proteins and amplifies ATM
signaling179. It enhances ATM phosphorylation of TP53, CHEK2 and BRCA1 and promotes
checkpoint control while loss or malfunction of 53BP1 results in G2/M-checkpoint defects
and increased genomic instability179-183. Furthermore, 53BP1 triggers DSB repair through

31
NHEJ by protection against DNA end-resection, which is crucial for pathway choice179,184. As
already mentioned for γH2AX, the activation and localization of 53BP1 to DSBs is mediated
by a series of chromatin ubiquitination steps, which involves the E3 ubiquitin ligase HERC2
(HECT domain and RCC1-like domain-containing 2)185 among others.
The tumor suppressor proteins BRCA1 and BRCA2 are DNA damage mediators and important
players in HR186 (see also sections 1.1.2 and 2.2). BRCA1 is recruited to sites of DNA lesions
after phosphorylation by ATM and ATR104,187-189, associates with RAD51190 and mediates-S-
phase and G2/M cell cycle checkpoints through the serine-threonine checkpoint kinase
CHEK1191-193. The major downstream kinase of ATM is CHEK2, which itself has a vast number
of substrates, amplifies the DDR signal to TP53 and forwards it to CDC25 phosphatases
crucial for the regulation of cell cycle progression126. It plays a major role in promoting HR
over NHEJ through targeting BRCA1 and BRCA2194. Not only TP53, BRCA2 and KAP1 (KRAB
[Kruppel-associated box domain]-associated protein 1), but also BRCA1 is mediated by both
ATM and CHEK2, which is likewise involved in cell cycle arrest to enable progression of DNA
DSB repair121,194. CHEK2 phosphorylation of BRCA1 furthermore promotes RAD51
recruitment, leading to strand invasion and exchange in the course of HR2 (section 1.1.2.).
Activation of CHEK2 by ATM and ATR includes several phosphorylation steps and involves
the phosphorylation sites Ser19, Thr26, Ser28, Ser33, Ser35, Ser50, and Thr68, as well as
autophosphorylation of CHEK2 itself in the course of signal amplification131,195,196.
Phosphorylation at the Thr68 residue is believed to be the initial activation step197-199, which
is followed by autophosphorylation of CHEK2 on residues Thr383 and Thr387 and
oligomerization to increase kinase acitivity197,200,201. Active monomers of CHEK2 can
translocate into the nucleus and target several substrates including cell cycle checkpoint
kinases to prevent cell cycle progression, and BRCA1 and BRCA2 to mediate HR194. After
completion of DNA damage repair, CHEK2 returns to an inactive state by protein
modification and degradation194.
Another major substrate of ATM is KAP1, which functions as transcriptional repressor and is
an important component of condensed heterochromatin202,203. As heterochromatin is
transcriptionally silent and tightly packed, repair of DNA requires more time in this part of
the genome and also differential regulation of repair compared to euchromatin-related
repair204,205. KAP1 is phosphorylated by ATM at the highly conserved residue Ser824 within
30 min after DNA damage206,205. Furthermore, it has been shown that DNA-PK and ATR,
besides ATM, can also activate KAP1206. Upon activation by phosphorylation, pKAP1
translocates into the nucleus, associates with damaged sites in chromatin, and has been
shown to colocalize with the damage foci of 53BP1, γH2AX and BRCA1206. It furthermore
serves as marker of sustained ATM activity at unrepaired sites within heterochromatin as its
phosphorylation is maintained by the hyperaccumulation of the MRN complex, dependent
on 53BP1, which mediates retention of ATM205.
The role of ATM in DNA repair, cell cycle control and survival pathways has been intensely
studied, however, there is also growing evidence that ATM mediates apoptosis through the
tyrosine kinase ABL1 (ABL Proto-Oncogene 1, Non-Receptor Tyrosine Kinase)207. ABL1 is
implicated in the hematological malignancy chronic myeloid leukemia (CML), in which ABL1
is fused to BCR after translocation, resulting in the BCR-ABL oncogene208. Following DNA
damage, ABL1 mediates cell fate determination in the context of cell cycle arrest in G1 or
induction of apoptosis by interaction with the tumor suppressor proteins TP53 or RB and the

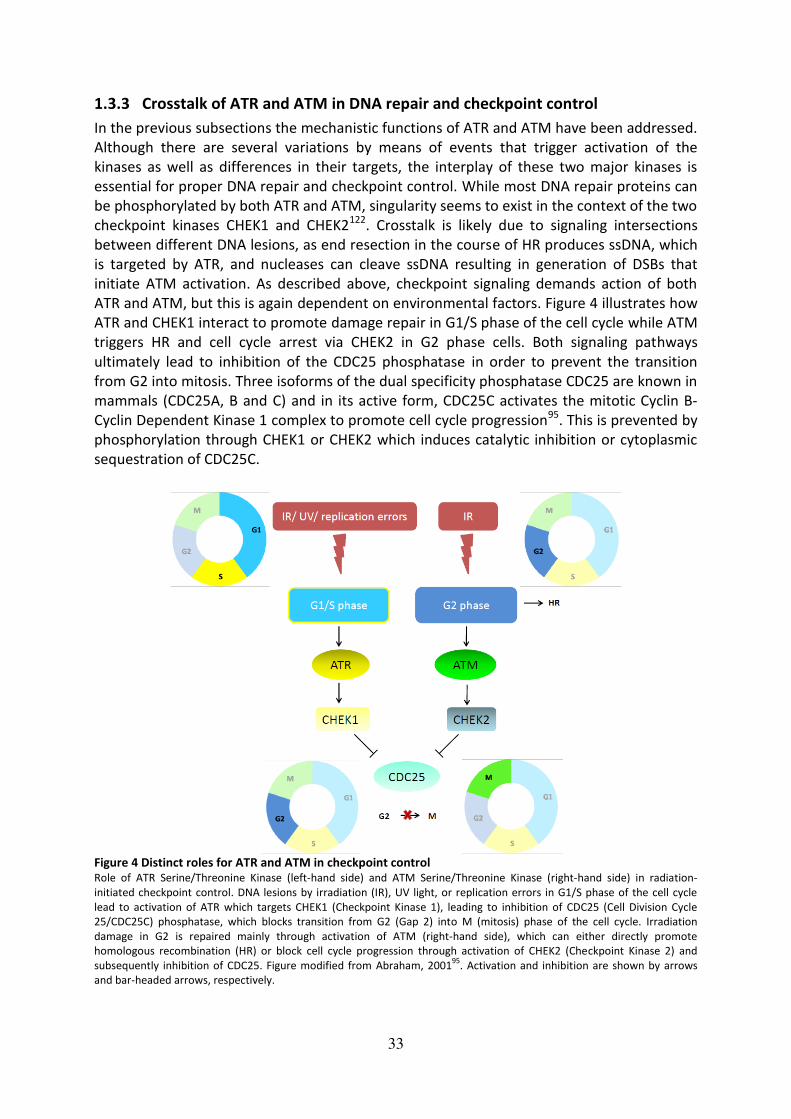
33
1.3.3 Crosstalk of ATR and ATM in DNA repair and checkpoint control
In the previous subsections the mechanistic functions of ATR and ATM have been addressed.
Although there are several variations by means of events that trigger activation of the
kinases as well as differences in their targets, the interplay of these two major kinases is
essential for proper DNA repair and checkpoint control. While most DNA repair proteins can
be phosphorylated by both ATR and ATM, singularity seems to exist in the context of the two
checkpoint kinases CHEK1 and CHEK2122. Crosstalk is likely due to signaling intersections
between different DNA lesions, as end resection in the course of HR produces ssDNA, which
is targeted by ATR, and nucleases can cleave ssDNA resulting in generation of DSBs that
initiate ATM activation. As described above, checkpoint signaling demands action of both
ATR and ATM, but this is again dependent on environmental factors. Figure 4 illustrates how
ATR and CHEK1 interact to promote damage repair in G1/S phase of the cell cycle while ATM
triggers HR and cell cycle arrest via CHEK2 in G2 phase cells. Both signaling pathways
ultimately lead to inhibition of the CDC25 phosphatase in order to prevent the transition
from G2 into mitosis. Three isoforms of the dual specificity phosphatase CDC25 are known in
mammals (CDC25A, B and C) and in its active form, CDC25C activates the mitotic Cyclin B-
Cyclin Dependent Kinase 1 complex to promote cell cycle progression95. This is prevented by
phosphorylation through CHEK1 or CHEK2 which induces catalytic inhibition or cytoplasmic
sequestration of CDC25C.
Figure 4 Distinct roles for ATR and ATM in checkpoint control Role of ATR Serine/Threonine Kinase (left-hand side) and ATM Serine/Threonine Kinase (right-hand side) in radiation-
initiated checkpoint control. DNA lesions by irradiation (IR), UV light, or replication errors in G1/S phase of the cell cycle
lead to activation of ATR which targets CHEK1 (Checkpoint Kinase 1), leading to inhibition of CDC25 (Cell Division Cycle
25/CDC25C) phosphatase, which blocks transition from G2 (Gap 2) into M (mitosis) phase of the cell cycle. Irradiation
damage in G2 is repaired mainly through activation of ATM (right-hand side), which can either directly promote
homologous recombination (HR) or block cell cycle progression through activation of CHEK2 (Checkpoint Kinase 2) and
subsequently inhibition of CDC25. Figure modified from Abraham, 200195
. Activation and inhibition are shown by arrows
and bar-headed arrows, respectively.

34
1.4 The Fanconi anemia (FA) pathway
1.4.1 Genetic heterogeneity of Fanconi anemia
Among the diversity of different repair mechanisms, the Fanconi anemia pathway is highly
interconnected with other DNA repair branches and cell cycle control functions. The
genetically heterogeneous recessive disorder Fanconi anemia (FA) belongs to the
chromosome breakage syndromes and is characterized by cytogenetic instability,
hypersensitivity to DNA crosslinking agents, increased chromosomal breakage, defective
DNA repair, bone marrow failure and susceptibility to a variety of cancers221-223. The FA core
complex consists of 14 proteins, which have been implicated in DNA damage signaling of
replication-fork-blocking ICLs, rendering them highly important for prevention of toxic
lesions that inhibit strand separation during replication and transcription20. Drugs which
induce ICLs have been one of the first forms of chemotherapeutics and are still prominent in
cancer therapy. However, functions of the FA complex are not limited to ICL repair but in
fact extend to stabilization and protection of replication forks, regulation of cytokinesis, end
resection and interaction with several other repair pathways223. Up to date, 19 FA gene
products have been identified, and several more are known to be part of the FA complex.
Furthermore, crosstalk with NER, NHEJ and also HR, hence the name FA/BRCA pathway, has
been reported. The clinical characteristics of FA show some connections with other
disorders, for example XP, tumors of breast, ovary, pancreas and especially hematological
malignancies like myeloid leukemia223. Several genes have been described as breast and
ovarian cancer susceptibility genes, for example BRCA2/FANCD1, BRCA1/FANCS,
BRIP1/FANCJ, FANCM, PALB2/FANCN and RAD51C/FANCO. BRCA1, BRCA2, FANCN and
FANCO are also associated with familial predisposition to cancer, the latter being
additionally linked to head and neck cancers223-224. As some of the classical features of FA are
missing in patients with FANCO, RAD51/FANCR and FANCS mutations, these genes have
been designated FA-like genes. The most intensively characterized function of FA genes is
proper repair of ICLs, which picture a threat to genomic integrity by initiation of DNA
breakage and chromosomal rearrangements20.
1.4.2 The FA pathway in crosslink repair
DNA-protein-, or DNA-DNA-crosslinks can be induced by chemical agents such as alcohol,
cigarette smoke, dietary fat and especially crosslinking agents like mitomycin C used in
diagnositics225 and chemotherapeutics (see subsection 2.3.4). Crosslink repair is
characterized by the interplay of FA pathway components and homologous recombination,
requires replication-fork convergence and hence proceeds mainly during S-phase223 226. The
sensing of the damage by FANCM (Fanconi anemia complementation group M) and
recruitment of ATR to the lesion, which phosphorylates and activates FANCM, is the initial
step of ICL repair. FANCM bound to chromatin provides a scaffold for the FA core complex,
which forms nuclear foci dependent on ATR and BRCA2227, and assumes the function of a
constituted ubiquitin ligase for FANCD2 and FANCI. FANCL (Fanconi anemia
complementation group L) catalyzes the first sequence in a complex cascade of
ubiquitination steps, finally emerging in nucleolytic incision to “unhook” the ICL at converged replication forks by ubiquitinated FANCD2228. Subsequently, several
endonucleases and scaffold proteins are recruited, including complexes consisting of XPF
family members, such as EME1 (Essential meiotic endonuclease 1 homolog 1). The sequence
homologue EME2 has been designated as the more active endonuclease that also shows
broader substrate specificity and seems to promotes reactions which are specific to higher

35
eukaryotes229,230. After unhooking of the ICL, the lesion is bypassed by a process known as
“insertion”, in which translesion synthesis polymerases, which can accommodate bulky
adducts, incorporate nucleotides opposite the ICL and extend the nascent strand
(“extension”), however, this process is susceptible to the introduction of mutations223.
Particularly the insertion step is highly error-prone231, which is believed to be accomplished
by a POL ν-RAD51 interaction, thus establishing a link to homologous recombination
repair232-234. The DSB that was introduced during the incision step, is subsequently repaired
by HR proteins235, which are downstream of the FANCD2-I complex223. This complex consists
of the paralogues FANCD2 and FANCI, is activated by the recruitment of the FA core complex
to the site of the ICL, and subsequently ubiquitinated by FANCL in conjugation with
FANCT223. In a complex with BRCA2 and PALB2/FANCN, ssDNA nucleofilaments are formed
by the recombinase RAD51, which catalyzes strand invasion, associates with RPA near the
ICL and catalyzes the extension step236 237. Furthermore, the association of RAD51 with its
paralog RAD51C/FANCO has been described in the context of ICL repair, however, its effects
are downstream of unhooking and FANCD2 monoubiquitination238.
1.4.3 Bridging of the FA pathway with other DNA repair mechanisms
Several lines of evidence indicate the interconnecting functions of the FA pathway with
other DNA repair complexes. As described above, FANCL is a putative E3 ubiquitin ligase
subunit of the core complex of nuclear FANC proteins222, whereas the recombinase
FANCO/RAD51C is a member of the RAD51 family of strand-transfer proteins that is involved
in homologous recombination and repair of DNA239 240. RAD51C deficiency is characterized
by hallmarks of the FA phenotype, such as ICL sensitivity, chromatid-type errors and G2/M-
accumulation, however, it is also associated with breast and ovarian cancer susceptibility. It
plays a major role in HR-mediated repair, replication and intra-S-phase checkpoint control
through CHEK2 activation238, underlining its role in ATM-signaling. Several studies have
shown the synergy of the FA pathway and HR, suggesting that the HR proteins function
downstream of FANCD2 activation, whereas FA-proteins also regulate HR by interaction with
the MRN complex and POL ν223. Furthermore, connections between the BRCA1-binding
helicase FANCJ and MLH1 are known, which demonstrates the role of FA proteins in
mismatch repair241. A functional association of the FA pathway with the DNA-end-resection
factor RBBP8 has been shown, as FANCD2 works in a complex with BRCA1 and MRE11A to
recruit RBBP8 to stalled replication forks242-244, demonstrating its role in initiation of
homologous recombination and fork stabilization through protecting emerging DNA strands
from MRE11A-mediated degradation223. Apart from HR, MR and the replication stress
response, the FA pathway also mediates suppression of NHEJ, therefore displaying a role
outside S-phase. As discussed in section 1.1.2, NHEJ is the major repair pathway of DSBs, but
also highly error-prone, demanding a significant level of regulation. Furthermore, the FA-
related cellular sensitivity to cytotoxic agents can be targeted by inhibiting the NHEJ
components DNA-PK and LIG4 by limiting the binding capacity of the Ku subunit through
resection of the DSB ends by FANCD2245-248. This channels repair towards end-resection-
dependent pathways of HR and the error-prone alternatives end joining and single-strand
annealing pathways, which can lead to genome rearrangements and oncogenic
transformation223,249. Furthermore, an inhibitory relationship between FANCD2 and 53BP1
was shown, which seems to depend on the histone acetylase TIP60. 53BP1 accesses
chromatin through binding to dimethylated H4, which is prevented by TIP60 resulting in
favoring HR over NHEJ245,250,251. FANCD2, which hinders the access of 53BP1 to chromatin in
a TIP60-dependent manner, resulting in increased levels of 53BP1 at chromatin lesions,

36
thereby favors NHEJ over DNA resection and HR250. Recently, the Tudor interacting repair
regulator (TIRR) was identified as regulator of 53BP1 by masking its binding function to H4
and hindering its localization to DSBs252.
From studies with cells from XP patients, a link between the FA pathway and NER emerged,
as cells deficient in NER genes (which applies to XP patients) are also sensitive to the
generation of crosslinks253 and vice versa, inactivation of FA-components can result in
increased sensitivity to UV-light, and hence crosslink-repair254. NER proteins, for example
XPC255, have been shown to be important for recruitment of the FA core complex as well as
excision of ICLs223. The above stated findings suggest that the FA pathway plays a more
general role in favoring genomic stability than previously anticipated. This underlines the
fact that DNA repair pathways are highly interconnected in a complex network of interacting
processes, rather than being absolutely unique in their functions as genomic integrity
wardens.
1.5 The translationally controlled tumor protein as new player in DNA repair
The translationally controlled tumor protein (TPT1, also known as TCTP, fortilin, p23 or
histamine releasing factor/HRF) is ubiquitously expressed in all eukaryotic cells, evolutionary
highly conserved and involved in several cellular processes256. TPT1 can be found in almost
all human tissues, except kidney tissue257. The level of TPT1 mRNA depends on cell type,
developmental stage and extracellular stimuli258. TPT1 has been identified as an important
factor in tumor reversion259 260, is highly expressed in tumor tissues, especially of epithelial
origin256, and promotes cell migration, invasion and metastasis via induction of epithelial to
mesenchymal transition261. The transcription of TPT1 can be positively regulated by the
CRE/CREB complex (cAMP-response element/cAMP-response element binding protein)262
and by DNA damaging agents like etoposid and cisplatin, while it is negatively regulated by
TP53263. TPT1 overexpression can lead to TP53 degradation and loss of TP53-mediated
apoptosis induction264, whereas TP53 can downregulate TPT1 levels259, suggesting
antagonistic effects of the two proteins. While the antagonistic effect on TP53 would suggest
an oncogenic function, Zhang et al. (2012) have reported that TPT1 interacts with TP53 to
inhibit cellular proliferation in irradiated cells265. Furthermore, low-dose γ IR enriched TPT1
in nuclei of normal human cells and its upregulation appeared to be dependent on ATM and
DNA-PK kinases. In that study, TPT1 formed a complex with ATM, phosphorylated H2AX and
53BP1, exhibited a protective effect on irradiated cells and thus may play an important role
in the maintenance of genomic integrity. Conflicting data regarding the TPT1 interactome
has been published as one proteomics study did not identify these proteins as part of the
TPT1 interactome in HeLa cells266. Contrasting these findings, a functional interaction with
RAD51 and other DNA repair components was very recently published in HeLa cells267.
Furthermore, it has been demonstrated that the protein level of TPT1 in breast cancer tissue
is significantly higher than in healthy tissues268, similar to what has been described for
cancers of colon, liver, prostate, skin and throat263. While TPT1 is known as both marker and
prognostic factor for breast cancer, its molecular impact is still incompletely understood269.

37
2 Introduction part 2: Individual radiosensitivity in cancer treatment
2.1 Cancer
Cancer reflects one of the leading causes of morbidity and mortality worldwide and has been
catching up to heart diseases as Grim Reaper number one in the last years270-272. The number
of new cancer cases is expected to rise by about 70 % over the next 2 decades273, promoted
by risk factors such as aging of the population and lifestyle changes like smoking,
overweight, physical inactivity as well as alternating reproductive patterns due to economic
development as well as immune system conditions274 275. It is considered as a multigenic and
multicellular disease276 and six hallmarks of cancer have been identified277: unlimited
proliferative potential, evasion of apoptosis, environmental independence for growth,
angiogenesis, invasion and metastasis throughout the body. However, this definition has
been critically discussed, as five of the proposed hallmarks also relate to benign tumors,
which are not invasive or possess metastatic potential278. Due to tremendous efforts in
cancer research, many underlying processes are now well understood and, as early
preventive and treatment options have advanced during the last years, many cancer types
have become curable279.
There are about 200 different types of cancers and classification is complex and subject to
change as increasing amounts of data are available due to rapid progress in research, for
example through access to OMICS data280. Carcinomas, which arise from epithelial cells, are
the most common type and account for up to 90 % of cancers, affecting the internal and
external linings of the body, including the skin281. Further subdivision includes basal cell
carcinomas and squamous cell carcinomas as the two most common human cancer types
which incidence is expected to double within the next 20 years282. Basal cell carcinoma is the
most common cancer, presenting low mortality but high morbidity283, and affecting only the
deepest layer of skin cells281. Squamous cell carcinoma (SCC) occurs in organs that are
covered with squamous epithelium including the top layer of the skin, lips, mouth,
esophagus and airways, urinary tract, prostate, lungs, vagina and cervix281 284. The majority
of cases within the SCC category includes non-melanoma skin cancer, esophageal cancer,
non-small cell lung cancer and head and neck cancer284. About 85 percent of head and neck
cancers are oral cancers which can involve the mouth, tongue, tonsils, the pharynx (throat)
and the nasal passageways285. Rectum cancer, sometimes referred to as part of the second
most common cancer type: colorectal cancer (see Figure 5), belongs to the cancers of the
digestive tract and accounts for 28 % of large intestine cancers286. Prostate cancer belongs to
the cancers of the genitourinary system and accounts for the majority of cancer deaths in
men287. Being the most prevalently diagnosed form of non-cutaneous malignancies in men,
its incidence is continuously rising (Figure 5)287 288. The molecular mechanisms underlying
this form of cancer involve androgens, which are male steroid hormones, and a well
established subject to therapy288. Breast cancer accounts for the largest group of cancer
diagnoses in women and is estimated to increase further (Figure 5). As the majority of
patients in this study were diagnosed with mammary carcinoma, this type of cancer will be
discussed in more detail in section 2.2.
Radiosensitive patients with the following cancers were collected for this study: 13 breast
cancer (two were chemoradiosensitive), one rectum, one prostate (which was
chemoradiosensitive), two oral cavity and pharynx (one hypopharynx and one keratinizing
squamous cell carcinoma of the base of the tongue), one head and neck (squamous

38
epithelium carcinoma of left tonsil) and one skin cancer (squamous cell carcinoma external
ear). Standard treatment of these patients had resulted in high toxicity, see Supplementary
table S-1.
Figure 5 Estimated new cancer cases and deaths in the USA in 2017, adapted from Siegel et al.
289
2.2 Breast cancer
2.2.1 Genetic predisposition and familial breast cancer
Breast cancer has been the leading cause of cancer deaths among females during the last
years275 and can affect females and males in more and less economically developed
countries worldwide. Less sophisticated countries become more and more afflicted, where
breast cancer remains the leading cause of cancer deaths among females275. Apart from
environmental risk factors, several genetic alterations can account for breast cancer
predisposition290 and morbidity and mortality can be reduced by preventative measures
through identification and care of patients with high risk due to genetic background291, while
the interplay between environmental factors and genetic predisposition also remains
substantial290. The growing understanding of the heterogeneous molecular nature of breast
cancer and its subtypes has reduced the mortality during the last two decades292 293,
emphasizing the importance of continuative research to gain additional insights into the
biochemical fingerprint of the disease eventually leading to individualized treatment.
39
Current data suggests that autosomal dominant susceptibility alleles account for up to 10 %
of breast cancers294 295, which are categorized as “hereditary” in contrast to “sporadic”290,
and it has been reported that 25 to 30 % of all breast cancers arise due to genetically
determined factors296. High- to intermediate-penetrance alleles were identified in over 20
genes which participate in DNA damage signaling and repair and some 180 low-penetrance
loci are known297 298. Breast cancer can be promoted by accumulation of mutations in
essential genes, such as BRCA1 (BReast CAncer 1)299 300 and BRCA2 (BReast CAncer 2)299 301
with high penetrance, in less than 7 % of cases302, or due to the cumulative effects of
mutations in several low-penetrance susceptibility genes290. Mutations in tumor suppressor
genes, for example Tumor Protein 53 (TP53) can account for a risk increase to a greater level
than BRCA1 and BRCA2302-304. Furthermore, PALB2 (partner and localizer of BRCA2), which
participates in homologous recombination repair (HR) and Fanconi Anemia is also classified
as high-risk299 305, while classical mutations in ATM297 306 307
(Ataxia Telangiectasia Mutated),
CHEK2 (checkpoint kinase 2)297, BARD1 (BRCA1 associated RING domain 1)306 308 or NBN297 309
310 account for moderate/intermediate risks.
Familial breast cancer (Fam BC) was initially defined as the occurrence of two or more first
degree relatives in the nuclear pedigree including the proband311 and accounts for 15–20 %
of all breast cancer cases290. Germline mutations in BRCA1 and BRCA2 and other rare
variants are associated with 15–20 % of familial breast cancer cases, while BRCA1 germline
mutations were identified in up to 80 % in patients with a family history including breast and
ovarian cancer290. In our study, 11 Fam BC patients served as comparison group to make out
differences in truncating mutations in selected pathways compared to RS (radiosensitive) BC
patients and control for identification of potentially genetically determined cancer and DNA
repair related dysfunctional background.
2.2.2 Breast cancer subtypes and triple negative breast cancer
The phenotypical convergence of genetic and epigenetic alterations into four main breast
cancer classes, which differ in prognosis and therapeutic response, was described by a large-
scale approach in 2012 by The Cancer Genome Atlas Network312. These four classes differ in
outcome prediction and response to treatment. Apart from the occurrence of genetic
susceptibility variants, breast cancer is characterized by hormone receptor status. The most
prominently represented subtype “luminal A” is characterized by high estrogen and progesterone receptor status and can be treated by hormone-based therapy if proliferation
rate of the cancer cells is low, and needs to be supplemented by chemotherapy to target
high proliferating cancer cells (“luminal B” as second most common subtype)312. A third
breast cancer subtype can be classified as “HER2E”, showing high protein and phosphoprotein expression of EGFR (Epidermal Growth Factor Receptor) and HER2 (human
epidermal growth factor receptor 2)312, now referred to as ERBB2 (Erb-B2 Receptor Tyrosine
Kinase 2), which can be treated by monoclonal antibodies like trastuzumab292 or tyrosine
kinase inhibitors like neratinib313.
Of all breast carcinomas, 10–15 % fall into the category of the “Triple negative breast cancer” (TNBC) subtype292, which is the diagnosis of 6 patients in our comparison group of
non-familial BC cases without irradiation side-effects. This subtype is associated with the
worst prognostic outcome314 and histologically characterized by lack of hormone receptor
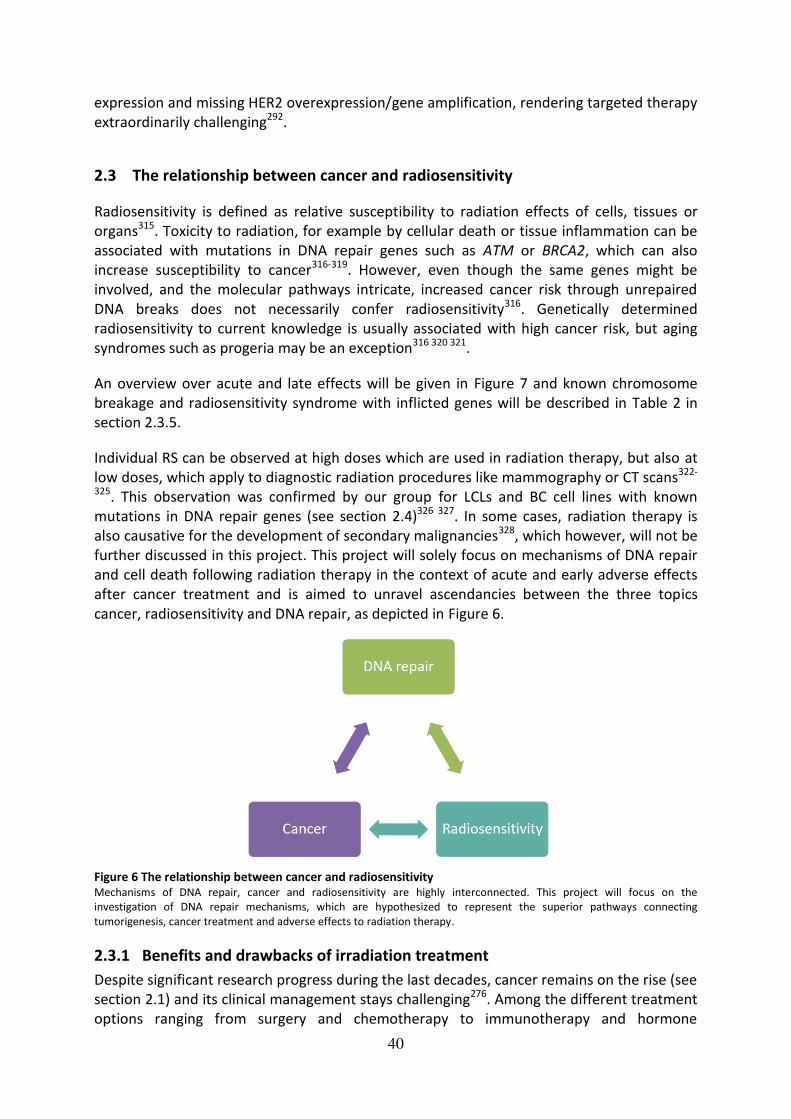
40
expression and missing HER2 overexpression/gene amplification, rendering targeted therapy
extraordinarily challenging292.
2.3 The relationship between cancer and radiosensitivity
Radiosensitivity is defined as relative susceptibility to radiation effects of cells, tissues or
organs315. Toxicity to radiation, for example by cellular death or tissue inflammation can be
associated with mutations in DNA repair genes such as ATM or BRCA2, which can also
increase susceptibility to cancer316-319. However, even though the same genes might be
involved, and the molecular pathways intricate, increased cancer risk through unrepaired
DNA breaks does not necessarily confer radiosensitivity316. Genetically determined
radiosensitivity to current knowledge is usually associated with high cancer risk, but aging
syndromes such as progeria may be an exception316 320 321.
An overview over acute and late effects will be given in Figure 7 and known chromosome
breakage and radiosensitivity syndrome with inflicted genes will be described in Table 2 in
section 2.3.5.
Individual RS can be observed at high doses which are used in radiation therapy, but also at
low doses, which apply to diagnostic radiation procedures like mammography or CT scans322-
325. This observation was confirmed by our group for LCLs and BC cell lines with known
mutations in DNA repair genes (see section 2.4)326 327. In some cases, radiation therapy is
also causative for the development of secondary malignancies328, which however, will not be
further discussed in this project. This project will solely focus on mechanisms of DNA repair
and cell death following radiation therapy in the context of acute and early adverse effects
after cancer treatment and is aimed to unravel ascendancies between the three topics
cancer, radiosensitivity and DNA repair, as depicted in Figure 6.
Figure 6 The relationship between cancer and radiosensitivity Mechanisms of DNA repair, cancer and radiosensitivity are highly interconnected. This project will focus on the
investigation of DNA repair mechanisms, which are hypothesized to represent the superior pathways connecting
tumorigenesis, cancer treatment and adverse effects to radiation therapy.
2.3.1 Benefits and drawbacks of irradiation treatment
Despite significant research progress during the last decades, cancer remains on the rise (see
section 2.1) and its clinical management stays challenging276. Among the different treatment
options ranging from surgery and chemotherapy to immunotherapy and hormone
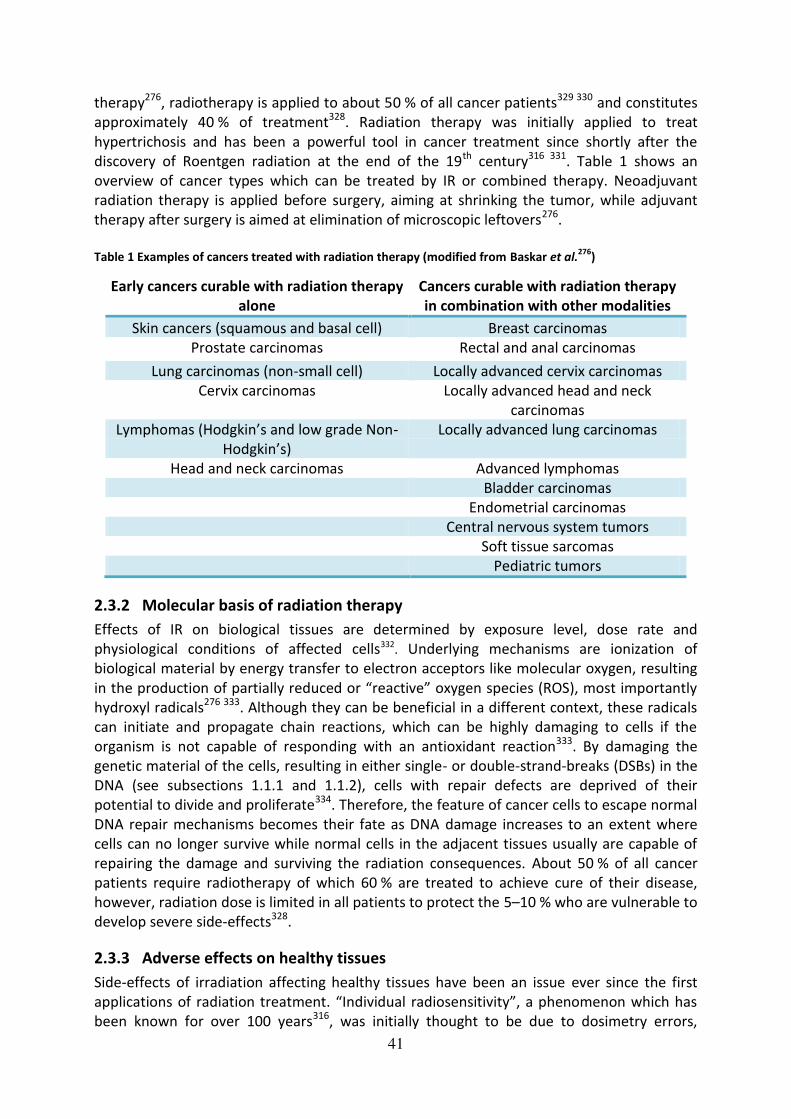
41
therapy276, radiotherapy is applied to about 50 % of all cancer patients329 330 and constitutes
approximately 40 % of treatment328. Radiation therapy was initially applied to treat
hypertrichosis and has been a powerful tool in cancer treatment since shortly after the
discovery of Roentgen radiation at the end of the 19th century316 331. Table 1 shows an
overview of cancer types which can be treated by IR or combined therapy. Neoadjuvant
radiation therapy is applied before surgery, aiming at shrinking the tumor, while adjuvant
therapy after surgery is aimed at elimination of microscopic leftovers276.
Table 1 Examples of cancers treated with radiation therapy (modified from Baskar et al.
276)
Early cancers curable with radiation therapy
alone
Cancers curable with radiation therapy
in combination with other modalities
Skin cancers (squamous and basal cell) Breast carcinomas
Prostate carcinomas Rectal and anal carcinomas
Lung carcinomas (non-small cell) Locally advanced cervix carcinomas
Cervix carcinomas Locally advanced head and neck
carcinomas
Lymphomas (Hodgkin’s and low grade Non-
Hodgkin’s) Locally advanced lung carcinomas
Head and neck carcinomas Advanced lymphomas
Bladder carcinomas
Endometrial carcinomas
Central nervous system tumors
Soft tissue sarcomas
Pediatric tumors
2.3.2 Molecular basis of radiation therapy
Effects of IR on biological tissues are determined by exposure level, dose rate and
physiological conditions of affected cells332. Underlying mechanisms are ionization of
biological material by energy transfer to electron acceptors like molecular oxygen, resulting
in the production of partially reduced or “reactive” oxygen species (ROS), most importantly hydroxyl radicals276 333. Although they can be beneficial in a different context, these radicals
can initiate and propagate chain reactions, which can be highly damaging to cells if the
organism is not capable of responding with an antioxidant reaction333. By damaging the
genetic material of the cells, resulting in either single- or double-strand-breaks (DSBs) in the
DNA (see subsections 1.1.1 and 1.1.2), cells with repair defects are deprived of their
potential to divide and proliferate334. Therefore, the feature of cancer cells to escape normal
DNA repair mechanisms becomes their fate as DNA damage increases to an extent where
cells can no longer survive while normal cells in the adjacent tissues usually are capable of
repairing the damage and surviving the radiation consequences. About 50 % of all cancer
patients require radiotherapy of which 60 % are treated to achieve cure of their disease,
however, radiation dose is limited in all patients to protect the 5–10 % who are vulnerable to
develop severe side-effects328.
2.3.3 Adverse effects on healthy tissues
Side-effects of irradiation affecting healthy tissues have been an issue ever since the first
applications of radiation treatment. “Individual radiosensitivity”, a phenomenon which has been known for over 100 years316, was initially thought to be due to dosimetry errors,

42
leading to subsequent improvement efforts and definition of reliable radiation units316 335. In
the early 1900s, suggestions have already been made that radiosensitivity could be linked to
the proliferation rate of cells336 and might be affected by hereditary or acquired
predisposition316 337. An important step forward and a possibility to actually quantify
radiation effects was the establishment of the “clonogenic (or “colony survival”) assay” as biological endpoint to measure the loss of proliferative potential in 1956338.
Research on normal tissue responses has been an issue for over 100 years and it is now
believed that injuries in normal tissues result from a dynamic and progressive process, rather
than immediate effects, and vary according to genetic predisposition and context of
treatment328. Application of ionizing radiation triggers ROS-related DNA damage, which
exerts a compromising effect on the cellular microenvironment. This triggers inflammation
by release of chemokines, inflammatory and fibrotic cytokines, for example transforming
growth factor-β1 (TGFB1) and changes in cell–cell interactions339. Furthermore, immune
deficiencies can also arise from DDR defects as primary cause334. Several genes involved in
DNA repair, immunological and apoptotic reactions have been suggested as drivers for
radiation side-effect reactions, however, no clear “radiosensitivity gene” apart from genes
inflicted in already known radiosensitivity syndromes (subsection 2.3.5), has been
discovered, see also subsection 2.3.5.
The classification systems of acute and late side-effects have changed over the years and the
first system was the RTOG (Radiation Therapy oncology Group)–EORTC system and was
replaced by the LENT SOMA (Late Effects Normal Tissues: Subjective, Objective,
Management and Analytic) system340-343. This again was exchanged and updated through the
National Cancer Institute (NCI) Common Terminology Criteria for Adverse Effects version 3.0
(CTCAE v3.0), which includes recording of acute and late effects and the category of death
following radiotherapy344, of which an update to version 4.0 is available today345.
Different forms of radiation side-effects have been described and can be divided into acute
and late effects, see Figure 7. Acute effects can arise during or shortly after treatment
(within 90 days of treatment according to315), are normally reversible and not considered
dose-limiting. They usually arise in highly proliferating tissues such as skin through
impairment of wound healing by effects on fibroblasts346, hair, gastrointestinal tract or
haematopoietic system and tend to cause inflammation328. They are unaffected by changes
of radiation dose per fraction but vary with radiation delivery time, but usually subside
during the first weeks after treatment. Acute toxicity is usually handled by expanding general
treatment time in parallel to limiting applied doses, which however, also reduces
effectiveness of cancer cell killing and is therefore contradictory by means of treatment
efficiency. Late effects usually occur during 6 months up to years after radiotherapy (more
than 90 days after treatment according to315) and include severe reactions that can be
permanent328. In contrary to acute effects, these afflictions relate to slow-proliferating
tissues such as heart, central nervous system and kidneys and include vascular damage,
atrophy and fibrosis. Furthermore, second malignancies and hormone deficiencies such as
infertility can arise and opposite to acute effects, late effects seem to be influenced by the
entire therapy time to a lesser extent and rather sensitive to alterations in radiation dose per
fraction328. Variations in patients response by means of acute as well as late effects was
proposed to follow a Gaussian distribution347 and several environmental factors other than
solely genetic inheritance, which is estimated to account for 80 % of side-effects348, need to

43
be considered for estimating the risk of side-effects. Risk factors can be the patient’s age, nutritional status, smoking habits, vascular and connective tissue diseases, diabetes mellitus,
infections and hypertension among others. Additional influence factors are radiation
parameters (as radiation dose-response follows a steep correlation), as well as possible
additional therapies such as surgery or chemotherapy and after all, chance according to
Poisson statistics need to be considered additional influence factors349-352.
Figure 7 The toxicity of radiotherapy Overview over a selection of acute and late adverse effects of radiotherapy, figure based on
328. Acute effects are shown in
orange boxes on the left-hand side and late effects are shown on the right-hand side in yellow boxes. Some examples of
effects are given at the bottom boxes.
2.3.4 Chemoradiosensitivity
The use of chemical agents in cancer chemotherapy is a well established and effective
therapy procedure which is directed at introducing DNA lesions in highly proliferative cancer
cells which subsequently die due to failure of repair capacity. Such agents initiate a variety of
DNA lesions ranging from alkylating agents like methyl-methane sulfonate (MMS), which
attach alkyl residues to DNA bases, to crosslinking agents such as mitomycin C (MMC) and
cisplatin, which induce intra-, and interstrand crosslinks2. For decades, 5 Fluorouracil (5FU)-
based therapy, which utilizes the antimetabolite properties of the base analogue 5FU, has
remained the standard first-line chemotherapy treatment in the majority of cancers and its
combination with cisplatin and radiation therapy became common clinical praxis353. In
contrast to surgery or radiation therapy, chemotherapy is not restricted to a certain area but
attacks cancer cells throughout the body. It is successfully used for treatment of the majority
of cancers, however, patients often suffer from side-effects. These can exceed hair loss,
inflammatory responses and skin or intestinal toxicity and extend to severe consequences.
Potentially lethal toxicity has been reported in the context of Dihydropyrimidine
dehydrogenase (DPYD) deficiency after 5FU administration related to defects in the DPYD
gene354. However, only a minority of chemotoxicity effects can be explained by this disorder

44
and the search for chemoradiotherapy-markers during the last decade in order to predict
outcome and benefit of chemotherapy revealed several associations of known DSB repair
genes related to toxicity effects. Those included TP53, BRCA1, XPA/XPC, RAD51, MLH1 and
PARP1 among others. However, not enough data on their usefulness in the clinical praxis are
available up to date355-357. In chemoradiotherapy, a combination of chemotherapy and
radiotherapy is applied in which chemotherapy often serves as radiosensitizer358. Similar to
personal manifestation of sensitivity to radiotherapy, the response to radiotherapy differs
strongly between patients. Assuming that all cells within a tumor have developed from
formally normal tissue cells, the inherent genetic sensitivity towards DNA damage should be
accessible via the genetic profile of the patient359. However, tumors always harbor a mixed
population of cells and highly proliferating cells are more sensitive to DNA damaging agents
compared to quiescent cells, but a recent study has correlated acute organ toxicity with
clinical outcome, suggesting varying levels of inherent repair capacity might serve as
prognostic marker in chemoradiosensitivity360.
2.3.5 Known radiosensitivity syndromes and inflicted genes
Radiosensitivity has been described by reference to borderline cases in an “all-or-none“-
manner, where patients with DNA Ligase 4 (LIG4) and ATM mutations consequently
succumbed to radiation therapy, however, such incidents were extremely rare316 361-363.
Table 2 shows an overview of chromosome breakage syndromes and known radiosensitivity
syndroms, with assignments to involved genes88,140,364-370. Moderate radiosensitivity
reactions such as proctitis (inflammation of the rectum lining) and dermatitis (inflammation
of the skin) arise much more frequently, as up to 15 % of cancer patients without established
radiosensitivity syndromes suffer from severe complications in the course of radiation
treatment316 371-375. None of these observations are due to dosimetry errors, however, one
historical radiation accident needs to be considered in which overdosing thousands of
prostate cancer patients with radiation therapy resulted in a wide variety of reactions
ranging from cure of the patients to decease, even though each patient suffered from the
same conditions (20 % excess of dose)376.
Table 2 Chromosome breakage and radiosensitivity syndroms
Genes Name Function Disease Additional features
BLM Bloom Syndrome
RecQ Like Helicase
Helicase Bloom’s syndrome
Chromosome
breakage syndrome,
cancer
predisposition,defecti
ve immunity
ATM Ataxia telangiectasia
mutated
Serine/threo
nine kinase in
HR, telomere
protection
and cell cycle
arrest
Ataxia
telangiectasia
Chromosome
breakage syndrome,
cancer proneness
(especially of
lymphoid origin),
neurodegeneration,
immunodeficiency,
cellular
radiosensitivity,
radioresistant DNA
synthesis
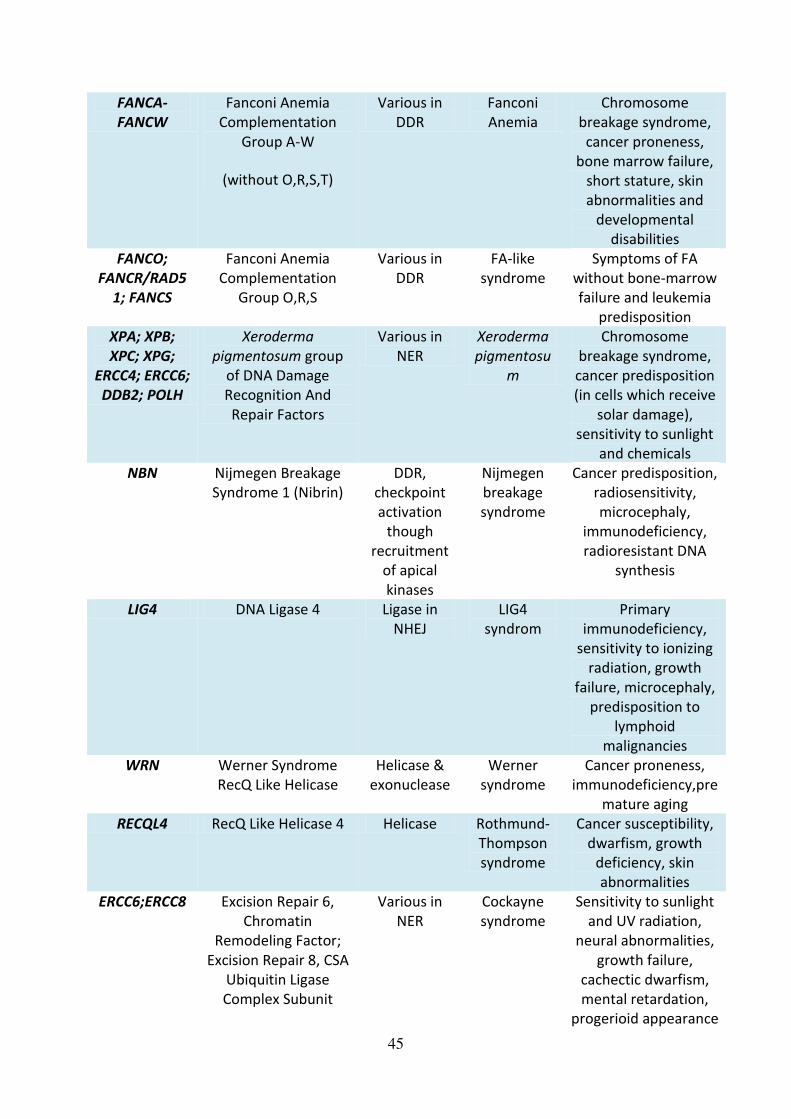
45
FANCA-
FANCW
Fanconi Anemia
Complementation
Group A-W
(without O,R,S,T)
Various in
DDR
Fanconi
Anemia
Chromosome
breakage syndrome,
cancer proneness,
bone marrow failure,
short stature, skin
abnormalities and
developmental
disabilities
FANCO;
FANCR/RAD5
1; FANCS
Fanconi Anemia
Complementation
Group O,R,S
Various in
DDR
FA-like
syndrome
Symptoms of FA
without bone-marrow
failure and leukemia
predisposition
XPA; XPB;
XPC; XPG;
ERCC4; ERCC6;
DDB2; POLH
Xeroderma
pigmentosum group
of DNA Damage
Recognition And
Repair Factors
Various in
NER
Xeroderma
pigmentosu
m
Chromosome
breakage syndrome,
cancer predisposition
(in cells which receive
solar damage),
sensitivity to sunlight
and chemicals
NBN Nijmegen Breakage
Syndrome 1 (Nibrin)
DDR,
checkpoint
activation
though
recruitment
of apical
kinases
Nijmegen
breakage
syndrome
Cancer predisposition,
radiosensitivity,
microcephaly,
immunodeficiency,
radioresistant DNA
synthesis
LIG4 DNA Ligase 4 Ligase in
NHEJ
LIG4
syndrom
Primary
immunodeficiency,
sensitivity to ionizing
radiation, growth
failure, microcephaly,
predisposition to
lymphoid
malignancies
WRN Werner Syndrome
RecQ Like Helicase
Helicase &
exonuclease
Werner
syndrome
Cancer proneness,
immunodeficiency,pre
mature aging
RECQL4 RecQ Like Helicase 4 Helicase Rothmund-
Thompson
syndrome
Cancer susceptibility,
dwarfism, growth
deficiency, skin
abnormalities
ERCC6;ERCC8 Excision Repair 6,
Chromatin
Remodeling Factor;
Excision Repair 8, CSA
Ubiquitin Ligase
Complex Subunit
Various in
NER
Cockayne
syndrome
Sensitivity to sunlight
and UV radiation,
neural abnormalities,
growth failure,
cachectic dwarfism,
mental retardation,
progerioid appearance

46
XPB/ERCC3;X
PD/ERCC2;TFB
5/GTF2H5
ERCC Excision Repair
3, TFIIH Core Complex
Helicase Subunit;ERCC
Excision Repair 2,
TFIIH Core Complex
Helicase Subunit;
General Transcription
Factor IIH Subunit 5
Various in
NER
Trichothiody
strophy
Sensitivity to sunlight
and UV radiation,
progeria, growth
retardation
ATR Ataxia telangiectasia
and Rad3-related)
Serine/threo
nine kinase in
DDR,
replicative
stress
response,
telomere
protection
and cell cycle
arrest
Seckel
syndrome
Primordial dwarfism,
CNS anomalies, ‘bird-
like’ face
RAD50 RAD50 Double Strand
Break Repair Protein
DSB repair,
cell cycle
checkpoint
activation,
telomere
maintenance
RAD50
deficiency/A
TLD
Microcephaly, mental
retardation, ‘bird-like’ face, short stature,
chromosomal
instability, cellular
radiosensitivity, radio-
resistant DNA
synthesis
MRE11A MRE11A Homolog,
Double Strand Break
Repair Nuclease
3' 5'
exonuclease
activity and
endonucle-
ase activity
Ataxia-
telangiectasi
a-like
disorder
(ATLD)
Chromosomal
instability, cancer
predisposition, cellular
radiosensitivity,
radioresistant DNA
synthesis
The chromosome breakage syndroms Ataxia telangiectasia (A-T), Bloom’s syndrome, Fanconi Anemia and Xeroderma pigmentosum have been known since decades140 and share the
common feature of increased cancer risk. Patients suffering from these disorders are
strongly radiosensitive and have been shown to develop gaps in skin fibroblasts after
radiation treatment377-379. A-T results from mutations in the ATM gene which causes cancer
proneness, immunodeficiency, radiation sensitivity, telangiectasia, atropy, cerebellar
degeneration, abnormalities in pigmentation and accelerated hair graying. A-T
heterozygosity is found in 1 % of the population380-382. Bloom’s syndrome, as well as Werner syndrome, and Rothmund-Thomson syndrome/RAPADILINO/Baller-Gerold syndrome, share
mutations in the helicases BLM, WRN, and RTS, respectively, which manifest as rare genomic
instability disorders88,383. Bloom’s syndrome is characterized by immunodeficiency and mutations in BLM result in impairment of its ATPase or helicase functions by
mislocalization87,384 385. In Werner syndrome, the BLM homolog WRN is truncated and results
in a premature aging phenotype, along with senescent features of cells, disturbed telomere
function and high cancer incidence87,386 387. Mutations in the helicase encoded by the

47
RECQL4 gene causeRothmund-Thomson syndrome, which leads to cancer susceptibility,
growth deficiency/dwarfism and skin abnormalities388 389. RECQL4 is known to localize to
telomeres and mitochondria and mediates growth arrest after DNA damage87,390.
Xeroderma pigmentosum is another chromosome breakage syndrome, associated with
defects in nucleotide excision repair and susceptibility to UV-related damage, leading to
increased cancer risk366,391. Related disorders are Cockayne syndrome (CS) and
trichothiodystrophy (TTD), all based on defects in NER. Mutations in ERCC6 and ERCC8 genes
cause growth implication, microcephaly, cachectic dwarfism and neurodegenration in
patients with CS392-394, while defects in XPB, XPD or TFB5 cause the progeroid disorder TTD,
which is further characterized by growth retardation and a photosensitive phenotype395. As
described in section 1.4, the FA genes are involved in DNA repair and defects in these genes
can result in SSBs, which induces progressive shortening of telomeres and chromosome-end
fusions as well as multinucleated cells396. Mutations in FA-genes result in cancer proneness,
developmental failures, short stature as well as bone marrow failure and skin implications397,
and 19 genes are currently known to cause FA (FANCA-FANCW)223, some of which are also
associated with breast and/or ovarian cancer predisposition in heterozygotes223 396.
The Nijmegen breakage syndrome (NBS) was often confused with LIG4 syndrom or FA, as
patients share a certain number of symptoms, such as cancer predisposition,
radiosensitivity, chromosomal breakage, microcephaly and immunodeficiency370. Similar to
A-T as well as NBS, patients with ataxia-telangiectasia-like disorder (ATLD) due to mutations
in MRE11A, show hypersensitivity to ionizing radiation and an occasional role in cancer
development398,399. Another NBS-like disorder due to mutations in the RAD50 gene, shows a
similar phenotype including chromosomal instability, radiosensitivity, radioresistant DNA
synthesis as well as cell cycle-checkpoint defects400. Furthermore, Seckel syndrome, caused
by ATR mutations, is associated with growth retardation and dwarfism along with central
nervous system anomalies and bird-like face401. Altogether, these syndromes are of very rare
occurrence and therefore of little relevance to adverse reactions in daily routine
radiotherapy, as most radiosensitive patients do not show a distinct phenotype.
2.3.6 Different forms of cell death following irradiation
As described above, the idea behind radiation therapy is to induce cell death in the tumor
tissues, this, however, does not occur immediately after irradiation. It usually takes hours,
days or even weeks until tumor cells have finally died and this also depends on the cell death
mechanism which is triggered by cancer therapy276. Damaged cells often undergo several
(attempts of) mitoses before finally dying and Figure 8 gives an overview of the cell death
mechanisms induced by ionizing radiation.
The most prevalent forms of cell death in radiation therapy are apoptosis and mitotic
catastrophe/mitotic cell death402-405. The programmed cell death apoptosis relies on the
ATM-p53-bax-cytochrome c-caspases pathway406 and is characterized by shrinkage of cells
and apoptotic body formation. Further characteristics are cell membrane blebbing, the
conservation of intact cell membranes, DNA fragmentation and condensed chromatin276.
Mitotic cell death occurs during or after abnormal mitosis, if cells fail to properly segregate
chromosomes, which leads to the formation of giant cells containing multiple nuclei and has
been shown to depend on the p53-caspases-cytochrome c cascade407.
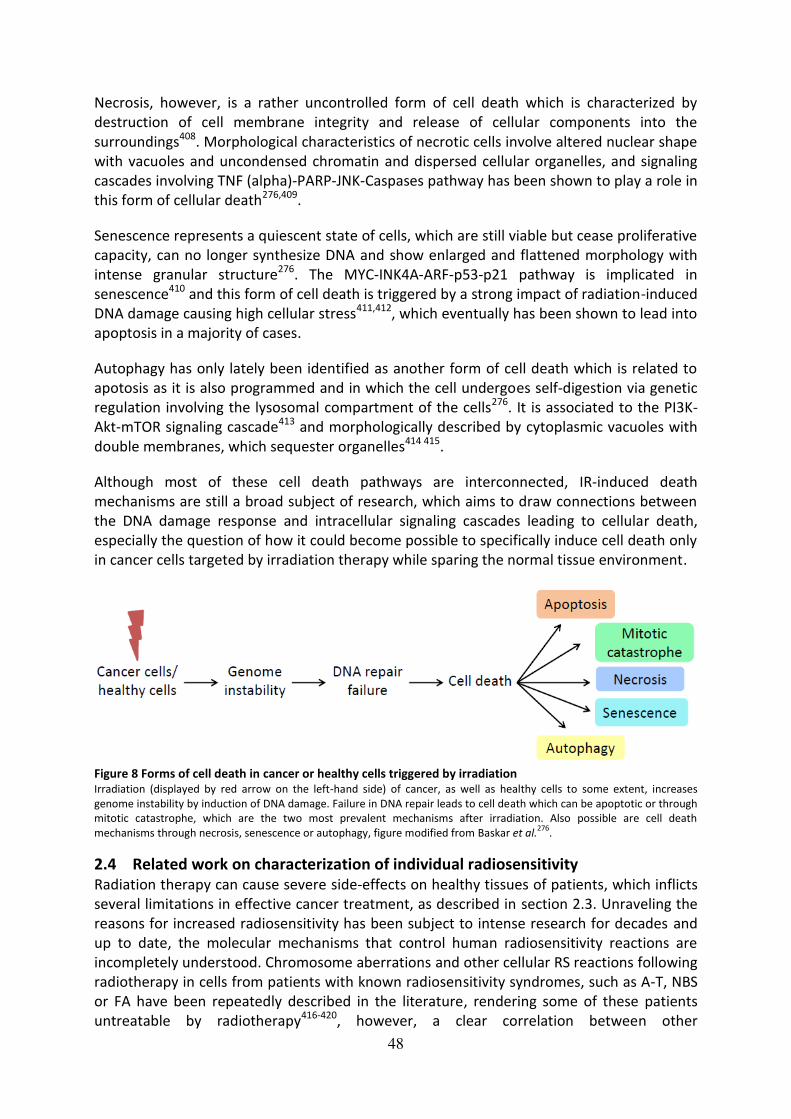
48
Necrosis, however, is a rather uncontrolled form of cell death which is characterized by
destruction of cell membrane integrity and release of cellular components into the
surroundings408. Morphological characteristics of necrotic cells involve altered nuclear shape
with vacuoles and uncondensed chromatin and dispersed cellular organelles, and signaling
cascades involving TNF (alpha)-PARP-JNK-Caspases pathway has been shown to play a role in
this form of cellular death276,409.
Senescence represents a quiescent state of cells, which are still viable but cease proliferative
capacity, can no longer synthesize DNA and show enlarged and flattened morphology with
intense granular structure276. The MYC-INK4A-ARF-p53-p21 pathway is implicated in
senescence410 and this form of cell death is triggered by a strong impact of radiation-induced
DNA damage causing high cellular stress411,412, which eventually has been shown to lead into
apoptosis in a majority of cases.
Autophagy has only lately been identified as another form of cell death which is related to
apotosis as it is also programmed and in which the cell undergoes self-digestion via genetic
regulation involving the lysosomal compartment of the cells276. It is associated to the PI3K-
Akt-mTOR signaling cascade413 and morphologically described by cytoplasmic vacuoles with
double membranes, which sequester organelles414 415.
Although most of these cell death pathways are interconnected, IR-induced death
mechanisms are still a broad subject of research, which aims to draw connections between
the DNA damage response and intracellular signaling cascades leading to cellular death,
especially the question of how it could become possible to specifically induce cell death only
in cancer cells targeted by irradiation therapy while sparing the normal tissue environment.
Figure 8 Forms of cell death in cancer or healthy cells triggered by irradiation Irradiation (displayed by red arrow on the left-hand side) of cancer, as well as healthy cells to some extent, increases
genome instability by induction of DNA damage. Failure in DNA repair leads to cell death which can be apoptotic or through
mitotic catastrophe, which are the two most prevalent mechanisms after irradiation. Also possible are cell death
mechanisms through necrosis, senescence or autophagy, figure modified from Baskar et al.276
.
2.4 Related work on characterization of individual radiosensitivity
Radiation therapy can cause severe side-effects on healthy tissues of patients, which inflicts
several limitations in effective cancer treatment, as described in section 2.3. Unraveling the
reasons for increased radiosensitivity has been subject to intense research for decades and
up to date, the molecular mechanisms that control human radiosensitivity reactions are
incompletely understood. Chromosome aberrations and other cellular RS reactions following
radiotherapy in cells from patients with known radiosensitivity syndromes, such as A-T, NBS
or FA have been repeatedly described in the literature, rendering some of these patients
untreatable by radiotherapy416-420, however, a clear correlation between other

49
radiosensitivity syndromes and cellular survival could not always be established, for example
in patients with Bloom’s syndrome or FA-like condition421 422. It was furthermore reported
that A-T carriers displayed moderately increased cellular and chromosomal radiosensitivity,
suggesting that this could relate to increased clinical RS. Therefore, sequence analysis of the
ATM gene was performed in genomic DNA of cancer patients with at least RTOG grade 3
acute and/or late effects, which showed sequence variations by already known
polymorphism and silent mutations in only 2 of 20 patients423. One of the two is part of this
project, suggesting a different genetic profile might lead to the adverse effects423. This was
further supported by a study in the year 2002, in which no evidence for ATM, NBS, MRE11A
or RAD50 mutation was found in patients with RTOG 3 late reactions, of which four are also
part of this study424. However, a possible association between increased chromosomal
sensitivity and ATM variants in form of polymorphism and silent mutations has been
described in two radiosensitive breast cancer patients, one being also part of the patient
collective used in this project425.
Furthermore, a strong diversity of both acute and late reactions even after identical
treatment parameters has been documented already two decades ago that could not be
attributed to a certain radiosensitivity syndrome347 348 350 351 426-428. At the end of the 1990s
evidence converged that individual radiosensitivity is determined by the genetic background
of a patient328 and prediction of personal risk of side-effects has been considered the “Holy Grail of radiobiology”429 430. In 2003, Dikomey et al. proposed a theory why contradictory
results might have been obtained so far, as the assumption, that only radiosensitive patients
develop reactions might not be true431. On the contrary, they implied that all patients are at
risk of developing side-effects but the time frame after treatment is determinative. This
model is supported by data gained in 2001, where one group described kinetics of the risk of
suffering from late side-effects following an exponential decline for all patients, whether
initially characterized as radiosensitive or not374. This possible lifelong risk of developing late
complications demands continuous follow-up examinations to determine which biological
processes might be responsible for the time dependency of late effects’ manifestation374.
Several studies addressing the relevance of polymorphisms in candidate genes followed, and
positive correlations were reported between variants in TGFB1 (which controls proliferation,
differentiation, is important in wound healing and is upregulated in tumors432 433), SOD2
(Superoxide Dismutase 2, involved in ROS scavenging, apoptosis and cancer434), and the two
DNA repair genes XRCC3 (X-Ray Repair Cross Complementing 3) and XRCC1 (X-Ray Repair
Cross Complementing 1). Increased risk of subcutaneous fibrosis and partly also
telangiectasia was reported435, however, these genes were only partly identified in other
studies429,434 436-439. It soon became clear that individual radiosensitivity reflects a complex
trait, and not a condition that can be broken down to one or two genes, but rather relies on
their synergistic effects434. Following studies aimed at increasing statistical power, providing
homogenous study parameters in terms of patient selection, cancer site, parameters of
treatment and functional end points for measuring toxicity effects, which should be
facilitated by establishment of the international Radiogenomics Consortium440,315.
Further studies focused on relating gene expression profiles to radiation toxicity, as it has
been previously shown that gene expression patterns can be altered in A-T patients441.
However, the outcome of these studies again was different. One study found a high

50
reciprocal correlation of the expression of CDKN1A (Cyclin Dependent Kinase Inhibitor 1A) to
reaction severity442, whereas gene expression of ubiquitin, apoptosis and stress signaling
networks only related to radiosensitivity to some extent in another study443. One study
found 18 genes assigned to apoptosis, extracellular matrix remodeling and cell adhesion,
proliferation and scavenging of ROS. Gene expression profiles could clearly distinguish
between high and low risk patients of IR-induced skin fibrosis in BC patients444, however, the
previously proposed marker gene CDKN1A was not found in concordance with another
study445. Transcriptomics-based studies successfully correlated early and late effects with
differential gene expression in genes involving inflammatory and stress responses as well as
antioxidant metabolism. However, they failed to converge to a final definition of driver
genes as radiotherapy involves distinct effects in a variety of tissues that are also subject to
remodeling and continuous change throughout the duration of therapy, as well as in time
between follow-up investigations328,446,447. Moreover, a summary of several studies aimed at
generation of RNA signatures from fibroblasts and lymphocytes to predict early and late
consequences and several more genes have been proposed to play an important role in the
pathogenesis of radiation toxicity. Their overall functions have been summarized to DNA
damage sensors and mediators, cell cycle checkpoint control genes, apoptosis and
inflammatory genes, oxidative stress mediators as well as genes involved in endothelial cell
damage328 and common variants in oxidative stress response NOS3 (eNOS/Nitric Oxide
Synthase 3) and DNA repair XRCC1 genes have been specifically associated with acute skin
toxicity in breast cancer patients more recently448.
However, candidate gene studies altogether largely failed to identify genetic variants causing
the majority of radiotoxic phenotypes and the pathogeny of the disease still seemed very
multifaceted. Therefore, a GWAS (Genome-wide association study) approach was already
suggested in 2009 to identify variants and the way they might interact, to enable a
pretreatment profile testing of patients328 which, however, requires a very large patient
group and might be difficult to realize as the minority of patients develops late reactions. It
was hypothesized that, in contrast to the candidate gene approach, individual RS might be
determined by multiple loci ranging from common variants with minor effects to rare
variants, with tremendous effects on the RS phenotype, and that the tissue- and endpoint-
specificity is of considerable importance315,439.
As gene expression studies rather concentrate on the phenotype than on the genotype,
radiooncology research underwent a change of direction again, stressing importance of
GWAS studies in finding common genetic variants315, which came into focus in 2010 and
recommendation about gene knockout studies were made429. In 2012, progress on GWAS
was published, stating the identification of 67 marker genes, which were differentially
induced after IR in lymphocytes from radiosensitive patients in a multicentric study449.
However, no match with previously described candidate genes was achieved and
interestingly, functional radiosensitivity assays showed great variability between patients.
Moreover emphasizing the importance of the GWAS approach, 80 % correlation between
radiosensitivity and acute toxicity in patients was found and genes of DNA repair, apoptosis
and cell cycle regulation were again identified, which supports previous data450. This
multifaceted approach confirmed the reproducibility problem, as previous data stating
reduced apoptosis of lymphocytes as predictive marker of radiotoxicity451 could not be
validated, which was supported by other studies452 453. As progress commenced in the field
of next generation sequencing, the radiogenomics field emerged, which included

51
identification of increasing numbers of polymorphisms associated with radiotoxicity and
larger GWAS studies315. Recent progress in this field supported the idea that inter-individual
variation between RS patients is based on common genetic variants with low penetrance. A
large GWAS study in 2014 confirmed association between common genetic variants and
toxicity, which however, seemed to be tumor site-specific, and found associations for
individual endpoints but not as an overall toxicity measure regarding all patients454.
However, none of the SNPs identified in this large study were found in previously described
candidate genes for radiotherapy toxicity455. However, potent radioprotective substances
could be established based on these research findings, for example inhibitors of superoxide
dismutase (SOD) conferred reduction of cytokine production in some tissues, for example
TGFB1, when being used in parallel to several other substances including apoptosis and
senescence inhibitors456. Further progress in the field of next generation sequencing, for
example by exome sequencing, has enabled identification of new players of the DNA
damage response, as was shown for MTPAP (mitochondrial poly-A-polymerase) more
recently457. Advances in genome editing techniques also enable a whole new area of
research and this methodology already emerged into the radiosensitivity field458.
Additionally to the task of unraveling genetic drivers in individual RS, a pre-radiation test
needed to be established, which allowed easy and fast feasibility according to clinical routine
requirements. Quantification of DNA damage by measuring DNA strand breaks in form of
micronuclei formation, chromosome aberrations, clonogenic survival and later also foci
analysis are all established assay systems but time-consuming in the first place and also did
not produce clearly reproducible results over the last decades. While most analyses focused
on investigating differences between cells of patients with established radiosensitivity
syndromes in comparison to healthy controls459, this approach was also addressed
concerning radiosensitive patients with no known RS syndromes. One group found a
significant correlation between clonogenic survival and excess acentric fragments with
radiosensitivity in dermal fibroblasts460 and fibroblast-specific parameters have been
associated with fibrosis observed in clinical procedures461 and radiation-triggered generation
of TGFB1, also in lymphocytes460,462,463. However, the excess risk of fibrosis could not be
reliably predicted in another study although correlation between residual DSBs and the
cellular radiosensitivity of the patients was possible464. Another group proposed an assay
system based on apoptosis of lymphocytes, which showed good correlation with late toxicity
effects in patients with a variety of cancers465, and lymphocyte-associated assay systems
were found to be a good predictor of acute reactions466. Furthermore, one group has
provided evidence for an impairment of the nucleo-cytoplasmic shuttling of the ATM protein
in radiosensitive cell systems467 468. Despite these progresses, however, no assay which met
requirements for clinical use had been established so far339 440, although new techniques are
on the rise. The visualization of DNA DSB sites through immunofluorescence analyses of
repair foci is a well established radiobiological endpoint, and recent findings provide
evidence for the γH2AX assay as predictive clinical ex vivo marker of individual patient
radiosensitivity through blood and eyebrow hair follicle samples469 and it has also been
modified to enhance practicability470. Furthermore, our group could lately show good
correlation with early and residual γH2AX and 53BP1 foci in the low-, and high-dose IR
context of lymphocytes and LCLs of patient cells with mutations in ATM, and triple negative
breast cancer cell lines with impaired TP53/BRCA1 and NBN/BRCA1326 327. Moreover, flow-
cytometry based assays for the prediction of RS for clinical routine have very recently been
established471,472.

52
2.5 Previous and related work on TPT1 in breast cancer and ATM signaling
2.5.1 TPT1 as a candidate BC susceptibility gene
Given that TPT1 levels can be increased in BC cells or BC tissues, which underlines its
function as a tumor marker protein and protective factor in cancer cells268 473 474, and its
possible role in DNA repair, a previous study in our lab sought to investigate whether
mutations in TPT1 were enriched in breast cancer patients475. The six coding exons of TPT1
were amplified from 200 genomic DNA samples of breast cancer patients from the
Hannover-Minsk Breast Cancer series476 and were subjected to mutation identification
through Sanger sequencing. A novel missense substitution, c.452G>A resulting in a Tyr to Cys
substitution p.Y151C, in one patient and a previously recorded synonymous variant,
c.492G>A in another patient were identified. The p.Y151C mutation was predicted to be
pathogenic by SIFT (Sorting Intolerant From Tolerant), Provean and Mutation Taster. These
were the only sequence alterations identified in this exploratory series of 200 fully
sequenced cases, and both changes were not detected in additional 500 breast cancer cases
scanned via HRM (high resolution melting) analysis of the respective exon, indicating that
germline mutations in TPT1 were rare events in breast cancer patients from our series.
2.5.2 The proposed role of TPT1 in ATM signaling
A direct involvement of TPT1 in ATM signaling and DNA repair was published in 2012265,
which has recently been supported by findings of RAD51 stability promotion by TPT1 and
retention of γH2AX and RAD51 foci following TPT1 knockdown267. While the antagonistic
effect of TPT1 on TP53 would suggest an oncogenic function, Zhang et al. (2012) have
reported that TPT1 interacts with TP53 to inhibit cellular proliferation in irradiated cells265.
Furthermore, low-dose IR enriched TPT1 in nuclei of normal human cells and its upregulation
appeared dependent on ATM kinase and DNA-PK. In that study, TPT1 formed a complex with
ATM, phosphorylated histone H2AX (γH2AX) and 53BP1, exhibited a protective effect on
irradiated cells and thus may play an important role in the maintenance of genomic integrity.
In this work, the question was addressed whether TPT1 immunoreactivity is also elevated in
our A-T LCLs and if a translocation and chromatin binding following irradiation, which would
indicate an involvement in the DDR, can be observed in our cellular systems. Figure 9A
shows one of the DDR related functions of TPT1 proposed by Zhang et al, 2012265, and
previous findings of this project showing elevated TPT1 levels in A-T cells compared to
wildtype LCLs477 (Figure 9B, C), which support data by Zhang et al., 2012. This result
confirmed the proposed elevation of TPT1 basal levels in A-T LCLs (160 % +/- 43) compared
to WT, as was also found in another A-T LCL culture with full blown AT477. However, no
induction after IR or changes in the intracellular distribution of TPT1 by ionizing radiation
were observed477. To clarify its role in ATM signaling and gain further insights into its
possible function as radiosensitivity marker, siRNA-mediated knockdown will be performed
in fibroblasts and breast epithelial cells (see section 4.1).

53
Figure 9 TPT1 in DNA repair modified from Zhang et al, 2012
265 and elevated levels in A-T LCLs
Panel A displays the role of TPT1 in ATM signaling as previously published, which was modified to show our approach of
analyzing TPT1 functions in our cellular systems, and its possible role as RS marker. Panel B shows a representative western
blot (experiment 3) of basal TPT1 levels in wildtype (WT) HA325 LCLs compared to A-T (ATM deficient) HA56 LCLs. Results of
densitometric analyses of TPT1 levels in A-T compared to WT LCLs are shown in panel C.
2.6 Hypothesis and aims of this project
Understanding the genetic background of RS is crucial not only to limit toxicity for
radiosensitive patients but also to improve cancer cure and maximize survival rates in the
90–95 % of patients, who are unlikely to suffer from severe and irreversible side-effects. Not
only the mutational status of patients, but also the specific end points of radiosensitivity are
variable. They depend on the site which is irradiated, ranging from skin telangiectasia to lung
pneumonitis, as well as on the volume effect of irradiated organs328.
Finding the genetic determinants of radiosensitivity has been a great challenge ever since its
first documentation. Candidate studies, gene expression analyses, as well as GWAS and
approaches to establish cellular toxicity testing did not agree on deriving biomarkers that
could be used in daily clinical routine to separate responders from non-responders prior to
radiation. A multitude of studies could relate clinically normal tissue toxicity to cellular
radiosensitivity already about 30 years ago328, building the basement of the relevance of
cellular radiation assays in radiooncology. The technical progress in identifying impairments
in the coding regions of the genome by next generation sequencing has enabled detection of
variants related to a wide range of diseases. With this approach, new insights can be gained
into the underlying mechanisms of radiosensitivity, which might overcome limitations of
and/or supplement traditional genetic mapping procedures, transcriptomics and GWAS
approaches. Exome sequencing has become a highly valuable and affordable tool in the last
years478 and given the well established finding that RS is associated with defects in DNA
repair, the analysis of RS patients through exome sequencing, firstly, has the power to
provide evidence for this association. Secondly, it holds the possibility to find new players in
the DNA damage response or other pathways, which have not previously been described.
Genetic material from patients with different cancers will be analyzed for superior RS
candidate genes, which might affect all cancer patients. Furthermore, cancer-specific RS
genes could be identified, as has been already indicated by previous studies addressing
prostate cancer479,480. As depicted in Figure 10, up to date research has not succeeded to
clarify which steps of the cellular DNA damage pathway are eventually involved in the failure
of normal tissue to withstand irradiation therapy. In this project, more insights into the
mechanistic and timely course of events leading to RS might be gained, which could
contribute to the quest of finding prognostic markers of adverse tissue reactions.

54
Figure 10 Cellular mechanisms following irradiation-induced DNA damage Simplified sequence of cellular events following DNA damage in the form of irradiation (displayed by red arrow) in normal
tissue (left panel) and radiosensitive tissue, indicating possible implication in subsequent steps by question marks (right
panel). The DNA damage response is constituted of sensors, for example H2AX (γH2AX in its active form) and the MRN-
complex consisting of MRE11A, RAD50 and NBN, transducers like ATM, effectors such as CHEK2 and different cellular target
options like apoptosis, senescence or DNA repair following cell cycle arrest, modified from Becker and Haferkamp481
. The
decision of cell fate is determined by the level of DNA damage, shown as triangular figure indicating choice of apoptosis by
high damage, senescence after high or medium damage and DNA repair after low damage, modified from Helton and
Chen482
.
This project consists of three parts and three different approaches to characterize individual
radiosensitivity will be made, see Figure 11. Given the hypothesis, that ATM signaling is a
predictive marker of RS, firstly, the RS candidate gene TPT1 will be analyzed with respect to
its possible influence on DSB recognition and repair. Knockdown experiments in skin
fibroblast and breast epithelial cell lines, resembling affected areas of IR treatment and
possible location of side-effect manifestation will be performed.
Secondly, the genetic signature of radiosensitivity will be analyzed by exome sequencing to
gain insights into the mutational background, which possibly leads to adverse effects in the
patients. Given the assumption that individual RS is – at least partly – determined by genetic
factors, variants affecting the coding regions of the genome, which are most likely associated
with functional defects, will be analyzed. The previously established relationship between
ATM signaling and clinical RS could be confirmed using exome sequencing.
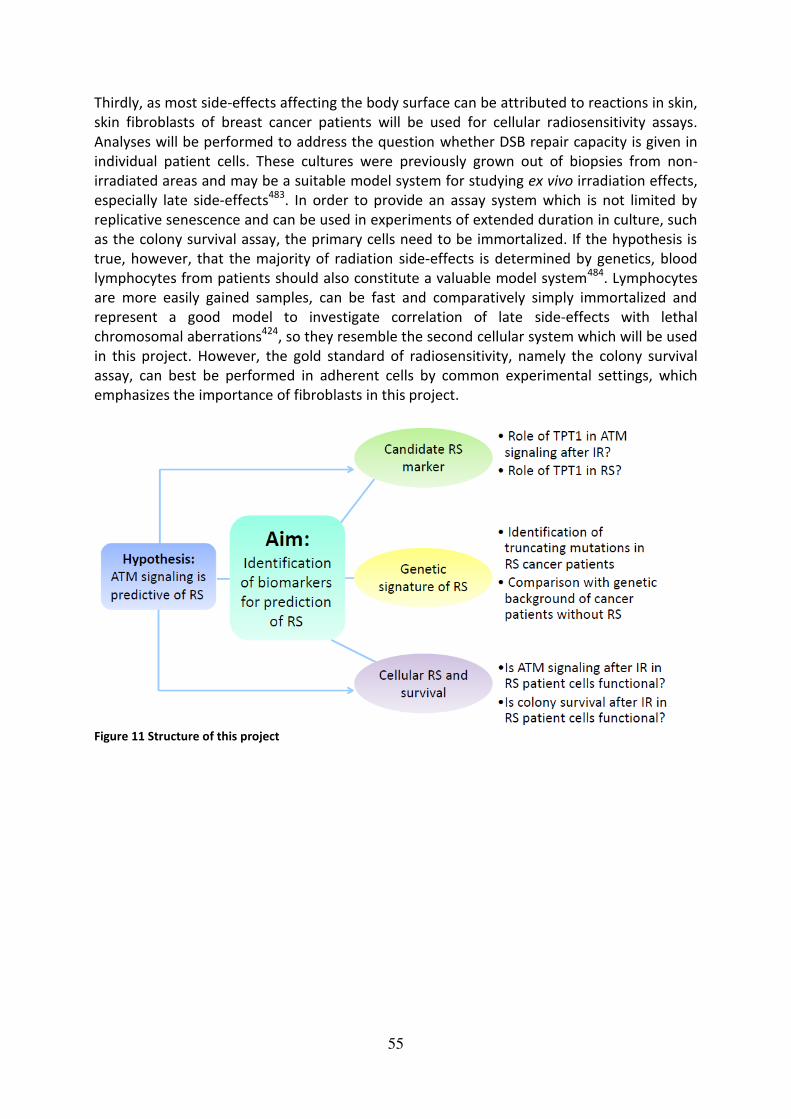
55
Thirdly, as most side-effects affecting the body surface can be attributed to reactions in skin,
skin fibroblasts of breast cancer patients will be used for cellular radiosensitivity assays.
Analyses will be performed to address the question whether DSB repair capacity is given in
individual patient cells. These cultures were previously grown out of biopsies from non-
irradiated areas and may be a suitable model system for studying ex vivo irradiation effects,
especially late side-effects483. In order to provide an assay system which is not limited by
replicative senescence and can be used in experiments of extended duration in culture, such
as the colony survival assay, the primary cells need to be immortalized. If the hypothesis is
true, however, that the majority of radiation side-effects is determined by genetics, blood
lymphocytes from patients should also constitute a valuable model system484. Lymphocytes
are more easily gained samples, can be fast and comparatively simply immortalized and
represent a good model to investigate correlation of late side-effects with lethal
chromosomal aberrations424, so they resemble the second cellular system which will be used
in this project. However, the gold standard of radiosensitivity, namely the colony survival
assay, can best be performed in adherent cells by common experimental settings, which
emphasizes the importance of fibroblasts in this project.
Figure 11 Structure of this project

56
3 Material and methods
3.1 Material
3.1.1 Cell lines
Table 3 Cell lines used in this project as described in this thesis
Culture Type Origin/number Immortalization
status
ADP Human skin fibroblasts from a healthy
individual
Würzburg, DE,
self-established
SV40 large T
immortalized MCF10A Human breast epithelial from a healthy
individual485
ATCC, CRL-10317 Spontaneously
immortalized
HA325 Human whole blood lymphocytes from a
healthy individual
Hannover, DE,
self-established
EBV immortalized
HA56 Human whole blood lymphocytes from an
individual with classic A-T
Hannover, DE,
self-established
EBV immortalized
HCC1395 Human TNBC486, mutation in BRCA1, CDKN2A,
PTEN, TP53487,488 and NBN419
ATCC, CRL-2324 Cancer cells
HCC1937 Human TNBC489, mutation in BRCA1 and TP53
487,488 ATCC, CRL-2336 Cancer cells
HCC38 Human TNBC490, 486, mutation in CDKN2A
and TP53
ATCC, CRL-2314 Cancer cells
HA236 Human whole blood lymphocytes from
patient MC (mamma carcinoma) 3
Göttingen, DE
EBV immortalized
BJ5TA Human skin fibroblasts from a healthy
individual
ATCC, CRL-4001 TERT immortalized
MC1 TERT Human skin fibroblasts from patient MC1 Göttingen, DE/
Hannover*, DE,
self-established
TERT immortalized
MC3 TERT Human skin fibroblasts from patient MC3 Göttingen, DE/
Hannover*, DE,
self-established
TERT immortalized
MC7 TERT Human skin fibroblasts from patient MC7 Göttingen, DE/
Hannover*, DE,
self-established
TERT immortalized
*= Primary fibroblasts were obtained from Göttingen and immortalized with TERT during this
thesis in Hannover.

57
Previously published data was generated with cell lines given in Table 4473,485.
Table 4 Cell lines used in this project as previously published
Culture Type Origin/number Immortalization
status
HA101 Human whole blood lymphocytes from an
individual with variant A-T
Hannover*, DE,
self-established
EBV immortalized
HA106 Human whole blood lymphocytes from an
individual with variant A-T
Hannover*, DE,
self-established
EBV immortalized
HA150 Human whole blood lymphocytes from an
individual with clinical RS (hypopharynx
carcinoma)
Hamburg, DE/
Hannover**, DE,
self-established
EBV immortalized
HA164 Human whole blood lymphocytes from an
individual with variant A-T
Hannover*, DE,
self-established
EBV immortalized
HA169 Human whole blood lymphocytes from a
healthy individual
Hannover*, DE,
self-established
EBV immortalized
HA195 Human whole blood lymphocytes from an
individual with clinical RS (squamous cell
carcinoma)
Hamburg, DE/
Hannover*, DE,
self-established
EBV immortalized
HA210 Human whole blood lymphocytes from an
individual with clinical RS (BC)
Würzburg, DE/
Hannover**, DE,
self-established
EBV immortalized
HA211 Human whole blood lymphocytes from an
individual with clinical RS (BC)
Würzburg, DE/
Hannover**, DE,
self-established
EBV immortalized
HA212 Human whole blood lymphocytes from an
individual with clinical RS (BC)
Würzburg, DE/
Hannover**, DE,
self-established
EBV immortalized
HA213 Human whole blood lymphocytes from an
individual with clinical RS (BC)
Würzburg, DE/
Hannover**, DE,
self-established
EBV immortalized
HA214 Human whole blood lymphocytes from an
individual with clinical RS (BC)
Würzburg, DE/
Hannover**, DE,
self-established
EBV immortalized
HA215 Human whole blood lymphocytes from an
individual with clinical RS (BC)
Würzburg, DE/
Hannover**, DE,
self-established
EBV immortalized
HA216 Human whole blood lymphocytes from an
individual with clinical RS (rectum
carcinoma)
Würzburg, DE/
Hannover**, DE,
self-established
EBV immortalized
HA223 Human whole blood lymphocytes from an
individual with clinical chemoradio-
sensitivity (BC)
Magdeburg, DE/
Hannover**, DE,
self-established
EBV immortalized
HA224 Human whole blood lymphocytes from an
individual with clinical
chemoradiosensitivity (prostata carcinoma)
Magdeburg, DE/
Hannover**, DE,
self-established
EBV immortalized

58
HA225 Human whole blood lymphocytes from an
individual with clinical chemoradio-
sensitivity (BC)
Magdeburg, DE/
Hannover**, DE,
self-established
EBV immortalized
HA239 Human whole blood lymphocytes from an
individual with RAD50 deficiency
Hannover*, DE,
self-established
EBV immortalized
HA256 Human whole blood lymphocytes from a
healthy individual
Hannover*, DE,
self-established
EBV immortalized
HA61 Human whole blood lymphocytes from an
individual with classic A-T
Hannover*, DE,
self-established
EBV immortalized
MC3 Human skin fibroblasts from patient MC3 Göttingen, DE Primary
MC7 Human skin fibroblasts from patient MC7 Göttingen, DE Primary
*= Primary blood lymphocytes were immortalized with EBV in the Molecular Gynaecology unit, Medical School
Hannover, Hannover, mostly by Britta Wieland.
**= Primary blood lymphocytes were obtained from different german hospitals and immortalized with EBV in
the Molecular Gynaecology unit, Medical School Hannover, Hannover, mostly by Britta Wieland.
3.1.2 Antibodies
3.1.2.1 Primary antibodies
Table 5 Primary antibodies
Antigen Host Western
blot
Immuno-
cytochemistry
Antigen
size [kDa]
Company, catalogue number,
concentration
53BP1 Rabbit – 1:200 430 Bethyl Laboratories, A300-272A,
1 mg/ml
ABL1 Mouse 1:750 – 174 BD, 554148, 0.5 mg/ml
ABL1 Rabbit 1:750 – 174 Santa Cruz, K12 sc-131, kindly
provided by Dr. Koch, MHH
p-CHEK2
(Ser19)
Rabbit 1:500–1:1000
– 62 Cell signaling, 2666
p-KAP1
(Ser824)
Mouse 1:2000–1:5000
– 130 Bethyl Laboratories, A300-767A,
0.2 mg/ml
RAD50 Mouse 1:500 – 154 Abcam, ab 89, 1.38 mg/ml
RAD51 Mouse – 1:200 37 Genetex, GTX70230, 1.39 mg/ml
SP1 Rabbit 1:500 – 81 Santa Cruz, sc-59, 100 µg/ml;
ß-actin Mouse 1:3000 – 37 Sigma-Aldrich Aldrich, A5441,
2 mg/ml
TERT Rabbit 1:500 – 127 Biorbyt, orb215529, Lot: DF414
TPT1 Rabbit 1:50000 1:250 20 Abcam, ab133568
TPT1 Rabbit 1:750 1:250 20 Abcam, ab37506, 1 mg/ml
TPT1 Rabbit – 1:800 20 Proteintech 10824-1-AP, Lot:1
yH2AX
(Ser139)
Mouse – 1:300 17 Millipore/Upstate, 05-636,
1 mg/ml
yH2AX
(Ser139)
Rabbit – 1:300 17 Epitomics, 2212-1, Lot: YE080802R

59
3.1.2.2 Secondary antibodies
Table 6 Secondary antibodies
Antigen Host Western blot Immuno-
cytochemistry
Company, catalogue
number,
concentration
Alexa Fluor anti-
mouse IgG 546
Goat – 1:200 Invitrogen, A-11018;
Lot: 1817158,
2 mg/ml
Alexa Fluor anti-
rabbit IgG 488
Goat – 1:200 Invitrogen, A-11070;
Lot: 161 8692,
2 mg/ml
FITC-conjugated
anti-mouse IgG
antibody
Goat – 1:200 Zymed, 62-6511,
1 mg/ml
Alexa Fluor anti-
rabbit IgG 546
Goat – 1:200 Invitrogen, A11071,
Lot: 1789904 2 mg/ml Anti-mouse Sheep 1:10000 – Amersham, NA9310
Anti-rabbit Donkey 1:10000 – GE Healthcare,
NA9340
3.1.3 Plasmids and kits
Table 7 Plasmids and kits
Plasmid/kit Company/catalogue
number (concentration)
Registered office/
distributor
Human TERT, pGRN145 ATCC MBA-141 Manassas, USA
Pmax GFP vector Lonza (1 µg/ml) Cologne, DE
RNAimax transfection kit Lipofectamine
RNAiMAX
Invitrogen, 13778 Karlsruhe, DE
EndoFree Plasmid Purification kit Mega Qiagen, 12381 Hilden, DE
Senescence β-Gal Staining kit Cell Signalling, 9860S Danvers, US
P2 Primary Cell 4D-Nucleofector X Kit Lonza, V4XP-2024 Cologne, DE

60
3.1.4 Chemicals
Table 8 Chemicals
Chemicals Company Registered office/
distributor
0.1 % gelatin from bovine skin, in
0.9 % NaCl
Gelatin, Sigma
NaCl, Sigmaultra
Kindly provided by
Susanne Alfken, AG
Cantz, REBIRTH, MHH
30 % Hydrochloric acid (HCl) Roth Karlsruhe, DE
4′,6-Diamidino-2-phenylindole
(DAPI)
Invitrogen Karlsruhe, DE
Agarose (ultra-pure) Invitrogen Karlsruhe, DE
Ammonium persulfate Bio-Rad Munich, DE
Aprotinin Serva, Feinbiochemika Heidelberg, DE
ATM-Inhibitor Ku55933 KuDos Pharmaceuticals Cambridge, UK
Bis-acrylamide 2 % Bio-Rad Munich, DE
Bovine Serum Albumin (BSA) New England Biolabs Ipswich, US
Bromophenolblue Sigma-Aldrich Steinheim, DE
Chloroform Roth Karlsruhe, DE
Coomassie Roti-Blue (5x) Roth Karlsruhe, DE
Crystal violet solution 1 % Sigma-Aldrich Steinheim, DE
Developer solution Kodak Sigma-Aldrich Steinheim, DE
Dimethyl sulfoxide (DMSO) Applichem Darmstadt, DE
Disodium hydrogenphosphate Roth Karlsruhe, DE
Dithiothreitol (DTT) Sigma-Aldrich Steinheim, DE
Ethanol, absolute J. T. Baker Deventer, NL
Ethanol, uvasol Merck Darmstadt, DE
Ethylenediaminetetraacetate
(EDTA)
Sigma-Aldrich Steinheim, DE
Ethyleneglycoltetraacetate (EGTA) Sigma-Aldrich Steinheim, D
Fixing solution Kodak Sigma-Aldrich Steinheim, DE
Formaldehyde 37 % Roth Karlsruhe, DE
Glycerol Merck, AppliChem Darmstadt, DE
Glycogen Affymetrix California, US
Hydrogen peroxide Merck Darmstadt, DE
HPLC water J. T. Baker Deventer, NL
Isopropanol Roth, Th. Geyer Karlsruhe, DE, Hamburg,
DE.
Leupeptin Serva, Feinbiochemika Heidelberg, DE
L-Glutamine PAA Pasching, AT
Luminol (5-Amino-2,3-dihydro- 1,4-
phthalazinedione)
Sigma-Aldrich Steinheim, DE
Mercaptoethanol Sigma-Aldrich Steinheim, DE
Methanol Merck Darmstadt, DE
My budget dNTP Set BioBudget Krefeld, DE
Normal goat serum (NGS) Dianova Hamburg, DE
NP-40 (NonidetP-40) Sigma-Aldrich Steinheim, DE
p-Coumaric acid Merck Darmstadt, DE

61
Phenol Sigma-Aldrich Steinheim, DE
Phenol/chloroform/isoamyl alcohol
(25:24:1)
AppliChem Darmstadt, DE
Phenylmethansulphanylfluoride
(PMSF)
Sigma-Aldrich Steinheim, DE
Polyethylene glycol (PEG) 8000 Merck Darmstadt, DE
Ponceau S solution AppliChem Darmstadt, DE
Potassium chloride Roth Karlsruhe, DE
Potassium dihydrogen phosphate AppliChem Darmstadt, DE
Prolong Gold Invitrogen Karlsruhe, DE
Protein Assay Dye Reagent
Concentrate
Bio-Rad Munich, DE
Sodium carbonate AppliChem Darmstadt, DE
Sodium chloride Roth Karlsruhe, DE
Sodium dodecylsulfate (SDS) Roth Karlsruhe, DE
Sodium fluoride Sigma-Aldrich Steinheim, DE
Sodium hydrogen carbonate Roth Karlsruhe
Sodium hydroxide pellets AppliChem Darmstadt, DE
Sodium metavanadate Sigma-Aldrich Steinheim, DE
Sodium pyruvate Biochrom Berlin, DE
Sucrose Sigma-Aldrich Steinheim, DE
Tetramethylethylenediamine
(TEMED)
Bio-Rad Munich, DE
Tris Roth Karlsruhe, DE
Tris HCl Roth Karlsruhe, DE
Triton-X-100 Sigma-Aldrich Steinheim, DE
Trypanblue Sigma-Aldrich Steinheim, DE
Tween 20 Sigma-Aldrich Steinheim, DE
Xylene cyanol Merck Darmstadt, DE
Hepes 2-[4-(2-
hydroxyethyl)piperazin-1-
yl]ethanesulfonic acid
Sigma-Aldrich Steinheim, DE
Form amide Merck Darmstadt, DE
Boric acid Merck Darmstadt, DE
Polyethylene glycol (PEG) 8000 Merck Darmstadt, DE
Sodiumacetate anhydrous Sigma-Aldrich Steinheim, DE
Glycine Roth Karlsruhe, DE
β-Glycerophosphate Merck Darmstadt, DE

62
3.1.5 Enzymes and siRNAs
Table 9 Enzymes and siRNAs
Enzyme/siRNA Company/number Registered office/
distributor
Benzonase EMD Millipore, 70664 Billerica, US
DNase I Roche, 92161121 Basel, CH Hot Star Taq Polymerase + buffer Qiagen, 1007837 Hilden, DE.
Proteinase K AppliChem Darmstadt, DE
Scrambled siRNA (control) Ambion/Applied Biosystems
International
Waltham, US
siRNA against TPT1, sense
(5’3’:AAGGGAAACUUGAAGAACAtt) antisense
(5’3’:UGUUCUUCAAGUUUCCCUUtg)
Ambion/Applied Biosystems
International,
AM16708A, 289422
Waltham, US
siRNA against TPT1, sense
(5’3’:GGAAACAAGUUUCACAAAAtt) antisense
(5’3’:UUUUGUGAAACUUGUUUCCtg)
Ambion/Applied Biosystems
International, AM16708A, 13153
Waltham, US
siRNA against TPT1, sense
(5’3’:GGGAAACUUGAAGAACAGAtt) antisense
(5’3’:UCUGUUCUUCAAGUUUCCCtt)
Ambion/Applied Biosystems
International,
AM16708A, 284697
Waltham, US
TopTaq Polymerase + buffer Qiagen, 200205 Hilden, DE
Trypsin/EDTA 0.25 % Biochrom Berlin, DE
3.1.6 Medium and other materials
Table 10 Medium and other materials used in this work
Material Company/number Registered office/
distributor
1 Kb Plus DNA Ladder Invitrogen Karlsruhe, DE
Dulbecco's modified Eagle‘s medium
(DMEM)
Sigma-Aldrich, 6546 Steinheim, DE
Dulbecco's modified Eagle‘s medium (DMEM)
Gibco, 21969-035 California, US
Dulbecco's modified Eagle‘s medium (DMEM) without Na-Pyruvate
Sigma-Aldrich, 6171 Steinheim, DE
Fetal calf serum (FCS) Biochrom Berlin, DE
Gel loading dye GelRed Biotium California, US
Hygromycin B 50 mg/ml Invitrogen, 10687010 Carlsbad, DE
Marvel milk powder Premier Foods plc St. Albans, UK
Medium 199 Sigma-Aldrich, M4530 Steinheim, DE
MEGM (Mammary Epithelial Cell
Growth Medium)
Lonza, CC-3151 Basel, BE
MEGM SingleQuot Kit Suppl. & Growth
Factors
Lonza, CC-4136 Basel, BE
Mynox Gold Minerva Biolabs Berlin, DE

63
NanoPOP6 polymer NimaGen Rotterdam, NL
Opti-Mem Gibco/Life Technologies Carlsbad, US
Penicillin/Streptomycin PAA Pasching, AT
Pierce Super-Signal West Dura Pierce/Thermo Scientific Rockford, US
Primer Eurogentec Seraing, BE
RPMI 1640 + L-Glutamine Gibco/Life Technologies,
Sigma-Aldrich
Carlsbad, US,
Steinheim, DE
Western Bright Quantum Biozym,
Advansta
Hessisch Oldendorf,
DE,
Menlo Park, US
3.1.7 Buffers and solutions
Table 11 Buffers and solutions prepared and used in this project
Protein lysate preparation and SDS-PAGE DNA isolation, PCR, sequencing, agarose gel
electrophoresis, immunocytochemistry, colony
survival assay, common solutions and western
blot
Whole cell lysate
buffer
50 mM Tris pH 7.4 10x STE buffer 0.5 M Tris-HCl
150 mM NaCl 1 M NaCl
2 mM EGTA 0.01 M EDTA
2 mM EDTA Fill up to 1 l with ddH2O
(pH 7,5)
25 mM NaF
25 mM ß-glycerophosphate Proteinase K reaction
mix (per sample)
190 μl sterile HPLC grade ddH2O
0.1 mM Na3VO4 150 μl proteinase K (10 mg/ml)
0.1 mM PMSF 40 μl 10x STE
5 µg/ml leupeptin 20 μl 10 % SDS
1 µg/ml aprotinin
0.2 % (v/v) Triton X-100 1x TE/DNA
suspension buffer
10 mM Tris pH 8.0
0.3 % (v/v) NonidetP-40 0.1 mM EDTA
Cellular
fractionization
buffer A
50 mM Hepes (pH 7.4) Agarose loading dye
(5x)
0.25 %
bromophenolblue
10 mM KCl 0.25 % xylene cyanol
1 mM EDTA 100 ml 100 % form
amide
1 mM EGTA
1 mM DTT 1x TBE buffer 890 mM Tris
0.5 % NonidetP 890 mM boric acid
0.1 mM PMSF 20 mM EDTA
5 µg/ml leupeptin Fill up to 1 l with ddH2O
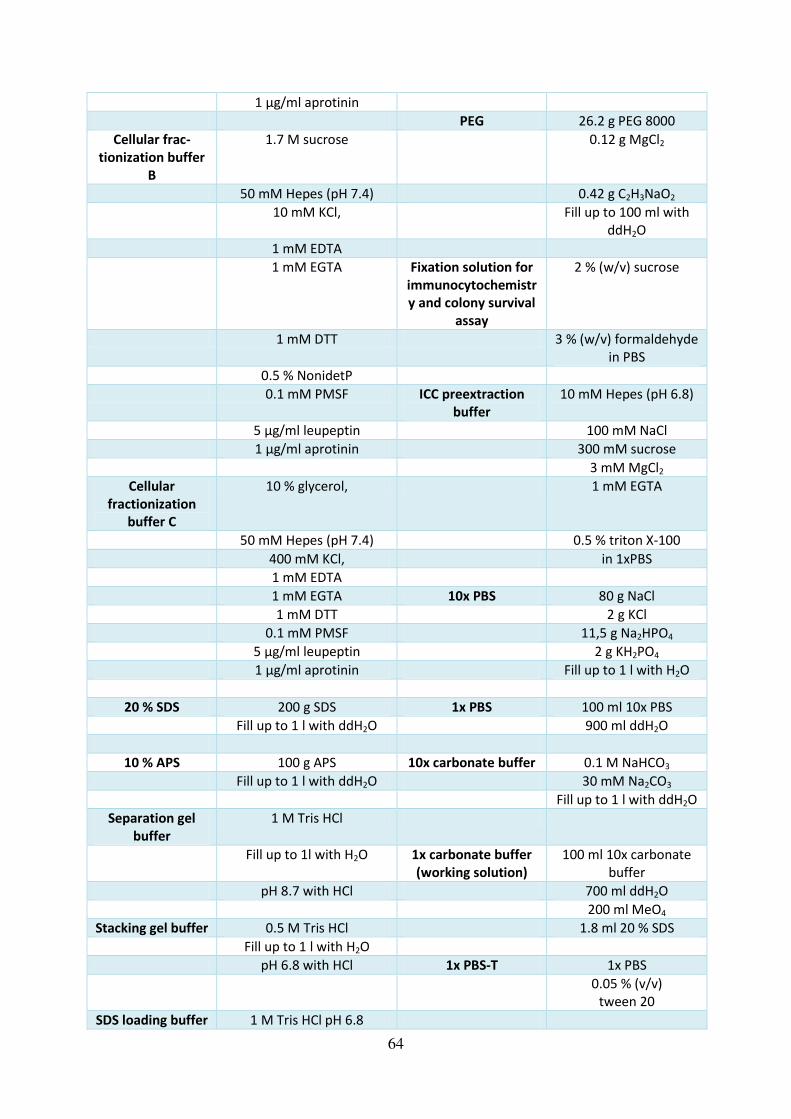
64
1 µg/ml aprotinin
PEG 26.2 g PEG 8000
Cellular frac-
tionization buffer
B
1.7 M sucrose 0.12 g MgCl2
50 mM Hepes (pH 7.4) 0.42 g C2H3NaO2
10 mM KCl, Fill up to 100 ml with
ddH2O
1 mM EDTA
1 mM EGTA Fixation solution for
immunocytochemistr
y and colony survival
assay
2 % (w/v) sucrose
1 mM DTT 3 % (w/v) formaldehyde
in PBS
0.5 % NonidetP
0.1 mM PMSF ICC preextraction
buffer
10 mM Hepes (pH 6.8)
5 µg/ml leupeptin 100 mM NaCl
1 µg/ml aprotinin 300 mM sucrose
3 mM MgCl2
Cellular
fractionization
buffer C
10 % glycerol, 1 mM EGTA
50 mM Hepes (pH 7.4) 0.5 % triton X-100
400 mM KCl, in 1xPBS
1 mM EDTA
1 mM EGTA 10x PBS 80 g NaCl
1 mM DTT 2 g KCl
0.1 mM PMSF 11,5 g Na2HPO4
5 µg/ml leupeptin 2 g KH2PO4
1 µg/ml aprotinin Fill up to 1 l with H2O
20 % SDS 200 g SDS 1x PBS 100 ml 10x PBS
Fill up to 1 l with ddH2O 900 ml ddH2O
10 % APS 100 g APS 10x carbonate buffer 0.1 M NaHCO3
Fill up to 1 l with ddH2O 30 mM Na2CO3
Fill up to 1 l with ddH2O
Separation gel
buffer
1 M Tris HCl
Fill up to 1l with H2O 1x carbonate buffer
(working solution)
100 ml 10x carbonate
buffer
pH 8.7 with HCl 700 ml ddH2O
200 ml MeO4
Stacking gel buffer 0.5 M Tris HCl 1.8 ml 20 % SDS
Fill up to 1 l with H2O
pH 6.8 with HCl 1x PBS-T 1x PBS
0.05 % (v/v)
tween 20
SDS loading buffer 1 M Tris HCl pH 6.8

65
(5x)
14.25 % (w/v) SDS Blocking buffer 1x PBS-T
47.5 % (v/v) glycine 5 % (w/v) Marvel milk
powder
14.25 % (v/v) β-
glycerophosphate
1.4 % (w/v)
bromophenolblue
Luminol, 250 mM 440 mg luminol
Fill up to 10 ml with DMSO
10x GTS 1.9 M glycine
0.25 M Tris p-Coumaric acid,
90 mM
150 mg p-coumaric acid
1 % (w/v) SDS Fill up to 10 ml with DMSO
Fill up to 1 l with ddH2O and dilute to 1x GTS with
ddH2O
Luminol detection
reagent, solution 1
500 μl luminol (250 mM)
220 μl p-coumaric acid
(90 mM)
Fill up to 45 ml with
ddH2O
5 ml Tris HCl pH 8.7
Luminol detection
reagent, solution 2
100 mM Tris HCl pH 8.7
30.5 μl H2O2
3.1.8 Devices and disposables
Table 12 Devices and disposables
Equipment/disposables Company/number Registered office/distributor
4D-Nucleofector core unit Lonza, AAF-1001B Cologne, DE
4D-Nucleofector X-unit Lonza, AAF-1002X Cologne, DE
6-well plate Nunc/Thermo Scientific Braunschweig, DE
6-well plate Eppendorf Hamburg, DE
Agarose gel tank
Peqlab 40-1410
Peqlab Erlangen, DE
Agarose gel tank
Horizon58
Life technologies California, US
CO2 incubator Heracell 240i Thermo Scientific Braunschweig, DE
Cell culture flasks (T25 cm2,
T75 cm2 & T175 cm
2)
Nunc/Thermo Scientific, Rockford, US
Cell scraper Sarstedt Nümbrecht, DE
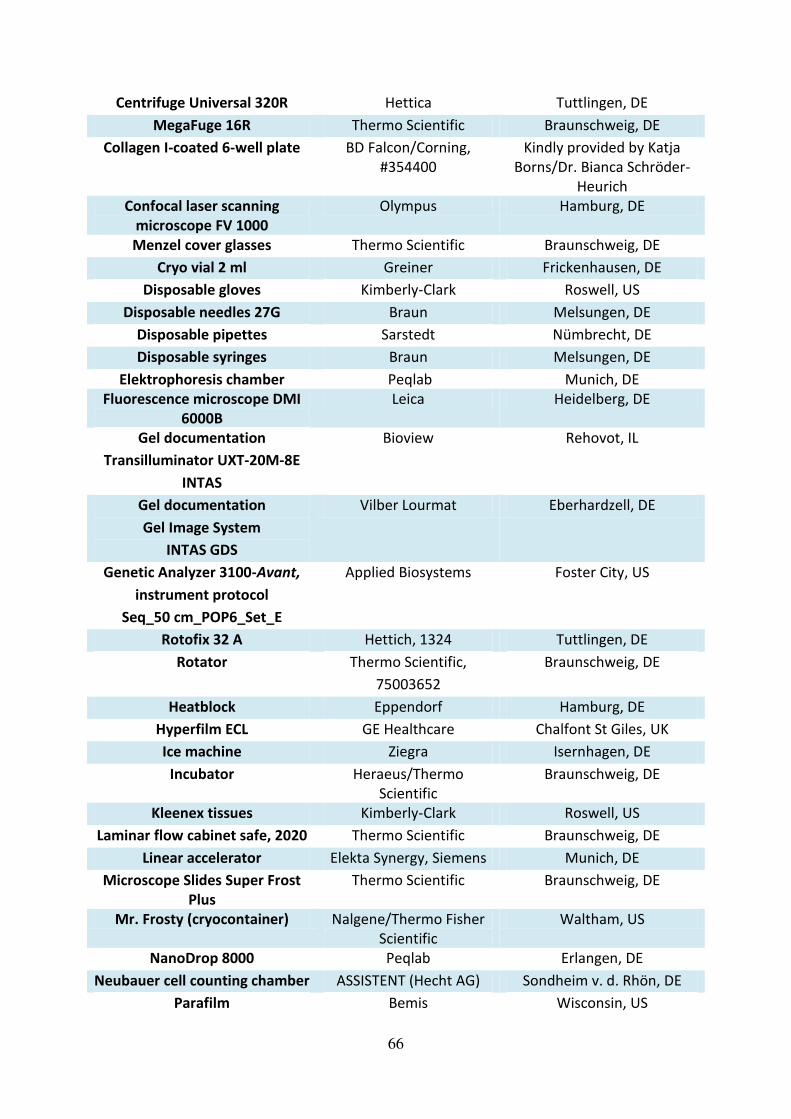
66
Centrifuge Universal 320R Hettica Tuttlingen, DE
MegaFuge 16R Thermo Scientific Braunschweig, DE
Collagen I-coated 6-well plate BD Falcon/Corning,
#354400
Kindly provided by Katja
Borns/Dr. Bianca Schröder-
Heurich
Confocal laser scanning
microscope FV 1000
Olympus Hamburg, DE
Menzel cover glasses Thermo Scientific Braunschweig, DE
Cryo vial 2 ml Greiner Frickenhausen, DE
Disposable gloves Kimberly-Clark Roswell, US
Disposable needles 27G Braun Melsungen, DE
Disposable pipettes Sarstedt Nümbrecht, DE
Disposable syringes Braun Melsungen, DE
Elektrophoresis chamber Peqlab Munich, DE
Fluorescence microscope DMI
6000B
Leica Heidelberg, DE
Gel documentation
Transilluminator UXT-20M-8E
INTAS
Bioview Rehovot, IL
Gel documentation
Gel Image System
INTAS GDS
Vilber Lourmat Eberhardzell, DE
Genetic Analyzer 3100-Avant,
instrument protocol
Seq_50 cm_POP6_Set_E
Applied Biosystems Foster City, US
Rotofix 32 A Hettich, 1324 Tuttlingen, DE
Rotator Thermo Scientific,
75003652
Braunschweig, DE
Heatblock Eppendorf Hamburg, DE
Hyperfilm ECL GE Healthcare Chalfont St Giles, UK
Ice machine Ziegra Isernhagen, DE
Incubator Heraeus/Thermo
Scientific
Braunschweig, DE
Kleenex tissues Kimberly-Clark Roswell, US
Laminar flow cabinet safe, 2020 Thermo Scientific Braunschweig, DE
Linear accelerator Elekta Synergy, Siemens Munich, DE
Microscope Slides Super Frost
Plus
Thermo Scientific Braunschweig, DE
Mr. Frosty (cryocontainer) Nalgene/Thermo Fisher
Scientific
Waltham, US
NanoDrop 8000 Peqlab Erlangen, DE
Neubauer cell counting chamber ASSISTENT (Hecht AG) Sondheim v. d. Rhön, DE
Parafilm Bemis Wisconsin, US

67
PCR-performance 96 well Sarstedt Nümbrecht, DE
pH meter Mettler Toledo Columbus, US
Photometer Eppendorf Hamburg, DE
Pipet boy Brand Wertheim, DE
Pipette 0.5–10 μl Eppendorf Hamburg, DE
Pipette 2 μl–20 μl Peqlab Erlangen, DE
Pipette 20 μl–200 μl Peqlab Erlangen, DE
Pipette 10 μl–100 μl Peqlab Erlangen, DE
Pipette 100 μl–1000 μl Peqlab Erlangen, DE
Pipette 200 μl–1000 μl Gilson Middelton, US
Pipette tips (10 μl, 200 μl,
1000 μl)
Sarstedt Nümbrecht, DE
Capillary tips Biozym Hessisch Oldendorf, DE
Plastic film Omnilab Bremen, DE
Power supply peqPOWER Peqlab Erlangen, DE
Power supply Power Pack P25 Biometra Göttingen, DE
Elektrophoresis power
supply Consort EV202
Sigma-Aldrich Steinheim, DE
Precision Plus Protein All
Blue Standards
Bio-Rad Laboratories Munich, DE
Scalpel Feather,
pfm medical AG
Osaka, J,
Cologne, DE
Scanner LiDE 110 Canon Middlesex, UK
Autoclavable glass bottles
100 ml, 250 ml, 500 ml, 1 l, 2 l
VWR Radnor, US
Shaker Biosan Riga, LV
Shrink-wrap device Serverin Folio Sundern, DE
Thermal cycler
PTC-200
MJ Research,
Biozym
Quebec, CA,
Hessisch Oldendorf, DE
Transfer unit Peqlab Erlangen, DE
UVette Eppendorf Hamburg, DE
Vortex Genie-Mixer Jürgens Bremen, DE/Hannover, DE
Scales Kern, Feinwaage? Balingen, DE
Water bath Biosan,
Jürgens
Riga, LV,
Bremen, DE/Hannover, DE
Whatman paper Whatman Maidstone, UK
X-ray cassette GE Healthcare Chalfont St. Giles, UK
Greiner cell star tubes, 15 ml Greiner, 188271 Frickenhausen, DE
Greiner cell star tubes, 50 ml Greiner, 227261 Frickenhausen, DE
Autoclaves Jürgens,
Systec
Bremen, DE/Hannover, DE,
Linden, DE
Nitrocellulose-membrane, Amersham Freiburg, DE
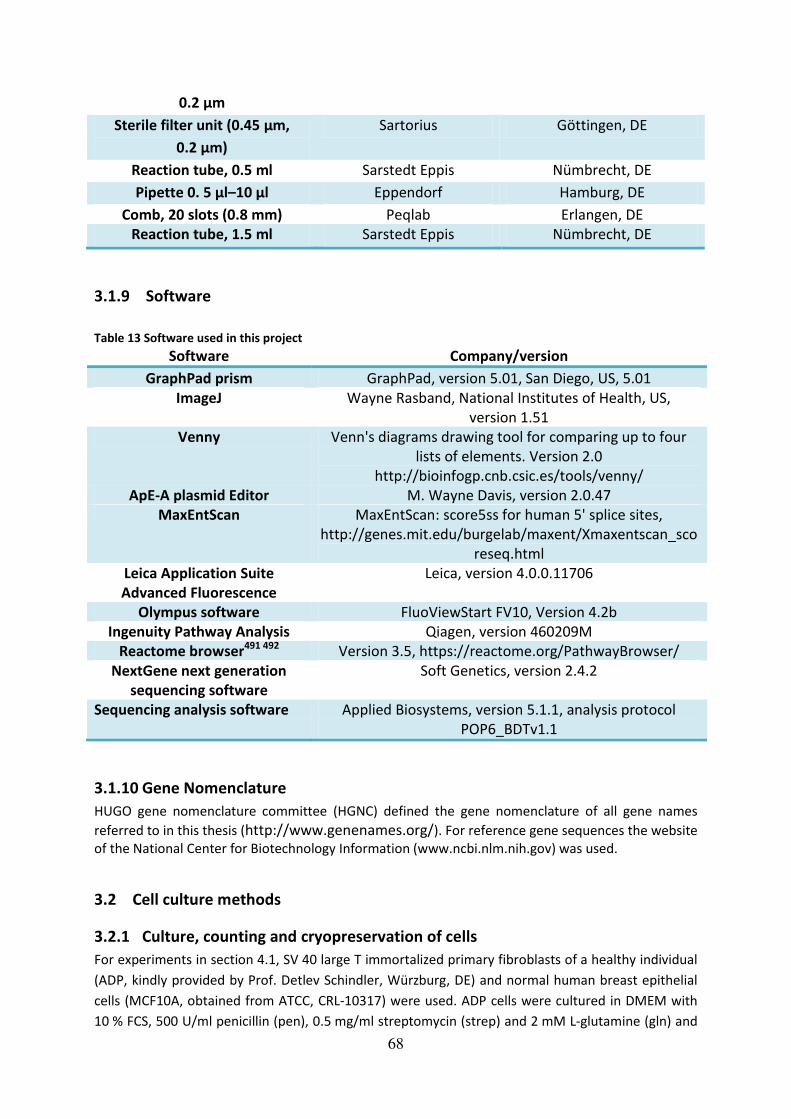
68
0.2 µm
Sterile filter unit (0.45 μm, 0.2 μm)
Sartorius Göttingen, DE
Reaction tube, 0.5 ml Sarstedt Eppis Nümbrecht, DE
Pipette 0. 5 μl–10 μl Eppendorf Hamburg, DE
Comb, 20 slots (0.8 mm) Peqlab Erlangen, DE
Reaction tube, 1.5 ml Sarstedt Eppis Nümbrecht, DE
3.1.9 Software
Table 13 Software used in this project
Software Company/version
GraphPad prism GraphPad, version 5.01, San Diego, US, 5.01
ImageJ Wayne Rasband, National Institutes of Health, US,
version 1.51
Venny Venn's diagrams drawing tool for comparing up to four
lists of elements. Version 2.0
http://bioinfogp.cnb.csic.es/tools/venny/
ApE-A plasmid Editor M. Wayne Davis, version 2.0.47
MaxEntScan MaxEntScan: score5ss for human 5' splice sites,
http://genes.mit.edu/burgelab/maxent/Xmaxentscan_sco
reseq.html
Leica Application Suite
Advanced Fluorescence
Leica, version 4.0.0.11706
Olympus software FluoViewStart FV10, Version 4.2b
Ingenuity Pathway Analysis Qiagen, version 460209M
Reactome browser491 492
Version 3.5, https://reactome.org/PathwayBrowser/
NextGene next generation
sequencing software
Soft Genetics, version 2.4.2
Sequencing analysis software Applied Biosystems, version 5.1.1, analysis protocol
POP6_BDTv1.1
3.1.10 Gene Nomenclature
HUGO gene nomenclature committee (HGNC) defined the gene nomenclature of all gene names
referred to in this thesis (http://www.genenames.org/). For reference gene sequences the website
of the National Center for Biotechnology Information (www.ncbi.nlm.nih.gov) was used.
3.2 Cell culture methods
3.2.1 Culture, counting and cryopreservation of cells
For experiments in section 4.1, SV 40 large T immortalized primary fibroblasts of a healthy individual
(ADP, kindly provided by Prof. Detlev Schindler, Würzburg, DE) and normal human breast epithelial
cells (MCF10A, obtained from ATCC, CRL-10317) were used. ADP cells were cultured in DMEM with
10 % FCS, 500 U/ml penicillin (pen), 0.5 mg/ml streptomycin (strep) and 2 mM L-glutamine (gln) and

69
MCF10A cells were grown in MEGM medium, supplemented with single quots MEGM according to
the manufacturer’s instructions. Furthermore, the triple negative breast cancer cell lines HCC1937
(ATCC CRL-2336), HCC1395 (ATCC, CRL-2324), and HCC38 (ATCC CRL-2314) were used and cultured in
RPMI medium supplemented with 15 % FCS, 500 U/ml pen, 0.5 mg/ml strep and 2 mM gln.
In section 4.3, fibroblasts of breast cancer patients with clinical radiosensitivity (RTOG 3) and a
normal wildtype fibroblast cell line (BJ5TA, immortalized with TERT) were used. BJ5TA cells were
obtained from ATCC (CRL-4001) and cultured in a mixture of four parts Dulbecco's Modified Eagle’s Medium and one part Medium 199 with 10 % FCS, 500 U/ml pen, 0.5 mg/ml strep and 2 mM gln.
Primary cultures were obtained from Margret Rave-Fränk, Göttingen, DE, and the radiosensitive cell
lines MC1, MC3 and MC7 were TERT-immortalized using nucleofection (see section 3.2.2) and
subsequently treated against mycoplasma (see section 3.2.3). Both, primary and immortalized
cultures, were grown in DMEM without Na-pyruvate with 10 % FCS, 500 U/ml pen, 0.5 mg/ml strep
and 2 mM gln. Because the TERT plasmid includes resistance against the selection marker
hygromycin B, the culture medium of BJ5TA and MC TERT cells was supplemented with hygromycin B
(10 μg/ml) to promote TERT-expression and to eliminate all the cells which have not obtained the
plasmid. All cells were grown at 37 °C in a humidified atmosphere supplemented with 5 % CO2.
Passaging of all adherent cell lines was performed after a confluence of 70–90 % was
reached and medium was changed twice a week and/or one day after passaging. For
splitting the cells, the medium was removed, the cells were washed with sterile 1x PBS and
incubated with 1x trypsin/EDTA ranging from 1 min to 5 min (MCF10A). After the
detachment of cells from the flask was verified by light microscopy, a surplus of culture
medium was added for stopping the trypsin activity. The cell suspension was transferred into
a reaction tube (15 or 50 ml, respectively) and centrifuged for 5 min at 200xg at room
temperature. After discarding the supernatant and resuspending the pellet in culture
medium, the cells were released into new cell culture flasks depending on the expansion
rate.
Lymphoblastoid cells (LCLs), which were previously generated from whole blood samples of
different patients and immortalized with Epstein-Barr virus (EBV) by Britta Wieland, were
cultured in RPMI medium supplemented with 15 % FCS, 500 U/ml pen, 0.5 mg/ml strep and
2 mM gln. The suspension cells were cultured in upright T25 cell culture flasks and passaged
through transferring dilutions of 1:4–1:8 of cell suspension in fresh medium to new flasks. If
cells were in critical condition, the content of the whole flask was centrifuged at 200xg for
5 min at room temperature, the pellet was resuspended in fresh medium and transferred to
a new flask.
Long-term storage of cells can be achieved through cryopreservation in liquid nitrogen and
was performed in special freezing medium containing DMSO for adherent cells, which
prevents crystal formation and subsequent cell damage493. Cryopreservation conditions
varied between cultures and composition of freezing media are given in Table 14. For
cryopreservation, cells were harvested in the same way as described for passaging, however,
cell pellets were resuspended in 1–1.5 ml of freezing medium and quickly transferred into
cryovials, which were placed into freezing containers immediately and stored in a –80 °C
freezer overnight. The cryovials were subsequently transferred to liquid nitrogen for
extended storage. Thawing of cells was performed by warming up the cryovial at 37 °C,

70
quickly transferring the contents to a reaction tube with 5 ml of prewarmed culture medium
and immediate centrifugation at room temperature for 5 min at 200xg. The pellet was
resuspended and transferred to a culture flask with fresh medium, which was changed again
after 24 h, similarly to the passaging procedure.
Cells were counted using trypan blue staining and a Neubauer counting chamber with a light
microscope. The harvested cells were resuspended in culture medium and 80 μl of cell
suspension was transferred to a 1.5 ml reaction tube. Trypan blue staining solution (20 μl)
was added for identifying viable cells and in order to distinguish living from dead cells, which
were excluded from the counting. Straight away, the cell counting chamber was filled with
this mixture and two segments were evaluated. The cell number per ml was calculated using
the following equation:
Cells
ml=
Mean
4x dilution factor x chamber factor
Mean = Mean of cell numbers determined in two counted segments, dilution factor= 1.25; chamber
factor= 10000
Table 14 Culture and cryopreservation conditions of cell cultures
Culture Growth medium Cryopreservation medium
ADP DMEM with 10 % FCS, 500 U/ml pen,
0.5 mg/ml strep, 2 mM L-gln
Normal growth medium with
10 % DMSO
MCF10A MEGM (Mammary Epithelial Cell Growth Medium) with SingleQuot Kit Suppl. & Growth
Factors
Normal growth medium with 10 % DMSO
HCCs RPMI with 10 % FCS, 500 U/ml pen, 0.5 mg/ml
strep, 2 mM L-gln
Normal growth medium with
5 % DMSO
LCLs RPMI with 15 % FCS, 500 U/ml pen, 0.5 mg/ml
strep, 2 mM L-gln
Normal growth medium with
20 % FCS and 10 % glycerol
BJ5TA DMEM with 10 % FCS, 500 U/ml pen,
0.5 mg/ml strep, 2 mM L-gln
Normal growth medium with
60 % FCS and 10 % DMSO
MCs (primary/TERT
immortalized)
DMEM without Na-pyruvate with 10 % FCS,
500 U/ml pen, 0.5 mg/ml strep, 2 mM L-gln
Normal growth medium with
20 % FCS and 8 % DMSO
3.2.2 Telomerase reverse transcriptase immortalization
Immortalization has been defined as the ability to yield cell lines that can be serially
cultivated without undergoing crisis494. Primary fibroblasts naturally undergo differentiation
or senescence in culture after repeated passaging495-497, and the TERT (telomerase reverse
transcriptase) activity is silenced upon differentiation in many cell types498. TERT is a
specialized reverse transcriptase that catalyzes the addition of telomeric DNA repeats to the
ends of chromosomes499, thus preventing premature aging and loss of genetic material500.
Mutations in the TERT gene are the most common mutations in many cancers and arise early
during the transformation process498. As cancer cells escape aging through TERT activation,
artificial introduction of TERT into primary skin fibroblasts can provide a cell line that is not
subject to aging- or differentiation-associated proliferation limitation. In contrast to one of
the other prominent immortalization protocols through transformation with oncogenes such

71
as simian virus 40 large T antigen (SV40 large T), TERT does not interfere with TP53 and thus
exerts less influence on elevated chromosomal instability501 502.
The plasmids containing TERT and GFP (green fluorescent protein) were obtained from ATCC
(pGRN145, # MBA-141) and Lonza (supplemented with P2 primary cell kit, #V4XP-2024),
respectively. They were amplified and purified using endotoxin-free solutions and
disposables and were kindly provided by Dr. Kristine Bousset, Molecular Gynaecology unit,
Clinics of Obstetrics and Gynaecology, Hannover Medical School. The nucleofection device
was kindly provided by Prof. Axel Schambach, Department Experimental Hematology,
Hannover Medical School. The immortalization procedure with TERT was established on
primary fibroblasts, using the nucleofection programs “CF-158” and “DS-138” and a
concentration range of plasmid DNA from 2–4 µg/ml. Subsequently, plasmid concentrations
of 4 µg/ml of TERT and 2 µg/ml of GFP, respectively, were chosen. Hygromycin B titration
was performed to determine the lethal concentration necessary to kill the non-transfected
cells. Short-term high-dose selection with hygromycin B was tested versus long-term
medium dose selection until a concentration of 10 µg/ml hygromycin B was chosen for
application of medium/long-term selection as well as follow-up culture conditions.
For nucleofection, the P2 primary cell kit (Lonza, #V4XP-2024) was used with 100 µl single
cuvettes. 6-well plates were prepared with cell culture medium and warmed to 37 °C prior to
nucleofection. Cells were harvested at subconfluent conditions (maximum 70 % confluency)
and counted as described in subsection 3.2.1. 0.5x10⁶ cells were prepared for each
experiment and centrifuged at 90xg for 10 min at room temperature. The supernatant was
carefully removed and the pellet was resuspended in 100 µl room temperature
nucleofection solution consisting of 82 µl nucleofector solution, 18 µl supplements and
corresponding plasmids (2 µg of GFP and 4 µg of TERT plasmid). Following bubble-free
transfer into the nucleocuvette, the program was immediately initiated. After completion of
the program, the nucleocuvette was placed into the cell culture incubator for 5 min. 500 µl
of prewarmed culture medium was added to the cells using the pipettes supplied with the
kit. The cell suspension was carefully mixed and transferred to the 6-well plates containing
1.5 ml culture medium, and placed into the incubator for recovery. 24 h post transfection,
the cells were analyzed for the development of GPF fluorescence as reporter using a
fluorescence microscope.
Selection with 10 µg/ml hygromycin B was started at 24–48 h after nucleofection, depending
on the conditions of the cells, and medium was changed back to normal growth medium
after the majority of non-transfected cells had died during the selection process. For the first
1–2 weeks, the medium was changed every day when a prominent number of cells had
undergone cell death. The selection pressure was maintained through subsequent boosts of
hygromycin B treatment, until a fully immortalized culture was obtained. If cells did not grow
well, they were transferred to new cell culture flasks in order to stimulate proliferation. Cells
in outgrowing colonies were separated and transferred to larger culture flasks. After the
respective recovery phases, the cells were tested for TERT levels by western blot and culture
conditions with hygromycin B were maintained if presence of TERT was confirmed.
3.2.3 Mycoplasm treatment
Cells, which were positively tested for mycoplasm contamination by routine PCR
(polymerase chain reaction) testing, were subjected to mycoplasm treatment with Mynox
72
Gold reagent according to the manufacturer's instructions. After confirmation of mycoplasm
clearance by PCR, cells were routinely tested for re-infection every three months or
additionally after freezing and thawing cycles.
3.2.4 Reverse transfection and siRNA silencing
siRNA-mediated knockdown is a well established tool for functional analyses aiming at
focusing on individual genes within living cell cultures. For knockdown experiments in
section 4.1, siRNAs capable of targeting TPT1 were obtained from Ambion (AM16708A
#284697, #13153, #289422) and were used as steady mixture265. Scrambled (scr) siRNA
duplex (Ambion) was included as control, and reverse transfection with Lipofectamine
RNAiMAX was used to apply siRNAs to subconfluent cells 48–72 h prior to analysis
(irradiation), as recommended by the manufacturer. This transfection reagent utilizes
cationic liposomes to deliver the siRNA and can yield high efficiency also in hard-to-transfect
cells. Reactions were performed in 6-well plates with 5x10⁵ cells per well for MCF10A and
8x10⁵ cells per well for ADP, respectively, which were harboured at subconfluent conditions
and counted as described in subsection 3.2.1. During the transfection, normal culture
medium without antibiotics was applied. Before complexion, RNAi duplexes and
lipofectamine reagent were diluted in Opti-MEM I Reduced Serum Medium. 10 pmol of each
siRNA was diluted in 100 µl Opti-MEM in the well of the culture plate and gently mixed. 5 µl
of Lipofectamine RNAiMAX was added, gently mixed and incubated for 15 min at room
temperature. 500 µl of cells were diluted in growth medium without antibiotics, applied to
the well in a total volume of 2.5 ml, gently mixed and incubated for 48 h. As knockdown was
confirmed to be complete after 48 h (see Supplementary figure S-1B), this incubation period
was chosen for TPT1 silencing.
3.2.5 ATM inhibition
For ATM inhibition experiments shown in Supplementary figure S-2, the cells were treated
with different concentrations (2 μM or 10 μM in DMSO) of the ATM inhibitor Ku55933 (KuDos Pharmaceuticals, Cambridge, UK) one hour before IR. Control cells were treated with
DMSO only.
3.2.6 Irradiation
Cells were usually seeded one day before irradiation (except for knockdown experiments
that were performed 48 h prior to IR treatment) and supplemented with fresh culture
medium shortly before IR. Ionizing radiation with doses between 60 mGy–8 Gy was applied
to the cells at room temperature using an Elekta Synergy accelerator (Siemens, Munich, DE).
The energy of the X-radiation was 6 MVX and a dose-rate of 400 MU/min was applied to the
cells.
3.2.7 Lysate preparation and immunoblotting
For preparation of protein extracts, cells were harvested by trypsination as described in
subsection 3.2.1, and all subsequent steps were performed on ice to avoid degradation of
proteins. Pellets were washed once in 5 ml ice cold 1x PBS and centrifuged for five minutes
at 4 °C. Subsequently, pellets were resuspended in 1 ml 1x PBS and centrifuged eight
minutes at 1000xg (3000 rpm) and 4 °C.

73
3.2.7.1 Generation of whole cell lysates and Bradford assay
For whole-cell lysis 50 µl-150 µl cell extraction buffer was applied to the pellets for 45 min on
ice. Protein extracts were cleared through centrifugation at 19500xg for 15 min, and protein
concentration was determined via the Bradford assay. This assay is based on the shift of the
absorption maximum of the dye Coomassie Brilliant Blue-G250 from 365 nm to 595 nm after
its binding to proteins via hydrophobic interactions503. Calibration was performed with
bovine serum albumin in concentrations of 0, 2, 4, 6, 8, and 10 mg/ml to generate the
standard curve. The Bradford solution was diluted 1:5 in ddH2O and 1 μl of the
corresponding lysis buffer in 1 ml of the dilution was used to blank the photometer.
Afterwards, 1 µl sample was added to 1 ml of the Bradford dilution, carefully mixed,
transferred to the UVette and measured in the photometer at λ= 595 nm immediately.
3.2.7.2 Subcellular fractionation
For cytoplasmic, nuclear and chromatin-bound protein isolation, cells were lysed in buffer A
(see subsection 3.1.7) for 10 min on ice by frequent vortexing intervals. Cytoplasmic
fractions were harvested by centrifugation with 4000xg for 4 min on ice. Pellets containing
nuclei were washed once with buffer B (see subsection 3.1.7) and centrifuged for 30 min at
full speed (15000xg). To harvest nuclei, pellets were resuspended in buffer C (see subsection
3.1.7) and incubated 30 min on ice with frequent vortexing intervals. Soluble nuclear
proteins were separated from insoluble chromatin by centrifugation at full speed (15000xg)
for 5 min at 4 °C. The final chromatin pellet was resuspended in 1 U/µl DNase I (Roche) in
buffer C and incubated for 30 min at 37 °C to release chromatin-bound proteins. Subsequent
centrifugation at 1300xg for 15 min at 4 °C was applied to harvest chromatin-bound proteins
in the supernatant. Antibodies directed against SP1 (SP1 Transcription Factor) and RAD50
were used for quality control of the fractionization, as they are known to localize to the
nucleus. Protein concentrations of the fractions were determined by Bradford assay as
described in section 3.2.7.1.
3.2.8 Sodium dodecyl sulfate polyacrylamide gel electrophoresis and western blot
After determination of the protein concentration by Bradford assay (see section 3.2.7), 30 µg
of protein lysates, generated either by whole cell or fractionization procedures, were mixed
with loading buffer containing sodium dodecyl sulfate (SDS), diluted in ddH2O and heated to
95 °C for 5 min. As a consequence of heating and binding of SDS to hydrophobic regions of
proteins, denaturation and charge-masking of proteins is triggered, respectively.
Subsequently, protein samples can be separated according to their size by segregation
through SDS polyacrylamide gel electrophoresis (PAGE) either directly, or stored at -80 °C
until further processing. Stacking gels were used to accumulate proteins and compensate
volume differences before the proteins were separated through separation gels with
according pore sizes. Stacking, as well as separation gels, were prepared according to Table
15 using 10 % gels for ATM signaling experiments and 15 % gels for all experiments involving
TPT1. The separation gel was poured into the gel chamber until approximately 60–70 % of
the total volume was covered and overlayed with propan-2-ol. After polymerization of the
gel, the propan-2-ol was discarded and the gel chamber filled up with stacking gel.
Immediately after, the comb was inserted with care to form even sample slots. After

74
polymerization of the stacker, the gel was stored at 4 °C covered in moist paper towels for a
few days or used straight away.
Before usage, the comb was removed and the sample slots were washed with ddH2O. The
gel was then transferred to the electrophoresis chamber, which was filled with 1x GTS (Table
11). The electrophoresis was run at room temperature at 80 V until the samples reached the
separation gel. If the samples moved evenly through the gel, the voltage was then increased
to 120 V. Otherwise it was either slightly increased or not changed. The electrophoresis was
stopped just before the dye front ran out.
Table 15 Composition of western blot gels
Separation gel 10 % Separation gel
15 %
Stacking
gel
40 % Acrylamide 5 ml 7.6 ml 1.28 ml
2 % Bis-acrylamide 1.32 ml 1.88 ml 0.7 ml
H2O 6.12 ml 4 ml 5.5 ml
20 % SDS 100 μl 100 µl 50 μl 1M Tris-Cl (pH 8.7) 7.52 ml 7.52 ml –
0.5M Tris-Cl (pH
6.8)
– – 2.46 ml
TEMED 20 μl 20 μl 40 μl 10 % APS 100 μl 100 μl 80 μl
In order to enable access of specific antibodies to the proteins separated by SDS-PAGE, the
wet immunoblot (tank blot) technique was applied using a nitrocellulose membrane. For the
transfer onto the membrane, the gel was taken out of the electrophoresis chamber and
placed on the blotting module in the following order: blot module with negative terminal,
sponge, two Whatman papers, gel, nitrocellulose membrane, two Whatman papers, sponge
and blot module with positive terminal. Everything was prepared in 1x carbonate buffer and
placed in the blotting chamber, which was filled with 1x carbonate buffer to the maximum.
The transfer was carried out at 4 °C for three hours at 35 V.
To check whether the transfer was successful, the membrane was removed from the
blotting module and a Ponceau S staining was performed, which unspecifically stains
abundant proteins enabling estimation of transfer completeness504. The following steps
were carried out at room temperature, if not stated otherwise, and while being gently
shaken. The membrane was once washed with 1x PBS and incubated with Ponceau S
solution for a few minutes, until the protein lanes were clearly visible. The staining solution
was then discarded and the membrane washed with ddH2O to remove the stain. Afterwards,
the membrane was blocked one hour in blocking solution (5 % skim milk powder in PBS-T)
and then incubated with primary antibody (diluted in fresh blocking solution) overnight at
4 °C, to allow marking of target proteins505. Subsequently, the antibody was removed and
stored at -20 °C for following usage. The membrane was washed four times with sufficient
1x PBS-T for ten minutes each, and the secondary antibody, also diluted in blocking solution,
was added for an incubation time of two hours. The membrane was again washed four times
with sufficient 1x PBS-T for ten minutes. For detection of the secondary antibody, which was

75
coupled to horseradish-peroxidase and also enables amplification of the signal, the
membrane was incubated with enhanced chemiluminescence (ECL) solution, based on
luminol, according to the manufacturer’s instructions. The peroxidase catalyzes the
oxidation of luminol, which subsequently emits light that can be detected by photographic
density of X-ray films. If the targeted protein was ß-actin, the secondary antibody was
detected with self-prepared luminol, due to the high abundance of the protein resulting in
strong photographic density. After incubation with the detection solution, the membrane
was shrink-wrapped in a plastic foil and the protein signals detected by light sensitive films in
the dark room. The exposure time depended on the signal strength and was varied from a
few seconds for ß-actin and TPT1 to half an hour for phospho-antibodies. The films were
subsequently scanned and analyzed with Image J.
3.2.9 Immunocytochemistry and pre-extraction
Immunocytochemistry, - or more precisely - immunofluoresence analyses were performed
to provide information on presence of proteins in intact cells and simultaneously collect data
on their localization. Proteins were marked with primary antibodies analogous to the
immunoblot technique and fluorescence-coupled secondary antibodies were used to enable
amplification and visualization of the signal with a fluorescence microscope. For detection of
irradiation-induced foci by immunofluorescence, cells were seeded and grown on cover
glasses in six-well plates (Nunc) one day prior to IR treatment. Depending on the
experimental setting, cells were washed three times in 1x PBS and fixed at time points
ranging from 1 h to 48 h, by treatment with 3 % (w/v) formaldehyde, 2 %(w/v) sucrose in
PBS for 10 min. Permeabilization was performed with 0.2 %(v/v) triton X-100 in PBS, in order
to allow penetration of the cell membrane by antibodies. Primary antibodies against the
target proteins were incubated in 2 % (w/v) normal goat serum (Dianova) for 2 h. After PBS
washing, cells were incubated with Alexa Fluor Anti-mouse IgG 488 (Invitrogen, #A11018)
and Alexa Fluor Anti-rabbit IgG 546 (Invitrogen, #A11071) or FITC-conjugated Anti-mouse IgG
antibody (Zymed, #62-6511) and Alexa Fluor Anti-rabbit IgG 488 (Invitrogen, #A11070) for
2 h, respectively. DNA was counterstained with DAPI (Invitrogen) and cover classes were
mounted onto slides with Pro-Long® Gold (Invitrogen) and dried overnight before evaluation
by fluorescence microscopy. For pre-extraction of proteins, which are abundant in the
cytoplasm, cells were subjected to detergent extraction with pre-extraction buffer
containing 10 mM Hepes (pH 6.8), 100 mM NaCl, 300 mM sucrose, 3 mM MgCl2, 1 mM EGTA
and 0.5 % triton X-100 in PBS for 5–10 min to remove the majority of non–chromatin-bound
proteins before fixation and immunostaining, in order to enable a noisefree view of the
nuclear forms of these proteins265.
3.2.9.1 Fluorescence micoscropy and confocal laser scanning microscopy
Images were taken by Leica DMI6000B microscope (63x–100x magnification) or, for a more
detailed inspection, using an Olympus confocal microscope FV 1000 (60× magnification),
Table 16. Confocal microscopy is a form of light microscopy which enables depiction of
three-dimensional structures by scanning different levels of a sample with a laser, which
excites fluorescence molecules and produces very high resolution images506. Table 16 shows
details about microscopes, objectives, and corresponding wavelengths used for excitation,
as well as applied software for data processing. γH2AX and 53BP1 foci were counted
manually with Image J software on pictures in an average of 100 cells after siRNA treatment

76
and/or IR for each of at least two independent experiments, independent from the cell-cycle
phase. Cells with apoptotic morphology or cells with intensely and completely stained
nucleus were excluded from the counting process. Colocalisation was defined as yellow
stained dots in overlay pictures generated with confocal microscopy. In general, the
colocalization rate in experiments described in subsection 4.1.3 was very low, but at least 10
colocalization-positive cells were examined and counted manually in control cells and at
least 15 cells in irradiated samples, respectively. RAD51 foci (see Supplementary figure S-25
and Supplementary figure S-27) were counted directly under the Leica fluorescence
microscope using the 100x oil objective.
Table 16 Fluorescence microscopy devices and parameters
Microscope Objective with numeric
aperture (NA)
Filter/excitation
wavelength
Software
Leica DMI6000B PLAN L PH2 (40x, NA: 0.6), A/BP 400/20 nm Leica
Application
Suite 1.9.0
HCX PLAN L (63x, NA: 0.7) L5/BP 480/40 nm
HCX PLAN L Oil (100x, NA: 1.3) Y3/BP 545/40 nm
Olympus
confocal
microscope FV
1000
Oil immersion (60x, NA: 1.35)
532nm, 559nm,
655nm
FluoView1000
3.2.10 Image processing and foci analyses
Image processing was performed with the programs Leica Application Suite, Olympus
FluoView1000, GraphPad Prism and ImageJ. For foci analysis, pictures of the cells were taken
with a Leica DMI6000B microscope with settings stated in Table 17. The settings were just
slightly changed during observation of one slide.
Table 17 Microscope settings used for foci images
Blue
channel,
λ = 425 nm
Red channel,
λ = 572–648 nm
Green channel,
λ = 512–542 nm
Fluorescence
Intensity Manager
[%]
100 55 30
Exposure time [ms] 30–200 60–390 50–260
Gain 2.6–6.0 2.0–10 2.0–10
The foci were counted by eye with support of the Image J software for γH2AX and 53BP1 foci and directly under the microscope for RAD51 foci, respectively. Results of RAD51 foci
analysis in primary cells were already published507 and RAD51 analysis in TERT-immortalized
cells were done by Katharina Stemwedel in the course of her student assistant work (as
pointed out by “observer 2” in Supplementary figure S-27). For analysis with the Image J

77
software, the images were split to single channel images and the area of the nucleus was
manually selected. The Image J option to find maxima within this area was chosen to find,
mark and count the foci. The noise factor was optimized for each picture by eye and all of
the counted were foci proof-read. Cells with apoptotic morphology or intensely stained
nucleus were excluded from this process. The threshold of at least three foci per nucleus was
applied and only cells meeting these criteria were considered as “foci-positive”. At least 100
cells were counted for each cell line and time point. Foci counting in subsection 4.4.2. was
performed by Katharina Stemwedel in the course of her bachelor thesis and the foci
counting procedure was validated by two second observers during an internship of two Life
Sciences students.
3.2.11 Colony survival assay
The colony survival assay is known as the “gold standard of radiosensitivity”508 and is a well
established method to assess effects of cell survival after different treatments. It is based on
the premise that surviving single cells can undergo a series of cell divisions and eventually
form colonies, which can be counted by microscopy. The effect of different treatments such
as irradiation or chemotherapeutics can be related to the surviving fraction of cells, which is
calculated based on the initial input of single cells. The CSA measures the sum of all modes
of cell death, including both early and late events such as delayed growth arrest.
One day prior to IR, subconfluent cells were harvested and counted as described in
subsection 3.2.1. Different seeding concentrations were tested from 1250–5000 cells per
flask for untreated and 5000–20000 cells per flask for irradiated cultures, respectively, until
optimal seeding densities for each cell line were obtained. In order to harvest evaluable
colonies, cells need to be seeded in higher densities for IR treatment compared with
controls. One day after seeding, cells were subjected to 2, 4, and 6 Gy radiation treatment
and kept in culture for up to three weeks. The medium was changed twice a week and
pictures of cells were taken once a week to assess progress of colony formation. When
visible colonies of at least 50 cells each were detected in the controls, the assay was
stopped. The medium was aspirated and cells were washed with 1x PBS three times. Cells
were fixed with 2 % sucrose, 3 % formaldehyde in 1xPBS for 30 min at room temperature.
The fixing solution was discarded and 0.5 % crystal violet in ddH20 was added for 30min at
room temperature. Afterwards, the staining solution was removed and stored for further
usage. Cells were washed several times with water until clearly stained colonies were visible.
Cell culture flasks/6-well plates were dried at room temperature at least overnight and
colonies were analyzed using light microscopy.
In order to provide physiological attachment surfaces for the radiosensitive cells, 6-well
plates coated with gelatin and collagen, respectively, were also tested. For preparation of
gelatin coating, a 0.1 % gelatin solution in 0.9 % NaCl was warmed to 37 °C, applied to the
culture plate or T25 flask and incubated for 20 min. It was subsequently discarded and the
plates or flasks were left to dry prior to addition of cells.
3.2.12 Senescence assay
The β-galactosidase staining assay was performed to analyze development of senescence in
cells subjected to irradiation treatment. It is based on β-galactosidase (β-gal) cleavage of the
artificial substrate X-gal (5-bromo-4-chloro-3-indolyl-beta-D-galactopyranoside), which is

78
subsequently metabolized and detected as blue color509. The β-galactosidase staining kit
(Qiagen, Table 7) was used to detect pH-specific (pH 6.0) activity of β-galactosidase, which is
associated with senescence510. The procedure was followed according to the manufacturer’s
instructions. Subconfluent cells were seeded in 6-well plates one day prior to IR. Optimal
seeding densities were established for each cell line and ranged from 5000–10000 cells for
early time points 24 h and 48 as well as the unirradiated controls and from 1000–3000 cells
per 6-well for late time points 7 d and 9 d. One day after seeding, cells were subjected to IR
with 4 Gy and fixed after 24 h, 48 h, 7 d or 9 d, respectively. The medium was aspirated, cells
were washed with 1xPBS and fixed for 15 min at room temperature. Subsequently, the fixing
solution was discarded and freshly prepared staining solution was added to the cells. The 6-
well plates were sealed with parafilm to prevent evaporation and placed into a 37 °C
incubator without CO2 supply for 48 h. Cells were checked for the development of blue color
and pictures were taken with the staining solution remaining on the cells. Cells were counted
according to positive criteria of development of blue color. Only clearly blue cells were
considered senescent, while cells with normal shape and appearance that lacked blue color
were considered non-senescent. Cells with apoptotic morphology and/or intense
vacuolization, which lacked β-galactosidase staining, were excluded from the counting
procedure. Non-senescent cells were normalized to total cells numbers counted (75–100
cells per well), plotted and analyzed with GraphPad Prism software. The results of the pilot
experiments were additionally anlyzed by Katharina Stemwedel (as indicated by “observer two” in Figure 34) during the course of her student assistant work.
3.3 Other methods
3.3.1 Statistics
All experiments were performed at least two times in section 4.1 and at least three times for
experiments in section 4.4. Comparisons between treatments or groups and respective
controls were conducted using unpaired two-tailed t-test or unpaired two-tailed Mann-
Whitney test by GraphPad Prism version 5.01 for Windows, GraphPad Software, San Diego
California USA. If data deviated from normal distribution parameters, tested by GraphPad
column statistics (D’Agostino and Pearson omnibus normality test), median was preferred
over the mean as subject to further testing. Outliers were determined using Grubb’s Test511.
Regression analyses and three-way ANOVA of data in subsection 4.1.4 were performed using
STATA12 by Dr. Thilo Dörk-Bousset. P values < 0.05 in the pairwise comparison of groups or
in interaction analyses were considered significant. The number of independent experiments
is indicated by “n”, given by the number of symbols of each column or explained in the according subtext of figures. Significance levels are given by p ≤ 0.001 (***), p ≤ 0.01 (**),p ≤ 0.05 (*), or p > 0.05 (ns= not significant). In Ingenuity Pathway Analysis, p-values of overlap
were calculated based on Fisher’s Exact Test, see explanation in Figure 12. The Null
hypothesis is defined by default as: no overlap between molecules from the dataset and a
disease/function/upstream regulator/pathway. Fisher’s Exact Test compares the set of molecules in the uploaded dataset to a reference set that includes all known molecules, for
example in the Ingenuity Knowledge Base dataset (Figure 8A).
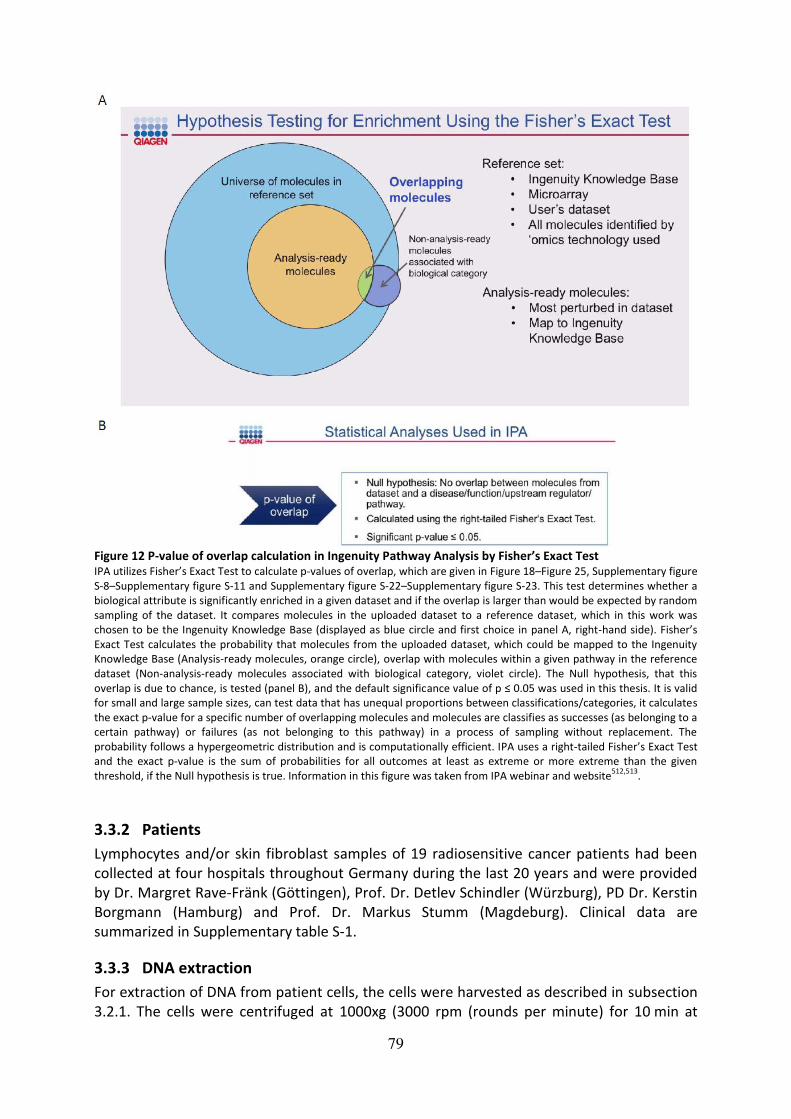
79
Figure 12 P-value of overlap calculation in Ingenuity Pathway Analysis by Fisher’s Exact Test IPA utilizes Fisher’s Exact Test to calculate p-values of overlap, which are given in Figure 18–Figure 25, Supplementary figure
S-8–Supplementary figure S-11 and Supplementary figure S-22–Supplementary figure S-23. This test determines whether a
biological attribute is significantly enriched in a given dataset and if the overlap is larger than would be expected by random
sampling of the dataset. It compares molecules in the uploaded dataset to a reference dataset, which in this work was
chosen to be the Ingenuity Knowledge Base (displayed as blue circle and first choice in panel A, right-hand side). Fisher’s Exact Test calculates the probability that molecules from the uploaded dataset, which could be mapped to the Ingenuity
Knowledge Base (Analysis-ready molecules, orange circle), overlap with molecules within a given pathway in the reference
dataset (Non-analysis-ready molecules associated with biological category, violet circle). The Null hypothesis, that this
overlap is due to chance, is tested (panel B), and the default significance value of p ≤ 0.05 was used in this thesis. It is valid for small and large sample sizes, can test data that has unequal proportions between classifications/categories, it calculates
the exact p-value for a specific number of overlapping molecules and molecules are classifies as successes (as belonging to a
certain pathway) or failures (as not belonging to this pathway) in a process of sampling without replacement. The
probability follows a hypergeometric distribution and is computationally efficient. IPA uses a right-tailed Fisher’s Exact Test and the exact p-value is the sum of probabilities for all outcomes at least as extreme or more extreme than the given
threshold, if the Null hypothesis is true. Information in this figure was taken from IPA webinar and website512,513
.
3.3.2 Patients
Lymphocytes and/or skin fibroblast samples of 19 radiosensitive cancer patients had been
collected at four hospitals throughout Germany during the last 20 years and were provided
by Dr. Margret Rave-Fränk (Göttingen), Prof. Dr. Detlev Schindler (Würzburg), PD Dr. Kerstin
Borgmann (Hamburg) and Prof. Dr. Markus Stumm (Magdeburg). Clinical data are
summarized in Supplementary table S-1.
3.3.3 DNA extraction
For extraction of DNA from patient cells, the cells were harvested as described in subsection
3.2.1. The cells were centrifuged at 1000xg (3000 rpm (rounds per minute) for 10 min at

80
4 °C. After discarding the supernatant, the pellet was washed twice with ice cold sterile 1x
PBS and centrifuged again at 1000xg (3000 rpm) for 10 min at 4 °C. After transfer to a new
1.5 ml reaction tube, the samples were centrifuged at 2800xg (5000 rpm) for 10 min at 4 °C
and after removal of the supernatant, pellets can either be frozen at -20 °C or directly
processed.
3.3.3.1 Phenol-chloroform extraction and ethanol precipitation of genomic DNA
For removal of protein contamination, the pellet was resuspended in 400 μl proteinase K
reaction mix (Table 11) with subsequent proteolysis at 56 °C overnight in a thermal shaker.
Impurities were removed by vigorous shaking of samples after proteinase K reaction with
400 μl of equilibrated phenol/chloroform/isoamyl alcohol mixture (25:24:1 in TE, pH 8.0).
After incubation on ice for 10 min, the emulsion was centrifuged for 10 min, 18900xg (13000
rpm), at 4 °C, and the upper aqueous phase was collected in new autoclaved 1.5 ml tubes.
This step was repeated once again with an equal volume of phenol/chloroform/isoamyl
alcohol, the emulsion centrifuged for 10 min, 18900xg (13000 rpm), at 4 °C, and the upper
aqueous phase again transferred to new autoclaved 1.5 ml tubes. Subsequently, an equal
volume of pure chloroform was applied to the supernatant (upper aquaeous phase),
carefully mixed and incubated for 10 min on ice. After centrifugation for 10 min, 18900xg
(13000 rpm), at 4 °C, the upper aqueous phase was collected for precipitation. Nucleic acids
were precipitated by addition of 40 µl (1/10 volume) 3 M sodium acetate (pH 4.8) and 1 ml
(2.5 volumes) of absolute ethanol/uvasol (100 %). The mixture was then carefully swayed,
incubated for 30 min on ice to complete DNA precipitation and centrifuged (30 min, 4 °C,
19500xg (13200 rpm)). The pellet was washed twice with 500 µl 70 % ethanol/uvasol to
remove residual salts and centrifuged (15 min, room temperature, 18900xg (13000 rpm).
After washing, the supernatant was carefully aspirated and the pellet was dried at 50 °C for
5–7 min.
Depending on the subsequent application, the dried pellet was resolved in either 1x TE
buffer or ddH2O, respectively. For exome sequencing, 1x TE buffer (depending on the size
100 µl–500 µl) was used to dissolve the pellet, the suspension was carefully vortexed and
the pellet dissolved either at room temperature for 1 h or overnight at 4 °C. After 1:5
dilution with 1x TE, the concentration of the DNA is determined by measuring in a NanoDrop
8000 device (Peqlab).
3.3.4 Exome sequencing
Exome sequencing has emerged as powerful tool to specifically enrich and analyze the
genetic background of the coding sequences of the genome. To investigate possible genetic
mutations underlying the clinical radiosensitivity of 19 cancer patients, and to analyze the
genetic background of two matched pairs in parallel, genomic DNA was isolated from whole
blood cells and subjected to exonic sequence enrichment using the Agilent SureSelect XT
Human All Exon V5 Library in cooperation with Dr. Robert Geffers at the Helmholtz Center
for Infection Research (HZI), Braunschweig. This was followed by exome sequencing at 100x
coverage on an Illumina HiSeq_PE200 platform, as performed by Dr. Sabin Bhuju at the HZI.
Sequencing reads were quality trimmed and aligned to human reference genome (hg19) by
Dr. Geffers. Variants were called by GATK-HaplotypeCaller and further evaluated using GATK
pipeline recommendations. Annotation of variants was performed by the Annovar tool.
Mutations identified were filtered for their predicted effect (truncating and splice site only),
for minor allele frequency < 0.005, and for simultaneous occurrence in <3 patients.

81
Mutations were then verified by direct Sanger sequencing of the corresponding genes and
regions by use of an in-house sequencer (3.3.7 and Table 12).
3.3.5 Primer design and polymerase chain reaction
3.3.5.1 Primer design
For validation of prioritized mutations identified by exome sequencing (for prioritization
criteria see section 4.2), sequence-specific primers were designed. The sequence was
retracted from the National Center for Biotechnology Information (NCBI) database514,
reference genomic sequence 37.p13 primary assembly. The region spanning 1000 bp (base
pairs) around the mutation was used as reference to design primers in the forward and
reverse 5’3’ direction with at least 50 bp distance to the region of interest. Primers were
designed to yield a PCR product of maximum size 600 bp, consisted of 20 bp stretches with
equal A/T–G/C content and initiated and terminated by G/C. Forward and reverse primer
were checked to be non-complementary and were designed outside of highly repetitive or
palindromic sequences, if possible. A complete list of primers is given in Supplementary table
S-6–Supplementary table S-8.
3.3.5.2 Polymerase chain reaction and purification of products
Polymerase chain reaction (PCR) is a technology to amplify selected pieces of DNA and was
invented by Kary Mullis in 1983515. It is one of the most important techniques in the field of
molecular biology as it very sensitive and requires only a small amout of DNA to generate
billions of replicates in a short time516. The general principle of PCR starts from a pair of
oligonucleotide primers that are designed so that a forward or sense primer directs the
synthesis of DNA on one strand in a 5’3’ direction, and a reverse or antisense primer on
the complementary strand vice versa. From the second cycle on, the daughter strands can
also serve as templates for PCR products with restricted lengths defined by both primers.
During several extension cycles of PCR, the Taq DNA polymerase (a heat stable
polymerase)517 catalyzes the synthesis of new DNA strands complementary to the template
DNA from the 5’3’ direction by a primer extension reaction, resulting in the exponential
production of the selected DNA region flanked by the two primers.
A mix for PCR was prepared with final concentrations of 0.2 mM dNTPs, 1.5 mM MgCl2, 1 U
heat stable DNA polymerase from Thermus Aquaticus (TopTaq or HotStar, if TopTaq was not
successful), 0.5 μM of each primer, 1 x specific amplification buffer, recommended by
manufacturers of enzymes, 50 ng genomic DNA and sterile HPLC-grade water to yield up to
15–25 μl end volume in either 0.5 ml PCR tubes or 96-well plates. Amplification was
performed in a peltier-controlled thermocycler (mostly PTC-200 from Biozym/MJ Research)
where an initial denaturation of 15 min (for HotStar Polymerase) or 5 min (for GoTaq
Polymerase) was followed by a range of 33 to 40 cycles of denaturation-annealing-extension
steps, depending on the primer pair. Denaturation and extension steps were performed for
1 min. Denaturation temperature was 95 °C, extension temperature 72 °C. Annealing
temperature was adjusted according to primer composition and was selected for each
primer pair independently in a prior optimization procedure with temperature gradient 54 °C
to 64 °C, see Table 18.

82
Table 18 PCR protocol for primer optimization and validation sequencing
Step Temperature Time
Initial denaturation 95 °C 5 min for TopTaq
15 min for HotStar
Annealing 54 °C to 64 °C 1 min Extension 72 °C 1 min
Denaturation 95 °C 1 min
35 cycles Go to 2, 35 times
Final extension 72 °C 5 min
Cooling 8 °C Until samples are removed
Purification of PCR products was performed by polyethylene glycol (PEG) precipitation. 1x
volume of PEG was applied to the PCR product and the sample was vortexed thoroughly.
After 10 min incubation at room temperature, the PCR product was centrifuged at 15700xg
for 10 min, the supernatant was removed and samples were washed with 100 µl absolute
ethanol/uvasol. The PCR products were incubated again for 10 min and centrifuged at
15700xg for 10 min. The supernatant was discarded and the dry pellet was dissolved in 10–20 µl HPLC-purified water. To check for loss of PCR product, 4 µl of PEG-purified sample were
run on a 2 % agarose gel.
3.3.6 Agarose gel electrophoresis
Electrophoresis is a technique by which a mixture of charged macromolecules, especially
nucleic acids or proteins, can be separated in an electric field according to the correlation of
electrophoretic mobility and the macromolecule’s charge to mass ratio. Nucleic acids can be separated according to their lengths by gel electrophoresis through agarose gels, with the
separation range being dependent on the agarose concentration. In this work 1–3 % w/v
agarose in TBE was prepared. The amount of 1–3 g of agarose was dissolved in 100 ml 1 x
TBE buffer, boiled in the microwave, cooled down to about 50–80 °C before addition of Gel-
Red (1000 fold in DMSO, final dilution approximately 1:50000), thoroughly mixed by gentle
swirling and then poured into an electrophoresis tray with appropriate comb(s). After
solidification of the agarose, the tray was transferred to a horizontal electrophoresis
chamber and the gel was covered with 1x TBE buffer. The 4–8 μl of sample were mixed with
2–4 μl of 6 x loading buffer (Table 11), applied onto the gel, and run at 100–150 V at RT until
samples were separated. To check for complete separation and for determination of size of
the nucleic acids fragments on agarose gels, molecular weight ladders were loaded in
parallel. After gel electrophoresis, the DNA was visualized on a UV transilluminator.
3.3.7 Sanger sequencing
With the progress in next generation sequencing techniques such as exome sequencing, a
new era of high-throughput and highly parallel sequencing has advanced. However, the
traditional sequencing protocol according to Dr. Frederick Sanger518 is still a very important
method for validation of findings among other applications. Using this chain termination
method, the order of nucleotides in a given DNA fragment can be determined. Modified
nucleotide substrates (most commonly di-desoxyribonucleoside triphosphates labeled with a
separate fluorescent dye, ddNTPs) account for the sequence-specific termination of a DNA

83
synthesis reaction. Sequence-specific primers composed of short oligonucleotide sequences
complementary to the template at the region of interest, are designed for the forward, and
the complementary reverse reaction on the opposite strand in 5’3’ direction. After binding of the primer, it is extended using a DNA polymerase which incorporates the
desoxyribonucleosidetriphosphates but also occasionally utilizes a chain terminating
nucleotide, each with a different fluorescent dye detectable at a different wavelength.
Incorporation of the ddNTPs at different positions in repeated cycles results in a series of
related DNA fragments that are terminated only at positions where that particular
nucleotide is used. The end-labeled fragments are then size-separated by electrophoresis
either in a slab gel or in a narrow glass tube (capillary) filled with a viscous polymer.
In this work, sequencing reactions were performed with the Sanger method using a Big Dye
Terminator Cycle Sequencing-Kit v.-1.1 (Applied Biosystems, Darmstadt). The sequencing
reaction was carried out in a total volume of 10 μl, usually containing 2 μl of purified PCR
products, 1 μl of sequencing primer (5 μM) and 1.5 μl BigDye reaction mix (contains reaction
buffer, dNTPs, four differentially labeled ddNTPs and polymerase) supplemented with
fluorescence-free HPLC grade water (Baker). Elongation and chain termination follows a
specific program in a thermocycler, see Table 19.
Table 19 Cycling conditions for sequencing reaction
Step Temperature Time
Initial activation 95 °C 5 min 26 cycles 50 °C 15 s
60 °C 4 min
95 °C 30 s
Subsequently, the DNA was precipitated by adding 1/10 volume 3 M sodium acetate and 3x
volume absolute uvasol/ethanol. The samples were vortexed and incubated for 1 h at room
temperature in the dark before being centrifuged for 30 min at 15700xg at 4 °C. The
supernatant was discarded and the pellet was washed with 300 µl 70 % ethanol/uvasol.
After centrifugation at 15700xg for 10 min at 4 °C the pellet was dried and resuspended in
20 µl 95 % form amide. The samples were incubated for 1 h at room temperature in the dark
and DNA was denatured for 3 min at 93 °C in a thermal cycler. The samples were transferred
onto a 96 well plate and sequenced using the Genetic Analyzer 3100-Avant by Applied
Biosystems with the following instrument protocol: Seq_50cm_POP6_Set_E and the analysis
protocol POP6_BDTv1.1. Dr. Natalia Bogdanova and the students Julia Enssen and Louisa
Weinhold helped with PCR amplifications and subsequent sequencing for the majority of the
mutations. For unambiguous identification of several mutations in the heterozygous state, a
control was sequenced as direct comparison.
3.3.8 Bioinformatics
3.3.8.1 GeneCards Database
For initial annotation of genes, which were identified by exome sequencing, the GeneCards
database was accessed519. It was developed and maintained by the Crown Human Genome
Center at the Weizmann Institute of Science, Israel, and has been used by scientists since
1998520,521. It can be utilized for collecting data on biomedical information about the gene
itself, the encoded protein and also associated diseases522. In this database, information
84
from over 90 data resources is unified, including NCBI, Ensembl (Ensembl genome database
project)523,524 and the HUGO Gene Nomenclature Committee521,520. GeneCards is a
searchable, integrative database that provides information on all annotated and predicted
human genes. It automatically integrates gene-centric data from ~125 web sources,
including genomic, transcriptomic, proteomic, genetic, clinical and functional information.
3.3.8.2 Ingenuity Pathway Analysis
Ingenuity Pathway Analysis (IPA) was used to annotate the exome sequencing data and
identify pathways or functions which could be overrepresented in RS patients. The following
settings were applied: data in the form of genelists, retrieved from exome sequencing hits of
truncating mutations, was uploaded using import filters: flexible format, gene symbol
identifier type and no specified array platform. Core analyses in the form of “variants effects
analyses” were performed using the Ingenuity Knowledge Base (genes + endogenous
chemicals) reference set. Only direct relationships were chosen to be considered,
endogenous chemicals were included in interaction networks calculations and causal
networks were scored using causal paths only. All node types and data sources were
considered, confidence parameters were set to only experimentally observed data and
species was restricted to human using stringent filter for molecules and relationships. All
available tissue and cell line data was used with also stringent filtering and all mutation types
were included. Comparison analyses were performed using either original datasets and Venn
diagrams to display overlapping genes or using separately conducted core analyses
generated by the procedure above. For statistical anlyses in IPA, Fisher’s Exact Test was applied, see subsection 3.3.1.
3.3.8.3 Reactome Pathway Browser
Reactome is an open-source, curated and peer reviewed pathway database and utilizes data
based on publications with PubMed links525,491,492. It provides bioinformatics tools for the
visualization, interpretation and analysis of pathway knowledge to support basic research,
genome analysis, modeling and systems biology.
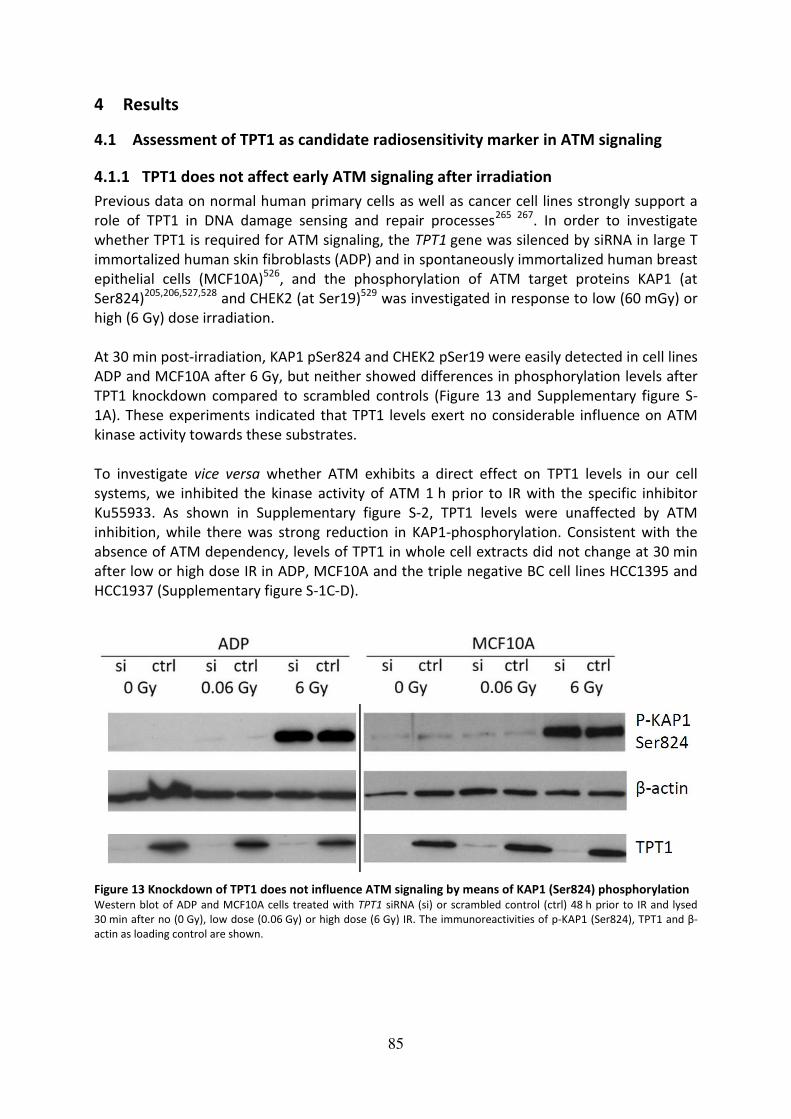
85
4 Results
4.1 Assessment of TPT1 as candidate radiosensitivity marker in ATM signaling
4.1.1 TPT1 does not affect early ATM signaling after irradiation
Previous data on normal human primary cells as well as cancer cell lines strongly support a
role of TPT1 in DNA damage sensing and repair processes265 267. In order to investigate
whether TPT1 is required for ATM signaling, the TPT1 gene was silenced by siRNA in large T
immortalized human skin fibroblasts (ADP) and in spontaneously immortalized human breast
epithelial cells (MCF10A)526, and the phosphorylation of ATM target proteins KAP1 (at
Ser824)205,206,527,528 and CHEK2 (at Ser19)529 was investigated in response to low (60 mGy) or
high (6 Gy) dose irradiation.
At 30 min post-irradiation, KAP1 pSer824 and CHEK2 pSer19 were easily detected in cell lines
ADP and MCF10A after 6 Gy, but neither showed differences in phosphorylation levels after
TPT1 knockdown compared to scrambled controls (Figure 13 and Supplementary figure S-
1A). These experiments indicated that TPT1 levels exert no considerable influence on ATM
kinase activity towards these substrates.
To investigate vice versa whether ATM exhibits a direct effect on TPT1 levels in our cell
systems, we inhibited the kinase activity of ATM 1 h prior to IR with the specific inhibitor
Ku55933. As shown in Supplementary figure S-2, TPT1 levels were unaffected by ATM
inhibition, while there was strong reduction in KAP1-phosphorylation. Consistent with the
absence of ATM dependency, levels of TPT1 in whole cell extracts did not change at 30 min
after low or high dose IR in ADP, MCF10A and the triple negative BC cell lines HCC1395 and
HCC1937 (Supplementary figure S-1C-D).
Figure 13 Knockdown of TPT1 does not influence ATM signaling by means of KAP1 (Ser824) phosphorylation Western blot of ADP and MCF10A cells treated with TPT1 siRNA (si) or scrambled control (ctrl) 48 h prior to IR and lysed
30 min after no (0 Gy), low dose (0.06 Gy) or high dose (6 Gy) IR. The immunoreactivities of p-KAP1 (Ser824), TPT1 and β-
actin as loading control are shown.

86
4.1.2 Intracellular distribution of TPT1 does not change after irradiation
As TPT1 is both a cytosolic and a nuclear protein, it was next examined whether the
intracellular localization pattern of TPT1 after IR may change according to a functional
recruitment of TPT1 in DNA damage sensing and repair processes in our cellular systems.
The intracellular distribution of the protein was analyzed by immunofluorescence analyses
(Figure 14, Supplementary figure S-3 and Supplementary figure S-4A) as well as by cellular
fractionation (Supplementary figure S-2B). The specificity of the immunofluorescence
staining was validated with two different TPT1 antibodies (Figure 14A and B; Supplementary
figure S-3 and Supplementary figure S-4A) at 1 h after IR. No gross changes in TPT1
localization at 1 h after low (0.06 or 0.25 Gy), medium (1 Gy) or high doses (6 Gy) of IR were
detected, respectively, when assessed in asynchronous subconfluent fibroblasts by
conventional fluorescence microscopy. Foci-like structures of TPT1 were visible by confocal
laser microscopy, which appeared in both cytoplasm and nucleus in irradiated and control
cells. There was no evidence for a translocation of TPT1 to the nucleus after 1 Gy IR in ADP
as well as MCF10A cells analyzed by confocal analyses (Supplementary figure S-3 and
Supplementary figure S-4C). In some cells, TPT1 moreover appeared to accumulate in the
nuclear periphery after IR (Supplementary figure S-4). Immunostainings in different triple
negative BC cell lines also provided no evidence for nuclear translocation of TPT1 at 1 h after
IR with 0.25 Gy and 1 Gy (Supplementary figure S-4A) or 0.06 Gy and 6 Gy (data not shown),
respectively. Consistent with this data, no robust evidence for chromatin binding of TPT1 in
ADP or MCF10A cells without or 30 min after IR with 60 mGy or 6 Gy was found
(Supplementary figure S-2B and data not shown). KAP1 was phosphorylated and present in
cytosolic, nuclear and chromatin-bound fractions. In contrast, TPT1 was only present in
cytosolic and nuclear fractions and not chromatin-bound, independent of treatment, and its
localization did not detectably change after IR. Furthermore, no increment in nuclear
translocation of TPT1 after IR in lymphoblastoid cells of healthy and radiosensitive
individuals was observed477. These findings supported the immunofluorescence data of ADP
and MCF10A (Figure 14; Supplementary figure S-3) HCC1937 (Supplementary figure S-4), as
well as HCC1395 and HCC38 (data not shown).

87
Figure 14 No evidence for colocalization of TPT1 and γH2AX in ADP and MCF10A cells Asynchronous, subconfluent cells were preextracted with Triton X-100
265 and fixed 1 h after IR. Panel A shows
immunofluorescence stainings for TPT1 (red) (ab37506) and γH2AX (green) in ADP cells and areas of colocalization are
visible in yellow in the overlay picture. Scale bar = 25 µm. As comparison, TPT1 stainings in ADP cells were performed with a
second antibody (ab133568) visualized in green, which are shown in panel C after 1 Gy IR. γH2AX foci and areas of
colocalization were counted manually and are shown as means with standard deviations for ADP in panel B and MCF10A
cells in panel D.
4.1.3 Limited colocalization of TPT1 with γH2AX foci after irradiation
Given the lack of evidence for an involvement of TPT1 in ATM signaling and its uniform
intracellular distribution after IR, the question was adressed whether the nuclear fraction of
TPT1 shows colocalization with the γH2AX repair foci after IR in our cellular systems. In order
to reduce cytoplasmic background staining, cells were subjected to a previously described
preextraction procedure with Triton X-100 prior to fixation265. The cells were analyzed at 1 h
after 1 Gy IR, with stainings for TPT1 and γH2AX also being performed in TPT1 knockdown
cells and non-preextracted cells (Supplementary figure S-3) as well as in irradiated triple
negative BC cell lines (represented in Supplementary figure S-4 for HCC1937, data for
HCC1395 and HCC38 not shown). In order to validate the staining, two different TPT1
antibodies were used, one of which has already been published in this context265. Although
both antibodies showed a spotty pattern of TPT1 in the cytoplasm as well as in the nucleus,
colocalization of TPT1 and γH2AX was poorly detectable in either cell type under any
condition. These results were confirmed by a second analyzer, namely Dr. Natalia
Bogdanova. Knockdown of TPT1 in ADP and MCF10A cells was approved by confocal
immunofluorescence analyses (Supplementary figure S-3A-B), in agreement with the
western blot results shown in Figure 13, and served as a negative control for antibody
specificity. Very few areas of colocalization were detected according to the overlay of TPT1
and γH2AX staining and were counted in accordance with γH2AX foci. The proportion of
colocalized foci is displayed as means with standard deviations in Figure 14C for ADP and
Figure 14D for MCF10A cells. It was below 10 % in ADP and below 5 % in MCF10A cells.
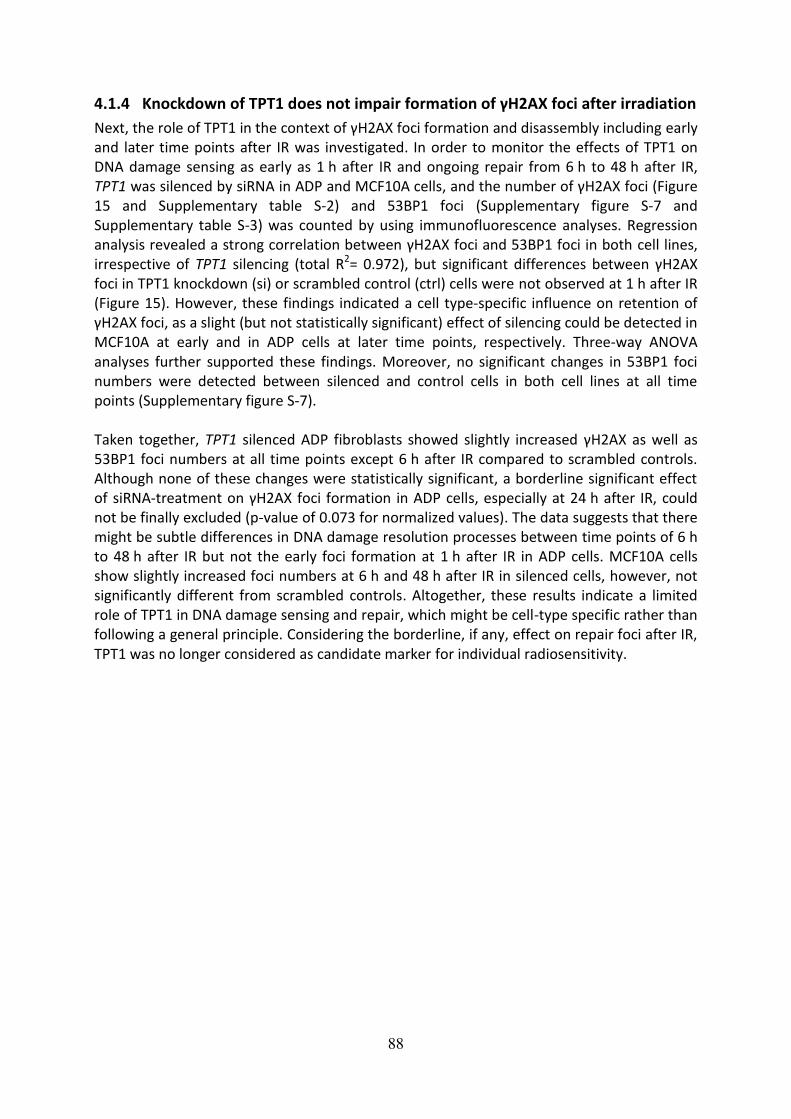
88
4.1.4 Knockdown of TPT1 does not impair formation of γH2AX foci after irradiation
Next, the role of TPT1 in the context of γH2AX foci formation and disassembly including early
and later time points after IR was investigated. In order to monitor the effects of TPT1 on
DNA damage sensing as early as 1 h after IR and ongoing repair from 6 h to 48 h after IR,
TPT1 was silenced by siRNA in ADP and MCF10A cells, and the number of γH2AX foci (Figure
15 and Supplementary table S-2) and 53BP1 foci (Supplementary figure S-7 and
Supplementary table S-3) was counted by using immunofluorescence analyses. Regression
analysis revealed a strong correlation between γH2AX foci and 53BP1 foci in both cell lines,
irrespective of TPT1 silencing (total R2= 0.972), but significant differences between γH2AX
foci in TPT1 knockdown (si) or scrambled control (ctrl) cells were not observed at 1 h after IR
(Figure 15). However, these findings indicated a cell type-specific influence on retention of
γH2AX foci, as a slight (but not statistically significant) effect of silencing could be detected in
MCF10A at early and in ADP cells at later time points, respectively. Three-way ANOVA
analyses further supported these findings. Moreover, no significant changes in 53BP1 foci
numbers were detected between silenced and control cells in both cell lines at all time
points (Supplementary figure S-7).
Taken together, TPT1 silenced ADP fibroblasts showed slightly increased γH2AX as well as
53BP1 foci numbers at all time points except 6 h after IR compared to scrambled controls.
Although none of these changes were statistically significant, a borderline significant effect
of siRNA-treatment on γH2AX foci formation in ADP cells, especially at 24 h after IR, could
not be finally excluded (p-value of 0.073 for normalized values). The data suggests that there
might be subtle differences in DNA damage resolution processes between time points of 6 h
to 48 h after IR but not the early foci formation at 1 h after IR in ADP cells. MCF10A cells
show slightly increased foci numbers at 6 h and 48 h after IR in silenced cells, however, not
significantly different from scrambled controls. Altogether, these results indicate a limited
role of TPT1 in DNA damage sensing and repair, which might be cell-type specific rather than
following a general principle. Considering the borderline, if any, effect on repair foci after IR,
TPT1 was no longer considered as candidate marker for individual radiosensitivity.
89
Figure 15 γH2AX foci numbers in TPT1 knockdown cells after irradiation Asynchronous, subconfluent ADP and MCF10A cells were treated with siRNA against TPT1 (si, light blue columns) or
scrambled controls (ctrl, dark blue columns) 48 h before IR with 1 Gy. Cells were fixed on glass slides at 1 h, 6 h, 24 h or 48 h
after IR and stained for TPT1, γH2AX and DAPI. γH2AX foci were counted manually in an average of 100 cells on each slide
and cells with a minimum of 3 foci were considered foci-positive and subjected to counting. Foci numbers were normalized
to unirradiated controls [%] (right-hand side, panels A and D) and means with standard deviations from two independent
experiments are shown. Original data are shown in scatter plots on the left-hand side in panels A and C. Raw data are given
in Supplementary table S-2. Means with standard deviation are shown and unpaired two-tailed t-tests using GraphPad
Prism Software were performed. Significance levels are given by p ≤ 0.01 (**), or P > 0.05 (ns = not significant).

90
4.2 Assessment of the functional relationship between clinical and cellular
radiosensitivity
In the second and third part of this project (see Figure 11 for overview), the experimental
procedures focused on patient material that had been collected throughout the past 20
years at different institutions. Figure 16 shows the workflow which was followed starting
from analyzing the genetic background of the RS patients, over generation of cell culture
models to establishment of a functional association between clinical and cellular
radiosensitivity.
Figure 16 Workflow for characterization of individual radiosensitivity using patient material
4.2.1 The genetic signature of radiosensitivity
4.2.2 Annotation of exome sequencing data by GeneCards
The exome sequencing of lymphocyte (from LCLs) and fibroblast (from primary cultures)
genomic DNA from 19 RS patients (11 BC, 3 Chemo RS, 5 with other cancers) and 2 BC
patients without radiation side-effects (see Supplementary figure S-1), was performed at the
Genome Analytics Unit of the Helmholtz Center for Infection Research, Braunschweig (Dr.
Robert Geffers). Filtering for mutation effect (stop gain, frameshift or intronic), for low
frequency in SNP databases (MAF<0.005) and for non-redundancy across the exomes (N<3)
was performed at our lab (Dr. Thilo Dörk-Bousset). The final list contained 527 truncating
mutations in RS patients and 60 truncating mutations in the two controls. For one patient,
MC3, genomic DNA from fibroblasts as well as from LCLs was extracted and subjected to
separate exome sequencings to examine whether somatic mutations would be a
confounder. However, no differences in mutations were observed between the two tissues.
For annotation, findings were cleared from genes involving the highly polymorphic human
olfactory (OR) and human leukocyte antigen (HLA) clusters, and the ZNF717 gene. Genes
with truncating mutations were preferred in further investigations, as their functional effect
on the respective protein can be considered likely deleterious.
For annotation and classification of genes revealed by exome sequencing, the GeneCards
database was accessed. Categories were chosen based on Kyoto Encyclopedia of Genes and
Genomes (KEGG)530 and Biocarta531-grouping: cancer, DNA repair, immune system, signal
transduction, cell-cell interaction, transport, gene expression, chromatin regulation, cell
cycle, cell death, metabolism, skin diseases and other/unknown, see Figure 17. The category
“skin diseases“ was chosen based on the observation, that a common manifestation of
irradiation side-effects includes skin burns and necrosis of epithelial tissue378,532-534.

91
Furthermore, the categories Cancer”, “DNA repair” and Immune System” were considered of
strongest interest for this project and chosen for further investigations. They are highly
represented in RS patients and do not vary significantly between the RS patient groups with
different cancers, according to the classification described above (Figure 17). The GeneCards
annotation shows a strong inter-individual variability in all categories, and no obvious
overrepresentation, which might be clearly associated with radiosensitivity, was found. Next,
the Ingenuity Pathway Analysis (IPA) program was used to assess superior pathways or
functions which might be associated with the radiosensitive phenotype. Furthermore IPA is
capable of emitting p-values of overlap (Fisher’s exact test) indicating the degree of
association between gene functions and disorders or canonical pathways (see subsection
3.3.1). Fisher’s Exact Test compares the set of molecules in the uploaded dataset to a reference set that includes all known molecules, and in this work the Ingenuity Knowledge
Base was chosen as reference dataset (Figure 8).
Figure 17 GeneCards annotation of genes with truncating mutations in RS patients Exome sequencing results of RS patients were filtered for genes with truncating mutations, which were annotated by
GeneCards database and categorized according to KEGG and Biocarta pathway suggestions. Grouping of patients was done
based on cancer type: BC (breast cancer) in panel A, other radiosensitive (RS) cancer patients (CP) in panel B (see
Supplementary table S-1) and chemoradiosensitive patients (chemo RS) in panel C. Median values of cancer, DNA repair
and immune system categories are shown. Unpaired t-tests were performed and showed no significant differences
(ns: p>0.05, panel D). Colors in the BC group represent patients MC1= green, MC3= blue and MC7= yellow, which were
functionally analyzed later.

92
4.2.3 Ingenuity Pathway Analysis
4.2.3.1 Ingenuity Pathway Analysis of radiosensitive cancer patients
The IPA core analyses with the three RS patient groups revealed significant associations in
the “Diseases and Disorders” section with p-values as low as 1E-09, see Figure 18 (for
complete analysis results see Supplementary figure S-8 - Supplementary figure S-11).
Figure 18 Comparative IPA analyses between RS cancer patients Results of the “Diseases and Disorders” section of IPA core analyses performed with 11 RS BC patients, 5 RS patients with
other cancers and 3 Chemo RS patients. P-values of overlap calculated by Fisher’s exact test, are given as red dots in the p-
value range section and median values are indicated by vertical blue bars. The numbers of molecules in the dataset
belonging to each pathway are indicated on the right-hand side. Cancer” and “Organismal Injury and Abnormalities” are
highlighted with red and faint red arrows, respectively, as discussed further in the text.
A high representation of “Cancer” in the RS and chemo RS patients and “Dermatological
Diseases and Conditions” in the RS group of patients with other cancers was found. The
superior category “Organismal Injury and Abnormalities” encloses functions associated with

93
injuries and abnormalities of multicellular organisms, including functions related to
abnormal tissue physiology such as lesions, ulcers, scars and wounds535. In this analysis, most
genes found in this category were also found in the Cancer” category (Supplementary figure
S-15). The category “Reproductive system disease” includes diseases and abnormalities of
the reproductive system, for example degeneration of oocytes, endometriosis and infertility
of organisms535. “Neurological disease” includes neurological system diseases such as
atrophy of axons, convulsion, dyskinesia and swelling of brain535. Most prominent hits in
categories “Neurological Disease”, “Reproductive system disease” and “Dermatological
diseases and conditions” in this analysis also relate to cancer-associated functions, as shown
in Supplementary figure S-16. The category “Hereditary Disorder” found in RS patients with
other cancers basically relates to hereditary prostate cancer (association of EHBP1, MSR1)
and hair and dental disorders. Several hits were also obtained in the category related to DNA
repair, as DNA Replication, Recombination and Repair, was one of the top networks in RS
patients, see Supplementary figure S-12). Upstream analysis revealed the transcription
regulator SMARCA4 (SWI/SNF Related, Matrix Associated, Actin Dependent Regulator Of
Chromatin, Subfamily A, Member 4) as common regulator of genes regarding RS patients,
which was identified by using the pathdesigner tool (Figure 19). SMARCA4 has been
implicated in a variety of cancers536-540, including breast cancer and binds BRCA1541,542.
Figure 19 IPA upstream analysis results of RS patients Ingenuity Pathway Analyses (IPA) upstream analysis conducted with results of exome sequencing regarding genes with
truncating mutations identified in the RS patient collection by pathdesigner tool applied to upstream network results.
SMARCA4 (SWI/SNF Related, Matrix Associated, Actin Dependent Regulator Of Chromatin, Subfamily A, Member 4) was
identified as upstream regulator, which directly regulates MICB543
(MHC Class I Polypeptide-Related Sequence B), KCNQ3543
(Potassium Voltage-Gated Channel Subfamily Q Member 3), TNFRSF9543
(TNF Receptor Superfamily Member 9) and
SPHK1543
(Sphingosine Kinase 1). IPA identified relationships between SMARCA4 and AR544
(Androgen Receptor), between
AR and RELA545
(Proto-Oncogene, NF-KB Subunit) and between AR and ESR1546
(Estrogen Receptor 1). MICA547
(MHC Class I

94
Polypeptide-Related Sequence A) and STIM1543,544
(Stromal Interaction Molecule 1) are targeted by RELA; NUSAP1
(Nucleolar And Spindle Associated Protein 1) is targeted by AR548
, and TNFRSF10A549
(TNF Receptor Superfamily Member
10a), MUC20549
(Mucin 20, Cell Surface Associated) and ZNF141549
(Zinc Finger Protein 141) are targeted by ESR1. Patient
IDs are given below genes (see Supplementary table S-1 for clinical data) and corresponding rs-numbers indicate already
known variants. All unknown gene mutations were validated except indicated by *=validation was not possible. Samples, in
which the mutations were identified, are indicated. Results of the overlay-tool for diseases and functions with p-values of
overlap and numbers of involved molecules (# Mol.) are given below.
Based on the findings, that cancer/DNA repair genes are strongly represented in the RS patients, the
hypothesis was elaborated that the accumulation of mutations in cancer-related and/or DNA repair
genes may contribute to the secretory phenotype, which activates immunological responses of RS
patients after irradiation therapy. In order to investigate whether these findings are specific for
radiosensitive cancer patients, a comparison with exome data from non-radiosensitive cancer
patients and non-radiosensitive familial breast cancer patients was performed. The latter category
was included to examine whether the presumably strong genetic background in heritable breast
cancer can be identified by IPA.
4.2.3.2 Comparative Ingenuity Pathway Analysis
In order to investigate whether mutations in genes related to cancer and DNA repair
pathways are significantly enriched in radiosensitive breast cancer patients, which comprises
the biggest group of RS patients with 11 individuals, genes with truncating mutations from
11 breast cancer patients without radiation sensitivity were used as comparison. Two BC
patients without RS, MC4 and MC6, are matched pairs of RS BC patients MC1 and MC3,
respectively. The other patients were analyzed in ongoing studies in our lab (data provided
by Dr. Thilo Dörk-Bousset). 11 exomes from an additional group of patients with familial
(Fam) breast cancer were also used as comparison (data provided by Dr. Thilo Dörk-Bousset).
The question was addressed whether IPA can identify a genetic predisposition for breast
cancer in this group and how this would relate to the radiation sensitivity disposition. Figure
20 shows overlapping genes of the three datasets, which were found by IPA.

95
Figure 20 Overlapping genes of datasets for comparison between cancer patients Venn diagram showing number of genes identified in each patient set (11 RS BC patients in A, 11 BC patients in B and 11
Fam BC patients in C) by Ingenuity Pathway Analysis. Numbers of overlapping genes are given in intersection areas and
associated gene symbols are shown in adjacent squares. The area shaded in blue represents genes identified in all three
datasets/patient groups.
It was hypothesized that genes, which are not restricted to RS patients, may not be involved
in the RS IR response. Therefore, all the comparisons were done in parallel with sets of
unique genes from every patient group. Figure 21 shows the results of the core analyses of
gene lists from 11 RS BC, 11 BC and 11 Fam BC patients.

96
Figure 21 Comparative IPA analyses between cancer patients Results of the “Diseases and Disorders” section of Ingenuity Pathway Analysis (IPA) core analyses performed with 11
radiosensitive (RS) breast cancer (BC) patients, 11 BC patients without RS and 11 Familial (Fam) BC patients without RS. P-
values of overlap calculated by Fisher’s exact test, are given as red dots in the p-value range section and median values are
indicated by vertical blue bars. The numbers of molecules in the dataset belonging to each pathway are indicated on the
right-hand side. “Cancer” and “Organismal Injury and Abnormalities” are highlighted with red and faint red arrows in all
three groups, respectively. “Reproductive System Disease”, “Neurological Disease” and “Hereditary Disorder” are specific to RS BC and Fam BC patients and highlighted with blue, green and orange arrows, respectively. See Supplementary figure S-
20 and Supplementary figure S-21 for corresponding heatmaps.
Cancer is overrepresented in all three datasets. By comparison, the strength of the
association between the genes with truncating mutations and cancer is highest in RS BC
patients according to p-values and number of molecules, followed by Fam BC patients and
BC patients. The category “Dermatological Diseases and Conditions” is represented in all
three datasets and also shows the strongest association in RS BC patients, whereas
“Neurological Disease” and “Reproductive System Disease” is restricted to RS BC patients only and both classifications include mainly cancer categories (heatmaps of Supplementary
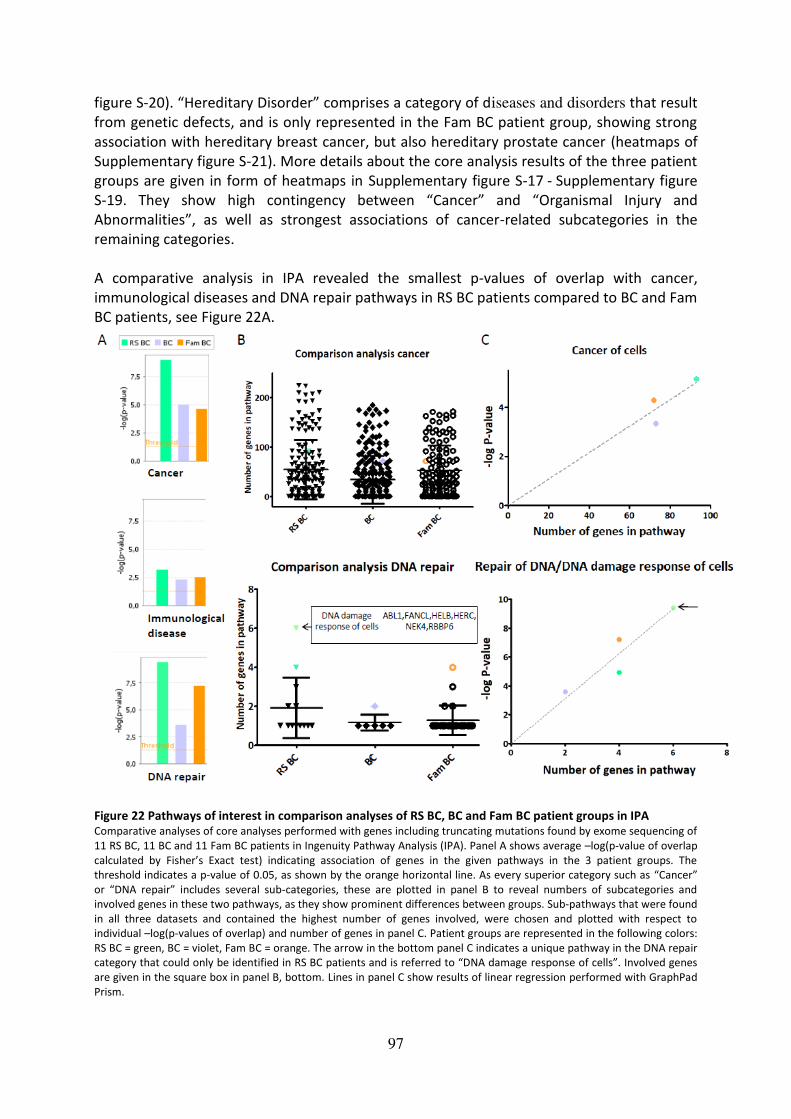
97
figure S-20). “Hereditary Disorder” comprises a category of diseases and disorders that result
from genetic defects, and is only represented in the Fam BC patient group, showing strong
association with hereditary breast cancer, but also hereditary prostate cancer (heatmaps of
Supplementary figure S-21). More details about the core analysis results of the three patient
groups are given in form of heatmaps in Supplementary figure S-17 - Supplementary figure
S-19. They show high contingency between “Cancer” and “Organismal Injury and
Abnormalities”, as well as strongest associations of cancer-related subcategories in the
remaining categories.
A comparative analysis in IPA revealed the smallest p-values of overlap with cancer,
immunological diseases and DNA repair pathways in RS BC patients compared to BC and Fam
BC patients, see Figure 22A.
Figure 22 Pathways of interest in comparison analyses of RS BC, BC and Fam BC patient groups in IPA Comparative analyses of core analyses performed with genes including truncating mutations found by exome sequencing of
11 RS BC, 11 BC and 11 Fam BC patients in Ingenuity Pathway Analysis (IPA). Panel A shows average –log(p-value of overlap
calculated by Fisher’s Exact test) indicating association of genes in the given pathways in the 3 patient groups. The threshold indicates a p-value of 0.05, as shown by the orange horizontal line. As every superior category such as “Cancer”
or “DNA repair” includes several sub-categories, these are plotted in panel B to reveal numbers of subcategories and
involved genes in these two pathways, as they show prominent differences between groups. Sub-pathways that were found
in all three datasets and contained the highest number of genes involved, were chosen and plotted with respect to
individual –log(p-values of overlap) and number of genes in panel C. Patient groups are represented in the following colors:
RS BC = green, BC = violet, Fam BC = orange. The arrow in the bottom panel C indicates a unique pathway in the DNA repair
category that could only be identified in RS BC patients and is referred to “DNA damage response of cells”. Involved genes are given in the square box in panel B, bottom. Lines in panel C show results of linear regression performed with GraphPad
Prism.
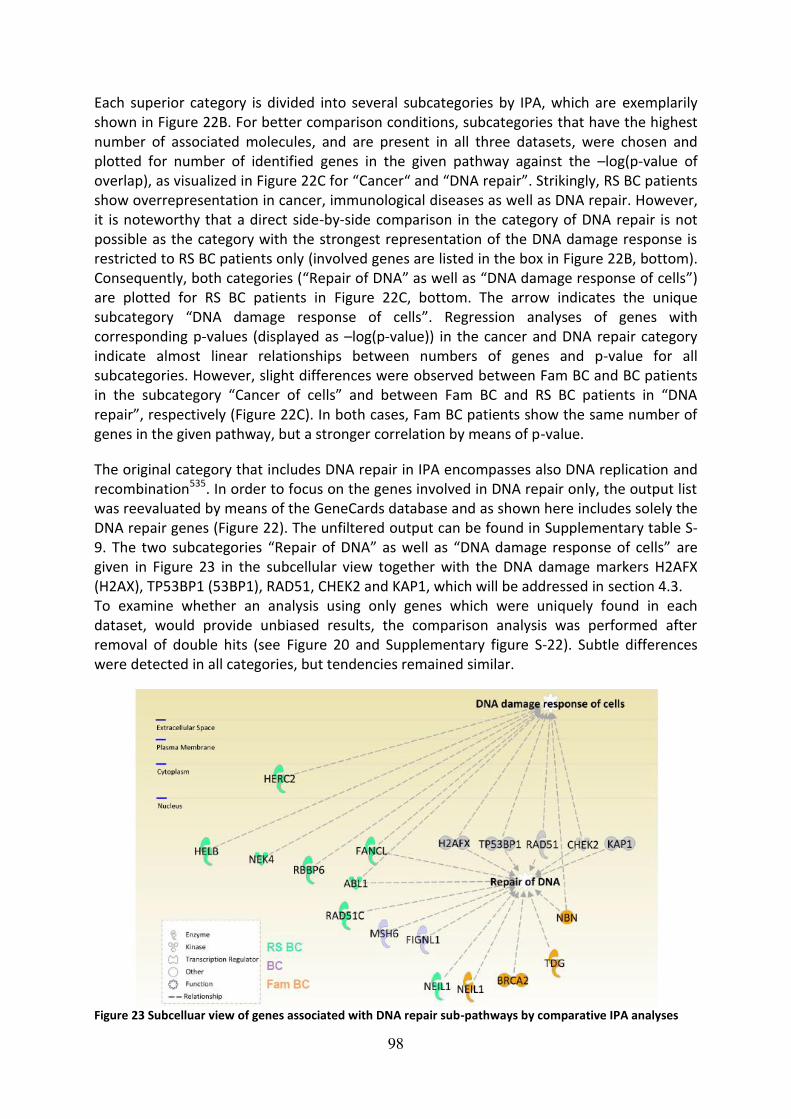
98
Each superior category is divided into several subcategories by IPA, which are exemplarily
shown in Figure 22B. For better comparison conditions, subcategories that have the highest
number of associated molecules, and are present in all three datasets, were chosen and
plotted for number of identified genes in the given pathway against the –log(p-value of
overlap), as visualized in Figure 22C for “Cancer“ and “DNA repair”. Strikingly, RS BC patients
show overrepresentation in cancer, immunological diseases as well as DNA repair. However,
it is noteworthy that a direct side-by-side comparison in the category of DNA repair is not
possible as the category with the strongest representation of the DNA damage response is
restricted to RS BC patients only (involved genes are listed in the box in Figure 22B, bottom).
Consequently, both categories (“Repair of DNA” as well as “DNA damage response of cells”)
are plotted for RS BC patients in Figure 22C, bottom. The arrow indicates the unique
subcategory “DNA damage response of cells”. Regression analyses of genes with
corresponding p-values (displayed as –log(p-value)) in the cancer and DNA repair category
indicate almost linear relationships between numbers of genes and p-value for all
subcategories. However, slight differences were observed between Fam BC and BC patients
in the subcategory “Cancer of cells” and between Fam BC and RS BC patients in “DNA repair”, respectively (Figure 22C). In both cases, Fam BC patients show the same number of
genes in the given pathway, but a stronger correlation by means of p-value.
The original category that includes DNA repair in IPA encompasses also DNA replication and
recombination535. In order to focus on the genes involved in DNA repair only, the output list
was reevaluated by means of the GeneCards database and as shown here includes solely the
DNA repair genes (Figure 22). The unfiltered output can be found in Supplementary table S-
9. The two subcategories “Repair of DNA” as well as “DNA damage response of cells” are
given in Figure 23 in the subcellular view together with the DNA damage markers H2AFX
(H2AX), TP53BP1 (53BP1), RAD51, CHEK2 and KAP1, which will be addressed in section 4.3.
To examine whether an analysis using only genes which were uniquely found in each
dataset, would provide unbiased results, the comparison analysis was performed after
removal of double hits (see Figure 20 and Supplementary figure S-22). Subtle differences
were detected in all categories, but tendencies remained similar.
Figure 23 Subcelluar view of genes associated with DNA repair sub-pathways by comparative IPA analyses

99
Subcellular view of genes associated with the subcategories “DNA damage response of cells” and “Repair of DNA” of the superior category “DNA replication, recombination and repair” given by Ingenuity Pathway Analysis (IPA), see Supplementary table S-10. Findings were further restricted to solely “DNA repair” by GeneCards database analysis, see
Supplementary table S-9 for unfiltered results. Genes were identified and grouped into pathways through comparative
analyses of core analyses performed with genes including truncating mutations found by exome sequencing of 11 RS BC, 11
BC and 11 Fam BC patients in IPA. DNA repair markers H2AFX (H2AX), TP53BP1 (53BP1), RAD51, CHEK2 and KAP1 are
additionally shown in grey as they will be subject to following functional assays. Genes from the RS BC dataset are shown in
green, genes from the BC dataset in violet and genes from the Fam BC dataset in orange. NEIL1 was identified in RS BC as
well as Fam BC patients.
Moreover, superior canonical pathways identified by comparative analyses, as well as
pathways related to the cancer subcategory in the “Diseases and biofunctions” section are
shown in heatmaps in Figure 24A and B, respectively. Interestingly, both RS BC and BC
patients showed associations with dopamine degradation and inflammatory signaling,
whereas DNA DSB repair is strongly related to RS BC and particularly to Fam BC patients
(Supplementary table S-11). Results of filtering the gene lists for DNA repair genes (as
described above) are shown for superior canonical pathways and “Diseases and
biofunctions” in Figure 24C and D, respectively. Apart from a prominent attribution of the RS
BC group to ATM signaling (p-values of 0.0007 for RS BC, 1 for BC, and 0.016 for Fam BC),
DNA repair pathways were identified in all three groups, for example mismatch repair was
mostly attributed to BC patients and homologous recombinational repair mostly to Fam BC
(Supplementary table S-12). Moreover, the association between Fam BC and hereditary
breast cancer signaling comprises one of the strongest findings using this approach.
Furthermore, a relation between cell-cycle genes and the Fam BC as well as the RS BC group
was detected. Diseases and biofunctions findings in Figure 24D supplement the data shown
in Figure 22 and Figure 23, as “DNA damage response of cells” is solely found in RS BC
patients and shows the strongest contribution within the whole category (p-values of 3.81E-
10 in RS BC, 1 in BC, and 0.044 in Fam BC, respectively). “Repair of DNA” is significantly associated with all patients, however strongest in Fam BC (p-values for RS BC= 0.0003, BC=
0.0002, Fam BC= 5.97E-08, respectively).
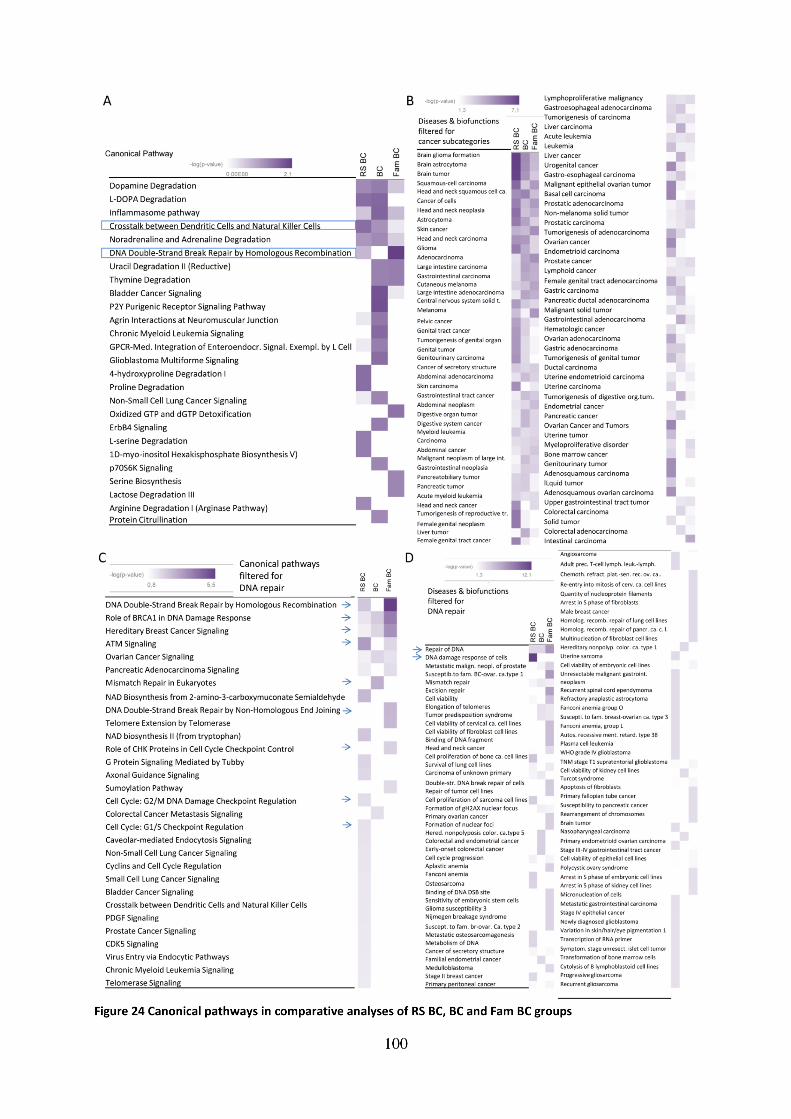

101
Heatmaps of canonical pathways identified by Ingenuity Pathway Analysis comparison tool. Panel A shows results of
superior canonical pathways in 11 radiosensitive (RS) breast cancer (BC) patients, 11 BC and 11 familial (Fam) BC patients.
Pathways of interest are enclosed by squares and marked by arrows. Panel B shows the results of the comparison analysis
in the “Diseases and biofunctions” section, filtered for “Cancer” subcategory. Panels C and D show the results of
comparison analysis with the modified datasets filtered for results obtained in the “DNA Replication, Recombination and Repair” category and further restricted to “DNA repair” as revised by GeneCards analysis, see also Figure 22. The genes
found in the “DNA Replication, Recombination and Repair” category in the three datasets are listed in Supplementary table
S-9. P-values of overlap for canonical pathway heatmaps in panel A and panel C are given in Supplementary table S-11 and
Supplementary table S-12, respectively).
Canonical pathway analyses with unique datasets were performed to assess whether
removal of the NEIL1 gene, which was found in both RS BC and Fam BC patients (Figure 20),
would alter these findings (Supplementary figure S-23C-D). No obvious differences were
observed in the DNA repair category as well as in the remaining categories (Supplementary
figure S-23A-B), which confirmed the findings shown in Figure 23 - Figure 24 and
Supplementary figure S-22, that the overlapping genes do not contribute strongly to the
outcome of the analyses.
As the previous results show the comparison of three datasets, all patients in one group are
analyzed as one dataset and inter-individual differences between patients cannot be
addressed. As some patients might contribute very strongly to the overrepresentation of
pathways, while others might have no effect, as shown for the GeneCards annotation (Figure
17), a comparison analysis with all 11 patients from one dataset was performed. Figure 25
shows the results of the comparative analyses with each patient through which a high
variability in association with the categories “Cancer”, “Immunological diseases” and “DNA repair” can be detected. Differences in the DNA repair category between RS BC and BC patients, as well as between Fam BC and BC patients are identified.
In order to supplement the IPA results, the exome sequencing results of the 11 BC and Fam
BC patients were subjected to GeneCards annotation using the categories described in
subsection 4.2.2. Furthermore, similar analyses were conducted with Reactome Pathway
Analysis491,492 and the three annotation methods were compared side-by-side, as shown in
Figure 26 and Figure 27.

102
Figure 25 Comparative IPA analyses with single patients in RS BC, BC and Fam BC groups Single-patient comparative analyses of core analyses performed with genes including truncating mutations found by exome
sequencing of 11 radiosensitive breast cancer (top), 11 breast cancer (middle) and 11 familial breast cancer (bottom)
patients in Ingenuity Pathway Analysis (IPA). Each core analysis was conducted separately for each patient (represented by
individual colors) and 11 patients in each group were compared to each other. Columns represent average –log(p-value of
overlap calculated by Fisher’s Exact test) indicating association of genes in the given pathways cancer, immunological
diseases and DNA repair. The threshold was set at p-value of 0.05, as indicated by the orange horizontal line. The superior
IPA category “DNA replication, recombination and repair” was further restricted to solely “DNA repair” by GeneCards
database analysis, as described before. Patients are either named by internal labeling (Supplementary table S-1) or
according to their cancer history, if known, and in case no other internal labeling was performed. FH= family history,
ColonCa= colon cancer, CxCa= cervix cancer, ThCa= throat cancer, TNBC= triple negative breast cancer.
4.2.4 Reactome Pathway Analysis and comparison of annotation tools
As third method of annotation, the Reactome browser was accessed, which is a well
established pathway analysis database491,492. Only about half of the DNA repair genes, which
were found by GeneCards and IPA, could also be found by Reactome, see Figure 26.
Therefore, a direct comparison of the results is not possible. Underlined genes as shown in
Figure 26 (left-hand side) were picked up by all three methods. For results regarding the
remaining two prioritized categories “Cancer” and “Immune System” see Supplementary
table S-14–Supplementary table S-15.

103
Figure 26 Comparison of annotation methods: DNA repair pathway
DNA repair genes, which were identified by exome sequencing of 11 radiosensitive (RS) breast cancer (BC), 11
BC and 11 familial (Fam) BC patients, were annotated by GeneCards, Reactome and Ingenuity Pathway Analysis
(IPA), and are given in the table (left-hand side). Genes, which were identified by all three annotation methods,
are underlined. The Venn diagram on the right-hand side shows overlapping findings by the three methods of
the RS BC group and numbers of overlapping genes are indicated.
As shown in Figure 27, nominally significant differences were only detected between the RS BC and
the BC patients in the category “DNA repair” by two of the three annotation methods: GeneCards
annotation at p-value: 0.002 and IPA annotation at p-value: 0.019. The percentage of truncating
mutations in DNA repair genes is highest in RS BC patients, closely followed by Fam BC patients and
lowest in BC patients, see Figure 27. Apart from known cancer and DNA repair genes, mutations in
the TNF-receptor superfamily genes TNFRSF9 and TNFRSF10A were identified in two patients, the
latter of which was recently related to lymphocyte radiosensitivity and prediction of dermatitis as
radiation consequence550. As these genes were, however, not directly related to DNA repair by any of
the annotation tools (but were part of the ”Cancer” and “Immune System” categories, see
Supplementary table S-15 for TNFRSF10A identified in RS BC), they were not included in the “DNA repair” category. Furthermore, they are both subject to regulation by SMARCA4 according to IPA, as shown in Figure 19.
All the results shown in this subsection were obtained by using validated exome sequencing
data, see subsection 4.2.5.
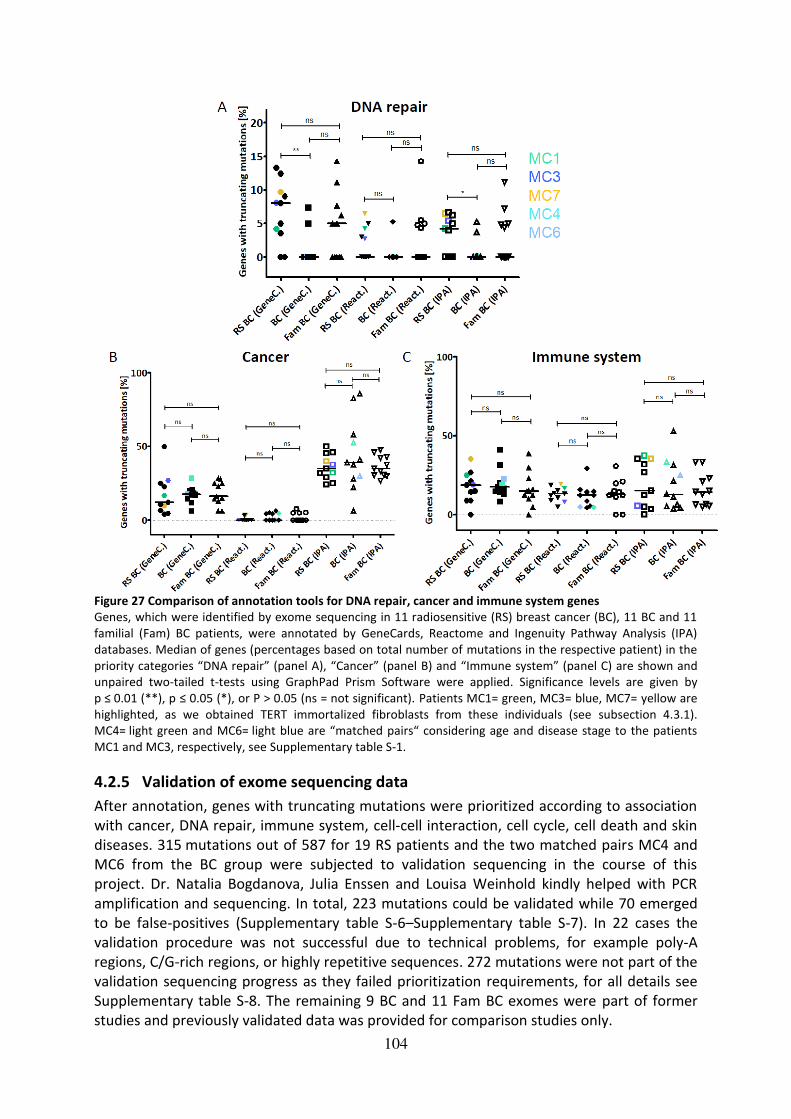
104
Figure 27 Comparison of annotation tools for DNA repair, cancer and immune system genes
Genes, which were identified by exome sequencing in 11 radiosensitive (RS) breast cancer (BC), 11 BC and 11
familial (Fam) BC patients, were annotated by GeneCards, Reactome and Ingenuity Pathway Analysis (IPA)
databases. Median of genes (percentages based on total number of mutations in the respective patient) in the
priority categories “DNA repair” (panel A), “Cancer” (panel B) and “Immune system” (panel C) are shown and
unpaired two-tailed t-tests using GraphPad Prism Software were applied. Significance levels are given by
p ≤ 0.01 (**), p ≤ 0.05 (*), or P > 0.05 (ns = not significant). Patients MC1= green, MC3= blue, MC7= yellow are
highlighted, as we obtained TERT immortalized fibroblasts from these individuals (see subsection 4.3.1).
MC4= light green and MC6= light blue are “matched pairs“ considering age and disease stage to the patients MC1 and MC3, respectively, see Supplementary table S-1.
4.2.5 Validation of exome sequencing data
After annotation, genes with truncating mutations were prioritized according to association
with cancer, DNA repair, immune system, cell-cell interaction, cell cycle, cell death and skin
diseases. 315 mutations out of 587 for 19 RS patients and the two matched pairs MC4 and
MC6 from the BC group were subjected to validation sequencing in the course of this
project. Dr. Natalia Bogdanova, Julia Enssen and Louisa Weinhold kindly helped with PCR
amplification and sequencing. In total, 223 mutations could be validated while 70 emerged
to be false-positives (Supplementary table S-6–Supplementary table S-7). In 22 cases the
validation procedure was not successful due to technical problems, for example poly-A
regions, C/G-rich regions, or highly repetitive sequences. 272 mutations were not part of the
validation sequencing progress as they failed prioritization requirements, for all details see
Supplementary table S-8. The remaining 9 BC and 11 Fam BC exomes were part of former
studies and previously validated data was provided for comparison studies only.

105
In summary, strong interindividual variability in DNA repair, cancer and immune system
related truncating gene mutations was observed in RS BC patients as well as in the two
comparison groups. The comparative analyses in IPA revealed overrepresentation of the
category “Cancer” in RS BC patients compared to BC and Fam BC patients. Truncating
mutations in DNA repair genes are significantly enriched in RS BC patients compared to BC
patients after annotation with GeneCards and IPA. In order to be able to carry out functional
radiosensitivity assays, fibroblasts from radiosensitive breast cancer patients MC1, MC3 and
MC7 were immortalized with TERT, as described in the next section.
4.3 Generation of cell cultures and functional assays
Primary human fibroblasts can only be cultured in vitro for a very limited time (usually up to
12–14 passages) until they undergo differentiation or replication-induced senescence495-497.
As primary cells from individual patients are difficult to harvest and especially hard to
surrogate if the patient has left the clinic or might have died, cells need to be immortalized
in order to generate long-lived stably proliferating assay tools. Therefore, the TERT
immortalization assay was established to generate immortal cells which can theoretically be
used in culture for indefinite time.
4.3.1 Immortalization of primary skin fibroblasts from RS BC patients
An example of the TERT immortalization progress using primary cells of patient MC7 is
shown in Figure 28A. Co-transfection of the TERT plasmid, which also includes the resistance
to hygromycin B as selection marker, with a GPF reporter plasmid was performed by
nucleofection. GFP-positive cells could be detected 24 h after nucleofection and it was
assumed that if plasmid uptake occurs, a cell will take up both of the plasmids. Depending on
the viability of the cells, two to three days after recovery from the nucleofection procedure,
the hygromycin B selection was started. During this process, about 70 % of the cells died,
which might have not taken up the TERT plasmid (see Figure 28 panel A, second picture).
Depending on the transfection efficiency, colonies of immortal cells grew out after several
weeks, as shown for MC7 cells in Figure 28A, right-hand side. Immortalized cell cultures from
patients MC1, MC3 and MC7 could be successfully generated with positive TERT
immunoreactivity as shown in Figure 28B. After the second hygromycin B boost, however,
TERT could not be detected in MC1 cells anymore, although it had initially been present.
Nevertheless, the MC1 cell line continued growing in the same manner as MC3 and MC7.
In all three patients, a significant representation of mutations in DNA repair genes was
detected by IPA, as shown in Figure 29. The mutations in HERC2, RAD51C and ABL1 all lead
to truncated versions of the respective proteins, whereas the FANCL variant encodes an
alternative C-terminus, but the protein might still be functional222 551-553, see Supplementary
figure S-24, Supplementary figure S-25, and Supplementary figure S-26. The FANCL variant
was not analyzed further since, in a side-project, it turned out not to be associated with
breast cancer551 and the functional impact of this variant was uncertain. The protein level of
ABL1 (c-abl) in MC7 TERT cells was analyzed by western blot with two different antibodies
and showed a reduction by about 50 % (48,6+/- 15 %) compared to the control BJ5TA
(Supplementary figure S-24). This appeared consistent with the heterozygous status of these
cells. Furthermore, immunocytochemical analyses were performed in MC3 cells to assess a

106
potential relevance of the RAD51C mutation for homologous recombinational repair as
monitored through RAD51 foci. This experiment revealed significant impairment of RAD51
foci formation in both untreated and irradiated MC3 primary cells compared to controls507.
The splice variants in RBBP6 and NPAT were predicted to be silent or leaky by MaxEntScan
and were not investigated further (Supplementary figure S-25-Supplementary figure S-26).
Thus, the most relevant DNA repair gene mutations in the three newly established RS BC
fibroblast lines were considered to target HERC2 in MC1, RAD51C in MC3 and ABL1 in MC7.
Figure 28 Immortalization of MC1, MC3 and MC7 primary fibroblasts with TERT
Panel A shows a typical course of the TERT immortalization procedure starting with detection of GFP 24 h after
nucleofection (left), white arrows indicating cells positive for GFP. About 70–80 % of cells die during the
hygromycin B selection process (middle) until immortalized cells grow colonies (right). Panel B shows western
blot results indicating immunoreactivity of TERT as detected compared to the positive control BJ5TA after
immortalization. Different blots are separated by vertical lines. Scale= 75 µm.
Figure 29 Mutations in DNA repair genes in RS BC patients MC1, MC3 and MC7
107
Results of comparative Ingenuity Pathway Analysis indicating enrichment in DNA repair genes in patients MC1
(green bar), MC3 (blue bar) and MC7 (yellow bar), as marked by red arrows. Positions in the human reference
genome (version 37) and types of validated mutations, which were identified by exome sequencing, are given
in the table below. For prediction of mutation effects, see Supplementary figure S-24, Supplementary figure S-
25, Supplementary figure S-26).
4.4 Functional studies in TERT immortalized cells of RS BC patients
4.4.1 ATM signaling after irradiation
To investigate the impact of the DNA damage response in cell culture models of the three
highly radiosensitive breast cancer patients MC1, MC3 and MC7 (Supplementary table S-1),
the immortalized cells were characterized through ATM-specific CHEK2 and KAP1
phosphorylation as early as 30 min after irradiation by western blot to analyze early signaling
of DSBs. Furthermore, γH2AX and 53BP1 foci kinetics were evaluated from 1 h up to 48 h
after IR, and cells were furthermore grown in colony survival as well as senescence assays to
follow the long-term IR response of these cultures for up to three weeks.
The checkpoint kinase CHEK2 as well as the transcriptional regulator protein KAP1 (also
known as TRIM28554) are both well known targets of the ATM kinase (see section 1.1.2 and
subsection 1.3.2) and also established DNA damage response markers. TERT immortalized
MC1, MC3 and MC7 cells were irradiated with 1.5 and 6 Gy and harvested at 30 min after IR
to investigate early activation of these proteins via phosphorylation by ATM. These data
were generated in the course of the bachelor thesis of Katharina Stemwedel.
As shown in Figure 30, detection of both proteins was possible in all analyzed cell lines and
significant increments were observed between 1.5 Gy and 6 Gy in all cultures after
densitometric analyses, except MC1 TERT (n= 3, Supplementary table S-16). In these cells, no
significant increment in p-KAP1 levels between 1.5 and 6 Gy was observed, probably due to
already pronounced p-KAP1 signal after 1.5 Gy IR treatment. However, increase of p-KAP1
levels between 0 and 6 Gy was highly significant in these cells, therefore indicating an IR-
induced effect (p-value of < 0.0001). MC7 TERT already showed a significant elevation of p-
KAP1 levels between 0 and 1.5 Gy (p-value: 0.021) and pSer19-CHEK2 levels in MC1 TERT
were lower at 6 Gy compared to the other cultures, however, not significantly (p-value:
0.056 for comparison to BJ5TA).
Furthermore, pSer824-KAP1 immunoreactivity appeared to be decreased in RS BC TERT cells
at 30 min after 1.5 Gy irradiation compared to BJ5TA, however, this was only significant
between MC7 TERT and BJ5TA (p-value: 0.04) and significantly higher levels of p-KAP1 were
detected in MC1 TERT compared to MC7 TERT after 1.5 Gy IR (p-value: 0.025).

108
Figure 30 ATM targets CHEK2 and KAP1 after irradiation in RS BC TERT cells Western blot results of early ATM signaling in TERT immortalized RS BC fibroblasts from patients MC1, MC3 and MC7 and
healthy BJ5TA wildtype control. Cells were irradiated with 1.5 Gy or 6 Gy and harvested after 30 min together with non-
irradiated controls (0 Gy). Antibodies against CHEK2 phosphorylated at serine 19 (Ser19) (p-CHEK2), KAP1 phosphorylated
at serine 824 (Ser824) (p-KAP1), and β-actin as loading control were used. The vertical line indicates that samples were on
two different blots with a control each. Three biological replicates were analyzed and representative blots are shown.
4.4.2 Kinetics of DNA damage recognition and repair in TERT immortalized cells of
RS BC patients
For a more detailed and extended inspection of DSB repair kinetics in the TERT immortalized
MC1, MC3 and MC7 cells, γH2AX and 53BP1 foci formation and resolution analyses were
performed. Cells were irradiated with 1 Gy and stained after 1 h, 6 h, 24 h, and 48 h by
immunocytochemistry techniques. Foci numbers were counted and are shown in Figure 31.


110
Prism Software and significance levels are given by p ≤ 0.001 (***), p ≤ 0.01 (**),p ≤ 0.05 (*), or P > 0.05 (ns = not
significant). At least three biological replicates were analyzed, given by the number of symbols of each column.
There were only subtle differences between the control and the RS cell cultures in foci
kinetics of γH2AX as well as 53BP1 foci. Initiation of foci formation 1 h after IR was functional
in all cultures, however, differences in foci resolution were visible between MC1 TERT and
the remaining three cultures. MC1 TERT seemed to return slower to the zero state, as the
drop between 6 h and 24 h was not significant for both γH2AX as well as 53BP1 foci in these
cells. Numbers of γH2AX and 53BP1 foci in MC3 TERT and MC7 TERT cells declined faster
after 6 and 24 h compared to MC1 TERT, however, similar to the control BJ5TA cells. The
final drop between time points 24 h and 48 h was only significant in MC1 TERT cells for both
analyzed proteins. Comparisons between cell lines revealed significant differences between
53BP1 foci numbers at the later time points of 24 h and 48 h. MC1 TERT cells displayed
significantly more 53BP1 foci at 24 h after 1 Gy IR compared to BJ5TA (p-value: 0.014), while
foci numbers in MC1 TERT were also significantly reduced compared to MC3 TERT at 24 h (p-
value of 0.004) and compared to MC7 TERT at 48 h (p-value: 0.002). For complete analysis
see Supplementary table S-16 and Supplementary table S-17.
Taken together, early as well as extended ATM signaling is functional in all four cell lines
tested, although, slight reductions in p-CHEK2 Ser19 levels 30 min after 6 Gy and as
marginally narrowed γH2AX as well as 53BP1 foci numbers at 1 h after 1 Gy of radiation were
observed in MC1 TERT cells. MC3 as well as MC7 TERT cells both showed a significant drop in
γH2AX as well as 53BP1 foci numbers between 6 h and 24 h after 1 Gy IR, whereas this was
not observed in MC1 TERT cells.
4.4.3 Previous studies on RAD51 foci formation in primary RS cells and comparison
to results obtained with TERT RS cells
In previous studies with MC3 and MC7 primary cultures, an impairment of RAD51 foci
formation 4 h after 6 Gy IR was observed, which was different in MC3 cells compared to ADP
controls507. Results in primary cells indicated significant increase of foci-positive cells after IR
in ADP as well as MC7 cells (p-values of 0.002= ADP and MC7, 0.08= MC3). MC3 primary cells
showed significantly less foci after IR compared to ADP as well as MC7 (p-values of 0.0002
and 0.0007, respectively). In order to investigate whether the TERT immortalization could
influence the DNA damage response via RAD51 foci formation in these cultures, these
analyses were repeated in MC3 TERT and MC7 TERT, in comparison to MC1 TERT (which was
not included in the primary cell experiment) and BJ5TA. Results are shown in Supplementary
figure S-27 and indicated, that the immortalization procedure indeed could have an impact
on RAD51 foci formation in cells from patients MC3 and MC7. However, background levels of
repair in the unirradiated condition were also strongly elevated in BJ5TA cells compared to
ADP cells. Therefore, the TERT immortalization procedure might have a strong effect also on
wiltype fibroblasts, compared to immortalization with large T in ADPs. In these studies, the
MC7 TERT showed the strongest impairment of RAD51 foci formation after IR, which was
significant compared to BJ5TA (p-value of 0.009). Increase in numbers of foci-positive cells
was only significant in BJ5TA after IR (p-value of 0.004). Normalization to the background
repair levels observed in unirradiated samples revealed significant impairment of RAD51 foci
formation after IR only in MC3 primary and MC7 TERT compared to respective controls (p-
values: MC3: 0.017, MC7: 0.087, MC1 TERT: 0.229, MC3 TERT: 0.607, MC7 TERT: 0.008).

111
As early steps in DNA damage sensing and repair seemed to be – despite subtle differences –functional in all RS cultures, and repair foci of γH2AX as well as 53BP1 at 48 h were
comparable to the control cells, it was tempting to investigate cellular survival after IR for an
extended time period as functional endpoint of radiosensitivity in these cultures, as will be
described in the next subsections.
4.4.4 Colony survival after irradiation as functional endpoint
In order to evaluate colony survival as a consequence of functional DNA repair after IR
damage over a time period of up to three weeks, cells were seeded in very low densities in
culture flasks and survival by means of colony formation ability was monitored. The colony
survival assay is a very well known and established method and has been known as the “gold standard of radiosensitivity” for many years508. The cells were seeded in the lowest densities
possible to achieve a good balance between single cell status and spatial proximity to allow
colonies arising from single cells, as well as cellular communication to take place. Colony
formation was monitored for up to three weeks and crystal violet stained cells are shown in
Figure 32.
Figure 32 Colony survival of TERT immortalized MC1, MC3 and MC7 cells after irradiation compared to BJ5TA Panel A shows the macroscopic view of colony survival results performed in T25 cell culture flasks. The cells were seeded in
the following densities given in cell numbers per flask: BJ5TA - 0 Gy = 2500 and 4 Gy = 10.000 cells; MC1 TERT - 0 Gy = 5000
and 4 Gy = 20.000; MC3 TERT - 0 Gy = 5000 and 4 Gy = 16.000; MC7 TERT - 0 Gy = 5000 and 4 Gy = 20.000, and have been
stained with crystal violet after 21 days after IR or without IR (0 Gy). Selected areas of panel A, indicated by numbered
white squares, were magnified in panel B for better visualization of colonies. Panel C shows microscopic views of flasks
above in 4x (left panels), 20x or 40x magnification (right panels). Cells with altered morphology are marked by white arrows
in MC3 TERT cells. Scale bars= 100 µm, except top left-hand side picture of panel C= 1000 µm.
112
It was very difficult to receive colonies from the radiosensitive cell cultures, even without IR.
In the traditionally utilized 6-well format, colony formation was only possible for the BJ5TA
cells, see Supplementary figure S-29A. For each cell culture, different seeding conditions
were established and collagen-, as well as gelatin-coated plates were used, see
Supplementary figure S-28. Furthermore, the cells were subjected to a boost with 10 µg/ml
hygromycin B (10H), which should activate TERT expression, to ensure that the failure of
colony survival is not due to loss of TERT during subsequent passaging after immortalization.
No changes were observed whether the cells were supplemented with 10H or normal
growth medium. Collagen-coating improved cell growth in the MC3 TERT cells, however, this
could not be considered as true colony formation because cells rather assembled together in
one region of the well than arising from colony-initiating single cells (Supplementary figure
S-28). None of the coatings had any effect on either survival and assembly of cells or colony
formation in MC7 TERT cells. By contrast, the control fibroblast line BJ5TA grew well in all
formats and coating conditions applied.
Using T25 flasks instead of 6-well plates enabled colony growth of all cultures in unirradiated
condition, see Figure 32A, top row. Characteristically, MC3 and MC7 TERT cells grew
preferably at the edge of the flasks and only very small colonies of MC3 TERT cells formed in
the middle of the flask after IR, while MC7 TERT did not show any colony formation in
irradiated flasks. In a different experiment, small colonies of MC3 TERT cells were observed
in the middle of the flask in the unirradiated condition when seeded in lower densities, see
Supplementary figure S-29C. MC1 TERT however, although strongly reduced, showed some
colony formation and size similar to BJ5TA when seeded in high densities, see Figure 32, also
after 4 Gy IR. This dose was chosen as medium dose to conduct comparative analyses with
all four cultures, considering the range of 2 Gy - 8 Gy, which is common for CSA508, and was
applied during establishment of the method for each cell line. In total, 7 out of 7
experiments for BJ5TA in T25 flasks were successful, while MC1 TERT only formed colonies in
1 out of 3 experiments, MC3 TERT formed only one very small colony in 1 out of 3
experiments and MC7 failed to yield any colonies after IR (n=3 for 4 Gy). Results were similar
for doses 2 Gy, 6 Gy and 8 Gy tested for MC3 TERT, MC7 TERT and BJ5TA cells.
Changes in the shape and granular pattern of especially irradiated cells of MC3 TERT and
MC7 TERT were observed, which are indicated by white arrows in Figure 32. These variations
were also detected through intensity changes of the crystal violet staining, as closely
assembled, small and round cells are stained darker than cells with flattened and granular
morphology, see also Supplementary figure S-29. Whereas BJ5TA and MC1 TERT cells looked
similar in the middle and at the edge of the flasks, MC3 TERT cells, which have assembled
closely at the edges, retained a rather normal morphology. However, cells which were in
single cell status (shown by white arrows in Figure 32C, bottom) were considerably bigger
and displayed flattened as well as granular morphology. These morphological changes
appeared in MC3 and MC7 TERT cells independent of their localization in the flasks especially
after IR.
For better understanding of the process of morphological changes and failure of colony
survival in the radiosensitive cell cultures after IR, the time course of cellular appearance and
colony outgrowth with and without preceding IR was monitored. Figure 33 shows a typical
course of colony formation over 7 days (panels B - C) and 21 days (panels D - E), respectively,
after IR with 4 Gy. Alterations in the morphology of cells particularly appeared in irradiated

113
flasks of the RS cultures as early as 7 days after IR, and examples of single cells with changed
shape are indicated by red arrows. At this time point, the BJ5TA had already started to form
colonies (panel C, top row). Similar to Figure 32, crystal violet stained cells are shown in
panels D - E of Figure 33, showing colonies located at the middle (M) of the flasks in all
cultures (except MC3 TERT at transition area, panel D) and colonies located in the middle
after IR only in BJ5TA and MC1 TERT cells. MC3 TERT cells assembled preferentially at the
edge (E) of the flasks after IR (apart from the single colony shown in Figure 32), while closely
assembled cells with altered morphology were observed in MC7 TERT cells throughout the
whole area of the flask after 4 Gy IR (panel E).
Figure 33 Time course of colony formation assay in TERT immortalized MC1, MC3 and MC7 cells Microscopic view of colony survival assays performed with BJ5TA, MC1 TERT, MC3 TERT and MC7 TERT cells grown in T25
flasks. Panel A shows single cells 24 h after seeding in the unirradiated control flasks, while panel B shows the same flasks 7
days after seeding. Single cell cultures, which have been growing for 7 days after 4 Gy IR, are shown in panel C and
morphologically altered cells are indicated by red arrows, which were predominantly found in the radiosensitive cell lines.
Panel D and E show crystal violet stained cultures after 21 days in either unirradiated (D) or 4 Gy irradiated state. The area
of the flask, in which the picture was taken, is indicated by M= middle or E= edge. Transition areas are depicted as
“edge/middle” (E/M). Scale bar = 100 µm.
As the altered morphology of the cells was overrepresented in RS cell cultures following IR,
the question was adressed whether this change could represent IR-induced senescence.
Senescence is a known form of cell death following endogenous as well as exogenous
stresses, such as insults by reactive oxygen species formed after radiation exposure (see
subsection 2.3.6).
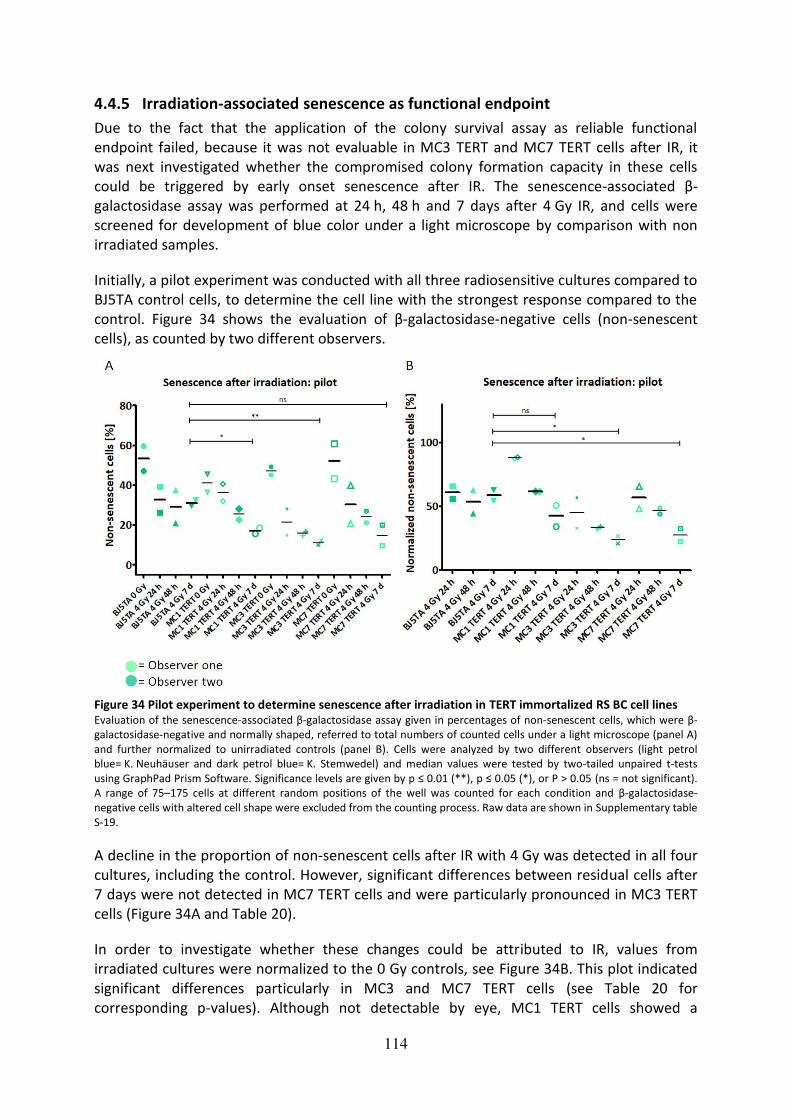
114
4.4.5 Irradiation-associated senescence as functional endpoint
Due to the fact that the application of the colony survival assay as reliable functional
endpoint failed, because it was not evaluable in MC3 TERT and MC7 TERT cells after IR, it
was next investigated whether the compromised colony formation capacity in these cells
could be triggered by early onset senescence after IR. The senescence-associated β-
galactosidase assay was performed at 24 h, 48 h and 7 days after 4 Gy IR, and cells were
screened for development of blue color under a light microscope by comparison with non
irradiated samples.
Initially, a pilot experiment was conducted with all three radiosensitive cultures compared to
BJ5TA control cells, to determine the cell line with the strongest response compared to the
control. Figure 34 shows the evaluation of β-galactosidase-negative cells (non-senescent
cells), as counted by two different observers.
Figure 34 Pilot experiment to determine senescence after irradiation in TERT immortalized RS BC cell lines Evaluation of the senescence-associated β-galactosidase assay given in percentages of non-senescent cells, which were β-
galactosidase-negative and normally shaped, referred to total numbers of counted cells under a light microscope (panel A)
and further normalized to unirradiated controls (panel B). Cells were analyzed by two different observers (light petrol
blue= K. Neuhäuser and dark petrol blue= K. Stemwedel) and median values were tested by two-tailed unpaired t-tests
using GraphPad Prism Software. Significance levels are given by p ≤ 0.01 (**), p ≤ 0.05 (*), or P > 0.05 (ns = not significant).
A range of 75–175 cells at different random positions of the well was counted for each condition and β-galactosidase-
negative cells with altered cell shape were excluded from the counting process. Raw data are shown in Supplementary table
S-19.
A decline in the proportion of non-senescent cells after IR with 4 Gy was detected in all four
cultures, including the control. However, significant differences between residual cells after
7 days were not detected in MC7 TERT cells and were particularly pronounced in MC3 TERT
cells (Figure 34A and Table 20).
In order to investigate whether these changes could be attributed to IR, values from
irradiated cultures were normalized to the 0 Gy controls, see Figure 34B. This plot indicated
significant differences particularly in MC3 and MC7 TERT cells (see Table 20 for
corresponding p-values). Although not detectable by eye, MC1 TERT cells showed a

115
significant decrease in non-senescent cells after normalization at 24 h after IR (p-value=
0.03) compared to BJ5TA.
Table 20 P-values of senescence analysis in radiosensitive cell cultures after irradiation compared to BJ5TA
MC1 TERT compared
to BJ5TA
MC3 TERT compared
to BJ5TA
MC7 TERT compared
to BJ5TA
7 d after 4 Gy 0.021 0.008 0.092
7 d after 4 Gy
normalized
0.22 0.022 0.042
As the steepest decline in the proportion of non-senescent cells after IR was observed in
MC3 TERT cells, this culture was chosen for further experiments, shown in Figure 35.
Figure 35 Irradiation-associated senescence in MC3 TERT cells compared to BJ5TA Non-senescent cells counted in the senescence-associated β-galactosidase assay after 4 Gy IR in BJ5TA and MC3 TERT cells.
Percentages of non-senescent cells, which were β-galactosidase-negative and normally shaped, with reference to total
numbers of counted cells under a light microscope (panel A) and further normalized to unirradiated controls (panel C) are
given. Panel B shows examples of β-galactosidase staining (blue areas) in unirradiated cells (upper panel), 7 days after 4 Gy
IR (middle planel) and in positive control cells in different densities (lower panel). Positive control 1 and 2 were very high
passage primary fibroblasts, which were known to have entered quiescence due to extended passaging in culture. Scale
bar = 100 µm. Median values of 3 independent experiments for the 9 day value and 4 independent experiments for all other
time points were analyzed by two-tailed unpaired t-tests using GraphPad Prism Software, and significance levels are given
by p ≤ 0.001 (***), p ≤ 0.01 (**), p ≤ 0.05 (*), or P > 0.05 (ns = not significant). Numbers of counted cells ranged between

116
75 - 175 cells at different random positions of the well. β-galactosidase-negative cells with altered cell shape were excluded
from the counting process. Raw data are shown in Supplementary table S-20.
Figure 35 shows results of four independent experiments performed with BJ5TA and MC3
TERT for all time points, except 9 days after 4 Gy IR, as this time point was chosen to be
added after the first experiment was finished. Panel A shows a significantly lower proportion
of non-senescent cells in MC3 TERT cells compared to BJ5TA in all tested conditions (for p-
values see Table 21). Especially following IR with 4 Gy, differences between the two cultures
were highly significant. To investigate whether these differences are IR-initiated, the
nonsenescent cells were normalized to respective unirradiated controls, which is shown in
Figure 35C. After normalization, percentages of non-senescent cells were only significantly
reduced at 48 hours and 7 days after 4 Gy IR in MC3 TERT cells compared to BJ5TA. Examples
of the output data are given in Figure 35B, which shows β-galactosidase-positive (blue) and
β-galactosidase-negative (transparent) cells in the two cultures compared to two positive
controls.
Table 21 P-values of senescence analysis in MC3 TERT cells compared to BJ5TA control
0 Gy 24 h after 4 Gy 48 h after
4 Gy
7 d after 4 Gy 9 d after 4 Gy
MC3 TERT
compared to
BJ5TA
0.027 0.0005 < 0.0001 0.009 0.007
MC3 TERT
compared to
BJ5TA
normalized
– 0.744 0.002 0.023 0.079
As culture conditions for the two cell lines were slightly different, additional tests were
performed. To exclude effects of the MC medium on accelerated senescence in culture, a
side-by-side comparison of BJ5TA cells grown in parallel in their usual medium as well as in
MC medium, was carried out. No significant differences between BJ5TA cells grown in
regular medium and MC medium were detected (data not shown). Furthermore, to test
whether hygromycin B supplementation exerts any influence on the senescence progress in
MC3 TERT cells, a side-by-side comparison of MC3 TERT cells growing in normal MC medium
and MC medium supplied with hygromycin B was performed. For both conditions, similar
results were obtained and differences were not significant (data not shown).
The data obtained for BJ5TA and MC3 TERT cells were subjected to regression analysis with
GraphPad Prism software, see Supplementary figure S-30. Data were fitted to an exponential
decay (one-phase) model and correlations with R2>0.5 were obtained for both cell lines.
Furthermore, genes identified in BC, Fam BC and the complete cohort of RS patients were
compared with a list of genes recently correlated to aging555, by using Venny 2.0. None of
the genes from the BC patient group were overlapping with the published findings but
BRCA2 in the Fam BC and also AKR1C2 (Aldo-Keto Reductase Family 1 Member C2) and
DHCR7 (7-Dehydrocholesterol Reductase) in the RS patient dataset were shared by the
aging-associated group of genes, see Supplementary figure S-31.

117
5 Discussion In the past decades, several attempts have been made to decipher the underlying genetic
background of individual radiosensitivity and many approaches aimed at identification of
prognostic markers prior to radiation treatment (section 2.4). In this work, three
methodological strategies were followed to characterize clinical and cellular radiosensitivity
(compare Figure 11).
5.1 TPT1 as candidate marker for individual radiosensitivity
TPT1 was investigated as candidate for individual radiosensitivity as it has been implicated in
DNA repair and especially, ATM signaling265,267. Previous reports have shown that TPT1
directly regulates ATM activity in Drosophila melanogaster cells556, that IR furthermore
increases TPT1 levels in nuclei of human AG1522 WT cells in an ATM-dependent manner and
that TPT1 colocalizes to radiation-induced foci to actively participate in DNA repair265. These
features of TPT1 could make this protein particularly useful as a biomarker for radiation
exposure and a possible target for radiosensitization. Furthermore, a recent study has
confirmed the finding that TPT1 can be upregulated in tumor cells and found that
inactivation of TPT1 can sensitize cancer cells to DNA damaging agents267. Also, its strong
association with tumor progression and severity of the disease pointed to the possibility that
TPT1 could promote genetic instability259 260 263 268 269 557-560. However, a previous study in our
lab did not find a strong association of mutations in the TPT1 gene with breast cancer
predisposition475.
Ionising radiation induces DNA double strand breaks (DSBs) that are signaled via ATM kinase,
which is activated rapidly after IR by direct or indirect pathways561 (subsection 1.3.2). In its
activated form, ATM can phosphorylate (and mostly activate) many downstream targets, for
example KAP1, CHEK2, or the histone H2AX leading to γH2AX. The activation of γH2AX
represents a very early consequence of DNA damage562, and it furthermore serves as a
platform to recruit additional proteins working in the DNA damage response. Subsequent
recruitment of numerous DNA repair or damage-signaling factors to the break is mediated
by chromatin modification and/or direct interactions of these factors with γH2AX562. The role
of TPT1 in this context is presently poorly understood, although TPT1 has been shown to
exhibit a broad spectrum of cellular functions including apoptosis, cell survival and DNA
damage sensing and repair265 563 564.
5.1.1 No evidence for a role of TPT1 in early ATM signaling
In this study, there was no indication of effects of TPT1 on ATM function after low or high
dose IR by assessing KAP1-phoshorylation on Ser824 in MCF10A and ADP cells, although this
phosphorylation site is a main target of ATM205,206,527,528. Similarly, no alterations in p-CHEK2
Ser19 levels after TPT1 depletion were observed. Although direct interactions between ATM
and TPT1 have been found in human cell cultures and also in fruit fly in vivo models after
IR265,556, ATM, 53BP1 or γH2AX had not been identified as being part of the potential TPT1
interactome by two recent studies using HeLa cells266,267. Furthermore, TPT1 does not seem
to be necessary for e. g. the translocation of ATM to the nucleus and formation of IR induced
ATM foci556. Interestingly, ATM depletion decreased TPT1 foci formation although it still
translocated to the nucleus556. These published findings using a Drosophila model indicate
that TPT1 does not seem to be necessary for ATM function, which is consistent with results
presented in this thesis. However, vice versa, the depletion of ATM seems to affect TPT1 foci

118
formation in Drosophila but not its nuclear translocation. In the presented work, however,
neither IR-induced TPT1 foci nor a prominent localization of TPT1 to the nucleus in human
cells generated from skin or breast epithelium were detected, indicating a distinct function
of TPT1 in cells of different origin.
5.1.2 No evidence for nuclear translocation or chromatin binding of TPT1 upon
irradiation
In the course of this work, no changes of TPT1 levels in whole cell extracts after ATM
inhibition and IR were detected in both ADP and MCF10A cells, while nuclear forms of TPT1
were visible 30 min after IR with previous ATM inhibition in MCF10A cells. However, the
amount of nuclear TPT1 was not affected by ATM inhibition and chromosome-bound TPT1
was not detectable. A previous study within this project using lymphoblastoid cell cultures,
indicated some chromatin binding of TPT1 only in one out of three WT cell lines477. This,
however, did not change after IR, and there was only a slight increase in nuclear TPT1 after
IR in two of the three cell lines.
Consistently, no translocation of TPT1 to the nucleus and no formation of nuclear TPT1 foci
was detected by ICC in several cell lines and the localization of TPT1 did not change after IR,
which is partially in line with published findings265,267,556. Although a spotty pattern of TPT1
was observed in five cell lines (which was validated in two of the cell lines with a second
TPT1 antibody), this pattern was different from foci, did not increase after IR and could
similarly be detected in the cytoplasm. In some cells, TPT1 seemed to assemble in the
vicinity of the nucleus after IR, but did not localize to the nucleus itself, as was confirmed by
confocal analyses.
The finding that TPT1 was not enriched in chromatin fractions after IR in several cell lines is
consistent with the absence of radiation-induced TPT1 foci. TPT1 has previously been
reported to show a granular localization pattern in the vicinity of and around the nucleus in
ovarian epithelial cells565. Furthermore, a spotty pattern of TPT1 in ovarian carcinoma cells
was described in the literature, while TPT1 was found to be present in the cell nucleus or cell
periphery in other cell types, thus presenting evidence for cell type dependent variation of
TPT1 localization259,265,566. Altogether, cytoplasmic as well as nuclear localization of TPT1 is
known256 557, and cell-type specific as well as cell-growth specific variations have been
reported263 566 567. However, clearly as such identified TPT1 foci were only described by Hong
et al. in the fruit fly556 and Zhang et al.265 in primary human fibroblasts and could not be
reproduced by Li et al.267 in a recent study using HeLa cells.
Three different antibodies directed against TPT1 were applied in this work, one of which was
also used by Zhang et al.265. The conflicting findings addressing the localization of TPT1 and
its capability of forming visible foci raise the question whether the specificity of the
antibodies could be confirmed. In the presented thesis, a mix of three TPT1 siRNAs, which
has also been applied by Zhang et al.265, was used for silencing. The specific effect of this
siRNA mixture could be confirmed by western blot (showing no additional bands) as well as
immunostainings in ADP and MCF10A cells. This renders the possibility of unspecificity of the
antibody unlikely.
119
There is evidence that the increase of TPT1 stability and elevation of immunoreactivity after
IR could be dependent on its initial level in the analyzed cell line. Zhang et al. found a
prominent upregulation in whole cell extracts, nuclear translocation as well as foci formation
of TPT1 after IR in primary wildtype fibroblasts. No detailed investigations were made to
determine the basal levels of TPT1 in that work, however, it was shown to be similar to the
housekeeper α-tubulin in the primary cells265. Cancer cell lines with different endogenous
TPT1 levels were addressed by Li et al267. The mutant cervical cancer HeLa cells, which were
constructed to express low-levels of TPT1, did only show marginal increase of endogenous
TPT1 after DNA damage and no nuclear translocation or nuclear foci formation was
observed. In breast cancer MCF7 cells with high endogenous TPT1 levels, however, the
persistent activation of γH2AX and prolonged retention of RAD51 foci after TPT1 silencing
was significant 12 h after 10 Gy IR267.
Taken together, it has been shown in the literature that TPT1 knockdown accounts for
persistent γH2AX foci early after low-, and medium-dose IR265, and also has a late effect after
high-dose IR267. However, those studies used either primary or ovarian/breast cancer cells.
Therefore, results obtained in spontaneously immortalized breast epithelial cells (MCF10A),
SV40-immortalized ADP and the TERT-immortalized BJ5TA (and especially, the additional RS
MC3 TERT cells) might not be directly comparable. However, the results in the TNBC cell
lines obtained in this thesis account for a strong variability of TPT1 levels and subcellar
localization.
5.1.3 No evidence for an effect of TPT1 on foci formation and resolution after
irradiation
Zhang et al. have shown formation of nuclear TPT1 foci after IR and reported a dramatic
effect of TPT1 knockdown on retention of γH2AX foci at 3 and 6 h after 50 cGy of irradiation
in wildtype primary cells, strongly supporting a role of TPT1 in DNA repair265. Very recently, a
proteomics study using HeLa cells identified several DNA repair proteins as part of the TPT1
interactome and detected an effect of TPT1 silencing on the efficiency of HR in breast cancer
MCF7 cells267. However, immunostainings by Li et al.267 indicated that TPT1 was a
predominantly cytoplasmic protein which did not localize to the nucleus after induction of
DNA DSBs by neocarzinostatin in this study, which is not consistent with data shown by
Zhang et al.265. Furthermore, Li et al. did not detect foci formation of TPT1 but rather
cytoplasmic foci which appeared thoughout the cell and did not change upon DNA damage
in HeLa cells, which they used for identification of the TPT1 interactome. However, these
cytoplasmic foci were more prominent than the foci-like structures seen in this thesis. In
MCF7 cells, which have a high endogenous TPT1 level, TPT1 depletion lead to the prolonged
retention of H2AX and RAD51 foci 12 h after 10 Gy IR and several DNA repair proteins such
as ATR and DNA-PKcs were identified as part of the TPT1 interactome in these cells.
However, there was a large discrepancy between TPT1 binding partners identified in that
study compared to the preceding study, which also utilized cells of cervical cancer origin
(HeLa)266. Furthermore, Li et al.267 found an effect of TPT1 on RAD51 stabilization during
normal cell culture conditions, however, not after IR. These results might indicate a
differential effect of TPT1 in unirradiated and irradiated cells, as was also reported by Zhang
et al.265.
120
Zhang et al observed a highly significant effect of TPT1 knockdown on retention of H2AX foci
6 h after low-dose IR with 50 cGy and also highly significant effects of TPT1 silencing on
clonogenic survival after 2 and 4 Gy. Interestingly, the pure knockdown of TPT1 even in
unirradiated condition resulted in significant impairment of survival and an enhanced basal
micronuclei level, indicating effects on DNA repair capacity265. As presented here, a
significant reduction of γH2AX levels after silencing was detected in unirradiated ADP cells,
however, numbers of γH2AX foci in silenced MCF10A cells tended to be higher in all
treatments and time-points investigated. However, none of these changes were statistically
evaluable as knockdown of TPT1 48 h prior to IR with 1 Gy did not result in significant
changes of γH2AX and 53BP1 foci numbers per positive nucleus at 1 h, 6 h, 24 h or 48 h after
IR in ADP and MCF10A cells. In agreement with these observations, there was no evidence
for formation of nuclear TPT1 foci or colocalization with γH2AX in ADP cells. For comparison,
colocalization between γH2AX and 53BP1 can be up to 100 %568 569.
Although the presented results on ADP fibroblasts and MCF10A breast epithelial cells were
largely similar, a delay in foci disappearance after TPT1 silencing in ADP compared to
MCF10A cells was detected. A possible reason for the variability could be the
immortalization status of these cells. TPT1 is a known interactor and target of TP53, which
could be affected due to the large T transformation of the ADP cells264 269 570, while MCF10A
are spontaneously immortalized cells526. Another possible explanation why TPT1 depletion
did not result in decreased γH2AX levels after IR might be that other kinases, which are
involved in DNA repair like ATR or DNA-PKcs, have increased activity due to the elevated
genomic instability of immortalized cells. This is a known side-effect of immortalization and
has been described for several cell lines, for example also breast epithelial cells571. Although
MCF10A cells were originally characterized to possess minimal genetic alterations526 572,
these could have accumulated by subsequent passaging. Especially the SV40 immortalized
skin fibroblasts ADP show increased genome destabilization due to large T, a known
phenomenon573, and elevated background level of DNA repair compared to primary cells.
Therefore, these cells might compensate the effect of TPT1 knockdown on DSB repair. A
hypothetic impairment of ATM activity by TPT1 depletion may be offset by ATR or DNA-PK,
as these kinases can also phosphorylate KAP1 on Ser824 in the course of the early DNA
damage reponse. However, the ATM kinase is believed to be dominant in this context206.
This possibility can be considered as unlikely, because ATM is known to be an important
mediator of the DDR, in particular at early time points after DNA damage562, while ATR is
believed to become important at later stages to maintain these pathways121 and is probably
not involved in early time points like 30 min after IR. Further investigations could address the
question whether the involvement of TPT1 in the DNA damage response can be explained by
ATM interaction/activation only, or if it also plays a role in ATR-mediated repair of DNA
damage.
5.1.4 No evidence for elevation of TPT1 levels in breast cancer cell lines
TPT1 is involved in tumor-reversion260 557, is upregulated in several tumors, may play a role in
the tumorigenesis and development of BC and could be an important prognostic factor for
this malignancy268. TPT1 expression levels tend to be higher in tumors, although this is not a
general observation259 and its downregulation is correlated with tumor reversion in the
majority of cases259 558. TPT1 has been described as biomarker for BC559 and correlation of
expression with clinical parameters of aggressive disease is high in several cancers including
breast and ovarian cancer263 269 560. A positive correlation of TPT1 overexpression with tumor

121
size, clinical stage, lymph node metastasis and histological grade of BC is known268 and the
high TPT1 activity in some cancer types, which contributes to oncogenesis, can result from a
mutation in TP53269. Because TPT1 levels correlate with mutational inactivation of TP53 in
BCs, it is likely that mutations in TP53, and not necessarily in TPT1 itself, result in changes of
TPT1 expression in BC patients269. As TCTP is a negative transcriptional target of P53, it has
been suggested that in those tumors where P53 is primarily inactivated by mutation, altered
TCTP activity might contribute to tumorigenesis269.
In this thesis, no differences in TPT1 levels in whole cell extracts of triple negative BC cell
lines HCC1937 and HCC1395 30 min after low and high dose IR compared to breast epithelial
cells MCF10A and also in WT cells HA325, HA169 and HA256477 was detected by western
blot. Moreover, no increase of the TPT1 level was found in whole cell extracts of MCF10A
cells 30 min after 20 Gy IR (data not shown). These data might indicate the heterogeneity of
TPT1 functions in cells of different origin. As mentioned above, the high TPT1 activity in
some cancer types, which contributes to oncogenesis, can result from a mutation in TP53269.
Although HCC1937 possesses a nonsense mutation in TP53, it is located outside the central
DNA-binding core, and HCC1395 is known to have a missense mutation in TP53574, which
might not influence the effect of TP53 on TPT1. This could explain the findings that the basal
TPT1 level is not higher in those two TNBC cell lines compared to MCF10A.
Li et al. concluded that TPT1 expression might correlate with efficient HR repair267. However,
the relation between high endogenous TPT1 level in cancer tissues and cells (as also shown
for the breast cancer cell line MCF7 by Li et al.) and its protective role in DNA repair is
undefined. In this thesis, no differences between the endogenous TPT1 levels of TNBC cell
lines between HCC1937, HCC1395, HCC38 were detected compared to each other as well as
in comparison to the control MCF10A, although all three TNBC lines are deficient in BRCA1
and, by inference, HR repair. The question remains why TPT1 has been reported as highly
upregulated tumor marker by a certain number of publications if it is supposed to be a
protective factor against DNA damage. One possible explanation could be that genetically
instable tumor cells compensate for the decreased DNA repair capacity by upregulation of
TPT1. Li et al. found that TPT1 only affected stabilization of RAD51 under normal culture
conditions and not after 10 Gy IR, which might indicate differential effects of TPT1 in
unirradiated and irradiated cultures, as was also hypothesized by Zhang et al. in an earlier
work265. This group observed that downregulation of ATM in unirradiated primary cells
resulted in increased levels of TPT1 and suggested differential effects of ATM on TPT1 in
irradiated and non-irradiated samples265. In conformity with these findings, our data on
unirradiated LCLs with ATM mutations (Figure 9) also support the role of ATM on TPT1-
upregulation in unirradiated samples. Interestingly, this seems to depend on the
manifestation of the ATM mutation, as has been shown by our group477, and may be due to
a mutual cellular function of these proteins other than DNA repair.
5.1.5 The effect of TPT1 on DNA damage sensing and repair might depend on cell
type
It is well known that the level of TPT1 mRNA varies in cell type, developmental stage and in
response to extracellular stimuli258. The role of TPT1 in apoptosis and cancer development
has been recurrently described in the literature, however, its precise involvement in both
processes remains complex, as a TP53-dependent induction of TPT1 can reduce oxidative
stress, apoptosis and promote cell survival after hydrogen peroxide treatment575 on the one
122
hand. On the other hand, elevated levels of TPT1 correlate with cancer development258,263.
For example, its expression can be increased dramatically during oxidative stress563, although
the findings of this thesis do not confirm an induction after IR as oxidative stressor.
Furthermore, expression of TPT1 is upregulated upon cell cycle entry but progression of such
is delayed due to TPT1 upregulation, which is an example of the complexity of TPT1
regulation576. Concerning TPT1’s function as a growth-regulating protein, diverging data has
been published263. One group proposed the stimulation of GDP/GTP exchange of Ras
homologue enriched in brain (Rheb) by TPT1 and its function in mTOR (mammalian target of
Rapamycin) signaling in Drosophila577. But other studies have reported that TPT1 does not
act as nucleotide exchange factor for Rheb in two mammalian cell lines as well as in
Drosophila cells578, nor as a regulator in mTOR signaling in mammalian cell lines579. This may
partly be due to different functions of human and Drosophila TPT1, although another
publication provides evidence that TPT1’s involvement in DNA repair is similar in Drosophila
and human cell systems265 556.
Additional evidence for a less generalized function of TPT1 is provided by different
observations of its role in cell growth and apoptosis regulation. While Gnanasekar et al.
showed that TPT1 knockdown in human prostate cancer cells causes apoptosis and inhibits
cell growth580, Zhang et al. did not find alterations of cloning efficiency in AG1522 WT cells
up to 72 h after TPT1 knockdown265. Taken together, these data suggest that the effects of
TPT1 are diverse and may depend on cell type and cellular status. To provide a cellular
system that is better comparable to the wildtype primary cells investigated by Zhang et al.,
the TPT1 knockdown and subsequent assays should be performed in primary cultures, too.
Furthermore, not only the different observations regarding nuclear translocation of TPT1
and formation/absence of nuclear TPT1 foci in primary fibroblasts265 versus cancer cell
lines267 needs to be considered. Although most action of DNA repair signaling is restricted to
the nucleus, nuclear translocation or foci formation per se is not a sufficient criterion to draw
conclusions on functions of this protein in ATM signaling and/or RS. Cytoplasmic proteins like
HERC2 are also strong regulators of the DDR. But more importantly, two pulldown
approaches identified many different potential TPT1 interactors, although the same cell lines
were used (HeLa)266,267. Therefore, not only cell-type specific but also environmental effects
need to be taken into consideration when comparing functions of TPT1 in cellular systems.
In summary, various lines of evidence have been presented in this thesis, from which one
can conclude that TPT1, an important biomarker for different cancers, may have subtle
effects on the course of DNA double strand break repair but does not considerably affect
ATM signaling.
5.2 Exome sequencing as tool to identify the genetic background of RS
Cancer is considered to be among the most complex of all human diseases581 and also
radiotherapy-induced changes in tissues during cancer treatment are of very complex nature
(see sections 2.3–2.4). In this work, 19 RS cancer patients were analyzed of which 16 had
previously been graded at least with RTOG 3 in either acute or late effects or even both. One
exception were three chemoradiosensitive patients, which are considered separately here,
because it is not known whether the observed side-effects might have solely been
attributable to the chemotherapy treatment and information on RTOG classification is not
entirely available.

123
Up to 2009, already about 60 studies have been published which addressed the relationship
between sequence variations and risk of radiotoxicity, which partly lacked reproducibility
due to several reasons439. The majority of studies was performed with breast cancer
patients, followed by prostate cancer patients, and clinical endpoints (whether analyzing
early or late responses) were variable. Clearly most studies involved genes of DNA repair
pathways, followed by ROS scavenging and fibrosis/endothelial cell damage, but inability of
reproducing these data was very prevalent439.
It is known that extreme radiosensitivity can be genetically determined, as many
connections between mutations in certain genes and radiosensitivity have been observed,
the most prominent example being ataxia-telangiectasia (as summarized in subsection
2.3.5). Therefore, it was tempting to investigate whether normal tissue reactions in patients
with no known radiotoxicity syndromes can be assigned to mutations in certain genes, too.
Exome sequencing had successfully identified new Mendelian disease genes in up to 60 % of
published disease gene identification projects in the last years478. Is is especially of great
profit for identification of rare monogenic diseases with a well-phenotyped patient and
family member cohort, which allows conclusion on inheritability. However, clinical
radiosensitivity is possibly not a monogenetic disease and no material from family members
of patients was available in this study. With this approach, some candidate genes were
identified that are mutated in more than one patient, see Supplementary table S-4. Partly
not considered were mutations, which were identical in more than two patients, as they
were suggested to be false positives, given in Supplementary table S-5. Mutations, that
affected the same region of the gene, however, were chosen for validation sequencing.
Genes, that were additionally found mutated in one of the two controls, were not analyzed
further (CD44, CRIPAK, FAT1, GPRIN1, KIR3DL1, KRTAP5-5, LOC283710, LRTOMT, SCN9A).
5.2.1 Annotation by GeneCards reveals strong inter-individual variability in RS
patients
As there was no gene identified, that occurred with mutations in the majority of patients at
once, a global approach was undertaken to analyze the genetic background of the disease in
order to identify pathways, which might be enriched and possibly not visible at first glance.
Firstly, genes were annotated by using the GeneCards database (subsection 3.3.8.1), which
can be used to collect data on the biomedical information about genes, proteins, and
pathways/diseases520-522.
For assignment of the genes to a certain category, including molecular pathways or diseases,
the KEGG530 and Biocarta531-grouping was used as orientation, as both systems represent
well established bioinformatic tools for categorizing cellular processes. The category “skin diseases” was included, as acute side-effects prevalently affect the skin of the RS
patients374,517-519.
Annotation using the GeneCards database revealed strong inter-individual variability
between RS patient groups, and also between the patients within each group. Possible
reasons for these differences could be that, although patients were grouped, only the 11
breast cancer patients constitute a collection, which is potentially large enough to perform
comparisons between patients. Even though they all suffered from BC, the manifestation of
their RS (and most likely also their tumors) was different. As summarized in Table 22,
patients with RTOG grade 3 at acute, late and also both time points of side-effect occurrence

124
were present within the largest group of RS BC patients. Also, the type of side-effect and
localization in the body was different, and ranged from skin fibrosis to breast edema and
lung complications. This strong variability between RS patients is a well-known problem,
which is most likely one of the reasons why so many preceding studies did not converge, as
RS itself is a heterogenous implication and also a rare event.
Table 22 Clinical data on RS BC patients showing variability of side-effect manifestation
Sample Irradiated area Side-effect in
organ/tissue
Acute tissue
reaction RTOG
grade
Late tissue
reaction RTOG
grade
HA210 Breast Skin 3 1
HA211 Breast Skin 3 1
HA212 Breast Skin 3 2
HA213 Thoracic wall Skin 3 Expired
HA214 Thoracic wall Skin, lung 1, 3 –, 3
HA215 Thoracic wall Skin, subcut.
tissue, lung
2, –, 3 2, 2, 2
MC1 Breast Breast edema
and fribosis
2 3
MC2 Breast Breast edema
and fribosis
1 3
MC3 Thoracic wall,
internal
mammary &
supraclav. nodes
Breast edema,
lung, skin
2, 0, 2 0, 2, 3
MC7 Breast Breast edema,
lung, skin
2, 0, 2 3, 0, 2
MC10 Breast Breast edema,
lung, skin
- 3
The pathway analyses included all 315 mutations (also from the two BC controls MC4 and
MC6) that were successfully validated through Sanger sequencing. For 22 mutations, the
validation procedure was not successful due to technical problems, for example poly-A
regions, C/G-rich regions, or highly repetitive sequences. These mutations were nevertheless
included into the final gene list, as no proof of false-positive hits by exome sequencing could
be furnished.
The categories “Cancer”, “DNA repair” and “Immune System” were of particular interest
based on the background of previous studies, as well as on the observation that RS patients
often suffer from immunological side-effects (see subsection 2.3.3). It was investigated
whether there were differences in the representation of these categories between the three
RS patient cohorts. As no significant differences between groups were observed, and all RS
patients seemed to associate somehow to these clusters, these categories were considered
priority for further investigations.
5.2.2 Mutations in Cancer and DNA repair genes correlate with individual RS
As the GeneCards annotation did not show a category or pathway that is highly represented
in RS patients, the Ingenuity Pathway Analysis was accessed. This program is equipped with a
considerable database, which was established by a large group of scientists utilizing

125
published information on gene functions, canonical pathways, diseases and many more.
Furthermore, it is able to draw conclusions about signifance levels of overlap between the
analysis dataset and a reference dataset, which in this thesis was chosen to be the Ingenuity
Knowledge Base (see subsections 3.3.1 and 3.3.8.2). Also, the possibility, that categories for
GeneCards annotation might not have been chosen in the appropriate way to find out
enrichments of impaired gene functions in RS patients, was considered.
Core analyses with the three patient groups in separate analyses as well as one combined
analysis was performed and showed strong association with cancer. Furthermore, “DNA replication, recombination and repair” was one of the top networks by considering the complete RS patient gene list. Interestingly, IPA upstream analysis identified SMARCA4 as
upstream regulator of a certain number of genes in RS patients that were not previously
associated to DNA repair, however, all related to the “Carcinoma” category in IPA.
SMARCA4 itself is implicated in cancer and binds BRCA1541,542,582 and by using IPA upstream
network pathdesigner, it was proposed to regulate certain already known cancer-associated
genes such as MICB583-587, MICA
588, KCNQ3,583,589-592, MUC20
584,588,593, ZNF141592,
TNFRSF10A594,595, STIM1
596,597, TNFRSF9598
, SPHK1599, NUSAP1
583,584,592,600-602. Some of these
genes are also implicated in immune system , for example MICA603, MICB
604, STIM1605,
SPHK1606, TNFRSF9
607-610, TNFRSF10A
607. However, it needs to be stated at this point that
MICA and MICB are highly polymorphic, similar to the HLA-cluster603.
For example the genes of the TNF (tumor necrosis factor) superfamily members TNFRSF9
and TNFRSF10A are possible candidates for promotion of RS. TNFRSF9 may have a role in
activation-induced cell death611, has been described as potential clinical target for cancer
and autoimmune disease612-614 and interacts with IRAK2615, which was also found mutated in
another RS patient (HA195, squamous cell carcinoma of external ear). Furthermore,
evidence for an association between TNFRSF9 and MICA (which was found mutated in
patients MC3 and the chemoradiosensitive prostate cancer patient HA224) exists, as they
share association with TNF616-618, that can cause upregulation of MICA619. Even stronger
evidence for a role in RS exists for TNFRSF10A, as another TRAIL (TNF-Related Apoptosis
Inducing Ligand) family member TNFRSF10 has recently been identified to predict radiation-
induced acute and subacute dermatitis550. Furthermore, the two TRAIL family members are
known to interact, and TNFRSF10A has been shown to control sensitivity to TRAIL-induced
apoptosis, and also its interaction with TP53 is published620. It has been identified in the RS
BC patient HA213 in the course of this project. TNFRSF10A as well as TNFRSF9 should be
considered in further functional studies, although they do not belong to the DNA damage
response group of proteins to current knowledge. Furthermore, all of these genes were
identified as part of the “Skin lesion”, and partially overlapping “Death of epithelial cells”
implication by IPA: SMARCA4591 621-623, MUC20584, TNFRSF10A624,595 TNFRSF9625, KCNQ3591,
NUSAP1584, STIM1626 MICB584,586, MICA627 SPHK1 via SMARCA4621,591, ZNF141 via ER628). The
hypothesis, that – at least some – causes of acute reactions could be (partially) due to
defective wound healing for instance. However, it needs to be remembered that not all
adverse effects focus on skin reactions, as some patients also suffer from inflictions of lungs
or hormone system (subsection 2.3.3 and Supplementary table S-1).
The above described genes might all play a role in one pathway, which is regulated by
SMARCA4 that could itself be related to RS. If this hypothesis is true, then it would not be
surprising that findings in individual RS patients are so different from each other. Each

126
patient could show impairment in only one of the steps, which might be different in each
individual patient but results in comparable RS. It would be interesting to investigate
SMARCA4 itself, but also its targets, with regard to the type and time point of manifestation
of side-effects.
As “Cancer” was identified to be highly associated with radiosensitivity patients, and an
association between DNA repair as well as cancer with RS is known, “Cancer”, Immune
System” and “DNA repair” furthermore seemed interesting candidates for RS
biomarkers/prediction. In order to test whether cancer is a feature of RS or possibly
introduces bias into the RS dataset due to redundancy, comparative analyses with BC
patients without RS were performed.
5.2.3 Association of cancer and DNA damage response genes in RS patients by IPA
The IPA analysis revealed strong association of the “Cancer” category within the “Diseases
and Disorders” section in all three BC groups. Strikingly, the category “Hereditary Disorder”, which is mainly attributed to genes of breast cancer susceptibility like BRCA2 and NBN (p-
value of overlap calculated by Fisher’s Exact Test in IPA: 2.65E-04) in Fam BC patients, was
only identified as subgroup in these familial patients and not in RS or non-familial BC
patients. However, the “Hereditary Disorder” category also came up in RS patients with
other cancers (hypopharynx, squamous epithelium carcinoma of left tonsil, keratinizing
squamous cell carcinoma of the base of the tongue, squamous cell carcinoma of external
ear, rectum carcinoma), involving genes attributed to hereditary prostate cancer such as
EHBP1 and MSR1 (p-value of overlap calculated by Fisher’s Exact Test in IPA: 4.42E-04).
MSR1 is additionally known to relate to esophageal adenocarcinoma/Barretts Syndrome629.
From these findings one can conclude that IPA is able to identify the genetic predisposition
underlying certain diseases and also estimate the strength of this association, as it is well
known that BRCA2 and NBN strongly account for Fam BC (subsection 2.2.1). As it utilizes
published data that has been manually attributed to certain pathways or diseases, IPA can
only identify connections between genes with known functions and/or pathway annotations.
As RS is not known as a “disease” or “disorder” so far, and is also not attributed to a defined pathway to current knowledge, IPA is not able to draw such conclusions per se. As
GeneCards and IPA both rely to a great extent on pubmed entries, it is not surprising that
both tools identified enrichments in DNA repair genes but it is noteworthy that such
mutations accumulated in the RS BC group in comparison to the BC group.
However, not all RS patients have shown mutations in genes related to DNA repair. Exome
sequencing of breast cancer patients HA214 and HA215 did not reveal mutations in DNA
repair genes, which could be due to the following reasons. Firstly, although being a very
sophisticated method, some alterations in exons might be missed by the technique due to
reduced coverage in regions with low or high GC content. However, Illumina platforms (one
of which was applied here) have been shown to perform comparatively well630. Another
possible reason for missing variants could be mistakes in the reference genome, to which the
exome sequencing results are aligned. It has already been suggested almost ten years ago,
that rare or erroneous alleles may have been incorporated into the NCBI human genome
sequence631, but the human reference sequence has been continuously improved since
then632, and an increasing number of common SNPs is consecutively identified. It needs to
be further considered that exome sequencing only covers variations in coding regions of the
genome which constitute only ~5 % of the entire genetic material. Regulatory regions or loci

127
without known function could exert an effect on radiotoxicity reactions, but are missed by
the exome sequencing approach and would only be covered by time consuming and cost-
intensive whole genome sequencing.
Additionally, exome data from the two control groups (BC and Fam BC) was not subjected to
validation sequencing to the same extent as RS data, as data was retrieved from other
ongoing projects in our lab. It might therefore still include a higher number of false-positives
compared to respective RS data. However, this obviously did not dilute the observed
enrichment of DNA repair gene mutations in the RS BC group and therefore might be
unlikely to mask other associations.
Occurrence of mutations solely in DNA repair genes has not been shown as prerequisite for
RS, also not in this study. Therefore, it is plausible, that mutations in genes associated
primarily with cancer or immune system (or also other functions) could account for RS in the
patients HA214 and HA215. HA214 revealed a truncating mutation in the cancer-associated
genes DNMT3A (DNA (Cytosine-5-)-Methyltransferase 3 Alpha)633 and CDKL2 (Cyclin-
Dependent Kinase-Like 2 (CDC2-Related Kinase))634. The latter was in addition identified in
HA173 and HA225, with the identical variant rs56229013, which could indicate a common
SNP. Furthermore, the immune system-related genes KIR3DL1 (killer cell immunoglobulin-
like receptor, three domains, long cytoplasmic tail, 1)635 and the apoptosis-associated gene
MAPK10 (mitogen-activated protein kinase 10)636 that is also associated with sensitivity to
chemotherapy637 were identified in patient HA214. Cell death pathways have been
connected to RS before (see section 2.3, precisely subsections 2.3.3 and 2.3.6) and recent
findings support this theory638. Interestingly, also a variety of cell cycle-associated genes
such as AURKC (Aurora Kinase C)639, or CRNKL1 (Crooked Neck Pre-MRNA Intronic
Factor 1)640, were identified which could potentially relate to RS641. Furthermore, the skin-
disease-related gene PSORS1C1 (Psoriasis Susceptibility 1 Candidate 1)642 was identified in
this patient. Therefore, there is evidence for a number of possible candidates that might
cause the RS reactions in patient HA214. It is furthermore conceivable that although
mutations in DNA repair genes are present in certain RS patients, additional mutations in
other functional categories like cancer, immune system, cell cycle, apoptosis or skin diseases
additionally support development of adverse effects.
In contrast to that, patient HA215 only showed a fraction of mutations in the categories
described above as solely NLRC3 (NLR Family, CARD Domain Containing 3), which is involved
in immunological processes643 and the cancer-related STIM1 (Stromal Interaction
Molecule 1)596,597 gene were identified. STIM1, however, might be part of a pathway
addressed by SMARCA4, which could itself play a role in RS apart from engagement in the
DNA damage response (see subsection 5.2.1).
5.2.4 Cancer and DNA damage response genes associate to clinical RS and not
solely to cancer malady
The GeneCards annotation of truncating mutations in genes identified by exome sequencing
in all three RS groups showed a high number of DNA repair genes in the RS group and by
comparison with RS BC patients, BC patients without RS seemed to encompass less
mutations in DNA repair genes. Interestingly, this difference was only significant by
comparison of RS BC with BC patients, not with Fam BC patients. Fam BC is characterized by
a strong genetic predisposition for the disease and a certain number of breast cancer

128
susceptibility genes has already been characterized (see subsection 2.2.1). A possible
association between RS and Fam BC is not known, and some Fam BC genes have already
been investigated in the RS context. For example BRCA2, of which a truncating mutation was
identified in one patient of our Fam BC group with no known RS background. This gene has
been described as likely not relevant in the radiotoxicity context by several previous
studies644-648. In contrast to that, Foray et al. found that heterozygous BRCA1 and BRCA2
mutations caused enhanced cellular radiosensitivity with an impaired proliferative capacity
after irradiation317. Similarly, the heterozygosity for NBN mutation c.657del5 in one of the
FamBC patients has been associated with increased chromosomal radiosensitivity in a
blinded study649 although the heterozygotes are not known to exhibit clinical
radiosensitivity, by contrast with homozygous NBS patients.
However, little evidence of connections between RS and familial cancer does not imply that
underlying pathways, which might be responsible for RS as well as Fam BC, could share some
components. One candidate pathway would be the FA pathway of crosslink-repair proteins
that accounts for hereditary cancer susceptibility, which has already been known for more
than a decade650. Especially FANCO/RAD51C, which has been identified as mutated in the
patient MC3 by exome sequencing with likely functional consequences (Supplementary
figure S-25), has already been linked to breast and ovarian cancer susceptibility (subsection
1.4.1). It is likely responsible for the additional development of ovarian cancer in the MC3
patient as secondary malignancy. The FANCL variant, which was identified in patient MC7,
however, was not associated with BC susceptibility in another project of our group551 and is
predicted to cause an alternative carboxy-terminus rather than actually truncating the
protein (Supplementary figure S-24). For association investigations between mutated genes
in the MC7 patient with its clinical and cellular RS, the ABL1 mutation should be considered,
which has been predicted to have a strong effect on the size of the protein and was also
shown to result in visibly reduced ABL1 levels in TERT-immortalized cells of this patient,
Supplementary figure S-24.
In contrast to GeneCards and IPA, the Reactome browser tool could only relate a small
number of genes to DNA repair and cancer in all categories. It missed some clearly DNA
damage-associated genes like ANKLE1651, EXO5 (subsection 1.1.1.1) HELB (subsection 1.1.2),
NEK4 (section 1.1.2), NPAT (section 1.3), RBBP6 (section 1.2) and RINT1 (subsection 1.3.2).
As this results in covering only approximately 65 % of the genes found by GeneCards in this
category, it is plausible that no statistically significant differences could be detected. On the
contrary, Reactome identified a large number of genes related to the immune system
category. This number was comparable to the other two tools (GeneCards= 47, IPA= 43,
Reactome= 35), but no significant differences between the three groups were found,
consistent with GeneCards and IPA analyses. From these findings, one could conclude that
Reactome is probably not suitable for addressing the DDR pathway or cancer-related genes,
but is well suitable for annotation of immunological genes. This is surprising, however, as
Reactome is known to be capable of discovering unexpected functional relationships
regarding somatic mutation catalogues from tumor cells492. However, the focus seems to lie
more on DNA replication and not on DNA repair, and superpathways such as “signaling” and
“immune function” could be given priority. Nevertheless, at this point, it needs to be
emphasized that 33 patients in total constitute three comparatively small groups, rendering
it difficult to draw conclusions in concern of statistical power. Furthermore, the comparison
groups included primarily selected cancer patients with unusual course and aspects of their


130
At first glance, it is difficult to draw any conclusions whether genes found in RS patients and
non RS patients participate solely in exclusive pathways. “ATM signaling”, “Repair of DNA” and “DNA damage response of cells” are not the only repair pathways identified by IPA.
“Mismatch repair” and “Hereditary BC signaling” strongly relate to BC or Fam BC patients,
respectively. For BC patients, MSH6 is clearly associated with mismatch repair, whereas
FIGNL1 (as its name as RAD51-binding protein already suggests), is involved in HR (section
1.1.2). Both genes were classified to the “Repair of DNA” category by IPA, together with the two FA-related genes RAD51C and FANCL in RS BC patients, which are involved in ICL repair
and HR (section 1.4). ABL1, however, (besides FANCL) was additionally classified as belonging
to the “DNA damage response of cells” pathway by IPA, which seems to include more central
and superior DNA repair mechanisms. However, it is difficult to judge which indications were
followed by IPA professionals, who established these two categories, as only high-level
categories (in this case “DNA Replication, Recombination and Repair”) are described in more
detail535. Furthermore – like most classifications performed by humans – also these
definitions of and assignments to functional classes are of subjective nature. Similarly, the
choice of categories for GeneCards annotation was, albeit orientated on KEGG and Biocarta
pathways, personal choice.
Genes (or gene products) that met requirements for classification in the sub-pathway “DNA damage response of cells” (as will be indicated by response) are classified according to the
following references (overview given in Supplementary table S-10). NBN and ABL1 were
potentially chosen as part of “DNA damage response of cells” as they were found to be “linked to the cellular DNA damage response”653 and the “apoptotic response to DNA
damage”654, respectively. FANCL was likely assigned to the “DNA damage response of cells” as it belongs to the FA-proteins that “fall into a common pathway that is activated in response to DNA damage”655,656. HELB “accumulates on chromatin in response to genotoxic
stress”89,657 and “HERC2 is a DNA damage-dependent target modified in response to
DSBs”185,658. NEK4 was likely classified as part of the DNA damage response as it “regulates entry into replicative senescence and the response to DNA damage in human fibroblasts”72.
RBBP6 is associated with MCM10106, which is “suggested to function in DNA repair in
association with TOPBP1”106 that is moreover “associated with DNA replication, checkpoint
response and homologous recombination”659. NBN, ABL1 and FANCL were additionally found
in the category “Repair of DNA” (which is indicated by repair). “Human NBN is involved in
double-stranded DNA break repair of DNA”653, is "necessary for non-homologous end joining
double-stranded DNA break repair of deoxyribonucleic acid"660 and was described as being
"necessary for repair of DNA"661. Furthermore, previous findings indicated that "mutant NBN
protein decreases double-stranded DNA break repair"662. ABL1 is involved in mismatch
repair as “cells are unable to carry out mismatch repair in which the nuclear enzyme c-Abl
tyrosine kinase is not activated”215, FANCL is involved in repair of DNA as "the Fanconi
anemia pathway is required for the efficient repair of damaged DNA"655 and RAD51C is
involved in repair of DNA as “human RAD51C participates in branch migration and Holliday
junction resolution and thus is important for processing HR intermediates late in the DNA
repair process”663. TDG was likely characterized as part of the “repair of DNA” subpathway
as it “excises T from G-T mispairs and is thought to initiate base excision repair664, is a “repair
enzyme”665 and belongs to a “family of enzymes that use a base-flipping mechanism to
locate damaged bases in dsDNA and initiate base replacement through the DNA base-
excision repair pathway37 666 667.
131
BRCA2 is a well known DNA repair gene, supported by the findings that “reduced ligation
during DNA base excision repair was supported by BRCA2 mutant cells”668, that “DNA repair
defects in BRCA2-deficient cells”669 occur, that “a lack of functional BRCA1 and BRCA2 led to
defective repair of DNA double-strand breaks317, and that “BRCA2 plays a role in replication-
coupled DNA interstrand crosslink repair”670.
NEIL1, which was identified in both RS BC and Fam BC patients was classified by IPA as
belonging to the “repair of DNA” subpathway according to the following evidence: “NEIL1 protein initiates oxidized DNA base excision repair”671, “Cockayne syndrome group B protein stimulates repair of formamidopyrimidines by NEIL1 DNA glycosylase”672, “NEIL1 Is Required for Forming BERosome Repair Complex“673 and “the human Werner syndrome protein
stimulates repair of oxidative DNA base damage by the DNA glycosylase NEIL1”674.
Interestingly, Greve et al.449 have previously identified asscociations of HIST1H4H and
FAM186B with RS, whereas the related genes HIST1H4B and FAM186A were found in Fam
BC and BC patients in the course of this thesis. Therefore, it needs to be stressed that apart
from NEIL1, which was identified in RS and non RS patients in parallel, a certain amount of
genes might be connected with cancer as well as RS manifestation.
DNA repair genes from the BC patients included FIGNL1, which “is required for efficient homologous recombination repair”76 and the mismatch repair gene MSH6, which “regulates human mismatch repair”675, forms “specific mispair-binding complexes”676, and is “the major mismatch recognition factor”677. Furthermore, ”loss of MSH6 is associated with an icrease in
frameshift mutagenesis”678 and “MSH3 and MSH6 are partially redundant for mismatch
repair”679.
The “response” to DNA damage as classified by IPA could also possibly include checkpoint
control or cell death signaling apart from DNA repair. However, this is not further specified
by IPA (personal communication with Dr. Jasmin Droege, Senior Scientist, Advanced
Genomics Support). Merging the findings in the subcategory with identified diseases and
disorders revealed that – apart from the well known role of ABL1 in cell death (see section
1.3) – also prominent roles of RAD51C680, FANCL681, RBBP6682 and NEK4683 in cell death
mechanisms were found. However, IPA also identified functions for BRCA2684-687 in cell
death, which was not attributed to the “DNA damage response of cells” subpathway. Thus,
these findings render it unlikely that cell death function alone as additional feature qualifies
for assignment of genes into this category.
Furthermore, especially the results in the DNA repair subcategory need to be interpreted
with caution, as filtering the genes for DNA repair according to GeneCards annotation
introduces bias to the dataset, because the focus is on certain characteristics. The number of
molecules that are submitted to an analysis (i. e. the analysis-ready molecules) will influence
the p-value of overlap. In this case, IPA recommends using the original dataset as reference
data (personal communication with Dr. Jasmin Droege, Senior Scientist, Advanced Genomics
Support). However, these analyses most likely failed due to the limited number of total
molecules in the exome sequencing results. Also, it should be considered, that the Ingenuity
Knowledge Base expands and changes continuously, as new findings get published and
previous findings might have been corrected or revised. Therefore, it would be reasonable to
perform the analysis again before deciding on focus molecules for further studies.

132
Interestingly, linear regression of numbers of genes in each subpathway with according p-
values showed that – although the two parameters correlate well – also the strength of
association and not only bare number of involved genes seems to influence the p-value. An
equal number of genes was identified in “cancer of cells” as well as “repair of DNA” for Fam BC and BC patients and Fam BC and RS BC patients, respectively. In both cases, the Fam BC
group showed the stronger association with p-values of overlap, indicating that it
encompasses genes, that have a larger impact on these functions. Still, RS BC could be
interpreted as possessing the strongest relationship to DNA repair, as the additional and
exclusive category “DNA damage response of cells” shows prominent results in both number of genes and p-value. The resulting behaviour, namely the proportionality to the number of
genes, is expected, and indicates that the applied analysis has been performed in a
reasonable way by considering both quality and quantity findings.
Moreover, repair of DNA naturally also occurs as response to damage, so other than
qualifying the actual mode of action of the proteins in either “responding” to DNA damage or “repairing” it, it is probably more appropriate to refer to the frequency of occurrence of
mutations in DNA repair genes, meaning the quantity. Considerably, the cell is likely to be
more vulnerable to damage if mutations in DNA repair genes occur in more than one gene,
which is for example the case for MC3 and MC7 patients, as will be discussed in the
following section.
As this thesis originally focused on the approach to identify biomarkers of RS, these could be
of functional nature and not necessarily related to single variants easily identified through
PCR amplification of the respective amplicons in DNA extracted from blood lymphocytes
prior to radiation treatment. Also, biomarkers correlating to cellular RS were – and still are –
of great interest, as they relate to the actual functional background of the adverse effects
and could cover more than one potentially lethal variant impact. Therefore, ATM signaling
and cellular colony formation was investigated in immortalized cellular models of RS BC
patient fibroblasts MC1, MC3 and MC7.
5.3 Functional studies in cells from radiosensitive patients
Cells of patients MC1, MC3 and MC7 were immortalized with TERT, in order to firstly address
ex vivo radiosensitivity reactions in the context of cellular RS assays and secondly, investigate
possible associations between mutated genes and their translation to functional impact. By
this procedure, permanent fibroblast cell lines were successfully generated for functional
studies, and MC3 and MC7 retained their TERT expression over time. Although they had
initially taken up and showed immunoreactivity of TERT, MC1 cells had lost TERT again
during subsequent passaging. Their hygromycin B resistance, however, was still given, as
cells grew well under continuous selection pressure. These cells might have silenced the
TERT gene while still maintaining expression of the hygromycin B resistance gene.
Otherwise, they would not have been capable of withstanding the selection.
A possible explanation for the silencing could be a spontaneous immortalization of these
cells independent of TERT, which can occur in cells that are subjected to extended passaging,
and is a rare – but still well documented – event688. Obviously, spontaneous immortalization
can also induce TERT expression689, but this is not the only possible underlying mechanism
and the molecular implications are not entirely understood. In contrast to immortalization
with viral oncogenes (SV40 large T, and in this work also EBV), spontaneously immortalized

133
cells often retain normal checkpoint behaviour and a diploid karyotype689. In order to initiate
immortalization, the M1 (mortality stage 1: senescence) and M2 (mortality stage 2: crisis)
cell cycle checkpoint gates need to be abrogated689,690. M1 can be circumvented by the SV40
large T antigen (which applies to the ADP cells) that targets the p53 DNA damage pathway
and is bypassed by viral oncogenes. For completion of immortalization, however, also the
second gate M2 must be skipped. This enables to avoid crisis, which normally causes
shortening of telomeres until initiation of cell death689.
RAD51 foci counting in primary and in TERT immortalized fibroblasts of the same patients
revealed prominent differences in the background levels of RAD51 foci (subsection 4.4.3.).
Moreover, these levels tended to be higher in all immortalized cells including the SV40
immortalized ADPs and the TERT immortalized control BJ5TA. These findings may indicate a
considerable influence of both immortalization procedures on DNA damage repair pathways,
which occurs independent of irradiation. These results need to be considered when
extrapolating/tracing back effects in immortalized cells to their biological origins and stress
that a direct side-by-side comparison of primary and immortalized cells is not always
possible. Therefore, these findings might be important when considering immortalized cells
rather than primary cells for functional radiobiology assays.
Regarding the history of characterization of cellular RS, many published findings indicate that
EBV (also a viral oncogene) immortalization of lymphocytes of patients might introduce bias
into experimental results due to their increase of genomic instability (section 2.4). Although
some studies stressed the great potential of patient-derived LCLs as cellular RS tools,
cumulating evidence suggests that primary fibroblasts of those patients should be prioritized
(section 2.4). Previous studies in lymphocytes, LCLs and also primary fibroblasts of some of
the patients analyzed in this work, have addressed chromosomal RS by means of
acentric/dicentric fragments and reciprocal translocations and also colony surival and
received reasonable correlations between clinical RS, chromosomal RS and cellular RS,
however, differences between patients were also prominent460 507.
Interestingly, not only RS BC patients, but also some fibroblasts derived from healthy
individuals showed elevated cellular RS425,507. Assuming clinical RS correlates with cellular RS
(which was not always the case in the literature), this indicates that RS reactions might also
affect humans without known cancer malady. In these assays, the known clinical RS
correlated well with cellular RS. Therefore, it should be taken into consideration that healthy
individuals might also carry mutations which predispose to RS independent of cancer. In
future studies, these healthy individuals should also be further analyzed by exome
sequencing to investigate, whether they share some of the mutations of RS patients which
have not (yet) been assigned to the cancer phenotype, which could include skin reactions for
instance.
5.3.1 Early ATM signaling is functional in TERT immortalized fibroblasts of RS BC
patients
As well described in the literature, ATM signaling can be predictive of clinical as well as
cellular RS to a great extent (see section 2.4). Therefore, in this thesis the hypothesis was
followed that clinical RS may be correlated to dysfunction of ATM signaling in RS patients
(Figure 11).

134
Addressing the two well-established DNA damage markers and ATM targets CHEK2 and KAP1
is a sophisticated technique to investigate the specific phosphorylation ability of ATM in cells
with a mutational background in DNA DSB repair. Phosphorylated forms of the two proteins
could be easily detected in all three cultures at a level similar to the control, however, subtle
differences were observed regarding cells from patients MC1 and MC7 (subsection 4.4.1).
MC7 TERT showed a significant elevation of p-CHEK2 levels between 0 Gy and 1.5 Gy,
indicating rapid signaling between ATM and CHEK2 already after lower IR doses in these
cells. MC1 TERT showed a comparatively lower immunoreactivity of p-CHEK2 at 6 Gy, which
was borderline significant compared to BJ5TA and might indicate a slight delay in
phosphorylation activity of ATM at high IR doses. Interestingly, significantly lower
immunoreactivity of p-KAP1 after 1.5 Gy compared to BJ5TA was observed in MC7 TERT
cells, while it was considerably higher in MC1 TERT compared to MC7 TERT. These findings
might indicate differential effects of ATM on the two target proteins in RS cells. MC1 cells
carry a truncating mutation in HERC2, which is normally targeted by ATM upon DNA
damage691,692. Protein formation and most likely also function is predicted to be completely
abrogated regarding one of the two alleles in these cells. This might have a prominent effect
on repair capacity in the context of coordinating the ubiquitin-dependent assembly of DNA
repair factors at lesions693. Interestingly, KAP1 phosphorylation is comparatively strong after
1.5 Gy, whereas CHEK2-phosphorylation after 6 Gy is diminished. Interaction partners of
HERC2 are currently poorly defined and therefore, these effects are difficult to explain.
However, binding between HERC2 and MDC1 (mediator of DNA damage checkpoint protein
1) has been described694, and MDC1 is known to interact with CHEK2695. Therefore, an
influence of reduced HERC2 activity could lead to a secondary inhibitory effect on CHEK2 –
and therefore possibly also on – p-CHEK2 levels.
In the patient MC7, truncating or splice site mutations in ABL1 (which was shown to reduce
protein levels by approximately 50 %), NPAT and FANCL were detected. However, both the
NPAT and FANCL variants were predicted to be likely silent or leaky and might confer only
subtle effects regarding protein functions. ABL1 is a central component of the DNA damage
response (see subsection 1.3.2). The differential effects of ATM on CHEK2 (resulting in
elevated levels), and on KAP1 (resulting in lower levels) after IR with 1.5 Gy could result from
potential interactions of these proteins, which are currently not known. ABL1 is an important
kinase in the DDR and targets plenty of downstream molecules, similarly to ATM and CHEK2.
ATM205,206,527,528 and CHEK2696,697 both are known to phosphorylate KAP1 on specific serine
residues. ABL1 could share this target, which would be phosphorylated to a lower extent if
ABL1 levels are depleted. However, this would insist that ABL1 also specifically
phosphorylates KAP1 at Ser824, which is unlikely, as it is a known target of ATM528. The
ATM-CHEK2 signaling possibily compensates this effect, which would result in
simultaneously higher CHEK2-levels. However, it needs to be emphazised at this point that
these changes are poorly significant and also were not detected at 6 Gy with the given
antibodies. Therefore, these results need to be confirmed in extended follow-up
experiments to clarify an effect of HERC2 and ABL1 mutations on ATM-dependent
phosphorylation of KAP1 and CHEK2.
135
5.3.2 Repair up to 48 h after IR is efficient in TERT immortalized fibroblasts of RS
BC patients
The assessment of DNA DSB repair foci kinetics is one of the most widely used assays to
determine functionality of the DNA damage response and also radiosensitivity reactions. The
clinical application of ionizing radiation both affects diagnostic as well as curative exposure.
The radiation dose during, for example mammography or diagnostic CT (computed
tomography), is considerably lower compared to RT (radiotherapy), however, it still affects
chromosomal RS. A previous study in our lab addressing foci kinetics after IR revealed that
especially repeated CT scans correlate with elevated levels of γH2AX and 53BP1 foci in cells
of different origin326. This memory effect was especially pronounced in the TNBC cell lines
HCC1937 and HCC1395, which are known to possess mutations in BRCA1 and TP53; and
BRCA1, CDKN2A, PTEN (Phosphatase and tensin homolog), TP53487 488 and NBN
419,
respectively. Interestingly, cells mutated in BRCA1 (HCC1937) and ATM (HA56) showed
stronger elevation of foci levels 30 min after IR compared to HCC1395. The latter cell line,
however, displayed persistence of elevated foci numbers after longer time periods,
indicating a cumulative effect of mutations in DNA repair genes exceeding early time points
of repair. These results already showed differential effects of IR on chromosomal/cellular RS
responses in radiosensitive breast cancer cell lines and furthermore emphazised that
individual RS might not only apply to conventional radiotherapy, but should also be
considered in the context of low-IR diagnostic procedures.
As formation and resolution of repair foci has been repeatedly applied for characterization
of RS (subsection 2.4 and determination of RS in TNBC326) and early ATM signaling 30 min
after IR revealed only subtle differences between RS cells and the control, numbers of γH2AX
and 53BP1 foci were counted at timepoints extending to 48 h after IR. Although foci
formation and resolution was significant in all tested cell lines, subtle differences between
the RS cultures were monitored (subsection 4.4.2). Interestingly, MC3 TERT and MC7 TERT
cells showed evidence for similar patterns of repair, peaking at 1 h and completion at 24 h,
which is the usual course of these events449. Foci numbers in these two cultures returned
even faster to the zero level after 24 h than the control BJ5TA, though this difference was
not significant. By comparison, MC1 TERT cells showed extended detection of foci after
repair is usually completed, resulting in a non significant drop from 6 h to 24 h. Only in these
cells, a delay in foci resolution could be observed, which results in significant decline of foci
numbers between 24 and 48 h after radiation exposure. This delay may be attributed to the
HERC2 mutation in these cells, as H2AX is known to be the main target of this ligase692. By
interaction with the E3 ubiquitin ligase RNF8 (Ring Finger Protein 8), it coordinates the
ubiquitin-dependent assembly of DNA repair factors on the damaged sites693. As it
furthermore regulates the retention of repair proteins at these sites, it is plausible that a
reduced action of HERC2 in MC1 cells is the cause for the delay in γH2AX foci resolution.
Furthermore, also 53BP1 resolution is likely affected, as 53BP1 is attracted by ubiquitylated
histones691. Moreover, the HERC2-MDC1 interaction694, which could be impaired in the
patient MC1, might execute a secondary effect on the function of MDC1 as platform for
recruitment of other DDR proteins and as a cornerstone for phosphorylation and
ubiquitylation crosstalk in DNA repair694. The direct binding of MDC1 to γH2AX698 and
support of its signal amplification ensures maintainance of damage signaling166 in order to
recruit and retain mediator proteins like 53BP1 at IR-induced foci, which could be impaired
by HERC2 disability. Comparative IPA analyses furthermore did not identify a strong

136
association of genes from RS BC patients with “formation of nuclear foci” (subsection 4.2.3.2), which supports the findings in our TERT immortalized RS BC cells.
5.3.3 Mutational background of MC3 and MC7 correlates with RAD51 foci
formation defects
Some of the classical features of FA are missing in patients with FANCO, FANCR and FANCS
mutations, which accounts for the designation of these genes as FA-like genes. As FA genes
play a crucial role in repair of ICLs, disability could assault genomic integrity through DNA
breakage and chromosomal rearrangements (section 1.4). As patients MC3 and MC7 both
showed mutations in FA/FA-like genes, RAD51/FANCR foci formation was investigated in
MC3 (RAD51C/FANCO mutation) and MC7 (FANCL mutation, also ABL1 mutation) primary
cells in a previous side-project507 prior to immortalization of these cells. The studies on
primary cells indicated a significant impairment of RAD51 foci formation in MC3 cells
compared to ADP as control. RAD51 foci formation in MC7 was also reduced, but not
significantly. To check whether the TERT immortalization could influence DNA repair capacity
of these cultures, this experiment was repeated with the immortalized cell lines. As MC1 had
shown significant impairment in γH2AX and 53BP1 foci resolution after IR, it was included in
the experiment. BJ5TA was used as TERT-immortalized control.
Interestingly, results in primary cells could not be inferred to the respective immortalized
cultures. Whereas only the primary MC3 exhibited poor increase in foci-positive cells after
IR, none of the RS TERT cells showed a significant increment in foci-positive cells after IR
either. The failure of MC3 and MC7 (TERT) cells to form RAD51 foci after IR could be related
to their respective mutations in RAD51C and FANCL or ABL1. ATM kinase function appeared
normal in these cells (also TP53-phosphorylation in MC3147 507 699), consistent with the roles
of RAD51C, FANCL and ABL1 in homologous recombination repair downstream of ATM.
Although RAD51C has been reported to be involved in the crucial step of checkpoint
activation by mediating the phosphorylation of CHEK2 by ATM700, no significant changes in
p-CHEK2 levels were observed in MC3 TERT cells (subsection 4.4.1). Either RAD51C does not
interact with ATM signaling in these cells, or the haploinsufficiency can be compensated for.
It has been reported that RAD51C localizes to the sites of DNA damage before and
independent of RAD51, supporting a role of RAD51C in the early stages of homologous
recombination repair700.
FANCL might exert less influence on IR-induced RAD51 foci as it, firstly, is not confirmed to
impact protein function222 in patient MC7. Secondly, it is a protein of the FA core complex at
the edge of crosslink repair upstream of HR and thus may execute less influence on ionizing
radiation sensitivity. ABL1 on the contrary is phosphorylated by ATM (subsection 1.3.2) and
known to phosphorylate RAD51137 218 besides ATM after IR. Thus, it likely promotes
activation of the RAD51 complex and inhibits the DNA strand exchange activity of the RAD51
recombinase (subsection 1.3.2), supporting the implication of ABL1 in the RS context581.
Interestingly, severe radiosensitivity of this FANCO mutation carrier was previously
confirmed by both chromosomal and cellular radiosensitivity assays507. Lymphocytes of this
patient showed an increased number of extra acentric fragments as well as dicentric
chromosomes, which indicates defective DNA DSB repair425.
137
On the contrary, lymphocytes from the patient MC7 have shown normal levels of dicentric
chromosomes and extra acentric fragments per cell, but colony survival has not previously
been investigated with primary MC7 cells. In addition, RAD51C dysfunction induces the
formation of centrosome aberrations700, an important cause of chromosomal instability,
which might lead to the high yield of chromosomal aberrations in MC3 primary lymphocytes.
It needs to be emphasized that results of RAD51 foci formation, although they were different
in primary compared to immortalized cells, indicate impaired RAD51 foci formation in both
patients. Influence of FA-proteins on RAD51 foci formation has initially been described for
FANCD1/BRCA2-deficient cells650. These findings have been extended to FANCO-deficiency
as FA-like disorder, as deletion of RAD51C correlated with RAD51 foci formation
impairment701,76,702,703.
Therefore, results in MC3 primary cells are consistent with the literature. It would be
interesting to include BRCA2-deficient cells into the analysis and check whether the effects
are similar to further characterize the RS in the MC3 patient.
MC1 TERT cells showed a strong elevation of RAD51 foci positive cells after IR and
comparably low basal RAD51 levels. This could be due to the following reasons. Firstly, MC1
cells are known to be mutated in the ubiquitin ligase HERC2, which coordinates the
ubiquitin-dependent assembly of DNA repair factors by interplay with the E3 ubiquitin ligase
RNF8693. RNF8 is known to enhance polymerization of RAD51 at IR-induced DSB sites and
showed correlation between cellular survival and RAD51 foci development at DSB sites704. As
a direct influence of HERC2 on RAD51 foci formation is currently not known, it is possible
that RNF8 is still capable of signal transduction leading to RAD51 foci formation without
prior interaction with HERC2. Importantly, HERC2 targets BRCA1 for degradation705 and loss
of HERC2 has been associated with higher DNA repair capacity706, perhaps explaining the
better RAD51 damage response in MC1. Secondly, MC1 TERT cells showed loss of TERT
immunoreactivity after extended culture, although it was confirmed to have been
introduced into these cells during immortalization. Therefore, in this point, it should be
considered that MC1 TERT cells have undergone spontaneous immortalization (section 5.3).
This could account for the low basal RAD51 level of these cells in comparison to the other
immortalized cultures.
Further experiments are required to directly compare the effect of the immortalization
protocols as one would need to transform the same primary cells for a side-by-side
comparison. Additionally, the evaluation of RAD51 foci is difficult, as the RAD51 antibody
additionally stains the cytoplasmic forms of RAD51 other than the restricted staining of
chromatin bound γH2AX and 53BP1. A preextraction according to the TPT1 protocol could be
reasonable (subsection 3.2.9). Moreover, countings in primary and immortalized cells would
need to be assessed in parallel by the same observer, as judgement of foci formation can be
subjective. As primary cell material is always limited, this might be difficult to realize in a
number of experiments which would meet criteria for extended statistical analysis.
Alternatively, ADP cells, which are the only readily available cells used in the first
experiment, should also be included in experiments with TERT cells, to provide the possibility
of investigation of possible variations between counting techniques. A possible effect of the
immortalization on the basic level of especially MC3 cells could be the strong impact of
138
introduction of additional threat by TERT, which might have added on to the high genomic
instability in primary cells of these patients.
Both γH2AX and RAD51 foci are two key markers of DNA damage signaling and HR repair
processes, however, addressing some different substrates and partially functional
redundancy of the two pathways is known. As ATM signaling appeared comparatively
normal in all RS BC TERT cells up to 48 h after IR, it was tempting to investigate whether RS-
related effects might manifest at later time points following repair signaling. Therefore,
colony survival as the gold standard of radiooncology assays508 was established for the three
cultures in comparison to the wildtype cells BJ5TA. As the mutation in ABL1 could lead to
apoptosis induction in MC7 cells (subsection 1.3.2), this cellular RS endpoint might be
especially interesting to draw the connection to clinical RS of this patient.
5.3.4 Cellular RS is associated with clinical RS according to colony survival
Chromosomal radiosensitivity has been evaluated as a method to predict radiation side-
effects707, however, previous studies conducted with lymphocytes of patients MC1, MC3 and
MC7 only assigned strongly defective DNA repair to MC3 and partially to MC1, not to
MC7507,425. Therefore one can conclude that chromosomal radiosensitivity as assessed by
chromosomal aberrations cannot solely account for predicting radiation side-effects
involving cell death of the irradiated area. Furthermore, as described in subsections 5.3.1-
5.3.3, recognition and repair of DSBs seems to be comparatively normal in all cultures,
despite subtle differences between patient cells and effects on repair proteins. Therefore, it
was hypothesized that RS may manifest at later timepoints after IR through cellular survival
mechanisms.
To assess long-term effects of IR in the RS cultures, colony survival was established and
commonly used doses ranging from 2 to 8 Gy508 were applied to the cells, and representative
data after 4 Gy as intermediate dose is described in more detail in this thesis. Commonly,
cells need to be seeded in higher densities when preparing for IR, as it can be assumed that –
even in the wildtype control – a great number of cells will not survive the treatment. Cell
death is difficult to assess and the read-out of the CSA assay only provides information about
the surviving fraction. Therefore it cannot distinguish between different forms of cell death
(subsection 2.3.6).
It was very difficult to receive colonies from all the RS cultures, especially MC3 TERT and
MC7 TERT, while the control cells grew well under all tested conditions (subsection 4.4.4).
Whereas MC1 and MC7 cells grew colonies in the unirradiated condition, MC3 TERT cells
preferentially assembled at the edges of the flasks, probably to avoid stress by gaseous
exchange or to use the walls of the plastic for additional support of adhesion and close
assembly for effective communication. Following IR, only MC1 TERT cells showed colony
formation comparable to the control, but still drastically reduced considering the higher cell
number which was required for initial plating. MC3 TERT cells only showed a focus point of
closely assembled cells, which could barely be considered a colony. Strikingly, MC7 TERT
cells failed colony formation in all tested applications.
Possible reasons for the differences in colony forming capacity between the RS cultures
could be their diverse genetic background. As already discussed in the preceding
139
subsections, cells of patient MC1 could have acquired RS due to their mutation in HERC2.
This ubiquitin ligase vigorously interacts with the ubiquitin ligase RNF8 (subsections 5.3.1-
5.3.3), which catalyzes nonproteolytic ubiquitylation of H2A-type histones via crosstalk with
RNF168708,658. The latter has been associated with RIDDLE (radiosensitivity,
immunodeficiency, dysmorphic features and learning difficulties) syndrome that shares
some characteristics with other RS syndromes (e. g. A-T). These are for example mental
retardation, microcephaly and other neurological defects709,710. The potentially reduced
activity of HERC2 could not only account for prolonged foci retention after IR, but also impair
action of RNF8, that could lead to RS-associated complications, as has been described for
RIDDLE syndrome710. However, the functional relationship between these proteins may not
be sufficiently impaired in the MC1 cells, as failure of 53BP1 foci formation, which is
associated with RIDDLE syndrome, was not observed in these HERC2 heterozygous cells.
Variations in fibroblast radiosensitivity can be due to several reasons. Not only differences in
DNA repair processes, but also changes in cellular differentiation processes or TGFB1 levels
can relate to RS460. Recent evidence suggests an influence of the age of breast cancer
patients with clinical RS on cellular RS by means of chromosome aberrations711. This aspect
should be considered, as patients MC3 and MC7 were 9 years older than patient MC1 at the
time of sampling (MC1= 51, MC3= 60, MC7= 60). Unfortunately, TERT immortalization was
not successful in non-RS BC patients MC4 and MC6, which constitute matched pairs to
patients MC1 and MC3 and would provide a good assay system to investigate age-related
effects on colony survival other than induced by ionizing radiation. However, colony survival
data of MC4 primary cells is available and showed normal IR response, whereas survival
capacity declined dramatically in MC1 and even stronger in MC3 primary fibroblasts460,
which is consistent with data obtained in the TERT immortalized cultures. Primary data on
MC7 are not available, however, MC10 primary fibroblasts (NEIL1 mutation) also showed
extreme cellular RS, although the patient was comparably young (35 years, data provided by
Dr. Margret Rave-Fränk, Göttingen). This indicates that the age of the patients alone cannot
account for occurrence or severity of RS reactions. Interestingly, subgroups between the
patients within one group were also identified by Auer et al.711, pointing to the inter-
individual variations observed in a magnitude of preceding studies (section 2.4), which is
consistent with the differences in mutational background as well as cellular RS observed
between RS patients in the presented thesis.
As also shown in this work, the manifestation of cellular RS can be diverse across clinical
features of RS and impact on DNA damage repair cannot easily be predicted simply by
characterization of mutations in repair genes. Known RS syndromes such as A-T or RAD50-
deficiency already cause defects in initial recognition of lesions, whereas this is not the case
for the cells of RS patients used in this work. It would be interesting to consider comparative
analyses of colony survival between patient cells with for example RAD50 deficiency and the
RS BC cells, in order to investigate whether the effects on long-term survival are similar.
Furthermore, it is already known that DNA repair genes implicated in clinical RS can take
over functions which are not directly associated with repair. For example, this has been
shown in our lab for RAD50, as it exerts a major influence on progression through mitosis712.
It would be interesting to investigate whether the genes identified in this study also impact
cell cycle control apart from DNA repair. This might correlate with failure of survival at later
time points after IR, as cells usually undergo one or two cell cycles before IR-induced cell
death is initiated713.
140
A more detailed inspection of the cellular morphology of the cells – especially after IR –
revealed extreme changes in size and a formation of granules in especially MC3 and MC7
patient cells. These were also visible in MC1 and BJ5TA, however, not as prominent. As the
fraction of morphologically altered cells seemed to increase after IR and resembled a
phenotype similar to senescence, β-galactosidase staining after IR was performed
(subsections 4.4.5 and 5.3.5).
5.3.5 RS may manifest downstream of DSB recognition through cellular senescence
Due to the failure of colony formation in two of the three RS cell lines, significant differences
between the three cultures in colony forming capacity cannot be finally determined at the
present state. In general it should be noted that all the three cell cultures were extremely
radiosensitive compared to the control cells as at least twice as many cells needed to be
seeded to ensure survival, although size and growth characteristics in routine cell culture
were similar.
Inspired by the changing morphology of irradiated RS cells, cellular senescence was
examined. The relationship between DNA repair and senescence, and also between IR-
induced senescence and RS, is already known (subsections 2.3.3 and 2.3.6). In a pilot
experiment in which assignment of senescent cells was reviewed by a second observer,
especially MC3 TERT and MC7 TERT cells showed a prominent decline in the proportion of
non-senescent cells after IR (subsection 4.4.5). Cells, which displayed altered morphological
appearance but were not positive for β-galactosidase staining, were excluded from the
counting. This disqualifier resulted in less non-senescent cell numbers, as cells were not
solely assessed for the development of blue color but additionally for their physiological
appearance. These cells could possibly represent pre-senescent or quiescent cells as
senescence-associated-β-galactosidase is not expressed by these sub-populations510. Pre-
senescence has been described by similar morphological criteria as observed here in non-β-
galactosidase-positive cells714 and further discrimination of pre-senescence and senescence
by for example increased resistance of senescent cells to apoptotic death715 could
characterize the two populations. Distinction between quiescent and proliferative cells could
be achieved by application of the quiescence marker Chromatin Assembly Factor-1716.
As MC3 TERT cells showed the stongest decline in the fraction of non-senescent cells already
24 h after IR compared to BJ5TA, and also TERT-levels in the two cell lines were similar
(subsections 4.3.1 and 4.4.5), this cell line was included in further experiments. In order to
exclude effects of replicative-senescence due to TERT-loss and a possible influence of the
different growth medium used for MC3 TERT cells, several tests were performed in side-by-
side comparisons. As none of the observed changes were significant, cells were grown in
their normal culture medium throughout the whole assay, supplemented with hygromycin B.
Differences between MC3 TERT and BJ5TA were significant at 48 h, 7 d and 9 d after IR.
Fitting of the data with a one phase model showed that both cultures followed exponential
decay according to the residual number of non-senescent cells, similar to radioactive decay,
as expected for the considered system. A higher quality of the fit was obtained for MC3 TERT
and could indicate that senescence is initiated after a certain threshold of DNA damage is
reached, which might spread to neighbouring cells by release of senescence-stimulating
factors into the medium, which again triggers senescence. As senescence is a permanent
state, cells cannot retain proliferative potential to counteract these changes (subsection
2.3.6). At this point, however, it needs to be considered that the fit is based on only four

141
timepoints (24 h, 48 h, 7 d and 9 d) which might not suffice to draw conclusions at the
present stage. A possible explanation for the comparatively strong decline of non-senescent
cells in BJ5TA could be the starting colony formation as early as 7 d after IR. Due to colony
development, which is missing in MC3 TERT, BJ5TA grew in close assembly and confluency
conditions were no longer entirely similar to non-colony-forming MC3 TERT cells. Therefore,
evaluation of timepoints longer than 7–9 d would not result in comparable conditions
between the two cultures and additional functional endpoints should range from 72 h to 6 d
after IR.
Recently, a data-mining approach aiming at classification of DNA repair genes according to
their involvement in aging/senescence has been made, which also utilized IPA717. Freitas et
al.717 have associated NEIL1 to aging pathways, which was identified in one RS BC (MC10)
and one Fam BC patient in the presented work. Furthermore, NEK4 has been related to
senescence72, which was found mutated in an RS BC patient. Moreover, RAD51C718 and
FANCL719 were related to senescence/aging pathways and also ABL1 was classified as
senescence-associated by utilizing the GenAge database720. Some genes documented by this
database included findings that were related to variants identified in this thesis. For example
KCNA3 (Potassium Voltage-Gated Channel Subfamily A Member 3) was assigned to be
involved in aging processes, which is related to the SMARCA4 target KCNQ3 (subsection
4.2.3.1). Also some of the major players in DNA repair were part of this database like ATM,
CHEK2, H2AX, and interestingly also BRCA1721. Besides being attributed to aging, BRCA1 has
also been suggested to be implicated in RS317. A recent publication by Kural et al.555
addressed identification of aging-related pathways and found AURKB (Aurora kinase B),
which is an important paralog of AURKC (Aurora kinase C) that was identified in an RS BC
patient in this study. Comparisons of hits from Kural et al.555 with genes identified in BC, Fam
BC and the complete collection of RS patients identified no overlap in the BC group but,
interestingly, BRCA2 in Fam BC and AKR1C2 (Aldo-Keto Reductase Family 1 Member C2) and
DHCR7 (7-Dehydrocholesterol Reductase) in the RS cohort were found, respectively. The
latter genes have not yet been investigated in more detail due to lack of assignment to any
of the initially prioritized categories. Furthermore, a mutation in PTTG2 (Pituitary Tumor-
Transforming 2) was identified in two RS patients which is related to cell adhesion and
apoptosis in a TP53-, and TP21-dependent manner113. Both proteins are known to be
involved in RS 722 and also senescence723,724.
Interestingly, Kural et al. also showed evidence for association of certain metabolism
pathways with aging, for example fatty acid metabolism555. Furthermore, the parkin-
associated pathway, aurora B cell cycle regulation and the caspase network were identified.
By comparison with IPA core analyses results of RS patients, some similarities between these
pathways and IPA hits were present. For example, IPA identified “lipid metabolism” (p-value
of overlap range: 4.32E-02-5.84E-04) and “L-Dopa degradation” (p-value of overlap: 3.9E-02),
however, the latter was also enriched in BC patients. It might be interesting to analyze IPA
results further in regard to overlap of genes or pathways/functions with aging-related
molecules. Also, more aging databases could be searched for genes, which were found to
possess truncating mutations in RS patients.
Furthermore, studies on the association between telomere length and radiosensitivity have
been conducted, which seems to be a promising biomarker for identification of
subpopulations at risk of developing late side-effects725,726. However, the IPA category

142
“elongation of telomeres” was not found significantly enriched in RS BC patients but
occurred in BC and Fam BC patients, which suggests that the association between telomere
length and RS is probably of minor relevance in these patients.
The principle goal of radiotherapy is depriving cancer cells of their cell division potential,
therefore it is plausible that senescence apart from apoptosis is a possible outcome of
radiation therapy for both cancer and normal tissues. Regarding results of the IPA analysis,
neither cell death nor senescence were part of the priority findings according to p-value of
overlap. Most cell death pathways after IR are a consequence of mitotic catastrophe and
hence not directly triggered by the initial cellular response to IR713. Furthermore, senescence
has also been described as form of cell death which occurs after accumulation of DNA
damage (subsection 2.3.6). Therefore, it is plausible that not only genes that are exclusively
or directly related to the aging process could account for IR-induced senescence in RS BC
patients, but loss of replicative potential might occur as a secondary consequence of high
amounts of unrepaired damage. Figure 37 shows a possible course of events starting with
radiotherapy treatment and terminating in IR-induced side-effects like immunological
complications. From the data provided in this thesis, one could assume that accumulation of
DNA damage due to impaired repair mechanisms in RS patients triggers initation of
senescence, which activates the senescence-associated secretory phenotype (SASP) resulting
in secretion of cytokines and other proinflammatory substances into the irradiated tissues
which finally manifests in adverse reactions.
Additionally, vice versa, defects in immunological functions, which might be inherent in RS
patients, can result in failure of senescent cell-clearance from the body727. Therefore, both
mechanisms might promote the maintainance of the other. Comparative IPA analyses have
shown that especially inflicted genes of RS BC patients were strongly associated with cancer-
related or cancer-promoting mechanisms (subsection 4.2.3.2). In support of this hypothesis,
several lines of evidence indicate the tumor-promoting effect of senescence728-730 and also
underline accumulating DNA damage as cause for the SASP related to inflammation731,732.
Figure 37 Proposed model of RS as consequence of DNA repair defects and senescence
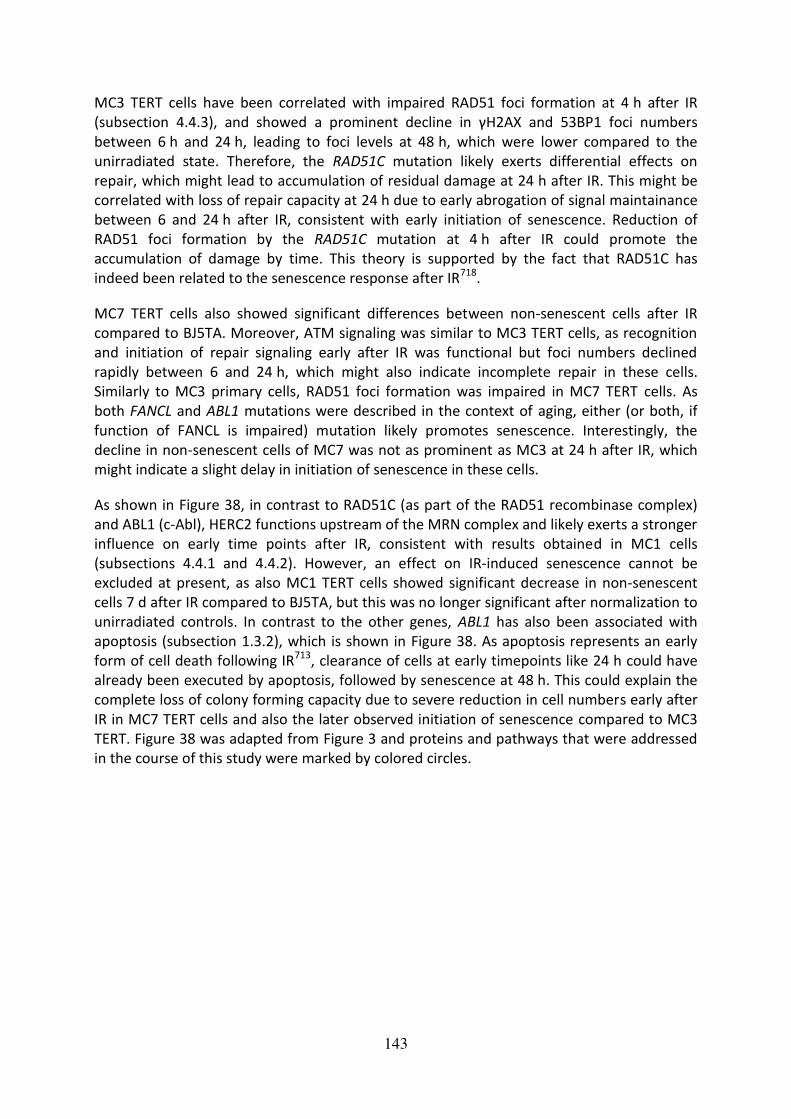
143
MC3 TERT cells have been correlated with impaired RAD51 foci formation at 4 h after IR
(subsection 4.4.3), and showed a prominent decline in γH2AX and 53BP1 foci numbers
between 6 h and 24 h, leading to foci levels at 48 h, which were lower compared to the
unirradiated state. Therefore, the RAD51C mutation likely exerts differential effects on
repair, which might lead to accumulation of residual damage at 24 h after IR. This might be
correlated with loss of repair capacity at 24 h due to early abrogation of signal maintainance
between 6 and 24 h after IR, consistent with early initiation of senescence. Reduction of
RAD51 foci formation by the RAD51C mutation at 4 h after IR could promote the
accumulation of damage by time. This theory is supported by the fact that RAD51C has
indeed been related to the senescence response after IR718.
MC7 TERT cells also showed significant differences between non-senescent cells after IR
compared to BJ5TA. Moreover, ATM signaling was similar to MC3 TERT cells, as recognition
and initiation of repair signaling early after IR was functional but foci numbers declined
rapidly between 6 and 24 h, which might also indicate incomplete repair in these cells.
Similarly to MC3 primary cells, RAD51 foci formation was impaired in MC7 TERT cells. As
both FANCL and ABL1 mutations were described in the context of aging, either (or both, if
function of FANCL is impaired) mutation likely promotes senescence. Interestingly, the
decline in non-senescent cells of MC7 was not as prominent as MC3 at 24 h after IR, which
might indicate a slight delay in initiation of senescence in these cells.
As shown in Figure 38, in contrast to RAD51C (as part of the RAD51 recombinase complex)
and ABL1 (c-Abl), HERC2 functions upstream of the MRN complex and likely exerts a stronger
influence on early time points after IR, consistent with results obtained in MC1 cells
(subsections 4.4.1 and 4.4.2). However, an effect on IR-induced senescence cannot be
excluded at present, as also MC1 TERT cells showed significant decrease in non-senescent
cells 7 d after IR compared to BJ5TA, but this was no longer significant after normalization to
unirradiated controls. In contrast to the other genes, ABL1 has also been associated with
apoptosis (subsection 1.3.2), which is shown in Figure 38. As apoptosis represents an early
form of cell death following IR713, clearance of cells at early timepoints like 24 h could have
already been executed by apoptosis, followed by senescence at 48 h. This could explain the
complete loss of colony forming capacity due to severe reduction in cell numbers early after
IR in MC7 TERT cells and also the later observed initiation of senescence compared to MC3
TERT. Figure 38 was adapted from Figure 3 and proteins and pathways that were addressed
in the course of this study were marked by colored circles.
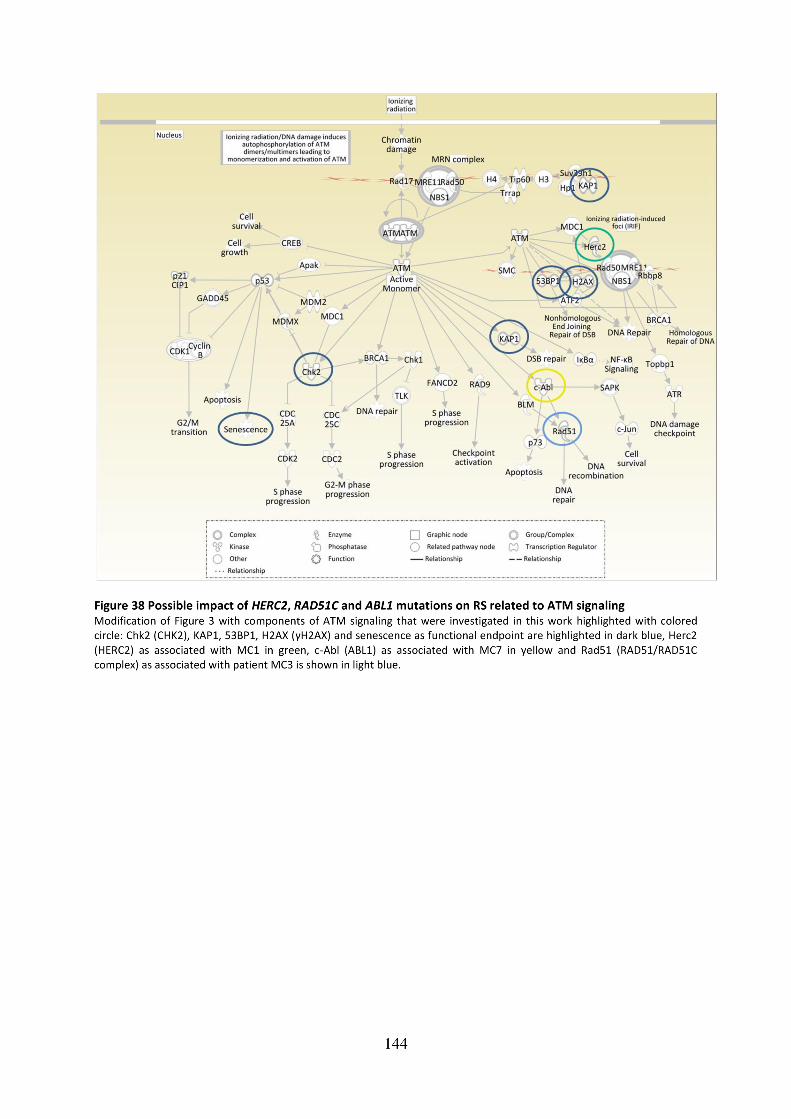

145
5.4 Impact of the DNA damage response on clinical and cellular RS
This thesis focused on characterization of radiosensitivity on the genetic, functional and
cellular level. In the course of the candidate gene approach, TPT1 was silenced and its effect
on ATM signaling was investigated. As no statistically significant changes following
downregulation of TPT1 were observed, it was no longer considered as possible biomarker
of RS. However, as cellular RS assays with patient cells have shown, future studies could
address the question whether TPT1 might also exert late effects on ionizing radiation
sensitivity that might not be observed at early time points after IR. Not only cell-type but
also environmental influences of TPT1 functions are likely to occur as TPT1 is subject to
intense regulation with underlying mechanisms that are incompletely understood (sections
1.5 and 5.1).
It is well known that extreme radiosensitivity can be genetically determined (subsection
2.3.5), therefore it was tempting to investigate whether normal tissue reactions in patients
with no known radiotoxicity syndromes can also be assigned to mutations in certain genes.
Results of exome sequencing showed strong inter-individual differences, consistent with
observed patient-to-patient variabilities across preceding studies that utilized other
approaches (section 2.4). At this point it needs to be emphasized that RS itself is a
heterogenous disease and therefore, it is not surprising that this approach did not result in
monogenetic findings. Furthermore, the patient cohort was also heterogenous, as samples
were collected at different hospitals over a time period of two decades and naturally, type
and clinical stage of cancers, age of the patients and in particular characteristics of side-
effects were different.
It should be remembered, that most of the mutations identified by exome sequencing are of
heterozygous nature. Therefore, expected influences on ATM signaling or other cellular
functions might be compensated by the wildtype allele and therefore show reduced
functional impact. Also, IPA only assesses the gene itself, not the effect of the variant. As not
all mutations found by exome sequencing were manually tested for their impact, a
considerable number of functionally silent mutations could be among the list.
Due to the lack of reproducibility of data gathered during the last decades, reasons why
normal tissue responses could not be reliably related to individual radiosensitivity over such
a long time period were already proposed over a decade ago431. Dikomey et al. criticized that
patients, who differed too much from each other in clinical aspects, were compared side-by-
side431. This was also pointed out by Andreassen et al., who addressed the problem that
previous studies often claimed to have presented a true association of candidate genes with
RS, while the probability of detecting false positives was extremely high429. Often SNPs are
located in non-coding areas without any obvious function733. This possibility is narrowed by
exome sequencing as only coding areas or splice sites (as the only intronic regions) are
addressed, however, also resulting in potential skipping of important regulatory regions.
Furthermore, Dikomey et al. proposed that according to a mathematical model, all irradiated
patients are at risk of developing severe side-effects correlating with time that has passed
after IR431. Therefore, future studies should focus on collection of patient material at defined
time points also years after IR and comparisons should only be made between patients with
similar clinical background. Nevertheless, unknown epigenetic factors could still influence RS
reactions in a way which is barely predictable, especially if timepoints expand over years.

146
Exome sequencing was performed in three consecutive steps and data was not received for
all patients at once. Prioritization of mutations for validation sequencing was not only
performed according to GeneCards and IPA annotation results, but also depending on
double or even triple hits in different patients. Therefore, genes that did not necessarily
meet criteria for prioritization due to their functions were included in the validation
sequencing project simply because they seemed to be prominent among RS patients. Vice
versa, mutations, which had occurred in more than one patient in the exact same position,
but were subjected to validation as the data was not available in parallel, eventually were
confirmed. These findings should be considered for choosing genes that would not normally
meet requirements for validation sequencing. Future studies could concentrate on
functional characterization of these loci.

147
6 Conclusions and perspectives As a common theme in the course of this thesis, the relationship between ATM signaling and
adverse effects of radiation therapy was investigated. By using a candidate gene approach
that addressed TPT1 on the one hand, and mutational effects of genes in RS patients located
at different mechanistic levels in the DDR on the other hand, ATM signaling was assessed at
the functional and cellular level. The findings of this thesis showed that early ATM signaling
might not necessarily relate to RS. On the contrary, effects on cellular survival and
senescence exceeding timepoints of 48 h after IR were visible in RS cultures and could be a
late consequence of unrepaired DNA damage. Literature findings suggest that fibroblast
radiation sensitivity does not correlate with acute, but rather correlates with late effects461,
which was observed in these particular cells and applies to the manifestation of side-effects
in the majority of RS patients in the presented study.
Using annotation with GeneCards and IPA, ATM signaling was shown to be enriched in RS
individuals with BC compared to non-RS BC and Fam BC patients and also cancer proneness
related to the RS phenotype. The hypothesis that RS patients suffer from residual unrepaired
DNA lesions that in turn trigger senescence, which consecutively promotes immunological
responses, was found to be plausible in cells of patient MC3. These cells were furthermore
shown to be impaired in RAD51 foci formation likely due to their RAD51C mutation, which is
consistent with unrepaired damage and high yields of dicentric chromosomes and extra
acentric fragments per cell (as shown on blood lymphocytes in previous studies425,507).
Formation of dicentric chromosomes prevents accurate cell division which can lead to
senescence or death of cells after one or two attempts to proceed through mitoses failed.
MC7 cells, which also showed RAD51 foci impairment likely due to their ABL1 mutation,
could have died of apoptosis as very early IR-consequence, which is consistent with low
yields of dicentrics in lymphocytes of this patient425,507. In both cell lines, failure of colony
survival correlated with cell death after IR. MC1 cells on the contrary might escape from
definite IR-induced cell death as the HERC2 mutation likely affects delay of early recognition
of DSBs and retention of repair foci, but is comparable to the control in RAD51 foci and
senescence assays. Perhaps consistent with these observations, side-effects in patients MC3
and MC7 were not localized to the site of direct IR exposure, as was observed for the MC1
patient, but spread to other regions of the body (Supplementary table S-1). This could be
due to the secretion of inflammatory cytokines by senescent cells arising from damaged
tissue in MC3 and MC7 which might cause overall tissue dysfunction456. It would be
interesting to assess whether senescence-associated soluble factors could induce cell cycle
arrest in control cells and render them senescent, for example by transferring medium from
irradiated MC3 TERT cells to BJ5TA. Furthermore, IR-induced senescence should be validated
by a second protocol, for example by assessment of the senescence markers TP21, TP16 or
senescence-associated heterochromatic foci formation among other methods734.
Figure 39A shows a simplified mechanism that could reflect the relationship between DNA
damage as initially caused by IR-induced ROS, and the cell fate depending on residual
damage residing in the DNA of the particular cell. The final descision whether the cell
survives or dies is well known to be correlated with the amount of damage that has
accumulated in this cell. In the control cells BJ5TA (left-hand side of Figure 39A), which are
radioresistant, primary damage by ROS can be repaired and the cell survives and continues
to proliferate. In RS patients MC1, MC3 and MC7 (right-hand side of Figure 39A), primary

148
damage by ROS remains unrepaired or partially unrepaired (MC1), which leads to secondary
damage through initiation of senescence. This in turn might spread to further cells in its
vicinity and transform neighbouring fibroblasts into proinflammatory cells via SASP735. Also,
the similarity between the exponential decay in non-senescent cells in MC3 TERT with the
one-phase model of radioactive decay could indicate a secondary effect by senescence itself
that adds on to the primary cause of damage. The RS BC cells could be correlated to the
amount of remaining damage and likelihood of undergoing cell death by observations in
cellular RS assays in the following order: MC1 < MC3 < MC7.
Figure 39B summarizes the results of this thesis according to the initially addressed question
which stage of the cellular damage response adverse effects in RS patients can likely be
assigned to (see also Figure 10). Further experiments are needed to characterize the IR-
induced cell death mechanisms and differences between the three cultures in more detail.
Figure 39 Possible mechanism of DNA repair defects leading to radiosensitivity
Follow-up studies should clarify the exact nature and possibly synergistic effects of more
than one cell death mechanism initiated by IR in cells of RS patients. Cell death through
apoptosis, senescence, autophagy or necrosis can occur early, or late as consequence of
mitotic catastrophe, following IR (Figure 40). Both chronological events can eventually lead
to failure of clonogenic survival.

149
Figure 40 Early and late forms of cell death leading to failure of clonogenic survival after irradiation Schematic representation of cellular mechanisms following DNA damage, as depicted by black arrow on the left-hand side.
After attempting mitosis, cells can die early by apoptosis, senescence, autophagy or necrosis (subsection 2.3.6). Some cells
might complete mitosis and are able to form colonies in the colonogenic survival assay (right-hand side). However, cells
might also fail subsequent mitoses, undergo mitotic catastrophe and eventually die by apoptosis, senescence, autophagy or
necrosis. Cells undergone mitotic catastrophe/crisis are indicated by enlargement in size and multinucleation,
granularization or shrinkage, depending on the form of initiated cell death (subsection 2.3.6). Source: Wouters BJ. Cell
death after irradiation - how, when and why cells die. Basic Clinical Radiobiology. 4th ed. UK: Hodder Arnold 2009.
If IR-induced senescence actually accounts for the adverse effects in a majority of patients,
antioxidants aiming at suppressing these effects in normal tissues could be applied during
RT, which has already been established in clinical routine456. As effects of senescence in ex
vivo cell culture models were also prominent at 7 d after IR, this treatment would need to be
extended for at least one week after IR exposure. Vice versa, if IR-impact on side-effects due
to senescence also correlates with clearance of cells in the tumor tissue (given that the
genetic background of the tumor has not deviated much from its tissue of origin due to
somatic mutations), senescence-promoting substances could be directly applied into the
tumor to enhance radiosensitization.
Although survival and senescence after IR could only be investigated in three RS BC cell lines
in this thesis, several lines of evidence from exome sequencing results point to the fact that
RS BC patients either exhibit a comparatively high number of DNA repair gene mutations or
mutations in immune system or aging-related genes. Furthermore, genes associated with
cell death like death-inducing ligant variants TNFRSF9 and TNFRSF10A were identified in two
RS patients. The TNF family has been recurrently described in the literature as associated
with RS (see section 2.4), for example fibrogenic cytokines like TGFB1, and could also
account for inappropriate immunological responses in RS patients. Both genes were part of
an upstream regulatory network administered by SMARCA4, which itself has been implicated
in cancer and is known to interact with BRCA1541,542,582. Future studies should address the
effect of TNFRSF9 and TNFRSF10A for RS in these patients, which has been already described
for association of TNFRSF10/TRAIL with radation-induced acute and subacute dermatitis550.
The skin-associated adverse effects in patient HA213 may thus be attributable to its
mutation in TNFRSF10A. Moreover, mutations in genes directly correlated with skin lesions
should also be considered as possible enhancers of adverse effects, especially in patients
with exclusively cutaneous reactions.

150
Altogether, it can be concluded that the genetic signature of RS is as individual and multi-
facetted as the RS phenotype itself. As no clearly RS associated markers were identified in
the course of this work and the common RS biomarkers like CHEK2, KAP1, γH2AX and 53BP1
seemed of minor impact in representing clinical RS in this study, pre-testing of patients could
be performed by colony survival assays with primary skin fibroblasts.
Interestingly, comparative IPA analyses identified some consensus between Fam BC and RS
BC patients. For example, NEIL1 was mutated in both patients at different positions.
Furthermore, both maladies show high correlation of gene mutations in both DNA repair and
also cancer-related genes (subsection 4.2.3.2.). It would be interesting to investigate
whether genetically determined BC predisposition correlates with risk of late IR effects. DNA
from patients with a strong familial history of BC who additionally suffered from side-effects,
should also be subjected to exome sequencing and results compared to RS BC and Fam BC
patients. Limitations, however, could be the low accessibility of biological material from
patients suffering from both complications, as occurrence of Fam BC as well as RS BC are
rare events. At this point it should be considered, that the RS BC patient MC2, who had a
great grandmother also diagnosed with breast cancer (third-degree relative), shows high
association with cancer genes in IPA (subsection 4.2.3.2.). Technically, although not a
prominent familial BC case as affecting a third-degree relative311, this pedigree can also
increase BC risk, however, low736. The MC2 could be counted to a new goup of “Fam RS BC”
but unfortunately, no viable cells were available from this particular patient.
Finally, to provide more insights into the genetic determinant of RS candidate genes, the
breakthrough technique of genome editing by means of CRISPR/Cas9737 may be applied in
two different approaches. Firstly, mutations in candidate genes, for instance HERC2, RAD51C
and ABL1 could be introduced into BJ5TA cells and the mutant cells investigated in cellular
RS assays. Vice versa, these mutations could be compensated by the CRISPR/Cas9-system737,
which could rescue the RS phenotype of these cells. Late IR-effects like senescence and
colony survival should be investigated. TPT1 mutations could be included in the
CRISPR/Cas9737 manipulation of cells in order to analyze late effects of TPT1 impairment on
colony survival potential, which could not be achieved though siRNA silencing over an
extended time period.
Moreover, cells of the two matched pairs MC4 and MC6 should be again subjected to an
immortalization approach with TERT to achieve BC cell culture models for comparison with
RS BC cells, which could be utilized to test the hypothesis established in this thesis.
Furthermore – if available – fibroblasts should be derived from Fam BC patients in parallel.
However, all these approaches might just aim at identifying the genetic background in
selected patients, not providing a more generalized and global association of a pathway with
clinical RS. Therefore, more studies with material of additional RS patients and – if available
– also their family members should be performed. Future studies could aim at identification
of superior pathways similar to the SMARCA4 pathway shown in this thesis, which might be
more reliable when investigated with a larger data set. If RS genes can be successfully
isolated, correction of mutations in RS genes in healthy tissues whilst increasing
radiosensitition solely in the tumor environment by next-generation gene technology could
save healthy tissues and in parallel exploit cell death capacity pathways solely in the tumor.
If patients are screened for mutations in RS susceptibility genes prior to RT, also non-
reactors could benefit from higher dosage meeting individual requirements in line with

151
personalized therapy. Figure 41 summarizes major findings of this thesis and indicates
possible future studies.
Figure 41 Conclusions and suggestions on follow-up studies
152
7 References 1. Helleday T, Eshtad S, Nik-Zainal S. Mechanisms underlying mutational signatures in human
cancers. Nat Rev Genet 2014;15(9):585-98. doi: 10.1038/nrg3729
2. Ciccia A, Elledge SJ. The DNA Damage Response: Making it safe to play with knives.
Molecular cell 2010;40(2):179-204. doi: 10.1016/j.molcel.2010.09.019
3. Zeman MK, Cimprich KA. Causes and Consequences of Replication Stress. Nature cell
biology 2014;16(1):2-9. doi: 10.1038/ncb2897
4. Lieber MR. The Mechanism of Double-Strand DNA Break Repair by the Nonhomologous
DNA End Joining Pathway. Annual review of biochemistry 2010;79:181-211. doi:
10.1146/annurev.biochem.052308.093131
5. Hoeijmakers JH. DNA damage, aging, and cancer. N Engl J Med 2009;361(15):1475-85. doi:
10.1056/NEJMra0804615 [published Online First: 2009/10/09]
6. Zhou B-BS, Elledge SJ. The DNA damage response: putting checkpoints in perspective.
Nature 2000;408(6811):433-39.
7. Burrell RA, McGranahan N, Bartek J, et al. The causes and consequences of genetic
heterogeneity in cancer evolution. Nature 2013;501(7467):338-45. doi:
10.1038/nature12625 [published Online First: 2013/09/21]
8. Rossetto D, Truman AW, Kron SJ, et al. Epigenetic Modifications in Double-Strand Break
DNA Damage Signaling and Repair. Clinical Cancer Research 2010;16(18):4543-52.
doi: 10.1158/1078-0432.ccr-10-0513
9. Weber AM, Ryan AJ. ATM and ATR as therapeutic targets in cancer. Pharmacol Ther
2015;149:124-38. doi: 10.1016/j.pharmthera.2014.12.001 [published Online First:
2014/12/17]
10. Lord CJ, Ashworth A. The DNA damage response and cancer therapy. Nature
2012;481(7381):287-94.
11. Guirouilh-Barbat J, Lambert S, Bertrand P, et al. Is homologous recombination really an
error-free process? Frontiers in Genetics 2014;5(175) doi: 10.3389/fgene.2014.00175
12. Lingaraju GM, Böhm K, Rabl J, et al. The Crossroads of Ubiquitination and DNA Repair: A
Structural Perspective. In: Hanaoka F, Sugasawa K, eds. DNA Replication,
Recombination, and Repair: Molecular Mechanisms and Pathology. Tokyo: Springer
Japan 2016:211-32.
13. Pages V, Fuchs RP. How DNA lesions are turned into mutations within cells? Oncogene
2002;21(58):8957-66. doi: 10.1038/sj.onc.1206006 [published Online First:
2002/12/17]
14. Asagoshi K, Wilson SH. Base-Excision Repair: Role of DNA Polymerase β in Late-Stage
Base Excision Repair. In: Penning TM, ed. Chemical Carcinogenesis. Totowa, NJ:
Humana Press 2011:297-319.
15. Lindahl T, Wood RD. Quality control by DNA repair. Science 1999;286(5446):1897-905.
[published Online First: 1999/12/03]
16. Vaughan P, Lindahl T, Sedgwick B. Induction of the adaptive response of Escherichia coli
to alkylation damage by the environmental mutagen, methyl chloride. Mutat Res
1993;293(3):249-57. [published Online First: 1993/03/01]
17. Sedgwick B. Nitrosated peptides and polyamines as endogenous mutagens in O6-
alkylguanine-DNA alkyltransferase deficient cells. Carcinogenesis 1997;18(8):1561-7.
[published Online First: 1997/08/01]
18. Moore MH, Gulbis JM, Dodson EJ, et al. Crystal structure of a suicidal DNA repair protein:
the Ada O6-methylguanine-DNA methyltransferase from E. coli. EMBO J
1994;13(7):1495-501. [published Online First: 1994/04/01]

153
19. Pieper RO. Cellular Responses to Methylation Damage. In: Nickoloff JA, Hoekstra MF,
eds. DNA Damage and Repair: Volume 2: DNA Repair in Higher Eukaryotes. Totowa,
NJ: Humana Press 1998:33-49.
20. Deans AJ, West SC. DNA interstrand crosslink repair and cancer. Nature reviews Cancer
2011;11(7):467-80. doi: 10.1038/nrc3088
21. Minko IG, Harbut MB, Kozekov ID, et al. Role for DNA polymerase kappa in the
processing of N2-N2-guanine interstrand cross-links. J Biol Chem
2008;283(25):17075-82. doi: 10.1074/jbc.M801238200 [published Online First:
2008/04/25]
22. Raschle M, Knipscheer P, Enoiu M, et al. Mechanism of replication-coupled DNA
interstrand crosslink repair. Cell 2008;134(6):969-80. doi: 10.1016/j.cell.2008.08.030
[published Online First: 2008/09/23]
23. Petermann E, Helleday T. Pathways of mammalian replication fork restart. Nature
reviews Molecular cell biology 2010;11(10):683-7. doi: 10.1038/nrm2974 [published
Online First: 2010/09/16]
24. Rangaswamy S, Pandey A, Mitra S, et al. Pre-Replicative Repair of Oxidized Bases
Maintains Fidelity in Mammalian Genomes: The Cowcatcher Role of NEIL1 DNA
Glycosylase. Genes 2017;8(7):175.
25. Srivastava DK, Vande Berg BJ, Prasad R, et al. Mammalian Abasic Site Base Excision
Repair: Identification of the reaction sequence and rate-determining steps. Journal of
Biological Chemistry 1998;273(33):21203-09. doi: 10.1074/jbc.273.33.21203
26. Hazra TK, Izumi T, Boldogh I, et al. Identification and characterization of a human DNA
glycosylase for repair of modified bases in oxidatively damaged DNA. Proc Natl Acad
Sci U S A 2002;99(6):3523-8. doi: 10.1073/pnas.062053799 [published Online First:
2002/03/21]
27. Gunes S, Agarwal A, Henkel R, et al. Association between promoter methylation of MLH1
and MSH2 and reactive oxygen species in oligozoospermic men—A pilot study.
Andrologia:e12903-n/a. doi: 10.1111/and.12903
28. Iyer RR, Pluciennik A, Burdett V, et al. DNA mismatch repair: functions and mechanisms.
Chemical reviews 2006;106(2):302-23. doi: 10.1021/cr0404794 [published Online
First: 2006/02/09]
29. Kat A, Thilly WG, Fang WH, et al. An alkylation-tolerant, mutator human cell line is
deficient in strand-specific mismatch repair. Proc Natl Acad Sci U S A
1993;90(14):6424-8. [published Online First: 1993/07/15]
30. Modrich P. Strand-specific mismatch repair in mammalian cells. J Biol Chem
1997;272(40):24727-30. [published Online First: 1997/10/06]
31. Hsieh P, Yamane K. DNA mismatch repair: Molecular mechanism, cancer, and ageing.
Mechanisms of ageing and development 2008;129(7-8):391-407. doi:
10.1016/j.mad.2008.02.012
32. Schmutte C, Marinescu RC, Sadoff MM, et al. Human exonuclease I interacts with the
mismatch repair protein hMSH2. Cancer Res 1998;58(20):4537-42. [published Online
First: 1998/10/27]
33. Jiricny J. The multifaceted mismatch-repair system. Nature reviews Molecular cell biology
2006;7(5):335-46.
34. Vo AT, Zhu F, Wu X, et al. hMRE11 deficiency leads to microsatellite instability and
defective DNA mismatch repair. EMBO Reports 2005;6(5):438-44. doi:
10.1038/sj.embor.7400392

154
35. Binz SK, Sheehan AM, Wold MS. Replication Protein A phosphorylation and the cellular
response to DNA damage. DNA Repair 2004;3(8–9):1015-24. doi:
https://doi.org/10.1016/j.dnarep.2004.03.028
36. Sparks JL, Kumar R, Singh M, et al. Human exonuclease 5 is a novel sliding exonuclease
required for genome stability. J Biol Chem 2012;287(51):42773-83. doi:
10.1074/jbc.M112.422444 [published Online First: 2012/10/26]
37. Zhang L, Lu X, Lu J, et al. Thymine DNA glycosylase specifically recognizes 5-
carboxylcytosine-modified DNA. Nature chemical biology 2012;8(4):328-30. doi:
10.1038/nchembio.914 [published Online First: 2012/02/14]
38. Maiti A, Morgan MT, Pozharski E, et al. Crystal structure of human thymine DNA
glycosylase bound to DNA elucidates sequence-specific mismatch recognition. Proc
Natl Acad Sci U S A 2008;105(26):8890-5. doi: 10.1073/pnas.0711061105 [published
Online First: 2008/07/01]
39. Neddermann P, Gallinari P, Lettieri T, et al. Cloning and expression of human G/T
mismatch-specific thymine-DNA glycosylase. J Biol Chem 1996;271(22):12767-74.
[published Online First: 1996/05/31]
40. He XJ, Chen T, Zhu JK. Regulation and function of DNA methylation in plants and animals.
Cell research 2011;21(3):442-65. doi: 10.1038/cr.2011.23 [published Online First:
2011/02/16]
41. Jaenisch R, Bird A. Epigenetic regulation of gene expression: how the genome integrates
intrinsic and environmental signals. Nat Genet 2003;33 Suppl:245-54. doi:
10.1038/ng1089 [published Online First: 2003/03/01]
42. He YF, Li BZ, Li Z, et al. Tet-mediated formation of 5-carboxylcytosine and its excision by
TDG in mammalian DNA. Science 2011;333(6047):1303-7. doi:
10.1126/science.1210944 [published Online First: 2011/08/06]
43. Simonsson S, Gurdon J. DNA demethylation is necessary for the epigenetic
reprogramming of somatic cell nuclei. Nat Cell Biol 2004;6(10):984-90. doi:
10.1038/ncb1176 [published Online First: 2004/09/28]
44. Wu SC, Zhang Y. Active DNA demethylation: many roads lead to Rome. Nature reviews
Molecular cell biology 2010;11(9):607-20. doi: 10.1038/nrm2950 [published Online
First: 2010/08/05]
45. Cortazar D, Kunz C, Selfridge J, et al. Embryonic lethal phenotype reveals a function of
TDG in maintaining epigenetic stability. Nature 2011;470(7334):419-23. doi:
10.1038/nature09672 [published Online First: 2011/02/01]
46. Mercher T, Quivoron C, Couronne L, et al. TET2, a tumor suppressor in hematological
disorders. Biochimica et biophysica acta 2012;1825(2):173-7. doi:
10.1016/j.bbcan.2011.12.002 [published Online First: 2012/01/14]
47. Cleaver JE, Thompson LH, Richardson AS, et al. A summary of mutations in the UV-
sensitive disorders: xeroderma pigmentosum, Cockayne syndrome, and
trichothiodystrophy. Human mutation 1999;14(1):9-22. doi: 10.1002/(sici)1098-
1004(1999)14:1<9::aid-humu2>3.0.co;2-6 [published Online First: 1999/08/14]
48. de Laat WL, Hoeijmakers JHJ, Jaspers NGJ. Molecular mechanism of nucleotide excision
repair. Genes & Development 1999 doi: urn:NBN:nl:ui:15-1765/9075
49. Sakai W, Sugasawa K. DNA Damage Recognition and Repair in Mammalian Global
Genome Nucleotide Excision Repair. In: Hanaoka F, Sugasawa K, eds. DNA
Replication, Recombination, and Repair: Molecular Mechanisms and Pathology.
Tokyo: Springer Japan 2016:155-74.

155
50. Sugasawa K, Ng JM, Masutani C, et al. Xeroderma pigmentosum group C protein complex
is the initiator of global genome nucleotide excision repair. Molecular cell
1998;2(2):223-32. [published Online First: 1998/09/12]
51. Hoogstraten D, Bergink S, Ng JM, et al. Versatile DNA damage detection by the global
genome nucleotide excision repair protein XPC. J Cell Sci 2008;121(Pt 17):2850-9. doi:
10.1242/jcs.031708 [published Online First: 2008/08/07]
52. Buterin T, Meyer C, Giese B, et al. DNA Quality Control by Conformational Readout on
the Undamaged Strand of the Double Helix. Chemistry & Biology;12(8):913-22. doi:
10.1016/j.chembiol.2005.06.011
53. Maillard O, Solyom S, Naegeli H. An aromatic sensor with aversion to damaged strands
confers versatility to DNA repair. PLoS biology 2007;5(4):e79. doi:
10.1371/journal.pbio.0050079 [published Online First: 2007/03/16]
54. Shimizu Y, Uchimura Y, Dohmae N, et al. Stimulation of DNA Glycosylase Activities by XPC
Protein Complex: Roles of Protein-Protein Interactions. Journal of Nucleic Acids
2010;2010:12. doi: 10.4061/2010/805698
55. Kou H, Zhou Y, Gorospe RMC, et al. Mms19 protein functions in nucleotide excision
repair by sustaining an adequate cellular concentration of the TFIIH component Rad3.
Proceedings of the National Academy of Sciences 2008;105(41):15714-19. doi:
10.1073/pnas.0710736105
56. Seroz T, Winkler GS, Auriol J, et al. Cloning of a human homolog of the yeast nucleotide
excision repair gene MMS19 and interaction with transcription repair factor TFIIH via
the XPB and XPD helicases. Nucleic Acids Research 2000;28(22):4506-13. doi:
10.1093/nar/28.22.4506
57. Zhao Y-L, Yang L-B, Geng X-L, et al. The association of XPG and MMS19L polymorphisms
response to chemotherapy in osteosarcoma. Pak J Med Sci 2013;29(5):1225-29.
58. Errol CF, Graham CW, Wolfram S, et al. DNA Repair and Mutagenesis, Second Edition:
American Society of Microbiology 2006.
59. Svejstrup JQ. Mechanisms of transcription-coupled DNA repair. Nature reviews Molecular
cell biology 2002;3(1):21-9. doi: 10.1038/nrm703 [published Online First:
2002/02/02]
60. Groisman R, Polanowska J, Kuraoka I, et al. The ubiquitin ligase activity in the DDB2 and
CSA complexes is differentially regulated by the COP9 signalosome in response to
DNA damage. Cell 2003;113(3):357-67. [published Online First: 2003/05/07]
61. Stehling O, Vashisht AA, Mascarenhas J, et al. MMS19 assembles iron-sulfur proteins
required for DNA metabolism and genomic integrity. Science 2012;337(6091):195-9.
doi: 10.1126/science.1219723 [published Online First: 2012/06/09]
62. Amé J-C, Rolli V, Schreiber V, et al. PARP-2, A Novel Mammalian DNA Damage-dependent
Poly(ADP-ribose) Polymerase. Journal of Biological Chemistry 1999;274(25):17860-68.
doi: 10.1074/jbc.274.25.17860
63. de Murcia G, de Murcia JM. Poly(ADP-ribose) polymerase: a molecular nick-sensor.
Trends in Biochemical Sciences 1994;19(4):172-76. doi:
https://doi.org/10.1016/0968-0004(94)90280-1
64. Schreiber V, Amé J-C, Dollé P, et al. Poly(ADP-ribose) Polymerase-2 (PARP-2) Is Required
for Efficient Base Excision DNA Repair in Association with PARP-1 and XRCC1. Journal
of Biological Chemistry 2002;277(25):23028-36. doi: 10.1074/jbc.M202390200
65. Caldecott KW. Single-strand break repair and genetic disease. Nat Rev Genet
2008;9(8):619-31.

156
66. Davis AJ, Chen DJ. DNA double strand break repair via non-homologous end-joining.
Translational cancer research 2013;2(3):130-43. doi: 10.3978/j.issn.2218-
676X.2013.04.02
67. Tounekti O, Kenani A, Foray N, et al. The ratio of single- to double-strand DNA breaks and
their absolute values determine cell death pathway. Br J Cancer 2001;84(9):1272-79.
68. Friedberg EC, Walker GC, Siede W, et al. DNA Repair and Mutagenesis. Washington D.C.:
ASM Press 2006:1118.
69. Moynahan ME, Jasin M. Mitotic homologous recombination maintains genomic stability
and suppresses tumorigenesis. Nature reviews Molecular cell biology 2010;11(3):196-
207. doi: 10.1038/nrm2851 [published Online First: 2010/02/24]
70. Lieber MR. NHEJ and its backup pathways in chromosomal translocations. Nature
structural & molecular biology 2010;17(4):393-5. doi: 10.1038/nsmb0410-393
[published Online First: 2010/04/07]
71. Burma S, Chen BP, Chen DJ. Role of non-homologous end joining (NHEJ) in maintaining
genomic integrity. DNA Repair (Amst) 2006;5(9-10):1042-8. doi:
10.1016/j.dnarep.2006.05.026 [published Online First: 2006/07/11]
72. Nguyen CL, Possemato R, Bauerlein EL, et al. Nek4 regulates entry into replicative
senescence and the response to DNA damage in human fibroblasts. Mol Cell Biol
2012;32(19):3963-77. doi: 10.1128/mcb.00436-12 [published Online First:
2012/08/02]
73. An J, Huang Y-C, Xu Q-Z, et al. DNA-PKcs plays a dominant role in the regulation of H2AX
phosphorylation in response to DNA damage and cell cycle progression. BMC
Molecular Biology 2010;11(1):18. doi: 10.1186/1471-2199-11-18
74. Serrano MA, Li Z, Dangeti M, et al. DNA-PK, ATM and ATR collaboratively regulate p53-
RPA interaction to facilitate homologous recombination DNA repair. Oncogene
2013;32(19):2452-62. doi: 10.1038/onc.2012.257
75. Liu H, Yan P, Fanning E. Human DNA helicase B functions in cellular homologous
recombination and stimulates Rad51-mediated 5'-3' heteroduplex extension in vitro.
PloS One 2015;10(1):e0116852. doi: 10.1371/journal.pone.0116852 [published
Online First: 2015/01/27]
76. Yuan J, Chen J. FIGNL1-containing protein complex is required for efficient homologous
recombination repair. Proc Natl Acad Sci U S A 2013;110(26):10640-5. doi:
10.1073/pnas.1220662110 [published Online First: 2013/06/12]
77. Bakr A, Oing C, Kocher S, et al. Involvement of ATM in homologous recombination after
end resection and RAD51 nucleofilament formation. Nucleic Acids Res
2015;43(6):3154-66. doi: 10.1093/nar/gkv160 [published Online First: 2015/03/11]
78. Broderick R, Nieminuszczy J, Baddock HT, et al. EXD2 promotes homologous
recombination by facilitating DNA end resection. Nat Cell Biol 2016;18(3):271-80. doi:
10.1038/ncb3303
79. Nieminuszczy J, Broderick R, Niedzwiedz W. EXD2 - a new player joins the DSB resection
team. Cell Cycle 2016;15(12):1519-20. doi: 10.1080/15384101.2016.1161997
80. Chae YK, Anker JF, Carneiro BA, et al. Genomic landscape of DNA repair genes in cancer.
Oncotarget 2016;7(17):23312-21. doi: 10.18632/oncotarget.8196 [published Online
First: 2016/03/24]
81. Kai M. Roles of RNA-Binding Proteins in DNA Damage Response. Int J Mol Sci
2016;17(3):310. doi: 10.3390/ijms17030310 [published Online First: 2016/03/02]
157
82. Chang EY, Stirling PC. Replication Fork Protection Factors Controlling R-Loop Bypass and
Suppression. Genes (Basel) 2017;8(1) doi: 10.3390/genes8010033 [published Online
First: 2017/01/19]
83. Nikolov I, Taddei A. Linking replication stress with heterochromatin formation.
Chromosoma 2016;125(3):523-33. doi: 10.1007/s00412-015-0545-6 [published
Online First: 2015/10/30]
84. Shen JC, Gray MD, Oshima J, et al. Characterization of Werner syndrome protein DNA
helicase activity: directionality, substrate dependence and stimulation by replication
protein A. Nucleic Acids Res 1998;26(12):2879-85. [published Online First:
1998/06/05]
85. Harmon FG, Kowalczykowski SC. RecQ helicase, in concert with RecA and SSB proteins,
initiates and disrupts DNA recombination. Genes & Development 1998;12(8):1134-44.
86. Czarny P, Pawlowska E, Bialkowska-Warzecha J, et al. Autophagy in DNA damage
response. Int J Mol Sci 2015;16(2):2641-62. doi: 10.3390/ijms16022641 [published
Online First: 2015/01/28]
87. Carrero D, Soria-Valles C, Lopez-Otin C. Hallmarks of progeroid syndromes: lessons from
mice and reprogrammed cells. Disease models & mechanisms 2016;9(7):719-35. doi:
10.1242/dmm.024711 [published Online First: 2016/08/03]
88. Compton SA, Tolun G, Kamath-Loeb AS, et al. The Werner syndrome protein binds
replication fork and holliday junction DNAs as an oligomer. J Biol Chem
2008;283(36):24478-83. doi: 10.1074/jbc.M803370200 [published Online First:
2008/07/04]
89. Tkac J, Xu G, Adhikary H, et al. HELB Is a Feedback Inhibitor of DNA End Resection.
Molecular cell 2016;61(3):405-18. doi: 10.1016/j.molcel.2015.12.013 [published
Online First: 2016/01/18]
90. Mazon G, Mimitou EP, Symington LS. SnapShot: Homologous recombination in DNA
double-strand break repair. Cell 2010;142(4):646, 46.e1. doi:
10.1016/j.cell.2010.08.006 [published Online First: 2010/08/21]
91. Sung P. Catalysis of ATP-dependent homologous DNA pairing and strand exchange by
yeast RAD51 protein. Science 1994;265(5176):1241-43. doi:
10.1126/science.8066464
92. Paques F, Haber JE. Multiple pathways of recombination induced by double-strand
breaks in Saccharomyces cerevisiae. Microbiology and molecular biology reviews :
MMBR 1999;63(2):349-404. [published Online First: 1999/06/05]
93. van den Bosch M, Lohman PH, Pastink A. DNA double-strand break repair by homologous
recombination. Biological chemistry 2002;383(6):873-92. doi: 10.1515/bc.2002.095
[published Online First: 2002/09/12]
94. Sulli G, Di Micco R, di Fagagna FdA. Crosstalk between chromatin state and DNA damage
response in cellular senescence and cancer. Nat Rev Cancer 2012;12(10):709-20.
95. Abraham RT. Cell cycle checkpoint signaling through the ATM and ATR kinases. Genes &
Development 2001;15(17):2177-96. doi: 10.1101/gad.914401
96. Knudsen ES, Wang JY. Targeting the RB-pathway in cancer therapy. Clin Cancer Res
2010;16(4):1094-9. doi: 10.1158/1078-0432.ccr-09-0787 [published Online First:
2010/02/11]
97. Cho H-S, Hayami S, Toyokawa G, et al. RB1 Methylation by SMYD2 Enhances Cell Cycle
Progression through an Increase of RB1 Phosphorylation. Neoplasia (New York, NY)
2012;14(6):476-86.
158
98. Knudsen ES, Knudsen KE. Tailoring to RB: tumour suppressor status and therapeutic
response. Nat Rev Cancer 2008;8(9):714-24. doi: 10.1038/nrc2401 [published Online
First: 2009/01/15]
99. Wang JY, Knudsen ES, Welch PJ. The retinoblastoma tumor suppressor protein. Advances
in cancer research 1994;64:25-85. [published Online First: 1994/01/01]
100. Mayhew CN, Perkin LM, Zhang X, et al. Discrete signaling pathways participate in RB-
dependent responses to chemotherapeutic agents. Oncogene 2004;23(23):4107-20.
doi: 10.1038/sj.onc.1207503 [published Online First: 2004/04/06]
101. Howard A, Pelc SR. Synthesis of Desoxyribonucleic Acid in Normal and Irradiated Cells
and Its Relation to Chromosome Breakage. International Journal of Radiation Biology
and Related Studies in Physics, Chemistry and Medicine 1986;49(2):207-18. doi:
10.1080/09553008514552501
102. Huberman JA, Riggs AD. On the mechanism of DNA replication in mammalian
chromosomes. Journal of molecular biology 1968;32(2):327-41. [published Online
First: 1968/03/14]
103. Alberts B, Johnson A, Lewis J, et al. Molecular Biology of the Cell. Components of the
Cell-Cycle Control System. New York: Garland Science, 2002.
104. Tibbetts RS, Cortez D, Brumbaugh KM, et al. Functional interactions between BRCA1
and the checkpoint kinase ATR during genotoxic stress. Genes Dev 2000;14(23):2989-
3002. [published Online First: 2000/12/15]
105. Aprelikova ON, Fang BS, Meissner EG, et al. BRCA1-associated growth arrest is RB-
dependent. Proceedings of the National Academy of Sciences of the United States of
America 1999;96(21):11866-71. doi: 10.1073/pnas.96.21.11866
106. Miotto B, Chibi M, Xie P, et al. The RBBP6/ZBTB38/MCM10 axis regulates DNA
replication and common fragile site stability. Cell Rep 2014;7(2):575-87. doi:
10.1016/j.celrep.2014.03.030 [published Online First: 2014/04/15]
107. Debatisse M, Le Tallec B, Letessier A, et al. Common fragile sites: mechanisms of
instability revisited. Trends in genetics : TIG 2012;28(1):22-32. doi:
10.1016/j.tig.2011.10.003 [published Online First: 2011/11/19]
108. Le Tallec B, Millot GA, Blin ME, et al. Common fragile site profiling in epithelial and
erythroid cells reveals that most recurrent cancer deletions lie in fragile sites hosting
large genes. Cell Rep 2013;4(3):420-8. doi: 10.1016/j.celrep.2013.07.003 [published
Online First: 2013/08/06]
109. Ozeri-Galai E, Bester AC, Kerem B. The complex basis underlying common fragile site
instability in cancer. Trends in genetics : TIG 2012;28(6):295-302. doi:
10.1016/j.tig.2012.02.006 [published Online First: 2012/04/03]
110. Chibi M, Meyer M, Skepu A, et al. RBBP6 interacts with multifunctional protein YB-1
through its RING finger domain, leading to ubiquitination and proteosomal
degradation of YB-1. Journal of molecular biology 2008;384(4):908-16. doi:
10.1016/j.jmb.2008.09.060 [published Online First: 2008/10/15]
111. Ntwasa M. Retinoblastoma Binding Protein 6, Another p53 Monitor. Trends in Cancer
2016;2(11):635-37. doi: 10.1016/j.trecan.2016.10.003
112. Meek DW. Tumour suppression by p53: a role for the DNA damage response? Nat Rev
Cancer 2009;9(10):714-23.
113. Mendez-Vidal C, Gamez-Del Estal MM, Moreno-Mateos MA, et al. PTTG2 silencing
results in induction of epithelial-to-mesenchymal transition and apoptosis. Cell death
& disease 2013;4:e530. doi: 10.1038/cddis.2013.48 [published Online First:
2013/03/09]

159
114. Meek DW, Cox M. Induction and activation of the p53 pathway: a role for the protein
kinase CK2? Molecular and Cellular Biochemistry 2011;356(1):133. doi:
10.1007/s11010-011-0966-3
115. Bruins W, Zwart E, Attardi LD, et al. Increased Sensitivity to UV Radiation in Mice with a
p53 Point Mutation at Ser389. Molecular and Cellular Biology 2004;24(20):8884-94.
doi: 10.1128/MCB.24.20.8884-8894.2004
116. Hoogervorst EM, Bruins W, Zwart E, et al. Lack of p53 Ser389 phosphorylation
predisposes mice to develop 2-acetylaminofluorene-induced bladder tumors but not
ionizing radiation-induced lymphomas. Cancer Res 2005;65(9):3610-6. doi:
10.1158/0008-5472.can-04-4328 [published Online First: 2005/05/04]
117. Bruins W, Bruning O, Jonker MJ, et al. The absence of Ser389 phosphorylation in p53
affects the basal gene expression level of many p53-dependent genes and alters the
biphasic response to UV exposure in mouse embryonic fibroblasts. Mol Cell Biol
2008;28(6):1974-87. doi: 10.1128/mcb.01610-07 [published Online First:
2008/01/16]
118. Bech-Otschir D, Kraft R, Huang X, et al. COP9 signalosome-specific phosphorylation
targets p53 to degradation by the ubiquitin system. EMBO J 2001;20(7):1630-9. doi:
10.1093/emboj/20.7.1630 [published Online First: 2001/04/04]
119. Uhle S, Medalia O, Waldron R, et al. Protein kinase CK2 and protein kinase D are
associated with the COP9 signalosome. The EMBO Journal 2003;22(6):1302-12. doi:
10.1093/emboj/cdg127
120. Franciosini A, Serino G, Deng X-W. Signaling: COP9 Signalosome. In: Howell SH, ed.
Molecular Biology. New York, NY: Springer New York 2015:1-17.
121. Shiloh Y. ATM and related protein kinases: safeguarding genome integrity. Nat Rev
Cancer 2003;3(3):155-68. doi: 10.1038/nrc1011 [published Online First: 2003/03/04]
122. Cimprich KA, Cortez D. ATR: An Essential Regulator of Genome Integrity. Nature reviews
Molecular cell biology 2008;9(8):616-27. doi: 10.1038/nrm2450
123. Podhorecka M, Skladanowski A, Bozko P. H2AX Phosphorylation: Its Role in DNA
Damage Response and Cancer Therapy. Journal of Nucleic Acids 2010;2010:9. doi:
10.4061/2010/920161
124. Andreassen PR, D'Andrea AD, Taniguchi T. ATR couples FANCD2 monoubiquitination to
the DNA-damage response. Genes Dev 2004;18(16):1958-63. doi:
10.1101/gad.1196104 [published Online First: 2004/08/18]
125. Shafman T, Khanna KK, Kedar P, et al. Interaction between ATM protein and c-Abl in
response to DNA damage. Nature 1997;387(6632):520-3. doi: 10.1038/387520a0
[published Online First: 1997/05/29]
126. Shiloh Y, Ziv Y. The ATM protein kinase: regulating the cellular response to genotoxic
stress, and more. Nature reviews Molecular cell biology 2013;14(4):197-210.
[published Online First: 2013/07/13]
127. Gao G, Bracken AP, Burkard K, et al. NPAT expression is regulated by E2F and is
essential for cell cycle progression. Mol Cell Biol 2003;23(8):2821-33. [published
Online First: 2003/04/01]
128. Zhao J, Dynlacht B, Imai T, et al. Expression of NPAT, a novel substrate of cyclin E-CDK2,
promotes S-phase entry. Genes Dev 1998;12(4):456-61. [published Online First:
1998/03/21]
129. Zhao J, Kennedy BK, Lawrence BD, et al. NPAT links cyclin E-Cdk2 to the regulation of
replication-dependent histone gene transcription. Genes Dev 2000;14(18):2283-97.
[published Online First: 2000/09/20]

160
130. Zou L. Single- and double-stranded DNA: building a trigger of ATR-mediated DNA
damage response. Genes Dev 2007;21(8):879-85. doi: 10.1101/gad.1550307
[published Online First: 2007/04/18]
131. Reinhardt HC, Yaffe MB. Kinases that control the cell cycle in response to DNA damage:
Chk1, Chk2, and MK2. Current opinion in cell biology 2009;21(2):245-55. doi:
10.1016/j.ceb.2009.01.018 [published Online First: 2009/02/24]
132. Coverley D, Kenny MK, Munn M, et al. Requirement for the replication protein SSB in
human DMA excision repair. Nature 1991;349(6309):538-41.
133. Cortez D, Guntuku S, Qin J, et al. ATR and ATRIP: partners in checkpoint signaling.
Science 2001;294(5547):1713-6. doi: 10.1126/science.1065521 [published Online
First: 2001/11/27]
134. Zou L, Elledge SJ. Sensing DNA damage through ATRIP recognition of RPA-ssDNA
complexes. Science 2003;300(5625):1542-8. doi: 10.1126/science.1083430 [published
Online First: 2003/06/07]
135. Toueille M, El-Andaloussi N, Frouin I, et al. The human Rad9/Rad1/Hus1 damage sensor
clamp interacts with DNA polymerase beta and increases its DNA substrate utilisation
efficiency: implications for DNA repair. Nucleic Acids Res 2004;32(11):3316-24. doi:
10.1093/nar/gkh652 [published Online First: 2004/08/18]
136. Wang X, Zou L, Lu T, et al. Rad17 Phosphorylation Is Required for Claspin Recruitment
and Chk1 Activation in Response to Replication Stress. Molecular cell 2006;23(3):331-
41. doi: https://doi.org/10.1016/j.molcel.2006.06.022
137. Khanna KK, Jackson SP. DNA double-strand breaks: signaling, repair and the cancer
connection. Nat Genet 2001;27(3):247-54.
138. Gatti RA, Becker-Catania S, Chun HH, et al. The pathogenesis of ataxia-telangiectasia.
Learning from a Rosetta Stone. Clinical reviews in allergy & immunology
2001;20(1):87-108. doi: 10.1385/criai:20:1:87 [published Online First: 2001/03/28]
139. Crawford TO. Ataxia telangiectasia. Seminars in Pediatric Neurology 1998;5(4):287-94.
doi: https://doi.org/10.1016/S1071-9091(98)80007-7
140. German J. Chromosome-Breakage Syndromes: Different Genes, Different Treatments,
Different Cancers. In: Generoso WM, Shelby MD, de Serres FJ, eds. DNA Repair and
Mutagenesis in Eukaryotes. Boston, MA: Springer US 1980:429-39.
141. Uziel T, Lerenthal Y, Moyal L, et al. Requirement of the MRN complex for ATM
activation by DNA damage. EMBO J 2003;22(20):5612-21. doi:
10.1093/emboj/cdg541 [published Online First: 2003/10/09]
142. You Z, Bailis JM, Johnson SA, et al. Rapid activation of ATM on DNA flanking double-
strand breaks. Nat Cell Biol 2007;9(11):1311-18. doi:
http://www.nature.com/ncb/journal/v9/n11/suppinfo/ncb1651_S1.html
143. Bakkenist CJ, Kastan MB. DNA damage activates ATM through intermolecular
autophosphorylation and dimer dissociation. Nature 2003;421(6922):499-506. doi:
http://www.nature.com/nature/journal/v421/n6922/suppinfo/nature01368_S1.html
144. Jazayeri A, Balestrini A, Garner E, et al. Mre11-Rad50-Nbs1-dependent processing of
DNA breaks generates oligonucleotides that stimulate ATM activity. EMBO J
2008;27(14):1953-62. doi: 10.1038/emboj.2008.128 [published Online First:
2008/07/04]
145. van den Bosch M, Bree RT, Lowndes NF. The MRN complex: coordinating and mediating
the response to broken chromosomes. EMBO Reports 2003;4(9):844-49. doi:
10.1038/sj.embor.embor925
161
146. Lee J-H, Paull TT. ATM Activation by DNA Double-Strand Breaks Through the Mre11-
Rad50-Nbs1 Complex. Science 2005;308(5721):551-54. doi: 10.1126/science.1108297
147. Kozlov S, Gueven N, Keating K, et al. ATP activates ataxia-telangiectasia mutated (ATM)
in vitro. Importance of autophosphorylation. J Biol Chem 2003;278(11):9309-17.
148. Matsuoka S, Ballif BA, Smogorzewska A, et al. ATM and ATR Substrate Analysis Reveals
Extensive Protein Networks Responsive to DNA Damage. Science
2007;316(5828):1160-66. doi: 10.1126/science.1140321
149. Xiao J, Liu CC, Chen PL, et al. RINT-1, a novel Rad50-interacting protein, participates in
radiation-induced G(2)/M checkpoint control. J Biol Chem 2001;276(9):6105-11. doi:
10.1074/jbc.M008893200 [published Online First: 2000/11/30]
150. Kong LJ, Meloni AR, Nevins JR. The Rb-related p130 protein controls telomere
lengthening through an interaction with a Rad50-interacting protein, RINT-1.
Molecular cell 2006;22(1):63-71. doi: 10.1016/j.molcel.2006.02.016 [published Online
First: 2006/04/08]
151. Szostak JW, Blackburn EH. Cloning yeast telomeres on linear plasmid vectors. Cell
1982;29(1):245-55. [published Online First: 1982/05/01]
152. Henderson E, Hardin CC, Walk SK, et al. Telomeric DNA oligonucleotides form novel
intramolecular structures containing guanine-guanine base pairs. Cell
1987;51(6):899-908. [published Online First: 1987/12/24]
153. Henderson ER, Blackburn EH. An overhanging 3' terminus is a conserved feature of
telomeres. Mol Cell Biol 1989;9(1):345-8. [published Online First: 1989/01/01]
154. Shay JW, Bacchetti S. A survey of telomerase activity in human cancer. Eur J Cancer
1997;33(5):787-91. doi: 10.1016/s0959-8049(97)00062-2 [published Online First:
1997/04/01]
155. Kim NW, Piatyszek MA, Prowse KR, et al. Specific association of human telomerase
activity with immortal cells and cancer. Science 1994;266(5193):2011-5. [published
Online First: 1994/12/23]
156. Tong Adrian S, Stern JL, Sfeir A, et al. ATM and ATR Signaling Regulate the Recruitment
of Human Telomerase to Telomeres. Cell Reports;13(8):1633-46. doi:
10.1016/j.celrep.2015.10.041
157. Londoño-Vallejo JA, Wellinger RJ. Telomeres and telomerase dance to the rhythm of the
cell cycle. Trends in Biochemical Sciences;37(9):391-99. doi:
10.1016/j.tibs.2012.05.004
158. Venteicher AS, Abreu EB, Meng Z, et al. A human telomerase holoenzyme protein
required for Cajal body localization and telomere synthesis. Science
2009;323(5914):644-8. doi: 10.1126/science.1165357 [published Online First:
2009/01/31]
159. Mahmoudi S, Henriksson S, Corcoran M, et al. Wrap53, a natural p53 antisense
transcript required for p53 induction upon DNA damage. Molecular cell
2009;33(4):462-71. doi: 10.1016/j.molcel.2009.01.028 [published Online First:
2009/03/03]
160. Jady BE, Richard P, Bertrand E, et al. Cell cycle-dependent recruitment of telomerase
RNA and Cajal bodies to human telomeres. Molecular biology of the cell
2006;17(2):944-54. doi: 10.1091/mbc.E05-09-0904 [published Online First:
2005/12/02]
161. Tomlinson RL, Ziegler TD, Supakorndej T, et al. Cell cycle-regulated trafficking of human
telomerase to telomeres. Molecular biology of the cell 2006;17(2):955-65. doi:
10.1091/mbc.E05-09-0903 [published Online First: 2005/12/13]

162
162. Yang J, Yu Y, Hamrick HE, et al. ATM, ATR and DNA-PK: initiators of the cellular
genotoxic stress responses. Carcinogenesis 2003;24(10):1571-80. doi:
10.1093/carcin/bgg137 [published Online First: 2003/08/16]
163. Kornberg RD. Chromatin structure: a repeating unit of histones and DNA. Science
1974;184(4139):868-71. [published Online First: 1974/05/24]
164. Kim J-A, Kruhlak M, Dotiwala F, et al. Heterochromatin is refractory to γ-H2AX
modification in yeast and mammals. The Journal of Cell Biology 2007;178(2):209-18.
doi: 10.1083/jcb.200612031
165. Rogakou EP, Boon C, Redon C, et al. Megabase chromatin domains involved in DNA
double-strand breaks in vivo. J Cell Biol 1999;146(5):905-16. [published Online First:
1999/09/09]
166. Rogakou EP, Pilch DR, Orr AH, et al. DNA double-stranded breaks induce histone H2AX
phosphorylation on serine 139. J Biol Chem 1998;273(10):5858-68. [published Online
First: 1998/04/16]
167. Furuta T, Takemura H, Liao ZY, et al. Phosphorylation of histone H2AX and activation of
Mre11, Rad50, and Nbs1 in response to replication-dependent DNA double-strand
breaks induced by mammalian DNA topoisomerase I cleavage complexes. J Biol Chem
2003;278(22):20303-12. doi: 10.1074/jbc.M300198200 [published Online First:
2003/03/28]
168. Fernandez-Capetillo O, Celeste A, Nussenzweig A. Focusing on foci: H2AX and the
recruitment of DNA-damage response factors. Cell Cycle 2003;2(5):426-7. [published
Online First: 2003/09/10]
169. Celeste A, Fernandez-Capetillo O, Kruhlak MJ, et al. Histone H2AX phosphorylation is
dispensable for the initial recognition of DNA breaks. Nat Cell Biol 2003;5(7):675-9.
doi: 10.1038/ncb1004 [published Online First: 2003/06/07]
170. Paull TT, Rogakou EP, Yamazaki V, et al. A critical role for histone H2AX in recruitment of
repair factors to nuclear foci after DNA damage. Curr Biol 2000;10(15):886-95.
[published Online First: 2000/08/26]
171. Ward IM, Chen J. Histone H2AX Is Phosphorylated in an ATR-dependent Manner in
Response to Replicational Stress. Journal of Biological Chemistry 2001;276(51):47759-
62. doi: 10.1074/jbc.C100569200
172. Stewart GS, Wang B, Bignell CR, et al. MDC1 is a mediator of the mammalian DNA
damage checkpoint. Nature 2003;421(6926):961-6. doi: 10.1038/nature01446
[published Online First: 2003/02/28]
173. Lou Z, Minter-Dykhouse K, Franco S, et al. MDC1 maintains genomic stability by
participating in the amplification of ATM-dependent DNA damage signals. Molecular
cell 2006;21(2):187-200. doi: 10.1016/j.molcel.2005.11.025 [published Online First:
2006/01/24]
174. Mailand N, Bekker-Jensen S, Faustrup H, et al. RNF8 ubiquitylates histones at DNA
double-strand breaks and promotes assembly of repair proteins. Cell
2007;131(5):887-900. doi: 10.1016/j.cell.2007.09.040 [published Online First:
2007/11/16]
175. Ikura T, Tashiro S, Kakino A, et al. DNA Damage-Dependent Acetylation and
Ubiquitination of H2AX Enhances Chromatin Dynamics. Molecular and Cellular
Biology 2007;27(20):7028-40. doi: 10.1128/mcb.00579-07
176. Stewart GS, Panier S, Townsend K, et al. The RIDDLE Syndrome Protein Mediates a
Ubiquitin-Dependent Signaling Cascade at Sites of DNA Damage. Cell
2009;136(3):420-34. doi: https://doi.org/10.1016/j.cell.2008.12.042

163
177. Moyal L, Lerenthal Y, Gana-Weisz M, et al. Requirement of ATM-Dependent
Monoubiquitylation of Histone H2B for Timely Repair of DNA Double-Strand Breaks.
Molecular cell 2011;41(5):529-42. doi: https://doi.org/10.1016/j.molcel.2011.02.015
178. Iwabuchi K, Bartel PL, Li B, et al. Two cellular proteins that bind to wild-type but not
mutant p53. Proc Natl Acad Sci U S A 1994;91(13):6098-102. [published Online First:
1994/06/21]
179. Panier S, Boulton SJ. Double-strand break repair: 53BP1 comes into focus. Nature
reviews Molecular cell biology 2014;15(1):7-18. doi: 10.1038/nrm3719 [published
Online First: 2013/12/12]
180. DiTullio RA, Jr., Mochan TA, Venere M, et al. 53BP1 functions in an ATM-dependent
checkpoint pathway that is constitutively activated in human cancer. Nat Cell Biol
2002;4(12):998-1002. doi: 10.1038/ncb892 [published Online First: 2002/11/26]
181. Fernandez-Capetillo O, Chen H-T, Celeste A, et al. DNA damage-induced G2-M
checkpoint activation by histone H2AX and 53BP1. Nat Cell Biol 2002;4(12):993-97.
doi: http://www.nature.com/ncb/journal/v4/n12/suppinfo/ncb884_S1.html
182. Wang B, Matsuoka S, Carpenter PB, et al. 53BP1, a mediator of the DNA damage
checkpoint. Science 2002;298(5597):1435-8. doi: 10.1126/science.1076182
[published Online First: 2002/10/05]
183. Ward IM, Minn K, van Deursen J, et al. p53 Binding protein 53BP1 is required for DNA
damage responses and tumor suppression in mice. Mol Cell Biol 2003;23(7):2556-63.
[published Online First: 2003/03/18]
184. Symington LS, Gautier J. Double-strand break end resection and repair pathway choice.
Annual review of genetics 2011;45:247-71. doi: 10.1146/annurev-genet-110410-
132435 [published Online First: 2011/09/14]
185. Bekker-Jensen S, Rendtlew Danielsen J, Fugger K, et al. HERC2 coordinates ubiquitin-
dependent assembly of DNA repair factors on damaged chromosomes. Nat Cell Biol
2010;12(1):80-6; sup pp 1-12. doi: 10.1038/ncb2008 [published Online First:
2009/12/22]
186. Yoshida K, Miki Y. Role of BRCA1 and BRCA2 as regulators of DNA repair, transcription,
and cell cycle in response to DNA damage. Cancer science 2004;95(11):866-71.
[published Online First: 2004/11/18]
187. Cortez D, Wang Y, Qin J, et al. Requirement of ATM-dependent phosphorylation of
brca1 in the DNA damage response to double-strand breaks. Science
1999;286(5442):1162-6. [published Online First: 1999/11/05]
188. Gatei M, Scott SP, Filippovitch I, et al. Role for ATM in DNA damage-induced
phosphorylation of BRCA1. Cancer Res 2000;60(12):3299-304. [published Online First:
2000/06/24]
189. Gatei M, Zhou BB, Hobson K, et al. Ataxia telangiectasia mutated (ATM) kinase and ATM
and Rad3 related kinase mediate phosphorylation of Brca1 at distinct and
overlapping sites. In vivo assessment using phospho-specific antibodies. J Biol Chem
2001;276(20):17276-80. doi: 10.1074/jbc.M011681200 [published Online First:
2001/03/30]
190. Scully R, Chen J, Plug A, et al. Association of BRCA1 with Rad51 in mitotic and meiotic
cells. Cell 1997;88(2):265-75. [published Online First: 1997/01/24]
191. Xu B, Kim S, Kastan MB. Involvement of Brca1 in S-phase and G(2)-phase checkpoints
after ionizing irradiation. Mol Cell Biol 2001;21(10):3445-50. doi:
10.1128/mcb.21.10.3445-3450.2001 [published Online First: 2001/04/21]

164
192. Lee EY. BRCA1 and Chk1 in G2/M checkpoint: a new order of regulation. Cell Cycle
2002;1(3):178-80. [published Online First: 2002/11/14]
193. Yarden RI, Pardo-Reoyo S, Sgagias M, et al. BRCA1 regulates the G2/M checkpoint by
activating Chk1 kinase upon DNA damage. Nat Genet 2002;30(3):285-9. doi:
10.1038/ng837 [published Online First: 2002/02/12]
194. Zannini L, Delia D, Buscemi G. CHK2 kinase in the DNA damage response and beyond.
Journal of Molecular Cell Biology 2014;6(6):442-57. doi: 10.1093/jmcb/mju045
195. Matsuoka S, Rotman G, Ogawa A, et al. Ataxia telangiectasia-mutated phosphorylates
Chk2 in vivo and in vitro. Proc Natl Acad Sci U S A 2000;97(19):10389-94. doi:
10.1073/pnas.190030497 [published Online First: 2000/09/06]
196. Kastan MB, Lim DS. The many substrates and functions of ATM. Nature reviews
Molecular cell biology 2000;1(3):179-86. doi: 10.1038/35043058 [published Online
First: 2001/03/17]
197. Schwarz JK, Lovly CM, Piwnica-Worms H. Regulation of the Chk2 protein kinase by
oligomerization-mediated cis- and trans-phosphorylation. Molecular cancer research
: MCR 2003;1(8):598-609. [published Online First: 2003/06/14]
198. Melchionna R, Chen XB, Blasina A, et al. Threonine 68 is required for radiation-induced
phosphorylation and activation of Cds1. Nat Cell Biol 2000;2(10):762-5. doi:
10.1038/35036406 [published Online First: 2000/10/12]
199. Ahn JY, Schwarz JK, Piwnica-Worms H, et al. Threonine 68 phosphorylation by ataxia
telangiectasia mutated is required for efficient activation of Chk2 in response to
ionizing radiation. Cancer Res 2000;60(21):5934-6. [published Online First:
2000/11/21]
200. Lee CH, Chung JH. The hCds1 (Chk2)-FHA domain is essential for a chain of
phosphorylation events on hCds1 that is induced by ionizing radiation. J Biol Chem
2001;276(32):30537-41. doi: 10.1074/jbc.M104414200 [published Online First:
2001/06/08]
201. Ahn J, Urist M, Prives C. The Chk2 protein kinase. DNA Repair (Amst) 2004;3(8-9):1039-
47. doi: 10.1016/j.dnarep.2004.03.033 [published Online First: 2004/07/29]
202. Lachner M, O'Carroll D, Rea S, et al. Methylation of histone H3 lysine 9 creates a binding
site for HP1 proteins. Nature 2001;410(6824):116-20. doi: 10.1038/35065132
[published Online First: 2001/03/10]
203. Nakayama J, Rice JC, Strahl BD, et al. Role of histone H3 lysine 9 methylation in
epigenetic control of heterochromatin assembly. Science 2001;292(5514):110-3. doi:
10.1126/science.1060118 [published Online First: 2001/04/03]
204. Noon AT, Shibata A, Rief N, et al. 53BP1-dependent robust localized KAP-1
phosphorylation is essential for heterochromatic DNA double-strand break repair.
Nat Cell Biol 2010;12(2):177-84. doi: 10.1038/ncb2017 [published Online First:
2010/01/19]
205. White D, Rafalska-Metcalf IU, Ivanov AV, et al. The ATM substrate KAP1 controls DNA
repair in heterochromatin: regulation by HP1 proteins and serine 473/824
phosphorylation. Molecular cancer research : MCR 2012;10(3):401-14. doi:
10.1158/1541-7786.mcr-11-0134 [published Online First: 2011/12/30]
206. White DE, Negorev D, Peng H, et al. KAP1, a novel substrate for PIKK family members,
colocalizes with numerous damage response factors at DNA lesions. Cancer Res
2006;66(24):11594-9. doi: 10.1158/0008-5472.can-06-4138 [published Online First:
2006/12/21]
165
207. Shiloh Y. ATM and ATR: networking cellular responses to DNA damage. Current Opinion
in Genetics & Development 2001;11(1):71-77. doi: https://doi.org/10.1016/S0959-
437X(00)00159-3
208. Wong S, Witte ON. The BCR-ABL story: bench to bedside and back. Annual review of
immunology 2004;22:247-306. doi: 10.1146/annurev.immunol.22.012703.104753
[published Online First: 2004/03/23]
209. Yoon MK, Ha JH, Lee MS, et al. Structure and apoptotic function of p73. BMB reports
2015;48(2):81-90. [published Online First: 2014/12/03]
210. Agami R, Blandino G, Oren M, et al. Interaction of c-Abl and p73[alpha] and their
collaboration to induce apoptosis. Nature 1999;399(6738):809-13.
211. Shaul Y. c-Abl: activation and nuclear targets. Cell death and differentiation
2000;7(1):10-6. doi: 10.1038/sj.cdd.4400626 [published Online First: 2000/03/14]
212. Shaul Y, Ben-Yehoyada M. Role of c-Abl in the DNA damage stress response. Cell
research 2005;15(1):33-5. doi: 10.1038/sj.cr.7290261 [published Online First:
2005/02/03]
213. Nehme A, Baskaran R, Nebel S, et al. Induction of JNK and c-Abl signalling by cisplatin
and oxaliplatin in mismatch repair-proficient and -deficient cells. Br J Cancer
1999;79(7-8):1104-10. doi: 10.1038/sj.bjc.6690176 [published Online First:
1999/03/31]
214. Nehme A, Baskaran R, Aebi S, et al. Differential induction of c-Jun NH2-terminal kinase
and c-Abl kinase in DNA mismatch repair-proficient and -deficient cells exposed to
cisplatin. Cancer Res 1997;57(15):3253-7. [published Online First: 1997/08/01]
215. Gong JG, Costanzo A, Yang HQ, et al. The tyrosine kinase c-Abl regulates p73 in
apoptotic response to cisplatin-induced DNA damage. Nature 1999;399(6738):806-9.
doi: 10.1038/21690 [published Online First: 1999/07/03]
216. Yuan ZM, Shioya H, Ishiko T, et al. p73 is regulated by tyrosine kinase c-Abl in the
apoptotic response to DNA damage. Nature 1999;399(6738):814-7. doi:
10.1038/21704 [published Online First: 1999/07/03]
217. Taagepera S, McDonald D, Loeb JE, et al. Nuclear-cytoplasmic shuttling of C-ABL
tyrosine kinase. Proc Natl Acad Sci U S A 1998;95(13):7457-62. [published Online
First: 1998/06/24]
218. Chen G, Yuan SS, Liu W, et al. Radiation-induced assembly of Rad51 and Rad52
recombination complex requires ATM and c-Abl. J Biol Chem 1999;274(18):12748-52.
[published Online First: 1999/04/23]
219. Kharbanda S, Yuan ZM, Weichselbaum R, et al. Functional role for the c-Abl protein
tyrosine kinase in the cellular response to genotoxic stress. Biochimica et biophysica
acta 1997;1333(2):O1-7. [published Online First: 1997/12/12]
220. Wang JY. Controlling Abl: auto-inhibition and co-inhibition? Nat Cell Biol 2004;6(1):3-7.
doi: 10.1038/ncb0104-3 [published Online First: 2004/01/06]
221. D'Andrea AD. Susceptibility Pathways in Fanconi's Anemia and Breast Cancer. New
England Journal of Medicine 2010;362(20):1909-19. doi:
doi:10.1056/NEJMra0809889
222. Ali AM, Kirby M, Jansen M, et al. Identification and characterization of mutations in
FANCL gene: a second case of Fanconi anemia belonging to FA-L complementation
group. Human mutation 2009;30(7):21032.
223. Ceccaldi R, Sarangi P, D'Andrea AD. The Fanconi anaemia pathway: new players and
new functions. Nature reviews Molecular cell biology 2016;17(6):337-49. doi:
10.1038/nrm.2016.48

166
224. Cancer Genome Atlas RN. Integrated genomic analyses of ovarian carcinoma. Nature
2011;474(7353):609-15. doi: 10.1038/nature10166 [published Online First:
2011/07/02]
225. Shimamura A, Alter BP. Pathophysiology and management of inherited bone marrow
failure syndromes. Blood reviews 2010;24(3):101-22. doi: 10.1016/j.blre.2010.03.002
[published Online First: 2010/04/27]
226. Zhang J, Dewar JM, Budzowska M, et al. DNA interstrand cross-link repair requires
replication-fork convergence. Nature structural & molecular biology 2015;22(3):242-
7. doi: 10.1038/nsmb.2956 [published Online First: 2015/02/03]
227. Castella M, Jacquemont C, Thompson EL, et al. FANCI Regulates Recruitment of the FA
Core Complex at Sites of DNA Damage Independently of FANCD2. PLoS genetics
2015;11(10):e1005563. doi: 10.1371/journal.pgen.1005563 [published Online First:
2015/10/03]
228. Lossaint G, Larroque M, Ribeyre C, et al. FANCD2 binds MCM proteins and controls
replisome function upon activation of s phase checkpoint signaling. Molecular cell
2013;51(5):678-90. doi: 10.1016/j.molcel.2013.07.023 [published Online First:
2013/09/03]
229. Pepe A, West SC. Substrate specificity of the MUS81-EME2 structure selective
endonuclease. Nucleic Acids Res 2014;42(6):3833-45. doi: 10.1093/nar/gkt1333
[published Online First: 2013/12/29]
230. Ciccia A, Ling C, Coulthard R, et al. Identification of FAAP24, a Fanconi anemia core
complex protein that interacts with FANCM. Molecular cell 2007;25(3):331-43. doi:
10.1016/j.molcel.2007.01.003 [published Online First: 2007/02/10]
231. Budzowska M, Graham TG, Sobeck A, et al. Regulation of the Rev1-pol zeta complex
during bypass of a DNA interstrand cross-link. EMBO J 2015;34(14):1971-85. doi:
10.15252/embj.201490878 [published Online First: 2015/06/14]
232. Wang AT, Kim T, Wagner JE, et al. A Dominant Mutation in Human RAD51 Reveals Its
Function in DNA Interstrand Crosslink Repair Independent of Homologous
Recombination. Molecular cell 2015;59(3):478-90. doi: 10.1016/j.molcel.2015.07.009
[published Online First: 2015/08/09]
233. Ameziane N, May P, Haitjema A, et al. A novel Fanconi anaemia subtype associated with
a dominant-negative mutation in RAD51. Nature communications 2015;6:8829. doi:
10.1038/ncomms9829 [published Online First: 2015/12/19]
234. Moldovan GL, Madhavan MV, Mirchandani KD, et al. DNA polymerase POLN
participates in cross-link repair and homologous recombination. Mol Cell Biol
2010;30(4):1088-96. doi: 10.1128/mcb.01124-09 [published Online First:
2009/12/10]
235. Knipscheer P, Raschle M, Smogorzewska A, et al. The Fanconi anemia pathway
promotes replication-dependent DNA interstrand cross-link repair. Science
2009;326(5960):1698-701. doi: 10.1126/science.1182372 [published Online First:
2009/12/08]
236. Howlett NG, Taniguchi T, Olson S, et al. Biallelic inactivation of BRCA2 in Fanconi
anemia. Science 2002;297(5581):606-9. doi: 10.1126/science.1073834 [published
Online First: 2002/06/18]
237. Long DT, Räschle M, Joukov V, et al. Mechanism of RAD51-Dependent DNA Interstrand
Cross-Link Repair. Science 2011;333(6038):84-87. doi: 10.1126/science.1204258
238. Somyajit K, Subramanya S, Nagaraju G. Distinct Roles of FANCO/RAD51C Protein in DNA
Damage Signaling and Repair: IMPLICATIONS FOR FANCONI ANEMIA AND BREAST

167
CANCER SUSCEPTIBILITY. Journal of Biological Chemistry 2012;287(5):3366-80. doi:
10.1074/jbc.M111.311241
239. Dosanjh MK, Collins DW, Schild D, et al. Isolation and characterization of RAD51C, a new
human member of the RAD51 family of related genes. Nucleic Acids Research
1998;26(5):1179-84. doi: 10.1093/nar/26.5.1179
240. van Gent DC, Hoeijmakers JH, Kanaar R. Chromosomal stability and the DNA double-
stranded break connection. Nat Rev Genet 2001;2(3):196-206.
241. Peng M, Litman R, Xie J, et al. The FANCJ/MutLalpha interaction is required for
correction of the cross-link response in FA-J cells. EMBO J 2007;26(13):3238-49. doi:
10.1038/sj.emboj.7601754 [published Online First: 2007/06/22]
242. Murina O, von Aesch C, Karakus U, et al. FANCD2 and CtIP cooperate to repair DNA
interstrand crosslinks. Cell Rep 2014;7(4):1030-8. doi: 10.1016/j.celrep.2014.03.069
[published Online First: 2014/05/06]
243. Unno J, Itaya A, Taoka M, et al. FANCD2 binds CtIP and regulates DNA-end resection
during DNA interstrand crosslink repair. Cell Rep 2014;7(4):1039-47. doi:
10.1016/j.celrep.2014.04.005 [published Online First: 2014/05/06]
244. Yeo JE, Lee EH, Hendrickson EA, et al. CtIP mediates replication fork recovery in a
FANCD2-regulated manner. Hum Mol Genet 2014;23(14):3695-705. doi:
10.1093/hmg/ddu078 [published Online First: 2014/02/22]
245. Bunting SF, Callen E, Kozak ML, et al. BRCA1 functions independently of homologous
recombination in DNA interstrand crosslink repair. Molecular cell 2012;46(2):125-35.
doi: 10.1016/j.molcel.2012.02.015 [published Online First: 2012/03/27]
246. Adamo A, Collis SJ, Adelman CA, et al. Preventing nonhomologous end joining
suppresses DNA repair defects of Fanconi anemia. Molecular cell 2010;39(1):25-35.
doi: 10.1016/j.molcel.2010.06.026 [published Online First: 2010/07/06]
247. Pace P, Mosedale G, Hodskinson MR, et al. Ku70 corrupts DNA repair in the absence of
the Fanconi anemia pathway. Science 2010;329(5988):219-23. doi:
10.1126/science.1192277 [published Online First: 2010/06/12]
248. Howard SM, Yanez DA, Stark JM. DNA damage response factors from diverse pathways,
including DNA crosslink repair, mediate alternative end joining. PLoS genetics
2015;11(1):e1004943. doi: 10.1371/journal.pgen.1004943 [published Online First:
2015/01/30]
249. Ceccaldi R, Rondinelli B, D'Andrea AD. Repair Pathway Choices and Consequences at the
Double-Strand Break. Trends in cell biology 2016;26(1):52-64. doi:
10.1016/j.tcb.2015.07.009 [published Online First: 2015/10/07]
250. Renaud E, Barascu A, Rosselli F. Impaired TIP60-mediated H4K16 acetylation accounts
for the aberrant chromatin accumulation of 53BP1 and RAP80 in Fanconi anemia
pathway-deficient cells. Nucleic Acids Res 2016;44(2):648-56. doi:
10.1093/nar/gkv1019 [published Online First: 2015/10/09]
251. Tang J, Cho NW, Cui G, et al. Acetylation limits 53BP1 association with damaged
chromatin to promote homologous recombination. Nature structural & molecular
biology 2013;20(3):317-25. doi: 10.1038/nsmb.2499 [published Online First:
2013/02/05]
252. Drané P, Brault M-E, Cui G, et al. TIRR regulates 53BP1 by masking its histone methyl-
lysine binding function. Nature 2017;543:211. doi: 10.1038/nature21358
253. Saffi J, Agnoletto MH, Guecheva TN, et al. Effect of the anti-neoplastic drug doxorubicin
on XPD-mutated DNA repair-deficient human cells. DNA Repair (Amst) 2010;9(1):40-
7. doi: 10.1016/j.dnarep.2009.10.003 [published Online First: 2009/11/21]
168
254. Pathania S, Nguyen J, Hill SJ, et al. BRCA1 is required for postreplication repair after UV-
induced DNA damage. Molecular cell 2011;44(2):235-51. doi:
10.1016/j.molcel.2011.09.002 [published Online First: 2011/10/04]
255. Shen X, Do H, Li Y, et al. Recruitment of fanconi anemia and breast cancer proteins to
DNA damage sites is differentially governed by replication. Molecular cell
2009;35(5):716-23. doi: 10.1016/j.molcel.2009.06.034 [published Online First:
2009/09/15]
256. Li F, Zhang D, Fujise K. Characterization of fortilin, a novel antiapoptotic protein. J Biol
Chem 2001;276 doi: 10.1074/jbc.M108954200
257. Thiele H, Berger M, Skalweit A, et al. Expression of the gene and processed
pseudogenes encoding the human and rabbit translationally controlled tumour
protein (TCTP). Eur J Biochem 2000;267(17):5473-81. [published Online First:
2000/08/22]
258. Koziol MJ, Gurdon JB. TCTP in development and cancer. Biochem Res Int
2012;2012:105203. doi: 10.1155/2012/105203 [published Online First: 2012/06/01]
259. Tuynder M, Susini L, Prieur S, et al. Biological models and genes of tumor reversion:
cellular reprogramming through tpt1/TCTP and SIAH-1. Proc Natl Acad Sci USA
2002;99 doi: 10.1073/pnas.222470799
260. Telerman A, Amson R. The molecular programme of tumour reversion: the steps
beyond malignant transformation. Nat Rev Cancer 2009;9 doi: 10.1038/nrc2589
261. Bae SY, Kim HJ, Lee KJ, et al. Translationally controlled tumor protein induces epithelial
to mesenchymal transition and promotes cell migration, invasion and metastasis. Sci
Rep 2015;5:8061. doi: 10.1038/srep08061 [published Online First: 2015/01/28]
262. Andree H, Thiele H, Fahling M, et al. Expression of the human TPT1 gene coding for
translationally controlled tumor protein (TCTP) is regulated by CREB transcription
factors. Gene 2006;380(2):95-103. doi: 10.1016/j.gene.2006.05.018 [published Online
First: 2006/07/25]
263. Acunzo J, Baylot V, So A, et al. TCTP as therapeutic target in cancers. Cancer Treat Rev
2014;40(6):760-9. doi: 10.1016/j.ctrv.2014.02.007 [published Online First:
2014/03/22]
264. Rho SB, Lee JH, Park MS, et al. Anti-apoptotic protein TCTP controls the stability of the
tumor suppressor p53. FEBS Letters 2011;585(1):29-35. doi:
http://dx.doi.org/10.1016/j.febslet.2010.11.014
265. Zhang J, de Toledo SM, Pandey BN, et al. Role of the translationally controlled tumor
protein in DNA damage sensing and repair. Proc Natl Acad Sci U S A 2012;109(16):26.
266. Li S, Chen M, Xiong Q, et al. Characterization of the Translationally Controlled Tumor
Protein (TCTP) Interactome Reveals Novel Binding Partners in Human Cancer Cells.
Journal of Proteome Research 2016;15(10):3741-51. doi:
10.1021/acs.jproteome.6b00556
267. Li Y, Sun H, Zhang C, et al. Identification of translationally controlled tumor protein in
promotion of DNA homologous recombination repair in cancer cells by affinity
proteomics. Oncogene 2017 doi: 10.1038/onc.2017.289 [published Online First:
2017/08/29]
268. Li SJ, Jia HY, Wu D, et al. [Expression of translationally controlled tumor protein in
human breast cancer and its clinical significance]. Nan Fang Yi Ke Da Xue Xue Bao
2011;31(9):1560-3. [published Online First: 2011/09/29]
269. Amson R, Pece S, Lespagnol A, et al. Reciprocal repression between P53 and TCTP. Nat
Med 2012;18(1):91-99. doi:

169
http://www.nature.com/nm/journal/v18/n1/abs/nm.2546.html#supplementary-
information
270. Siegel RL, Miller KD, Jemal A. Cancer statistics, 2016. CA: a cancer journal for clinicians
2016;66(1):7-30. doi: 10.3322/caac.21332 [published Online First: 2016/01/09]
271. Heron M, Anderson RN. Changes in the Leading Cause of Death: Recent Patterns in
Heart Disease and Cancer Mortality. NCHS data brief 2016(254):1-8. [published
Online First: 2016/09/07]
272. Finegold JA, Asaria P, Francis DP. Mortality from ischaemic heart disease by country,
region, and age: Statistics from World Health Organisation and United Nations().
International Journal of Cardiology 2013;168(2):934-45. doi:
10.1016/j.ijcard.2012.10.046
273. Moten A, Schafer D, Ferrari M. Redefining global health priorities: Improving cancer
care in developing settings. Journal of Global Health 2014;4(1):010304. doi:
10.7189/jogh.04.010304
274. Society AC. Cancer Facts & Figures 2017. Atlanta, Georgia: American Cancer Society,
2017.
275. Torre LA, Bray F, Siegel RL, et al. Global cancer statistics, 2012. CA: a cancer journal for
clinicians 2015;65(2):87-108. doi: 10.3322/caac.21262 [published Online First:
2015/02/06]
276. Baskar R, Lee KA, Yeo R, et al. Cancer and Radiation Therapy: Current Advances and
Future Directions. International Journal of Medical Sciences 2012;9(3):193-99. doi:
10.7150/ijms.3635
277. Hanahan D, Weinberg RA. The hallmarks of cancer. Cell 2000;100(1):57-70. [published
Online First: 2000/01/27]
278. Lazebnik Y. What are the hallmarks of cancer? Nature Reviews Cancer 2010;10:232. doi:
10.1038/nrc2827
279. Pollack LA, Rowland JH, Crammer C, et al. Introduction: charting the landscape of
cancer survivors' health-related outcomes and care. Cancer 2009;115(18
Suppl):4265-9. doi: 10.1002/cncr.24579 [published Online First: 2009/09/05]
280. Song Q, Merajver SD, Li JZ. Cancer classification in the genomic era: five contemporary
problems. Human genomics 2015;9(1):27. doi: 10.1186/s40246-015-0049-8
281. Health NIo. SEER Training Module. Cancer Classification 2016, 2016.
282. Xie J. Molecular biology of basal and squamous cell carcinomas. Advances in
experimental medicine and biology 2008;624:241-51. doi: 10.1007/978-0-387-77574-
6_19 [published Online First: 2008/03/20]
283. Montagna E, Lopes OS. Molecular basis of basal cell carcinoma. Anais brasileiros de
dermatologia 2017;92(4):517-20. doi: 10.1590/abd1806-4841.20176544 [published
Online First: 2017/09/28]
284. Yan W, Wistuba, II, Emmert-Buck MR, et al. Squamous Cell Carcinoma - Similarities and
Differences among Anatomical Sites. American journal of cancer research
2011;1(3):275-300. [published Online First: 2011/09/23]
285. Foundation TOC. Oral Cancer Facts.
286. Fazeli MS, Keramati MR. Rectal cancer: a review. Medical Journal of the Islamic Republic
of Iran 2015;29:171-71.
287. Dakubo GD. Prostate Cancer Biomarkers in Circulation. Cancer Biomarkers in Body
Fluids: Biomarkers in Circulation. Cham: Springer International Publishing 2017:339-
69.

170
288. Munkley J, Vodak D, Livermore KE, et al. Glycosylation is an Androgen-Regulated
Process Essential for Prostate Cancer Cell Viability(). EBioMedicine 2016;8:103-16.
doi: 10.1016/j.ebiom.2016.04.018
289. Siegel RL, Miller KD, Jemal A. Cancer statistics, 2017. CA: a cancer journal for clinicians
2017;67(1):7-30. doi: 10.3322/caac.21387
290. Nathanson KL, Wooster R, Weber BL. Breast cancer genetics: what we know and what
we need. Nat Med 2001;7(5):552-6. doi: 10.1038/87876 [published Online First:
2001/05/01]
291. Weitzel JN, Blazer KR, MacDonald DJ, et al. Genetics, genomics, and cancer risk
assessment: State of the Art and Future Directions in the Era of Personalized
Medicine. CA: a cancer journal for clinicians 2011;61(5):327-59. doi:
10.3322/caac.20128 [published Online First: 2011/08/23]
292. Dawood S. Triple-Negative Breast Cancer. Drugs 2010;70(17):2247-58. doi:
10.2165/11538150-000000000-00000
293. Berry DA, Inoue L, Shen Y, et al. Modeling the impact of treatment and screening on
U.S. breast cancer mortality: a Bayesian approach. Journal of the National Cancer
Institute Monographs 2006(36):30-6. doi: 10.1093/jncimonographs/lgj006 [published
Online First: 2006/10/13]
294. Blackwood MA, Weber BL. BRCA1 and BRCA2: from molecular genetics to clinical
medicine. J Clin Oncol 1998;16(5):1969-77. doi: 10.1200/jco.1998.16.5.1969
[published Online First: 1998/05/20]
295. NCCN. NCCN Guidelines genetic/familial high-risk assessment: breast and ovarian.
2016;V.2.2016
296. Lichtenstein P, Holm NV, Verkasalo PK, et al. Environmental and heritable factors in the
causation of cancer--analyses of cohorts of twins from Sweden, Denmark, and
Finland. N Engl J Med 2000;343(2):78-85. doi: 10.1056/nejm200007133430201
[published Online First: 2000/07/13]
297. Bogdanova N, Helbig S, Dörk T. Hereditary breast cancer: ever more pieces to the
polygenic puzzle. Hereditary Cancer in Clinical Practice 2013;11(1):12-12. doi:
10.1186/1897-4287-11-12
298. Michailidou K, Lindström S, Dennis J, et al. Association analysis identifies 65 new breast
cancer risk loci. Nature 2017;551:92. doi: 10.1038/nature24284
299. Dong H, Nebert DW, Bruford EA, et al. Update of the human and mouse Fanconi anemia
genes. Human genomics 2015;9:32. doi: 10.1186/s40246-015-0054-y [published
Online First: 2015/11/26]
300. Miki Y, Swensen J, Shattuck-Eidens D, et al. A strong candidate for the breast and
ovarian cancer susceptibility gene BRCA1. Science 1994;266(5182):66-71. [published
Online First: 1994/10/07]
301. Wooster R, Bignell G, Lancaster J, et al. Identification of the breast cancer susceptibility
gene BRCA2. Nature 1995;378(6559):789-92. doi: 10.1038/378789a0 [published
Online First: 1995/12/21]
302. Pasche B. 1. RECENT ADVANCES IN BREAST CANCER GENETICS. Cancer treatment and
research 2008;141:1-10.
303. Varley JM. Germline TP53 mutations and Li-Fraumeni syndrome. Human mutation
2003;21(3):313-20. doi: 10.1002/humu.10185 [published Online First: 2003/03/06]
304. Mouchawar J, Korch C, Byers T, et al. Population-based estimate of the contribution of
TP53 mutations to subgroups of early-onset breast cancer: Australian Breast Cancer

171
Family Study. Cancer Res 2010;70(12):4795-800. doi: 10.1158/0008-5472.can-09-
0851 [published Online First: 2010/05/27]
305. Rahman N, Seal S, Thompson D, et al. PALB2, which encodes a BRCA2-interacting
protein, is a breast cancer susceptibility gene. Nat Genet 2007;39(2):165-7. doi:
10.1038/ng1959 [published Online First: 2007/01/04]
306. Slavin TP, Maxwell KN, Lilyquist J, et al. The contribution of pathogenic variants in
breast cancer susceptibility genes to familial breast cancer risk. NPJ Breast Cancer
2017;3:22. doi: 10.1038/s41523-017-0024-8
307. Renwick A, Thompson D, Seal S, et al. ATM mutations that cause ataxia-telangiectasia
are breast cancer susceptibility alleles. Nat Genet 2006;38(8):873-5. doi:
10.1038/ng1837 [published Online First: 2006/07/13]
308. De Brakeleer S, De Greve J, Loris R, et al. Cancer predisposing missense and protein
truncating BARD1 mutations in non-BRCA1 or BRCA2 breast cancer families. Human
mutation 2010;31(3):E1175-85. doi: 10.1002/humu.21200 [published Online First:
2010/01/16]
309. Damiola F, Pertesi M, Oliver J, et al. Rare key functional domain missense substitutions
in MRE11A, RAD50, and NBN contribute to breast cancer susceptibility: results from a
Breast Cancer Family Registry case-control mutation-screening study. Breast Cancer
Res 2014;16(3):R58. doi: 10.1186/bcr3669 [published Online First: 2014/06/05]
310. Gorski B, Debniak T, Masojc B, et al. Germline 657del5 mutation in the NBS1 gene in
breast cancer patients. Int J Cancer 2003;106(3):379-81. doi: 10.1002/ijc.11231
[published Online First: 2003/07/08]
311. Phipps RF, Perry PM. Familial breast cancer. Postgraduate medical journal
1988;64(757):847-9. [published Online First: 1988/11/01]
312. Cancer Genome. Atlas N. Comprehensive molecular portraits of human breast tumours.
Nature 2012;490(7418):61-70. doi: 10.1038/nature11412 [published Online First:
2012/09/25]
313. Tiwari SR, Mishra P, Abraham J. Neratinib, A Novel HER2-Targeted Tyrosine Kinase
Inhibitor. Clinical breast cancer 2016;16(5):344-48. doi: 10.1016/j.clbc.2016.05.016
[published Online First: 2016/07/14]
314. Dawood S, Broglio K, Buzdar AU, et al. Prognosis of women with metastatic breast
cancer by HER2 status and trastuzumab treatment: an institutional-based review. J
Clin Oncol 2010;28(1):92-8. doi: 10.1200/jco.2008.19.9844 [published Online First:
2009/11/26]
315. Rattay T, Talbot CJ. Finding the genetic determinants of adverse reactions to
radiotherapy. Clin Oncol (R Coll Radiol) 2014;26(5):301-8. doi:
10.1016/j.clon.2014.02.001 [published Online First: 2014/04/08]
316. Foray N, Colin C, Bourguignon M. 100 years of individual radiosensitivity: how we have
forgotten the evidence. Radiology 2012;264(3):627-31. doi: 10.1148/radiol.12112560
[published Online First: 2012/08/25]
317. Foray N, Randrianarison V, Marot D, et al. Gamma-rays-induced death of human cells
carrying mutations of BRCA1 or BRCA2. Oncogene 1999;18(51):7334-42. doi:
10.1038/sj.onc.1203165 [published Online First: 1999/12/22]
318. Löbrich M, Jeggo PA. The two edges of the ATM sword: co-operation between repair
and checkpoint functions. Radiother Oncol 2005;76(2):112-8. doi:
10.1016/j.radonc.2005.06.027 [published Online First: 2005/07/20]
172
319. Tutt A, Ashworth A. The relationship between the roles of BRCA genes in DNA repair
and cancer predisposition. Trends in molecular medicine 2002;8(12):571-6. [published
Online First: 2002/12/10]
320. Deschavanne PJ, Fertil B. A review of human cell radiosensitivity in vitro. Int J Radiat
Oncol Biol Phys 1996;34(1):251-66. [published Online First: 1996/01/01]
321. Joubert A, Zimmerman KM, Bencokova Z, et al. DNA double-strand break repair defects
in syndromes associated with acute radiation response: at least two different assays
to predict intrinsic radiosensitivity? Int J Radiat Biol 2008;84(2):107-25. doi:
10.1080/09553000701797039 [published Online First: 2008/02/05]
322. Colin C, Devic C, Noël A, et al. DNA double-strand breaks induced by mammographic
screening procedures in human mammary epithelial cells. International Journal of
Radiation Biology 2011;87(11):1103-12. doi: 10.3109/09553002.2011.608410
323. Colin C, Granzotto A, Devic C, et al. MRE11 and H2AX biomarkers in the response to
low-dose exposure: Balance between individual susceptibility to radiosensitivity and
to genomic instability. International Journal of Low Radiation 2011;8(2):96-106.
324. Słonina D, Biesaga B, Urbaoski K, et al. The Response of Primary Keratinocytes and Fibroblasts from Cancer Patients to Multiple Low-Dose Irradiations. Radiation
research 2007;168(5):631-36. doi: 10.1667/RR1001.1
325. Słonina D, Biesaga B, Urbaoski K, et al. Low-Dose Radiation Response of Primary
Keratinocytes and Fibroblasts from Patients with Cervix Cancer. Radiation research
2007;167(3):251-59. doi: 10.1667/RR0649
326. Bogdanova N, Jguburia, N., Neuhäuser, K., Wieland, B., Stamm, G., Wacker, F.,
Christiansen, H., Dörk, T. Chromosomal radiosensitivity of breast epithelial cells and
lymphocytes in repeated diagnostic CT scans. International Wolfsberg Meeting on
Molecular Radiation Biology/Oncology. Ermatingen, Switzerland, 2017 36.
327. Bogdanova N, Jguburia, N., Neuhäuser, K., Wieland, B., Stamm, G., Wacker, F.,
Christiansen, H., Dörk, T. Chromosomal radiosensitivity of breast epithelial cells and
lymphocytes in repeated diagnostic CT scans. Radiology (in review)
328. Barnett GC, West CM, Dunning AM, et al. Normal tissue reactions to radiotherapy:
towards tailoring treatment dose by genotype. Nat Rev Cancer 2009;9
329. Delaney G, Jacob S, Featherstone C, et al. The role of radiotherapy in cancer treatment:
estimating optimal utilization from a review of evidence-based clinical guidelines.
Cancer 2005;104
330. Begg AC, Stewart FA, Vens C. Strategies to improve radiotherapy with targeted drugs.
Nat Rev Cancer 2011;11(4):239-53. doi: 10.1038/nrc3007 [published Online First:
2011/03/25]
331. Observation concernant un cas de cancer de l’estomac traité par les rayons Roentgen. Lyon medical; 1896 July 26, 1896; Lyon, France. Librairie Médicale de Louis Savy.
332. Zeegers D, Venkatesan S, Koh SW, et al. Biomarkers of Ionizing Radiation Exposure: A
Multiparametric Approach. Genome integrity 2017;8:6. doi: 10.4103/2041-
9414.198911 [published Online First: 2017/03/03]
333. Riley PA. Free Radicals in Biology: Oxidative Stress and the Effects of Ionizing Radiation.
International Journal of Radiation Biology 1994;65(1):27-33. doi:
10.1080/09553009414550041
334. Jackson SP, Bartek J. The DNA-damage response in human biology and disease. Nature
2009;461(7267):1071-8. doi: 10.1038/nature08467 [published Online First:
2009/10/23]
173
335. Serwer DP. Rise of radiation protection: science, medicine and technology in society,
1896--1935. Upton, N.Y.: Brookhaven National Lab., 1976:291.
336. Bergonie J. Interprétation de quelques résultats de la radiothérapie et essai de fixation
d'une technique rationnelle. CR Acad Sci 1906;143:983-85.
337. Une nouvelle unité de quantité de rayons X: l’unité I. Discussions. Congress of the French Association for the Advancement of Science; 1906; Lyon, France. Masson.
338. Puck TT, Marcus PI. Action of x-rays on mammalian cells. J Exp Med 1956;103
339. Bentzen SM. Preventing or reducing late side effects of radiation therapy: radiobiology
meets molecular pathology. Nat Rev Cancer 2006;6
340. Perez C, Brady L. Late radiation morbidity scoring criteria (RTOG, EORTC). Perez CA,
Brady LW (eds) 1993
341. Group RTO. RTOG Acute Radiation Morbidity Scoring Criteria 2000.
342. LENT SOMA tables. Radiother Oncol 1995;35(1):17-60. [published Online First:
1995/04/01]
343. LENT SOMA scales for all anatomic sites. Int J Radiat Oncol Biol Phys 1995;31(5):1049-
91. [published Online First: 1995/03/30]
344. Institute NC. Common Terminology Criteria for Adverse Events, Version 3.0, 2006.
345. Chen AP, Setser A, Anadkat MJ, et al. Grading dermatologic adverse events of cancer
treatments: The Common Terminology Criteria for Adverse Events Version 4.0.
Journal of the American Academy of Dermatology 2012;67(5):1025-39. doi:
https://doi.org/10.1016/j.jaad.2012.02.010
346. Tibbs MK. Wound healing following radiation therapy: a review. Radiotherapy and
Oncology 1997;42(2):99-106. doi: https://doi.org/10.1016/S0167-8140(96)01880-4
347. Burnet NG, Johansen J, Turesson I, et al. Describing patients' normal tissue reactions:
concerning the possibility of individualising radiotherapy dose prescriptions based on
potential predictive assays of normal tissue radiosensitivity. Steering Committee of
the BioMed2 European Union Concerted Action Programme on the Development of
Predictive Tests of Normal Tissue Response to Radiation Therapy. Int J Cancer
1998;79(6):606-13. [published Online First: 1998/12/08]
348. Turesson I, Nyman J, Holmberg E, et al. Prognostic factors for acute and late skin
reactions in radiotherapy patients. Int J Radiat Oncol Biol Phys 1996;36(5):1065-75.
[published Online First: 1996/12/01]
349. Holscher T, Bentzen SM, Baumann M. Influence of connective tissue diseases on the
expression of radiation side effects: a systematic review. Radiother Oncol
2006;78(2):123-30. doi: 10.1016/j.radonc.2005.12.013 [published Online First:
2006/02/01]
350. Bentzen SM, Overgaard J. Patient-to-Patient Variability in the Expression of Radiation-
Induced Normal Tissue Injury. Semin Radiat Oncol 1994;4(2):68-80. doi:
10.1053/srao00400068 [published Online First: 1994/04/01]
351. Turesson I. Individual variation and dose dependency in the progression rate of skin
telangiectasia. Int J Radiat Oncol Biol Phys 1990;19(6):1569-74. [published Online
First: 1990/12/01]
352. Bentzen SM, Agrawal RK, Aird EG, et al. The UK Standardisation of Breast Radiotherapy
(START) Trial A of radiotherapy hypofractionation for treatment of early breast
cancer: a randomised trial. Lancet Oncol 2008;9(4):331-41. doi: 10.1016/s1470-
2045(08)70077-9 [published Online First: 2008/03/22]
174
353. Bonetti A, Leone R, Muggia F, et al. Platinum and other heavy metal compounds in
cancer chemotherapy: Molecular mechanisms and clinical applications: Springer
Science & Business Media 2009.
354. van Kuilenburg ABP. Dihydropyrimidine dehydrogenase and the efficacy and toxicity of
5-fluorouracil. European Journal of Cancer 2004;40(7):939-50. doi:
https://doi.org/10.1016/j.ejca.2003.12.004
355. Sato Y, Motoyama S, Saito H, et al. Novel Candidate Biomarkers of
Chemoradiosensitivity in Esophageal Squamous Cell Carcinoma: A Systematic Review.
European surgical research Europaische chirurgische Forschung Recherches
chirurgicales europeennes 2016;56(3-4):141-53. doi: 10.1159/000443607 [published
Online First: 2016/02/13]
356. Tassone P, Tagliaferri P, Perricelli A, et al. BRCA1 expression modulates
chemosensitivity of BRCA1-defective HCC1937 human breast cancer cells. Br J Cancer
2003;88(8):1285-91.
357. Okumura H, Uchikado Y, Setoyama T, et al. Biomarkers for predicting the response of
esophageal squamous cell carcinoma to neoadjuvant chemoradiation therapy.
Surgery Today 2014;44(3):421-28. doi: 10.1007/s00595-013-0580-y
358. Grade M, Wolff HA, Gaedcke J, et al. The molecular basis of chemoradiosensitivity in
rectal cancer:implications for personalized therapies. Langenbeck's Archives of
Surgery 2012;397(4):543-55. doi: 10.1007/s00423-012-0929-5
359. Steel GG, Peckham MJ. Exploitable mechanisms in combined radiotherapy-
chemotherapy: the concept of additivity. Int J Radiat Oncol Biol Phys 1979;5(1):85-91.
[published Online First: 1979/01/01]
360. Wolff HA, Daldrup B, Jung K, et al. High-Grade Acute Organ Toxicity as Positive
Prognostic Factor in Adjuvant Radiation and Chemotherapy for Locally Advanced
Head and Neck Cancer. Radiology 2011;258(3):864-71. doi: 10.1148/radiol.10100705
361. Attard-Montalto S, Saha V, Kingston J, et al. Increased radiosensitivity in a child with T-
cell non-Hodgkin's lymphoma. Medical and Pediatric Oncology 1996;27(6):565-70.
doi: 10.1002/(SICI)1096-911X(199612)27:6<565::AID-MPO11>3.0.CO;2-7
362. Plowman PN, Bridges BA, Arlett CF, et al. An instance of clinical radiation morbidity and
cellular radiosensitivity, not associated with ataxia-telangiectasia. The British Journal
of Radiology 1990;63(752):624-28. doi: 10.1259/0007-1285-63-752-624
363. Pietrucha BM, Heropolitanska-Pliszka E, Wakulinska A, et al. Ataxia-Telangiectasia With
Hyper-IgM and Wilms Tumor: Fatal Reaction to Irradiation. Journal of Pediatric
Hematology/Oncology 2010;32(1):e28-e30. doi: 10.1097/MPH.0b013e3181bfd3d9
364. Mogi S, Butcher CE, Oh DH. DNA polymerase eta reduces the gamma-H2AX response to
psoralen interstrand crosslinks in human cells. Experimental cell research
2008;314(4):887-95. doi: 10.1016/j.yexcr.2007.10.031 [published Online First:
2007/12/11]
365. Ozgenc A, Loeb LA. Current advances in unraveling the function of the Werner
syndrome protein. Mutat Res 2005;577(1-2):237-51. doi:
10.1016/j.mrfmmm.2005.03.020 [published Online First: 2005/06/11]
366. Marteijn JA, Lans H, Vermeulen W, et al. Understanding nucleotide excision repair and
its roles in cancer and ageing. Nature reviews Molecular cell biology 2014;15(7):465-
81. doi: 10.1038/nrm3822 [published Online First: 2014/06/24]
367. Altmann T, Gennery AR. DNA ligase IV syndrome; a review. Orphanet Journal of Rare
Diseases 2016;11:137. doi: 10.1186/s13023-016-0520-1
175
368. Pennarun G, Hoffschir F, Revaud D, et al. ATR contributes to telomere maintenance in
human cells. Nucleic Acids Research 2010;38(9):2955-63. doi: 10.1093/nar/gkp1248
369. Scalet D, Balestra D, Rohban S, et al. Exploring Splicing-Switching Molecules For Seckel
Syndrome Therapy. Biochimica et Biophysica Acta (BBA) - Molecular Basis of Disease
2017;1863(1):15-20. doi: https://doi.org/10.1016/j.bbadis.2016.09.011
370. Chrzanowska KH, Gregorek H, Dembowska-Bagioska B, et al. Nijmegen breakage syndrome (NBS). Orphanet Journal of Rare Diseases 2012;7:13-13. doi:
10.1186/1750-1172-7-13
371. Feight D, Baney T, Bruce S, et al. Putting evidence into practice. Clinical journal of
oncology nursing 2011;15(5):481-92. doi: 10.1188/11.cjon.481-492 [published Online
First: 2011/09/29]
372. Schnur JB, Love B, Scheckner BL, et al. A systematic review of patient-rated measures of
radiodermatitis in breast cancer radiotherapy. American journal of clinical oncology
2011;34(5):529-36. doi: 10.1097/COC.0b013e3181e84b36 [published Online First:
2010/09/15]
373. DahlBerg WK, Little JB. Response of dermal fibroblast cultures from patients with
unusually severe responses to radiotherapy and from ataxia telangiectasia
heterozygotes to fractionated radiation. Clin Cancer Res 1995;1(8):785-90. [published
Online First: 1995/08/01]
374. Jung H, Beck-Bornholdt HP, Svoboda V, et al. Quantification of late complications after
radiation therapy. Radiother Oncol 2001;61(3):233-46. [published Online First:
2001/12/04]
375. Dorr W, Hendry JH. Consequential late effects in normal tissues. Radiother Oncol
2001;61(3):223-31. [published Online First: 2001/12/04]
376. Ash D. Lessons from Epinal. Clin Oncol (R Coll Radiol) 2007;19(8):614-5. doi:
10.1016/j.clon.2007.06.011 [published Online First: 2007/07/28]
377. Iannuzzi CM, Atencio DP, Green S, et al. ATM mutations in female breast cancer
patients predict for an increase in radiation-induced late effects. Int J Radiat Oncol
Biol Phys 2002;52(3):606-13. [published Online First: 2002/02/19]
378. Bray FN, Simmons BJ, Wolfson AH, et al. Acute and Chronic Cutaneous Reactions to
Ionizing Radiation Therapy. Dermatology and Therapy 2016;6(2):185-206. doi:
10.1007/s13555-016-0120-y
379. Sanford KK, Parshad R, Gantt R, et al. Factors affecting and significance of G2 chromatin
radiosensitivity in predisposition to cancer. Int J Radiat Biol 1989;55(6):963-81.
[published Online First: 1989/06/01]
380. Swift M, Morrell D, Cromartie E, et al. The incidence and gene frequency of ataxia-
telangiectasia in the United States. Am J Hum Genet 1986;39(5):573-83. [published
Online First: 1986/11/01]
381. Rothblum-Oviatt C, Wright J, Lefton-Greif MA, et al. Ataxia telangiectasia: a review.
Orphanet Journal of Rare Diseases 2016;11:159. doi: 10.1186/s13023-016-0543-7
382. Sahin E, Depinho RA. Linking functional decline of telomeres, mitochondria and stem
cells during ageing. Nature 2010;464(7288):520-8. doi: 10.1038/nature08982
[published Online First: 2010/03/26]
383. Hanada K, Hickson ID. Molecular genetics of RecQ helicase disorders. Cellular and
molecular life sciences : CMLS 2007;64(17):2306-22. doi: 10.1007/s00018-007-7121-z
[published Online First: 2007/06/16]

176
384. Ellis NA, Sander M, Harris CC, et al. Bloom's syndrome workshop focuses on the
functional specificities of RecQ helicases. Mech Ageing Dev 2008;129(11):681-91.
[published Online First: 2009/02/25]
385. Machwe A, Xiao L, Groden J, et al. RecQ family members combine strand pairing and
unwinding activities to catalyze strand exchange. J Biol Chem 2005;280(24):23397-
407. doi: 10.1074/jbc.M414130200 [published Online First: 2005/04/23]
386. Yu CE, Oshima J, Fu YH, et al. Positional cloning of the Werner's syndrome gene. Science
1996;272(5259):258-62. [published Online First: 1996/04/12]
387. Crabbe L, Jauch A, Naeger CM, et al. Telomere dysfunction as a cause of genomic
instability in Werner syndrome. Proc Natl Acad Sci U S A 2007;104(7):2205-10. doi:
10.1073/pnas.0609410104 [published Online First: 2007/02/08]
388. Puzianowska-Kuznicka M, Kuznicki J. Genetic alterations in accelerated ageing
syndromes. Do they play a role in natural ageing? The international journal of
biochemistry & cell biology 2005;37(5):947-60. doi: 10.1016/j.biocel.2004.10.011
[published Online First: 2005/03/04]
389. Werner SR, Prahalad AK, Yang J, et al. RECQL4-deficient cells are hypersensitive to
oxidative stress/damage: Insights for osteosarcoma prevalence and heterogeneity in
Rothmund-Thomson syndrome. Biochemical and biophysical research
communications 2006;345(1):403-9. doi: 10.1016/j.bbrc.2006.04.093 [published
Online First: 2006/05/09]
390. Croteau DL, Rossi ML, Canugovi C, et al. RECQL4 localizes to mitochondria and preserves
mitochondrial DNA integrity. Aging cell 2012;11(3):456-66. doi: 10.1111/j.1474-
9726.2012.00803.x [published Online First: 2012/02/03]
391. Cleaver JE. Cancer in xeroderma pigmentosum and related disorders of DNA repair. Nat
Rev Cancer 2005;5(7):564-73. doi: 10.1038/nrc1652 [published Online First:
2005/08/03]
392. Tan WH, Baris H, Robson CD, et al. Cockayne syndrome: the developing phenotype.
American journal of medical genetics Part A 2005;135(2):214-6. doi:
10.1002/ajmg.a.30731 [published Online First: 2005/05/12]
393. Laugel V. Cockayne syndrome: the expanding clinical and mutational spectrum. Mech
Ageing Dev 2013;134(5-6):161-70. doi: 10.1016/j.mad.2013.02.006 [published Online
First: 2013/02/23]
394. Karikkineth AC, Scheibye-Knudsen M, Fivenson E, et al. Cockayne syndrome: Clinical
features, model systems and pathways. Ageing research reviews 2017;33:3-17. doi:
10.1016/j.arr.2016.08.002 [published Online First: 2016/10/22]
395. Itin PH, Sarasin A, Pittelkow MR. Trichothiodystrophy: update on the sulfur-deficient
brittle hair syndromes. Journal of the American Academy of Dermatology
2001;44(6):891-920; quiz 21-4. doi: 10.1067/mjd.2001.114294 [published Online
First: 2001/05/23]
396. Bogliolo M, Surralles J. Fanconi anemia: a model disease for studies on human genetics
and advanced therapeutics. Curr Opin Genet Dev 2015;33:32-40. doi:
10.1016/j.gde.2015.07.002 [published Online First: 2015/08/10]
397. Deakyne JS, Mazin AV. Fanconi anemia: at the crossroads of DNA repair. Biochemistry
Biokhimiia 2011;76(1):36-48. [published Online First: 2011/05/17]
398. Fukuda T, Sumiyoshi T, Takahashi M, et al. Alterations of the double-strand break repair
gene MRE11 in cancer. Cancer Res 2001;61(1):23-6. [published Online First:
2001/02/24]
177
399. Stewart GS, Maser RS, Stankovic T, et al. The DNA Double-Strand Break Repair Gene
hMRE11 Is Mutated in Individuals with an Ataxia-Telangiectasia-like Disorder. Cell
1999;99(6):577-87. doi: https://doi.org/10.1016/S0092-8674(00)81547-0
400. Waltes R, Kalb R, Gatei M, et al. Human RAD50 deficiency in a Nijmegen breakage
syndrome-like disorder. Am J Hum Genet 2009;84(5):605-16. doi:
10.1016/j.ajhg.2009.04.010 [published Online First: 2009/05/05]
401. Shanske A, Caride DG, Menasse-Palmer L, et al. Central nervous system anomalies in
Seckel syndrome: report of a new family and review of the literature. American
journal of medical genetics 1997;70(2):155-8. [published Online First: 1997/05/16]
402. Dewey WC, Ling CC, Meyn RE. Radiation-induced apoptosis: relevance to radiotherapy.
Int J Radiat Oncol Biol Phys 1995;33(4):781-96. doi: 10.1016/0360-3016(95)00214-8
[published Online First: 1995/11/01]
403. Rupnow BA, Knox SJ. The role of radiation-induced apoptosis as a determinant of tumor
responses to radiation therapy. Apoptosis : an international journal on programmed
cell death 1999;4(2):115-43. [published Online First: 2003/11/25]
404. Cragg MS, Harris C, Strasser A, et al. Unleashing the power of inhibitors of oncogenic
kinases through BH3 mimetics. Nat Rev Cancer 2009;9(5):321-6. doi:
10.1038/nrc2615 [published Online First: 2009/04/04]
405. Jonathan EC, Bernhard EJ, McKenna WG. How does radiation kill cells? Current opinion
in chemical biology 1999;3(1):77-83. [published Online First: 1999/02/18]
406. Schmitt CA. Senescence, apoptosis and therapy--cutting the lifelines of cancer. Nat Rev
Cancer 2003;3(4):286-95. doi: 10.1038/nrc1044 [published Online First: 2003/04/03]
407. Vakifahmetoglu H, Olsson M, Zhivotovsky B. Death through a tragedy: mitotic
catastrophe. Cell death and differentiation 2008;15(7):1153-62. doi:
10.1038/cdd.2008.47 [published Online First: 2008/04/12]
408. Hotchkiss RS, Strasser A, McDunn JE, et al. Cell death. N Engl J Med 2009;361(16):1570-
83. doi: 10.1056/NEJMra0901217 [published Online First: 2009/10/16]
409. Brandsma D, Stalpers L, Taal W, et al. Clinical features, mechanisms, and management
of pseudoprogression in malignant gliomas. Lancet Oncol 2008;9(5):453-61. doi:
10.1016/s1470-2045(08)70125-6 [published Online First: 2008/05/03]
410. Schmitt CA, Fridman JS, Yang M, et al. A senescence program controlled by p53 and
p16INK4a contributes to the outcome of cancer therapy. Cell 2002;109(3):335-46.
[published Online First: 2002/05/23]
411. Roninson IB. Tumor cell senescence in cancer treatment. Cancer Res 2003;63(11):2705-
15. [published Online First: 2003/06/05]
412. Schmitt CA. Cellular senescence and cancer treatment. Biochimica et biophysica acta
2007;1775(1):5-20. doi: 10.1016/j.bbcan.2006.08.005 [published Online First:
2006/10/10]
413. Kondo Y, Kanzawa T, Sawaya R, et al. The role of autophagy in cancer development and
response to therapy. Nat Rev Cancer 2005;5(9):726-34. doi: 10.1038/nrc1692
[published Online First: 2005/09/09]
414. Ito H, Daido S, Kanzawa T, et al. Radiation-induced autophagy is associated with LC3
and its inhibition sensitizes malignant glioma cells. International journal of oncology
2005;26(5):1401-10. [published Online First: 2005/04/06]
415. Kuwahara Y, Oikawa T, Ochiai Y, et al. Enhancement of autophagy is a potential
modality for tumors refractory to radiotherapy. Cell death & disease 2011;2:e177.
doi: 10.1038/cddis.2011.56 [published Online First: 2011/07/01]

178
416. Gatti RA. The inherited basis of human radiosensitivity. Acta Oncol 2001;40(6):702-11.
[published Online First: 2002/01/05]
417. Taylor AM, Harnden DG, Arlett CF, et al. Ataxia telangiectasia: a human mutation with
abnormal radiation sensitivity. Nature 1975;258
418. Savitsky K, Sfez S, Tagle DA, et al. The complete sequence of the coding region of the
ATM gene reveals similarity to cell cycle regulators in different species. Hum Mol
Genet 1995;4(11):2025-32. [published Online First: 1995/11/01]
419. Schroder-Heurich B, Bogdanova N, Wieland B, et al. Functional deficiency of NBN, the
Nijmegen breakage syndrome protein, in a p.R215W mutant breast cancer cell line.
BMC cancer 2014;14:434. doi: 10.1186/1471-2407-14-434 [published Online First:
2014/06/15]
420. Kawata T, Ito H, George K, et al. Radiation-Induced Chromosome Aberrations in Ataxia
Telangiectasia Cells: High Frequency of Deletions and Misrejoining Detected by
Fluorescence In Situ Hybridization. Radiation research 2003;159(5):597-603. doi:
10.1667/0033-7587(2003)159[0597:RCAIAT]2.0.CO;2
421. Andreassen CN. Can risk of radiotherapy-induced normal tissue complications be
predicted from genetic profiles? Acta Oncol 2005;44(8):801-15. doi:
10.1080/02841860500374513 [published Online First: 2005/12/08]
422. Leong T, Borg M, McKay M. Clinical and cellular radiosensitivity in inherited human
syndromes. Clin Oncol (R Coll Radiol) 2004;16(3):206-9. [published Online First:
2004/06/12]
423. Oppitz U, Bernthaler U, Schindler D, et al. Sequence analysis of the ATM gene in 20
patients with RTOG grade 3 or 4 acute and/or late tissue radiation side effects. Int J
Radiat Oncol Biol Phys 1999;44(5):981-8. [published Online First: 1999/07/27]
424. Borgmann K, Roper B, El-Awady R, et al. Indicators of late normal tissue response after
radiotherapy for head and neck cancer: fibroblasts, lymphocytes, genetics, DNA
repair, and chromosome aberrations. Radiother Oncol 2002;64(2):141-52. [published
Online First: 2002/09/21]
425. Rave-Fränk M, Virsik-Kopp P, Dörk T, et al. Comparison of radiosensitivity of
lymphocytes and fibroblasts from three donors with fibroblasts identified as
radiosensitive. STRAHLENTHERAPIE UND ONKOLOGIE 2002;178:85.
426. Tucker SL, Turesson I, Thames HD. Evidence for individual differences in the
radiosensitivity of human skin. European Journal of Cancer 1992;28(11):1783-91. doi:
10.1016/0959-8049(92)90004-L
427. Borger JH, Kemperman H, Smitt HS, et al. Dose and volume effects on fibrosis after
breast conservation therapy. Int J Radiat Oncol Biol Phys 1994;30(5):1073-81.
[published Online First: 1994/12/01]
428. Safwat A, Bentzen SM, Turesson I, et al. Deterministic rather than stochastic factors
explain most of the variation in the expression of skin telangiectasia after
radiotherapy. Int J Radiat Oncol Biol Phys 2002;52(1):198-204. [published Online
First: 2002/01/05]
429. Andreassen CN. Searching for genetic determinants of normal tissue radiosensitivity--
are we on the right track? Radiother Oncol 2010;97(1):1-8. doi:
10.1016/j.radonc.2010.07.018 [published Online First: 2010/09/08]
430. West CM. Invited review: intrinsic radiosensitivity as a predictor of patient response to
radiotherapy. Br J Radiol 1995;68(812):827-37. doi: 10.1259/0007-1285-68-812-827
[published Online First: 1995/08/01]
179
431. Dikomey E, Borgmann K, Peacock J, et al. Why recent studies relating normal tissue
response to individual radiosensitivity might have failed and how new studies should
be performed. International Journal of Radiation Oncology*Biology*Physics
2003;56(4):1194-200. doi: https://doi.org/10.1016/S0360-3016(03)00188-3
432. Bowen T, Jenkins RH, Fraser DJ. MicroRNAs, transforming growth factor beta-1, and
tissue fibrosis. The Journal of pathology 2013;229(2):274-85. doi: 10.1002/path.4119
[published Online First: 2012/10/09]
433. Gordon KJ, Blobe GC. Role of transforming growth factor-β superfamily signaling pathways in human disease. Biochimica et Biophysica Acta (BBA) - Molecular Basis of
Disease 2008;1782(4):197-228. doi: https://doi.org/10.1016/j.bbadis.2008.01.006
434. Andreassen CN, Alsner J, Overgaard J. Does variability in normal tissue reactions after
radiotherapy have a genetic basis--where and how to look for it? Radiother Oncol
2002;64(2):131-40. [published Online First: 2002/09/21]
435. Andreassen CN, Alsner J, Overgaard M, et al. Prediction of normal tissue radiosensitivity
from polymorphisms in candidate genes. Radiother Oncol 2003;69
436. Fachal L, Gomez-Caamano A, Sanchez-Garcia M, et al. TGFbeta1 SNPs and radio-induced
toxicity in prostate cancer patients. Radiother Oncol 2012;103(2):206-9. doi:
10.1016/j.radonc.2012.01.015 [published Online First: 2012/03/06]
437. Barnett GC, Elliott RM, Alsner J, et al. Individual patient data meta-analysis shows no
association between the SNP rs1800469 in TGFB and late radiotherapy toxicity.
Radiother Oncol 2012;105(3):289-95. doi: 10.1016/j.radonc.2012.10.017 [published
Online First: 2012/12/04]
438. Barnett GC, Coles CE, Burnet NG, et al. No association between SNPs regulating TGF-
beta1 secretion and late radiotherapy toxicity to the breast: results from the RAPPER
study. Radiother Oncol 2010;97
439. Andreassen CN, Alsner J. Genetic variants and normal tissue toxicity after radiotherapy:
a systematic review. Radiother Oncol 2009;92
440. West C, Rosenstein BS, Alsner J, et al. Establishment of a Radiogenomics Consortium.
Int J Radiat Oncol Biol Phys 2010;76
441. Watts JA, Morley M, Burdick JT, et al. Gene expression phenotype in heterozygous
carriers of ataxia telangiectasia. Am J Hum Genet 2002;71(4):791-800. doi:
10.1086/342974 [published Online First: 2002/09/13]
442. Badie C, Dziwura S, Raffy C, et al. Aberrant CDKN1A transcriptional response associates
with abnormal sensitivity to radiation treatment. Br J Cancer 2008;98
443. Svensson JP, Stalpers LJ, Esveldt-van Lange RE, et al. Analysis of gene expression using
gene sets discriminates cancer patients with and without late radiation toxicity. PLoS
medicine 2006;3(10):e422. doi: 10.1371/journal.pmed.0030422 [published Online
First: 2006/11/02]
444. Rodningen OK, Borresen-Dale AL, Alsner J, et al. Radiation-induced gene expression in
human subcutaneous fibroblasts is predictive of radiation-induced fibrosis. Radiother
Oncol 2008;86(3):314-20. doi: 10.1016/j.radonc.2007.09.013 [published Online First:
2007/10/30]
445. Chang-Claude J, Ambrosone CB, Lilla C, et al. Genetic polymorphisms in DNA repair and
damage response genes and late normal tissue complications of radiotherapy for
breast cancer. Br J Cancer 2009;100(10):1680-6. doi: 10.1038/sj.bjc.6605036
[published Online First: 2009/04/16]

180
446. Kruse JJ, Stewart FA. Gene expression arrays as a tool to unravel mechanisms of normal
tissue radiation injury and prediction of response. World journal of gastroenterology
2007;13(19):2669-74. [published Online First: 2007/06/15]
447. West CM, Elliott RM, Burnet NG. The genomics revolution and radiotherapy. Clin Oncol
(R Coll Radiol) 2007;19
448. Terrazzino S, La Mattina P, Masini L, et al. Common variants of eNOS and XRCC1 genes
may predict acute skin toxicity in breast cancer patients receiving radiotherapy after
breast conserving surgery. Radiother Oncol 2012;103(2):199-205. doi:
10.1016/j.radonc.2011.12.002 [published Online First: 2012/01/18]
449. Greve B, Bolling T, Amler S, et al. Evaluation of different biomarkers to predict
individual radiosensitivity in an inter-laboratory comparison--lessons for future
studies. PloS One 2012;7(10):e47185. doi: 10.1371/journal.pone.0047185 [published
Online First: 2012/10/31]
450. Mayer C, Popanda O, Greve B, et al. A radiation-induced gene expression signature as a
tool to predict acute radiotherapy-induced adverse side effects. Cancer letters
2011;302(1):20-8. doi: 10.1016/j.canlet.2010.12.006 [published Online First:
2011/01/18]
451. Crompton NE, Miralbell R, Rutz HP, et al. Altered apoptotic profiles in irradiated
patients with increased toxicity. Int J Radiat Oncol Biol Phys 1999;45(3):707-14.
[published Online First: 1999/10/19]
452. Wistop A, Keller U, Sprung CN, et al. Individual radiosensitivity does not correlate with
radiation-induced apoptosis in lymphoblastoid cell lines or CD3+ lymphocytes.
Strahlentherapie und Onkologie 2005;181(5):326-35.
453. Williams JR, Zhang Y, Zhou H, et al. Genotype-dependent radiosensitivity: clonogenic
survival, apoptosis and cell-cycle redistribution. Int J Radiat Biol 2008;84(2):151-64.
doi: 10.1080/09553000701797021 [published Online First: 2008/02/05]
454. Barnett GC, Thompson D, Fachal L, et al. A genome wide association study (GWAS)
providing evidence of an association between common genetic variants and late
radiotherapy toxicity. Radiother Oncol 2014;111(2):178-85. doi:
10.1016/j.radonc.2014.02.012 [published Online First: 2014/05/03]
455. Barnett GC, Coles CE, Elliott RM, et al. Independent validation of genes and
polymorphisms reported to be associated with radiation toxicity: a prospective
analysis study. Lancet Oncol 2012;13(1):65-77. doi: 10.1016/s1470-2045(11)70302-3
[published Online First: 2011/12/16]
456. Rosen EM, Day R, Singh VK. New Approaches to Radiation Protection. Frontiers in
Oncology 2015;4(381) doi: 10.3389/fonc.2014.00381
457. Martin NT, Nakamura K, Paila U, et al. Homozygous mutation of MTPAP causes cellular
radiosensitivity and persistent DNA double-strand breaks. Cell death & disease
2014;5:e1130. doi: 10.1038/cddis.2014.99 [published Online First: 2014/03/22]
458. Matsuura S, Royba E, Akutsu SN, et al. Analysis of individual differences in
radiosensitivity using genome editing. Annals of the ICRP 2016;45(1 Suppl):290-6. doi:
10.1177/0146645316633941 [published Online First: 2016/03/26]
459. Russell N, Arlett C, Bartelink H, et al. Use of fluorescence in situ hybridization to
determine the relationship between chromosome aberrations and cell survival in
eight human fibroblast strains. International Journal of Radiation Biology
1995;68(2):185-96.
460. Rave-Fränk M, Virsik-Kopp P, Pradier O, et al. In vitro response of human dermal
fibroblasts to X-irradiation: relationship between radiation-induced clonogenic cell
181
death, chromosome aberrations and markers of proliferative senescence or
differentiation. Int J Radiat Biol 2001;77(12):1163-74.
461. Hill R, Rodemann H-P, Hendry J, et al. Normal tissue radiobiology: from the laboratory
to the clinic. International Journal of Radiation Oncology* Biology* Physics
2001;49(2):353-65.
462. Barcellos-Hoff M, Derynck R, Tsang M, et al. Transforming growth factor-beta activation
in irradiated murine mammary gland. Journal of Clinical Investigation 1994;93(2):892.
463. Dickson J, Davidson SE, Hunter RD, et al. Pretreatment plasma TGFβ1 levels are prognostic for survival but not morbidity following radiation therapy of carcinoma of
the cervix. International Journal of Radiation Oncology* Biology* Physics
2000;48(4):991-95.
464. Dikomey E, Brammer I, Johansen J, et al. Relationship between DNA double-strand
breaks, cell killing, and fibrosis studied in confluent skin fibroblasts derived from
breast cancer patients. International Journal of Radiation Oncology*Biology*Physics
2000;46(2):481-90. doi: https://doi.org/10.1016/S0360-3016(99)00335-1
465. Ozsahin M, Crompton NE, Gourgou S, et al. CD4 and CD8 T-lymphocyte apoptosis can
predict radiation-induced late toxicity: a prospective study in 399 patients. Clin
Cancer Res 2005;11
466. Borgmann K, Hoeller U, Nowack S, et al. Individual Radiosensitivity Measured With
Lymphocytes May Predict the Risk of Acute Reaction After Radiotherapy.
International Journal of Radiation Oncology*Biology*Physics 2008;71(1):256-64. doi:
https://doi.org/10.1016/j.ijrobp.2008.01.007
467. Granzotto A, Benadjaoud MA, Vogin G, et al. Influence of Nucleoshuttling of the ATM
Protein in the Healthy Tissues Response to Radiation Therapy: Toward a Molecular
Classification of Human Radiosensitivity. Int J Radiat Oncol Biol Phys 2016;94(3):450-
60. doi: 10.1016/j.ijrobp.2015.11.013 [published Online First: 2016/02/13]
468. Ferlazzo ML, Bach-Tobdji MKE, Djerad A, et al. Radiobiological Characterization of
Tuberous Sclerosis: a Delay in the Nucleo-Shuttling of ATM May Be Responsible for
Radiosensitivity. Molecular neurobiology 2017 doi: 10.1007/s12035-017-0648-6
[published Online First: 2017/08/09]
469. Leong T, Lobachevsky PN, Daly PE, et al. Gamma-H2AX as a Predictive Biomarker of
Individual Radiosensitivity. International Journal of Radiation Oncology • Biology • Physics 2014;90(1):S779. doi: 10.1016/j.ijrobp.2014.05.2255
470. Johansson P, Muslimovic A, Hultborn R, et al. In-solution staining and arraying method
for the immunofluorescence detection of gammaH2AX foci optimized for clinical
applications. BioTechniques 2011;51(3):185-9. doi: 10.2144/000113738 [published
Online First: 2011/09/13]
471. Johansson P, Fasth A, Ek T, et al. Validation of a flow cytometry-based detection of
gamma-H2AX, to measure DNA damage for clinical applications. Cytometry Part B,
Clinical cytometry 2016 doi: 10.1002/cyto.b.21374 [published Online First:
2016/04/10]
472. Mathew ST, Johansson P, Gao Y, et al. A flow cytometry assay that measures cellular
sensitivity to DNA-damaging agents, customized for clinical routine laboratories.
Clinical biochemistry 2016;49(7-8):566-72. doi: 10.1016/j.clinbiochem.2016.01.009
[published Online First: 2016/01/19]
473. Wu D, Guo, Z., Min, W., Zhou, B., Li, M., Li, W., & Luo, D. Upregulation of TCTP
expression in human skin squamous cell carcinoma increases tumor cell viability
182
through anti-apoptotic action of the protein. Experimental and Therapeutic Medicine
2012;3:437-42.
474. Lucibello M, Gambacurta A, Zonfrillo M, et al. TCTP is a critical survival factor that
protects cancer cells from oxidative stress-induced cell-death. Experimental cell
research 2011;317(17):2479-89. doi: 10.1016/j.yexcr.2011.07.012 [published Online
First: 2011/08/02]
475. Küper L. Varianten desTCTP-Gens bei weißrussischen Patientinnen mit
Mammakarzinom. Hannover Medical School, 2017.
476. Bogdanova N, Sokolenko AP, Iyevleva AG, et al. PALB2 mutations in German and
Russian patients with bilateral breast cancer. Breast Cancer Res Treat
2011;126(2):545-50. doi: 10.1007/s10549-010-1290-4 [published Online First:
2010/12/18]
477. Neuhäuser K, Bogdanova, N., Borgmann, K., Dahm-Daphi, J., Schindler, D., Christiansen,
H., Dörk, T. Evidence for elevated basal levels of TCTP, but no induction after
irradiation, in lymphoblastoid cells from individuals with increased clinical
radiosensitivity. Experimentelle Strahlentherapie und Klinische Strahlenbiologie.
Tübingen, Germany, 2017:24-30.
478. Gilissen C, Hoischen A, Brunner HG, et al. Disease gene identification strategies for
exome sequencing. Eur J Hum Genet 2012;20(5):490-97.
479. Kerns SL, Stone NN, Stock RG, et al. A 2-stage genome-wide association study to identify
single nucleotide polymorphisms associated with development of urinary symptoms
after radiotherapy for prostate cancer. The Journal of urology 2013;190(1):102-8. doi:
10.1016/j.juro.2013.01.096 [published Online First: 2013/02/05]
480. Kerns SL, Stock R, Stone N, et al. A 2-stage genome-wide association study to identify
single nucleotide polymorphisms associated with development of erectile
dysfunction following radiation therapy for prostate cancer. Int J Radiat Oncol Biol
Phys 2013;85(1):e21-8. doi: 10.1016/j.ijrobp.2012.08.003 [published Online First:
2012/10/02]
481. Becker T, Haferkamp S. Molecular Mechanisms of Cellular Senescence. In: Wang Z,
Inuzuka H, eds. Senescence and Senescence-Related Disorders. Rijeka: InTech
2013:Ch. 02.
482. Helton ES, Chen X. p53 modulation of the DNA damage response. Journal of cellular
biochemistry 2007;100(4):883-96. doi: 10.1002/jcb.21091 [published Online First:
2006/10/13]
483. Gervaz P, Morel P, Vozenin-Brotons MC. Molecular aspects of intestinal radiation-
induced fibrosis. Current molecular medicine 2009;9(3):273-80. [published Online
First: 2009/04/10]
484. West CM, Davidson SE, Elyan SA, et al. Lymphocyte radiosensitivity is a significant
prognostic factor for morbidity in carcinoma of the cervix. Int J Radiat Oncol Biol Phys
2001;51
485. Soule H, McGrath Charles M. 1989/02/28/Application date 1989.
486. Gazdar AF, Kurvari V, Virmani A, et al. Characterization of paired tumor and non-tumor
cell lines established from patients with breast cancer. Int J Cancer 1998;78(6):766-
74. [published Online First: 1998/12/02]
487. Lehmann BD, Bauer JA, Chen X, et al. Identification of human triple-negative breast
cancer subtypes and preclinical models for selection of targeted therapies. The
Journal of Clinical Investigation 2011;121(7):2750-67. doi: 10.1172/JCI45014

183
488. ATCC. American Type Culture Collection [Available from: https://www.lgcstandards-
atcc.org/Products/All/CRL-2336.aspx?geo_country=de.
489. Tomlinson GE, Chen TT, Stastny VA, et al. Characterization of a breast cancer cell line
derived from a germ-line BRCA1 mutation carrier. Cancer Res 1998;58(15):3237-42.
[published Online First: 1998/08/12]
490. Sundaresan V, Chung G, Heppell-Parton A, et al. Homozygous deletions at 3p12 in
breast and lung cancer. Oncogene 1998;17(13):1723-9. doi: 10.1038/sj.onc.1202103
[published Online First: 1998/10/31]
491. Croft D, Mundo AF, Haw R, et al. The Reactome pathway knowledgebase. Nucleic Acids
Research 2014;42(D1):D472-D77. doi: 10.1093/nar/gkt1102
492. Fabregat A, Jupe S, Matthews L, et al. The Reactome Pathway Knowledgebase. Nucleic
Acids Res 2017 doi: 10.1093/nar/gkx1132 [published Online First: 2017/11/18]
493. Cavins JA, Djerassi I, Roy AJ, et al. Preservation of viable human granulocytes at low
temperatures in dimethyl sulfoxide. Cryobiology 1965;2(3):129-33. [published Online
First: 1965/11/01]
494. Lock RL, Benvenuti S, Jat PS. Immortalization by Sv40 Large T Antigen. Cell Cycle and
Growth Control: John Wiley & Sons, Inc. 2005:467-95.
495. Bayreuther K, Francz PI, Gogol J, et al. Differentiation of primary and secondary
fibroblasts in cell culture systems. Mutat Res 1991;256(2-6):233-42. [published
Online First: 1991/03/01]
496. Auburger G, Klinkenberg M, Drost J, et al. Primary Skin Fibroblasts as a Model of
Parkinson's Disease. Molecular neurobiology 2012;46(1):20-27. doi: 10.1007/s12035-
012-8245-1
497. Kollarovic G, Studencka M, Ivanova L, et al. To senesce or not to senesce: how primary
human fibroblasts decide their cell fate after DNA damage. Aging (Albany NY)
2016;8(1):158-76.
498. Bell RJ, Rube HT, Xavier-Magalhaes A, et al. Understanding TERT Promoter Mutations: A
Common Path to Immortality. Molecular cancer research : MCR 2016;14(4):315-23.
doi: 10.1158/1541-7786.mcr-16-0003 [published Online First: 2016/03/05]
499. Greider CW, Blackburn EH. Telomeres, telomerase and cancer. Scientific American
1996;274(2):92-7. [published Online First: 1996/02/01]
500. Bodnar AG, Ouellette M, Frolkis M, et al. Extension of Life-Span by Introduction of
Telomerase into Normal Human Cells. Science 1998;279(5349):349-52. doi:
10.1126/science.279.5349.349
501. Jiang X-R, Jimenez G, Chang E, et al. Telomerase expression in human somatic cells does
not induce changes associated with a transformed phenotype. Nature Genetics
1999;21:111. doi: 10.1038/5056
502. Ouellette MM, McDaniel LD, Wright WE, et al. The establishment of telomerase-
immortalized cell lines representing human chromosome instability syndromes.
Human Molecular Genetics 2000;9(3):403-11. doi: 10.1093/hmg/9.3.403
503. Bradford MM. A rapid and sensitive method for the quantitation of microgram
quantities of protein utilizing the principle of protein-dye binding. Analytical
biochemistry 1976;72:248-54. [published Online First: 1976/05/07]
504. Stochaj WR, Berkelman T, Laird N. Staining membrane-bound proteins with ponceau s.
CSH protocols 2006;2006(5) doi: 10.1101/pdb.prot4543 [published Online First:
2006/01/01]

184
505. Towbin H, Staehelin T, Gordon J. Electrophoretic transfer of proteins from
polyacrylamide gels to nitrocellulose sheets: procedure and some applications. 1979.
Biotechnology (Reading, Mass) 1992;24:145-9. [published Online First: 1992/01/01]
506. Minerick AR, Thibaudeau G. Confocal Microscopy, Detection. In: Li D, ed. Encyclopedia
of Microfluidics and Nanofluidics. Boston, MA: Springer US 2013:1-10.
507. Neuhäuser K, Bogdanova, N., Bhuju, S., Geffers, R., Christiansen, H., Dörk, T., Rave-
Fränk, M. Mutation in FANCO/RAD51C, but not FANCL, is Associated with Clinical and
Chromosomal Radiosensitivity. Experimentelle Strahlentherapie und Klinische
Strahlenbiologie. Dresden, Germany, 2016:31-37.
508. Mirzayans R, Andrais B, Scott A, et al. A sensitive assay for the evaluation of cytotoxicity
and its pharmacologic modulation in human solid tumor-derived cell lines exposed to
cancer-therapeutic agents. Journal of pharmacy & pharmaceutical sciences : a
publication of the Canadian Society for Pharmaceutical Sciences, Societe canadienne
des sciences pharmaceutiques 2007;10(2):298s-311s. [published Online First:
2007/08/28]
509. Burn SF. Detection of beta-galactosidase activity: X-gal staining. Methods Mol Biol
2012;886:241-50. doi: 10.1007/978-1-61779-851-1_21 [published Online First:
2012/05/29]
510. Dimri GP, Lee X, Basile G, et al. A biomarker that identifies senescent human cells in
culture and in aging skin in vivo. Proc Natl Acad Sci U S A 1995;92(20):9363-7.
[published Online First: 1995/09/26]
511. GraphPad. GraphPad QuickCalcs Outlier calculator [Available from:
https://www.graphpad.com/quickcalcs/Grubbs1.cfm.
512. Ingenuity. Ingenuity Pathway Analysis: Understanding the P-Value of Overlap Statistic in
IPA [Available from:
https://tv.qiagenbioinformatics.com/video/19605716/understanding-the-p-value-of-
overlap-statistic-in.
513. Ingenuity. Ingenuity Pathway Analysis: official website [Available from:
https://www.qiagenbioinformatics.com/products/ingenuity-pathway-analysis/.
514. NCBI. National Centre for Biotechnology Information database accessed in 2016-2017
[Available from: https://www.ncbi.nlm.nih.gov/gene.
515. Mullis KB. Target amplification for DNA analysis by the polymerase chain reaction.
Annales de biologie clinique 1990;48(8):579-82. [published Online First: 1990/01/01]
516. Saiki RK, Gelfand DH, Stoffel S, et al. Primer-directed enzymatic amplification of DNA
with a thermostable DNA polymerase. Science 1988;239(4839):487-91. [published
Online First: 1988/01/29]
517. Chien A, Edgar DB, Trela JM. Deoxyribonucleic acid polymerase from the extreme
thermophile Thermus aquaticus. Journal of bacteriology 1976;127(3):1550-7.
[published Online First: 1976/09/01]
518. Sanger F, Nicklen S, Coulson AR. DNA sequencing with chain-terminating inhibitors. Proc
Natl Acad Sci U S A 1977;74(12):5463-7. [published Online First: 1977/12/01]
519. Genecards. Human Gene Database [Available from: http://www.genecards.org/.
520. Safran M, Dalah I, Alexander J, et al. GeneCards Version 3: the human gene integrator.
Database: The Journal of Biological Databases and Curation 2010;2010:baq020. doi:
10.1093/database/baq020
521. Stelzer G, Dalah I, Stein TI, et al. In-silico human genomics with GeneCards. Human
genomics 2011;5(6):709-17. doi: 10.1186/1479-7364-5-6-709

185
522. Rebhan M, Chalifa-Caspi V, Prilusky J, et al. GeneCards: integrating information about
genes, proteins and diseases. Trends in genetics : TIG 1997;13(4):163. [published
Online First: 1997/04/01]
523. Hubbard T, Barker D, Birney E, et al. The Ensembl genome database project. Nucleic
Acids Research 2002;30(1):38-41.
524. Flicek P, Aken BL, Ballester B, et al. Ensembl's 10th year. Nucleic Acids Res
2010;38(Database issue):D557-62. doi: 10.1093/nar/gkp972 [published Online First:
2009/11/13]
525. Reactome. Reactome Pathway Browser [Available from: https://reactome.org/.
526. Soule HD, Maloney TM, Wolman SR, et al. Isolation and characterization of a
spontaneously immortalized human breast epithelial cell line, MCF-10. Cancer Res
1990;50(18):6075-86. [published Online First: 1990/09/25]
527. Li X, Lee YK, Jeng JC, et al. Role for KAP1 serine 824 phosphorylation and
sumoylation/desumoylation switch in regulating KAP1-mediated transcriptional
repression. J Biol Chem 2007;282(50):36177-89. doi: 10.1074/jbc.M706912200
[published Online First: 2007/10/19]
528. Ziv Y, Bielopolski D, Galanty Y, et al. Chromatin relaxation in response to DNA double-
strand breaks is modulated by a novel ATM- and KAP-1 dependent pathway. Nat Cell
Biol 2006;8(8):870-6. doi: 10.1038/ncb1446 [published Online First: 2006/07/25]
529. Buscemi G, Carlessi L, Zannini L, et al. DNA damage-induced cell cycle regulation and
function of novel Chk2 phosphoresidues. Mol Cell Biol 2006;26(21):7832-45. doi:
10.1128/mcb.00534-06 [published Online First: 2006/08/31]
530. Ogata H, Goto S, Sato K, et al. KEGG: Kyoto Encyclopedia of Genes and Genomes.
Nucleic Acids Research 1999;27(1):29-34.
531. Biocarta. [Available from: https://cgap.nci.nih.gov/Pathways/BioCarta_Pathways.
532. Haubner F, Ohmann E, Pohl F, et al. Wound healing after radiation therapy: Review of
the literature. Radiation Oncology 2012;7(1):162. doi: 10.1186/1748-717x-7-162
533. Ryan JL. Ionizing Radiation: The Good, the Bad, and the Ugly. The Journal of
investigative dermatology 2012;132(3 0 2):985-93. doi: 10.1038/jid.2011.411
534. Akita S. Treatment of Radiation Injury. Advances in Wound Care 2014;3(1):1-11. doi:
10.1089/wound.2012.0403
535. Ingenuity. Definitions of the High-Level Functional Categories [Available from:
http://qiagen.force.com/KnowledgeBase/KnowledgeNavigatorPage?id=kA1D000000
0PIokKAG.
536. Wong AK, Shanahan F, Chen Y, et al. BRG1, a component of the SWI-SNF complex, is
mutated in multiple human tumor cell lines. Cancer Res 2000;60(21):6171-7.
[published Online First: 2000/11/21]
537. Medina PP, Romero OA, Kohno T, et al. Frequent BRG1/SMARCA4-inactivating
mutations in human lung cancer cell lines. Human mutation 2008;29(5):617-22. doi:
10.1002/humu.20730 [published Online First: 2008/04/05]
538. Chiba H, Muramatsu M, Nomoto A, et al. Two human homologues of Saccharomyces
cerevisiae SWI2/SNF2 and Drosophila brahma are transcriptional coactivators
cooperating with the estrogen receptor and the retinoic acid receptor. Nucleic Acids
Res 1994;22(10):1815-20. [published Online First: 1994/05/25]
539. Itamochi H, Oishi T, Oumi N, et al. Whole-genome sequencing revealed novel prognostic
biomarkers and promising targets for therapy of ovarian clear cell carcinoma. Br J
Cancer 2017;117(5):717-24. doi: 10.1038/bjc.2017.228 [published Online First:
2017/07/21]

186
540. Errichiello E, Mustafa N, Vetro A, et al. SMARCA4 inactivating mutations cause
concomitant Coffin-Siris syndrome, microphthalmia and small-cell carcinoma of the
ovary hypercalcaemic type. The Journal of pathology 2017;243(1):9-15. doi:
10.1002/path.4926 [published Online First: 2017/06/14]
541. Bochar DA, Wang L, Beniya H, et al. BRCA1 is associated with a human SWI/SNF-related
complex: linking chromatin remodeling to breast cancer. Cell 2000;102(2):257-65.
[published Online First: 2000/08/16]
542. Hill DA, de la Serna IL, Veal TM, et al. BRCA1 interacts with dominant negative SWI/SNF
enzymes without affecting homologous recombination or radiation-induced gene
activation of p21 or Mdm2. Journal of cellular biochemistry 2004;91(5):987-98. doi:
10.1002/jcb.20003 [published Online First: 2004/03/23]
543. Orvis T, Hepperla A, Walter V, et al. BRG1/SMARCA4 inactivation promotes non-small
cell lung cancer aggressiveness by altering chromatin organization. Cancer Res
2014;74(22):6486-98. doi: 10.1158/0008-5472.can-14-0061 [published Online First:
2014/08/15]
544. Li X, Zhu C, Tu WH, et al. ZMIZ1 preferably enhances the transcriptional activity of
androgen receptor with short polyglutamine tract. PloS One 2011;6(9):e25040. doi:
10.1371/journal.pone.0025040 [published Online First: 2011/09/29]
545. Lamb LE, Zarif JC, Miranti CK. The androgen receptor induces integrin alpha6beta1 to
promote prostate tumor cell survival via NF-kappaB and Bcl-xL Independently of PI3K
signaling. Cancer Res 2011;71(7):2739-49. doi: 10.1158/0008-5472.can-10-2745
[published Online First: 2011/02/12]
546. Yeh S, Hu YC, Wang PH, et al. Abnormal mammary gland development and growth
retardation in female mice and MCF7 breast cancer cells lacking androgen receptor. J
Exp Med 2003;198(12):1899-908. doi: 10.1084/jem.20031233 [published Online First:
2003/12/17]
547. Molinero LL, Fuertes MB, Girart MV, et al. NF-kappa B regulates expression of the MHC
class I-related chain A gene in activated T lymphocytes. J Immunol 2004;173(9):5583-
90. [published Online First: 2004/10/21]
548. Hu R, Lu C, Mostaghel EA, et al. Distinct transcriptional programs mediated by the
ligand-dependent full-length androgen receptor and its splice variants in castration-
resistant prostate cancer. Cancer Res 2012;72(14):3457-62. doi: 10.1158/0008-
5472.can-11-3892 [published Online First: 2012/06/20]
549. Salazar MD, Ratnam M, Patki M, et al. During hormone depletion or tamoxifen
treatment of breast cancer cells the estrogen receptor apoprotein supports cell
cycling through the retinoic acid receptor alpha1 apoprotein. Breast Cancer Res
2011;13(1):R18. doi: 10.1186/bcr2827 [published Online First: 2011/02/09]
550. Baijer J, Dechamps N, Perdry H, et al. TNFSF10/TRAIL regulates human T4 effector
memory lymphocyte radiosensitivity and predicts radiation-induced acute and
subacute dermatitis. Oncotarget 2016;7(16):21416-27. doi:
10.18632/oncotarget.7893 [published Online First: 2016/03/17]
551. Pfeifer K, Schürmann P, Bogdanova N, et al. Frameshift variant
FANCL*c.1096_1099dupATTA is not associated with high breast cancer risk. Clinical
Genetics 2016:n/a-n/a. doi: 10.1111/cge.12837
552. Lhota F, Zemankova P, Kleiblova P, et al. Hereditary truncating mutations of DNA repair
and other genes in BRCA1/BRCA2/PALB2-negatively tested breast cancer patients.
Clinical Genetics 2016;90(4):324-33. doi: 10.1111/cge.12748

187
553. Ellingson MS, Hart SN, Kalari KR, et al. Exome sequencing reveals frequent deleterious
germline variants in cancer susceptibility genes in women with invasive breast cancer
undergoing neoadjuvant chemotherapy. Breast Cancer Res Treat 2015;153(2):435-43.
doi: 10.1007/s10549-015-3545-6 [published Online First: 2015/08/25]
554. Bunch H, Calderwood SK. TRIM28 as a novel transcriptional elongation factor. BMC
Molecular Biology 2015;16(1):14. doi: 10.1186/s12867-015-0040-x
555. Kural KC, Tandon N, Skoblov M, et al. Pathways of aging: comparative analysis of gene
signatures in replicative senescence and stress induced premature senescence. BMC
genomics 2016;17(Suppl 14):1030. doi: 10.1186/s12864-016-3352-4
556. Hong ST, Choi KW. TCTP directly regulates ATM activity to control genome stability and
organ development in Drosophila melanogaster. Nature communications
2013;4:2986. doi: 10.1038/ncomms3986 [published Online First: 2013/12/20]
557. Bommer UA, Thiele BJ. The translationally controlled tumour protein (TCTP). The
international journal of biochemistry & cell biology 2004;36 doi: 10.1016/s1357-
2725(03)00213-9
558. Tuynder M, Fiucci G, Prieur S, et al. Translationally controlled tumor protein is a target
of tumor reversion. Proc Natl Acad Sci USA 2004;101 doi: 10.1073/pnas.0406776101
559. Deng SS, Xing TY, Zhou HY, et al. Comparative proteome analysis of breast cancer and
adjacent normal breast tissues in human. Genomics Proteomics Bioinformatics
2006;4(3):165-72. doi: 10.1016/s1672-0229(06)60029-6 [published Online First:
2006/11/28]
560. Chen C, Deng Y, Hua M, et al. Expression and clinical role of TCTP in epithelial ovarian
cancer. J Mol Histol 2015;46(2):145-56. doi: 10.1007/s10735-014-9607-y [published
Online First: 2015/01/08]
561. Lee JH, Goodarzi AA, Jeggo PA, et al. 53BP1 promotes ATM activity through direct
interactions with the MRN complex. EMBO J 2010;29(3):574-85. doi:
10.1038/emboj.2009.372 [published Online First: 2009/12/17]
562. Burma S, Chen BP, Murphy M, et al. ATM phosphorylates histone H2AX in response to
DNA double-strand breaks. J Biol Chem 2001;276(45):42462-7. doi:
10.1074/jbc.C100466200 [published Online First: 2001/09/26]
563. Gnanasekar M, Ramaswamy K. Translationally controlled tumor protein of Brugia
malayi functions as an antioxidant protein. Parasitol Res 2007;101(6):1533-40. doi:
10.1007/s00436-007-0671-z [published Online First: 2007/08/10]
564. Susini L, Besse S, Duflaut D, et al. TCTP protects from apoptotic cell death by
antagonizing bax function. Cell death and differentiation 2008;15 doi:
10.1038/cdd.2008.18
565. Kloc M, Tejpal N, Sidhu J, et al. Inverse relationship between TCTP/RhoA and p53 /cyclin
A/actin expression in ovarian cancer cells. Folia Histochem Cytobiol 2012;50(3):358-
67. doi: 10.5603/19745 [published Online First: 2012/10/09]
566. Baylot V, Katsogiannou M, Andrieu C, et al. Targeting TCTP as a new therapeutic
strategy in castration-resistant prostate cancer. Mol Ther 2012;20(12):2244-56. doi:
10.1038/mt.2012.155 [published Online First: 2012/08/16]
567. Ma YP, Zhu WL. Cytoplasmic and nuclear localization of TCTP in normal and cancer cells.
Biochem Res Int 2012;2012:871728. doi: 10.1155/2012/871728 [published Online
First: 2012/06/06]
568. Rappold I, Iwabuchi K, Date T, et al. Tumor suppressor p53 binding protein 1 (53BP1) is
involved in DNA damage-signaling pathways. J Cell Biol 2001;153(3):613-20.
[published Online First: 2001/05/02]

188
569. Schultz LB, Chehab NH, Malikzay A, et al. p53 binding protein 1 (53BP1) is an early
participant in the cellular response to DNA double-strand breaks. J Cell Biol
2000;151(7):1381-90. [published Online First: 2001/01/03]
570. Ahuja D, Saenz-Robles MT, Pipas JM. SV40 large T antigen targets multiple cellular
pathways to elicit cellular transformation. Oncogene 2005;24(52):7729-45.
571. Huang Y, Bove B, Wu Y, et al. Microsatellite instability during the immortalization and
transformation of human breast epithelial cells in vitro. Mol Carcinog
1999;24(2):118-27. [published Online First: 1999/03/17]
572. Tait L, Soule HD, Russo J. Ultrastructural and immunocytochemical characterization of
an immortalized human breast epithelial cell line, MCF-10. Cancer Res
1990;50(18):6087-94. [published Online First: 1990/09/15]
573. Woods C, LeFeuvre C, Stewart N, et al. Induction of genomic instability in SV40
transformed human cells: sufficiency of the N-terminal 147 amino acids of large T
antigen and role of pRB and p53. Oncogene 1994;9(10):2943-50. [published Online
First: 1994/10/01]
574. Lacroix M, Toillon RA, Leclercq G. p53 and breast cancer, an update. Endocrine-related
cancer 2006;13(2):293-325. doi: 10.1677/erc.1.01172 [published Online First:
2006/05/27]
575. Chen W, Wang H, Tao S, et al. Tumor protein translationally controlled 1 is a p53 target
gene that promotes cell survival. Cell Cycle 2013;12(14):2321-8. doi:
10.4161/cc.25404 [published Online First: 2013/09/27]
576. Gachet Y, Tournier S, Lee M, et al. The growth-related, translationally controlled protein
P23 has properties of a tubulin binding protein and associates transiently with
microtubules during the cell cycle. J Cell Sci 1999;112 ( Pt 8):1257-71. [published
Online First: 1999/03/23]
577. Hsu Y-C, Chern JJ, Cai Y, et al. Drosophila TCTP is essential for growth and proliferation
through regulation of dRheb GTPase. Nature 2007;445(7129):785-88. doi:
http://www.nature.com/nature/journal/v445/n7129/suppinfo/nature05528_S1.html
578. Rehmann H, Bruning M, Berghaus C, et al. Biochemical characterisation of TCTP
questions its function as a guanine nucleotide exchange factor for Rheb. FEBS Lett
2008;582(20):3005-10. doi: 10.1016/j.febslet.2008.07.057 [published Online First:
2008/08/12]
579. Wang X, Fonseca BD, Tang H, et al. Re-evaluating the roles of proposed modulators of
mammalian target of rapamycin complex 1 (mTORC1) signaling. J Biol Chem
2008;283(45):30482-92. doi: 10.1074/jbc.M803348200 [published Online First:
2008/08/05]
580. Gnanasekar M, Thirugnanam S, Zheng G, et al. Gene silencing of translationally
controlled tumor protein (TCTP) by siRNA inhibits cell growth and induces apoptosis
of human prostate cancer cells. International journal of oncology 2009;34(5):1241-6.
[published Online First: 2009/04/11]
581. Torres-Roca JF. A molecular assay of tumor radiosensitivity: a roadmap towards biology-
based personalized radiation therapy. Personalized medicine 2012;9(5):547-57. doi:
10.2217/pme.12.55 [published Online First: 2012/10/30]
582. Bultman SJ, Herschkowitz JI, Godfrey V, et al. Characterization of mammary tumors
from Brg1 heterozygous mice. Oncogene 2008;27(4):460-8. doi:
10.1038/sj.onc.1210664 [published Online First: 2007/07/20]
583. Kumar A, Coleman I, Morrissey C, et al. Substantial interindividual and limited
intraindividual genomic diversity among tumors from men with metastatic prostate

189
cancer. Nat Med 2016;22(4):369-78. doi: 10.1038/nm.4053 [published Online First:
2016/03/02]
584. Sharpe HJ, Pau G, Dijkgraaf GJ, et al. Genomic analysis of smoothened inhibitor
resistance in basal cell carcinoma. Cancer cell 2015;27(3):327-41. doi:
10.1016/j.ccell.2015.02.001 [published Online First: 2015/03/12]
585. Gavert N, Sheffer M, Raveh S, et al. Expression of L1-CAM and ADAM10 in human colon
cancer cells induces metastasis. Cancer Res 2007;67(16):7703-12. doi: 10.1158/0008-
5472.can-07-0991 [published Online First: 2007/08/19]
586. Urosevic M, Dummer R, Conrad C, et al. Disease-independent skin recruitment and
activation of plasmacytoid predendritic cells following imiquimod treatment. J Natl
Cancer Inst 2005;97(15):1143-53. doi: 10.1093/jnci/dji207 [published Online First:
2005/08/04]
587. Santin AD, Zhan F, Cane S, et al. Gene expression fingerprint of uterine serous papillary
carcinoma: identification of novel molecular markers for uterine serous cancer
diagnosis and therapy. Br J Cancer 2005;92(8):1561-73. doi: 10.1038/sj.bjc.6602480
[published Online First: 2005/03/24]
588. Martin D, Abba MC, Molinolo AA, et al. The head and neck cancer cell oncogenome: a
platform for the development of precision molecular therapies. Oncotarget
2014;5(19):8906-23. doi: 10.18632/oncotarget.2417 [published Online First:
2014/10/03]
589. Hayes TF, Benaich N, Goldie SJ, et al. Integrative genomic and functional analysis of
human oral squamous cell carcinoma cell lines reveals synergistic effects of FAT1 and
CASP8 inactivation. Cancer letters 2016;383(1):106-14. doi:
10.1016/j.canlet.2016.09.014 [published Online First: 2016/10/30]
590. van de Wetering M, Francies HE, Francis JM, et al. Prospective derivation of a living
organoid biobank of colorectal cancer patients. Cell 2015;161(4):933-45. doi:
10.1016/j.cell.2015.03.053 [published Online First: 2015/05/11]
591. Pickering CR, Zhou JH, Lee JJ, et al. Mutational landscape of aggressive cutaneous
squamous cell carcinoma. Clin Cancer Res 2014;20(24):6582-92. doi: 10.1158/1078-
0432.ccr-14-1768 [published Online First: 2014/10/12]
592. Mouradov D, Sloggett C, Jorissen RN, et al. Colorectal cancer cell lines are
representative models of the main molecular subtypes of primary cancer. Cancer Res
2014;74(12):3238-47. doi: 10.1158/0008-5472.can-14-0013 [published Online First:
2014/04/24]
593. Comprehensive molecular characterization of human colon and rectal cancer. Nature
2012;487(7407):330-7. doi: 10.1038/nature11252 [published Online First:
2012/07/20]
594. Stadel D, Mohr A, Ref C, et al. TRAIL-induced apoptosis is preferentially mediated via
TRAIL receptor 1 in pancreatic carcinoma cells and profoundly enhanced by XIAP
inhibitors. Clin Cancer Res 2010;16(23):5734-49. doi: 10.1158/1078-0432.ccr-10-0985
[published Online First: 2010/10/14]
595. Stary G, Bangert C, Tauber M, et al. Tumoricidal activity of TLR7/8-activated
inflammatory dendritic cells. J Exp Med 2007;204(6):1441-51. doi:
10.1084/jem.20070021 [published Online First: 2007/05/31]
596. Campbell JD, Alexandrov A, Kim J, et al. Distinct patterns of somatic genome alterations
in lung adenocarcinomas and squamous cell carcinomas. Nat Genet 2016;48(6):607-
16. doi: 10.1038/ng.3564 [published Online First: 2016/05/10]
190
597. Barbieri CE, Baca SC, Lawrence MS, et al. Exome sequencing identifies recurrent SPOP,
FOXA1 and MED12 mutations in prostate cancer. Nat Genet 2012;44(6):685-9. doi:
10.1038/ng.2279 [published Online First: 2012/05/23]
598. Korman AJ, Peggs KS, Allison JP. Checkpoint blockade in cancer immunotherapy.
Advances in immunology 2006;90:297-339. doi: 10.1016/s0065-2776(06)90008-x
[published Online First: 2006/05/30]
599. Heffernan-Stroud LA, Helke KL, Jenkins RW, et al. Defining a role for sphingosine kinase
1 in p53-dependent tumors. Oncogene 2012;31(9):1166-75. doi:
10.1038/onc.2011.302 [published Online First: 2011/07/19]
600. Gerlinger M, Horswell S, Larkin J, et al. Genomic architecture and evolution of clear cell
renal cell carcinomas defined by multiregion sequencing. Nat Genet 2014;46(3):225-
33. doi: 10.1038/ng.2891 [published Online First: 2014/02/04]
601. Satow R, Shitashige M, Kanai Y, et al. Combined functional genome survey of
therapeutic targets for hepatocellular carcinoma. Clin Cancer Res 2010;16(9):2518-
28. doi: 10.1158/1078-0432.ccr-09-2214 [published Online First: 2010/04/15]
602. Chang Q, Chen J, Beezhold KJ, et al. JNK1 activation predicts the prognostic outcome of
the human hepatocellular carcinoma. Molecular cancer 2009;8:64. doi:
10.1186/1476-4598-8-64 [published Online First: 2009/08/19]
603. Bahram S, Bresnahan M, Geraghty DE, et al. A second lineage of mammalian major
histocompatibility complex class I genes. Proc Natl Acad Sci U S A 1994;91(14):6259-
63. [published Online First: 1994/07/05]
604. Nachmani D, Gutschner T, Reches A, et al. RNA-binding proteins regulate the expression
of the immune activating ligand MICB. Nature communications 2014;5:4186. doi:
10.1038/ncomms5186 [published Online First: 2014/06/14]
605. Nunes P, Cornut D, Bochet V, et al. STIM1 juxtaposes ER to phagosomes, generating
Ca(2)(+) hotspots that boost phagocytosis. Curr Biol 2012;22(21):1990-7. doi:
10.1016/j.cub.2012.08.049 [published Online First: 2012/10/09]
606. Cao C, Gao Y, Li Y, et al. The efficacy of activated protein C in murine endotoxemia is
dependent on integrin CD11b. J Clin Invest 2010;120(6):1971-80. doi:
10.1172/jci40380 [published Online First: 2010/05/12]
607. Takeda K, Kojima Y, Uno T, et al. Combination therapy of established tumors by
antibodies targeting immune activating and suppressing molecules. J Immunol
2010;184(10):5493-501. doi: 10.4049/jimmunol.0903033 [published Online First:
2010/04/20]
608. Boyman O, Purton JF, Surh CD, et al. Cytokines and T-cell homeostasis. Current opinion
in immunology 2007;19(3):320-6. doi: 10.1016/j.coi.2007.04.015 [published Online
First: 2007/04/17]
609. Kwajah MMS, Schwarz H. CD137 ligand signaling induces human monocyte to dendritic
cell differentiation. European journal of immunology 2010;40(7):1938-49. doi:
10.1002/eji.200940105 [published Online First: 2010/05/01]
610. Lee DY, Choi BK, Lee DG, et al. 4-1BB signaling activates the t cell factor 1 effector/beta-
catenin pathway with delayed kinetics via ERK signaling and delayed PI3K/AKT
activation to promote the proliferation of CD8+ T Cells. PloS One 2013;8(7):e69677.
doi: 10.1371/journal.pone.0069677 [published Online First: 2013/07/23]
611. Zhang B, Zhang Y, Niu L, et al. Dendritic Cells and Stat3 Are Essential for CD137-Induced
CD8 T Cell Activation-Induced Cell Death. The Journal of Immunology
2010;184(9):4770-78. doi: 10.4049/jimmunol.0902713

191
612. Foell JL, Diez-Mendiondo BI, Diez OH, et al. Engagement of the CD137 (4-1BB)
costimulatory molecule inhibits and reverses the autoimmune process in collagen-
induced arthritis and establishes lasting disease resistance. Immunology
2004;113(1):89-98. doi: 10.1111/j.1365-2567.2004.01952.x [published Online First:
2004/08/18]
613. Zhang B, Maris CH, Foell J, et al. Immune suppression or enhancement by CD137 T cell
costimulation during acute viral infection is time dependent. J Clin Invest
2007;117(10):3029-41. doi: 10.1172/jci32426 [published Online First: 2007/09/15]
614. Croft M. Co-stimulatory members of the TNFR family: keys to effective T-cell immunity?
Nature reviews Immunology 2003;3(8):609-20. doi: 10.1038/nri1148 [published
Online First: 2003/09/17]
615. Ma J, Bang BR, Lu J, et al. The TNF family member 4-1BBL sustains inflammation by
interacting with TLR signaling components during late-phase activation. Science
signaling 2013;6(295):ra87. doi: 10.1126/scisignal.2004431 [published Online First:
2013/10/03]
616. Ohshima Y, Yang LP, Uchiyama T, et al. OX40 costimulation enhances interleukin-4 (IL-4)
expression at priming and promotes the differentiation of naive human CD4(+) T cells
into high IL-4-producing effectors. Blood 1998;92(9):3338-45. [published Online First:
1998/10/27]
617. Gramaglia I, Weinberg AD, Lemon M, et al. Ox-40 ligand: a potent costimulatory
molecule for sustaining primary CD4 T cell responses. J Immunol 1998;161(12):6510-
7. [published Online First: 1998/12/23]
618. Harrop JA, McDonnell PC, Brigham-Burke M, et al. Herpesvirus entry mediator ligand
(HVEM-L), a novel ligand for HVEM/TR2, stimulates proliferation of T cells and
inhibits HT29 cell growth. J Biol Chem 1998;273(42):27548-56. [published Online
First: 1998/10/09]
619. Lin D, Lavender H, Soilleux EJ, et al. NF-kappaB regulates MICA gene transcription in
endothelial cell through a genetically inhibitable control site. J Biol Chem
2012;287(6):4299-310. doi: 10.1074/jbc.M111.282152 [published Online First:
2011/12/16]
620. Keane MM, Ettenberg SA, Nau MM, et al. Chemotherapy augments TRAIL-induced
apoptosis in breast cell lines. Cancer Res 1999;59(3):734-41. [published Online First:
1999/02/11]
621. Sanborn JZ, Chung J, Purdom E, et al. Phylogenetic analyses of melanoma reveal
complex patterns of metastatic dissemination. Proc Natl Acad Sci U S A
2015;112(35):10995-1000. doi: 10.1073/pnas.1508074112 [published Online First:
2015/08/20]
622. Li YY, Hanna GJ, Laga AC, et al. Genomic analysis of metastatic cutaneous squamous cell
carcinoma. Clin Cancer Res 2015;21(6):1447-56. doi: 10.1158/1078-0432.ccr-14-1773
[published Online First: 2015/01/16]
623. Nikolaev SI, Rimoldi D, Iseli C, et al. Exome sequencing identifies recurrent somatic
MAP2K1 and MAP2K2 mutations in melanoma. Nat Genet 2011;44(2):133-9. doi:
10.1038/ng.1026 [published Online First: 2011/12/27]
624. Wagle N, Van Allen EM, Treacy DJ, et al. MAP kinase pathway alterations in BRAF-
mutant melanoma patients with acquired resistance to combined RAF/MEK
inhibition. Cancer discovery 2014;4(1):61-8. doi: 10.1158/2159-8290.cd-13-0631
[published Online First: 2013/11/23]

192
625. COSMIC. Mutant human TNFRSF9 gene (substitution c.457G>A translating to p.E153K
[somatic missense]) is observed with melanoma in human skin (COSMIC: observed in
2 of 345 samples). Mutation ID: COSM3492648 [Available from:
http://cancer.sanger.ac.uk/cosmic/mutation/overview?id=3492648.
626. Steinckwich N, Myers P, Janardhan KS, et al. Role of the store-operated calcium entry
protein, STIM1, in neutrophil chemotaxis and infiltration into a murine model of
psoriasis-inflamed skin. FASEB journal : official publication of the Federation of
American Societies for Experimental Biology 2015;29(7):3003-13. doi: 10.1096/fj.14-
265215 [published Online First: 2015/04/04]
627. Gonzalez S, Martinez-Borra J, Torre-Alonso JC, et al. The MICA-A9 triplet repeat
polymorphism in the transmembrane region confers additional susceptibility to the
development of psoriatic arthritis and is independent of the association of Cw*0602
in psoriasis. Arthritis and rheumatism 1999;42(5):1010-6. doi: 10.1002/1529-
0131(199905)42:5<1010::aid-anr21>3.0.co;2-h [published Online First: 1999/05/14]
628. Toutain CE, Brouchet L, Raymond-Letron I, et al. Prevention of skin flap necrosis by
estradiol involves reperfusion of a protected vascular network. Circ Res
2009;104(2):245-54, 12p following 54. doi: 10.1161/circresaha.108.182410
[published Online First: 2008/12/09]
629. Orloff M, Peterson C, He X, et al. Germline mutations in MSR1, ASCC1, and CTHRC1 in
patients with Barrett esophagus and esophageal adenocarcinoma. Jama
2011;306(4):410-9. doi: 10.1001/jama.2011.1029 [published Online First:
2011/07/28]
630. Chilamakuri CSR, Lorenz S, Madoui M-A, et al. Performance comparison of four exome
capture systems for deep sequencing. BMC genomics 2014;15(1):449. doi:
10.1186/1471-2164-15-449
631. Ng PC, Levy S, Huang J, et al. Genetic Variation in an Individual Human Exome. PLoS
genetics 2008;4(8):e1000160. doi: 10.1371/journal.pgen.1000160
632. The Genomes Project C. A global reference for human genetic variation. Nature
2015;526(7571):68-74. doi: 10.1038/nature15393
633. Li H, Rauch T, Chen ZX, et al. The histone methyltransferase SETDB1 and the DNA
methyltransferase DNMT3A interact directly and localize to promoters silenced in
cancer cells. J Biol Chem 2006;281(28):19489-500. doi: 10.1074/jbc.M513249200
[published Online First: 2006/05/10]
634. Li L, Liu C, Amato RJ, et al. CDKL2 promotes epithelial-mesenchymal transition and
breast cancer progression. Oncotarget 2014;5(21):10840-53. doi:
10.18632/oncotarget.2535 [published Online First: 2014/10/22]
635. Guinan KJ, Cunningham RT, Meenagh A, et al. Signatures of natural selection and
coevolution between killer cell immunoglobulin-like receptors (KIR) and HLA class I
genes. Genes and immunity 2010;11(6):467-78. doi: 10.1038/gene.2010.9 [published
Online First: 2010/03/05]
636. Ezanno H, Pawlowski V, Abdelli S, et al. JNK3 is required for the cytoprotective effect of
exendin 4. Journal of diabetes research 2014;2014:814854. doi:
10.1155/2014/814854 [published Online First: 2014/07/16]
637. Dai F, Zhang Y, Chen Y. Involvement of miR-29b signaling in the sensitivity to
chemotherapy in patients with ovarian carcinoma. Human pathology
2014;45(6):1285-93. doi: 10.1016/j.humpath.2014.02.008 [published Online First:
2014/04/29]
193
638. Horton JK, Siamakpour-Reihani S, Lee CT, et al. FAS Death Receptor: A Breast Cancer
Subtype-Specific Radiation Response Biomarker and Potential Therapeutic Target.
Radiat Res 2015;184(5):456-69. doi: 10.1667/rr14089.1 [published Online First:
2015/10/22]
639. Goldenson B, Crispino JD. The aurora kinases in cell cycle and leukemia. Oncogene
2015;34(5):537-45. doi: 10.1038/onc.2014.14 [published Online First: 2014/03/19]
640. Chung S, Zhou Z, Huddleston KA, et al. Crooked neck is a component of the human
spliceosome and implicated in the splicing process. Biochimica et biophysica acta
2002;1576(3):287-97. [published Online First: 2002/06/27]
641. Mei Z, Su T, Ye J, et al. The miR-15 family enhances the radiosensitivity of breast cancer
cells by targeting G2 checkpoints. Radiat Res 2015;183(2):196-207. doi:
10.1667/rr13784.1 [published Online First: 2015/01/17]
642. Holm SJ, Carlen LM, Mallbris L, et al. Polymorphisms in the SEEK1 and SPR1 genes on
6p21.3 associate with psoriasis in the Swedish population. Exp Dermatol
2003;12(4):435-44. [published Online First: 2003/08/22]
643. Gultekin Y, Eren E, Ozoren N. Overexpressed NLRC3 acts as an anti-inflammatory
cytosolic protein. Journal of innate immunity 2015;7(1):25-36. doi:
10.1159/000363602 [published Online First: 2014/10/04]
644. Gaffney DK, Brohet RM, Lewis CM, et al. Response to radiation therapy and prognosis in
breast cancer patients with BRCA1 and BRCA2 mutations. Radiother Oncol
1998;47(2):129-36. [published Online First: 1998/07/31]
645. Leong T, Whitty J, Keilar M, et al. Mutation analysis of BRCA1 and BRCA2 cancer
predisposition genes in radiation hypersensitive cancer patients. Int J Radiat Oncol
Biol Phys 2000;48(4):959-65. [published Online First: 2000/11/10]
646. Shanley S, McReynolds K, Ardern-Jones A, et al. Late toxicity is not increased in
BRCA1/BRCA2 mutation carriers undergoing breast radiotherapy in the United
Kingdom. Clin Cancer Res 2006;12(23):7025-32. doi: 10.1158/1078-0432.ccr-06-1244
[published Online First: 2006/12/06]
647. Damaraju S, Murray D, Dufour J, et al. Association of DNA repair and steroid
metabolism gene polymorphisms with clinical late toxicity in patients treated with
conformal radiotherapy for prostate cancer. Clin Cancer Res 2006;12(8):2545-54. doi:
10.1158/1078-0432.ccr-05-2703 [published Online First: 2006/04/28]
648. Pierce LJ, Strawderman M, Narod SA, et al. Effect of radiotherapy after breast-
conserving treatment in women with breast cancer and germline BRCA1/2
mutations. J Clin Oncol 2000;18(19):3360-9. doi: 10.1200/jco.2000.18.19.3360
[published Online First: 2000/10/03]
649. Neubauer S, Arutyunyan R, Stumm M, et al. Radiosensitivity of ataxia telangiectasia and
Nijmegen breakage syndrome homozygotes and heterozygotes as determined by
three-color FISH chromosome painting. Radiat Res 2002;157(3):312-21. [published
Online First: 2002/02/13]
650. Godthelp BC, Artwert F, Joenje H, et al. Impaired DNA damage-induced nuclear Rad51
foci formation uniquely characterizes Fanconi anemia group D1. Oncogene
2002;21(32):5002-5. doi: 10.1038/sj.onc.1205656 [published Online First:
2002/07/16]
651. Brachner A, Braun J, Ghodgaonkar M, et al. The endonuclease Ankle1 requires its LEM
and GIY-YIG motifs for DNA cleavage in vivo. J Cell Sci 2012;125(Pt 4):1048-57. doi:
10.1242/jcs.098392 [published Online First: 2012/03/09]

194
652. Stevens KN, Vachon CM, Couch FJ. Genetic susceptibility to triple-negative breast
cancer. Cancer Res 2013;73(7):2025-30. doi: 10.1158/0008-5472.can-12-1699
[published Online First: 2013/03/29]
653. Carney JP, Maser RS, Olivares H, et al. The hMre11/hRad50 Protein Complex and
Nijmegen Breakage Syndrome: Linkage of Double-Strand Break Repair to the Cellular
DNA Damage Response. Cell 1998;93(3):477-86. doi: https://doi.org/10.1016/S0092-
8674(00)81175-7
654. Raina D, Pandey P, Ahmad R, et al. c-Abl tyrosine kinase regulates caspase-9
autocleavage in the apoptotic response to DNA damage. J Biol Chem
2005;280(12):11147-51. doi: 10.1074/jbc.M413787200 [published Online First:
2005/01/20]
655. Machida YJ, Machida Y, Chen Y, et al. UBE2T Is the E2 in the Fanconi Anemia Pathway
and Undergoes Negative Autoregulation. Molecular cell 2006;23(4):589-96. doi:
https://doi.org/10.1016/j.molcel.2006.06.024
656. D'Andrea AD, Grompe M. The Fanconi anaemia/BRCA pathway. Nat Rev Cancer
2003;3(1):23-34. doi: 10.1038/nrc970 [published Online First: 2003/01/02]
657. Guler GD, Liu H, Vaithiyalingam S, et al. Human DNA helicase B (HDHB) binds to
replication protein A and facilitates cellular recovery from replication stress. J Biol
Chem 2012;287(9):6469-81. doi: 10.1074/jbc.M111.324582 [published Online First:
2011/12/24]
658. Danielsen JR, Povlsen LK, Villumsen BH, et al. DNA damage-inducible SUMOylation of
HERC2 promotes RNF8 binding via a novel SUMO-binding Zinc finger. J Cell Biol
2012;197(2):179-87. doi: 10.1083/jcb.201106152 [published Online First:
2012/04/18]
659. Germann SM, Oestergaard VH, Haas C, et al. Dpb11/TopBP1 plays distinct roles in DNA
replication, checkpoint response and homologous recombination. DNA Repair
2011;10(2):210-24. doi: https://doi.org/10.1016/j.dnarep.2010.11.001
660. Goldstein M, Kastan MB. Repair versus checkpoint functions of Brca1 are differentially
regulated by site of chromatin binding. Cancer research 2015;75(13):2699-707. doi:
10.1158/0008-5472.CAN-15-0400
661. Mahmoudi M, Gorenne I, Mercer J, et al. Statins Use a Novel Nijmegen Breakage
Syndrome-1–Dependent Pathway to Accelerate DNA Repair in Vascular Smooth
Muscle Cells. Circulation Research 2008;103(7):717-25. doi:
10.1161/circresaha.108.182899
662. Tseng S-F, Chang C-Y, Wu K-J, et al. Importin KPNA2 Is Required for Proper Nuclear
Localization and Multiple Functions of NBS1. Journal of Biological Chemistry
2005;280(47):39594-600. doi: 10.1074/jbc.M508425200
663. Badie S, Liao C, Thanasoula M, et al. RAD51C facilitates checkpoint signaling by
promoting CHK2 phosphorylation. The Journal of Cell Biology 2009;185(4):587-600.
doi: 10.1083/jcb.200811079
664. Maiti A, Drohat AC. Thymine DNA Glycosylase Can Rapidly Excise 5-Formylcytosine and
5-Carboxylcytosine: POTENTIAL IMPLICATIONS FOR ACTIVE DEMETHYLATION OF CpG
SITES. The Journal of Biological Chemistry 2011;286(41):35334-38. doi:
10.1074/jbc.C111.284620
665. Maiti A, Noon MS, MacKerell AD, Jr., et al. Lesion processing by a repair enzyme is
severely curtailed by residues needed to prevent aberrant activity on undamaged
DNA. Proc Natl Acad Sci U S A 2012;109(21):8091-6. doi: 10.1073/pnas.1201010109
[published Online First: 2012/05/11]

195
666. Lindahl T. Instability and decay of the primary structure of DNA. Nature
1993;362(6422):709-15. doi: 10.1038/362709a0 [published Online First: 1993/04/22]
667. Stivers JT, Jiang YL. A mechanistic perspective on the chemistry of DNA repair
glycosylases. Chemical reviews 2003;103(7):2729-59. doi: 10.1021/cr010219b
[published Online First: 2003/07/10]
668. Bogliolo M, Taylor RM, Caldecott KW, et al. Reduced ligation during DNA base excision
repair supported by BRCA2 mutant cells. Oncogene 2000;19(50):5781-7. doi:
10.1038/sj.onc.1203951 [published Online First: 2000/12/29]
669. Saeki H, Siaud N, Christ N, et al. Suppression of the DNA repair defects of BRCA2-
deficient cells with heterologous protein fusions. Proc Natl Acad Sci U S A
2006;103(23):8768-73. doi: 10.1073/pnas.0600298103 [published Online First:
2006/05/30]
670. Cipak L, Watanabe N, Bessho T. The role of BRCA2 in replication-coupled DNA
interstrand cross-link repair in vitro. Nature structural & molecular biology
2006;13(8):729-33. doi: 10.1038/nsmb1120 [published Online First: 2006/07/18]
671. Hegde ML, Banerjee S, Hegde PM, et al. Enhancement of NEIL1 protein-initiated
oxidized DNA base excision repair by heterogeneous nuclear ribonucleoprotein U
(hnRNP-U) via direct interaction. J Biol Chem 2012;287(41):34202-11. doi:
10.1074/jbc.M112.384032 [published Online First: 2012/08/21]
672. Muftuoglu M, de Souza-Pinto NC, Dogan A, et al. Cockayne syndrome group B protein
stimulates repair of formamidopyrimidines by NEIL1 DNA glycosylase. J Biol Chem
2009;284(14):9270-9. doi: 10.1074/jbc.M807006200 [published Online First:
2009/01/31]
673. Hegde PM, Dutta A, Sengupta S, et al. The C-terminal Domain (CTD) of Human DNA
Glycosylase NEIL1 Is Required for Forming BERosome Repair Complex with DNA
Replication Proteins at the Replicating Genome: DOMINANT NEGATIVE FUNCTION OF
THE CTD. J Biol Chem 2015;290(34):20919-33. doi: 10.1074/jbc.M115.642918
[published Online First: 2015/07/03]
674. Das A, Boldogh I, Lee JW, et al. The human Werner syndrome protein stimulates repair
of oxidative DNA base damage by the DNA glycosylase NEIL1. J Biol Chem
2007;282(36):26591-602. doi: 10.1074/jbc.M703343200 [published Online First:
2007/07/06]
675. Li F, Mao G, Tong D, et al. The Histone Mark H3K36me3 Regulates Human DNA
Mismatch Repair through Its Interaction with MutSα. Cell 2013;153(3):590-600. doi:
https://doi.org/10.1016/j.cell.2013.03.025
676. Acharya S, Wilson T, Gradia S, et al. hMSH2 forms specific mispair-binding complexes
with hMSH3 and hMSH6. Proceedings of the National Academy of Sciences of the
United States of America 1996;93(24):13629-34.
677. Ghodgaonkar Medini M, Lazzaro F, Olivera-Pimentel M, et al. Ribonucleotides
Misincorporated into DNA Act as Strand-Discrimination Signals in Eukaryotic
Mismatch Repair. Molecular cell;50(3):323-32. doi: 10.1016/j.molcel.2013.03.019
678. Ceccotti S, Ciotta C, Fronza G, et al. Multiple mutations and frameshifts are the hallmark
of defective hPMS2 in pZ189-transfected human tumor cells. Nucleic Acids Research
2000;28(13):2577-84.
679. Risinger JI, Umar A, Boyd J, et al. Mutation of MSH3 in endometrial cancer and evidence
for its functional role in heteroduplex repair. Nat Genet 1996;14(1):102-5. doi:
10.1038/ng0996-102 [published Online First: 1996/09/01]

196
680. Lio YC, Schild D, Brenneman MA, et al. Human Rad51C deficiency destabilizes XRCC3,
impairs recombination, and radiosensitizes S/G2-phase cells. J Biol Chem
2004;279(40):42313-20. doi: 10.1074/jbc.M405212200 [published Online First:
2004/08/05]
681. Zhang J, Wang X, Lin CJ, et al. Altered expression of FANCL confers mitomycin C
sensitivity in Calu-6 lung cancer cells. Cancer biology & therapy 2006;5(12):1632-6.
[published Online First: 2006/11/16]
682. Li L, Deng B, Xing G, et al. PACT is a negative regulator of p53 and essential for cell
growth and embryonic development. Proc Natl Acad Sci U S A 2007;104(19):7951-6.
doi: 10.1073/pnas.0701916104 [published Online First: 2007/05/02]
683. Doles J, Hemann MT. Nek4 status differentially alters sensitivity to distinct microtubule
poisons. Cancer Res 2010;70(3):1033-41. doi: 10.1158/0008-5472.can-09-2113
[published Online First: 2010/01/28]
684. Singh KK, Shukla PC, Quan A, et al. BRCA2 protein deficiency exaggerates doxorubicin-
induced cardiomyocyte apoptosis and cardiac failure. J Biol Chem 2012;287(9):6604-
14. doi: 10.1074/jbc.M111.292664 [published Online First: 2011/12/14]
685. Rajagopalan S, Andreeva A, Rutherford TJ, et al. Mapping the physical and functional
interactions between the tumor suppressors p53 and BRCA2. Proc Natl Acad Sci U S A
2010;107(19):8587-92. doi: 10.1073/pnas.1003689107 [published Online First:
2010/04/28]
686. Sakai W, Swisher EM, Jacquemont C, et al. Functional restoration of BRCA2 protein by
secondary BRCA2 mutations in BRCA2-mutated ovarian carcinoma. Cancer Res
2009;69(16):6381-6. doi: 10.1158/0008-5472.can-09-1178 [published Online First:
2009/08/06]
687. Yuan SS, Lee SY, Chen G, et al. BRCA2 is required for ionizing radiation-induced
assembly of Rad51 complex in vivo. Cancer Res 1999;59(15):3547-51. [published
Online First: 1999/08/14]
688. Shay JW, Tomlinson G, Piatyszek MA, et al. Spontaneous in vitro immortalization of
breast epithelial cells from a patient with Li-Fraumeni syndrome. Mol Cell Biol
1995;15(1):425-32. [published Online First: 1995/01/01]
689. Forsyth NR, Morales CP, Damle S, et al. Spontaneous immortalization of clinically
normal colon-derived fibroblasts from a familial adenomatous polyposis patient.
Neoplasia 2004;6(3):258-65. doi: 10.1593/neo.4103 [published Online First:
2004/05/22]
690. Gollahon LS, Kraus E, Wu TA, et al. Telomerase activity during spontaneous
immortalization of Li-Fraumeni syndrome skin fibroblasts. Oncogene 1998;17(6):709-
17. doi: 10.1038/sj.onc.1201987 [published Online First: 1998/08/26]
691. Willers H, Pfäffle HN, Zou L. Chapter 7 - Targeting Homologous Recombination Repair in
Cancer A2 - Kelley, Mark R. DNA Repair in Cancer Therapy. San Diego: Academic Press
2012:119-60.
692. DeWeese TL, Laiho M. Molecular determinants of radiation response: Springer Science
& Business Media 2011.
693. Zhu M, Zhao H, Liao J, et al. HERC2/USP20 coordinates CHK1 activation by modulating
CLASPIN stability. Nucleic Acids Research 2014;42(21):13074-81. doi:
10.1093/nar/gku978
694. Brown JS, Jackson SP. Ubiquitylation, neddylation and the DNA damage response. Open
biology 2015;5(4):150018. doi: 10.1098/rsob.150018 [published Online First:
2015/04/03]

197
695. Lou Z, Minter-Dykhouse K, Wu X, et al. MDC1 is coupled to activated CHK2 in
mammalian DNA damage response pathways. Nature 2003;421(6926):957-61. doi:
10.1038/nature01447 [published Online First: 2003/02/28]
696. Hu C, Zhang S, Gao X, et al. Roles of Kruppel-associated Box (KRAB)-associated Co-
repressor KAP1 Ser-473 Phosphorylation in DNA Damage Response. J Biol Chem
2012;287(23):18937-52. doi: 10.1074/jbc.M111.313262 [published Online First:
2012/04/13]
697. Bolderson E, Savage KI, Mahen R, et al. Kruppel-associated Box (KRAB)-associated co-
repressor (KAP-1) Ser-473 phosphorylation regulates heterochromatin protein 1beta
(HP1-beta) mobilization and DNA repair in heterochromatin. J Biol Chem
2012;287(33):28122-31. doi: 10.1074/jbc.M112.368381 [published Online First:
2012/06/21]
698. Stucki M, Clapperton JA, Mohammad D, et al. MDC1 Directly Binds Phosphorylated
Histone H2AX to Regulate Cellular Responses to DNA Double-Strand Breaks.
Cell;123(7):1213-26. doi: 10.1016/j.cell.2005.09.038
699. Canman CE, Lim D-S, Cimprich KA, et al. Activation of the ATM Kinase by Ionizing
Radiation and Phosphorylation of p53. Science 1998;281(5383):1677-79. doi:
10.1126/science.281.5383.1677
700. Katsura M, Tsuruga T, Date O, et al. The ATR-Chk1 pathway plays a role in the
generation of centrosome aberrations induced by Rad51C dysfunction. Nucleic Acids
Res 2009;37(12):3959-68.
701. Kuznetsov S, Pellegrini M, Shuda K, et al. RAD51C deficiency in mice results in early
prophase I arrest in males and sister chromatid separation at metaphase II in
females. The Journal of Cell Biology 2007;176(5):581-92. doi: 10.1083/jcb.200608130
702. Mizuta R, LaSalle JM, Cheng H-L, et al. RAB22 and RAB163/mouse BRCA2: Proteins that
specifically interact with the RAD51 protein. Proceedings of the National Academy of
Sciences 1997;94(13):6927-32.
703. Takata M, Sasaki MS, Tachiiri S, et al. Chromosome instability and defective
recombinational repair in knockout mutants of the five Rad51 paralogs. Mol Cell Biol
2001;21(8):2858-66. doi: 10.1128/mcb.21.8.2858-2866.2001 [published Online First:
2001/04/03]
704. Kobayashi S, Kasaishi Y, Nakada S, et al. Rad18 and Rnf8 facilitate homologous
recombination by two distinct mechanisms, promoting Rad51 focus formation and
suppressing the toxic effect of nonhomologous end joining. Oncogene
2015;34(33):4403-11. doi: 10.1038/onc.2014.371 [published Online First:
2014/11/25]
705. Wu W, Sato K, Koike A, et al. HERC2 is an E3 ligase that targets BRCA1 for degradation.
Cancer Res 2010;70(15):6384-92. doi: 10.1158/0008-5472.can-10-1304 [published
Online First: 2010/07/16]
706. Morice-Picard F, Benard G, Rezvani HR, et al. Complete loss of function of the ubiquitin
ligase HERC2 causes a severe neurodevelopmental phenotype. European Journal Of
Human Genetics 2016;25:52. doi: 10.1038/ejhg.2016.139
https://www.nature.com/articles/ejhg2016139#supplementary-information
707. Huber R, Braselmann H, Geinitz H, et al. Chromosomal radiosensitivity and acute
radiation side effects after radiotherapy in tumour patients - a follow-up study.
Radiation Oncology (London, England) 2011;6:32-32. doi: 10.1186/1748-717X-6-32

198
708. Panier S, Durocher D. Regulatory ubiquitylation in response to DNA double-strand
breaks. DNA Repair (Amst) 2009;8(4):436-43. doi: 10.1016/j.dnarep.2009.01.013
[published Online First: 2009/02/24]
709. Devgan SS, Sanal O, Doil C, et al. Homozygous deficiency of ubiquitin-ligase ring-finger
protein RNF168 mimics the radiosensitivity syndrome of ataxia-telangiectasia. Cell
Death & Differentiation 2011;18(9):1500-06.
710. Stewart GS, Stankovic T, Byrd PJ, et al. RIDDLE immunodeficiency syndrome is linked to
defects in 53BP1-mediated DNA damage signaling. Proceedings of the National
Academy of Sciences 2007;104(43):16910-15.
711. Auer J, Keller U, Schmidt M, et al. Individual radiosensitivity in a breast cancer collective
is changed with the patients' age. Radiology and oncology 2014;48(1):80-6. doi:
10.2478/raon-2013-0061 [published Online First: 2014/03/04]
712. Schroder-Heurich B, Wieland B, Lavin MF, et al. Protective role of RAD50 on chromatin
bridges during abnormal cytokinesis. FASEB journal : official publication of the
Federation of American Societies for Experimental Biology 2014;28(3):1331-41. doi:
10.1096/fj.13-236984 [published Online First: 2013/12/18]
713. Wouters BJ. Cell death after irradiation - how, when and why cells die. Basic Clinical
Radiobiology. 4th ed. UK: Hodder Arnold 2009.
714. Makpol S, Durani LW, Chua KH, et al. Tocotrienol-rich fraction prevents cell cycle arrest
and elongates telomere length in senescent human diploid fibroblasts. Journal of
biomedicine & biotechnology 2011;2011:506171. doi: 10.1155/2011/506171
[published Online First: 2011/05/05]
715. Wadhwa R, Kaul Z, Kaul SC. Cell Cycle Checkpoints and Senescence. In: Rattan SIS,
Hayflick L, eds. Cellular Ageing and Replicative Senescence. Cham: Springer
International Publishing 2016:145-67.
716. Polo SE, Theocharis SE, Klijanienko J, et al. Chromatin assembly factor-1, a marker of
clinical value to distinguish quiescent from proliferating cells. Cancer Res
2004;64(7):2371-81. [published Online First: 2004/04/03]
717. Freitas AA, Vasieva O, de Magalhaes JP. A data mining approach for classifying DNA
repair genes into ageing-related or non-ageing-related. BMC genomics 2011;12:27.
doi: 10.1186/1471-2164-12-27 [published Online First: 2011/01/14]
718. Tumiati M, Munne PM, Edgren H, et al. Rad51c- and Trp53-double-mutant mouse
model reveals common features of homologous recombination-deficient breast
cancers. Oncogene 2016;35(35):4601-10. doi: 10.1038/onc.2015.528
719. Rodríguez-Rodero S, Fernández-Morera JL, Menéndez-Torre E, et al. Aging Genetics and
Aging. Aging and Disease 2011;2(3):186-95.
720. GenAge. GenAge by HAGR (Human Ageing Genomic Resources) 2017 [Available from:
http://genomics.senescence.info/genes/.
721. Cao L, Li W, Kim S, et al. Senescence, aging, and malignant transformation mediated by
p53 in mice lacking the Brca1 full-length isoform. Genes Dev 2003;17(2):201-13. doi:
10.1101/gad.1050003 [published Online First: 2003/01/21]
722. Tan XL, Popanda O, Ambrosone CB, et al. Association between TP53 and p21 genetic
polymorphisms and acute side effects of radiotherapy in breast cancer patients.
Breast Cancer Res Treat 2006;97
723. Qian Y, Chen X. Senescence Regulation by the p53 Protein Family. Methods in molecular
biology (Clifton, NJ) 2013;965:37-61. doi: 10.1007/978-1-62703-239-1_3
199
724. Shtutman M, Chang BD, Schools GP, et al. Cellular Model of p21-Induced Senescence.
Methods Mol Biol 2017;1534:31-39. doi: 10.1007/978-1-4939-6670-7_3 [published
Online First: 2016/11/05]
725. Ayouaz A, Raynaud C, Heride C, et al. Telomeres: Hallmarks of radiosensitivity.
Biochimie 2008;90(1):60-72. doi: https://doi.org/10.1016/j.biochi.2007.09.011
726. Mirjolet C, Boidot R, Saliques S, et al. The role of telomeres in predicting individual
radiosensitivity of patients with cancer in the era of personalized radiotherapy.
Cancer Treatment Reviews 2015;41(4):354-60. doi: 10.1016/j.ctrv.2015.02.005
727. Childs BG, Baker DJ, Kirkland JL, et al. Senescence and apoptosis: dueling or
complementary cell fates? EMBO Reports 2014;15(11):1139-53. doi:
10.15252/embr.201439245
728. Munoz-Espin D, Serrano M. Cellular senescence: from physiology to pathology. Nature
reviews Molecular cell biology 2014;15(7):482-96. doi: 10.1038/nrm3823
729. Gorgoulis VG, Halazonetis TD. Oncogene-induced senescence: the bright and dark side
of the response. Current opinion in cell biology 2010;22(6):816-27. doi:
10.1016/j.ceb.2010.07.013 [published Online First: 2010/09/03]
730. Paasch J, Fiala MA, Chen L, et al. The Senescence-Associated Secretory Phenotype In
Multiple Myeloma. Blood 2013;122(21):5357-57.
731. Rodier F, Coppe JP, Patil CK, et al. Persistent DNA damage signalling triggers
senescence-associated inflammatory cytokine secretion. Nat Cell Biol
2009;11(8):973-9. doi: 10.1038/ncb1909 [published Online First: 2009/07/15]
732. Schmitt E, Paquet C, Beauchemin M, et al. DNA-damage response network at the
crossroads of cell-cycle checkpoints, cellular senescence and apoptosis. Journal of
Zhejiang University Science B 2007;8(6):377-97. doi: 10.1631/jzus.2007.B0377
733. Altshuler D, Daly MJ, Lander ES. Genetic mapping in human disease. Science
2008;322(5903):881-8. doi: 10.1126/science.1156409 [published Online First:
2008/11/08]
734. Althubiti M, Lezina L, Carrera S, et al. Characterization of novel markers of senescence
and their prognostic potential in cancer. Cell death & disease 2014;5(11):e1528. doi:
10.1038/cddis.2014.489
735. Coppé J-P, Desprez P-Y, Krtolica A, et al. The Senescence-Associated Secretory
Phenotype: The Dark Side of Tumor Suppression. Annual review of pathology
2010;5:99-118. doi: 10.1146/annurev-pathol-121808-102144
736. Slattery ML, Kerber RA. A comprehensive evaluation of family history and breast cancer
risk. The Utah Population Database. Jama 1993;270(13):1563-8. [published Online
First: 1993/10/06]
737. Paquet D, Kwart D, Chen A, et al. Efficient introduction of specific homozygous and
heterozygous mutations using CRISPR/Cas9. Nature 2016;533(7601):125-29. doi:
10.1038/nature17664
http://www.nature.com/nature/journal/v533/n7601/abs/nature17664.html#supple
mentary-information
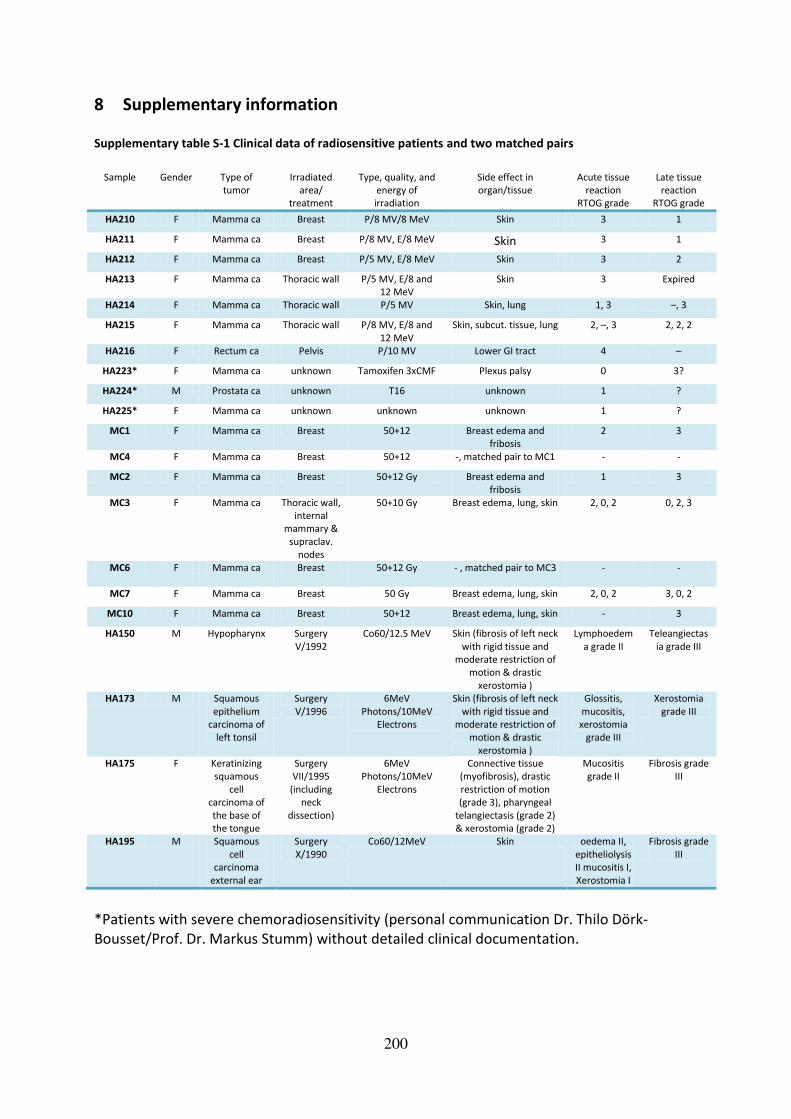
200
8 Supplementary information Supplementary table S-1 Clinical data of radiosensitive patients and two matched pairs
Sample Gender Type of
tumor Irradiated
area/ treatment
Type, quality, and energy of irradiation
Side effect in organ/tissue
Acute tissue reaction
RTOG grade
Late tissue reaction
RTOG grade
HA210 F Mamma ca Breast P/8 MV/8 MeV Skin 3 1
HA211 F Mamma ca Breast P/8 MV, E/8 MeV Skin 3 1
HA212 F Mamma ca Breast P/5 MV, E/8 MeV Skin 3 2
HA213 F Mamma ca Thoracic wall P/5 MV, E/8 and 12 MeV
Skin 3 Expired
HA214 F Mamma ca Thoracic wall P/5 MV Skin, lung 1, 3 –, 3
HA215 F Mamma ca Thoracic wall P/8 MV, E/8 and
12 MeV
Skin, subcut. tissue, lung 2, –, 3 2, 2, 2
HA216 F Rectum ca Pelvis P/10 MV Lower GI tract 4 –
HA223* F Mamma ca unknown Tamoxifen 3xCMF Plexus palsy 0 3?
HA224* M Prostata ca unknown T16 unknown 1 ?
HA225* F Mamma ca unknown unknown unknown 1 ?
MC1 F Mamma ca Breast 50+12 Breast edema and fribosis
2 3
MC4 F Mamma ca Breast 50+12 -, matched pair to MC1 - -
MC2 F Mamma ca Breast 50+12 Gy Breast edema and fribosis
1 3
MC3 F Mamma ca Thoracic wall, internal
mammary &
supraclav. nodes
50+10 Gy Breast edema, lung, skin 2, 0, 2 0, 2, 3
MC6 F Mamma ca Breast 50+12 Gy
- , matched pair to MC3 - -
MC7 F Mamma ca Breast 50 Gy Breast edema, lung, skin 2, 0, 2 3, 0, 2
MC10 F Mamma ca Breast 50+12 Breast edema, lung, skin - 3
HA150 M Hypopharynx Surgery
V/1992
Co60/12.5 MeV Skin (fibrosis of left neck
with rigid tissue and moderate restriction of
motion & drastic
xerostomia )
Lymphoedem
a grade II
Teleangiectas
ia grade III
HA173 M Squamous
epithelium carcinoma of
left tonsil
Surgery
V/1996
6MeV
Photons/10MeV Electrons
Skin (fibrosis of left neck
with rigid tissue and moderate restriction of
motion & drastic
xerostomia )
Glossitis,
mucositis, xerostomia
grade III
Xerostomia
grade III
HA175 F Keratinizing squamous
cell carcinoma of
the base of
the tongue
Surgery VII/1995
(including neck
dissection)
6MeV Photons/10MeV
Electrons
Connective tissue (myofibrosis), drastic
restriction of motion (grade 3), pharyngeal
telangiectasis (grade 2)
& xerostomia (grade 2)
Mucositis grade II
Fibrosis grade III
HA195 M Squamous
cell carcinoma
external ear
Surgery
X/1990
Co60/12MeV Skin oedema II,
epitheliolysis II mucositis I,
Xerostomia I
Fibrosis grade
III
*Patients with severe chemoradiosensitivity (personal communication Dr. Thilo Dörk-
Bousset/Prof. Dr. Markus Stumm) without detailed clinical documentation.

201
Supplementary figure S-1 No alterations in TPT1 levels after IR in different cell systems and no effect of TPT1
knockdown on p-CHEK2 Ser19 levels after IR
Western blot of ADP and MCF10A whole cell extracts after treatment with TPT1 siRNA (si) or scrambled control
(ctrl) 48 h prior to IR and lysed 30 minutes after 6 Gy IR (panel A). The immunoreactivities of p-CHEK2 (Ser19),
TPT1 and β-actin as loading control are shown. Panel B shows whole cell extracts of ADP cells which were
treated with siRNAs specific for TPT1 (si) or scrambled controls (ctrl) 48–72 h prior to lysis. TPT1 levels in whole
cell extracts from ADP cells (panel C), the triple negative breast cancer cells lines (HCC1937 and HCC1395) and
normal breast epithelial cells (MCF10A) in panel D are shown 30 min after 0.06 Gy, 1 Gy and 6 Gy IR. β-actin
was used as loading control.


203
Supplementary figure S-3 No evidence for colocalization of TPT1 and γH2AX or decreased γH2AX foci
numbers after TPT1 knockdown
Confocal analyses of immunostainings of asynchronous, subconfluent ADP (panel A) and MCF10A (panel B) cells
preextracted with Triton X-100265
and non-preextracted control cells fixed 1 h after IR. Cells were treated with
TPT1-specific siRNAs (TPT1 knockdown) or scrambled controls (negative control). Antibodies against TPT1
(green) (ab133568) and γH2AX (red) were used and nuclei were stained with DAPI (blue). Panels C and D show
immunostainings of asynchronous, subconfluent ADP cells preextracted with Triton X-100265
and non-
preextracted control cells fixed 1 h after no (C) or 1 Gy IR (D). Antibodies against TPT1 (red) (ab37506) and
γH2AX (green) were used and nuclei were stained with DAPI (blue). Scale bar= 25 µm.

204
Supplementary figure S-4 No evidence for nuclear translocation of TPT1 in ADP or colocalization with γH2AX
after IR in HCC1937 cells
Panel A shows immunostainings of asynchronous, subconfluent HCC1937 cells fixed 1 h after no (0 Gy), low
(0.25 Gy) or medium (1 Gy) IR. Antibodies against TPT1 (green) (ab133568) and γH2AX (red) were applied and
nuclei were stained with DAPI (blue). Similar results were obtained in HCC1395 and HCC38 cells. Panel B shows
enlargements of panel A with arrows pointing to the area of possible “foci-like”-structure-forming. Confocal
pictures of translocation analyses in non-preextracted ADP cells stained with TPT1 (ab133568) after 0 Gy and
1 h after 1 Gy irradiation are shown in Panel C. Scale bar= 25 µm.


206
Supplementary figure S-6 Secondary antibody controls for immunostainings
Immunostaining controls with solely secondary antibodies applied to ADP, HCC1937 and MCF10A cells
exemplarily given for co-staining with Alexa Fluor Anti-rabbit IgG 488 in green and Alexa Fluor Anti-mouse IgG
546 in red, as well as co-stainings with FITC-conjugated Anti-mouse IgG antibody in green and Alexa Fluor Anti-
rabbit IgG 546 in red, respectively, in the upper part of the figure. Antibody controls for BJ5TA; MC1 TERT, MC3
TERT and MC7 TERT cells using green Alexa Fluor Anti-rabbit IgG 488 and red Alexa Fluor Anti-mouse IgG 546
are given in the lower panel. Nuclei were stained with DAPI (blue). Scale bar= 25 µm.
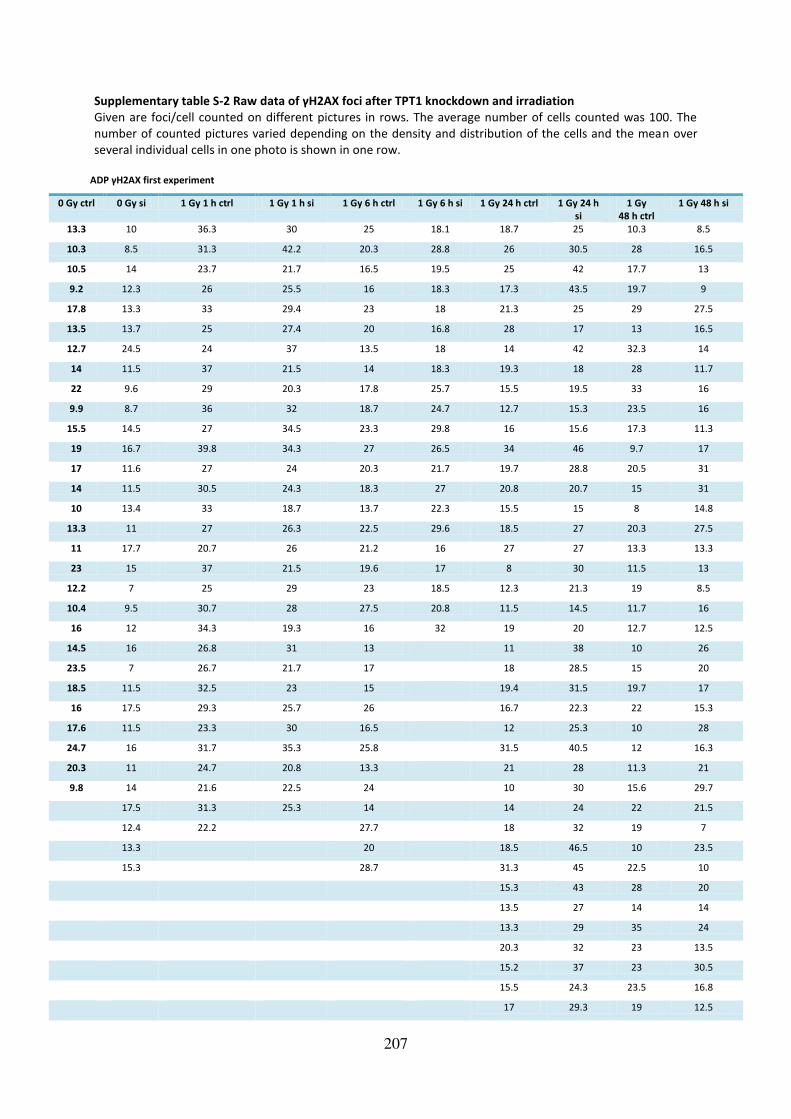
207
Supplementary table S-2 Raw data of γH2AX foci after TPT1 knockdown and irradiation
Given are foci/cell counted on different pictures in rows. The average number of cells counted was 100. The
number of counted pictures varied depending on the density and distribution of the cells and the mean over
several individual cells in one photo is shown in one row.
ADP γH2AX first experiment
0 Gy ctrl 0 Gy si 1 Gy 1 h ctrl 1 Gy 1 h si 1 Gy 6 h ctrl 1 Gy 6 h si 1 Gy 24 h ctrl 1 Gy 24 h
si
1 Gy
48 h ctrl
1 Gy 48 h si
13.3 10 36.3 30 25 18.1 18.7 25 10.3 8.5
10.3 8.5 31.3 42.2 20.3 28.8 26 30.5 28 16.5
10.5 14 23.7 21.7 16.5 19.5 25 42 17.7 13
9.2 12.3 26 25.5 16 18.3 17.3 43.5 19.7 9
17.8 13.3 33 29.4 23 18 21.3 25 29 27.5
13.5 13.7 25 27.4 20 16.8 28 17 13 16.5
12.7 24.5 24 37 13.5 18 14 42 32.3 14
14 11.5 37 21.5 14 18.3 19.3 18 28 11.7
22 9.6 29 20.3 17.8 25.7 15.5 19.5 33 16
9.9 8.7 36 32 18.7 24.7 12.7 15.3 23.5 16
15.5 14.5 27 34.5 23.3 29.8 16 15.6 17.3 11.3
19 16.7 39.8 34.3 27 26.5 34 46 9.7 17
17 11.6 27 24 20.3 21.7 19.7 28.8 20.5 31
14 11.5 30.5 24.3 18.3 27 20.8 20.7 15 31
10 13.4 33 18.7 13.7 22.3 15.5 15 8 14.8
13.3 11 27 26.3 22.5 29.6 18.5 27 20.3 27.5
11 17.7 20.7 26 21.2 16 27 27 13.3 13.3
23 15 37 21.5 19.6 17 8 30 11.5 13
12.2 7 25 29 23 18.5 12.3 21.3 19 8.5
10.4 9.5 30.7 28 27.5 20.8 11.5 14.5 11.7 16
16 12 34.3 19.3 16 32 19 20 12.7 12.5
14.5 16 26.8 31 13 11 38 10 26
23.5 7 26.7 21.7 17 18 28.5 15 20
18.5 11.5 32.5 23 15 19.4 31.5 19.7 17
16 17.5 29.3 25.7 26 16.7 22.3 22 15.3
17.6 11.5 23.3 30 16.5 12 25.3 10 28
24.7 16 31.7 35.3 25.8 31.5 40.5 12 16.3
20.3 11 24.7 20.8 13.3 21 28 11.3 21
9.8 14 21.6 22.5 24 10 30 15.6 29.7
17.5 31.3 25.3 14 14 24 22 21.5
12.4 22.2 27.7 18 32 19 7
13.3 20 18.5 46.5 10 23.5
15.3 28.7 31.3 45 22.5 10
15.3 43 28 20
13.5 27 14 14
13.3 29 35 24
20.3 32 23 13.5
15.2 37 23 30.5
15.5 24.3 23.5 16.8
17 29.3 19 12.5

208
37 22.3 36
42 22.3 30
35 16 24.5
30.3 22
27
15.5
ADP γH2AX second experiment
0 Gy ctrl 0 Gy si 1 Gy 1 h
ctrl
1 Gy 1 h si 1 Gy 6 h ctrl 1 Gy 6 h si 1 Gy 24 h ctrl 1 Gy 24 h
si
1 Gy
48 h ctrl
1 Gy 48 h si
11 11 20.7 16 27 21.5 9.5 16 6 11
14.3 11 18.8 37.5 18 21 11.5 25 9 11
10 15.8 23 37 15 15.3 15.5 21 9.3 12
10.4 16.5 15.7 18 21 18.5 21 25 22.5 12
15.7 11.5 26.5 20 19.5 19.5 12.5 22 7 12.3
17 17.5 28.5 17 23.5 22 13 23.3 23 12.5
14.3 7 24 18 26.5 15.5 10 28.5 18.5 13
14.3 7.2 25 26.5 20 18 12.7 24 12 13
13.7 13.3 21.5 13.7 28 13.3 9.3 19.3 24.5 14.5
17 8.6 24.5 28.5 24 18 19.5 32.5 12.5 15.5
14.7 8 28.3 19 20 24.7 14 25.3 18.7 16
17.7 11.7 19.5 17 26 14.3 9 31.5 23 16
16.5 23 29 37 33.5 14.5 10.5 26.3 11 17.5
10.3 9.5 28.5 23.7 23.5 21.7 16.5 16.5 18 18
13.6 16.3 27.5 18 19 24 16.8 20.8 18.7 18.5
14 13 22.7 33 26.7 23.5 15.8 20 10.5 18.5
16.5 9 18 33.5 27 20.5 18.5 25 11.5 18.7
12.5 7.5 15 23.7 24.7 17.5 9.8 24.7 16 19
18.8 15 28 23.3 28 18.3 20.5 21.5 18.3 20
19.5 13 29 19 16.7 20.3 19.3 14.5 17 20
9.8 8 16.3 26 17.3 24.5 16 21 25.5 20.3
18 16 27.3 20.3 17 23.3 11 22 9 20.5
15.3 18.4 20 27 18 15.3 23 20 16.3 21
18 6 18.3 28.5 12.7 16 19.3 27.5 19 22
19 14.3 23 23 16 14.3 12 28.5 21 22
17.3 6.3 16.5 26 14.8 14.7 21.5 24 10.5 22
12.5 12.8 15.3 18 18 21.2 11.5 23.3 17 22
15.3 6.3 28.7 20.5 18 19 13 15.5 15.5 22.3
17.3 22.5 25 22 14 23.3 19.3 15.8 8 22.7
15.7 22.3 29 16.3 19.7 15.3 26.7 16 24
18.3 21.5 27 20.5 18.8 14 16 24
13.3 27.3 30 20 21 25.3 18 25
15 26 27 19.5 22.5 20.8 28 25.3
18.3 24.5 18 24.7 16.3 14 26
24 23.3 28.3 11.7 22.5 23.3 26
23.3 17 22 14.7 27
23 15.7 24 15 27
24.3 16.5 13.5 17.8 28
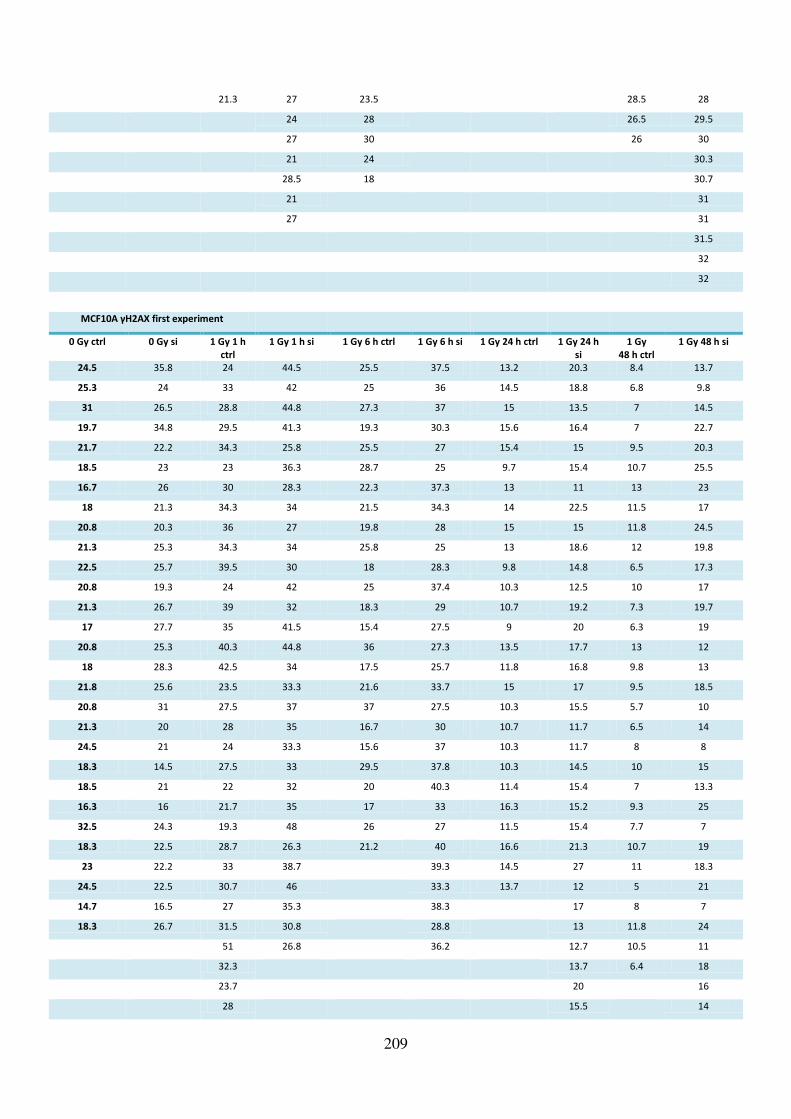
209
21.3 27 23.5 28.5 28
24 28 26.5 29.5
27 30 26 30
21 24 30.3
28.5 18 30.7
21 31
27 31
31.5
32
32
MCF10A γH2AX first experiment
0 Gy ctrl 0 Gy si 1 Gy 1 h
ctrl
1 Gy 1 h si 1 Gy 6 h ctrl 1 Gy 6 h si 1 Gy 24 h ctrl 1 Gy 24 h
si
1 Gy
48 h ctrl
1 Gy 48 h si
24.5 35.8 24 44.5 25.5 37.5 13.2 20.3 8.4 13.7
25.3 24 33 42 25 36 14.5 18.8 6.8 9.8
31 26.5 28.8 44.8 27.3 37 15 13.5 7 14.5
19.7 34.8 29.5 41.3 19.3 30.3 15.6 16.4 7 22.7
21.7 22.2 34.3 25.8 25.5 27 15.4 15 9.5 20.3
18.5 23 23 36.3 28.7 25 9.7 15.4 10.7 25.5
16.7 26 30 28.3 22.3 37.3 13 11 13 23
18 21.3 34.3 34 21.5 34.3 14 22.5 11.5 17
20.8 20.3 36 27 19.8 28 15 15 11.8 24.5
21.3 25.3 34.3 34 25.8 25 13 18.6 12 19.8
22.5 25.7 39.5 30 18 28.3 9.8 14.8 6.5 17.3
20.8 19.3 24 42 25 37.4 10.3 12.5 10 17
21.3 26.7 39 32 18.3 29 10.7 19.2 7.3 19.7
17 27.7 35 41.5 15.4 27.5 9 20 6.3 19
20.8 25.3 40.3 44.8 36 27.3 13.5 17.7 13 12
18 28.3 42.5 34 17.5 25.7 11.8 16.8 9.8 13
21.8 25.6 23.5 33.3 21.6 33.7 15 17 9.5 18.5
20.8 31 27.5 37 37 27.5 10.3 15.5 5.7 10
21.3 20 28 35 16.7 30 10.7 11.7 6.5 14
24.5 21 24 33.3 15.6 37 10.3 11.7 8 8
18.3 14.5 27.5 33 29.5 37.8 10.3 14.5 10 15
18.5 21 22 32 20 40.3 11.4 15.4 7 13.3
16.3 16 21.7 35 17 33 16.3 15.2 9.3 25
32.5 24.3 19.3 48 26 27 11.5 15.4 7.7 7
18.3 22.5 28.7 26.3 21.2 40 16.6 21.3 10.7 19
23 22.2 33 38.7 39.3 14.5 27 11 18.3
24.5 22.5 30.7 46 33.3 13.7 12 5 21
14.7 16.5 27 35.3 38.3 17 8 7
18.3 26.7 31.5 30.8 28.8 13 11.8 24
51 26.8 36.2 12.7 10.5 11
32.3 13.7 6.4 18
23.7 20 16
28 15.5 14

210
10.2
8.3
18.3
16
8.5
25
18
14.5
22
MCF10A γH2AX second experiment
0 Gy ctrl 0 Gy si 1 Gy 1 h
ctrl
1 Gy 1 h si 1 Gy 6 h ctrl 1 Gy 6 h si 1 Gy 24 h ctrl 1 Gy 24 h
si
1 Gy
48 h ctrl
1 Gy 48 h si
20 24.5 24 19.3 10 25 13.4 11.8 7.3 9
15 24 20 21 15 26 12.4 14.7 9.5 11.7
13.5 17 17.7 21 12 23 14 14.2 14.3 14
12.5 23 27.5 18.7 11.3 16 14.6 12 10 9.3
19.5 24.5 24 18.7 25.8 19.3 11.4 11 9 13.3
16.3 21 24 18 14 19.5 11 13.8 12 12
23.7 23.3 22.5 19 16.7 16 15 10.8 13.5 15.5
20.7 17.7 24.8 18 17.8 16.8 10.8 13.5 8.6 15
21.5 20.5 18.7 19 19.8 24 14 10.5 11.4 17.3
16.7 12 22.7 18 13.6 15.3 13.7 11 12.7 17
15.7 23.3 23.3 21.5 17.8 27.3 12.7 12.3 9.3 13
11 18.8 26 18.3 21.3 20 14 12 11.5 17
16.5 19.3 23.7 21 21.5 17.3 11 12 10 11
12 18.5 21 22.7 13.8 30.3 13 15.7 16.5 16.5
12.3 20 23.3 20.7 16.6 24.8 10.5 14.3 15 7
19.3 17 25 18.8 10.2 24.7 11 14.5 9.3 8
13.7 13.5 25 20 16 25 13.8 13 11 10
14.5 19 17.8 21 17.8 18 15 11.3 11.7 17
17.5 23 17.7 26.5 17.3 27 10.4 13.3 8.5 19
21 20.3 21 19.7 21.3 21.3 14.4 13 11.3 11
17.3 22.7 12.3 21.7 19 20.3 10 13 11.5 11
14.3 22 27.5 21 17.3 22.3 10.8 13 9.3 8
16 14.8 24.8 29 21.4 20 15.3 12 8 18.3
17.3 24.7 16 25.3 18 23.3 11 12.3 12.6 16.5
19.2 16.5 23.3 20.6 20.3 32.7 9.8 12.8 14.3 5
18.3 23 19.3 26.6 16.8 19.5 11 14 12.8 15.5
20 18.3 28 15.5 10 24 10 14.3 12.5 15.5
15 17.3 23 16.8 19 25.3 8.6 10.2 11.3 8
22 15 26.5 16.3 15.3 30.5 12.3 13.7 11.6 14
15 21 17.5 29 14.5 23.3 11.3 12.3 11 9
16.7 16.5 23.5 19 10.8 22.5 14.5 16.5 17.7 14
17 24.7 24 16.7 18.3 29 14 16.8 14.7 11
18.7 24 23 24 13.3 26.7 9.8 12.8 8
16 22.3 15.3 18 31 12.4 15 5

211
18 26.5 16.7 33.5 13 14.5 7
18.3 16.5 14.8 9.3 16 9
16 16.3 10.8 11.3 13.8 12.5
23 15.5 16.7 13 16 14
24 15.8 16 14
15.7 17.5 15
18 7
20.5 6
18.7 18.5
12
14
13
Supplementary figure S-7 No changes in 53BP1 foci numbers after IR in TPT1 knockdown cells compared to
controls
Asynchronous, subconfluent cells were treated with siRNA against TPT1 (si, light blue) or scrambled controls
(ctrl, dark blue) 48 h before IR with 1 Gy. Cells were fixed on glass slides 1 h, 6 h, 24 h or 48 h after IR and
stained for TPT1, 53BP1 and DAPI. 53BP1 foci were counted manually in an average of 100 cells on each slide
and cells with a minimum of 3 foci were considered foci-positive and subjected to counting. Means with
standard deviations are shown for ADP cells (left) and MCF10A cells (right).
Supplementary table S-3 Raw data of 53BP1 foci countings in ADP and MCF10A after TPT1 knockdown
ADP MCF10A
Mean SD Mean SD
0 Gy ctrl 8.3 2.7 14.2 2.4
0 Gy si 9.4 3 12.8 2.3
1 Gy 1 h ctrl 17.6 4 17.3 3.6
1 Gy 1 h si 18.1 5.3 15.7 4.1
1 Gy 6 h ctrl 14.9 3.4 13.3 2.7 1 Gy 6 h si 14.3 3.7 17.1 4.7
1 Gy 24 h ctrl 11.34 2.9 9.1 1.2
1 Gy 24 h si 12.4 2.7 10.8 2.0
1 Gy 48 h ctrl 12 3 7.4 2.1
1 Gy 48 h si 13.6 3.8 7.7 3.1
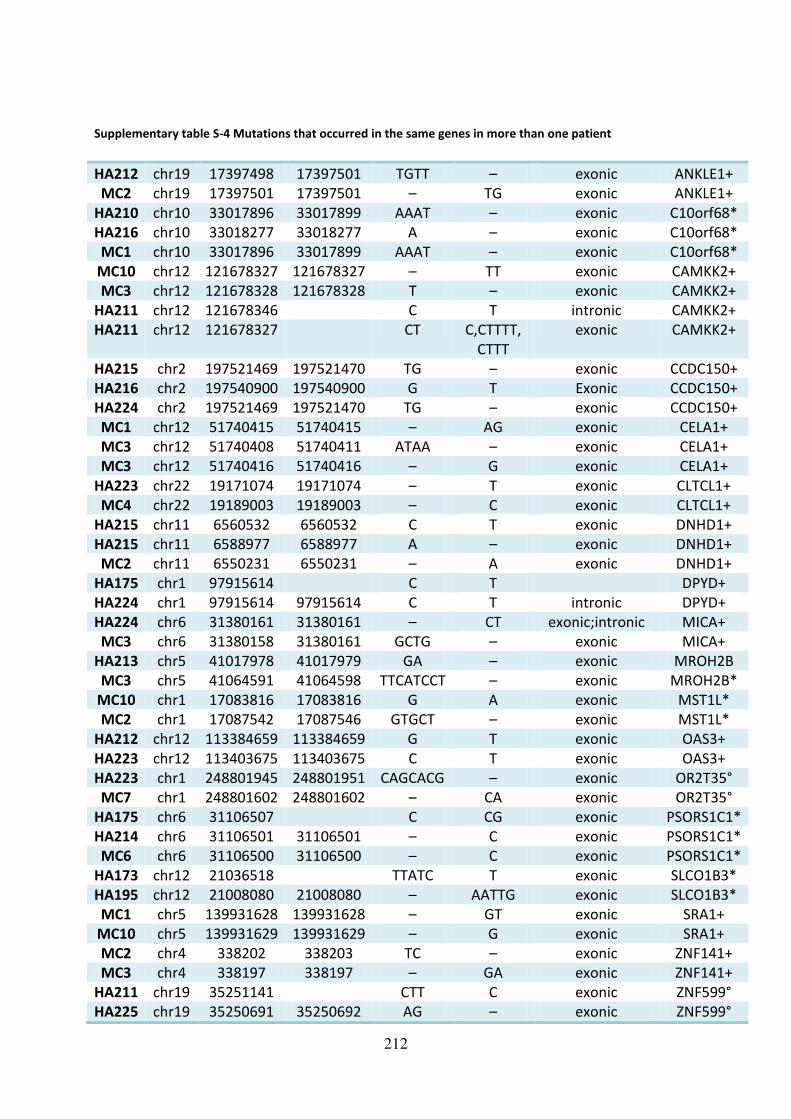
212
Supplementary table S-4 Mutations that occurred in the same genes in more than one patient
HA212 chr19 17397498 17397501 TGTT – exonic ANKLE1+
MC2 chr19 17397501 17397501 – TG exonic ANKLE1+
HA210 chr10 33017896 33017899 AAAT – exonic C10orf68*
HA216 chr10 33018277 33018277 A – exonic C10orf68*
MC1 chr10 33017896 33017899 AAAT – exonic C10orf68*
MC10 chr12 121678327 121678327 – TT exonic CAMKK2+
MC3 chr12 121678328 121678328 T – exonic CAMKK2+
HA211 chr12 121678346 C T intronic CAMKK2+
HA211 chr12 121678327 CT C,CTTTT,
CTTT
exonic CAMKK2+
HA215 chr2 197521469 197521470 TG – exonic CCDC150+
HA216 chr2 197540900 197540900 G T Exonic CCDC150+
HA224 chr2 197521469 197521470 TG – exonic CCDC150+
MC1 chr12 51740415 51740415 – AG exonic CELA1+
MC3 chr12 51740408 51740411 ATAA – exonic CELA1+
MC3 chr12 51740416 51740416 – G exonic CELA1+
HA223 chr22 19171074 19171074 – T exonic CLTCL1+
MC4 chr22 19189003 19189003 – C exonic CLTCL1+
HA215 chr11 6560532 6560532 C T exonic DNHD1+
HA215 chr11 6588977 6588977 A – exonic DNHD1+
MC2 chr11 6550231 6550231 – A exonic DNHD1+
HA175 chr1 97915614 C T DPYD+
HA224 chr1 97915614 97915614 C T intronic DPYD+
HA224 chr6 31380161 31380161 – CT exonic;intronic MICA+
MC3 chr6 31380158 31380161 GCTG – exonic MICA+
HA213 chr5 41017978 41017979 GA – exonic MROH2B
MC3 chr5 41064591 41064598 TTCATCCT – exonic MROH2B*
MC10 chr1 17083816 17083816 G A exonic MST1L*
MC2 chr1 17087542 17087546 GTGCT – exonic MST1L*
HA212 chr12 113384659 113384659 G T exonic OAS3+
HA223 chr12 113403675 113403675 C T exonic OAS3+
HA223 chr1 248801945 248801951 CAGCACG – exonic OR2T35°
MC7 chr1 248801602 248801602 – CA exonic OR2T35°
HA175 chr6 31106507 C CG exonic PSORS1C1*
HA214 chr6 31106501 31106501 – C exonic PSORS1C1*
MC6 chr6 31106500 31106500 – C exonic PSORS1C1*
HA173 chr12 21036518 TTATC T exonic SLCO1B3*
HA195 chr12 21008080 21008080 – AATTG exonic SLCO1B3*
MC1 chr5 139931628 139931628 – GT exonic SRA1+
MC10 chr5 139931629 139931629 – G exonic SRA1+
MC2 chr4 338202 338203 TC – exonic ZNF141+
MC3 chr4 338197 338197 – GA exonic ZNF141+
HA211 chr19 35251141 CTT C exonic ZNF599°
HA225 chr19 35250691 35250692 AG – exonic ZNF599°

213
HA212 chr16 89291210 89291210 – GTGA exonic ZNF778+
MC2 chr16 89294865 89294865 C A exonic ZNF778+
+= validated, *= validation not possible, °= not subjected to validation
Supplementary table S-5 Identical mutations that occurred in at least two patients
HA150 chr19 831815 GT G exonic AZU1+
HA210 chr19 831815 GT G exonic AZU1+
HA210 chr20 34828141 34828141 – C exonic AAR2+
MC10 chr20 34828141 34828141 – C exonic AAR2+
HA210 chr7 31697913 31697913 – T exonic CCDC129+
HA223 chr7 31697913 31697913 – T exonic CCDC129+
HA173 chr3 56655621 A AAGAG exonic CCDC66+
MC1 chr3 56655621 56655621 – AGAG exonic CCDC66+
HA173 chr4 76521525 C T intronic CDKL2+
HA214 chr4 76521525 76521525 C T intronic CDKL2+
HA225 chr4 76521525 76521525 C T intronic CDKL2+
HA150 chr16 23768875 23768875 C T exonic CHP2+
HA195 chr16 23768875 23768875 C T exonic CHP2+
HA210 chrX 133988145 133988145 A – exonic FAM122C+
MC10 chrX 133988145 133988145 A – exonic FAM122C+
HA173 chr11 12270793 GGT G intronic MICAL2+
HA214 chr11 12270794 12270795 GT – intronic MICAL2+
MC3 chr11 12270794 12270795 GT – intronic MICAL2+
HA216 chr18 48331612 48331613 AG – exonic MRO*
MC7 chr18 48331612 48331613 AG – exonic MRO*
HA210 chr14 23889445 23889445 – G intronic MYH7°
HA215 chr14 23889445 23889445 – G intronic MYH7°
HA210 chr7 123197691 123197691 G C exonic NDUFA5°
HA225 chr7 123197691 123197691 G C exonic NDUFA5°
HA195 chr16 450140 450140 – AG exonic NME4+
HA216 chr16 450140 450140 – AG exonic NME4+
HA225 chr16 450140 450140 – AG exonic NME4+
HA175 chr4 37962608 CAT C exonic PTTG2+
HA210 chr4 37962609 37962610 AT – exonic PTTG2+
HA175 chr6 71378354 AC A exonic SMAP1°
HA215 chr6 71378355 71378355 C – exonic SMAP1°
HA216 chr6 71378355 71378355 C – exonic SMAP1°
HA223 chr6 71378355 71378355 C – exonic SMAP1°
HA195 chr15 81624929 81624929 G T exonic TMC3+
HA212 chr15 81624929 81624929 G T exonic TMC3+
HA195 chr1 16073527 16073527 – G exonic TMEM82°
HA215 chr1 16073527 16073527 – G exonic TMEM82°
HA211 chr6 41766432 41766432 C CCCCCA exonic USP49+
HA223 chr6 41766432 41766432 – CCCCA exonic USP49+
HA210 chr4 265195 265195 A C exonic ZNF732*
HA224 chr4 265195 265195 A C exonic ZNF732*
+= validated, *= validation not possible, °= not subjected to validation

214
Supplementary table S-6 Mutations identified by exome sequencing and subjected to validation sequencing Patient Chr
.
Position
start
Position
end
Ref. Mut. Type Gene Forward primer
5’3’ Reverse primer
5’3’ Rs-number
HA210 20 34828141 34828141 – C exonic AAR2 GCATCCACTTCCTC
CACTAC
CAGGTAGCACATCG
GAAAAG
MC10 20 34828141 34828141 – C exonic AAR2 GCATCCACTTCCTC
CACTAC
CAGGTAGCACATCG
GAAAAG
HA223 16 48212598 48212598 C A intronic ABCC11 GCAGAAAGACATA
CAGAGGG
CCTTCATGTACTGCA
GTATC
HA195 17 27893566 27893566 A – exonic ABHD15 CTTGTTTGCAAGC
CGTCGGC
GTGTCGGAAGCGGA
TGTATG
rs201971667
HA216 17 27893566 27893566 A – exonic ABHD15 CTTGTTTGCAAGC
CGTCGGC
GTGTCGGAAGCGGA
TGTATG
rs201971667
MC7 9 13375387
4
13375387
4
T – exonic ABL1 TGCACAGTTGAAT
TTCCTGG
GCCTGGTAAAATGT
CAGAGC
MC7 2 21105754
2
21105754
2
C – exonic ACADL TGGTTTTGAAGCA
CCTCATG
CTCCAACCTGGGTG
ACAGAG
HA175 8 39138654 . G T Intronic ADAM32 GATCTCCTGACCTT
GTGATC
GACTTTATCGATTGT
GGCTG
MC1 21 45712875 45712875 G C intronic AIRE CTTTCCCACTCAGT
GTGGAC
CTCTCCTCCTGTTTC
AGGTG
HA212 19 17397498 17397501 TGTT – exonic ANKLE1 GTTTGAATGTTCC
AGCTGCC
CTTCTGCTTCCCTTCT
TGTC
MC2 19 17397501 17397501 – TG exonic ANKLE1 CTTGTCTTCCTGGC
TGAAGG
GTGGAGTTGCCCAG
GTTCAAAC
MC3 16 28509193 28509193 G – exonic APOBR GTAGAGGCCGAG
GAATCTGC
CCGGAGTCCGACGA
AAAGAG
HA216 2 69046383 69046383 C T exonic ARHGAP2
5
CATAATCTCCAACT
CCAAGC
CACTGCATCACCTAA
AACTC
MC3 19 7504927 7504970 GGCATAAAA
ACGGCGCAG
CCCAGCCTG
GCGCCGCGC
CGGGTCCC
– exonic ARHGEF18 CATCATGTGCGAG
GTTTTGG
GCTCGTTATCCAAGA
AGACG
MC3 10 63852660 63852660 G – exonic ARID5B CTCGCTTGTGATG
CAAAGAG
CGTGCGAAGTGAAT
GATCTG
HA175 7 12326485
6
CTAAT C exonic ASB15 CTGTGTCAAGCGA
TGGTCAG
CAGCAGAGGAAGA
GGAGCTC
rs778460253
MC2 10 73921295 73921295 C T intronic ASCC1 CAGGATCATGGGG
TTGACAG
GGGCTCCATCAAAT
CACATG
HA214 19 57746411 57746411 C G exonic AURKC CTTGCCGCCAGAA
ATGATTG
GCTGTTCTGGACCA
CAGAAG
HA150 19 831815 GT G exonic AZU1 GTCCACTAGCAGT
TAACCAG
CATTCACTGTGTGAC
CTCTG
rs372854624
HA210 19 831815 GT G exonic AZU1 GTCCACTAGCAGT
TAACCAG
CATTCACTGTGTGAC
CTCTG
rs372854624
MC6 21 11098723 11098723 T C intronic BAGE CTTCTCCTAGATCT
CTAGCC
GCTTAGAGGACCAG
GAGAAG
HA175 15 52404514 . T TC exonic BCL2L10 GTCCTTTTTCTCCG
CCTACC
GACTTCACAGCGAA
CGTTCC
HA195 3 13316735
8
13316735
8
A T exonic BFSP2 GGAAGCCAGGTTA
TCAGAAG
GTGAACTTCTGGTCT
TGTGG
MC2 8 22479005 22479005 – C exonic BIN3 CCTTTTGGTTCAGT
CTCAGC
CAAGGATGAATGAG
GCTGAC
HA213 20 31647696 31647696 G T intronic BPIFB3 CTGGATCCTATGC
CATTGCC
GGTGCGAGATGATC
CTGAGC
rs11697151
HA173 5 18047725
3
AC A exonic BTNL9 CTGCAAATGCTGA
ACAGTGG
CACTGACCTGCTATC
TGGAC
rs367635312
HA216 10 33018277 33018277 A – exonic C10orf68 CGTCAGTGTGTAC
TTCAGAC
CGTTTGAGATTCGCT
TCTTG
HA210 10 33017896 33017899 AAAT – exonic C10orf68*
*
CGTCAGTGTGTAC
TTCAGAC
CGTTTGAGATTCGCT
TCTTG
HA210 10 33017896 33017899 AAAT – exonic C10orf68*
*
GTGTCAGATCTAG
CATTATG
CGTTTGAGATTCGCT
TCTTG
rs202220321
HA216 10 33018277 33018277 A – exonic C10orf68*
*
GTGTCAGATCTAG
CATTATG
CGTTTGAGATTCGCT
TCTTG
MC1 10 33017896 33017899 AAAT – exonic C10orf68*
*
GTGTCAGATCTAG
CATTATG
CGTTTGAGATTCGCT
TCTTG
rs202220321
MC1 10 33017896 33017899 AAAT – exonic C10orf68*
*
CGTCAGTGTGTAC
TTCAGAC
CGTTTGAGATTCGCT
TCTTG
rs202220321
HA214 17 71238446 71238446 C – exonic C17orf80 CGGTAAACAATGA
CAGTGAC
GAGGAGGCTAATAC
AACTGG
HA212 1 75065474 75065475 CT – exonic C1orf173 CAGTTCACTCTCA
GAGCATC
GTAGATGAGGAGAA
ACAAGG
HA210 5 41150035 41150035 A G intronic C6 AGAATCCATGCTG
TGCACTG
CAGCAGAGCACAGG
AATATC
HA195 1 57406638 57406638 G A exonic C8B CATCTCTCAGACA
AGTTCAG
GCAGCGTTGTGTAC
CTTAAC
HA211 12 12167832
7
CT C,CTTTT
,CTTT
exonic CAMKK2 GTTTTCTGTTCGGT
GAGCAG
GAGTTTTCTGCTCGC
CTTTC
rs761569371

215
MC10 12 12167832
7
12167832
7
– TT exonic CAMKK2 GTTTTCTGTTCGGT
GAGCAG
GAGTTTTCTGCTCGC
CTTTC
MC3 12 12167832
8
12167832
8
T – exonic CAMKK2 GTTTTCTGTTCGGT
GAGCAG
GAGTTTTCTGCTCGC
CTTTC
HA211 12 12167834
6
C T intronic CAMKK2 GTTTTCTGTTCGGT
GAGCAG
GAGTTTTCTGCTCGC
CTTTC
rs770833088
MC6 11 10487804
0
10487804
0
– T exonic CASP5* CATTATTCCCAATG
CCACAG
GTCAGAACATCGTG
TTTTGC
HA210 7 31697913 31697913 – T exonic CCDC129 GCATAGGCCATGT
AGATTTG
GTGTTATACTCTGGA
AACTG
HA223 7 31697913 31697913 – T exonic CCDC129 GCATAGGCCATGT
AGATTTG
GTGTTATACTCTGGA
AACTG
rs35589779
HA215 2 19752146
9
19752147
0
TG – exonic CCDC150 GCTATTTGGAAGC
TCCAGAC
GCTTCAGGTCCTTAG
AATGC
rs143904259
HA216 2 19754090
0
19754090
0
G T exonic CCDC150 CAGTTACTCCAAA
TGACACC
CTAGTTTCTTGAGG
GCAGAG
HA224 2 19752146
9
19752147
0
TG – exonic CCDC150 GCTATTTGGAAGC
TCCAGAC
GCTTCAGGTCCTTAG
AATGC
rs143904259
HA173 3 56655621 A AAGAG exonic CCDC66 CAAATGAGGTGGT
CTAGTAC
GGTGACAGAGCAGA
AGAACC
rs570037412
MC1 3 56655621 56655621 – AGAG exonic CCDC66 CAAATGAGGTGGT
CTAGTAC
GGTGACAGAGCAGA
AGAACC
HA215 12 549867 549867 C T exonic CCDC77 GTCCCTTTGACTTG
TAGTCC
GGAAGGCATTTACG
AAGGTG
HA216 7 75401263 75401263 C T exonic CCL26 GAACTGCCACACG
TACGTAG
CCCATCCTGTTGCAT
GACTG
rs41463245
HA223 7 80303461 80303464 TAAG – exonic CD36 CTTGATTACAGAC
TGGGACC
CAGTGGCTAGACAT
GTCTAG
rs56293647
HA173 4 76521525 C T Intronic CDKL2 CTGCTTGTTAGTTG
GTGCTG
AAGTCTAGAGCTGA
CTGGTG
rs56229013
HA214 4 76521525 76521525 C T intronic CDKL2 CTGCTTGTTAGTTG
GTGCTG
AAGTCTAGAGCTGA
CTGGTG
rs56229013
HA225 4 76521525 76521525 C T intronic CDKL2 CTGCTTGTTAGTTG
GTGCTG
AAGTCTAGAGCTGA
CTGGTG
rs56229013
MC1 12 51740415 51740415 – AG exonic CELA1 GATGATTAATTCA
GCCCTGG
CCTTTTCTATCTTGG
CCTCC
MC3 12 51740408 51740411 ATAA – exonic CELA1 GATGATTAATTCA
GCCCTGG
CCTTTTCTATCTTGG
CCTCC
MC3 12 51740416 51740416 – G exonic CELA1 GATGATTAATTCA
GCCCTGG
CCTTTTCTATCTTGG
CCTCC
MC10 9 80881357 80881357 G C intronic CEP78 GACCTACTCCTGG
CTATAGC
GGACTCCTAGGTTG
TTGCTG
HA150 16 23768875 23768875 C T exonic CHP2 GACAGACTTGGGA
AACGTTC
GCTGAGCTAGACTT
TAGTAC
rs61731149
HA195 16 23768875 23768875 C T exonic CHP2 GACAGACTTGGGA
AACGTTC
GCTGAGCTAGACTT
TAGTAC
rs61731149
HA216 12 12019005
4
12019005
4
– GA intronic CIT GAGAAGGTGGTTC
CAAGACC
CTTCAGCTTCTGCTG
TGGTC
rs141931278
HA212 1 86894223 86894227 TAACT – exonic CLCA2 CATACACCCTACA
ATACAGAG
CAGGTTTTGTGAGT
GAGTCC
HA212 1 86894223 86894227 TAACT – exonic CLCA2** CCATACACCCTACA
ATACAG
CTGCTGCCACAGTTT
TCTTC
MC2 7 14162994
9
14162994
9
T – exonic CLEC5A CCTGCAAGACTCT
CACTCTG
GCAAGGACCGCTAC
TGGTAG
HA223 22 19171074 19171074 – T exonic CLTCL1 CATCTCCGTTTCAC
CAGTGG
GTCATAGCAGGTGA
AGAGAC
MC4 22 19189003 19189003 – C exonic CLTCL1 CTTACCACCCTAGC
AAACAG
CACTGCTGCCTGATA
CTCAC
HA175 1 22454474
6 G A intronic CNIH4 CTCTCTCCTCGATT
GTTGCG
GAAAAACAGCGACG
CTTCTC
rs56105022
MC2 3 13018766
2
13018766
2
G T exonic COL6A5 CCTCATGCTGTGT
ATTTGCC
CAACCCTGTCTCCTA
AGGTG
rs115375867
HA223 4 83970472 83970472 – A intronic COPS4 GCACACATCTTCCT
AACTTG
GCAAATGTCAGTTG
GAGTTG
HA175 3 9976205 . G A intronic CRELD1 CTTGTAATAACGC
AGATCCC
GAGTTCCCCACTCTA
AATCG
HA225 4 1388594 1388622 CACGTGCCCA
TGTGGAGTG
CCCGCCTGCT
– exonic CRIPAK CTGCTCACACATG
TCGATGC
GCAGGCGAACACTC
CACATG
MC4 4 1388350 1388350 – TGCCC
ATGTG
GAGTG
CCCGC
CTGCTC
ACACA
exonic CRIPAK GGCATCTCGTTCCT
CAGATC
CCACATGGGCACAT
GAGCAG
HA214 20 20033322 20033322 G A exonic CRNKL1 GGGAATGGTAGTT
TCCTCGC
CTTTGACCTCTCGCT
TGAGC
rs74404969
MC7 22 37333973 37333973 C – exonic CSF2RB AACAGGCTTCCAG
CTTTGAC
GCTCCACATAGCCCT
CAAAC
MC4 11 65647351 65647358 GCCTCCTG – exonic CTSW CAGGGACTGAAA
GCCTGAAG
CATAGGTAAGGGTT
TGGGAG
MC4 11 65647351 65647358 GCCTCCTG – exonic CTSW** GAATTGCTTGAAC GTTAGCCTTTTCTGT

216
CCGGGAG CTTCCC
MC4 11 65647351 65647358 GCCTCCTG – exonic CTSW** CAGGGACTGAAAG
CCTGAAG
CATAGGTAAGGGTT
TGGGAG
HA213 6 16869481
7
16869481
7
G C exonic DACT2 CTCTGTGTCCTCAC
ACCTAG
CGTCTGCTACTGCTC
TTTGC
HA213 1 32674742 32674742 – G exonic DCDC2B GATAAATGCTCCT
GCCACAG
GGCCATGACAAGGT
GTGTAG
rs200086869
HA173 20 168625 G GT exonic DEFB128 CTCTTCTGCTCTTC
CTTACG
GATGTAATCCTGCA
GCACAC
rs11396059
HA213 20 239946 239946 A C exonic DEFB132 GACTTCTCTGTCTT
GTCCTC
CAGCAATGTAGGAG
GAATTG
rs147196160
HA213 2 19675980
8
19675980
8
– T exonic DNAH7 GCGTATGTGAACT
ATTCCTC
GTCGAAAGCAAGTT
TGTGGC
MC3 6 38818191 38818191 G A intronic DNAH8 CAGCCTGAGACTA
ATAGAGG
CAAAGGTGTCTTCCT
CACAG
MC2 11 6550231 6550231 – A exonic DNHD1 CCATTATAGCCGC
ATGCCTC
GAAGAGAAGCAGTA
CTCACC
HA215 11 6560532 6560532 C T exonic DNHD1 GTGCTCTAGACCT
TGAGTTC
GGAGTCTGGAATCA
CACAAG
HA215 11 6588977 6588977 A – exonic DNHD1 GTCACTGTCATCC
ACAGTGC
GTGGCCAAGAAACT
AGGTTC
HA214 2 25467083 25467083 G A exonic DNMT3A CCAGGTGCTTTTG
CGTGGAG
TCACAAATTCCTGGT
CGTGG
HA175 1 97915614 C T intronic DPYD CATCAGTGAGAAA
ACGGCTG
GCATCAGCAAAGCA
ACTGGC
rs3918290
HA224 1 97915614 C T intronic DPYD CATCAGTGAGAAA
ACGGCTG
GCATCAGCAAAGCA
ACTGGC
rs3918290
HA210 18 29055783 29055783 A T exonic DSG3 GATAATGAAGGCG
CAGATGC
CAAAGCAGAAGCTC
CTTGAC
HA195 17 45438788 45438788 C T exonic EFCAB13 CCTTAGTAGGCTA
TTGACAC
GGAGAAGCAAAGG
ACAGATC
HA150 6 32134398 32134398 G T intronic EGFL8 GCTCCAAGCAGAC
ACTGGTG
GAAGACCCAGCCTC
ACCTTC
HA175 2 63175824 . GACACAGA G exonic EHBP1 GGTTGGAGAGTCA
GAAAGTG
CTGTGCTTGGGTTG
AATCTG
HA175 2 63175824 . GACACAGA G exonic EHBP1** CTATGCAGAGCTT
AGTGATC
GTGGAGACATATCC
TTCTTC
HA150 1 32696768 32696768 C T exonic EIF3I CAACAGTGTTGCC
TTCCATC
CTGGTCTTAAACTCC
TGACC
HA175 16 1823389 CG C exonic EME2 GACCTCCAACCTG
GGAGATC
CTGGCGGAGAAAGG
CCTTTC
rs377074694
MC3 11 726303 726303 G A intronic EPS8L2* AGGCCGGTCAGAA
GTACTGG
GCATGGTGAGCTGG
CTGTAC
MC3 11 726303 726303 G A intronic EPS8L2** AGGCCGGTCAGAA
GTACTGG
GCCGCACACTTTCTT
CAGCT
MC3 11 726303 726303 G A intronic EPS8L2** GGAACAAAGACG
GTGAGAGG
CCTCGCCGCACACTT
TCTTC
MC3 11 726303 726303 G A intronic EPS8L2** GCTTCCCGGGGAA
CAAAGAC
CACACTTTCTTCAGC
TCCTC
HA195 9 14024269
2
14024269
2
T C intronic EXD3 AAAACAGAGACA
GAGTGCTGG
CTTCACCATTGCCCA
GCATG
HA211 1 40981245 C CG exonic EXO5 GTCTCTAACACTGT
CAGACC
CAACAGGAGCAGGA
AGGATC
rs150018949
MC4 9 96259883 96259883 – A intronic FAM120A CACCTTGCGACGT
AGTGATC
GAACATGACCAGGC
TACCTC
HA210 X 13398814
5
13398814
5
A – exonic FAM122C CATGTGTAGACAA
AGCAGAG
CACAGGAGAGTTTG
TGACAG
MC10 X 13398814
5
13398814
5
A – exonic FAM122C CATGTGTAGACAA
AGCAGAG
CACAGGAGAGTTTG
TGACAG
HA225 7 286468 286468 – GACAG
GTGAG
CCCTTC
CTTCCT
CCCTCC
ATCCG
C
exonic FAM20C GGCTTTCTCAGTG
ACAAACC
GTGACAGAGGGATG
ATTAGG
HA150 8 12419535
2
12419535
2
G T exonic FAM83A GCTGACTTTAGTG
ACAACGAG
GACGGTCTGGAAGT
ACACAG
rs148011353
HA214 19 49104533 49104533 G A exonic FAM83E CTCCACAGCTCAA
GAAATCC
CTCTGGGCTCTTGAA
GTTTG
MC7 2 58386928 58386928 – TAAT exonic FANCL TCGCATCATCATAC
CTGTCC
TCCTAGGTGATCTG
AAACTTC
HA173 4 18751698
1
. C T Intronic FAT1 GAGTAAATCTCAG
GCCATCG
CCATTGTCATCGCAC
GATTC
MC4 4 18752435
0
18752435
7
GCCCTGTG – exonic FAT1 CTTCCGTGACTGA
CATTGAG
CCATCAAAGGCTTCA
AAGGC
HA225 1 16703297
6
16703297
6
T C intronic GPA33 GCCATATTGGGGT
GAATTGG
GCATGTGTTGCACTT
TGACG
HA173 7 23313823 G T exonic GPNMB GAATGTGGTCAGA
AGCAAAG
GTTAATAGCCACTCC
AGCAC
rs11537976
MC10 17 72366664 72366664 C – exonic GPR142 GGTGGTCTTGGCA
AGAATTC
GACAATGGCAAGGA
AAGACC

217
MC6 5 17602613
6
17602614
6
CCTCCTTCCT
C
– exonic GPRIN1 CACTTCCATAGGA
AAGGAGG
CCGACAATACAAGA
TCTACC
MC7 5 17602612
2
17602613
4
CAAAGACCC
AGGA
– exonic GPRIN1 CACTTCCATAGGA
AAGGAGG
CCGACAATACAAGA
TCTACC
HA223 1 24649608 24649608 G C intronic GRHL3 GACATTGTGTCGA
GTGCTTG
GATGATGATGATGG
TCCACG
HA224 2 14470962
2
14470962
2
– TAGAA
TACAG
ATATTC
AGCTG
CAGGA
AAA
exonic GTDC1 GTTGTACGGGTAC
ATAAGGC
CCTAGGTTAATACAA
CTGGC
MC7 5 15648244
2
15648244
2
– CT exonic HAVCR1** GTTTTGCCATGTTG
GCTAGG
CTATGGTCAAAGAG
ACATCC
MC7 5 15648244
2
15648244
2
– CT exonic HAVCR1 GTTCTTGGATTAC
AGGCGTG
GCTTATAGCGTGTG
TCCTTC
HA212 12 66704274 66704274 G – exonic HELB GTGAAGTTCAGCT
GGATCAG
CAGTGTGTAGGCAT
GAAGAC
rs199672632
MC1 15 28518115 28518115 C – exonic HERC2 GTGATTGTAAGCA
TGCTGTC
CAGTGAAACACACA
CAATGC
MC1 3 10807687
5
10807687
5
G A exonic HHLA2 CTGTCCTGGCTTAC
TATCTG
CTACATGCACTGTGT
GGATG
rs41267017
MC2 22 30517624 30517624 – A exonic HORMAD2 CCATCGCTCCCCTA
ATTTAC
GCACTTAAGGAGGA
ATTTGC
MC1 1 15219572
9
15219572
9
T – exonic HRNR CTACATGGCTTGA
ACAAGTC
GTATCATACTCCCCA
TGCTG
rs34061715
HA223 19 16268208 16268208 A – intronic HSH2D CTCCAATTTCTGG
GACAGAC
GTGATCTTGGCTGC
CTTTTC
MC1 16 70896016 70896016 A – exonic HYDIN CTGCCTCTCACTGC
AAATGC
GGGGATAAGAGCCA
CAGAGC
rs77276171
HA175 1 79101171 T A exonic IFI44L GTCTTGAATGCTG
GGTGATG
GCAAATGAGTAGAA
TCCTGC
rs115901054
HA212 14 36004018 36004018 – CCTTCA
GAGTC
TGAAG
CGG
exonic INSM2** GCAGTTTCTGCTG
CCGCTTC
CTTTGGCTTCTTGAT
TCCCG
HA211 9 95411816 . G GT exonic IPPK CTGTGTGTGTCCC
ACAATCC
CACGTGACTCTTGG
ACTTAC
HA195 3 10242051 10242051 A G intronic IRAK2 GCAACACCATGCA
TTTGTGG
CCTTTCTTACAGAAG
CTGCC
rs140903779
HA210 16 31418867 31418867 C T exonic ITGAD CTCTCCAGATGAG
AGGACTG
GATAGCGTAGCGGA
TGATGC
rs147321998
HA215 8 13315023
3
13315023
3
T – exonic KCNQ3 GAAGTTCTTCCAG
CAAGCTC
CTAGACATCCACAA
GGCTTC
HA212 3 10827860
4
10827860
5
CT – exonic KIAA1524 GGAAACAAAAGCT
CTAGCCC
GAGGCATGTCAAAT
GCTAAGG
HA175 20 16410518 . TATAAG T exonic KIF16B CCCATTCTGACAAT
CTGAAG
GTTCCTTACCTCCCT
CTTAC
MC10 5 15439561
3
15439561
3
C T exonic KIF4B CAATCCAGTGTGC
TCAGACG
GAGTTGAACCACAT
CCTGAG
HA214 6 39387723 39387723 C T intronic KIF6 CAGCACAGAAACC
TTACAGC
CTCTCAAAGCAGCTT
CCTTG
rs371798783
HA214 19 55331298 55331298 G – exonic KIR3DL1 GAAAAGACACGG
AGATGCAG
CAGAACCGTAGCAT
CTGTAG
MC3 19 55331298 55331298 G – exonic KIR3DL1** CTCTTTCTAGGAA
ACCACAG
CAATGTCTAGACACT
CTCAC
MC3 19 55331298 55331298 G – exonic KIR3DL1 GAAAAGACACGG
AGATGCAG
CAGAACCGTAGCAT
CTGTAG
MC6 19 55341708 55341708 C – exonic KIR3DL1** CTCACTCAGCATTT
CCCTCC
GAGAGGCACCAGAT
TTGTGG
MC2 7 15194507
1
15194507
1
– T exonic KMT2C CAGACTTGCCTTC
GCATGAC
CACCCTACCTGTTTG
GACCG
rs150073007
HA216 12 52681822 52681822 A T exonic KRT81 GATCCTCATTCTCC
AGTCGC
CTGACACGTCTAGC
AGGCAG
rs138597671
HA150 12 52711747 52711747 C A exonic KRT83 GGCACTTCATTTCT
CCAGTG
GCTTCACTCACCTTC
TTTAG
rs146753414
MC1 21 45959556 45959556 – TG exonic KRTAP10–1**
CTGGCAGCATGAA
GTGGAAG
GGATTCCTCTTCATG
CTGCC
MC6 11 1651595 1651598 GTCC – exonic KRTAP5–5 CCAAGAGAGGCTG
TGTCTCC
GTTCAGGAGAAGTA
GTAGGC
HA225 11 1651600 1651625 GCTGCTGTAA
GCCTTACTGC
TGCCAG
– exonic KRTAP5–5*
CCAAGAGAGGCTG
TGTCTCC
GTTCAGGAGAAGTA
GTAGGC
HA225 11 1651600 1651625 GCTGCTGTA
AGCCTTACTG
CTGCCAG
– exonic KRTAP5–5**
TGTTCCTGCTCCAG
CTGTGG
CTCAGATCTTACACT
GGCAG
MC6 11 1651595 1651598 GTCC – exonic KRTAP5–5**
TGTTCCTGCTCCAG
CTGTGG
CTCAGATCTTACACT
GGCAG
HA214 1 62676248 62676251 AACT – exonic L1TD1 GTCACTAGAGATG
AGTCATG
CAAGACACCTGAAT
GGGAAC
rs202029696
HA211 11 71807767 A C Intronic LAMTOR1 GACAAGGTTTCGC
CATGTTG
GTGATGATGGGAAC
ACTGTC

218
HA211 11 71807767 A C Intronic LAMTOR1
**
CACTGGAGACGTG
GGAAAAC
GCTGAACAGACCTG
AATCTG
HA225 8 98788165 98788165 – GGCGG
GCTCC
AGGCG
A
exonic LAPTM4B CTGATGGATTTAC
TCACCGG
CACCCGGAGAATTA
AGTTTC
HA225 8 98788165 98788165 – GGCGG
GCTCCA
GGCGA
exonic LAPTM4B*
*
GCACGCTGATGGA
TTTACTC
CAACTTTAGGCGGA
TGAGCG
MC7 1 20374359
4
20374359
4
C – exonic LAX1 GACAGGGTTGGAT
CTCAGTG
GTCCTCACTCTGTGT
GAATG
MC7 1 20374359
4
20374359
4
C – exonic LAX1** TCATAGTCTCTGCA
GCACTG
CACTGGAGTCCTCAT
TTGAC
MC7 7 2552881 2552881 – GATG exonic LFNG GCATGGAGCAAAT
GCTCAGG
CAAAGGATATTCCA
GGCTGC
rs34637446
HA213 19 55107223 G T exonic LILRA1 GAAGCCATCACTC
TCAGTGC
GTTGTATGCACCGG
AGCATC
rs150508449
HA210 17 61775990 61775990 G C exonic LIMD2 CGTTGTTTGGCTTC
TGCAGC
GAAGGTTACAGAGG
CCTCAG
MC7 4 14137265
6
14137265
6
G A exonic LOC15258
6
GCACAACTGGGAA
CAGTAAG
CCAACTCCTTTGCTC
TATTC
rs62346874
MC3 15 31521506 31521507 GG – exonic LOC28371
0
CTATGAAGTGGCC
GGCAGTC
GCTCCTTGGGTCAG
GGTCTA
rs3835087
MC6 15 31521507 31521507 G – exonic LOC28371
0
CTATGAAGTGGCC
GGCAGTC
GCTCCTTGGGTCAG
GGTCTA
rs3835087
MC7 15 31521506 31521506 G – exonic LOC28371
0
CTATGAAGTGGCC
GGCAGTC
GCTCCTTGGGTCAG
GGTCTA
rs3835087
MC3 15 31521506 31521507 GG – exonic LOC28371
0**
TCTGAGGCCATTG
AGACCATG
GACCTGCAGACATTT
CTGCAG
rs3835087
MC3 19 19735379 19735379 C T intronic LPAR2 GGCTGTGGATTTG
TTGCTTG
GAATCAGGGAAACA
AGCAGC
MC3 19 19735379 19735379 C T intronic LPAR2** GGAAGTACTTTTCT
ACAGCC
GCCACTGTGTACCA
ATTAGC
MC7 3 18847802
4
18847807
4
CATTCTATGC
TGTGGAAAA
GAAAGCATA
CTGCGAGCC
CTGCTACATT
GTAA
– exonic LPP GAAAACGTAGTTG
GGGAAGG
GCTTATGAATGGGG
GATGTG
MC6 14 60448779 60448779 G A ncRNA
intronic
LRRC9 CAGCAACTGATTT
TGCAATG
CGCTTTAGGTAGCA
TTGTAC
HA214 8 86057746 86057746 A G exonic LRRCC1 CATGTCGATTTAG
GTCCATC
GTGGAGATGGCTAC
ATATAC
rs200010501
HA173 21 30318610 CTAAAG C Intronic LTN1 GTTTGGAGACAGG
GTCTCTG
GGGGATGAGCAGTA
TTTCAG
rs373358802
MC10 3 47917305 47917305 – T exonic MAP4 CTTGTCTGTTTGAT
GTTGCC
GTCTATCTGACACTC
AGAGG
MC10 3 47917305 47917305 – T exonic MAP4** GTTGCATCTATCCT
CATTGC
CTTACCTTTGGCTTC
ACGTC
MC10 3 47917305 47917305 – T exonic MAP4** CAGTTCACTCTCAG
AGCATC
GTAGATGAGGAGAA
ACAAGG
HA215 X 20069020 20069020 G A exonic MAP7D2 CAAAGCCAGCAAA
TAGGAAGC
CATGTTCTGCCACCC
AAAAG
HA214 4 87023187 87023187 – AGA intronic MAPK10 GAGAGGAAGTGA
TTCCCTAG
GAATGGAGGTGCTT
AATGCC
MC4 18 32558480 32558483 GAAT – exonic MAPRE2 CTACCAATCACTC
GGTGAGC
GTTGCGATTGTGGT
CAGACG
HA210 3 19251707
7
19251707
7
– A exonic MB21D2 CCCAAAAGTGGTT
CTCCATG
GTAATCAGCCTGTG
ACACTC
HA175 16 21611081 . C A exonic METTL9 AGTGCTCCGGATG
GAAACTG
CGCTAGTCATGTTCA
CGTAC
HA175 16 21611081 . C A exonic METTL9** CCTCCGCCATTTAC
TAGAGG
GTACCTGGTGGTTCT
CCTTC
HA215 2 22819449
8
22819449
8
– G exonic MFF CCTAAGCCATGTT
CAAATCC
AAAGAGCATGGTTA
GCCTAC
HA214 15 42000407 42000407 G A intronic MGA CCATAATATTGGC
CTGCTAG
CAAGAGCAAAACTC
AGTCTC
HA175 5 17922285
8
G A Intronic MGAT4B GGGTGAACTGCAG
CGAGTAC
GCGAGGAGGCCCGC
TTCTTC
HA224 6 31380161 31380161 – CT exonic,
intronic
MICA GAACACAGCGGG
AATCACAG
GAAGCCTTGTCACC
AACATG
MC3 6 31380158 31380161 GCTG – exonic MICA GAACACAGCGGG
AATCACAG
GAAGCCTTGTCACC
AACATG
rs138201170
HA173 11 12270793 GGT G Intronic MICAL2 CTGCAATGTCCTA
ACCTATG
CCAGTACAAGCACA
TGTCTG
rs146412715
HA214 11 12270794 12270795 GT – intronic MICAL2 CTGCAATGTCCTA
ACCTATG
CCAGTACAAGCACA
TGTCTG
rs146412715
MC3 11 12270794 12270795 GT – intronic MICAL2 CTGCAATGTCCTA
ACCTATG
CCAGTACAAGCACA
TGTCTG
rs146412715
HA212 6 31473525 31473525 C – exonic MICB CACCCTCACAGTTT
TCCTTG
CTTGTAATGAGTCA
GGGTCC
rs45459705
HA150 10 21845667 21845667 C A exonic MLLT10 TTGCAGTTTTCTAG GACCACATCAGAAA

219
GGCAGG CACAAG
HA224 11 10264948
2
10264948
2
T C intronic MMP10 CAGCAGACACCAA
CATTCAG
CACCTGATGCATCTT
CTGTC
rs17860955
MC1 10 88703604 88703604 C – exonic MMRN2 CAATTTGGTGTCC
ACATCGG
CTACAAGTGCATTTC
AGCCC
HA173 10 99229890 . GTC G exonic MMS19 CTTGATGTGACTG
ACACACC
GTCAGCCTTTCCTCA
GTTAC
MC7 18 48331612 48331613 AG – exonic MRO* CAGTTCCTGTGCTA
TTACTG
GCTGAGATTACAGG
CATGAG
HA216 18 48331612 48331613 AG – exonic MRO* CAGTTCCTGTGCTA
TTACTG
GCTGAGATTACAGG
CATGAG
HA213 5 41017978 41017979 GA – exonic MROH2B GCTGAACTATAGA
GGGAAGG
CATCCTGGGATATG
ACCAAG
MC3 5 41064591 41064598 TTCATCCT – exonic MROH2B* CTGCAATGTCCTA
ACCTATG
GATAACTCCCTGCTG
AGGAC
HA213 5 41017978 41017979 GA – exonic MROH2B*
*
CATCACAATAGGA
TGCCTCC
GAGGAGGACAGAA
GAAGATG
HA175 8 16035502 C T Intronic MSR1 GATGACGAGTTTG
TGGGTGC
GCTGTCATTGAGCG
AGCATC
rs33912200
MC10 1 17083816 17083816 G A exonic MST1L* GCAGGCTAGTCAT
TGCTGTG
CCCAGTCTCATGACC
TTGTG
rs11260920
MC2 1 17087542 17087546 GTGCT – exonic MST1L* GCTAGACTGGCCC
TTGAAAG
GGCTGCTCACATTGT
AGTGG
rs113982165
HA150 17 72768101 72768101 G A exonic NAT9 CGGTAAGAAAGTG
TGAGCAG
CTCTGTAAGGCTTCT
CTTCC
HA213 2 15235793
7
15235793
7
G A exonic NEB GTGGCTTCAAGTC
CAGTATC
GATGGGTCCAGGTT
GATTTG
MC10 15 75641682 75641682 T C intronic NEIL1* CAGTTTGTGAATG
AGGCCTG
CACTAAGAGAGTCA
GGTGTG
rs5745908
HA213 3 52780827 52780827 G A exonic NEK4 GTACCAGGTTGCT
GCTATAC
CCTTACTCTGCTTCG
AACTC
rs201029132
HA215 16 3599227 3599227 – G intronic NLRC3 GCCCAGACTATGC
AGAACTC
CATGGCATGAACAG
CCTGTG
HA173 19 56423924 TGAAA T exonic NLRP13 CAGTGACCAAAAT
CCTACAC
GAGTGATTGACTGG
AGATCG
rs147101216
HA195 16 450140 450140 – AG exonic NME4 CATGACAGCTCAC
ACTGGTG
GTAAGTGGTTTGGG
ACAGGC
HA216 16 450140 450140 – AG exonic NME4 CATGACAGCTCAC
ACTGGTG
GTAAGTGGTTTGGG
ACAGGC
HA225 16 450140 450140 – AG exonic NME4 CATGACAGCTCAC
ACTGGTG
GTAAGTGGTTTGGG
ACAGGC
rs35963490
HA150 9 95064094 95064094 G A exonic NOL8 GAGAAAACTGAG
GCCTAGTG
CCTGGATTTCCTCAG
GTTTC
MC7 1 12061200
3
12061200
4
GG – exonic NOTCH2 GGAGTTTCTGAGA
CTTGCTG
CACACCCGAGAAAG
TTTCAG
MC10 9 14032555
4
14032555
4
T G intronic NOXA1 CATCCCTGTGTAA
GACCTGG
CTTGGGGAGTCCAT
GATTAG
rs148308245
MC7 11 10804058
0
10804058
0
C T intronic NPAT GTAGGGATGATCC
CAGTATC
CTTAGTCCCTGAGCC
TTCTG
MC3 7 15104243
3
15104243
3
G A intronic NUB1 GACAGAGGAAGG
GAGCTTTG
GGTCATGCCTGACA
ATTCAG
MC1 15 41663884 41663884 – A intronic NUSAP1* GAAAGTCTGCACA
TGTGACC
CTGGGTGACAAAAG
CGAAAC
HA212 12 11338465
9
11338465
9
G T exonic OAS3 CACTTGTTCTTGGA
ACAGGC
GCTATTAGGAAGTA
CCTGGG
HA223 12 11340367
5
11340367
5
C T exonic OAS3 CTAACTCACAGTC
CAGAACC
GGGCCCTCTTCTTTA
GATAC
rs61942233
HA213 13 25671814 25671814 C – exonic PABPC3 GTGCCAGACCTCA
TCCATTC
GCTGTGCATTACGA
TGTTGC
HA215 5 14079520
8
14079520
8
– A exonic PCDHGA1
0
GCATTCAGAGGAA
CAGCTAG
GGAAAAGCAAGCTA
CTCTGC
MC3 5 14081139
5
14081139
5
C – exonic PCDHGA1
2
CTACCAGATGGAA
GTGCAAG
GGTCACTGTGATGT
TGTAGC
MC7 9 5522576 5522576 G – exonic PDCD1LG2 CCTATAACTTCTCC
TCCCAG
AGCCCAGAAATCAT
ACGTCC
HA223 1 14492372
9
14492372
9
T – exonic PDE4DIP CCAAAGCACTGGC
ATTACAG
CCATGACTGAAGAG
TTGCTG
HA175 12 18715827 G A Intronic PIK3C2G CACACACTTGCAC
AAATGTC
CCTCTTAATGACACT
TCTGC
rs187352063
HA195 19 30102847 30102847 G T intronic POP4 CATCCCAAGCTCA
TGTTGTC
CTTGGCCTGAATCAT
CTGTG
HA211 8 12842818
0
G A exonic POU5F1B CATACGGTCACAG
AGCTTTC
CACATCGGCCTGTG
TATATC
rs531267041
HA195 11 61254687 61254687 C T exonic PPP1R32 GACTTGACAATTC
CCCTGTC
CTTATCCCAGTCTCA
GTCTG
rs144191864
HA150 7 11351916
1
11351916
2
CT – exonic PPP1R3A GAGAAGACAGTTC
ACAGCAC
GCAATCACAGCAGA
TGTGTC
HA210 9 15465556 15465557 TC – exonic PSIP1 CAACCATGTCTGG
AAAAGCAG
GTCCATGACACTTTG
CTGAG
MC6 6 31106500 31106500 – C exonic PSORS1C1
*
GTTCACTTGACCCA
CTTTAAACTG
CCAGAAATGGCTTTC
TGGAC
rs138474986

220
HA214 6 31106501 31106501 – C exonic PSORS1C1
*
GATGGATCTGAAC
CGTTCAC
CCAGAAATGGCTTTC
TGGAC
HA175 6 31106507 . C CG exonic PSORS1C1
*
GATGGATCTGAAC
CGTTCAC
CCAGAAATGGCTTTC
TGGAC
MC6 6 31106500 31106500 – C exonic PSORS1C1
**
GATGGATCTGAAC
CGTTCAC
CCAGAAATGGCTTTC
TGGAC
rs138474986
HA175 6 31106500 TC T exonic PSORS1C1
*
GATGGATCTGAAC
CGTTCAC
CCAGAAATGGCTTTC
TGGAC
rs373592714
HA216 1 71418662 71418662 G – exonic PTGER3 GCAGTTTGCAGAA
CTCTCAG
GACCAACCAGTTTGT
TCAGC
HA175 4 37962608 CAT C exonic PTTG2 CATGATCCTTGAT
GAGGAGG
GACAGCTGAGACAG
ATGCAC
rs200376306
HA210 4 37962609 37962610 AT – exonic PTTG2 CATGATCCTTGAT
GAGGAGG
GACAGCTGAGACAG
ATGCAC
rs200376306
HA175 5 34911900 G A exonic RAD1 GCAGAAATCAAAG
TCCAGGG
GAGGAGTGTATGAC
AACCTG
rs2308956
MC3
17 56774211 56774214 AAGG - exonic RAD51C
TGATAGAGTGGTA
GACCTTG
GTCCAGTAATTAGG
CTTCAC
MC7 19 15568282 15568295 GCGCCCGCA
GCGCT
– exonic RASAL3* ACTCCCATCTGCA
GGACAAC
CGAAGCGCGTTATC
GGTCTA
MC7 19 15568282 15568295 GCGCCCGCA
GCGCT
– exonic RASAL3* CTCAGGCCCAGTC
CTTCAAG
GAGGCTCCACGCTT
CACTTG
MC7 19 15568282 15568295 GCGCCCGCA
GCGCT
– exonic RASAL3** GTGCCAACAAACC
AAAACGC
CATTACAGGTGCAA
CTCAGG
MC3 16 24564880 24564881 TA – intronic RBBP6 GTAGGCTGAGCTA
CATTTTC
CAGCAACTACTCTTT
ACAGG
HA225 X 11929321
6
11929321
6
– G exonic RHOXF2 GAGAAGAAAAAG
ATGGCGGC
CGTTGGAAAATGCG
CTCCAG
HA213 7 10519093
4
10519093
4
G A intronic RINT1 CTGTCATTTGGTG
GATGAAG
CAAACTACTGCACTT
TAGCC
HA213 7 10519093
4
10519093
4
G A intronic RINT1** GGAGCTACACAGT
GTTCATG
CAACAGAGCAAGAG
TCTGTC
MC6 19 50140152 50140167 CCCGAACTCT
TCCTGG
– exonic RRAS GAATCTGCGTGAA
GAGCTTG
GCACTGCAGTAACT
ATCCTC
MC10 3 13390191
6
13390191
6
C T intronic RYK CAACACTGAAATG
CTGGTGG
GCATTTCTTAGGACT
GAGGC
MC10 3 13390191
6
13390191
6
C T intronic RYK** CAGTCTGTTATTGC
ATTTTC
CAAGTGTTGCCATG
CTCAAC
HA211 16 51175657 CTG C exonic SALL1 CGTTGCTGTTGATT
ACGGAG
CAGATCTTCTGCTCC
ACAAG
rs768581623
HA211 16 51175660 CTGCTGCT C exonic SALL1 CGTTGCTGTTGATT
ACGGAG
CAGATCTTCTGCTCC
ACAAG
MC7 17 26708303 26708304 GT – exonic SARM1 CACTGTCCCCTTCC
ACTTTC
CCTCCTTGGAGAAG
GCGAGC
HA225 1 87333787 87333787 T – intronic SEP15 CTCCACTACAATCA
CCTTAC
CTCTCCCTCTCTCTG
ATTTG
MC7 19 50455629 50455629 – C exonic SIGLEC11 GTGAGCCTTGCTA
AGCAGAG
CCTGCTCTGATCCTC
TTGCC
MC3 13 21729952 21729952 – A intronic SKA3* CATCTGTGTAACT
GGCTAGG
CCACTTTTTTCCAAC
TGCTG
rs11446085
MC3 13 21729952 21729952 – A intronic SKA3* TTTACCTGTTGTCC
AGCCTG
CCATGTTGGTCAGG
ATGGTC
rs11446085
MC3 13 21729952 21729952 – A intronic SKA3** CAAACTCCTGACCT
CAAGTG
GGTTCCTTAAACATG
GACAG
rs11446085
MC7 X 48769143 48769144 AC – exonic SLC35A2 GAAAAACCACTTC
CGCGTTC
CTTCCCTTATGTGCG
TCAAC
MC7 X 48769143 48769144 AC – exonic SLC35A2 CTGCCCTGACTATT
CTTACAC
GCTGGAAAAAAGAG
ATCTCC
HA195 12 21008080 21008080 – AATTG exonic SLCO1B3 CATCATGGCCATC
TGAGAAC
CCCAGCCCATTTATA
GCAAC
HA173 12 21036518 TTATC T exonic SLCO1B3 GGGAGCTATTTTG
CCTTCAC
CACACTGATTGACA
GTTGCC
rs775300015
HA175 14 62235390 GAA G exonic SNAPC1* CAGATGTACCCTT
ACAGCTG
CATCTTCAGTCCAGG
TCCAG
rs758866144
HA175 14 62235390 GAA G Exonic SNAPC1* GGCATGTGAGAG
GATACTTC
CTGAGATTACAGGT
GTGAGC
rs758866144
HA210 7 16502202 16502202 T – exonic SOSTDC1 CAGTAGTCACTGC
CTGCAAG
GCTGGGTTTGATCA
AAGCAG
MC2 17 74382047 74382048 TT – exonic SPHK1* GTTATGGATCCAG
GTTTGTG
GAAGGAGATTTCAG
CCTCAG
HA173 19 4328755 G C exonic STAP2 CACCTCAGCTCTG
ACTCCTC
CAAGAGCGAAACCC
TGTCTC
rs79657645
HA215 11 4108092 4108092 G A intronic STIM1 AGCCTTTCATCTG
GACAGTC
GGTCATGAGGGAAG
AAAGTC
rs118128831
MC7 6 15913491
1
15913491
1
G – intronic SYTL3 CGCTGAATGAAGA
AGATGCC
CTCTTCCTATGAGGA
ACCAG
rs369429053
MC1 7 38299702 38299702 C – exonic TARP CACATGAGAACTG
AAATGGC
TAGATACACTACTGC
TGCAG
HA211 7 45148836 TG T exonic TBRG4 GTAGATGCTCGTT
CCTTCTC
CAGGCTGTAATGTT
CCTGAG
rs36007488
HA195 4 10615738
4
10615738
4
– C exonic TET2 GCAACATAAGCCT
CATAAACAG
GACATTATGAGTCTC
GAACTCG
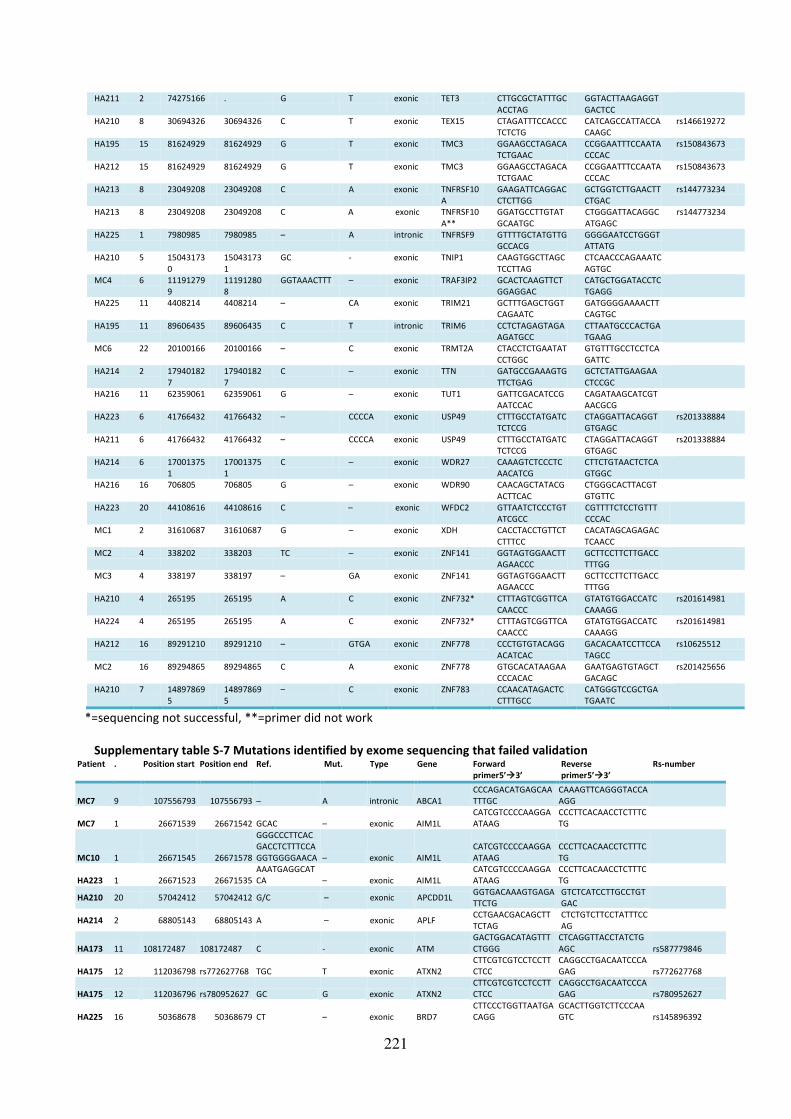
221
HA211 2 74275166 . G T exonic TET3 CTTGCGCTATTTGC
ACCTAG
GGTACTTAAGAGGT
GACTCC
HA210 8 30694326 30694326 C T exonic TEX15 CTAGATTTCCACCC
TCTCTG
CATCAGCCATTACCA
CAAGC
rs146619272
HA195 15 81624929 81624929 G T exonic TMC3 GGAAGCCTAGACA
TCTGAAC
CCGGAATTTCCAATA
CCCAC
rs150843673
HA212 15 81624929 81624929 G T exonic TMC3 GGAAGCCTAGACA
TCTGAAC
CCGGAATTTCCAATA
CCCAC
rs150843673
HA213 8 23049208 23049208 C A exonic TNFRSF10
A
GAAGATTCAGGAC
CTCTTGG
GCTGGTCTTGAACTT
CTGAC
rs144773234
HA213 8 23049208 23049208 C A exonic TNFRSF10
A**
GGATGCCTTGTAT
GCAATGC
CTGGGATTACAGGC
ATGAGC
rs144773234
HA225 1 7980985 7980985 – A intronic TNFRSF9 GTTTTGCTATGTTG
GCCACG
GGGGAATCCTGGGT
ATTATG
HA210 5 15043173
0
15043173
1
GC - exonic TNIP1 CAAGTGGCTTAGC
TCCTTAG
CTCAACCCAGAAATC
AGTGC
MC4 6 11191279
9
11191280
8
GGTAAACTTT – exonic TRAF3IP2 GCACTCAAGTTCT
GGAGGAC
CATGCTGGATACCTC
TGAGG
HA225 11 4408214 4408214 – CA exonic TRIM21 GCTTTGAGCTGGT
CAGAATC
GATGGGGAAAACTT
CAGTGC
HA195 11 89606435 89606435 C T intronic TRIM6 CCTCTAGAGTAGA
AGATGCC
CTTAATGCCCACTGA
TGAAG
MC6 22 20100166 20100166 – C exonic TRMT2A CTACCTCTGAATAT
CCTGGC
GTGTTTGCCTCCTCA
GATTC
HA214 2 17940182
7
17940182
7
C – exonic TTN GATGCCGAAAGTG
TTCTGAG
GCTCTATTGAAGAA
CTCCGC
HA216 11 62359061 62359061 G – exonic TUT1 GATTCGACATCCG
AATCCAC
CAGATAAGCATCGT
AACGCG
HA223 6 41766432 41766432 – CCCCA exonic USP49 CTTTGCCTATGATC
TCTCCG
CTAGGATTACAGGT
GTGAGC
rs201338884
HA211 6 41766432 41766432 – CCCCA exonic USP49 CTTTGCCTATGATC
TCTCCG
CTAGGATTACAGGT
GTGAGC
rs201338884
HA214 6 17001375
1
17001375
1
C – exonic WDR27 CAAAGTCTCCCTC
AACATCG
CTTCTGTAACTCTCA
GTGGC
HA216 16 706805 706805 G – exonic WDR90 CAACAGCTATACG
ACTTCAC
CTGGGCACTTACGT
GTGTTC
HA223 20 44108616 44108616 C – exonic WFDC2 GTTAATCTCCCTGT
ATCGCC
CGTTTTCTCCTGTTT
CCCAC
MC1 2 31610687 31610687 G – exonic XDH CACCTACCTGTTCT
CTTTCC
CACATAGCAGAGAC
TCAACC
MC2 4 338202 338203 TC – exonic ZNF141 GGTAGTGGAACTT
AGAACCC
GCTTCCTTCTTGACC
TTTGG
MC3 4 338197 338197 – GA exonic ZNF141 GGTAGTGGAACTT
AGAACCC
GCTTCCTTCTTGACC
TTTGG
HA210 4 265195 265195 A C exonic ZNF732* CTTTAGTCGGTTCA
CAACCC
GTATGTGGACCATC
CAAAGG
rs201614981
HA224 4 265195 265195 A C exonic ZNF732* CTTTAGTCGGTTCA
CAACCC
GTATGTGGACCATC
CAAAGG
rs201614981
HA212 16 89291210 89291210 – GTGA exonic ZNF778 CCCTGTGTACAGG
ACATCAC
GACACAATCCTTCCA
TAGCC
rs10625512
MC2 16 89294865 89294865 C A exonic ZNF778 GTGCACATAAGAA
CCCACAC
GAATGAGTGTAGCT
GACAGC
rs201425656
HA210 7 14897869
5
14897869
5
– C exonic ZNF783 CCAACATAGACTC
CTTTGCC
CATGGGTCCGCTGA
TGAATC
*=sequencing not successful, **=primer did not work
Supplementary table S-7 Mutations identified by exome sequencing that failed validation Patient . Position start Position end Ref. Mut. Type Gene Forward
primer5’3’ Reverse
primer5’3’ Rs-number
MC7 9 107556793 107556793 – A intronic ABCA1
CCCAGACATGAGCAA
TTTGC
CAAAGTTCAGGGTACCA
AGG
MC7 1 26671539 26671542 GCAC – exonic AIM1L
CATCGTCCCCAAGGA
ATAAG
CCCTTCACAACCTCTTTC
TG
MC10 1 26671545 26671578
GGGCCCTTCAC
GACCTCTTTCCA
GGTGGGGAACA – exonic AIM1L
CATCGTCCCCAAGGA
ATAAG
CCCTTCACAACCTCTTTC
TG
HA223 1 26671523 26671535
AAATGAGGCAT
CA – exonic AIM1L
CATCGTCCCCAAGGA
ATAAG
CCCTTCACAACCTCTTTC
TG
HA210 20 57042412 57042412 G/C – exonic APCDD1L GGTGACAAAGTGAGA
TTCTG
GTCTCATCCTTGCCTGT
GAC
HA214 2 68805143 68805143 A – exonic APLF CCTGAACGACAGCTT
TCTAG
CTCTGTCTTCCTATTTCC
AG
HA173 11 108172487 108172487 C - exonic ATM
GACTGGACATAGTTT
CTGGG
CTCAGGTTACCTATCTG
AGC rs587779846
HA175 12 112036798 rs772627768 TGC T exonic ATXN2
CTTCGTCGTCCTCCTT
CTCC
CAGGCCTGACAATCCCA
GAG rs772627768
HA175 12 112036796 rs780952627 GC G exonic ATXN2
CTTCGTCGTCCTCCTT
CTCC
CAGGCCTGACAATCCCA
GAG rs780952627
HA225 16 50368678 50368679 CT – exonic BRD7
CTTCCCTGGTTAATGA
CAGG
GCACTTGGTCTTCCCAA
GTC rs145896392
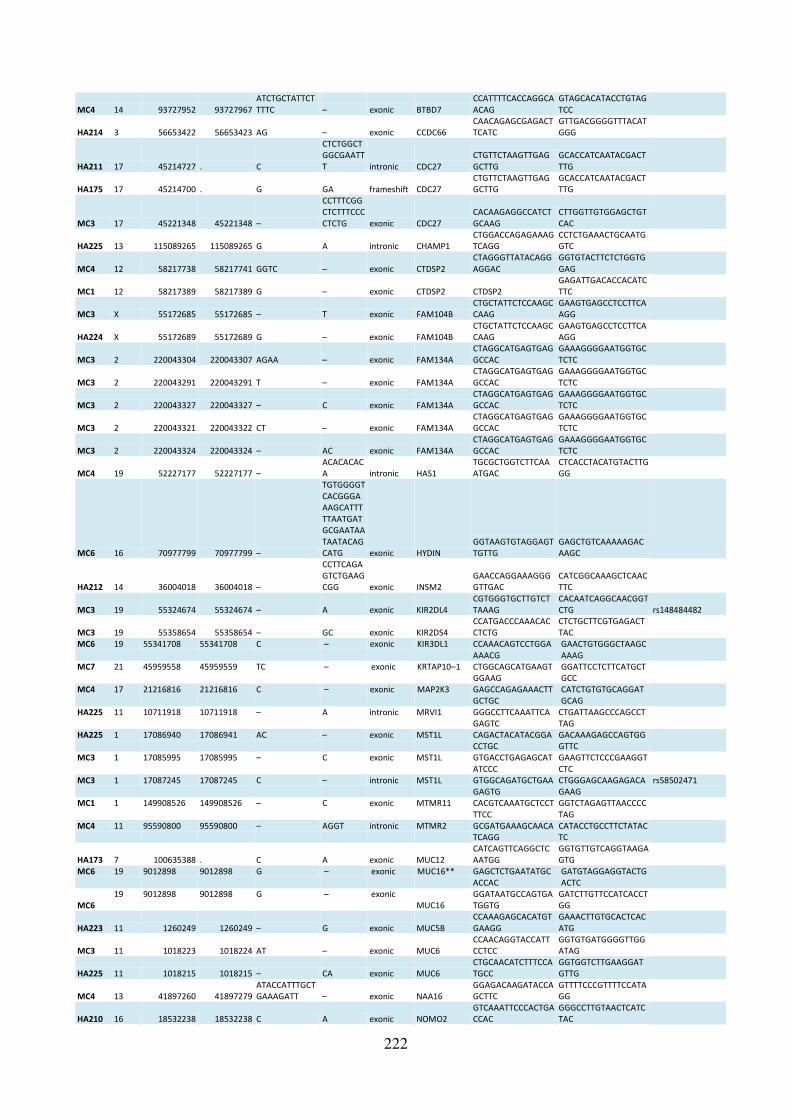
222
MC4 14 93727952 93727967
ATCTGCTATTCT
TTTC – exonic BTBD7
CCATTTTCACCAGGCA
ACAG
GTAGCACATACCTGTAG
TCC
HA214 3 56653422 56653423 AG – exonic CCDC66
CAACAGAGCGAGACT
TCATC
GTTGACGGGGTTTACAT
GGG
HA211 17 45214727 . C
CTCTGGCT
GGCGAATT
T intronic CDC27
CTGTTCTAAGTTGAG
GCTTG
GCACCATCAATACGACT
TTG
HA175 17 45214700 . G GA frameshift CDC27
CTGTTCTAAGTTGAG
GCTTG
GCACCATCAATACGACT
TTG
MC3 17 45221348 45221348 –
CCTTTCGG
CTCTTTCCC
CTCTG exonic CDC27
CACAAGAGGCCATCT
GCAAG
CTTGGTTGTGGAGCTGT
CAC
HA225 13 115089265 115089265 G A intronic CHAMP1
CTGGACCAGAGAAAG
TCAGG
CCTCTGAAACTGCAATG
GTC
MC4 12 58217738 58217741 GGTC – exonic CTDSP2
CTAGGGTTATACAGG
AGGAC
GGTGTACTTCTCTGGTG
GAG
MC1 12 58217389 58217389 G – exonic CTDSP2 CTDSP2
GAGATTGACACCACATC
TTC
MC3 X 55172685 55172685 – T exonic FAM104B
CTGCTATTCTCCAAGC
CAAG
GAAGTGAGCCTCCTTCA
AGG
HA224 X 55172689 55172689 G – exonic FAM104B
CTGCTATTCTCCAAGC
CAAG
GAAGTGAGCCTCCTTCA
AGG
MC3 2 220043304 220043307 AGAA – exonic FAM134A
CTAGGCATGAGTGAG
GCCAC
GAAAGGGGAATGGTGC
TCTC
MC3 2 220043291 220043291 T – exonic FAM134A
CTAGGCATGAGTGAG
GCCAC
GAAAGGGGAATGGTGC
TCTC
MC3 2 220043327 220043327 – C exonic FAM134A
CTAGGCATGAGTGAG
GCCAC
GAAAGGGGAATGGTGC
TCTC
MC3 2 220043321 220043322 CT – exonic FAM134A
CTAGGCATGAGTGAG
GCCAC
GAAAGGGGAATGGTGC
TCTC
MC3 2 220043324 220043324 – AC exonic FAM134A
CTAGGCATGAGTGAG
GCCAC
GAAAGGGGAATGGTGC
TCTC
MC4 19 52227177 52227177 –
ACACACAC
A intronic HAS1
TGCGCTGGTCTTCAA
ATGAC
CTCACCTACATGTACTTG
GG
MC6 16 70977799 70977799 –
TGTGGGGT
CACGGGA
AAGCATTT
TTAATGAT
GCGAATAA
TAATACAG
CATG exonic HYDIN
GGTAAGTGTAGGAGT
TGTTG
GAGCTGTCAAAAAGAC
AAGC
HA212 14 36004018 36004018 –
CCTTCAGA
GTCTGAAG
CGG exonic INSM2
GAACCAGGAAAGGG
GTTGAC
CATCGGCAAAGCTCAAC
TTC
MC3 19 55324674 55324674 – A exonic KIR2DL4
CGTGGGTGCTTGTCT
TAAAG
CACAATCAGGCAACGGT
CTG rs148484482
MC3 19 55358654 55358654 – GC exonic KIR2DS4
CCATGACCCAAACAC
CTCTG
CTCTGCTTCGTGAGACT
TAC
MC6 19 55341708 55341708 C – exonic KIR3DL1 CCAAACAGTCCTGGA
AAACG
GAACTGTGGGCTAAGC
AAAG
MC7 21 45959558 45959559 TC – exonic KRTAP10–1 CTGGCAGCATGAAGT
GGAAG
GGATTCCTCTTCATGCT
GCC
MC4 17 21216816 21216816 C – exonic MAP2K3 GAGCCAGAGAAACTT
GCTGC
CATCTGTGTGCAGGAT
GCAG
HA225 11 10711918 10711918 – A intronic MRVI1 GGGCCTTCAAATTCA
GAGTC
CTGATTAAGCCCAGCCT
TAG
HA225 1 17086940 17086941 AC – exonic MST1L CAGACTACATACGGA
CCTGC
GACAAAGAGCCAGTGG
GTTC
MC3 1 17085995 17085995 – C exonic MST1L GTGACCTGAGAGCAT
ATCCC
GAAGTTCTCCCGAAGGT
CTC
MC3 1 17087245 17087245 C – intronic MST1L GTGGCAGATGCTGAA
GAGTG
CTGGGAGCAAGAGACA
GAAG
rs58502471
MC1 1 149908526 149908526 – C exonic MTMR11 CACGTCAAATGCTCCT
TTCC
GGTCTAGAGTTAACCCC
TAG
MC4 11 95590800 95590800 – AGGT intronic MTMR2 GCGATGAAAGCAACA
TCAGG
CATACCTGCCTTCTATAC
TC
HA173 7 100635388 . C A exonic MUC12
CATCAGTTCAGGCTC
AATGG
GGTGTTGTCAGGTAAGA
GTG
MC6 19 9012898 9012898 G – exonic MUC16** GAGCTCTGAATATGC
ACCAC
GATGTAGGAGGTACTG
ACTC
MC6
19 9012898 9012898 G – exonic
MUC16
GGATAATGCCAGTGA
TGGTG
GATCTTGTTCCATCACCT
GG
HA223 11 1260249 1260249 – G exonic MUC5B
CCAAAGAGCACATGT
GAAGG
GAAACTTGTGCACTCAC
ATG
MC3 11 1018223 1018224 AT – exonic MUC6
CCAACAGGTACCATT
CCTCC
GGTGTGATGGGGTTGG
ATAG
HA225 11 1018215 1018215 – CA exonic MUC6
CTGCAACATCTTTCCA
TGCC
GGTGGTCTTGAAGGAT
GTTG
MC4 13 41897260 41897279
ATACCATTTGCT
GAAAGATT – exonic NAA16
GGAGACAAGATACCA
GCTTC
GTTTTCCCGTTTTCCATA
GG
HA210 16 18532238 18532238 C A exonic NOMO2
GTCAAATTCCCACTGA
CCAC
GGGCCTTGTAACTCATC
TAC
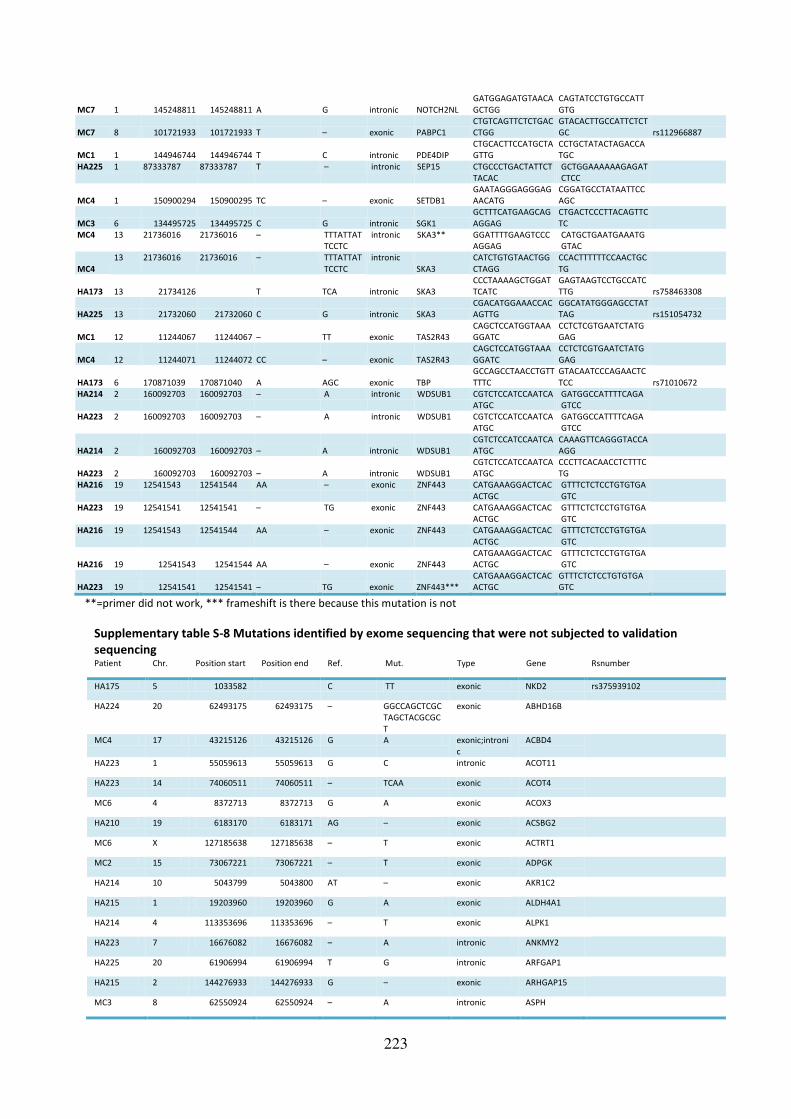
223
MC7 1 145248811 145248811 A G intronic NOTCH2NL
GATGGAGATGTAACA
GCTGG
CAGTATCCTGTGCCATT
GTG
MC7 8 101721933 101721933 T – exonic PABPC1
CTGTCAGTTCTCTGAC
CTGG
GTACACTTGCCATTCTCT
GC rs112966887
MC1 1 144946744 144946744 T C intronic PDE4DIP
CTGCACTTCCATGCTA
GTTG
CCTGCTATACTAGACCA
TGC
HA225 1 87333787 87333787 T – intronic SEP15 CTGCCCTGACTATTCT
TACAC
GCTGGAAAAAAGAGAT
CTCC
MC4 1 150900294 150900295 TC – exonic SETDB1
GAATAGGGAGGGAG
AACATG
CGGATGCCTATAATTCC
AGC
MC3 6 134495725 134495725 C G intronic SGK1
GCTTTCATGAAGCAG
AGGAG
CTGACTCCCTTACAGTTC
TC
MC4 13 21736016 21736016 – TTTATTAT
TCCTC
intronic SKA3** GGATTTTGAAGTCCC
AGGAG
CATGCTGAATGAAATG
GTAC
MC4
13 21736016 21736016 – TTTATTAT
TCCTC
intronic
SKA3
CATCTGTGTAACTGG
CTAGG
CCACTTTTTTCCAACTGC
TG
HA173 13 21734126
T TCA intronic SKA3
CCCTAAAAGCTGGAT
TCATC
GAGTAAGTCCTGCCATC
TTG rs758463308
HA225 13 21732060 21732060 C G intronic SKA3
CGACATGGAAACCAC
AGTTG
GGCATATGGGAGCCTAT
TAG rs151054732
MC1 12 11244067 11244067 – TT exonic TAS2R43
CAGCTCCATGGTAAA
GGATC
CCTCTCGTGAATCTATG
GAG
MC4 12 11244071 11244072 CC – exonic TAS2R43
CAGCTCCATGGTAAA
GGATC
CCTCTCGTGAATCTATG
GAG
HA173 6 170871039 170871040 A AGC exonic TBP
GCCAGCCTAACCTGTT
TTTC
GTACAATCCCAGAACTC
TCC rs71010672
HA214 2 160092703 160092703 – A intronic WDSUB1 CGTCTCCATCCAATCA
ATGC
GATGGCCATTTTCAGA
GTCC
HA223 2 160092703 160092703 – A intronic WDSUB1 CGTCTCCATCCAATCA
ATGC
GATGGCCATTTTCAGA
GTCC
HA214 2 160092703 160092703 – A intronic WDSUB1
CGTCTCCATCCAATCA
ATGC
CAAAGTTCAGGGTACCA
AGG
HA223 2 160092703 160092703 – A intronic WDSUB1
CGTCTCCATCCAATCA
ATGC
CCCTTCACAACCTCTTTC
TG
HA216 19 12541543 12541544 AA – exonic ZNF443 CATGAAAGGACTCAC
ACTGC
GTTTCTCTCCTGTGTGA
GTC
HA223 19 12541541 12541541 – TG exonic ZNF443 CATGAAAGGACTCAC
ACTGC
GTTTCTCTCCTGTGTGA
GTC
HA216 19 12541543 12541544 AA – exonic ZNF443 CATGAAAGGACTCAC
ACTGC
GTTTCTCTCCTGTGTGA
GTC
HA216 19 12541543 12541544 AA – exonic ZNF443
CATGAAAGGACTCAC
ACTGC
GTTTCTCTCCTGTGTGA
GTC
HA223 19 12541541 12541541 – TG exonic ZNF443***
CATGAAAGGACTCAC
ACTGC
GTTTCTCTCCTGTGTGA
GTC
**=primer did not work, *** frameshift is there because this mutation is not
Supplementary table S-8 Mutations identified by exome sequencing that were not subjected to validation
sequencing Patient Chr. Position start Position end Ref. Mut. Type Gene Rsnumber
HA175 5 1033582 C TT exonic NKD2 rs375939102
HA224 20 62493175 62493175 – GGCCAGCTCGC
TAGCTACGCGC
T
exonic ABHD16B
MC4 17 43215126 43215126 G A exonic;introni
c
ACBD4
HA223 1 55059613 55059613 G C intronic ACOT11
HA223 14 74060511 74060511 – TCAA exonic ACOT4
MC6 4 8372713 8372713 G A exonic ACOX3
HA210 19 6183170 6183171 AG – exonic ACSBG2
MC6 X 127185638 127185638 – T exonic ACTRT1
MC2 15 73067221 73067221 – T exonic ADPGK
HA214 10 5043799 5043800 AT – exonic AKR1C2
HA215 1 19203960 19203960 G A exonic ALDH4A1
HA214 4 113353696 113353696 – T exonic ALPK1
HA223 7 16676082 16676082 – A intronic ANKMY2
HA225 20 61906994 61906994 T G intronic ARFGAP1
HA215 2 144276933 144276933 G – exonic ARHGAP15
MC3 8 62550924 62550924 – A intronic ASPH

224
MC3 13 31843415 31843415 G A intronic B3GALTL
MC1 21 11098704 11098723 ACTCCAGC
CGCCATCT
TACT
– exonic BAGE2
MC7 11 101929618 101929618 – CC exonic C11orf70
HA215 16 81094957 81094957 G A exonic C16orf46
HA210 17 65989037 65989037 A G exonic C17orf58
HA223 18 47010118 47010118 T – exonic C18orf32,RPL
17–C18orf32
MC2 1 154171909 154171910 TC – exonic C1orf189
MC6 20 1187535 1187536 AG – exonic C20orf202
MC3 22 38340509 38340509 T – exonic C22orf23
HA223 22 19435270 19435270 – A exonic C22orf39
MC1 3 138668458 138668467 GGCATTC
GAA
– exonic C3orf72
HA195 4 76489322 76489322 A G intronic C4orf26
HA195 4 5527115 5527115 – T exonic C4orf6
HA210 7 1037383 1037383 C – exonic C7orf50 rs200169409
MC4 8 67590023 67590023 G – exonic C8orf44
HA212 9 74586535 74586538 GTGA – intronic C9orf85
HA216 1 116243979 116243979 C T exonic CASQ2
MC2 2 179714812 179714812 T – exonic CCDC141
HA210 13 103399818 103399818 – T exonic CCDC168
HA215 3 126133023 126133023 G A intronic CCDC37
MC4 Y 21154529 21154529 – TTA exonic CD24
MC4 Y 21154528 21154528 – AAAATACATAA
AAA
exonic CD24
MC7 1 54605318 54605318 – GG exonic CDCP2
HA224 16 55844924 55844924 – A intronic CES1
HA223 1 203186950 203186950 – AGACCATGGCC
CCGCCCAGTCC
CT
exonic CHIT1
HA223 2 233406191 233406191 – A exonic CHRNG
MC1 10 125780753 125780753 G – exonic CHST15
HA224 3 190106072 190106072 G – exonic CLDN16
HA223 16 58577316 58577316 A – exonic CNOT1
HA195 4 84206004 84206004 T A exonic COQ2
MC2 11 46342259 46342259 – G intronic CREB3L1
MC4 10 126692023 126692023 G – exonic CTBP2
HA225 X 23933912 23933912 G A intronic CXorf58
HA173 3 50391167 T C CYB561D2 rs114924982
MC2 1 155003712 155003712 – G intronic DCST2
HA224 4 169315747 169315747 G A exonic DDX60L
MC6 1 197621397 197621421 GTACTGG
GTGGTTAT
ACAGTGA
TCT
– exonic DENND1B
HA216 1 225334919 225334922 AATT – exonic DNAH14
MC3 2 25170534 25170534 A – exonic DNAJC27
MC2 11 637537 637549 CCGCCGA
CCTCCT
– exonic DRD4
MC1 18 28647999 28647999 – TC exonic DSC2
HA224 17 80019231 80019232 TG – intronic DUS1L
MC10 3 73111724 73111724 T G exonic EBLN2

225
HA224 6 53152683 53152683 G A exonic ELOVL5
MC1 12 7080212 7080212 T C intronic EMG1
HA150 4 71508402 71508402 – AG exonic ENAM
HA195 1 43621956 43621956 G A exonic FAM183A rs149435229
MC4 12 50747117 50747121 TTTCT – exonic FAM186A
HA223 5 7863112 7863112 – A intronic FASTKD3
MC10 18 74208486 74208486 G – intronic FLJ44313
MC3 10 135438960 135438960 C – exonic FRG2B
MC3 15 40018807 40018807 – A exonic FSIP1
HA173 2 242716400 G A intronic GAL3ST2 rs78620448
HA150 5 145895394 145895394 G A exonic GPR151 rs114285050
HA212 17 36493523 36493523 G – exonic GPR179
HA214 5 90049403 90049403 G T exonic GPR98
MC2 6 117113762 117113762 – A exonic GPRC6A
MC3 12 122287697 122287697 C T intronic HPD
HA210 4 88235068 88235068 G C exonic HSD17B13 rs142648167
HA225 20 43374722 43374723 GG – exonic KCNK15
HA210 6 39282816 39282816 G A exonic KCNK16 rs138573996
HA225 6 36452603 36452603 – A intronic KCTD20
MC2 1 175129948 175129955 TCTTCTTG – exonic KIAA0040
MC1 13 46946088 46946088 C – exonic KIAA0226L
HA216 14 58899157 58899157 G – exonic KIAA0586
MC6 5 5460669 5460669 A T exonic KIAA0947
MC2 20 36869090 36869090 T – exonic KIAA1755
MC7 22 50987497 50987497 G – exonic KLHDC7B
MC6 17 39458574 39458586 GTACAGA
TGGTTG
– exonic KRTAP29-1 rs144150438
HA150 3 156697055 156697055 – T exonic LEKR1 rs200834448
HA216 12 49499706 49499706 C T intronic LMBR1L rs201470223
HA224 19 4682879 4682880 AG – exonic LOC1001310
94
HA195 10 105005931 105005931 C T exonic LOC729020
HA224 17 62855003 62855003 – A intronic LRRC37A3
MC3 7 91793327 91793327 A – exonic LRRD1
MC4 11 71807767 71807767 A C intronic LRTOMT
MC2 9 139748277 139748296 CCCTGTG
GCAGAGC
ACAGGG
– exonic MAMDC4
HA150 4 103611909 103611909 C T exonic MANBA
HA215 8 144651725 144651725 – G exonic MROH6
MC1 12 65762786 65762786 C – exonic MSRB3
MC2 3 195452668 195452668 C G exonic;introni
c
MUC20 rs201581458
HA150 6 30993758 30993758 G – exonic MUC22
HA210 14 23889445 23889445 – G intronic MYH7 rs45504498
HA215 14 23889445 23889445 – G intronic MYH7 rs45504498
MC2 17 18062605 18062605 C – exonic MYO15A
MC6 10 95159156 95159156 C – exonic MYOF
HA210 7 123197691 123197691 G C exonic NDUFA5 rs118062590
HA225 7 123197691 123197691 G C exonic NDUFA5 rs118062590

226
MC3 18 70423384 70423384 – A intronic NETO1
MC10 20 44519224 44519224 – T exonic NEURL2
MC6 5 175811094 175811094 – GT exonic NOP16
HA150 14 74947404 74947404 C T intronic NPC2
MC3 17 45669428 45669428 – A intronic NPEPPS rs59875832
HA225 19 49168026 49168026 T C intronic NTN5
HA223 9 99694525 99694525 – A exonic NUTM2G
MC4 1 228558993 228558994 CA – exonic OBSCN
HA210 22 50969725 50969725 C T intronic ODF3B
HA213 17 80369330 80369330 C T intronic OGFOD3
HA224 9 125424415 125424415 – G exonic OR1L1
HA223 1 248801945 248801951 CAGCACG – exonic OR2T35
MC7 1 248801602 248801602 – CA exonic OR2T35
MC6 15 22369176 22369177 TG – exonic OR4M2
HA210 11 5410769 5410769 C G exonic OR51M1 rs182074434
HA214 11 58207036 58207036 T – exonic OR5B12 rs201567144
HA210 11 55703050 55703051 AT – exonic OR5I1
HA214 12 55759485 55759485 – T exonic OR6C75
MC4 11 17631831 17631831 G T exonic OTOG
HA213 12 29630166 29630166 C T intronic OVCH1 rs189316643
HA212 12 121570899 121570899 G T intronic P2RX7
HA225 12 56500502 56500502 – A intronic PA2G4 rs34728522
HA211 5 140181971 CT C exonic PCDHA3 rs782412251
MC7 5 140579736 140579736 – T exonic PCDHB11
MC10 2 178969170 178969171 TC – exonic PDE11A
MC3 13 73409508 73409508 – A intronic PIBF1
MC2 10 3208567 3208567 – GCACGCTAGG
GAAGAGAGAG
GAATG
exonic PITRM1
MC3 16 81242149 81242150 TT – exonic PKD1L2
HA213 8 110464510 110464510 G A intronic PKHD1L1
HA215 3 16926562 16926562 T C intronic PLCL2
MC1 9 140356449 140356449 – C exonic PNPLA7
MC2 1 145592762 145592762 G – exonic POLR3C
MC6 8 67922949 67922949 C T intronic PPP1R42
HA223 12 11461154 11461154 C G intronic PRB4
HA215 16 31150656 31150656 C A exonic PRSS36 rs201757658
HA225 19 43420568 43420568 A – exonic PSG6
MC1 12 133277869 133277869 – G exonic PXMP2
MC3 2 28081439 28081439 C G intronic RBKS
HA224 2 220197294 220197294 G – exonic RESP18
HA223 1 156354348 156354348 C – intronic RHBG
HA225 X 119293216 119293216 – G exonic RHOXF2B
MC7 1 153520256 153520256 C – exonic S100A3
MC1 19 3179413 3179413 G – exonic S1PR4
MC7 6 130466547 130466548 AT – exonic SAMD3
MC4 14 55251159 55251159 C T exonic SAMD4A
HA212 4 129925032 129925032 C A intronic SCLT1

227
HA216 2 167138320 167138320 – A intronic SCN9A rs35888674
MC6 2 167138320 167138320 – A intronic SCN9A rs35888674
HA223 1 1222262 1222262 C – exonic SCNN1D
MC2 2 120219488 120219488 – T exonic SCTR
HA216 14 24909629 24909629 C – exonic SDR39U1
MC3 12 113874568 113874568 C – exonic SDSL
MC2 4 119666217 119666217 – A intronic SEC24D rs35951660
MC10 6 108243115 108243115 – GGG intronic SEC63
HA210 21 40823984 40823985 AG – exonic SH3BGR
MC7 2 233131 233131 C – exonic SH3YL1
HA175 X 50350726 T TC exonic SHROOM4 rs587780460
HA150 3 38355433 38355433 G T intronic SLC22A14
HA215 5 140683301 140683301 – T exonic SLC25A2
MC4 7 103062016 103062016 T C intronic SLC26A5
HA210 4 25678141 25678141 C T exonic SLC34A2
HA175 6 71378354 AC A exonic SMAP1 rs200042613
HA215 6 71378355 71378355 C – exonic SMAP1 rs200042613
HA216 6 71378355 71378355 C – exonic SMAP1 rs200042613
HA223 6 71378355 71378355 C – exonic SMAP1 rs200042613
MC2 11 57313384 57313384 – C exonic SMTNL1
MC10 8 145086759 145086759 A T exonic SPATC1
MC2 15 42147511 42147511 G A exonic SPTBN5 rs369248083
MC1 5 139931628 139931628 – GT exonic SRA1 rs3085220
MC10 5 139931629 139931629 – G exonic SRA1 rs5871740
MC4 14 38679763 38679763 – GCTCTGAGCCC
GGGCCACGCA
GGG
exonic SSTR1
HA212 2 153004816 153004816 – A intronic STAM2
HA214 3 111718266 111718266 A G intronic TAGLN3
MC3 12 10958845 10958845 – A exonic TAS2R8
HA212 6 167591956 167591956 C T exonic TCP10L2
MC2 19 36530272 36530272 G – exonic THAP8
HA216 17 1613129 1613130 GC – exonic TLCD2
MC3 4 159136408 159136408 T – exonic TMEM144
HA224 10 81841421 81841421 – A exonic TMEM254
HA195 1 16073527 16073527 – G exonic TMEM82 rs199908593
HA215 1 16073527 16073527 – G exonic TMEM82 rs199908593
MC7 21 10970008 10970008 C T intronic TPTE
HA215 11 89606435 89606435 C T intronic TRIM64B rs201030722
HA223 22 38106569 38106578 AAGAGGT
GGG
– exonic TRIOBP
MC3 4 8442843 8442843 C A exonic TRMT44
MC7 6 41010518 41010518 G A intronic TSPO2
HA223 5 34896981 34896981 G T intronic TTC23L
HA211 6 30689576 C T Intronic TUBB rs145807661
HA216 3 38043191 38043191 A T intronic VILL
MC7 16 89782865 89782868 CTTA – intronic VPS9D1
HA212 3 183959134 183959134 – C exonic VWA5B2
MC10 3 101370529 101370529 – AAA intronic ZBTB11
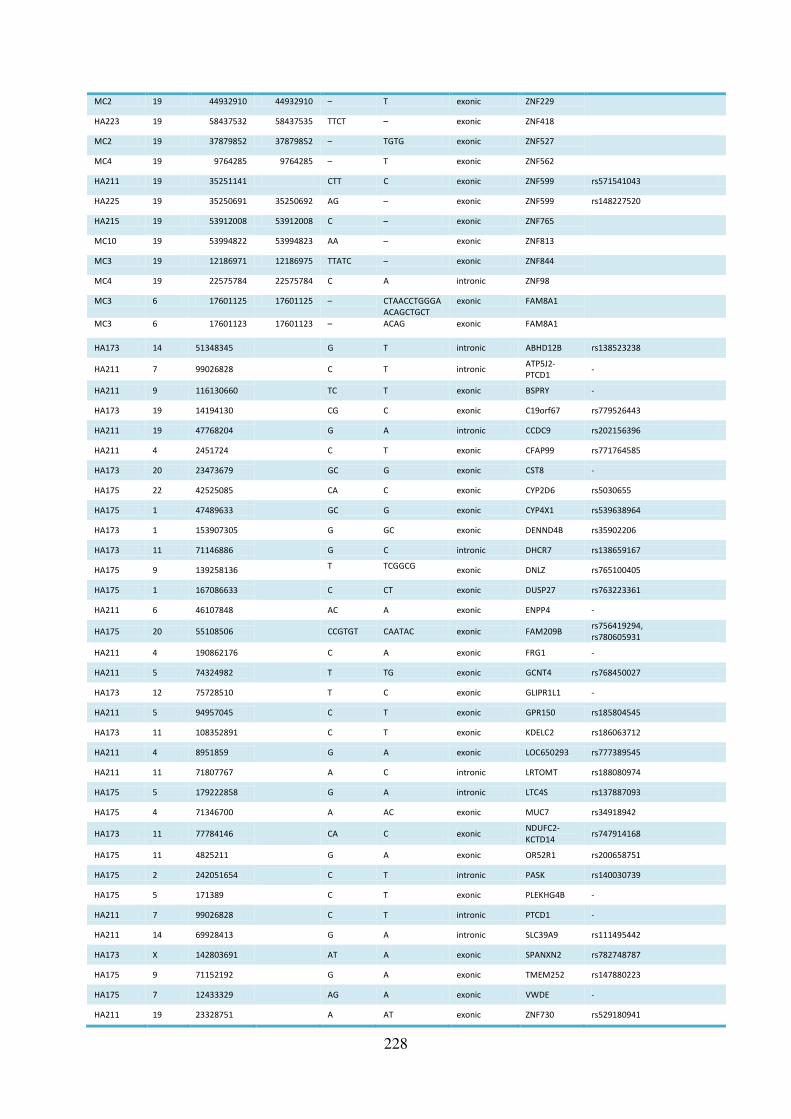
228
MC2 19 44932910 44932910 – T exonic ZNF229
HA223 19 58437532 58437535 TTCT – exonic ZNF418
MC2 19 37879852 37879852 – TGTG exonic ZNF527
MC4 19 9764285 9764285 – T exonic ZNF562
HA211 19 35251141 CTT C exonic ZNF599 rs571541043
HA225 19 35250691 35250692 AG – exonic ZNF599 rs148227520
HA215 19 53912008 53912008 C – exonic ZNF765
MC10 19 53994822 53994823 AA – exonic ZNF813
MC3 19 12186971 12186975 TTATC – exonic ZNF844
MC4 19 22575784 22575784 C A intronic ZNF98
MC3 6 17601125 17601125 – CTAACCTGGGA
ACAGCTGCT
exonic FAM8A1
MC3 6 17601123 17601123 – ACAG exonic FAM8A1
HA173 14 51348345
G T intronic ABHD12B rs138523238
HA211 7 99026828
C T intronic ATP5J2-
PTCD1 -
HA211 9 116130660
TC T exonic BSPRY -
HA173 19 14194130
CG C exonic C19orf67 rs779526443
HA211 19 47768204
G A intronic CCDC9 rs202156396
HA211 4 2451724
C T exonic CFAP99 rs771764585
HA173 20 23473679
GC G exonic CST8 -
HA175 22 42525085
CA C exonic CYP2D6 rs5030655
HA175 1 47489633
GC G exonic CYP4X1 rs539638964
HA173 1 153907305
G GC exonic DENND4B rs35902206
HA173 11 71146886
G C intronic DHCR7 rs138659167
HA175 9 139258136
T TCGGCG exonic DNLZ rs765100405
HA175 1 167086633
C CT exonic DUSP27 rs763223361
HA211 6 46107848
AC A exonic ENPP4 -
HA175 20 55108506
CCGTGT CAATAC exonic FAM209B rs756419294,
rs780605931
HA211 4 190862176
C A exonic FRG1 -
HA211 5 74324982
T TG exonic GCNT4 rs768450027
HA173 12 75728510
T C exonic GLIPR1L1 -
HA211 5 94957045
C T exonic GPR150 rs185804545
HA173 11 108352891
C T exonic KDELC2 rs186063712
HA211 4 8951859
G A exonic LOC650293 rs777389545
HA211 11 71807767
A C intronic LRTOMT rs188080974
HA175 5 179222858
G A intronic LTC4S rs137887093
HA175 4 71346700
A AC exonic MUC7 rs34918942
HA173 11 77784146
CA C exonic NDUFC2-
KCTD14 rs747914168
HA175 11 4825211
G A exonic OR52R1 rs200658751
HA175 2 242051654
C T intronic PASK rs140030739
HA175 5 171389
C T exonic PLEKHG4B -
HA211 7 99026828
C T intronic PTCD1 -
HA211 14 69928413
G A intronic SLC39A9 rs111495442
HA173 X 142803691
AT A exonic SPANXN2 rs782748787
HA175 9 71152192
G A exonic TMEM252 rs147880223
HA175 7 12433329
AG A exonic VWDE -
HA211 19 23328751
A AT exonic ZNF730 rs529180941

229
HA175 19 11834158
C T intronic ZNF823 -
HA173 14 51348345
G T intronic ABHD12B rs138523238
HA211 7 99026828
C T intronic ATP5J2-
PTCD1 -
HA211 9 116130660
TC T exonic BSPRY -

230
Supplementary figure S-8 Complete IPA core analysis results of all RS patients
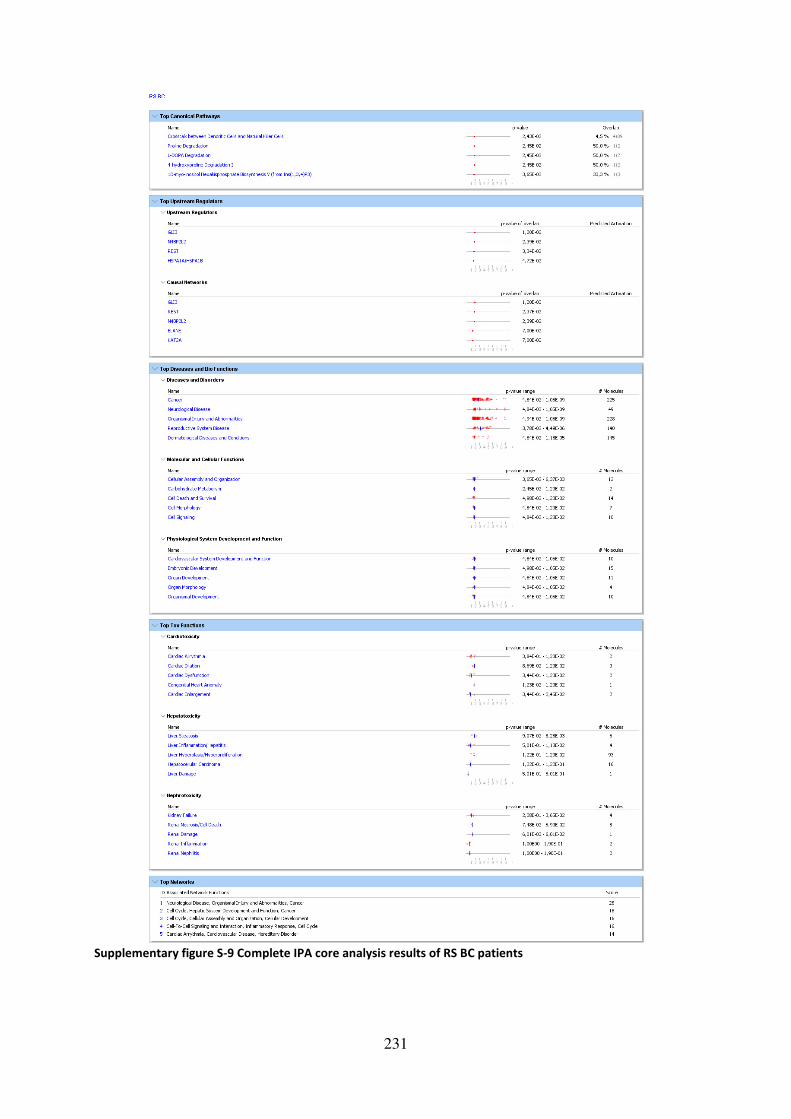
231
Supplementary figure S-9 Complete IPA core analysis results of RS BC patients
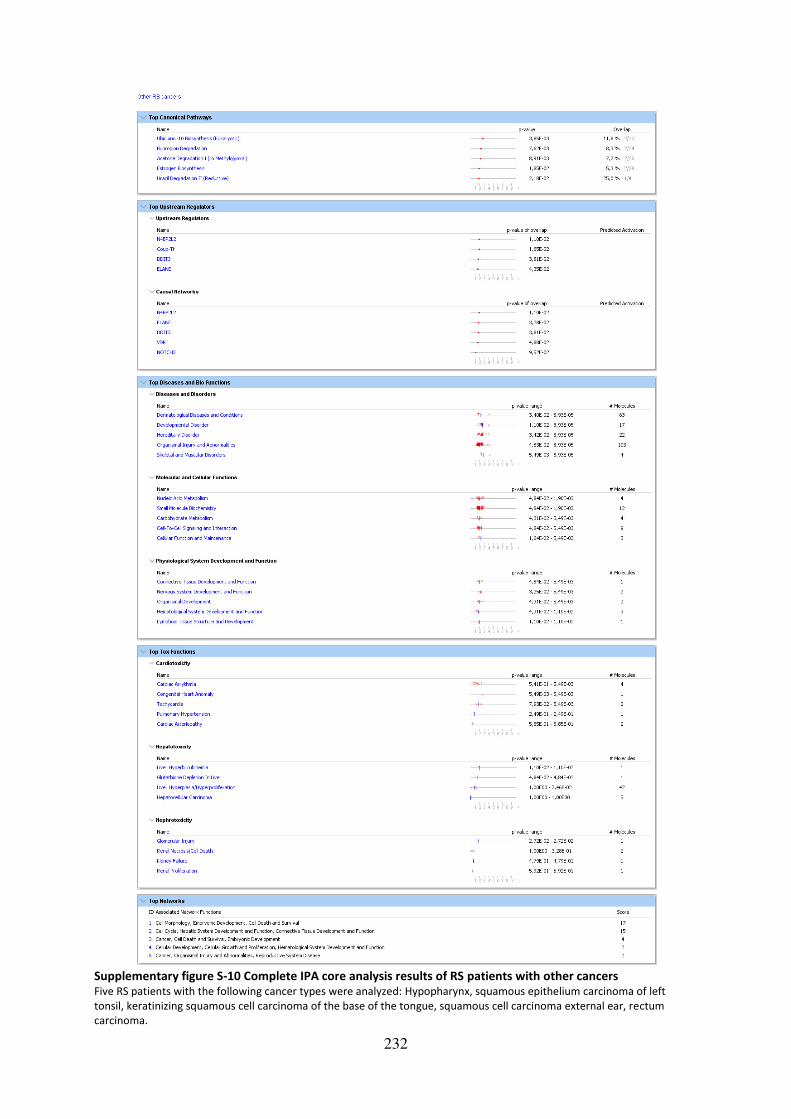
232
Supplementary figure S-10 Complete IPA core analysis results of RS patients with other cancers Five RS patients with the following cancer types were analyzed: Hypopharynx, squamous epithelium carcinoma of left
tonsil, keratinizing squamous cell carcinoma of the base of the tongue, squamous cell carcinoma external ear, rectum
carcinoma.

233
Supplementary figure S-11 Complete IPA core analysis results of all Chemo RS patients Chemo RS patients with the following cancer types were analyzed: two breast cancer and one prostate cancer.


235
Supplementary figure S-13 Complete IPA core analysis results of BC patients
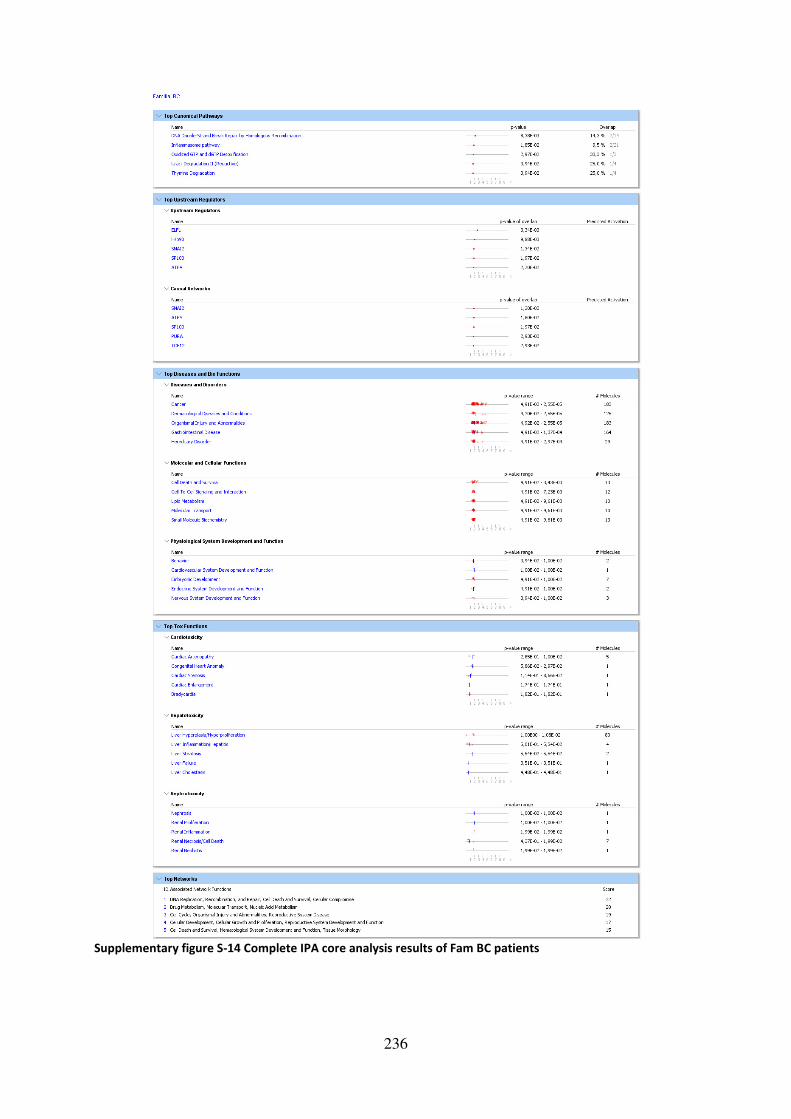
236
Supplementary figure S-14 Complete IPA core analysis results of Fam BC patients

237
Supplementary figure S-15 IPA heatmaps of “Cancer” and “Organismal Injury and Abnormalities” in RS
patients
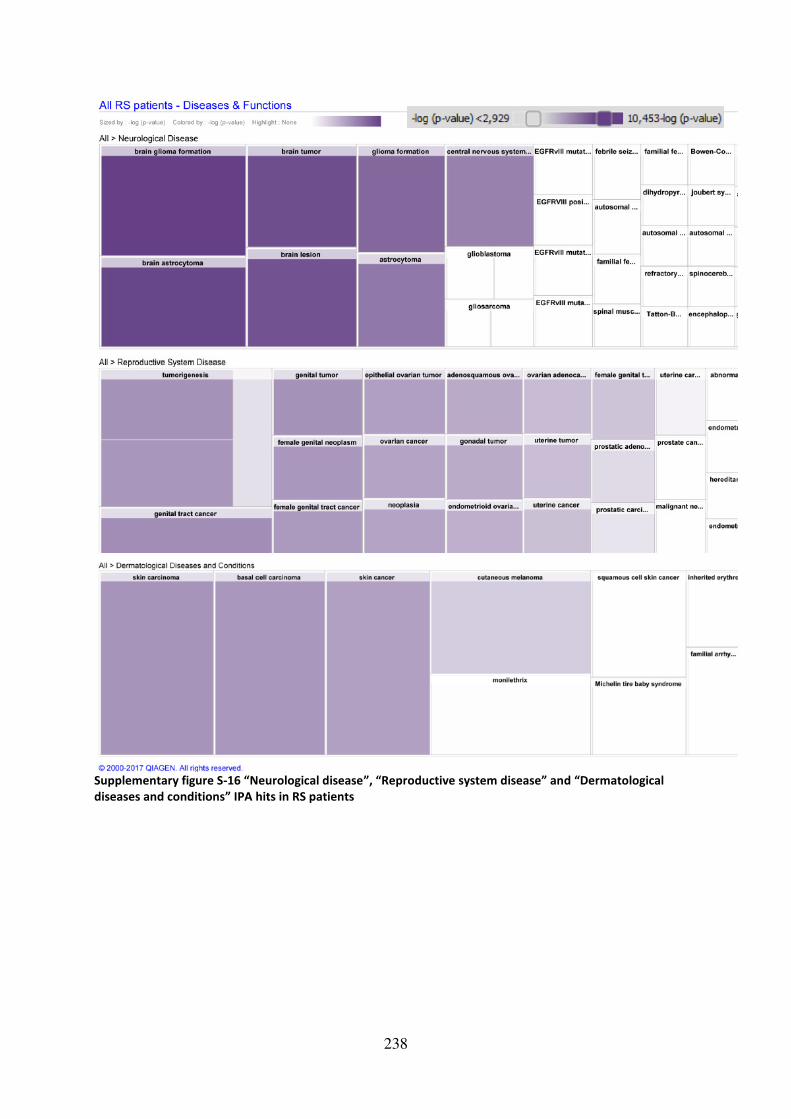
238
Supplementary figure S-16 “Neurological disease”, “Reproductive system disease” and “Dermatological
diseases and conditions” IPA hits in RS patients

239
Supplementary figure S-17 IPA heatmaps of “Cancer” and “Organismal Injury and Abnormalities” in RS BC
patients

240
Supplementary figure S-18 IPA heatmaps of “Cancer” and “Organismal Injury and Abnormalities” in BC
patients
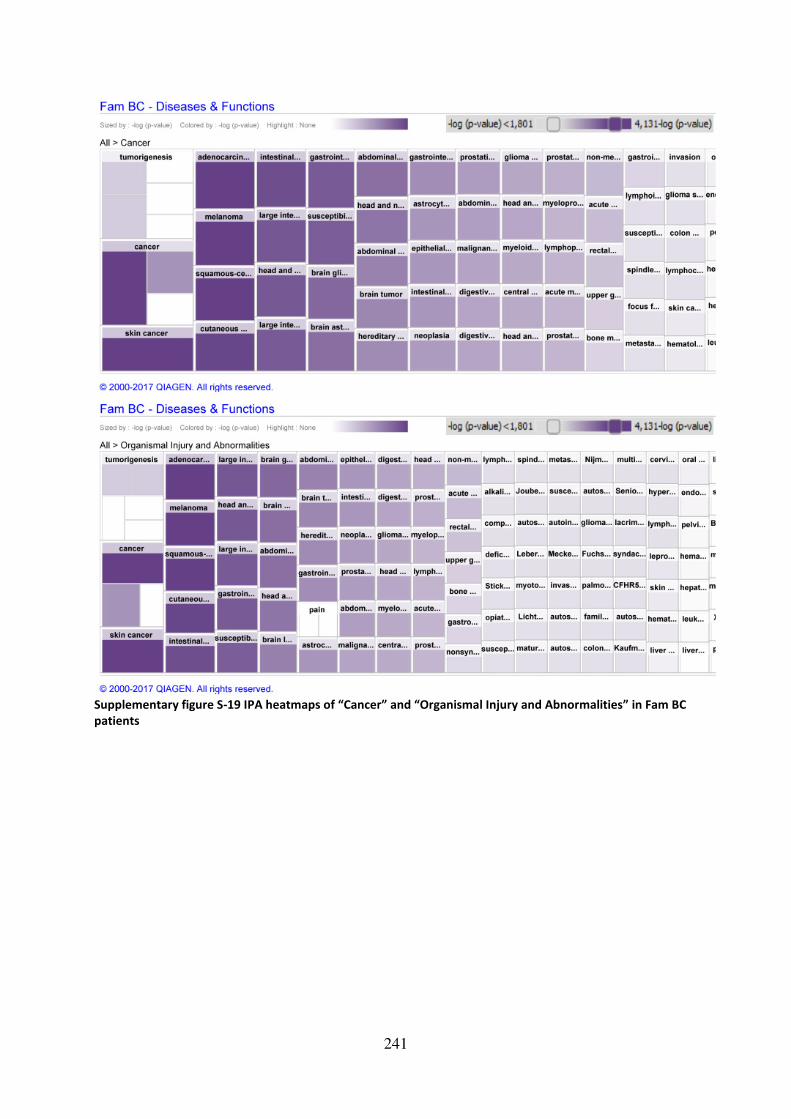
241
Supplementary figure S-19 IPA heatmaps of “Cancer” and “Organismal Injury and Abnormalities” in Fam BC
patients

242
Supplementary figure S-20 IPA heatmaps of “Reproductive system disease” and “Neurological Disease” in RS
BC patients
Supplementary figure S-21 IPA heatmap of “Hereditary Disorder” in Fam BC patients
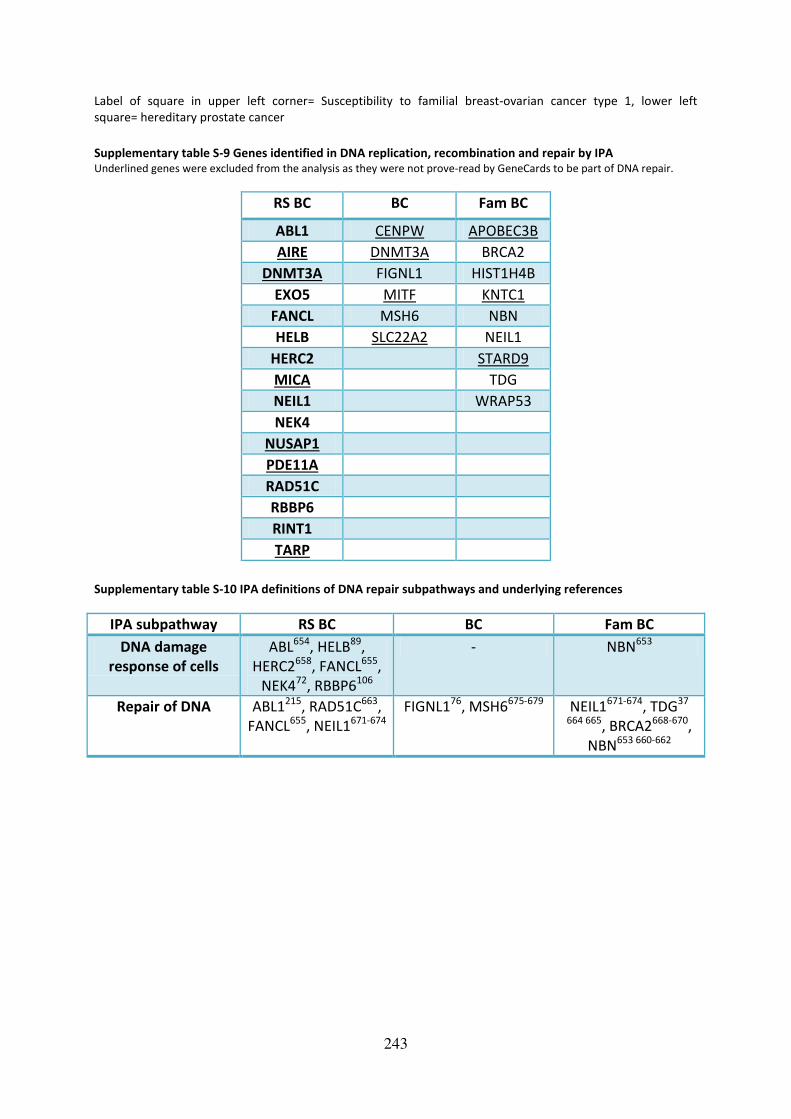
243
Label of square in upper left corner= Susceptibility to familial breast-ovarian cancer type 1, lower left
square= hereditary prostate cancer
Supplementary table S-9 Genes identified in DNA replication, recombination and repair by IPA Underlined genes were excluded from the analysis as they were not prove-read by GeneCards to be part of DNA repair.
RS BC BC Fam BC
ABL1 CENPW APOBEC3B
AIRE DNMT3A BRCA2
DNMT3A FIGNL1 HIST1H4B
EXO5 MITF KNTC1
FANCL MSH6 NBN
HELB SLC22A2 NEIL1
HERC2 STARD9
MICA TDG
NEIL1 WRAP53
NEK4
NUSAP1
PDE11A
RAD51C
RBBP6
RINT1
TARP
Supplementary table S-10 IPA definitions of DNA repair subpathways and underlying references
IPA subpathway RS BC BC Fam BC
DNA damage
response of cells
ABL654, HELB89,
HERC2658, FANCL655,
NEK472, RBBP6106
- NBN653
Repair of DNA ABL1215, RAD51C663,
FANCL655, NEIL1671-674
FIGNL176, MSH6675-679 NEIL1671-674, TDG37
664 665, BRCA2668-670,
NBN653 660-662

244
Supplementary figure S-22 IPA comparison analyses between groups with unique genes The following abbreviations were used: Neurolog.= neurological, Orgn. Inj./Abnorm.= organismal injuries and abnormalities,
Reprod. S. Dis.= reproductive system disease, Dermat. Dis./Cond.= dermatological diseases and conditions,
Endocr. S. Dis.= endocrine system disease, Immunolog. Disease= immunological disease, Heredit. Dis= Hereditary Disorder.
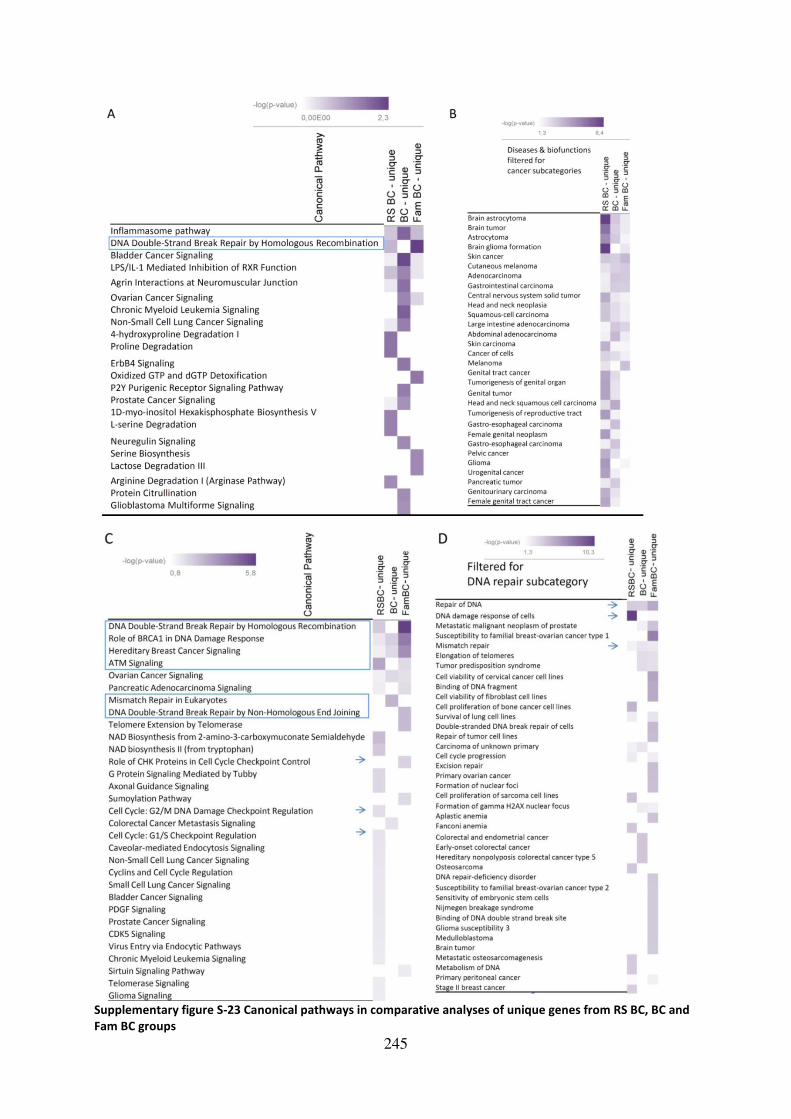
245
Supplementary figure S-23 Canonical pathways in comparative analyses of unique genes from RS BC, BC and
Fam BC groups

246
Heatmaps of canonical pathways identified by Ingenuity Pathway Analysis comparison tool regarding only genes, which
were unique to the respective patient group, compare Figure 20. Heatmaps of canonical pathways identified by Ingenuity
Pathway Analysis comparison tool. Panel A shows results of superior canonical pathways in 11 radiosensitive (RS) breast
cancer (BC) patients, 11 BC and 11 familial (Fam) BC patients. Pathways of interest are enclosed by squares. Panel B shows
the results of the comparison analysis in the “Diseases and Disorders” section, filtered for “Cancer” subcategory. Panels C
and D show the results of comparison analysis with the modified datasets filtered for results obtained in the “DNA Replication, Recombination and Repair” category and further restricted to “DNA repair” as revised by GeneCards analysis,
see also Figure 22. The genes in the three datasets are listed in Supplementary table S-9. Arrows indicate particularly
interesting categories in the radiosensitive context. List of p-values of overlap for panel C and the top 40 hits in panel D are
given in. Supplementary table S-12 and Supplementary table S-13.
Supplementary table S-11 Canonical pathway p-values of comparative IPA analysis
Canonical Pathway RS BC BC Fam BC
Dopamine Degradation 0.049354 0.035189 0.240749
L-DOPA Degradation 0.024489 0.020327 1
Inflammasome pathway 0.22931 0.019194 0.18078
Crosstalk between Dendritic Cells and Natural Killer Cells 0.024307 0.063025 0.571119
Noradrenaline and Adrenaline Degradation 0.068967 0.049568 0.282841
DNA Double-Strand Break Repair by Homologous
Recombination
0.159379 1 0.007494
Uracil Degradation II (Reductive) 1 0.040244 0.037253
Thymine Degradation 1 0.040244 0.037253
Bladder Cancer Signaling 1 0.012172 0.562863
P2Y Purigenic Receptor Signaling Pathway 1 0.01152 1
Agrin Interactions at Neuromuscular Junction 0.564826 0.031212 1
Chronic Myeloid Leukemia Signaling 1 0.021338 1
GPCR-Mediated Integration of Enteroendocrine Signaling
Exemplified by an L Cell
0.591071 0.037461 1
Glioblastoma Multiforme Signaling 1 0.023805 1
4-hydroxyproline Degradation I 0.024489 1 1
Proline Degradation 0.024489 1 1
Non-Small Cell Lung Cancer Signaling 0.61574 0.044298 1
Oxidized GTP and dGTP Detoxification 1 1 0.028071
ErbB4 Signaling 1 0.03489 1
L-serine Degradation 0.036509 1 1
1D-myo-inositol Hexakisphosphate Biosynthesis V 0.036509 1 1
p70S6K Signaling 1 0.045529 1
Serine Biosynthesis 1 1 0.046349
Lactose Degradation III 1 1 0.046349
Arginine Degradation I (Arginase Pathway) 0.048382 1 1
Protein Citrullination 1 0.05005 1
Supplementary table S-12 Canonical pathway p-values of comparative IPA analysis after DNA repair filtering
Canonical Pathway RS BC
(p-value of
overlap)
BC
(p-value of
overlap)
Fam BC
(p-value of
overlap)
DNA Double-Strand Break Repair by Homologous
Recombination
0.00716531 1 2.88E-06
Role of BRCA1 in DNA Damage Response 0.03933616 0.007992 9.45E-05
Hereditary Breast Cancer Signaling 0.07008492 0.014424 0.000309
ATM Signaling 0.00071552 1 0.016125
Ovarian Cancer Signaling 0.07104639 0.014628 0.029044
Pancreatic Adenocarcinoma Signaling 0.0589634 1 0.024013
Mismatch Repair in Eukaryotes 1 0.001642 1
DNA Double-Strand Break Repair by Non-Homologous End 1 1 0.002872

247
Joining
NAD Biosynthesis from 2-amino-3-carboxymuconate
Semialdehyde
0.00307653 1 1
Telomere Extension by Telomerase 1 1 0.003077
NAD biosynthesis II (from tryptophan) 0.00665504 1 1
Role of CHK Proteins in Cell Cycle Checkpoint Control 1 1 0.011247
G Protein Signaling Mediated by Tubby 0.0158039 1 1
Sumoylation Pathway 1 1 0.019569
Axonal Guidance Signaling 0.02075259 1 1
Colorectal Cancer Metastasis Signaling 1 0.024794 1
Cell Cycle: G2/M DNA Damage Checkpoint Regulation 0.02487686 1 1
Cell Cycle: G1/S Checkpoint Regulation 0.03188149 1 1
Caveolar-mediated Endocytosis Signaling 0.03586377 1 1
Non-Small Cell Lung Cancer Signaling 0.0388408 1 1
Cyclins and Cell Cycle Regulation 0.0388408 1 1
Small Cell Lung Cancer Signaling 0.0427973 1 1
Bladder Cancer Signaling 0.04378413 1 1
PDGF Signaling 0.04526266 1 1
Prostate Cancer Signaling 0.04723084 1 1
CDK5 Signaling 0.04919536 1 1
Supplementary table S-13 First 40 Hits of Diseases and Biofunctions p-values of comparative IPA analyses
after DNA repair filtering
Diseases and Bio Functions after filtering for
DNA repair
RS BC - unique
(p-value of
overlap)
BC – unique
(p-value of
overlap)
Fam BC – unique
(p-value of
overlap)
Repair of DNA 0.000209 0.000251 3.97E-06
DNA damage response of cells 5.51E-11 1 0.03369
Metastatic malignant neoplasm of prostate 0.039596 0.010048 7.51E-05
Susceptibility to familial breast-ovarian cancer
type 1 1 1 4.75E-08
Mismatch repair 0.011049 0.002773 0.004157
Elongation of telomeres 1 0.001028 0.001541
Tumor predisposition syndrome 1 0.00113 0.001695
Cell viability of cervical cancer cell lines 1 1 2.61E-06
Binding of DNA fragment 1 1 5.15E-06
Cell viability of fibroblast cell lines 1 1 5.56E-06
Cell proliferation of bone cancer cell lines 1.56E-05 1 1
Survival of lung cell lines 0,006969 1 0.002619
Double-stranded DNA break repair of cells 1 1 2.61E-05
Repair of tumor cell lines 1 1 3.29E-05
Carcinoma of unknown primary 0.011863 0.002979 1
Cell cycle progression 0.005529 1 0.007027
Excision repair 1 1 4.15E-05
Primary ovarian cancer 1 1 4.63E-05
Formation of nuclear foci 1 1 4.87E-05
Cell proliferation of sarcoma cell lines 5.19E-05 1 1
Formation of gamma H2AX nuclear focus 1 0.006158 0.009223
Aplastic anemia 1 1 6.05E-05
Fanconi anemia 9.78E-05 1 1
Colorectal and endometrial cancer 1 0.000103 1
Early-onset colorectal cancer 1 0.000103 1
Hereditary nonpolyposis colorectal cancer 1 0.000103 1

248
type 5
Osteosarcoma 0.000121 1 1
DNA repair-deficiency disorder 1 1 0.000124
Susceptibility to familial breast-ovarian cancer
type 2 1 1 0.000154
Sensitivity of embryonic stem cells 1 1 0.000154
Nijmegen breakage syndrome 1 1 0.000154
Binding of DNA double strand break site 1 1 0.000154
Glioma susceptibility 3 1 1 0.000154
Medulloblastoma 1 1 0.000156
Brain tumor 1 1 0.000167
Metastatic osteosarcomagenesis 0.000179 1 1
Metabolism of DNA 0.000183 1 1
Primary peritoneal cancer 0.024006 1 0.009069
Stage II breast cancer 0.000242 1 1
Supplementary table S-14 Comparison of annotation methods: cancer
GeneCards Reactome IPA
RS BC ABL1, ANKLE1, ARID5B, ASCC1, ASPH, AURKC, BAGE2, C10orf68, C17orf80, C1orf173, CLCA2,
CREB3L1, DNAH8, DNAJC27, DNMT3A, DSC2, GPR142, HELB, ITGAD, KIAA1524, L1TD1, LIMD2, LPAR2, MAP4, MAG, MICA, MICB,
NPAT, NUB1, PDE11A, POU5F1B, PTTG2, RAD51C, RBBP6, RYK, SCTR, SKA3, SRA1,
STIM1, SYTL3, TCP10L2, TMC3, TNFRSF10A
ABL1, MUC20, TNIP1 ABL1,ACADL,ARHGAP15,ARID5B,ASCC1,ASPH,AURKC,C17orf80,C7orf50,C9orf85,CAMKK2,CCDC141,CCDC1
50,CCDC168,CCDC66,CDCP2,CDKL2,CELA1,CHST15,COL6A5,CREB3L1,CRNKL1,DEFB132,DNAH7,DNAH8,D
NHD1,DNMT3A,DSG3,ERICH3,FANCL,FRG1,FRG2/FRG
2B,GPRC6A,GPRIN1,HAVCR1,HELB,HERC2,HHLA2,HRNR,HYDIN,ITGAD,KCNK16,KCNQ3,KIAA0040,KIAA152
4,KIAA1755,KIR3DL1,KMT2C,LILRA1,LRRCC1,MAMDC4,MAP4,MAPK10,MB21D2,MGA,MICA,MICB,MUC20,MYH7,MYO15A,NEB,NEIL1,NOTCH2,NPEPPS,OAS3,P
ABPC3,PCDHA3,PCDHGA10,PDE11A,PITRM1,PKD1L2,PKHD1L1,PNPLA7,PSORS1C1,PXMP2,RBBP6,SALL1,SA
MD3,SH3BGR,SIGLEC11,SKA3,SPHK1,SRA1,STIM1,TARP,TEX15,TRIM64/TRIM64B,TTN,USP49,WDR27,ZNF
527,ZNF599,ZNF844
BC AIM2,BAGE,C1QTNF8,CCBE1,CD44,CHST5,CHTF18,CLEC11A,CLTCL1,CRIPAK,DNAH2,DNMT3A
,ERBB4,FAM120A,FAT1,FGF20,KRT83,LASP1,MAGEC1,MAPRE2,MICB,MMP8,MOK,MSH6,NMB,NOP16,PTCHD3,RNASEL,RRAS,SLC22A2,SP10
0,SSTR1,SYTL3,TKTL2,TMC3,TNXB,TRIM40,TRMT2A,ULBP3
ERBB4, SOS2, CTBP2, MSH6 ,FGF20
A1BG,A2ML1,ACOT4,ADAR,AFP,AIM2,C17orf82,C1orf167,C1QTNF12,C1QTNF8,C4orf36,CASP5,CCDC150,C
D24,CD44,CEP126,CHST5,CHTF18,CIT,CLEC4M,CLTCL1,COL20A1,COL23A1,COQ2,CRIPAK,CTBP2,CTU2,CXCR3,CXorf58,CYHR1,DNAH2,DNMT3A,EIF2AK4,ERBB4,
FADS6,FAM120A,FAM151A,FAM186A,FAT1,FLG2,GGN,GPRIN1,GZMM,KIAA1683,KIR3DL1,KRTAP5-
3/KRTAP5-5,MAGEC1,MICB,MITF,MNDA,MSH6,MYH15,MYH7,
MYOF,NF1,NIPSNAP1,NLRX1,NMB,OBSCN,PADI1,PCD
HGA9,PLCH2,PRAMEF1(includesothers),PRB4,PSORS
1C1,PTCHD3,PXDNL,RAB3GAP1,RBM44,RNFT1,RP1L1,SAMD1,SAMD4A,SCN9A,SLC13A1,SLC22A2,SLC34A3,
SLCO1B3,SLFN13,SOSTDC1,SP100,SPERT,SSC5D,SSTR1,TARS2,TAS2R43,TBC1D17,TNXB,UPK3B,USP49,ZFYV
E19,ZNF527,ZNF534

249
Fam
BC
BRCA2,ANO7,C4orf6,CD22,CDC27,CDK11A,CEP290,CHP2,CRIPAK,DDX43,DDX6,DNAH7,EPPK1,
FAM120A,GPRC5A,IFLTD1,KLK14,KMT2C,LPAR3,MLX,MMP1,MOK,MSR1,MST1,NBN,NES,NOMO2,NOP16,PNLIPRP3,PSMB11,PSPH,SLC6A1
3,SLC9A1,SPANXN4,TCP10L2,TDRKH
CD22,DDX6,NBN,NEURL3 ADAM2,AGBL1,ANKRD36,APOBEC3B,ARHGEF16,BRCA2,BTN3A3,C11orf40,C7orf50,CASP8AP2,CCDC178,C
D48,CDC27,CDKL2,CLCN1,CRIPAK,CYP2A6(includesothers),DDX6,DNAH7,DNAH9,EPPK1,FAM120A,FHAD1,FOLH1B,GJA1,GLB1L3,GPRC5A,GPRC6A,HIST1H4B,IFI
44L,IGFN1,IGSF3,KCNK16,KIAA1755,KIAA1841,KIR2DS4(includesothers),KIR3DL2,KMT2C,KNTC1,LEXM,LGALS9B,LILRA1,LRG1,MMP1,MSR1,MST1,NEIL1,NES,NLR
C4,OPRM1,PCDHGA10,PDE4DIP,PNLIPRP3,PRSS3,PSPH,RIPK3,SLC22A24,SLC9A1,SNAPC2,STARD9,TAS2R43
,TDG,TLR5,TMEM247,TRIM38,TRIM58,TRIM64/TRIM64B,ZAN,ZCCHC4,ZDHHC13,ZNF527,ZNF599
Supplementary table S-15 Comparison of annotation methods: immune system GeneCards Reactome IPA
RS BC ABL1, AIRE, APOBR, BPIFB3, C6, CELA1,
CHST15, CLEC5A, CSF2RB, DCST2, DEFB132, DSG3, GPRC6A, GPRIN1, HAVCR1, HERC2,
HHLA2, KIF4B, KIR3DL1, LAX1, LFNG, LILRA1,
MICA, MICB, MROH2B, MST1L, NLRC3, NPEPPS, NUB1, OAS3, PDCD1LG2, POLR3C,
RASAL3, RBBP6, RYK, SARM1, SEC24D, SIGLEC11, SLC35A2, SPHK1, SPTBN5, STAM2,
STIM1, TARP, TNIP1, TTN, ZNF783
ABL1, AZU1, C6,
CLEC5A,CSF2RB, DEFB132, DSC2, ENPP4, HERC2, HRNR, ITGAD, KIF4B,
KIR3DL1, LAMTOR1, LILRA1, MAPK10, MAG,
MICA, MICB, MUC20, NLRC3, NPEPPS, OAS3,
P2RX7, PDCD1LG2,
POLR3C, RASAL3, RBBP6, SARM1, SEC24D,
SIGLEC11, SPTBN5, STIM1,
TUBB, XDH
ABL1, AIRE, ALPK1, ARID5B, CCDC7, CHST15, CSF2RB,
DNMT3A, FAM83E, FANCL, GPRIN1, HAVCR1, HELB, HERC2, HRNR, HYDIN, KIR3DL1, KMT2C, LPP, LRRCC1,
MAG, MICA, MICB, MMRN2, MYO15A, NEB, NEK4,
NOTCH2, NPAT, PABPC3, PDCD1LG2, PDE11A, PSIP1, SEC24D, SIGLEC11, STIM1, TARP, TNFRSF10A, TSPO2,
TTN, XDH, ZNF229, ZNF527
BC A1BG,ADAR,AIM2,AMICA1,BAGE,C1orf168,CASP5,CCBE1,CD24,CD44,CLEC11A,CLEC4M,CLTC
L1,CNP,CTSW,CXCL6,CXCR3,DENND1B,FAM132A,FLG2,GPRIN1,GZMM,IFNA5,KIR3DL1,MICB,MMP8,MNDA,MST1L,MYH15,MYH7,NLRX1,PA
2G4,PRG3,RNASEL,SCART1,SLC22A2,SP100,SSC5D,STBD1,TRAF3IP2,TRIM40,ULBP3
A1BG,ADAR,AIM2,AMICA1,CD44,CLEC4M,ERBB4,FAT
1,FGF20,FLG2,GZMM,IFNA5,KIR3DL1,MICB,MMP8,MNDA,NF1,NLRX1,PA2G4,PR
G3,RNASEL,SP100,STBD1,ULBP3
ADAR,AGRN,AIM2,C1orf167,CD24,CD44,CLEC4M,CRIPAK,CTBP2,CTSW,CXCL6,CXCR3,DNAH2,DNMT3A,EFC
AB5,FAT1,FLG2,GPRIN1,GZMM,HPS1,KCNK18,KIR3DL1,MICB,MITF,MMP8,MYOF,NF1,OBSCN,OTOA,PADI1,PSORS1C1,PVRIG,SCN9A,TNXB,TRIM40,TSPO2,ZNF49
2/ZNF98,ZNF527
Fam
BC
APOBEC3B,ARHGAP9,ASGR1,BTN3A3,C2,CD22
,CD300A,CD48,CEP290,CFHR5,CXCL6,DDX43,IFI44L,IFNK,KIR2DS4,KIR3DL2,LILRA1,LRG1,MOK,
MSR1,NBN,NLRC4,PLA2G4D,PSMB11,SPTBN5,TLR5,TRIM38,UBE2W,UBE3B,WRAP53,
ARHGAP9,BTN3A3,C2,CD2
2,CD300A,CDC27,CEP290,CFHR5,CNKSR1,HSPA6,KIR2
DS4,KIR3DL2,LILRA1,LRG1,MMP1,NLRC4,OPRM1,PRSS3,PSMB11,RIPK3,SPTBN5,
TLR5,TRIM38,UBE2W,UBE3B
ADAM2,AFAP1L1,AGBL1,ALDH1L2,C2,CD22,CD48,CF
HR5,CRELD2,CYP2A6(includesothers),DNAH9,GJA1,HSPA6,IGSF3,KIR3DL2,KMT2C,LEKR1,LEXM,MMP1,MT
MR11,NBN,NLRC4,NOMO1(includesothers),OPRM1,PDIA2,PRSS3,SLC9A1,TLR5,TRIM38,ZAN,ZNF492/ZNF9
8,ZNF599,
Supplementary table S-16 P-values of densitometric analyses performed for results discussed in 4.4.1
p-CHEK2 compared to ß-actin BJ5TA MC1 TERT MC3 TERT MC7 TERT
0 Gy/1.5 Gy 0.789 1.000 0.158 0.021
1.5 Gy/6 Gy 0.001 0.0001 0.038 < 0.0001
BJ5TA 1.5 Gy/1.5 Gy 1.000 0.272 0.106
BJ5TA 6 Gy/6 Gy 0.056 0.401 0.101
MC3 TERT 1.5 Gy/1.5 Gy 0.272 0.106 0.106
MC3 TERT 6 Gy/6 Gy 0.401 0.945 0.789
MC1 TERT 1.5 Gy/1.5 Gy 1.000 0.106 0.106

250
MC1 TERT 6 Gy/6 Gy 0.056 0.945 0.386
p-CHEK2 compared to BJ5TA MC1 TERT MC3 TERT MC7 TERT
0 Gy/1.5 Gy 0.459 0.874 0.589
1.5 Gy/6 Gy 0.555 0.968 0.303
MC3 TERT 1.5 Gy/1.5 Gy 0.631 0.642
MC3 TERT 6 Gy/6 Gy 0.394 0.593
MC1 TERT 1.5 Gy/1.5 Gy 0.631 0.379
MC1 TERT 6 Gy/6 Gy 0.394 0.848
p-KAP1 compared to ß-actin BJ5TA MC1 TERT MC3 TERT MC7 TERT
0 Gy /1.5 Gy 0.025 0.054 0.102 0.092
1.5 Gy/6 Gy 0.012 0.145 0.005 < 0.0001
BJ5TA 1.5 Gy /1.5 Gy 0.398 0.381 0.078
BJ5TA 6 Gy/6 Gy 0.817 0.293 0.545
MC3 TERT 1.5 Gy/1.5 Gy 0.381 0.133 0.338
MC3 TERT 6 Gy/6 Gy 0.293 0.156 0.501
MC1 TERT 1.5 Gy/1.5 Gy 0.398 0.133 0.025
MC1 TERT 6 Gy/6 Gy 0.817 0.156 0.087
p-KAP1 compared to BJ5TA MC1 TERT MC3 TERT MC7 TERT
0 Gy/1.5 Gy 0.855 0.373 0.040 1.5 Gy/6 Gy 0.395 0.584 0.885
MC3 TERT 1.5 Gy/1.5 Gy 0.551 0.262
MC3 TERT 6 Gy/6 Gy 0.872 0.558
MC1 TERT 1.5 Gy/1.5 Gy 0.551 0.219
MC1 TERT 6 Gy/6 Gy 0.872 0.664

251
Supplementary table S-17 P-values of γH2AX foci corresponding to Figure 31
BJ5TA MC1 TERT MC3 TERT MC7 TERT
0 Gy/1 Gy 1 h γH2AX foci 0.023 0.004 0.002 0.002
0 Gy/1 Gy 1 h γH2AX foci 0.0002 0.002 < 0.0001 < 0.0001
1 Gy 1 h/1 Gy 6 h γH2AX foci 0.008 0.280 0.020 0.005
1 Gy 1 h/1 Gy 6 h γH2AX foci 0.001 0.194 0.005 0.002
1 Gy 6 h/1 Gy 24 h γH2AX foci 0.007 0.093 0.024 0.031
1 Gy 6 h/1 Gy 24 h γH2AX foci 0.003 0.090 0.020 0.008
1 Gy 24 h/1 Gy 48 h γH2AX foci 0.400 0.046 0.536 0.292
1 Gy 24 h/1 Gy 48 h γH2AX foci 0.111 0.010 0.203 0.222
BJ5TA 0 Gy/0 Gy yH2AX Foci 0.334 0.648 0.163
BJ5TA 1 Gy 1 h/1 Gy 1 h yH2AX Foci 0.193 0.255 0.207
BJ5TA 1 Gy 6 h/1 Gy 6 h yH2AX Foci 0.454 0.879 0.065
BJ5TA 1 Gy 24 h/1 Gy 24 h yH2AX Foci 0.069 0.160 0.641
BJ5TA 1 Gy 48 h/1 Gy 48 h yH2AX Foci 0.273 0.389 0.359
MC3 TERT 0 Gy/0Gy yH2AX Foci 0.648 0.400 0.125
MC3 TERT 1 Gy 1 h/1 Gy 1 h yH2AX Foci 0.255 0.655 0.699
MC3 TERT 1 Gy 6 h/1 Gy 6 h yH2AX Foci 0.879 0.546 0.248
MC3 TERT 1 Gy 24 h/1 Gy 24 h yH2AX Foci 0.160 0.137 0.467
MC3 TERT 1 Gy 48 h/1 Gy 48 h yH2AX Foci 0.389 0.214 0.122
MC1 TERT 0 Gy/0 Gy yH2AX Foci 0.334 0.400 0.267
MC1 TERT 1 Gy 1 h/1 Gy 1 h yH2AX Foci 0.193 0.655 0.955
MC1 TERT 1 Gy 6 h/1 Gy 6 h yH2AX Foci 0.454 0.546 0.166
MC1 TERT 1 Gy 24 h/1 Gy 24 h yH2AX Foci 0.069 0.137 0.119
MC1 TERT 1 Gy 48 h/1 Gy 48 h yH2AX Foci 0.273 0.214 0.056

252
Supplementary table S-18 P-values of 53BP1 foci corresponding to Figure 31
BJ5TA MC1 TERT MC3 TERT MC7 TERT
BJ5TA 0 Gy/0 Gy 53BP1 Foci 0.279 0.615 0.275
BJ5TA 1 Gy 1 h /1 Gy 1 h 53BP1 Foci 0.201 0.423 0.155
BJ5TA 1 Gy 6 h/1 Gy 6 h 53BP1 Foci 0.449 0.966 0.147
BJ5TA 1 Gy 24 h/1 Gy 24 h 53BP1 Foci 0.014 0.960 0.574
BJ5TA 1 Gy 48 h/1 Gy 48 h 53BP1 Foci 0.342 0.668 0.045
MC3 TERT 0 Gy/0 Gy 53BP1 Foci 0.615 0.699 0.719
MC3 TERT 1 Gy 1 h /1 Gy 1 h 53BP1 Foci 0.423 0.329 0.119
MC3 TERT 1 Gy 6 h/1 Gy 6 h 53BP1 Foci 0.966 0.525 0.433
MC3 TERT 1 Gy 24 h/1 Gy 24 h 53BP1 Foci 0.960 0.004 0.489
MC3 TERT 1 Gy 48 h/1 Gy 48 h 53BP1 Foci 0.668 0.817 0.071
MC1 TERT 0 Gy/0 Gy 53BP1 Foci 0.279 0.699 0.928
MC1 TERT 1 Gy 1 h /1 Gy 1 h 53BP1 Foci 0.201 0.329 0.705
MC1 TERT 1 Gy 6 h/1 Gy 6 h 53BP1 Foci 0.449 0.525 0.220
MC1 TERT 1 Gy 24 h/1 Gy 24 h 53BP1 Foci 0.014 0.004 0.072
MC1 TERT 1 Gy 48 h/1 Gy 48 h 53BP1 Foci 0.342 0.817 0.002
Supplementary figure S-24 Predicted effects of the mutations in ABL1 and FANCL of patient MC7 on protein
sequence Gene sequence to protein sequence translation was computed with ApE-A plasmid Editor. Arrows indicate mutation sites
and squares show resulting stop codons. Western blot results of BJ5TA and MC/ TERT cells using two different antibodies
directed against the kinase domain of ABL1 are shown in the upper panel on the right-hand side. S. e.= short exposure,
l. e.= long exposure. For further information about the antibodies see subsection 3.1.2.1. Publications relating to the FANCL
mutation are listed below the lower panel.
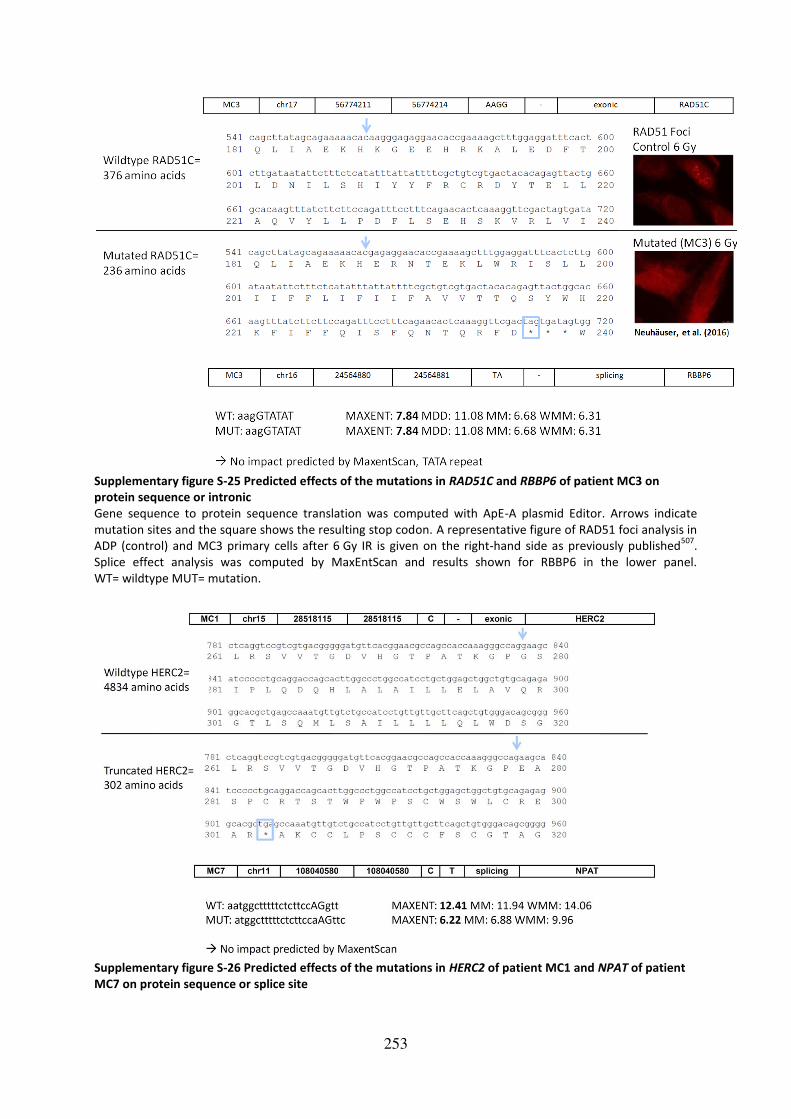
253
Supplementary figure S-25 Predicted effects of the mutations in RAD51C and RBBP6 of patient MC3 on
protein sequence or intronic
Gene sequence to protein sequence translation was computed with ApE-A plasmid Editor. Arrows indicate
mutation sites and the square shows the resulting stop codon. A representative figure of RAD51 foci analysis in
ADP (control) and MC3 primary cells after 6 Gy IR is given on the right-hand side as previously published507
.
Splice effect analysis was computed by MaxEntScan and results shown for RBBP6 in the lower panel.
WT= wildtype MUT= mutation.
Supplementary figure S-26 Predicted effects of the mutations in HERC2 of patient MC1 and NPAT of patient
MC7 on protein sequence or splice site

254
Gene sequence to protein sequence translation was computed with ApE-A plasmid Editor. Arrows indicate
mutation sites and the square shows the resulting stop codon. Splice effect analysis was computed by
MaxEntScan and results shown for NPAT in the lower panel. WT= wildtypem MUT= mutation.
Supplementary figure S-27 RAD51 foci analysis in primary and immortalized RS cells RAD51 foci were counted 4 h after IR with 6 Gy in primary RS BC fibroblasts MC3 and MC7 in comparison to the SV40
immortalized wildtype ADP fibroblasts and median values of two biological and two technical replicates are shown on the
left-hand side of the graphs and marked by obs 1= observer one507
. Results of ADP are given in dark green , MC3 primary
cells in blue and MC7 primary cells in yellow, respectively. RAD51 foci analyzed with the same protocol but by a different
observer (obs 2, namely Katharina Stemwedel) in TERT immortalized RS BC fibroblasts of patients MC1 (light blue), MC3
(dark blue) and MC7 (yellow). The TERT immortalized wildtype fibroblast cell line BJ5TA served as control.

255
Supplementary figure S-28 CSA in 6well plates with different coating Colony survival assays fixed 14 days after no (0 Gy) or 4 Gy IR. BJ5TA, MC3 TERT and MC7 TERT cells were grown in seeding
numbers of 1500 cells per 6-well for unirradiated and 3000 cells per 6-well for irradiated plates. Uncoated, gelatin-coated
and collagen-coated 6-wells were used and colonies stained with crystal violet. Medium without and including hygromycin
(10µg/ml= 10H) was applied to the cells during culture. Arrows indicate areas of higher density cell growth, however, not
resembling colonies.

256
Supplementary figure S-29 No colony growth in 6-well plates and change of morphology of MC3 TERT cells Colony survival assay results with unirradiated BJ5TA, MC3 TERT and MC7 TERT cells seeded in uncoated 6-well plates in
two different concentrations low D= low densitiy = 1500 cells and high D= high densitiy = 3000 cells (panel A). Panels B and
C show corresponding cells after 3 weeks in culture in T25 flasks, with arrows in panel C indicating MC3 TERT colonies
growing in the middle of the flasks, as supplementation to the finding of panel F (upper figure), which shows MC3 TERT cells
growing predominantly at the edges of the flask without irradiation when seeded in higher densities. Cell numbers MC3
TERT and BJ5TA in panels B and C, respectively= 2000, MC3 TERT in panel F= 5000 cells. Panels D and E show magnification
of panels C and F and display microscopic views of colonies of unirradiated MC3 TERT cells growing in the middle and edge
of the flask, respectively. The arrow in the upper picture of panel F indicates the area of magnification shown in the lower
picture of panel F that depicts increased granularity of cells. Scale= 100µm.
Supplementary table S-19 Raw data pilot experiment senescence after irradiation
BJ5TA 0 Gy BJ5TA
4 Gy 24 h
BJ5TA
4 Gy 48 h
BJ5TA
4 Gy 7 d
MC1 TERT
0 Gy
MC1 TERT
4 Gy 24 h
MC1 TERT
4 Gy 48 h
MC1 TERT
4 Gy 7 d
59.6 39.3 37.5 32.5 36.6 32 22.6 18.6
47.1 26.3 20.9 29.6 45.7 40.6 28.2 15.7
MC3 TERT
0 Gy
MC3 TERT
4 Gy 24 h
MC3 TERT
4 Gy 48 h
MC3 TERT
4 Gy 7 d
MC7 TERT
0 Gy
MC7 TERT
4 Gy 24 h
MC7 TERT
4 Gy 48 h
MC7 TERT
4 Gy 7 d
45.3 15 14.7 12.2 43.4 20.9 21,3 9.7
49.2 28.1 17 10.3 60.9 40.0 26.9 19.9
Supplementary table S-20 Raw data senescence after irradiation in BJ5TA and MC3 TERT cells BJ5TA
0 Gy
BJ5TA
4 Gy 24 h
BJ5TA
4 Gy 48 h
BJ5TA
4 Gy 7 d
BJ5TA
4 Gy 9 d
MC3 TERT
0 Gy
MC3 TERT
4 Gy 24 h
MC3 TERT
4 Gy 48 h
MC3 TERT
4 Gy 7 d
MC3 TERT
4 Gy 9 d
59.6 39.3 37.5 32.5 45.3 15 14.7 12.2
40.3 34.9 33.5 16.3 36.1 24.5 22 7.9 7.2 2.3
50.7 45.7 32.7 44.5 24.9 25.8 23.4 11.9 10.1 7.2
45.6 39.5 31.2 39.8 24.5 22.8 21.3 9.4 6.7 9.3
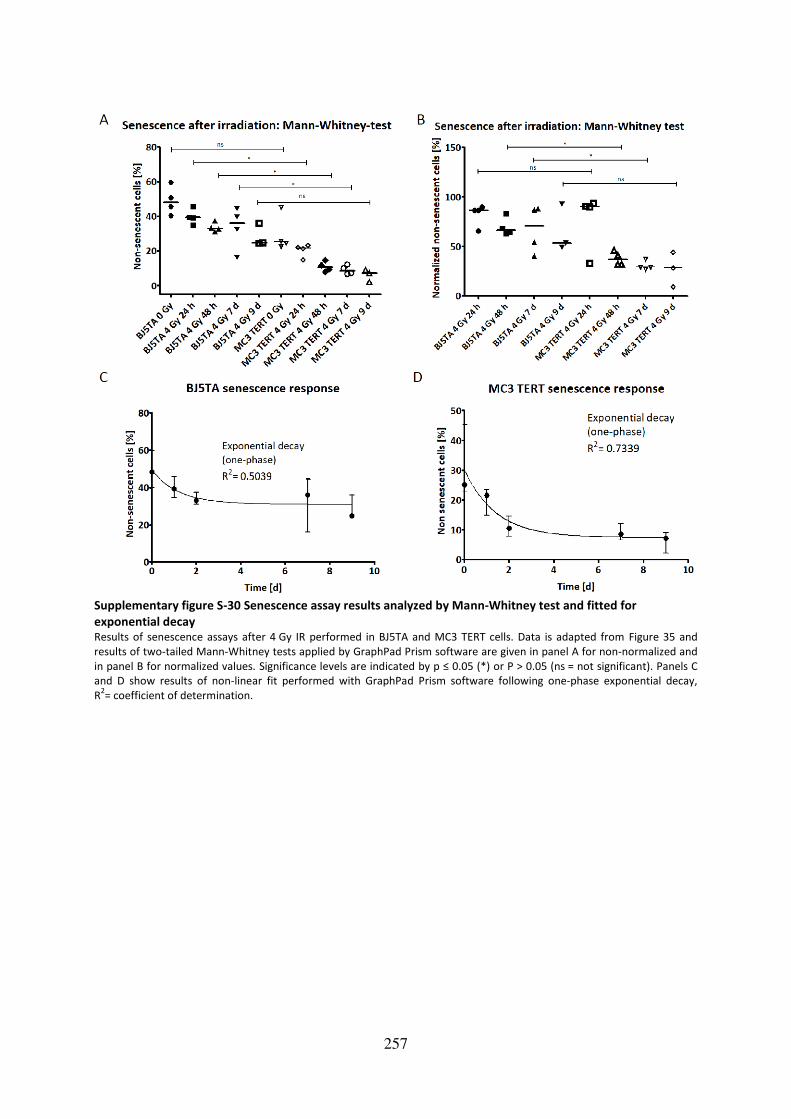
257
Supplementary figure S-30 Senescence assay results analyzed by Mann-Whitney test and fitted for
exponential decay Results of senescence assays after 4 Gy IR performed in BJ5TA and MC3 TERT cells. Data is adapted from Figure 35 and
results of two-tailed Mann-Whitney tests applied by GraphPad Prism software are given in panel A for non-normalized and
in panel B for normalized values. Significance levels are indicated by p ≤ 0.05 (*) or P > 0.05 (ns = not significant). Panels C
and D show results of non-linear fit performed with GraphPad Prism software following one-phase exponential decay,
R2= coefficient of determination.


259
9 Acknowledgement
Herrn Dr. Thilo Dörk-Bousset danke ich für die Übernahme der Erstbetreuung und die
Bereitstellung des interessanten Themas. Insbesondere danke ich ihm für die Verarbeitung
und Bereitstellung der Exomsequenzierungsdaten. Der große Freiraum, der mir während der
Durchführung dieser Arbeit gewährt wurde, hat maßgeblich zu meiner wissenschaftlichen
sowie persönlichen Entwicklung beigetragen.
Herrn Professor Dr. Christiansen danke ich für die Übernahme des Erstreferats und für die
fachliche und persönliche Unterstützung. Ebenfalls vielen Dank an das Team der
Radioonkologie für die Unterstützung bei der Bestrahlung der Zellen.
Ich danke Frau Professor Dr. Tamura-Niemann für die Übernahme der Zweitbetreuung und
die produktiven Diskussionen während der Projektbesprechungen. Ebenfalls vielen Dank an
Dr. Alexandra Koch für die Bereitstellung der ABL-Antikörper.
Dr. Natalia Bogdanova danke ich für ihre Unterstützung auf wissenschaftlicher Ebene im
Rahmen der Hilfe bei der PCR-Amplifikation und Sequenzierung und für die interessanten
Diskussionen. Dr. Kristine Bousset danke ich ebenfalls für die Hilfe bei der Bewältigung
alltäglicher Schwierigkeiten des Laboralltags und die vielen fachlichen Diskussionen. Dr.
Bianca Schröder-Heurich, Dr. Sonja Helbig, Dr. Anna Otte, Hoda Radmanesh und Catharina
Melzer danke ich für das freundliche Arbeitsklima, das das Arbeiten im Labor auf fachlicher
und persönlicher Ebene bereichert hat. Ebenso danke ich Peter Schürmann, Britta Wieland
und dem gesamten Team der Molekularen Gynäkologie für das angenehme Arbeitsklima und
die Hilfe im Labor. Britta Wieland danke ich im Besonderen für Ihre Unterstützung während
der schwierigen Etablierung des Immortalisierungsprotokolls und Julia Enssen sowie Louisa
Weinhold für ihre Hilfe bei der Validierung der vielen Mutationen. Vielen Dank an Maike
Willers für Ihre Untersuchungen während ihres Praktikums und insbesondere Katharina
Stemwedel für die optimale Zusammenarbeit und das positive Arbeitsklima während der
Durchführung ihrer Bachelorarbeit und anschließender HiWi-Tätigkeit.
Der Arbeitsgruppe von Dr. Robert Geffers am Helmholtz-Zentrum in Braunschweig danke ich
für die Kooperation die Durchführung der Exomsequenzierung betreffend. Vielen Dank an
Prof. Dr. Axel Schambach für die Bereitstellung des Nukleofektors. Professor Dr. Detlev
Schindler, PD Dr. Kerstin Borgmann, Dr. Margret Rave-Fränk und Prof. Dr. Markus Stumm
danke ich für die Bereitstellung der Patientenzellen.
Vielen herzlichen Dank an meine lieben Eltern, die mich während all meiner Vorhaben stets
unterstützt haben. Ich danke Euch für Euer immer offenes Ohr und insbesondere dafür, dass
Ihr mir immer wieder Mut gemacht und mir beigebracht habt, dass es sich stets lohnt, stark
zu bleiben und nicht aufzugeben. Ein besonderer Dank gilt Dir, Holger, für Deine
bedingungslose Unterstützung nicht nur während der Höhen und Tiefen dieser Arbeit,
sondern auch dafür, dass Du in den letzten 10 Jahren immer für mich da warst. Mit deiner
positiven Art hast Du mir stets Kraft gegeben. Vielen Dank natürlich auch an meine Freunde
für die tolle Unterstützung, ihre Anteilnahme und Motivation, die mich durch diese Arbeit
geführt haben.
261
Hannover, den 29.11.2017
Publications and contributions
Journal article:
Pfeifer K, Schürmann P, Bogdanova N, Neuhäuser K, Kostovska IM, Plaseska-Karanfilska D,
Park-Simon TW, Schindler D, Dörk T Frameshift variant FANCL*c.1096_1099dupATTA is not
associated with high breast cancer risk. Clinical Genetics 2016:n/a-n/a. doi: 10.1111/cge.12837.
Conference paper and oral presentation:
Neuhäuser K, Bogdanova N, Bhuju S, Geffers R, Christiansen H, Dörk T, Rave-Fränk M
Mutation in FANCO/RAD51C, but not FANCL, is Associated with Clinical and Chromosomal
Radiosensitivity. Experimentelle Strahlentherapie und Klinische Strahlenbiologie, 2016:31-37.
Conference paper and poster presentation:
Neuhäuser K, Bogdanova N, Borgmann K, Dahm-Daphi J, Schindler D, Christiansen H, Dörk T Evidence for elevated basal levels of TPT1, but no induction after irradiation, in
lymphoblastoid cells from individuals with increased clinical radiosensitivity.
Experimentelle Strahlentherapie und Klinische Strahlenbiologie, 2017:24-30.
Bogdanova N, Jguburia N, Neuhäuser K, Wieland B, Stamm G, Wacker F, Christiansen H, Dörk
T Chromosomal radiosensitivity of breast epithelial cells and lymphocytes in repeated
diagnostic CT scans. International Wolfsberg Meeting on Molecular Radiation
Biology/Oncology, Ermatingen, Switzerland, 2017:36.
Manuscripts:
Neuhäuser K, Küper L, Bogdanova N, Willers M, Wieland B, Christiansen H, Dörk T.
Assessment of the role of TPT1 in ATM signaling and breast cancer susceptibility. Radiation
research (accepted with major revision requirements)
Bogdanova N, Jguburia N, Neuhäuser K, Wieland B, Stamm G, Wacker F, Christiansen H,
Dörk T. Chromosomal radiosensitivity of breast epithelial cells and lymphocytes in
repeated diagnostic CT scans. Radiology (in review)

262
Erklärung
Hiermit erkläre ich, dass ich die Dissertation (“Impact of the DNA damage response in clinical
and cellular radiosensitivity of cancer patients“) selbstständig verfasst habe. Bei der
Anfertigung wurden folgende Hilfen Dritter in Anspruch genommen:
Dr. Thilo Dörk-Bousset Betreuung der Doktorarbeit
Ich habe keine entgeltliche Hilfe von Vermittlungs- bzw. Beratungsdiensten
(Promotionsberater oder anderer Personen) in Anspruch genommen. Niemand hat von mir
unmittelbar oder mittelbar entgeltliche Leistungen für Arbeiten erhalten, die im
Zusammenhang mit dem Inhalt der vorgelegten Dissertation stehen. Ich habe die
Dissertation an folgender Institution angefertigt:
Klinik für Strahlentherapie und Spezielle Onkologie, Arbeitsgruppe Experimentelle Radioonkologie,
Medizinische Hochschule Hannover
Die Dissertation wurde bisher nicht für eine Prüfung oder Promotion oder für einen
ähnlichen Zweck zur Beurteilung eingereicht. Ich versichere, dass ich die vorstehenden
Angaben nach bestem Wissen vollständig und der Wahrheit entsprechend gemacht habe.
Ort, Datum Unterschrift

263
Electronic appendix
The electronic appendix includes a pdf version of this thesis, which is enclosed on a CD.