Using Informatics to Improve Medical Device Safety ... - AAMI
Upload
khangminh22Category
view
2download
0
1
Medical Device Recall Report
FY2003 to FY2012
Food and Drug Administration Center for Devices and Radiological Health
Office of Compliance Division of Analysis and Program Operations

2
1. Executive Summary As part of a broader initiative on recalls and public health, CDRH reviews and systematically assesses medical device recall information.1 We created this report to better understand how CDRH and industry can better address the public health risks posed by unsafe or defective medical devices.
1 A medical device recall means a firm's removal or correction of a marketed medical device that the FDA considers to be in violation of the laws it administers and against which the agency would initiate legal action, e.g., seizure. 21 CFR 7.3(g)
Medical device recall information was collected, reviewed, and analyzed for the period encompassing FY 2003 through FY 2012. Concerted efforts to improve the quality and safety of medical devices on the part of both CDRH and industry has resulted in greater numbers of recalls reported - and greater benefit for the public health. Some of the significant findings are listed below:
• The annual number of medical device recalls increased by 97 percent from FY 2003 to FY 2012. We attribute this increase to: enhanced awareness by device firms, including those that were cited for reporting violations; and specific CDRH efforts to improve medical device safety.
• The annual number of Class I recalls increased in part due to CDRH and industry efforts to improve performance of devices historically associated with high numbers of device problems, such as ventilators, infusion pumps, and external defibrillators.
• In the last 3 years, CDRH reduced the average classification times for high risk Class I recalls by 9 days and Class II by 26 days. By significantly reducing the time it takes us to process recalls, CDRH assures that medical device problems are effectively addressed and underlying problems resolved.
• The most frequent causes for recalls are related to device design, software, and non-conforming material or component issues. If industry and CDRH can address these problems jointly, we may be able to prevent as many as 400 recalls each year.
This report is part of a broader initiative to optimize the public health benefits of timely and effective recalls, reduce the number and frequency of recalls, and streamline the recall process. CDRH has taken several actions to improve our recall program, including:
• Systemic and systematic analysis of recall information; • Establishment of a Recall Process Improvement team, which increased the
number of on-time recall classifications and improved recall communication; • Implementation of improved methods for communicating recall information, data
and trends to stakeholders; • Improved internal processes to determine, describe, and incorporate recall root
causes in premarket reviews. These processes include a review to prevent problems being perpetuated due to recalls of predicate devices.
The underlying principles, such as classification of a recall’s risk, have not changed. With this report, we continue our efforts to strengthen the recall process, assure safe and effective device performance, and publicly share medical device recall information.

3
2. Introduction This report provides a data-driven overview of medical device recalls during a ten-year period – FY 2003 through FY 2012. It was prompted by the Recall Process Improvement (RPI) initiative, begun by CDRH in 2010.2
2 Recall communication, http://www.fda.gov/Training/CDRHLearn/ucm162015.htm#recalls. 3 Medical Devices: FDA Should Enhance Its Oversight of Recalls, GAO-11-468, Jun 14, 2011. 4 Food and Drug Administration Safety and Innovation Act, PUBLIC LAW 112–144—JULY 9, 2012.
Goals of the RPI included enhancing public health by decreasing recall processing times and improving recall communications through increasing collaboration between CDRH and the Office of Regulatory Affairs (ORA), streamlining the recall process, analyzing recall data, using these analyses to inform our regulatory decision making across the total product lifecycle, and providing the results of our analyses to device manufacturers and other members of the public to improve the overall quality and safety of medical devices. The review was also undertaken to address concerns raised by the Government Accountability Office (GAO) and Congress concerning FDA’s oversight of medical device recalls. In its June 2011 report, the GAO recommended that FDA enhance its oversight of medical device recalls.3 The GAO recommended that FDA create a program to routinely and systematically assess medical device recall information and use this information to proactively identify strategies for mitigating health risks presented by defective or unsafe devices. The GAO also recommended that FDA perform an assessment to identify trends in the numbers and types of recalls, the devices most frequently being recalled, and the underlying causes of recalls. Subsequently, in 2012, Congress directed FDA to establish a program to “routinely and systematically assess” information regarding device recalls and to use that information “to proactively identify strategies for mitigating health risks presented by defective or unsafe devices.”4 This Medical Device Recall Report provides the following data analyses for the 10-year period from FY 2003 – FY 2012:
Time Trends in Classification and Terminations • Recall Classification Timelines • Recall Termination Timelines • Reduction in Recall Backlog
Recall Counts, Trends, and Descriptive Analysis
• Recall Counts for Events and Products • Recall Trend Analyses • Recalls by Medical Specialty • Most Frequently Recalled Device Procodes (Medical Device Types) • Time on Market of Recalled Devices • Recalling Firms, Domestic and Foreign • Regulatory Violations Cited • Recall Classifications (Review for Severity and Risk) • Recall Causes
3. Time Trends in Classification and Terminations

4
As defined at Title 21, Code of Federal Regulations (CFR), 7.3(g), “Recall means a firm's removal or correction of a marketed product that the Food and Drug Administration considers to be in violation of the laws it administers and against which the agency would initiate legal action, e.g., seizure.” A Class I recall is a situation in which there is a reasonable probability that use of or exposure to a violative product will cause serious adverse health consequences or death. A Class II recall is a situation in which use of or exposure to a violative product may cause temporary or medically reversible adverse health consequences, or where the probability of serious adverse health consequences is remote. Also, a Class III recall is a situation in which use of, or exposure to, a violative product is not likely to cause adverse health consequences.5
5 Definitions of the recall classes are located at 21 CFR 7.3 (m). 6 In rare cases, such as when a device firm in uncooperative, FDA may perform a mandatory recall. However, all medical device recalls during this report period were performed on a voluntary basis by the firms.
The initiation, classification, and termination process of a medical device recall requires interaction and collaboration amongst the medical device firm, ORA, and CDRH (Figure 1). The recall process typically begins with the device manufacturer becoming aware of the issue warranting a recall action, initiating the recall, and notifying FDA’s ORA district office (Phase I in Figure 1).6 The ORA district office issues a 24-hour alert to CDRH and a recall classification recommendation (Phase II). CDRH conducts a final review and classification (Phase III). Recalls are publicly posted online within a day of classification. Figure 1:
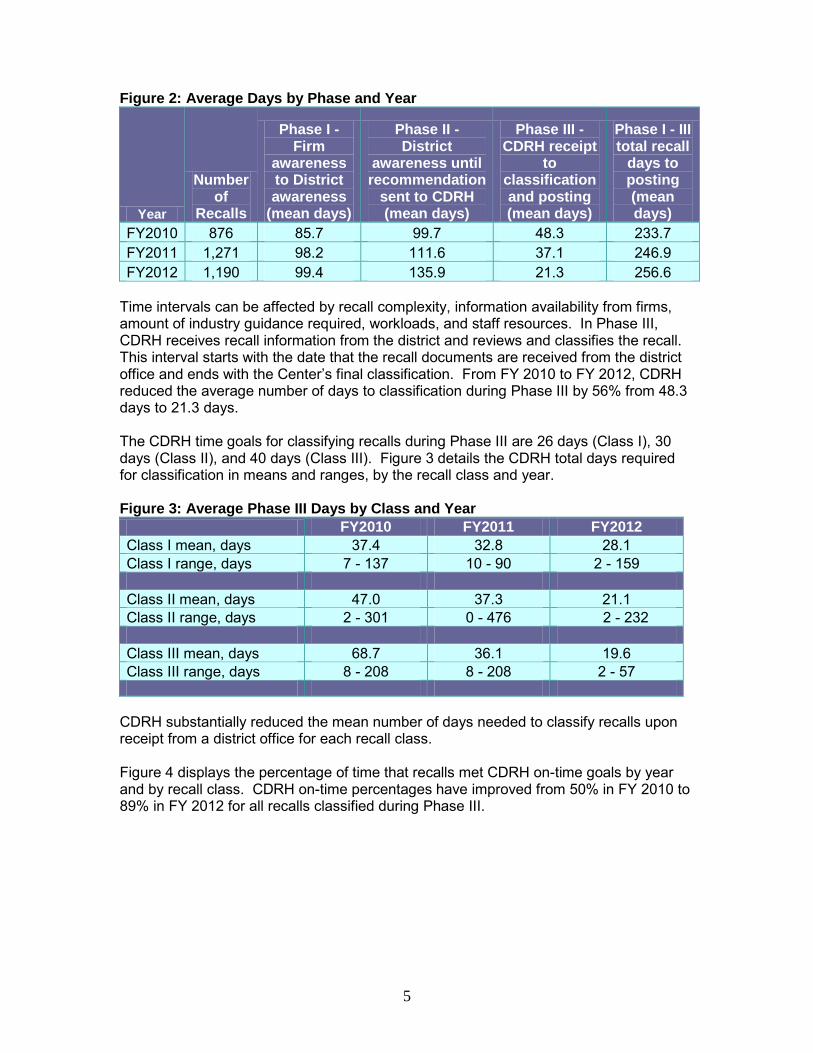
The average number of days from firm awareness of the need to conduct a recall to FDA’s posting of the recall classification for FY 2010 – FY 2012 is displayed in Figure 2. The annual average time from firm awareness to recall posting during this time period ranged from 233.7 days to 256.6 days.
5
Figure 2: Average Days by Phase and Year
Year
Number of
Recalls
Phase I - Firm
awareness to District awareness
(mean days)
Phase II - District
awareness until recommendation
sent to CDRH (mean days)
Phase III - CDRH receipt
to classification and posting (mean days)
Phase I - III total recall
days to posting (mean days)
FY2010 876 85.7 99.7 48.3 233.7 FY2011 1,271 98.2 111.6 37.1 246.9 FY2012 1,190 99.4 135.9 21.3 256.6
Time intervals can be affected by recall complexity, information availability from firms, amount of industry guidance required, workloads, and staff resources. In Phase III, CDRH receives recall information from the district and reviews and classifies the recall. This interval starts with the date that the recall documents are received from the district office and ends with the Center’s final classification. From FY 2010 to FY 2012, CDRH reduced the average number of days to classification during Phase III by 56% from 48.3 days to 21.3 days. The CDRH time goals for classifying recalls during Phase III are 26 days (Class I), 30 days (Class II), and 40 days (Class III). Figure 3 details the CDRH total days required for classification in means and ranges, by the recall class and year. Figure 3: Average Phase III Days by Class and Year FY2010 FY2011 FY2012 Class I mean, days 37.4 32.8 28.1 Class I range, days 7 - 137 10 - 90 2 - 159 Class II mean, days 47.0 37.3 21.1 Class II range, days 2 - 301 0 - 476 2 - 232 Class III mean, days 68.7 36.1 19.6 Class III range, days 8 - 208 8 - 208 2 - 57
CDRH substantially reduced the mean number of days needed to classify recalls upon receipt from a district office for each recall class. Figure 4 displays the percentage of time that recalls met CDRH on-time goals by year and by recall class. CDRH on-time percentages have improved from 50% in FY 2010 to 89% in FY 2012 for all recalls classified during Phase III.

6
Figure 4: Percentage of Recalls Meeting Timelines
0%10%
20%30%40%50%
60%70%80%
90%100%
Class I Class II Class III
FY2010FY2011FY2012
• Significant decreases in CDRH days needed to classify recalls are seen for each year and all recall classes.
• CDRH improved the percentage of time that recall classifications met established time goals in 2012 when compared to the previous two years.
Recalls are terminated when FDA determines that manufacturers have completed all reasonable efforts to remove or correct the product in accordance with the recall strategy, and that proper disposition or correction has been made commensurate with the degree of hazard of the recalled product (Phase IV). CDRH terminates only Class I recalls (ORA district offices are responsible for terminating Class II and Class III recalls). CDRH implemented systematic process improvements and significantly reduced the time intervals between recall completion and termination for Class I recalls from FY 2009 through FY 2012 (Figure 5). Specifically, while Class I recall terminations took nearly 600 days in FY 2009, they were completed in 15 days, on average, in FY 2012 Q4. Figure 5: Number of Completed Class I Recalls and Time to Termination
0
5
10
15
20
25
30
35
40
45
50
Num
ber o
f rec
alls
0
100
200
300
400
500
600
700
Day
s un
til te
rmin
atio
n
# Recalls completed 20 44 8 10 11 7 13 14 9 9
Avg days to termination 597 351 317 201 154 68 105 45 77 15
FY 2009
FY 2010
FY 2011 Q1
FY 2011 Q2
FY 2011 Q3
FY 2011 Q4
FY 2012 Q1
FY 2012 Q2
FY 2012 Q3
FY 2012 Q4

7
4. Recall Counts, Trends, and Descriptive Analysis All CDRH Recalls affecting medical devices and radiation-emitting products during the 10-year study period were evaluated and included in the analysis.7 Figure 6 shows medical device and radiation-emitting product8 recall counts by the year of recall classification and class of recall. Total counts for all classes of recalls in the fiscal year are shown below each column.
7 The data used in these analyses are from ORA’s Recall Enterprise System (RES) as well as CDRH’s Center Tracking System (CTS) and recall database (RECS). RES and RECS became operational in the fall of 2002. These systems were developed to track, classify, and terminate recalls. RES contains a standard set of information for recalls of all FDA-regulated products. CTS and RECS contain information specific to medical devices and radiological products. In 2010, CDRH replaced RECS with CTS and additional data became available for analysis. 8 CDRH recall counts include both medical devices and radiation-emitting products (e.g., microwaves and laser pointers). Between FY 2010-2012, recalls for radiation-emitting products represented 1.3% of the total numbers of recalls. Recalls for radiation-emitting products are always Class II by policy.
Figure 6: CDRH Recall Counts by Fiscal Year and Class
Key Observations for Figure 6:
• Overall annual recall counts increased 97%, from 604 recalls in FY 2003 to 1,190 recalls in FY 2012.
• Increases were observed in the annual number of both Class I and II recalls. o Class I recalls represented 1% of recalls in FY 2003 (7 recalls), but
comprised nearly 5% (57 recalls) in FY 2012. o The annual number of Class II recalls more than doubled from FY 2003 to
FY 2012. o The number of Class III recalls declined by approximately 35% during the
study period. Recall classification is guided by FDA’s determination of the risk associated with the device failure.

8
Recall Events and Products A single recall event may include more than one product, type, or model of a device. The majority of recalls include one product, although some contain many more. For example, a recent recall for a device used in orthopedic surgery contained 12 different-sized products9. Each product in a recall event is assigned a separate Z-number – an identification number – which is posted to FDA’s public website. The number of units per product recalled also varies.
9 http://www.accessdata.fda.gov/scripts/cdrh/cfdocs/cfRES/res.cfm?id=109865
Figure 7 shows the annual number of recall events and the number of recalled products. Since 2003, while the number of recall events and the number of products recalled has increased, the mean number of products per recall event has remained generally between 2 and 3 and has not significantly changed. Figure 7: Recall events and Product Numbers by Fiscal Year
Increase in Number of Recalls Two specific industry segments account for the majority of the observed increase in the number of FDA-classified recalls that occurred during the study period:
• Manufacturers of radiology devices; and • Manufacturers that receive 21 CFR 806 observations following FDA inspections.
We believe that firms receiving inspectional 806 obervations subsequently improved their recall reporting to FDA. Radiology device recalls increased in 2010 following enhanced media and FDA attention, relating to concerns aimed at reduction of unnecessary radiation exposure.
Increased reporting from these two manufacturer categories accounted for most of the overall increase in reported recalls since 2003. Figure 8 shows the numbers for all recalls by year for each of the last 10 years. It also shows the parallel and adjusted number of recalls - after removal of the radiology recalls and those from firms with 806 observations. Without inclusion of the radiology and 806-related recalls, the annual rate for recall increases becomes 3% over the study period, as indicated by the chart line.

9
The overall recall increase from 2003 to 2012 is 27% (530 to 671), as compared to 97% when all recalls are included. Figure 8: Adjusted Recall Counts FY 2003 - FY 2012
During inspections, FDA investigators examine whether firms have appropriately reported or documented corrections and removals as required by 21 CFR 806. Each year, about 46 firms receive observations related to 21 CFR 806 violations. During the study period, 364 unique establishments, representing less than 2% of the medical device firms registered with FDA, were observed to have 21 CFR 806 reporting deficiencies. Some firms received more than one 806 observation over the study period. As shown in Figure 9, during the study period, firms that received 21 CFR 806 observations also account for a significant number of reported recalls in subsequent years. Over half of the increase in recalls since 2003 can be attributed to the recalls reported by establishments that were observed to have 21 CFR 806 reporting issues. Firms cited for 806 observations were also likely to be cited for quality system regulation observations during the study period. In fact, 97% of firms cited for 806 observations were also cited for quality system observations. Figure 9: Number of Recalls Reported by Firms with 21 CFR 806 Observations
10
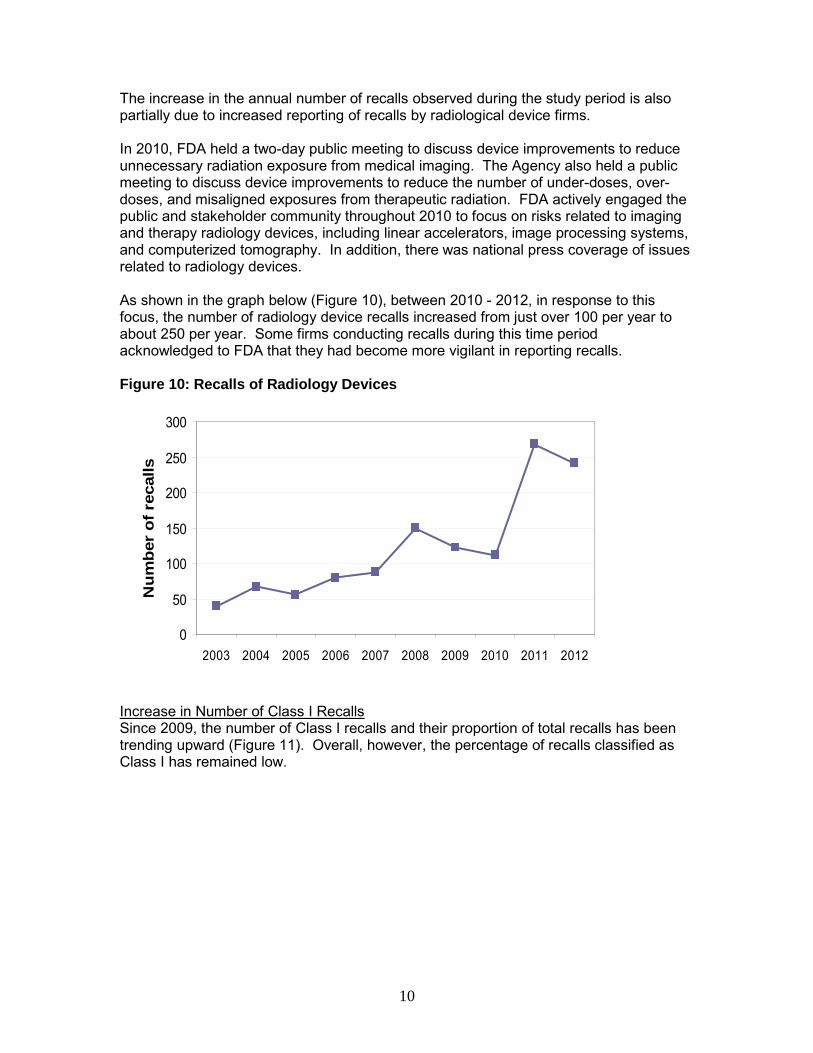
The increase in the annual number of recalls observed during the study period is also partially due to increased reporting of recalls by radiological device firms. In 2010, FDA held a two-day public meeting to discuss device improvements to reduce unnecessary radiation exposure from medical imaging. The Agency also held a public meeting to discuss device improvements to reduce the number of under-doses, over-doses, and misaligned exposures from therapeutic radiation. FDA actively engaged the public and stakeholder community throughout 2010 to focus on risks related to imaging and therapy radiology devices, including linear accelerators, image processing systems, and computerized tomography. In addition, there was national press coverage of issues related to radiology devices. As shown in the graph below (Figure 10), between 2010 - 2012, in response to this focus, the number of radiology device recalls increased from just over 100 per year to about 250 per year. Some firms conducting recalls during this time period acknowledged to FDA that they had become more vigilant in reporting recalls. Figure 10: Recalls of Radiology Devices
0
50
100
150
200
250
300
2003 2004 2005 2006 2007 2008 2009 2010 2011 2012
Num
ber
of r
ecal
ls
Increase in Number of Class I Recalls Since 2009, the number of Class I recalls and their proportion of total recalls has been trending upward (Figure 11). Overall, however, the percentage of recalls classified as Class I has remained low.

11
Figure 11: Class I Recall Counts and Percentages FY 2003 - FY 2012
0
10
20
30
40
50
60
0.0%
1.0%
2.0%
3.0%
4.0%
5.0%
6.0%
Class I recall counts 7 24 26 22 27 13 32 49 50 57
All recalls % Class I 1.1% 3.8% 4.5% 3.3% 4.1% 1.6% 4.1% 5.6% 3.9% 4.8%
2003 2004 2005 2006 2007 2008 2009 2010 2011 2012
The most frequent device procodes10 for Class I recalls were:
10 A product code (or procode) identifies the generic category of a device for FDA and is based upon the medical device product classifications designated under 21 CFR Parts 862-892. There are over 6,000 procodes.
1. FRN PUMP, INFUSION 2. MKJ AUTOMATED EXTERNAL DEFIBRILLATORS 3. CBK VENTILATOR, CONTINUOUS 4. NBW SYSTEM, TEST, BLOOD GLUCOSE, OTC 5. DYB INTRODUCER, CATHETER
6. LKK PUMP, INFUSION, IMPLANTED Risk to the public can be observed from the reports received for death and injury. When a firm submits a recall or correction to FDA, the number of deaths and serious injuries caused by defective devices are reported at that time. These numbers were compared between the Class I recalls and a Class II matched-sample group for the FY 2003 – FY 2012 period. Deaths were more often associated with Class I recalls (25% of the time) than with Class II recalls (1% of the time). As part of its project to improve recall classification efficiency and communication effectiveness, CDRH implemented new internal classification policies for selected products with high recall volumes including AEDs, infusion pumps, ventilators, and vascular catheters to improve consistency in risk assessments and recall classifications for these products. As noted above, in 2010, CDRH began focusing efforts on improving quality and safety for radiology devices due to identified safety concerns. In addition, in 2010, CDRH expanded its focus to additional targeted device areas with high-volume adverse event reports and recurrent recalls, including automatic external defibrillators (AEDs), infusion pumps, and ventilators. Recalls of these devices represent nearly 30% of the Class I recalls over the FY 2003 – FY 2012 period. From FY 2009 to FY 2012, the annual number of Class I recalls increased by 25. As shown in Figure 12, these few product areas account for 80% of the observed increase and are likely attributable to the

12
increased focus and attention of both CDRH and industry on improving product quality in these areas. Figure 12: Class I Recalls for Specific Device Types
0
5
10
15
20
25
30
2003 2004 2005 2006 2007 2008 2009 2010 2011 2012
Num
ber o
f rec
alls Ventilators
RadiologyAEDSInfusion pumpsAll
Comparison of the Class I to Class II recalls over the study period revealed different distributions by medical specialty. Most of the Class I recalls were in the anesthesia, cardiovascular, chemistry, and general hospital specialties (Figure 13). The radiology, orthopedic, general hospital, and cardiovascular areas had the most Class II recalls. Figure 13: Comparative Distribution of Class I and II Recalls FY 2003- FY 2012
0
10
20
30
40
50
60
70
80
90
HO CV AN CH GU MI SU RA NE OP HE OR EN IM PM DE OB PA TX
Cla
ss I
0
200
400
600
800
1,000
1,200
Cla
ss II
Class I Class II
AN- Anesthesiology CH- Chemistry CV- Cardiovascular DE- Dental EN- Ear, Nose and Throat GU- Gastro and Urology HE- Hematology
HO- General Hospital IM- Immunology MI- Microbiology NE- Neurology OB-OB and Gynecology OP- Ophthalmic OR- Orthopedics
PA- Pathology PM- Physical Medicine RA - Radiology SU- General Surgery TX- Toxicology

13
All Recalls by Medical Specialty Recalls are associated with distinct medical specialties. Figure 14 displays the six specialties (radiology, cardiovascular, general hospital, general surgery, orthopedics, and chemistry) that account for the majority of all recalls. As previously noted, the most significant increase was observed in the number of recalls for radiology medical devices, related to previously identified media focus and better monitoring for and reporting of problems by industry. Figure 14: Recalls by Medical Specialty
0
50
100
150
200
250
300
2003 2004 2005 2006 2007 2008 2009 2010 2011 2012
CardiovascularChemistryGeneral SurgeryGeneral HospitalOrthopedicsRadiology
There are thirteen other medical specialties comprising the remainder of the recalls (listed with Figure 13). Most Frequently Recalled Device Procodes During the study period, the ten most common device procodes associated with recalls (0.15% of all procodes) accounted for 20% of device recall events (see Figure 15). CDRH has, where appropriate, taken action to address industry-wide product performance issues and challenges that may impact device quality, safety, and effectiveness. Figure 15: Most Commonly Recalled Procodes
Recalls Pro code Product description Specialty
176 IYE ACCELERATOR, LINEAR, MEDICAL Radiology 153 LLZ SYSTEM, IMAGE PROCESSING, RADIOLOGICAL Radiology 130 FRN PUMP, INFUSION Gen Hospital 115 JAK SYSTEM, X-RAY, TOMOGRAPHY, COMPUTED Radiology 109 MKJ AUTOMATED EXTERNAL DEFIBRILLATORS Cardiovascular 106 GEI ELECTROSURGICAL, CUTTING & COAGULATION & ACCESSORIES Surgery 101 JJE ANALYZER, CHEMISTRY, FOR CLINICAL USE Chemistry 98 JQP CALCULATOR/DATA PROCESSING MODULE, FOR CLINICAL USE Chemistry 97 GKZ COUNTER, DIFFERENTIAL CELL Hematology 96 JWH PROSTHESIS, KNEE, PATELLOFEMOROTIBIAL, SEMI-CONSTRAINED Orthopedic

14
Additional analysis of the most frequently recalled procode: IYE Linear Accelerators In some cases, CDRH conducts more detailed analyses of recall data to better understand identified trends. For example, further trend analysis of the most frequently recalled radiological device (linear accelerators – procode IYE, Figure 16) demonstrates that software failures cause the majority of recalls associated with these devices (Figure 17). Among these recalls due to software issues, system compatibility (interoperability between treatment planning and treatment delivery systems), user interfaces (human factors), and dose calculation (clinical decision support software) are the most frequently cited causes, accounting for more than two thirds of these recalls. Figure 16: Recalls for Procode IYE
2 1 2 5
15
25
158
65
38
0
10
20
30
40
50
60
70
2003 2004 2005 2006 2007 2008 2009 2010 2011 2012
Rec
all n
umbe
r
Figure 17: Causes of Linear Accelerator Recalls
0 20 40 60 80 100 120 140
Packaging
Assembly
Labeling
Electrical
Installation
Mechanical
Software
Number of recalls
CDRH has identified each of these areas (interoperability, human factors, and dose calculations) as cross-cutting issues with important implications for the safe and effective use of linear accelerators. CDRH believes attention from both the media and CDRH prompted manufacturers of radiology devices to be more aware of potential issues related to unnecessary radiation exposure. While this resulted in an increase in recall reporting, CDRH is also aware that industry is working to identify and incorporate new safety features into equipment, which will likely improve device performance over time. For the most part, the radiology

15
problems have not been with the technology in itself, but rather with clinical use of the technology. Analysis of All Recalls of Recently-Cleared Devices Seeing significant increases in medical device complexity and software-related recalls, CDRH evaluated whether devices cleared recently were more likely to be recalled than devices with more time in the marketplace. Between FY 2004 and FY 2012, the proportion of recalls affecting products within one year of FDA marketing authorization held constant at approximately 10%. Likewise, devices on the market for more than 15 years consistently represent approximately 10% of recalled devices (Figure 18). Figure 18: Age of Recalled Devices: time on market
0%10%20%30%40%50%60%70%80%90%
100%
2004 2005 2006 2007 2008 2009 2010 2011 2012
first 365 days
1 to 5 years
5 to 10 years
10 to 15 years
>15 years
No trends were identified with regard to the time on market and device recalls.
Foreign vs. Domestic Manufacturing From FY 2010 - FY 2012, US-based manufacturing firms have accounted for approximately 80% of device recalls. Review of manufacturer registration data over the same three-year period shows that slightly less than 50% of registered manufacturing firms are domestic (Figure 19). Figure 19: Proportion of Foreign and Domestic Manufacturer Registration and Recall
US % of Mfg Registration
Foreign % of Mfg
Registration
US Mfg % of
Recalls Foreign Mfg % of Recalls
FY 2010 48.4% 51.6% 81.8% 18.2%
FY 2011 47.6% 52.4% 82.7% 17.3%
FY 2012 46.7% 53.3% 79.5% 20.5% The observed differences between the domestic and foreign recall rates may be attributable to better recall reporting by domestic firms, under-reporting of recalls by foreign firms, and the foreign registration of firms not actually shipping devices to the US. In addition, domestic firms are more likely to undergo inspection than foreign firms – and as indicated earlier in the report, certain types of inspectional observations are associated with an increase in recall reporting by the cited firms. FDA is participating in

820.50 Purchasing controls 19 366 29 820.130 Device packaging 0 377 5 820.120 Device labeling and related subparts 2 271 29 820.25 Personnel 0 159 2 820.100 Corrective and preventive action 0 122 7
Recall reasons Number Nonconforming Material/Component 429 Software Design(Device) 429 Device Design 425 Process Control 266 Component Design/Selection 144
16
a Medical Device Single Audit Program that is expected to increase the percentage of foreign firms from which FDA receives inspectional information.
Recall Regulatory Violations For each recall, FDA determines the associated Federal Food, Drug, and Cosmetic Act (FDCA) violation. Regulatory violations for medical device recalls classified from FY 2010 – FY 2012 were counted and ranked. The top ten, all related to Quality System Regulations (QSR), are listed by recall class in Figure 20. A recall may have more than one regulatory violation. A small number (<2%) of CDRH recall events come under the Electronic Product Radiation Control (EPRC) authority of 21 CFR Part 1003 - 1004, instead of 21 CFR 806. These EPRC regulations require manufacturers of radiation-emitting electronic products to notify FDA and purchasers upon discovery of a defect or failure to meet applicable performance standards (contained in 21 CFR Parts 1010 - 1050). The regulations also apply to radiation-emitting medical devices (e.g., x-ray systems and medical lasers) and when such defects or failures occur, they are deemed a recall event, and are always Class II by policy. Figure 20: Recall Regulations
Number Regulation Subpart Title Class
I Class
II Class
III 820.30 Design controls and related subparts 703 1,759 36
820.80 Receiving, in-process, and finished device acceptance 204 1,068 61
820.70 Production and process controls and subparts 119 830 58 820.90 Nonconforming product 17 415 28 820.75 Process Validation 16 390 30
Reasons for recalls Recall causes assigned by FDA were tabulated for recalls classified during FY 2010 – FY 2012. These are listed in Figure 21 in decreasing frequency of use. Note that each recall has only one recall cause determination and uses FDA current terminology and processes. Figure 21:

17
Employee Error 134 Labeling Mixups/Errors 99 Under Investigation by the Firm 81 Process Design 77 Packaging Process Control 76 Error In Labeling 59 Packaging 58 Mix-up of Material/Components 49 Material/Component Contamination 47 Labeling Design 42 Radiation Control for Health and Safety Act 41 Labeling False And Misleading 39 Component Change Control 37 Equipment Maintenance 31 Process Change Control 31 Software Change Control 24 Software Design (Process) 22 PMA- Illegally Marketed 21 Labeling Change Control 19 Packaging Design/Selection 18 Release of Material/Component Prior to Receiving Test results 15 Expiration Dating 15 Vendor Change Control 12 Packaging Change Control 8 Manufacturing Material Removal 8 Storage 7 Environmental Control 6 Unknown/Undetermined by the Firm 6 Finished Device Change Control 4 Reprocessing Controls 2
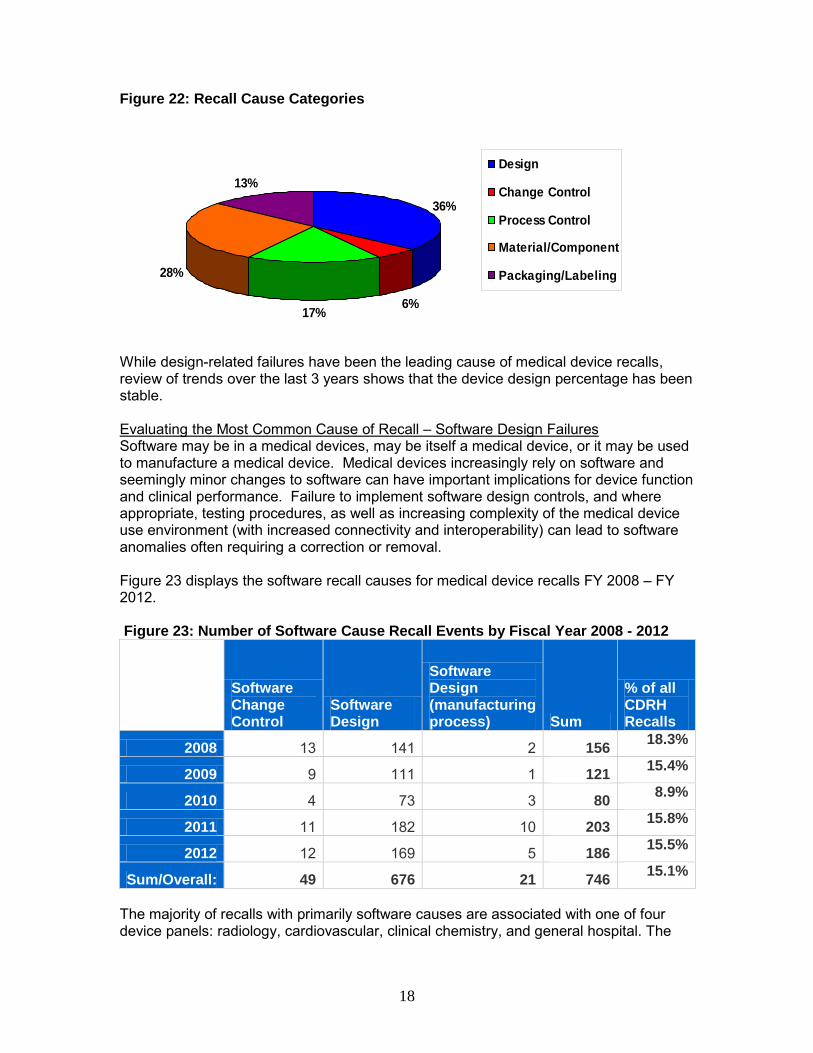
Individual recall causes were aggregated for review purposes into broader categories when related to: design (includes device and software design), change control (includes component, labeling, vendor, process, packaging, software, or finished-device change control), process control (includes process, packaging process, process design or reprocessing controls), material/component (includes nonconforming material or component, component design or selection, material contamination, material mix-up, removal or release of material prior to testing), and packaging/labeling (includes labeling mix-up, packaging, packaging design/selection, expired dating, labeling design, labeling false and misleading, or error in labeling). These categories are shown in Figure 22 as proportions of reasons for the recalls classified in FY 2010 - FY 2012.
18
Figure 22: Recall Cause Categories
36%
6%17%
28%
13%Design
Change Control
Process Control
Material/Component
Packaging/Labeling
While design-related failures have been the leading cause of medical device recalls, review of trends over the last 3 years shows that the device design percentage has been stable. Evaluating the Most Common Cause of Recall – Software Design Failures Software may be in a medical devices, may be itself a medical device, or it may be used to manufacture a medical device. Medical devices increasingly rely on software and seemingly minor changes to software can have important implications for device function and clinical performance. Failure to implement software design controls, and where appropriate, testing procedures, as well as increasing complexity of the medical device use environment (with increased connectivity and interoperability) can lead to software anomalies often requiring a correction or removal. Figure 23 displays the software recall causes for medical device recalls FY 2008 – FY 2012. Figure 23: Number of Software Cause Recall Events by Fiscal Year 2008 - 2012
Software Change Control
Software Design
Software Design (manufacturing process) Sum
% of all CDRH Recalls
2008 13 141 2 156 18.3%
2009 9 111 1 121 15.4%
2010 4 73 3 80 8.9%
2011 11 182 10 203 15.8%
2012 12 169 5 186 15.5%
Sum/Overall: 49 676 21 746 15.1%
The majority of recalls with primarily software causes are associated with one of four device panels: radiology, cardiovascular, clinical chemistry, and general hospital. The

19
table below lists the top twenty procodes found in software-related recalls with the associated specialty area. Figure 24: Devices with Software Cause Recalls
Procode Specialty DescriptionLLZ Radiology SYSTEM, IMAGE PROCESSING, RADIOLOGICAL
IYE Radiology ACCELERATOR, LINEAR, MEDICAL
MUJ Radiology SYSTEM,PLANNING,RADIATION THERAPY TREATMENT
JAK Radiology SYSTEM, X-RAY, TOMOGRAPHY, COMPUTED
JQP Chemistry CALCULATOR/DATA PROCESSING MODULE, FOR CLINICAL USE
JJE Chemistry ANALYZER, CHEMISTRY (PHOTOMETRIC, DISCRETE), CLINICAL USE
IYN Radiology SYSTEM, IMAGING, PULSED DOPPLER, ULTRASONIC
MHX Cardiovascular
OR ALARMS)
KPS Radiology SYSTEM, TOMOGRAPHY, COMPUTED, EMISSION
GKZ Hematology COUNTER, DIFFERENTIAL CELL
IYO Radiology SYSTEM, IMAGING, PULSED ECHO, ULTRASONIC
FRN General Hospital PUMP, INFUSION
LNH Radiology SYSTEM, NUCLEAR MAGNETIC RESONANCE IMAGING
LNX General Hospital MEDICAL COMPUTERS AND SOFTWARE
MQB Radiology SOLID STATE X-RAY IMAGER (FLAT PANEL/DIGITAL IMAGER)
IZI Radiology SYSTEM, X-RAY, ANGIOGRAPHIC
JAA Radiology SYSTEM, X-RAY, FLUOROSCOPIC, IMAGE-INTENSIFIED
KPR Radiology SYSTEM, X-RAY, STATIONARY
MKJ Cardiovascular AUTOMATED EXTERNAL DEFIBRILLATORS (NON-WEARABLE)
LWS Cardiovascular IMPLANTABLE CARDIOVERTER DEFIBRILLATOR (NON-CRT)
NSX General Hospital SOFTWARE, TRANSMISSION AND STORAGE, PATIENT DATA
• The proportion of recalls identified with a software cause remained consistent at 15% between FY 2010 - FY 2012.
5. Conclusion Analysis of recall data can assist FDA in:
• Refining and explaining observed trends; • Understanding common causes of device failures; • Identifying risks posed by a specific device type; • Identifying and prioritizing areas for process improvement; • Enhancing risk-based inspections of firms; and • Providing outreach, guidance, and workshops for external stakeholders.
The recall data analysis suggests that the increase in the number of recalls between FY 2003 and FY 2012 can be largely attributed to improved reporting by firms that were cited with 806 reporting violations and by manufacturers of radiology devices. We have seen greater reporting by industry and a more concerted effort by CDRH and industry working together to improve the quality and safety of medical devices.

20
The number of Class I recalls increased primarily in key device-type initiative areas, which were developed by FDA in response to identified patient safety concerns. Based on the data we have reviewed and our experience, we believe the increase is the result of increased awareness prompted by targeted interactions with industry and individual manufacturers. Moreover, these interactions triggered efforts within industry to improve safety of devices, which are expected to improve device performance over time. FDA will continue to use recall information to better inform our decision-making across the total product lifecycle, provide guidance to industry, and help identify firms and device areas for inspection and appropriate, targeted interventions. Review and analysis of recall data helps to guide both FDA and industry in strategically focusing efforts that will improve the quality of medical devices, thereby improving patient health outcomes.
Copyright © 2022 FDOKUMEN