MEDC) Jakarta, 20 December 2021 - Medco Energi
20
PT Medco Energi Internasional Tbk (IDX Ticker: MEDC) Jakarta, 20 December 2021
-
Upload
khangminh22 -
Category
Documents
-
view
3 -
download
0
Transcript of MEDC) Jakarta, 20 December 2021 - Medco Energi
PT Medco Energi Internasional Tbk
(IDX Ticker: MEDC)
Jakarta, 20 December 2021
2
The following presentation has been prepared by PT Medco Energi Internasional Tbk. (the “Company”) and contains certain projections, plans, business strategies, policies of the Company and industry data in which the Company operates in, which could be
treated as forward-looking statements within the meaning of applicable law. Any forward-looking statements, by their nature, involve risks and uncertainties that could prove to be incorrect and cause actual results to dif fer materially from those expressed
or implied in these statements. The Company does not guarantee that any action, which may have been taken in reliance on this document will bring specific results as expected. The Company disclaims any obligation to revise forward-looking statements to
reflect future events or circumstances.
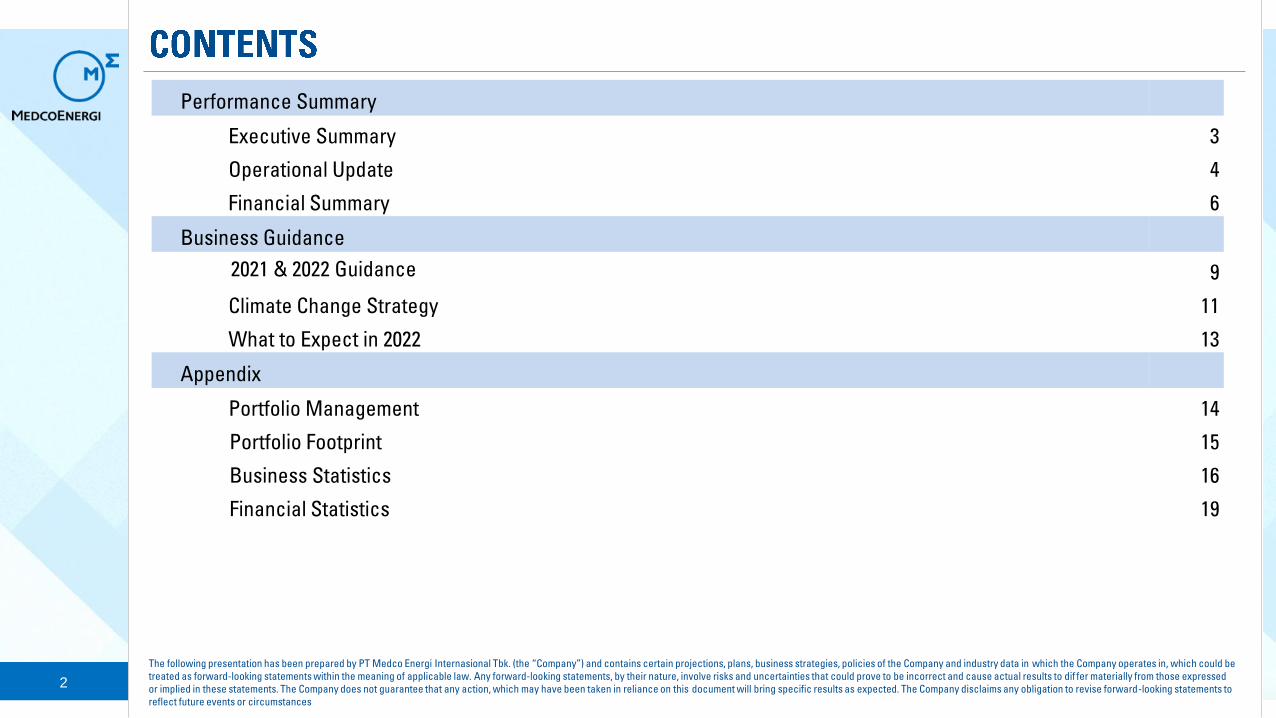
Performance Summary
Executive Summary 3
Operational Update 4
Financial Summary 6
Business Guidance
2021 & 2022 Guidance 9
Climate Change Strategy 11
What to Expect in 2022 13
Appendix
Portfolio Management 14
Portfolio Footprint 15
Business Statistics 16
Financial Statistics 19
3
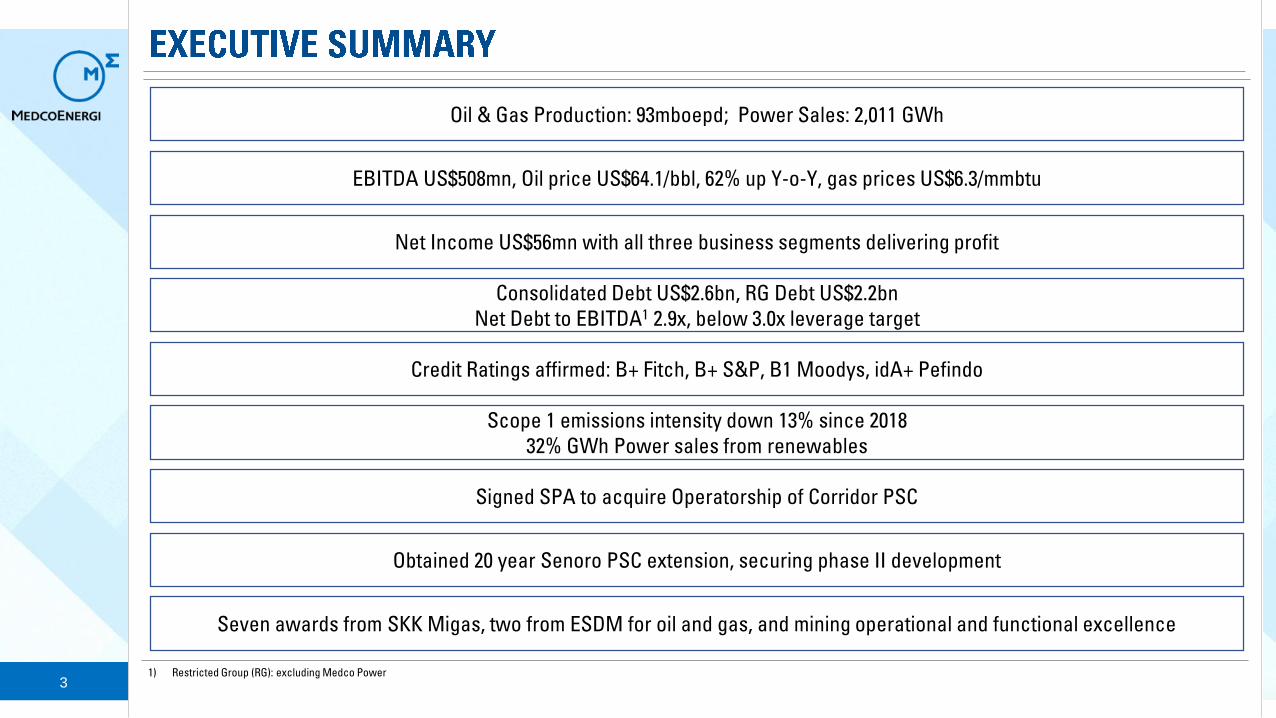
Scope 1 emissions intensity down 13% since 2018
32% GWh Power sales from renewables
Oil & Gas Production: 93mboepd; Power Sales: 2,011 GWh
Consolidated Debt US$2.6bn, RG Debt US$2.2bn
Net Debt to EBITDA1 2.9x, below 3.0x leverage target
Credit Ratings affirmed: B+ Fitch, B+ S&P, B1 Moodys, idA+ Pefindo
EBITDA US$508mn, Oil price US$64.1/bbl, 62% up Y-o-Y, gas prices US$6.3/mmbtu
Signed SPA to acquire Operatorship of Corridor PSC
Net Income US$56mn with all three business segments delivering profit
1) Restricted Group (RG): excluding Medco Power
Obtained 20 year Senoro PSC extension, securing phase II development
Seven awards from SKK Migas, two from ESDM for oil and gas, and mining operational and functional excellence
4
• Oil and gas production 93 mboepd, down 7% YoY due to extended downtime in the 2Q and low domestic
gas demand during Indonesia’s Covid-19 lockdowns.
• Expect domestic gas demand will continue to improve in 2022
• Cash costs US$9.3/boe. Full year guidance remains below US$10/boe
Project updates
• Progressing Gas developments in South Natuna Sea Block B first gas: Hiu by Q2-2022, Belida Extension
by Q4-2022, Bronang in Q4-2023 and Forel oil development Q4-2023
• Secured a 20 Year Contract Extension for Senoro effective from December 2027
• Signed a GSA to continue gas supply from South Sumatra Block to PT Pupuk Sriwijaya
• Signed an agreement to acquire ConocoPhillips Indonesian assets with expected completion Q1-22
5
46%
52%
49%
54%
48%
51%
297
526
645 638 638 638
600 1,245
2016 2017 2018 2019 2020 2021 Development
Pipeline
Split by
Generation
Source
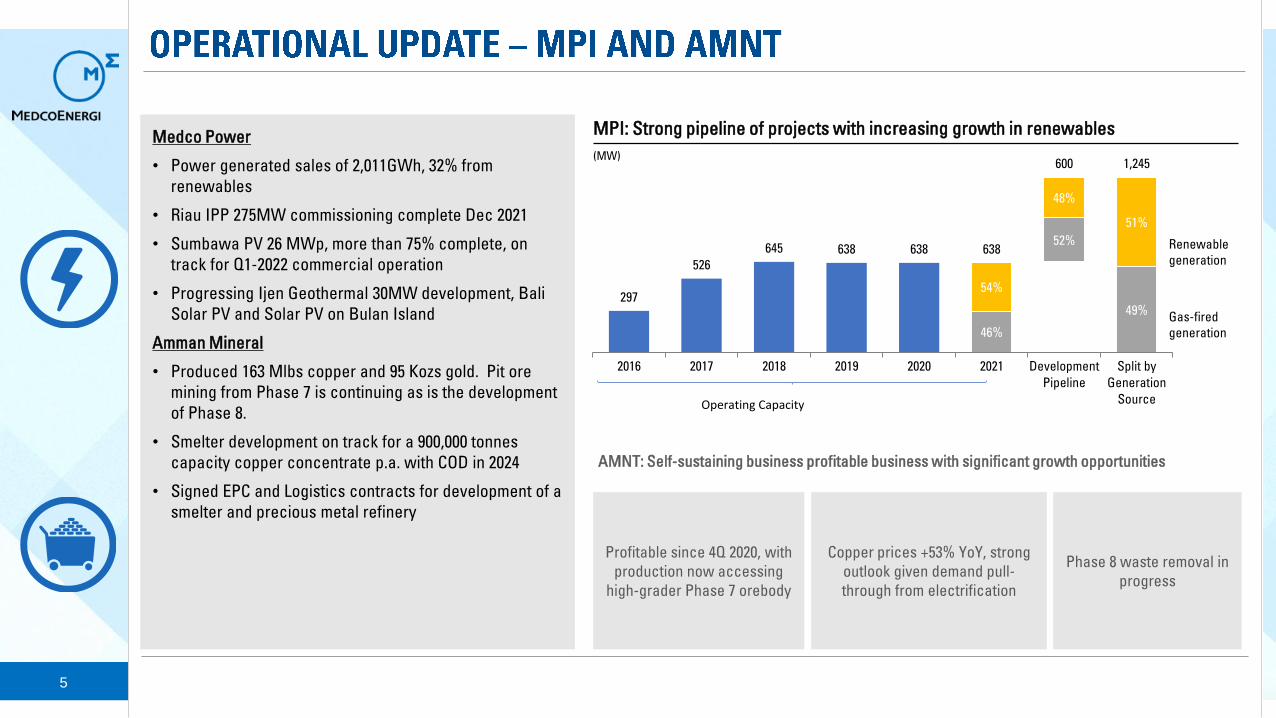
Medco Power
• Power generated sales of 2,011GWh, 32% from
renewables
• Riau IPP 275MW commissioning complete Dec 2021
• Sumbawa PV 26 MWp, more than 75% complete, on
track for Q1-2022 commercial operation
• Progressing Ijen Geothermal 30MW development, Bali
Solar PV and Solar PV on Bulan Island
Amman Mineral
• Produced 163 Mlbs copper and 95 Kozs gold. Pit ore
mining from Phase 7 is continuing as is the development
of Phase 8.
• Smelter development on track for a 900,000 tonnes
capacity copper concentrate p.a. with COD in 2024
• Signed EPC and Logistics contracts for development of a
smelter and precious metal refinery
Profitable since 4Q 2020, with
production now accessing
high-grader Phase 7 orebody
Copper prices +53% YoY, strong
outlook given demand pull-
through from electrification
Phase 8 waste removal in
progress
AMNT: Self-sustaining business profitable business with significant growth opportunities
Renewable
generation
Gas-fired
generation
Operating Capacity
MPI: Strong pipeline of projects with increasing growth in renewables
(MW)
6
• EBITDA US$508mn, Oil price US$64.1/bbl, 62% up Y-o-Y, gas prices US$6.3/mmbtu
• Profit in all three business segment, Oil & Gas US$140mn, Power US$21mn and AMNT US$48mn
following price improvement and Phase 7 performance. Profits were offset by headquarters and
financing charges. Consolidated Net Income US$56mn
• 9M-2021 Capex US$53mn, consistent with lower activity during COVID-19 restrictions, now ramping up
but will be under full year guidance of US$215mn
• Consolidated Debt US$2.6bn, down 10% Y-o-Y. Restricted Group Debt1 US$2.2bn and Net Debt1 US$1.8bn
• Net Debt to EBITDA1 2.9x below target due to improved EBITDA and deleveraging. Medco will use
excess cash to continue to reduce debt Q-o-Q. Average loan life 4.8 years
• Strong liquidity, cash & cash equivalents US$548mn. 2021 IDR Bonds1 maturities secured in escrow
• Climate change strategy published, continued progress on ESG and reporting in alignment with TCFD2
1) Restricted Group (RG): excluding Medco Power
2) Task Force on Climate-Related Financial Disclosure
7
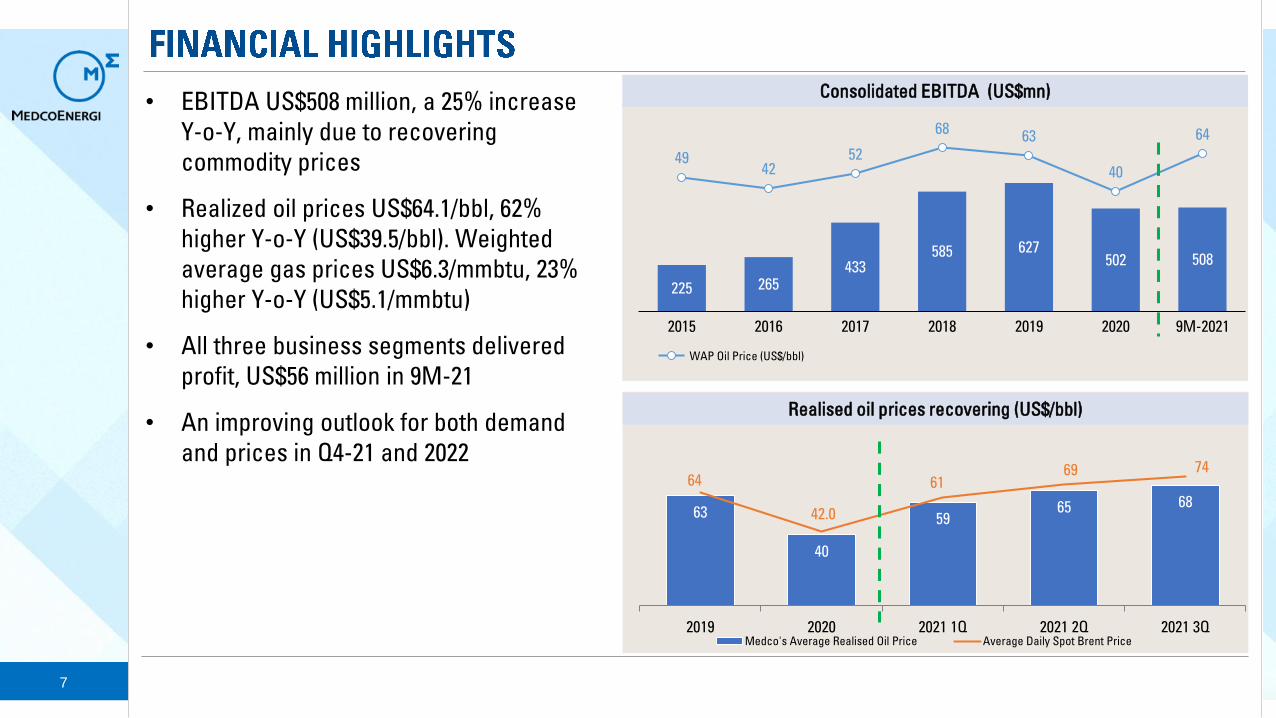
• EBITDA US$508 million, a 25% increase
Y-o-Y, mainly due to recovering
commodity prices
• Realized oil prices US$64.1/bbl, 62%
higher Y-o-Y (US$39.5/bbl). Weighted
average gas prices US$6.3/mmbtu, 23%
higher Y-o-Y (US$5.1/mmbtu)
• All three business segments delivered
profit, US$56 million in 9M-21
• An improving outlook for both demand
and prices in Q4-21 and 2022
225 265433
585 627502 508
4942
52
6863
40
64
20202015 9M-20212016 2017 2018 2019
WAP Oil Price (US$/bbl)
Consolidated EBITDA (US$mn)
63
40
59 65 68
64
42.0
61 69 74
2019 2020 2021 1Q 2021 2Q 2021 3QMedco's Average Realised Oil Price Average Daily Spot Brent Price
Realised oil prices recovering (US$/bbl)
8
Consolidated Debt and Production (US$ bn)
Restricted Group1 Debt (US$ bn)
Debt numbers includes unamortized cost and excludes derivatives
1.9 1.92.2
2.52.3 2.2
1.81.5
1.72.0 2.0 1.8
6.7
3.6 3.34.2
2.9
20202016 2017
2.82
2018 20192 9M-21Gross Debt Net Debt Net Debt/EBITDA
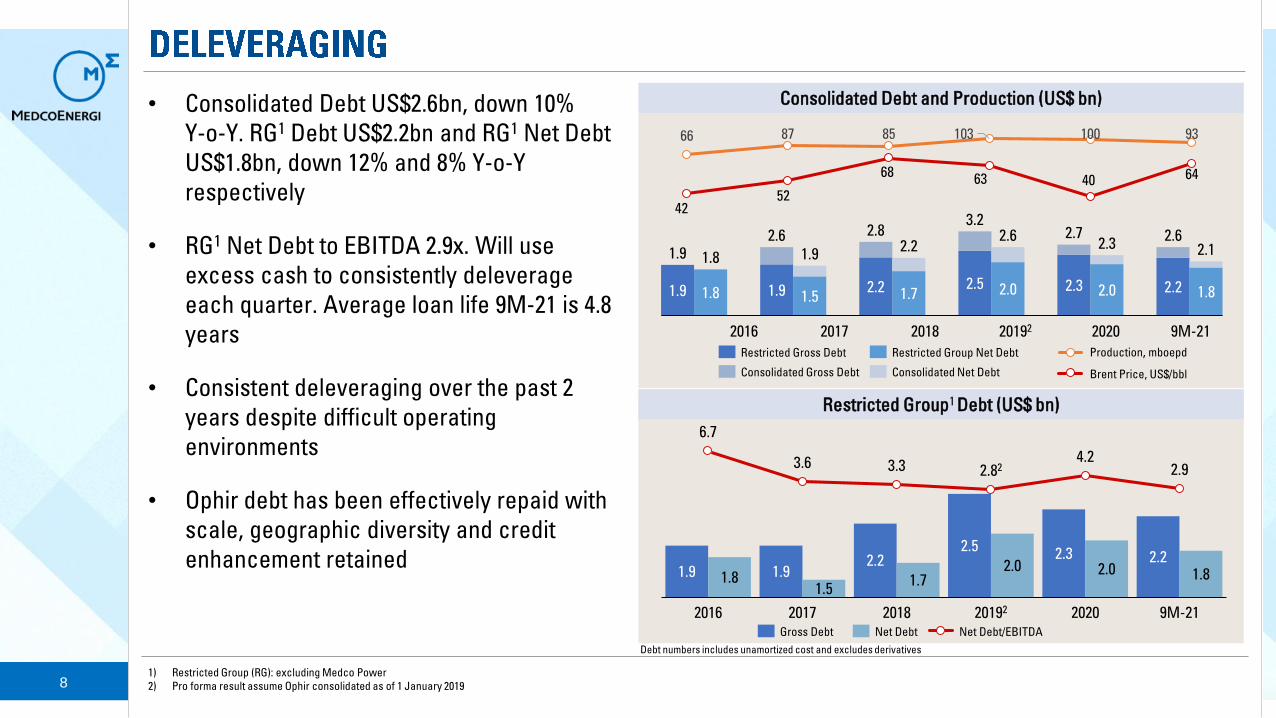
• Consolidated Debt US$2.6bn, down 10%
Y-o-Y. RG1 Debt US$2.2bn and RG1 Net Debt
US$1.8bn, down 12% and 8% Y-o-Y
respectively
• RG1 Net Debt to EBITDA 2.9x. Will use
excess cash to consistently deleverage
each quarter. Average loan life 9M-21 is 4.8
years
• Consistent deleveraging over the past 2
years despite difficult operating
environments
• Ophir debt has been effectively repaid with
scale, geographic diversity and credit
enhancement retained
1.9 1.8 1.9 1.52.2 1.7
2.5 2.0 2.3 2.0 2.2 1.8
1.82.3
2.7
1.9 1.9 2.12.6 2.62.8
3.2
2.22.6
Consolidated Gross Debt
Restricted Gross Debt Restricted Group Net Debt
Consolidated Net Debt
4252
6863 40 64
66 87 85 103 100 93
9M-212016 20182017 20192 2020
Production, mboepd
Brent Price, US$/bbl
1) Restricted Group (RG): excluding Medco Power
2) Pro forma result assume Ophir consolidated as of 1 January 2019
9
2021-2022 Guidance (mboepd)
39 35 34
64 6058
121
2019 2021
Guidance
40
2020
59
56%
9M21
36 40%
35%
25%
Indexed &
Fixed Gas
Composition
2022
Pro forma
Guidance1
22%
22%
Indexed &
Fixed Gas
Composition
103
100%
10093 94-95 100%
155
Liquids Gas Indexed Priced GasFixed Priced Gas
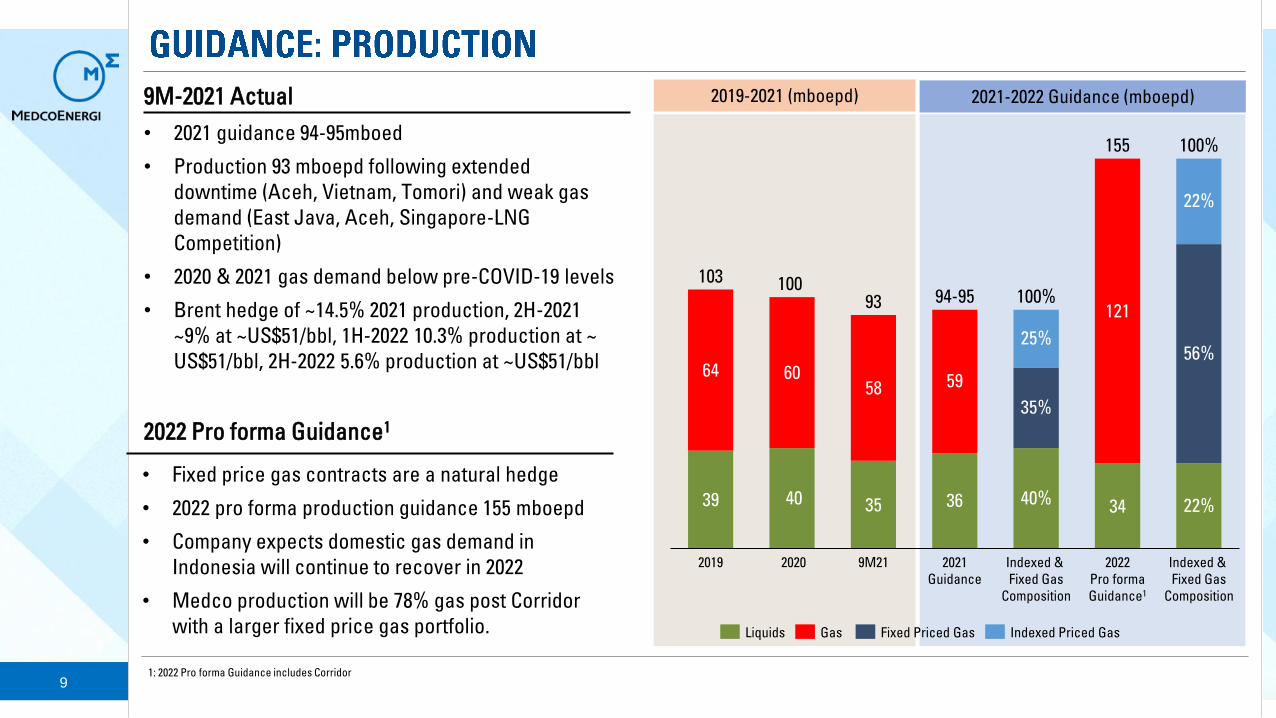
• 2021 guidance 94-95mboed
• Production 93 mboepd following extended
downtime (Aceh, Vietnam, Tomori) and weak gas
demand (East Java, Aceh, Singapore-LNG
Competition)
• 2020 & 2021 gas demand below pre-COVID-19 levels
• Brent hedge of ~14.5% 2021 production, 2H-2021
~9% at ~US$51/bbl, 1H-2022 10.3% production at ~
US$51/bbl, 2H-2022 5.6% production at ~US$51/bbl
9M-2021 Actual
2022 Pro forma Guidance1
• Fixed price gas contracts are a natural hedge
• 2022 pro forma production guidance 155 mboepd
• Company expects domestic gas demand in
Indonesia will continue to recover in 2022
• Medco production will be 78% gas post Corridor
with a larger fixed price gas portfolio.
2019-2021 (mboepd)
1: 2022 Pro forma Guidance includes Corridor

10
• Oil & Gas Capex US$31mn. Activities ramping up but
will be under full year guidance of US$150mn
• Power1 US$22mn, progress Riau Project
commissioning. Expect to be under full year
guidance of US$65mn
• Oil & Gas cash costs US$9.3/boe, notwithstanding
extended shutdowns in Q2-21
Capex , US$ mn
Cash Cost/Unit3, US$/boe
268194
144 150
275
61119
63 65
50
207 215
313
2022 Pro forma
Guidance2
325
2018 2019 2020 2021
Guidance
329
Power1Oil and gas
• Oil & Gas Capex US$275mn, Power1 US$50mn
• Remain disciplined on expenditure but retain
flexibility as demand recovers
• Oil and Gas cash costs below $10/boe
12.38.8 9.1 8.4
9.9 9.1 9.3
93
155
15.4
66
2015
5656
87
2014
<10
2016 2017
85
2018
103
2019
100
2020 9M21 2022
Pro forma
guidance2
Cash Cost Production (mboepd)
1) Power capex is working interest Riau (51%) and Ijen (51%)
2) 2022 Pro forma Guidance includes Corridor
3) Unit cash cost excludes production and expenditure on Oman KSF service contract
9M-2021 Actual
2022 Pro forma Guidance2
11
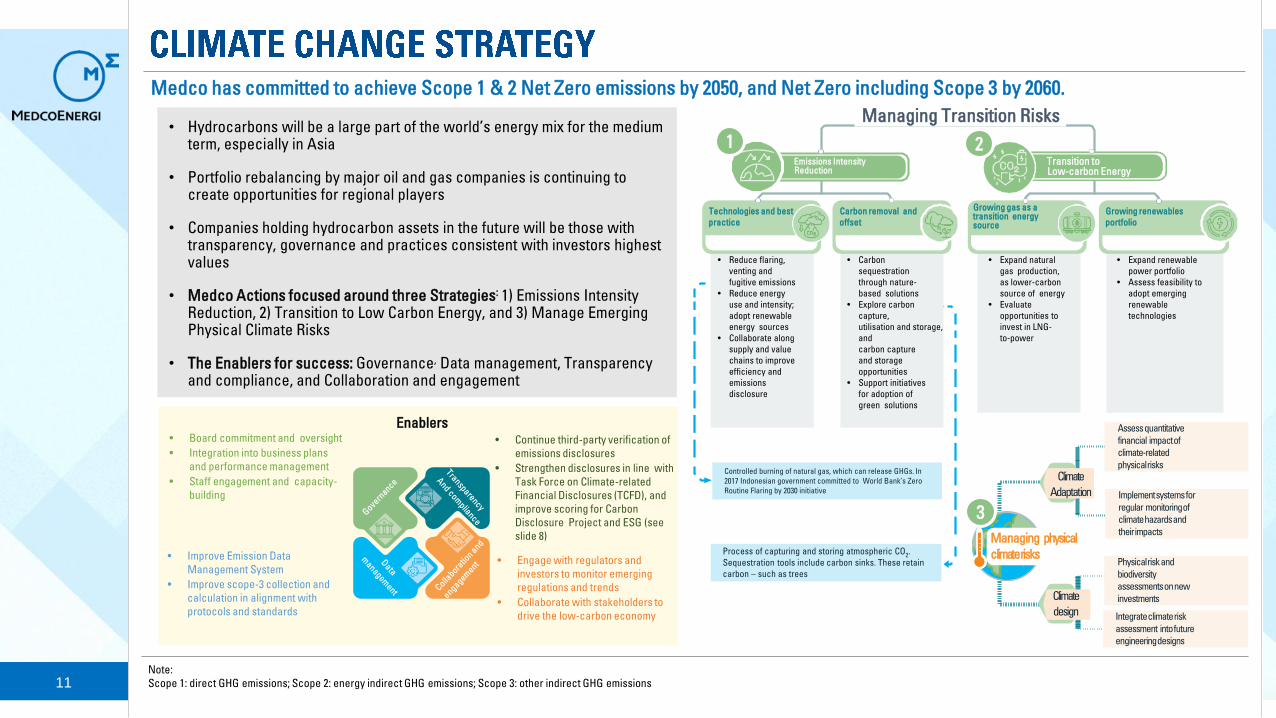
• Hydrocarbons will be a large part of the world’s energy mix for the medium term, especially in Asia
• Portfolio rebalancing by major oil and gas companies is continuing to create opportunities for regional players
• Companies holding hydrocarbon assets in the future will be those with transparency, governance and practices consistent with investors highest values
• Medco Actions focused around three Strategies: 1) Emissions Intensity Reduction, 2) Transition to Low Carbon Energy, and 3) Manage Emerging Physical Climate Risks
• The Enablers for success: Governance, Data management, Transparency and compliance, and Collaboration and engagement
Medco has committed to achieve Scope 1 & 2 Net Zero emissions by 2050, and Net Zero including Scope 3 by 2060.
Emissions Intensity Reduction
Transition to Low-carbon Energy
• Reduce flaring,
venting and
fugitive emissions
• Reduce energy
use and intensity;
adopt renewable
energy sources
• Collaborate along
supply and value
chains to improve
efficiency and
emissions
disclosure
• Expand renewable
power portfolio
• Assess feasibility to
adopt emerging
renewable
technologies
• Carbon
sequestration
through nature-
based solutions
• Explore carbon
capture,
utilisation and storage,
and
carbon capture
and storage
opportunities
• Support initiatives
for adoption of
green solutions
Controlled burning of natural gas, which can release GHGs. In
2017 Indonesian government committed to World Bank’s Zero
Routine Flaring by 2030 initiative
Process of capturing and storing atmospheric CO2.
Sequestration tools include carbon sinks. These retain
carbon – such as trees
• Expand natural
gas production,
as lower-carbon
source of energy
• Evaluate
opportunities to
invest in LNG-
to-power
Technologies and best
practice
Carbon removal and
offset
Growing gas as a transition energysource
Growing renewables
portfolio
Managing Transition Risks
• Board commitment and oversight
• Integration into business plans
and performance management
• Staff engagement and capacity-
building
• Improve Emission Data
Management System
• Improve scope-3 collection and
calculation in alignment with
protocols and standards
• Continue third-party verification of
emissions disclosures
• Strengthen disclosures in line with
Task Force on Climate-related
Financial Disclosures (TCFD), and
improve scoring for Carbon
Disclosure Project and ESG (see
slide 8)
• Engage with regulators and
investors to monitor emerging
regulations and trends
• Collaborate with stakeholders to
drive the low-carbon economy
Enablers
Managing physical
climaterisks
Implement systems for
regular monitoring of
climate hazards and
their impacts
Physical risk and
biodiversity
assessments on new
investments
Integrate climate risk
assessment into future
engineering designs
Assess quantitative
financial impact of
climate-related
physical risks
Climate
Adaptation
Climate
design
1
Note:
Scope 1: direct GHG emissions; Scope 2: energy indirect GHG emissions; Scope 3: other indirect GHG emissions
2
3

12
0
200
400
600
800
2015 2016 2017 2018 2019 2020 9M2021
Medco Chevron Repsol BP
ConoccoPhillips Exxon Shell Equinor
987
340
629
226
1,364
906
1,692
919
1,406
779
1,327
855
248 237218 216
136,749 Tons CO2 eq. 2021 offset from
renewables(1)
13%Reduced E&P Scope 1 intensity
2018-9M 2021
62%/52%/90%of 9M-21 production / 2P reserves
/ Contingent Resources is gas
54% of 9M-21 operating power
generation capacity is renewable
energy
163m lbscopper production (renewable
assets require 3-15x more copper
than conventional power)
E&P and MPI Scope-1 GHG Emissions(2) (in 1,000 tCO2eq)
Since acquisition Medco has reduced GHG emissions from South Natuna Sea Block B (SNSB)(2)
1floating production
storage and offloading vessel
1floating storage and
offloading vessel
1moveable gas-production unit
1gas lift platform
1drilling production
platform
1logistics and air
transport base at Matak
2central processing
platforms
Severalwellhead platforms
Numeroussubsea wells
SNSB facilities
0
400,000
800,000
1,200,000
Total GHG emissions GHG emissions from fuel gas
2018 2019 2020
-11%-16%
-8%
-20%
GHG Scope 1+2 (Intensity) – Global O&G Companies(3)
(ktCO2e / Mtoe)
Medco
Medco E&P Medco Power
E&P Scope-1 GHG emissions intensity (tCO2eq/1,000 TOE HC product)
Annualized
GHG Scope 1+2 – Medco E&P and MPI
ktCO2e, tCO2eq/1,000 TOE HC product
2018 2019 2020 9M-21
1) Based on ESDM (Ministry of Energy and Mineral Resources) 2016 emission factor in Java, Madura, and Bali (Jamali).
2) All data is verified by third parties, except for 9M-21 figures.
3) Source: available public data
13
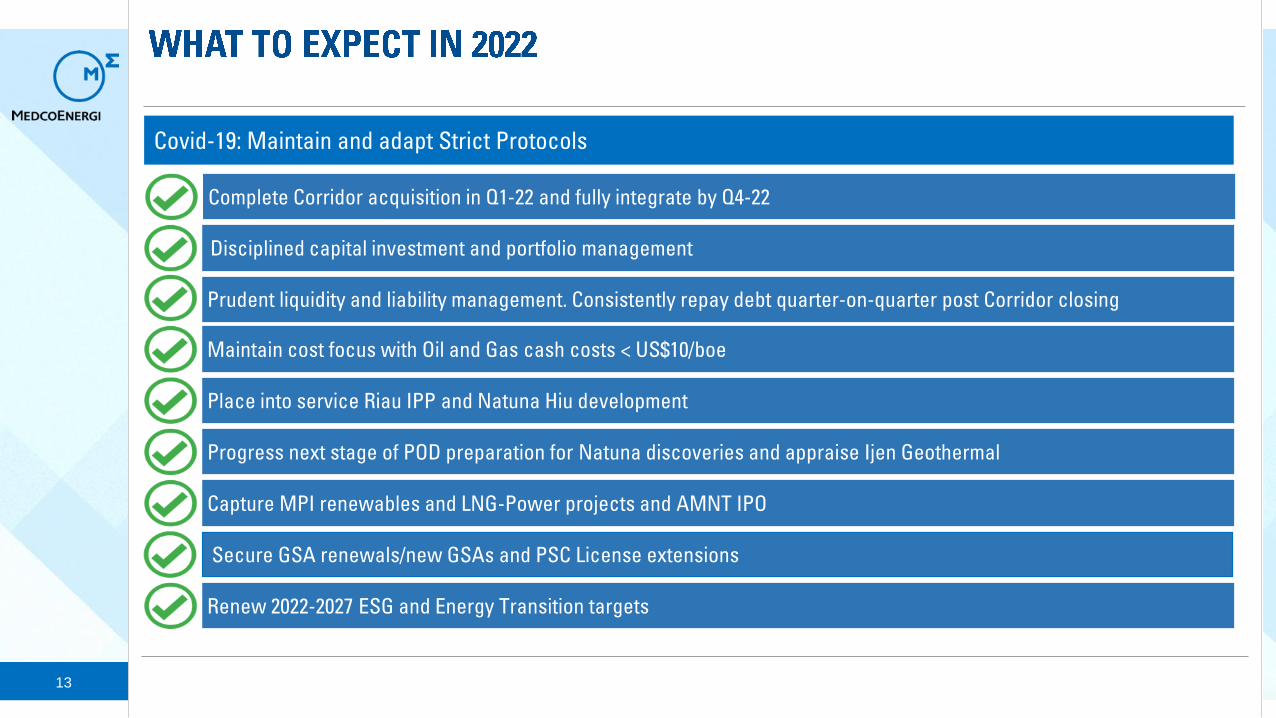
Covid-19: Maintain and adapt Strict Protocols
Capture MPI renewables and LNG-Power projects and AMNT IPO
Prudent liquidity and liability management. Consistently repay debt quarter-on-quarter post Corridor closing
Maintain cost focus with Oil and Gas cash costs < US$10/boe
Place into service Riau IPP and Natuna Hiu development
Progress next stage of POD preparation for Natuna discoveries and appraise Ijen Geothermal
Renew 2022-2027 ESG and Energy Transition targets
Disciplined capital investment and portfolio management
Secure GSA renewals/new GSAs and PSC License extensions
Complete Corridor acquisition in Q1-22 and fully integrate by Q4-22
14
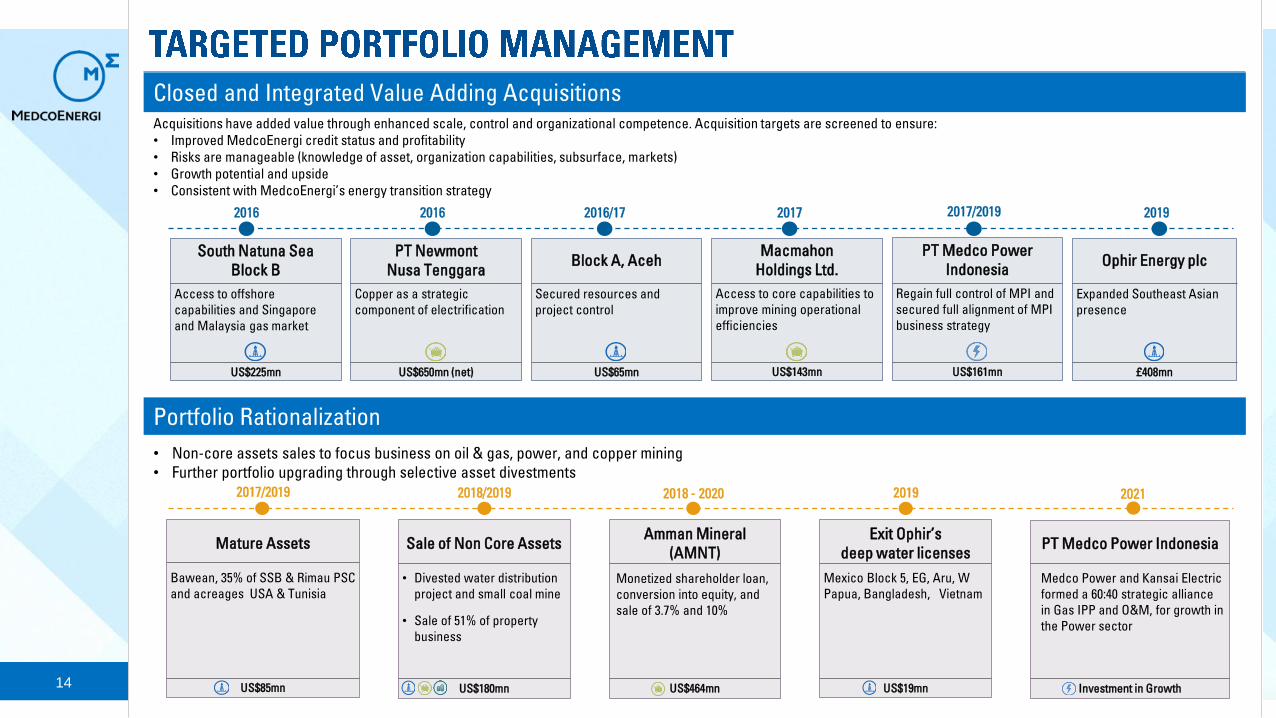
Acquisitions have added value through enhanced scale, control and organizational competence. Acquisition targets are screened to ensure:
• Improved MedcoEnergi credit status and profitability
• Risks are manageable (knowledge of asset, organization capabilities, subsurface, markets)
• Growth potential and upside
• Consistent with MedcoEnergi’s energy transition strategy
Portfolio Rationalization
• Non-core assets sales to focus business on oil & gas, power, and copper mining
• Further portfolio upgrading through selective asset divestments
2016 2016 2017 2017/20192016/17 2019
PT Medco Power
Indonesia
Regain full control of MPI and
secured full alignment of MPI
business strategy
US$161mn
Macmahon
Holdings Ltd.
Access to core capabilities to
improve mining operational
efficiencies
US$143mn
South Natuna Sea
Block B
Access to offshore
capabilities and Singapore
and Malaysia gas market
US$225mn
PT Newmont
Nusa Tenggara
Copper as a strategic
component of electrification
US$650mn (net)
Block A, Aceh
Secured resources and
project control
US$65mn
Ophir Energy plc
Expanded Southeast Asian
presence
£408mn
Closed and Integrated Value Adding Acquisitions
2017/2019 2018/2019 2018 - 2020 2019
Sale of Non Core Assets
US$180mn
• Divested water distribution
project and small coal mine
• Sale of 51% of property
business
PT Medco Power Indonesia
Investment in Growth
Medco Power and Kansai Electric
formed a 60:40 strategic alliance
in Gas IPP and O&M, for growth in
the Power sector
2021
Mature Assets
US$85mn
Bawean, 35% of SSB & Rimau PSC
and acreages USA & Tunisia
Amman Mineral
(AMNT)
US$464mn
Monetized shareholder loan,
conversion into equity, and
sale of 3.7% and 10%
Exit Ophir’s
deep water licenses
US$19mn
Mexico Block 5, EG, Aru, W
Papua, Bangladesh, Vietnam
15
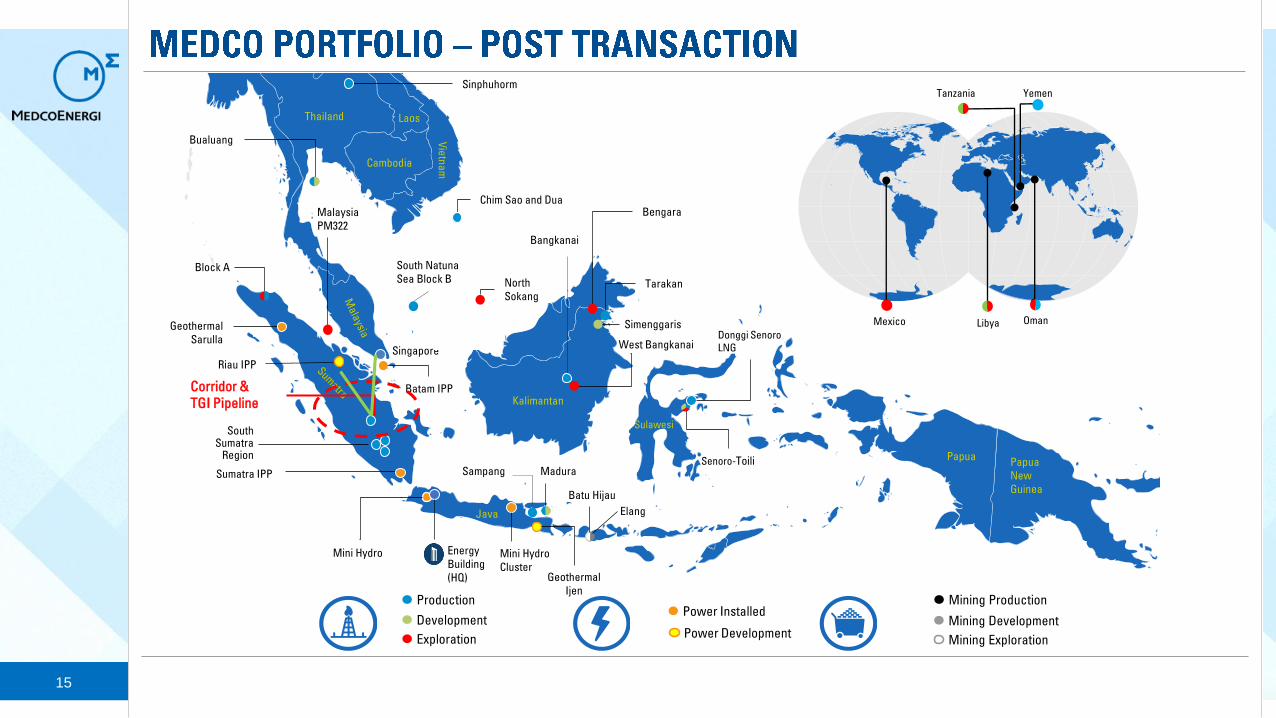
Papua
New
Guinea
Papua
ProductionPower Installed
Mining Production
Libya
Tanzania
Mexico Oman
Yemen
North
Sokang
Thailand Laos
Cambodia
Vie
tna
m
Kalimantan
Sulawesi
Java
Block A
Geothermal
Sarulla
Bualuang
Sinphuhorm
Chim Sao and Dua
Batam IPP
Riau IPP
South Natuna
Sea Block B
South SokangSimenggaris
Tarakan
Bengara
Bangkanai
South Sumatra
Region
Sumatra IPP
Mini Hydro Energy
Building
(HQ)
Mini Hydro
ClusterGeothermal
Ijen
Batu Hijau
MaduraSampangSenoro-Toili
Elang
Donggi Senoro
LNG West Bangkanai
Malaysia
PM322
Singapore
Corridor &
TGI Pipeline
ProductionPower Installed
Mining Production
Development
ExplorationPower Development
Mining Development
Mining Exploration
16
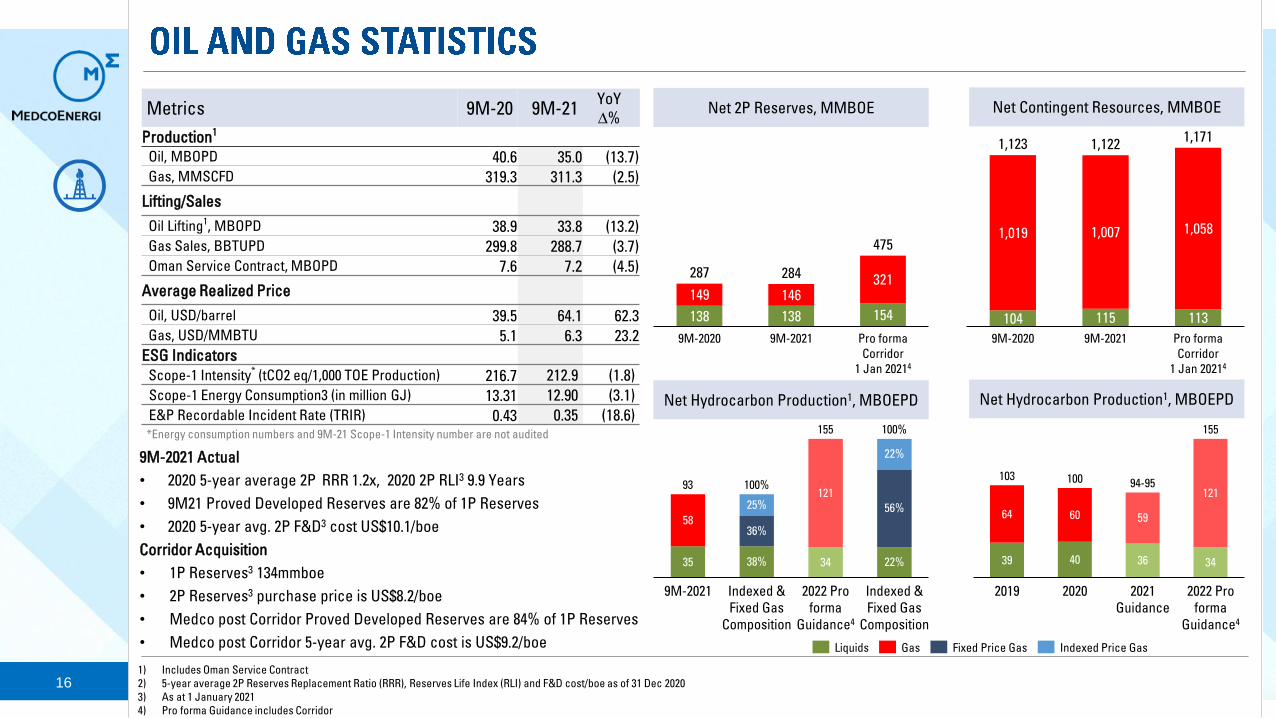
Metrics 9M-20 9M-21YoY
∆%
Production1
Oil, MBOPD 40.6 35.0 (13.7)
Gas, MMSCFD 319.3 311.3 (2.5)
Lifting/Sales
Oil Lifting1, MBOPD 38.9 33.8 (13.2)
Gas Sales, BBTUPD 299.8 288.7 (3.7)
Oman Service Contract, MBOPD 7.6 7.2 (4.5)
Average Realized Price
Oil, USD/barrel 39.5 64.1 62.3
Gas, USD/MMBTU 5.1 6.3 23.2
ESG Indicators
Scope-1 Intensity* (tCO2 eq/1,000 TOE Production) 216.7 212.9 (1.8)
Scope-1 Energy Consumption3 (in million GJ) 13.31 12.90 (3.1)
E&P Recordable Incident Rate (TRIR) 0.43 0.35 (18.6)*Energy consumption numbers and 9M-21 Scope-1 Intensity number are not audited
9M-2021 Actual
• 2020 5-year average 2P RRR 1.2x, 2020 2P RLI3 9.9 Years
• 9M21 Proved Developed Reserves are 82% of 1P Reserves
• 2020 5-year avg. 2P F&D3 cost US$10.1/boe
Corridor Acquisition
• 1P Reserves3 134mmboe
• 2P Reserves3 purchase price is US$8.2/boe
• Medco post Corridor Proved Developed Reserves are 84% of 1P Reserves
• Medco post Corridor 5-year avg. 2P F&D cost is US$9.2/boe
Net Hydrocarbon Production1, MBOEPD
Net Contingent Resources, MMBOENet 2P Reserves, MMBOE
138 138 154
149 146321
9M-2020 9M-2021
475
Pro forma
Corridor
1 Jan 20214
287 284
104 115 113
1,019 1,007 1,058
1,122
Pro forma
Corridor
1 Jan 20214
9M-2020 9M-2021
1,1231,171
1) Includes Oman Service Contract
2) 5-year average 2P Reserves Replacement Ratio (RRR), Reserves Life Index (RLI) and F&D cost/boe as of 31 Dec 2020
3) As at 1 January 2021
4) Pro forma Guidance includes Corridor
Net Hydrocarbon Production1, MBOEPD
35 34
58
121100%
22%
2022 Pro
forma
Guidance4
Indexed &
Fixed Gas
Composition
9M-2021
22%
36%
38%
25% 56%
Indexed &
Fixed Gas
Composition
93
155 100%
Liquids Fixed Price GasGas Indexed Price Gas
39 40 34
64 60
121
100
155
94-95
2022 Pro
forma
Guidance4
2019 2021
Guidance
103
2020
59
36
17
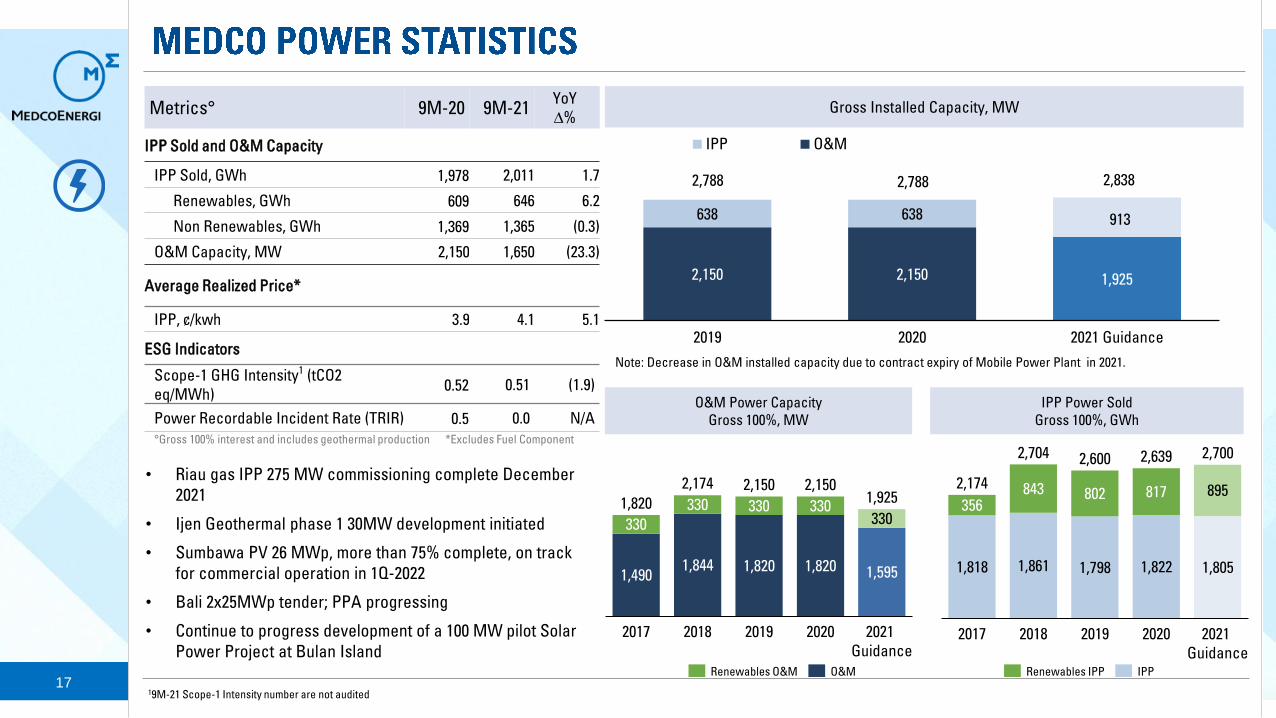
• Riau gas IPP 275 MW commissioning complete December
2021
• Ijen Geothermal phase 1 30MW development initiated
• Sumbawa PV 26 MWp, more than 75% complete, on track
for commercial operation in 1Q-2022
• Bali 2x25MWp tender; PPA progressing
• Continue to progress development of a 100 MW pilot Solar
Power Project at Bulan Island
2,150 2,150 1,925
638 638 913
2,788 2,788 2,838
2019 2020 2021 Guidance
IPP O&M
Note: Decrease in O&M installed capacity due to contract expiry of Mobile Power Plant in 2021.
Metrics° 9M-20 9M-21YoY
∆%
IPP Sold and O&M Capacity
IPP Sold, GWh 1,978 2,011 1.7
Renewables, GWh 609 646 6.2
Non Renewables, GWh 1,369 1,365 (0.3)
O&M Capacity, MW 2,150 1,650 (23.3)
Average Realized Price*
IPP, ¢/kwh 3.9 4.1 5.1
ESG Indicators
Scope-1 GHG Intensity1 (tCO2
eq/MWh)0.52 0.51 (1.9)
Power Recordable Incident Rate (TRIR) 0.5 0.0 N/A
°Gross 100% interest and includes geothermal production *Excludes Fuel Component
Gross Installed Capacity, MW
1,4901,844 1,820 1,820 1,595
330
330 330 330330
201920182017
2,1502,150
2020 2021
Guidance
1,820
2,1741,925
O&M Power Capacity
Gross 100%, MW
O&MRenewables O&M
IPP Power Sold
Gross 100%, GWh
1,818 1,861 1,798 1,822 1,805
356843 802 817 895
2021
Guidance
2017
2,174
20192018 2020
2,704 2,600 2,639 2,700
Renewables IPP IPP
19M-21 Scope-1 Intensity number are not audited
18
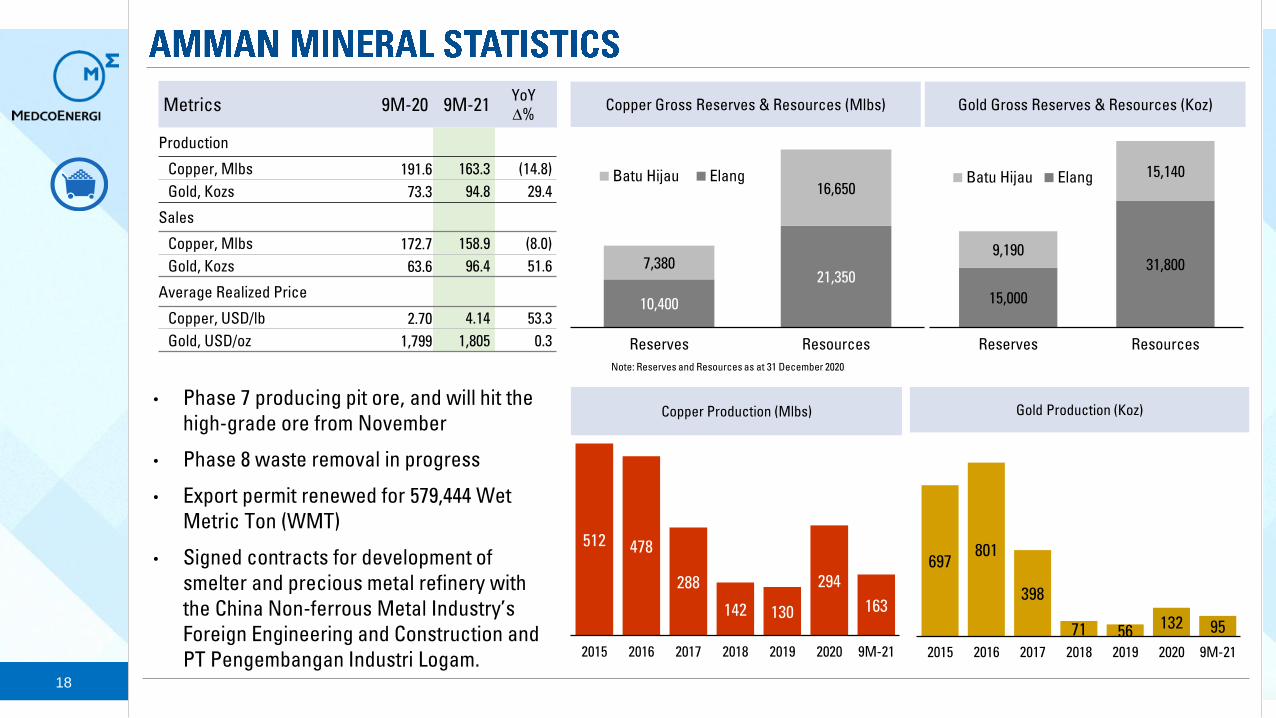
Amman Mineral Nusa Tenggara
10,400
21,3507,380
16,650
Reserves Resources
Batu Hijau Elang
Copper Gross Reserves & Resources (Mlbs)
15,000
31,800 9,190
15,140
Reserves Resources
Batu Hijau Elang
Gold Gross Reserves & Resources (Koz)
• Phase 7 producing pit ore, and will hit the
high-grade ore from November
• Phase 8 waste removal in progress
• Export permit renewed for 579,444 Wet
Metric Ton (WMT)
• Signed contracts for development of
smelter and precious metal refinery with
the China Non-ferrous Metal Industry’s
Foreign Engineering and Construction and
PT Pengembangan Industri Logam.
512 478
288
142 130
294
163
2015 2016 2017 2018 2019 2020 9M-21
Copper Production (Mlbs)
697 801
398
71 56 132 95
2015 2016 2017 2018 2019 2020 9M-21
Gold Production (Koz)
Metrics 9M-20 9M-21YoY
∆%
Production
Copper, Mlbs 191.6 163.3 (14.8)
Gold, Kozs 73.3 94.8 29.4
Sales
Copper, Mlbs 172.7 158.9 (8.0)
Gold, Kozs 63.6 96.4 51.6
Average Realized Price
Copper, USD/lb 2.70 4.14 53.3
Gold, USD/oz 1,799 1,805 0.3
Note: Reserves and Resources as at 31 December 2020
19
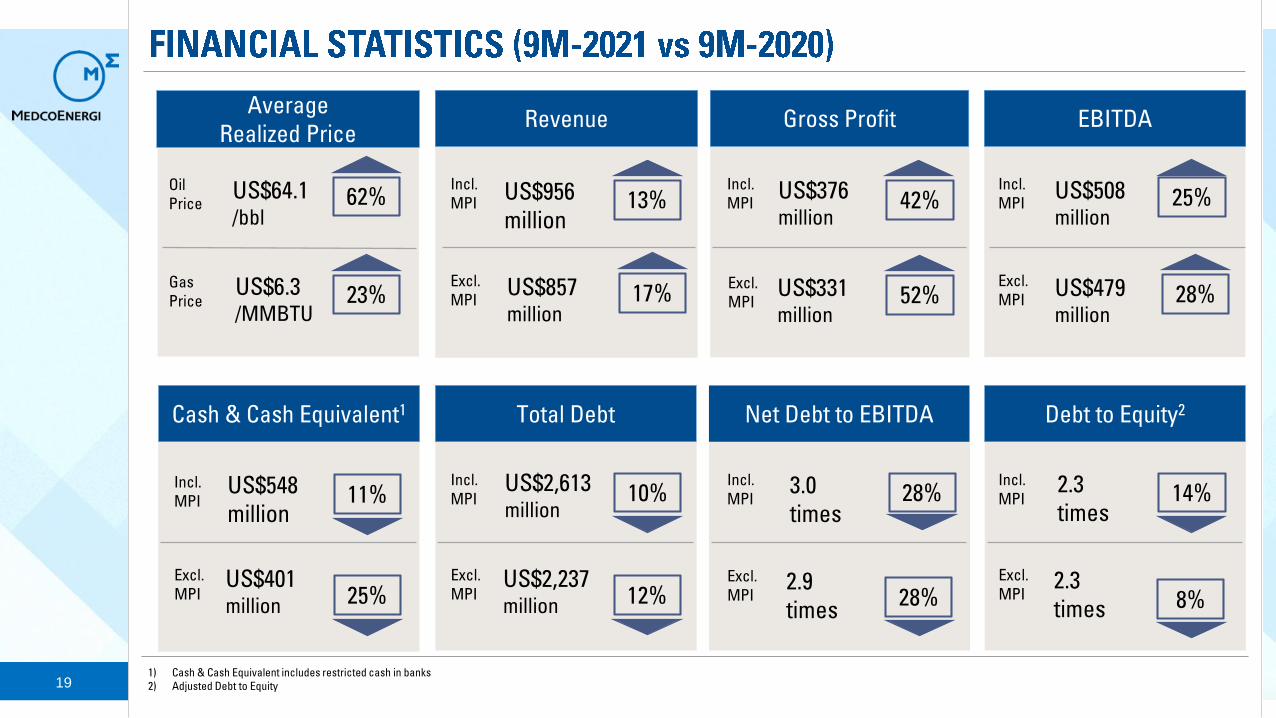
Revenue
Incl.
MPI
US$857million
Excl.
MPI
US$956
million
EBITDA
US$508million
Incl.
MPI
US$479million
Excl.
MPI
Total Debt
US$2,613million
Incl.
MPI
US$2,237million
Excl.
MPI
Gross Profit
US$376million
Incl.
MPI
US$331million
Debt to Equity2
Incl.
MPI
Excl.
MPI
2.3
times
2.3
times
Net Debt to EBITDA
Incl.
MPI
Excl.
MPI
Average
Realized Price
Oil
Price
US$6.3/MMBTU
Gas
Price
US$64.1/bbl
Cash & Cash Equivalent1
US$548
million
Incl.
MPI
US$401million
Excl.
MPI
3.0
times
2.9
times
Excl.
MPI
62% 42%
23% 52%
28%
13%
17%
25%
28%
11% 10%
12%
28%
25% 8%
14%
1) Cash & Cash Equivalent includes restricted cash in banks
2) Adjusted Debt to Equity

PT Medco Energi Internasional TbkThe Energy Building 53rd Floor
SCBD Lot 11A
Jl. Jend. Sudirman, Jakarta 12190
Indonesia
P. +62-21 2995 3000
F. +62-21 2995 3001
Website : www.medcoenergi.com