Mechanisms of iron oxide transformations in hydrothermal systems
16
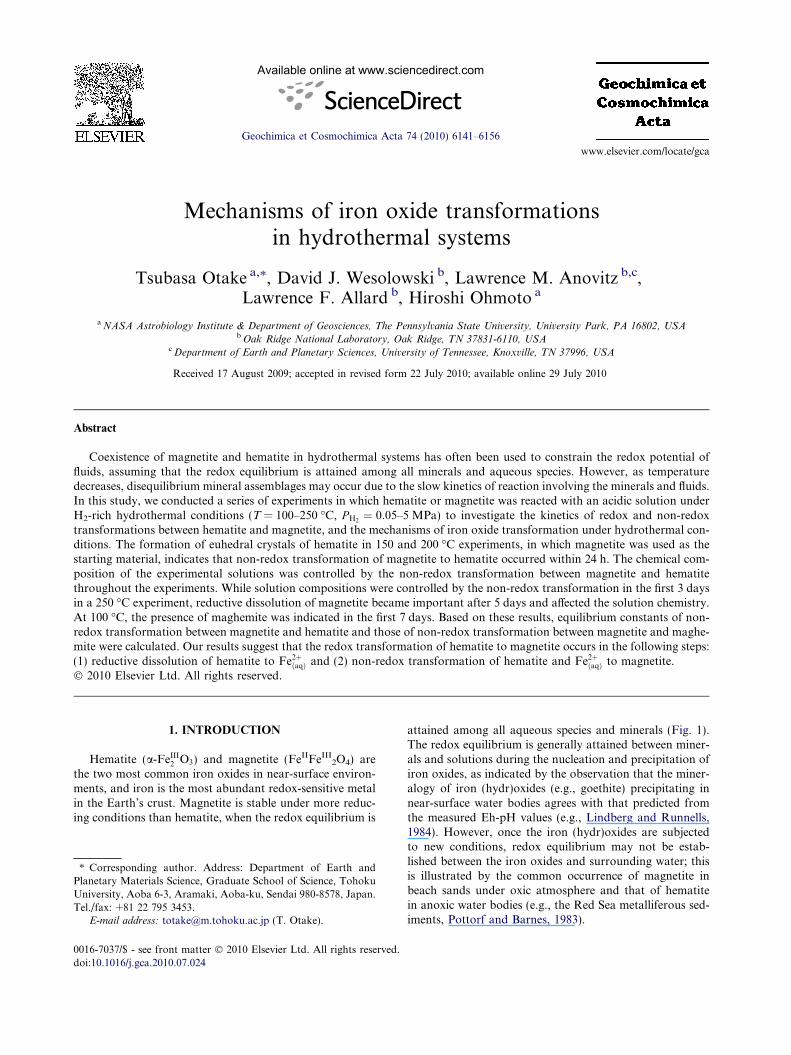
Mechanisms of iron oxide transformations in hydrothermal systems Tsubasa Otake a,⇑ , David J. Wesolowski b , Lawrence M. Anovitz b,c , Lawrence F. Allard b , Hiroshi Ohmoto a a NASA Astrobiology Institute & Department of Geosciences, The Pennsylvania State University, University Park, PA 16802, USA b Oak Ridge National Laboratory, Oak Ridge, TN 37831-6110, USA c Department of Earth and Planetary Sciences, University of Tennessee, Knoxville, TN 37996, USA Received 17 August 2009; accepted in revised form 22 July 2010; available online 29 July 2010 Abstract Coexistence of magnetite and hematite in hydrothermal systems has often been used to constrain the redox potential of fluids, assuming that the redox equilibrium is attained among all minerals and aqueous species. However, as temperature decreases, disequilibrium mineral assemblages may occur due to the slow kinetics of reaction involving the minerals and fluids. In this study, we conducted a series of experiments in which hematite or magnetite was reacted with an acidic solution under H 2 -rich hydrothermal conditions (T = 100–250 °C, P H 2 ¼ 0:05–5 MPa) to investigate the kinetics of redox and non-redox transformations between hematite and magnetite, and the mechanisms of iron oxide transformation under hydrothermal con- ditions. The formation of euhedral crystals of hematite in 150 and 200 °C experiments, in which magnetite was used as the starting material, indicates that non-redox transformation of magnetite to hematite occurred within 24 h. The chemical com- position of the experimental solutions was controlled by the non-redox transformation between magnetite and hematite throughout the experiments. While solution compositions were controlled by the non-redox transformation in the first 3 days in a 250 °C experiment, reductive dissolution of magnetite became important after 5 days and affected the solution chemistry. At 100 °C, the presence of maghemite was indicated in the first 7 days. Based on these results, equilibrium constants of non- redox transformation between magnetite and hematite and those of non-redox transformation between magnetite and maghe- mite were calculated. Our results suggest that the redox transformation of hematite to magnetite occurs in the following steps: (1) reductive dissolution of hematite to Fe 2þ ðaqÞ and (2) non-redox transformation of hematite and Fe 2þ ðaqÞ to magnetite. Ó 2010 Elsevier Ltd. All rights reserved. 1. INTRODUCTION Hematite (a-Fe III 2 O 3 ) and magnetite (Fe II Fe III 2 O 4 ) are the two most common iron oxides in near-surface environ- ments, and iron is the most abundant redox-sensitive metal in the Earth’s crust. Magnetite is stable under more reduc- ing conditions than hematite, when the redox equilibrium is attained among all aqueous species and minerals (Fig. 1). The redox equilibrium is generally attained between miner- als and solutions during the nucleation and precipitation of iron oxides, as indicated by the observation that the miner- alogy of iron (hydr)oxides (e.g., goethite) precipitating in near-surface water bodies agrees with that predicted from the measured Eh-pH values (e.g., Lindberg and Runnells, 1984). However, once the iron (hydr)oxides are subjected to new conditions, redox equilibrium may not be estab- lished between the iron oxides and surrounding water; this is illustrated by the common occurrence of magnetite in beach sands under oxic atmosphere and that of hematite in anoxic water bodies (e.g., the Red Sea metalliferous sed- iments, Pottorf and Barnes, 1983). 0016-7037/$ - see front matter Ó 2010 Elsevier Ltd. All rights reserved. doi:10.1016/j.gca.2010.07.024 ⇑ Corresponding author. Address: Department of Earth and Planetary Materials Science, Graduate School of Science, Tohoku University, Aoba 6-3, Aramaki, Aoba-ku, Sendai 980-8578, Japan. Tel./fax: +81 22 795 3453. E-mail address: [email protected] (T. Otake). www.elsevier.com/locate/gca Available online at www.sciencedirect.com Geochimica et Cosmochimica Acta 74 (2010) 6141–6156
Transcript of Mechanisms of iron oxide transformations in hydrothermal systems
Available online at www.sciencedirect.com
www.elsevier.com/locate/gca
Geochimica et Cosmochimica Acta 74 (2010) 6141–6156
Mechanisms of iron oxide transformationsin hydrothermal systems
Tsubasa Otake a,⇑, David J. Wesolowski b, Lawrence M. Anovitz b,c,Lawrence F. Allard b, Hiroshi Ohmoto a
a NASA Astrobiology Institute & Department of Geosciences, The Pennsylvania State University, University Park, PA 16802, USAb Oak Ridge National Laboratory, Oak Ridge, TN 37831-6110, USA
c Department of Earth and Planetary Sciences, University of Tennessee, Knoxville, TN 37996, USA
Received 17 August 2009; accepted in revised form 22 July 2010; available online 29 July 2010
Abstract
Coexistence of magnetite and hematite in hydrothermal systems has often been used to constrain the redox potential offluids, assuming that the redox equilibrium is attained among all minerals and aqueous species. However, as temperaturedecreases, disequilibrium mineral assemblages may occur due to the slow kinetics of reaction involving the minerals and fluids.In this study, we conducted a series of experiments in which hematite or magnetite was reacted with an acidic solution underH2-rich hydrothermal conditions (T = 100–250 �C, P H2
¼ 0:05–5 MPa) to investigate the kinetics of redox and non-redoxtransformations between hematite and magnetite, and the mechanisms of iron oxide transformation under hydrothermal con-ditions. The formation of euhedral crystals of hematite in 150 and 200 �C experiments, in which magnetite was used as thestarting material, indicates that non-redox transformation of magnetite to hematite occurred within 24 h. The chemical com-position of the experimental solutions was controlled by the non-redox transformation between magnetite and hematitethroughout the experiments. While solution compositions were controlled by the non-redox transformation in the first 3 daysin a 250 �C experiment, reductive dissolution of magnetite became important after 5 days and affected the solution chemistry.At 100 �C, the presence of maghemite was indicated in the first 7 days. Based on these results, equilibrium constants of non-redox transformation between magnetite and hematite and those of non-redox transformation between magnetite and maghe-mite were calculated. Our results suggest that the redox transformation of hematite to magnetite occurs in the following steps:(1) reductive dissolution of hematite to Fe2þ
ðaqÞ and (2) non-redox transformation of hematite and Fe2þðaqÞ to magnetite.
� 2010 Elsevier Ltd. All rights reserved.
1. INTRODUCTION
Hematite (a-FeIII2 O3) and magnetite (FeIIFeIII
2O4) arethe two most common iron oxides in near-surface environ-ments, and iron is the most abundant redox-sensitive metalin the Earth’s crust. Magnetite is stable under more reduc-ing conditions than hematite, when the redox equilibrium is
0016-7037/$ - see front matter � 2010 Elsevier Ltd. All rights reserved.
doi:10.1016/j.gca.2010.07.024
⇑ Corresponding author. Address: Department of Earth andPlanetary Materials Science, Graduate School of Science, TohokuUniversity, Aoba 6-3, Aramaki, Aoba-ku, Sendai 980-8578, Japan.Tel./fax: +81 22 795 3453.
E-mail address: [email protected] (T. Otake).
attained among all aqueous species and minerals (Fig. 1).The redox equilibrium is generally attained between miner-als and solutions during the nucleation and precipitation ofiron oxides, as indicated by the observation that the miner-alogy of iron (hydr)oxides (e.g., goethite) precipitating innear-surface water bodies agrees with that predicted fromthe measured Eh-pH values (e.g., Lindberg and Runnells,1984). However, once the iron (hydr)oxides are subjectedto new conditions, redox equilibrium may not be estab-lished between the iron oxides and surrounding water; thisis illustrated by the common occurrence of magnetite inbeach sands under oxic atmosphere and that of hematitein anoxic water bodies (e.g., the Red Sea metalliferous sed-iments, Pottorf and Barnes, 1983).
150ºC
5
0
-5
-10
-15
-202 4 6 80
Fe2+
Hematite(Fe2O3)
aFe2+ = 10-2 10-4 10-6log
P H2 (M
Pa)
pH
Magnetite (Fe3O4)
(b)
200ºC
5
0
-5
-10
-15
-202 4 6 80
Fe2+
Hematite(Fe2O3)
Magnetite (Fe3O4)
aFe2+ = 10-2 10-4 10-6
log
P H2 (M
Pa)
pH
(c)
250ºC
5
0
-5
-10
-15
-202 4 6 80
Fe2+
Hematite(Fe2O3)
Magnetite (Fe3O4)
aFe2+ = 10-2 10-4 10-6
log
P H2 (M
Pa)
pH
(d)
100ºC
5
0
-5
-10
-15
-202 4 6 80
Fe2+
Hematite(Fe2O3)
Magnetite (Fe3O4)
aFe2+ = 10-2 10-4 10-6
log
P H2 (M
Pa)
pH
(a)
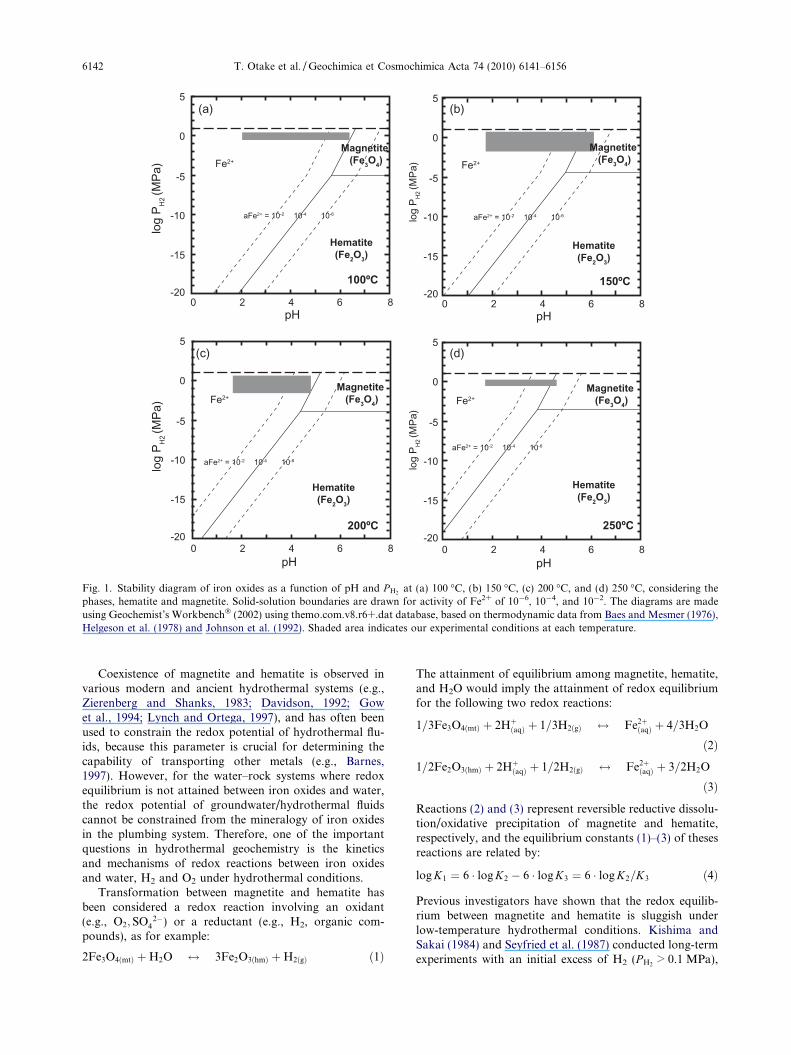
Fig. 1. Stability diagram of iron oxides as a function of pH and P H2at (a) 100 �C, (b) 150 �C, (c) 200 �C, and (d) 250 �C, considering the
phases, hematite and magnetite. Solid-solution boundaries are drawn for activity of Fe2+ of 10�6, 10�4, and 10�2. The diagrams are madeusing Geochemist’s Workbench� (2002) using themo.com.v8.r6+.dat database, based on thermodynamic data from Baes and Mesmer (1976),Helgeson et al. (1978) and Johnson et al. (1992). Shaded area indicates our experimental conditions at each temperature.
6142 T. Otake et al. / Geochimica et Cosmochimica Acta 74 (2010) 6141–6156
Coexistence of magnetite and hematite is observed invarious modern and ancient hydrothermal systems (e.g.,Zierenberg and Shanks, 1983; Davidson, 1992; Gowet al., 1994; Lynch and Ortega, 1997), and has often beenused to constrain the redox potential of hydrothermal flu-ids, because this parameter is crucial for determining thecapability of transporting other metals (e.g., Barnes,1997). However, for the water–rock systems where redoxequilibrium is not attained between iron oxides and water,the redox potential of groundwater/hydrothermal fluidscannot be constrained from the mineralogy of iron oxidesin the plumbing system. Therefore, one of the importantquestions in hydrothermal geochemistry is the kineticsand mechanisms of redox reactions between iron oxidesand water, H2 and O2 under hydrothermal conditions.
Transformation between magnetite and hematite hasbeen considered a redox reaction involving an oxidant(e.g., O2; SO4
2�) or a reductant (e.g., H2, organic com-pounds), as for example:
2Fe3O4ðmtÞ þH2O $ 3Fe2O3ðhmÞ þH2ðgÞ ð1Þ
The attainment of equilibrium among magnetite, hematite,and H2O would imply the attainment of redox equilibriumfor the following two redox reactions:
1=3Fe3O4ðmtÞ þ 2HþðaqÞ þ 1=3H2ðgÞ $ Fe2þðaqÞ þ 4=3H2O
ð2Þ
1=2Fe2O3ðhmÞ þ 2HþðaqÞ þ 1=2H2ðgÞ $ Fe2þðaqÞ þ 3=2H2O
ð3Þ
Reactions (2) and (3) represent reversible reductive dissolu-tion/oxidative precipitation of magnetite and hematite,respectively, and the equilibrium constants (1)–(3) of thesesreactions are related by:
log K1 ¼ 6 � log K2 � 6 � log K3 ¼ 6 � log K2=K3 ð4Þ
Previous investigators have shown that the redox equilib-rium between magnetite and hematite is sluggish underlow-temperature hydrothermal conditions. Kishima andSakai (1984) and Seyfried et al. (1987) conducted long-termexperiments with an initial excess of H2 (P H2
> 0.1 MPa),

Iron oxide transformations in hydrothermal systems 6143
and demonstrated that redox equilibrium between hematiteand magnetite was established only after 80 days at 300 �C.Therefore, under the conditions where equilibria (2) and (3)do not easily take place, transformations of iron oxides maynot occur through redox reactions. Ohmoto (2003) inferredfrom preliminary experimental studies (Wesolowski et al.,2000) that transformations between hematite and magnetiteat temperatures below �300 �C proceed through the follow-ing redox-independent reaction:
Fe3O4ðmtÞ þ 2HþðaqÞ $ Fe2O3ðhmÞ þ Fe2þðaqÞ þH2O ð5Þ
In this reaction, hematite is formed by the removal of Fe2+
from magnetite and magnetite is formed by the addition ofFe2+ to hematite; no reductant or oxidant is involved in thereaction. However, this transformation requires either so-lid-state recrystallization or dissolution/precipitation, sincethese phases have different oxygen framework structures.Ohmoto (2003) termed reaction (5) a ‘non-redox transfor-mation’ reaction of iron oxide.
Otake et al. (2007) conducted a series of laboratoryexperiments to investigate the processes of non-redoxtransformation of magnetite to hematite, and hematite tomagnetite, both under H2-rich hydrothermal conditionsat 150 �C ðP H2
¼ 0:05–3:5 MPa and pH = 2–6). Underthe high P H2
conditions of the experiments, only magnetiteshould be thermodynamically stable (Fig. 1b; Baes andMesmer, 1976; Helgeson et al., 1978; Johnson et al.,1992). However, we found that the dissolution of Fe2+
from magnetite by proton attack caused the transforma-tion of some magnetite crystals to larger, euhedral hema-tite crystals, as indicated by the forward direction ofreaction (5). While equilibrium [Fe2+]/[H+]2 ratios in termsof reaction (5) were attained very rapidly (within 24 h) un-der these conditions, redox equilibrium in terms of reaction(2) or (3) was not attained, even after 16 days in the stirredreactor. Although hematite was not expected to be presentin redox equilibrium under the experimental conditions,the metastable mineral assemblage persisted and controlledthe chemical composition of the experimental solution dur-ing the course of experiments. Acid/base titration experi-ments demonstrated that non-redox transformationbetween magnetite and hematite is reversible, and thatFe2þðaqÞ is the dominant aqueous species under the experi-
mental conditions. This study suggested that the hema-tite–magnetite assemblage buffered pH and Feconcentration of fluids through reaction (5), rather thanthe redox-equilibrium reaction (1), under low-temperaturehydrothermal conditions. The transformation productsare chemically and structurally homogeneous and typicallyoccur as euhedral, 3–6 lm single crystals. Notably, pro-duced hematite exhibits the unusual ditrigonal dipyramidmorphology.
The purposes of this study are (i) to determine the equi-librium constants for non-redox equilibrium between mag-netite and hematite under a wide range of temperatureconditions (i.e., 100–250 �C), (ii) to investigate the effectof hydrogen pressure and pH change on the transformationmechanisms of magnetite to hematite, and hematite to mag-netite, (iii) to investigate whether a precursor mineral waspresent for the formation of hematite during the non-redox
transformation of magnetite to hematite at a low tempera-ture (i.e., 100 �C), and finally (iv) to understand the mech-anisms of iron oxide transformation occurring in naturaland laboratory systems under low-temperature hydrother-mal conditions.
2. EXPERIMENTAL
2.1. Experimental apparatus and materials
The apparatus used in this study was the same as thatused in our previous study (Otake et al., 2007). The stirred,hydrogen-electrode concentration cell consists of a heavy-walled pressure vessel (stainless steel) containing two Tefloncompartments that share a common head-space and arejoined by a porous Teflon liquid junction (Mesmer et al.,1970; Palmer and Hyde, 1993; Wesolowski et al., 2000).Each compartment contains a Pt–H2 electrode for in situ
pH measurement. This cell is fitted with titrant delivery, fil-tered sample removal lines, and a hydrogen-permeablemembrane enabled continuous monitoring of the hydrogenpartial pressure.
Methods for preparation of the magnetite and hematitepowders and trifluoromethanesulfonic (hereafter “triflic”)acid and NaTriflate solutions used in the experiments aredescribed in Otake et al. (2007).
2.2. Experimental procedure
We ran a total of 11 series of experiments, which are di-vided into the following types: (1) magnetite + acidic solu-tion at 100–250 �C (runs #4, #7, #9, #15, #18, and #21),(2) magnetite + acid/base titration at 150 and 200 �C (runs#5, #6, and #14), (3) hematite + acidic solution at 150 �C(run #11), and (4) hematite + acid/base titration at 150 �C(run #12). We use terms “magnetite experiment” and“hematite experiment”, depending on the starting ironoxide. Magnetite or hematite (0.3–1.2 g) was placed inthe cell with �50 g of various concentrations (0.00025–0.02 mol/kg) of triflic acid solution. NaTriflate was addedto the solution for the adjustment of the ionic strength(0.10–0.12). This background electrolyte, rather thanNaCl, was used to minimize the liquid junction term inthe calculation of pH from the measured cell potential,while avoiding the complication of chloride complexationof the dissolved iron species. The vessel was repeatedlypurged and then pressurized by high-purity hydro-gen + argon (P H2
¼ 0:05–5 MPa) and rapidly (<1 h) heatedto the desired temperature (100, 150, 200, or 250 �C), andthen thermostatted to ±0.05 �C. After the system reached asteady state, as indicated by stabilized potential reading(typically <0.5 mV change in a few hours), the stirring mo-tor was turned off, and the solid permitted to settle for aperiod of �10 min. A solution sample was then withdrawnfrom the experimental solution through a platinum fritgold-welded to a platinum capillary tube immersed in thetest solution, then through a 0.2 lm PVDF syringe filteraffixed to the titanium sampling valve outside the furnace.About 1 g of solution was extracted and discarded, then 2–5 g were collected in a polypropylene syringe, pre-loaded

6144 T. Otake et al. / Geochimica et Cosmochimica Acta 74 (2010) 6141–6156
with 2–8 g of 0.2 wt.% HNO3 solution. Stirring was thenresumed until the next sampling. In the first series of exper-iments, hydrogen pressure was increased during the runs.In the second series of experiments, titrant solutions wereadded to the experimental solution. Experiments wererun for 1–16 days. After the vessel was removed from thefurnace and rapidly cooled to ambient temperature, the so-lid product was recovered from the cell, quickly rinsed withdistilled-deionized water and immediately dried under vac-uum. Initial conditions and compositions of experimentalsolutions and solids for each run are summarized inTable 1.
2.3. Measurements and analyses
The pH of experimental solutions was determined bymonitoring the potential difference between the Pt elec-trodes immersed in the experimental and reference solu-
Table 1Summary of experimental conditions and results.
Run# Initialsolution
Initialsolid
T (�C) Duration(days)
P H2ðMPaÞ p
1 0.001 m HTr0.099 m NaTr
mt* 150 4 �0.1 �
2 0.02 m HTr0.085 m NaTr
mt 150 3.5 �0.5 �
4 0.02 m HTr0.085 m NaTr
mt 150 4 0.5–5 �
5 0.001 m HTr0.099 m NaTr
mt 150 9.5 �1.5 4
6 0.02 m HTr0.085 m NaTr
mt 150 13 �0.7 4
7 0.02 m HTr0.085 m NaTr
mt 150 16 0.05–3.5 �
8 0.02 m HCl0.085 NaCl
mt 150 7 �0.05 �
9 0.02 m HTr0.085 m NaTr
mt 200 11 0.05–5 �
10 0.02 m HTr0.085 m NaTr
mt 150 1 �5 4
11 0.02 m HTr0.085 m NaTr
hm* 150 5 �4 2
12 0.02 m HTr0.085 m NaTr
hm 150 15 �4.5 2
14 0.00025 m HTr0.1m NaTr
mt 200 11 �1 3
15 0.02 m HTr0.085 m NaTr
mt 250 10 0.3–4 3
18 0.001 m HTr0.1 m NaTr
mt 100 21 �3 3
21 0.01 m HTr0.1 m NaTr
mt 100 18 0.5–6 3
* mt, magnetite; hm, hematite.
tions. The details of pH measurement are described inprevious publications (Wesolowski et al., 1998, 2000). Esti-mated uncertainty of the pH measurements in this study isless than ±0.03. The pH in this study is defined as �log[H+]on the stoichiometric molal pH scale. A solution samplewithdrawn from the experimental solution was diluted to0.1–10 ppm total Fe for analysis using ICP-AES (ThermoElectron IRIS Intrepid II XSP) at ORNL. Precision betterthan 1% of measured concentrations was routinely achievedin repeated analyses of samples and standards. The associ-ated standard errors (2r) are included as error bars in allthe figures showing Fe concentrations.
Solid samples were analyzed by SEM and XRD. SEMimages were obtained using a JEOL 6700 field-emissionSEM at Penn State and a Hitachi S-4700 field-emissionSEM at ORNL. XRD spectra of staring materials andrun products were obtained using a Bruker/SiemensD5005 diffractometer with CuKa X-ray radiation at
H log[Fe]log(mol/kg)
Run product(mol fraction)
comments
4.5 ��3.3 100%mt
4.1 ��2.0 77%mt, 23%hm Acid titration
4.2 ��2.0 79%mt, 21%hm P H2change
.4–5.8 �2.6 to �5.3 95%mt, 5%hm Acid/base titration
.2–7.3 �2 to �3.6 95%mt, 5%hm Base titration
4.2 ��2.0 94%mt, 6%hm P H2change
4.2 ��2.0 78%mt, 22%hm Cl system
3.6 ��2.0 89%mt, 11%hm P H2change
.9 ��2.0 100%mt Short term
.2–4.6 �2.0 to �2.2 95%hm,5%mt
.0–5.3 �2.0 to �3.5 80%hm, 20%mt Base titration
.8–4.7 �2.3 to �3.9 100%mt Acid/base titration
.2–3.7 ��2.0 100%mt P H2change
.7–6.4 ��3.1 Mt/Mh/Fe(OH)2?
.7–5.8 ��2.8 Mt/Mh/Fe(OH)2?
P H2change

Iron oxide transformations in hydrothermal systems 6145
ORNL. Hematite and/or magnetite were the only identi-fied minerals by XRD in all the starting materials andrun products. Note that maghemite (c-FeIII
2 O3) and iso-structural magnetite are not readily distinguishable fromthe XRD spectra, particularly if maghemite is present insmall quantity relative to magnetite. However, maghemiteis thermodynamically unstable relative to hematite andnormally is observed only in low-temperature environ-ments. Fractions of hematite and magnetite in the runproducts at the end of each run were estimated from thepeak height ratio and those of standards with known frac-tions of hematite and magnetite. The method is semi-quan-titative and accuracy of the estimate is ±�5 mol% asmineral fractions, although some factors, such as differencein crystallinity or grain size, may cause the accuracy to beworse. Standards and three run samples (runs #4, #7, and#9) were also analyzed using a Rigaku DMAX-RapidMicrodiffractometer with MoKa X-ray radiation at PennState. In the estimate, peak area ratios were used insteadof peak height ratios. The results obtained at ORNL andPenn State (PSU) were consistent, displaying a differencein the estimates of the three run samples of less than3 mol% (#4: 21% (ORNL) vs. 21% (PSU), #7: 6% vs.5%, and #9: 11% vs. 8%). Although the Mo source maybe superior for determining the fraction of hematite, weused the Cu source results in the discussion for consistency.We also calculated the fraction of hematite and magnetiteduring hydrogen pressure change experiments (shown inFig. 2), based on the mineral fraction at the end of the runsestimated by XRD and reduction rates of FeIII by hydro-gen calculated in Section 4.1.7 at each temperature. Detailsof the estimation method are described in Sections 4.1.4and 4.1.7.
3. RESULTS
All the experimental data obtained, including those at150 �C (Otake et al., 2007), and those at 100, 200, and250 �C are presented in Supplementary data. The first seriesof experiments were intended to investigate the effect ofhydrogen pressure on the chemical compositions of experi-mental solutions in magnetite experiments (runs #4, #7, #9,and #15). No significant change in pH or Fe concentrationwas observed corresponding to the hydrogen pressure in-crease of up to an order of magnitude at 150 �C (Fig. 2a).At the end of runs, both magnetite and hematite are identi-fied in the run products by XRD analysis. The fraction ofhematite in the run products estimated from the XRD spec-tra is 21 mol% for the 4-day run and 6 mol% for the 16-dayrun. SEM images of the 4-day run product show that large(�4 � �6 lm) ditrigonal dipyramidal crystals of hematiteformed (Fig. 3a), compared with the �1 lm, euhedral mag-netite starting material. Otake et al. (2007) confirmed thatthe dipyramidal crystals are monolithic hematite by TEMelectron diffraction patterns. In contrast, SEM images ofthe long-term, 16-day run product show that hematite crys-tals in the run product are slightly rounded and smaller, 3–5lm size (Fig. 3b).
When hydrogen pressure was increased from 0.05 to�5 MPa after 6 days at 200 �C (run #9), the pH of the solu-
tion slightly increased from 3.5 to 3.6 (Fig. 2b). No changein Fe concentration was observed. Note that the total dis-solved Fe concentrations in our experimental solutionsare much higher than the measured H+ concentrations.On the other hand, at 250 �C, the pH spontaneously (i.e.,without increasing hydrogen pressure) increased after3 days, and reached the second steady state after 5 days atpH 3.5 (Fig. 2c). Then, when hydrogen pressure was in-creased from 0.2 to �4 MPa after 6 days, the pH of thesolution increased from 3.5 to 3.7. XRD analysis indicatesthat the run product at 200 �C contains 11 mol% hematite.The SEM images show that the hematite crystals at 200 �Care rounded and their grain size is smaller (2–3 lm; Fig. 3c)than those found in the short-term, 4-day run product at150 �C. On the other hand, only magnetite (no hematite)is identified in the 250 �C run product by XRD and SEM(Fig. 3d).
A second series of experiments were conducted to inves-tigate the pH dependence of dissolved Fe speciation andthe transformation mechanisms of iron oxides. Otakeet al. (2007) performed magnetite + acid/base titrationexperiments at 150 �C, yielding the regression line of log[-Fe] = �1.98pH + 6.28 in the log[Fe]–pH diagram (thin so-lid line in Fig. 4). The slope very close to �2 indicated thatthe dominant species in the experimental solutions wasFe2+. However, our new data obtained from a hema-tite + base titration experiment (run #12) yielded a slopeof �1.4 in the log[Fe]–pH diagram (bold solid line inFig. 4). In two runs (#11 and #12), hematite was used asthe starting material at 150 �C (Fig. 5a). It should beemphasized that, in these experiments, Fe was added onlyas hematite (FeIII
2 O3) into the system and no FeII was ini-tially present. It should be also noted that hematite startingmaterial was finer-grained (e.g., <0.5 lm; Otake et al.,2007) than the magnetite starting material (e.g., �1 lm).We kept hydrogen pressure constant at �5 MPa through-out the experiments. Hematite experiments needed muchlonger duration (�3 days) to reach the steady state, com-pared with magnetite experiments. XRD analysis indicatesthat the run products contain both hematite and magne-tite, the latter in the form of much larger euhedral grainsclearly exhibiting the cubic crystal structure (cf. Otakeet al., 2007). Fractions of magnetite estimated by XRDanalysis are �5 mol% for run #11, and 20 mol% for run#12. At 200 �C, acid/base titrations were performed inmagnetite experiments (Fig. 5b), yielding the regressionline of log[Fe] = �2.00pH + 5.44 in the log[Fe]–pH dia-gram (Fig. 6).
The third series of experiment was conducted to investi-gate the possible presence of maghemite (c-FeIII
2 O3) as aprecursor of hematite at a lower temperature, 100 �C (runs#18 and #21; Fig. 5c). While hydrogen pressure was keptconstant at �3 MPa in run #18, it was increased from 0.8to 6 MPa after 6 days in run #21. In both experiments, afterreaching the first steady state at pH �3.7 within 36 h, pHgradually increased to �6. While the pH increase occurredspontaneously after 3 days in run #18, it was induced by thehydrogen pressure increase after 8 days in run #21. No sig-nificant change in Fe concentration was observed in eitherexperiment. XRD analysis indicates no hematite present

stage I stage II stage III stage I stage II stage III stage I stage III stage IV6.0
7.0
8.0
9.0
-1.5
-1
-0.5
0
0.5
1
-1.5
-1
-0.5
0
0.5
1pH
logP
H2 (
MPa
)lo
g[Fe
] (m
ol/k
g)(a) Magnetite + acid (150ºC) (b) Magnetite + acid (200ºC) (c) Magnetite + acid (250ºC)
1.5
2
3.5
4
~~
1.5
2
3.5
4
~~
Estim
ated
m
iner
al fr
actio
n
MagnetiteMagnetite
Magnetite
HematiteHematite
Hematite
log(
[Fe]
/[H+ ]
2 )
-2.02
-2.00
-1.98
-1.96
-1.94
-2.02
-2.00
-1.98
-1.96
-1.941.5
2
4
4.5-1.5
-1
-0.5
0
0.5
1
H2 added
H2 added H2 added
Run #9 Run #15
~~
-2.02
-2.00
-1.98
-1.96
-1.94
0
0.2
0.4
0.6
0.8
1
0 4 8 12 16 0
0.2
0.4
0.6
0.8
1
0 4 8 120
0.2
0.4
0.6
0.8
1
0 4 8 12Time (day) Time (day) Time (day)
#4#7
Run #4Run #7
Mt-HmMt dissolution
Mt-HmMt dissolution
4.5
6.0
7.5
4.0
5.0
6.0
7.0Mt-HmMt dissolution
Fig. 2. Hydrogen pressure, solution compositions, and modeled mineral fractions of the hydrogen pressure change experiments at (a) 150 �C,(b) 200 �C, and (c) 250 �C runs. Magnetite was reacted with a 2.0 � 10�2 mol/kg triflic acid + 8.5 � 10�2 mol/kg NaTriflate solution in eachrun. Hydrogen pressure was increased during the experiments. While no change in pH or Fe concentration was observed at 150 �C, pHincreased corresponding to the PH2 changes at 200 and 250 �C. Dotted and Dashed-dotted lines are predicted solution compositions for non-redox transformation between magnetite and hematite, and reductive dissolution of magnetite at the experimental hydrogen pressures,respectively (Baes and Mesmer, 1976; Helgeson et al., 1978; Johnson et al., 1992; Shock et al., 1997). Shaded areas are interpreted as timeperiods during which the solution compositions were not equilibrated. Modeled fractions of hematite and magnetite were estimated based onthe P H2
values and calculated effective rate constants that are obtained in Section 4.1.5. Moles of hematite formed by non-redox reaction wereestimated from pH change in the first 24 h of each run. Hematite was formed with concomitant proton consumption in the first �24 h (StageI), then the fraction of hematite/magnetite reached the steady state values at low P H2
pressures (Stage II). When P H2was increased, the
hematite fractions were significantly decreased (Stage III). After all the hematite was consumed, chemical compositions of the solutions werecontrolled by reductive dissolution of magnetite (Stage IV).
6146 T. Otake et al. / Geochimica et Cosmochimica Acta 74 (2010) 6141–6156
in the run products. This, however, does not preclude thepresence of maghemite, either as a separate phase or as
an iron-deficient solid-solution with isostructural magne-tite, as described in Section 2.3.

(c)
(a) (b)
(d)
Fig. 3. SEM images of (a) 150 �C short-term run product (run #4), and (b) 150 �C long-term run product (run #7), (c) 200 �C run product(run #9), and (d) 250 �C run product (run #15). Scale bars are (a and b) 4 lm, and (c and d) 1 lm. The long-term run at 150 and 200 �C runshow dissolution features of dipyramidal hematite crystals, compared with the short-term run at 150 �C. No hematite crystals are observed in250 �C runs.
Iron oxide transformations in hydrothermal systems 6147
4. DISCUSSION
4.1. Non-redox and redox transformations between magnetite
and hematite in H2-rich hydrothermal solutions
4.1.1. Response of solution composition to P H2change
To distinguish which of reactions (2), (3), or (5) controlsthe chemical composition of the experimental solution ateach temperature, we conducted hydrogen pressure changeexperiments during which P H2
was increased orders of mag-nitude. Because hydrogen is involved in reductive dissolu-tion of magnetite and hematite (i.e., reactions (2) and (3)),the solution compositions resulting from the redox-equilib-rium reactions are functions of hydrogen pressure:
logð½Fe2þ�=½Hþ�2Þ ¼ log Q2 þ 1=3 log P H2ð6Þ
and
logð½Fe2þ�=½Hþ�2Þ ¼ log Q3 þ 1=2 log P H2ð7Þ
where Q2 and Q3 are the stoichiometric molal solubilityquotients for reductive dissolution of magnetite and hema-tite, respectively. On the other hand, the solution composi-tions controlled by non-redox transformation betweenmagnetite and hematite are independent of hydrogenpressure:
logð½Fe2þ�=½Hþ�2Þ ¼ log Q5 ð8Þ
where Q5 is the solubility quotient for non-redox transfor-mation between magnetite and hematite.
When Otake et al. (2007) varied hydrogen pressure from0.05 to 5 MPa at 150 �C, log([Fe]/[H+]2) values of theexperimental solution remained constant at 6.43 ± 0.02for 16 days (also shown in Fig. 2a). This clearly indicatesa lack of redox equilibrium during the experiments. Thelog([Fe]/[H+]2) values agreed better with those predictedfor non-redox transformation of magnetite to hematite(6.10), than those for reductive dissolution of magnetite(7:57þ 1=3 log P H2
), and hematite (8:31þ 1=2 log P H2),
based on available thermodynamic data (Baes and Mesmer,1976; Helgeson et al., 1978; Johnson et al., 1992; Shocket al., 1997). The Fe concentration and pH in titrationexperiments at 150 �C and P H2
¼� 1 MPa fall on the line:log[Fe] = �1.98pH + 6.23 (Otake et al., 2007; also shownin Fig. 4). This line was also more consistent with the linepredicted for non-redox transformation between magnetiteand hematite than that for reductive dissolution of magne-tite or hematite under the P H2
conditions (Fig. 4). There-fore, the results of both hydrogen pressure changeexperiments and titration experiments suggest that thechemical compositions of the experimental solution at150 �C are controlled by non-redox reaction (5).
At 200 �C, log([Fe]/[H+]2) values of the experimentalsolution were 5.11 at P H2
¼ 0:05 MPa, which were alsomuch closer to those calculated for the non-redox reaction(4.98) than those predicted for the redox reactions at the

-6
-5
-4
-3
-2
-1
4 4.5 5 5.5 6
Hematite + acid titration (150ºC)lo
g [F
e] (m
ol/k
g)
pH
Run #11Run #12 (bas e titration)Non-redox transformation of Mt-HmReductive dissolution of Mt (PH2=5MPa)Reductive dissolution of Hm (PH2=5MPa)
Fig. 4. Solubility diagrams for titration experiments at 150 �C.Solid arrows indicate the pathways of titration in a hema-tite + acid/base titration experiment. Open symbols are the resultsof magnetite + hydrogen + acid/base titration experiments at150 �C, shown in Otake et al. (2007). While regression line (thinsolid line) produced by magnetite experiments has a slope of �2,which was consistent with thermodynamically predicated non-redox magnetite-hematite transformation line (dotted line), regres-sion line produced by hematite experiment (bold solid line) has aslope of �1.4. Dashed-dotted and long-dashed lines are thepredicted solubility lines for reductive dissolution of magnetiteand hematite at P H2
= 5 MPa, respectively (Baes and Mesmer,1976; Helgeson et al., 1978; Johnson et al., 1992; Shock et al.,1997).
6148 T. Otake et al. / Geochimica et Cosmochimica Acta 74 (2010) 6141–6156
hydrogen pressure (i.e., reductive dissolutions of magnetite,5.52, and hematite, 6.29; Fig. 2b). However, the log([Fe]/[H+]2) values increased by �0.2 log units when we increasedhydrogen pressure from 0.05 to 5.6 MPa. This increase inlog([Fe]/[H+]2), proportional to 1=10 log P H2
, is still muchless than the increase expected from reductive dissolutionof magnetite (proportional to 1=3 log P H2
) or hematite (pro-portional to 1=2 log P H2
). The results suggest that the solu-tion chemistry is controlled by the non-redoxtransformation at 200 �C. However, the slight response tohydrogen pressure change appeared to reflect that the redoxreaction started affecting the solution chemistry due to fas-ter reaction rates, compared with 150 �C.
In contrast, at 250 �C, the log([Fe]/[H+]2) value was�5.0 after 5 days at P H2
¼ 0:2 MPa, which was closer tothat calculated for reductive dissolution of magnetite(4.72) at the experimental hydrogen pressure than that fornon-redox transformation of magnetite to hematite (4.07)or reductive dissolution of hematite (5.55). When we in-creased hydrogen pressure from 0.2 to 3.6 MPa, thelog([Fe]/[H+]2) value increased from 5.2 to 5.4 (Fig. 2c).The results suggest that, at 250 �C, reductive dissolutionof magnetite became important and affected the chemicalcomposition of the experimental solution. Note that, beforereaching �5.2 after 5 days, log([Fe]/[H+]2) values first
became stable at �4.5 between 1 and 3 days. The temporarysteady state suggests that the solution chemistry was con-trolled by the non-redox reaction between magnetite andhematite only in the first 3 days at 250 �C.
4.1.2. Metastability of maghemite
Maghemite, which has a spinel structure and is oftenformed as a result of oxidation of magnetite (Swaddle andOltmann, 1980), is thermodynamically unstable with respectto hematite. However, because transformation of maghemiteto hematite is very slow at room temperature, maghemite is acommon mineral in nature, including weathered volcanicrocks and some soils (Singer and Fine, 1989; Da Costaet al., 1999;). Maghemite can be also formed by a reaction be-tween magnetite and acidic solutions at a low temperature(e.g., <150 �C) by the forward direction of the following reac-tion (Jolivet and Tronc, 1988; White et al., 1994):
Fe3O4ðmtÞ þ 2HþðaqÞ $ Fe2O3ðmhÞ þ Fe2þðaqÞ þH2O ð9Þ
This process can be viewed as leaching of Fe2+ from mag-netite by an acidic solution, leaving isostructural, butiron-deficient, maghemite behind. This is supported bythe studies of Jolivet and Tronc (1988) wherein room tem-perature acid/base titrations of magnetite nanoparticles re-sulted in reversible magnetite–maghemite transformations(9) with no change in particle size or morphology. At lowtemperature, maghemite may also form a solid-solutionwith magnetite, such that within the same particle, someportions of the particle are magnetite-rich, and other partsmaghemite-rich. The solubility quotient for reaction (9), Q9
is described as follows:
log Q9 ¼ logð½Fe2þ�=½Hþ�2Þ ð10Þ
Recent calorimetric studies by Majzlan et al. (2003a,b) pro-vide thermodynamic data for maghemite. According totheir results, the logQ9 value is expected to be 5.13 at100 �C. During our 100 �C experiments, we observed steadystates twice. The first steady state occurred after 3 days inrun #18 and after 6 days in run #21. The log([Fe]/[H+]2) va-lue (5.37) obtained during the first steady state was signifi-cantly lower than predicted logQ5 values at thistemperature (7.51), but are in reasonably good agreementwith the calculated value for logQ9 values (Fig. 5c). Thisobservation indicates that maghemite was present duringthe first steady state in the 100 �C experiments. The differ-ence between the observed and predicted solubility quo-tients for Q9 corresponds to a change in the free energyof formation of maghemite of only 2 kJ/mol at this temper-ature, relative to the value of �736 kJ/mol for maghemitereported by Majzlan et al. (2003a,b).
When both runs #18 and #21 reached to the secondsteady state, the log([Fe]/[H+]2) values (e.g., 9.32 in run#21) were consistent with those predicted for reductive dis-solution of magnetite (e.g., 9.44; Fig. 5c), possibly indicat-ing that reduction of FeIII in maghemite occurred within14 days at 100 �C. The apparent control of solution compo-sitions by redox reactions and lack of hematite in the runproduct may be explained by reductive dissolution of meta-stable maghemite that occurred at a greater rate than thatof hematite in the higher temperature experiments:

#18 #21
#18#21
4
5
6
7
8
pHlo
g[Fe
] (m
ol/k
g)lo
g([F
e]/[H
+ ]2 )
logP
H2 (
MPa
)
-1.5
-1
-0.5
0
0.5
1
1
2
3
4
5
6
-3.5
-3
-2.5
-2
-1.5
1
3
5
7
9
0 4 8 12 16
OH- added
OH- addedH+ added
H2 addedH2 added H2 added
-1.5
-1
-0.5
0
0.5
1
3
3.5
4
4.5
5
-4
-3.5
-3
-2.5
-2
0 4 8 12
-1.5
-1
-0.5
0
0.5
1
2
3
4
5
6
7
-4
-3.5
-3
-2.5
-2
Time (day) Time (day) Time (day)
Run #11Run #12
Run #18Run #21Run #14
Mt-HmMt dissolution
4
8
12
16
0 5 10 15 20 25
Hematite + base titration (150ºC)
Magnetite + acid/base titration (200ºC) Magnetite + acid (100ºC)(a) (b) (c)
Mt-HmMt dissolutionHm dissolution
Mt-MhMt-HmMt dissolution
Fig. 5. Hydrogen pressure and solution compositions of (a) hematite experiments at 150 �C, and magnetite experiments at (b) 200 �C and (c)100 �C. Base and/or acid were added during the titration experiments. Predicted chemical compositions of the experimental solution areindicated for non-redox transformation between magnetite and hematite (dotted lines), reductive dissolution of magnetite (dash-dotted lines),reductive dissolution of hematite at the experimental hydrogen pressures (long-dashed lines), and non-redox transformation betweenmagnetite and maghemite (dashed lines), (Baes and Mesmer, 1976; Helgeson et al., 1978; Johnson et al., 1992; Shock et al., 1997). In hematiteexperiments, Fe concentration decreased during base titrations. In magnetite titration experiment at 200 �C, a base titration resulted in asignificant change in the log([Fe]/[H+]2) value, which appeared to be controlled by the reductive dissolution of magnetite at the end of the run.At 100 �C, steady states were observed twice. The log([Fe]/[H+]2) values at the first steady state were lower than those predicated for non-redox transformation between magnetite and hematite, but were more consistent with those for non-redox transformation between magnetiteand maghemite. On the other hand, log([Fe]/[H+]2) values at the second steady state were close to those predicted for reductive dissolution ofmagnetite. Shaded areas are interpreted as time periods during which the solution compositions were not equilibrated.
Iron oxide transformations in hydrothermal systems 6149
1=2Fe2O3ðmhÞ þ 2HþðaqÞ þ 1=2H2ðgÞ ! Fe2þðaqÞ þ 3=2H2O
ð11Þ
Alternative possibility for yielding the high solubility quo-tient toward the end of runs #18 and #21 is the precipita-tion of Fe(OH)2 on the surface of magnetite andmaghemite. There is a large uncertainty in the solubilityof Fe(OH)2 predicated from the literature data, as shownin Fig. 7. Ziemniak et al. (1995) postulated that Fe(OH)2
controls the solubility of magnetite by covering its surfaceat temperatures below 116 �C under reducing conditions
(P H2¼ 0:1 MPa at 25 �C). If we consider the thermody-
namic properties of Fe(OH)2 reported by Ziemniak et al.(1995), it is possible that Fe(OH)2 controlled the solutioncomposition at the second steady state observed in our100 �C experiments. However, other thermodynamic data(e.g., Wagman et al., 1982) indicates much higher solubilityof Fe(OH)2 at our experimental conditions, shown as theupper boundary of Fe(OH)2 stability field in Fig. 7.Fe(OH)2 was not identified in our run products by SEMor XRD analyses, but we did not conduct XPS studies ofthe run products as was done by Ziemniak et al. (1995).
-6
-5
-4
-3
-2
-1
3 3.5 4 4.5 5
Magnetite + acid/base titration (200ºC)
Run #14 (acid titration)Run #14 (base titration)Non-redox transformation of Mt-HmReductive dissolution of Mt (PH2=1MPa)Reductive dissolution of Hm (PH2=1MPa)
pH
log
[Fe]
(mol
/kg)
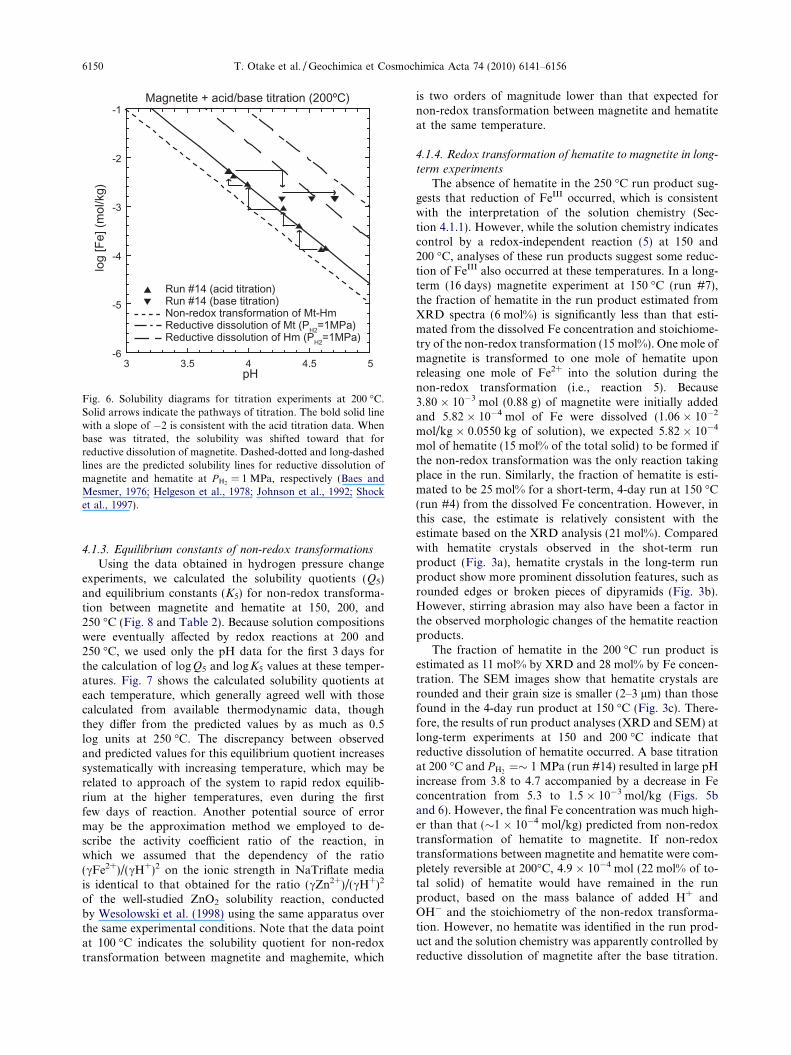
Fig. 6. Solubility diagrams for titration experiments at 200 �C.Solid arrows indicate the pathways of titration. The bold solid linewith a slope of �2 is consistent with the acid titration data. Whenbase was titrated, the solubility was shifted toward that forreductive dissolution of magnetite. Dashed-dotted and long-dashedlines are the predicted solubility lines for reductive dissolution ofmagnetite and hematite at P H2
= 1 MPa, respectively (Baes andMesmer, 1976; Helgeson et al., 1978; Johnson et al., 1992; Shocket al., 1997).
6150 T. Otake et al. / Geochimica et Cosmochimica Acta 74 (2010) 6141–6156
4.1.3. Equilibrium constants of non-redox transformations
Using the data obtained in hydrogen pressure changeexperiments, we calculated the solubility quotients (Q5)and equilibrium constants (K5) for non-redox transforma-tion between magnetite and hematite at 150, 200, and250 �C (Fig. 8 and Table 2). Because solution compositionswere eventually affected by redox reactions at 200 and250 �C, we used only the pH data for the first 3 days forthe calculation of logQ5 and log K5 values at these temper-atures. Fig. 7 shows the calculated solubility quotients ateach temperature, which generally agreed well with thosecalculated from available thermodynamic data, thoughthey differ from the predicted values by as much as 0.5log units at 250 �C. The discrepancy between observedand predicted values for this equilibrium quotient increasessystematically with increasing temperature, which may berelated to approach of the system to rapid redox equilib-rium at the higher temperatures, even during the firstfew days of reaction. Another potential source of errormay be the approximation method we employed to de-scribe the activity coefficient ratio of the reaction, inwhich we assumed that the dependency of the ratio(cFe2+)/(cH+)2 on the ionic strength in NaTriflate mediais identical to that obtained for the ratio (cZn2+)/(cH+)2
of the well-studied ZnO2 solubility reaction, conductedby Wesolowski et al. (1998) using the same apparatus overthe same experimental conditions. Note that the data pointat 100 �C indicates the solubility quotient for non-redoxtransformation between magnetite and maghemite, which
is two orders of magnitude lower than that expected fornon-redox transformation between magnetite and hematiteat the same temperature.
4.1.4. Redox transformation of hematite to magnetite in long-
term experiments
The absence of hematite in the 250 �C run product sug-gests that reduction of FeIII occurred, which is consistentwith the interpretation of the solution chemistry (Sec-tion 4.1.1). However, while the solution chemistry indicatescontrol by a redox-independent reaction (5) at 150 and200 �C, analyses of these run products suggest some reduc-tion of FeIII also occurred at these temperatures. In a long-term (16 days) magnetite experiment at 150 �C (run #7),the fraction of hematite in the run product estimated fromXRD spectra (6 mol%) is significantly less than that esti-mated from the dissolved Fe concentration and stoichiome-try of the non-redox transformation (15 mol%). One mole ofmagnetite is transformed to one mole of hematite uponreleasing one mole of Fe2+ into the solution during thenon-redox transformation (i.e., reaction 5). Because3.80 � 10�3 mol (0.88 g) of magnetite were initially addedand 5.82 � 10�4 mol of Fe were dissolved (1.06 � 10�2
mol/kg � 0.0550 kg of solution), we expected 5.82 � 10�4
mol of hematite (15 mol% of the total solid) to be formed ifthe non-redox transformation was the only reaction takingplace in the run. Similarly, the fraction of hematite is esti-mated to be 25 mol% for a short-term, 4-day run at 150 �C(run #4) from the dissolved Fe concentration. However, inthis case, the estimate is relatively consistent with theestimate based on the XRD analysis (21 mol%). Comparedwith hematite crystals observed in the shot-term runproduct (Fig. 3a), hematite crystals in the long-term runproduct show more prominent dissolution features, such asrounded edges or broken pieces of dipyramids (Fig. 3b).However, stirring abrasion may also have been a factor inthe observed morphologic changes of the hematite reactionproducts.
The fraction of hematite in the 200 �C run product isestimated as 11 mol% by XRD and 28 mol% by Fe concen-tration. The SEM images show that hematite crystals arerounded and their grain size is smaller (2–3 lm) than thosefound in the 4-day run product at 150 �C (Fig. 3c). There-fore, the results of run product analyses (XRD and SEM) atlong-term experiments at 150 and 200 �C indicate thatreductive dissolution of hematite occurred. A base titrationat 200 �C and P H2
¼� 1 MPa (run #14) resulted in large pHincrease from 3.8 to 4.7 accompanied by a decrease in Feconcentration from 5.3 to 1.5 � 10�3 mol/kg (Figs. 5band 6). However, the final Fe concentration was much high-er than that (�1 � 10�4 mol/kg) predicted from non-redoxtransformation of hematite to magnetite. If non-redoxtransformations between magnetite and hematite were com-pletely reversible at 200�C, 4.9 � 10�4 mol (22 mol% of to-tal solid) of hematite would have remained in the runproduct, based on the mass balance of added H+ andOH� and the stoichiometry of the non-redox transforma-tion. However, no hematite was identified in the run prod-uct and the solution chemistry was apparently controlled byreductive dissolution of magnetite after the base titration.
5MPa
0.05MPa
Temperature (ºC)
log(
[Fe]
/[H+ ]
2 )
4
6
8
10
12
100 150 200 250
Experimental dataNon-redox transformation of Mt-HmNon-redox transformation of Mt-MhReductive dissolution of MtDissolution of Fe(OH)2
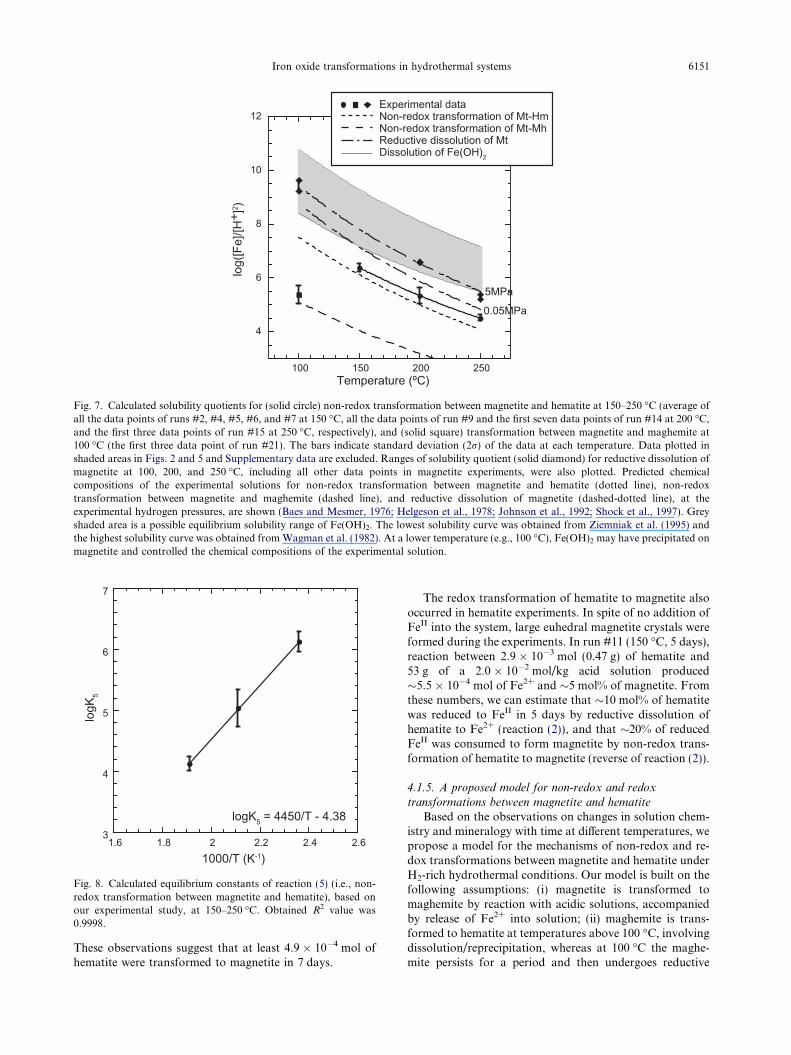
Fig. 7. Calculated solubility quotients for (solid circle) non-redox transformation between magnetite and hematite at 150–250 �C (average ofall the data points of runs #2, #4, #5, #6, and #7 at 150 �C, all the data points of run #9 and the first seven data points of run #14 at 200 �C,and the first three data points of run #15 at 250 �C, respectively), and (solid square) transformation between magnetite and maghemite at100 �C (the first three data point of run #21). The bars indicate standard deviation (2r) of the data at each temperature. Data plotted inshaded areas in Figs. 2 and 5 and Supplementary data are excluded. Ranges of solubility quotient (solid diamond) for reductive dissolution ofmagnetite at 100, 200, and 250 �C, including all other data points in magnetite experiments, were also plotted. Predicted chemicalcompositions of the experimental solutions for non-redox transformation between magnetite and hematite (dotted line), non-redoxtransformation between magnetite and maghemite (dashed line), and reductive dissolution of magnetite (dashed-dotted line), at theexperimental hydrogen pressures, are shown (Baes and Mesmer, 1976; Helgeson et al., 1978; Johnson et al., 1992; Shock et al., 1997). Greyshaded area is a possible equilibrium solubility range of Fe(OH)2. The lowest solubility curve was obtained from Ziemniak et al. (1995) andthe highest solubility curve was obtained from Wagman et al. (1982). At a lower temperature (e.g., 100 �C), Fe(OH)2 may have precipitated onmagnetite and controlled the chemical compositions of the experimental solution.
3
4
5
6
7
1.6 1.8 2 2.2 2.4 2.6
logK
5
1000/T (K-1)
logK5 = 4450/T - 4.38
Fig. 8. Calculated equilibrium constants of reaction (5) (i.e., non-redox transformation between magnetite and hematite), based onour experimental study, at 150–250 �C. Obtained R2 value was0.9998.
Iron oxide transformations in hydrothermal systems 6151
These observations suggest that at least 4.9 � 10�4 mol ofhematite were transformed to magnetite in 7 days.
The redox transformation of hematite to magnetite alsooccurred in hematite experiments. In spite of no addition ofFeII into the system, large euhedral magnetite crystals wereformed during the experiments. In run #11 (150 �C, 5 days),reaction between 2.9 � 10�3 mol (0.47 g) of hematite and53 g of a 2.0 � 10�2 mol/kg acid solution produced�5.5 � 10�4 mol of Fe2+ and �5 mol% of magnetite. Fromthese numbers, we can estimate that �10 mol% of hematitewas reduced to FeII in 5 days by reductive dissolution ofhematite to Fe2+ (reaction (2)), and that �20% of reducedFeII was consumed to form magnetite by non-redox trans-formation of hematite to magnetite (reverse of reaction (2)).
4.1.5. A proposed model for non-redox and redox
transformations between magnetite and hematite
Based on the observations on changes in solution chem-istry and mineralogy with time at different temperatures, wepropose a model for the mechanisms of non-redox and re-dox transformations between magnetite and hematite underH2-rich hydrothermal conditions. Our model is built on thefollowing assumptions: (i) magnetite is transformed tomaghemite by reaction with acidic solutions, accompaniedby release of Fe2+ into solution; (ii) maghemite is trans-formed to hematite at temperatures above 100 �C, involvingdissolution/reprecipitation, whereas at 100 �C the maghe-mite persists for a period and then undergoes reductive

Table 2Calculated solubility quotients and equilibrium constants.
(a) Non-redox transformation of magnetite–hematite ðFe3O4ðmtÞ þ 2HþðaqÞ $ Fe2O3ðhmÞ þ Fe2þðaqÞ þH2OÞ
Solubility quotienta
(logQ5)Number ofsamples
Uncertainity(as 2r)
Ionicstrength
Activity correctionb
(logQ5/K5)Equilibrium constanta,c
(logK5)
150 �C 6.4 37 0.2 0.12 0.25 6.1200 �C 5.3 14 0.3 0.12 0.30 5.0250 �C 4.5 3 0.1 0.12 0.38 4.1
(b) Non-redox transformation of magnetite–maghemite ðFe3O4ðmhÞ þ 2HþðaqÞ $ Fe2O3ðhmÞ þ Fe2þðaqÞ þH2OÞ
Solubility quotienta
(logQ5)Number ofsamples
Uncertainity(as 2r)
Ionicstrength
Activity correctionb
(logQ9/K9)Equilibrium constanta
(logK9)
100 �C 5.4 3 0.2 0.11 0.21 5.2
a While logQ5 and logQ9 is defined as logð½Fe2þðaqÞ�=HþðaqÞ�
2Þ; log K5 and logK9 is defined as logðfFe2þðaqÞg=fFe2þ
ðaqÞg2Þ.
b Activity correction was made based on the assumption that dependency of the activity coefficient ratio of reactants vs products on the ionicstrength is identical to that of well-studied ZnO solubility experiment by Wesolowski et al. (1998).
c Regression line for logK5:logK5 = 4450/T � 4.38 (427K < T < 523K) (see Fig. 8).
6152 T. Otake et al. / Geochimica et Cosmochimica Acta 74 (2010) 6141–6156
transformation to magnetite; (iii) magnetite crystals nucle-ate by reaction of dissolved Fe2+ and Fe(OH)3(aq), andhematite crystals rapidly form by precipitation of Fe(O-H)3(aq); (iv) reduction of Fe(OH)3(aq) by H2 is slow, butthe rate increases as temperature increases. Our model fur-ther indicates that Fe(OH)3(aq) is the dominant ferric ironspecies in solution, but in most experiments was not a sig-nificant species relative to Fe2+, shuttling rapidly betweensolid phases during dissolution/precipitation processes.The model is illustrated by the following chemicalreactions:
Fe3O4ðmtÞ þ 2HþðaqÞ ! Fe2þðaqÞ þ Fe2O3ðmhÞ þH2O ð12Þ
Fe2O3ðmhÞ þ 3H2O ! 2FeðOHÞ3ðaqÞ ð13Þ2FeðOHÞ3ðaqÞ ! Fe2O3ðhmÞ þ 3H2O ð14ÞFe2O3ðhmÞ þ 3H2O ! 2FeðOHÞ3ðaqÞ ð15Þ
2FeðOHÞ3ðaqÞ þ Fe2þðaqÞ ! Fe3O4ðmtÞ þ 2HþðaqÞ þ 2H2O
ð16Þ
2FeðOHÞ3ðaqÞ þH2ðgÞ þ 4HþðaqÞ ! 2Fe2þðaqÞ þ 6H2O
ð17Þ
When reaction (13) is fast, maghemite may not be recogniz-able as a precursor of hematite. Then, magnetite is congru-ently dissolved as Fe2þ
ðaqÞ and Fe(OH)3(aq) by the combinationof reaction (12) and (13):
Fe3O4ðmtÞ þ 2HþðaqÞ þ 2H2O! Fe2þðaqÞ þ 2FeðOHÞ3ðaqÞ ð18Þ
This reaction (18) may have occurred in magnetite experi-ments above 100 �C, because we did not observe any indi-cations of maghemite present during the experiments.However, the solution stoichiometries at T > 100 �C indi-cate rapid precipitation of released Fe(OH)3(aq) via reaction(14) or reaction (16).
Combination of reactions (14) and (18) gives an overallreaction of “non-redox transformation of magnetite tohematite” (forward reaction (5)). The reaction mechanisminvolving aqueous FeIII species explains the growth of largeeuhedral hematite (Otake et al., 2007). Combination of
reactions (15) and (16) gives an overall reaction of “non-re-dox transformation of hematite to magnetite” (reverse reac-tion (5)). Combination of reactions (17) and (18) gives anoverall reaction of reductive dissolution of magnetite (reac-tion (2)). Combination of reactions (15) and (17) gives anoverall reaction of reductive dissolution of hematite (reac-tion (3)). Combination of reactions (15)–(17) (3 � reaction(15) + 2 � reaction (16) + reaction (17)) gives an overallreaction of redox transformation of hematite to magnetite(reaction (1)). In a hydrogen pressure change experimentat 150 �C (run #7), Fe concentrations and pH were con-stant throughout the experiments (Fig. 2a), regardless ofwhether or not reduction of Fe(OH)3(aq) occurred, as dis-cussed in the previous section. This suggests that all Fe2+
produced by reduction of Fe(OH)3(aq) (reaction (17)) wasreacted with hematite by non-redox transformation ofhematite to magnetite (reaction (5)) with no apparentchange in the overall solution chemistry.
On the other hand, in a hematite experiment at 150 �C(run#12), base titration yielded a slope of �1.4 in thelog[Fe]–pH diagram (Fig. 4), indicating that Fe2+ was notthe only dominant species in the solution. We speculate thataqueous FeIIIspecies (e.g., Fe(OH)3(aq)) were metastablypresent in the experimental solution. If we assume Fe2+
and Fe(OH)3(aq) were the two dominant species in theexperiment, �30% of dissolved Fe would have beenFe(OH)3(aq) based on the observed slope of �1.4. This ismuch greater abundance than predicted at the equilibriumP½FeIII�=
P½FeII� ratios (10�11 and 10�4) under the experi-
mental conditions (Mesmer et al., 1970; Shock et al., 1997).However, currently, there is no reasonable explanation whythe aqueous FeIII species were metastably present in thishematite experiment.
4.1.6. Electron exchange on the surface of iron oxides
Aqueous FeII species are known to facilitate dissolutionof FeIII-bearing minerals through surface adsorption andelectron exchange between FeII and FeIII (e.g., Stummand Sulzberger, 1992; Pedersen et al., 2005, Yanina andRosso, 2008). Dissolution occurs by the following sequence:

Iron oxide transformations in hydrothermal systems 6153
BFeIII–OHþFe2þðaqÞ ! � ðFeIII–O–FeIIÞþ þHþðaqÞ ð19Þ
(adsorption of aqueous Fe2+ on the FeIII-mineral surface)
� ðFeIII–O–FeIIÞþ ! � ðFeII–O–FeIIIÞþ ð20Þ
(interfacial electron transfer)
ð21Þ
(detachment of FeII and FeIII from the surface =dissolution)
where „FeIII–OH and „(FeIII–O–FeII)+ indicate sur-face species. The rates of reactions (12), (15), and (18)may be facilitated by the presence of Fe2+ in the solution.In both magnetite and hematite experiments, aqueousFe2+ release into solution was associated with consumptionof H+ in the initial solution. Hematite produced in magne-tite experiments exhibits ditrigonal dipyramid morphology(Fig. 3a), which is similar to hematite observed in a recentlystudy by Yanina and Rosso (2008). They reported the rapidgrowth of monolithic hematite ‘pyramid’s on the 001 basalsurface of hematite, with the c-axis perpendicular to the001 surface, from anoxic solutions at room temperature,in which Fe2+ was the stable aqueous species. Yanina andRosso (2008) argued, based on novel manipulation of ex-posed surfaces to the aqueous phase, that Fe2+ ions adsorbat the 001 surface and release electrons into the crystal,leaving behind Fe3+ ions that grow as the hematite pyra-mids, in crystallographic registry with the underlying hema-tite substrate. The electrons migrate to edge sites, wherethey convert Fe3+ ions of the bulk crystal surface intoFe2+ species, which are then released into solution to com-plete the circuit. Based on similarity in the observed mor-phology, the formation mechanism of hematite pyramidsproposed by Yanina and Rosso (2008) may be applicableto formation of the hematite crystals observed in ourexperiments.
4.1.7. Reduction kinetics of FeIII by H2
According to the difference in hematite fractions esti-mated from XRD and Fe concentration, �60% of hematiteinitially formed through the non-redox reaction (�10 mol%of total solid) was transformed to magnetite at 150 �C after16 days, and �60% of hematite (�20 mol% of total solid)was transformed to magnetite after 11 days at 200 �C. At250 �C, hematite was completely transformed to magnetiteafter 10 days, but likely transformed before 3.5 days whenthe large pH increase from 3.2 to 3.6 (Fig. 2c) was observed.
Table 3Calculated reduction rates of FeIII by H2.
Elapsedtime (day)
P H2ðMPaÞ Hematite fraction
estimated by XRD (m
150 �C (run #7) 16 0.05–3.5 6200 �C (run #9) 11 0.05–5 11250 �C (run #15) 10* 0.3–4 0
* All hematite is assumed to be transformed to magnetite after 3.5 days.
The pH increase is interpreted as the transition from non-redox transformation between magnetite and hematite toreductive dissolution of magnetite as the predominant reac-tion to control the solution chemistry. The transition wouldhave been caused by the complete redox transformation ofhematite to magnetite within 3.5 days. Based on the aboveestimates, we calculated mineral fractions of magnetite andhematite during the experiments (shown in Fig. 2). It wasassumed for the estimates that reduction kinetics of reac-tion (17) is only dependent on hydrogen pressure by the firstorder, and that other parameters (e.g., pH, concentration ofaqueous FeIII species, surface area of hematite) are approx-imately in a steady state, and therefore, can be treated asconstants. Then, we can estimate the rate equation as thefollowing:
R ¼ d½Fe2þ�dt
¼ kef P H2ð22Þ
where kef = k � [Fe(OH)3(aq)] � [H+]n.The first order kinetics in terms of hydrogen pressure
refers to a previous study on reductive dissolution of goe-thite by hydrogen (Fischer, 1987). The calculated rate con-stants, kef in units of mmol kg H2O�1 day�1 MPa�1, were0.2, 0.3, and 8 at 150, 200, and 250 �C, respectively (Ta-ble 3). Reduction rates of FeIII thus obtained in our exper-iments are much faster than those obtained in previousexperimental studies (Kishima and Sakai, 1984; Seyfriedet al., 1987). They showed that redox equilibrium betweenhematite and magnetite was established much more slowly(�80 days at 300 �C with an initial excess of H2,P H2
> 0:1 MPa). This is presumably due to Pt electrodesin our experiments catalyzing the reduction of aqueousFeIII by hydrogen.
4.2. Implications
Regardless of the possible effect of Pt electrodes catalyz-ing the reduction kinetics, our experimental results demon-strated that non-redox transformations between magnetiteand hematite (and magnetite and maghemite) occurred overa wide range of temperature and hydrogen pressure condi-tions. Without an effective catalyst in natural systems, redoxkinetics may be much slower, and the non-redox transfor-mations may control the chemical compositions of hydro-thermal fluids over much longer time scales. We proposethat transformation mechanisms of iron oxides revealed inthis study are applicable to various natural and laboratorysystems involving low-temperature hydrothermal fluids,which were also discussed partly in Otake et al. (2007).
ol%)Hematite fractionestimated from [Fe] (mol%)
Rate constant (mmol kgH2O�1 day�1 MPa�1)
15 0.228 0.327 8

6154 T. Otake et al. / Geochimica et Cosmochimica Acta 74 (2010) 6141–6156
4.2.1. Transformation between hematite and magnetite in
various hydrothermal systems
Coexistence of hematite (or FeIII (hydr)oxides) and mag-netite has been long recognized in various hydrothermalenvironments: modern seafloor hydrothermal systems (Pot-torf and Barnes, 1983; Zierenberg and Shanks (1983); Rona,1984), volcanogenic massive sulfide (Callow, 1967; Westen-dorp et al., 1991) and oxide (Davidson, 1992; Duhig et al.,1992) deposits, magnetite skarn-deposits (Buseck, 1966;Zurcher et al., 2001; Forster et al., 2004), Olympic Dam-type(Fe oxide–Cu–Au–Co), porphyry Cu deposits (Gow et al.,1994; Lynch and Ortega, 1997; Kolb et al., 2006), andbanded iron formations (BIFs; Ewers and Morris, 1981; La-Berge et al., 1987; Pecoits et al., 2009). Some authors ques-tioned whether redox equilibrium was attained between theiron oxides, and whether enough oxidants/reducants werepresent during the replacement of magnetite to hematite/hematite to magnetite. In the Coxheath Cu–Mo–Au deposit,Lynch and Ortega (1997) proposed the formation of tour-maline by a reaction with albite and magnetite:
12NaAlSi3O8ðalbiteÞ þ 6Fe3O4ðmtÞ þ 6BðOHÞ3ðaqÞ þ 10HþðaqÞ
! 2NaFe3Al6ðBO3Þ3Si6O18ðOHÞ4ðschorlÞ
þ 24SiO2ðqzÞ þ 6Fe2O3ðhmÞ þ 10H2Oþ 10NaþðaqÞ ð23Þ
Although this reaction postulated to control the redox con-ditions of the hydrothermal system by these authors, it isalso a redox-independent reaction; there is no change inthe oxidation state of iron. Therefore, the existence of mag-netite and hematite may not have buffered the P O2
, but in-stead buffered the pH.
For a seawater–basalt interaction, Bischoff and Dickson(1975) carried out an experimental study reacting a basalticrock with a hydrothermal solution at 200 �C and speculatedthat the magnetite + hematite assemblage observed duringthe experiment did not buffer the P O2
, but buffered the pHand ferrous iron concentration in the fluids, however, with-out decisive evidence. Seyfried and Ding (1995) also indicatedthat, in a theoretical treatment for understanding water–rockinteractions in mid-ocean ridges, the non-redox transforma-tion is an important mass action reaction. Our current studyprovides explicit evidence that non-redox transformationsbetween hematite (or FeIII (hydr)oxides) and magnetite occurunder low temperature hydrothermal conditions, and, infact, commonly occur in natural environments.
Coexistence of magnetite and hematite is commonly ob-served in typical oxide-type BIFs. Based on detailed geo-chemical and mineralogical studies, Hoashi et al. (2009)suggested that hematite is a primary mineral in ferruginouscherts (i.e., low-grade oxide BIFs) of the 3.46 Ga MarbleBar Chert, and that magnetite is a transformation productof primary hematite. Several transformation processes havebeen suggested for the transformation of hematite to magne-tite in BIFs, including (a) reduction of hematite by organicmatter during metamorphism (e.g., Perry et al., 1973), (b)biological iron reduction of hematite before diagenesis(e.g., Johnson et al., 2008), (c) reaction between hematiteand siderite (FeIICO3) during metamorphism (e.g., Burt,1972). However, our experimental study showed that non-redox transformation of hematite to magnetite is a plausible
process in these systems, by a reaction between primaryhematite and Fe2+-rich hydrothermal fluids during earlydiagenesis (Ohmoto, 2003; Otake et al., 2007). An importantimplication in considering the origin of magnetite in BIFs isthat magnetite was likely formed under the conditions wherethe system was far from redox equilibrium. Therefore, thepresence of magnetite in BIFs cannot be used to constrainthe atmospheric or oceanic oxygen levels during the deposi-tion of BIFs. This contradicts the recent arguments by Ros-ing et al. (2010) that magnetite and siderite in BIFs were innear-equilibrium with atmospheric gas, and therefore, thathigh atmospheric P H2
ðlog P H2¼ 10�6 MPaÞ was sustained
during the deposition of BIFs.
4.2.2. Role of Pt as a catalyst of redox reactions
Previous experimental studies that investigated redoxreactions (e.g., solubility of redox-sensitive minerals, isotopeexchange reactions) encountered a difficulty reaching the re-dox equilibrium because of the slow reaction rates atT < �500 �C. For example, Ohmoto and Lasaga (1982)showed that redox equilibrium between SO2�
4ðaqÞ andH2S(aq), which is essentially the same as complete exchangeof sulfur isotopes between the species, is nearly attained (i.e.,90% isotope exchange) in �1 year at T = 250 �C, pH 7, andP
S ¼ 10�2 m. The rates of CO2(aq)–CH4(aq) redox reactionsare several orders of magnitude slower than those ofSO2�
4ðaqÞ–H2SðaqÞ reactions (Ohmoto and Goldhaber, 1997).Therefore, currently, solubility of many redox-sensitiveminerals (e.g., Cr2O3, UO2) under various redox conditionsis determined based on thermodynamic data obtained athigh temperatures and extrapolated to low-temperatureranges, which could give a potential error in the solubilitydata.
However, our experimental study surprisingly demon-strates that redox equilibrium in the Fe–H–O system wasattained in 3.5 day, much faster than reaction rates ob-tained by Kishima and Sakai (1984) and Seyfried et al.(1987) in a similar experimental set-up. The major differ-ence between the two groups of experiments was the pres-ence of Pt electrodes in our experimental system. The Ptelectrodes, which were coated with platinum black (i.e.,nano-size Pt particles), were used for in situ pH measure-ment. While the Pt electrodes catalyze the half-cell reactionbetween hydrogen molecules and protons, they also appearto catalyze reduction of FeIII by molecular hydrogen.Therefore, we propose that, by adding finely-divided plati-num in an experimental system, future experimental studieswill give us much more accurate solubility data of redox-sensitive minerals as well as isotope fractionation factorsbetween species with various oxidation states (e.g., CO2–CH4, N2–NH3) in true redox equilibrium under low-tem-perature conditions.
5. CONCLUSION
We conducted a series of experiments (100–250 �C) inwhich hematite or magnetite was reacted with an acid solu-tion under H2-rich hydrothermal conditions, with in situ
measurements of pH and partial hydrogen pressure (P H2).
During the 1–16 day experiments, pH was varied from 1.7

Iron oxide transformations in hydrothermal systems 6155
to 7.3 and P H2was varied from 0.05 to 5 MPa. The exper-
imental results are summarized as follows:
1. The formation of euhedral crystals of hematite in allmagnetite experiments at 150 �C and some experimentsat 200 �C, and euhedral crystals of magnetite in allhematite experiments at 150 �C, indicate that redox-independent acid–base transformations between magne-tite and hematite occurred.
2. Responses of log([Fe]/[H+]2) values to hydrogen pressurechanges indicate that, at 150 and 200 �C, non-redox trans-formation between magnetite and hematite controls thesolution chemistry. However, at 250 �C, reductive disso-lution of magnetite becomes important and affects thesolution chemistry. On the other hand, the presence ofmaghemite was indicated from the chemical compositionof the experimental solution at 100 �C in the first 7 days.
3. A discordance in estimated fraction of hematite in the150 and 200 �C run products from the XRD spectraand from the dissolved Fe concentrations suggests thathematite formed through the non-redox process partiallytransformed back to magnetite by a redox transforma-tion. This redox transformation of hematite to magnetiteoccurs in the following steps: (1) reductive dissolution ofhematite to Fe2+ and (2) non-redox transformation ofhematite and Fe2+ to magnetite. The reduction kineticswas apparently facilitated by the Pt electrodes.
The results of this study suggest that non-redox trans-formations between hematite magnetite occur in varioushydrothermal systems, particularly when redox kineticsare sluggish under low-temperature conditions.
ACKNOWLEDGMENTS
The authors acknowledge H. Barnes, S. Brantley, P. Heaney, T.Lasaga, K. Osseo-Asare, I. Johnson, and D. Bevacqua for valuablecomments on the early manuscript. The authors also acknowledgeJ. Rosenqvist, M. Angelone, and J. Cantolina for technical assis-tance. Comments by K.M. Rosso and two anonymous reviewersare greatly appreciated. This project was supported by grants fromNASA Astrobiology Institute (NCC2-1057; NNA04CC06A) andNSF (EAR-0229556) to H.O. D.J.W.’s effort and a portion ofthe effort of T.O. were supported by the U.S. Department of En-ergy, Office of Basic Energy, Geoscience Research Program, atOak Ridge National Laboratory, managed by UT-Battelle, LLC,for the U.S. Department of Energy (DE-AC05-00OR22725).
APPENDIX A. SUPPLEMENTARY DATA
Supplementary data associated with this article can befound, in the online version, at doi:10.1016/j.gca.2010.07.024.
REFERENCES
Baes C. F. and Mesmer R. E. (1976) The Hydrolysis of Cations.John Wiley & Sons.
Barnes H. L. (1997) Geochemistry of Hydrothermal Ore Deposits,third ed. John Wiley & Sons Inc., New York.
Bischoff J. L. and Dickson F. W. (1975) Seawater-basalt interactionat 200 �C and 500 bars: Implications for origin of sea-floorheavy-metal deposits and regulation of seawater chemistry.Earth. Planet. Sci. Lett. 25, 385–397.
Burt D. M. (1972) The system Fe–Si–C–O–H: a model formetamorphosed iron formation. Carnegie Inst. Wash. Year
Book 1971–1972, 435–443.
Buseck P. R. (1966) Contact metasomatism and ore deposition:concepcion Del Oro, Mexico. Econ. Geol. 61, 97–136.
Callow K. J. (1967) The geology of the Thanksgiving Mine, BaguioDistrict, Mountain Province, Philippines. Econ. Geol. 62, 472–
481.
Da Costa A. C. S., Bigham J. M., Rhoton F. E. and Traina S. J.(1999) Quantification and characterization of maghemite insoils derived from volcanic rocks in Southern Brazil. Clays Clay
Miner. 47, 466–473.
Davidson G. J. (1992) Hydrothermal geochemistry and ore genesisof sea-floor volcanogenic copper-bearing oxide ores. Econ.
Geol. 87, 889–912.
Duhig N. C., Stolz J., Davidson G. J. and Large R. R. (1992)Cambrian microbial and silica-gel textures in silica iron exhalitesfrom the Mount Windsor Volcanic Belt, Australia – theirpetrography, chemistry, and origin. Econ. Geol. 87, 764–784.
Ewers W. E. and Morris R. C. (1981) Studies of the Dales Gorgemember of the Brockman Iron Formation, Western Australia.Econ. Geol. 76, 1929–1953.
Fischer W. R. (1987) Standard potential (E0) and iron (III) oxidesunder reducing conditions. Z. Pflanzenernahr. Bodenk. 150,
286–289.
Forster D. B., Seccombe P. K. and Phillips D. (2004) Controls onskarn mineralization and alteration at the Cadia Deposits, NewSouth Wales, Australia. Econ. Geol. 99, 761–788.
Gow P. A., Wall V. J., Oliver N. H. S. and Valenta R. K. (1994)Proterozoic iron oxide (Cu–U–Au–REE) deposits: Furtherevidence of hydrothermal origins. Geology 22, 633–636.
Helgeson H. C., Delany J. M., Nesbitt H. W. and Bird D. K. (1978)Summary and critique of the thermodynamic properties ofrock-forming minerals. Am. J. Sci. 278, 229.
Hoashi M., Bevacqua D. C., Otake T., Watanabe Y., Hickman A.,Utsunomiya S. and Ohmoto H. (2009) Primary haematiteformation in an oxygenated sea 3.46 billion years ago. Nat.
Geosci. 2, 301–306.
Johnson C. M., Beard B. L., Klein C., Beukes N. J. and Roden E.E. (2008) Iron isotopes constrain biologic and abiologicprocesses in banded iron formation genesis. Geochim. Cosmo-
chim. Acta 72, 151–169.
Johnson J. W., Oelkers E. H. and Helgeson H. C. (1992)SUPCRT92: a software package for calculating the standardmolal thermodynamic properties of minerals, gases, aqueousspecies, and reactions from 1 to 5000 bar and 0 to 1000 �C.Comp. Geosci. 18, 899–947.
Jolivet J.-P. and Tronc E. (1988) Interfacial electron transfer incolloidal spinel iron oxide. Conversion of Fe3O4–cFe2O3 inaqueous medium. J. Colloid Interface Sci. 125, 688–701.
Kishima N. and Sakai H. (1984) A simple gas analytical techniquefor the Dickson-type hydrothermal apparatus and its applica-tion to the calibration of MH, NNO and FMQ oxygen buffers.Geochem. J. 18, 19–29.
Kolb J., Sakellaris G. and Meyer F. (2006) Controls on hydro-thermal Fe oxide–Cu–Au–Co mineralization at the GuelbMoghrein deposit, Akjoujt area, Mauritania. Miner. Deposita
41, 68–81.
LaBerge G. L., Robbins E. I. and Han T.-M. (1987) A model forthe biological precipitation of Precambrian iron-formations –A: geological evidence. In Precambrian Iron-Formations (eds. P.

6156 T. Otake et al. / Geochimica et Cosmochimica Acta 74 (2010) 6141–6156
W. U. Appel and G. L. LaBerge). Theophrastus Publications,Athens, pp. 69–96.
Lindberg R. D. and Runnells D. D. (1984) Groundwater redoxreactions – an analysis of equilibrium state applied to Ehmeasurements and geochemical modeling. Science 225, 925–
927.
Lynch G. and Ortega S. (1997) Hydrothermal alteration andtourmaline–albite equilibria at the Coxheath porphyry Cu–Mo–Au deposit, Nova Scotia. Can. Mineral. 35, 79–94.
Majzlan J., Grevel K. D. and Navrotsky A. (2003a) Thermody-namics of Fe oxides: Part II. Enthalpies of formation andrelative stability of goethite (a-FeOOH), lepidocrocite (c-FeOOH), and maghemite (c-Fe2O3). Am. Mineral. 88, 855–859.
Majzlan J., Lang B. E., Stevens R., Navrotsky A., Woodfield B. F.and Boerio-Goates J. (2003b) Thermodynamics of Fe oxides:Part I. Entropy at standard temperature and pressure and heatcapacity of goethite (a-FeOOH), lepidocrocite (c-FeOOH), andmaghemite (c-Fe2O3). Am. Mineral. 88, 846–854.
Mesmer R. E., Baes, Jr., C. F. and Sweeton F. H. (1970) Aciditymeasurements at elevated temperatures: IV. Apparent dissoci-ation product of water in 1 m potassium chloride up to 292�. J.
Phys. Chem. 74, 1937–1942.
Ohmoto H. (2003) Nonredox transformations of magnetite–hematite in hydrothermal systems. Econ. Geol. 98, 157–161.
Ohmoto H. and Goldhaber M. B. (1997) Isotopes of sulfur andcarbon. In Geochemistry of Hydrothermal Ore Deposits (ed. H.L. Barnes), third ed. John Wiley & Sons, New York, pp. 517–
611.
Ohmoto H. and Lasaga A. C. (1982) Kinetics of reactions betweenaqueous sulfates and sulfides in hydrothermal systems. Geo-
chim. Cosmochim. Acta 46, 1727–1745.
Otake T., Wesolowski D. J., Anovitz L. A., Allard L. F. andOhmoto H. (2007) Experimental evidence for non-redoxtransformations between magnetite and hematite under H2-rich hydrothermal conditions. Earth Planet. Sci. Lett. 257, 60–
70.
Palmer D. A. and Hyde K. E. (1993) An experimental determina-tion of ferrous chloride and acetate complexation in aqueoussolutions to 300 �C. Geochim. Cosmochim. Acta 57, 1393–1408.
Pecoits E., Gingras M. K., Barley M. E., Kappler A., Posth N. R.and Konhauser K. O. (2009) Petrography and geochemistry ofthe Dales Gorge banded iron formation: paragenetic sequence,source and implications for palaeo-ocean chemistry. Precam-
brian Res. 172, 163–187.
Pedersen H. D., Postma D., Jakobsen R. and Larsen O. (2005) Fasttransformation of iron oxyhydroxides by the catalytic action ofaqueous Fe(II). Geochim. Cosmochim. Acta 69, 3967–3977.
Perry, Jr., E. C., Tan F. C. and Morey G. B. (1973) Geology andstable isotope geochemistry of the Biwabiki Iron Formation.Northern Minn. Econ. Geol. 68, 1110–1125.
Pottorf R. J. and Barnes H. L. (1983) Mineralogy, geochemistry,and ore genesis of hydrothermal sediments from the Atlantis IIdeep, Red Sea. Econ. Geol. Monogr. 5, 198–223.
Rona P. A. (1984) Hydrothermal mineralization at Seafloorspreading centers. Earth Sci. Rev. 20, 1–104.
Rosing M. T., Bird D. K., Sleep N. H. and Bjerrum C. J. (2010) Noclimate paradox under the faint early Sun. Nature 464, 744–747.
Seyfried W. E. and Ding K. (1995) Phase equilibria in subseafloorhydrothermal systems: a review of the role of redox, temper-
ature, pH, and dissolved Cl on the chemistry of hot spring fluidsat mid-ocean ridges. In Seafloor Hydrothermal Systems: Phys-
ical, Chemical, Biological, and Geological Interactions (eds. S.E.Humphirs, R.A. Zierenberg, L.S. Mullineaux and R.E. Thom-son). Geophysical Monograph, vol. 91, American GeophysicalUnion, Washington, DC. pp. 248–272.
Seyfried W. E., Janecky D. R. and Berndt M. E. (1987) Rockingautoclaves for hydrothermal experiments: II. the flexiblereaction-cell system. In Hydrothermal Experimental Techniques
(eds. G. G. Ulmer and H. L. Barnes). John Wiley & Sons, New
York, pp. 216–239.
Shock E. L., Sassani D. C., Willis M. and Sverjensky D. A. (1997)Inorganic species in geologic fluids: correlations among stan-dard molal thermodynamic properties of aqueous ions andhydroxide complexes. Geochim. Cosmochim. Acta 61, 907–950.
Singer M. J. and Fine P. (1989) Pedogenic factors affectingmagnetic susceptibility of northern California soils. Soil Sci.
Soc. Am. J. 53, 1119–1127.
Stumm W. and Sulzberger B. (1992) The cycling of iron in naturalenvironments: considerations based on laboratory studies ofheterogeneous redox processes. Geochim. Cosmochim. Acta 56,
3233–3257.
Swaddle T. W. and Oltmann P. (1980) Kinetics of the magnetite–maghemite–hematite transformation, with special reference tohydrothermal systems. Can. J. Chem. 58, 1763–1772.
Wagman D. D., Evans W. H., Parker V. B., Schumm R. H., HalowI., Bailey S. M., Churney K. L. and Nuttall R. L. (1982) TheNBS tables of chemical thermodynamic properties, selectedvalues for inorganic and c1 and c2 organic substances in SIunits. J. Phys. Chem. Ref. Data 11, 392.
Wesolowski D. J., Benezeth P. and Palmer D. A. (1998) ZnOsolubility and Zn2+ complexation by chloride and sulfate inacidic solution to 290 �C with in-situ pH measurement.Geochim. Cosmochim. Acta 62, 971–984.
Wesolowski D. J., Machesky M. L., Palmer D. A. and Anovitz L.M. (2000) Magnetite surface charge studies to 290 �C fromin situ pH titrations. Chem. Geol. 167, 193–229.
Westendorp R. W., Watkinson D. H. and Jonasson I. R. (1991)Silicon-bearing zoned magnetite crystals and the evolution ofhydrothermal fluids at the Ansil Cu–Zn mine, Rouyn-Noranda,Quebec. Econ. Geol. 86, 1110–1114.
White A. F., Peterson M. L. and Hochella, Jr., M. F. (1994)Electrochemistry and dissolution kinetics of magnetite andilmenite. Geochim. Cosmochim. Acta 58, 1859–1875.
Yanina S. V. and Rosso K. M. (2008) Linked reactivity at mineral–water interfaces through bulk crystal conduction. Science 320,
218–222.
Ziemniak S. E., Jones M. E. and Combs K. E. S. (1995) Magnetitesolubility and phase stability in alkaline media at elevatedtemperatures. J. Solution Chem. 24, 837–877.
Zierenberg R. A. and Shanks, III, W. C. (1983) Mineralogy andgeochemistry of epigenetic features in metalliferous sediment,Atlantis II Deep, Read Sea. Econ. Geol. 78, 57–72.
Zurcher L., Ruiz J. and Barton M. D. (2001) Paragenesis,elemental distribution, and stable isotopes at the Pena Coloradairon skarn, Colima, Mexico. Econ. Geol. 96, 535–557.
Associate editor: Kevin M. Rosso