Mechanisms of ecological succession: insights from plant functional strategies
15
1761 Mechanisms of ecological succession: insights from plant functional strategies Valérie Raevel, Cyrille Violle and François Munoz V. Raevel and C. Violle, UMR 5175 Centre d’Ecologie Fonctionnelle et Evolutive, CNRS, 1919 route de Mende, FR-34293 Montpellier cedex 5, France. – F. Munoz ([email protected]), Univ. Montpellier 2, UMR-AMAP, TA A-51/PS2, FR-34398 Montpellier cedex 5, France. Successions are a central issue of ecological theory. ey are governed by changes in community assembly processes that can be tracked by species’ traits. While single-trait-based approaches have been mostly promoted to address community assembly, ecological strategies actually encompass tradeoffs between multiple traits that are relevant to succession theory. We analyzed plant ecological strategies along a 140-year-long succession primary succession of 52 vertical outcrop com- munities after roadwork. We performed a RLQ analysis to relate six functional traits, associated with resource acquisition, competition, colonization ability and phenology, to the age of the outcrops. We found the prominence of two main axes of specialization, one related to resource acquisition and the other to reproduction and regeneration. We further examined the community-level variation in ecological strategies to assess the abiotic and biotic drivers of community assembly. Using trait-based statistics of functional richness, regularity and divergence, we found that different processes drove the variation in ecological strategies along the axes of specialization. In late succession, functional convergence was detected for the traits related to resource acquisition as a signature of habitat filtering, while the coexistence of contrasted strategies was found for the traits related to reproduction and regeneration as a result of spatial micro-heterogeneity. We observed a lack of niche differentiation along the succession, revealing a weak importance of biotic interactions for the regulation of community assembly in the outcrops. Overall, we highlight a prominent role of habitat filtering and spatial micro-heterogeneity in driving the primary succession governed by water and nutrient limitation. Plant functional traits, i.e. morphological, physiological or life history characteristics related to fitness (Violle et al. 2007), co-vary along primary axes of ecological specializa- tion (Grime 2002, Westoby 1998). ese axes define dif- ferent and complementary aspects of the species niches, and thereby represent a multidimensional framework for investigating plant ecological strategies. Consistent or dif- ferent strategies can be found in communities according to the environmental conditions and the underlying assembly processes (Grime 2002, Vile et al. 2006). Ecological succes- sions have been a relevant context to address the nature of these strategies, as well as to investigate how and why they change with time (Bazzaz 1979, Huston and Smith 1987, Walker and del Moral 2003). Variation in plant strategies along a succession is classically expected along two main axes of specialization representing the plant resource economy, related to nutrient, water and light use, and the dispersal–regeneration strategies, related to seed mass and seed output (Westoby et al. 2002). Positive interactions such as facilitation are classically expected to partly drive community assembly and ecological strategies at early and intermediate stages, while negative interactions such as interspecific competition should become more prominent at later stages (Connell and Slatyer 1977, Bazzaz 1979, Huston and Smith 1987). e balance between positive and negative interactions further depends upon the more or less stressful abiotic context (Callaway and Walker 1997). For instance, at later stages, physiological stress tolerance is a more prominent strategy than competition ability in cold alpine ecosystems after glacial retreat (Caccianiga et al. 2006). We investigate here the functional nature of an origi- nal plant primary succession on man-made vertical outcrops in a water-limited Mediterranean context. ese outcrops are vertical portions of bedrock that were denudated during roadwork. Community assembly processes drive the diversity of ecological strategies in a given community according to local and regional environmental filters. Habitat filtering selects viable strategies around optimal trait values and leads to trait convergence (i.e. less variation than random, Cornwell and Ackerly 2009), while biotic interactions such as com- petition and facilitation limit the community-wide func- tional similarity, leading to niche differentiation (Stubbs and Wilson 2004, Brooker et al. 2008, Verdu et al. 2009). Stochastic forces such as dispersal limitation, historical contingency or ecological drift further yield variation in taxonomic and functional composition (Diamond 1975, Bell et al. 2006, Cornwell and Ackerly 2009). Trait-based Oikos 121: 1761–1770, 2012 doi: 10.1111/j.1600-0706.2012.20261.x © 2012 e Authors. Oikos © 2012 Nordic Society Oikos Subject Editor: Enrique Chaneton. Accepted 13 January 2012
Transcript of Mechanisms of ecological succession: insights from plant functional strategies
1761
Mechanisms of ecological succession: insights from plant functional strategies
Valérie Raevel, Cyrille Violle and François Munoz
V. Raevel and C. Violle, UMR 5175 Centre d’Ecologie Fonctionnelle et Evolutive, CNRS, 1919 route de Mende, FR-34293 Montpellier cedex 5, France. – F. Munoz ([email protected]), Univ. Montpellier 2, UMR-AMAP, TA A-51/PS2, FR-34398 Montpellier cedex 5, France.
Successions are a central issue of ecological theory. They are governed by changes in community assembly processes that can be tracked by species’ traits. While single-trait-based approaches have been mostly promoted to address community assembly, ecological strategies actually encompass tradeoffs between multiple traits that are relevant to succession theory. We analyzed plant ecological strategies along a 140-year-long succession primary succession of 52 vertical outcrop com-munities after roadwork. We performed a RLQ analysis to relate six functional traits, associated with resource acquisition, competition, colonization ability and phenology, to the age of the outcrops. We found the prominence of two main axes of specialization, one related to resource acquisition and the other to reproduction and regeneration. We further examined the community-level variation in ecological strategies to assess the abiotic and biotic drivers of community assembly. Using trait-based statistics of functional richness, regularity and divergence, we found that different processes drove the variation in ecological strategies along the axes of specialization. In late succession, functional convergence was detected for the traits related to resource acquisition as a signature of habitat filtering, while the coexistence of contrasted strategies was found for the traits related to reproduction and regeneration as a result of spatial micro-heterogeneity. We observed a lack of niche differentiation along the succession, revealing a weak importance of biotic interactions for the regulation of community assembly in the outcrops. Overall, we highlight a prominent role of habitat filtering and spatial micro-heterogeneity in driving the primary succession governed by water and nutrient limitation.
Plant functional traits, i.e. morphological, physiological or life history characteristics related to fitness (Violle et al. 2007), co-vary along primary axes of ecological specializa-tion (Grime 2002, Westoby 1998). These axes define dif-ferent and complementary aspects of the species niches, and thereby represent a multidimensional framework for investigating plant ecological strategies. Consistent or dif-ferent strategies can be found in communities according to the environmental conditions and the underlying assembly processes (Grime 2002, Vile et al. 2006). Ecological succes-sions have been a relevant context to address the nature of these strategies, as well as to investigate how and why they change with time (Bazzaz 1979, Huston and Smith 1987, Walker and del Moral 2003). Variation in plant strategies along a succession is classically expected along two main axes of specialization representing the plant resource economy, related to nutrient, water and light use, and the dispersal–regeneration strategies, related to seed mass and seed output (Westoby et al. 2002). Positive interactions such as facilitation are classically expected to partly drive community assembly and ecological strategies at early and intermediate stages, while negative interactions such as interspecific competition should become more prominent at later stages (Connell and Slatyer 1977, Bazzaz 1979,
Huston and Smith 1987). The balance between positive and negative interactions further depends upon the more or less stressful abiotic context (Callaway and Walker 1997). For instance, at later stages, physiological stress tolerance is a more prominent strategy than competition ability in cold alpine ecosystems after glacial retreat (Caccianiga et al. 2006). We investigate here the functional nature of an origi-nal plant primary succession on man-made vertical outcrops in a water-limited Mediterranean context. These outcrops are vertical portions of bedrock that were denudated during roadwork.
Community assembly processes drive the diversity of ecological strategies in a given community according to local and regional environmental filters. Habitat filtering selects viable strategies around optimal trait values and leads to trait convergence (i.e. less variation than random, Cornwell and Ackerly 2009), while biotic interactions such as com-petition and facilitation limit the community-wide func-tional similarity, leading to niche differentiation (Stubbs and Wilson 2004, Brooker et al. 2008, Verdu et al. 2009). Stochastic forces such as dispersal limitation, historical contingency or ecological drift further yield variation in taxonomic and functional composition (Diamond 1975, Bell et al. 2006, Cornwell and Ackerly 2009). Trait-based
Oikos 121: 1761–1770, 2012 doi: 10.1111/j.1600-0706.2012.20261.x
© 2012 The Authors. Oikos © 2012 Nordic Society Oikos Subject Editor: Enrique Chaneton. Accepted 13 January 2012
1762
statistics are currently available to investigate functional trait variation within communities and to infer underly-ing ecological drivers (Mason et al. 2005, Schleuter et al. 2010). Our objective was to test the signature of assem-bly processes on the basis of both one-dimensional and multidimensional trait-based statistics. One-dimensional statistics were used to represent the variation of ecological strategies along a single axis of specialization that repre-sents a ‘synthetic’ trait. We thereby used one-dimensional statistics to investigate whether the ecological processes related to separate components of species niches are dif-ferent (Helmus et al. 2007, Swenson and Enquist 2009). Conversely, a multidimensional envelope (e.g. convex hull, Cornwell et al. 2006, Villéger et al. 2008) was used to rep-resent the overall variation in ecological strategies along several axes of specialization (Schleuter et al. 2010), so as to highlight the prominent drivers of functional variation for a large number of traits.
We measured species traits related to resource acquisi-tion (specific leaf area), competition (height), colonization ability (seed mass, mode of dispersion) and phenology (life span and start of flowering period) along a 140-year primary ecological succession on man-made vertical out-crops in the French Mediterranean area. We identified the prominent axes of specialization and tested their relevance by use of a RLQ analysis (Doledec et al. 1996). We finally compared and discussed the performance of the one- and multidimensional trait-based approaches to investigate how habitat filtering and niche differentiation influenced the variation in plant strategies within communities. We thereby discuss the assembly processes underlying the func-tional composition of communities along the succession.
Material and methods
Study area and selected sites
The study was carried out in the Mediterranean region of southern France (48°37′–43°58′N, 3°28′–4°E). The climate is Mediterranean sub-humid, characterized by hot dry summers, cold winters, and noticeable inter- annual variation in the timing and amount of rainfall from September to May. The vegetation of the study area is domi-nated by typical French Mediterranean scrublands, i.e. ‘garrigues’ dominated by the evergreen oak Quercus ilex.
We selected a total of 52 vertical outcrops created after rail and road management across a rectangle of 46 km east– west by 41 km north–south above the town of Montpellier, on the basis of four criteria: 1) slope over 80°, 2) Mesozoic superior limestone bedrock, 3) outcrop face over 6 m high and 4) elevation between 100 and 400 m. We devised six successional stages: 0–10 years old (n 7 sites), 10–20 years old (n 7), 20–30 years old (n 10), 30–50 years old (n 7), 50–80 years old (n 11), 90 years old (n 10), on the basis of information from road and rail builders and the ancient administrative maps.
Floristic data
We counted all the plant individuals found in five 2 2 m quadrats on each outcrop, that is, in 260 quadrats overall. The data from the five quadrats were aggregated to provide a single sample of the species relative abundances per out-crop. Floristic data were collected from mid-April to mid-July in 2008 or 2009, and we visited each site twice a year to improve the detection. We counted 14 632 individuals belonging to 221 species (nomenclature BDNFF V4.02, Bock 2005). Because measuring traits for all the species was not feasible, we subsequently selected a representative enough subset of species for trait analyses. We followed the recommendation of Pakeman and Quested (2007) to include at least 80% of the vegetation per sampling unit, and to cover a relevant enough range of traits. First, we ranked the species in order of decreasing abundance on each outcrop and retained the first ones until the cumu-lative abundance reached 75% of the outcrop abundance. We further added to the list all the phanerophytes, because they occurred in smaller populations but enlarged the range of traits and represented a significant part of the biomass in the communities. We selected for trait analyses the spe-cies that displayed more than 20 individuals on at least one site. Species that were found on a single outcrop were also excluded. The 97 plant species we finally selected for trait measurement represented more than 90% of the individuals per outcrop (13 335 individuals, Supplementary material Appendix 1 Table A1).
Plant trait data
We selected six plant functional traits (summarized in Table 1; see also Supplementary material Appendix 1
Table 1. List of plant traits used. The sources of trait values are indicated by the superscript number: 1measured, 2local flora (Tison and Jauzein in press), 3Seed Information Database (Liu et al. 2008) and Navas et al. (2010). Abbreviations are those used in figures, n species number per category.
Biological traits Data type Description
Life span2 qualitative herbaceous perennial (n 38); woody perennial (n 40); short-lived annuals and biennials (n 19)
Vegetative height (H)1 quantitative maximal vegetative height (range: 4.1–187 cm)Specific leaf area (SLA)1 quantitative leaf weight per unit area (range: 0–45.6 mm2 mg21)Start of flowering2 qualitative early flowering, January–March (JM, n 17); spring flowering, April–May (AM, n 60);
summer flowering, June–August (JA, n 20)Seed dispersal mode2 qualitative anemochory (n 32); barochory and autochory (n 27); endozoochory (n 11); epizoochory
and myrmecochory (n 27)Seed mass (SM)3 quantitative mean seed mass (range: 1 1025–2311 mg)
1763
Table A1), related to resources use, regeneration and pheno-logy, which are classically presented as main components of plant ecological strategies (Westoby 1998, Grime 2002). We harvested 10 intact, full-grown replicate leaves per species, and averaged their specific leaf area (SLA; ratio of fresh leaf area to leaf dry mass; mm2 mg21), following a standard protocol (Cornelissen et al. 2003). We assessed plant height (H; cm) as the maximum vegetative height during the growth period (from March to mid-July) and averaged it over 20 individual plants per species. All the replicate plants were sampled on a single site per species. The data for the four remaining traits were obtained from published literature. Seed mass (SM; mg) information was extracted from the Seed Infor-mation Database (Liu et al. 2008) and Navas et al. (2010). Seed mass and vegetative height values were log-transformed prior to analysis. Life span, dispersal mode and start of flowering period were extracted from a local Flora (Tison and Jauzein in press) and from the European database LEDA (Kleyer et al. 2008). We considered four classes of plant phenology, namely, early flowering (January to March, JM), spring flowering (April to May, AM) and summer flowering (June to August, JA). We devised three life span groups, short-lived species (annuals and biennials), perennial herbaceous and perennial woody species. As a first approxi-mation, we assumed intraspecific trait variability (Kraft et al. 2008) to be negligible compared to the inter specific variation in a context of extensive species turnover along the succession (Albert et al. 2011).
Data analysis
Axes of specializationRelating species traits to environmental information through community composition has been promoted to identify ecological strategies (Fourth-corner problem, Legendre et al. 1997). Doledec et al. (1996) developed the RLQ analysis to relate environmental conditions (R table) to species traits (Q table) through species abun-dances (L table). This method is more and more used to identify ecological strategies along environmental gradi-ents (Bernhardt-Romermann et al. 2008, Pakeman 2011). In our analysis, the only environmental information in R was the age of the 52 outcrops, to represent the succes-sional gradient, and we considered 6 traits for 97 species. The RLQ analysis was based on separate multivariate anal-yses of the three tables, namely a correspondence analysis (CA) of the abundance matrix L, a Hill–Smith ordination of quantitative and qualitative data for Q and a multiple correspondence analysis of R using, in the two latter cases, the row and column weights used of the CA analysis of L (Doledec et al. 1996). The overall statistical significance of the link between traits in Q and successional stages in R was assessed by performing 999 random permutations of the rows of tables R and Q (Monte Carlo procedure, Doledec et al. 1996, Dray and Legendre 2008). If the test was sig-nificant, the axes of the RLQ analysis provided relevant axes of specialization, and the species coordinates onto the axes defined their ecological strategies. The position of commu-nities on the axes was finally used to investigate the varia-tion in ecological strategies and assembly processes along the succession.
Functional trait-based statisticsFollowing Mason et al. (2005), we considered three types of trait-based statistics to represent trait diversity in com-munities: functional richness (FRI), functional regular-ity (FRE) and functional divergence (FD). FRI measures the amount of niche space filled by all the species in a com-munity. If the composition of a community is constrained by habitat filtering, the range of available niches should be limited and FRI is expected to decrease. FRE represents the regularity in species traits values in the community as mea-sured, e.g. by the distances in trait values between nearest neighbors. If niche differentiation occurs, FRE is expected to increase. FRE is conversely lower if some parts of the functional space are empty while other are densely populated (Mouchet et al. 2010). Finally, FD describes the variance of species traits in the community (Schleuter et al. 2010). Habitat filtering is expected to yield trait convergence around an optimal trait value, and hence lower FD values. Niche differentiation conversely limits species trait similar-ity, so that trait divergence is expected and FD should get higher (Cornwell and Ackerly 2009).
We further considered both multidimensional and one-dimensional trait-based statistics complying with this framework:
– One-dimensional statistics. The functional range of Mason et al. (2005), denoted as FRIu, compares the range of a trait in a community tjc with the range of that trait in all the communities (Table 2), and is a measure of functional richness (Schleuter et al. 2010). Second, the unweighted functional regularity index is adapted from Mouillot et al. (2005) and denoted as FREu. Third, the community-weighted variance of traits, named FDu, is a one-dimensional measure of functional divergence (Schleuter et al. 2010). We calculated these statistics on the basis of the species ecological strate-gies stemming from the RLQ analysis, that this, on the basis of their coordinates on the axes of specialization.
– Multidimensional statistics. The multidimensional indexes were adapted from Villéger et al. (2008) and denoted as FRIm, FREm and FDm (Table 2). We used an unweighted version of FREm, to be consistent with the definition of the one-dimensional alternative FREu. The multidimensional niche space was defined on the basis of all the axes of the RLQ analysis, which together conveyed a global picture of the ecological strategies.
The multidimensional and one-dimensional statistics, as well as the related expectations under habitat filtering and niche differentiation, are presented in Table 2. They were calculated for each site and compared to a null model, using a swap randomization algorithm of the species abundances (Gotelli and Entsminger 2001), which maintained the global relative abundances of each species and the number of indi-viduals per site. We calculated the standard effect size (SES), i.e. the relative deviation of each observed statistic (Iobs) from its null swap expectation (Gotelli and Entsminger 2001),
SES (Iobs 2 Inull)/Isdnull
where Inull and Isdnull were the mean and the standard devia-tion, respectively, of the values under the null model. SES
1764
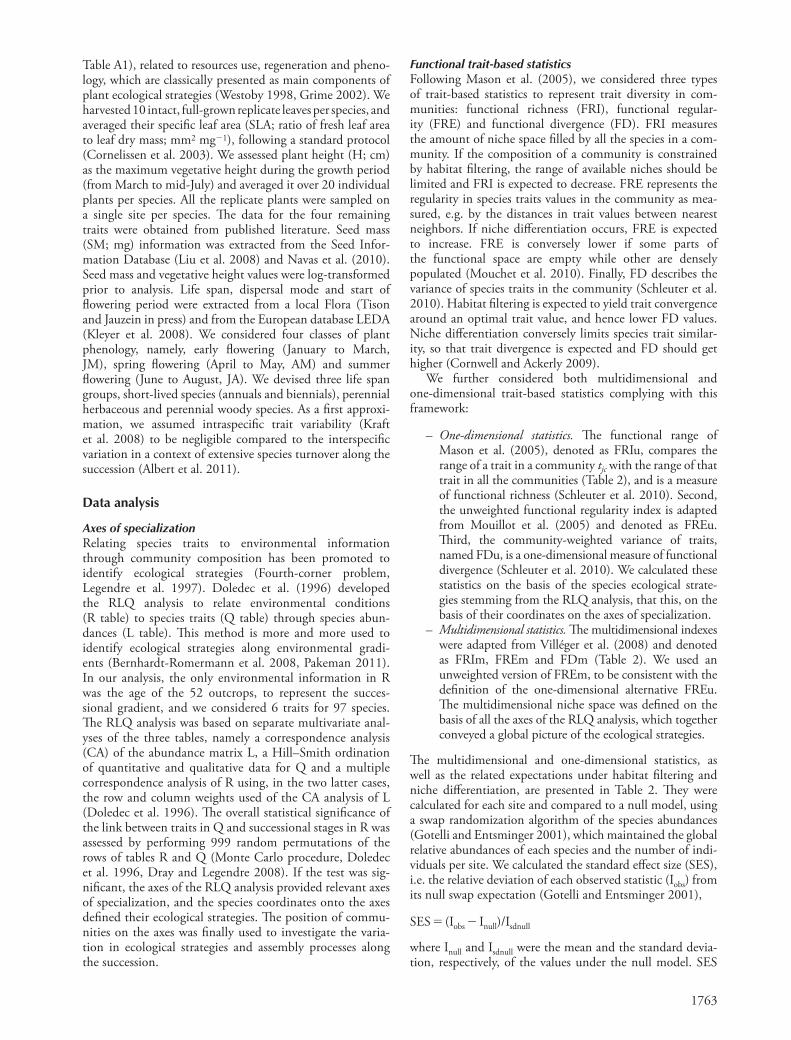
Table 2. Trait-based statistics measured at community level.
Statistic
Description
Calculation
Relationship with underlying processes (Mouchet et al. 2010, Schleuter et al. 2010)
Functional richness (FRI)
amount of niche space filled by species in the community
- multidimensional (FRIm): the volume inside the smallest convex hull that encloses all the species in functional space (Villéger et al. 2008)
low FRI indicates that some of the resources potentially available to the community are not used
- one-dimensional (FRIu): the functional range proposed by Mason et al. (2005),
FRIut t
t t
jc jc
jj
jC
max( ) min( )
max( ) min( )C
Functional regularity (FRE)
the regularity with which functional space is filled by species
- multidimensional (FREm): the regularity of the branch lengths of the minimum spanning tree (MST) that links all the species in the trait space (Villéger et al. 2008),
FREm
dist i j
dist i ji
Si
S
min( , )
( , )
,1
1
11
1∑
∑
1S S
111
1
S
high FRE is expected if niche differentiation occurs.
low FRE is expected when species are distributed as separate clouds in the functional space
- one-dimensional (FREu): functional regularity modified from Mouillot et al. (2005),
FREut t
t tS S
ji ji
ji jii
Sj
min ,
+
+∑
1
11
11
11
1ii
S1
∑
Functional divergence (FD)
how abundance is distributed within the functional trait space occupied by species
- multidimensional (FDm): species deviance from the mean distance to the centre of gravity weighted by relative abundances (Villéger et al. 2008)
FDmd dGd dG
∆∆
high FD (divergence) can result from niche differentiation due to biotic interactions between functionally close species.
low FD (convergence) is expected when habitat filtering restricts the variation of traits around an optimum.
- one-dimensional (FDu): community weighted mean variance (Mason et al. 2005)
FDu x t x tj ii
S
ji j ii
S
ji j 1
2
1
2 2∑ ( ) ∑CWM CWM
S: species richness in the community.tji: value of trait j of species i, with species ranked by increasing values of tji. t
–j is mean value of tji over all the species.
tjc and tjC: values of trait j in community c and in all communities C, respectively.xi: relative abundance of species i in the local community.dist(i,i′): Euclidean distance between species i and i′ in the functional space.dG—
: mean distance to the centre of gravity.Δd: sum of abundance-weighted deviances from the centre of gravity.Δ|d|: sum of absolute abundance-weighted deviances from the centre of gravity.
CWMj: community weighted mean of trait j, CWM .j ii
S
jix t1∑
hence represented the direction and the magnitude of the shift between the observed statistic and the null distribu-tion. All the statistical analyses were carried out within the R software (R Development Core Team 2010, packages ade4 and vegan).
Results
Axes of specialization related to the successional gradient
The RLQ analysis provided the global ordination of succes-sional stages, plant traits and plant species along independent
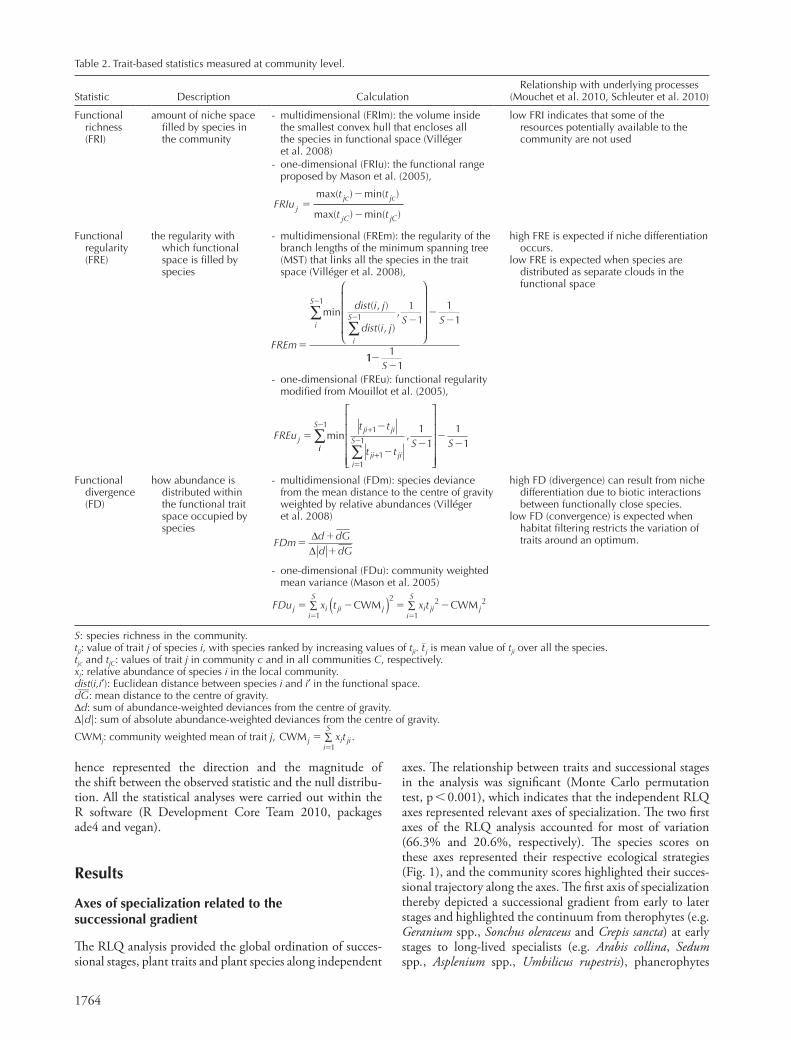
axes. The relationship between traits and successional stages in the analysis was significant (Monte Carlo permutation test, p 0.001), which indicates that the independent RLQ axes represented relevant axes of specialization. The two first axes of the RLQ analysis accounted for most of variation (66.3% and 20.6%, respectively). The species scores on these axes represented their respective ecological strategies (Fig. 1), and the community scores highlighted their succes-sional trajectory along the axes. The first axis of specialization thereby depicted a successional gradient from early to later stages and highlighted the continuum from therophytes (e.g. Geranium spp., Sonchus oleraceus and Crepis sancta) at early stages to long-lived specialists (e.g. Arabis collina, Sedum spp., Asplenium spp., Umbilicus rupestris), phanerophytes
1765
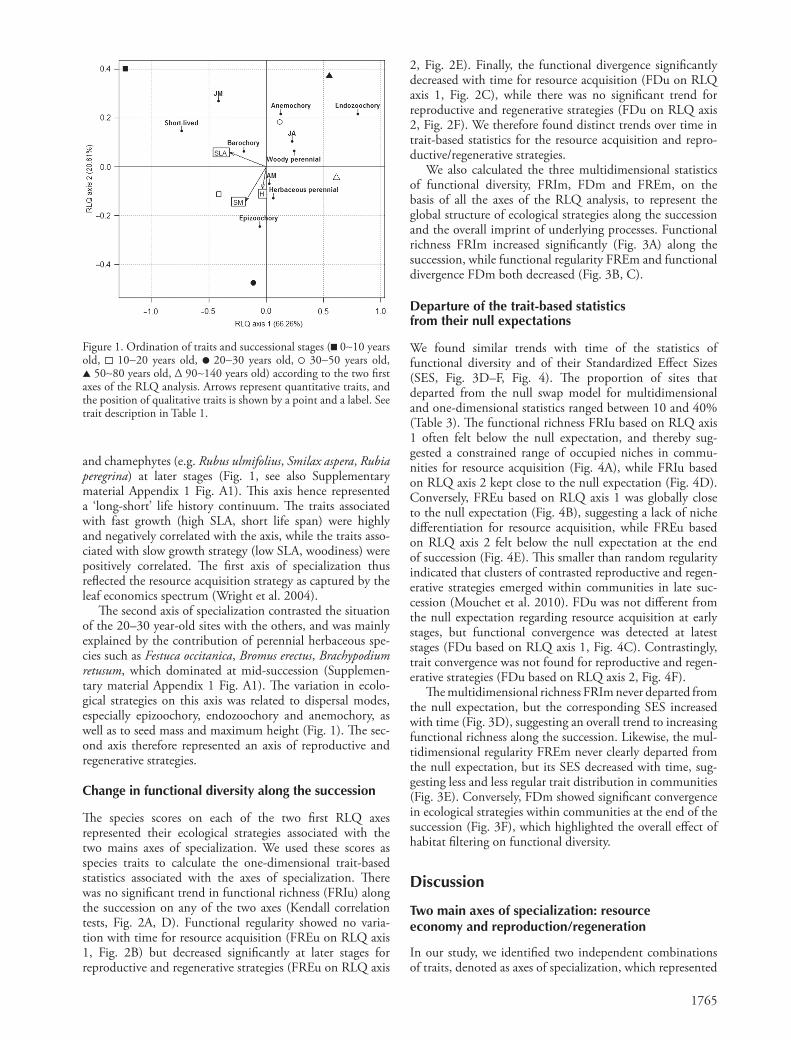
2, Fig. 2E). Finally, the functional divergence significantly decreased with time for resource acquisition (FDu on RLQ axis 1, Fig. 2C), while there was no significant trend for reproductive and regenerative strategies (FDu on RLQ axis 2, Fig. 2F). We therefore found distinct trends over time in trait-based statistics for the resource acquisition and repro-ductive/regenerative strategies.
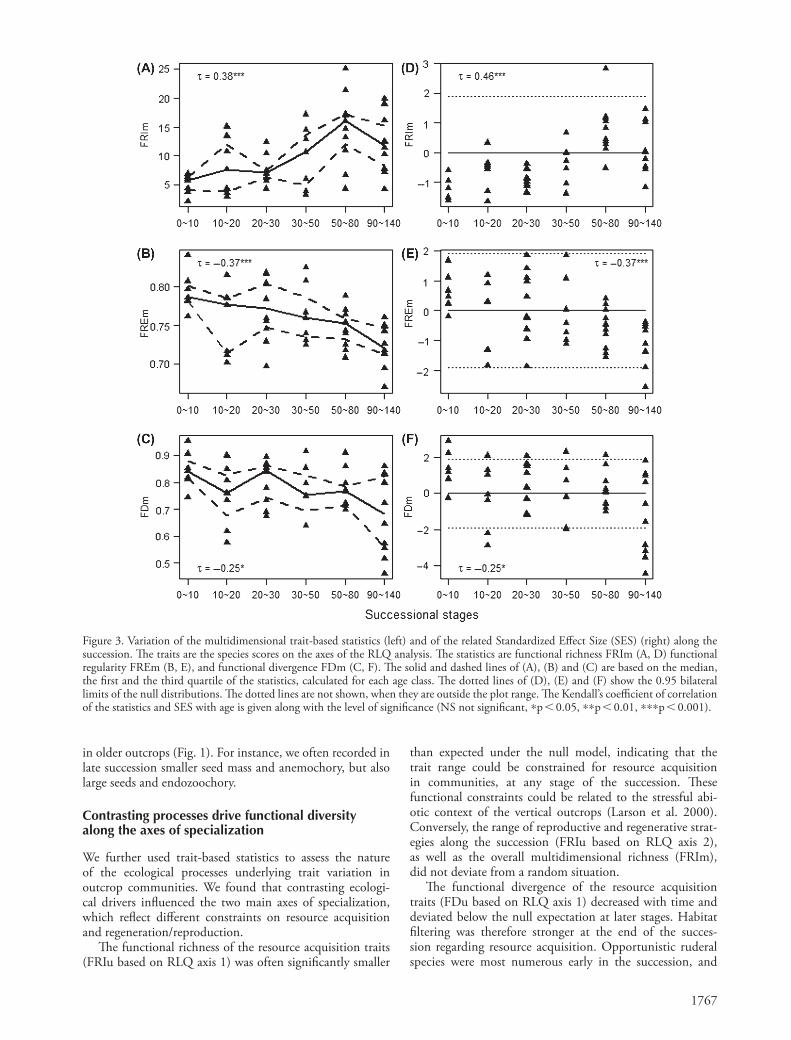
We also calculated the three multidimensional statistics of functional diversity, FRIm, FDm and FREm, on the basis of all the axes of the RLQ analysis, to represent the global structure of ecological strategies along the succession and the overall imprint of underlying processes. Functional richness FRIm increased significantly (Fig. 3A) along the succession, while functional regularity FREm and functional divergence FDm both decreased (Fig. 3B, C).
Departure of the trait-based statistics from their null expectations
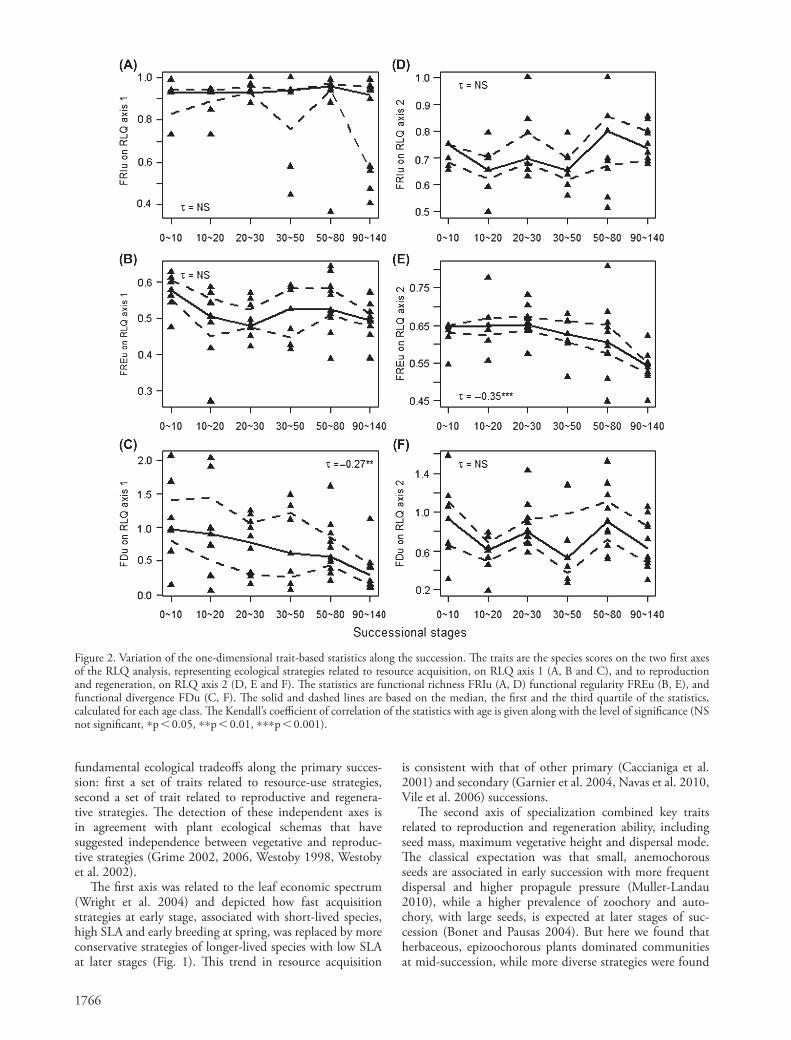
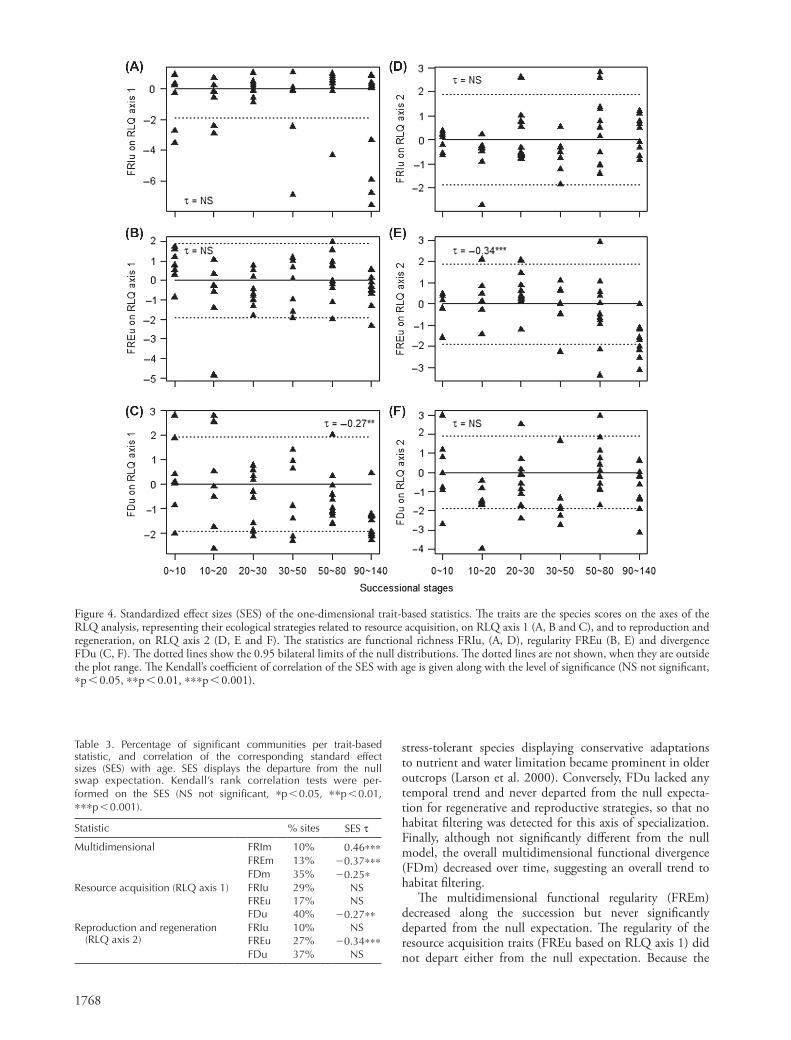
We found similar trends with time of the statistics of functional diversity and of their Standardized Effect Sizes (SES, Fig. 3D–F, Fig. 4). The proportion of sites that departed from the null swap model for multidimensional and one-dimensional statistics ranged between 10 and 40% (Table 3). The functional richness FRIu based on RLQ axis 1 often felt below the null expectation, and thereby sug-gested a constrained range of occupied niches in commu-nities for resource acquisition (Fig. 4A), while FRIu based on RLQ axis 2 kept close to the null expectation (Fig. 4D). Conversely, FREu based on RLQ axis 1 was globally close to the null expectation (Fig. 4B), suggesting a lack of niche differentiation for resource acquisition, while FREu based on RLQ axis 2 felt below the null expectation at the end of succession (Fig. 4E). This smaller than random regularity indicated that clusters of contrasted reproductive and regen-erative strategies emerged within communities in late suc-cession (Mouchet et al. 2010). FDu was not different from the null expectation regarding resource acquisition at early stages, but functional convergence was detected at latest stages (FDu based on RLQ axis 1, Fig. 4C). Contrastingly, trait convergence was not found for reproductive and regen-erative strategies (FDu based on RLQ axis 2, Fig. 4F).
The multidimensional richness FRIm never departed from the null expectation, but the corresponding SES increased with time (Fig. 3D), suggesting an overall trend to increasing functional richness along the succession. Likewise, the mul-tidimensional regularity FREm never clearly departed from the null expectation, but its SES decreased with time, sug-gesting less and less regular trait distribution in communities (Fig. 3E). Conversely, FDm showed significant convergence in ecological strategies within communities at the end of the succession (Fig. 3F), which highlighted the overall effect of habitat filtering on functional diversity.
Discussion
Two main axes of specialization: resource economy and reproduction/regeneration
In our study, we identified two independent combinations of traits, denoted as axes of specialization, which represented
and chamephytes (e.g. Rubus ulmifolius, Smilax aspera, Rubia peregrina) at later stages (Fig. 1, see also Supplementary material Appendix 1 Fig. A1). This axis hence represented a ‘long-short’ life history continuum. The traits associated with fast growth (high SLA, short life span) were highly and negatively correlated with the axis, while the traits asso-ciated with slow growth strategy (low SLA, woodiness) were positively correlated. The first axis of specialization thus reflected the resource acquisition strategy as captured by the leaf economics spectrum (Wright et al. 2004).
The second axis of specialization contrasted the situation of the 20–30 year-old sites with the others, and was mainly explained by the contribution of perennial herbaceous spe-cies such as Festuca occitanica, Bromus erectus, Brachypodium retusum, which dominated at mid-succession (Supplemen-tary material Appendix 1 Fig. A1). The variation in ecolo-gical strategies on this axis was related to dispersal modes, especially epizoochory, endozoochory and anemochory, as well as to seed mass and maximum height (Fig. 1). The sec-ond axis therefore represented an axis of reproductive and regenerative strategies.
Change in functional diversity along the succession
The species scores on each of the two first RLQ axes represented their ecological strategies associated with the two mains axes of specialization. We used these scores as species traits to calculate the one-dimensional trait-based statistics associated with the axes of specialization. There was no significant trend in functional richness (FRIu) along the succession on any of the two axes (Kendall correlation tests, Fig. 2A, D). Functional regularity showed no varia-tion with time for resource acquisition (FREu on RLQ axis 1, Fig. 2B) but decreased significantly at later stages for reproductive and regenerative strategies (FREu on RLQ axis
Figure 1. Ordination of traits and successional stages (■ 0∼10 years old, 10∼20 years old, ● 20∼30 years old, 30∼50 years old, ▲ 50∼80 years old, ∆ 90∼140 years old) according to the two first axes of the RLQ analysis. Arrows represent quantitative traits, and the position of qualitative traits is shown by a point and a label. See trait description in Table 1.
1766
Figure 2. Variation of the one-dimensional trait-based statistics along the succession. The traits are the species scores on the two first axes of the RLQ analysis, representing ecological strategies related to resource acquisition, on RLQ axis 1 (A, B and C), and to reproduction and regeneration, on RLQ axis 2 (D, E and F). The statistics are functional richness FRIu (A, D) functional regularity FREu (B, E), and functional divergence FDu (C, F). The solid and dashed lines are based on the median, the first and the third quartile of the statistics, calculated for each age class. The Kendall’s coefficient of correlation of the statistics with age is given along with the level of significance (NS not significant, *p 0.05, **p 0.01, ***p 0.001).
fundamental ecological tradeoffs along the primary succes-sion: first a set of traits related to resource-use strategies, second a set of trait related to reproductive and regenera-tive strategies. The detection of these independent axes is in agreement with plant ecological schemas that have suggested independence between vegetative and reproduc-tive strategies (Grime 2002, 2006, Westoby 1998, Westoby et al. 2002).
The first axis was related to the leaf economic spectrum (Wright et al. 2004) and depicted how fast acquisition strategies at early stage, associated with short-lived species, high SLA and early breeding at spring, was replaced by more conservative strategies of longer-lived species with low SLA at later stages (Fig. 1). This trend in resource acquisition
is consistent with that of other primary (Caccianiga et al. 2001) and secondary (Garnier et al. 2004, Navas et al. 2010, Vile et al. 2006) successions.
The second axis of specialization combined key traits related to reproduction and regeneration ability, including seed mass, maximum vegetative height and dispersal mode. The classical expectation was that small, anemochorous seeds are associated in early succession with more frequent dispersal and higher propagule pressure (Muller-Landau 2010), while a higher prevalence of zoochory and auto-chory, with large seeds, is expected at later stages of suc-cession (Bonet and Pausas 2004). But here we found that herbaceous, epizoochorous plants dominated communities at mid-succession, while more diverse strategies were found
1767
Figure 3. Variation of the multidimensional trait-based statistics (left) and of the related Standardized Effect Size (SES) (right) along the succession. The traits are the species scores on the axes of the RLQ analysis. The statistics are functional richness FRIm (A, D) functional regularity FREm (B, E), and functional divergence FDm (C, F). The solid and dashed lines of (A), (B) and (C) are based on the median, the first and the third quartile of the statistics, calculated for each age class. The dotted lines of (D), (E) and (F) show the 0.95 bilateral limits of the null distributions. The dotted lines are not shown, when they are outside the plot range. The Kendall’s coefficient of correlation of the statistics and SES with age is given along with the level of significance (NS not significant, *p 0.05, **p 0.01, ***p 0.001).
in older outcrops (Fig. 1). For instance, we often recorded in late succession smaller seed mass and anemochory, but also large seeds and endozoochory.
Contrasting processes drive functional diversity along the axes of specialization
We further used trait-based statistics to assess the nature of the ecological processes underlying trait variation in outcrop communities. We found that contrasting ecologi-cal drivers influenced the two main axes of specialization, which reflect different constraints on resource acquisition and regeneration/reproduction.
The functional richness of the resource acquisition traits (FRIu based on RLQ axis 1) was often significantly smaller
than expected under the null model, indicating that the trait range could be constrained for resource acquisition in communities, at any stage of the succession. These functional constraints could be related to the stressful abi-otic context of the vertical outcrops (Larson et al. 2000). Conversely, the range of reproductive and regenerative strat-egies along the succession (FRIu based on RLQ axis 2), as well as the overall multidimensional richness (FRIm), did not deviate from a random situation.
The functional divergence of the resource acquisition traits (FDu based on RLQ axis 1) decreased with time and deviated below the null expectation at later stages. Habitat filtering was therefore stronger at the end of the succes-sion regarding resource acquisition. Opportunistic ruderal species were most numerous early in the succession, and
1768
Table 3. Percentage of significant communities per trait-based statistic, and correlation of the corresponding standard effect sizes (SES) with age. SES displays the departure from the null swap expectation. Kendall’s rank correlation tests were per-formed on the SES (NS not significant, *p 0.05, **p 0.01, ***p 0.001).
Statistic % sites SES t
Multidimensional FRIm 10% 0.46***FREm 13% 20.37***FDm 35% 20.25*
Resource acquisition (RLQ axis 1) FRIu 29% NSFREu 17% NSFDu 40% 20.27**
Reproduction and regeneration (RLQ axis 2)
FRIu 10% NSFREu 27% 20.34***FDu 37% NS
Figure 4. Standardized effect sizes (SES) of the one-dimensional trait-based statistics. The traits are the species scores on the axes of the RLQ analysis, representing their ecological strategies related to resource acquisition, on RLQ axis 1 (A, B and C), and to reproduction and regeneration, on RLQ axis 2 (D, E and F). The statistics are functional richness FRIu, (A, D), regularity FREu (B, E) and divergence FDu (C, F). The dotted lines show the 0.95 bilateral limits of the null distributions. The dotted lines are not shown, when they are outside the plot range. The Kendall’s coefficient of correlation of the SES with age is given along with the level of significance (NS not significant, *p 0.05, **p 0.01, ***p 0.001).
stress-tolerant species displaying conservative adaptations to nutrient and water limitation became prominent in older outcrops (Larson et al. 2000). Conversely, FDu lacked any temporal trend and never departed from the null expecta-tion for regenerative and reproductive strategies, so that no habitat filtering was detected for this axis of specialization. Finally, although not significantly different from the null model, the overall multidimensional functional divergence (FDm) decreased over time, suggesting an overall trend to habitat filtering.
The multidimensional functional regularity (FREm) decreased along the succession but never significantly departed from the null expectation. The regularity of the resource acquisition traits (FREu based on RLQ axis 1) did not depart either from the null expectation. Because the
1769
assembly along ecological successions from trait information. The joint use of functional richness, regularity and diver-gence trait-based statistics helps assess their relative signa-tures. Because inferring processes is challenging whenever different processes yield similar patterns, exploring several facets of functional diversity is required.
Acknowledgements – We are grateful to A. Renaux and V. Pons for their help in data collection. We also thank Enrique Chaneton and Roger del Moral for their useful comments and suggestions. CV was supported by a Marie Curie International Outgoing Fellowship within the 7th European Community Framework Program (DiversiTraits project, no. 221060).
References
Albert, C. H. et al. 2011. When and how should intraspecific variability be considered in trait-based plant ecology? – Persp. Plant Ecol. Evol. Syst. 13: 217–225.
Bazzaz, F. A. 1979. Physiological ecology of plant succession. – Annu. Rev. Ecol. Syst. 10: 351–371.
Bell, G. et al. 2006. The comparative evidence relating to func-tional and neutral interpretations of biological communities. – Ecology 87: 1378–1386.
Bernhardt-Romermann, M. et al. 2008. On the identification of the most suitable traits for plant functional trait analyses. – Oikos 117: 1533–1541.
Bock, B. 2005. Base de Données Nomenclaturales de la Flore de France Ver. 4.02. – Tela Botanica.
Bonet, A. and Pausas, J. G. 2004. Species richness and cover along a 60-year chronosequence in old-fields of southeastern Spain. – Plant Ecol. 174: 257–270.
Brooker, R. W. et al. 2008. Facilitation in plant communities: the past, the present, and the future. – J. Ecol. 96: 18–34.
Caccianiga, M. et al. 2001. Vegetation and environmental factors during primary succession on glacier forelands: some outlines from the Italian Alps. – Plant Biosystems 135: 295–310.
Caccianiga, M. et al. 2006. The functional basis of a primary suc-cession resolved by CSR classification. – Oikos 112: 10–20.
Callaway, R. M. and Walker, L. R. 1997. Competition and facilitation: a synthetic approach to interactions in plant communities. – Ecology 78: 1958–1965.
Connell, J. H. and Slatyer, R. O. 1977. Mechanisms of succession in natural communities and their role in community stability and organization. – Am. Nat. 111: 1119–1144.
Cornelissen, J. H. C. et al. 2003. A handbook of protocols for standardised and easy measurement of plant functional traits worldwide. – Aust. J. Bot. 51: 335–380.
Cornwell, W. K. and Ackerly, D. D. 2009. Community assembly and shifts in plant trait distributions across an environmental gradient in coastal California. – Ecol. Monogr. 79: 109–126.
Cornwell, W. K. et al. 2006. A trait-based test for habitat filtering: convex hull volume. – Ecology 87: 1465–1471.
Davis, P. H. 1951. Cliff vegetation in the eastern Mediterranean. – J. Ecol. 39: 63–93.
Diamond, J. M. 1975. Assembly of species communities in ecology and evolution of communities. – Harvard Univ. Press.
Doledec, S. et al. 1996. Matching species traits to environmental variables: a new three-table ordination method. – Environ. Ecol. Stat. 3: 143–166.
Dray, S. and Legendre, P. 2008. Testing the species traits- environment relationships: the fourth-corner problem revisited. – Ecology 89: 3400–3412.
nutrient and water resources are quite limited in the context of the outcrops, we would expect competition to occur, and the classical expectation would be that niche differentiation due to competition increases with time. Rather, our result support the hypothesis that facilitation at early stages and competition at later stages both influence niche differen-tiation for resource acquisition and conceal any temporal trend (Verdu et al. 2009). Conversely, significant functional clustering (lower than random FREu for RLQ axis 2) was found for regenerative and reproductive strategies at later stages (Mouchet et al. 2010). We indeed found in old out-crops contrasted microsites with species exhibiting quite different traits including height and reproductive traits. An important conclusion here is that the spatially-based func-tional heterogeneity increased along the succession. Physi-cal heterogeneity of the microsites (size of the crevices, water availability) exists on outcrops from the beginning of the succession. But small specialist perennials establish later in the microsites that are not suitable for generalists (Davis 1951, Escudero 1996). The coexistence of special-ists and generalists in heterogeneous microsites could be therefore related to the increasing functional heterogeneity in the context of outcrop plant communities.
Conclusion
Ecological successions are governed by key ecological processes including species niche requirements, biotic interactions, dispersal limitation and habitat dynamics. Under the hypothesis that species traits can capture these processes (McGill et al. 2006), a trait-based approach to community assembly is useful for succession theory (Fukami et al. 2005, Garnier et al. 2004). We found two prominent axes of specialization in the context of a pri-mary plant succession from man-made outcrops, related to resource economy and reproduction/regeneration. The functional diversity within plant communities changed along the succession with 1) decreasing regularity and ultimately clustering of reproductive and regenerative traits, and 2) increasing habitat filtering for resource-use traits. These results support the idea that mechanisms of community assembly do not act similarly on each facet of plant ecological strategies (Cornwell and Ackerly 2009, Swenson and Enquist 2009, Kraft and Ackerly 2010), and that spatially-based functional heterogeneity can increase when the successional trajectories in microsites are differ-ent (Davis 1951, Escudero 1996). Finally, stressful envi-ronments are interesting contexts where both positive and negative interactions, as well as habitat heterogeneity, yield such complex patterns of functional diversity.
The prominent forces driving community assembly were further assessed by means of multidimensional statis-tics (Mason et al. 2005, Villéger et al. 2008, Schleuter et al. 2010), which highlighted an overall trend to trait conver-gence in late succession, combined with decreasing regular-ity, and greater functional richness. We finally suggest here that multidimensional and one-dimensional statistics con-vey complementary insights on functional variation within communities. This framework opens broader perspectives on how to disentangle independent drivers of community
1770
Mouillot, D. et al. 2005. Functional regularity: a neglected aspect of functional diversity. – Oecologia 142: 353–359.
Muller-Landau, H. C. 2010. The tolerance–fecundity tradeoff and the maintenance of diversity in seed size. – Proc. Natl Acad. Sci. USA 107: 4242–4247.
Navas, M. L. et al. 2010. Suites of plant traits in species from different stages of a Mediterranean secondary succession. – Plant Biol. 12: 183–196.
Pakeman, R. J. 2011. Multivariate identification of plant func-tional response and effect traits in an agricultural landscape. – Ecology 92: 1353–1365.
Pakeman, R. J. and Quested, H. M. 2007. Sampling plant functional traits: what proportion of the species need to be measured? – Appl. Veg. Sci. 10: 91–96.
Schleuter, D. et al. 2010. A user’s guide to functional diversity indices. – Ecol. Monogr. 80: 469–484.
Stubbs, W. J. and Wilson, J. B. 2004. Evidence for limiting similar-ity in a sand dune community. – J. Ecol. 92: 557–567.
Swenson, N. G. and Enquist, B. J. 2009. Opposing assembly mechanisms in a Neotropical dry forest: implications for phy-logenetic and functional community ecology. – Ecology 90: 2161–2170.
Tison, J. M. and Jauzein, P. in press. Flore de France méditer-ranéenne continentale. – CBNMED (Conservatoire Bota-nique National Méditerranéen).
Verdu, M. et al. 2009. Phylogenetic signatures of facilitation and competition in successional communities. – J. Ecol. 97: 1171–1180.
Vile, D. et al. 2006. A structural equation model to integrate changes in functional strategies during old-field succession. – Ecology 87: 504–517.
Villéger, S. et al. 2008. New multidimensional functional diversity indices for a multifaceted framework in functional ecology. – Ecology 89: 2290–2301.
Violle, C. et al. 2007. Let the concept of trait be functional! – Oikos 116: 882–892.
Walker, L. R. and del Moral, R. 2003. Primary succession and ecosystem rehabilitation. – Cambridge Univ. Press.
Westoby, M. 1998. A leaf-height-seed (LHS) plant ecology strategy scheme. – Plant Soil 199: 213–227.
Westoby, M. et al. 2002. Plant ecological strategies: some leading dimensions of variation between species. – Annu. Rev. Ecol. Syst. 33: 125–159.
Wright, I. J. et al. 2004. The worldwide leaf economics spectrum. – Nature 428: 821–827.
Escudero, A. 1996. Community patterns on exposed cliffs in a Mediterranean calcareous mountain. – Vegetatio 125: 99–110.
Fukami, T. et al. 2005. Species divergence and trait convergence in experimental plant community assembly. – Ecol. Lett. 8: 1283–1290.
Garnier, E. et al. 2004. Plant functional markers capture ecosys-tem properties during secondary succession. – Ecology 85: 2630–2637.
Gotelli, N. J. and Entsminger, G. L. 2001. Swap and fill algorithms in null model analysis: rethinking the knight’s tour. – Oecologia 129: 281–291.
Grime, J. P. 2002. Plant strategies, vegetation processes and ecosystem properties. – Wiley.
Grime, J. P. 2006. Trait convergence and trait divergence in herbaceous plant communities: mechanisms and conse-quences. – J. Veg. Sci. 17: 255–260.
Helmus, M. R. et al. 2007. Separating the determinants of phy-logenetic community structure. – Ecol. Lett. 10: 917–925.
Huston, M. and Smith, T. 1987. Plant succession: life history and competition. – Am. Nat. 130: 168–198.
Kleyer, M. et al. 2008. The LEDA traitbase: a database of life-history traits of the northwest European flora. – J. Ecol. 96: 1266–1274.
Kraft, N. J. B. and Ackerly, D. D. 2010. Functional trait and phylogenetic tests of community assembly across spatial scales in an Amazonian forest. – Ecol. Monogr. 80: 401–422.
Kraft, N. J. B. et al. 2008. Functional traits and niche-based tree community assembly in an amazonian forest. – Science 322: 580–582.
Larson, D. W. et al. (eds) 2000. Cliff ecology: pattern and process in cliff ecosystems. – Cambridge Univ. Press.
Legendre, P. et al. 1997. Relating behavior to habitat: solutions to the fourth-corner problem. – Ecology 78: 547–562.
Liu, K. et al. 2008. Seed information database. www.kew.org/data/sid
Mason, N. W. H. et al. 2005. Functional richness, functional even-ness and functional divergence: the primary components of functional diversity. – Oikos 111: 112–118.
McGill, B. J. et al. 2006. Rebuilding community ecology from functional traits. – Trends Ecol. Evol. 21: 178–185.
Mouchet, M. A. et al. 2010. Functional diversity measures: an overview of their redundancy and their ability to discriminate community assembly rules. – Funct. Ecol. 24: 867–876.
Supplementary material (available online as Appendix O20261 at www.oikosoffice.lu.se/appendix ). Appendix 1.

Oikos o20261
Raevel, V., Violle, C. and Munoz, F.
2012. Mechanisms of ecological
succession: insights from plant functional
strategies. – Oikos 000: 000–000.
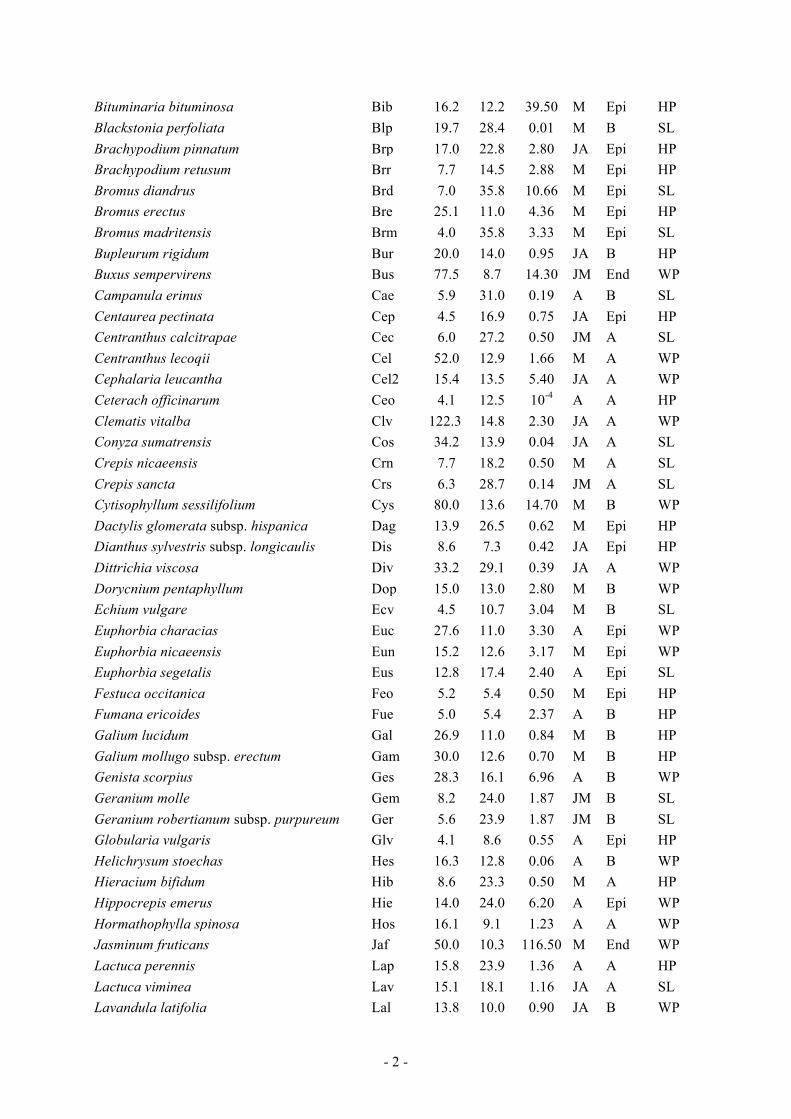
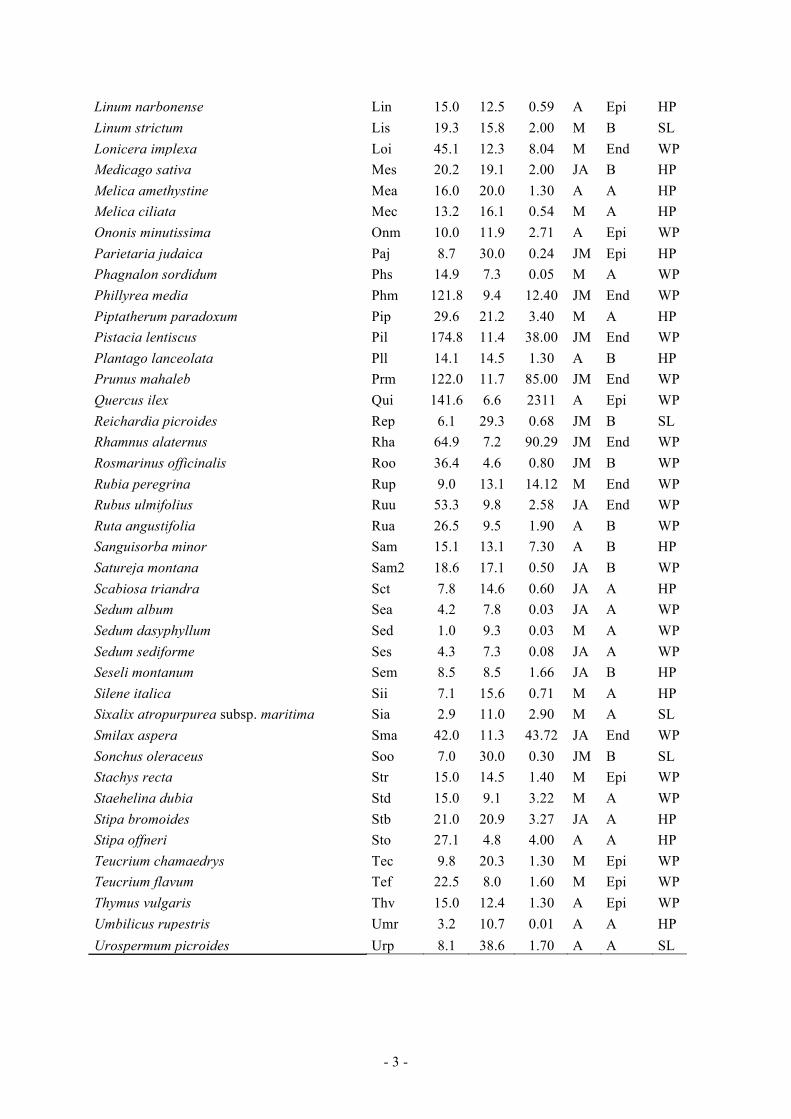
Appendix 1 Table A1. Scientific names. abbreviations and trait values of the 97 species included in the
survey. Scientific names follow the nomenclature BDNFF V4.02 (Bock 2005). Three traits
were measured (denoted with superscript 1) and the four other were extracted from
bibliographic sources: ²Tison and Jauzein (in press); 3Navas et al. (2010) and Seed
Information Database (Liu et al. 2008); 4LEDA (Kleyer et al. 2008); 5Biolflor (Klotz et al.
2002). H = vegetative height (in cm); SLA = specific leaf area (in mm2 mg-1); SM = seed
mass (mg); FS = flowering start period [JM: January–March; A: April; M: May; JA: June–
August]; DM = dispersal mode [A: anemochory; B: barochory and autochory are grouped;
Epi: epizoochory and myrmerochory are grouped; End: endozoochory]; LS = life span [SL:
short-lived; HP: herbaceous perennial; WP: woody perennial].
Species abbrev H1 SLA1 GM3 FS2 DM4. 5 LS²
Amelanchier ovalis Amo 187.9 14.3 4.60 JM End WP Antirrhinum majus Anm 49.2 17.8 0.20 JM Epi WP Aphyllanthes monspeliensis Apm 27.9 5.1 0.09 M B HP Arabis collina. Arc 1.4 13.8 0.09 M A HP Aristolochia pistolochia Arp 16.4 18.3 1.30 JM B HP Arrhenatherum elatius subsp. bulbosum Are 14.5 23.5 2.80 M Epi HP Asperula cynanchica Asc 30.1 11.7 0.73 M B WP Asplenium ruta-muraria Asr 4.9 12.8 10-4 JA A HP Asplenium trichomanes Ast 5.7 15.7 10-4 JM A HP Avena barbata Avb 12.6 27.3 9.00 M Epi SL Avenula bromoides Avb2 8.5 13.5 0.59 M Epi HP Biscutella laevigata Bil 8.5 13.3 4.36 M A HP
- 2 -
Bituminaria bituminosa Bib 16.2 12.2 39.50 M Epi HP Blackstonia perfoliata Blp 19.7 28.4 0.01 M B SL Brachypodium pinnatum Brp 17.0 22.8 2.80 JA Epi HP Brachypodium retusum Brr 7.7 14.5 2.88 M Epi HP Bromus diandrus Brd 7.0 35.8 10.66 M Epi SL Bromus erectus Bre 25.1 11.0 4.36 M Epi HP Bromus madritensis Brm 4.0 35.8 3.33 M Epi SL Bupleurum rigidum Bur 20.0 14.0 0.95 JA B HP Buxus sempervirens Bus 77.5 8.7 14.30 JM End WP Campanula erinus Cae 5.9 31.0 0.19 A B SL Centaurea pectinata Cep 4.5 16.9 0.75 JA Epi HP Centranthus calcitrapae Cec 6.0 27.2 0.50 JM A SL Centranthus lecoqii Cel 52.0 12.9 1.66 M A WP Cephalaria leucantha Cel2 15.4 13.5 5.40 JA A WP Ceterach officinarum Ceo 4.1 12.5 10-4 A A HP Clematis vitalba Clv 122.3 14.8 2.30 JA A WP Conyza sumatrensis Cos 34.2 13.9 0.04 JA A SL Crepis nicaeensis Crn 7.7 18.2 0.50 M A SL Crepis sancta Crs 6.3 28.7 0.14 JM A SL Cytisophyllum sessilifolium Cys 80.0 13.6 14.70 M B WP Dactylis glomerata subsp. hispanica Dag 13.9 26.5 0.62 M Epi HP Dianthus sylvestris subsp. longicaulis Dis 8.6 7.3 0.42 JA Epi HP Dittrichia viscosa Div 33.2 29.1 0.39 JA A WP Dorycnium pentaphyllum Dop 15.0 13.0 2.80 M B WP Echium vulgare Ecv 4.5 10.7 3.04 M B SL Euphorbia characias Euc 27.6 11.0 3.30 A Epi WP Euphorbia nicaeensis Eun 15.2 12.6 3.17 M Epi WP Euphorbia segetalis Eus 12.8 17.4 2.40 A Epi SL Festuca occitanica Feo 5.2 5.4 0.50 M Epi HP Fumana ericoides Fue 5.0 5.4 2.37 A B HP Galium lucidum Gal 26.9 11.0 0.84 M B HP Galium mollugo subsp. erectum Gam 30.0 12.6 0.70 M B HP Genista scorpius Ges 28.3 16.1 6.96 A B WP Geranium molle Gem 8.2 24.0 1.87 JM B SL Geranium robertianum subsp. purpureum Ger 5.6 23.9 1.87 JM B SL Globularia vulgaris Glv 4.1 8.6 0.55 A Epi HP Helichrysum stoechas Hes 16.3 12.8 0.06 A B WP Hieracium bifidum Hib 8.6 23.3 0.50 M A HP Hippocrepis emerus Hie 14.0 24.0 6.20 A Epi WP Hormathophylla spinosa Hos 16.1 9.1 1.23 A A WP Jasminum fruticans Jaf 50.0 10.3 116.50 M End WP Lactuca perennis Lap 15.8 23.9 1.36 A A HP Lactuca viminea Lav 15.1 18.1 1.16 JA A SL Lavandula latifolia Lal 13.8 10.0 0.90 JA B WP
- 3 -
Linum narbonense Lin 15.0 12.5 0.59 A Epi HP Linum strictum Lis 19.3 15.8 2.00 M B SL Lonicera implexa Loi 45.1 12.3 8.04 M End WP Medicago sativa Mes 20.2 19.1 2.00 JA B HP Melica amethystine Mea 16.0 20.0 1.30 A A HP Melica ciliata Mec 13.2 16.1 0.54 M A HP Ononis minutissima Onm 10.0 11.9 2.71 A Epi WP Parietaria judaica Paj 8.7 30.0 0.24 JM Epi HP Phagnalon sordidum Phs 14.9 7.3 0.05 M A WP Phillyrea media Phm 121.8 9.4 12.40 JM End WP Piptatherum paradoxum Pip 29.6 21.2 3.40 M A HP Pistacia lentiscus Pil 174.8 11.4 38.00 JM End WP Plantago lanceolata Pll 14.1 14.5 1.30 A B HP Prunus mahaleb Prm 122.0 11.7 85.00 JM End WP Quercus ilex Qui 141.6 6.6 2311 A Epi WP Reichardia picroides Rep 6.1 29.3 0.68 JM B SL Rhamnus alaternus Rha 64.9 7.2 90.29 JM End WP Rosmarinus officinalis Roo 36.4 4.6 0.80 JM B WP Rubia peregrina Rup 9.0 13.1 14.12 M End WP Rubus ulmifolius Ruu 53.3 9.8 2.58 JA End WP Ruta angustifolia Rua 26.5 9.5 1.90 A B WP Sanguisorba minor Sam 15.1 13.1 7.30 A B HP Satureja montana Sam2 18.6 17.1 0.50 JA B WP Scabiosa triandra Sct 7.8 14.6 0.60 JA A HP Sedum album Sea 4.2 7.8 0.03 JA A WP Sedum dasyphyllum Sed 1.0 9.3 0.03 M A WP Sedum sediforme Ses 4.3 7.3 0.08 JA A WP Seseli montanum Sem 8.5 8.5 1.66 JA B HP Silene italica Sii 7.1 15.6 0.71 M A HP Sixalix atropurpurea subsp. maritima Sia 2.9 11.0 2.90 M A SL Smilax aspera Sma 42.0 11.3 43.72 JA End WP Sonchus oleraceus Soo 7.0 30.0 0.30 JM B SL Stachys recta Str 15.0 14.5 1.40 M Epi WP Staehelina dubia Std 15.0 9.1 3.22 M A WP Stipa bromoides Stb 21.0 20.9 3.27 JA A HP Stipa offneri Sto 27.1 4.8 4.00 A A HP Teucrium chamaedrys Tec 9.8 20.3 1.30 M Epi WP Teucrium flavum Tef 22.5 8.0 1.60 M Epi WP Thymus vulgaris Thv 15.0 12.4 1.30 A Epi WP Umbilicus rupestris Umr 3.2 10.7 0.01 A A HP Urospermum picroides Urp 8.1 38.6 1.70 A A SL
- 4 -
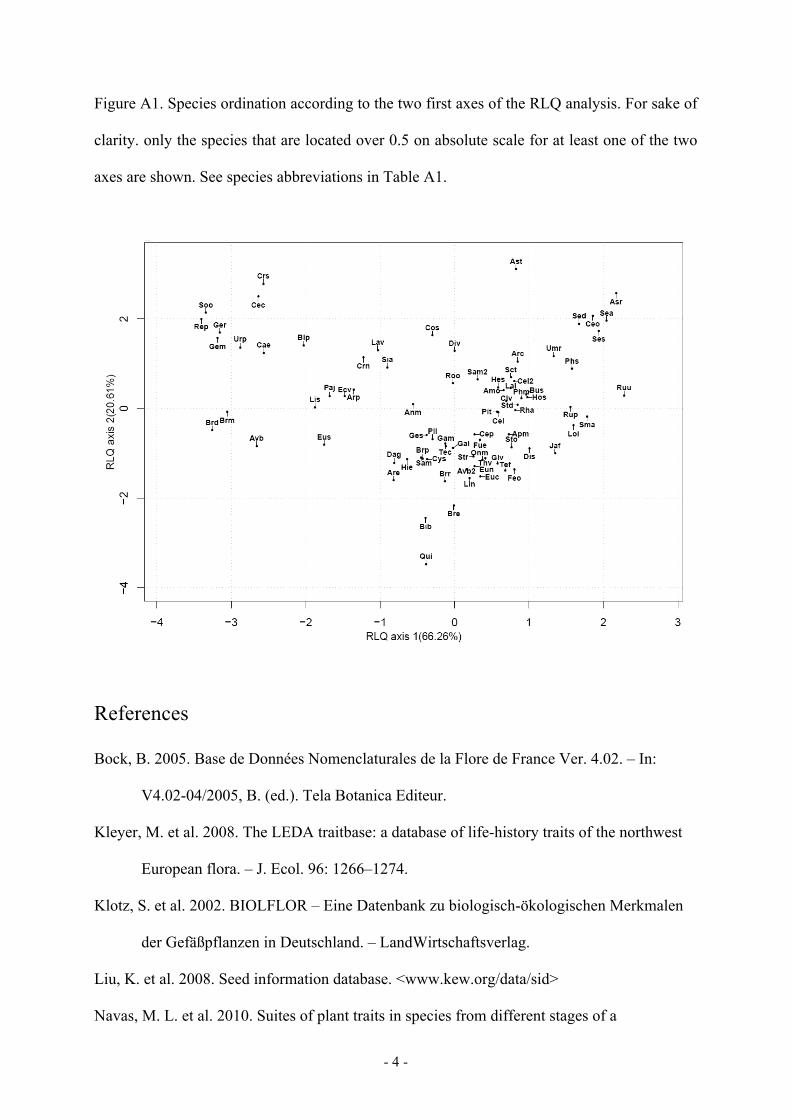
Figure A1. Species ordination according to the two first axes of the RLQ analysis. For sake of
clarity. only the species that are located over 0.5 on absolute scale for at least one of the two
axes are shown. See species abbreviations in Table A1.
References
Bock, B. 2005. Base de Données Nomenclaturales de la Flore de France Ver. 4.02. – In:
V4.02-04/2005, B. (ed.). Tela Botanica Editeur.
Kleyer, M. et al. 2008. The LEDA traitbase: a database of life-history traits of the northwest
European flora. – J. Ecol. 96: 1266–1274.
Klotz, S. et al. 2002. BIOLFLOR – Eine Datenbank zu biologisch-ökologischen Merkmalen
der Gefäßpflanzen in Deutschland. – LandWirtschaftsverlag.
Liu, K. et al. 2008. Seed information database. <www.kew.org/data/sid>
Navas, M. L. et al. 2010. Suites of plant traits in species from different stages of a

- 5 -
Mediterranean secondary succession. – Plant Biol. 12: 183–196.
Tison, J. M. and Jauzein, P. in press. Flore de France méditerranéenne continentale. –
CBNMED (Conservatoire Botanique National Méditerranéen).