Mechanisms and Dynamics of Orphan Gene Emergence in ...
17
Mechanisms and Dynamics of Orphan Gene Emergence in Insect Genomes Lothar Wissler 1 , Ju ¨ rgen Gadau 2 , Daniel F. Simola 3 , Martin Helmkampf 2 , and Erich Bornberg-Bauer 1, * 1 Institute for Evolution and Biodiversity, University of Muenster, Muenster, Germany 2 School of Life Sciences, Arizona State University 3 Department of Cell and Developmental Biology, University of Pennsylvania *Corresponding author: E-mail: [email protected]. Accepted: January 15, 2013 Abstract Orphan genes are defined as genes that lack detectable similarity to genes in other species and therefore no clear signals of common descent (i.e., homology) can be inferred. Orphans are an enigmatic portion of the genome because their origin and function are mostly unknown and they typically make up 10% to 30% of all genes in a genome. Several case studies demonstrated that orphans can contribute to lineage-specific adaptation. Here, we study orphan genes by comparing 30 arthropod genomes, focusing in particular on seven recently sequenced ant genomes. This setup allows analyzing a major metazoan taxon and a comparison between social Hymenoptera (ants and bees) and nonsocial Diptera (flies and mosquitoes). First, we find that recently split lineages undergo accelerated genomic reorganization, including the rapid gain of many orphan genes. Second, between the two insect orders Hymenoptera and Diptera, orphan genes are more abundant and emerge more rapidly in Hymenoptera, in particular, in leaf-cutter ants. With respect to intragenomic localization, we find that ant orphan genes show little clustering, which suggests that orphan genes in ants are scattered uniformly over the genome and between nonorphan genes. Finally, our results indicate that the genetic mechanisms creating orphan genes—such as gene duplication, frame-shift fixation, creation of overlapping genes, horizontal gene transfer, and exaptation of transposable elements—act at different rates in insects, primates, and plants. In Formicidae, the majority of orphan genes has their origin in intergenic regions, pointing to a high rate of de novo gene formation or generalized gene loss, and support a recently proposed dynamic model of frequent gene birth and death. Key words: orphan genes, genome evolution, insects, ants (Formicidae). Introduction Genomic comparisons enable us to study the emergence and benefits of new genetic material upon which selection can act. Genomic innovations underlying speciation and adaptation can be caused by a variety of processes that include, but are not limited to, chromosomal rearrangements, changes in gene regulation and emergence of new genes, or addition and loss of gene fragments (Ohno 1970; Lynch and Conery 2000; Noor et al. 2001; Prud’homme et al. 2007; Carroll 2008; Khalturin et al. 2009; Kaessmann 2010; Stevison et al. 2011). The application of comparative genomics has uncovered great variation in the gene content in genomes within the same (Tettelin et al. 2005; Stankiewicz and Lupski 2010) and among different species (Tatusov et al. 2003; Gil et al. 2004). In fact, only a small set of genes seems to be universal across kingdoms, whereas the phyloge- netic distribution of all other genes is restricted at different levels (Harris et al. 2003). Depending on its age, evolutionary rate, and the mechanism by which a new gene has emerged, it shares different degrees of similarity to genes in other spe- cies. Most extreme are orphan genes, which lack detectable homology to a gene in other lineages but represent up to one- third of all genes in eukaryotes (Khalturin et al. 2009; Tautz and Domazet-Los ˇo 2011). Here, we will distinguish between taxon-specific orphan genes (TSOGs), which are characterized by the lack of homology to genes outside of a focal taxonomic group, and species-specific orphan genes (SSOGs), which are the subset of TSOGs that appear to be strictly species-specific according to the taxon sampling; true SSOGs lack homology GBE ß The Author(s) 2013. Published by Oxford University Press on behalf of the Society for Molecular Biology and Evolution. This is an Open Access article distributed under the terms of the Creative Commons Attribution Non-Commercial License (http://creativecommons.org/licenses/by-nc/3.0/), which permits unrestricted non-commercial use, distribution, and reproduction in any medium, provided the original work is properly cited. Genome Biol. Evol. 5(2):439–455. doi:10.1093/gbe/evt009 Advance Access publication January 24, 2013 439 Downloaded from https://academic.oup.com/gbe/article/5/2/439/560219 by guest on 13 April 2022
-
Upload
khangminh22 -
Category
Documents
-
view
0 -
download
0
Transcript of Mechanisms and Dynamics of Orphan Gene Emergence in ...

Mechanisms and Dynamics of Orphan Gene Emergence in
Insect Genomes
Lothar Wissler1, Jurgen Gadau2, Daniel F. Simola3, Martin Helmkampf2, and Erich Bornberg-Bauer1,*1Institute for Evolution and Biodiversity, University of Muenster, Muenster, Germany2School of Life Sciences, Arizona State University3Department of Cell and Developmental Biology, University of Pennsylvania
*Corresponding author: E-mail: [email protected].
Accepted: January 15, 2013
Abstract
Orphan genes are defined as genes that lack detectable similarity to genes in other species and therefore no clear signals of common
descent (i.e., homology) can be inferred. Orphans are an enigmatic portion of the genome because their origin and function are
mostly unknown and they typically make up 10% to 30% of all genes in a genome. Several case studies demonstrated that orphans
can contribute to lineage-specific adaptation. Here, we study orphan genes by comparing 30 arthropod genomes, focusing in
particularonsevenrecently sequencedantgenomes.This setupallowsanalyzingamajormetazoan taxonandacomparisonbetween
social Hymenoptera (ants and bees) and nonsocial Diptera (flies and mosquitoes). First, we find that recently split lineages undergo
accelerated genomic reorganization, including the rapid gain of many orphan genes. Second, between the two insect orders
Hymenoptera and Diptera, orphan genes are more abundant and emerge more rapidly in Hymenoptera, in particular, in leaf-cutter
ants. With respect to intragenomic localization, we find that ant orphan genes show little clustering, which suggests that orphan
genes in ants are scattered uniformly over the genome and between nonorphan genes. Finally, our results indicate that the genetic
mechanisms creating orphan genes—such as gene duplication, frame-shift fixation, creation of overlapping genes, horizontal gene
transfer,andexaptationof transposableelements—actatdifferent rates in insects,primates,andplants. InFormicidae, themajorityof
orphan genes has their origin in intergenic regions, pointing to a high rate of de novo gene formation or generalized gene loss, and
support a recently proposed dynamic model of frequent gene birth and death.
Key words: orphan genes, genome evolution, insects, ants (Formicidae).
Introduction
Genomic comparisons enable us to study the emergence and
benefits of new genetic material upon which selection can act.
Genomic innovations underlying speciation and adaptation
can be caused by a variety of processes that include, but are
not limited to, chromosomal rearrangements, changes in
gene regulation and emergence of new genes, or addition
and loss of gene fragments (Ohno 1970; Lynch and Conery
2000; Noor et al. 2001; Prud’homme et al. 2007; Carroll
2008; Khalturin et al. 2009; Kaessmann 2010; Stevison
et al. 2011). The application of comparative genomics has
uncovered great variation in the gene content in genomes
within the same (Tettelin et al. 2005; Stankiewicz and
Lupski 2010) and among different species (Tatusov et al.
2003; Gil et al. 2004). In fact, only a small set of genes
seems to be universal across kingdoms, whereas the phyloge-
netic distribution of all other genes is restricted at different
levels (Harris et al. 2003). Depending on its age, evolutionary
rate, and the mechanism by which a new gene has emerged,
it shares different degrees of similarity to genes in other spe-
cies. Most extreme are orphan genes, which lack detectable
homology to a gene in other lineages but represent up to one-
third of all genes in eukaryotes (Khalturin et al. 2009; Tautz
and Domazet-Loso 2011). Here, we will distinguish between
taxon-specific orphan genes (TSOGs), which are characterized
by the lack of homology to genes outside of a focal taxonomic
group, and species-specific orphan genes (SSOGs), which are
the subset of TSOGs that appear to be strictly species-specific
according to the taxon sampling; true SSOGs lack homology
GBE
� The Author(s) 2013. Published by Oxford University Press on behalf of the Society for Molecular Biology and Evolution.
This is an Open Access article distributed under the terms of the Creative Commons Attribution Non-Commercial License (http://creativecommons.org/licenses/by-nc/3.0/), which
permits unrestricted non-commercial use, distribution, and reproduction in any medium, provided the original work is properly cited.
Genome Biol. Evol. 5(2):439–455. doi:10.1093/gbe/evt009 Advance Access publication January 24, 2013 439
Dow
nloaded from https://academ
ic.oup.com/gbe/article/5/2/439/560219 by guest on 13 April 2022

to any gene from any species. Note that any SSOG may
become relabeled as a TSOG as soon as taxon sampling be-
comes denser.
In general, the variability of gene content across species
suggests that gene loss (Krylov et al. 2003) and the emergence
of new genes (Long et al. 2003) play a significant role in both
genome evolution and phenotypic evolution (Long et al. 2003;
Khalturin et al. 2009; Chen et al. 2010). The contribution of
new genes to important species-specific adaptations can in-
volve both the morphological level (Khalturin et al. 2008;
Milde et al. 2009) as well as the genetic basis for responses
to changing environmental stimuli (Colbourne et al. 2011;
Donoghue et al. 2011; Voolstra et al. 2011). For example,
orphan genes can be involved in the creation of morphological
innovation as shown in Hydra sp. In Hydra sp., Khalturin et al.
(2008) uncovered a new gene that encodes a protein regu-
lating tentacle formation. Other Hydra sp. orphan genes are
involved in the evolution of the cnidarian nematocyst (Milde
et al. 2009). In human, it has been suggested that orphan
genes play an important role in early brain development
(Zhang et al. 2011). Environmentally responsive genes in
corals, which show traces of positive selection are often
TSOGs (Voolstra et al. 2011). In Daphnia, orphan genes
make up more than a third of the genome and are the
most environmentally responsive genes in the genome
(Colbourne et al. 2011). In plants, orphan genes are also en-
riched for responses to a variety of abiotic stresses (Donoghue
et al. 2011).
But where do new genes in general, and orphan genes in
particular, come from? Multiple studies have addressed the
molecular genetic mechanisms responsible for the formation
of new genes (Long et al. 2003; Zhou et al. 2008; Kaessmann
2010; Wu et al. 2011). These studies identified a variety of
genetic mechanisms involved in creating new genes, including
gene duplication, gene fusion and fission, exon shuffling, re-
cruitment of new exons from mobile element sequences, ret-
roposition, lateral gene transfer, and de novo origination (i.e.,
from previously noncoding sequence). Systematic studies on
the evolutionary origin of orphan genes in primates (Toll-Riera
et al. 2009) and the plant Arabidopsis thaliana (Donoghue
et al. 2011) indicate that gene duplication and exaptation
from transposable elements (TEs) are the major forces driving
the emergence of orphan genes. Another study investigating
the emergence of new Drosophila genes (not restricted to
orphan genes) corroborated the dominant role of gene dupli-
cation but also suggested that surprisingly many genes
(�12%) seem to have originated de novo, that is, from pre-
viously noncoding sequences or RNA coding sequences (CDS)
(Zhou et al. 2008). Similarly, a recent study has estimated that
as many as 10 protein-coding genes emerge de novo in
humans per 1 Myr (Wu et al. 2011), contradicting the previous
assumption that de novo origination of new genes is very rare
(Long et al. 2003). The relative contribution of each of the
genetic mechanisms to the creation of new genes remains
controversial and seems to vary considerable between taxa
(discussed later).
We here investigate rates and genetic mechanisms of
orphan gene emergence across insects with a focus on the
Formicidae (ants) clade that includes seven ant species with
recently sequenced genomes. The ecological prevalence and
diversity of insects makes them an ideal object for comparative
genomics research. Almost 1 million insect species have been
described so far, and it is believed that the total number
ranges between 2.5 and 10 million (Grimaldi and Engel
2005). Moreover, insects display a huge variety of structural,
physiological, and behavioral adaptations (Grimaldi and Engel
2005), resulting in high rates of speciation, diversification, and
adaptation. Overall, comparative genomics across insect ge-
nomes benefits from a large taxon sampling covering more
than 350 Myr (n> 20; supplementary fig. S1, Supplementary
Material online) and provides a promising resource for the
study of genomic innovations. With the sequencing of seven
ant genomes and the honey bee genome, we can now also
study genome evolution in the context of social versus solitary
insects (discussed later).
Among the “big four” insect orders that account for ap-
proximately 80% of all described insect species, Diptera has
been the most “genomically” sampled order with 15 avail-
able genomes (supplementary fig. S1, Supplementary
Material online). Although genomes are still scarce for
Coleoptera and Lepidoptera, taxon sampling has strongly
increased for Hymenoptera, which are now represented by
nine genomes. These nine fully sequenced hymenopteran
species comprise the solitary jewel wasp (Nasonia vitripennis),
the eusocial honey bee (Apis mellifera), and seven eusocial
ants. The large number of available genomes and variation
in important life history traits currently renders the
Hymenoptera the only insect order that has a number and
diversity of taxa comparable with Dipterans/Drosophilidae so
that these two insect orders are well suited for cross-taxa
comparative genomics analyses. The nine hymenopteran
species span a broad evolutionary time scale of approxi-
mately 150–200 Myr (Grimaldi and Engel 2005; Werren
et al. 2010), with the speciation times of the sequenced
ants spanning approximately 100 Myr (Brady et al. 2006;
Moreau et al. 2006; Gadau et al. 2012), whereas the
Drosophila clade is characterized by a higher density of
very closely related species (12 species with a last common
ancestor 40–60 Ma; Tamura et al. 2004; Markow and
O’Grady 2007).
Here, we concentrate on genomic innovation in
Hymenoptera with a focus on orphan genes in ants. The
sequenced seven ant species represent important evolutionary
transitions including fundamental changes in nutrition (e.g.,
carnivores, herbivores specialized on seeds, fungivores,
or omnivores), expansion into new habitats (from terrestrial
to arboreal), or social organization (supplementary text
S1, Supplementary Material online, for details and
Wissler et al. GBE
440 Genome Biol. Evol. 5(2):439–455. doi:10.1093/gbe/evt009 Advance Access publication January 24, 2013
Dow
nloaded from https://academ
ic.oup.com/gbe/article/5/2/439/560219 by guest on 13 April 2022

Gadau et al. 2012, for a review). We compare our results to
the other available insect genomes (28; supplementary fig. S1,
Supplementary Material online). In particular, we compare
rates of orphan gene emergence between Hymenoptera/
Formicidae and Diptera/Drosophilidae. We also give a com-
prehensive overview of the structure and genetic origin of
SSOGs in the seven recently sequenced ant genomes.
Finally, the comparison among insect and arthropod outgroup
genomes allows deriving expected frequencies of orphan
genes and thus provides a foundation for future insect
genome projects. Our analyses also address the role of new
genes for the evolution of sociality and social evolution within
ants and Hymenoptera. As such, our results will build a base-
line for further studies on genomic innovations in insects in
general and Hymenoptera in particular.
Materials and Methods
Thirty Arthropod Genome Data Set
Genome data of 30 arthropod species were obtained from
different sources (table 1), which included protein, CDS, and
gene feature files.
Divergence times (table 1) were obtained from the time-
tree.orgdatabase (Hedgesetal. 2006) andmanually reconciled
if necessary. These estimates served as approximate values,
which allowed normalizing for different phylogenetic branch
lengths when determining the rate of SSOG emergence.
Identification of Orphan Genes
SSOGs were identified by filtering annotated proteins against
two data sets, including 30 arthropod proteomes and all
Table 1
Data Set Overview: Genomes and Selected Features of 30 Arthropod Species
Species Genome
Version
Source Abbreviation Genes Missing
Genes
SSOGs
Standard
SSOGs
Refined
Distance to
MRCA
Aedes aegypti L1.2 [V] Aaeg 17,399 1,161 1,105 52
Atta cephalotes 1.2 [H] Acep 18,093 989 2,074 1,970 10
Acyrthosiphon pisum 1 [A] Acyp 34,821 12,522 12,151 280
Acromyrmex echinatior 2.0/3.8 [H] Aech 17,278 1,253 2,730 2,644 10
Anopheles gambiae P3.6 [V] Agam 14,324 840 769 150
Apis mellifera 2 [H] Amel 11,062 223 431 289 140
Bombyx mori 2 [S] Bmor 14,623 2,866 2,701 285
Camponotus floridanus 3.3 [H] Cflo 17,064 676 1,896 1,761 115
Culex quinquefasciatus J1.2 [V] Cqui 18,882 902 821 52
Drosophila ananassae 1.3 [F] Dana 15,070 944 810 12
D. erecta 1.3 [F] Dere 15,048 666 558 4
D. grimshawi 1.3 [F] Dgri 14,986 811 702 32
D. melanogaster 5.37 [F] Dmel 13,914 318 230 4
D. mojavensis 1.3 [F] Dmoj 14,595 1,118 948 24
D. persimilis 1.3 [F] Dper 16,878 878 755 1
D. pseudoobscura 1.3 [F] Dpse 16,029 567 464 1
D. pulex 1.1 [J] Dpul 30,907 13,709 13,181 470
D. sechellia 1.3 [F] Dsec 16,471 645 527 1
D. simulans 1.3 [F] Dsim 15,415 637 522 1
D. virulans 1.2 [F] Dvir 14,491 792 680 24
D. willistoni 1.3 [F] Dwil 15,513 1,230 1,105 36
D. yakuba 1.3 [F] Dyak 16,082 959 829 4
Harpegnathos saltator 3.3 [H] Hsal 18,564 622 1,919 1,391 125
Ixodes scapularis W1.1 [V] Isca 20,486 7,007 6,677 550
Linepithema humile 1.2 [H] Lhum 16,116 678 1,448 1,349 120
Nasonia vitripennis 1.2 [H] Nvit 18,822 150 2,305 2,191 150
Pogonomyrmex barbatus 1.2 [H] Pbar 17,189 729 2,173 2,054 105
Pediculus humanus U1.2 [V] Phum 10,774 1,176 1,096 280
Solenopsis invicta 2.2.3 [H] Sinv 16,522 1,049 926 885 60
Tribolium castaneum 3 [B] Tcas 16,645 3,757 3,623 300
NOTE.—For each genome, the species name, genome version, and download source are given. A: AphidBase (Legeai et al. 2010); B: BeetleBase (Kim et al. 2010); F:FlyBase (McQuilton et al. 2012); H: Hymenoptera Genome Database (Munoz-Torres et al. 2011); J: DOE Joint Genome Institute (http://www.jgi.doe.gov/); S: SilkDB (Duan et al.2010); V: VectorBase (Lawson et al. 2009). Abbreviation: Four-letter species abbreviation used throughout this manuscript; Genes: Number of protein-coding genes in the OGS(i.e., excluding possibly missing genes); SSOGs: derived with standard methods (Standard) or comprehensive filtering (Refined); Distance to the MRCA: Evolutionary distance(Myr) to the MRCA node in the phylogenetic tree of these 30 arthropods.
Orphan Gene Emergence in Insect Genomes GBE
Genome Biol. Evol. 5(2):439–455. doi:10.1093/gbe/evt009 Advance Access publication January 24, 2013 441
Dow
nloaded from https://academ
ic.oup.com/gbe/article/5/2/439/560219 by guest on 13 April 2022

SwissProt taxonomic divisions excluding invertebrates. For all
non-ant genes, three filtering stages were used, whereas for
the ant genes, a forth filtering step was added, as follows:
1. Eliminate all proteins that have a BLAST hit with E� 10�3
in any of the other arthropod proteomes, using defaultsettings otherwise.
2. Eliminate all proteins that have a BLAST hit with E� 10�3
in any of SwissProt taxonomic divisions other than inverte-brates, using default settings otherwise.
3. Eliminate all proteins that have a BLAST hit with E� 10�3
in any of the other arthropod proteomes when low com-plexity filtering is deactivated.
4. (For ants only) Accept as SSOG only if no evidence could befound that homologous genes were missed in other ge-nomes (see Materials and Methods: Identification of miss-ing gene models).
TSOGs were identified as genes annotated in any species part
of the focal taxonomic group that lack sequence similarity to
genes outside of the focal group. The identification was based
on an all versus all BLASTP search; sequence similarity was
assumed if a BLAST hit with E< 10�3 was found. BLAST hits
of genes in any species from the focal group were ignored.
Identification of Missing Gene Models
Tentative ant SSOGs were compared against the DNA se-
quence of all hymenopteran species and Drosophila melano-
gaster. We used TBLASTN (low complexity filtering activated,
E<10�5) to identify the most likely position of the missing
gene model in the genome. If such a BLAST hit was found,
GeneWise v2.4.1 (Birney et al. 2004) was employed to align
the protein sequence of the tentative SSOG to the scaffold
strand and position specifically. For performance reasons, the
candidate genome region determined by TBLASTN was ex-
tracted before running GeneWise using the TBLASTN match
coordinates plus 50 kb up- and downstream. Only GeneWise
models with a score >35, coverage of the query sequence
>75%, and zero indels were accepted. By accepting only
zero-indel models, putative pseudogenes were not identified
as missing gene models and falsely assumed to be homolo-
gous functional genes.
Modeling Rate of Orphan Gene Emergence
A linear model was used to relate the distance to the most
recent common ancestor (MRCA) node in the insect phyloge-
netic tree and the number of SSOGs using R and the lm()
function. As a base model, all non-formicid insect species
from the 30 arthropod genome data set with less than 300
Myr distance to their MRCA node except Amel were used. We
excluded Amel due to its current bias in genome annotation,
which is depleted for orphan genes. R’s predict( ) function was
used to determine the confidence and prediction intervals.
Origin of SSOGs in Ants
Gene duplication was inferred for gene pairs with significant
sequence similarity. If the two encoding proteins shared a local
alignment with E<10�3 as determined by BLASTP, they are
considered to be gene duplicates.
Nondeleterious frame shift mutations across ant SSOGs
were inferred as follows: Each SSOG was compared against
the full-genome CDS of all other hymenopteran species plus
Dmel and Tcas using TBLASTN with E< 10�5. Frame shifts
were inferred only if both of the following criteria were met:
1) one or more significant BLAST hits in CDS across these
reference species on the sense strand and out of the regular
frame, that is, +2 or +3; 2) no significant BLAST hit in CDS in
frame +1 or on the antisense strand.
Alternative reading frames were screened among ant
SSOGs as follows: Each SSOG protein sequence was com-
pared against all CDS within the same species using
TBLASTN with E< 10�5. Self-hits, in-frame matches, and
matches on the anti-sense strand were ignored. For the re-
maining candidate protein/CDS pairs, the genomic locations
were obtained from the gff, and only candidates, which are
encoded by the same genomic locus were accepted as pro-
teins from alternative reading frames.
Overlap with TEs was identified based on CDS overlaps of
ant SSOGs with TE coordinates using BEDtools (Quinlan and
Hall 2010). TEs were identified with RepeatMasker (v3.3.0,
Smit et al. 2010) and default settings using homology to
known metazoan TEs part of Repbase (20110920, Jurka
et al. 2005).
Horizontal gene transfer (HGT) candidates using the
domain-based approach were determined in a three-step pro-
cess. First, all proteins in the NCBI nonredundant database
(from March 30, 2011) were annotated against Pfam-A
v25.0 (Punta et al. 2011) (see Identification of protein do-
mains). For each domain, the relative frequency was deter-
mined of occurring in proteins from selected taxonomic units
within the NCBI Taxonomy. All domains with a relative fre-
quency of �95% in any one of these nodes, Bacteria,
Archaea, Viridae, Fungi, and Viridiplantae, were saved as a
list of candidate alien domains. Second, the proteomes of
the 30 arthropods were annotated against Pfam-A.
Overlapping domains were resolved by recursively removing
the less significant domain(s) in overlap regions. As a second
candidate list of alien domains, those domains were deter-
mined which fulfilled the following three criteria: 1) the
domain was found in at least one ant species and showed a
score above gathering threshold; 2) the domain was not
found with a score above the gathering threshold in
any non-formicid arthropod species; and 3) the domain
showed a difference in E-values of at least 10-fold be-
tween the ant match and the best non-Formicidae arthropod
match. Third, the final list of alien domains in ants was
Wissler et al. GBE
442 Genome Biol. Evol. 5(2):439–455. doi:10.1093/gbe/evt009 Advance Access publication January 24, 2013
Dow
nloaded from https://academ
ic.oup.com/gbe/article/5/2/439/560219 by guest on 13 April 2022

generated by cross-referencing the two lists of candidate alien
domains.
Overlapping gene models were inferred as pairs of genes
whose CDS overlaps by at least 30 nt on opposite strands
(“CDS–CDS different-strand overlaps”). CDS coordinates
were obtained from gene feature files and BEDtools
(Quinlan and Hall 2010) was used to intersect these CDS fea-
tures and identify overlaps �30 nt.
Intergenic matches in other hymenopteran genomes were
determined using the same method as used by Donoghue
et al. (2011): Ant SSOGs were screened against all hymenop-
teran scaffolds with TBLASTN (E<10�3). BLAST hits were
concatenated if they were nonoverlapping and less than
4,000 nt apart. The coverage was determined as the percent-
age of aligned codons to the full protein length, and only
matches with a bit score >30 and a coverage >10% an
intergenic match was inferred.
Expression Analysis
Expressed sequence tags (ESTs) were mapped to the scaffolds
using GMAP (Wu and Watanabe 2005) with default settings.
Mapped ESTs were then intersected with annotated gene
models using BEDtools (Quinlan and Hall 2010), and expres-
sion support was inferred in case an EST overlaps with a gene
model (i.e., no distinction is made between fully and partially
supported gene models).
RNA-seq data for Harpegnathos saltator and Camponotus
floridanus were downloaded from NCBI GEO using accession
number GSE22680 (Bonasio et al. 2010). Raw sequence reads
were mapped using Bowtie + Tophat (Langmead et al. 2009)
allowing 1 mismatch and up to 50 alignments per read (“-v 1
-k 50 ––best”) and default parameter values otherwise.
Expression levels for SSOGs were quantified with these
maps using Cufflinks (Trapnell et al. 2010), correcting for frag-
ment bias (“––frag-bias-correct”) and uncertain align-
ment location (“––multi-read-correct”) and using
default parameter values otherwise.
Real-time quantitative polymerase chain reaction (RT-qPCR)
was used to test functional gene status of a different-strand
CDS-overlapping gene pair involving an SSOG by employing
QuantiTect SYBR Green (Qiagen) one-step chemistry. As tem-
plate, 20 ng of DNase I treated total RNA derived from a pool
of Pogonomyrmex barbatus specimens representing queens
and workers of several developmental stages was used.
Primers were designed to span partially nonoverlapping frag-
ments of antisense-encoded genes to prevent amplification of
transcripts derived from the sense strand. To assess target
gene expression levels, cycle threshold (Ct) values were com-
pared with b-actin (PB20873, forward primer 50-TCAAGGTGT
CATGGTCGGTA-30, reverse primer 50-CCATGCTCGATCGGAT
ATTT-30) serving as reference gene, and with negative con-
trols excluding reverse transcriptase to correct for DNA
contamination.
Identification of Protein Domains
Protein domains were annotated in predicted peptides using
the Pfam-A v25.0 database (Punta et al. 2011). Unless other-
wise denoted, only domain annotations above the
domain-specific gathering threshold provided by Pfam were
considered.
Results
Abundance of SSOGs Is Time Dependent
The primary basis of our results is the robust and accurate
determination of SSOGs across 28 insect and two arthropod
outgroup species (supplementary fig. S1, Supplementary
Material online). We first applied a standard method that
identifies an SSOG as a gene encoding a protein that lacks
homology to any predicted peptide from other arthropod ge-
nomes (table 1, SSOGs Standard). We applied three additional
filters to improve these preliminary estimates and exclude po-
tentially false-positive SSOGs. First, we discarded proteins that
matched potentially missing gene models in Hymenoptera.
Second, we discarded proteins that matched a homolog
when including low complexity protein regions. Third, we dis-
carded proteins that matched noninvertebrate proteins, as-
suming that proteins missing in arthropods but present in
other taxonomic divisions likely reflect contamination or selec-
tive retention and extinction between lineages (but see later
for discussion of HGT as an evolutionary origin of SSOGs).
These three filtering steps consistently lowered the estimates
of SSOGs in all tested genomes (table 1, SSOGs Refined vs.
SSOGs Standard) and had the largest impact on SSOG esti-
mates in the ant genomes. The massive reduction of orphan
genes in ants after the three filtering steps is in large part due
to the fact that no homology information from other ants was
originally used in the annotation of the seven ant genomes,
with the exception of C. floridanus and H. saltator (Bonasio
et al. 2010). Our estimates of SSOG counts in ant genomes are
significantly lower than those originally reported by the indi-
vidual genome papers (Bonasio et al. 2010; Nygaard et al.
2011; Smith CD, et al. 2011; Smith CR, et al. 2011; Suen
et al. 2011; Wurm et al. 2011). This decrease in orphan
genes stems not only from the addition of missing gene
models based on homology and from a more conservative
definition of orphan genes in this study (BLAST E> 10�3 in
a database of 520,428 proteins) but also from an increased
taxon sampling and revisions in the official genome annota-
tion. SSOG numbers changed from 9,361 to 1,970 in Atta
cephalotes (Suen et al. 2011), from 5,183 to 2,644 in
Acromyrmex echinatior (Nygaard et al. 2011), from 2,982 to
885 in Solenopsis invicta (Wurm et al. 2011), and from 7,184
to 1,349 in Linepithema humile (Smith CD, et al. 2011).
Notably, these four studies used only a handful of reference
species and included only two other hymenopteran species,
Api. mellifera and N. vitripennis, to determine the number of
Orphan Gene Emergence in Insect Genomes GBE
Genome Biol. Evol. 5(2):439–455. doi:10.1093/gbe/evt009 Advance Access publication January 24, 2013 443
Dow
nloaded from https://academ
ic.oup.com/gbe/article/5/2/439/560219 by guest on 13 April 2022

putative orphan genes. Thus, accurate gene annotation ben-
efits significantly from comprehensive comparison of multiple
closely related genomes, but at the same time there still re-
mains a significant percentage of SSOGs in each ant species.
Note that all subsequent analyses are based on the SSOG
Refined data set.
Averaged over all included insect and arthropod outgroup
species, approximately 13% of all genes lack a homologous
protein in any other species; this estimate falls within the
expected range of 10–30% for SSOGs in other studies
(Wilson and Holldobler 2005; Wilson et al. 2005, 2007;
Khalturin et al. 2009; Tautz and Domazet-Loso 2011).
SSOGs are not distributed uniformly across the investigated
species. Species that are separated by greater phylogenetic
distances from their nearest neighbor appear to have more
SSOGs compared with species from well-sampled clades
(table 1). Orphan genes are defined based on the absence
of detectable homology in other species. Therefore, phyloge-
netic context, that is, the number of species and distance to
other species, is a critical parameter in determining orphan
genes (Khalturin et al. 2009; Tautz and Domazet-Loso
2011). We examined the relationship between SSOG abun-
dance and distance to the MRCA and found that, in general,
this relationship can be well approximated with a linear model.
We first built a linear model using SSOG counts observed in all
insects relative to their estimated divergence time to MRCA
excluding ants and Api. mellifera. This model explained a sig-
nificant proportion of the observed variance ([formula:
y¼ 8.464x + 541.709] R2¼ 0.85; P¼ 6.9� 10�7; fig. 1). We
excluded ants in this analysis because we wanted to test
whether SSOG counts observed in these recently sequenced
genomes fall within the expected range based on previously
sequenced insect genomes. We also excluded Api. mellifera
because its gene annotations are severely biased toward
genes with homology (Weinstock et al. 2006) and may thus
be artificially depleted for orphan genes.
Based on the linear model, we expected to find a minimum
of 540 SSOGs for any insect species in our data set, plus an
additional 85 SSOGs per every 10 Myr elapsed since the
MRCA. Thus, even genomes of recently split species should
have accumulated several hundred SSOGs; this prediction is
consistent with the observed SSOG counts of closely related
Drosophila species (table 1). We then tested whether SSOG
counts observed in ants fall within the expected range of this
distribution. Most ant genomes contain the expected number
of orphan genes given their phylogenetic age. However, the
two leaf-cutter ants Att. cephalotes and Acr. echinatior (tribe
Attini) clearly fall outside of this distribution and have 1,970
and 2,644 SSOGs, respectively, despite very recent common
ancestry (�10 Ma). In fact, the two leaf-cutter ants exhibit the
greatest number of SSOGs among all hymenopteran and dip-
teran genomes sequenced thus far.
Furthermore, we could show that the trends mentioned
earlier do not only apply to SSOGs but are also valid for
TSOGs. TSOGs not only include SSOGs but also comprise
genes that have homologs only within the considered taxo-
nomic group. Thus, TSOGs are more loosely defined as they
additionally comprise genes that have emerged at internal
phylogenetic branches. Comparison of the abundance and
emergence rate of TSOGs for various taxonomic groups of
insects (fig. 2) confirm the trends reported above for SSOGs,
supporting 1) a rapid emergence of new genes in Attini (com-
pared to D. melanogaster group with a similar age), and 2)
an increased rate of orphan gene gain in Hymenoptera
compared with Diptera. Thus, compared with other insects,
Hymenoptera in general and leaf-cutter ants in particular
appear to exhibit elevated rates of orphan gene gains.
Origin of Orphan Genes
We utilized two approaches to understand the evolutionary
processes underlying the origin of orphan genes. First, we
identified the physical location of SSOGs in the ant genomes
and asked whether they occur in clusters indicative of geno-
mic hotspots for the emergence of SSOGs. Local differences in
mutation rates have been documented before, for example,
as an increase of nucleotide substitutions surrounding inser-
tions and deletions in eukaryotic genomes (Tian et al. 2008).
Orphan gene clusters could therefore exist as a consequence
of hotspots of DNA gain and loss which have been reported
for primates (Perry 2006; Mefford and Eichler 2009).
Across the seven ant genomes, we determined SSOG clus-
ters based on gene adjacency. We determined that 24–32%
of all SSOGs are located in clusters, depending on whether
interruption of direct neighbors was allowed (table 1, see
confidence interval
prediction interval
ants
other insects
No
)(
Agam
Aech
Acep
FIG. 1.—Abundance of SSOGs and their dependence on the distance
to the MRCA (table 1). SSOGs per species were plotted against the dis-
tance to the MRCA node in the phylogenetic tree. A linear regression (solid
black line) was constructed to fit the observed SSOG counts from 12
Drosophilidae, 3 Culicidae, Bombyx, Tribolium, and Nasonia (circles,
R2¼ 0.85). The confidence interval and the prediction interval of the
linear model are shown in dark and light gray, respectively. The ant
SSOG data points were added after fitting the linear model and are
shown as triangles.
Wissler et al. GBE
444 Genome Biol. Evol. 5(2):439–455. doi:10.1093/gbe/evt009 Advance Access publication January 24, 2013
Dow
nloaded from https://academ
ic.oup.com/gbe/article/5/2/439/560219 by guest on 13 April 2022

Materials and Methods). The median cluster size is two genes,
the biggest perfect cluster contains eight SSOGs, and only
eleven clusters (<1%) across all seven species contain more
than five SSOGs without interruption. In addition, hardly any
SSOGs that are located in clusters (�0.5%) appear to be
tandem duplicates of each other, that is, the clusters of
SSOGs typically consist of unrelated genes. These data suggest
that most ant-specific SSOGs are uniformly distributed
throughout the genomes. Consequently, the frequency of
SSOG clusters is influenced by the genome-wide abundance
of SSOGs: S. invicta has the lowest number of SSOGs (885)
and SSOG clusters (18–24, comprising 4–6% of all SSOGs); at
the other extreme, Acr. echinatior has the highest SSOG count
(2,644) and SSOG clusters (395–430, comprising 38–48% of
all SSOGs; table 1). Future investigations are necessary to clar-
ify whether SSOG clustering contributes to the high frequency
of SSOGs observed in the two leaf-cutter species and whether
any of 11 SSOG clusters with >5 SSOGs in fact represent
genomic locations in which SSOGs emerge more frequently,
that is, represent a gene gain/loss hotspot.
Second, to address the phylogenetic history of SSOGs in
ants, we determined the relative frequency of the different
evolutionary origins of ant SSOGs which are detectable by
sequence similarity. We neglect some of the mechanisms pre-
viously shown to facilitate gene innovation, such as exoniza-
tion, exon shuffling, and gene fusion and fission (Long et al.
2003; Zhou et al. 2008; Kaessmann 2010; Schmitz and
Brosius 2011; Ranz and Parsch 2012) because such mecha-
nisms would retain short homologous regions among genes
of other species and are thus by definition not part of our
SSOG data set. Instead, we focused on six scenarios (discussed
later) that leave genomic signatures inside or in the immediate
proximity to SSOGs, which can be detected using a compar-
ative approach and bioinformatics tools.
Gene Duplication
All metazoans sequenced so far carry a substantial number of
genes that exist in multiple copies, and many more have likely
emerged by gene duplication but subsequently diverged
beyond recognition (Zhang 2003). Gene duplication is as-
sumed to occur frequently (Lynch and Conery 2000), although
most of the time, one copy eventually becomes pseudogen-
ized. Alternatively, it is possible that the second copy is re-
tained in the genome, either because higher gene dosage or
FIG. 2.—Contrasting the abundance and rate of emergence of orphan genes between partially overlapping taxonomic groups of Hymenoptera and
Diptera. Each tested group is highlighted by a rectangle and the associated group data, including number of species, distance to the MRCA, total orphan
gene count, and rate of orphan gene emergence, are shown on the right side. Branch lengths in the phylogenetic tree are approximate values and were
obtained from the timetree.org database (Hedges et al. 2006).
Orphan Gene Emergence in Insect Genomes GBE
Genome Biol. Evol. 5(2):439–455. doi:10.1093/gbe/evt009 Advance Access publication January 24, 2013 445
Dow
nloaded from https://academ
ic.oup.com/gbe/article/5/2/439/560219 by guest on 13 April 2022

redundancy is beneficial, or because sub- or neofunctionaliza-
tion has occurred (Zhang 2003). Therefore, one possible sce-
nario to explain the emergence of SSOGs is gene duplication
and subsequent divergence of one copy beyond the threshold
of detectable similarity (Domazet-Loso and Tautz 2003).
We identified 1,195 SSOGs (9.9%) in the seven ant ge-
nomes with detectable sequence similarity to a paralog, that
is, another gene in the same species and where this paralog
has in turn detectable homologs in other species (table 2).
Therefore, gene duplication and divergence appear to
happen less frequently in ants than has been reported for
primates and plants (>20%, Toll-Riera et al. 2009;
Donoghue et al. 2011).
It is possible that among the duplicated gene pairs, the
associated SSOG is a spurious open-reading frame (ORF).
SSOG function may have been lost, and the sequence diver-
gence may reflect the degeneration of its CDS. To test for this
scenario, we performed RT-qPCR on one pair of genes, which
includes an SSOG (PB21732) and the corresponding paralog,
which has orthologs in other species (PB13276). For both of
these genes, low expression could be detected, indicating that
at least in this gene pair, both gene copies are expressed and
possibly functional. Of course, high-throughput expression
data are necessary to validate the activity of duplicate gene
pairs involving SSOGs more comprehensively.
Nondeleterious Frame-Shift Mutations
A nondeleterious frame shift mutation in the N-terminal
region of the CDS has the power to produce an almost entirely
different protein sequence from a slightly altered CDS (Hahn
and Lee 2005; Raes and Van De Peer 2005; Okamura et al.
2006) without affecting the regulatory context of the gene.
Therefore, genes which have undergone a nondeleterious
frame shift mutation are likely expressed and can immediately
contribute to an organism’s phenotype.
Across all seven ant genomes, we identified 268 SSOGs
(2.2%) that are candidates for frame shift mutations. These
candidate SSOGs match CDS translations in other insect spe-
cies in a different frame on the same strand of DNA. The
contribution of frame shifts to orphan gene emergence has
not been investigated in primates (Toll-Riera et al. 2009) but
has been predicted to contribute even more frequently to the
origin of A. thaliana SSOGs (7%, Donoghue et al. 2011). Thus,
the creation of new proteins by frame shifts in the CDS may
represent an important, but often neglected, mechanism for
the emergence of new proteins. Note that we also tested for
another mechanism, which has the potential of producing
different-frame proteins: Alternative translation start sites in
a transcript allow for the co-existence of multiple alternative
reading frames in the same transcript (Kochetov 2008). We
could, however, find only 12 cases (0.1%) in which an SSOG
protein sequence originates from translation of an alternative
reading frame in a non-SSOG, suggesting that alternative
reading frames virtually never contribute to SSOG emergence
in ants.
Overlap with TEs
TEs (or mobile elements) represent “jumping DNA fragments”
that are typically 1–10 kb long and can change the genome in
various ways by moving or inserting copies of themselves into
new genomic locations (Gonzalez and Petrov 2009). Although
it is generally assumed that random insertion of mobile ele-
ments is detrimental to the organism, accumulating evidence
suggests that TEs can also contribute to adaptation (Kazazian
2004; Gogvadze and Buzdin 2009; Gonzalez and Petrov
2009). In the majority of documented cases, such adaptations
are achieved by TEs modulating gene expression (Fablet et al.
2007; Gonzalez and Petrov 2009), but TEs have also been
shown to disrupt CDSs and facilitate the generation of new
genes (Lockton and Gaut 2009; Toll-Riera et al. 2009).
Table 2
Inferred Origins of Orphan Genes in Different Data Sets and Investigated in Different Studies
This Study This Study Toll-Riera et al. (2009) Donoghue et al. (2011)
Study
Data set Formicidae SSOGs Attini SSOGs Primate shared TSOGs Arabidopsis thaliana SSOGs
Genome size (Mb) 250–450 300–335 1,600–2,870 125
Genomic TE content (%) 8–30 25–28 �50 �10
Origins (%)
Gene duplication 9.9 6.4 24 22
Overlap with TE 12.4 10.6 53 10
Frame shift 2.2 2.2 NA 7
Overlapping genes 11.1 13.3 NA 1
Intergenic match 43.5 61.2 6% de novo 25
HGT 0.1 0.0 NA NA
Unexplained 20.8 6.3 17 35
NOTE.—The Formicidae and Attini data sets consist of 12,054 and 4,614 SSOGss, respectively. Genome stats were obtained from the Arabidopsis Genome Initiative (2000),Lander et al. (2001), Bonasio et al. (2010), Nygaard et al. (2011), Smith CD, et al. (2011); Smith CR, et al. (2011), and Suen et al. (2011).
Wissler et al. GBE
446 Genome Biol. Evol. 5(2):439–455. doi:10.1093/gbe/evt009 Advance Access publication January 24, 2013
Dow
nloaded from https://academ
ic.oup.com/gbe/article/5/2/439/560219 by guest on 13 April 2022

Across the seven ant genomes, we determined the number
of SSOGs whose CDSs overlap with TEs from either of the
following four categories: short interspersed elements (SINEs),
long interspersed elements (LINEs), long terminal repeats, and
DNA TEs. Based on these overlaps, 1,496 ant SSOGs (12.4%)
may have formed by domesticating TEs into their CDSs. It
should be noted that overlap between a TE and the CDS of
an orphan gene does not necessarily qualify them as exapta-
tions as previous studies have sometimes done (Toll-Riera et al.
2009). Employing this previously used definition, the fre-
quency of predicted TE exaptation during orphan gene emer-
gence in ants is comparable to A. thaliana, where TEs have
been predicted to affect approximately 10% of the SSOGs
(Donoghue et al. 2011). In contrast, Toll-Riera et al. (2009)
reported that TEs overlap with more than half of the orphan
genes in primates, suggesting that TEs might be more fre-
quently involved in the creation of new genes in primates.
An increased rate of TE exaptation may be related to a
much higher abundance of TEs in primates than in the inves-
tigated plant and insect species (table 2). In particular, Alu
elements are a major type of SINEs in primates, and these
elements often contain motifs that can readily turn into func-
tional splice sites allowing exonization (Gal-Mark et al. 2008).
These conditions may lead to the observed higher frequency
of new genes whose generation is driven by mobile elements
in primates, compared with other taxa.
Horizontal Gene Transfer
In recent years, evidence has accumulated that HGT is not
limited to exchange between bacteria but also occurs in eu-
karyotic genome evolution (Gladyshev et al. 2008; Dunning
Hotopp 2011; Sommer and Streit 2011; Christin et al. 2012).
In numerous insect and arthropod genomes, putative HGTs
have been found (Dunning Hotopp et al. 2007; Nikoh et al.
2008; Klasson et al. 2009; Moran and Jarvik 2010; Werren
et al. 2010; Grbic et al. 2011; Zhu et al. 2011; Acuna et al.
2012). HGT has not been quantified by the other orphan gene
studies in primates (Toll-Riera et al. 2009) and Arabidopsis
(Donoghue et al. 2011). However, HGT has been suggested
as a principal source for orphan genes (Tautz and Domazet-
Loso 2011) and may well have occurred in ant lineages, in
particular because some of the sequenced ant species have
been living in very close symbioses with other organisms in-
cluding bacteria (e.g., gut endosymbionts—Blochmannia spp.
in C. floridanus) and fungi (both leaf-cutter ants) for millions of
years (Gil et al. 2003). In addition, the general insect endo-
symbiontic bacteria of the genus Wolbachia have been found
in many ant species (Russell 2011) including Attine ants (Van
Borm et al. 2001) and S. invicta (Bouwma et al. 2006).
However, this close association of some ant species with bac-
teria prevented sampling of pure ant genomic DNA and made
subsequent in silico filtering of bacterial sequences necessary
(Bonasio et al. 2010; Nygaard et al. 2011), which interfere
with the detection of HGT.
We screened all SSOGs against the SwissProt database
using BLAST not only to identify possible candidates for HGT
but also to exclude potentially spurious SSOGs, which may
have arisen by contamination during genome sequencing
(table 1; SSOG Standard vs. SSOG Refined). Eight ant genes
were identified in filtering steps between the Standard and
Refined sets of SSOGs (see Materials and Methods) as poten-
tial contaminants or products of HGT (supplementary table S2,
Supplementary Material online). In addition, we used a phy-
logenomic domain-based approach to determine protein do-
mains in the refined set of SSOGs that have not been
identified in the other arthropod genomes but could have
been transferred from other organisms (see Materials and
Methods). This domain-based approach using HMMer com-
plements BLAST-based approaches; it can achieve a higher
sensitivity and identify short functional meaningful protein
components, even if the rest of the protein has diverged or
has been lost. Our domain-based approach identified six ad-
ditional ant genes containing nonarthropod domains, sug-
gesting that the seven ants have acquired at most 14
(0.1%) ant SSOGs through HGT (supplementary table S2,
Supplementary Material online). It is, however, possible that
the number of predicted HGTs across the seven ant species is
an underestimate considering thorough elimination steps of
bacterial sequences before and after genome assembly.
Overlapping Genes
Eukaryotic genomes harbor an abundance of overlapping
genes (Sanna et al. 2008; Solda et al. 2008). In most cases,
overlapping genes involve a noncoding gene feature (intron or
untranslated region) from one gene and part of the CDS from
another gene, whereas only a small fraction of overlapping
gene pairs involve two CDSs (“CDS-CDS overlap”). Pairs of
genes with CDS overlaps can be located on the same DNA
strand (“same-strand”) or on opposite strands (“different-
strand”), with different-strand CDS-overlaps being much
more abundant (Sanna et al. 2008). In general, it is thought
that CDS–CDS overlap is selected against due to additional
constraint on sequence evolution because multiple proteins
have to be optimized simultaneously (“structural constraint,”Keese et al. [1992]); gene overlap also introduces potential for
transcriptional (Prescott and Proudfoot 2002; Osato et al.
2007) or translational (Yu et al. 2007) interference (“regula-
tory constraint”) between overlapping genes.
We observed a high rate of overlapping gene models
(different-strand CDS overlaps) in some of the ant genomes
irrespective of their orphan gene status (supplementary table
S3, Supplementary Material online). Only 21% of these over-
lapping genes involve SSOGs, suggesting that different-strand
CDS overlaps are a general phenomenon of gene organization
in ant genomes. Nonetheless, 1,341 (11.1%) ant-specific
SSOGs are involved in different-strand CDS overlaps.
Similarly to frame shifts, these data implicate the reuse of
Orphan Gene Emergence in Insect Genomes GBE
Genome Biol. Evol. 5(2):439–455. doi:10.1093/gbe/evt009 Advance Access publication January 24, 2013 447
Dow
nloaded from https://academ
ic.oup.com/gbe/article/5/2/439/560219 by guest on 13 April 2022

existing ORFs in other frames, and our results support the
frequent emergence of ant SSOGs in the anti-sense strand
of existing CDS. Gene overlaps were not considered as a
source of orphan genes in primates (Toll-Riera et al. 2009),
but affect approximately 1% of SSOGs in Arabidopsis
(table 2). Although gene overlaps are thus rarer in
Arabidopsis than in ants, SSOGs were much more frequently
involved in gene overlaps in Arabidopsis than non-SSOGs
(Donoghue et al. 2011). Thus, existing ORFs may become
functionalized in another frame, whereas the original protein
function is still conserved, in particular in some ant species.
The high frequency of gene overlaps in ants compared with
Arabidopsis and other insects and the possibility of technical
artifacts calls for further in depth studies. In fact, the frequency
of CDS–CDS overlaps may be influenced by difficulties in the
accurate prediction of gene and exon–intron structure in some
of the ant genomes. Indeed, we found a high incidence of
CDS–CDS overlaps in Att. cephalotes, L. humile, and P. barba-
tus, whose genomes were all annotated using MAKER
(Cantarel et al. 2008). It is possible that overlaps in these ge-
nomes are inflated due to technical artifacts where noncoding
regions were mistaken for a protein-coding region, suggesting
that some gene models in these draft genomes require
refinement.
By contrast, the genomes of Acr. echinatior, C. floridanus,
and H. saltator were all annotated using the pipeline of BGI
(http://www.genomics.cn/), and both C. floridanus and
H. saltator genomes were sequenced and computationally
processed in the same lab and with exactly the same methods
(Bonasio et al. 2010). Hence, it is very unlikely that technical
artifacts can explain the discrepancy in the number of over-
lapping genes between C. floridanus (which compares well
with all previously sequenced insects) and the two ant species
Acr. echinatior and H. saltator (which have increased frequen-
cies of gene overlaps; supplementary table S3, Supplementary
Material online). Furthermore, the H. saltator genome is larger
than the C. floridanus genome, suggesting that a putative
increase of overlapping genes in H. saltator cannot be ex-
plained by overall increase in gene density. With RT-qPCR,
we specifically validated the expression of PB27018, a gene
with significant different-strand CDS overlap to gene PB23252
in P. barbatus. Additionally, all SSOGs involved in gene over-
laps in C. floridanus and H. saltator have RNA-seq support
(Bonasio et al. 2010). However, partial EST or RNA-seq sup-
port for these genes may be ambiguous because these se-
quence data are typically not strand specific. Hence, such
expression data can only confirm overlapping gene models,
if both overlapping genes have also unique exons.
Signals from Conserved Intergenic Regions in Formicidaeand Hymenoptera
With the five previously presented scenarios, the origin of
4,306 (36%) of all 12,054 ant SSOGs could be explained.
For the remaining 7,748 SSOGs having thus far unknown
origin, we tried to find any traces of their ORF in other hyme-
nopteran genomes. Such ORF traces were detected by
screening the proteins encoded by the remaining SSOGs
against the six-frame translated scaffolds or chromosomes
of all available hymenopteran species which, by excluding
the five previous scenarios of origin, would have to occur in
intergenic regions.
We found significant scaffold matches for 5,239 (43.5%)
SSOGs in at least one other hymenopteran species. Among
the now six scenarios of origin we considered, this approach
identified the largest proportion of SSOGs (table 2).
These SSOGs with intergenic matches could represent genes
that were actually generated by one of the scenarios of ori-
gin tested earlier, but whose signature cannot be unambigu-
ously detected any more. Alternative scenarios comprise
generalized gene loss or pseudogenization in other lineages,
and de novo gene formation from previously noncoding
regions.
We found an abundance of SSOGs for which gene models
with a slightly disrupted and possibly nonfunctional ORF could
be constructed in other species (supplementary fig. S2A,
Supplementary Material online), supporting an abundance
of pseudogenes that are homologous to SSOGs. At the
same time, recent studies have highlighted the unexpectedly
high rate of de novo formation of new genes in non-CDSs in
Drosophila (Zhou et al. 2008) and human (Wu et al. 2011). In
general, the expected genomic signatures of pseudogeniza-
tion of orthologs outside a focal lineage and de novo gener-
ation of genes are similar (supplementary text S6,
Supplementary Material online): Searching tentative SSOGs
against genome sequences of related species should result
in significant hits in noncoding regions, and the number of
hits should decrease as the phylogenetic distance increases
because both pseudogenized genes and noncoding regions
are not constrained by the necessity to retain a fully functional
ORF (Zhang and Gerstein 2004; Donoghue et al. 2011).
Hence, an unequivocal inference of either one scenario re-
quires a well-sampled phylogeny and confirmation with tran-
scription and translation evidence (Guerzoni and McLysaght
2011). In some cases, the two processes of pseudogenization
and de novo gene formation might even be linked, when a
pseudogene acquires a new function (Balakirev and Ayala
2003; Carvunis et al. 2012).
Overall, we expect that most of the SSOGs with intergenic
matches derive from de novo formation or generalized gene
loss, but we cannot estimate the extent of SSOGs, which were
possibly missed in the identification of the previously tested
mechanisms due to sequence divergence. As additional ant
genomes become available, along with full-genome align-
ments among all ant genomes, the origin of SSOGs with
intergenic matches and the issue of gene loss versus de
novo gene formation can be revisited again.
Wissler et al. GBE
448 Genome Biol. Evol. 5(2):439–455. doi:10.1093/gbe/evt009 Advance Access publication January 24, 2013
Dow
nloaded from https://academ
ic.oup.com/gbe/article/5/2/439/560219 by guest on 13 April 2022

Unexplained Origin
With the aforementioned six mechanisms, the evolutionary
origin of 9,545 ant-specific SSOGs (79%) could be explained.
Similar to other studies in primates (17%, Toll-Riera et al.
2009) and Arabidopsis (36.67%, Donoghue et al. 2011), we
could not predict the evolutionary origin for 21% ant SSOGs
(2,509 genes). This suggests a general trend whereby the evo-
lutionary origin of some new genes cannot be reconstructed
after a few million years of divergence. Among the
ant-specific SSOGs with unexplained origin, the majority are
single copy genes (92.1%). Future in-depth studies may want
to first focus on the 197 ant SSOGs that exist in multiple
copies, because SSOGs with multiple retained copies may
have a high chance in having lineage-specific function.
Discussion
Abundance of Orphan Genes among Insect Taxa
The comparative analyses of 28 insect and 2 outgroup arthro-
pod genomes allowed us to identify SSOGs and TSOGs. It
should be noted that our analysis relies on existing gene an-
notations, which tend to be conservative and may leave some
genes, in particular orphan genes that lack homologs in ref-
erence species, undiscovered. With several filtering steps,
however, we tried to maximize the fidelity of orphan gene
identification among the annotated arthropod genes.
Moreover, our Refined orphan gene data set (table 1) consists
only of proteins with no sequence similarity to genes in other
species, including similarity in protein low complexity regions.
As such, the Refined orphan gene data set includes only genes
with truly novel protein sequences. Overall, the presented es-
timates of orphan genes are conservative and may thus un-
derestimate their true abundance.
In general, much of the observed variation in SSOG counts
among the examined insect genomes can be explained by the
evolutionary distance of the sampled species (fig. 1). However,
three insect genomes significantly deviate from the expected
SSOG counts: Genomes of the two leaf-cutter species, Att.
cephalotes and Acr. echinatior, appear to be enriched for
SSOGs, and the genome of the mosquito Anopheles gambiae
appears to be depleted of SSOGs. Even if normalized for dif-
ferences in evolutionary distances, we found that hymenop-
teran genomes contain more SSOGs and TSOGs in
comparison with dipterans.
As another general trend, our comparison uncovered an
accelerated accumulation of SSOGs between younger species
pairs or clades in both Hymenoptera and Diptera (fig. 1).
Genomes of sister species that split a few million years ago
typically contain more than 500 SSOGs, whereas the
long-term gain of SSOGs is only approximately 85 genes per
10 Myr (fig. 1). Assuming that at the time of speciation, there
are no or very few orphan genes present between the sepa-
rating populations, the presence of several hundred orphan
genes in closely related sister species can only be explained by
a strongly accelerated rate of orphan gene emergence imme-
diately after speciation. These results support findings from
broad phylogenetic analyses of orphan gene emergence in
which a high rate of new gene formation is consistently in-
ferred in the most recent evolutionary history, in particular for
mouse, Drosophila, and Arabidopsis (Tautz and Domazet-Loso
2011). Overall, these findings suggest that new genes may be
formed frequently over a very short evolutionary time, but
despite rapid sequence evolution and the potential that
some of these genes are adaptive, a large number of newly
generated genes are likely to be purged over a longer evolu-
tionary time frame. Thus, the imbalance between a rapid gen-
eration of orphan genes early in the history of a taxon and
lower rate of orphan gene retention over longer phylogenetic
distances probably causes the observed lower average rate of
net gains of orphan genes in older clades or in longer phylo-
genetic branches.
In Formicidae, we found a 3-fold difference between the
lowest and highest numbers of SSOGs among the seven ant
genomes (table 1), indicating that the Formicidae gene con-
tent shaped by birth and death of orphan genes is highly var-
iable. Across the ant genomes, no major genomic hot spots,
characterized by a high density of neighboring SSOGs, could
be identified. Overall, Formicidae SSOGs appear to be uni-
formly distributed throughout the genome, and if at all,
they occur in small clusters of two to three neighboring
SSOGs. We note that a uniform distribution of orphan
genes across chromosomes has already been reported in
Arabidopsis (Donoghue et al. 2011). Similar to other organ-
isms (e.g., Domazet-Loso and Tautz 2003; Donoghue et al.
2011), orphan genes identified among ants are significantly
shorter, have longer introns, and a biased GC content com-
pared with nonorphan genes (supplementary text S3,
Supplementary Material online).
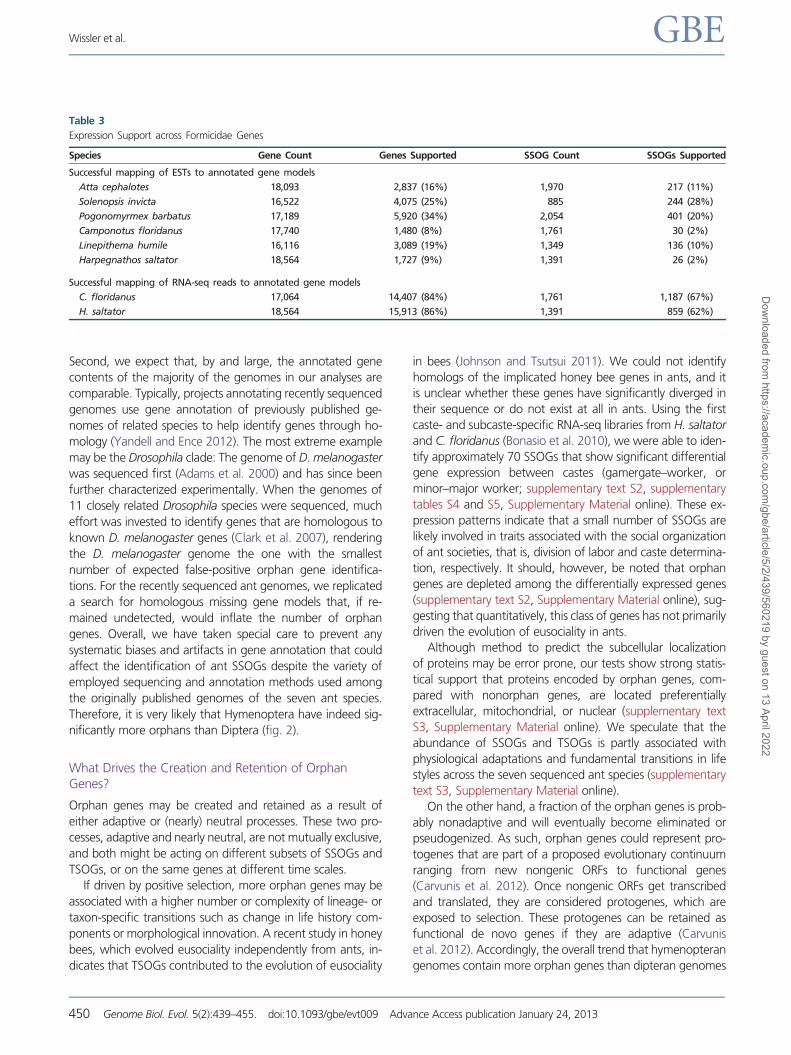
Previous studies and this one (table 3) have found incom-
plete expression support for SSOGs using ESTs or RNA-seq
short reads mapped to the predicted gene models. This may
be attributed to generally lower and possibly more
tissue-specific expression of orphan genes in comparison
with phylogenetically conserved genes (Levine et al. 2006;
Donoghue et al. 2011; Wu et al. 2011); it is also possible
that some orphan genes may instead represent spurious
ORFs that are not expressed. We argue that the observed
trend of a high prevalence of ant SSOG is robust for two
reasons:
First, the high SSOG counts in ants are consistent with a high
number of SSOGs in the independent lineage of N. vitripennis
(2,191 SSOGs; table 1). The current data therefore suggest
that a large fraction of the gene content in Hymenoptera is
taxon specific. The only exception seems to be Api. mellifera
which, based on the current annotation, likely has undergone
a significant genome contraction in terms of annotated genes.
Orphan Gene Emergence in Insect Genomes GBE
Genome Biol. Evol. 5(2):439–455. doi:10.1093/gbe/evt009 Advance Access publication January 24, 2013 449
Dow
nloaded from https://academ
ic.oup.com/gbe/article/5/2/439/560219 by guest on 13 April 2022
Second, we expect that, by and large, the annotated gene
contents of the majority of the genomes in our analyses are
comparable. Typically, projects annotating recently sequenced
genomes use gene annotation of previously published ge-
nomes of related species to help identify genes through ho-
mology (Yandell and Ence 2012). The most extreme example
may be the Drosophila clade: The genome of D. melanogaster
was sequenced first (Adams et al. 2000) and has since been
further characterized experimentally. When the genomes of
11 closely related Drosophila species were sequenced, much
effort was invested to identify genes that are homologous to
known D. melanogaster genes (Clark et al. 2007), rendering
the D. melanogaster genome the one with the smallest
number of expected false-positive orphan gene identifica-
tions. For the recently sequenced ant genomes, we replicated
a search for homologous missing gene models that, if re-
mained undetected, would inflate the number of orphan
genes. Overall, we have taken special care to prevent any
systematic biases and artifacts in gene annotation that could
affect the identification of ant SSOGs despite the variety of
employed sequencing and annotation methods used among
the originally published genomes of the seven ant species.
Therefore, it is very likely that Hymenoptera have indeed sig-
nificantly more orphans than Diptera (fig. 2).
What Drives the Creation and Retention of OrphanGenes?
Orphan genes may be created and retained as a result of
either adaptive or (nearly) neutral processes. These two pro-
cesses, adaptive and nearly neutral, are not mutually exclusive,
and both might be acting on different subsets of SSOGs and
TSOGs, or on the same genes at different time scales.
If driven by positive selection, more orphan genes may be
associated with a higher number or complexity of lineage- or
taxon-specific transitions such as change in life history com-
ponents or morphological innovation. A recent study in honey
bees, which evolved eusociality independently from ants, in-
dicates that TSOGs contributed to the evolution of eusociality
in bees (Johnson and Tsutsui 2011). We could not identify
homologs of the implicated honey bee genes in ants, and it
is unclear whether these genes have significantly diverged in
their sequence or do not exist at all in ants. Using the first
caste- and subcaste-specific RNA-seq libraries from H. saltator
and C. floridanus (Bonasio et al. 2010), we were able to iden-
tify approximately 70 SSOGs that show significant differential
gene expression between castes (gamergate–worker, or
minor–major worker; supplementary text S2, supplementary
tables S4 and S5, Supplementary Material online). These ex-
pression patterns indicate that a small number of SSOGs are
likely involved in traits associated with the social organization
of ant societies, that is, division of labor and caste determina-
tion, respectively. It should, however, be noted that orphan
genes are depleted among the differentially expressed genes
(supplementary text S2, Supplementary Material online), sug-
gesting that quantitatively, this class of genes has not primarily
driven the evolution of eusociality in ants.
Although method to predict the subcellular localization
of proteins may be error prone, our tests show strong statis-
tical support that proteins encoded by orphan genes, com-
pared with nonorphan genes, are located preferentially
extracellular, mitochondrial, or nuclear (supplementary text
S3, Supplementary Material online). We speculate that the
abundance of SSOGs and TSOGs is partly associated with
physiological adaptations and fundamental transitions in life
styles across the seven sequenced ant species (supplementary
text S3, Supplementary Material online).
On the other hand, a fraction of the orphan genes is prob-
ably nonadaptive and will eventually become eliminated or
pseudogenized. As such, orphan genes could represent pro-
togenes that are part of a proposed evolutionary continuum
ranging from new nongenic ORFs to functional genes
(Carvunis et al. 2012). Once nongenic ORFs get transcribed
and translated, they are considered protogenes, which are
exposed to selection. These protogenes can be retained as
functional de novo genes if they are adaptive (Carvunis
et al. 2012). Accordingly, the overall trend that hymenopteran
genomes contain more orphan genes than dipteran genomes
Table 3
Expression Support across Formicidae Genes
Species Gene Count Genes Supported SSOG Count SSOGs Supported
Successful mapping of ESTs to annotated gene models
Atta cephalotes 18,093 2,837 (16%) 1,970 217 (11%)
Solenopsis invicta 16,522 4,075 (25%) 885 244 (28%)
Pogonomyrmex barbatus 17,189 5,920 (34%) 2,054 401 (20%)
Camponotus floridanus 17,740 1,480 (8%) 1,761 30 (2%)
Linepithema humile 16,116 3,089 (19%) 1,349 136 (10%)
Harpegnathos saltator 18,564 1,727 (9%) 1,391 26 (2%)
Successful mapping of RNA-seq reads to annotated gene models
C. floridanus 17,064 14,407 (84%) 1,761 1,187 (67%)
H. saltator 18,564 15,913 (86%) 1,391 859 (62%)
Wissler et al. GBE
450 Genome Biol. Evol. 5(2):439–455. doi:10.1093/gbe/evt009 Advance Access publication January 24, 2013
Dow
nloaded from https://academ
ic.oup.com/gbe/article/5/2/439/560219 by guest on 13 April 2022

could be a consequence of natural selection being more per-
missive in retaining superfluous protogenes in Hymenoptera
than in Diptera. Clearly, natural selection will influence reten-
tion as has been shown for gene duplicate retention in yeast
populations (Ames et al. 2010). In eusocial insects, it is as-
sumed that due to their haplo-diploid sex determination
mechanism and a small number of reproducing individuals
per colony, the effective population size is reduced in compar-
ison to solitary insects with a comparable population size
(Crozier 1979; Schmitz and Moritz 1998; Bromham and
Leys 2005). Consequently, selection should be less efficient
in removing nonadaptive or slightly deleterious genes. At
the same time, genetic drift has a higher impact on genome
evolution in eusocial Hymenopterans compared with solitary
Dipterans (Wright and Andolfatto 2008). However, even
(nearly) neutral processes could eventually give rise to func-
tionally relevant orphan genes for lineage-specific adaptation,
assuming that longer retention times increase the chance of
acquiring rare beneficial mutations. Accordingly, the presence
of an increased number of orphan genes in a genome would
suggest a higher adaptive potential of this species.
Specifics of Orphan Gene Emergence in Ants
We have investigated in detail through which mechanisms ant
orphan genes were formed. Our results indicate that contrary
to the long-standing assumption that new genes originate
primarily from gene duplications (Ohno 1970; Long et al.
2003; Zhou et al. 2008), the majority of orphan genes in
ants resulted from either de novo formation or generalized
gene loss (discussed later). Thus, observed patterns of orphan
gene emergence in ants rather support a dynamic model of
frequent gene birth and death, which has very recently been
proposed (Carvunis et al. 2012). Our study represents only the
third study we are aware of that systematically investigates the
evolutionary origin of orphan genes in eukaryotes. Toll-Riera
et al. (2009) studied primate orphan genes, which are con-
served between three species over 25 Myr (human, chimp,
macaque), but which lack homology in other mammalian spe-
cies that split �41 Ma (Kumar and Hedges 1998). Donoghue
et al. (2011) investigated A. thaliana-specific orphan genes
and used A. lyrata and non-Brassicaceae species as references
with evolutionary distances of 10 and �72 Myr (Wikstrom
et al. 2001; Hu et al. 2011). The frequency spectrum of
various mechanisms for orphan gene emergence in ant,
Arabidopsis, and primate orphan genes are summarized in
table 2. Clearly, cross-study comparisons are hampered by
various factors, including different definitions of orphan
genes, different characteristic of the data sets including phy-
logenetic distances between focal and outgroup species, and
differences in the considered mechanisms and scenarios.
However, our analysis is relatively similar to Donoghue et al.
(2011) as we address a comparable set of scenarios with
similar methods.
Scenarios of Orphan Gene Emergence Inferred fromSimilarity to Other Genes, Proteins, or TEs
Consistent throughout all three studies, gene duplication fol-
lowed by sequence divergence is a dominant mechanism
bringing about orphan genes. Among ants, primates, and
Arabidopsis, the lowest rate of orphan gene formation by
gene duplication was found in ants (table 2). Mobile elements
seem to contribute equally to orphan gene formation in ants
and in Arabidopsis, but are significantly more frequently found
in primates. Overall, all three studies confirm previous theo-
retical expectations and recent empirical data suggesting that
the two mechanisms, gene duplication and exaptation from
TEs, play an important role in the evolution of genetic inno-
vations (Ohno 1970; Lynch and Conery 2000; Kazazian 2004;
Zhou et al. 2008).
New protein sequences can also emerge by exploiting dif-
ferent frames of existing ORFs. In ants and Arabidopsis, a sub-
stantial number of SSOG proteins are predicted to be formed
from either nondeleterious frame shifts in an ORF or by utiliz-
ing parts of the antisense strand of an ORF, thereby generat-
ing overlapping genes (table 2). Although both these
mechanisms can contribute to the formation of new genes
across different taxa, further studies are necessary to validate
the high frequency of orphan gene emergence via
different-frame functionalization of existing CDS in ants.
Mechanisms for generating new proteins have not been ad-
dressed in primates (Toll-Riera et al. 2009), possibly due to
terminology: Strictly speaking, using different frames of exist-
ing genes can create orphan proteins, but the new gene itself
may still share significant sequence similarity to the non–
frame-shifted or overlapping homolog in other species.
Therefore, based on sequence similarity, the protein, but not
necessarily the gene, is an orphan.
Scenarios of Orphan Gene Emergence with No Similarityto Other Genes, Proteins, or TEs
A majority of ant SSOGs has at least a partial ORF match in the
DNA sequence of other Hymenoptera (“intergenic match”),
but their emergence could not be explained by the previously
mentioned mechanisms (43.5% in total, or 55% of SSOGs
with explained origin; table 2). Such intergenic matches of
orphan genes may be indicative for either one of two scenar-
ios: First, intergenic matches may represent remnants of
genes, which have been independently lost across all but
one lineage in which it has been selectively retained as a func-
tional gene (“generalized gene loss,” Foret et al. [2010]).
Second, intergenic matches may represent precursor se-
quences of de novo gene generation events (Wu et al.
2011). Both scenarios are feasible, considering that a recent
study in human found that approximately 100 disrupted
protein-coding genes (loss-of-function variants) exist in ge-
nomes within each individual human genome, that is, varia-
tion exists already at the population level (MacArthur et al.
Orphan Gene Emergence in Insect Genomes GBE
Genome Biol. Evol. 5(2):439–455. doi:10.1093/gbe/evt009 Advance Access publication January 24, 2013 451
Dow
nloaded from https://academ
ic.oup.com/gbe/article/5/2/439/560219 by guest on 13 April 2022

2012). It should be noted that this high rate of gene disruption
has been reported to be strongly favored toward seemingly
dispensable genes. Such dispensable genes include less evo-
lutionarily conserved genes, genes that tend to have highly
similar paralogs, and genes that tend to have lower connec-
tivity in gene and protein–protein interactions. Accordingly,
dispensable genes will in the long run likely be removed by
purifying selection (MacArthur et al. 2012). However, over
long evolutionary time, it is possible that pseudogenization
and gene loss occurs rapidly and frequently among genomes
of species that split several million years ago. This suggests that
a substantial amount of pseudogenized genes exists in the ant
genomes and lends at least partial support to the generalized
gene loss scenario.
At the same time, genes being formed de novo across
several lineages with adaptive potential has found much sup-
port in recent studies (Cai et al. 2008; Khalturin et al. 2009;
Kaessmann 2010; Tautz and Domazet-Loso 2011; Wilson and
Masel 2011; Wu et al. 2011), and de novo formation of new
genes may occur even more frequently than gene duplication
(Carvunis et al. 2012). 24% of orphan genes (797 genes) with
intergenic match are single exon genes. This observed simpler
gene structure in humans and ants supports the scenario of de
novo gene birth (Guerzoni and McLysaght 2011; Wu et al.
2011). Ant SSOGs with intergenic matches are the best can-
didates for a confirmation of their de novo formation.
For a number of ant orphan genes, it still remains unclear
whether the orphan gene stems from gene losses and
lineage-specific retention or from the gain of a previously
nonexistent gene, for example, by de novo formation.
Although the myrmicine ant species are currently represented
by four hierarchically related species, the resolution does not
always suffice to unambiguously resolve the issue of gene gain
versus gene loss (supplementary text S6, Supplementary
Material online), and additional close-species taxon sampling
may be necessary to uncover the true genetic origin of such
orphan genes.
Finally, for a significant fraction of ant orphan genes
(20.8%), which we classified as orphan genes with unex-
plained origin, the origin of their genetic material could not
be determined using sequence similarity. The “unexplained”category may include genes that are not necessarily new but
rapidly evolving so that their sequence diverged beyond rec-
ognition. We found that 1:1 orthologs that are restricted to
Formicidae evolve 2–3 times faster than nonrestricted 1:1
orthologs (supplementary text S4, Supplementary Material
online), and that in some cases, such sequence divergence
may be driven by positive selection. If the sequence divergence
is even higher, genes may eventually appear as orphan genes
because their ancestry is no longer identifiable at the sequence
level. This divergence scenario is further supported by the
strong correlation between the number of SSOGs, the phylo-
genetic distance to the next closely related species in the data
set (fig. 1) and the finding that the frequency of detectable
protein domains is negatively correlated with the phylogenetic
conservation of genes (supplementary text S5, Supplementary
Material online).
Toward the Identification of Taxon-Specific Differences inOrphan Gene Emergence
Systematic studies of orphan gene emergence in ants, pri-
mates (Toll-Riera et al. 2009), and plants (Donoghue et al.
2011) pave the way toward the identification of similarities
and differences in the mechanistic basis of orphan gene emer-
gence between taxa. Do genetic mechanisms that create
orphan genes occur at unequal rates, that is, are rates specific
for each clade? We have identified differences in the fre-
quency spectrum of orphan gene emergence between the
three clades which could support taxon-specific differences
in orphan gene emergence (table 2). For instance, higher rel-
ative rates of TE-mediated orphan gene formation in primates
(Toll-Riera et al. 2009) could very well relate to taxon-specific
genomic characteristics such as the lineage-specific TE con-
tent, including many lineage-specific TE families with varying
activity levels.
However, we have also outlined earlier that characteristics
of the data sets and applied methods vary, which warrants
caution in such cross-study comparisons. Inferring gene dupli-
cation and frame-shifts in one species requires well-conserved
genes in other species, which are used for comparison. In our
study, gene duplicates were identified as phylogenetically con-
served genes, that is, a paralog of a given orphan gene exists
that in turn has orthologs in other species. The resulting pre-
diction rate will decrease with increasing evolutionary dis-
tance, and this inherent bias might contribute to lowering
the predicted rate of gene duplication and frame shifts ac-
counting for orphan gene creation in our data set, compared
with other studies that have used much more closely related
genomes. On the other hand, our study did not require an-
cestors dating back approximately 25 Myr (Toll-Riera et al.
2009), such that very young orphan genes, which seem to
make up a significant fraction of the overall orphan gene
count, are included in our study (fig. 1).
Outlook
Insects comprise the most diverse group of metazoan species
and thus represent great study objects to investigate the role
and origin of new genes in genome and phenotypic evolution.
We have uncovered a relatively high number of SSOG and
TSOG in ants (Formicidae), suggesting that ant genomes and
their gene content are highly dynamic. Understanding the
roles that new gene classes, such as orphan genes, play in
genome evolution might provide insights into the striking re-
ciprocal paradoxon of evolutionary developmental biology:
“The conservation of similar developmental genetic toolkits
despite a diversity of life forms, and the inverse paradox—
the development of similar morphologies despite the
Wissler et al. GBE
452 Genome Biol. Evol. 5(2):439–455. doi:10.1093/gbe/evt009 Advance Access publication January 24, 2013
Dow
nloaded from https://academ
ic.oup.com/gbe/article/5/2/439/560219 by guest on 13 April 2022
phylogenetically variable presence of the genetic tools that are
thought to be responsible for those forms” (Canestro et al.
2007). Our comprehensive annotation of orphan genes with a
special focus on the recently sequenced Formicidae undoubt-
edly represents a valuable resource for further research on
genomes of social insects and their evolution. The pending
availability of further genomes (Robinson et al. 2011) will
not only further boost the powers of comparative genomics
but also call for more in-depth functional and molecular in-
vestigations on selected genes to resolve issues of mechanisms
and implications of gene loss and gain.
Supplementary Material
Supplementary texts S1–S6, tables S1–S5, and figures S1–S5
are available at Genome Biology and Evolution online (http://
www.gbe.oxfordjournals.org/).
Acknowledgments
This work was supported by the Volkswagen Foundation to
L.W. and E.B.-B., the NSF award IOS-0920732 to J.S., a
post-doctoral fellowship from the University of Pennsylvania
Department of Cell and Developmental Biology to D.F.S., and
a Howard Hughes Medical Institute Collaborative Innovation
Award #2009005 to D. Reinberg, S. Berger, and J. Liebig.
Literature CitedAcuna R, et al. 2012. Adaptive horizontal transfer of a bacterial gene to an
invasive insect pest of coffee. Proc Natl Acad Sci U S A. 109(11):
4197–4202.
Adams MD, et al. 2000. The genome sequence of Drosophila melanoga-
ster. Science 287(5461):2185–2195.
Ames RM, et al. 2010. Gene duplication and environmental adaptation
within yeast populations. Genome Biol Evol. 2:591–601.
Arabidopsis Genome Initiative. 2000. Analysis of the genome sequence of
the flowering plant Arabidopsis thaliana. Nature 408(6814):796–815.
Balakirev ES, Ayala FJ. 2003. Pseudogenes: are they “junk” or functional
DNA? Annu Rev Genet. 37:123–151.
Birney E, Clamp M, Durbin R. 2004. GeneWise and genomewise. Genome
Res. 14(5):988–995.
Bonasio R, et al. 2010. Genomic comparison of the ants Camponotus
floridanus and Harpegnathos saltator. Science 329(5995):1068–1071.
Bouwma AM, Ahrens ME, DeHeer CJ, DeWayne Shoemaker D. 2006.
Distribution and prevalence of Wolbachia in introduced populations
of the fire ant Solenopsis invicta. Insect Mol Biol. 15(1):89–93.
Brady SG, Schultz TR, Fisher BL, Ward PS. 2006. Evaluating alternative
hypotheses for the early evolution and diversification of ants. Proc
Natl Acad Sci U S A. 103(48):18172–18177.
Bromham L, Leys R. 2005. Sociality and the rate of molecular evolution.
Mol Biol Evol. 22(6):1393–1402.
Canestro C, Yokoi H, Postlethwait JH. 2007. Evolutionary developmental
biology and genomics. Nat Rev Genet. 8(12):932–942.
Cai J, Zhao R, Jiang H, Wang W. 2008. De novo origination of a new
protein-coding gene in Saccharomyces cerevisiae. Genetics 179(1):
487–496.
Cantarel BL, et al. 2008. MAKER: an easy-to-use annotation pipeline de-
signed for emerging model organism genomes. Genome Res. 18(1):
188–196.
Carroll SB. 2008. Evo-devo and an expanding evolutionary synthesis: a
genetic theory of morphological evolution. Cell 134(1):25–36.
Carvunis AR, et al. 2012. Proto-genes and de novo gene birth. Nature,
Advance Access published July 19, 2012, doi: 10.1038/nature11184.
Chen S, Zhang YE, Long M. 2010. New genes in Drosophila quickly
become essential. Science 330(6011):1682–1685.
Christin PA, et al. 2012. Adaptive evolution of C(4) photosynthesis through
recurrent lateral gene transfer. Curr Biol. 22(5):445–449.
Clark AG, et al. 2007. Evolution of genes and genomes on the Drosophila
phylogeny. Nature 450(7167):203–218.
Colbourne JK, et al. 2011. The ecoresponsive genome of Daphnia pulex.
Science 331(6017):555–561.
Crozier R. 1979. Genetics of sociality. In: Hermann HR, editor. Social in-
sects. New York: Academic Press. p. 223–286.
Domazet-Loso T, Tautz D. 2003. An evolutionary analysis of orphan genes
in Drosophila. Genome Res. 13(10):2213–2219.
Donoghue MT, Keshavaiah C, Swamidatta SH, Spillane C. 2011.
Evolutionary origins of Brassicaceae specific genes in Arabidopsis thali-
ana. BMC Evol Biol. 11(1):47.
Duan J, et al. 2010. SilkDB v2.0: a platform for silkworm (Bombyx
mori) genome biology. Nucleic Acids Res. 38(Database issue):
D453–D456.
Dunning Hotopp JC. 2011. Horizontal gene transfer between bacteria and
animals. Trends Genet. 27(4):157–163.
Dunning Hotopp JC, et al. 2007. Widespread lateral gene transfer from
intracellular bacteria to multicellular eukaryotes. Science 317(5845):
1753–1756.
Fablet M, Rebollo R, Biemont C, Vieira C. 2007. The evolution of retro-
transposon regulatory regions and its consequences on the Drosophila
melanogaster and Homo sapiens host genomes. Gene 390(1–2):
84–91.
Foret S, et al. 2010. New tricks with old genes: the genetic bases of novel
cnidarian traits. Trends Genet. 26(4):154–158.
Gadau J, et al. 2012. The genomic impact of 100 million years of social
evolution in seven ant species. Trends Genet. 28(1):14–21.
Gal-Mark N, Schwartz S, Ast G. 2008. Alternative splicing of Alu exons—
two arms are better than one. Nucleic Acids Res. 36(6):2012–2023.
Gil R, et al. 2003. The genome sequence of Blochmannia floridanus: com-
parative analysis of reduced genomes. Proc Natl Acad Sci U S A.
100(16):9388–9393.
Gil R, Silva FJ, Pereto J, Moya A. 2004. Determination of the core of a
minimal bacterial gene set. Microbiol Mol Biol Rev. 68(3):518–537.
Gladyshev EA, Meselson M, Arkhipova IR. 2008. Massive horizontal gene
transfer in bdelloid rotifers. Science 320(5880):1210–1213.
Gogvadze E, Buzdin A. 2009. Retroelements and their impact on genome
evolution and functioning. Cell Mol Life Sci. 66(23):3727–3742.
Gonzalez J, Petrov DA. 2009. The adaptive role of transposable elements
in the Drosophila genome. Gene 448(2):124–133.
Grbic M, et al. 2011. The genome of Tetranychus urticae reveals herbivo-
rous pest adaptations. Nature 479(7374):487–492.
Grimaldi D, Engel MS. 2005. Evolution of the insects. Cambridge Evolution
Series. Cambridge: Cambridge University Press.
Guerzoni D, McLysaght A. 2011. De novo origins of human genes. PLoS
Genet. 7(11):e1002381.
Hahn Y, Lee B. 2005. Identification of nine human-specific frameshift
mutations by comparative analysis of the human and the chimpanzee
genome sequences. Bioinformatics 21(Suppl 1):i186–i194.
Harris JK, Kelley ST, Spiegelman GB, Pace NR. 2003. The genetic core of
the universal ancestor. Genome Res. 13(3):407–412.
Hedges SB, Dudley J, Kumar S. 2006. TimeTree: a public knowledge-base
of divergence times among organisms. Bioinformatics 22(23):
2971–2972.
Hu TT, et al. 2011. The Arabidopsis lyrata genome sequence and the basis
of rapid genome size change. Nat Genet. 43(5):476–481.
Orphan Gene Emergence in Insect Genomes GBE
Genome Biol. Evol. 5(2):439–455. doi:10.1093/gbe/evt009 Advance Access publication January 24, 2013 453
Dow
nloaded from https://academ
ic.oup.com/gbe/article/5/2/439/560219 by guest on 13 April 2022

Johnson BR, Tsutsui ND. 2011. Taxonomically restricted genes are associ-
ated with the evolution of sociality in the honey bee. BMC Genomics
12(1):164.
Jurka J, et al. 2005. Repbase Update, a database of eukaryotic repetitive
elements. Cytogenet Genome Res. 110(1–4):462–467.
Kaessmann H. 2010. Origins, evolution, and phenotypic impact of new
genes. Genome Res. 20(10):1313–1326.
Kazazian HH. 2004. Mobile elements: drivers of genome evolution.
Science 303(5664):1626–1632.
Keese PK, Gibbs A, Gibbst A. 1992. Origins of genes: “big bang” or
continuous creation? Proc Natl Acad Sci U S A. 89(20):9489–9493.
Khalturin K, et al. 2008. A novel gene family controls species-specific
morphological traits in Hydra. PLoS Biol. 6(11):e278.
Khalturin K, Hemmrich G, Fraune S, Augustin R, Bosch TCG. 2009. More
than just orphans: are taxonomically-restricted genes important in evo-
lution? Trends Genet. 25(9):404–413.
Kim HS, et al. 2010. BeetleBase in 2010: revisions to provide comprehen-
sive genomic information for Tribolium castaneum. Nucleic Acids Res.
38(Database issue):D437–D442.
Klasson L, Kambris Z, Cook PE, Walker T, Sinkins SP. 2009. Horizontal gene
transfer between Wolbachia and the mosquito Aedes aegypti. BMC
Genomics 10(1):33.
Kochetov AV. 2008. Alternative translation start sites and hidden coding
potential of eukaryotic mRNAs. Bioessays 30(7):683–691.
Krylov DM, Wolf YI, Rogozin IB, Koonin EV. 2003. Gene loss, protein
sequence divergence, gene dispensability, expression level, and inter-
activity are correlated in eukaryotic evolution. Genome Res. 13(10):
2229–2235.
Kumar S, Hedges SB. 1998. A molecular timescale for vertebrate evolution.
Nature 392(6679):917–920.
Lander ES, et al. 2001. Initial sequencing and analysis of the human
genome. Nature 409(6822):860–921.
Langmead B, Trapnell C, Pop M, Salzberg SL. 2009. Ultrafast and
memory-efficient alignment of short DNA sequences to the human
genome. Genome Biol. 10(3):R25.
Lawson D, et al. 2009. VectorBase: a data resource for invertebrate vector
genomics. Nucleic Acids Res. 37(Database issue):D583–D587.
Legeai F, et al. 2010. AphidBase: a centralized bioinformatic resource
for annotation of the pea aphid genome. Insect Mol Biol.
19(Suppl 2):5–12.
Levine MT, Jones CD, Kern AD, Lindfors HA, Begun DJ. 2006. Novel genes
derived from noncoding DNA in Drosophila melanogaster are fre-
quently X-linked and exhibit testis-biased expression. Proc Natl Acad
Sci U S A. 103(26):9935–9939.
Lockton S, Gaut BS. 2009. The contribution of transposable elements to
expressed coding sequence in Arabidopsis thaliana. J Mol Evol. 68(1):
80–89.
Long M, Betran E, Thornton K, Wang W. 2003. The origin of new genes:
glimpses from the young and old. Nat Rev Genet. 4(11):865–875.
Lynch M, Conery JS. 2000. The evolutionary fate and consequences of
duplicate genes. Science 290(5494):1151–1155.
MacArthur DG, et al. 2012. A systematic survey of loss-of-function variants
in human protein-coding genes. Science 335(6070):823–828.
Markow TA, O’Grady PM. 2007. Drosophila biology in the genomic age.
Genetics 177(3):1269–1276.
McQuilton P, St Pierre SE, Thurmond J. 2012. FlyBase 101—the basics
of navigating FlyBase. Nucleic Acids Res. 40(Database issue):
D706–D714.
Mefford HC, Eichler EE. 2009. Duplication hotspots, rare genomic disor-
ders, and common disease. Curr Opin Genet Dev. 19(3):196–204.
Milde S, et al. 2009. Characterization of taxonomically restricted genes in a
phylum-restricted cell type. Genome Biol. 10(1):R8.
Moran NA, Jarvik T. 2010. Lateral transfer of genes from fungi underlies
carotenoid production in aphids. Science 328(5978):624–627.
Moreau CS, Bell CD, Vila R, Archibald SB, Pierce NE. 2006. Phylogeny of
the ants: diversification in the age of angiosperms. Science 312(5770):
101–104.
Munoz-Torres MC, et al. 2011. Hymenoptera genome database: inte-
grated community resources for insect species of the order
Hymenoptera. Nucleic Acids Res. 39(Database issue):D658–D662.
Nikoh N, et al. 2008. Wolbachia genome integrated in an insect chromo-
some: evolution and fate of laterally transferred endosymbiont genes.
Genome Res. 18(2):272–280.
Noor MA, Grams KL, Bertucci LA, Reiland J. 2001. Chromosomal inver-
sions and the reproductive isolation of species. Proc Natl Acad Sci
U S A. 98(21):12084–12088.
Nygaard S, et al. 2011. The genome of the leaf-cutting ant Acromyrmex
echinatior suggests key adaptations to advanced social life and fungus
farming. Genome Res. 21(8):1339–1348.
Ohno S. 1970. Evolution by gene duplication. London: Allen and Unwin.
Okamura K, Feuk L, Marques-Bonet T, Navarro A, Scherer SW. 2006.
Frequent appearance of novel protein-coding sequences by frameshift
translation. Genomics 88(6):690–697.
Osato N, Suzuki Y, Ikeo K, Gojobori T. 2007. Transcriptional interferences
in cis natural antisense transcripts of humans and mice. Genetics
176(2):1299–1306.
Perry GH. 2006. Hotspots for copy number variation in chimpanzees and
humans. Proc Natl Acad Sci U S A. 103(21):8006–8011.
Prescott EM, Proudfoot NJ. 2002. Transcriptional collision between con-
vergent genes in budding yeast. Proc Natl Acad Sci U S A. 99(13):
8796–8801.
Prud’homme B, Gompel N, Carroll SB. 2007. Emerging principles of reg-
ulatory evolution. Proc Natl Acad Sci U S A. 104(Suppl 1):8605–8612.
Punta M, et al. 2011. The Pfam protein families database. Nucleic Acids
Res. 40(D1):D290–D301.
Quinlan AR, Hall IM. 2010. BEDTools: a flexible suite of utilities for com-
paring genomic features. Bioinformatics 26(6):841–842.
Raes J, Van De Peer Y. 2005. Functional divergence of proteins through
frameshift mutations. Trends Genet. 21(8):428–431.
Ranz JM, Parsch J. 2012. Newly evolved genes: moving from comparative
genomics to functional studies in model systems: how important is
genetic novelty for species adaptation and diversification? BioEssays
34(6):477–483.
Robinson GE, et al. 2011. Creating a buzz about insect genomes. Science
331(6023):1386.
Russell J. 2011. The ants are unique and enigmatic hosts of prevalent
Wolbachia symbionts. Myrmecol News. 16:7–23.
Sanna CR, Li WH, Zhang L. 2008. Overlapping genes in the human and
mouse genomes. BMC Genomics 9(1):169.
Schmitz J, Brosius J. 2011. Exonization of transposed elements: a challenge
and opportunity for evolution. Biochimie 93(11):1928–1934.
Schmitz J, Moritz RF. 1998. Sociality and the rate of rDNA sequence evo-
lution in wasps (Vespidae) and honeybees (Apis). J Mol Evol. 47(5):
606–612.
Smit A, Hubley R, Green P. 2010. RepeatMasker, Open-3.0 1996–2010.
Available from: http://www.repeatmasker.org.
Smith CD, et al. 2011. Draft genome of the globally widespread and
invasive Argentine ant (Linepithema humile). Proc Natl Acad Sci
U S A. 108(14):5673–5678.
Smith CR, et al. 2011. Draft genome of the red harvester ant Pogono-
myrmex barbatus. Proc Natl Acad Sci U S A. 108(14):5667–5672.
Solda G, et al. 2008. Non-random retention of protein-coding overlapping
genes in Metazoa. BMC Genomics 9(1):174.
Sommer RJ, Streit A. 2011. Comparative genetics and genomics of nem-
atodes: genome structure, development, and lifestyle. Annu Rev
Genet. 45:1–20.
Stankiewicz P, Lupski JR. 2010. Structural variation in the human genome
and its role in disease. Annu Rev Med. 61:437–455.
Wissler et al. GBE
454 Genome Biol. Evol. 5(2):439–455. doi:10.1093/gbe/evt009 Advance Access publication January 24, 2013
Dow
nloaded from https://academ
ic.oup.com/gbe/article/5/2/439/560219 by guest on 13 April 2022

Stevison LS, Hoehn KB, Noor MAF. 2011. Effects of inversions on within-
and between-species recombination and divergence. Genome Biol
Evol. 3:830–841.
Suen G, et al. 2011. The genome sequence of the leaf-cutter ant Atta
cephalotes reveals insights into its obligate symbiotic lifestyle. PLoS
Genet. 7(2):e1002007.
Tamura K, Subramanian S, Kumar S. 2004. Temporal patterns of fruit fly
(Drosophila) evolution revealed by mutation clocks. Mol Biol Evol.
21(1):36–44.
Tatusov RL, et al. 2003. The COG database: an updated version includes
eukaryotes. BMC Bioinformatics 4:41.
Tautz D, Domazet-Loso T. 2011. The evolutionary origin of orphan genes.
Nat Rev Genet. 12(10):692–702.
Tettelin H, et al. 2005. Genome analysis of multiple pathogenic isolates of
Streptococcus agalactiae: implications for the microbial
“pan-genome”. Proc Natl Acad Sci U S A. 102(39):13950–13955.
Tian D, et al. 2008. Single-nucleotide mutation rate increases close to
insertions/deletions in eukaryotes. Nature 455(7209):105–108.
Toll-Riera M, et al. 2009. Origin of primate orphan genes: a comparative
genomics approach. Mol Biol Evol. 26(3):603–612.
Trapnell C, et al. 2010. Transcript assembly and quantification by RNA-Seq
reveals unannotated transcripts and isoform switching during cell dif-
ferentiation. Nat Biotechnol. 28(5):511–515.
Van Borm S, Wenseleers T, Billen J, Boomsma J. 2001. Wolbachia in
leafcutter ants: a widespread symbiont that may induce male killing
or incompatible matings. J Evol Biol. 14(5):805–814.
Voolstra CR, et al. 2011. Rapid evolution of coral proteins responsible for
interaction with the environment. PLoS One 6(5):e20392.
Weinstock GM, et al. 2006. Insights into social insects from the genome of
the honeybee Apis mellifera. Nature 443(7114):931–949.
Werren JH, et al. 2010. Functional and evolutionary insights from the
genomes of three parasitoid Nasonia species. Science 327(5963):
343–348.
Wikstrom N, Savolainen V, Chase MW. 2001. Evolution of the angio-
sperms: calibrating the family tree. Proc Biol Sci. 268(1482):2211–2220.
Wilson BA, Masel J. 2011. Putatively noncoding transcripts show extensive
association with ribosomes. Genome Biol Evol. 3:1245–1252.
Wilson EO, Holldobler B. 2005. The rise of the ants: a phylogenetic
and ecological explanation. Proc Natl Acad Sci U S A. 102(21):
7411–7414.
Wilson GA, et al. 2005. Orphans as taxonomically restricted and ecologi-
cally important genes. Microbiology 151(Pt 8):2499–2501.
Wilson GA, Feil EJ, Lilley AK, Field D. 2007. Large-scale comparative ge-
nomic ranking of taxonomically restricted genes (TRGs) in bacterial and
archaeal genomes. PLoS One 2(3):e324.
Wright SI, Andolfatto P. 2008. The impact of natural selection on the
genome: emerging patterns in Drosophila and Arabidopsis. Annu
Rev Ecol Evol Syst. 39(1):193–213.
Wu DD, Irwin DM, Zhang YP. 2011. De Novo origin of human
protein-coding genes. PLoS Genet. 7(11):e1002379.
Wu TD, Watanabe CK. 2005. GMAP: a genomic mapping and alignment
program for mRNA and EST sequences. Bioinformatics 21(9):
1859–1875.
Wurm Y, et al. 2011. The genome of the fire ant Solenopsis invicta. Proc
Natl Acad Sci U S A. 108(14):5679–5684.
Yandell M, Ence D. 2012. A beginner’s guide to eukaryotic genome an-
notation. Nat Rev Genet. 13(5):329–342.
Yu JS, Kokoska RJ, Khemici V, Steege DA. 2007. In-frame overlapping
genes: the challenges for regulating gene expression. Mol Microbiol.
63(4):1158–1172.
Zhang J. 2003. Evolution by gene duplication: an update. Trends Ecol Evol.
18(6):292–298.
Zhang YE, Landback P, Vibranovski MD, Long M. 2011. Accelerated re-
cruitment of new brain development genes into the human genome.
PLoS Biol. 9(10):e1001179.
Zhang Z, Gerstein M. 2004. Large-scale analysis of pseudogenes in the
human genome. Curr Opin Genet Dev. 14(4):328–335.
Zhou Q, et al. 2008. On the origin of new genes in Drosophila. Genome
Res. 18(9):1446–1455.
Zhu B, et al. 2011. Horizontal gene transfer in silkworm, Bombyx mori.
BMC Genomics 12(1):248.
Associate editor: Laura Landweber
Orphan Gene Emergence in Insect Genomes GBE
Genome Biol. Evol. 5(2):439–455. doi:10.1093/gbe/evt009 Advance Access publication January 24, 2013 455
Dow
nloaded from https://academ
ic.oup.com/gbe/article/5/2/439/560219 by guest on 13 April 2022