Measuring the Value of HR and Leadership Programs - ROI Institute
36
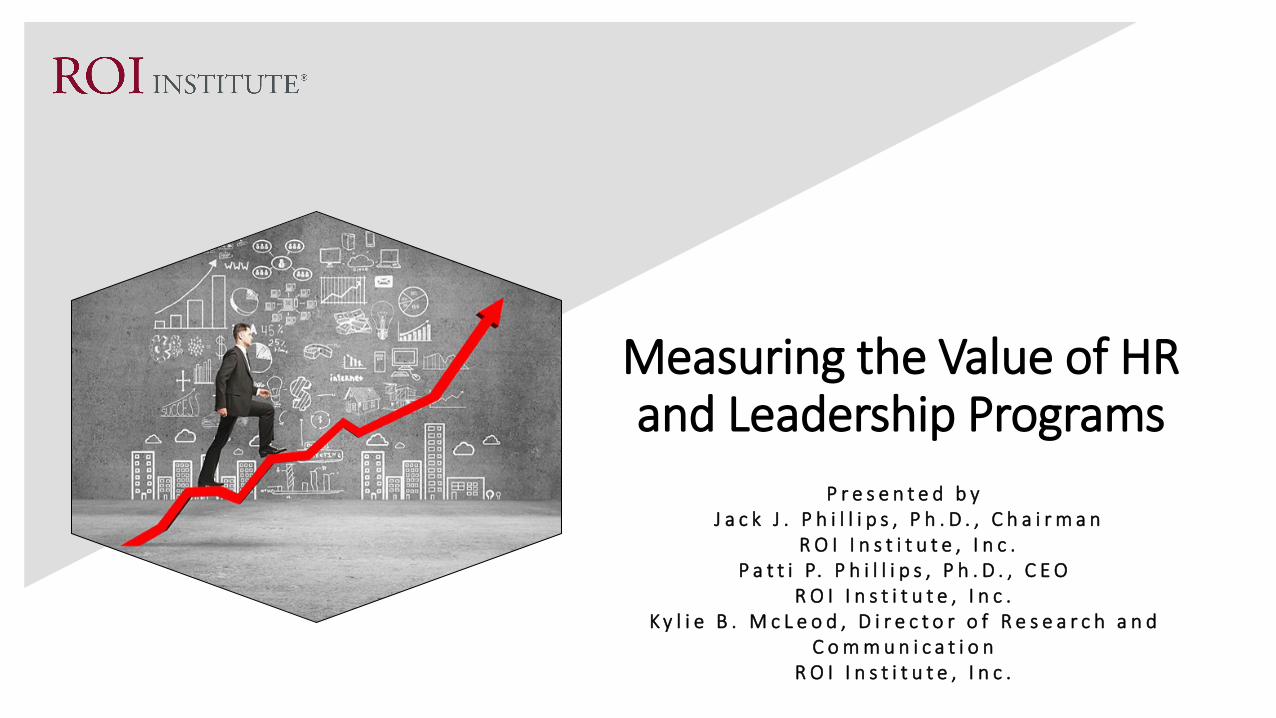
Measuring the Value of HR and Leadership Programs Presented by Jack J. Phillips, Ph.D., Chairman ROI Institute, Inc. Patti P. Phillips, Ph.D., CEO ROI Institute, Inc. Kylie B. McLeod, Director of Research and Communication ROI Institute, Inc.
-
Upload
khangminh22 -
Category
Documents
-
view
2 -
download
0
Transcript of Measuring the Value of HR and Leadership Programs - ROI Institute
Measuring the Value of HR and Leadership Programs
P r e s e n t e d b yJ a c k J . P h i l l i p s , P h . D . , C h a i r m a n
R O I I n s t i t u t e , I n c .P a t t i P. P h i l l i p s , P h . D . , C E O
R O I I n s t i t u t e , I n c .K y l i e B . M c L e o d , D i r e c t o r o f R e s e a r c h a n d
C o m m u n i c a t i o nR O I I n s t i t u t e , I n c .

Learning Objectives
After attending this session, participants will be able to:1. Explain why impact and ROI are important.2. Identify five levels of outcomes.3. Design programs to deliver impact.
2
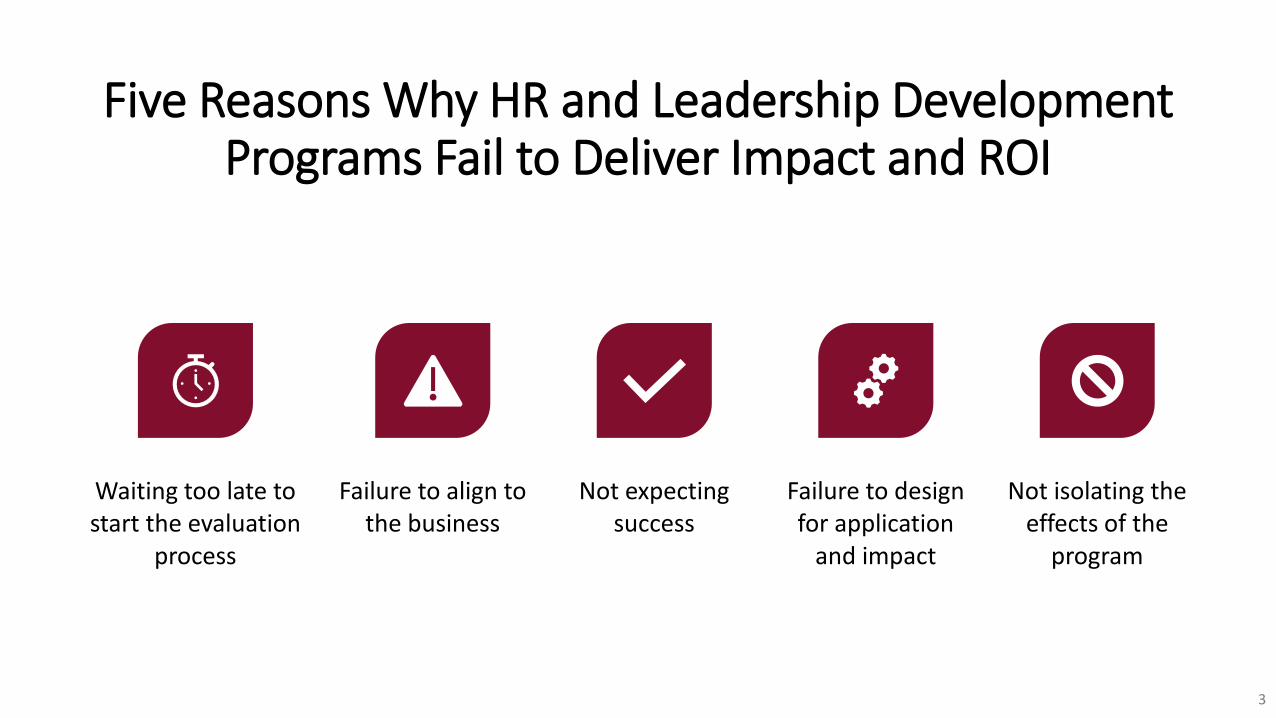
Five Reasons Why HR and Leadership Development Programs Fail to Deliver Impact and ROI
3
Waiting too late to start the evaluation
process
Failure to align to the business
Not expecting success
Failure to design for application
and impact
Not isolating the effects of the
program

LEVEL ISSUE MEASURES TARGETS†
This is easyAlways measured
0 Inputs Volume, Hours, Convenience, Cost 100%
This is easyAlmost always measured
1 Reaction *Relevance, Engaging, *Important, Useful, *New Content, *Intent to Use, *Recommend to Others
100%
Not difficultUsually measured
2 Learning Concepts, Trends, Facts, Contacts, Skills, Competencies
90%
PossibleOften measured
3 Application Use of content, Frequency of Use, Success with Use, Barriers, Enablers
30%
Not so difficult to connectSometimes measured
4 Impact Productivity, Time, Quality, Costs, Image, Reputation, Engagement, Compliance
10%
Possible for many programs
Rarely measured
5 ROI Benefit Cost Ratio or Return on Investment, Expressed as a Percent
5%
*Can
pre
dict
Exec
utiv
es
pref
er
† Best Practice: Percent of Programs Evaluated at this level each year.
Must take a step to isolate the effects
The Value Chain is Always There!
4

This methodology works with all HR areas.• Recruiting and Selection
• Onboarding/Socialization
• Learning and Development
• Compensation/Benefits
• Safety/Health
• Labor Relations
5
• Diversity, Equity, and Inclusion
• Employee Engagement
• Performance Management
• Motivation/Rewards
• Compliance/Legal
• Human Resource Information Systems

Why Are You Interested in Impact and ROI Now?
Top executives are requiring ROI. I must pursue this. I have pressure to justify my budget. I need to pursue this. I know I will need to demonstrate more value in the future. I want to show increased accountability for our
expenditures. I want to experiment with and explore new techniques to
measure program success.
6
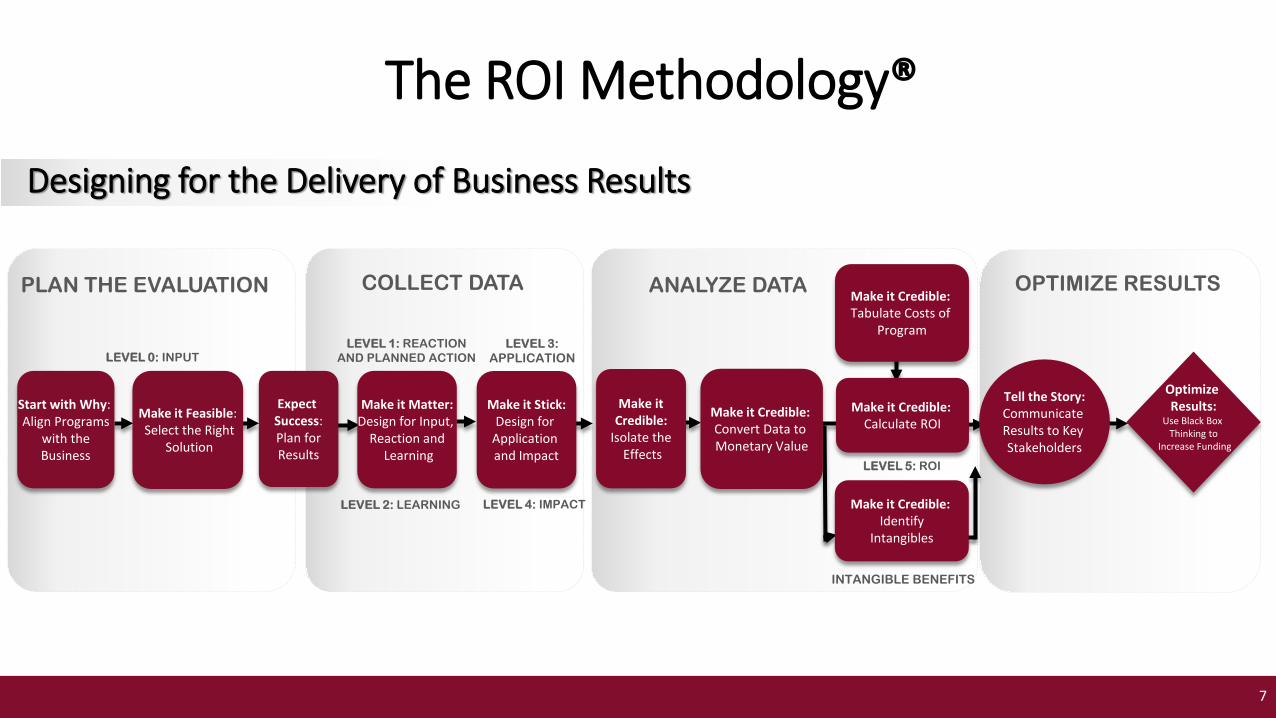
PLAN THE EVALUATION COLLECT DATA ANALYZE DATA OPTIMIZE RESULTS
LEVEL 5: ROI
LEVEL 1: REACTION AND PLANNED ACTION
LEVEL 3:APPLICATION
LEVEL 2: LEARNING LEVEL 4: IMPACT
INTANGIBLE BENEFITS
Start with Why: Align Programs
with the Business
Make it Feasible:Select the Right
Solution
Make it Matter:Design for Input,
Reaction andLearning
Make itCredible:
Isolate theEffects
Make it Credible:Convert Data to Monetary Value
Make it Credible:Tabulate Costs of
Program
Make it Credible:Calculate ROI
Make it Credible:Identify
Intangibles
Tell the Story:Communicate Results to Key Stakeholders
Expect Success:Plan for Results
Make it Stick:Design for
Application and Impact
Optimize Results:
Use Black Box Thinking to
Increase Funding
LEVEL 0: INPUT
The ROI Methodology®
7
Designing for the Delivery of Business Results
77
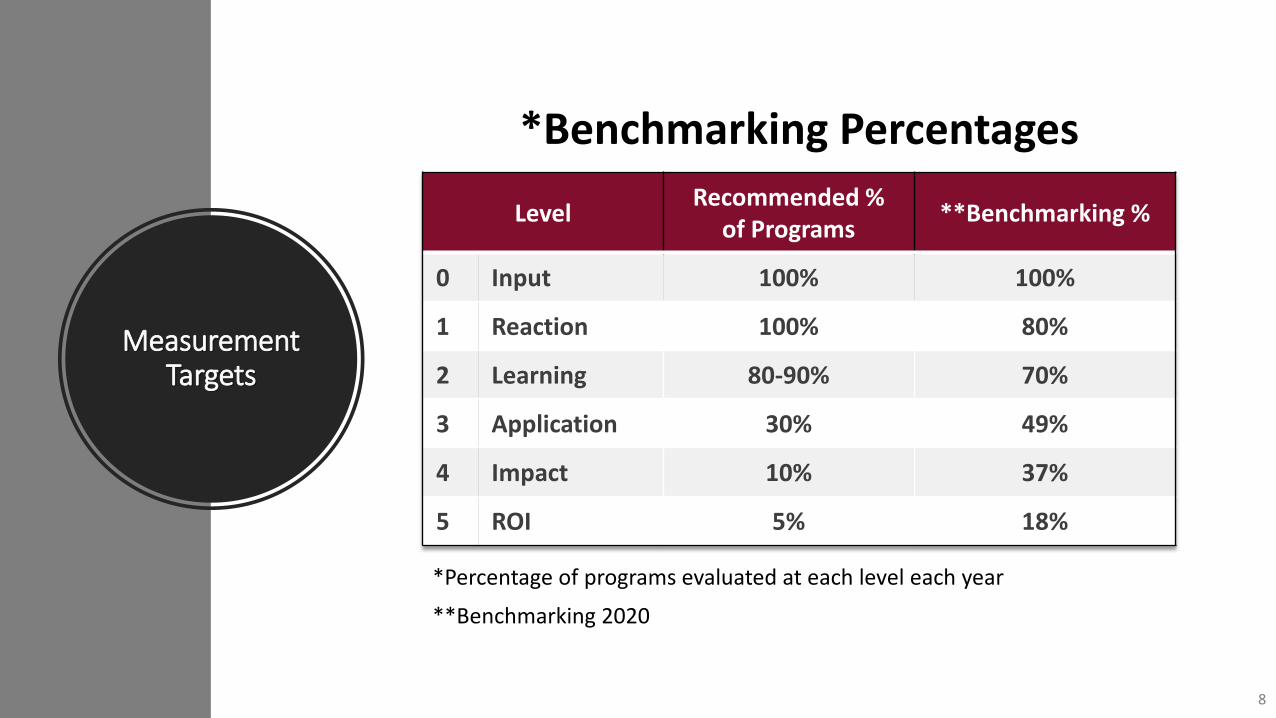
Measurement Targets
Level Recommended % of Programs **Benchmarking %
0 Input 100% 100%
1 Reaction 100% 80%
2 Learning 80-90% 70%
3 Application 30% 49%
4 Impact 10% 37%
5 ROI 5% 18%
*Benchmarking Percentages
**Benchmarking 2020
*Percentage of programs evaluated at each level each year
8

Measuring ROI in Leadership Development: Presidential Management Fellows
• Program Description
• Why ROI?
9

THE PMF PROGRAM LEADERSHIP DEVELOPMENT GOALS
10
The PMF Leadership Development Program (LDP) was established to support a PMF's leadership journey during their two-year fellowship and provides 100+ hours of formal interactive training and development toward fellowship requirements. The program is designed to:
• Deliver a premier developmental experience that equips PMFs for future leadership roles in 21st-century government
• Assist supervisors in fulfilling their roles as models and mentors
• Cultivate a strong esprit de corps across each PMF Class through collaboration and relationship building
• Apply experiential learning methods to work-related projects• Connect accomplished PMF Alumni with current PMFs to serve as mentors and guide

PMFLeadership Development Program
• Data, discussion, benchmarking led to business measures
• Retention, Assignments, Promotions, Developmental Project, Direct Contribution, and Tenure
1. Start with Why—Align to Business Measures
• The leaders (participants) made the connection.
2. Make it Feasible—Select the Right Solution
11
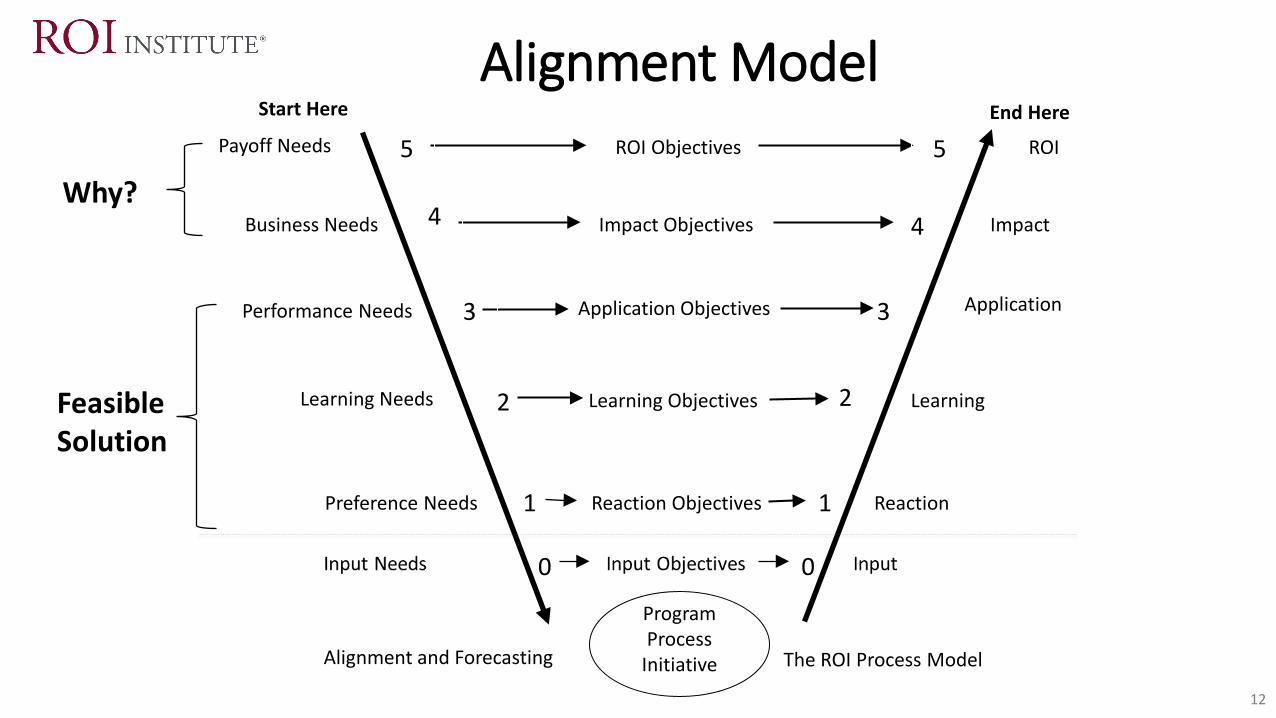
Program Process
InitiativeAlignment and Forecasting The ROI Process Model
Alignment Model
Learning Needs
Preference Needs Reaction
Learning
Application
Impact
ROI
Reaction Objectives
Learning Objectives
Application ObjectivesPerformance Needs
Impact ObjectivesBusiness Needs
Payoff Needs ROI Objectives
End HereStart Here
5
4
3
2
5
4
3
2
1 1
0 0
Feasible Solution
Why?
12

PMFLeadership Development Program
• Definition of success: Impact (business measures)• Objectives developed for reaction, learning,
application, and impact• Objectives provided to all stakeholders with the
request: Design to application and impact
3. Expect Success
13

20
Matching Evaluation Levels with Objectives
Objective Evaluation Level
After completing this program or project, participants should:
1. Decrease time to produce a report by 20%. _____
2. Listen intently to team members routinely. _____
3. Be able to demonstrate the five steps to diffuse a conflict, given two individuals in a heated argument. _____
4. Rate the content 4 out of 5 on relevance. _____
5. Decrease the amount of time required to complete a project. _____
14

20
Matching Evaluation Levels with Objectives
Objective Evaluation Level
After completing this program or project, participants should:
1. Decrease time to produce a report by 20%. 4
2. Listen intently to team members routinely. 3
3. Be able to demonstrate the five steps to diffuse a conflict, given two individuals in a heated argument. 2
4. Rate the content 4 out of 5 on relevance. 1
5. Decrease the amount of time required to complete a project. 4
15
20
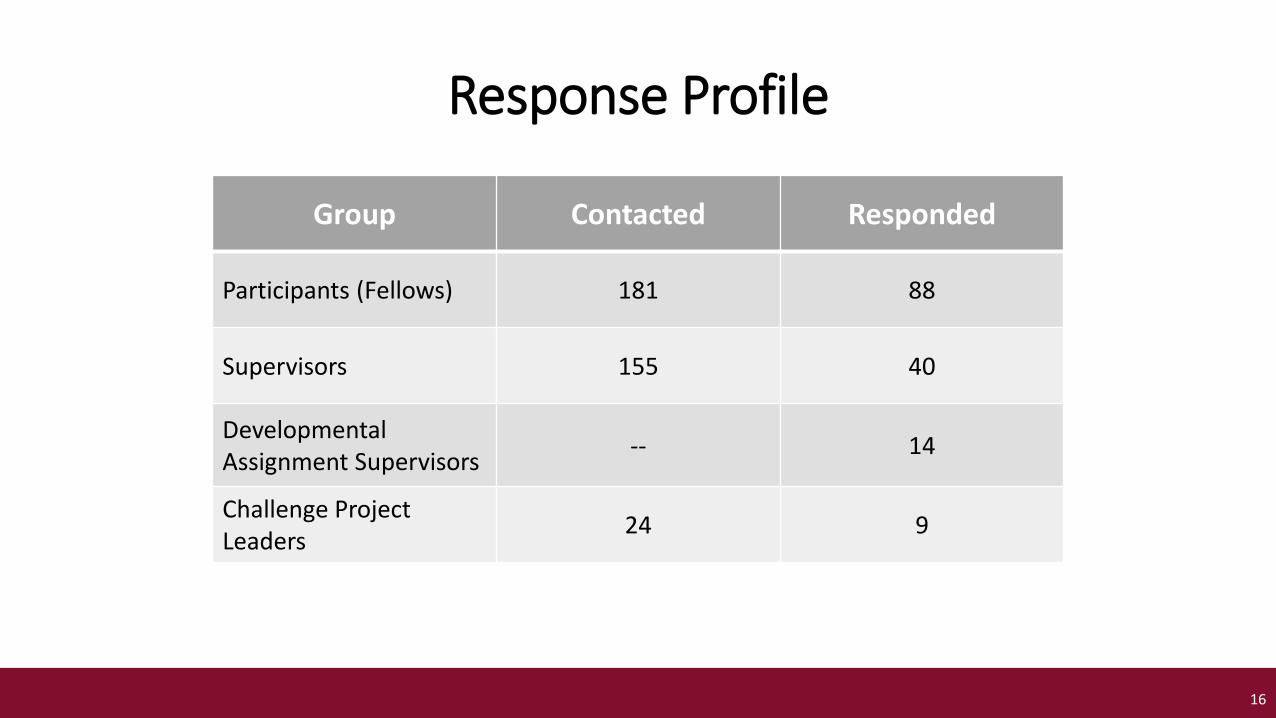
Response Profile
16
Group Contacted Responded
Participants (Fellows) 181 88
Supervisors 155 40
Developmental Assignment Supervisors -- 14
Challenge Project Leaders 24 9
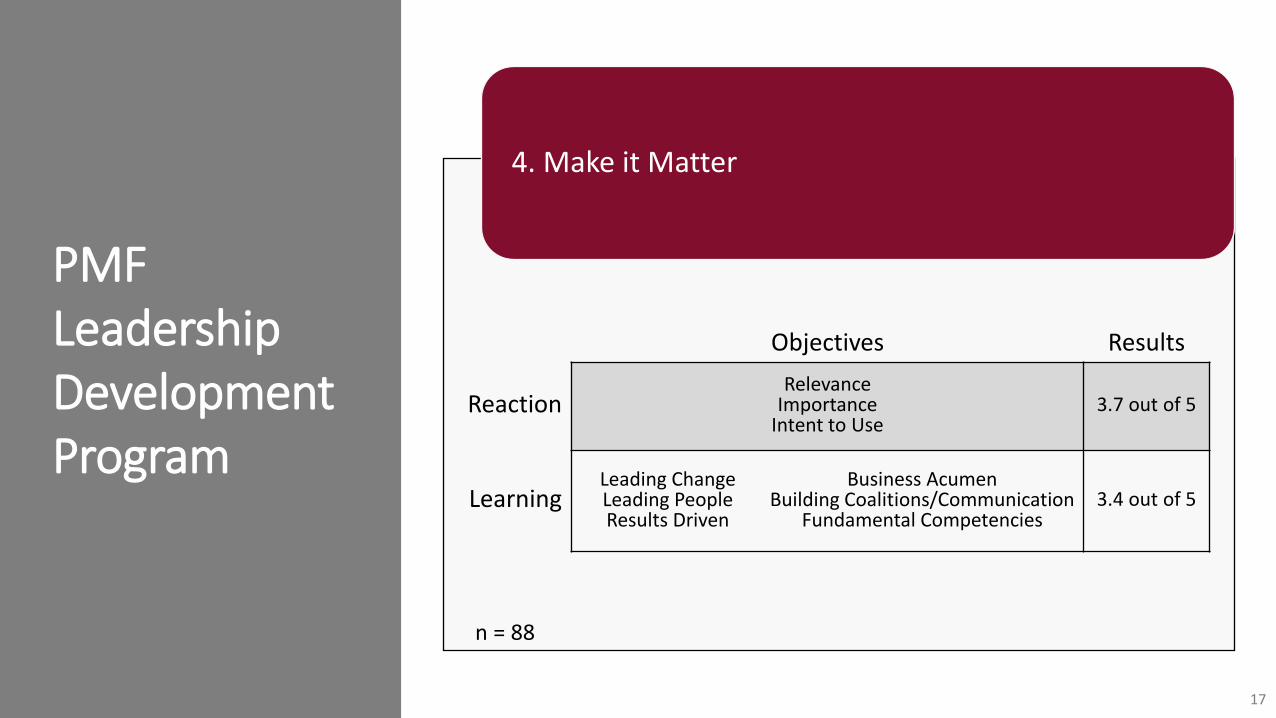
PMFLeadership Development Program
4. Make it Matter
17
Objectives Results
ReactionRelevance
Importance Intent to Use
3.7 out of 5
Learning 3.4 out of 5Leading ChangeLeading PeopleResults Driven
Business AcumenBuilding Coalitions/Communication
Fundamental Competencies
n = 88

PMFLeadership Development Program
5. Make it Stick
18
Objectives Results
Application 4.5 out of 5
Impact Various impacts
Creativity and InnovationFlexibilityResilience
Strategic ThinkingDeveloping Others
Team Building
RetentionAssignmentsPromotions
Developmental ProjectDirect Contribution
Tenure
n = 88

*Survey of Users, N = 246
Data Collection Methods
27%
35%
36%
39%
43%
51%
71%
0% 10% 20% 30% 40% 50% 60% 70% 80%
Focus Groups
Interviews
Tests
Observation
Action Plans/Performance Contracts
Performance Records/Databases
Surveys/Questionnaires
19

PMFLeadership Development Program
• Explored: experimental versus control group• Tried: trend line analysis• Used: estimates from participants adjusted for error
Step 6. Make it Credible: Isolate the Effects of the Program
20
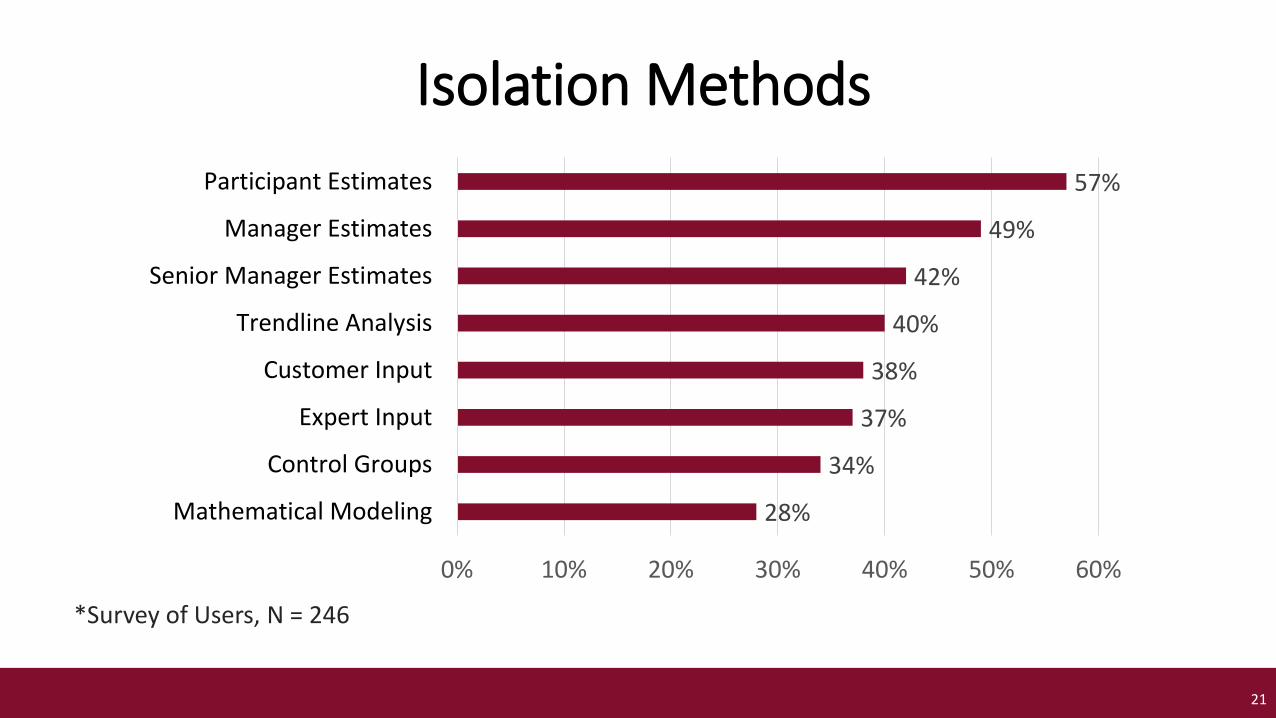
*Survey of Users, N = 246
Isolation Methods
28%
34%
37%
38%
40%
42%
49%
57%
0% 10% 20% 30% 40% 50% 60%
Mathematical Modeling
Control Groups
Expert Input
Customer Input
Trendline Analysis
Senior Manager Estimates
Manager Estimates
Participant Estimates
21

PMFLeadership Development Program
• Voluntary Turnover – HR provided (150% of annual pay)• Project Contribution – Estimates and Records • Direct Contribution – Payroll Records • Developmental Assignments – Estimates and Records• Challenge Projects – Estimates and Records• Total Monetary Value – One year of benefits
Step 7. Make it Credible: Convert Data to Money
22
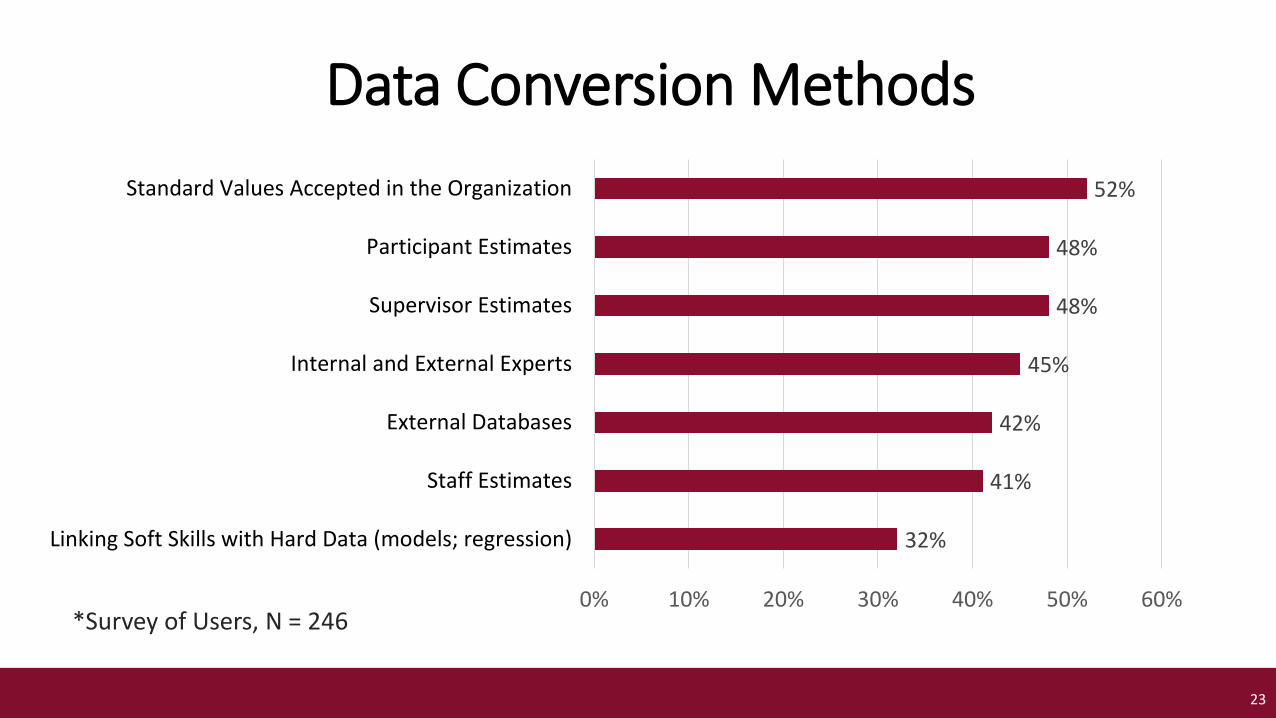
*Survey of Users, N = 246
Data Conversion Methods
32%
41%
42%
45%
48%
48%
52%
0% 10% 20% 30% 40% 50% 60%
Linking Soft Skills with Hard Data (models; regression)
Staff Estimates
External Databases
Internal and External Experts
Supervisor Estimates
Participant Estimates
Standard Values Accepted in the Organization
23
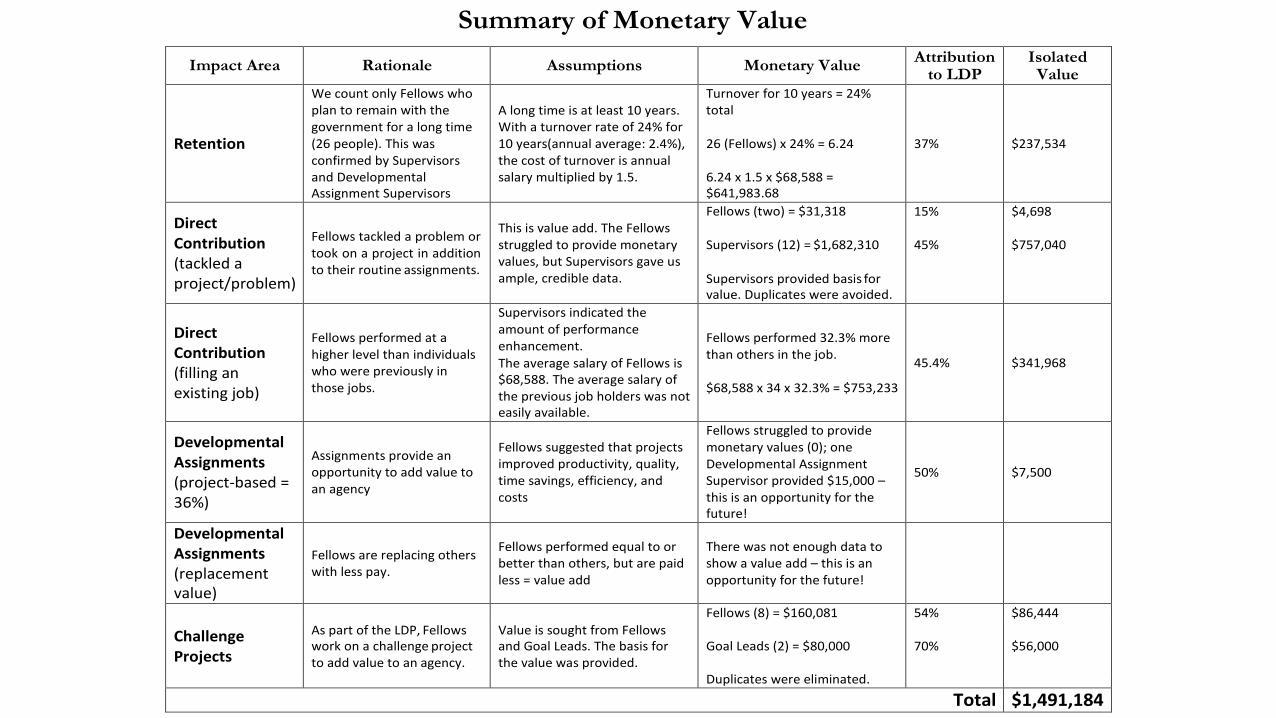
Summary of Monetary Value
Impact Area Rationale Assumptions Monetary Value Attribution to LDP
Isolated Value
Retention
We count only Fellows who plan to remain with the government for a long time (26 people). This was confirmed by Supervisors and Developmental Assignment Supervisors
A long time is at least 10 years. With a turnover rate of 24% for 10 years(annual average: 2.4%), the cost of turnover is annual salary multiplied by 1.5.
Turnover for 10 years = 24% total
26 (Fellows) x 24% = 6.24
6.24 x 1.5 x $68,588 = $641,983.68
37%
$237,534
Direct Contribution (tackled a project/problem)
Fellows tackled a problem or took on a project in addition to their routine assignments.
This is value add. The Fellows struggled to provide monetary values, but Supervisors gave us ample, credible data.
Fellows (two) = $31,318
Supervisors (12) = $1,682,310
Supervisors provided basis for value. Duplicates were avoided.
15%
45%
$4,698
$757,040
Direct Contribution (filling an existing job)
Fellows performed at a higher level than individuals who were previously in those jobs.
Supervisors indicated the amount of performance enhancement. The average salary of Fellows is $68,588. The average salary of the previous job holders was not easily available.
Fellows performed 32.3% more than others in the job.
$68,588 x 34 x 32.3% = $753,233
45.4%
$341,968
Developmental Assignments (project-based = 36%)
Assignments provide an opportunity to add value to an agency
Fellows suggested that projects improved productivity, quality, time savings, efficiency, and costs
Fellows struggled to provide monetary values (0); one Developmental Assignment Supervisor provided $15,000 – this is an opportunity for the future!
50%
$7,500
Developmental Assignments (replacement value)
Fellows are replacing others with less pay.
Fellows performed equal to or better than others, but are paid less = value add
There was not enough data to show a value add – this is an opportunity for the future!
Fellows (8) = $160,081 54% $86,444
Challenge Projects
As part of the LDP, Fellows work on a challenge project to add value to an agency.
Value is sought from Fellows and Goal Leads. The basis for the value was provided.
Goal Leads (2) = $80,000
70%
$56,000
Duplicates were eliminated.
Total $1,491,184
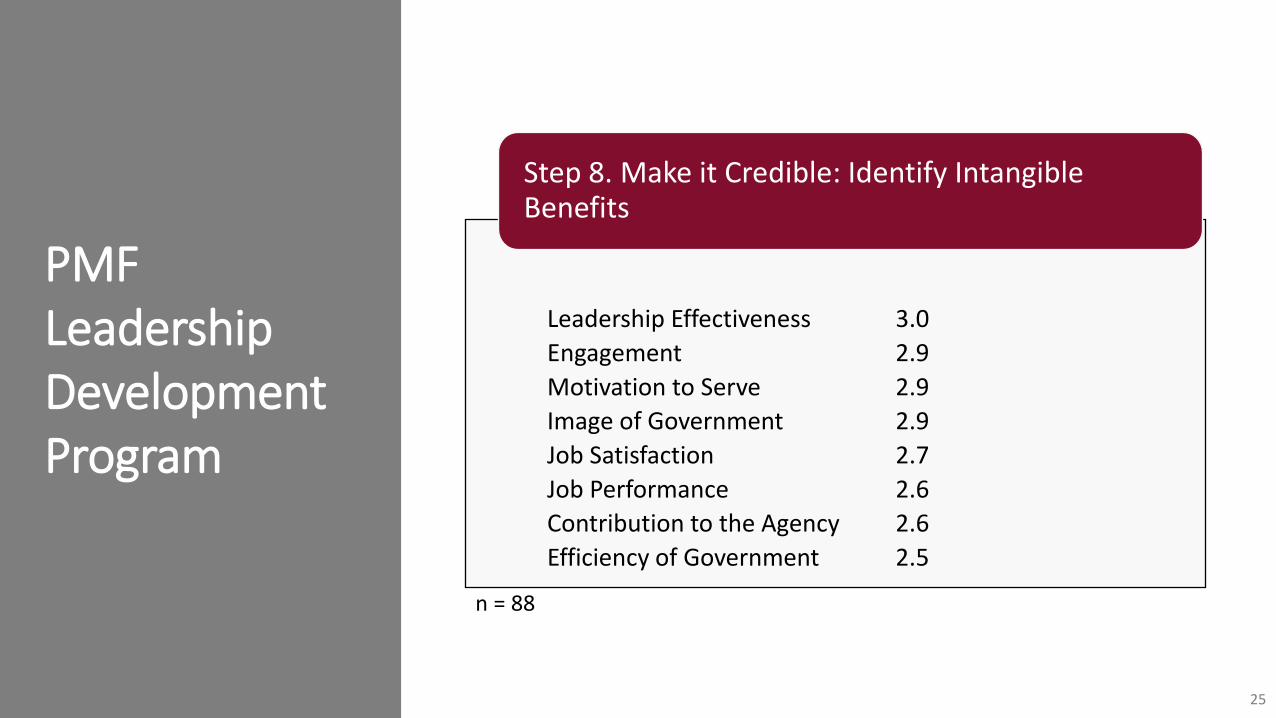
PMFLeadership Development Program
Leadership Effectiveness 3.0Engagement 2.9Motivation to Serve 2.9Image of Government 2.9Job Satisfaction 2.7Job Performance 2.6Contribution to the Agency 2.6Efficiency of Government 2.5
Step 8. Make it Credible: Identify Intangible Benefits
25
n = 88
PMF Leadership Development Program
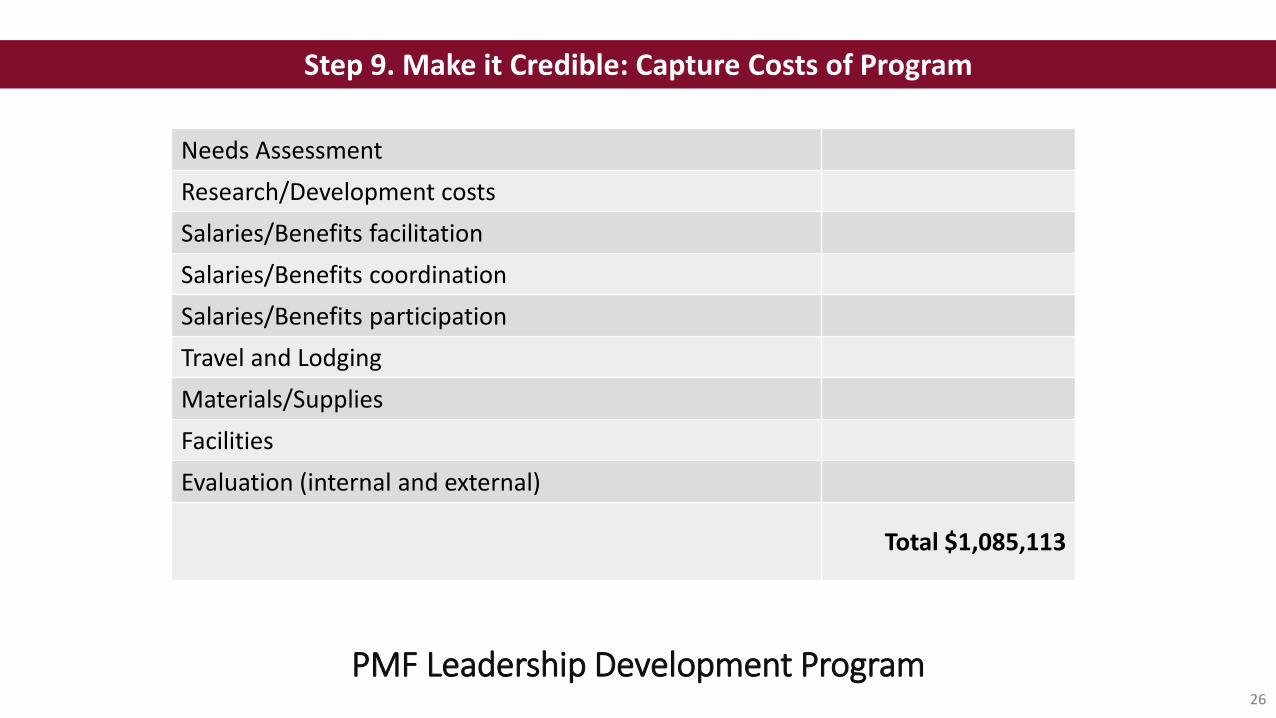
Step 9. Make it Credible: Capture Costs of Program
Needs Assessment Research/Development costs Salaries/Benefits facilitationSalaries/Benefits coordinationSalaries/Benefits participationTravel and LodgingMaterials/SuppliesFacilitiesEvaluation (internal and external)
Total $1,085,113
26
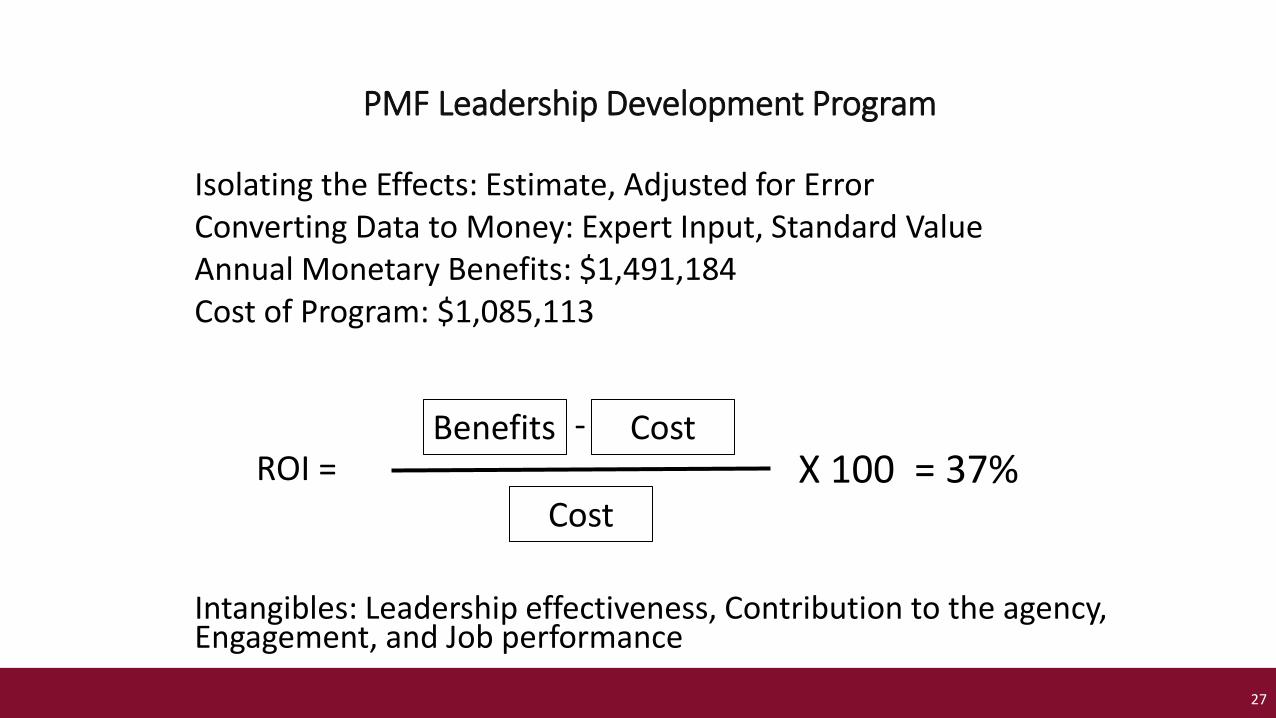
Isolating the Effects: Estimate, Adjusted for ErrorConverting Data to Money: Expert Input, Standard ValueAnnual Monetary Benefits: $1,491,184Cost of Program: $1,085,113
Intangibles: Leadership effectiveness, Contribution to the agency, Engagement, and Job performance
X 100 = 37%Benefits
Cost
-ROI =
Cost
27
PMF Leadership Development Program

PMFLeadership Development Program
• Senior Leadership — Virtual Briefing • Respondents — Infographic• PMF Program Team – Infographic
Step 11. Tell the Story: Communicate Results to Key Stakeholders
28
With numbers and narrative, results were communicated to:
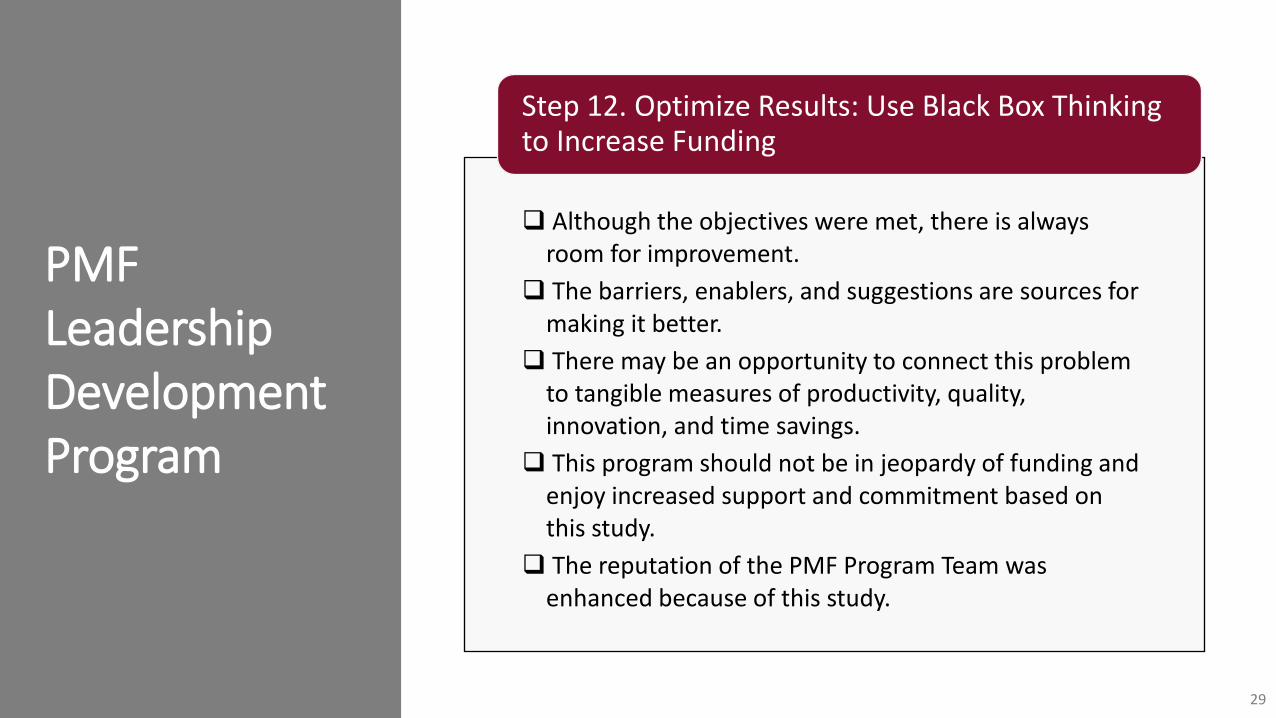
PMFLeadership Development Program
Although the objectives were met, there is always room for improvement.
The barriers, enablers, and suggestions are sources for making it better.
There may be an opportunity to connect this problem to tangible measures of productivity, quality, innovation, and time savings.
This program should not be in jeopardy of funding and enjoy increased support and commitment based on this study.
The reputation of the PMF Program Team was enhanced because of this study.
Step 12. Optimize Results: Use Black Box Thinking to Increase Funding
29
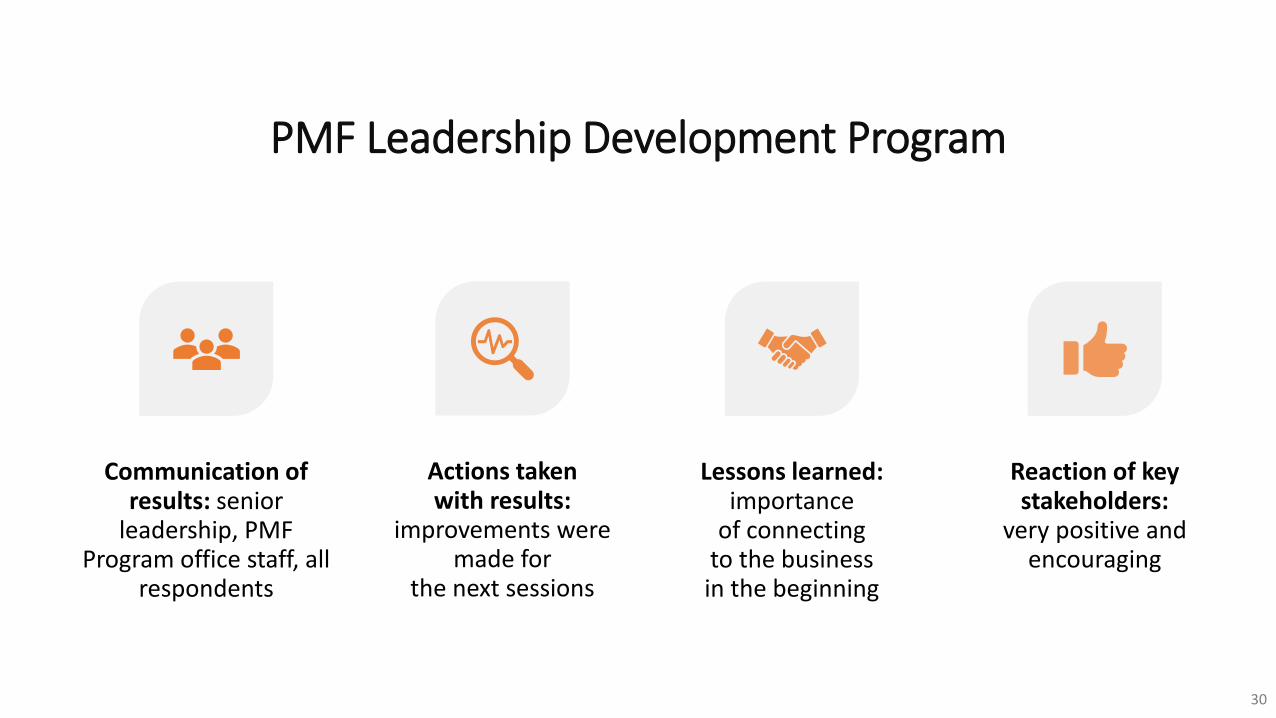
Communication of results: senior
leadership, PMF Program office staff, all
respondents
Actions taken with results:
improvements were made for
the next sessions
Lessons learned: importance
of connecting to the business in the beginning
Reaction of key stakeholders:
very positive and encouraging
30
PMF Leadership Development Program

It’s That Easy

We are pleased to provide you with a complimentary book of your choice. Here are 10 recommended titles:


https://www.roiinstituteacademy.comJoin Level 0 Membership at no cost to gain access
to resource materials, tools, and case studies.

Questions?Visit us online:
www.roiinstitute.net
Email: [email protected]@[email protected]
Connect with Us