Measuring the Credibility of Student Attendance Data in ...
7
Abstract—Educational Data Mining (EDM) is a developing discipline, concerned with expanding the classical Data Mining (DM) methods and developing new methods for discovering the data that originate from educational systems. Student attendance in higher education has always been dealt with in a classical way, i.e. educators rely on counting the occurrence of attendance or absence building their knowledge about students as well as modules based on this count. This method is neither credible nor does it necessarily provide a real indication of a student’s performance. This study tries to formulate the extracted knowledge in a way that guarantees achieving accurate and credible results. Student attendance data, gathered from the educational system, were first cleaned in order to remove any randomness and noise, then various attributes were studied so as to highlight the most significant ones that affect the real attendance of students. The next step was to derive an equation that measures the Student Attendance’s Credibility (SAC) considering the attributes chosen in the previous step. The reliability of the newly developed measure was then evaluated in order to examine its consistency. Finally, the J48 DM classification technique was utilized in order to classify modules based on the strength of their SAC values. Results of this study were promising, and credibility values achieved using the newly derived formula gave accurate, credible, and real indicators of student attendance, as well as accurate classification of modules based on the credibility of student attendance on those modules. Index Terms—EDM, credibility, reliability, student attendance, higher education. I. INTRODUCTION Student attendance in higher education is an important issue as it has been shown to directly affect students’ performance [1], In order to consider student attendance as a criterion for estimating students’ performance, student attendance data should be represented by a form that reflects the real weight of student attendance rather than the number of attendance occurrences, because of the fact that previous studies that considered investigating students’ attendance have either considered the number of attendance occurrences as it is, or used its average value without relating these values to any other factors that may represent the real student attendance. On the other hand, those studies intended to use student attendance data without preparation that can neither be reliable nor credible. Therefore, the Student Attendance’s Credibility (SAC) should be taken into consideration. The credibility in research involves establishing that the Manuscript received March 23, 2017; revised May 21, 2017. The authors are with the Loughborough University, Epinal Way, Loughborough Leicestershire, UK (e-mail: [email protected], [email protected], [email protected]). results of research are credible or believable. It is a term that when incorporated with other terms like: Transferability, Dependability, and Confirmability, can be used to replace ‘reliability’ and ‘validity’, which are usually linked to quantitative research [2]. On one hand, the reliability refers to the ability to measure the attributes of a variable or construct consistency; while on the other hand, the validity is the extent to which the measurement of a concept is done accurately [3]. SAC represents a measure that can determine how much credible student attendance is for each class during the semester. Hence, the ability to measure SAC is crucial in educational environments since it can accurately evaluate the weight of student attendance compared to his/her number of attendance occurrences. By measuring SAC for each module and comparing it to the same student’s SAC of other modules, the performance of the student can then be evaluated and compared to his/her performance in other semesters. SAC is based on various factors that will be described in detail later in this paper. By measuring SAC for each module he/she attends, modules can be classified using data mining classification techniques depending on SAC values tied to the module. Data mining is exploration and analysis, by automatic or semi-automatic means, of large quantities of data in order to discover meaningful patterns [4]. Fig. 1 shows the process of data mining. Fig. 1. Levels of the data processes [5]. Figure 1 shows that in order to start mining the data, one should select the target data from the database. Then, preprocess the target data to get the transformed data. Finally, mine the data to get the proposed knowledge. In terms of data preprocessing, the initial attendance data used in this study were random, noisy and needed to be cleaned. If the data were not processed and unchanged, it would have been impossible to achieve logical results since the technique to be applied would never comprehend such data. Based on that, an extensive research was undertaken on this field in order to investigate the existence of any related works that considered cleaning the attendance and absence data. The majority of those research works either neglected these data or used the data without cleaning or modification. Measuring the Credibility of Student Attendance Data in Higher Education for Data Mining International Journal of Information and Education Technology, Vol. 8, No. 2, February 2018 121 doi: 10.18178/ijiet.2018.8.2.1020 Mohammed Alsuwaiket, Christian Dawson, and Firat Batmaz
-
Upload
khangminh22 -
Category
Documents
-
view
0 -
download
0
Transcript of Measuring the Credibility of Student Attendance Data in ...
Abstract—Educational Data Mining (EDM) is a developing
discipline, concerned with expanding the classical Data Mining
(DM) methods and developing new methods for discovering the
data that originate from educational systems.
Student attendance in higher education has always been dealt
with in a classical way, i.e. educators rely on counting the
occurrence of attendance or absence building their knowledge
about students as well as modules based on this count. This
method is neither credible nor does it necessarily provide a real
indication of a student’s performance.
This study tries to formulate the extracted knowledge in a
way that guarantees achieving accurate and credible results.
Student attendance data, gathered from the educational system,
were first cleaned in order to remove any randomness and noise,
then various attributes were studied so as to highlight the most
significant ones that affect the real attendance of students. The
next step was to derive an equation that measures the Student
Attendance’s Credibility (SAC) considering the attributes
chosen in the previous step. The reliability of the newly
developed measure was then evaluated in order to examine its
consistency. Finally, the J48 DM classification technique was
utilized in order to classify modules based on the strength of
their SAC values.
Results of this study were promising, and credibility values
achieved using the newly derived formula gave accurate,
credible, and real indicators of student attendance, as well as
accurate classification of modules based on the credibility of
student attendance on those modules.
Index Terms—EDM, credibility, reliability, student
attendance, higher education.
I. INTRODUCTION
Student attendance in higher education is an important
issue as it has been shown to directly affect students’
performance [1], In order to consider student attendance as a
criterion for estimating students’ performance, student
attendance data should be represented by a form that reflects
the real weight of student attendance rather than the number
of attendance occurrences, because of the fact that previous
studies that considered investigating students’ attendance
have either considered the number of attendance occurrences
as it is, or used its average value without relating these values
to any other factors that may represent the real student
attendance. On the other hand, those studies intended to use
student attendance data without preparation that can neither
be reliable nor credible. Therefore, the Student Attendance’s
Credibility (SAC) should be taken into consideration.
The credibility in research involves establishing that the
Manuscript received March 23, 2017; revised May 21, 2017.
The authors are with the Loughborough University, Epinal Way,
Loughborough Leicestershire, UK (e-mail: [email protected], [email protected], [email protected]).
results of research are credible or believable. It is a term that
when incorporated with other terms like: Transferability,
Dependability, and Confirmability, can be used to replace
‘reliability’ and ‘validity’, which are usually linked to
quantitative research [2]. On one hand, the reliability refers to
the ability to measure the attributes of a variable or construct
consistency; while on the other hand, the validity is the extent
to which the measurement of a concept is done accurately [3].
SAC represents a measure that can determine how much
credible student attendance is for each class during the
semester.
Hence, the ability to measure SAC is crucial in educational
environments since it can accurately evaluate the weight of
student attendance compared to his/her number of attendance
occurrences. By measuring SAC for each module and
comparing it to the same student’s SAC of other modules, the
performance of the student can then be evaluated and
compared to his/her performance in other semesters. SAC is
based on various factors that will be described in detail later
in this paper.
By measuring SAC for each module he/she attends,
modules can be classified using data mining classification
techniques depending on SAC values tied to the module.
Data mining is exploration and analysis, by automatic or
semi-automatic means, of large quantities of data in order to
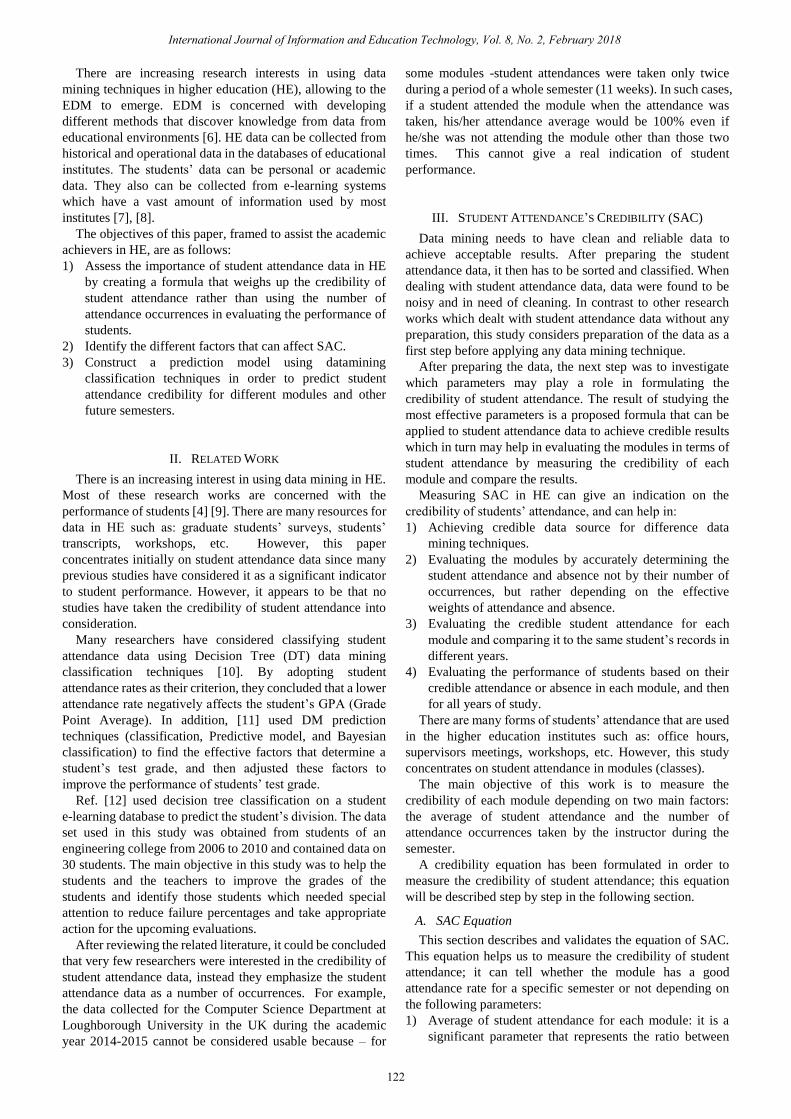
discover meaningful patterns [4]. Fig. 1 shows the process of
data mining.
Fig. 1. Levels of the data processes [5].
Figure 1 shows that in order to start mining the data, one
should select the target data from the database. Then,
preprocess the target data to get the transformed data. Finally,
mine the data to get the proposed knowledge.
In terms of data preprocessing, the initial attendance data
used in this study were random, noisy and needed to be
cleaned. If the data were not processed and unchanged, it
would have been impossible to achieve logical results since
the technique to be applied would never comprehend such
data.
Based on that, an extensive research was undertaken on
this field in order to investigate the existence of any related
works that considered cleaning the attendance and absence
data. The majority of those research works either neglected
these data or used the data without cleaning or modification.
Measuring the Credibility of Student Attendance Data in
Higher Education for Data Mining
International Journal of Information and Education Technology, Vol. 8, No. 2, February 2018
121doi: 10.18178/ijiet.2018.8.2.1020
Mohammed Alsuwaiket, Christian Dawson, and Firat Batmaz
There are increasing research interests in using data
mining techniques in higher education (HE), allowing to the
EDM to emerge. EDM is concerned with developing
different methods that discover knowledge from data from
educational environments [6]. HE data can be collected from
historical and operational data in the databases of educational
institutes. The students’ data can be personal or academic
data. They also can be collected from e-learning systems
which have a vast amount of information used by most
institutes [7], [8].
The objectives of this paper, framed to assist the academic
achievers in HE, are as follows:
1) Assess the importance of student attendance data in HE
by creating a formula that weighs up the credibility of
student attendance rather than using the number of
attendance occurrences in evaluating the performance of
students.
2) Identify the different factors that can affect SAC.
3) Construct a prediction model using datamining
classification techniques in order to predict student
attendance credibility for different modules and other
future semesters.
II. RELATED WORK
There is an increasing interest in using data mining in HE.
Most of these research works are concerned with the
performance of students [4] [9]. There are many resources for
data in HE such as: graduate students’ surveys, students’
transcripts, workshops, etc. However, this paper
concentrates initially on student attendance data since many
previous studies have considered it as a significant indicator
to student performance. However, it appears to be that no
studies have taken the credibility of student attendance into
consideration.
Many researchers have considered classifying student
attendance data using Decision Tree (DT) data mining
classification techniques [10]. By adopting student
attendance rates as their criterion, they concluded that a lower
attendance rate negatively affects the student’s GPA (Grade
Point Average). In addition, [11] used DM prediction
techniques (classification, Predictive model, and Bayesian
classification) to find the effective factors that determine a
student’s test grade, and then adjusted these factors to
improve the performance of students’ test grade.
Ref. [12] used decision tree classification on a student
e-learning database to predict the student’s division. The data
set used in this study was obtained from students of an
engineering college from 2006 to 2010 and contained data on
30 students. The main objective in this study was to help the
students and the teachers to improve the grades of the
students and identify those students which needed special
attention to reduce failure percentages and take appropriate
action for the upcoming evaluations.
After reviewing the related literature, it could be concluded
that very few researchers were interested in the credibility of
student attendance data, instead they emphasize the student
attendance data as a number of occurrences. For example,
the data collected for the Computer Science Department at
Loughborough University in the UK during the academic
year 2014-2015 cannot be considered usable because – for
some modules -student attendances were taken only twice
during a period of a whole semester (11 weeks). In such cases,
if a student attended the module when the attendance was
taken, his/her attendance average would be 100% even if
he/she was not attending the module other than those two
times. This cannot give a real indication of student
performance.
III. STUDENT ATTENDANCE’S CREDIBILITY (SAC)
Data mining needs to have clean and reliable data to
achieve acceptable results. After preparing the student
attendance data, it then has to be sorted and classified. When
dealing with student attendance data, data were found to be
noisy and in need of cleaning. In contrast to other research
works which dealt with student attendance data without any
preparation, this study considers preparation of the data as a
first step before applying any data mining technique.
After preparing the data, the next step was to investigate
which parameters may play a role in formulating the
credibility of student attendance. The result of studying the
most effective parameters is a proposed formula that can be
applied to student attendance data to achieve credible results
which in turn may help in evaluating the modules in terms of
student attendance by measuring the credibility of each
module and compare the results.
Measuring SAC in HE can give an indication on the
credibility of students’ attendance, and can help in:
1) Achieving credible data source for difference data
mining techniques.
2) Evaluating the modules by accurately determining the
student attendance and absence not by their number of
occurrences, but rather depending on the effective
weights of attendance and absence.
3) Evaluating the credible student attendance for each
module and comparing it to the same student’s records in
different years.
4) Evaluating the performance of students based on their
credible attendance or absence in each module, and then
for all years of study.
There are many forms of students’ attendance that are used
in the higher education institutes such as: office hours,
supervisors meetings, workshops, etc. However, this study
concentrates on student attendance in modules (classes).
The main objective of this work is to measure the
credibility of each module depending on two main factors:
the average of student attendance and the number of
attendance occurrences taken by the instructor during the
semester.
A credibility equation has been formulated in order to
measure the credibility of student attendance; this equation
will be described step by step in the following section.
A. SAC Equation
This section describes and validates the equation of SAC.
This equation helps us to measure the credibility of student
attendance; it can tell whether the module has a good
attendance rate for a specific semester or not depending on
the following parameters:
1) Average of student attendance for each module: it is a
significant parameter that represents the ratio between
International Journal of Information and Education Technology, Vol. 8, No. 2, February 2018
122

International Journal of Information and Education Technology, Vol. 8, No. 2, February 2018
123
the number of students attended at a certain week in each
module to the number of registered students in each
module. Hence it is a variable parameter that relies on
both numbers.
2) Number of attendance occurrences taken by the
instructor for each module per semester: this significant
parameter represents the number of attendance
occurrences taken by instructor, and its significance
comes from the fact that no information of the student
attendance will be available whether the students really
attended the module or not.
3) Total number of weeks per semester: a variable
parameter, depending on the system of each school, and
it should be part of the equation since it is connected
directly to both the number of attendance occurrences
taken by instructor, and the average of student attendance
for each module.
1) Average of student attendance
As mentioned earlier, the average of student attendance
depends on two factors: number of students attended at
certain week and the number of registered students at each
module. Number of students registered on a module is given,
hence let us assume that:
X= Number of students attended on a certain week at a
module
Y= Number of registered students at a module
- Number of weeks starting with 1 until the last week (n)
By dividing X over Y, we can obtain the ratio of
attendance for one week only. Therefore, by considering the
summation of this value throughout the semester multiplied
by 100%, we can calculate the average percentage of student
attendance for the whole semester.
To find the average of student attendance, we have to use
the following equation:
Average of Student Attendance =∑ (𝑋
𝑌) ∗ 100%
𝑛
𝑤𝑒𝑒𝑘=1
(1)
Note: the number of registered students in a module must
be more than zero (otherwise there would be no module),
therefore:
Y≠0
Note: Number of students attended at a certain week in
such module must be less or equal to the number of registered
students in such module, therefore:
X ≤ Y
Average ∈ [0-100%]
We conclude that the more students attend at a certain
week will give a better average of attendance (closer to
100%).
2) Credibility of student attendance
In order to measure SAC for each module, three
parameters should be considered: the average value of
student attendance should be calculated for each module; the
number of attendance occurrences taken by the instructor for
each module; and, finally, the total number of weeks for each
semester. Let us assume that:
SAC: Student Attendance’s Credibility for each module
A: Average of student attendance for each module
C1: Number of attendance occurrences taken by instructor
for each module
C2: Total number of weeks for each semester
Using the above notations, equation 2 can be derived,
which measures SAC based on A, C1, and C2. The result will
always be always a number between 0 and 1. The purpose of
finding SAC of each module is to find which module has a
good attendance rate compared to other modules. The values
of the average student attendance for each module, the
number of attendance occurrences taken by instructor for
each module and the total number of weeks for each semester
are affecting SAC value.
SAC= 1
100(𝐴 ∗ 𝑐1
𝑐2) (2)
We can simplify the previous equation to be:
SAC= 𝐴 𝑐1
100 𝑐2
𝐴
100∗
𝑐1
𝑐2 , But A ∈ [0-100]
Let us assume that Z1 denotes the attendance average
divided by 100 (the left hand side of the multiplication)
Z1= 𝐴
100
Z1 ∈ [0-1]
And, Let us assume that Z2, which is a ratio representing
the instructor’s overall recording of student attendance
throughout the semester, denotes the number of attendance
occurrences taken by instructor for each module divided by
the total number of weeks for each semester (right hand-side
of the multiplication)
Z2= 𝑐1
𝑐2
Z2 ∈ [0-1]
Therefore, the more attendance occurrences taken by
instructor the closer to 1 Z2 will approach.
0 ≤ Z1 & Z2 ≤ 1
The closer to 1 Z1 and Z2 are approaching, the more
reliable the student attendance is (i.e. R approaches 1).
By taking the limits of the credibility equation when the
number of weeks approaches n, equation (3), and when the
number of attendance occurrences taken by instructor for
each week approaches the number of weeks per semester (i.e.
if the instructor is taking the attendance each time throughout
the semester) and, at the same time, when the average value
of student attendance is approaching 100% (i.e. when the
number of students attending a certain modules is equal the
number of registered students at the same module) as in
equation (4).
International Journal of Information and Education Technology, Vol. 8, No. 2, February 2018
124
(Lim c2→ ∞𝐴 𝑐1
100 𝑐2= 0) (3)
(Lim c1→ c2 & A→ 100 𝐴 𝑐1
100 𝑐2= 1) (4)
From equations 3 and 4, it is clear that when the number of
weeks increases while fixing the values of A, and C1, the
limit of SAC will approach 0, which means that in order to
achieve higher credibility (i.e. =1) C1 and C2 must be equal
(i.e. instructor must consider taking attendance every week
during the semester), and A must be equal to 100 (i.e. number
of students attending every week equals to number of
students registered at the module).
As an example, by applying equation 2 on three different
computer science modules (subjects) - given the codes:
14COC180, 14COA105, and 14COF180 -that represent a
sample from the 59 modules’ data that were gathered from
Computer Science undergraduates of Loughborough
University in the UK during the years 2014-2015. We have
found that the first module (in this case, 14COC180) has a
SAC ratio of 0.067, the second module (14COA105) has a
SAC value of 0.349, and the third module (14COF180) has a
SAC value of 0.812. We conclude that the first module has
the lowest credibility because its value is the smallest and that
could be caused by different reasons, such as low number of
attendance occurrences taken by the instructor for this
module, or low number of students attending the module in a
certain week compared to total number of students registered
on this module (i.e. low average). The third module has the
highest credibility, while the second module has medium
credibility.
In order to distinguish between SAC and the occurrence of
student’s attendance at a certain module, values of SAC at
each module should be compared. For example, in module
14COC180, the attendance of the student was 100% knowing
that the instructor took the attendance only once during the
whole semester. Therefore, the value of 100% will not reflect
the real attendance of the student since the module’s SAC is
very low 0.067. In the second module (14COA105), the
attendance of the student was 50% knowing that the
instructor took the attendance seven times and that also does
not reflect the real attendance because the module’s SAC is
0.349. On the other hand, third module (14COF180), the
attendance of the student was 70% knowing that the
instructor took the attendance eleven times (out of eleven
weeks: total number of weeks in this semester). The 70%
SAC ratio now reflects the real attendance because the
module’s SAC is high 0.812 and Z2=1. This draws a
conclusion that the higher the SAC, the more accurate the
student attendance value will be.
Based on the above, SAC can be seen as an equation that
not only takes into account the students' role as an indicator
of their attendance, but also the instructor's role: the student's
role is represented by A since it measures the student average
attendance throughout the semester, while the instructor's
role is represented by Z2 which refers to the ratio of taking
attendance for the whole semester. That is, a perfect A does
not reflect the student's real attendance unless it is
complemented with a perfect Z2, and vice versa.
B. Reliability of SAC
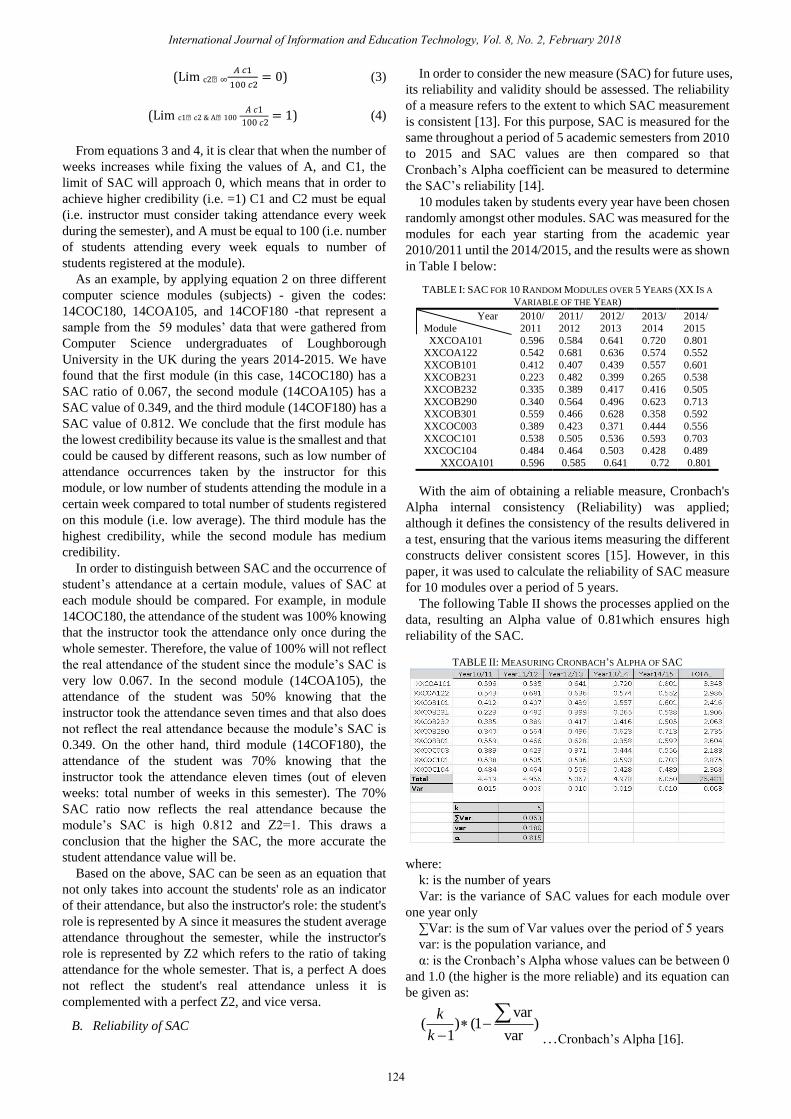
In order to consider the new measure (SAC) for future uses,
its reliability and validity should be assessed. The reliability
of a measure refers to the extent to which SAC measurement
is consistent [13]. For this purpose, SAC is measured for the
same throughout a period of 5 academic semesters from 2010
to 2015 and SAC values are then compared so that
Cronbach’s Alpha coefficient can be measured to determine
the SAC’s reliability [14].
10 modules taken by students every year have been chosen
randomly amongst other modules. SAC was measured for the
modules for each year starting from the academic year
2010/2011 until the 2014/2015, and the results were as shown
in Table I below:
TABLE I: SAC FOR 10 RANDOM MODULES OVER 5 YEARS (XX IS A
VARIABLE OF THE YEAR)
Year
Module
2010/
2011
2011/
2012
2012/
2013
2013/
2014
2014/
2015
XXCOA101 0.596 0.584 0.641 0.720 0.801
XXCOA122 0.542 0.681 0.636 0.574 0.552
XXCOB101 0.412 0.407 0.439 0.557 0.601
XXCOB231 0.223 0.482 0.399 0.265 0.538
XXCOB232 0.335 0.389 0.417 0.416 0.505
XXCOB290 0.340 0.564 0.496 0.623 0.713
XXCOB301 0.559 0.466 0.628 0.358 0.592
XXCOC003 0.389 0.423 0.371 0.444 0.556
XXCOC101 0.538 0.505 0.536 0.593 0.703
XXCOC104 0.484 0.464 0.503 0.428 0.489
XXCOA101 0.596 0.585 0.641 0.72 0.801
With the aim of obtaining a reliable measure, Cronbach's
Alpha internal consistency (Reliability) was applied;
although it defines the consistency of the results delivered in
a test, ensuring that the various items measuring the different
constructs deliver consistent scores [15]. However, in this
paper, it was used to calculate the reliability of SAC measure
for 10 modules over a period of 5 years.
The following Table II shows the processes applied on the
data, resulting an Alpha value of 0.81which ensures high
reliability of the SAC.
TABLE II: MEASURING CRONBACH’S ALPHA OF SAC
where:
k: is the number of years
Var: is the variance of SAC values for each module over
one year only
∑Var: is the sum of Var values over the period of 5 years
var: is the population variance, and
α: is the Cronbach’s Alpha whose values can be between 0
and 1.0 (the higher is the more reliable) and its equation can
be given as:
var( ) (1 )
1 var
k
k
…Cronbach’s Alpha [16].

International Journal of Information and Education Technology, Vol. 8, No. 2, February 2018
125
Based on the above results, it can be concluded that the
newly proposed measure (SAC) can be relied on when
dealing with student attendance data; hence it can be
considered as a reliable measure.
IV. CLASSIFYING SAC
The aim of classifying SAC is to identify the attributes that
can affect the final SAC values. In other words, the
classification process will highlight the attributes that
significantly affect the module’s SAC.
In this paper, data set was analyzed using J48 decision tree
classification technique. The J48 DT technique is
characterized by the ease of rules generation and ease of
understanding. The J48 DT works as follows: In order to
classify a new data item, firstly, a DT has to be created based
on the attribute values of the available training data (i.e. 70%
out of the available 59 modules’ data). It uses the fact that
each attribute of the data can be used to make a decision by
splitting the data into smaller subsets. J48 examines the
normalized information gain that results from choosing an
attribute for splitting the data. The J48 makes the decision by
using the attribute with the highest normalized information
gain. Then the algorithm recurs on the smaller subsets [17].
In this paper, the J48 recursively split the tree based on
choosing the Average Student Attendance as the attribute
with the highest normalized gain. In fact, for each iteration,
the J48 examines the information gain for all the attributes
again, and then chooses the one with the highest information
gain as follows:
The information gain can be given as:
where p is the probability of the attribute [18].
Hence, by examining any data record (i.e. set of attributes)
against the above formula, the J48 ranks the independent
attributes based on their information gain as shown in Table
III below:
TABLE III: SELECTED ATTRIBUTES AND THEIR INFORMATION GAIN
Attribute Information Gain
attend_avg 2.357
reg_modulecode 2.352
attend_taken 0.728
reg_semester 0.138
Therefore, it can be clearly shown that the J48 has chosen
the Average Student Attendance for its relatively high
information gain.
In order to apply this technique following steps are
performed in sequence:
A. Data Selection and Transformation
In this step, only the attributes that are required for
processing with data mining were selected. The selection was
based on the value those attributes add. In other words, some
attributes add no value to the measurement per se, like the
Module Date or Attendance Reason, hence they were
neglected since it is not crucial to determine the average
student attendance, for example, for attendance occurrences
that have certain reason, all occurrences count. On the
contrary, other attributes represent the base of the
measurement, such as the Attendance Status. All related
variables derived from the database are given in Table IV.
The table shows the selected variables and their possible
values; the attend_avg denotes the Average of Student
Attendance, whose value can be calculated using equation 1,
attend_taken represent the number of occurrences the
instructor has taken the attendance. Its values range from 1 to
11 times, where 11 is the maximum number of weeks during
which the instructor may take attendance. SAC is a value that
can be calculated using equation 2, and its values range from
0-1. SAC_Strength is derived directly from the SAC values
in a way J48 can handle the SAC as nominal values. That is,
in order to overcome one of the main drawbacks of using J48,
which is the fact that it does not classify numerical values,
SAC (i.e. numerical) had to be represented as nominal values
in order to be classified properly by the J48 algorithm. Table
V below shows the nominal representation of SAC.
TABLE IV: STUDENT RELATED VARIABLES
Variable Description Possible Values
Module_code Module code All Modules codes
attend_avg Average of Student
Attendance
0 – 100 (%)
attend_taken Number of student
attendance occurrences taken
by instructor
1-11(times)
SAC Student Attendance’s
Credibility
0.0 – 1.0
sem_no Semester number 1, 2
SAC_Strength Strength of Credibility
(Nominal)
1- 10
TABLE V: NOMINAL REPRESENTATION OF CREDIBILITY
SAC
(Numeric)
Strength of SAC
(Nominal)
[0 – 0.1) 1
[0.1 – 0.2) 2
[0.2 - 0.3) 3
[0.3 – 0.4) 4
[0.4 – 0.5) 5
[0.5 – 0.6) 6
[0.6 – 0.7) 7
[0.7 – 0.8) 8
[0.8 – 0.9) 9
[0.9 – 1.0] 10
B. Classification Process
Table IV shows a number of variables through which the
J48 built the decision tree. All variables, except for SAC are
independent variables, whereas SAC is a dependent variable.
As mentioned before, the J48 will start by examining the
normalized information gain for each of the independent
variables and by doing so, it recursively splits the tree into
branches. As an example, the J48 starts examining the
information gain of each of the attributes, starting with
Average Attendance.
V. RESULTS AND DISCUSSION
The results of the training test using J48 Decision Tree
showing that when the output is the SAC_Strength; the
correctly classified instances (Accuracy) is 88.9 %, the
incorrectly classified instances is 11.1 %, and the Root mean
squared error is 0.1337.
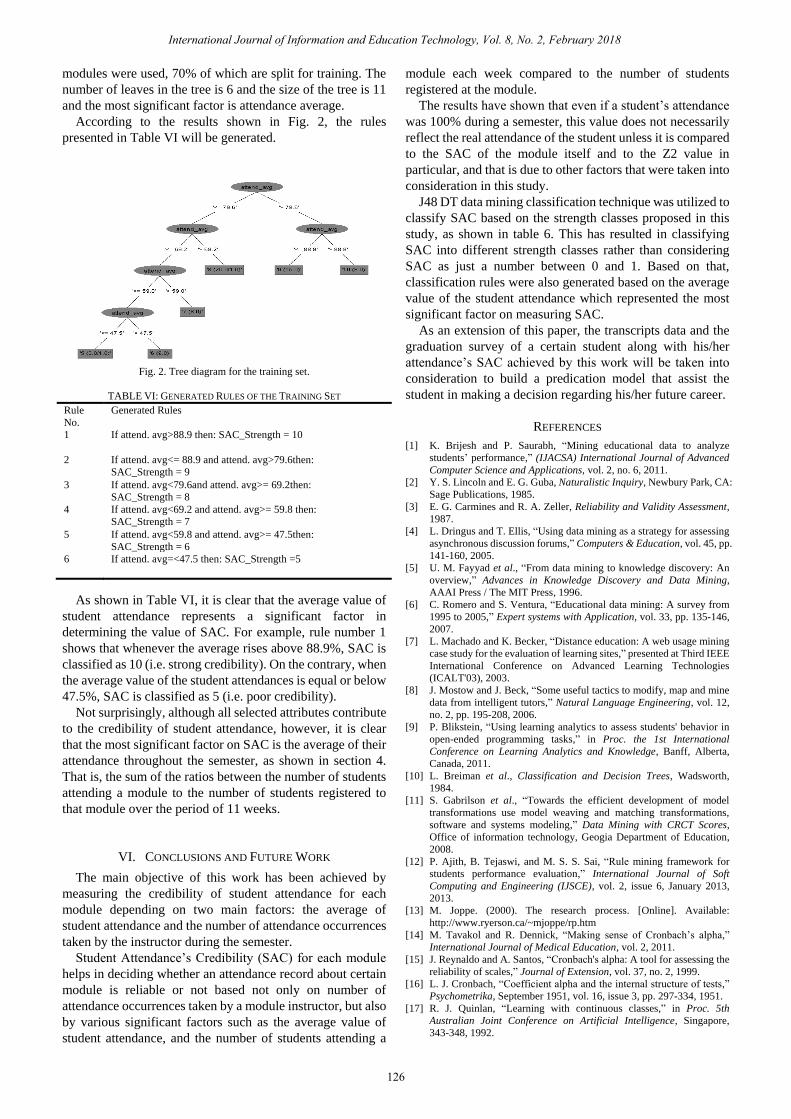
Figure 2 shows the tree diagram for the training set when
the output is the SAC_Strength. As mentioned earlier, 59
International Journal of Information and Education Technology, Vol. 8, No. 2, February 2018
126
modules were used, 70% of which are split for training. The
number of leaves in the tree is 6 and the size of the tree is 11
and the most significant factor is attendance average.
According to the results shown in Fig. 2, the rules
presented in Table VI will be generated.
Fig. 2. Tree diagram for the training set.
TABLE VI: GENERATED RULES OF THE TRAINING SET
Rule
No.
Generated Rules
1 If attend. avg>88.9 then: SAC_Strength = 10
2 If attend. avg<= 88.9 and attend. avg>79.6then:
SAC_Strength = 9
3 If attend. avg<79.6and attend. avg>= 69.2then:
SAC_Strength = 8
4 If attend. avg<69.2 and attend. avg>= 59.8 then:
SAC_Strength = 7
5 If attend. avg<59.8 and attend. avg>= 47.5then:
SAC_Strength = 6
6 If attend. avg=<47.5 then: SAC_Strength =5
As shown in Table VI, it is clear that the average value of
student attendance represents a significant factor in
determining the value of SAC. For example, rule number 1
shows that whenever the average rises above 88.9%, SAC is
classified as 10 (i.e. strong credibility). On the contrary, when
the average value of the student attendances is equal or below
47.5%, SAC is classified as 5 (i.e. poor credibility).
Not surprisingly, although all selected attributes contribute
to the credibility of student attendance, however, it is clear
that the most significant factor on SAC is the average of their
attendance throughout the semester, as shown in section 4.
That is, the sum of the ratios between the number of students
attending a module to the number of students registered to
that module over the period of 11 weeks.
VI. CONCLUSIONS AND FUTURE WORK
The main objective of this work has been achieved by
measuring the credibility of student attendance for each
module depending on two main factors: the average of
student attendance and the number of attendance occurrences
taken by the instructor during the semester.
Student Attendance’s Credibility (SAC) for each module
helps in deciding whether an attendance record about certain
module is reliable or not based not only on number of
attendance occurrences taken by a module instructor, but also
by various significant factors such as the average value of
student attendance, and the number of students attending a
module each week compared to the number of students
registered at the module.
The results have shown that even if a student’s attendance
was 100% during a semester, this value does not necessarily
reflect the real attendance of the student unless it is compared
to the SAC of the module itself and to the Z2 value in
particular, and that is due to other factors that were taken into
consideration in this study.
J48 DT data mining classification technique was utilized to
classify SAC based on the strength classes proposed in this
study, as shown in table 6. This has resulted in classifying
SAC into different strength classes rather than considering
SAC as just a number between 0 and 1. Based on that,
classification rules were also generated based on the average
value of the student attendance which represented the most
significant factor on measuring SAC.
As an extension of this paper, the transcripts data and the
graduation survey of a certain student along with his/her
attendance’s SAC achieved by this work will be taken into
consideration to build a predication model that assist the
student in making a decision regarding his/her future career.
REFERENCES
[1] K. Brijesh and P. Saurabh, “Mining educational data to analyze
students’ performance,” (IJACSA) International Journal of Advanced
Computer Science and Applications, vol. 2, no. 6, 2011.
[2] Y. S. Lincoln and E. G. Guba, Naturalistic Inquiry, Newbury Park, CA:
Sage Publications, 1985.
[3] E. G. Carmines and R. A. Zeller, Reliability and Validity Assessment,
1987.
[4] L. Dringus and T. Ellis, “Using data mining as a strategy for assessing
asynchronous discussion forums,” Computers & Education, vol. 45, pp.
141-160, 2005.
[5] U. M. Fayyad et al., “From data mining to knowledge discovery: An
overview,” Advances in Knowledge Discovery and Data Mining,
AAAI Press / The MIT Press, 1996.
[6] C. Romero and S. Ventura, “Educational data mining: A survey from
1995 to 2005,” Expert systems with Application, vol. 33, pp. 135-146,
2007.
[7] L. Machado and K. Becker, “Distance education: A web usage mining
case study for the evaluation of learning sites,” presented at Third IEEE
International Conference on Advanced Learning Technologies
(ICALT'03), 2003.
[8] J. Mostow and J. Beck, “Some useful tactics to modify, map and mine
data from intelligent tutors,” Natural Language Engineering, vol. 12,
no. 2, pp. 195-208, 2006.
[9] P. Blikstein, “Using learning analytics to assess students' behavior in
open-ended programming tasks,” in Proc. the 1st International
Conference on Learning Analytics and Knowledge, Banff, Alberta,
Canada, 2011.
[10] L. Breiman et al., Classification and Decision Trees, Wadsworth,
1984.
[11] S. Gabrilson et al., “Towards the efficient development of model
transformations use model weaving and matching transformations,
software and systems modeling,” Data Mining with CRCT Scores,
Office of information technology, Geogia Department of Education,
2008.
[12] P. Ajith, B. Tejaswi, and M. S. S. Sai, “Rule mining framework for
students performance evaluation,” International Journal of Soft
Computing and Engineering (IJSCE), vol. 2, issue 6, January 2013,
2013.
[13] M. Joppe. (2000). The research process. [Online]. Available:
http://www.ryerson.ca/~mjoppe/rp.htm
[14] M. Tavakol and R. Dennick, “Making sense of Cronbach’s alpha,”
International Journal of Medical Education, vol. 2, 2011.
[15] J. Reynaldo and A. Santos, “Cronbach's alpha: A tool for assessing the
reliability of scales,” Journal of Extension, vol. 37, no. 2, 1999.
[16] L. J. Cronbach, “Coefficient alpha and the internal structure of tests,”
Psychometrika, September 1951, vol. 16, issue 3, pp. 297-334, 1951.
[17] R. J. Quinlan, “Learning with continuous classes,” in Proc. 5th
Australian Joint Conference on Artificial Intelligence, Singapore,
343-348, 1992.

International Journal of Information and Education Technology, Vol. 8, No. 2, February 2018
127
[18] E. T. Jaynes, “Information theory and statistical mechanics,”
Department of physics, Stanford University, Stanford, California,
1956.
D.
Christian
is with the Loughborough University,
Epinal Way, Loughborough Leicestershire, UK. LE11
3TU.
He is a senior lecturer in the Department of
Computer Science at Loughborough University. He
joined the Department in October 1999 from the
University of Derby (1993 -
1999) where he began as a
lecturer and moved on to become a School Reader. His
research
interests
are
primarily in the application and
development of artificial neural networks to rainfall-runoff modelling and
flood forecasting (neurohydrology) although he also involved in research
and consultancy in software project
management.
Dr. Dawson
is an editorial board member of Computational Intelligence
and Neuroscience, External Examiner -
Nottinngham Trent University, UK 0
undergraduate degree programmes in Computer Science, DMIN Programme
Committee Member - 10th International Conference on Data Mining, Las
Vegas, 21-24 July, 2014., Elected member of the IACCS Board
(International Association of Computer Science in Sport)., and DMIN
Programme Committee Member - 9th International Conference on Data
Mining, Las Vegas, 22-25 July, 2013.
B. Firat delivered the computer science BSc degree
foundation subjects at London Meridian College
between 1997 and 2001. He received a BSc degree
from Computer Engineering Department of Ege
University, Izmir, Turkey in 1997. He obtained a
database systems MSc degree from University of
Westminster in 2002 and a PhD degree from the
Department of Computer Science, Loughborough
University in 2011.
He has been a university teacher at Department of Computer Science,
Loughborough University since 2007. He was a visiting lecturer at School of
Electronics and Computer Science, University of Westminster, London
before he is employed by Loughborough University as a teaching assistant in
2003.
Dr. Batmaz is co-ordinator of Erasmus, Widening Parcitipation, Part A
Tutor, and Member of the Software Based Systems (SBS) interest group.
Mohammed Alsuwaiket got the bachelor degree from University of
Bradford, UK, 2006, in information technology management; the master
degree from University of Hertfordshire, UK, 2012, in computer science;
and the PhD student, University of Loughborough, UK, in computer science.