Assessing Users' Perceptions on how to Improve Public Services Quality
Upload
khangminh22Category
view
0download
0
GLOBAL JOURNAL OF BUSINESS RESEARCH ♦ VOLUME 4 ♦ NUMBER 1 ♦ 2010
MEASURING SERVICE QUALITY: PERCEPTIONS OF EMPLOYEES
Prabha Ramseook-Munhurrun, University of Technology, Mauritius Perunjodi Naidoo, University of Technology, Mauritius
Soolakshna Desai Lukea-Bhiwajee, University of Technology, Mauritius
ABSTRACT The purpose of this paper was to assess the service quality of a call centre as perceived by its employees using the SERVQUAL model. The paper focused on employees as internal customers and the critical role employees play in the delivery of quality service. The dimensions predicting front-line employee satisfaction and loyalty were explored. Data was collected by field study in a particular call centre in Mauritius using a modified SERVQUAL questionnaire. The study examined both perception and expectation levels of front-line employees. Regression models were used to test the influence of service quality dimensions on satisfaction and loyalty. The results indicated that loyalty was best predicted by overall satisfaction, tangibles and responsiveness. This study contributes to the understanding of service quality, satisfaction and employees’ loyalty within a business process outsourcing organization. JEL: M31 Keywords: Employee, Satisfaction, Loyalty, SERVQUAL, Call Centre, Mauritius INTRODUCTION
he worldwide Business Process Outsourcing (BPO) market is growing rapidly and in Mauritius this sector is expected to grow into the fifth pillar of its economy. The country is aiming to become a cyber island so as to meet the demands of an ever changing economic environment. The
Information Technology Enabling Services (ITES)-BPO industry in Mauritius is a relatively young and nascent sector, barely over five years old. The workforce in the ITES-BPO sector has recorded an increase of 26.2% over the period of 2006-2007 with the call centre industry still the highest generator of employment (Board of Investment, 2007). Since 2006, the government strategy is to attract higher value-added activities in the ITES-BPO field and generate $1 billion revenue from this sector. The government objective is also to expand and create as many as 20,000 jobs in the sector by 2008. To achieve the set goals, it is essential for this sector to effectively manage its resources. In today’s competitive markets, service organizations are continuously exploring different ways to gain sustainable competitive advantage. In the services marketing research, quality has received considerable attention has been to satisfaction and loyalty. Despite numerous studies linking service quality to customer satisfaction and customer loyalty, little empirical work has been done in assessing employee satisfaction and loyalty. Front-line employees (FLE) in call centre perform a crucial role in the delivery of frontline services, which is fundamental to the management of customer relationships (Frenkel et al., 1998). Although the call centre industry is growing at a rapid rate, yet little is known about employee satisfaction with respect to service quality within this industry. Previous studies have observed that employee commitment and high levels of employees’ turnover are issues of great concern in call centers (Deery, Iverson and Walsh, 2002; Malhotra and Mukherjee, 2004). Therefore it is essential to measure the perceptions of FLE in a service setting. Despite the large amount of research examining customer service, little attention has centered on the employees who are responsible for customer service processes in the service industries. Gabbott and Hogg (1998) suggested that the quality of the service encounter involves
T
47

P. Ramseook-Munhurrun et al Global Journal of Business Research ♦ Vol. 4 ♦ No. 1 ♦ 2010
two significant elements: service personnel and the service setting. Thus the purpose of this paper is to evaluate service quality and satisfaction among FLE in a particular call centre in Mauritius. More specifically, this study seeks: (1) to measure employees’ expectations and perceptions of service quality based on the SERVQUAL model and (2) to examine service quality dimensions in predicting satisfaction and loyalty among FLE in call centre in Mauritius. This paper provides a brief review on service quality, employee satisfaction and loyalty, followed by the research methodology and main results of the study. Finally conclusions and further research are outlined. SERVICE QUALITY Delivering quality service is considered to be an important strategy for success in today’s competitive environment (Parasuraman et al., 1985; Reichheld and Sasser, 1990; Zeithaml et al., 1990, 1996). According to Grönroos (1988), service quality is commonly defined as a discrepancy between the service quality that is delivered by the organization and the service performance that employees expect. Conceptually, service quality is defined as global judgment or attitude relating to the overall excellence or superiority of the service (Parasuraman et al., 1988). Parasuraman et al. (1985) developed the framework for measuring service quality, the gap theory. SERVQUAL is the most widely utilized tool for measuring service quality (Parasuraman et al., 1988; 1994; Sureshchandar et al., 2001; Chiu, 2002) and its application continues to increase in different service settings, such as banks (Jabnoun and Al-Tamimi, 2003), hospitality industry (Saleh and Ryan, 1992), health sector (Arasli et al., 2008), education (Tan and Kek, 2004) and travel and tourism (Fick and Ritchie, 1991). The service quality model examines the discrepancy between the expectations and perceptions and is often referred to as a disconfirmation model (Oliver, 1980; Bitner, 1990). The initial 10 categories were (1) reliability; (2) responsiveness; (3) competence; (4) access; (5) courtesy; (6) communication; (7) credibility; (8) security; (9) understanding/ knowing; and (10) tangibles (Parasuraman et al., 1988). In 1988, they refined the SERVQUAL dimensions which collapsed to five dimension as follows: Tangibles (physical facilities, equipment, and appearance of personnel), Reliability (ability to perform the promised service dependably and accurately), Responsiveness (willingness to help customers and provide prompt service), Assurance (knowledge and courtesy of employees and their ability to inspire trust and confidence), and Empathy (caring, individualized attention the firm provides its customers). The SERVQUAL instrument for measuring service quality has been subjected to a number of criticisms. Researchers have criticized the SERVQUAL dimensions (Crompton and MacKay, 1989; Taylor et al., 1993 and Babakus and Boller, 1992) and they argued that the dimensions change with the type of service. Researches (Cronin and Taylor, 1992; Teas, 1993) have argued that there is no real evidence to support the concept of performance minus expectations gap as a basis for measuring service quality. Despite the criticisms, Parasuraman et al. (1991; 1994) contended that the SERVQUAL scale using the expectation/performance gaps method is a much richer approach to measuring service quality. Relationship between Service Quality and Satisfaction Studies in services marketing have shown that service quality and satisfaction are closely related constructs (Cronin and Taylor, 1992; Oliver, 1993; Babakus et al., 2004). Employee satisfaction is an important factor in determining service quality (Zeithaml et al., 1990). Satisfied employees are more committed to continuous improvement and quality (Matzler et al., 2004), thus they are also more committed to delivering quality service. However, the interactive nature of service delivery places service employees in a very critical role in the delivery of quality services (Zeithaml and Bitner, 2000). Numerous studies also show that satisfied employees are highly motivated, have good morale at work, and work more effectively and efficiently (Eskildsen and Dahlgaard, 2000; Yoon and Suh, 2003). Research by Reichheld and Sasser (1990) suggest that the higher the degree of employee satisfaction, the greater the chance of customer satisfaction and customer retention. According to Schmit and Allscheid
48

GLOBAL JOURNAL OF BUSINESS RESEARCH ♦ VOLUME 4 ♦ NUMBER 1 ♦ 2010
(1995) satisfied employees will engage in better service delivery. Yoon, Beatty, and Suh (2001) found a significant linkage between front-line bank employees’ satisfaction and customer-perceived service performance. Yee et al. (2008) empirically examined employee satisfaction through a survey of service shops in Hong Kong and found that employee satisfaction is significantly related to service quality and customer satisfaction, while the latter in turn influenced firms profitability. Employee satisfaction should not be ignored, yet very few businesses seriously consider employee satisfaction. According to Allred (2001) the most difficult step to service quality improvement usually involves developing consistent service performance from front-line employees. This study therefore is interested in investigating employee satisfaction as a function of service quality perceived by front-liners. Relationship between Service Quality, Satisfaction and Loyalty Service quality has been related to customer satisfaction and loyalty. Satisfaction often plays a mediating role between customer perceptions of service quality and the creation of behavioral intentions (Cronin and Taylor, 1992; Boulding et al., 1993; Cronin, Brady and Hult, 2000). According to Zeithaml et al. (1996), behavioral intentions can be measured by repurchase intentions, word-of-mouth, loyalty, complaining behavior and price sensitivity. Customer loyalty can be defined and assessed by both attitudinal and behavioral measures. In practice, it is difficult to observe and measure action loyalty. Most researchers employ behavioral intentions, to measure the compromise of loyalty (Yang and Peterson, 2004). This study focused on intentions to stay and willingness to recommend as specific forms of loyalty. Today service organizations are concerned in the delivery of quality service and the building of loyalty among employees and customers. If employees are not happy with the work, they are more readily to quit their jobs than satisfied employees. Researchers have found that satisfied employees are more likely to improve their job performance (Judge et al., 2001), be creative and cooperate with others because satisfaction is the inner force that drives employee behavior. Previous studies have suggested that loyal employees are more willing and capable of delivering a higher level of service quality (Loveman, 1998; Silvestro and Cross, 2000). According to Schneider and Bowen (1985; 1993) the efforts to promote service quality must be based on managing employee behaviors and training them in interpersonal skills in order to exhibit a true customer focus. Bitner et al. (1990) observed that in service encounters, employee behavior will impact on the customer perceptions of service quality. Zeithaml et al. (1990) argue that employees who are not suited to their jobs will not be able to deliver quality service. Consequently having the right employees will enhance the likelihood of success for any enterprise. It is therefore crucial to understand employees’ needs, demands and wishes and not only those of the customers (Edvardsson et al., 1997). Conversely, employee satisfaction can improve productivity, reduce staff turnover and enhance creativity and commitment. Employees who are satisfied have higher intentions of staying with an organization and recommending the organisation to others. However, although a substantial amount of service quality research has focused on service customers’ perceived service quality (Parasuraman et al., 1988; Carman, 1990; Parasuraman et al., 1991; Babakus and Boller, 1992; Cronin and Taylor, 1992), relatively little attention has been paid to exploring what factors impact on service employees’ behavior with regard to delivering service quality, and to articulating the predictors of employee behavior to service quality perception and satisfaction. RESEARCH METHODOLOGY Service quality from the employees’ perspective in call centre has not been widely researched. This study seeks to fill that gap by adapting the SERVQUAL model to explore the factors predicting call centre employee satisfaction and loyalty. The items incorporated in the SERVQUAL model were modified to collect data from FLE (Appendix 1). The service firm examined for this study was a call centre located in the Business Park at Ebene in Mauritius. The research design was based on Parasuraman et al. (1988) five dimensions of service quality: responsiveness, reliability, assurance, empathy and tangible. Some
49

P. Ramseook-Munhurrun et al Global Journal of Business Research ♦ Vol. 4 ♦ No. 1 ♦ 2010
modifications were made to the items as 19 items were selected out of the SERVQUAL 22 items in order to suit the call centre service setting and to measure the expectations, perceptions and satisfaction of internal service levels of front-line employees. Each item was reworded to capture internal rather than external service quality. The questionnaire consisted of three sections. In the first section, demographic information about the respondents was captured. The second section was designed to measure the expectations (E) and perceptions (P) of the respondents according to the five service dimensions. Respondents were asked to rate their expectations and perceptions of each of the 19 items on a 5-point Likert scale ranging from “1 = strongly disagree” to “5 = strongly agree” as suggested by Babakus and Mangold (1992) and Johns et al. (2004). The final section was structured for the purpose of measuring employees’ satisfaction with the call centre and subsequently their loyalty towards the organization. The study adopted the use of a single five-point item with endpoints “extremely dissatisfied” to “extremely satisfied” to measure FLE satisfaction and loyalty was assessed by two five-point items, namely intentions to stay and willingness to recommend the organization to others. The developed questionnaire was pilot tested and no major problems were observed, but respondents suggested a few minor changes in the wordings of the instrument. The survey was administered to the FLE population of a particular call centre during a one-week period in March 2008. All employees in the call centre were invited to participate in the study. A total of 130 questionnaires and covering letters were distributed. In total, 90 were judged usable for data analysis for this study. The SPSS 14.0 for Windows was used to analyze the data. Descriptive statistics analysis was used to investigate the service quality gaps. A paired t-test was used to evaluate the internal service quality of the call centre. Gap measures were defined as the difference in scores between the rating of each perception measure statement and the rating of the corresponding expectation statement. Regression analyses were used to identify the SERVQUAL dimensions influencing overall satisfaction and FLE loyalty. RESULTS In this study, the ratio of male to female employees was 56 percent to 44 percent. More than 61% of the respondents were between the ages of 18-25 and it is observed that employees in the call centre are on average young. Approximately 83% have either School Certificate or Higher School Certificate as highest level of education and the majority (68%) has less than 1 year of service. While the main objective of the study was to address the issue of FLE perceptions of service quality in a call centre, it also proved useful to test the use of the adapted SERVQUAL instrument for measuring service quality within this service setting. The reliability of the scale was tested using Cronbach’s alpha. An alpha value of 0.904 was obtained indicating a good internal consistency for the 19 item scale. The mean scores and standard deviation for the 19 expectations and perceptions items are presented in Table 1 together with the mean service quality gaps. Table 1 also presents the grand mean scores on the basis of the expectations, perceptions and gap for the five dimensions. The gap scores enable the service manager to understand current service quality and also to quantify gaps that exist. The t-statistics was calculated to test for the significance difference between expectations and perceptions. The gap scores for the five dimensions were all negative implying that FLE expectations were actually not being met. All the gap scores were statistically significantly different at p < 0.05. It is further observed that the gap scores for Reliability (-1.12) is significantly higher than the other dimensions, followed by the gap scores for Empathy (-0.80), Tangibles (-0.68), Assurance (-0.54) and Responsiveness (-0.51). The gap scores for Reliability could be used to prioritize systems and process improvements while the other four gap scores could be used to develop staff training programs and improve service environment. The overall gap score (-0.57) was statistically significantly different at p < 0.05, indicating that the overall service quality fell below the employees’ expectations.
50

GLOBAL JOURNAL OF BUSINESS RESEARCH ♦ VOLUME 4 ♦ NUMBER 1 ♦ 2010
Table 1: Gap Mean Difference between Expectations and Perceptions
Description of Items
Mean Expectation Scores
Mean Perception Scores
Gap Scores (P-E)
t-value Mean SD Mean SD Mean SD
Reliability 4.56
0.77
3.44
0.92
-1.12
0.81
-12.29
When we promised to do something by a certain time, we do so
3.91 0.99 3.41 1.33 -0.50 1.36 - 3.32*
We show sincere interest on solving our customers’ problems
3.46 0.97 3.25 1.02 -0.21 1.19 - 1.51
We perform services right the first time 3.90 0.69 3.20 1.24 -0.70 1.23 -5.02*
We provide services at the time required/ promised 3.67 1.14 3.42 1.16 -0.25 1.26 -1.79*
We provide correct /accurate information to our customers 4.09 0.77 3.92 1.03 -0.17 1.19 -1.23 Responsiveness
3.89
0.66
3.39
1.06
-0.51
0.89
-5.06
We provide prompt services to our customers
3.78 1.06 3.19 1.41 -0.59 1.17 -4.51* We are always willing to help our customers 4.01 0.78 3.54 1.12 -0.47 1.16 -3.58*
We are never too busy to respond to our customers’ request 3.89 0.91 3.43 1.16 -0.46 1.05 -3.87* Assurance
3.92
0.40
3.37
0.40
-0.54
0.78
-6.22 Customers’ behavior instill confidence in us 3.75 0.81 3.38 0.88 -0.37 1.16 -2.82*
We can be trusted by our customers 4.18 0.69 3.37 0.99 -0.81 1.35 -5.33* We are consistently courteous to our customers 4.05 0.82 3.54 0.92 -0.51 1.44 -3.13*
We have the required knowledge to answer our customers’ questions
3.70 0.82 3.20 0.99 -0.50 0.96 -4.58*
Empathy 3.82
0.60
3.02
0.91
-0.80
1.02
-6.94
We give individual attention to our customers 3.76 0.79 2.89 1.10 -0.87 1.10 -7.04*
We have our customers’ best interest at heart 3.86 0.83 3.00 1.23 -0.86 1.53 -4.99*
We understand the specific needs of our customers 4.00 0.80 2.94 1.05 -1.06 1.26 -7.47*
We have convenient working hours 3.65 0.98 3.24 1.05 -0.41 1.45 -2.48* Tangibles
4.11
0.61
3.43
0.61
-0.68
0.95
-6.34 We have up-to-date equipment 4.09 1.13 3.43 1.19 -0.66 1.56 -3.75* The materials used in the workplace are visually appealing 4.43 0.78 3.48 1.22 -0.95 1.29 -6.54*
The work environment is comfortable and attractive 3.81 0.82 3.39 1.18 -0.42 1.28 -2.91*
Overall (Combined scores of 19 items) 3.32 0.69 3.89 0.41 -0.57 0.66 -7.61*
Notes: Scores based on a five-point scale ranging from 1 = strongly disagree to 5 = strongly agree; SD = Standard Deviation; a Gap mean is defined as perception mean – expectation mean; A negative gap indicates that customers perceived that internet banking service delivery did not meet their expectations; A positive gap indicates that customers perceived that internet banking service delivery exceeded their expectations; *Significant at p < 0.05 Table 1 presents FLE perceptions, expectations and the gap scores for the five SERVQUAL dimensions. The scores show that FLE expectations were consistently higher than their perceptions for all the five dimensions, resulting in negative service quality gaps. This indicates that there is a need for service improvements in all service quality dimensions. Relative importance of the SERVQUAL dimensions on overall satisfaction and loyalty The focus of this study was the extent to which overall satisfaction and loyalty among FLE in call centre can be predicted; therefore regression models were used to determine these relationships. The regression models considered the SERVQUAL dimensions as independent variables and overall satisfaction and loyalty as dependent variables.
51

P. Ramseook-Munhurrun et al Global Journal of Business Research ♦ Vol. 4 ♦ No. 1 ♦ 2010
The adjusted R2 of 0.304 indicates 30.4 percent of variances in FLE satisfaction can be predicted by the service quality dimensions (Table 2). Overall satisfaction is predicted by the four dimensions, with the exception of Tangibles. The results of the regression analysis showed that each coefficient carried negative signs. Reliability, Responsiveness, Assurance and Empathy appeared to be significant predictors of overall employee satisfaction. These negative coefficients mean decreasing level of satisfaction. Table 2: Regression Analysis for FLE Satisfaction
Independent variable Coefficient Beta t-vales
Constant 3.547 17.603a Reliability -0.170 -0.113 -0.608a Responsiveness -0.126 -0.092 -0.456a Assurance -0.400 -0.256 -1.577a Empathy -0.120 -0.268 -1.430b Tangibles -0.026 -0.020 -0.150 Note: R2 = 0.304; a Significant at 0.01 level; b significant at 0.5 level
Table 2 shows the regression results of the five dimensions on FLE satisfaction. The table reveals that four of the five dimensions- ‘Reliability’, ‘Responsiveness’, ‘Assurance’ and ‘Empathy’ with the exception of ‘Tangibles’, were significant in predicting FLE satisfaction. To further test employee loyalty measures against those of the SERVQUAL dimensions, additional regression analysis was conducted, using both employee satisfaction and SERVQUAL dimensions as predictors of intentions to stay and willingness to recommend the call centre to others. As it can be seen from Table 3, the regression is statistically significant. 36 per cent of the variation of loyalty could be explained by overall satisfaction and two of the five SERVQUAL dimensions, responsiveness and tangibles. The other SERVQUAL dimensions were not significant predictors of loyalty. It is surprising to note that tangibles of service did not contribute to overall satisfaction but contribute to willingness to recommend to others. Table 3: Regression Analysis for Willingness to Recommend
Independent variable Coefficient Beta t-vales
Constant 1.731 12.146a
Overall satisfaction 0.041 0.110 1.145a Reliability 0.040 0.071 0.461 Responsiveness 0.239 0.464 2.793a Assurance -0.014 -0.024 -0.176 Empathy 0.116 0.261 2.366 Tangibles -0.074 -0.154 -1.394b Note: R2 = 0.36; F = 6.759; a Significant at 0.01 level; b significant at 0.5 level
Table 3 shows that only ‘Overall satisfaction’, ‘Responsiveness’ and ‘Tangibles’ are significant in predicting loyalty among FLE. The other SERVQUAL dimensions were not significant predictors of loyalty. DISCUSSION The purpose of this study was to examine the relationships between the five SERVQUAL dimensions, overall satisfaction and their predictive power in terms of loyalty among FLE in a call centre setting. The SERVQUAL items used in the present study were modified so as to assess the internal service setting. The results showed that the FLE perceptions were consistently lower than their expectations. These negative gaps revealed that the internal service levels were below the FLE expectations of service quality and the call centre quality improvements require change in Mauritius. The SERVQUAL dimensions with the exception of tangibles have negative influence on overall employee satisfaction. This suggests that the service delivered by the FLE at the call centre do not necessarily result in higher levels of employee satisfaction. According to Berry and Parasuraman (1991) it is important to create job products that meet the needs of employees thus satisfying and motivating them.
52

GLOBAL JOURNAL OF BUSINESS RESEARCH ♦ VOLUME 4 ♦ NUMBER 1 ♦ 2010
The results of the regressions analyses showed that overall satisfaction, responsiveness and tangibles were significantly associated with employee willingness to recommend the call centre, and intentions to stay. Researchers suggest that employee attitudes such as satisfaction and intention to stay are developed through interaction with the work environment (Naumann, 1993). This study show that overall satisfaction is more important than the SERVQUAL dimensions when predicting employee willingness to recommend the call centre and their intentions to stay. CONCLUSIONS AND LIMITATIONS OF STUDY The study presented the findings of the expectations and perceptions of internal service quality for a call centre. According to Comm and Dennis (2000) employee satisfaction is vital because it will determine the success or failure of what the customer experiences. The SERVQUAL dimensions were found to have significant negative relationships with an employee’s overall satisfaction. These findings should enable the manager to identify specific areas for performance improvement that should have a direct effect on employee satisfaction. Call centre employees also do not allow for tangible elements in assessing their level of satisfaction and managers must take this issue into account. They should direct their resources towards improving the human services rather than the tangibles element of their services. It is clear from this study that the SERVQUAL instrument can be modified to measure the quality of the internal customer. Assessing the service quality of FLE and understanding how the different dimensions influence overall service quality should enable service organizations to effectively and efficiently design the service delivery process, thus ultimately provide better service to the external customers. There are some limitations in this study that need to be acknowledged. The results reported in the study are specific to a particular call centre, so the findings may be limited to this call centre only and might not represent the call centre service quality in the whole island. Further the study used a single-item employee satisfaction measure, multi-item perceptions may give different results. The five SERVQUAL dimensions of service quality were used in this study, further research may consider other dimensions of service quality that may have an indirect influence on employees’ loyalty via overall satisfaction. APPENDIX 1 Survey Questionnaire Dear respondent This questionnaire aims to collect data that will be used in academic research. The survey measures your expectations from an excellent BPO company and your actual performance as an employee of the BPO services. Please indicate the level of importance each statement has for you. Your comment is highly important to the analysis, and will be treated with anonymity and confidentiality. Thank you very much for your cooperation. Part 2: Please tick the appropriate box below 1. Gender: Male Female 2. Marital Status: Single Married Divorced 3. Your age group:
18 – 25 36 – 45 55 + 26 – 35 46 – 55 4. Highest level of education:
School certificate Diploma
53

P. Ramseook-Munhurrun et al Global Journal of Business Research ♦ Vol. 4 ♦ No. 1 ♦ 2010
Higher School certificate Degree
Others (specify :…………………………………………) 5. How many years have you been working for this organisation? Less than 1 year 3 years < 5 years
1 year < 3 years > 5 years 6. What is your income range?
Rs 5000 – Rs 9999 Rs 10000 – Rs 14999 Rs 15000 – Rs 19999 Rs 20000 – Rs 24999
More than Rs 25000 7. What is your position in this organisation?
Call Agent Team Leader Data Entry Operator Supervisor Others (Please specify :………......................................)
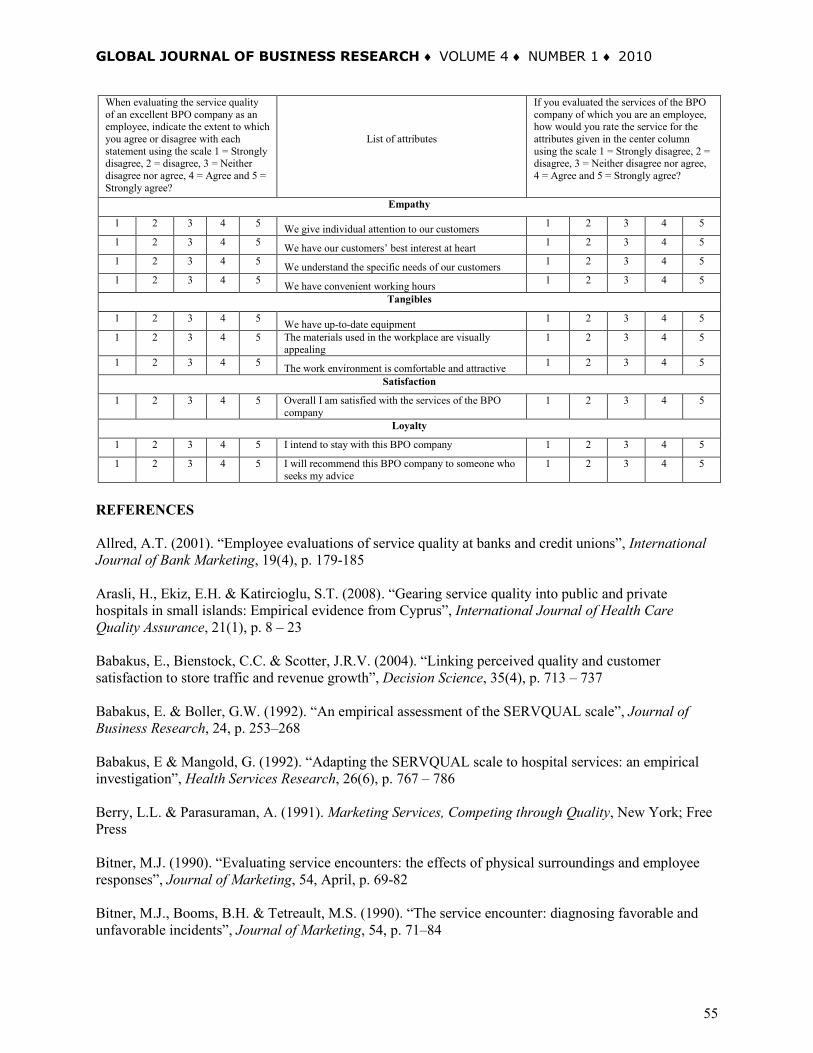
Part 2: Center column contains some attributes that as an employee, you would expect from an excellent BPO company. There are two scales on each side of this column, the one on the left measures your expectations and the one on the right measures your perceptions. Please read each attribute first and then circle the numbers in both scales that indicate your judgments. The corresponding values for the numbers are shown at the top of both scales.
When evaluating the service quality of an excellent BPO company as an employee, indicate the extent to which you agree or disagree with each statement using the scale 1 = Strongly disagree, 2 = disagree, 3 = Neither disagree nor agree, 4 = Agree and 5 = Strongly agree?
List of attributes
If you evaluated the services of the BPO company of which you are an employee, how would you rate the service for the attributes given in the center column using the scale 1 = Strongly disagree, 2 = disagree, 3 = Neither disagree nor agree, 4 = Agree and 5 = Strongly agree?
Reliability
1 2 3 4 5 When we promised to do something by a certain time, we do so
1 2 3 4 5
1 2 3 4 5 We show sincere interest on solving our customers’ problems
1 2 3 4 5
1 2 3 4 5 We perform services right the first time 1 2 3 4 5
1 2 3 4 5 We provide services at the time required/ promised 1 2 3 4 5
1 2 3 4 5 We provide correct /accurate information to our customers
1 2 3 4 5
Responsiveness
1 2 3 4 5 We provide prompt services to our customers 1 2 3 4 5
1 2 3 4 5 We are always willing to help our customers 1 2 3 4 5
1 2 3 4 5 We are never too busy to respond to our customers’ request
1 2 3 4 5
Assurance
1 2 3 4 5 Customers’ behavior instill confidence in us 1 2 3 4 5
1 2 3 4 5 We can be trusted by our customers 1 2 3 4 5
1 2 3 4 5 We are consistently courteous to our customers 1 2 3 4 5
1 2 3 4 5 We have the required knowledge to answer our customers’ questions
1 2 3 4 5
54
GLOBAL JOURNAL OF BUSINESS RESEARCH ♦ VOLUME 4 ♦ NUMBER 1 ♦ 2010
When evaluating the service quality of an excellent BPO company as an employee, indicate the extent to which you agree or disagree with each statement using the scale 1 = Strongly disagree, 2 = disagree, 3 = Neither disagree nor agree, 4 = Agree and 5 = Strongly agree?
List of attributes
If you evaluated the services of the BPO company of which you are an employee, how would you rate the service for the attributes given in the center column using the scale 1 = Strongly disagree, 2 = disagree, 3 = Neither disagree nor agree, 4 = Agree and 5 = Strongly agree?
Empathy
1 2 3 4 5 We give individual attention to our customers 1 2 3 4 5
1 2 3 4 5 We have our customers’ best interest at heart 1 2 3 4 5
1 2 3 4 5 We understand the specific needs of our customers 1 2 3 4 5
1 2 3 4 5 We have convenient working hours 1 2 3 4 5
Tangibles
1 2 3 4 5 We have up-to-date equipment 1 2 3 4 5
1 2 3 4 5 The materials used in the workplace are visually appealing
1 2 3 4 5
1 2 3 4 5 The work environment is comfortable and attractive 1 2 3 4 5
Satisfaction
1 2 3 4 5 Overall I am satisfied with the services of the BPO company
1 2 3 4 5
Loyalty
1 2 3 4 5 I intend to stay with this BPO company 1 2 3 4 5
1 2 3 4 5 I will recommend this BPO company to someone who seeks my advice
1 2 3 4 5
REFERENCES Allred, A.T. (2001). “Employee evaluations of service quality at banks and credit unions”, International Journal of Bank Marketing, 19(4), p. 179-185 Arasli, H., Ekiz, E.H. & Katircioglu, S.T. (2008). “Gearing service quality into public and private hospitals in small islands: Empirical evidence from Cyprus”, International Journal of Health Care Quality Assurance, 21(1), p. 8 – 23 Babakus, E., Bienstock, C.C. & Scotter, J.R.V. (2004). “Linking perceived quality and customer satisfaction to store traffic and revenue growth”, Decision Science, 35(4), p. 713 – 737 Babakus, E. & Boller, G.W. (1992). “An empirical assessment of the SERVQUAL scale”, Journal of Business Research, 24, p. 253–268 Babakus, E & Mangold, G. (1992). “Adapting the SERVQUAL scale to hospital services: an empirical investigation”, Health Services Research, 26(6), p. 767 – 786 Berry, L.L. & Parasuraman, A. (1991). Marketing Services, Competing through Quality, New York; Free Press Bitner, M.J. (1990). “Evaluating service encounters: the effects of physical surroundings and employee responses”, Journal of Marketing, 54, April, p. 69-82 Bitner, M.J., Booms, B.H. & Tetreault, M.S. (1990). “The service encounter: diagnosing favorable and unfavorable incidents”, Journal of Marketing, 54, p. 71–84
55

P. Ramseook-Munhurrun et al Global Journal of Business Research ♦ Vol. 4 ♦ No. 1 ♦ 2010
Board of Investment (2007). BPO Flash: A semi annual publication of the ITES BPO Sector, Mauritius Boulding, W., Kalra, A., Staelin, R. & Zeithaml, V. A. (1993). “A dynamics process model of service quality: From expectations to behavioral intentions”, Journal of Marketing Research, 30, February, pp. 7 - 27 Carman, J.M. (1990). “Consumer perceptions of service quality: an assessment of the SERVQUAL dimensions”, Journal of Retailing, 66(2), p. 27 – 45 Chiu, H.C. (2002). “A study on the cognitive and affective components of service quality”, Total Quality Management, 13 (2), p. 265 – 274 Comm, C.L. & Dennis, F.X. (2000). “Assessing employee satisfaction in service firms: An example in higher education”, Journal of Business and Economic Studies, 6(1), p. 43 – 53 Cronin, Jr., J.J. & Taylor, S.A. (1992). “Measuring service quality: A re-examination and extension”, Journal of Marketing, 56(3), p. 55 – 68 Cronin, J., Brady, M. & Hult, G. (2000). “Assessing the effect of quality, value, and customer satisfaction on consumer behavioral intentions in service environments”, Journal of Retailing, 76(2), p. 193-218 Crompton, J.L. & MacKay, K.J. (1989). “Users’ perceptions of the relative importance of service quality dimensions in selected public recreation programs”, Leisure Sciences, 11 (4), p. 367–375 Deery, S., Iverson, R. & Walsh, J. (2002). “Work relationships in telephone call centers: understanding emotional exhaustion and employee withdrawal”, Journal of Management Studies, 39(4), p. 471-96 Edvardsson, B., Larsson, G. & Setterlind, S. (1997). “Internal service quality and the psychosocial work environment: An empirical analysis of conceptual interrelatedness”, The Service Industries Journal, 17(2), p. 252 – 263 Eskildsen, J. K. & Dahlgaard, J.J. (2000). “A causal model for employee satisfaction”, Total Quality Management, 11(8), p. 1081–1094 Fick, G.R. & Ritchie, J.R.B. (1991). “Measuring service quality in the travel and tourism industry”, Journal of Travel Research, 30(2), p. 2-9 Frenkel, S.J., Korczynski, M., Shire, K.A. & Tam, M. (1998). “Beyond bureaucracy Work organization in call centers”, International Journal of Human Resource Management, 9 (6), p. 957-79 Gabbott, M. & Hogg, G. (1998). Consumers and Services, New York: John Wiley & Sons Ltd Grönroos, C. (1988). “The six criteria of good perceived service quality”, Review of Business, 9, p. 10 -13 Jabnoun, N. & Al-Tamimi, H.A.H. (2003). “Measuring perceived service quality at UAE commercial banks”, International Journal of Quality & Reliability Management, 20 (4), p. 458 – 472 Johns, N., Avci, T. & Karatepe, O.M. (2004). “Measuring service quality of travel agents: evidence from Northern Cyprus”, The Service Industries Journal, 24 (3), p. 82 – 100
56

GLOBAL JOURNAL OF BUSINESS RESEARCH ♦ VOLUME 4 ♦ NUMBER 1 ♦ 2010
Judge, T.A., Thoresen, C.J., Bono, J.E. and Patton, G.K. (2001). “The job satisfaction – job performance relationship: A qualitative and quantitative review”, Psychological Bulletin, 127, p. 376– 407 Loveman, G.W. (1998). “Employee satisfaction, customer loyalty and financial performance: an empirical examination of the service profit chain in retail banking”, Journal of Service Research, 1(1), p. 18 – 31 Malhotra, N. & Mukherjee, A. (2004). “The relative influence of organizational commitment and job satisfaction on service quality of customers contact employees in banking call centers”, International Journal of Service Industry Management, 17(5), p. 444 - 473 Matzler, K., Fuchs, M., & Schubert, A.K. (2004). “Employee satisfaction: Does Kano’s model apply?”, TQM and Business Excellence, 15 (9–10), p. 1179–1198 Naumann, E. (1993). “Antecedents and consequences of satisfaction and commitment among expatriate manager”, Group & Organization Management, 18, p. 153-187 Oliver, R.L. (1980). “A cognitive model of the antecedents and consequences of satisfaction decisions”, Journal of Marketing Research, 17, p. 460 – 469 Oliver, R.L. (1993). “A conceptual model of service quality and service satisfaction: compatible goals, different concepts”, In Swartz, A.T., Bowen, D.E., Brown, S.W. (Eds), Advances in Services Marketing Management, JAI Press, Greenwich, CT, 2, p.65-85 Parasuraman, A., Zeithaml, V.A. & Berry, L.L. (1985). “A conceptual model of service quality and its implications for future research”, Journal of Marketing, 49(5), p. 41 - 50 Parasuraman, A., Zeithaml, V.A. & Berry, L.L. (1988). “SERVQUAL: a multiple item scale for measuring consumer perceptions of service quality”, Journal of Retailing, 64(5), p. 21- 40 Parasuraman, A., Berry, L.L. & Zeithaml, V.A. (1991). “Refinement and reassessment of SERVQUAL scale”, Journal of Retailing, 67(4), p. 420 – 450 Parasuraman, A., Zeithaml, V.A. & Berry, L.L. (1994). “Reassessment of expectations as a comparison standard in measuring service quality: implications for future research”, Journal of Marketing, 58, p. 111–124 Reichheld, F.F. & Sasser, W.E. (1990). “Zero defections: quality comes to services”, Harvard Business Review, 68(5), p. 105 –111 Saleh, F. & Ryan, C. (1992). “Analyzing service quality in the hospitality industry using SERVQUAL model”, Services Industries Journal, 11(3), p. 324-43 Schneider, B. & Bowen, D.E. (1985). “Employee and customer perceptions of service in banks: replication and extension”, Journal of Applied Psychology, 70(12), p.423-33 Schneider, B. & Bowen, D. E. (1993). “The service organization: human resources management is crucial”, Organizational Dynamics, 21, p. 39–52 Schmit, M.J. & Allscheid, S.P. (1995). “Employee attitudes and customer satisfaction: Making theoretical and empirical connections”, Personnel Psychology, 48, p. 521-536
57

P. Ramseook-Munhurrun et al Global Journal of Business Research ♦ Vol. 4 ♦ No. 1 ♦ 2010
Silvestro, R. & Cross, S. (2000). “Applying the service profit chain in a retail environment: challenging the satisfaction mirror”, International Journal of Service Industry Management, 11(3), p. 244 – 268 Sureshchandar, G.S., Rajendran, C. & Kamalanabhan, T.J. (2001). “Customer perceptions of service quality: a critique”, Total Quality Management, 12(1), p. 111- 124 Tan, K.C. & Kek, S.W. (2004), “Service Quality in Higher Education using an enhanced SERVQUAL approach”, Quality in Higher Education, 10(1), p. 17- 24 Taylor, S.A., Sharland, A., Cronin Jr., J.J. & Bullard, W. (1993). “Recreational service quality in the international setting”, International Journal of Service Industry Management, 4(4), p. 68–86 Teas, R.K. (1993). “Expectations, performance evaluation, and consumers’ perceptions of quality”, Journal of Marketing, October, p. 18-34 Yang, Z., & Peterson, R. T. (2004). “Customer perceived value, satisfaction, and loyalty: The role of switching costs”. Psychology and Marketing, 21(10), p. 799–822 Yee, R.W.Y, Yeung, A.C.L. & Cheng, T.C.E. (2008). “The impact of employee satisfaction on quality and profitability in high-contact service industries”, Journal of Operations Management, 25, p. 651 – 668 Yoon, M.H., Beatty, S.E. & Suh, J. (2001). “The effect of work climate on critical employee and customer outcomes”, International Journal of Service Industry Management, 12(5), p. 500- 521 Yoon, M.H. & Suh, J. (2003). “Organizational citizenship behaviors and service quality as external effectiveness of contact employees”, Journal of Business Research, 56 (8), p. 597–611 Zeithaml, V.A., Parasuraman, A. & Berry, L.L. (1990). Delivering Quality Services-Balancing Customer perceptions and Expectation, New York: The Free Press Zeithaml, V.A., Berry, L.L. & Parasuraman, A. (1996). “The behavioral consequences of service quality”, Journal of Marketing, 52, p. 2 -22 Zeithaml, V.A. & Bitner, M.J. (2000). Service Marketing: Integrating Customer Focus across the firm, 2nd Ed., Boston, McGraw-Hill BIOGRAPHY Prabha Ramseook-Munhurrun is a lecturer of Services Management at the University of Technology, Mauritius. Her main research interests include Services Marketing, Service Quality and Tourism. Email: [email protected] Perunjodi Naidoo is a lecturer in Tourism at the University of Technology, Mauritius. Her main research interests include Sustainable Tourism and Service Quality. Email: [email protected] Soolakshna D. Lukea-Bhiwajee is a lecturer in the field of Human Resource Management at the University of Technology, Mauritius. Her research includes service quality in the public service. Email: [email protected]
58
Copyright © 2022 FDOKUMEN