Identification of Dimensions for Measuring Service Quality of Health Care in West Bengal
10
© 2013, IJARCSMS All Rights Reserved 43 | P age ISSN: 2321-7782 (Online) Volume 1, Issue 7, December 2013 International Journal of Advance Research in Computer Science and Management Studies Research Paper Available online at: www.ijarcsms.com Identification of Dimensions for Measuring Service Quality of Health Care in West Bengal Dr. Ranajit Chakraborty 1 Anirban Majumdar 2 Professor Department of Business Management University of Calcutta Kolkata - India Assistant Professor - Marketing Area Future Institute of Engineering and Management Kolkata - India Abstract: In the liberalized and globalized era, the health care sector has been witnessing a rapid growth in India. In the present economic environment, private investors have found Indian health sector a lucrative area for their investment. With this radical change, the demand for continual improvement of quality has become an upcoming challenge in Indian health sector. Therefore, measurement of health care quality is an important exercise that helps understand the standard of health care service maintained by health care providers in India. The focus of the paper is to identify the dimensions of service quality on the basis of service parameters. A questionnaire survey has been conducted to gather the patients’ perception towards the service quality. Finally, factor analysis of the perception rating against service parameters helps generate three dimensions of service quality which is equivalent to 3Ps concept of service marketing. Keywords: Service parameters, Patient’s perception, Service quality, 3Ps concept of service industry, Dimensions of service quality. I. INTRODUCTION In the age of globalization and liberalization, India has emerged as a rising power where health care industry, one of the largest sectors in terms of revenue and employment, has shown rapid growth (Itumalla and Acharyulu, 2012, Bisht et.al. 2012). In the health care sector in India, it has also been observed that the participation of private and corporate houses has been increasing significantly (Shah and Mohanty, 2010). Private participation in health care brings about the need for continuous improvement of quality that ensures patient satisfaction (Shabbir et.al. 2010). During the same period, Government of India has also implemented a policy to put much importance on quality of health care services at every corner of the country to ensure the security and safety of patients (John, 2010). Therefore, from the above discussion, it can be interpreted that the measurement of patient satisfaction or the quality of health care service is an important issue to determine the standard of performance of health care providers in the country. In the present economic scenario quality is a major issue for survival of an organization when it put much emphasis on customer-focused effort than the production-led philosophy (Rahaman et.al. 2012). Various methods have been applied to measure the service quality viz. SERVQUAL, SERVPERF, SERVQUAL-Kano’s-QFD etc. (Zisis, 2009). Quality of health service can be classified into two categories viz. technical quality and functional quality. Technical quality deals with medical diagnosis and procedures whereas functional quality focuses on the way of delivering health care (Ibraheem and Al-Hawary, 2012). Patients cannot evaluate the technical quality of health care service due to their lack of knowledge of the technical aspects of medical care (Lam, 1997). Recognition of customers’ expectation is the key criterion on the basis of which high quality of service can be defined (Ziethaml et.al.1996). Therefore, when service quality is related to patients’ expectation and
Transcript of Identification of Dimensions for Measuring Service Quality of Health Care in West Bengal
© 2013, IJARCSMS All Rights Reserved 43 | P a g e
ISSN: 2321-7782 (Online) Volume 1, Issue 7, December 2013
International Journal of Advance Research in Computer Science and Management Studies
Research Paper Available online at: www.ijarcsms.com
Identification of Dimensions for Measuring Service Quality of Health Care in West Bengal
Dr. Ranajit Chakraborty1 Anirban Majumdar
2
Professor
Department of Business Management
University of Calcutta
Kolkata - India
Assistant Professor - Marketing Area
Future Institute of Engineering and Management
Kolkata - India
Abstract: In the liberalized and globalized era, the health care sector has been witnessing a rapid growth in India. In the
present economic environment, private investors have found Indian health sector a lucrative area for their investment. With
this radical change, the demand for continual improvement of quality has become an upcoming challenge in Indian health
sector. Therefore, measurement of health care quality is an important exercise that helps understand the standard of health
care service maintained by health care providers in India.
The focus of the paper is to identify the dimensions of service quality on the basis of service parameters. A questionnaire
survey has been conducted to gather the patients’ perception towards the service quality. Finally, factor analysis of the
perception rating against service parameters helps generate three dimensions of service quality which is equivalent to 3Ps
concept of service marketing.
Keywords: Service parameters, Patient’s perception, Service quality, 3Ps concept of service industry, Dimensions of service
quality.
I. INTRODUCTION
In the age of globalization and liberalization, India has emerged as a rising power where health care industry, one of the
largest sectors in terms of revenue and employment, has shown rapid growth (Itumalla and Acharyulu, 2012, Bisht et.al. 2012).
In the health care sector in India, it has also been observed that the participation of private and corporate houses has been
increasing significantly (Shah and Mohanty, 2010). Private participation in health care brings about the need for continuous
improvement of quality that ensures patient satisfaction (Shabbir et.al. 2010). During the same period, Government of India has
also implemented a policy to put much importance on quality of health care services at every corner of the country to ensure the
security and safety of patients (John, 2010). Therefore, from the above discussion, it can be interpreted that the measurement of
patient satisfaction or the quality of health care service is an important issue to determine the standard of performance of health
care providers in the country.
In the present economic scenario quality is a major issue for survival of an organization when it put much emphasis on
customer-focused effort than the production-led philosophy (Rahaman et.al. 2012). Various methods have been applied to
measure the service quality viz. SERVQUAL, SERVPERF, SERVQUAL-Kano’s-QFD etc. (Zisis, 2009). Quality of health
service can be classified into two categories viz. technical quality and functional quality. Technical quality deals with medical
diagnosis and procedures whereas functional quality focuses on the way of delivering health care (Ibraheem and Al-Hawary,
2012). Patients cannot evaluate the technical quality of health care service due to their lack of knowledge of the technical
aspects of medical care (Lam, 1997). Recognition of customers’ expectation is the key criterion on the basis of which high
quality of service can be defined (Ziethaml et.al.1996). Therefore, when service quality is related to patients’ expectation and
Dr. Ranajit Chakraborty et al.., International Journal of Advance Research in Computer Science and Management Studies
Volume 1, Issue 7, December 2013 pg.43-52
© 2013, IJARCSMS All Rights Reserved ISSN: 2321-7782 (Online) Impact Factor: 3.5 44 | P a g e
perception, the functional quality of the service should be the area of interest of the research. SERVQUAL model is one of the
best and most popular models for evaluating customer expectation with functional quality of health care service (Zarei, 2012).
In this paper, SERVQUAL parameters have been taken into account for identifying dimensions of service quality of hospitals,
nursing homes and clinics with 3Ps of marketing mix of health care service.
II. LITERATURE REVIEW
A. Additional 3Ps of Service Marketing:
Marketing mix has been defined as a process of translating marketing planning into practice (McCarthy, 1964). Marketing
mix comprises four elements viz. product, price, place and promotion which are commonly known as 4Ps (Kotler et.al. 2010).
The concept of 4Ps is relevant for introductory marketing and consumer marketing whereas the additional 3Ps viz. Physical
evidence, Process and Participants along with earlier 4Ps concept is more acceptable marketing mix framework (Rafiq and
Ahmed, 1995) the 4Ps concept of marketing mix ignores important aspects of the service marketing (Gabriel 2005). The service
marketing is a process in which purchasing and consumption occurs simultaneously (Gabriel 2005). Any service is featured by
intangibility, inseparability, variability, perishability and right of ownership (Kotler et.al. 2010).
The above features differentiate the service from product. Therefore, additional 3Ps are considered along with 4Ps
marketing mix for service marketing. These are physical evidence, people and process (Gabriel 2005).Physical evidence is
defined as an element of marketing mix of service sector which is an indicator of some tangible items associated with the
service viz. ambience, fixture and fittings in the given intangible nature of services. Process is the method by which the service
is provided viz. delivery of the service, facilities in offering the service, fulfillment of order at the point of contact. People are
another element of marketing mix that indicates the skills, competence etc. relating to a service (Muzondo and Mutandwa,
2011).
B. Servqual Model – A Tool For Measuring Service Quality In Health Care Sector:
SERVQUAL is a reliable and standardized model which is mostly applied in measuring service quality based on five
dimensions viz. responsiveness, reliability, assurance, tangibles and empathy (Parasuraman et. al., 1988, Babakus and Mangold
1992, Lam 1997, Yesilada and Direktör 2010, Bhattacherjee 2010, Kavitha R 2012, Zarei, 2012).
The model has been applied for a number of times to measure health care quality. The following literature review shows
how many times the SERVQUAL model has been used to measure service quality in health sector across the world.
Youseff (1996) has conducted research in National Health Service Hospitals, UK and the service quality of the hospital has
been measured by applying SERVQUAL model (Youseff 1996). Lam (1997) examined the validity, reliability and predictive
validity of SERVQUAL and analyzed its applicability to the health sector in Hong Kong. Yesilada F and Direktör E (2010)
applied SERVQUAL scale to measure a service quality of health care organizations in Northern Cyprus. Gunawardane (2011),
conducted reliability test with SERVQUAL instrument and applied it for measuring patient satisfaction in Los Angeles and
Southern California. Brahmbhatt et. al. (2011) applied SERVQUAL model for measuring service quality of different private and
public hospitals in the state of Gujrata, India. Ramez (2012) applied SERVQUAL to measure quality of healthcare service in
Bahrain. Kavitha R (2012) applied the same model after some modifications to measure the service quality of Sri Gokulam
Hospital in Salem. SERVQUAL model considers twenty two parameters which describe attributes of service quality of any
hospitals or health clinic (Parasuraman et.al., 1988, Parasuraman et.al. 1991). These are as follows:
1. Doctors’ wide spectrum of knowledge and competence
2. Doctors’ understanding of specific need of patients
3. Doctor’s sincere effort to solve patients’ problems
Dr. Ranajit Chakraborty et al.., International Journal of Advance Research in Computer Science and Management Studies
Volume 1, Issue 7, December 2013 pg.43-52
© 2013, IJARCSMS All Rights Reserved ISSN: 2321-7782 (Online) Impact Factor: 3.5 45 | P a g e
4. Doctors’ thorough explanation regarding patients’ medical condition
5. Provision for individualized attention for each patient
6. Patients treated with dignity and respect
7. Patients’ security and safety in receiving medical care
8. Doctors and staff having patients’ best interest at heart
9. Willingness and interest of doctors and staff to listen to the patients and keep them informed
10. Willingness of hospital staff to help patients
11. Friendly and courteous behaviour of doctors and staff
12. Attitude of doctors and staff instilling confidence in patients
13. Prompt services to patients
14. Error free documentation
15. Providing services at required time
16. 24 hours service to patients
17. Providing services right at the first time
18. Maintenance of hospital’s equipment
19. Clean, comfortable and visually attractive environment of the hospital
20. Maintenance of high standard of hygiene
21. Testy meals as per patients’ need
22. Accessibility of the hospital (e.g. Parking facility, signage etc.)
Parasuraman et.al. (1988) has described five dimensions associated with twenty two parameters. These five dimensions are
responsiveness, reliability, assurance, empathy and tangibles.
Ikiz and Masoudi (2008) suggested a hypothetical model where they found a translation process between five dimensions
of service quality suggested by SERVQUAL model and 3Ps concept of service marketing in hotel industry.
III. RESEARCH METHODOLOGY
The above two subsections of literature review have identified two major aspects for measuring service quality. These are
3Ps of service marketing viz. Physical evidence, People and Process on one hand and on the other hand twenty two parameters
and five dimensions suggested by SERVQUAL model. Considering both of them as two important tools for measuring quality
of health care service, the objective of this paper has been set up.
A. Objective of the Study:
The Objective of the study is to identify the dimensions of quality of health care in terms of 3Ps of service industry.
B. Data Collection and Sampling Method:
As the paper has major thrust on SERVQUAL tool, primary data related to perception of patients towards service quality of
hospitals and clinics have been collected from five government medical college hospitals, eight government district hospitals
and ten private hospitals and twelve nursing homes available at Kolkata, and suburban cities in West Bengal viz. Howrah,
Dr. Ranajit Chakraborty et al.., International Journal of Advance Research in Computer Science and Management Studies
Volume 1, Issue 7, December 2013 pg.43-52
© 2013, IJARCSMS All Rights Reserved ISSN: 2321-7782 (Online) Impact Factor: 3.5 46 | P a g e
Burdwan, Bankura, Midnapur, Baharampur, Malda, Siliguri, Alipurdwar and Jalpaiguri. A survey has been conducted with a
structured questionnaire where the twenty two parameters mentioned in the above section have been considered during the
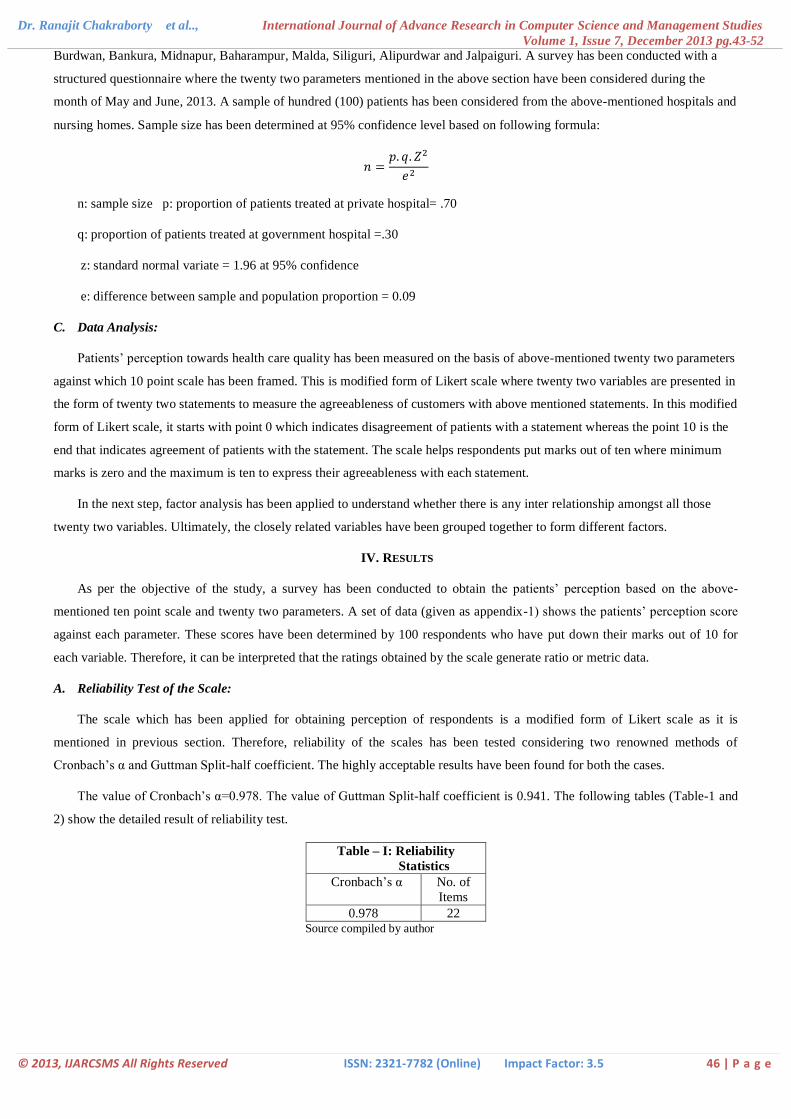
month of May and June, 2013. A sample of hundred (100) patients has been considered from the above-mentioned hospitals and
nursing homes. Sample size has been determined at 95% confidence level based on following formula:
n: sample size p: proportion of patients treated at private hospital= .70
q: proportion of patients treated at government hospital =.30
z: standard normal variate = 1.96 at 95% confidence
e: difference between sample and population proportion = 0.09
C. Data Analysis:
Patients’ perception towards health care quality has been measured on the basis of above-mentioned twenty two parameters
against which 10 point scale has been framed. This is modified form of Likert scale where twenty two variables are presented in
the form of twenty two statements to measure the agreeableness of customers with above mentioned statements. In this modified
form of Likert scale, it starts with point 0 which indicates disagreement of patients with a statement whereas the point 10 is the
end that indicates agreement of patients with the statement. The scale helps respondents put marks out of ten where minimum
marks is zero and the maximum is ten to express their agreeableness with each statement.
In the next step, factor analysis has been applied to understand whether there is any inter relationship amongst all those
twenty two variables. Ultimately, the closely related variables have been grouped together to form different factors.
IV. RESULTS
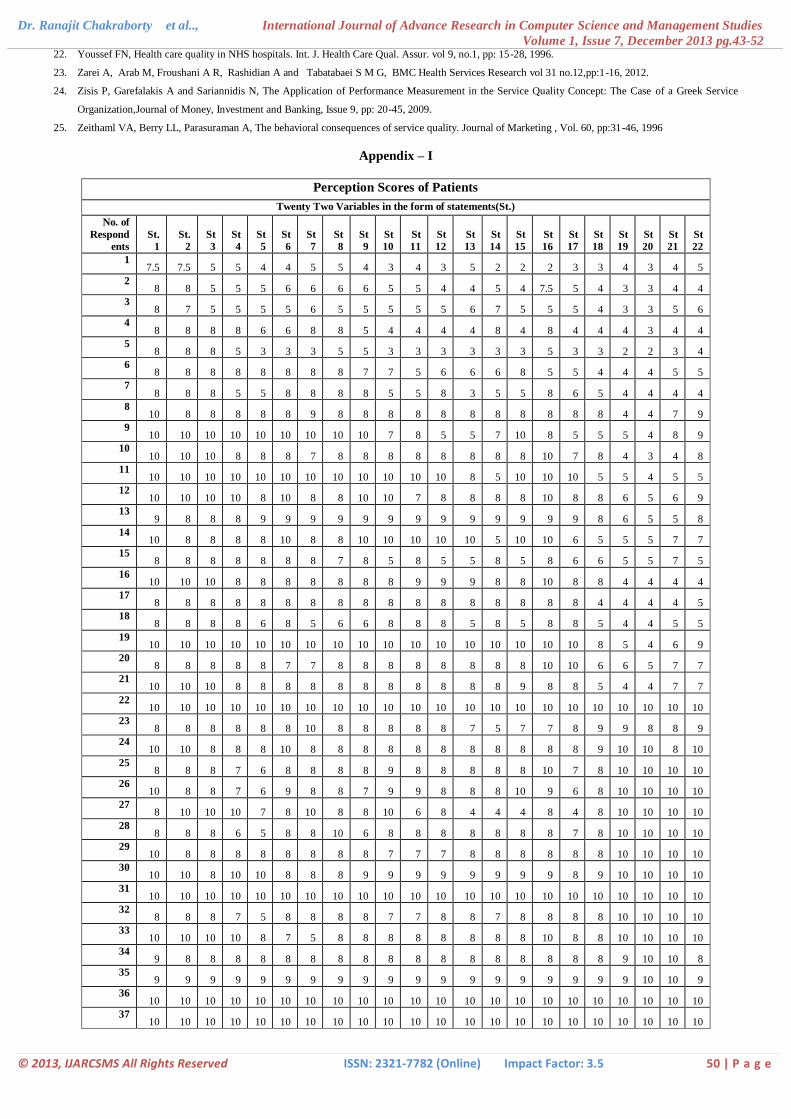
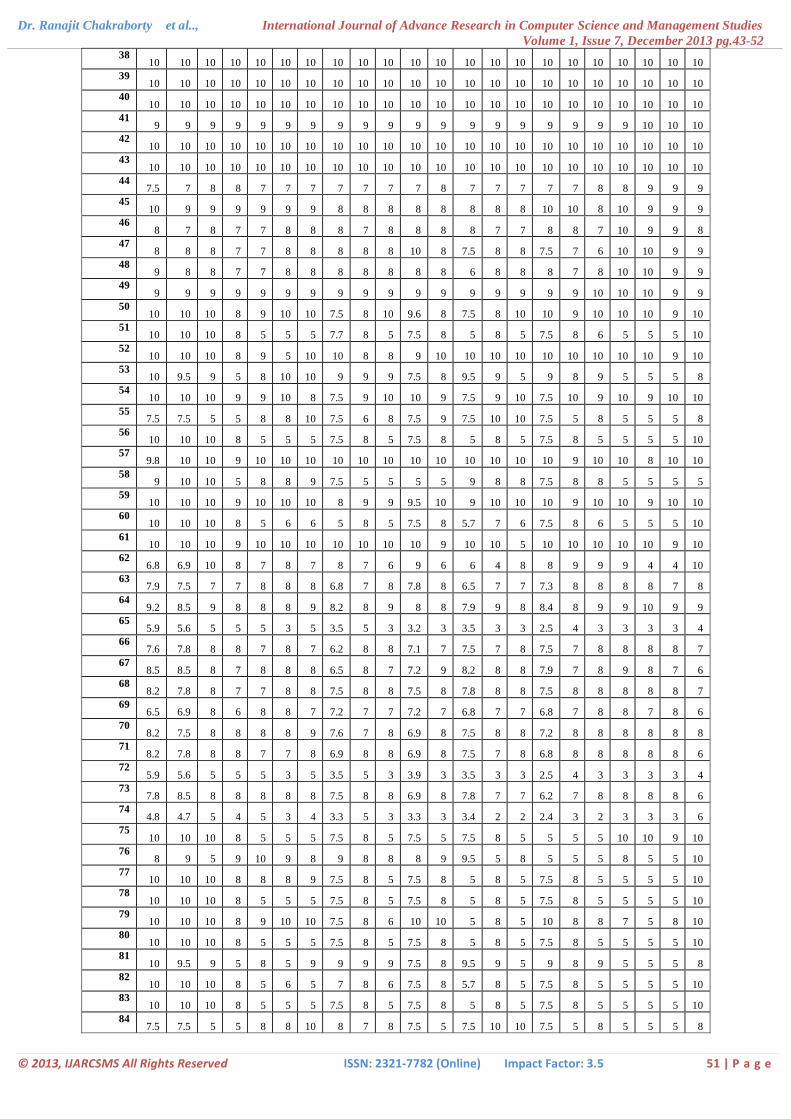
As per the objective of the study, a survey has been conducted to obtain the patients’ perception based on the above-
mentioned ten point scale and twenty two parameters. A set of data (given as appendix-1) shows the patients’ perception score
against each parameter. These scores have been determined by 100 respondents who have put down their marks out of 10 for
each variable. Therefore, it can be interpreted that the ratings obtained by the scale generate ratio or metric data.
A. Reliability Test of the Scale:
The scale which has been applied for obtaining perception of respondents is a modified form of Likert scale as it is
mentioned in previous section. Therefore, reliability of the scales has been tested considering two renowned methods of
Cronbach’s α and Guttman Split-half coefficient. The highly acceptable results have been found for both the cases.
The value of Cronbach’s α=0.978. The value of Guttman Split-half coefficient is 0.941. The following tables (Table-1 and
2) show the detailed result of reliability test.
Table – I: Reliability
Statistics
Cronbach’s α No. of
Items
0.978 22 Source compiled by author
Dr. Ranajit Chakraborty et al.., International Journal of Advance Research in Computer Science and Management Studies
Volume 1, Issue 7, December 2013 pg.43-52
© 2013, IJARCSMS All Rights Reserved ISSN: 2321-7782 (Online) Impact Factor: 3.5 47 | P a g e
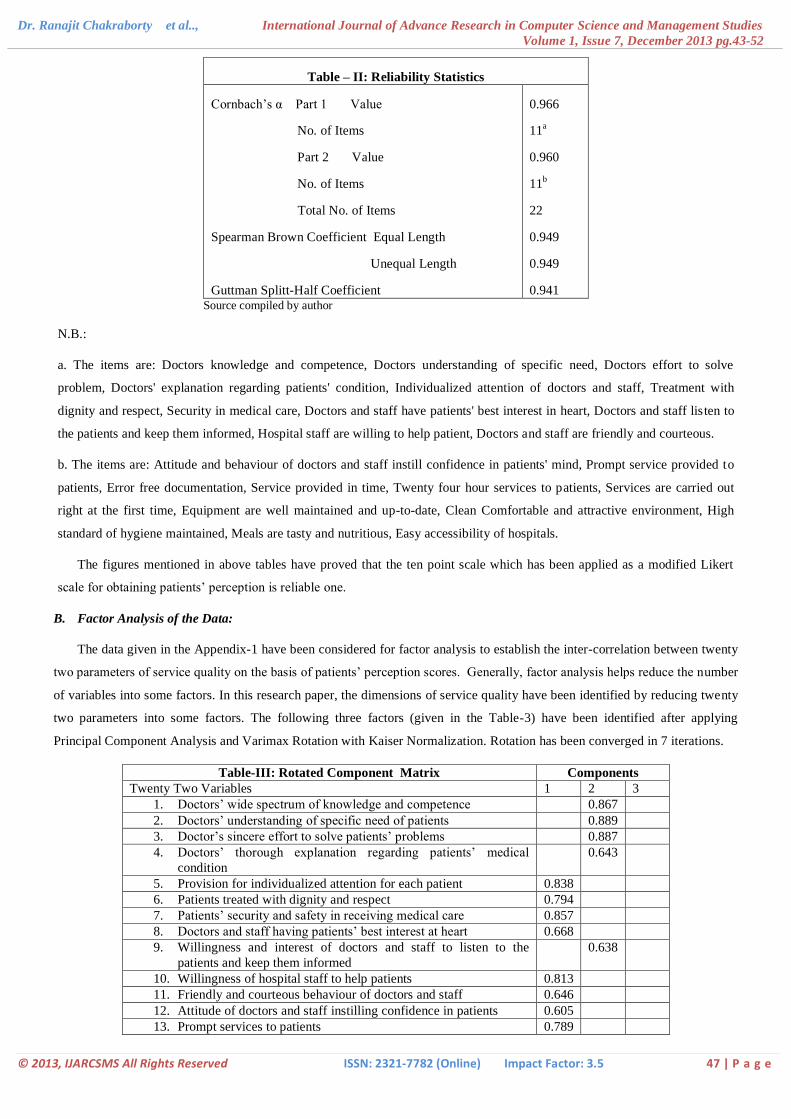
Table – II: Reliability Statistics
Cornbach’s α Part 1 Value
No. of Items
Part 2 Value
No. of Items
Total No. of Items
Spearman Brown Coefficient Equal Length
Unequal Length
Guttman Splitt-Half Coefficient
0.966
11a
0.960
11b
22
0.949
0.949
0.941 Source compiled by author
N.B.:
a. The items are: Doctors knowledge and competence, Doctors understanding of specific need, Doctors effort to solve
problem, Doctors' explanation regarding patients' condition, Individualized attention of doctors and staff, Treatment with
dignity and respect, Security in medical care, Doctors and staff have patients' best interest in heart, Doctors and staff listen to
the patients and keep them informed, Hospital staff are willing to help patient, Doctors and staff are friendly and courteous.
b. The items are: Attitude and behaviour of doctors and staff instill confidence in patients' mind, Prompt service provided to
patients, Error free documentation, Service provided in time, Twenty four hour services to patients, Services are carried out
right at the first time, Equipment are well maintained and up-to-date, Clean Comfortable and attractive environment, High
standard of hygiene maintained, Meals are tasty and nutritious, Easy accessibility of hospitals.
The figures mentioned in above tables have proved that the ten point scale which has been applied as a modified Likert
scale for obtaining patients’ perception is reliable one.
B. Factor Analysis of the Data:
The data given in the Appendix-1 have been considered for factor analysis to establish the inter-correlation between twenty
two parameters of service quality on the basis of patients’ perception scores. Generally, factor analysis helps reduce the number
of variables into some factors. In this research paper, the dimensions of service quality have been identified by reducing twenty
two parameters into some factors. The following three factors (given in the Table-3) have been identified after applying
Principal Component Analysis and Varimax Rotation with Kaiser Normalization. Rotation has been converged in 7 iterations.
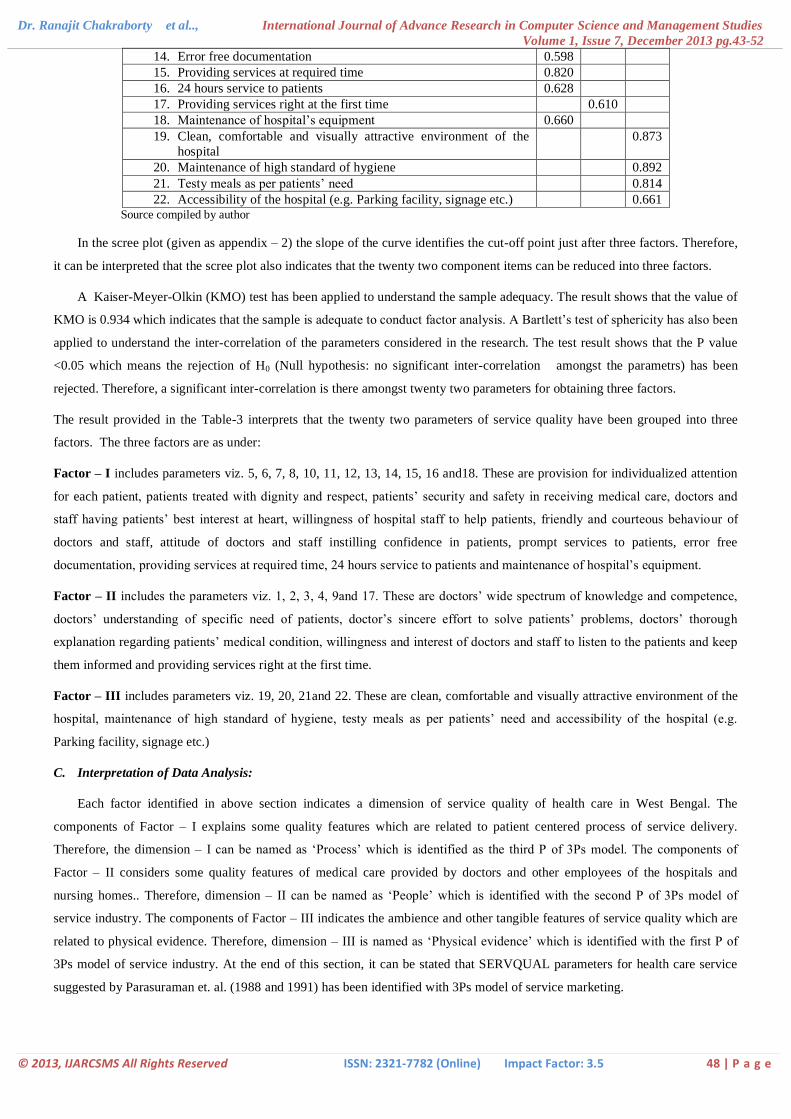
Table-III: Rotated Component Matrix Components
Twenty Two Variables 1 2 3
1. Doctors’ wide spectrum of knowledge and competence 0.867
2. Doctors’ understanding of specific need of patients 0.889
3. Doctor’s sincere effort to solve patients’ problems 0.887
4. Doctors’ thorough explanation regarding patients’ medical
condition
0.643
5. Provision for individualized attention for each patient 0.838
6. Patients treated with dignity and respect 0.794
7. Patients’ security and safety in receiving medical care 0.857
8. Doctors and staff having patients’ best interest at heart 0.668
9. Willingness and interest of doctors and staff to listen to the
patients and keep them informed
0.638
10. Willingness of hospital staff to help patients 0.813
11. Friendly and courteous behaviour of doctors and staff 0.646
12. Attitude of doctors and staff instilling confidence in patients 0.605
13. Prompt services to patients 0.789
Dr. Ranajit Chakraborty et al.., International Journal of Advance Research in Computer Science and Management Studies
Volume 1, Issue 7, December 2013 pg.43-52
© 2013, IJARCSMS All Rights Reserved ISSN: 2321-7782 (Online) Impact Factor: 3.5 48 | P a g e
14. Error free documentation 0.598
15. Providing services at required time 0.820
16. 24 hours service to patients 0.628
17. Providing services right at the first time 0.610
18. Maintenance of hospital’s equipment 0.660
19. Clean, comfortable and visually attractive environment of the
hospital
0.873
20. Maintenance of high standard of hygiene 0.892
21. Testy meals as per patients’ need 0.814
22. Accessibility of the hospital (e.g. Parking facility, signage etc.) 0.661 Source compiled by author
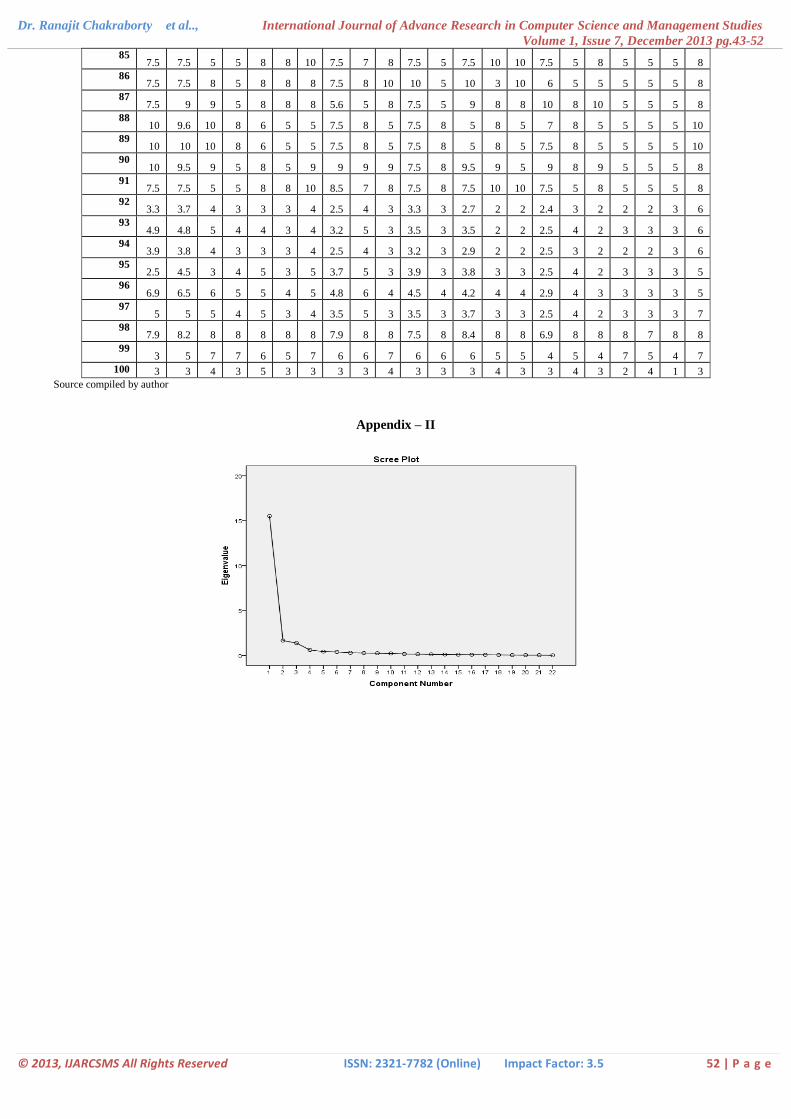
In the scree plot (given as appendix – 2) the slope of the curve identifies the cut-off point just after three factors. Therefore,
it can be interpreted that the scree plot also indicates that the twenty two component items can be reduced into three factors.
A Kaiser-Meyer-Olkin (KMO) test has been applied to understand the sample adequacy. The result shows that the value of
KMO is 0.934 which indicates that the sample is adequate to conduct factor analysis. A Bartlett’s test of sphericity has also been
applied to understand the inter-correlation of the parameters considered in the research. The test result shows that the P value
<0.05 which means the rejection of H0 (Null hypothesis: no significant inter-correlation amongst the parametrs) has been
rejected. Therefore, a significant inter-correlation is there amongst twenty two parameters for obtaining three factors.
The result provided in the Table-3 interprets that the twenty two parameters of service quality have been grouped into three
factors. The three factors are as under:
Factor – I includes parameters viz. 5, 6, 7, 8, 10, 11, 12, 13, 14, 15, 16 and18. These are provision for individualized attention
for each patient, patients treated with dignity and respect, patients’ security and safety in receiving medical care, doctors and
staff having patients’ best interest at heart, willingness of hospital staff to help patients, friendly and courteous behaviour of
doctors and staff, attitude of doctors and staff instilling confidence in patients, prompt services to patients, error free
documentation, providing services at required time, 24 hours service to patients and maintenance of hospital’s equipment.
Factor – II includes the parameters viz. 1, 2, 3, 4, 9and 17. These are doctors’ wide spectrum of knowledge and competence,
doctors’ understanding of specific need of patients, doctor’s sincere effort to solve patients’ problems, doctors’ thorough
explanation regarding patients’ medical condition, willingness and interest of doctors and staff to listen to the patients and keep
them informed and providing services right at the first time.
Factor – III includes parameters viz. 19, 20, 21and 22. These are clean, comfortable and visually attractive environment of the
hospital, maintenance of high standard of hygiene, testy meals as per patients’ need and accessibility of the hospital (e.g.
Parking facility, signage etc.)
C. Interpretation of Data Analysis:
Each factor identified in above section indicates a dimension of service quality of health care in West Bengal. The
components of Factor – I explains some quality features which are related to patient centered process of service delivery.
Therefore, the dimension – I can be named as ‘Process’ which is identified as the third P of 3Ps model. The components of
Factor – II considers some quality features of medical care provided by doctors and other employees of the hospitals and
nursing homes.. Therefore, dimension – II can be named as ‘People’ which is identified with the second P of 3Ps model of
service industry. The components of Factor – III indicates the ambience and other tangible features of service quality which are
related to physical evidence. Therefore, dimension – III is named as ‘Physical evidence’ which is identified with the first P of
3Ps model of service industry. At the end of this section, it can be stated that SERVQUAL parameters for health care service
suggested by Parasuraman et. al. (1988 and 1991) has been identified with 3Ps model of service marketing.
Dr. Ranajit Chakraborty et al.., International Journal of Advance Research in Computer Science and Management Studies
Volume 1, Issue 7, December 2013 pg.43-52
© 2013, IJARCSMS All Rights Reserved ISSN: 2321-7782 (Online) Impact Factor: 3.5 49 | P a g e
V. CONCLUSION
The modern economic environment in India is favourable for the growth of the country’s health care service where number
of private entrepreneurs intends to invest their money. With the increasing dominance of private sector in health care in India,
the demand for quality health care service is also growing. In the backdrop of such an environment, it has been found that the
measurement of service quality is an important issue in health care sector. In relation to measurement of service quality
SERVQUAL has been identified a very popular and relevant model that has suggested twenty two parameters for measuring
service quality of health care. A ten point Likert scale on the above-mentioned parameters helps obtain perception of patients
towards the service quality. A factor analysis of the perception score given by patients helps reduce the twenty two parameters
into three factors. These three factors have come up as three dimensions of service quality of health care. Three dimensions
once again represent the three elements of marketing mix either in the form of 3Ps model of service industry or in the form of a
new 3Ps model of health care service where the middle P indicates patient centeredness.
References
1. Babakus E. and Mangold W.G., Adapting the SERVQUAL Scale to Hospital Services: An Empirical Investigation, HSR: Health Services Research 26:6,
pp: 767-786, 1992.
2. Bhattacherjee P K, A Novel Service Quality Measurement Method with Minimum Attributes(SERVQUAL-MA) of a Service Industry Involving Human
Interactions, International Journal of Innovation, Management and Technology,Vol.1, No.1, pp: 106-109,2010.
3. Bisht R, Pitchforth E and Murray F S, Understanding India, globalization and health care systems: a mapping of research in the social sciences,
Globalization and Health, 8:32, pp 2-15, 2012.
4. Brahmbhatt M, Bashir N and Joshi N, Adapting the SERVQUAL Scale to Hospitals Services: an Empirical Investigation of Patients’ Perceptions of
Service Quality , International Journal of Multidisciplinary Research Vol.1 Issue 8, pp: 27- 42, 2011.
5. Gunawardane G, Total Experience as a Dimension of Quality in Services - A Study in the Health Care Industry, California Journal of Operations
Management, Vol. 9, No. 1, pp:91-103, 2011.
6. Gabriel E, Managing the Expanded Marketing Mix (EMM): A critical Perspective Approach, (From 4Ps to 7Ps), The African Journal of Finance and
Management, Vol. 15, No 1, pp: 1-28, 2005.
7. Ibraheem S and Al-Hawary S, Health care services quality at private hospitals, from patients’ perspective: A comparative study between Jordan and Saudi
Arabia, African Journal of Business Management, Vol.6, No. 22, pp : 6516-6529, 2012.
8. Ikiz A K and Masoudi A, A QFD and SERVQUAL Approach to Hotel Service Design, Isletme Fakültesi Dergisi, vol 9, no 1, pp: 17-31, 2008.
9. Itumalla R and Acharyulu G.V.R.K., Indian Healthcare and Foreign Direct Investment, Asia Pacific Journal of Marketing & Management Review, Vol.1
No. 2 pp:57- 69, 2012.
10. John J, Is India for an Overhaul in Health Care? Economic and Political Weekly, vol. XlV no.20, pp: 14-17, 2010.
11. Kavitha R, Factors Influencing the Service Quality Gap between Expected Service and Perceived Service- A Study of Sri Gokulam Hospitals, Salem
International Journal of Business and Management Invention Volume 1 Issue 1 PP.30-36, 2012.
12. Kotler P, Armstrong G, Agnihotri Y P and Haque E (2010). Principles of Marketing, 13th edition, Pearson Education Inc., pp: 46-48.
13. Lam SSK, SERVQUAL: A tool for measuring patients” opinions of hospital service quality in Hong Kong. Total Qual Manage , 8, pp:145-152, 1997.
14. Muzondo N and Mutandwa E, The Seven Ps of Marketing and Choice of Main Grocery Store in a Hyperinflationary Economy, Contemporary Marketing
Review Vol. 1(9) pp. 01 – 18, 2011.
15. Parasuraman A., Berry L., SERVQUAL: A multiple item scale for measuring consumer perceptions of service quality, Journal of Retail, Vol.1, pp: 12-40,
1988.
16. Rafiq M and Ahmed K P, Using the 7Ps as a generic marketing mix: an exploratory survey of UK and European marketing academics, Marketing
Intelligence & Planning, Vol. 13 No. 9, pp: 4-15, 1995.
17. Rahman S M, Khan A H and Haque M, A Conceptual Study on the Relationship between Service Quality towards Customer Satisfaction: Servqual and
Gronroos’s Service Quality Model Perspective, Asian Social Science; Vol. 8, No. 13,pp: 201-210, 2012.
18. Ramez S W, Patients' Perception of Health Care Quality, Satisfaction and Behavioral Intention: An Empirical Study in Bahrain, International Journal of
Business and Social Science Vol. 3, pp: 131-141, 2012.
19. Shabbir S, Kaufmann H R and Shehzad M,Service quality, word of mouth and trust: Drivers to achieve patient satisfaction, Scientific Research and Essays
Vol. 5(17), pp: 2457-2462, 2010.
20. Shah U and Mohanty R, Private Sector in Indian Healthcare Delivery: Consumer Perspective and Government Policies to promote private Sector ,
Information Management and Business Review, Vol. 1, No. 2, pp : 79-87, 2010.
21. Yesilada F and Direktör E, Health care service quality: A comparison of public and private hospitals, African Journal of Business Management Vol. 4,
No.6, pp: 962-971, 2010.
Dr. Ranajit Chakraborty et al.., International Journal of Advance Research in Computer Science and Management Studies
Volume 1, Issue 7, December 2013 pg.43-52
© 2013, IJARCSMS All Rights Reserved ISSN: 2321-7782 (Online) Impact Factor: 3.5 50 | P a g e
22. Youssef FN, Health care quality in NHS hospitals. Int. J. Health Care Qual. Assur. vol 9, no.1, pp: 15-28, 1996.
23. Zarei A, Arab M, Froushani A R, Rashidian A and Tabatabaei S M G, BMC Health Services Research vol 31 no.12,pp:1-16, 2012.
24. Zisis P, Garefalakis A and Sariannidis N, The Application of Performance Measurement in the Service Quality Concept: The Case of a Greek Service
Organization,Journal of Money, Investment and Banking, Issue 9, pp: 20-45, 2009.
25. Zeithaml VA, Berry LL, Parasuraman A, The behavioral consequences of service quality. Journal of Marketing , Vol. 60, pp:31-46, 1996
Appendix – I
Perception Scores of Patients
Twenty Two Variables in the form of statements(St.)
No. of
Respond
ents
St.
1
St.
2
St
3
St
4
St
5
St
6
St
7
St
8
St
9
St
10
St
11
St
12
St
13
St
14
St
15
St
16
St
17
St
18
St
19
St
20
St
21
St
22
1 7.5 7.5 5 5 4 4 5 5 4 3 4 3 5 2 2 2 3 3 4 3 4 5
2 8 8 5 5 5 6 6 6 6 5 5 4 4 5 4 7.5 5 4 3 3 4 4
3 8 7 5 5 5 5 6 5 5 5 5 5 6 7 5 5 5 4 3 3 5 6
4 8 8 8 8 6 6 8 8 5 4 4 4 4 8 4 8 4 4 4 3 4 4
5 8 8 8 5 3 3 3 5 5 3 3 3 3 3 3 5 3 3 2 2 3 4
6 8 8 8 8 8 8 8 8 7 7 5 6 6 6 8 5 5 4 4 4 5 5
7 8 8 8 5 5 8 8 8 8 5 5 8 3 5 5 8 6 5 4 4 4 4
8 10 8 8 8 8 8 9 8 8 8 8 8 8 8 8 8 8 8 4 4 7 9
9 10 10 10 10 10 10 10 10 10 7 8 5 5 7 10 8 5 5 5 4 8 9
10 10 10 10 8 8 8 7 8 8 8 8 8 8 8 8 10 7 8 4 3 4 8
11 10 10 10 10 10 10 10 10 10 10 10 10 8 5 10 10 10 5 5 4 5 5
12 10 10 10 10 8 10 8 8 10 10 7 8 8 8 8 10 8 8 6 5 6 9
13 9 8 8 8 9 9 9 9 9 9 9 9 9 9 9 9 9 8 6 5 5 8
14 10 8 8 8 8 10 8 8 10 10 10 10 10 5 10 10 6 5 5 5 7 7
15 8 8 8 8 8 8 8 7 8 5 8 5 5 8 5 8 6 6 5 5 7 5
16 10 10 10 8 8 8 8 8 8 8 9 9 9 8 8 10 8 8 4 4 4 4
17 8 8 8 8 8 8 8 8 8 8 8 8 8 8 8 8 8 4 4 4 4 5
18 8 8 8 8 6 8 5 6 6 8 8 8 5 8 5 8 8 5 4 4 5 5
19 10 10 10 10 10 10 10 10 10 10 10 10 10 10 10 10 10 8 5 4 6 9
20 8 8 8 8 8 7 7 8 8 8 8 8 8 8 8 10 10 6 6 5 7 7
21 10 10 10 8 8 8 8 8 8 8 8 8 8 8 9 8 8 5 4 4 7 7
22 10 10 10 10 10 10 10 10 10 10 10 10 10 10 10 10 10 10 10 10 10 10
23 8 8 8 8 8 8 10 8 8 8 8 8 7 5 7 7 8 9 9 8 8 9
24 10 10 8 8 8 10 8 8 8 8 8 8 8 8 8 8 8 9 10 10 8 10
25 8 8 8 7 6 8 8 8 8 9 8 8 8 8 8 10 7 8 10 10 10 10
26 10 8 8 7 6 9 8 8 7 9 9 8 8 8 10 9 6 8 10 10 10 10
27 8 10 10 10 7 8 10 8 8 10 6 8 4 4 4 8 4 8 10 10 10 10
28 8 8 8 6 5 8 8 10 6 8 8 8 8 8 8 8 7 8 10 10 10 10
29 10 8 8 8 8 8 8 8 8 7 7 7 8 8 8 8 8 8 10 10 10 10
30 10 10 8 10 10 8 8 8 9 9 9 9 9 9 9 9 8 9 10 10 10 10
31 10 10 10 10 10 10 10 10 10 10 10 10 10 10 10 10 10 10 10 10 10 10
32 8 8 8 7 5 8 8 8 8 7 7 8 8 7 8 8 8 8 10 10 10 10
33 10 10 10 10 8 7 5 8 8 8 8 8 8 8 8 10 8 8 10 10 10 10
34 9 8 8 8 8 8 8 8 8 8 8 8 8 8 8 8 8 8 9 10 10 8
35 9 9 9 9 9 9 9 9 9 9 9 9 9 9 9 9 9 9 9 10 10 9
36 10 10 10 10 10 10 10 10 10 10 10 10 10 10 10 10 10 10 10 10 10 10
37 10 10 10 10 10 10 10 10 10 10 10 10 10 10 10 10 10 10 10 10 10 10
Dr. Ranajit Chakraborty et al.., International Journal of Advance Research in Computer Science and Management Studies
Volume 1, Issue 7, December 2013 pg.43-52
© 2013, IJARCSMS All Rights Reserved ISSN: 2321-7782 (Online) Impact Factor: 3.5 51 | P a g e
38 10 10 10 10 10 10 10 10 10 10 10 10 10 10 10 10 10 10 10 10 10 10
39 10 10 10 10 10 10 10 10 10 10 10 10 10 10 10 10 10 10 10 10 10 10
40 10 10 10 10 10 10 10 10 10 10 10 10 10 10 10 10 10 10 10 10 10 10
41 9 9 9 9 9 9 9 9 9 9 9 9 9 9 9 9 9 9 9 10 10 10
42 10 10 10 10 10 10 10 10 10 10 10 10 10 10 10 10 10 10 10 10 10 10
43 10 10 10 10 10 10 10 10 10 10 10 10 10 10 10 10 10 10 10 10 10 10
44 7.5 7 8 8 7 7 7 7 7 7 7 8 7 7 7 7 7 8 8 9 9 9
45 10 9 9 9 9 9 9 8 8 8 8 8 8 8 8 10 10 8 10 9 9 9
46 8 7 8 7 7 8 8 8 7 8 8 8 8 7 7 8 8 7 10 9 9 8
47 8 8 8 7 7 8 8 8 8 8 10 8 7.5 8 8 7.5 7 6 10 10 9 9
48 9 8 8 7 7 8 8 8 8 8 8 8 6 8 8 8 7 8 10 10 9 9
49 9 9 9 9 9 9 9 9 9 9 9 9 9 9 9 9 9 10 10 10 9 9
50 10 10 10 8 9 10 10 7.5 8 10 9.6 8 7.5 8 10 10 9 10 10 10 9 10
51 10 10 10 8 5 5 5 7.7 8 5 7.5 8 5 8 5 7.5 8 6 5 5 5 10
52 10 10 10 8 9 5 10 10 8 8 9 10 10 10 10 10 10 10 10 10 9 10
53 10 9.5 9 5 8 10 10 9 9 9 7.5 8 9.5 9 5 9 8 9 5 5 5 8
54 10 10 10 9 9 10 8 7.5 9 10 10 9 7.5 9 10 7.5 10 9 10 9 10 10
55 7.5 7.5 5 5 8 8 10 7.5 6 8 7.5 9 7.5 10 10 7.5 5 8 5 5 5 8
56 10 10 10 8 5 5 5 7.5 8 5 7.5 8 5 8 5 7.5 8 5 5 5 5 10
57 9.8 10 10 9 10 10 10 10 10 10 10 10 10 10 10 10 9 10 10 8 10 10
58 9 10 10 5 8 8 9 7.5 5 5 5 5 9 8 8 7.5 8 8 5 5 5 5
59 10 10 10 9 10 10 10 8 9 9 9.5 10 9 10 10 10 9 10 10 9 10 10
60 10 10 10 8 5 6 6 5 8 5 7.5 8 5.7 7 6 7.5 8 6 5 5 5 10
61 10 10 10 9 10 10 10 10 10 10 10 9 10 10 5 10 10 10 10 10 9 10
62 6.8 6.9 10 8 7 8 7 8 7 6 9 6 6 4 8 8 9 9 9 4 4 10
63 7.9 7.5 7 7 8 8 8 6.8 7 8 7.8 8 6.5 7 7 7.3 8 8 8 8 7 8
64 9.2 8.5 9 8 8 8 9 8.2 8 9 8 8 7.9 9 8 8.4 8 9 9 10 9 9
65 5.9 5.6 5 5 5 3 5 3.5 5 3 3.2 3 3.5 3 3 2.5 4 3 3 3 3 4
66 7.6 7.8 8 8 7 8 7 6.2 8 8 7.1 7 7.5 7 8 7.5 7 8 8 8 8 7
67 8.5 8.5 8 7 8 8 8 6.5 8 7 7.2 9 8.2 8 8 7.9 7 8 9 8 7 6
68 8.2 7.8 8 7 7 8 8 7.5 8 8 7.5 8 7.8 8 8 7.5 8 8 8 8 8 7
69 6.5 6.9 8 6 8 8 7 7.2 7 7 7.2 7 6.8 7 7 6.8 7 8 8 7 8 6
70 8.2 7.5 8 8 8 8 9 7.6 7 8 6.9 8 7.5 8 8 7.2 8 8 8 8 8 8
71 8.2 7.8 8 8 7 7 8 6.9 8 8 6.9 8 7.5 7 8 6.8 8 8 8 8 8 6
72 5.9 5.6 5 5 5 3 5 3.5 5 3 3.9 3 3.5 3 3 2.5 4 3 3 3 3 4
73 7.8 8.5 8 8 8 8 8 7.5 8 8 6.9 8 7.8 7 7 6.2 7 8 8 8 8 6
74 4.8 4.7 5 4 5 3 4 3.3 5 3 3.3 3 3.4 2 2 2.4 3 2 3 3 3 6
75 10 10 10 8 5 5 5 7.5 8 5 7.5 5 7.5 8 5 5 5 5 10 10 9 10
76 8 9 5 9 10 9 8 9 8 8 8 9 9.5 5 8 5 5 5 8 5 5 10
77 10 10 10 8 8 8 9 7.5 8 5 7.5 8 5 8 5 7.5 8 5 5 5 5 10
78 10 10 10 8 5 5 5 7.5 8 5 7.5 8 5 8 5 7.5 8 5 5 5 5 10
79 10 10 10 8 9 10 10 7.5 8 6 10 10 5 8 5 10 8 8 7 5 8 10
80 10 10 10 8 5 5 5 7.5 8 5 7.5 8 5 8 5 7.5 8 5 5 5 5 10
81 10 9.5 9 5 8 5 9 9 9 9 7.5 8 9.5 9 5 9 8 9 5 5 5 8
82 10 10 10 8 5 6 5 7 8 6 7.5 8 5.7 8 5 7.5 8 5 5 5 5 10
83 10 10 10 8 5 5 5 7.5 8 5 7.5 8 5 8 5 7.5 8 5 5 5 5 10
84 7.5 7.5 5 5 8 8 10 8 7 8 7.5 5 7.5 10 10 7.5 5 8 5 5 5 8
Dr. Ranajit Chakraborty et al.., International Journal of Advance Research in Computer Science and Management Studies
Volume 1, Issue 7, December 2013 pg.43-52
© 2013, IJARCSMS All Rights Reserved ISSN: 2321-7782 (Online) Impact Factor: 3.5 52 | P a g e
85 7.5 7.5 5 5 8 8 10 7.5 7 8 7.5 5 7.5 10 10 7.5 5 8 5 5 5 8
86 7.5 7.5 8 5 8 8 8 7.5 8 10 10 5 10 3 10 6 5 5 5 5 5 8
87 7.5 9 9 5 8 8 8 5.6 5 8 7.5 5 9 8 8 10 8 10 5 5 5 8
88 10 9.6 10 8 6 5 5 7.5 8 5 7.5 8 5 8 5 7 8 5 5 5 5 10
89 10 10 10 8 6 5 5 7.5 8 5 7.5 8 5 8 5 7.5 8 5 5 5 5 10
90 10 9.5 9 5 8 5 9 9 9 9 7.5 8 9.5 9 5 9 8 9 5 5 5 8
91 7.5 7.5 5 5 8 8 10 8.5 7 8 7.5 8 7.5 10 10 7.5 5 8 5 5 5 8
92 3.3 3.7 4 3 3 3 4 2.5 4 3 3.3 3 2.7 2 2 2.4 3 2 2 2 3 6
93 4.9 4.8 5 4 4 3 4 3.2 5 3 3.5 3 3.5 2 2 2.5 4 2 3 3 3 6
94 3.9 3.8 4 3 3 3 4 2.5 4 3 3.2 3 2.9 2 2 2.5 3 2 2 2 3 6
95 2.5 4.5 3 4 5 3 5 3.7 5 3 3.9 3 3.8 3 3 2.5 4 2 3 3 3 5
96 6.9 6.5 6 5 5 4 5 4.8 6 4 4.5 4 4.2 4 4 2.9 4 3 3 3 3 5
97 5 5 5 4 5 3 4 3.5 5 3 3.5 3 3.7 3 3 2.5 4 2 3 3 3 7
98 7.9 8.2 8 8 8 8 8 7.9 8 8 7.5 8 8.4 8 8 6.9 8 8 8 7 8 8
99 3 5 7 7 6 5 7 6 6 7 6 6 6 5 5 4 5 4 7 5 4 7
100 3 3 4 3 5 3 3 3 3 4 3 3 3 4 3 3 4 3 2 4 1 3
Source compiled by author
Appendix – II