MEASURING SERVICE QUALITY AND BRAND LOYALTY RELATIONSHIP IN TURKISH LOW COST AIRLINE MARKET: A CASE...
115
MEASURING SERVICE QUALITY AND BRAND LOYALTY RELATIONSHIP ıN TURKISH LOW COST AIRLINE MARKET: A CASE STUDY OF PEGASUS AIRLINES AND ANADOLUJET by Duhan Can ÇAKI Thesis submitted for the degree of Professional Master Department of Business Administration September 2014
Transcript of MEASURING SERVICE QUALITY AND BRAND LOYALTY RELATIONSHIP IN TURKISH LOW COST AIRLINE MARKET: A CASE...

!
MEASURING SERVICE QUALITY AND BRAND LOYALTY RELATIONSHIP ıN
TURKISH LOW COST AIRLINE MARKET:
A CASE STUDY OF PEGASUS AIRLINES AND ANADOLUJET
by
Duhan Can ÇAKI
Thesis submitted for the degree of Professional Master
Department of Business Administration
September 2014
!
Abstract !
The importance of the airline transportation sector in service sector is developing rapidly with
each passing day. The new entrants to the market are trying to take some market share and
existing firms are trying to increase their market share. These airline companies operating in
highly competitive environment are committed to providing quality service in order to meet
customer expectations and preferred customer-centric work.
The way to retain or gain customers depends on creating brand loyalty in low cost airline
industry which is open to international competition. Therefore, the measurement of service
quality, customer brand preference and assessing customer loyalty constitute the main objective
of the study. In this study, a questionnaire was carried on in order to make clear the common
preference of low-cost airline passengers in Ankara Esenboğa Airport.
As a scope of this study, we will evaluate the questionnaire of the relationship between service
quality of Turkish low cost airline businesses and brand preference.
Keywords: SERVQUAL analysis, Low Cost Airline Business, Pegasus Airlines, Anadolujet
Airlines
i

ii!!!
Preface and Acknowledgement !
The service sector is becoming increasingly important in the process of economic development.
Since the early years parallel to service industry, the airline transportation industry remained in a
continuous process of change. The face of these changes taking place in the sector, airline
companies adapt to these changes at once and must become competitive advantage with
responding to the changing needs and expectations. In order to learn changing needs and
expectations, it is essential for the airline companies to have a close relationship with the
customers coming from all around the world. Having knowledge of the services offered to
customers and how airline companies perceive them will shed light on weighing pros and cons of
them. The airline companies’ stuffs which have agility to see themselves from the right
perspective and plan what is to be done in order to ensure continuity of their companies can
create their loyal customers. Thus, brand loyal customers can move one step ahead in the air
transportation sector, which has intense competition.
The result of the research will enable us to look from the right point to the low cost airline sector
and to assist them in making their decisions. In this study, customer perceived service quality is
determined by dint of examining the difference between customer expectations and perceptions.
Thus, the elements of perceived quality over the impact on brand loyalty examined and has been
tried to be helpful on future decisions of low cost airline business in Turkey.
For a clearer understanding of the research, information related to the air transport sector and
concepts of forming research were collected in five sections. After some introductory
information, concept of service and service quality is covered in second section. Respectively,
brand loyalty concept and the emergence and development of low cost airline business from
iii!!
global to local are covered in third and fourth sections. The final part of the study was given a
place to a questionnaire about passengers’ conception of their brand loyalty on Turkish low cost
airline business and companies, which has flight from Ankara Esenboğa Airport.
First of all I would like to thank my advisor for his assistance during the study period. Secondly,
I owe a favor to my respectable classmate Ahmet Aksoy for encouraging me to register this
MBA program. Finally, I would like to state my sincere appreciations to my dear fiancée
Duygu, my dear father Yusuf, my dear mother Gülay, my dear brother Furkan and my dear
friend Enes for proof reading.

iv!!!
Declaration Statement !
I hereby declare that the thesis is based on my work except citations, which have been duly
acknowledged. I also declare that it has not been previously or concurrently submitted for any
other degree or other institutions.
Duhan Can ÇAKI
September 2014

v!!!
Contents Abstract!.......................................................................................................................................................!i!
Preface and Acknowledgement!.................................................................................................................!ii!
Declaration Statement!...............................................................................................................................!iv!
List of Tables!............................................................................................................................................!viii!
List of Figures!............................................................................................................................................!ix!
INTRODUCTION!.....................................................................................................................................!1!
CHAPTER 1: SERVICE CONCEPT AND SERVICE BUSINESS!......................................................!4!
1.1 Service Concept!................................................................................................................................!4!
1.1.2. The Importance of Service!......................................................................................................!5!
1.1.3. Features of Service!...................................................................................................................!5!
1.2. Service Sector and Service Business!..............................................................................................!8!
1.3. The Importance of the Service Sector!...........................................................................................!8!
1.4. General Features of Service Sector and Service Business!.........................................................!10!
1.5. Service Sector Role in Economy!..................................................................................................!10!
1.6. Differences between Manufacturing and Service Sector!...........................................................!11!
1.7. Quality of Service Concept!...........................................................................................................!12!
1.7.1. Definition of Quality of Service!.............................................................................................!12!
1.8. Service Quality Perceptions!.........................................................................................................!13!
1.9. Dimensions of Service Quality Perception!..................................................................................!15!
1.10. Relationship of Service Quality and Customer Satisfaction!....................................................!16!
1.11. Precautions of the Improvement of Service Quality Perceptions!...........................................!17!
1.12. Challenges in Improving Service Quality!.................................................................................!17!
CHAPTER 2: BRAND LOYALTY!........................................................................................................!18!
2.1. Brand Loyalty Concept!................................................................................................................!18!
2.2. Brand Loyalty!...............................................................................................................................!18!
2.3. Types of Brand Loyalty!................................................................................................................!19!
2.3.1. Cognitive Loyalty!...................................................................................................................!19!
2.3.2. Affective Loyalty!....................................................................................................................!19!
2.3.3. Conative Loyalty!....................................................................................................................!20!
2.3.4. Action Loyalty!........................................................................................................................!20!
2.4. The Importance of Brand Loyalty!...............................................................................................!20!
2.5. Creating Brand Loyalty!...............................................................................................................!21!

vi!!
2.5.1. Factors of Creating Brand Loyalty!......................................................................................!23!
2.6. Factors Affecting Brand Loyalty!.................................................................................................!24!
2.6.1. Internal Factors Affecting Brand Loyalty!...........................................................................!24!
2.6.2. External Factors Affecting Brand Loyalty!..........................................................................!27!
2.7. Strategic Importance of Brand Loyalty!......................................................................................!28!
2.7.1. Reduce Marketing Cost!.........................................................................................................!28!
2.7.2. Provides Commercial Power!.................................................................................................!29!
2.7.3. Attract New Customer!...........................................................................................................!29!
2.8. Brand Loyalty Development Programs!......................................................................................!29!
2.8.1. Incentives!................................................................................................................................!29!
2.8.2. Customer Loyalty Card!.........................................................................................................!30!
2.8.3. Customer Clubs!......................................................................................................................!30!
2.8.4. Making Prize Contest, Coupons, Gifts and Free Products!.................................................!30!
2.9. Brand Loyalty Models!......................................................................................................................!30!
2.9.1. Bernoulli Model!......................................................................................................................!31!
2.9.2. Markov Models!......................................................................................................................!32!
2.9.3. Entropy Loyalty Model!.........................................................................................................!33!
2.9.4. Linear Learning Model!.........................................................................................................!33!
2.9.5. New Trial Model!....................................................................................................................!34!
CHAPTER 3: LOW COST AIRLINE BUSINESS!...............................................................................!35!
3.1. General Structure of the Air Transport Sector and Scope!........................................................!35!
3.1.2. Regional Development of Air Transportation Industry!.....................................................!36!
3.2. Airline Business Models!...............................................................................................................!39!
3.2.1. Historical Development of Airline Business Models!...........................................................!39!
3.3. Airline Models!...............................................................................................................................!40!
3.3.1. Traditional Airline Model!.....................................................................................................!40!
3.3.2. Charter Airline Model!...........................................................................................................!41!
3.3.3. Regional Airline Model!..........................................................................................................!41!
3.3.4. Low Cost Airline Model!........................................................................................................!42!
3.4. Low Cost Airline Businesses!........................................................................................................!43!
3.4.1. Low Cost Airline Business Concept and Scope!...................................................................!43!
3.4.2. Emergence of Low-Cost Airline!............................................................................................!43!
3.4.3. Characteristics of Low-Cost Airline!.....................................................................................!49!

vii!!
3.4.4. Cost Comparison between Low Cost Carriers and Traditional Airline Operations!........!57!
3.4.5. Differences between Low Cost Carriers and Charter Airline Operators!.........................!57!CHAPTER 4: RESEARCH OF MEASURING SERVICE QUALITY AND BRAND LOYALTY RELATIONSHIP ıN TURKISH LOW COST AIRLINE MARKET!.................................................!61!
4.1. Purpose and Importance of Research!.........................................................................................!61!
4.2. Research Constraints!....................................................................................................................!61!
4.3. Hypothesis of Research!.................................................................................................................!62!
4.4. Research Methods!.........................................................................................................................!63!
4.4.1. Research Methods!..................................................................................................................!63!
4.4.2. Populations and Sampling!.....................................................................................................!65!
4.4.3. Determination of Data Collection Tool!................................................................................!66!
4.4.4. Data Collection Tool!..............................................................................................................!66!
4.5. EVALUATION OF RESEARCH DATA!....................................................................................!67!
4.5.1. Reliability Analysis!................................................................................................................!67!
4.5.2. SERVQUAL Scale Findings and Evaluation of SERVQUAL Score!.................................!68!
4.5.3. Findings of Service Quality Dimensions!...............................................................................!71!
4.5.4.! SERVQUAL Score Calculation!.........................................................................................!74!
4.5.5. Weighted SERVQUAL Score!...............................................................................................!76!
4.5.6. Examination of Research Hypothesis!...................................................................................!78!
CONCLUSION!........................................................................................................................................!85!
REFERENCES!........................................................................................................................................!89!
APPENDIXES!..........................................................................................................................................!99!
Survey Sample!......................................................................................................................................!99!
!
!

viii!!
List of Tables
Table 1: SERVQUAL Dimensions Reliability Analysis Results ................................................ 68
Table 2: Passenger’s Age Variable .............................................................................................. 69
Table 3: Passenger’s Gender Variable ......................................................................................... 69
Table 4: Passenger's Education Level .......................................................................................... 70
Table 5: Passenger's Job Details .................................................................................................. 70
Table 6: Passenger’s Monthly Income Variable .......................................................................... 71
Table 7: Scores of Passengers Perceptions and Expectations ...................................................... 73
Table 8 : SERVQUAL Scores in Quality Dimensions for Pegasus Airlines ............................... 77
Table 9: SERVQUAL Scores in Quality Dimensions for Anadolujet Airlines .......................... 77
Table 10 : The overall satisfaction degree of Pegasus Airlines customers and their preferences
again .............................................................................................................................................. 79
Table 11: The overall satisfaction degree of Anadolujet customers and their preferences again79
Table 12: Chi-Square Test for hypothesis 1 ................................................................................ 80
Table 14: The overall satisfaction degree of Pegasus Airlines customers and their
recommendation to others ............................................................................................................. 80
Table 15: Chi-Square Test for hypothesis 2 ................................................................................ 81
Table 16: The overall satisfaction degree of Anadolujet Airlines customers and their
recommendation to others ............................................................................................................. 81
Table 17: The overall satisfaction degree of Pegasus Airlines in-flight catering and other
services and their preference again ............................................................................................... 82
Table 18: The overall satisfaction degree of Anadolujet Airlines in-flight catering and other
services and their preference again ............................................................................................... 83
Table 19: Consumer promotion activities of Pegasus Airlines and its relations with customer
decision ......................................................................................................................................... 83
Table 20: Consumer promotion activities of Anadolujet Airlines and its relations with customer
decision ......................................................................................................................................... 84
!

ix!!
List of Figures
Figure 1: Values of Brand Loyalty Caused ................................................................................. 28
Figure 2: Air Transportation Passenger Traffic by Region in 2012 ............................................ 36
Figure 3: Low cost Airlines from Gulf Countries ........................................................................ 46
Figure 4: Airline operating expenses ........................................................................................... 57
Figure 5: Research Model ............................................................................................................ 64
x!!!
List of Abbreviations
ACI: Airports Council International
ASK: Available Seat Kilometers
Bmi: British Midland Airways
ES: Expected Service
EU: European Union
Flypgs: Pegasus Airlines’s Website
GDP: Gross Domestic Products
ICAO: International Civil Aviation Organization
LCC: Low Cost Carriers
OECD: Organization for Economic Cooperation and Development
PS: Perceived Service
R&D: Research and Development
SPSS: Statistical Package for the Social Sciences
UAE: United Arab Emirates
US: United States

1!!!
INTRODUCTION
!
A product can come into a prominence with a name, logo or symbols and these elements become
unified with the product in the competitive environment. The main purpose of the product with a
name, logo or symbols can continue to be referred as the forefront of the brand in the competitive
environment. However, only unifying product with aforementioned elements under the high
competition alone may not be sufficient. Brand should be of a value in the consumer's mind.
Therefore, value measurement takes place as an important step in the branding process. The
brand which has created a positive or negative image in the minds of consumers is extremely
important for businesses. Maintenance of a positive image converted from a negative image will
be possible with learning of consumers thoughts. For this purpose, it is required to determine
consumer oriented brand value. When related literature is reviewed, the significant level
reference area comes from Aaker's (1991) study. At the end of his study, Aaker (1991) states
that brand awareness, brand loyalty and perceived quality are the main three elements of brand
value.
Assessing the quality of service for consumers is more difficult than to assess the quality of the
product. The quality of service perceived by customers will occur at the end of the comparison
with the quality of service and actual quality of service which expected by customers.
Service quality perceptions are the result of comparing consumer expectations and actual service
performance.

2!!!
In the second part of the study, the concept of service and service quality were considered. In
order to improve the quality of services in developing business, it must be have to be focused on
customers that defining quality in clear way, well-trained and motivated employees are required
to define quality in a clear way. In the second part of the study, the concept of service and
service quality were considered.
The concept of customer loyalty in service firms as another important factor is the brand loyalty.
the third part of the study were examined within a theoretical framework of brand loyalty.
There are several reasons for preferring a brand and making it loyal to its customers. Business
departments should research the factors which will form a basis for creating brand loyalty and try
to redirect the demands towards their brand hence the consumer's loyalty to what they will be
developing.
In our era, air transport has become one of the world's most important industries. With the
impact of globalization, travel opportunities has increased and extremely important contribution
has become with the intersection of these two concepts.
Except charter and some international destinations, Turkish Airlines, which has a monopoly in
the domestic market until the last months of 2003. From that time till today, with the opening of
domestic routes to private airlines has shown tremendous growth. Many companies have entered
the market, experienced a large increase in passenger demand and competition in the sector has
increased rapidly.
Low cost airline model (LCC model) is a business model which addresses to economic
passengers depends on keeping low cost and efficient use of resources. In order to ensure the

3!!!
lowest cost, high service costs and some expenses are restricted. Low cost airline company
phenomenon is much more recent issue in Turkey compared to Europe and America. Turkey is
closely related in the European low cost airline companies in the sphere of competition. In the
fourth chapter of the study, low cost airline (LCC) model is examined.
In order to be one of the preferred ones within customers from all around the world, airline
companies, which operate in intensely competitive environment, have to meet customers'
expectations, work in a customer-centric way and provide them with a good service. The way of
having a customer depends on spreading the loyalty in the low cost airline market which is open
to international competition and which contains all range of players in its sphere. Thus, the main
objective of this study is to evaluate the cases related to the customer loyalty in Turkish Low
Cost Airline market. Within this scope of understanding, the fifth part of the study was formed
with a questionnaire, which shows brand loyalty in Turkish low cost airline business presenting
the companies which has flight from Ankara Esenboga Airport.

4!!!
CHAPTER 1: SERVICE CONCEPT AND SERVICE BUSINESS
!
1.1 Service Concept
According to Rao (1998) the process of globalization and information technology is rapidly
changing traditional view of the service sector. Service is began to be used more than in the past,
and the concept has become an expanding area.
When Economic and sociological change of the concept of service are handled in different ways,
there is faced with different definitions. Say et.al. (1964) defined that all non-production
activities which add a certain benefit, however, Smith et.al. (1937) mentioned that all activities
which has not got any tangible outcomes. On the other hand Marshall (1892) claimed that
operations which consumed during the production time. As Kotler and Armstrong represented
(1991); service as offered things by one party to other party or parties, as basically anything that
cannot be touched and as an activity that does not result in the ownership of anything.
Stanton et.al. (1991) mentioned that physical and psychological elements which could meet the
consumer's needs to clear away the problems create good image in demander’s minds as a whole.
Goods; tangible marketing component that can be perceived through the senses, while services
usually cannot be detected by the sensory organs, the abstract, but it can be defined as marketing
component that can be felt by consumers. A consumer with its material, color, brand, packaging

5!!!
and such other qualities, perceives a smartphone. In contrast, a consulting service, cannot be
seen by the consumer as concrete, but can be felt.
1.1.2. The Importance of Service
According to Seyran (2004) the first usage of concept of the service sector was used by Allen
Fisher's work 'The Clash of Progress and Security' in 1934. Apart from the old history of service
production, service sector has made a great development following the period of industrialization
in 20th century.
In recent years, the service sector's share in the country's economy grew much more than
agriculture and industry sectors share. Especially in developed countries, the share of the service
sector is higher than compared to other industries. For this reason, the service sector increase its
share in the country's economy and this case is interpreted as an increase in the level of
development of the country.
These developments in the country's economy are becoming even more important day by day.
Hence there is an increasement in the importance the service sector concept and sector
1.1.3. Features of Service
The known first step of quality applications in the service sector consists of differences between
the characteristics of services and distinction between other sectors. According to Zeithaml and
Bitner (2000) service has five major important features. These features are respectively,
intangibility, heterogeneity (variability), simultaneous production and consumption, ownership
and dishoarding.

6!!!
1.1.3.1. Intangibility
This concept can be supervised as the basic difference between services and goods. Service
intangibility is the key point for service production. According to Zeithaml and Bitner (2000)
services rather than the other tangible elements which are classified into performance class, is
not considered with visibility, sensitivity, touchability etc.
There are two different means of intangibility concept. First one is to be one of the untouchables
and inability of someone to feel something. Second one is inability to easily identify and inability
to easily mental detect. (p. 4).
1.1.3.2. Heterogeneity
Services generally come into prominence as the result of performances done by the people.
Because of this reason it is impossible to see two presentations of the same service performance.
A service quality and cost can vary from manufacturer to manufacturer consumer to consumer as
days go by. According to Lovelock (2001) customers usually perceive equivalent both personnel
that servicing and the services which are offered.! Different expectations and customer
experiences are two of the reasons the variability of service can offer. Therefore, the services
which offer variables may be specified as the result of interaction between subsidiaries.
1.1.3.3. Simultaneous production and consumption
This feature describes lacking of time separation in service creation (produced) and presentation
(consumed) with consumers. It cannot be removed from the service production process. More
simple words, while the production of products and its consumption separate functions, this
situation is not valid for services.

7!!!
According to Zeithaml and Bitner (2000) products are manufactured, then sold and eventually is
consumed. On the other hand, services request/sold first then consumed simultaneously. This
feature of the service means that customers are the part of the service. As a result of
simultaneous production and consumption, people who present a service see customers as an
important input of service experience and see themselves as a part of the service.!Because of this
feature of the service, many people in service industry make efforts in the direction of both
production and marketing areas. In a sense, customers rent all these services in related firms'
factory, buy and consume there.
1.1.3.4. Ownership
Customers can also take place in service production process and this is one of the important
features of service businesses. According to Ozturk (1996) due to the participation of the
customer in the service production process, some issues which cannot be evaluated in the
traditional production activities have to be taken into account in service businesses. Service is an
experience occurring in service environment for customers. Therefore, if service environment
has been designed in accordance with customer expectations, the quality of service is increased.
1.1.3.5. Dishoarding
Because of a performance product, services are not stored, stocked, resold and cannot be
changed. In other ways, the free capacity which appear in the service production will not store
for future use. For example, empty seats in a tour or empty beds in a hotel means that they serve
under their capacities. In addition, Zeithaml and Bitner (2000) claimed that fluctuations in
demand is a common condition in service sector. Fluctuations in demand is evident a certain
hour/time period (in airline industry or restaurants), on certain days of the week (in entertainment
place), in certain months of the year (holiday package, tax services)
8!!!
1.2. Service Sector and Service Business
The service sector is becoming increasingly important role in the development process of
economy in today. According to Keller and Wilderom (1992) starting from the second half of
twentieth century, service sector has been passing all industries and agricultures in both
developed and developing countries. Intangibility of service can occur some difficulties in
identifying and evaluating service businesses. However, defining business services are not as
complicated the concept of service. A service business is a place where the service is marketed.
These types of businesses are also called pure service businesses.
Pure service businesses primarily are a place where services are sold. For example, airports, law
offices, banks are typical examples. Transferring any physical goods or presenting service with a
physical product does not change this fact. Because such a transfer is temporary and does not
constitute the focus of business activity.
1.3. The Importance of the Service Sector
Globalization, technological developments and information age help people to provide easy
access to information and in line with these developments are rising to people's living standards.
Rising standards of living increase the importance of services and have led to the rapid growth of
service sector day by day. These developments and rapid developing rate of service sector
caused to find themselves in a fierce competition. In this respect, ensuring quality in intense
competition is essential for business in order to survive in the market.
The service sector has a great importance in creating infrastructure of both domestic and foreign
markets in national economies. Therefore, it has a particular importance in terms of trade.
According to Buera and Kaboski (2009) commercial performance of an economy significantly

9!!!
depends on the effectiveness of the service sector. Service sector in the national economy plays a
decisive role in terms of employment, entrepreneurship and creating new opportunities in the
areas of investment and raising the standard of living. All these depending, the sector has
increased world trade and its investment in recent years.
According to Oztürk (1998) when examining share of service sector in Gross National Product of
many countries, this share has increased steadily. Strength of the service sector in the economy
seen that in a first place of providing employment. The economy where has produced more than
half of GDP is said Service economy. Within this direction, statistics show that developed
western countries are proving to transform to service economy.
According to Alajaasko’s study (2008) for Eurostat, current works out of 67% of member
countries of the European Union are covered by service sectors in 2005. 56.7% of the works
where man worked and 82.9% of the works where woman worked constitutes of the service
sector. Organization for Economic Cooperation and Development (OECD) explained that after
oil crisis in 70s, service sector's role increasing of the employment in world level.
The level of economic development of the service sector has a correlation between the powers of
service sector. It is not clear whether a strong service sector caused economic development or as
a result of economic growth caused service sector.
According to Kirgiz (2014) the proportion of workers in the service sector in developed
economies are higher this ratio is lower in developing and least developed countries. The service
sector gaining more importance in the national economies as well as in world trade. The US, the

10!!
UK, Germany, France and Japan are seen as taking the lead in top service exporting countries
list.
Services have a number of different characteristics from products has brought some difficulties
in measuring the quality of service. These features and critical role of human factor which
determining service quality determining important to customer perception of service quality. In
this case, we may say that businesses, which will offer, better quality of service than its
competitors could achieve and gain a sustainable competitive advantage.
1.4. General Features of Service Sector and Service Business
Due to the unique characteristics of services, it is natural that difference between service
business and business, which produced tangible products. According to OECD outlook (2001)
the properties, which impact on decisions taken in service enterprises, can be explained as
follows.
i. There is no flexibility in production management.
ii. It is labor intensive.
iii. Quality and quantity measuring facilities are limited.
iv. Cost calculation is very difficult.
v. Is usually close to market.
vi. Difficult to define the target market.
1.5. Service Sector Role in Economy
Production is a heart of industrialized societies while manufactured goods was a sign of wealth.
During the transition period to knowledge societies, service sector developing rather than the

11!!
manufacturing sector. This new sectors take the place of physical goods production in knowledge
societies. They will also have a potency of developing greatly as known new profitable sectors.
According to Kurtulmus (2001) with information technology in the service sector, especially in
the field of communication, causing of many services is to gain a commercial character. This
new sector to cover the services of production clearly shows that importance of them on a world
scale is increasing day by day. As Erdal and Zengin (2000) claims that the service sector which
operates in various areas has a very important role as a measure of economic development. For
instance, according to World Bank' wealth level ranking research, the relationship between
wealth level and service sector are outstanding. Service sector in industrialized western countries
have a ratio of 50%-70% in total workforce.
1.6. Differences between Manufacturing and Service Sector
Goods are a physical substance, which is produced to meet an existing demand from the
customers. Property can be owned and property can be changed. Goods provided by services
differ in terms of their features of intangibility, heterogeneity, perishability etc. Goods those are
tangible can be moved, stored and transported. As a general rule, goods are produced in a
different place from where it can be consumed. Service cannot be traded separately from the
production. The output structure is different in the service sector and performance is very
important in the evaluation of project. Active user's participation in the production of service the
service user's active participation in the production and customer constitute a part of customer
service. Production is consumed simultaneously and customer does quality control process. So,
this progress is not objective.

12!!
1.7. Quality of Service Concept
According to Romanovski (1982) service concept was introduced in mid of 70s. The concept of
quality of service in the marketing literature was introduced in the early 1980s. Since this period,
academicians and executives have started to develop marketing strategies about this topic.
1.7.1. Definition of Quality of Service
One of the key differentiating points that a service firm should provide more superior quality
services than those of competitors. This is because there is often felt a need to meet expectations
of the targeted customers. Quality item has an inevitable importance in service industry. For
example two of airline companies have Boeing aircraft or two banks may offer the same interest
rates. These organizations operate same business in the same time and place. Service is the only
thing that differentiates their quality from each other.
There are some different definitions, perspectives and difficulties due to the intangibility of
service concept. According to Berry et. al. (1994) quality of service businesses is more uncertain
and complex area than from all implementation and supervision processes as for thinking how
well the quality defines the roles of them. Any consumers who have purchased a product to
decide the product quality may be affected from some features of the product like style, color,
label, packaging, hardness etc. The lack of physical assets may force to make evaluations based
on other properties.! Intangibility of services makes difficulty in understanding of perception in
service quality and the aspects of consumer services ran by enterprises. However, businesses that
do not know how its customers evaluate them in service area will be insufficient to meet
customer wants and needs.

13!!
According to Dursun (2008) defining the quality of service is no matter how difficult, the only
thing that the management should take in to account is that manufacturer and dealer do not
determine quality in service. The fact is defined and determined by consumers. For instance, a
hairdresser might like one of its customer's haircuts at the end of a session. But, if consumers do
not like its own haircut style, in this case, the important thing is that what consumer's think about
the service.
1.8. Service Quality Perceptions
Shoplifting, staff's level of education, behavior/ attitude/ physical appearance, corporate image
and other features are becoming more important day by day. Therefore, the questions in
reference with these issues arise and make up a list.
Basic questions about the quality of service can be ordered in the following:
How can be the quality of service formed?
What are the obstacles to the process of this formation?
What should be done to overcome these obstacles?
In order to answer these questions on the quality of service modeling, research is becoming
increasingly common. According to Esin (2004) one of the most important researches in this area
was carried out by Zeithmel and Parasu. In this research, service is modeled as a closed loop
with formation of quality exhibited and described as a prevented formation of defects. These two
people’s notes in the beginning are issued as that service quality determination is more difficult
than product quality. Any tangible product, can be seen, tasted as a sample product whenever

14!!
requested from one of them. However service provides once and only when those specific and
instant cases are met.
Esin (2004) continued that one of the other important determination of these 2 writers are
perception of service quality is the result of consumer expectations with actual performance
comparison. The quality of service perceived by customers will emerge with expected quality
of service and actual quality of service.
Service quality perceptions are the result of comparing consumer expectations with actual
service performance and their expectations. Customer expectations consist of previously defined
quality indicators. These indicators have some priorities which have relation with past
experiences of customers, personal needs and expectations. These priorities will differ from
customer to customer.
Quality assessments are done just by looking at the output of services. It also includes an
assessment of the service delivery process. So consumers don’t only evaluate the result of the
service, but also they evaluate the service delivery methods and supplementary services as a
whole. As Antonio (2001), in the light of definitions above two basic assumptions can be
explained in modelling of quality of a service.
1) Consumers are based on experience in assessing the quality of services.
2) In “ES”- Expected service and “PS”- perceived service;
- When ES>PS happened, perceived quality is lower than satisfactory level. The
difference between ES and PS increases will go toward totally unacceptable
quality.
15!!
- When ES=PS happened, perceived quality is satisfactory.
- When ES<PS occurred, perceived quality is higher than satisfactory level. The
differences between ES and PS will be close to ideal quality.
1.9. Dimensions of Service Quality Perception According to Uyguc (1998), many different types of Quality of service approaches have emerged
since 1978. Many different type of approaches have emerged in literature related with the quality
of service since 1978. According to Berry et.al. (1994), they defined 10 quality dimensions for
service industry respectively;
1) Reliability: It means that consistency in performance, services at a time and in other
words do it right.
2) Keenness: It explains that employees are being ready and willing to perform services.
3) Ability: It is the degree of professional knowledge and ability of service providers.
4) Accessibility: It covers the conformity of relationship between business and
approachability to the customer.
5) Kindness: It involves of politeness, respect and friendship of employees in customer
relations.
6) Communication: Employees provide information about the service in which they are
mastered.
7) Credibility: Employees show a sincere interest to the customers. They are also
succeeded in convincing customers to herself/himself.
8) Security: It means that services should be away from the risk of danger and suspicion.

16!!
9) Understanding customer: Particular attention should be given to the customer. That
service employee calls them by customers’ names and that they get acquaintance with
customers are behaviors wished by customers.
10) Concrete Features: The environment in which the services are provided to express
compliance of physical characteristics, the external appearance of personnel, tools,
equipment and their technological advances.
1.10. Relationship of Service Quality and Customer Satisfaction
Customers, which are the driving force in improving the quality of service, offer tips how
business is supposed to generate a service. In other words, customers are the key elements for
enhancing quality of service. In this context, as Berry et. al. (1994) claimed that the factors
which affect customer satisfaction can be listed as follows.
Experiences: Previous experiences are the most important elements for customer satisfaction.
Customers often benefit from past experiences and compared with this when deciding to buy
new services.
Personal characteristics: The degree of social, educational level, physical, expertise,
demographic features of customers are very effective on satisfaction degree of customers.
Verbal communication: The knowledge, which acquired information, their environment about
the services provided.
Factors of situational effect: It includes advertising, technological advances and some activities
like public relations in the product category.

17!!
In order to provide the fastest and most effective service, new organizational structures must be
created in this direction. In order to improve customer relations, satisfaction should be checked,
the control between two parties should be analyzed, analysis should be well measured and the
style of speaking should be well defined. These touchy points are vital for a company’s good
perception of its customers.
1.11. Precautions of the Improvement of Service Quality Perceptions
To improve the quality of services in developing business are required to have focusing on
customers, clearly intended to define quality, well-trained and motivated employees. Continuous
improvement and process driven should be given to all employees. In addition, healthy
relationships between employees, good communication and a strong organizational culture are
extremely important in ensuring the quality of the business.
1.12. Challenges in Improving Service Quality
When service purchased, the quality of a physical property may not be available. This situation
depends on the nature of service, which often evaluates quality. In this case, customer will tend
to make decisions in such quality instruments such as building, staff, equipment etc. If the
service business does not know how customers evaluate services, they also don’t know how
these assessments can be used in any direction. Many services offer a sophisticated service to
ensure whether the sale is considered before. Services relating to certain aspects are expressed
numerically can create quality standards. However, people's behavior is much more difficult to
catch up with these standards. In addition, services are consumed as they are produced. So, it is
very difficult to detect the problematic parts in whole service process at what stage they are.

18!!
CHAPTER 2: BRAND LOYALTY !
2.1. Brand Loyalty Concept
Brands have a leading role on customer choice to decide which product to buy. In this direction,
brand reflects the thoughts of consumers towards products. Brand is identification sign also a
name, symbol, term, or design which differentiate product from competing products/services.
According to Raj (1985) every brand in the consumer's mind is different from the others. This
case caused rather than competition between brands of products. This situation also leads to the
increasing importance of brand loyalty. Because of these and other similar reasons, brand
loyalty is an absorbing concept today.!Before starting to analyze the concept of brand loyalty, it
is useful to look at the improved relevant definition.
2.2. Brand Loyalty
Brand loyalty is a measurement tool of customers who are satisfied with specific brand and
intention of buying the same brand again. In shortly, customers that previously purchased the
brand, at the same time, show satisfaction by buying the product again. In terms of marketers,
brand loyalty is an indicator of expressing consumer’s belief to brand.
According to Biong (1993) brand loyalty creates an invisible bond between the consumer and the
brand. This bond shows its existence during the buying behavior of consumers. Every business
aims to create potential loyal customers in the long term. This situation helps to succeed in their
market to be sustained.

19!!
2.3. Types of Brand Loyalty Oliver (1999) grouped types of brand loyalty under four headings with their stages respectively,
cognitive loyalty, affective loyalty, conative loyalty and action loyalty.
2.3.1. Cognitive Loyalty
In this first step, there has been cited a brand indication that is preferable to the alternatives
according to the nature of consumer’s brand knowledge. At this stage there has also been
mentioned of cognitive loyalty, which is based on sheer brand loyalty faith. According to Back
(2003) cognition can be based on previous or indirect knowledge. It may be also formed with a
new experience, which grounds on knowledge. The concept of loyalty in this stage is directly
related with the brand due to the nature of the information about the brand.!Thanks to the level of
performance information at this stage is routed to brand loyalty. But, this status alone is not
enough. If no measurement has been done to satisfaction level, commitment level alone can not
be deeper than performance of a customer's satisfaction level.
2.3.2. Affective Loyalty
Affective loyalty is the second phase of development. Deciding on an accurate appreciation or
opinions, exploitation of the opportunities happens in reference with whether the total
satisfaction is provided. According to Back (2003) sense of commitment at this stage is
characterized as emotional loyalty. Conceptualization is encoded in the minds of customers.!
Exhibition is done at a result of the tendency to brand loyalty of customers. This situation affects
the degree of trend. This concept has been exposed to the argument against the desire of
indispensable easily. So, this situation affects the degree of trend.

20!!
2.3.3. Conative Loyalty
This third stage of development covers that repeated episodes and developed a positive attitude
towards the brand affected. Han et.al (2011) claimed that desire is arranging for the re-purchase
the same brand again. Then the commitment related efforts is made to have customers to long to
buy the product with their owned passions. As a result, customers want to buy at this stage, but
only intend to remain in this request.
2.3.4. Action Loyalty
In the last stage of development, behavioral control sequence is created to prevent movement
with the desire to overcome obstacles. According to Back (2003)!behavior occur as a result of
putting together of these two cases. The compatibility between the two behavioral controls create
predefined commitment with being ready to move and hanging obstacles. The state of being
ready to move is parallel with the promise of a product or service to be continuous customers in
the future.
In addition to cognitive and emotional behavioral loyalty, commitment models must also be
added. Cognitive performance focuses on effectively commitment and the opinion of the brand
performance. This customer is experienced when focusing to re-purchase this brand.
2.4. The Importance of Brand Loyalty
As Stanton et.al (1991) claimed that, companies' loyalty development programs will bring major
benefits with spending more effort and money. These programs can be listed as the following;
- Brand loyalty reduces marketing costs. So, marketing cost of retaining customers is less
than the cost of gaining new customers.

21!!
- The loyalty of existing customers provides protection against competitors. A customer
satisfied with a brand may not be interested with new entrant to the market.
- Brand loyalty provides bargaining power to businesses across to intermediaries.
Intermediaries put preferred brands on their shelves. If they do not, they know that
customers will change its stores. This gives a major trading power on business across the
intermediaries.
- Brand loyalty saves time in business for it responds to the movements of competitors.
Because loyal customers care to remain in the same business as soon as possible.
- Brand loyalty creates a deterrent force into the potential entrance of competitors in goods
and services area.
- During the price competition between competitors, loyal customers outclass their
business. Because loyal customers are less sensitive to price.
- Loyal customers can affect people in their environment in a positive way about the brand.
This situation helps to gain new customers.
- Brand loyalty has several benefits to customers. Customers do not lose time to look for
other products. They know the praised brand would be more comfortable to buy. This
situation prevents customers from encountering unwanted surprises.
Brand loyalty provides many benefits to the consumer. Consumers will not spend time to
evaluate other alternatives.
2.5. Creating Brand Loyalty
According to Stanton et.al. (1991), there are four approaches in creating brand loyalty. These
approaches are discussed below, respectively:

22!!
1. The first approach; to be the best in the market. To make sure that consumer expectations
and service expectations will be met in same extent or more.
2. In the second approach, adding new approaches to existing products is dominant.
3. In the third approach, brands turn to marketing activities which are part of loyalty
programs. For eg: Harley Davidson motor club. Being a member of this club is the
chance to join launching of new models.
4. The fourth approach is to invest in brand identity, strengthening the market activities.
Advertising is only one part supporting the brand identity. But advertising is one of the most
important elements for continued brand loyalty. As Stanton et.al. (1991) claimed that there are
some circumstances when creating a brand. These conditions are:
a. To standardize the product: If customers purchase A, they will always be faced with
the same standards. For example, all B customers when they enter into any Burger King
chain, they will be aware of the standards of their hamburger.
b. To identify the correct product image: Product A can be a high quality, expensive or
inexpensive product. But, there is only one accurate classification and identification for
this product. For example the-cheap detergents have created a cheap brand identity.
c. Ensure continuity and regularity in product advertising campaign: It is impossible to
make brand a single product with single financing campaign. Producer or service
provider should work with a professional agency, develop a strategy which can continue
for a few years and should not change their agencies frequently.
d. A common strategy should be followed for years: Creating brand identity should be
noted that the very long-term business even knowing that getting serious sales figures in
the short term.

23!!
2.5.1. Factors of Creating Brand Loyalty
According to Anderson and Sulivan (1993) forming factors of loyalties are listed in the following
way below.
2.5.1.2. The Separation of Continuous and Irregular Customers
In this case, separation between usually with a small number of loyal consumers and a large
number of faithless (not loyal) customers occurs in the business sector.
At the end of this step, business should aim to ensure the continuity of loyal customer
satisfaction.
2.5.1.3. Importance of Market Entrance
Market share is the most important indicator of brand success which is recognized by consumers.
If a brand does not get the expected reaction from entering market, then it will be harder to
achieve success.
2.5.1.4. Importance of Coverage
Consumer is considered as a complementary element and a particular category under the specific
brand. For this reason, the disparagement of competing brands will not be good for their image.
2.5.1.5. Brand Concept as a Whole
All these features form part of created pieces of marketing activities. Apart from these, such as
the brand's presentation and distribution will be the factors that affect success. The satisfaction of
the first person that tried the new brand in the market will lead to success.

24!!
2.6. Factors Affecting Brand Loyalty
Intrinsic and extrinsic factors that determine brand loyalty is collected in two groups. Some of
these factors have a positive effect. Some marketing scientists state dissatisfaction or
attractiveness of new products entering the market cause a decline in brand loyalty.
2.6.1. Internal Factors Affecting Brand Loyalty !
According to Lemmink et.al. (2001) the factors which are perceived as determinant in brand
loyalty such as perceived importance / risk ratings, product performance / satisfaction,
demographic features, habit / inertia, innovation and variety seeking, attitudinal brand loyalty,
frequency of purchase, brand awareness / brand sensitivity, the taken time for the brand in the
market / past experience and recommendation are discussed as internal factors.
2.6.1.1. Perceived Importance (Involvement) / Risk Ratings
Involvement concept represents the degree of perceived importance to products or services by
the consumer's point of view. Bergiel and Walters (1989) suggested that, when consumer attach
particular importance to a product or service during the purchasing decision, it will help to
increase knowledge of this product category. If customer try and satisfy to the product, it will
purchase the product/service again and help to develop brand loyalty in its mind. In the case of
low level of loyalty, brand habit can be formed after establishing brand awareness.
2.6.1.2. Product Performance / Satisfaction
Oliver (1999) claimed that consumers will be happy when services offered to meet with their
expectations. Satisfied customers will tend to purchase this brand in their next preferences. This
repetitive purchase which is performance result oriented will create brand loyalty after a while.
25!!
2.6.1.3. Demographic Characteristics
According to Bergiel and Walters (1989), demographic characteristics, which are among the
internal factors that closely affects, brand loyalty. Previously conducted research has been
concluded in various sectors such as age, education, income level and other socio-demographic
characteristics affect to brand loyalty.
2.6.1.4. Habits/Inertia
Customer habit means that there is never felt a need to look for alternative means of goods,
services and brands. For customers, buying goods or services from the same company is easier
than to change them. When customer satisfaction and superiority image are combined with each
other, this habit will help foster customer loyalty.
2.6.1.5. Innovation and Variety Seeking
Some features resulting from the nature of the consumers may prevent loyalty.!For example,
variety-seeking behaviors have an inhibitory effect on the stage of cognitive loyalty and
willingness. Another factor that prevents customers from feeling loyalty to a particular brand is
the presence of multiple brand loyalty. Innovation request could be evaluated as proposals,
which are surprising, and as an unexpected encounter with the situation. These changes in
proposals are natural desire of the people from inside. They choose trends, which address to their
pleasures. For these reasons, not only a single brand, consumers can show their loyalty one of the
few brands simultaneously.
2.6.1.6. Attitudinal Brand Loyalty
Generally, a disposition is defined as the state of individual's attitude towards the object or
human feelings and behavior of the logic. In order to show a consumer's brand loyalty, they must
be connected to the brand on primarily attitudinal aspects. In terms of attitudinal situation, brand

26!!
on an item is for connecting consumers to have positive attitudes toward the brand so that the
consumers can adopt a positive stance on the brand and believe that they may prefer this brand
against the other ones.
2.6.1.7. Frequency of Purchase
As Tıngır (2008) claimed that, as long as buying period between two purchasing becomes more
frequent, the probability of that these consumers are heavy users comes to a high point.
Consumer who has intensive performance during the purchase and acquisition of two short
durations may repeat their previous purchasing behavior.
2.6.1.8. Brand Awareness / Brand Sensitivity
Advertising is criticized more than ever and its effects are reduced. Consumers are easily
accessible to information from anywhere nowadays. However, Tıngır (2008) mentioned that if a
product is available in a product category with a strong advertisement, some might acquire a
strong position in the minds of consumers. As a result of the increase of unknown brands in the
market, consumers are turning to brands, which they know and trust.
2.6.1.9. Taken Time for the Brand in the Market / Past Experience
As Ceritoglu (2004) suggested that, the researches show that the residence time in the brand's
market and past experiences to be effective in creating brand loyalty has been concluded. If
consumer knows a brand for many years, they remain loyal to that brand in the future.
2.6.1.10. Recommendations
In addition to constantly buying brand loyal customers, they want to promote these
brand/product or service to other people. Uzun and Erdil (2009) claimed that this situation

27!!
reveals "brand evangelist" concept. This case provides great advantages to the brand in a
competitive environment on brand loyal customers.
2.6.2. External Factors Affecting Brand Loyalty
The factors which are applied by the departments in business sector have also become apparent
in social responsibility campaigns, promotions and price discounts and product / brand status not
in stock. These issues were discussed below as external factors affecting brand loyalty.
2.6.2.1. Social Responsibility Campaigns
Successful companies create a difference with their contributions to society apart from their
product and services. Because successful companies know that social esteem increases the value
of company. However, according to Kagnıcıoglu (2007) we must not forget that the direction of
their interests’ tendency to use social contribution as a resource will bring more harm than good
results.
2.6.2.2. Promotion and Price Discounts
Frequent promotions and price reductions negatively affect brand loyalty. Shifting probability is
quite high when consumers don’t notice too much of a product's quality or price reductions
occurred in the promotion of these products.
2.6.2.3. Out of Stock Products
So far, very few studies have been examined in "out of stock” situation. This case is among the
factors of the effect of brand loyalty. According to Ceritoglu (2004), when consumers cannot
find its favorite brand, their reactions can change in short and long term. When a consumer
switches to another brand or replace with another product, he or she will buy from another store,
give up buying or preferences will change on further decisions.

28!!
2.7. Strategic Importance of Brand Loyalty
If brand loyalty of existing customers is managed properly, this case offers a strategic value for
businesses. According to Aaker’s study (1991), these values have been presented in the figure
below.
!Figure 1: Values of Brand Loyalty Caused
2.7.1. Reduce Marketing Cost
Brand loyalty has the effect of reducing marketing costs on business. If a customer chances up
on an alternative brand, this could be a significant reason for him or her to change his/her
preference. Additional promotion costs must be accepted for gaining new customers. For this
reason, loyal customers reduce marketing costs.

29!!
2.7.2. Provides Commercial Power
Aaker (1991) mentioned that brand loyalty tool provides commercial advantage against
mediator. In particular, consumers require from retailers to bear the brand they want. If loyal
product isn’t available in the stocks of mediators’ shops, customer will change their shopping
point.
2.7.3. Attract New Customer
Loyal customers can be easily under a spell of the brand usually around them. Satisfied
customers can provide guarantees to potential customers. Satisfied customers with a wide
audience provide a successful image to the second parties.
2.7.4. Responding to the Threat of Competitors on Time
The brand, which has developed thanks to the brand loyalty of customers, its own product
category affects the introduction of new products to market. In addition, brand loyalty allows
responding on competitive actions against businesses. According to Ersin (1999) if the
competitor launch a superior product than loyal product, the concept of loyalty is engaged. Loyal
customer gives chance to his own firms for developing similar or better product.
2.8. Brand Loyalty Development Programs
Nowadays, many loyalty programs are used intensively by the business sector. Businesses that
use the principal of loyalty as a part of their development programs are as follows.
2.8.1. Incentives
As Wreden (2005) claimed that, according to the frequency and quantity of buying, incentive is a
form of awarding. Businesses provide various conveniences for regular customers. One of them

30!!
is on sale. Customers benefit from price reductions in many purchases. The latter are the quota.
Businesses can provide more purchase to their customers by putting various quotas.
2.8.2. Customer Loyalty Card
According to Smith (2008), the main purpose of the usage of loyalty card applications by
business, offering several advantages with providing these car ds to their customer. So,
businesses can create customer database by collecting personal information. The ways of doing
loyal customer are respectively, calling him/her on his birthday to celebrate, sending cards or
sms via mobile phone are frequent methods of connection tool between two parties.
2.8.3. Customer Clubs
Businesses have set up clubs to build better relationships with customers and brand communities.
The aim here is literally to be able to make brand loyal customers. According to Stauss et.al.
(2001), brand communities can be named as the customer clubs; participating communities are
paying a membership fee annually. Becoming members of this club can provide special
discounts, special rights, priority assistance and such other issues.
2.8.4. Making Prize Contest, Coupons, Gifts and Free Products
Short-term retention tools such as prize contest, coupons, gifts and free products are used for
shaping the brand image. Thus, when a customer purchases the product in the next time, he/she
may become more willing to buy. However, this kind of short-term instruments needs to be
aligned with long-term activities such as R&D.
2.9. Brand Loyalty Models
In order to understand how a consumer’s buying behavior transforms into brand loyalty, many
models have been developed to understand the behavioral change process. Brand loyalty models

31!!
refer to consumers with the possibility of choosing a particular brand, the factors influencing the
functional relationship between these possibilities during the buying behavior.
2.9.1. Bernoulli Model
Bernoulli tried to explain the formation of brand loyalty with behavioral terms. According to
Frank (1962), this model the consumer's past experiences has no effect on the current purchase.
Each brand changing possibility remains constant from one acquisition period to the other. This
indicator shows that, our previous purchasing experiences did not effect to current situation. As
Yi and Jeon (2003), Bernoulli model grounds on the presence or absence of the brand
promotions and some similar activities in the store. For example, (on the assumption that all
other variables constant) That X brand in the store becomes more in number than any other
brand, raises the possibility of the purchase of X brand.
Bernoulli model can also be expressed as:
X: Brand, which will be measured in sense of its loyalty
Y: All other brands
t: Moment of purchase
During the moment of buying possibility of brand X is expressed as a purchase possibility P
(Xt). P possibility is determined by cumulative brand choice and all external influences or by
from previous purchase of the product. It is defined by consumer characteristics.
According to Kollat et.al. (1968), in time, due to changes in consumer structures, Bernoulli
model is also developed and discussed in two different formats.

32!!
1. United Bernoulli Model: Although the probability P is fixed for each consumer,
according to the pre-specified probability distribution, the value of p varies between
consumers. In other words, the possibility of buying can be variable for each consumer.
2. Dynamic Bernoulli Model: "P" can vary between individuals from different purchasing
areas under the same standards. In other words, the possibility of buying not only varies
from consumer to consumer. It also affects the likelihood of purchase.
2.9.2. Markov Models
It was developed by a Russian mathematician named Markov. This could be mentioned as the
extension of probability theory, in contrast to consumer preferences in Bernoulli’s model, which
is assumed to be effective for a new purchase. Kollat et.al. (1968) claimed that the number of
bought things in the past affects the degree of current and future acquisitions.
Single degree: The last purchase.
Two degrees: The last two purchases.
Markov models are examined in two parts which heterogeneous and homogenous in the first
order.
2.9.2.1. Homogenous first order Markov model
It is used to evaluate the level of different product purchase in different periods. In this model,
which brand is preferred by how many consumers is determined. In the second purchase of the
same consumers, there may be shifts in brand preference. As a result of this preference shift,
preference of the next brand can be predicted.

33!!
2.9.2.2. Heterogeneous first order Markov model
After a certain time, probabilities arise in that there is a constant transition between brands.
Block et.al. (1976) claimed that, in time, this model has been developed with two different
models.
1) Brand loyalty model: It means that consumer shows full commitment to a particular
brand.
2) Final purchase brand model: If consumers are satisfied with a brand after the
promotion session, there would be higher probability for them to buy the same brand
as their future preference rather than to buy the products of alternative brands.
2.9.3. Entropy Loyalty Model
In this model, it is defined that brand loyalty is different from repeating purchase behavior of the
consumer. According to Kollat et.al. (1968), the basic information in the model are limited
number of market share and number of brand. Therefore it is important for marketers. Because
the market share of the brands in the market is determined with the characteristics of consumers.
2.9.4. Linear Learning Model
In this model, according to Bush and Mosteller (1955) the basic assumption is that past buying
behavior shape their future buying behavior. A consumer's past positive experiences, raises the
possibility of buying the brand. There is a linear relationship between probabilities of pre
purchase and post purchase. This model is different from other models. it includes the impact of
recent acquisitions.

34!!
2.9.5. New Trial Model
This model has been developed to determine the brand choice which is not known before. Your
brand does not need to be new in the market. First time, trial of a brand or have forgotten the
brand's presence is sufficient for the implementation of this model. According to this model,
consumers reach its decision after trying the brand several times. Thus, there arises the
possibility of buying the new brand.

35!!
CHAPTER 3: LOW COST AIRLINE BUSINESS !
3.1. General Structure of the Air Transport Sector and Scope
Air transportation sector covers all airline operations, airport management, air navigation and air
traffic control services, ground handling and catering services, training, maintenance, lower,
upper structures and other aviation related activities, its coordination and control according to the
international standards.
The air transport industry is an industry in itself rather than is an industry that provides input to
other sectors moving the people and products between production and consumption centers.
Therefore, Barnhart (2007) claimed that, in today's globalized world, air transportation industry
provides a combination and interaction between world economies and cultures, facilitate a
balanced distribution of population, quickly transport millions of passengers and billions of
dollars’ worth of goods on the world market. The development of the air transportation industry
helps to increase both governmental and private investments. This situation will enable to create
more competitive and wide economic growth.
Development of the large capacity, fuel saving, low emission levels aircraft in the sector have a
major impact on the activities of the airline business, management, service and quality.
Liberalization and privatization have transformed the industry with a more commercial structure.
Formation of alliances has changed the structure of the industry. Thus, sector was transformed
into a market that is dominated by consumers. In this direction, the examination of development
of the air transport industry on a regional basis will reveal more clearly in the development
process of sector.

36!!
3.1.2. Regional Development of Air Transportation Industry
Regional development of the air transport sector in Europe, USA, Africa-Middle East and Asia-
Pacific region will be explained by addressing respectively.
3.1.2.1. Europe
Smith and Cox (n.d.) mentioned that deregulation that took place in 1978 in the United States has
affected Europe. Subsequently, the third liberalization movement the process of liberalization
has officially entered. The third liberalization movement has brought to end all restriction on the
flight schedules, frequency and restrictions on flight routes. This state allows airlines to fly
anywhere within the EU without any restriction in ticket pricing. In this direction, the
competition began to accelerate between airlines.
Passing to the single market and deregulation law in EU has provided the emergence of low cost
airlines. This business formation has provided not only price sensitive leisure travelers, but also
companies, which aim to save their money.
According to ICAO (2013) and ACI (2013) data, 1.614.933.901 passengers preferred air
transportation in 2012. The years between 2013-2017 passenger growth rates is expected to be
around 3.9% in
Europe.
Number of Passenger Region Total
Passengers 2013-2017 Period Estimated Develop Rate
Europe 1.614.933.901 3.9% America 2.006.472.886 4.1% Asia-Pacific 1.685.367.153 5.7% Africa-Middle East 417.112.773 6.3% Total 5.723.886.663 5.0%
Figure 2: Air Transportation Passenger Traffic by Region in 2012

37!!
3.1.2.2. America
According to five-year development plan which was prepared by State plannıng organization
(2001), liberalization movement that began in 1978 has provided efficiency and development of
the aviation industry in the US. Due to the negative impact that has come with Gulf War, air
transport industry came under a great debt in beginning of 90s. In order to change old and noisy
aircraft, significant amount of capital is needed by airliners. When we came to middle of 90s, the
air transport industry has experienced its most successful years in security and financial aspects.
One year after, the most successful profit history was achievable in the history of the US air
transport industry with the number of $ 2.8 billion profit.
According to ICAO (2013) and ACI (2013) data, 2.006.472.886 passengers preferred air
transportation in 2012. The years between 2013-2017 passenger growth rates are expected to be
around 3.6% in North America and, 4.5% in South America.
3.1.2.3. Asia-Pacific
With globalization effect and moving production where the cheap raw materials and labor places,
have contributed a significant degree of development, development of trade, has helped people to
travel. As a result of this, as to five-year development plan which was prepared by State plannıng
organization (2001) it was claimed that, the demand for air transport of the Asia-Pacific region,
the annual increase has occurred up to 6%. Along with economic liberalization and some other
economical instruments, there had been have given rise to provide the world's most profitable
airlines from 8 out of 15 in the world in this region. Due to the increasing demands on civil
airlines, governments were forced to make some changes on the aviation regulations for the
establishment of new private airline companies. These changes have facilitated the liberalization

38!!
of the sector. It facilitated the entry of private sector via privatization and led to an increase in
the number of airline companies. However, excessive increase of the capacity more than
demands began to decrease companies’ revenue.
Regional and local economic difficulties have led to cooperation between airlines. A part of this
cooperation agreement has helped to sharing of resources, sharing of traffic, aircraft utilization
and increase the efficiency of aircraft.
According to ICAO (2013) and ACI (2013) data, 1.685.367.153 passengers preferred air
transportation in 2012. During the years between 2013-2017 passenger growth rates is expected
to be around 5.7% in Asia Pacific region.
3.1.2.4. Africa – Middle East
Some conflict areas in Israel, some Arabic countries and some North African countries affect
negatively travel and tourism in these areas.
Air transport sector in Africa is not in a position to conduct without government support.
Infrastructure problems, which were experienced by the air, transport sector made impossible to
invest in this sector.
The two countries except (Qatar and UAE) the region remained outside the global competition in
the aviation industry. This problem is solved by some cooperation. According to five year
development plan which was prepared by State plannıng organization (2001), it was claimed that
Arabian Air Carriers Organization members were seen to be growing cooperation particularly in
the field of distribution systems. Companies who are members of this organization established
cooperation with other Arabian carrier and some international carriers from all around the world.
39!!
According to ICAO (2013) and ACI (2013) data, 417.112.773 passengers preferred air
transportation in 2012. The years between 2013-2017 passenger growth rates are expected to be
around 6.3 % in Africa - Middle East region.
3.2. Airline Business Models
Airline operators are working to ensure their superiority over competitors by choosing different
strategies such as cost leadership, differentiation or focusing on niche targets. Depending on
these strategies, according to Butler and Diederiks (2006) there are four main airline business
models known as traditional, charter, regional and low cost airline models (p. 19).
3.2.1. Historical Development of Airline Business Models
In the pre-liberalization period, the traditional flag carriers ruled a significant portion of the
world airline industry. Apart from the traditional airline companies in the industry, charter
carrier was operating at its peak.
In order to carry passengers with an appropriate amount of fee to the market, there were main
focuses on charter companies. This oldest cost oriented model is the basis of low cost airline
model. Taneja (2004) claimed that, this model is able to reduce total costs because it allows high
passenger occupancy rate with more seats in the cabin while, at the same time, it increases
revenue, and provide someone with paying low airport fees with irregular flight schedules and
using secondary airports. However, charter airlines flight schedules cover to a certain period and
particular segment. Therefore, passengers who organize its flight within a certain period of time
preferred traditional airline system.

40!!
As a result of US deregulation and its spread to Europe, low price carriers has emerged. Cost
reductions oriented this third business model in the industry. It is determined low rates system
with cost reductions, which also targeted business model in the industry.
With the introduction of Low-cost airline business model to the industry, customer profiles
became evident within business models. Traditional airlines are based on the concept of
customer satisfaction. They don’t give a service, which cover higher income and generally
business travelers. Charter airlines make position between these two models. Even if it appears
as a close model of low cost airlines, it shows strict differences in practice.
3.3. Airline Models
According to Wensveen and Wells (2011), airlines are classified in various ways which are type
of their operation, marketing and economic issues, passenger profile, scale of operations, playing
role national and international markets by ICAO (International Civil Aviation Organization) and
IATA (International Air Transport Association).
The airline companies operating in the airline industry are divided into four classes related with
their marketing and operation strategies. These are; traditional airlines, low cost carriers, charter
airlines and regional carriers.
3.3.1. Traditional Airline Model
Traditional airline model is one of the biggest airline business models, which made out of a
certain tariff for flights and which have a cabin service with expensive fleet and flight network
services.
According to Ahn and Lee (2011), the traditional flag carriers serve with short-and long haul
fleet types. Traditional airline companies, which tend to have a wide flight networks serve hub

41!!
and have an established spoke network structure. In hub and spoke network structure, one airport
is selected as a center (hub) point and other airports (spokes) are determined around the hub.
Passengers who transported from spokes to hub are distributed to their final destinations. Thus,
traditional airline companies deploy their network areas to wide areas. Higher sales, employee,
service, ground service costs, and low profit margins constitute a significant cost item in
traditional carrier model (pp. 537-539).
3.3.2. Charter Airline Model
Charter carrier models offer non-scheduled flights with leased airplanes. This model generally
operates in a certain period with short or long distance and point-to-point flights. Charter carrier
model is often used in the tourism sector. In the time period when package tour programs that
dominates the sector within the year start, charter flights are organized.
According to Kim and Barnhart (2007) the most important feature of this model is that charter
carriers are operating in a periodic structure (p. 1518).!This point of difference separate charter
airline model from low cost carrier model.
3.3.3. Regional Airline Model
According to Morley (2007), regional carriers are airlines which operate regular flights that have
100 or less seat capacity in their fleets, and operate flights less than 800 km between 2 points (p.
476). Regional carrier companies generally carry from small settlement to larger settlements.
Their direct flight connection web is generally run within this route.
Regional airline model connects two low traffic residential areas with mutual flights. The hub
and spoke system helps for collecting and distributing passenger to their final destinations.

42!!
3.3.4. Low Cost Airline Model
As Lin (2012) claimed that, low cost airline model (lcc model) is a business model, which aim to
gain price sensitive passengers to use resources efficiently and keeping costs low. In order to
ensure the lowest cost, lcc carriers put some restrictions on their service costs and expenses (p.
642). Frequent flights and low wages are the main structures of profitableness in this business
model. Low cost goal provide an important competitive advantage.
Compared with the traditional airlines, low-cost carriers have significant savings on service,
operational and overhead expenses.
As Williams (2001) claimed that, low cost carrier model properties can be listed as follows (p.
278):
- One type of fleet size
- Direct sales
- Outsourcing
- Flight from point to point or hub to hub
- Single class cabin
- Use of secondary airports
- Limited seating arrangement
- High aircraft utilization rate
- Short distance flights

43!!
3.4. Low Cost Airline Businesses
Deregulation of the law has been brought to freedom to fly with their desired price and desired
point. This liberal concept in other term freedom in the airline companies has revealed low-cost
carrier concept of the airline business.
3.4.1. Low Cost Airline Business Concept and Scope
According to Button (2012), low cost airline companies cover second biggest pie out of four
airline models which have low-cost strategy, operations with higher flight frequency, low prices,
and short-haul flights. On these flights, flying from point to another point and catering services
usually are not given (p. 200). As Mason (2001) claimed that philosophy of newly established
low cost carrier, which is the most important success, is to build vehicles in which maximum
number of passengers could be carried with minimum cost understanding. In this respect, there
is a paid catering service inside the aircraft (p. 106).
Again Button (2012) mentioned that, one of the most important factors to minimize costs
involves implementing innovative booking system for low cost carriers. These businesses
provide their ticket sales via internet or call center instead of travel agencies or tour operators (p.
202). This case provides a significant cost advantage in terms of sales expenses.
3.4.2. Emergence of Low-Cost Airline
The first established years of the airline industry, air transportation method is far from the cheap
transportation method. So, there has not been a low-cost transportation in that period. As
Neufville (2006) claimed that, the concept of low-cost airline operating in the sector for the first
time has been emerging with Britannia and Monarch Airlines at the first half of 1960. In the
early years, these airlines have scheduled flights mainly to European countries for tourists.

44!!
However, they have also brought in a serious risk to scheduled flights. Due to tariff agreements,
regardless of the number of passenger, flights have had to be made. Britannia and Monarch
airline companies have been forced in that their scheduled flights must be turned into
nonscheduled flight in a very short time period (pp. 347-348). Risk in charter flights covered by
travel agents could be that all of the seats may be bought. Therefore, airline companies operating
flights are conducted with aircraft and flight crew.
3.4.2.1. Emergence of Low-Cost Airline in United States
Unlike Europe, as Morrell (2005), low cost air transportation concept flowered in the US. In mid
of 60s, Pacific Southwest Airlines started its high frequency flights with Lockheed Martin
Electra planes. Pacific Southwest airlines have continued its activities until the company was
purchased by US Airways (pp. 304-306).
Southwest Airlines is the first accepted airline company, which shows that low cost airlines will
be successful and generate income from this business. According to Southwest Airlines Investor
Relations webpage (2014), this company was founded by Herb Kelleher and Rolling King in
1967. Southwest Airlines has had an extensive flight network in short period with the high flight
frequency and low prices in the US. Southwest Airlines has established itself in domestic
operations without meet difficulties in competition with the largest airline companies. Southwest
Airlines has become world's and America's fourth largest airline in 28 years with operating in 92
airports and carrying 133 million passenger in 2013. Southwest Airlines has 594 aircrafts with an
average of 11.8 years old.
With the exception of Southwest Airlines operating in the United States, as Doganis (2001)
claimed that, some other low cost airlines like People Express, Muse Air and Florida Express

45!!
were able to survive less than 5 years. Except Southwest Airlines, the failure of other airlines
during 1996 and 1997 has been led to huge profits of traditional airline companies. However,
with the increasing traffic in beginning of 2000s, low cost airline companies have gain
significant market share from business sector and it may cause to begin earning huge profits (p.
156). Against the success of the low cost airline business, traditional airline companies have set
up their own low-cost airline business but have never succeeded.
Besides, Air Tran Airways, Frontier Airlines, and JetBlue airlines succeeded with applying
Southwest model and still carry on their activities today. The competition among of low cost
carriers in US may affect negatively development of these companies. As a result of intense price
war in the same lines, some of the low cost carriers will be forced to go bankrupt. This idea is
supported by many aviation authorities.
3.4.2.2. Emergence of Low-Cost Airline in Asia
Low-cost carrier in Asia has emerged by the liberalization of the domestic aviation sector in
Malaysia, the Philippines and Japan. Again Doganis (2001) claimed that, after Southwest was
modeled, low cost airline companies have established centers in Indonesia and Thailand. After
1998, low cost carriers succeeded to drop their unit cost with 20.9% and increase staff
productivity with 22% by their implemented costs and efficiency policies (pp. 49-50).
According to Thomas (2002), Air Asia started to operate taking the example of Southwest and
Ryanair models in 1993. It started with B 737/300 aircraft to provide low cost service. At the end
of the first year the number of aircraft increased from 5 to 9 (p. 46). Air Asia’s ticket prices were
40-60% lower than traditional big airlines. The company carried 42.6 million passengers in 2013.

46!!
Some Gulf countries, which are AirArabia, Flydubai and Flynas, have been creating successful
LCC Carriers since 2003. Corporate information data related to AirArabia (2014), Flydubai
(2014) and Flynas (2014), a figure was created below;
Company Origin country Founded Fleet Size
Number of Destinations
Passenger numbers for 2013
Air Arabia UAE 2003 34 89 6.1 million Flydubai UAE 2009 39 68 6.82 million FlyNas Saudi Arabia 2007 26 23 3.3 million
Figure 3: Low cost Airlines from Gulf Countries
3.4.2.3. Development of Low-Cost Airline in Europe According to Tuzcuoglu (2003) low cost air transportation in Europe has started in 1997 after the
removal of national single competence rights in domestic flights in the European community
member countries (p. 60). This liberalization has dragged effective competition to big airlines.
Newly established low cost airline companies have become a stable threat for big airline
companies. These companies have started to gain market share and profits of big airline
companies in time.
Low cost and non-catering airlines in Europe have emerged in Britain with the help of providing
more opportunities in regulatory laws. Doganis (2001) claimed that, low-cost transportation in
Europe has focused on the purpose of visiting friends and relatives between UK and Ireland first.
The first low cost airline transportation is made by Irish low cost airline Ryanair. It began its
airline operations between Ireland to England by serving both economy and business classes in
1985. Initially, the target market of Ryanair was on travelling with sea transport. London-Dublin
line passengers of Ryanair have doubled in three years. However, despite that they offer low
prices, the company was not able to get operating profit.

47!!
Neufville (2006) mentioned that Ryanair lost 18 million pounds in 1991. This event caused it to
enter into a serious cash shortage. After significant changes in management, Ryanair, has
adopted Southwest's low cost strategy in 1992. At this company, Ryanair adopted non-catering
flights for reducing costs. After this innovation, the demand has increased and company becomes
profitable in 1992. Since 1992, the company has increased its profit every year regularly (pp.
348-349).
Doganis (2001) claimed that, respectively Easyjet in 1995 and Debonair in 1996 started to
operate at Luton Airport in London. After establishment of Easyjet, British Airways has started
to operate its own low cost operator, which is Go-Fly. Following the British Airways, KLM
(Dutch flag carrier company) established its own LCC carrier, which are Buzz airlines in 2000.
In 2001, Virgin Express was established in Belgium.
In 1994, as Doganis (2001) mentioned that an approximate 3 million passengers have been
transported with Low cost carriers. Despite the failure of British Debonair and Norwegian Color
Air, the number of passenger reached 14 million in 1998. In terms of percentage of total revenue
low cost airline’s amount was approximately 2% out of total market. In 1999, this number
increased 17.5 million with doubled revenue compare to the previous year. Malglaive (2003)
claimed that, according to Available Seat Kilometers in another term ASK, low cost carriers
showed 7.2% growth in 2001 with approximately 21 million passengers. Both Ryanair and
Easyjet took respectively 2nd and 3rd place in profitability area. Ryanair's passenger carrying
capacity has grown 37% within this year. Except Virgin Express all low cost airline companies
getting profit within 2011. When we came to 2002 average growth increased 15% with 25
million passengers (p. 33). With the establishment of European Low Fares Airline Association

48!!
(ELFAA), big low cost carriers collected under this umbrella. According to their last report
(2014), their members are respectively EasyJet (United Kingdom) Flybe (United Kingdom) Jet2
(United Kingdom) Norwegian Air Shuttle (Norway) Ryanair (Ireland), Sverigeflyg (Sweden),
Transavia.com (Netherlands) Volotea (Spain) Vueling (Spain) Wizz Air (Hungary). According
to ELFAA report (2014), these 10 low cost companies carried 216 million passengers, an
increase of 6.7% over 2012.
One of the most important indicators of LCC carriers will grow in the future is number of aircraft
orders which they gave to aircraft manufacturers. Sparacco (2002) claimed that, Ryanair has
given of ordering 150 737/800 aircraft and Easyjet did 120 Airbus A319 within the same period
within 2002 (p. 59).
3.4.2.4. Development of Low-Cost Airline in Turkey
According to Turkish Civil Aviation Regulations (1983), there is no information related to
definition, concept and scope of low cost airlines. Low cost airline companies are much more
recent phenomenon in Turkey than in America and Europe. Severe market competition in the
European low-cost airline operating condition is closely related with Turkey. Potential European
Union membership in future years or expected visa exemption increases the importance of
Turkey in the market.
According to Vakif yatirim report (2013), Pegasus Airlines operates only real low cost airline
model in Turkey since November 2005 after purchasing by Esas Holding. Within the next two
years with entering low cost system in Pegasus Airlines to the market, the company had a 64%
growth and all aviation industry had 36% growth. Within 2007, it has been largest private airline

49!!
with 4.1 million passengers. This number quadrupled when we came to end of 2013 with 16.8
million passengers (pp. 1-2).
According to Turkish Airlines Investor Relations and Board document (2014), Anadolujet,
which is a trademark company of Turkish Airlines, and Sunexpress, which 50% of shareholders
managed, by Turkish Airlines are adopting low cost model in Turkey. Additionally to 16.8
million passengers of Pegasus Airlines, Anadolujet carried 7.7 million and Sunexpress carried
6.7 million passengers.
3.4.3. Characteristics of Low-Cost Airline
The typical features of low cost carriers are that reducing cost and providing cheaper service
with giving up some of the services that adopted by traditional airline companies. However, low
cost carrier concept covers many different best practices. These best practices will be examined
in seven different categories below.
3.4.3.1. Low Price Structure
Low-cost carriers are usually offered the lowest prices. Doganis (2001) mentioned that, low cost
and high occupancy rates provide offering lower price, which is 50-70%, compared to traditional
carriers. Low cost airline companies are flying 50-85 Euros in single way in Europe. On the
other hand, in the same line of traditional airlines serving the prices are around 180-200 euros (p.
152). Price-sensitive passengers and leisure travelers prefer low-cost carriers. For instance,
British-Iberia’s (International Airlines Group) budget ticket price is 198 £, while the price of
Easyjet is around 98 pounds.
According to Tuzcuoglu (2003), revenue management concept which aims to maximize the
revenue is implemented by European airline companies. Hundreds of different revenue

50!!
management that implements the same low cost flight. In this way, low cost carriers may offer
more than 5 different prices for the same flight. Sometimes the difference between the highest
price and the lowest price can be up to 3 times. In determining the lowest and highest price of
airline tickets, there is benefited from the date of buying. According to this method, if
reservations are done sooner, ticket price decreases in this line. In other words, when the flight
date nears, ticket prices increases (p.61).
For example, Ryanair sell its flight from Aeroporto Galileo Galilei (Pisa) to Frankfurt in 11€ 6
weeks before from the departure. This flight was sold 170€ one day before from the flight.
However, when we investigate average price for this flight, the price is realized as 50€.
One of the most important innovations is not limited with offering lowest fares in low cost
airlines. Single way and unrestricted ticket are one of the most important innovations in low cost
carriers. When traditional airlines offer low prices, they put some limitations and restrictions in
choice of flight times and day/season periods.
3.4.3.2. Short Haul Flights
Low-cost carriers are usually serve in short and medium-haul markets. Operating short - medium
distance of flights has been caused to eliminate restrictions and decreasing prices. The low prices
and the absence of any restrictions on tickets makes more attractive to fly with it. In addition to
these, a point-to-point flight in LCC increases the revenue and profitability of enterprises per
passenger.
Another reason is not to perform connected flights by low cost airlines, which causes to increase
delay of the flights. According to Doganis (2001), delays adversely affect timing performance
and create some additional costs for carriers.!One of the biggest factors in generating revenue is

51!!
to make numerous making flights for an airline company. Due to the shorter distance than other
major scheduled airlines, low cost airlines use more efficiency in their aircrafts during the day.
According to British Civil Aviation Authority report (2012), while Easyjet was using its aircrafts
10.7 hours in a day average, British Airways, which is the main company of International
Airlines Group, did 7.1 hours in a day.
The lines that operate by low cost carriers are highly profitable lines that have enough potential
to increase seat occupancy rate. For example, in order to able to make a good profit in a
destination, Doganis (2001) mentioned that, Ryanair provides more than 30.000 round-trip
flights. Even if a company does not fly with high price in the same destination, low cost carriers
keep prices low to stimulate demand.
3.4.3.3. Using Single Type of Aircraft
Low cost airline companies usually keep only single type of aircraft model in their fleet. This
situation provides numerous cost advantages, from piloting to maintenance. On the other hand,
Doganis (2001) mentioned that, traditional airline companies using 7-8 different types of aircraft
in their fleet to improve fleet efficiency. Along with the increasing number of aircraft types in
the fleet, they cause to increase training, maintenance, and operation costs. However, big
expense for different types of aircraft type training and the certification of each pilots create an
important cost factor for traditional airlines. For example in order to fly with Boeing 737 family
to a flight crew who has a certificate of A320 family, pilots and respective teams are required to
have a certificate that can be used for this aircraft.

52!!
According to Gross and Bjelicic (2007), Boeing-737/700 and Boeing 737/800 are most preferred
aircraft by low cost airline companies. Due to the low maintenance and operating costs these
medium range airplanes are preferred by many airlines. After A320 family orders by Easyjet,
Airbus that is one of the biggest player in this market also get a crucial role. When we look at
today's low cost airline companies, Jetblue, Wizzair, Airasia, Airarabia, Jetstar, Airasia, Indigo
are crucial A320 low cost operators alternative to Easyjet.
According to Southwest’s website (n.d.), the world's largest low-cost airline Southwest's entire
fleet which consist of Boeing 737 family aircrafts. Today, Southwest has 606 Boeing 737 family
aircrafts. According to Doganis (2001), seat capacity per mile in terms of their direct operational
expenses for 737 families in Southwest has been 20%-40% lower than other the major airline
operators.
Although low cost and traditional airline companies use the same aircraft types, low cost airline
companies are increasing their capacity by making structural changes on aircraft. During the
order period these companies request different configurations from them. Due to short haul
flights, these low cost operators are demanding to lighten the aircraft. Thus, operating costs can
be reduced even further. Doganis (2001) again claimed that, aircraft-seating capacity is higher
than traditional airlines in low cost airline companies. With converting business class seats to
economy class, low cost airline companies increase their seat capacity in the aircraft. Reducing
the seat distance to 30-32 inches create 8-10 additional seating capacity per aircraft.
3.4.3.4. Using Secondary Airports
Many of the low-cost airlines are continuing their activities in secondary airports. These airports
are approximately 15-20 km away from the city centers. This situation can be turned into

53!!
advantages than disadvantages for operators in landing-takeoff fees, airport usage fees, parking
fees, boarding bridge fees etc. In addition to these factors, Tuzcuoglu (2003), loading and
unloading average time is 20-25 minutes while this period is around 45-60 minutes in other
major airports (p. 63).
In order to shorten the duration of aircraft at the airport and taking advantage of low price, low
cost carriers choose secondary airports. As Doganis (2001) claimed that, the purpose of using
secondary airports is to get rid of the cost of flights in larger airports and increase the number of
flights with making loading and unloading faster in these airports. Low cost carriers are able to
2-3 more flights than traditional airline companies. Therefore, it is determined that increase their
profit. Many low cost airlines can departure after 25 minutes later from landing (p. 155). Major
airports like Frankfurt, Heathrow, Paris have expensive parking fees as flight cost, while small
airports don't require parking fee from operators. According to Creaton (2004), airport
managements offers several advantages to airlines for carrying out their activities in their
airports. For instance, some airport authorities allocate a specific part which is free to use for
Southwest Airlines in the US. As a result of its agreement with Ryanair, some European airports
made a special discount to Ryanair crew on their airline hotels.
Due to 25 + km away from the city center, some passenger might consider the location of
secondary airports affect the extension of flight time. But researches show that according to
Creaton (2004), high traffic density on big airports caused big delays. Therefore, it was
determined that both airline passengers arrived to the city center approximately in the same time.
Some low cost carriers like Ryanair offer bus service to the city center from these secondary
airports.!

54!!
3.4.3.5. In-flight Services
According to Chang and Jones (2007), in-flight catering services issues were divided into two
different side to low cost airline companies.!Companies like Ryanair, Easyjet and GO do not
provide free food and beverage services during the flight. On the other hand some LCC carriers
like Southwest Airlines offers cheese sandwiches, crackers, light snacks such as peanuts and
low-alcohol drinks, instead of the rich menu (p. 48). Thus, low cost carriers achieve large
savings.
In Turkey, 100% private owned Pegasus Airlines included in the first category above. Pegasus
Airlines are not providing free food and beverage services during the flight. In 2007, according
to Star Gazetesi news (2008), Pegasus Airlines sold 128 thousand bottle of water inflight. In
addition to these, Pegasus Airlines offered different product types during the flight such as soup,
lottery, ice cream etc. These services which offered in flight is a major source of income for both
airlines and cabin crews. The other state controlled Turkish low cost carrier Anadolujet included
in the second category like Southwest. Anadolujet offers free small cheese sandwich or cake
with tea/coffee/water options to their passengers.
According to Doganis’s (2001) research, feedback received from passengers, passengers do not
need any catering services on short haul flights. Instead of getting in-flight catering services, it
has determined that to prefer to pay less to ticket price. Besides, passengers who want to take
catering services may take it during the flight with paying lower amounts (p. 166). In addition,
some low cost airline companies offer to choose meal options before flying in their website.
Passengers may choose their meal with paying money.

55!!
The lack of catering services also minimize allocated time for the cleaning services. Thus, when
the plane lands in airport, it can be departure again soon without taking any cleaning services.
This situation also increasing lifetime of the aircraft for low cost carriers.
3.4.3.6. Daily High Availability and Capacity
The two most important advantage for low cost airlines are high seating capacity and high daily
availability. Low cost airlines decrease the distance between seats and the tilt angle of the seat
back for increasing the number of seats. The distance between the seats is narrower than
traditional airline companies. So, these companies can carry more passengers with the same type
of aircraft. According to Doganis (2001), the seat distances are between the seats 32 to 33 inches
in traditional airlines, while the low-cost airline is reduced to 28-29 inches (p. 170). For example,
Pegasus Airlines Boeing 737-800 aircraft can carry 189 passengers, while according to
Seatguru’s (n.d.) data, the same type of Turkish Airlines plane can carry 155 passengers. Thus,
according to Flypgs website (2014) fleet information, Pegasus Airlines operates 33 passenger
more with same aircraft type. This situation reduces the seating capacity per km costs by 17%.
One of the biggest factors in generating revenue is to make numerous flight for an airline
company. High frequency of flights, loading and unloading time is short (less than 30 minutes)
also increases the availability of the aircraft. For example according to Doganis (2001), short
medium range aircraft in a traditional airline company can fly 8 hours a day. However, the same
type of airplane can fly 14 hours per day in low cost airline companies (p. 171).
Doganis (2001) continued, Easyjet’s fleet can fly 14 hours per day, while the bmi's fleet can fly 8
hours in a day in Britain. Besides these two companies, British Airways aircraft can fly around 7

56!!
hours. According to these figures, Easyjet utilize 27% more than bmi's fleet (p. 172). This
situation is benefited as a decrease of the unit cost of Easyjet compared to its competitors.
3.4.3.7. Direct Ticket Sales and Reservation
Ticket sales and reservation operations are done via ticket offices by airlines, travel agencies, call
centers and internet. However, passengers usually pay their tickets via internet in low cost airline
companies. Call centers are another method of buying or booking of the tickets for low cost
carriers. However, a few companies prefer to work with travel agencies like Southwest Airlines.
Airline companies pay some certain amount of commissions for each sales of ticket. This
commission rate may vary in certain amount or may change in certain percentage of the ticket
cost. With emerging call center and internet facilities, low cost carriers shift their sales areas to
both methods.
According to Piga and Filippi (2001), since the establishment period, Easyjet has put a special
phone number which can make a free call from any European countries. Passengers give their
credit card number to these sales agent on phone until e-shopping operations usage rate comes to
satisfied level. Easyjet started to sell their ticket in its webpage as a pioneer company in Europe
in 1998. Thanks to both methods, airline companies eliminate the commissions which are paid to
travel agencies.
Internet has become an important distribution channel for low cost airline companies. Internet is
a tool which helps being closer to low cost carrier and its customer. In addition, internet provide
a reliable and fast access to business services which are offered by low cost airlines.

57!!
3.4.4. Cost Comparison between Low Cost Carriers and Traditional Airline Operations
Feldman (1988) claimed that, low cost airlines and traditional airlines, which operate with the
same type of aircraft’s common operating expenses, could be listed as follows in a table (p. 28):
1) Sales Person Expenses 2) Expenses of Flight Crew in Economy Class 3) Pilot Salaries 4) Location Services Expenses 5) Insurance Expenses 6) Airport landings and takeoffs fees 7) Aircraft Ownership Costs 8) Air Traffic Control Costs 9) Maintenance Expenses 10) Fuel Expenses
Figure 4: Airline operating expenses Feldman (1988) continued, compared to the traditional airlines, low cost airlines' cost advantages
can be listed as follows (p. 29).
• Due to the lack of business class, services have higher seat capacity.
• Due to the lack of business class, services have fewer cabin crew.
• Instead of paying commission to travel agents low cost airlines are using the
Internet and telephone centers.
• Due to operate in their activities in secondary airports, aircraft availability and
efficiency are higher than traditional airlines.
3.4.5. Differences between Low Cost Carriers and Charter Airline Operators
According to William (2001) research, due to operating longer range and larger capacity
aircrafts, and high seat occupancy rates, cost per passenger in charter airline operators are lower
than low cost airlines. Differences between charter airlines and low cost carriers can be listed as
follows (p. 278).

58!!
3.4.5.1. Aircraft Capacity and Size
Capacity and range of the aircraft has a direct impact on the cost of airline business. Long range
wide body aircraft's flight cost per flight hour is lower than short and medium range low capacity
aircraft. Due to usage of large capacity and long range aircraft used by charter airline companies,
they precede the low cost airlines in cost related issues. For example: According to Easyjet
annual report (2005), Easyjet's Boeing 737/300 fleets which has 149 seats in 1999 unit cost of
depending Available Seat Kilometers (ASK) was 3.84 pence while Doganis (2001) claimed that,
Air2000 which has a charter airline company of Easyjet's Boeing 757 with 235 seat options had
3 pence ASK cost. Compared to low cost carriers, using large capacity aircraft of charter airlines
allow approximately 20% of cost advantage.
3.4.5.2. Flight Distance
The average flight distance, the availability of aircraft and flight crew, the amount of fuel per
hour of flight, directly affects size of the airport and maintenance costs. Average flight distance
is around 2000 kilometers in charter airlines while low cost airlines has less than 1000
kilometers.
3.4.5.3. Seat Occupancy Rate
High occupancy rate is one of the most important features of non-scheduled airline operations.
The size of charter airlines' aircraft, has a direct impact on occupancy rate rise. As Doganis
(2001) mentioned that, Easyjet’s seat occupancy rate was 78 %, calculated in relevance with year
average. While Thomas Cook Groups' Airtour charter airline company had around 95%.
3.4.5.4. Availability of Aircraft
In the short and medium-haul flights, low cost airline companies use their aircraft less than
charter airlines. Low cost airline companies aim their aircraft to use dwell time as short as

59!!
possible to increase the availability of keeping the air in a day. Low-cost carriers have managed
to reduce this time up to 20-25 minutes. In addition, operating night flights ensure maximum
benefit from the work of each aircraft.!Low-cost carriers have managed to reduce this time up to
20-25 minutes. In addition, with operating during the night period they ensure maximum benefit
from their aircrafts. Low cost airline companies can use their aircraft 11 hours average in a day
while charter airlines may use 13 hours average. Especially, this period is up to 15 hours for
charter carriers during the summer season.
3.4.5.5. Distribution Expenses
Distribution expenses are very low in charter airline companies. The most important reason is
that ticket sales and promotions are operated by their partner travel agencies. Due to the rate of
commissions, low cost airline companies do not prefer to work with travel agencies. The cost of
advertisement is higher than charter airlines in low cost operators, while ticket sales cost are
lower than charter companies. The reason for this, instead of high cost of travel agencies, low
cost carrier prefers to work via internet. According to Gross and Lock (2013), the booking
process is around 90% in low cost carriers while this ratio decrease around 5% for charter
companies.
3.4.5.6. Passenger Services Expenses
Passenger service expenses consist of usually served catering and entertainment expenses during
the flight. Passenger service expenses are very low compared to charter airlines. Many of the low
cost carriers do not provide catering and entertainment services during the flight and this case
provide significant cost advantages. The absence of catering service also shortened the time of
loading and discharge. Catering service presentation is similar to traditional airline’s catering
service in charter carriers.

60!!
3.4.5.7. Departure and Landing Fees
Both airline categories pay lower airline landing and take-off fees than traditional airlines. The
most important reason is that both companies prefer to refrain operating their activities in intense
times. Another important reason is to use secondary airports. These landing-takeoff, bellow,
parking and airport user charges are lower than main large airports. Another advantage is that,
low cost airline companies are more active than charter carriers in secondary airports.

61!!
CHAPTER 4: RESEARCH OF MEASURING SERVICE QUALITY AND BRAND LOYALTY RELATIONSHIP ıN TURKISH LOW COST AIRLINE MARKET !
4.1. Purpose and Importance of Research
In order to meet customer expectations and being preferred company in highly competitive
environment in Turkey, low cost carriers should provide customer-oriented quality service. The
way to retain a customer in low cost airline market which is open to international competition
focus on gaining through of customer loyalty and brand loyalty. Thus, the quality of service of
low-cost airlines constitutes the main objective of study for evaluating customer brand
preference and loyalty.
This study will seek to answer the following questions.
i. Which factors determine brand preference in Turkish low-cost airline business?
ii. How service quality affect preference of Turkish low cost airline companies?
iii. Is service quality effective to create customer loyalty on customers who prefer to
fly with Turkish low cost airline companies?
4.2. Research Constraints
This thesis was conducted within the framework of the following limitations:
! This research covered 100 passengers who travel with implementing low cost
strategy in Ankara Esenboğa Airport which are Pegasus Airlines and Anadolujet
Airlines.
! Research is limited to field survey and questionnaire application.
! If this work can be obtained to people who have different job titles, different
results may be obtained due to vary of title and roles in groups.

62!!
! Question form is limited to questions which is used as a data collection tool in the
research for understanding dimensions and behaviors of customer loyalty and
brand preferences.
! In addition, person who answered the questionnaire may meet with some
restrictions due to the misunderstanding of the questions.
4.3. Hypothesis of Research
On the basis of research, there has been covered the relationship between customer loyalties,
brand preference and service quality of low cost airline companies in Turkey which are state
funded as in Anadolujet and private enterprise as in Pegasus Airlines. Starting from this point,
hypothesis of research has been determined as follows:
• H1: There is a positive relationship between satisfaction levels of customers to
flight and travel again with same low cost airline company.
• H2: There is a positive relationship between satisfaction level from their previous
flight experiences of Pegasus Airlines or Anadolujet customers and their
recommendation of these firms to their relatives and friends.
• H3: There is a relationship between in-flight catering and other services of
Pegasus Airlines or Anadolujet Airlines and their preference by the customers
again.
• H4: Consumer promotion activities in Pegasus Airlines or Anadolujet Airlines
create brand loyalty on their airline preference.

63!!
4.4. Research Methods
In this survey the questionnaire study was undertaken for determining the relationship between
brand preference and customer loyalty on 100 passengers whose travel preference is by planes.
The airlines such as Pegasus Airlines and Anadolujet Airlines were fixed as firms implementing
low cost strategy in Ankara Esenboğa Airport.
The data were collected from 100 randomly selected candidates who flew with two Turkish low
cost carriers which are Pegasus Airlines and Anadolujet. It was agreed that they answer this web
based questionnaire between April-August 2014.! In order to analyze, the collected data were
entered into SPSS. T-test was performed for demographic analysis, reliability analysis,
SERVQUAL analysis, t-test and hypothesis tests.
4.4.1. Research Methods
Research model is a regulatory organization tool for data collection and analysis of economic
indicators, which is suitable for the purpose of research. In this study, single scan model was
used. In order to determine the formation of survey as individual or as a certain amount of
variable, these models are called single scan model.
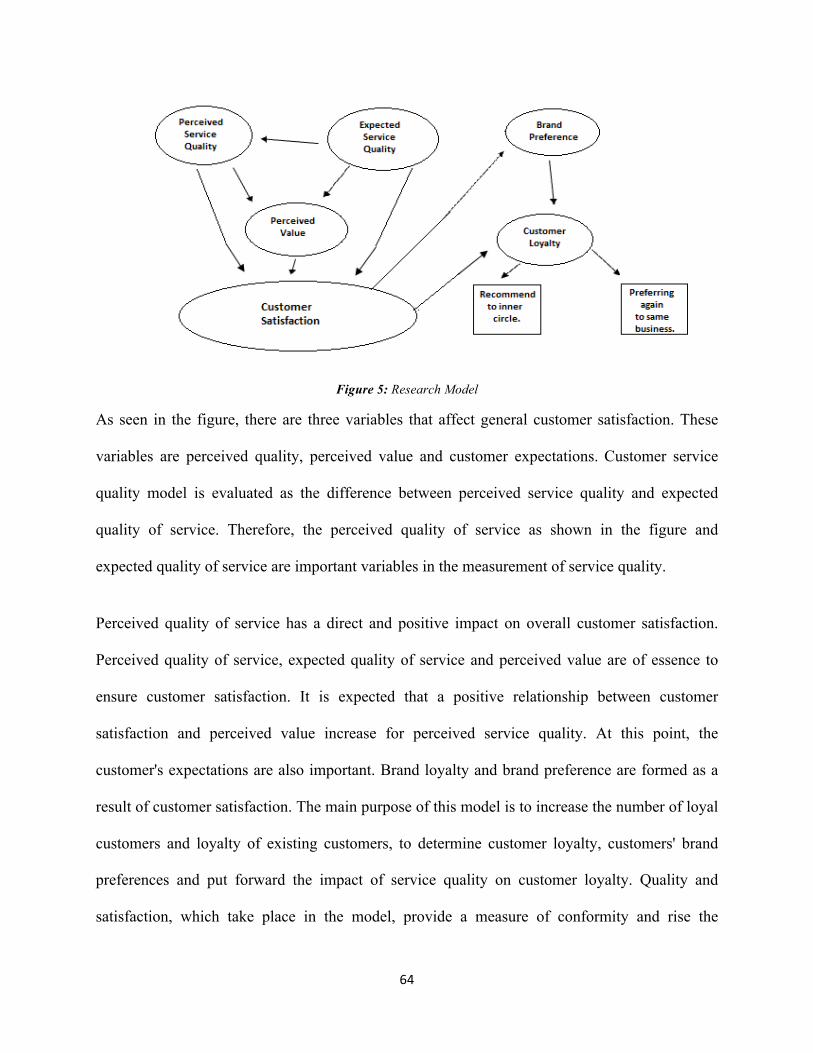
64!!
!
Figure 5: Research Model
As seen in the figure, there are three variables that affect general customer satisfaction. These
variables are perceived quality, perceived value and customer expectations.!Customer service
quality model is evaluated as the difference between perceived service quality and expected
quality of service. Therefore, the perceived quality of service as shown in the figure and
expected quality of service are important variables in the measurement of service quality.
Perceived quality of service has a direct and positive impact on overall customer satisfaction.
Perceived quality of service, expected quality of service and perceived value are of essence to
ensure customer satisfaction. It is expected that a positive relationship between customer
satisfaction and perceived value increase for perceived service quality. At this point, the
customer's expectations are also important. Brand loyalty and brand preference are formed as a
result of customer satisfaction. The main purpose of this model is to increase the number of loyal
customers and loyalty of existing customers, to determine customer loyalty, customers' brand
preferences and put forward the impact of service quality on customer loyalty. Quality and
satisfaction, which take place in the model, provide a measure of conformity and rise the

65!!
reliability of the model. As a result of quality service, customers share their positive experiences
to 2nd parties and tend to buy service again.
According to Bozdag et.al. (2003), there are five dimensions of airline service quality.
Reliability: Airline obeys the departure and arrival time commitment.
Responsibility: Airline has fast and trustable baggage and ticket systems.
Trust: Airline has reliable expert employees and trustable brand.
Empathy: Airline pays attention to the customer's specific needs and requests.
Physical Conditions: The aircraft has suitable sites for all kinds of needs for passengers.
4.4.2. Populations and Sampling
The population of this research consists of a passenger who use 2 low cost airlines which are
Pegasus Airlines and Anadolujet in Ankara Esenboga Airport. Systematic sampling technique is
used for participants.
The calculation of the sample size should be determined at a certain confidence level. Commonly
used statistical confidence level of 0.95 was considered to be sufficient for this work. In the
calculation of sample size formula is used.
n: sample volume
Z: standard normal distribution value for corresponding to a given confidence level
p: a certain percentage of the population that have characteristics (p= 0,5)

66!!
q: a certain percentage of the population that have not got any characteristics (p+q=1)
(q=0,5)
e: error level
100 of the questionnaire to be answered is provided to ensure the sampling volume is up to the
mark.
4.4.3. Determination of Data Collection Tool
One of the most important stages of the research is selection of data (information) tool. The
source of research data in social issues is human. Questionnaire is one of the tools that receive
direct information from them. In addition, questionnaire is the primary source of first hand data
collection form. In primary source research, the researcher himself becomes occupied with data
collection, so that data collection method selection has more significant importance. Costs, error
probability and selection of the most effective method related with the purpose of research
should be considered. Data collection techniques of research method for the thesis are identified
as a questionnaire.
4.4.4. Data Collection Tool
In this study, SERVQUAL scale was used to measure the quality of service. In order to measure
the relationship between service quality, brand preference and customer loyalty, separated
questions were used.

67!!
4.5. EVALUATION OF RESEARCH DATA
4.5.1. Reliability Analysis
Results obtained from research are entered into SPSS program and respective scale degrees are
determined. In this regard, questionnaires were evaluated and reliability analysis was performed
with the degrees respectively -- I totally disagree (1 point) I disagree (2 points) Neutral (3 points)
I agree (4 points) and I totally agree (5 points).
In reliability concept scales, there can be seen the consistency of all questions with each other.
They were put forward to measure the homogeneity of these scales. The implementation of
measurement tool and scoring require evaluator reviews. So, there is benefited from evaluator's
reviews to calculate in a more reliable way. In this context, in order to analyze the reliability of
the measurement instrument, coefficients are calculated. The most common method for this
evaluation is seen to be Cronbach's alpha coefficient method. In this scale, "k" is calculated as
the total variance of related questions, which are divided, by the overall variance. By the virtue
of this calculation, Cronbach's alpha coefficient weighted standard deviation is found. Due to the
fact that all of the questions are taken into account while doing the calculation based on a
consistent structure, this method reflects the best overall reliability structure compared to the
other coefficients. The evaluation criteria of alpha coefficient (α) are as follows:
If 0,00 ≤ α < 0,40 scale is not reliable.
If 0,40 ≤ α < 0,60 scale reliability is low.
If 0,60 ≤ α < 0,80 scale is reliable.
If 0,80 ≤ α < 1,00 scale is highly reliable.

68!!
Reliability analyzes of questionnaires were performed. The resulting reliability coefficients are
shown in Table 1.
Alpha Coefficients on SERVQUAL (N = 100)
Table 1: SERVQUAL Dimensions Reliability Analysis Results SERVQUAL Dimensions Questions Cronbach Alpha Expected 22 Physical Evidences 1-4 0.965 Reliability 5-9 0.961 Enthusiasm 10-13 0.956 Trust 14-17 0.965 Sensitivity 18-22 0,978 Perceived from Pegasus Airlines 22 Physical Evidences 1-4 0.974 Reliability 5-9 0,981 Enthusiasm 10-13 0,971 Trust 14-17 0,980 Sensitivity 18-22 0,980 General Average For Pegasus Airlines 0-44 0,971 Perceived from Anadolujet Airlines Physical Evidences 1-4 0,981 Reliability 5-9 0,972 Enthusiasm 10-13 0,959 Trust 14-17 0,982 Sensitivity 18-22 0,984 General Average For Anadolujet Airlines 0-44 0,970
Perceived and expected scales in applied SERVQUAL scales were highly reliable. Considering
all the questions, the reliability was found in 0,877 scale. According to the data, the survey has
proven to be highly reliable.
4.5.2. SERVQUAL Scale Findings and Evaluation of SERVQUAL Score
In this section, the findings obtained from the SERVQUAL scale in the demographic and socio-
economic variables are evaluated parallel with the symptoms and the quality of service.
Passengers’ statistical dump is shown in the table below. When we examine passengers who use
low cost airlines in Ankara Esenboğa Airport, the age group of passengers consist of

69!!
respectively; 19% of them between 18-25, 46% of them between 26-35, 28% of them between
36 - 50 and 7% of them 50+ years old.
Table 2: Passenger’s Age Variable
The Age Variable Age Frequency Percentage 18-25 19 19 26-35 46 46 36-50 28 28 50+ 7 7 Total 100 100
Passengers who participated in the study is shown in table below according to their
gender distribution. According to these data, 62% of passengers using low cost airline in Ankara
Esenboğa Airport are male and just 38% of the female passengers make up the group.
Table 3: Passenger’s Gender Variable
Gender Variable Gender Frequency Percentage Male 62 62 Female 38 38
When we investigate education level of passengers who use low cost airlines in Ankara
Esenboğa Airport, it is observed that 6% of them graduated from primary school; 34% of them
graduated from high school, 51% of them from undergraduate, 7% of them from master and 2%
of them completed his/her PhD level education.

70!!
Table 4: Passenger's Education Level
Passenger’s Education Level Types of Education Frequency Percentage Literate 0 0 Primary School 6 6 High School 34 34 Undergraduate 51 51 Graduate (Master level) 7 7 PhD level 2 2 Total 100 100
The distribution of passengers occupational groups are as follows: 7% of them Business partner /
owner, 11% of them are self-employed, 23% of them are officer, 7% of them are worker, 9% of
them are director, 2% of them are unemployed, 3% of them are retired, 9 % of them are
housewife and rest 29 % of them are from other specified jobs such as student, developers,
engineer, musician, technician and tradespeople.
Table 5: Passenger's Job Details
Job Details Types of Job Frequency Percentage Business partner / owner 7 7 Self-employed 11 11 Officer: 23 23 Worker 7 7 Director 9 9 Unemployed 2 2 Retired 3 3 Housewife 9 9 Other 29 29 Total 100 100
The distribution of total monthly income of the participants is shown in table. Accordingly,
variety of participants’ monthly income is determined respectively as the following inscriptions;

71!!
17% of them earn / receive between 0-1000 TL, 38% of them 1001-2000 TL, 23% of them 2001-
3000 TL, 19% of them 3001-4000 TL and 3% of them earn 4001+ TL monthly.
Table 6: Passenger’s Monthly Income Variable
Monthly Income Variable Income Frequency Percentage 0-1000 17 17 1001-2000 38 38 2001-3000 23 23 3001-4000 19 19 4001+ 3 3 Total 100 100
4.5.3. Findings of Service Quality Dimensions
Dimensions for airline companies are respectively; physical evidence, reliability, responsibility,
confidence and awareness. Descriptions are stated below:
1) Physical Evidence: The aircraft has suitable places for all kinds of needs. (Question 1-
2-3-4)
2) Reliability: Airline complies with its departure and arrival time commitment. (Question
5-6-7-8-9)
3) Responsibility: Airline has a trustful and fast ticket and luggage services.(Question 10-
11-12-13)
4) Confidence: Airline has a good, reliable brand and employees. (Question 14-15-16-17)
5) Awareness: The airline pays attention and meets the customer's specific needs and
requests. (Question 18-19-20-21-22)
As a result of the analysis included in five dimensions of SERVQUAL measurement tool, the
highest expectations of the individuals came from reliability part in which there is asked question

72!!
5 "If lcc company promised to do something at a particular time, it should fulfil." and question 8
" LCC companies must be fulfilled their services at the time promised. " these questions
corresponds to 4.54 and 4,47 points in numerical table..
For Pegasus Airlines, “When customers have some problems, lcc company should be insightful
and reassuring" this statement could be the question to be cared and studied in a painstaking way.
On the other hand for Anadolujet Airlines, "LCC staff should be well dressed and elegant
appear." In terms of outer appearance, this suggestion also has to be thought to come to an
understanding of the difference between expectation and perception side. Question 21 “By the
company, the customer should be evaluated in reference with what's best for him" As for
revising Pegasus airlines, this question is at variance with this firm. Also, the question 9 “LCC
companies must keep proper and accurate records." disaccord with Anadolujet Airlines.
Within the framework of the responses to each question, the difference between expectation and
perception were investigated with t-test and the obtained results are shown in the following table.
Accordingly, for all the questions there is a significant difference shows between passenger's
expectations and perceptions.

73!!
Table 7: Scores of Passengers Perceptions and Expectations
What are your expectations related to the services provided by LCC?
Expectation
score
Perception score of Pegasus A
irlines
Perception score of A
nadolujet A
irlines
t-test Pegasus A
irlines
t-test A
nadolujet A
irlines
Physical Evidences
1) LCC carriers should have modern equipment. 4,38 3,42 3,23 9,967 11,5
2) Working environments should be visually remarkable. 4,00 3,78 3,61
5,284
6,49
3) LCC staff should be well dressed and elegant appear. 4,33 3,73 2,86
10,553
15
4) The low cost carrier company's physical image should be related with the service they offer. 4,13 3,41 3,28
15,218
12,1
Reliability
5) If lcc company promised to do something at a particular time, it should fulfil. 4,54 3,46 3,45 11,368 11,3
6) When customers have some problems, LCC company should be insightful and reassuring. 4,31 2,74 3,47 15,429 10
7) LCC company should be reliable 3,99 3,3 3,5 9,973 8,76
8) LCC companies must be fulfilled their services at the time promised. 4,47 3,04 3,02 15,857 18,2
9) LCC companies must keep proper and accurate records. 4,16 3,72 4,11 6,152 1,15
Enthusiasm 10) Service should be expected when fulfilled. 3,4 3,56 3,48 -4,342 -2,39
11) Customers expect a quick service from this lcc company's employees. 4,16 3,56 3,53 8,617 6,87
12) Company employees are always willing to help their customers. 4,39 3,87 3,98 9,614 7,43
13) If the employee is busy in flying, does not matter to respond to the customer's request. 3,77 3,24 3,32 9,574 9
Trust
14) Customers should be able to trust these companies' employees. 4,15 3,35 3,59 12 8,34
15) Customers should feel confident in their dealing with employees. 3,94 3,42 3,46 10,356 9,2
16) Employees should be polite. 4,08 3,59 3,64 6,966 6,41
17) Employees should take adequate support to do their jobs well from their company. 3,83 3,22 3,4 9,622 8,64

74!!
Sensitivity
18) Individual care should be expected from company to their customers. 4,15 3,44 3,53 5,836 4,05
19) Individual care should be expected from company employees to their customers. 3,88 3,7 3,75 4,135 3,85
20) Expectation of customers should know before needing to this by employees are realistic 4,12 3,98 4,01 4,015 5,13
21)
The customer should be expected that knowing what's best for him by company is realistic idea 4,15 4,03 3,98 3,674 4,5
22)
The customer should expect a suitable working hour for him by the company that provide service. 3,79 3,6 3,66 4,819 3,55
4.5.4. SERVQUAL Score Calculation
The quality score is calculated on the basis of size, taking difference between the expectation and
the perception questions. Receiving differences divided by the number of questions in each part.
Basis size SERVQUAL scores will be reached with the sum of scores calculated with the sample
size divisor.
SERVQUAL method is measured according to the scale of the difference between expectations
and perceptions of customers. When SERVQUAL scores is being created, perception and
expectation expressions are taken into account. Thus, SERVQUAL score= Perception -
Expectation is calculated as the score. From this result, two types of SERVQUAL scores can be
calculated. The first of these is unweighting calculated SERVQUAL score. In this score, the
importance of quality dimensions by passengers is not taken into account. Second one is
calculated as a weighted score, which is also sensitive to the importance given to dimensions.

75!!
In relevance with these, the substances, which are located on each factor, are determined. In
order to calculate unweight SERVQUAL score, each substance score is summed together under
each factor and is divided to the number of the factors referred in it. These summed scores are
divided into N number of passengers.
SQ1: Physical Specifications Dimensions SERVQUAL Score
SQ2: Reliability Size SERVQUAL Score
SQ3: Enthusiasm Size SERVQUAL Score
SQ4: Trust Size SERVQUAL Score
SQ5: Empathy (sensitivity) Size SERVQUAL Score
Calculating SERVQUAL Scores
SQ1 = [(P1- E1) + (P2 - E2 ) + (P3 - E3 ) + ( P4 - E4) ] / 4
SQ2 = [(P5 - E5 ) + (P6 - E6 ) + ( P7 - E7) + (P8 - E8 ) + (P9 - E9 )] / 5
SQ3 = [( P10 - E10) + (P11 - E11 ) + (P12 - E12 ) + (P13 - E13 )] / 4
SQ4 = [( P14 - E14) + (P15 - E15 ) + (P16 - E16 ) + (P17 - E17 )] / 4
SQ5 = [( P18 - E18) + (P19 - E19 ) + (P20 - E20 ) + (P21 - E21 ) + (P22 - E22 ) ] / 5
Unweighted SERVQUAL Score
SQ1UW = ( SQ11 + SQ12 + …+ SQ1N) / N
SQ2UW = ( SQ21 + SQ22 + …+ SQ2N) / N
SQ3UW = ( SQ31 + SQ32 + …+ SQ3N) / N

76!!
SQ4UW = ( SQ41 + SQ42 + …+ SQ4N) / N
SQ5UW = ( SQ51 + SQ52 + …+ SQ5N) / N
4.5.5. Weighted SERVQUAL Score
In order to calculate weighted SERVQUAL score, the following operations are performed.
1) Five dimensions of SERVQUAL scores are calculated for each passenger one by one
SQ1 = [(P1- E1) + (P2 - E2 ) + (P3 - E3 ) + ( P4 - E4) ] / 4
SQ2 = [+ (P5 - E5 ) + (P6 - E6 ) + ( P7 - E7) + (P8 - E8 ) + (P9 - E9 )] / 5
SQ3 = [( P10 - E10) + (P11 - E11 ) + (P12 - E12 ) + (P13 - E13 )] / 4
SQ4 = [( P14 - E14) + (P15 - E15 ) + (P16 - E16 ) + (P17 - E17 )] / 4
SQ5 = [( P18 - E18) + (P19 - E19 ) + (P20 - E20 ) + (P21 - E21 ) + (P22 - E22 ) ] / 5
2) The average of each dimension, which determines the degree of importance, is
calculated.
3) The importance of each aspect and the SERVQUAL score calculated for each dimension
is multiplied with the number of each passenger.
SQzW = ( k1i * SQz + k2i *SQz + k3i *SQz + k4i *SQz + k5i *SQz) / 5
!kzi = the weight importance of customer “i” in dimension “z”. z = 1, 2, 3, 4, 5
4) Weighted SERVQUAL scores of five dimensions for each passenger are summed.
SQWi = SQ1Wi + SQ2Wi + SQ3Wi + SQ4Wi + SQ5Wi
5) N numbers of passengers scores obtained in the previous step are summed and divided to
N. SQW = (SQW1 + SQ1W2 + SQ2W3 +… + SQ5WN ) / N
SERVQUAL scores are calculated with (perceived score – expected points formula. So, it will be
between -4 and +4. If the quality of the services, which are offered, is much lower than expected,

77!!
it shows "-4". If it is much higher than expected, it shows "+4". Each SERVQUAL results shows
different meaning. If SERVQUAL score is negative, the inference which airline passenger's
expectations are not met can be made. When calculating SERVQUAL scores, the values can be
seen as closer to +4. This means that a high level of expectations of each person is met. If it is
close to 0, we may understand that the expectations are met in the low level. -4 shows that their
expectations are not met. In the light of the information given in the table, perceived service
quality of Turkish low cost airlines doesn’t provide any satisfaction. Let alone the satisfaction
status, the perception of their service qualities is also low. So, a treatment process should be
defined which is described in SERVQUAL measurement tool for Pegasus Airlines and
Anadolujet Airlines.
Table 8 : SERVQUAL Scores in Quality Dimensions for Pegasus Airlines
SERVQUAL Scores N Average Standard Deviation
Minimum Maximum
SQ1 (Physical Evidences) 100 -0.625 1.3329 -2.80 0.80 SQ2(Reliability) 100 -1.042 1.2762 -2.40 0.70 SQ3(Enthusiasm) 100 -0.3725 0.6242 -2.00 0.40 SQ4(Trust) 100 -0.605 0.6781 -2.60 0.50 SQ5(Sensitivity) 100 -0.268 0.5792 -1.40 0.60
Table 9: SERVQUAL Scores in Quality Dimensions for Anadolujet Airlines
SERVQUAL Scores N Average Standard Deviation
Minimum Maximum
SQ1 (Physical Evidences) 100 -0.9650 1.2624 -3.00 1.00 SQ2(Reliability) 100 -0.7840 0.9421 -2.60 0.80 SQ3(Enthusiasm) 100 -0.3525 0.6432 -2.40 0.60 SQ4(Trust) 100 -0.4775 0.8724 -2.00 0.70 SQ5(Sensitivity) 100 -0.2320 0.5421 -1.20 0.50
As shown in table 8, the lowest average SERVQUAL score was calculated in SQ2 (Reliability)
part as -1.042 for Pegasus Airlines. On the other hand, the lowest average SERVQUAL score for

78!!
Anadolujet, which is shown in Table 9, was calculated in SQ1 (Physical Evidences) part as -
0.9650. The cases dedicate that; Pegasus and Anadolujet Airlines passengers were not pleased
with the companies’ conditions and their perception of how a customer should be treated. So
these companies remain below under the customers’ expectations.
4.5.6. Examination of Research Hypothesis
The purpose of this study is to determine the relationship between the service quality of Turkish
low cost airline companies in relevance with their customer loyalty status and brand preference.
From this point, the basic hypothesis of the study is given in the tables below.
The following hypothesis were formed in order to examine whether there is a relationship
between the satisfaction levels of customers from traveling and their wish to travel with the same
airline company for their next travels.
When analyzing of Table 10 and Table 11, all passengers who are very satisfied from Pegasus
Airlines and Anadolujet flights stated that their preference would have over the same companies
for their future flights. Evaluating the level of satisfaction, 13 passengers out of 27 passengers
implied their displeasure for Pegasus Airlines flight and also they reported that they would not
use this firm for their future flights. These figures for Anadolujet were detected from 15/41 level
which means that 36% of the satisfied passengers will not prefer again Anadolujet for their
future flight.
In addition to these, 58% of Pegasus Airlines customer who gave opinion as neutral, dissatisfied
and very dissatisfied implied that they would not prefer this firm again. These percentages were
detected as 48% for Anadolujet Airlines.
!

79!!
Table 10 : The overall satisfaction degree of Pegasus Airlines customers and their preferences again Preferring regularly Pegasus Airlines on flights Yes No Total Overall level of satisfaction from Pegasus Airlines
Very Satisfied 15 0 15 Satisfied 14 13 27 Neutral 0 9 9 Dissatisfied 0 24 24 Very dissatisfied 0 25 25 Total 29 71 100
Table 11: The overall satisfaction degree of Anadolujet customers and their preferences again
Preferring regularly Anadolujet Airlines on flights Yes No Total Overall level of satisfaction from Anadolujet Airlines
Very Satisfied 11 0 11 Satisfied 26 15 41 Neutral 0 14 14 Dissatisfied 0 18 18 Very dissatisfied 0 16 16 Total 37 63 100
The following conclusions were reached to examine from the hypothesis of relationship between
degrees of satisfaction and fly again with the same company.
H1: There is a positive relationship between satisfaction levels of customers to flight and travel
again with same low cost airline company.

80!!
Table 12: Chi-Square Test for hypothesis 1
Value df Asymp. Sig. (2-sided) Pearson Chi-Square 288,130a 16 ,000 Likelihood Ratio 123,535 16 ,000 Linear-by-Linear Association
76,950 1 ,000
N of Valid Cases 100
As a result of the analysis for low cost airline industry, Pearson chi square value was found 288.8
and probability level determined 0.00 value. According to this result H1 hypothesis is accepted
in alpha 5% significance level. In other words, the results obtained that there is a relationship
between satisfaction levels of customers to flight and travel again with same low cost airline
company.
H2: There is a positive relationship between satisfaction level from customers’ previous flight
experiences of Pegasus Airlines or Anadolujet Airlines and their recommendation of these firms
to their relatives and friends.
Table 13: The overall satisfaction degree of Pegasus Airlines customers and their recommendation to
others
Recommendation Pegasus Airlines to others Yes No Neutral Total Overall level of satisfaction from Pegasus Airlines
Very Satisfied 15 0 0 15 Satisfied 27 0 0 27 Neutral 4 0 0 4 Dissatisfied 6 13 0 19 Very dissatisfied 4 14 17 35 Total 56 27 17 100

81!!
Table 14: Chi-Square Test for hypothesis 2
Value df Asymp. Sig. (2-sided) Pearson Chi-Square 354,888a 16 ,000 Likelihood Ratio 95,168 16 ,000 Linear-by-Linear Association 67,439 1 ,000 N of Valid Cases 100
When table 12 is analyzed, it could be seen that all participants express their positive perceptions
of Pegasus Airlines and they recommend this firm to their friends and relatives. However, 18.5%
of dissatisfied and very dissatisfied participants would also express their recommendations for
Pegasus Airlines. As a result of the analysis for Pegasus Airlines, Pearson chi square value and
probability value were found 354 and 0.00. According to this, the results obtained mean that
there was a relationship between satisfaction level from their previous flight experiences of
Pegasus Airlines and their recommendations of this firm to their relative and friends.
Table 15: The overall satisfaction degree of Anadolujet Airlines customers and their recommendation
to others
Recommendation Anadolujet to others Yes No Neutral Total Overall level of satisfaction from Anadolujet Airlines
Very Satisfied 11 0 0 11 Satisfied 34 2 0 36 Neutral 10 4 0 14 Dissatisfied 5 3 0 8 Very dissatisfied 3 16 12 31 Total 63 25 12 100
When table 13 is analyzed, all participants express their intense satisfaction with Anadolujet
Airlines and their recommendation of this firm to their friends and relatives. However, 5.5% of
satisfied participants expressed that they would not recommend Pegasus Airlines to their friends

82!!
and relatives. On the other hand 33.9% of very dissatisfied, dissatisfied and neutral passengers
recommend this firm to their friends and relatives. As a result of the analysis, Pearson chi square
value and probability value were found 317 and 0.00. According to this, the results obtained
mean that there is a relationship between customers’ satisfaction level from their previous flight
experiences of Anadolujet Airlines and their recommendations of this firm to their relatives and
friends.
In order to research whether in-flight catering and other services affect Pegasus and Anadolujet
Airlines customers’ preference, independent samples in t-test were used. The results obtained
were shown in Table 14 and Table 15 for each airline. The status of preference was measured on
two independent groups. According to these groups, a statistically significant difference was
determined between the perceptions of quality for each company.
H3: There is a relationship between in-flight catering and other services of Pegasus Airlines or
Anadolujet Airlines and preference again.
Table 16: The overall satisfaction degree of Pegasus Airlines in-flight catering and other services and
their preference again
All kinds of needs during the flight are met in Pegasus Airlines flight.
(SQ1)
Preference again Pegasus
Airlines
N Mean Std. Deviation
t Std. Error Mean
Q1 Yes 29 0,5172 ,63362 21,123
,11766
No 71 -1,2720 ,55084 ,06537
Q2 Yes 29 0,4279 1,03152 13,918
,19155 No 71 -1,3944 ,49219 ,05841
Q3 Yes 29 0,3793 ,67685 9,816
,12569 No 71 -1,2817 ,48353 ,05738
Q4 Yes 29 -0,0379 ,74278 -
11,605 ,13793
No 71 0,9296 ,68293 ,08105

83!!
Table 17: The overall satisfaction degree of Anadolujet Airlines in-flight catering and other services
and their preference again
The following hypotheses were tested based on the promotion activities of Pegasus Airlines and
Anadolujet Airlines. There were studied whether or not customer loyalty is changeable in
accordance with the promotion activities. Measurements were done to see whether there is a
significance difference in enthusiasm side (SQ3) after the promotion activities. The obtained t-
test results are summarized in Table 16 and Table 17.
H4: Consumer promotion activities in Pegasus Airlines or Anadolujet Airlines create brand
loyalty on their airline preference.
Table 18: Consumer promotion activities of Pegasus Airlines and its relations with customer decision
Will promotion activities of Pegasus Airlines affect their customer’s loyalty of their airline choice? (SQ3) Q10-Q13 Enthusiasm
Preference again Pegasus Airlines
N Mean Std. Deviation
t
Q10-Q13 Yes 56 ,7631 ,8153 7,023 No 44 ,2145 ,1926
All kinds of needs during the flight are met in Anadolujet Airlines
flight. (SQ1)
Preference again
Anadolujet Airlines
N Mean Std. Deviation
t Std. Error Mean
Q1 Yes 37 0,5676 ,68882 19,602
,11324
No 63 -1,2063 ,62627 ,07890
Q2 Yes 37 0,1351 ,94757 -13,918
,15578 No 63 -1,4762 ,50344 ,06343
Q3 Yes 37 -0,2703 ,45023 11,663 ,07402 No 63 -0,7937 ,96985 ,12219
Q4 Yes 37 0,7838 ,47930 -
17,796 ,07880
No 63 0,1587 ,72304 ,09109

84!!
Table 19: Consumer promotion activities of Anadolujet Airlines and its relations with customer
decision
Will promotion activities of Anadolujet Airlines affect their customer’s loyalty of their airline choice? (SQ3) Q10-Q13 Enthusiasm
Preference again Anadolujet Airlines
N Mean Std. Deviation
t
Q10-Q13 Yes 37 ,1842 ,5253 -7,356 No 63 ,7378 ,6458
As a result of the obtained test, promotion activities of Pegasus Airlines and Anadolujet Airlines
affect customers’ enthusiasm level, which depends on the airline service quality, revised under
the components of customer choice.
The reason for the negative t-test result is deduction of the average of the first defined group
from the average of second group. If the exact opposite definition is done, the results will be
positive. Because of its symmetrical structure, distribution does not create any problem.
!
!

85!!
CONCLUSION
Services and services sector, which are in the area of economic activity, hold an important place
in almost all developed and developing countries in today's economy. The development of the
service sector would be possible when quality service is provided to the customer who wants to
be satisfied with what is provided to him or her. However, evaluation of the service quality for
consumers can be more difficult to assess since the quality of a tangible product is constant and
the same for each consumers. However, the quality of service result is revealed with the
cognizance of the quality of service that a customer expects and receives. Perceptions of service
quality are the result of the comparison of them with the actual service performance
expectations.
The concept of brand loyalty in service businesses is an important element for the quality of
service. The most important thing for understanding the formation of brand loyalty is to
investigate which factors are effective and try to redirect the consumer's loyalty behavior towards
its own brand. Airlines have become a major service provider to meet the needs of consumers in
transportation sector nowadays. Because of the increased transportation costs, rising prices of
airline tickets were decreased thanks to the low cost airline concepts in 1970s. Low cost carrier
is a business model which emerged with the need of passengers who are sensitive to economic
issues. Based on efficient use of resources, there were kept low costs. Low cost airlines began to
serve point-to-point travel with their low quality of service offering very low prices which sound
appealing to economic passengers. In order to provide quality service, airline companies
operating in highly competitive environment should work customer centric to meet customer
expectations and gain their sympathy.

86!!
The way to retain a customer depends on gaining customer loyalty and brand loyalty in low-cost
airline market, which is open to international competition involving many players in the market.
There are three variables, which mostly affect customer satisfaction. These variables can be
counted as perceived quality, perceived value and customer expectations. Perceived quality of
service has a direct and positive impact on overall customer satisfaction. Perception of the
service quality, expectation of the service quality and perceived value form the customer
satisfaction.
As a result of the study conducted, to determine the quality of services in Turkish low cost airline
brand preference and customer study, the highest expectations in terms of customer expectations
from individuals who participated in the research can be cited in the following statements
respectively "Turkish LCC companies must be fulfilled their services at the time promised" and
"When customers have some problems, Turkish LCC companies should be insightful and
reassuring." These two statements show that reliable service can be said that reliable service in
the flight time is the biggest expectation of the customers.
The reliability dimension which is located on the vital elements of the service given is perceived
in line with the following statement "If LCC company promise to do something at a particular
time, it should fulfill its promise” the question has been identified as maximum difference
between the level of perceived service quality and expectations with the level of that service
quality.
Calculated on the basis of their individual scores, weighted SERVQUAL scores were resulted as
negative. Based on these results from Ankara Esenboğa Airport, passengers who use low-cost
airlines are not satisfied with their expectations.

87!!
According to the analysis of the data obtained; all passengers who are very satisfied (level 5)
with the airline company prefer again the same airline company. 33% of passengers who choose
satisfied (level 4) option prefer again the Pegasus Airlines and 53% of passengers in Anadolujet
Airlines. Rest of them didn’t prefer again the same airline company.
The result of the hypothesis "relationship between satisfaction level of customer to fly and fly
with another low cost airline company in the most recent travel" shows that there is a
relationship between customers’ satisfaction with their travels and their preference of the same
company for their next trip. This situation reveals the result that if passenger is satisfied with the
service, they would like to get the same service again.
When the hypothesis "there is a relationship between satisfaction levels of customers from low
cost airline company and customers’ recommendation of the company to their relatives and
friends" is examined, result shows that passengers who are very satisfied with the airline
company they benefited advice this company to their friends and relatives. However 18.5% of
dissatisfied passengers from Pegasus Airlines and 33.9% from Anadolujet Airlines also clarified
that the passengers recommend the Airline Company to their friends and relatives even if they
don’t like.
The significant relationship clarified the analysis relevant to the existence between in-flight
catering services and the re-preference of the same low cost airline company from Ankara
Esenboğa Airport.
In all SERVQUAL dimensions, the result of the research about the customers who prefer low-
cost airline in terms of service quality components shows that there was found a significant

88!!
difference in services, which are provided by the airline companies and the loyalty decisions of
the passengers based on the services offered to them.
As a result of the research, the airline services provided to the consumers by Turkish low cost
airline companies affect their brand choice. This has great impact on consumers’ brand choice
relevant to the quality of the service component.
The statistical difference was determined on the basis of the size of each component. The quality
of service was evaluated in accordance with passengers’ education level. From the results, there
could be inferred that the people from different educational backgrounds prefer low-cost airline
companies in terms of their quality of service components.

89!!
REFERENCES
Aaker, D. A. (1991). Managing brand equity: capitalizing on the value of a brand name. New
York: Free Press.
ACI Council International. (2013, September 3). ACI Releases its 2012 World Airport Traffic
Report: Airport Passenger Traffic Maintains Momentum; Cargo Growth Remains Almost flat for
Second Year as Advanced Economies Face Austerity. ACI. Retrieved August 11, 2014, from
http://www.aci.aero/News/Releases/Most-Recent/2013/09/03
Ahn, T., & Lee, T. J. (2011). Service Quality in the Airline Industry: Comparison Between
Traditional and Low-Cost Airlines. Tourism Analysis, 16(5), 535-542. Retrieved June 28, 2014,
from http://dx.doi.org/10.3727/108354211X132
Airarabia news. (2014). Air Arabia fourth quarter net profit up 12 per cent to AED 94 million.
Retrieved August 10, 2014, from http://www.airarabia.com/en/air-arabia-fourth-quarter-net-
profit-12-cent-aed-94-million
Alajaasko, P. (2008). Main features of the EU-27 services sector. Eurostat Industry, trade and
services . Retrieved August 5, 2014, from
http://epp.eurostat.ec.europa.eu/cache/ITY_OFFPUB/KS-SF-08-078/EN/KS-SF-08-078-
EN.PDF
Anderson, E. W., & Sullivan, M. W. (1993). The Antecedents and Consequences Of Customer
Satisfaction For Firms. Marketing Science, 12(2), 125-143. Retrieved June 29, 2014, from
http://dx.doi.org/10.1287/mksc.12.2.125

90!!
Antonio, M. R. (2001). Measuring and managing service quality: integrating customer
expectations. Managing Service Quality, 11(1), 22-31. Retrieved May 14, 2014, from
http://dx.doi.org/10.1108/0960452011037
Back, K. (2003). A Brand Loyalty Model Involving Cognitive, Affective, and Conative Brand
Loyalty and Customer Satisfaction. Journal of Hospitality & Tourism Research, 27(4), 419-435.
Retrieved June 20, 2014, from http://dx.doi.org/10.1177/10963480030274
Barnhart, C. (2007). Transportation. Amsterdam: North Holland.
Bergiel, B. J., & Walters, C. G. (1989). Consumer behavior: a decision-making approach.
Cincinnati [etc.: South-Western Publishing Co..
Berry, L. L., Parasuraman, A., & Zeithaml, V. A. (1994). Reassessment of Expectations as a
Comparison Standard in Measuring Service Quaiity: implications for Further Research. Journal
of Marketing, 58, 111-124. Retrieved July 21, 2014, from http://areas.kenan-
flagler.unc.edu/marketing/facultystaff/zeithaml
Bozdağ, N., Atan, M. Altan Ş., (2003). Hizmet sektöründe toplam hizmet kalitesinin
SERVQUAL analizi ile ölçümü ve bankacılık sektöründe bir uygulama. VI. Ulusal Ekonometri
ve İstatistik Sempozyumu 29-30 Mayıs, Ankara: Gazi Üniversitesi Ekonometri Bölümü, 1-14.
Biong, H. (1993). Satisfaction and Loyalty to Suppliers within the GroceryTrade. European
Journal of Marketing, 27(7), 21-38. Retrieved June 18, 2014, from
http://dx.doi.org/10.1108/0309056931004

91!!
British Civil Aviation Authority (2013, February 10). UK Airport Statistic of Civil Aviation
Authority. Retrieved August 2, 2014, from
https://www.caa.co.uk/default.aspx?catid=80&pagetype=88&sglid=3&fld=2012A
Buera, F. J., & Kaboski, J. P. (2009). The rise of the service economy. Cambridge, Mass.:
National Bureau of Economic Research.
Bush, R. R., & Mosteller, F. (1955). Stochastic models for learning. New York: Wiley.
Butler, M. A. & Diederiks, I. H. (2006). An introduction to air law. Alphen an den Rijn: Kluwer
Law International.
Button, K. (2012). Low-Cost Airlines:. Transportation Journal, 51(2), 197-219. Retrieved July
27, 2014, from http://dx.doi.org/10.5325/transportationj.5
Ceritoglu, A. B. (2004). Genç Tüketicilerde Marka Bilincinin Oluşması ve Marka Sadakati
Kavramlarının İncelenmesi ve Konu İle İlgili Bir Uygulama. Ulusal Tez Merkezi. Retrieved
July 13, 2014, from https://tez.yok.gov.tr/
Chang, Y. Y., & Jones, P. (2007). Flight Catering: An Investigation of the Adoption of Mass
Customisation. Journal of Hospitality and Tourism Management, 14(1), 47-56. Retrieved July
20, 2014, from http://dx.doi.org/10.1375/jhtm.14.1.47
Creaton, S. (2004). Ryanair: How a small Irish airline conquered Europe. London: Aurum Press.
Doganis, R. (2001). The airline business in the twenty-first century. London: Routledge.
Dursun, M. E. (2008). Havayolu İşletmelerinde Uçuş Öncesi, Uçuş Esnası Ve Uçuş Sonrasında
Sunulan Hizmetlerin Kalitesinin Ölçülmesi: İç Hatlarda Bir Uygulama. Ulusal Tez Merkezi.
Retrieved May 13, 2014, from https://tez.yok.gov.tr/

92!!
ELFAA members “Europe’s success stories”. (2014, February 15). European Low Fares Airline
Association. Retrieved July 13, 2014, from http://www.elfaa.com/140226_ELFAA_Pres
Erdal, A., & Zengin, E. (2000). HÌZMET SEKTÖRÜNDE TOPLAM KALÌTE YÖNETİMİ .
Journal of Qafqaz University, 3(1). Retrieved July 3, 2014, from Qafqaz University
Ersin, M., (1999). Tüketici Satın Alma Karar Aşamasında Marka Bağımlılığı Etkisi ve Meyve
Suyu Tüketicileri Üzerine Bir Uygulama Retrieved July 13, 2014, from https://tez.yok.gov.tr/
Esin, A. (2002). ISO 9001:2000 ışığında hizmette toplam kalite. Ankara: Metu Press.
Feldman, J. (1988). Development strategies for the world's airlines. London: Economist
Intelligence Unit.
Frank, R. E. (1962). Brand Choice as a Probability Process. The Journal of Business, 35(1), 43.
Retrieved August 4, 2014, from http://dx.doi.org/10.1086/294465
Flydubai. (n.d.). flydubai announces 47 per cent profit increase over 2012 Results. Retrieved
August 5, 2014, from http://www.flydubai.com/en/news/article/flydubai-announces-47-per-cent-
profit-increase-over-2012-results/
Flynas. (n.d.). About flynas. Retrieved August 5, 2014, from http://www.flynas.com/en/about-
flynas/
Flypgs Filomuz. (n.d.). Pegasus Hakkında Pegasus Havayolları. Retrieved August 10, 2014, from
http://www.flypgs.com/pegasus-hakkinda/filomuz.aspx
Gross, S., & Bjelicic, B. (2007). Handbook of low cost airlines: strategies, business processes
and market environment. Berlin: Erich Schmidt.
Gross, S., & Luck, M. (2013). The low cost carrier worldwide. Farnham: Ashgate.

93!!
Han, H., Kim, Y., & Kim, E. (2011). Cognitive, affective, conative, and action loyalty: Testing
the impact of inertia. International Journal of Hospitality Management, 30(4), 1008-1019.
Retrieved June 27, 2014, from http://dx.doi.org/10.1016/j.ijhm.2011.03.00
Icao. (2013, December 16). 2013 ICAO AIR TRANSPORT RESULTS CONFIRM ROBUST
PASSENGER DEMAND, SLUGGISH CARGO MARKET. International Civil Aviation
Organization . Retrieved August 9, 2014, from
http://www.icao.int/Newsroom/News%20Doc%202013/COM.43.13.ECON-RESULTS.Final-
2.en.pdf
Kağnıcıoğlu, D. (2007). Endüstri ilişkileri boyutuyla sosyal sorumluluk. Eskişehir: Anadolu
Üniversitesi.
Keller, N., & Wilderom, C. (1992). What the Service World Needs Now: Leadership Lessons
from the 1980s to the 1990s. International Journal of Service Industry Management, 3(2), 45-57.
Retrieved July 8, 2014, from http://dx.doi.org/10.1108/0956423921001
Kırgız, A. C. (2014). An Example to the Use of Mystical Metaphor for Brand Identity In Turkey:
The Evil Eye Bead. European Scientific Journal, 10(11), 14-26. Retrieved August 13, 2014, from
http://eujournal.org/index.php/esj/article/
Kim, D., & Barnhart, C. (2007). Flight schedule design for a charter airline. Computers &
Operations Research, 34(6), 1516-1531. Retrieved August 15, 2014, from
http://dx.doi.org/10.1016/j.cor.2005.07.010
Kotler, P., & Armstrong, G. (1991). Principles of marketing (5th ed.). Englewood Cliffs, N.J.:
Prentice Hall.

94!!
Kurtulmuş, N. (2001). Sanayi ötesi dönüşüm: küreselleşme ve insan kaynakları boyutuyla (2nd.
ed.). İstanbul: İz Yayıncılık.
Lemmink, J., Ouwersloot, H., & Riel, A. V. (2001). Consumer Evaluations of Service Brand
Extensions. Journal of Service Research, 3(3), 220-231. Retrieved July 3, 2014, from
http://dx.doi.org/10.1177/10946705013300
Lin, M. H. (2012). Airlines-within-airlines strategies and existence of low-cost carriers.
Transportation Research Part E: Logistics and Transportation Review, 48(3), 637-651.
Lovelock, C. H. (2001). Services marketing: people, technology, strategy (4th ed.). Upper Saddle
River, NJ: Prentice Hall.
Malglaive, E. d. (2003, April). How are Europe‘s Low-cost Carriers Bucking The Trend?. Flight
International Magazine, 71, 29-37.
Marshall, A. (1892). Elements of economics of industry, being the first volume of Elements of
economics,. London and: Macmillan and Co..
Mason, K., 2001. Marketing low-cost airline services to business travelers, Journal of Air
Transport Management 7(2), 103-109.
Morley, C. L. (2007). Implications for regional destinations of new airline strategies. Tourism
Economics, 13(3), 475-480. Retrieved July 18, 2014, from
http://dx.doi.org/10.5367/00000000778149
Morrell, P. (2005). Airlines within airlines: An analysis of US network airline responses to Low
Cost Carriers. Journal of Air Transport Management, 11(5), 303-312.

95!!
Neufville, R. D. (2006). Planning Airport Access in an Era of Low-Cost Airlines. Journal of the
American Planning Association, 72(3), 347-356. Retrieved July 29, 2014, from
http://dx.doi.org/10.1080/0194436060897
OECD employment outlook: June 2001 (pp. 89-128). (2001). The Characteristics and Quality of
Service Sector Jobs. Paris: Organization for Economic Co-operation and Development.
Oliver, R. L. (1999). Whence Consumer Loyalty?. Journal of Marketing, 63, 33. Retrieved June
18, 2014, from http://dx.doi.org/10.2307/1252099
Ozturk, S. A. (1996, Fall). Hizmet İşletmelerinde Kalite Boyutları ve Kalitenin Arttırılması.
Verimlilik, 2, 11-23. Retrieved July 8, 2014, from
https://academy.anadolu.edu.tr/xdisplayx.asp?kod=0&acc=sozturk
Ozturk, S. A. (1998). Hizmet pazarlaması. Eskişehir: Anadolu Üniversitesi.
Piga, C., & Filippi, N. (2001). Booking and flying with low cost airlines. Nottingham: Christel
DeHaan Tourism and Travel Research Institute, University of Nottingham.
Raj, S. P. (1985). Striking a Balance between Brand "Popularity" and Brand Loyalty. Journal of
Marketing, 49(1), 53. Retrieved May 19, 2014, from http://dx.doi.org/10.2307/1251175
Rao, C. P. (1998). Globalization, privatization and free market economy. Westport, Conn.:
Quorum Books.
Romanovskii, I. V. (1982). Analysis of the service concept. Cybernetics, 17(4), 498-505
Say, J. B., Princep, C. R., & Biddle, C. C. (1964). A treatise on political economy; or, The
production, distribution & consumption of wealth,. New York: A.M. Kelley, bookseller.

96!!
Sekizinci Beş Yıllık Kalkınma Planı (2001-2005) Ulastırma Özel İhtisas Komisyonu Raporları
(2011. T.C Kalkınma Bakanlığı Başlık alanı değeri.. Retrieved July 19, 2014, from
http://www.kalkinma.gov.tr/Pages/content.aspx?List=0e61756a-b3f2-4261-8c0d-
2350283f9855&ID=175
Seyran, C. D. (2004). Hizmet kalitesi: modeller ve hizmet kalitesine yeni bir bakış açısı.
İstanbul: KalDer.
Smith, A., Cannan, E., & Lerner, M. (1937). An inquiry into the nature and causes of the wealth
of nations (Canaan ed.). New York: The Modern library.
Smith, A. D. (2008). Customer Loyalty Card Programmes And Its Interaction With Support
Technology In The Retail Industry. International Journal of Management and Enterprise
Development, 5(2), 157. Retrieved July 21, 2014, from
http://dx.doi.org/10.1504/IJMED.2008.01697
Stanton, W. J., Etzel, M. J., & Walker, B. J. (1991). Fundamentals of marketing (9th ed.). New
York: McGraw-Hill.
Stauss, B., Chojnacki, K., Decker, A., & Hoffmann, F. (2001). Retention Effects Of A Customer
Club. International Journal of Service Industry Management, 12(1), 7-19. Retrieved August 2,
2014, from http://dx.doi.org/10.1108/0956423011038
Smith, F. L., & Cox, B. (n.d.). Airline Deregulation. : The Concise Encyclopedia of Economics.
Retrieved July 4, 2014, from http://www.econlib.org/library/Enc/AirlineDe
Southwest Airlines Company Profile. (n.d.). Southwest Airlines Investor Relations - . Retrieved
August 15, 2014, from http://southwest.investorroom.com/

97!!
Star Gazetesi (2008, April 4). Türkiye'nin memur portalı. PEGASUS, 10 YTL alınca iş
başvuruları dibe vurdu. Retrieved July 6, 2014, from http://www.memurlar.net/haber/106678/
Taneja, N. K. (2004). Simpli-Flying: optimizing the airline business model. Aldershot, Hants,
England: Ashgate.
Thomas, G. (2002). Asia's absent revolution. Air Transport World, 39, 42-47. Retrieved July 26,
2014, from https://getinfo.de/app/Asia-s-absent-revolution/id/BLSE%3ARN118889721
Tıngır, E. (2006). İşletmelerde Sosyal Sorumluluk Faaliyetlerinin Marka Sadakatine Etkileri
Üzerine Bir Araştırma. Ulusal Tez Merkezi. Retrieved May 13, 2014, from https://tez.yok.gov.tr/
Turkish Airlines 01 OCAK – 31 ARALIK 2013 DÖNEMİNE İLİŞKİN YÖNETİM KURULU
FAALİYET RAPORU. (2014, March 6). Turkish Airlines Investor Relations. Retrieved June 1,
2014, from http://investor.turkishairlines.com/documents/ThyInvestorRelations/download/
Turkish Airlines Seat Maps. (n.d.). SeatGuru Seat Map Turkish Airlines Boeing 737-800 (738)
V1. Retrieved August 5, 2014, from
http://www.seatguru.com/airlines/Turkish_Airlines/Turkish_Airlines_Boeing_737-800_B.php
Turkish Civil Aviation Act. (1983, October 14). General Directorate of Turkish Civil Aviation.
Retrieved July 11, 2014, from http://web.shgm.gov.tr/doc2/law2920.pdf
Tuzcuoglu, S. (2003, April). Bulutlar Uzerinde Rekabet. Marketing Turkiye Dergisi, 26, 57-67.
Uyguç, N. (1998). Hizmet Sektöründe Kalite Yönetimi-Stratejik Bir Yaklaşım. İzmir: Eylul
Yayınları.
Uzun, Y., & Erdil, T. S. (2009). Marka olmak (1.baskı ed.). İstanbul: Beta Basım Yayım
Dağıtım.

98!!
Vakif Yatirim Pegasus Hava Taşımacılığı . (2013, April 18). Vakif Yatirim. Retrieved July 19,
2014, from http://www.vakifyatirim.com.tr/files/news
Wensveen, J. G., & Wells, A. T. (2011). Air transportation a management perspective. (7th ed.).
Farnham, England: Ashgate.
Williams, G., 2001. Will Europe’s charter carriers be replaced by “no-frills” scheduled Airlines?,
Journal of Air Transport Management 7(5), 277-286.
Wreden, N. (2005). ProfitBrand how to increase the profitability, accountability & sustainability
of brands. London: Kogan Page.
Yi, Y., & Jeon, H. (2003). Effects of loyalty programs on value perception, program loyalty, and
brand loyalty. Journal of the Academy of Marketing Science, 31(3). Retrieved August 5, 2014,
from http://dx.doi.org/10.1177/00920703030310
Zeithaml, V. A., & Bitner, M. J. (2000). Services marketing: integrating customer focus across
the firm (2nd ed.). Boston: Irwin/McGraw-Hill.

99!!
APPENDIXES
Survey Sample
Dear participant;
The following questionnaire is prepared to determine the quality of service for Turkish low cost airline companies. Obtaining accurate information on the subject will be possible with your sincere and honest answers to the questions. The information obtained from this study will not share with any organizations and institutions. These information will be used only for scientific purposes. Thank you for your contribution and participation.
Duhan Can ÇAKI
Socio Demographic Questions
1) Gender: Male:� Female:� 2) Your age: 18-25 � 26-35 � 36-50� 50+� 3) Education level:
Literate:�
Primary School:�
High School: �
Undergraduate: �
Graduate (Master level): �
PhD level: �!
4) Your average salary level (Turkish Lira):
0-1000 � 1001-2000 � 2001-3000 � 3001-4000 � 4001+ �
5) Your job:
Business partner / owner: � Self-employed:�
Officer: � Worker: �
Director: � Unemployed: �
Retired: � Housewife: �
Other (please specify). .........

100!!
!! !! I"totally"disagree"
I"disagree"
Neu
tral"
I"agree
"
I"totally"agree
"
!! What are your expectations related to the services provided by LCC? !! !! !! !! !!!! Physical Evidences !! !! !! !! !!1)! LCC carriers should have modern equipment. !! !! !! !! !!2)! Working environments should be visually remarkable. !! !! !! !! !!3)! LCC staff should be well dressed and elegant appear. !! !! !! !! !!
4)!The low cost carrier company's physical image should be related with the service they offer. !! !! !! !! !!
!! Reliabilty !! !! !! !! !!
5)!If lcc company promised to do something at a particular time, it should fulfil. !! !! !! !! !!
6)!When customers have some problems, lcc company should be insightful and reassuring. !! !! !! !! !!
7)! Lcc company should be reliable !! !! !! !! !!8)! LCC companies must be fulfilled their services at the time promised. !! !! !! !! !!9)!! LCC companies must keep proper and accurate records. !! !! !! !! !!!! Enthusiasm !! !! !! !! !!10)! Service should be expected when fulfilled. !! !! !! !! !!11)! Customers expect a quick service from this lcc company's employees. !! !! !! !! !!12)! Company employees are always willing to help their customers. !! !! !! !! !!
13)!If the employee is busy in flying, does not matter to respond to the customer's request. !! !! !! !! !!
!! Trust !! !! !! !! !!14)! Customers should be able to trust these companies' employees. !! !! !! !! !!15)! Customers should feel confident in their dealing with employees. !! !! !! !! !!16)!! Employees should be polite. !! !! !! !! !!
17)!Employees should take adequate support to do their jobs well from their company. !! !! !! !! !!
!! Sensitivity !! !! !! !! !!18)! Individual care should be expected from company to their customers. !! !! !! !! !!
19)!Individual care should be expected from company employees to their customers. !! !! !! !! !!
20)!Expectation of customers should know before needing to this by employees are realistic !! !! !! !! !!
21)!The customer should be expected that knowing what's best for him by company is realistic idea !! !! !! !! !!
22)!The customer should expect a suitable working hour for him by the company that provide service. !! !! !! !! !!
!
!

101!!
!! !! I"totally"disagree"
I"disagree"
Neu
tral"
I"agree
"
I"totally"agree
"
!! How"did"you"perceive"the"services"provided"by"Pegasus"Airlines?" !! !! !! !! !!
!Physical"Evidences" !! !! !! !! !!
1)! Pegasus!have!modern!equipment.! !! !! !! !! !!2)! Pegasus's!working!environments!should!be!visually!remarkable.! !! !! !! !! !!3)! Pegasus!staff!have!well!dressed!and!elegant!appear.! !! !! !! !! !!4)! Pegasus's!physical!image!related!with!the!service!they!offer.! !! !! !! !! !!!! Reliability" !! !! !! !! !!5)! If!Pegasus!promised!to!do!something!at!a!particular!time,!it!fulfil.! !! !! !! !! !!
6)!When!customers!have!some!problems,!Pegasus!is!being!insightful!and!reassuring.! !! !! !! !! !!
7)! Pegasus!is!a!reliable!company! !! !! !! !! !!8)! Pegasus!fulfil!their!services!at!the!time!promised.!! !! !! !! !! !!9)!! Pegasus!keeps!proper!and!accurate!records.! !! !! !! !! !!!! Enthusiasm" !! !! !! !! !!10)! Service!is!being!expected!when!fulfilled.!! !! !! !! !! !!11)! Customers!expect!a!quick!service!from!Pegasus's!employees.! !! !! !! !! !!12)! Pegasus!employees!are!always!willing!to!help!their!customers.! !! !! !! !! !!
13)!If! Pegasus! employee! is! busy,! does! not! matter! to! respond! to! the!customer's!request.!! !! !! !! !! !!
!! Trust" !! !! !! !! !!14)! You!can!trust!to!Pegasus!employees.! !! !! !! !! !!15)! You!feel!confident!in!your!dealing!with!Pegasus!employees.! !! !! !! !! !!16)!! Pegasus!employees!are!polite.! !! !! !! !! !!
17)!Pegasus!employees! take!adequate! support! to!do! their! jobs!well! from!their!management.! !! !! !! !! !!
!! Sensitivity" !! !! !! !! !!
18)!Individual! care! should! be! expected! from! Pegasus! Airlines! to! their!customers.! !! !! !! !! !!
19)!Individual! care! should! be! expected! from! Pegasus! employees! to! their!customers.! !! !! !! !! !!
20)!Expectation! of! customers! should! know! before! needing! ! to! this! by!Pegasus!employees!are!realistic! !! !! !! !! !!
21)!The! customer! should! expect! that! knowing! what's! best! for! him! by!Pegasus!is!realistic!idea! !! !! !! !! !!
22)!The! customer! should! expect! a! suitable! working! hour! for! him! by!Pegasus.! !! !! !! !! !!
!

102!!
!! !! I"totally"disagree"
I"disagree"
Neu
tral"
I"agree
"
I"totally"agree
"
!! How did you perceive the services provided by Anadolujet Airlines? !! !! !! !! !!!! Physical Evidences !! !! !! !! !!1)! Anadolujet have modern equipment. !! !! !! !! !!2)! Anadolujet's working environments should be visually remarkable. !! !! !! !! !!3)! Anadolujet staff well dressed and elegant appear. !! !! !! !! !!4)! Anadolujets physical image related with the service they offer. !! !! !! !! !!!! Reliability !! !! !! !! !!5)! If Anadolujet promised to do something at a particular time, it fulfil. !! !! !! !! !!
6)!When customers have some problems, Anadolujet is being insightful and reassuring. !! !! !! !! !!
7)! Anadolujet is a reliable company. !! !! !! !! !!8)! Anadolujet fulfil their services at the time promised. !! !! !! !! !!9)!! Anadolujet keeps proper and accurate records. !! !! !! !! !!!! Enthusiasm !! !! !! !! !!10)! Service is being expected when fulfilled. !! !! !! !! !!11)! Customers expect a quick service from Anadolujet's employees. !! !! !! !! !!12)! Anadolujet employees are always willing to help their customers. !! !! !! !! !!
13)!If Anadolujet employee is busy, does not matter to respond to the customer's request. !! !! !! !! !!
!! Trust !! !! !! !! !!14)! You can trust to Anadolujet employees. !! !! !! !! !!15)! You can feel confident in your dealing with Anadolujet employees. !! !! !! !! !!
16)!! Anadolujet employees are polite. !! !! !! !! !!
17)!Anadolujet employees take adequate support to do their jobs well from their management. !! !! !! !! !!
!! Sensitivity !! !! !! !! !!18)! Individual care should be expected from Anadolujet to their customers. !! !! !! !! !!
19)!Individual care should be expected from Anadolujet employees to their customers. !! !! !! !! !!
20)!Expectation of customers should know before needing to this by Anadolujet employees are realistic !! !! !! !! !!
21)!The customer should expect that knowing what's best for him by Anadolujet is realistic idea !! !! !! !! !!
22)!The customer should expect a suitable working hour for him by Anadolujet. !! !! !! !! !!
!
!

103!!
OTHER"QUESTIONS"
!
1 Too
bad
bad
aver
age
good
very
goo
d
When you consider the quality of services to aircraft what is your overall impressions from Pegasus Airlines?
2 Too
bad
bad
aver
age
good
very
goo
d
When you consider the quality of services to aircraft what is your overall impressions from Anadolujet Airlines?
3 I to
tally
di
sagr
ee
I dis
agre
e
Neu
tral
I agr
ee
I to
tally
ag
ree
I would travel again with Pegasus Airlines in the future.
4 I to
tally
di
sagr
ee
I dis
agre
e
Neu
tral
I agr
ee
I to
tally
ag
ree
I would travel again with Anadolujet Airlines in the future.
5 No
Neu
tral
Yes
Would you recommend Pegasus airlines to others?
6 No
Neu
tral
Yes
Would you recommend Anadolujet airlines to others?

104!!
7 No
Yes
Do you prefer Pegasus Airlines in your future travel?
8 No
Yes
Do you prefer Anadolujet Airlines in your future travel?
9 No
Yes
Have you ever experienced any problem with Pegasus Airlines?
10 No
Yes
Have you ever experienced any problem with Anadolujet Airlines?
11 V
ery
diss
atis
fied
Dis
satis
fied
Neu
tral
Satis
fied
Ver
y sa
tisfie
d
What is your overall level of satisfaction from Pegasus Airlines?
12 Ver
y di
ssat
isfie
d
Dis
satis
fied
Neu
tral
Satis
fied
Ver
y sa
tisfie
d
What is your overall level of satisfaction from Anadolujet?