Measuring Religious Attitudes in Secularised Western European Context: A Psychometric Analysis of...
21
This article was downloaded by: [UNSW Library] On: 12 January 2015, At: 19:53 Publisher: Routledge Informa Ltd Registered in England and Wales Registered Number: 1072954 Registered office: Mortimer House, 37-41 Mortimer Street, London W1T 3JH, UK Click for updates The International Journal for the Psychology of Religion Publication details, including instructions for authors and subscription information: http://www.tandfonline.com/loi/hjpr20 Measuring Religious Attitudes in Secularized Western European Context: A Psychometric Analysis of the Post- Critical Belief Scale Karolina Krysinska a , Kim De Roover a , Jan Bouwens b , Eva Ceulemans a , Jozef Corveleyn a , Jessie Dezutter a , Bart Duriez a , Dirk Hutsebaut a & Didier Pollefeyt b a Psychology and Educational Sciences KU Leuven–University of Leuven Leuven, Belgium b Theology and Religious Studies KU Leuven-Catholic University of Leuven Leuven, Belgium Accepted author version posted online: 08 Jan 2014.Published online: 02 Oct 2014. To cite this article: Karolina Krysinska, Kim De Roover, Jan Bouwens, Eva Ceulemans, Jozef Corveleyn, Jessie Dezutter, Bart Duriez, Dirk Hutsebaut & Didier Pollefeyt (2014) Measuring Religious Attitudes in Secularized Western European Context: A Psychometric Analysis of the Post- Critical Belief Scale, The International Journal for the Psychology of Religion, 24:4, 263-281, DOI: 10.1080/10508619.2013.879429 To link to this article: http://dx.doi.org/10.1080/10508619.2013.879429 PLEASE SCROLL DOWN FOR ARTICLE Taylor & Francis makes every effort to ensure the accuracy of all the information (the “Content”) contained in the publications on our platform. However, Taylor & Francis, our agents, and our licensors make no representations or warranties whatsoever as to the accuracy, completeness, or suitability for any purpose of the Content. Any opinions and views expressed in this publication are the opinions and views of the authors, and are not the views of or endorsed by Taylor & Francis. The accuracy of the Content should not be relied upon and should be independently verified with primary sources of information. Taylor and Francis shall not be liable for any losses, actions, claims, proceedings, demands, costs, expenses, damages, and other liabilities whatsoever or howsoever caused arising directly or indirectly in connection with, in relation to or arising out of the use of the Content.
-
Upload
independent -
Category
Documents
-
view
2 -
download
0
Transcript of Measuring Religious Attitudes in Secularised Western European Context: A Psychometric Analysis of...
This article was downloaded by: [UNSW Library]On: 12 January 2015, At: 19:53Publisher: RoutledgeInforma Ltd Registered in England and Wales Registered Number: 1072954 Registeredoffice: Mortimer House, 37-41 Mortimer Street, London W1T 3JH, UK
Click for updates
The International Journal for thePsychology of ReligionPublication details, including instructions for authors andsubscription information:http://www.tandfonline.com/loi/hjpr20
Measuring Religious Attitudes inSecularized Western European Context:A Psychometric Analysis of the Post-Critical Belief ScaleKarolina Krysinskaa, Kim De Roovera, Jan Bouwensb, Eva Ceulemansa,Jozef Corveleyna, Jessie Dezuttera, Bart Durieza, Dirk Hutsebauta &Didier Pollefeytb
a Psychology and Educational Sciences KU Leuven–University ofLeuven Leuven, Belgiumb Theology and Religious Studies KU Leuven-Catholic University ofLeuven Leuven, BelgiumAccepted author version posted online: 08 Jan 2014.Publishedonline: 02 Oct 2014.
To cite this article: Karolina Krysinska, Kim De Roover, Jan Bouwens, Eva Ceulemans, JozefCorveleyn, Jessie Dezutter, Bart Duriez, Dirk Hutsebaut & Didier Pollefeyt (2014) MeasuringReligious Attitudes in Secularized Western European Context: A Psychometric Analysis of the Post-Critical Belief Scale, The International Journal for the Psychology of Religion, 24:4, 263-281, DOI:10.1080/10508619.2013.879429
To link to this article: http://dx.doi.org/10.1080/10508619.2013.879429
PLEASE SCROLL DOWN FOR ARTICLE
Taylor & Francis makes every effort to ensure the accuracy of all the information (the“Content”) contained in the publications on our platform. However, Taylor & Francis,our agents, and our licensors make no representations or warranties whatsoever as tothe accuracy, completeness, or suitability for any purpose of the Content. Any opinionsand views expressed in this publication are the opinions and views of the authors,and are not the views of or endorsed by Taylor & Francis. The accuracy of the Contentshould not be relied upon and should be independently verified with primary sourcesof information. Taylor and Francis shall not be liable for any losses, actions, claims,proceedings, demands, costs, expenses, damages, and other liabilities whatsoever orhowsoever caused arising directly or indirectly in connection with, in relation to or arisingout of the use of the Content.

This article may be used for research, teaching, and private study purposes. Anysubstantial or systematic reproduction, redistribution, reselling, loan, sub-licensing,systematic supply, or distribution in any form to anyone is expressly forbidden. Terms &Conditions of access and use can be found at http://www.tandfonline.com/page/terms-and-conditions
Dow
nloa
ded
by [
UN
SW L
ibra
ry]
at 1
9:53
12
Janu
ary
2015
The International Journal for the Psychology of Religion, 24:263–281, 2014
Copyright © Taylor & Francis Group, LLC
ISSN: 1050-8619 print/1532-7582 online
DOI: 10.1080/10508619.2013.879429
RESEARCH
Measuring Religious Attitudes in SecularizedWestern European Context: A Psychometric
Analysis of the Post-Critical Belief Scale
Karolina Krysinska and Kim De RooverPsychology and Educational Sciences
KU Leuven–University of Leuven
Leuven, Belgium
Jan BouwensTheology and Religious Studies
KU Leuven-Catholic University of Leuven
Leuven, Belgium
Eva Ceulemans, Jozef Corveleyn, Jessie Dezutter, Bart Duriez, andDirk Hutsebaut
Psychology and Educational Sciences
KU Leuven–University of Leuven
Leuven, Belgium
Didier PollefeytTheology and Religious Studies
KU Leuven-Catholic University of Leuven
Leuven, Belgium
Wulff’s two-dimensional model of approaches to religion was an inspiration for the development
of the Post-Critical Belief Scale (PCBS), an instrument measuring religious attitudes, that is,
“paradigms of religious belief structure” in a secularized Western European context. The scale
Correspondence should be sent to Karolina Krysinska, Department of Psychology, KU Leuven–University of
Leuven, Tiensestraat 102 Box 3720, 3000 Leuven, Belgium. E-mail: [email protected]
263
Dow
nloa
ded
by [
UN
SW L
ibra
ry]
at 1
9:53
12
Janu
ary
2015
264 KRYSINSKA ET AL.
has been frequently used in psychological studies, has undergone psychometric analyses and
modifications, and has been translated into several languages. The current study shows results
of a psychometric analysis of the component structure of PCBS in different age groups over
time using Clusterwise Simultaneous Component Analysis-Equal Cross-Product (SCA-ECP). The
analysis was based on samples collected in Flanders (Belgium; N D 14,599). The one-cluster
and two-cluster models yielded three components: Literal Affirmation, Literal Disaffirmation, and
Symbolic Attitude, and there were no differences between age groups. In the two-cluster model,
subtle differences between samples collected before and after 2002 were found, and these were
related to two PCBS items referring to interpretation of Biblical stories. Our finding of a generalized
Symbolic Attitude might be related to the changes in the approaches to religion in secularized
Western Europe, and might capture the religious (dis-)belief of individuals who are open and
tolerant to other religious systems, or alternatively, have become indifferent to them. Further
cross-cultural and longitudinal studies are needed to better understand the religious attitudes in
a secularized context, and the development of a new scale based on the paradigm of personal
meaning systems is suggested
INTRODUCTION
The religious landscape of Belgium, a traditionally Roman Catholic country, has been evolving
over the last three decades (Boeve, 2006, 2008). There have been significant changes regarding
the content of individuals’ beliefs and the ways religion is practiced in public and private
domains. Between 1981 and 2009, the percentage of regular churchgoers decreased from 30%
to 11%, and the percentage of individuals believing in God has decreased from 77% to 57%
(Abts, Dobbelaere, & Voyé, 2011). Nonetheless, although some individuals give up public
religious practices and beliefs, they remain interested in spiritual issues and engage in private
religious activities, such as prayer or meditation. In 2008, 38% of the Belgian respondents
believed in the existence of a spirit or a life force other than a personal God, 47% of the
respondents described themselves as “very or somehow spiritual,” and 22% had their own way
of “connecting with the divine” (European Values Study, 1999/2000, 2010). This evolution
has been observed in other Western European countries (Houtman & Aupers, 2007; Pollack,
2008) and in the United States (Pew Research Center, 2012). Apparently, some individuals
reject practices and beliefs of an organized religion (i.e., Christianity) but remain interested
in religious/spiritual issues and create their own system of beliefs and behaviors, related to
an individually defined “sacred.” This increasing interest in the personal “spiritual” and the
tendency to “pick and choose” among religious/spiritual traditions, beliefs, and practices has
been described as “believing without belonging” (Davie, 1990, 2005), “fuzzy fidelity” (Voas,
2009), “religion à la carte” (Abts et al., 2011), or “rise of the nones” (Pew Research Center,
2012). The latter refers to the increasing numbers of U.S. respondents who “answer a survey
question about their religion by saying they have no religion, no particular religion, no religious
preference, or the like” (Pew Research Center, 2012, p. 7).
Such changes in religious practices and beliefs observed in the Belgian population have
called for new theoretical frameworks and the development of new psychological instruments
able to reflect their complexity and diversity. To address this issue, in the mid-1990s, Hutsebaut
(1996, 1997) constructed the Post-Critical Belief Scale (PCBS), a multidimensional instrument
measuring religious attitudes defined as “paradigms of religious belief structure” (Hutsebaut,
Dow
nloa
ded
by [
UN
SW L
ibra
ry]
at 1
9:53
12
Janu
ary
2015
MEASURING RELIGIOUS ATTITUDES 265
1996, p. 56). The PCBS is based on Wulff’s (1991, 1997) categorization of psychological
and individual approaches to religion. Wulff’s comprehensive framework (presented next),
encompassing both religious belief and disbelief, seemed particularly well suited as a theoretical
model guiding the development of a scale measuring attitudes toward religion in a secularized
Christian context.
THE WULFF MODEL
In his seminal book Psychology of Religion: Classic and Contemporary Views, Wulff (1991,
1997) presented a summary schema to classify both psychological approaches toward and
individuals’ views on religion. On the basis of two dimensions (i.e., Inclusion vs. Exclusion of
Transcendence and Literal vs. Symbolic), Wulff discerned four religious attitudes: Literal Affir-
mation, Literal Disaffirmation, Symbolic Affirmation, and Symbolic Disaffirmation. Although
the dimension of Inclusion versus Exclusion of Transcendence specifies the degree to which
an individual believes in the existence of a transcendental reality, the Literal versus Symbolic
dimension reflects the way in which religious messages are interpreted.
The attitude of Literal Affirmation applies to individuals who define themselves as reli-
gious and interpret religious contents in a rigid, closed-minded, and dogmatic fashion. These
individuals uncritically and strictly adopt religious contents as taught by a particular religious
tradition. In its extreme, it is represented by religious fundamentalism or orthodoxy. Literal
Disaffirmation represents an utter rejection of religion on the basis of strict and literal arguments
(e.g., the lack of scientific evidence for the miraculous stories in the Bible). The belief in the
transcendent is replaced with belief in science and the rational principles of knowledge. Like a
literal believer, the literal disbeliever tends to be rigid, low in ability to adapt, and less capable
to evaluate ideas (Wulff, 1991, 1997).
The other two concepts, Symbolic Affirmation and Symbolic Disaffirmation, are derived
from the hermeneutic ideas presented in the works of the French philosopher Paul Ricoeur
(1978). According to Ricoeur, development of faith is based on the reconciliation of two
opposing but potentially complementary processes: reduction and restoration. Reduction in-
volves a deciphering of religious messages in order to find the deep spiritual messages hidden
beyond the religious mythology. In a secularized cultural context this also requires confrontation
with the critique of religion delivered by the “masters of suspicion” (i.e., Nietzsche, Freud,
and Marx). Restoration implies a return to religious faith, now on a deeper, symbolic level
of interpretation (“a second naiveté”). The attitude of Reductive Interpretation (or Symbolic
Disaffirmation) is based on a rejection of the existence of a transcendental realm. However,
it goes beyond the simple literal disbelief and sees religion and its rituals as an expression
of human needs and “restores to religion some fundamental, positive meaning” (Wulff, 1991,
p. 634). Individuals representing this attitude consider religiosity as one way of giving meaning
to life among many others. They respect other people’s choice to be religious but do not need
religiosity themselves to find meaning in life. Finally, Restorative Interpretation (or Symbolic
Affirmation) represents a belief in religious ideas and objects based upon a search for “symbolic
meaning that resides within and ultimately points beyond these objects” (Wulff, 1991, p. 634).
This attitude can also be described as “postcritical belief” as it tries to go beyond the criticism
of religion. Individuals with this attitude define themselves as religious persons yet process
Dow
nloa
ded
by [
UN
SW L
ibra
ry]
at 1
9:53
12
Janu
ary
2015
266 KRYSINSKA ET AL.
religious contents in a more symbolic, open, and tolerant fashion. They assume that several
interpretations of religious contents are possible and try to find one that they find personally
meaningful.
In Hutsebaut’s (1996) opinion, Wulff’s model seemed particularly appropriate as a theoretical
basis for the development of a scale that measures religious attitudes in the secularized
context of Belgium (Flanders). The two dimensions encompass both the contents and the
way of processing information in religious and nonreligious worldviews, thus providing more
psychological insight into a variety of ways in which individuals approach religion. For
example, initial Flemish studies of religious attitudes using the PCBS drafted a profile of
believers and nonbelievers approaching religion in a symbolic way. According to Hutsebaut
(1996), a symbolic believer
is basically aware, after reflection that his way of thinking about religious belief is one possibility
besides other possibilities. He has a fundamental symbolic interpretation of the Bible stories and
is fundamentally aware of the quest dimension in belief: : : : He has no fear for the complexity of
the questions. (p. 57)
A symbolic nonbeliever
is not a real unbeliever. He will score low on religious items, but religion is still present in his
life, perhaps on a rather negative or ambivalent mode, but present. His religiosity is colored by
the critique formulated by the masters of suspicion. This means that the subject is in search of
objective certainty, he is anxious about uncertainty in belief, he wants to be objectively sure about
belief just as he can be sure in objective positive science. (Hutsebaut, 1996, p. 58)
PRESENT STUDY
The PCBS has been used extensively in studies in psychology of religion in Belgium (Flanders)
and other countries (for an overview, see Duriez, Dezutter, Neyrinck, & Hutsebaut, 2007). It
has also been applied in studies looking at Catholic school identity in Flanders and Australia
(Bouwens, 2012; Pollefeyt & Bouwens, 2010). Over the last decade, authors of the current study
have collected a large database of PCSB scores on item level (N D 28,562; for more details,
see the Method section) in different age groups and have gathered considerable experience
in using the scale. Over the years, however, we have observed that some of the Flemish
participants, especially adolescents, have problems understanding and accepting scale items
relating to specific Catholic religious teachings, such as the Biblical stories (e.g., Items 2 and
25). Also, a recent study assessing Catholic school identity in Australia reported problems with
the understanding of scale items by young Australian participants (Bouwens, 2012; Pollefeyt
& Bouwens, 2010). Consequently, a research question has arisen whether the meaning or
interpretation of the PCBS items has changed over time in different data sets.
The aim of the current study is to analyze the scale structure based on data collected
(a) from subjects in different age groups (i.e., adolescents, young adults, and adults), and (b) in
different periods (data collected before 2002, 2002–2005, and 2006–2010). The choice of the
age groups and the data collection cut-off points was guided by both practical and theoretical
considerations. The practical aspect relates to three effective periods of data collection, that
Dow
nloa
ded
by [
UN
SW L
ibra
ry]
at 1
9:53
12
Janu
ary
2015

MEASURING RELIGIOUS ATTITUDES 267
is, before 2002, 2002–2005, 2005–2010 (Dezutter & Hutsebaut, 2010; Duriez, Fontaine, &
Hutsebaut, 2000; Duriez, Soenens, & Hutsebaut, 2005; Fontaine, Duriez, Luyten, & Hutsebaut,
2003; Pollefeyt & Bouwens, 2010). The theoretical considerations refer to the aforementioned
changes in the religious culture in Western Europe (see the Introduction section). These
sociological and historical evolutions clearly involved also changes in educational practices in
general, and in religious education in particular (Duriez, Soenens, Neyrinck, & Vansteenkiste,
2009; Henckens et al., 2011).
In this study we used a recently developed component analysis method called “Clusterwise
SCA-ECP,” a specific variant of simultaneous component analysis (De Roover, Ceulemans,
& Timmerman, 2012; De Roover, Ceulemans, Timmerman, Vansteelandt, et al., 2012; De
Roover, Ceulemans, Timmerman, Nezlek, & Onghena, 2013). This method seemed particularly
appropriate for the study aims, as it provides insight into the between-sample structural simi-
larities and differences. It provides best clustering of the samples according to the underlying
component structure, and thus allows to explore which samples differ in their underlying
structure and how.
METHOD
Participants
In this study we use 16 different samples (N D 28,562) that were collected in Flanders
(Belgium) using two versions of the 33-item PCBS: a 7-point scale, from 1 (strongly disagree)
to 7 (strongly agree), and a 6-point scale, from 1 (strongly disagree) to 6 (strongly agree).
In these samples we distinguished three age groups: adolescents (12–17 years), young adults
(18–24 years), and adults (25–85 years), and three data collection cut-off points for the analysis
(i.e., <2002, 2002–2005, and 2006–2010). Unfortunately, older data used in the original studies
of Hutsebaut (1996, 1997) are not available because of a simple but very sad fact: They were
lost in a fatal computer crash in the late 1990s. We can refer to the results reported in the
published studies, but we cannot reanalyze the original data.
The data that were gathered have a hierarchical structure, with subjects nested in 16 samples
differing with respect to age, year of administration of the scale, and scale version. Such
hierarchically structured data can also be referred to as “multiblock data,” as each sample
corresponds to a “data block.” The complete data set, discarding subjects with missing values,
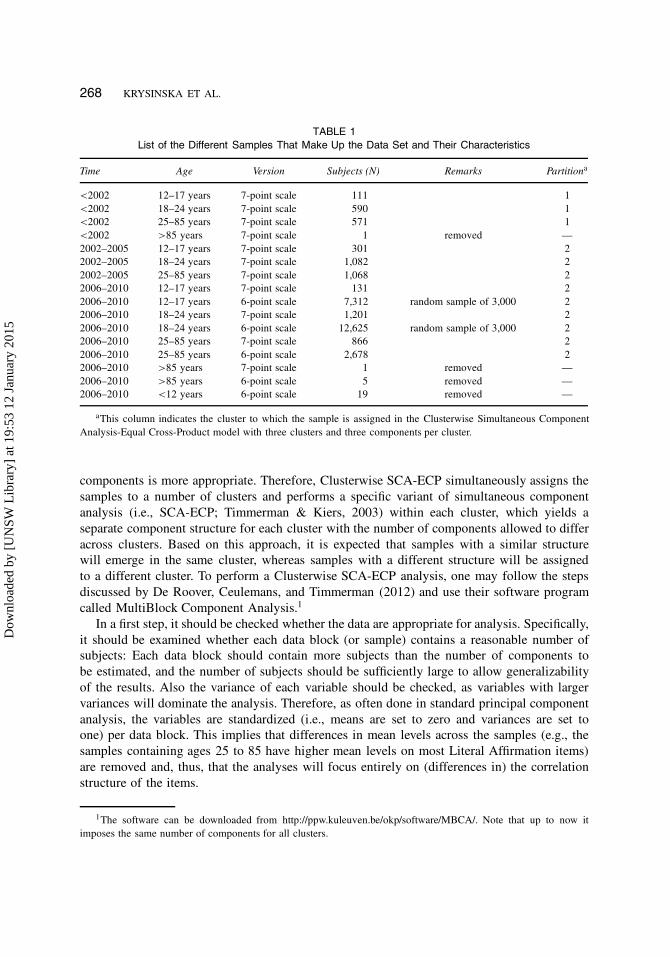
contains the 16 data blocks (or “samples”) enlisted in Table 1.
Analysis
To answer the research question, a component analysis method called “Clusterwise SCA-ECP”
was used (De Roover, Ceulemans, & Timmerman, 2012; De Roover, Ceulemans, Timmerman,
Vansteelandt, et al., 2012; De Roover et al., 2013). Like in standard principal component
analysis, the underlying structure of the PCBS was unveiled by reducing the items to a lower
number of constructed variables called “components” that summarize the observed scores on
the items. The general idea of the Clusterwise SCA-ECP approach is that some samples can
be modeled using the same set of components, whereas for other samples, a different set of
Dow
nloa
ded
by [
UN
SW L
ibra
ry]
at 1
9:53
12
Janu
ary
2015
268 KRYSINSKA ET AL.
TABLE 1
List of the Different Samples That Make Up the Data Set and Their Characteristics
Time Age Version Subjects (N) Remarks Partitiona
<2002 12–17 years 7-point scale 111 1
<2002 18–24 years 7-point scale 590 1
<2002 25–85 years 7-point scale 571 1
<2002 >85 years 7-point scale 1 removed —
2002–2005 12–17 years 7-point scale 301 2
2002–2005 18–24 years 7-point scale 1,082 2
2002–2005 25–85 years 7-point scale 1,068 2
2006–2010 12–17 years 7-point scale 131 2
2006–2010 12–17 years 6-point scale 7,312 random sample of 3,000 2
2006–2010 18–24 years 7-point scale 1,201 2
2006–2010 18–24 years 6-point scale 12,625 random sample of 3,000 2
2006–2010 25–85 years 7-point scale 866 2
2006–2010 25–85 years 6-point scale 2,678 2
2006–2010 >85 years 7-point scale 1 removed —
2006–2010 >85 years 6-point scale 5 removed —
2006–2010 <12 years 6-point scale 19 removed —
aThis column indicates the cluster to which the sample is assigned in the Clusterwise Simultaneous Component
Analysis-Equal Cross-Product model with three clusters and three components per cluster.
components is more appropriate. Therefore, Clusterwise SCA-ECP simultaneously assigns the
samples to a number of clusters and performs a specific variant of simultaneous component
analysis (i.e., SCA-ECP; Timmerman & Kiers, 2003) within each cluster, which yields a
separate component structure for each cluster with the number of components allowed to differ
across clusters. Based on this approach, it is expected that samples with a similar structure
will emerge in the same cluster, whereas samples with a different structure will be assigned
to a different cluster. To perform a Clusterwise SCA-ECP analysis, one may follow the steps
discussed by De Roover, Ceulemans, and Timmerman (2012) and use their software program
called MultiBlock Component Analysis.1
In a first step, it should be checked whether the data are appropriate for analysis. Specifically,
it should be examined whether each data block (or sample) contains a reasonable number of
subjects: Each data block should contain more subjects than the number of components to
be estimated, and the number of subjects should be sufficiently large to allow generalizability
of the results. Also the variance of each variable should be checked, as variables with larger
variances will dominate the analysis. Therefore, as often done in standard principal component
analysis, the variables are standardized (i.e., means are set to zero and variances are set to
one) per data block. This implies that differences in mean levels across the samples (e.g., the
samples containing ages 25 to 85 have higher mean levels on most Literal Affirmation items)
are removed and, thus, that the analyses will focus entirely on (differences in) the correlation
structure of the items.
1The software can be downloaded from http://ppw.kuleuven.be/okp/software/MBCA/. Note that up to now it
imposes the same number of components for all clusters.
Dow
nloa
ded
by [
UN
SW L
ibra
ry]
at 1
9:53
12
Janu
ary
2015
MEASURING RELIGIOUS ATTITUDES 269
In the next step, Clusterwise SCA-ECP analyses with different numbers of clusters and
components are conducted and model selection is performed, that is, the most appropriate
number of clusters (K) and the most appropriate number of components (Qk) for each cluster
is determined based on theoretical knowledge about the data or formal model selection tech-
niques. In the MultiBlock Component Analysis software, a formal model selection technique is
implemented that is based on scree plots (i.e., plots of the percentage of explained variance in
function of the number of components and clusters) and that determines for which model the
increase in fit with additional clusters or components levels off. The last step involves inspecting
and interpreting the selected model(s) through examination of the clustering of the samples
and/or the component loadings for the different clusters. As in regular principal component
analysis (PCA), standard rotational procedures (e.g., varimax; Kaiser, 1958) can be applied per
cluster to make the structure of the component loadings easier to interpret.
RESULTS
Data Characteristics
Following the recommendations just listed, we removed from the analysis data blocks contain-
ing subjects younger than 12 and older than 85 (see Table 1). As the data size of the remaining
12 data blocks (from now on called “samples”; 28,536 subjects � 33 items) exceeded the
memory limit of the analysis software, a random selection of 3,000 subjects from each of
the two largest samples was used (see Table 1).2 Consequently, the analyses were performed
on a total of 14,599 subjects nested in 12 samples. The data for the selected subjects were
standardized, resulting in each PCBS item having a mean of zero and a variance of 1 in every
sample.
Model Selection
The factor analyses and Multidimensional Scaling (MDS) performed to-date to investigate the
structure of the PCBS gave divergent results: three predominantly unipolar dimensions versus
two bipolar dimensions. As just described, the PCBS aimed to capture the four approaches
to religion proposed by Wulff (1991, 1997) in his two-dimensional model; however, factor
analysis followed by varimax rotation revealed three unipolar factors (Desimpelaere, Sulas,
Duriez, & Hutsebaut, 1999; Hutsebaut, 1996, 1997). The first factor referred to items showing
the literal acceptance of Christian beliefs, the second factor encompassed items designed
to measure literal disaffirmation, and the third factor referred to items reflecting both the
meaningfulness of Christian religion and its relativity. Nonetheless, subsequent psychometric
studies using MDS supported the interpretation of the scale items in terms of two bipolar
dimensions (i.e., Inclusion vs. Exclusion of Transcendence and Literal vs. Symbolic) and the
respective four quadrants (i.e., Literal Affirmation, Literal Disaffirmation, Symbolic Affirma-
tion, and Symbolic Disaffirmation; Duriez et al., 2000). MDS pointed out the presence of
2The reported results were replicated using four other random selections of 3,000 subjects.
Dow
nloa
ded
by [
UN
SW L
ibra
ry]
at 1
9:53
12
Janu
ary
2015
270 KRYSINSKA ET AL.
two different aspects capturing a symbolic approach to religion: Symbolic Affirmation and
Symbolic Disaffirmation.
In the current study a data-driven analysis was performed without employing any a priori
hypothesis about the (number of) underlying dimensions. Moreover, the most appropriate
number of clusters was unknown. Therefore, Clusterwise SCA-ECP analyses with the number
of clusters varying from one to five and the number of cluster-specific components varying
from one to six were performed.
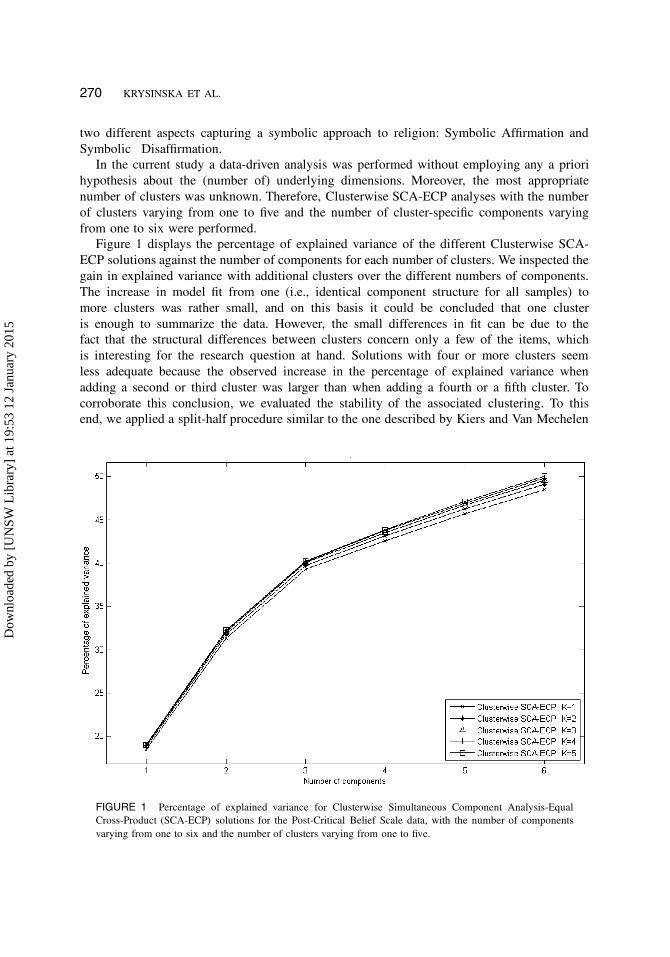
Figure 1 displays the percentage of explained variance of the different Clusterwise SCA-
ECP solutions against the number of components for each number of clusters. We inspected the
gain in explained variance with additional clusters over the different numbers of components.
The increase in model fit from one (i.e., identical component structure for all samples) to
more clusters was rather small, and on this basis it could be concluded that one cluster
is enough to summarize the data. However, the small differences in fit can be due to the
fact that the structural differences between clusters concern only a few of the items, which
is interesting for the research question at hand. Solutions with four or more clusters seem
less adequate because the observed increase in the percentage of explained variance when
adding a second or third cluster was larger than when adding a fourth or a fifth cluster. To
corroborate this conclusion, we evaluated the stability of the associated clustering. To this
end, we applied a split-half procedure similar to the one described by Kiers and Van Mechelen
FIGURE 1 Percentage of explained variance for Clusterwise Simultaneous Component Analysis-Equal
Cross-Product (SCA-ECP) solutions for the Post-Critical Belief Scale data, with the number of components
varying from one to six and the number of clusters varying from one to five.
Dow
nloa
ded
by [
UN
SW L
ibra
ry]
at 1
9:53
12
Janu
ary
2015
MEASURING RELIGIOUS ATTITUDES 271
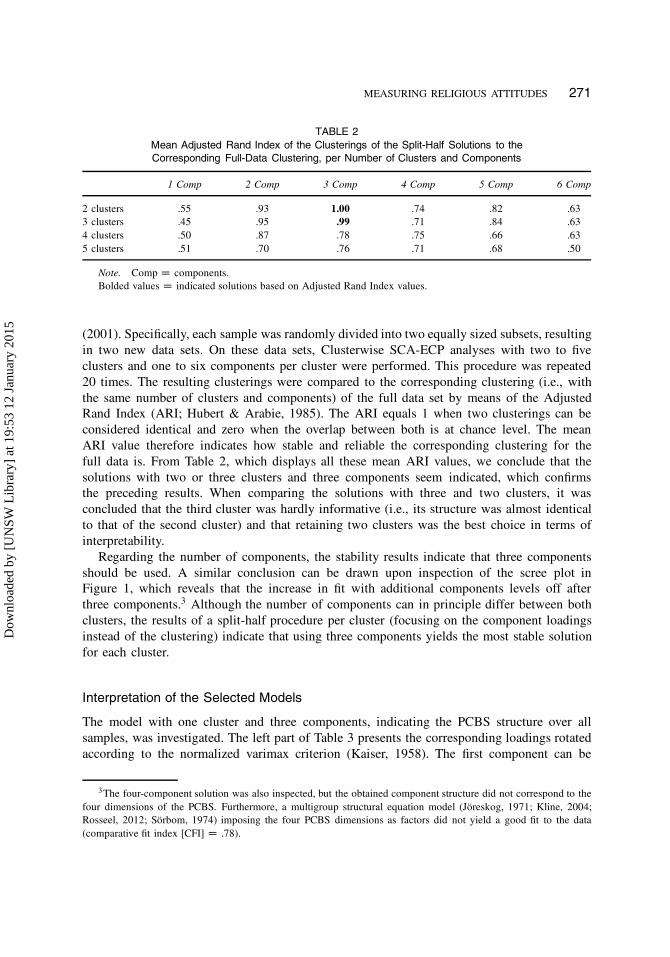
TABLE 2
Mean Adjusted Rand Index of the Clusterings of the Split-Half Solutions to the
Corresponding Full-Data Clustering, per Number of Clusters and Components
1 Comp 2 Comp 3 Comp 4 Comp 5 Comp 6 Comp
2 clusters .55 .93 1.00 .74 .82 .63
3 clusters .45 .95 .99 .71 .84 .63
4 clusters .50 .87 .78 .75 .66 .63
5 clusters .51 .70 .76 .71 .68 .50
Note. Comp D components.
Bolded values D indicated solutions based on Adjusted Rand Index values.
(2001). Specifically, each sample was randomly divided into two equally sized subsets, resulting
in two new data sets. On these data sets, Clusterwise SCA-ECP analyses with two to five
clusters and one to six components per cluster were performed. This procedure was repeated
20 times. The resulting clusterings were compared to the corresponding clustering (i.e., with
the same number of clusters and components) of the full data set by means of the Adjusted
Rand Index (ARI; Hubert & Arabie, 1985). The ARI equals 1 when two clusterings can be
considered identical and zero when the overlap between both is at chance level. The mean
ARI value therefore indicates how stable and reliable the corresponding clustering for the
full data is. From Table 2, which displays all these mean ARI values, we conclude that the
solutions with two or three clusters and three components seem indicated, which confirms
the preceding results. When comparing the solutions with three and two clusters, it was
concluded that the third cluster was hardly informative (i.e., its structure was almost identical
to that of the second cluster) and that retaining two clusters was the best choice in terms of
interpretability.
Regarding the number of components, the stability results indicate that three components
should be used. A similar conclusion can be drawn upon inspection of the scree plot in
Figure 1, which reveals that the increase in fit with additional components levels off after
three components.3 Although the number of components can in principle differ between both
clusters, the results of a split-half procedure per cluster (focusing on the component loadings
instead of the clustering) indicate that using three components yields the most stable solution
for each cluster.
Interpretation of the Selected Models
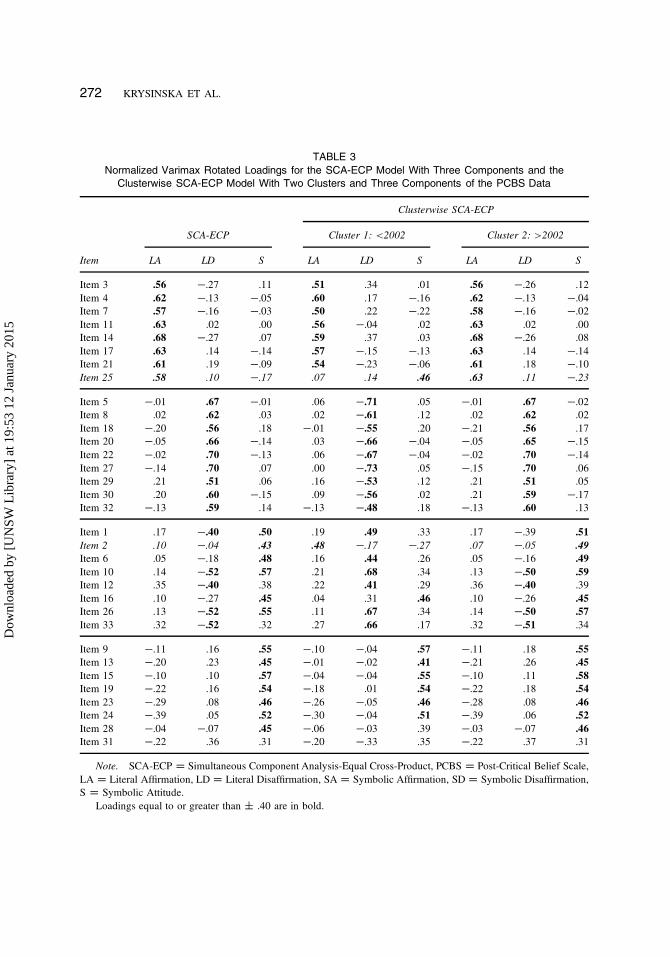
The model with one cluster and three components, indicating the PCBS structure over all
samples, was investigated. The left part of Table 3 presents the corresponding loadings rotated
according to the normalized varimax criterion (Kaiser, 1958). The first component can be
3The four-component solution was also inspected, but the obtained component structure did not correspond to the
four dimensions of the PCBS. Furthermore, a multigroup structural equation model (Jöreskog, 1971; Kline, 2004;
Rosseel, 2012; Sörbom, 1974) imposing the four PCBS dimensions as factors did not yield a good fit to the data
(comparative fit index [CFI] D .78).
Dow
nloa
ded
by [
UN
SW L
ibra
ry]
at 1
9:53
12
Janu
ary
2015
272 KRYSINSKA ET AL.
TABLE 3
Normalized Varimax Rotated Loadings for the SCA-ECP Model With Three Components and the
Clusterwise SCA-ECP Model With Two Clusters and Three Components of the PCBS Data
Clusterwise SCA-ECP
SCA-ECP Cluster 1: <2002 Cluster 2: >2002
Item LA LD S LA LD S LA LD S
Item 3 .56 �.27 .11 .51 .34 .01 .56 �.26 .12
Item 4 .62 �.13 �.05 .60 .17 �.16 .62 �.13 �.04
Item 7 .57 �.16 �.03 .50 .22 �.22 .58 �.16 �.02
Item 11 .63 .02 .00 .56 �.04 .02 .63 .02 .00
Item 14 .68 �.27 .07 .59 .37 .03 .68 �.26 .08
Item 17 .63 .14 �.14 .57 �.15 �.13 .63 .14 �.14
Item 21 .61 .19 �.09 .54 �.23 �.06 .61 .18 �.10
Item 25 .58 .10 �.17 .07 .14 .46 .63 .11 �.23
Item 5 �.01 .67 �.01 .06 �.71 .05 �.01 .67 �.02
Item 8 .02 .62 .03 .02 �.61 .12 .02 .62 .02
Item 18 �.20 .56 .18 �.01 �.55 .20 �.21 .56 .17
Item 20 �.05 .66 �.14 .03 �.66 �.04 �.05 .65 �.15
Item 22 �.02 .70 �.13 .06 �.67 �.04 �.02 .70 �.14
Item 27 �.14 .70 .07 .00 �.73 .05 �.15 .70 .06
Item 29 .21 .51 .06 .16 �.53 .12 .21 .51 .05
Item 30 .20 .60 �.15 .09 �.56 .02 .21 .59 �.17
Item 32 �.13 .59 .14 �.13 �.48 .18 �.13 .60 .13
Item 1 .17 �.40 .50 .19 .49 .33 .17 �.39 .51
Item 2 .10 �.04 .43 .48 �.17 �.27 .07 �.05 .49
Item 6 .05 �.18 .48 .16 .44 .26 .05 �.16 .49
Item 10 .14 �.52 .57 .21 .68 .34 .13 �.50 .59
Item 12 .35 �.40 .38 .22 .41 .29 .36 �.40 .39
Item 16 .10 �.27 .45 .04 .31 .46 .10 �.26 .45
Item 26 .13 �.52 .55 .11 .67 .34 .14 �.50 .57
Item 33 .32 �.52 .32 .27 .66 .17 .32 �.51 .34
Item 9 �.11 .16 .55 �.10 �.04 .57 �.11 .18 .55
Item 13 �.20 .23 .45 �.01 �.02 .41 �.21 .26 .45
Item 15 �.10 .10 .57 �.04 �.04 .55 �.10 .11 .58
Item 19 �.22 .16 .54 �.18 .01 .54 �.22 .18 .54
Item 23 �.29 .08 .46 �.26 �.05 .46 �.28 .08 .46
Item 24 �.39 .05 .52 �.30 �.04 .51 �.39 .06 .52
Item 28 �.04 �.07 .45 �.06 �.03 .39 �.03 �.07 .46
Item 31 �.22 .36 .31 �.20 �.33 .35 �.22 .37 .31
Note. SCA-ECP D Simultaneous Component Analysis-Equal Cross-Product, PCBS D Post-Critical Belief Scale,
LA D Literal Affirmation, LD D Literal Disaffirmation, SA D Symbolic Affirmation, SD D Symbolic Disaffirmation,
S D Symbolic Attitude.
Loadings equal to or greater than ˙ .40 are in bold.
Dow
nloa
ded
by [
UN
SW L
ibra
ry]
at 1
9:53
12
Janu
ary
2015
MEASURING RELIGIOUS ATTITUDES 273
labeled “Literal Affirmation” with all items measuring this attitude loading high on this compo-
nent. The second component can be labeled “Literal Disaffirmation” due to the strong positive
loadings of the Literal Disaffirmation items. In addition, most of the Symbolic Affirmation
items have a strong negative loading on this component, indicating a negative relation between
Literal Disaffirmation and Symbolic Affirmation. The third component is labeled “Symbolic,”
as most of the items related to Symbolic Affirmation and Symbolic Disaffirmation have high
positive loadings on this component. The latter indicates a positive relation between Symbolic
Affirmation and Symbolic Disaffirmation. Specifically, to some extent, a high score on Symbolic
Affirmation items seems to co-occur with a high score on Symbolic Disaffirmation items and
vice versa.
To explore possible differences between samples, the selected Clusterwise SCA-ECP model
was examined.4 The clustering of the samples (presented in Table 1) was inspected to see
which samples are brought together in the clusters. Cluster 1 (labeled “<2002”) contains the
samples collected before 2002. Cluster 2 (labeled “>2002”) consists of all samples collected
after 2002 (i.e., 2002–2005 and 2006–2010). Based on the clustering, it can be concluded that
the structural differences in the PCBS are mostly determined by the year of administration of
the scale and not by the age of the subjects.
The normalized varimax rotated loadings for the two clusters of the selected Clusterwise
SCA-ECP model can be found in Table 3. Comparing these loadings across clusters, the
general loading pattern is very similar and strongly resembles the structure found when using
only one cluster. Thus, the three components can again be interpreted as “Literal Affirmation,”
“Literal Disaffirmation,” and “Symbolic Attitude.” As stated previously, the difference between
the clusters pertains to a few items only. Specifically, Items 2 and 25 (Table 3, in italics)
both have a high loading on Literal Affirmation in one cluster and on Symbolic Attitude in
the other. Indeed, when these two items are omitted, the Tucker congruence coefficients (see
Tucker, 1951) between the corresponding cluster-specific components are all higher than .95,
indicating that they can be considered identical (Lorenzo-Seva & ten Berge, 2006). Note that
when Items 2 and 25 are included, the congruence coefficients amount to .91, .98, and .84,
respectively.
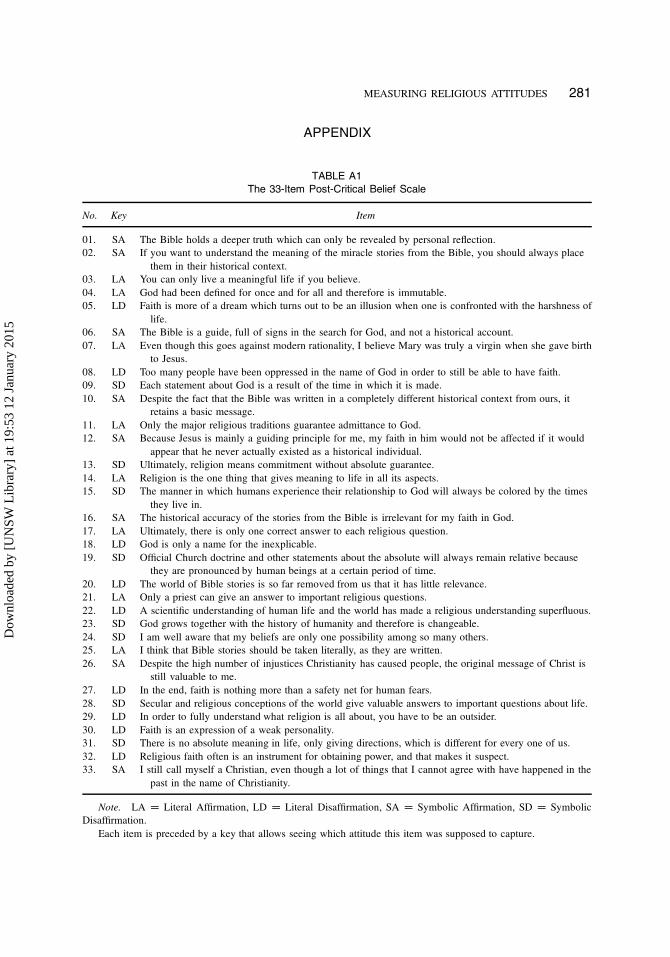
In the appendix, we read that Items 2 and 25 are intended to measure Symbolic and Literal
Affirmation, respectively, and that they both pertain to the interpretation of Bible stories.
In Table 3 we see that Item 2 has a high loading on the Literal Affirmation component in
Cluster 1 and a high loading on the Symbolic Attitude component in Cluster 2. Thus, for the
test administrations before 2002, placing Bible stories in their historical context is positively
correlated with most of the Literal Affirmation items (but not with Item 25), whereas after 2002
this item is more correlated with the other Symbolic Affirmation as well as with the Symbolic
Disaffirmation items. Therefore, it seems that, over time, a shift occurred in what this item is
4We applied multigroup structural equation modeling (Jöreskog, 1971; Kline, 2004; Rosseel, 2012; Sörbom, 1974)
to test for invariance of the loading structure over the samples (i.e., weak invariance; Meredith, 1993) when imposing
an orthogonal three-factor structure that is based on the one-cluster (SCA-ECP) structure previously described (and
printed in Table 3), that is, with a factor consisting of all Literal Affirmation items, one consisting of all Literal
Disaffirmation items and one consisting of all Symbolic Affirmation and Disaffirmation items. This test could not
confirm invariance of the loading structure, that is, ��2 D 2530.874 (�df D 363, �p < .001) and �CFI D 0.015
(Chen, 2007; Cheung & Rensvold, 2002), which supports our choice to inspect the Clusterwise SCA-ECP model with
two clusters.
Dow
nloa
ded
by [
UN
SW L
ibra
ry]
at 1
9:53
12
Janu
ary
2015
274 KRYSINSKA ET AL.
measuring. The opposite is true for Item 25, that is, it has a high loading on the Symbolic
Attitude component in Cluster 1 and has shifted to the Literal Affirmation component in
Cluster 2. This implies that, before 2002, people who agreed that Bible stories should be taken
literally, also score high on Symbolic Affirmation as well as Symbolic Disaffirmation items
(thus reflecting a general symbolic attitude). After 2002, mainly those who believe literally
(i.e., score high on Literal Affirmation items) also interpret the Bible stories literally.
DISCUSSION
The aim of our study was to analyze the psychometric structure of the PCBS. In our earlier
research we have observed that some of the participants in Flanders (and more recently also in
Australia), especially younger people, had problems with the scale. They could not understand
or accept some of the scale items, especially the items relating to specific Catholic religious
teachings, such as Biblical stories. Consequently, a question has arisen whether over the last
decade the meaning of the PCBS items has changed, and whether there would be differences
between age groups in relation to the ability of the PCBS to measure the four religious attitudes
proposed by Wulff and studied by Hutsebaut and his colleagues.
In our study we have used an innovative sample-based data-driven method of analysis, that
is, Clusterwise SCA-ECP. Based on the explained variance of the different Clusterwise SCA-
ECP solutions, we concluded that a one-cluster model with identical component structure for
all 12 samples is sufficient to summarize the data. However, because small differences in model
fit can occur because the structural differences between clusters concern only a few items, the
one-cluster solution was compared to the two-cluster solution. In this way we obtained two
important results: We have found three attitudes (components) measured by the PCBS (instead
of four attitudes as suggested by the theoretical framework of Wulff’s model), and the analysis
showed that a shift occurred regarding the meaning of two PCBS items over time. These two
points are elaborated next.
First, the one-cluster model (including all 12 data blocks or samples) yielded three com-
ponents: Literal Affirmation, Literal Disaffirmation, and Symbolic Attitude. In other words,
the distinction between literal belief and literal disbelief was found irrespective of the year of
administration of the scale and of the age of the subjects. However, the Symbolic Affirmation
and Symbolic Disaffirmation items do not measure the two respective attitudes described by
Wulff and Hutsebaut; instead they measure an open symbolic attitude in relation to religious
(dis-)belief, which we have called a “Symbolic Attitude.” This generalized symbolic attitude
might be related to the changes in the traditionally Christian religious landscape of Western
Europe, including Belgium (Flanders; Boeve, 2006, 2008). In addition to progressing secular-
ization and religious pluralization, new sociological phenomena related to individuation and
detraditionalization of religious beliefs, such as “believing without belonging” (Davie, 1990,
2005) or creating one’s own “religion à la carte” (Abts et al., 2011) have been observed. This
symbolic attitude might capture the belief of individuals who follow (or do not follow) a certain
religious tradition and are open and accepting of other religious or philosophical position, or
alternatively, have become indifferent to them.
Of interest, the three PCBS attitudes (or components) present in both psychometric models
in our study have been reported in the original studies by Hutsebaut (1996, 1997) and his
Dow
nloa
ded
by [
UN
SW L
ibra
ry]
at 1
9:53
12
Janu
ary
2015
MEASURING RELIGIOUS ATTITUDES 275
colleagues (e.g., Desimpelaere et al., 1999). As previously described, the scale aimed to capture
the four approaches to religion proposed by Wulff (1991, 1997); however, factor analysis
followed by varimax rotation revealed only three unipolar factors (Desimpelaere et al., 1999;
Hutsebaut, 1996, 1997). These factors referred to (a) the literal acceptance of Christian beliefs,
(b) an attitude of literal disaffirmation, and (c) an attitude reflecting both the meaningfulness and
the relativity of the Christian religion. Only in later studies, using another method of analysis
(i.e., Multidimensional Scaling), the two bipolar dimensions of Inclusion versus Exclusion of
Transcendence and Literal versus Symbolic, as well as the respective four quadrants (i.e., Literal
Affirmation/Disaffirmation and Symbolic Affirmation/Disaffirmation), were reported (Duriez
et al., 2000). The phenomenon of acquiescence, that is, an individual’s tendency to endorse
or reject the scale items irrespective of their content, can explain the discrepancy between the
results obtained with factor analysis and MDS (Duriez et al., 2000; Fontaine et al., 2003).
Apparently, acquiescence leads to an increase of positive and a suppression of negative inter-
item correlations resulting in masking bipolarity in factor analysis (whereas MDS is only
marginally affected by this phenomenon; Green, Goldman, & Salovey, 1993). In line with
this explanation, further psychometric analyses were conducted using orthogonal Procrustes
rotation, which led to a convergence of the results obtained with MDS and factor analysis
(Duriez et al., 2000).
In addition, studies conducted outside Flanders, using adaptations of the PCBS in German
(Duriez, Appel, & Hutsebaut, 2003), Hungarian (Kezdy, Martos, Boland, & Horvath-Szabo,
2011), and Polish (Zarzycka & Rydz, 2011), confirmed the two-dimensional structure of the
scale and reported the four attitudes originally proposed by Wulff (1991, 1997). However, these
studies followed the methodology proposed by Duriez et al. (2000) and Fontaine et al. (2003)
previously described. Consequently, results of these studies are not comparable with the results
of our analysis using a data-driven Clusterwise SCA-ECP. A replication of our analysis using
data collected in other countries, for example, a still traditionally Catholic Poland, could show
whether the generalized Symbolic Attitude can be found in a different socio-cultural context,
or alternatively the distinction between Symbolic Affirmation and Disaffirmation could still be
detected.
In summary, our study using a data-driven method, without employing any assumptions
regarding the number of underlying dimensions, has shown three components (attitudes) com-
parable to the three unipolar factors reported in the earlier studies. It is possible that the
symbolic attitude found in our study, and in the original studies of Hutsebaut, is the “third
attitude” (besides Literal Affirmation and Literal Disaffirmation) reflecting an open and tolerant,
or alternatively indifferent, approach to religious beliefs. As mentioned earlier, studies in the
sociology of religion indicate the emergence of such attitude in the secularized, individualized
and detraditionalized Western European societies (Boeve, 2006, 2008; Voas, 2009). On the other
hand, it is possible that the original distinction between acceptance and rejection of religion
(or belief and disbelief) on the symbolic level proposed by Wulff (1991, 1997) remains a fact,
but it is not possible to measure these attitudes using the PCBS. There have been complaints
regarding the comprehensibility of some of the scale items, and this might affect the quality
of the collected data and interpretation of results.
Second, the two-cluster model provided more insight into subtle differences between the
analyzed samples. The structure in both clusters was comparable to the structure obtained
in the one-cluster solution, and the same three components (i.e., Literal Affirmation, Literal
Dow
nloa
ded
by [
UN
SW L
ibra
ry]
at 1
9:53
12
Janu
ary
2015
276 KRYSINSKA ET AL.
Disaffirmation, and Symbolic Attitude) emerged in the earlier samples (<2002) and in the
more recent samples (>2002). Again, no differences were found between the age groups. Of
interest, the subtle differences between samples collected before and after 2002 were related
only to a few PCBS items, in particular Items 2 and 25.
In the two-cluster model we found subtle differences between the samples collected before
and after 2002. In particular, there were differences relating to Item 2 (“If you want to
understand the meaning of the miracle stories from the Bible, you should always place them
in their historical context”) and Item 25 (“I think that Bible stories should be taken literally,
as they are written”). These two items pertain to the interpretation of Bible stories and are
intended to measure Symbolic and Literal Affirmation, respectively. However, over time, a shift
occurred in what these items are measuring. Regarding Item 2, before 2002, people scoring
high on the Literal Affirmation items also believed that Bible stories should be placed in their
historical context which might indicate that even people who believe literally interpret these
stories in a nuanced light. After 2002 this item seems to reflect a general symbolic attitude,
which may be an attribute of both believers and nonbelievers. The opposite is true for Item 25,
that is, before 2002, people who agreed that Bible stories should be taken literally also scored
high on Symbolic Affirmation and Disaffirmation items, thus reflecting a general Symbolic
Attitude. After 2002, mainly those who believe literally also interpret the Bible stories literally.
An important thing to note is that how one interprets the Bible stories (i.e., literally, or in
historical context) may be separated from whether one believes in them or not. Consequently,
someone who takes the stories literally does not necessarily believe in them, and vice versa.
Given the cross-sectional character of data used in the current study it is not possible to draw
conclusions regarding the changes in religious attitudes and/or meaning of the scale items over
time. Future longitudinal studies could provide information and insights regarding the stability
or change in the interpretation of PCBS statements.
STRENGTHS AND LIMITATIONS
The analyses were performed on a large sample, including individuals in different age groups,
collected over 10 years. This allowed to us determine whether the structural differences in the
PCBS could be due to the year of administration of the scale and/or to the age of the subjects.
In this study a data-driven analysis was performed without employing any a priori hypothesis
about the number of or content of the underlying dimensions or the most appropriate number
of clusters. Even though Clusterwise SCA-ECP is a new and, hence, less known method, it
certainly has its strengths. First, the clustering is an important added value when comparing it
to related factor analytic approaches like, for instance, the widely used multigroup structural
equation modeling (Jöreskog, 1971; Kline, 2004; Sörbom, 1974). More specifically, Clusterwise
SCA-ECP makes it easy to gain insight into the between-sample structural differences and
similarities because it automatically looks for the best clustering of the samples according to
the underlying component structure. Thus, whenever an invariant factor structure cannot be
confirmed in multigroup structural equation modeling (as was the case in the current article;
see footnote 6), and it is infeasible or tedious to fit and compare separate factor or structural
equation models for different samples, Clusterwise SCA-ECP provides an efficient solution
to explore which samples differ in their underlying structure and how. Second, where other
Dow
nloa
ded
by [
UN
SW L
ibra
ry]
at 1
9:53
12
Janu
ary
2015

MEASURING RELIGIOUS ATTITUDES 277
component methods for modeling the underlying structure of multiblock data are either too
generic to be insightful (fitting a separate principal component model to each sample) or too
restrictive to capture structural differences (fitting one common SCA model for all samples),
Clusterwise SCA-ECP is a very flexible method. On one hand, it encompasses the existing
methods as special cases (i.e., taking as many clusters as there are samples boils down to
separate PCAs and retaining only one cluster corresponds to SCA) and, on the other hand, it
allows each intermediate solution (i.e., the number of clusters can take any value between one
and the number of samples).
In spite of these strengths, the present study has several limitations. Only cross-sectional
data collected using the PCBS have been used. We have no information regarding the so-
ciodemographic profile of the study participants (except for their age), including their religious
denomination, church attendance, or self-definition as a religious or a nonreligious person,
which could help us to gain deeper insights into the results of our study. In addition, the
age groups and the cut-off points for the time of data collection have been chosen based on
the three periods of data collection and on the sociological and historical evolutions in the
religious culture in Flanders. Nonetheless, they have been chosen arbitrarily by us instead
of being hypothesis driven. Also, the data of each sample was standardized, thus removing
the sample-specific mean levels of the items. This implies some information loss, as these
differences may be substantively interesting and may be related to the differences in structure.
The removal of the mean differences may explain why no differences were found between the
different age groups. It would certainly be worthwhile to simultaneously evaluate mean level
and structural differences between the samples in future research. Finally, as a weakness of
Clusterwise SCA-ECP, or any component method, some might conjecture that the components
are based on the total variance of the observed variables, without distinguishing between the
common and unique variance of each variable (as is done in factor analysis; Lawley & Maxwell,
1962). Consequently, the resulting model might be affected by error variance. However, based
on prior studies, it can be argued that error fitting mostly boils down to a slight overestimation
of the loadings, without it affecting the interpretation of the components (see, e.g., Velicer,
Peacock, & Jackson, 1982).
CONCLUSIONS
Using an innovative sample-based data-driven method we have analyzed the psychometric
structure of the PCBS to answer our question regarding possible changes in the meaning of
the scale items in different age groups over time. We found the distinction between Literal
Affirmation and Disaffirmation irrespectively of the year of administration of the scale and
of the age of the subjects. However, the PCBS items related to Symbolic Affirmation and
Symbolic Disaffirmation do not measure the attitudes proposed in the original model of Wulff
(1991, 1997); instead they tap into an open symbolic attitude in relation to religious (dis-)belief.
Of interest, we also found subtle differences between the earlier and the more recent samples
in regards to two PCBS items that relate to the interpretation of Bible stories.
Our study has raised a number of issues that require further investigation. The major question
is related to the finding that a number of PCBS items are measuring a generalized Symbolic
Attitude instead of two attitudes: Symbolic Affirmation and Disaffirmation. Is our finding an
Dow
nloa
ded
by [
UN
SW L
ibra
ry]
at 1
9:53
12
Janu
ary
2015
278 KRYSINSKA ET AL.
artefact related to problems with comprehensibility of (some of) the scale items, as reported by
research participants in our earlier studies, or does it reflect the existence of a postcritical, open,
and tolerant (or alternatively indifferent) approach to religion in a secularized country? Further
studies, especially cross-cultural comparisons, should explore this point further. Moreover, the
cross-sectional nature of our data limits the scope of our interpretation of the observed shift
in the meaning of some of the PCBS items related to the interpretation of Biblical stories.
Longitudinal studies looking at the stability of meaning of the PCBS items could help resolve
this issue.
Our final conclusion relates to the future of the PCBS. Despite the success of the scale—
its broad research application and numerous adaptations to other languages and cultures,
the development of a scale measuring religious belief and disbelief, or in other words, a
variety of religious and secular worldviews, in a pluralistic Western European context may
be recommended. Undoubtedly, the model of Wulff (1991, 1997) remains a comprehensive
and inspiring framework for classification of theoretical approaches and individual’s attitudes
toward religion. Nonetheless, in our opinion, the perspective of personal (religious or secular)
orienting systems, which has been proposed as a new unifying framework for the study of
psychology of religion and spirituality (Paloutzian & Park, 2013), could serve as theoretical
model guiding the development of a new scale. This comprehensive framework acknowledges
a variety of cognitive, motivational, and affective components comprising a personal meaning
system (Dezutter & Corveleyn, 2013), and reflects the multidimensionality of religious attitudes
(Saroglou, 2011).
REFERENCES
Abts, K., Dobbelaere, K., & Voyé, L. (2011). Nieuwe tijden, nieuwe mensen [New times, new people]. Tielt, Belgium:
Lannoo Campus.
Boeve, L. (2006). God onderbreekt de geschiedenis. Theologie in tijden van ommekeer [God interrupts history:
Theology in a time of upheaval]. Kapellen, Belgium: Pelckmans.
Boeve, L. (2008). Onderbroken traditie. Heeft het christelijk verhaal nog toekomst? [Interrupting tradition. Does the
Christian faith still have a future?]. Kapellen, Belgium: Pelckmans.
Bouwens, J. (2012). Identity in diversity: Assessing and enhancing Catholic school identity (Unpublished master’s
thesis). KU Leuven-Catholic University of Leuven, Leuven, Belgium.
Chen, F. F. (2007). Sensitivity of goodness of fit indexes to lack of measurement invariance. Structural Equation
Modeling, 14, 464–504.
Cheung, G. W., & Rensvold, R. B. (2002). Evaluating goodness-of-fit indexes for testing measurement invariance.
Structural Equation Modeling, 9, 233–255.
Davie, G. (1990). Believing without belonging: Is this the future of religion in Britain? Social Compass, 37, 455–469.
Davie, G. (2005). Believing without belonging: Just how secular is Europe? Retrieved from http://www.pewforum.org/
Politics-and-Elections/Believing-Without-Belonging-Just-How-Secular-Is-Europe.aspx
De Roover, K., Ceulemans, E., & Timmerman, M. E. (2012). How to perform multiblock component analysis in
practice. Behavior Research Methods, 44, 41–56.
De Roover, K., Ceulemans, E., Timmerman, M. E., Nezlek, J. B., & Onghena, P. (2013). Modeling differences in the
dimensionality of multiblock data by means of clusterwise simultaneous component analysis. Psychometrika, 78,
648–668.
De Roover, K., Ceulemans, E., Timmerman, M. E., Vansteelandt, K., Stouten, J., & Onghena, P. (2012). Cluster-
wise simultaneous component analysis for the analysis of structural differences in multivariate multiblock data.
Psychological Methods, 17, 100–119.
Dow
nloa
ded
by [
UN
SW L
ibra
ry]
at 1
9:53
12
Janu
ary
2015
MEASURING RELIGIOUS ATTITUDES 279
Desimpelaere, P., Sulas, F., Duriez, B., & Hutsebaut, D. (1999). Psycho-epistemological styles and religious beliefs.
The International Journal for the Psychology of Religion, 9, 125–137.
Dezutter, J., & Corveleyn, J. (2013). Meaning making: A crucial psychological process in the confrontation with a life
stressor. In H. Westerink (Ed.), Constructs of meaning and religious transformation (pp. 167–184). Vienna, Austria:
University Press.
Dezutter, J., & Hutsebaut, D. (2010). Cognitive and affective aspects of religion in relation to mental health. An
exploration in community and clinical samples. Leuven, Belgium: KU Leuven–University of Leuven.
Duriez, B., Appel, C., & Hutsebaut, D. (2003). The German Post-Critical Belief scale: Internal and external validity.
Zeitschrift für Socialpsychologie, 34, 219–226.
Duriez, B., Dezutter, J., Neyrinck, B., & Hutsebaut, D. (2007). An introduction to the Post-Critical Belief Scale:
Internal structure and external relationships. Psyke & Logos, 28, 767–793.
Duriez, B., Fontaine, J. R. J., & Hutsebaut, D. (2000). A further elaboration of the Post-Critical Belief scale: Evidence
for the existence of four different approaches to religion in Flanders-Belgium. Psychologica Belgica, 40, 153–181.
Duriez, B., Soenens, B., & Hutsebaut, D. (2005). Introducing the shortened Post-Critical Belief Scale. Personality and
Individual Differences, 38, 851–857.
Duriez, B., Soenens, B., Neyrinck, B., & Vansteenkiste, M. (2009). Is religiosity related to better parenting? Disen-
tangling religiosity from religious cognitive style. Journal of Family Issues, 30, 1287–1307.
European Values Study. (1999/2000). Release 2, May 2006 (ZA3811). Cologne, Germany: GESIS Data Archive.
European Values Study. (2010). European Values Study 2008, 4th Wave, Integrated Dataset. Cologne, Germany: GESIS
Data Archive.
Fontaine, J. R. J., Duriez, B., Luyten, P., & Hutsebaut, D. (2003). The internal structure of the Post-Critical Belief
scale. Personality and Individual Differences, 35, 501–518.
Green, D. P., Goldman, S. L., & Salovey, P. (1993). Measurement error masks bipolarity in affect ratings. Journal of
Personality and Social Psychology, 64, 1029–1041.
Henckens, R., Pollefeyt, D., Hutsebaut, D., Dillen, A., Maex, J., & De Boeck, E. (2011). Geloof in kinderen? [Religious
faith of children?]. Leuven, Belgium: Uitgeevrij Peeters.
Houtman, D., & Aupers, S. (2007). The spiritual turn and the decline of tradition: The spread of post-Christian
spirituality in 14 Western countries, 1981–2000. Journal for the Scientific Study of Religion, 46, 305–320.
Hubert, L., & Arabie, P. (1985). Comparing partitions. Journal of Classification, 2, 193–218.
Hutsebaut, D. (1996). Post-critical belief. A new approach to the religious attitude problem. Journal of Empirical
Theology, 9, 48–66.
Hutsebaut, D. (1997). Identity statuses, ego-integration, God representation and religious cognitive styles. Journal of
Empirical Theology, 10, 39–54.
Jöreskog, K. G. (1971). Simultaneous factor analysis in several populations. Psychometrika, 36, 409–426.
Kaiser, H. F. (1958). The varimax criterion for analytic rotation in factor analysis. Psychometrika, 23, 187–200.
Kezdy, A., Martos, T., Boland, V., & Horvath-Szabo, K. (2011). Religious doubts and mental health in adolescence
and young adulthood: The association with religious attitudes. Journal of Adolescence, 34, 39–47.
Kiers, H. A. L., & Van Mechelen, I. (2001). Three-way component analysis: Principles and illustrative application.
Psychological Methods, 6, 84–110.
Kline, R. B. (2004). Principles and practice of structural equation modeling (2nd ed.). New York, NY: Guilford.
Lawley, D. N., & Maxwell, A. E. (1962). Factor analysis as a statistical method. The Statistician, 12, 209–229.
Lorenzo-Seva, U., & ten Berge, J. M. F. (2006). Tucker’s congruence coefficient as a meaningful index of factor
similarity. Methodology, 2, 57–64.
Meredith, W. (1993). Measurement invariance, factor analysis and factorial invariance. Psychometrika, 58, 525–543.
Paloutzian, R. F., & Park, C. L. (2013). Recent progress and core issues in the science of the psychology of religion
and spirituality. In R. F. Paloutzian & C. L. Park (Eds.), Handbook of the psychology of religion and spirituality
(pp. 3–46). New York, NY: Guilford.
Pew Research Center. (2012). “Nones” on the rise: One-in-five adults have no religious affiliation. Washington, DC:
Pew Research Center.
Pollack, D. (2008). Religious change in Europe: Theoretical considerations and empirical findings. Social Compass,
55, 168–186.
Pollefeyt, D., & Bouwens, J. (2010). Framing the identity of Catholic schools: Empirical methodology for quantitative
research on the Catholic identity of an education institute. International Studies in Catholic Education, 2, 193–211.
Dow
nloa
ded
by [
UN
SW L
ibra
ry]
at 1
9:53
12
Janu
ary
2015
280 KRYSINSKA ET AL.
Ricoeur, P. (1978). The critique of religion. In C. Reagan & D. Stewart (Eds.), The philosophy of Paul Ricoeur: An
anthology of his work (pp. 213–222). Boston, MA: Beacon Press.
Rosseel, Y. (2012). Lavaan: An R package for structural equation modeling. Journal of Statistical Software, 48, 1–36.
Saroglou, V. (2011). Believing, bonding, behaving, and belonging: The Big Four religious dimensions and cultural
variation. Journal of Cross-Cultural Psychology, 42, 1320–1340.
Sörbom, D. (1974). A general method for studying differences in factor means and factor structure between groups.
British Journal of Mathematical and Statistical Psychology, 27, 229–239.
Timmerman, M. E., & Kiers, H. A. L. (2003). Four simultaneous component models of multivariate time series from
more than one subject to model intraindividual and interindividual differences. Psychometrika, 86, 105–122.
Tucker, L. R. (1951). A method for synthesis of factor analysis studies (Personnel Research Section Report No. 984).
Washington, DC: Department of the Army.
Velicer, W. F., Peacock, A. C., & Jackson, D. N. (1982). A comparison of component and factor patterns: A Monte
Carlo approach. Multivariate Behavioral Research, 17, 371–388.
Voas, D. (2009). The rise and fall of fuzzy fidelity in Europe. European Sociological Review, 25, 155–168.
Wulff, D. M. (1991). Psychology of religion: Classic and contemporary views. New York, NY: Wiley.
Wulff, D. M. (1997). Psychology of religion: Classic and contemporary views (2nd ed.). New York, NY: Wiley.
Zarzycka, B., & Rydz, E. (2011). The selective relationship between religious dimensions and social desirability among
Polish students. Mental Health, Religion and Culture, 14, 411–422.
Dow
nloa
ded
by [
UN
SW L
ibra
ry]
at 1
9:53
12
Janu
ary
2015
MEASURING RELIGIOUS ATTITUDES 281
APPENDIX
TABLE A1
The 33-Item Post-Critical Belief Scale
No. Key Item
01. SA The Bible holds a deeper truth which can only be revealed by personal reflection.
02. SA If you want to understand the meaning of the miracle stories from the Bible, you should always place
them in their historical context.
03. LA You can only live a meaningful life if you believe.
04. LA God had been defined for once and for all and therefore is immutable.
05. LD Faith is more of a dream which turns out to be an illusion when one is confronted with the harshness of
life.
06. SA The Bible is a guide, full of signs in the search for God, and not a historical account.
07. LA Even though this goes against modern rationality, I believe Mary was truly a virgin when she gave birth
to Jesus.
08. LD Too many people have been oppressed in the name of God in order to still be able to have faith.
09. SD Each statement about God is a result of the time in which it is made.
10. SA Despite the fact that the Bible was written in a completely different historical context from ours, it
retains a basic message.
11. LA Only the major religious traditions guarantee admittance to God.
12. SA Because Jesus is mainly a guiding principle for me, my faith in him would not be affected if it would
appear that he never actually existed as a historical individual.
13. SD Ultimately, religion means commitment without absolute guarantee.
14. LA Religion is the one thing that gives meaning to life in all its aspects.
15. SD The manner in which humans experience their relationship to God will always be colored by the times
they live in.
16. SA The historical accuracy of the stories from the Bible is irrelevant for my faith in God.
17. LA Ultimately, there is only one correct answer to each religious question.
18. LD God is only a name for the inexplicable.
19. SD Official Church doctrine and other statements about the absolute will always remain relative because
they are pronounced by human beings at a certain period of time.
20. LD The world of Bible stories is so far removed from us that it has little relevance.
21. LA Only a priest can give an answer to important religious questions.
22. LD A scientific understanding of human life and the world has made a religious understanding superfluous.
23. SD God grows together with the history of humanity and therefore is changeable.
24. SD I am well aware that my beliefs are only one possibility among so many others.
25. LA I think that Bible stories should be taken literally, as they are written.
26. SA Despite the high number of injustices Christianity has caused people, the original message of Christ is
still valuable to me.
27. LD In the end, faith is nothing more than a safety net for human fears.
28. SD Secular and religious conceptions of the world give valuable answers to important questions about life.
29. LD In order to fully understand what religion is all about, you have to be an outsider.
30. LD Faith is an expression of a weak personality.
31. SD There is no absolute meaning in life, only giving directions, which is different for every one of us.
32. LD Religious faith often is an instrument for obtaining power, and that makes it suspect.
33. SA I still call myself a Christian, even though a lot of things that I cannot agree with have happened in the
past in the name of Christianity.
Note. LA D Literal Affirmation, LD D Literal Disaffirmation, SA D Symbolic Affirmation, SD D Symbolic
Disaffirmation.
Each item is preceded by a key that allows seeing which attitude this item was supposed to capture.
Dow
nloa
ded
by [
UN
SW L
ibra
ry]
at 1
9:53
12
Janu
ary
2015