
Measuring Media Use Across Platforms: Evolving Audience Information Systems
20
The International Journal on Media Management, 14:121–140, 2012 Copyright © Institute for Media and Communications Management ISSN: 1424-1277 print/1424-1250 online DOI: 10.1080/14241277.2011.648468 RESEARCH ARTICLES Measuring Media Use Across Platforms: Evolving Audience Information Systems HARSH TANEJA Northwestern University, USA UTSAV MAMORIA IMRB International, India Audience measurement worldwide is responding to the need to measure media consumption across platforms. One approach being employed by the industry is “single source” audience infor- mation systems that measure usage across media and purchase behavior from the same set of respondents. This study evaluates the readiness of such systems to meet the current challenges in measuring audiences by analyzing single source systems from 5 diverse media markets. The analysis reveals that these sys- tems capture dimensions of audience behavior other than expo- sure—an enhancement over traditional audience information systems. However, their usage in the marketplace suggests that sin- gle source data complement existing mono media systems than serve as alternate currencies. “Audience information systems” facilitate buying and selling of advertising in commercial media markets (Napoli, 2011). Market participants create such systems to measure media audiences and, thus, make them institutionally effective entities by assigning them economic value (Ettema & Whitney, 1994). Jointly created by measurement firms, advertisers, and media own- ers, these serve as “market information regimes” for trading advertising time (Anand & Peterson, 2000). Traditionally, such systems have measured usage of a specific medium. For instance, the Nielsen national peoplemeter panel Address correspondence to Harsh Taneja, Doctoral Candidate, Media, Technology, and Society Program, Northwestern University, 2240 Campus Dr., Rm. FSB 2-168, Evanston, IL 60208. E-mail: [email protected] 121
-
Upload
independent -
Category
Documents
-
view
1 -
download
0
Transcript of Measuring Media Use Across Platforms: Evolving Audience Information Systems
The International Journal on Media Management, 14:121–140, 2012Copyright © Institute for Media and Communications ManagementISSN: 1424-1277 print/1424-1250 onlineDOI: 10.1080/14241277.2011.648468
RESEARCH ARTICLES
Measuring Media Use Across Platforms:Evolving Audience Information Systems
HARSH TANEJANorthwestern University, USA
UTSAV MAMORIAIMRB International, India
Audience measurement worldwide is responding to the need tomeasure media consumption across platforms. One approachbeing employed by the industry is “single source” audience infor-mation systems that measure usage across media and purchasebehavior from the same set of respondents. This study evaluatesthe readiness of such systems to meet the current challenges inmeasuring audiences by analyzing single source systems from5 diverse media markets. The analysis reveals that these sys-tems capture dimensions of audience behavior other than expo-sure—an enhancement over traditional audience informationsystems. However, their usage in the marketplace suggests that sin-gle source data complement existing mono media systems thanserve as alternate currencies.
“Audience information systems” facilitate buying and selling of advertisingin commercial media markets (Napoli, 2011). Market participants create suchsystems to measure media audiences and, thus, make them institutionallyeffective entities by assigning them economic value (Ettema & Whitney,1994). Jointly created by measurement firms, advertisers, and media own-ers, these serve as “market information regimes” for trading advertising time(Anand & Peterson, 2000). Traditionally, such systems have measured usageof a specific medium. For instance, the Nielsen national peoplemeter panel
Address correspondence to Harsh Taneja, Doctoral Candidate, Media, Technology, andSociety Program, Northwestern University, 2240 Campus Dr., Rm. FSB 2-168, Evanston, IL60208. E-mail: [email protected]
121

122 H. Taneja and U. Mamoria
measures only television viewing, and Nielsen Online measures Internet use.However, in the contemporary media environment, content is available onmultiple platforms and audiences have greater control in scheduling theirmedia use. These developments warrant the creation of audience informationsystems that measure media use across platforms.
Media industries worldwide have responded to this need by creating“single source” audience information systems that capture consumption fromthe same respondent across multiple media. In addition to capturing respon-dents’ exposure to media, these often obtain other information such asattitudes and product purchase behavior. Many single source systems havebeen in existence in various media markets for the last 3 decades. Yet, lim-ited scholarship on audience measurement has focused on these “alternateaudience information systems,” the dimensions of audience behavior theycapture, and their usage by market participants. Drawing on case studies ofsuch systems from five media markets, this study aims to address this gap.
First, we identify key challenges confronting present-day audience infor-mation systems by reviewing extant literature from both academic and tradesources. After explaining the methods, we briefly describe each of the fiveaudience information systems selected. We then analyze these systems for thedimensions of audience behaviors they capture, and explore the purposesfor which market participants utilize them. We conclude by discussing howeffective are these systems in meeting the challenges confronting audienceinformation systems in the contemporary media environment.
CHALLENGES FOR AUDIENCE INFORMATION SYSTEMS
Changing Audience Behavior
Patterns of media use have changed significantly in recent times. Contentoptions within each media have grown, even as newer media types such asInternet and mobile phones have made inroads into daily lives of consumers(Napoli, 2011). Such changes can be witnessed across developed, as well asemerging media markets. For instance, the number of cable television sta-tions in the United States, today is 565 (National Cable & TelecommunicationsAssociation, 2011). In comparison, India, an emerging media market, also has540 television channels (Forrester, 2009). According to one estimate, in May2010 there were 203 million operational Web sites (“May 2010 Web,” 2010).
This immense media fragmentation (Napoli, 2003; Picard, 2000; Webster,2005) has fragmented audience attention across multiple content options(Webster, 2005; Webster & Ksiazek, 2012). Consequently, the prominentshare of audience attention occupied by TV in the past 20 to 30 years isnow shrinking due to increased time spent on other media (Licastro, 2007).
The rapid adoption of new media platforms has facilitated convergence,making possible multiple ways in which audiences can access the samecontent (Jenkins, 2004). For instance, television networks make available
Evolving Audience Information Systems 123
their content on online video platforms, such as Hulu. In fact, most traditionalmedia content is available anytime (online), as well as anywhere, as mobiledevices enable all manner of content to be also consumed outside one’shome (Licastro, 2009). In sum, not only is attention fragmented but alsoaudiences are less reliant on schedules and have much greater autonomy tostructure their own usage patterns (Napoli, 2011).
Expectations From Audience Information Systems
Media convergence “alters the relationship between existing technolo-gies, industries, markets, genres and audiences” (Jenkins, 2004, p. 34).These changes also cause market participants to revise their conceptionof institutionally effective audiences, leading to altered audience informa-tion systems. Historically, as well, changes in the media environment haveforced media institutions to modify the ways in which audience informationis constructed (e.g., Andrews & Napoli, 2006; Barnes & Thomson, 1994).
New media technologies provide advertisers opportunities to reach con-sumers using a variety of media platforms and content options. They wantto use them in the most effective and efficient manner and realize that tra-ditional mono-media planning is not the most effective solution (Licastro,2009). To execute multimedia campaigns, media planners need audienceinformation systems with capabilities to compare performance of advertis-ing across platforms, plan and evaluate mixed media schedules (Rothman,1988). However, in moving from mono media systems to those that capturemultimedia use, many challenges exist.
First, for multimedia planning to be successful, metrics of audienceexposure need to be comparable across media. Traditionally, individualmedia categories have conducted their own research (White, 2007). Eachaudience information system suits the particular medium in question, result-ing in development of currencies usable for that medium alone (Levine,Morgan, Hepenstall, North, & Smith, 2001). For instance, the readership andfrequency of newspaper reading cannot be directly compared with televisionrating points. Response-based measures used in interactive platforms, suchas click through rates and cost per action, are even harder to equate withtraditional measures (Bermejo, 2009).
Second, traditional audience information systems provide currencies thatare derived entirely from exposure. Television and radio industries use audi-ence information based on ratings data (Webster, Phalen, & Lichty, 2006)that essentially capture exposure, which provides the most fundamental,yet limited, window into audience behavior. Many alternative dimensionsof audience activity can be captured (Napoli, 2011, elaborates on these), twoof which, engagement and product purchases, we elaborate as follows.
In addition to knowing audience size and time spent with content,advertisers and content providers are interested in capturing their affin-ity with content, often termed as engagement (Calder & Malthouse, 2008).
124 H. Taneja and U. Mamoria
Increased audience fragmentation has made engagement even more impor-tant as outlets with small audiences see their measured audiences suppressedfurther by existing systems. For instance, Nielsen does not account for 25%of America’s total TV viewing because the sample size of its peopleme-ter panel is too small to measure smaller cable stations (Napoli, 2011).Therefore, outlets that target niche (and small) audiences are likely to findmeasures based on engagement much more attractive than those based onexposure.
Further, the audience information of ultimate interest to advertisersis one that establishes linkages between media use and purchase behav-ior. Traditional audience information systems seldom provide informationbeyond audience demographics. However, demographics for many prod-uct categories may be poor surrogates for purchase behavior. For instance, amarketer for high quality wines has to use a demographic proxy for his target,such as high-income groups, when using a traditional audience informationsystem. However, advertisers desire more precise targeting from audienceinformation systems (Webster, 2008).
Finally, all manner of consumption on digital platforms leaves traces,which potentially can provide census like information on audience behav-ior. For instance, data from set-top boxes and Internet servers can provideviewership of TV channels and Web sites, irrespective of the size of theiraudiences. Using such data eliminates errors due to sampling. Many digitalmedia outlets use these traces to track and make visible to users, mea-sures of their interaction with content. The resulting measures, termed “userinformation regimes,” such as “most liked” or “most shared” videos, fur-ther influence aggregate audience behavior (Webster, 2010), and audienceinformation systems need to incorporate them.
In sum, audience information systems for the contemporary mediaenvironment should be able to incorporate changes in audience behaviordue to fragmentation and autonomy (Napoli, 2011). With the “long tail”of media content growing (Anderson, 2006), they cannot restrict theirfocus only on the short head (Napoli, 2011). Besides providing highlygranular reports of exposure across platforms and outlets, consumed atmultiple locations, they must provide additional information on engagement,interactivity and purchase behavior. In light of these challenges, this studyevaluates the efforts made in media markets worldwide to develop audienceinformation systems that measure consumption across media, and poses thefollowing research question:
RQ1: What approach are media industries employing to develop audienceinformation systems that measure multimedia consumption?
Further, we pose additional questions for the audience informationsystems that are based on such approaches:
Evolving Audience Information Systems 125
RQ2a: What dimensions of audience behavior, other than exposure, dothese systems capture?
RQ2b: How effective are they in measuring exposure to media outlets withsmall audience sizes?
RQ2c: What is their status as audience currencies in their respectivemarkets?
We acknowledge that audience information systems are politically andsocially constructed by market participants and many institutional factorsaffect their development and adoption (Ettema & Whitney, 1994; Napoli,2003, 2005). In this article, however, we primarily focus on their technicalcapabilities to serve as coins of exchange between advertisers and mediaowners.
METHOD
We first surveyed developments in audience information systems by mediaindustries worldwide. These are showcased at one of two annual confer-ences: the Audience Measurement Conference of the Advertising ResearchFoundation and the Worldwide Multi Media Measurement of the ESOMAR.Cumulatively, these meetings discuss developments in audience measure-ment encompassing the Americas, Europe, Africa, Middle East, and AsiaPacific. Reviewing archives of proceedings of all editions of both theseconferences from World Advertising Research Center, we selected five casestudies. These are from five diverse media markets, and they exhibit a widerange of approaches that the industry is considering for multimedia audienceinformation systems.
Once these cases were selected, we referred to archives of major tradepublications (both country-specific and publications with a global scope)to evaluate the usage and industry perception of these systems. The rele-vant articles were retrieved through keyword searches of names of thesesystems from digitized archives of the selected trade publications. We alsoobtained questionnaires, sampling plans, sales brochures, and other techni-cal documents on each of these systems. In two markets where we wereunable to find sufficient documentation of the system through secondarysources, we interviewed the vendors and users of those audience informationsystems.
MULTIMEDIA AUDIENCE INFORMATION SYSTEMS
In this section, we first illustrate the broad approaches to multimedia mea-surement that are being employed in markets globally through a description
126 H. Taneja and U. Mamoria
of the technical features of the selected audience information systems.Following these descriptions, we explore the dimensions of audiencebehavior they capture, their use in respective markets and their status ascurrency.
Approaches
Media industries have long recognized the need for alternate audienceinformation systems that measure consumption across media, and linkmedia exposure with purchase behavior. The first single source system wasdevised in England in 1966, recruiting 255 housewives, who, for 3 months,wrote down every purchase made, all programs viewed, and magazines read(McDonald, 1971). The Target Group Index (TGI) surveys (1969, Kantar),Infoscan (1981–1982, IRI), Scan America (1986, Arbitron), and Scantrack(later, Homescan; 1990–1992, Nielsen) are other examples of early singlesource studies (Kamin, 1989; White, 2007; Wood & Gloeckler, 2007).
In the last decade, however, media industries worldwide have showntremendous interest in creating multimedia audience information systems,with most markets actively designing single source systems to possibly serveas advertising currencies (Dreblow, 2008). These employ one of two broadmethodological approaches. The first approach, single source, requires thatall information about multiple media usage, attitudes and purchase behav-ior be obtained from the same respondents. This information is obtainedeither through surveys, peoplemeters, set-top boxes or a combination ofthese methods. Industry practitioners often term single source as the “HolyGrail” of audience information systems (Fitzgerald & Jarvis, 2004).
Another approach, “data fusion“ is the merging of two or more exist-ing surveys by matching each respondent on one survey to a respondenton another survey using some common variables. The fused data are thenanalyzed as if they came from one survey (Rothman, 1988) and used to cross-tabulate variables from disparate surveys. For instance, television viewershipdata fused with print readership data using demographic variables such asage, gender and social class as common variables, allow analysts to associateviewers of TV channels with readers of newspaper titles.
All multimedia audience information systems that we encountered usedeither single source or data fusion, or combined the two approaches. Of thevarious extant initiatives, we selected systems from five media markets, cap-turing the ways in which these approaches are being utilized worldwideto design multimedia audience information systems. The first two, fromAustralia and India, respectively, are single source systems entirely basedon recall surveys. The third, from the United States, is a single source systemthat completely relied on passive measurement, whereas the fourth, fromItaly, combined recall survey and passive measurement. The final system weincluded, from the United Kingdom, used a recall survey, data from which
Evolving Audience Information Systems 127
are then fused with existing currencies to create a multimedia audienceinformation system.
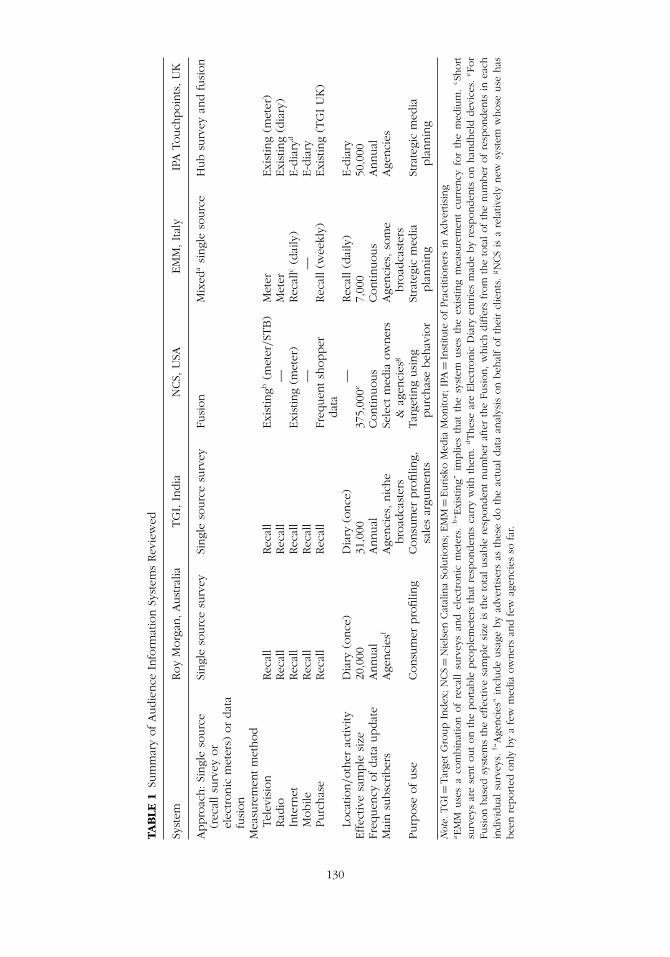
System 1: Roy Morgan, Australia. Roy Morgan Single Source has a large-base survey sample of over 50,000 respondents (chosen from 550 approxi-mately equally populated areas), who are asked questions on lifestyle andattitudes and media consumption habits (including TV, radio, newspapers,magazines, cinema, catalogues, pay TV, and the Internet). Respondents arealso asked to recall brand and product usages, purchase intentions, retailvisitations, service provider preferences, financial information, and evenrecreation and leisure activities. The data are collected in two stages. Firstan establishment survey is administered door to door. The interviewers thenleave the self-completion materials with the respondents, which are thenfilled in and mailed to Roy Morgan, and these amounted to 20,000 (“HowWe Collect,” 2011). Roy Morgan has been in the market since 1988. Thesingle source data reported by them has been consistently close to the datareleased by external agencies, such as the Australian Bureau of Statistics.It has been accepted as an accurate data source, so much so that financialinformation from Roy Morgan Single Source was used in a major Australiangovernment enquiry into banking in Australia (Levine et al., 2001).
System 2: TGI India. TGI surveys, conducted in 51 countries, like RoyMorgan, capture data on media use, product purchase behavior, lifestyle,and attitude. TGI India, started in 2001, has had six releases to date. The2008 edition sampled about 31,000 respondents belonging to the age groupof 15 to 55 years. Of the three socioeconomic classes (A, B, & C) covered,TGI deliberately oversamples higher classes to capture usage of high-endproducts and brands. Most parts of urban India are included in the sample(TGI India, 2008). Like Roy Morgan, TGI also collects data in two ways: first,an interviewer–assisted, face-to-face readership questionnaire; and second,a “leave-behind” media and product booklet filled in the by the respondentand scrutinized by the interviewer. These are filled in over 1 week, withtwo telephonic and two personalized follow ups (A. Karnad, personal com-munication, August 23, 2010). TGI, India, initially a biennial study, is nowconducted every year (TGI India, n.d.).
System 3: Nielsen Catalina Solutions, USA. Nielsen Catalina Solutions(NCS) is a single source system created by fusing multiple data on mediause with product purchase. NCS integrates television and Internet use datafrom the existing Nielsen currency panels and set-top boxes, with shop-ping data sourced both from households (Nielsen Homescan, a householdpurchase panel) and retailers (data captured through frequent shoppercards). The final sample size of the fused database is 375,000 households.Advertisers, particularly consumer packaged goods companies, can use thissystem to determine the media outlets on which advertising has the maxi-mum impact on purchase behavior, for a given category. This informationcan subsequently be used to target consumers through media outlets and
128 H. Taneja and U. Mamoria
programs that actually deliver a sales uptake, based on past purchases ofthose product categories, than by using demographics alone.
NCS is Nielsen’s attempt to reenter this space after the failure of themuch-hyped Project Apollo, created in 2006, jointly by Nielsen and Arbitron,providing Arbitron’s Portable People Meter to 11,000 panelists of NielsenHomescan panel, resulting in a single source panel that provided pas-sive measures of their media use linked to product purchase (Kennedy,McDonald, & Sharp, 2008). However, despite its potential to demonstrate acausal relation between advertising and sales and “a promising level of inter-est” (7 large advertisers provided initial funding), Apollo failed, as Arbitronand Neilsen “did not secure sufficient client commitments to make ProjectApollo a sustainable venture for [the] two companies” (McClellan, 2008,para. 6).
System 4: Eurisko Media Monitor (EMM), Italy. This single source study,devised by Gfk Eurisko, captures Italians’ exposure to multiple media usinga combination of active recall (survey) and passive measurement (meter).The meter, called the Eurisko Dialogue Machine (EDM), is an integrateddevice containing a hand held computer connected via general packet radioservice (GPRS) and an electronic meter with sound-matching technology.It captures audio signals from media like TV and radio. Other media, such asprint, Internet and outdoor (daily), cinema and in-store advertising (weekly),are recorded through recall surveys sent electronically via GPRS on the EDM.Face-to-face interviews are only used to profile a respondent (upon establish-ment) and assess impact of direct marketing (once every fortnight). The dataare collected in seven waves throughout the year, which removes the effectof seasonality. A nationally representative sample (N = 7,000 individuals in2010) of Italians over 14 years of age is surveyed (Licastro, 2009).
System 5: IPA Touchpoints, United Kingdom. The Institute ofPractitioners in Advertising (IPA) Touchpoints aims to integrate existingmono media currencies in the United Kingdom to create a multimedia audi-ence information system. The study is done in two stages. First, a hub surveyis conducted that gathers information from 5,000 adults 15 years and olderthrough electronic diaries (e-diaries), which respondents fill at 1/2-hr intervalsfor 7 days. The e-diary records the respondent’s location, mode of travel,mood, and state of alertness every 1/2 hr. Information on media like cinema,mailers, telemarketing, e-mail and commercial text messaging is recorded atthe end of the day (Ken Baker Associates, 2006). Respondents also com-plete a paper questionnaire covering attitude, product ownership, shoppingand media behavior (Robinson & Turner, 2007; Robinson, 2009). The secondstage involves fusing all existing measurement currencies with this “hub sur-vey” to produce a robust, channel-planning tool. Currently, the Broadcasters’Audience Research Board (aka BARB; a TV measurement panel), Radio JointAudience Research (aka RAJAR; a radio panel), National Readership Survey(aka NRS), and TGI are being fused into Touchpoints, with an overall fusion
Evolving Audience Information Systems 129
efficiency of 93%. This creates an average of nine proxies for every hubsurvey respondent, delivering an operational sample size of approximately50,000 (Ken Baker Associates, 2006). Touchpoints, started in 2006, has hadthree releases to date. The fourth edition is scheduled for a 2012 release.In Table 1, we summarize the methodological features of each of thesesystems.
Dimensions of Audience Behavior Captured
Apart from measuring exposure, most single source surveys ask respondentsabout their awareness, interest, intensity of use and affinity with media out-lets, as well as content genres. These can then be used to construct measuresof engagement. Roy Morgan, in its leave-behind questionnaire, asks usersabout media they find most useful and their preferences for each medium indifferent dayparts. Besides, users are asked to report their involvement withTV programs, as well as their attention spans, when watching TV (“How WeCollect,” 2009). Similarly, TGI, India has questions that help estimate engage-ment with and brand equity of media outlets. For instance, respondents areasked to rate news channels on parameters like credibility, trust, and bias (M.Poondi, personal communication, August 13, 2011). Studies using passivemeasurement, such as Touchpoints and EMM, gauge engagement throughsimilar questions in their self-completion components.
These variables can be maneuvered in a variety of ways by advertisersto judge their brands’ fit with media outlets, as well as correlate exposurelevels with affinity to content. Similarly, media owners can use such infor-mation to compare their outlets with competitors on measures of audienceengagement, in addition to exposure levels. Rather than looking at media usein isolation, these studies attempt to link respondents’ social practices withmedia use. One approach is to have respondents to fill a time-use diary fortheir locations and activities throughout the day, on the day they completethe self-completion questionnaire. Another method is to record this infor-mation electronically, and in real time, resulting in more granular data. Forinstance, the e-diary in Touchpoints prompts respondents every 1/2 hr to entertheir location, who they are with, and what media they are using. Besides,respondents are asked to report their mood and whether they were usingmedia passively or actively. Such information enables advertisers and mediaowners to establish how social contexts influence exposure and engagementwith content and commercials.
Some single source systems link product purchase behavior with mediause. This helps advertisers precisely define their target audiences on the basisof past purchases, and then study their media habits. For instance, TGI Indiaasks respondents to provide usage of 3,300 brands spanning 330 productcategories (Global TGI, n.d.). The survey captures usage frequency of variousbrands, which helps advertisers correlate use of brands with consumption
TAB
LE1
Sum
mar
yofA
udie
nce
Info
rmat
ion
Syst
ems
Rev
iew
ed
Syst
emRoy
Morg
an,A
ust
ralia
TG
I,In
dia
NCS,
USA
EM
M,Ital
yIP
ATo
uch
poin
ts,U
K
Appro
ach:Si
ngl
eso
urc
e(r
ecal
lsu
rvey
or
elec
tronic
met
ers)
or
dat
afu
sion
Singl
eso
urc
esu
rvey
Singl
eso
urc
esu
rvey
Fusi
on
Mix
eda
singl
eso
urc
eH
ub
surv
eyan
dfu
sion
Mea
sure
men
tm
ethod
Tele
visi
on
Rec
all
Rec
all
Exi
stin
gb(m
eter
/ST
B)
Met
erExi
stin
g(m
eter
)Rad
ioRec
all
Rec
all
—M
eter
Exi
stin
g(d
iary
)In
tern
etRec
all
Rec
all
Exi
stin
g(m
eter
)Rec
allc
(dai
ly)
E-d
iary
d
Mobile
Rec
all
Rec
all
——
E-d
iary
Purc
has
eRec
all
Rec
all
Freq
uen
tsh
opper
dat
aRec
all(w
eekl
y)Exi
stin
g(T
GIU
K)
Loca
tion/oth
erac
tivity
Dia
ry(o
nce
)D
iary
(once
)—
Rec
all(d
aily
)E-d
iary
Effec
tive
sam
ple
size
20,0
0031
,000
375,
000e
7,00
050
,000
Freq
uen
cyofdat
aupdat
eA
nnual
Annual
Contin
uous
Contin
uous
Annual
Mai
nsu
bsc
riber
sA
genci
esf
Age
nci
es,nic
he
bro
adca
ster
sSe
lect
med
iaow
ner
s&
agen
cies
gA
genci
es,so
me
bro
adca
ster
sA
genci
es
Purp
ose
ofuse
Consu
mer
pro
filin
gConsu
mer
pro
filin
g,sa
les
argu
men
tsTar
getin
gusi
ng
purc
has
ebeh
avio
rSt
rate
gic
med
iapla
nnin
gSt
rate
gic
med
iapla
nnin
g
Not
e.TG
I=Tar
getG
roup
Index
;N
CS=
Nie
lsen
Cat
alin
aSo
lutio
ns;
EM
M=
Eurisk
oM
edia
Monito
r;IP
A=
Inst
itute
ofPra
ctiti
oner
sin
Adve
rtis
ing
aEM
Muse
sa
com
bin
atio
nof
reca
llsu
rvey
san
del
ectronic
met
ers.
b“E
xist
ing”
implie
sth
atth
esy
stem
use
sth
eex
istin
gm
easu
rem
ent
curr
ency
for
the
med
ium
.cSh
ort
surv
eys
are
sentouton
the
portab
lepeo
ple
met
ers
that
resp
onden
tsca
rry
with
them
.dThes
ear
eEle
ctro
nic
Dia
ryen
trie
sm
ade
by
resp
onden
tson
han
dhel
ddev
ices
.eFo
rFu
sion
bas
edsy
stem
sth
eef
fect
ive
sam
ple
size
isth
eto
talusa
ble
resp
onden
tnum
ber
afte
rth
eFu
sion,w
hic
hdiffe
rsfrom
the
tota
lof
the
num
ber
of
resp
onden
tsin
each
indiv
idual
surv
eys.
f “Age
nci
es”
incl
ude
usa
geby
adve
rtis
ers
asth
ese
do
the
actu
aldat
aan
alys
ison
beh
alf
of
thei
rcl
ients
.gN
CS
isa
rela
tivel
ynew
syst
emw
hose
use
has
bee
nre
ported
only
by
afe
wm
edia
ow
ner
san
dfe
wag
enci
esso
far.
130
Evolving Audience Information Systems 131
of media outlets. The granularity of such information further improves whenpassive methods are used to measure both media use and purchase behavior,such as in NCS. This dimension of purchase behavior, captured by thesesystems, is a marked enhancement over traditional audience informationsystems, such as the Nielsen television panel, where campaign planners usedemographics as proxies for purchase behavior.
Applications in the Marketplace
Primarily, these systems provide advertisers strategic media planning toolsto design multimedia campaigns. Because such data captures usage acrossmedia from the same respondents, campaign planners consider these sys-tems to be more accurate than the optimizers most media agencies have inhouse, which integrate data from disparate studies, such as readership sur-veys and television measurement panels. In particular, systems that capturedata through passive methods (Touchpoints and EMM) are extensively usedfor optimizing allocation of advertising budgets across different media.
Advertisers also use these systems for consumer profiling. In particular,they use survey-based single source studies, such as TGI and Roy Morgan,primarily for detailed profiling of their target audiences. For instance, a mediaagency working on a launch campaign for a car used TGI India to pro-file consumers, who had purchased cars of a certain segment in the last2 years, for their demographics, allocation of time across media, contentpreferences, and attitudes toward advertising (P. Shah, personal communica-tion, August 25, 2010). Such information usually forms the basis for decidingwhich media and content genres are the most effective for reaching theseprecisely defined target groups. Detailed media plans are then made usingthe traditional currency for each medium.
Media owners use data from single source surveys to boost salesarguments. Because advertisers use single source data to plan campaigns,media owners, too, use them to showcase their audiences to advertisers.Because these usually have larger samples than television measurementpanels and readership surveys, they are able to report viewership infor-mation for a wider range of TV channels and print titles. Hence, televisionchannels and newspapers that have small audience sizes find single sourcesurveys attractive to construct sales arguments, usually based on engage-ment, rather than exposure. Often, these arguments are also based onpurchase behavior. For instance, BBC World News and CNN International,in India, use TGI data to evaluate their reach among international businesstravelers—a statistic they market to advertisers, such as airlines and hotels(S. Mohapatra, personal communication, August 25, 2010). Media owners inItaly are increasingly buying EMM to enhance sales arguments, as 80% ofmedia agencies and many leading advertisers subscribe to it (G. Licastro,personal communication, August 10, 2011).
132 H. Taneja and U. Mamoria
A system based entirely on passive measurement, such as NCS, helpsadvertisers evaluate the direct effect of exposure to advertising on sales.Media owners, however, are still figuring how to market such data to adver-tisers. For instance, CBS recently analyzed NCS data to demonstrate that,instead of planning campaigns based on age and gender, advertising in pro-grams that are watched by heavy users of a product category helps lift sales(Poltrack & Bowen, 2011). NCS data, in general, show a higher correlationbetween sales and ad exposure among heavy users of many product cate-gories than all 18- to 49-year-old users (0.69 vs. 0.12; Neff, 2011). Similarly,Time magazine fused its subscriber database with NCS’s shoppers’ panel totrack which segments of its subscribers are more attractive to advertisers(Ives, 2011).
Measuring the Long Tail of Media
Given the immense fragmentation in audience attention, new audience infor-mation systems must effectively measure audiences to outlets at the end ofthe long media tail. Single source systems based on panels, however, facesimilar limitations of sample sizes that have plagued traditional audienceinformation systems (Napoli, 2003). In general, these studies derive theirprimary funding from large advertisers (and their media agencies) whosepriorities are to measure mass audience behavior. For instance, EMM (Italy)has a sample size of 7,000, which prevents it from reliably capturing audi-ence to smaller local radio stations, international TV, or smaller Web sites(G. Licastro, personal communication, August 10, 2011).
However, single source systems are attractive to niche media outlets,due to the other dimensions of audience behavior they capture, such asengagement and purchase behavior. For instance, an international broad-caster like BBC uses TGI, India extensively to construct sales argumentsfor its TV channels, as the survey measures affinity with and likeability ofcontent, where the BBC scores very well (S. Mohapotra, personal communi-cation, August 25, 2010). Similarly, advertisers who want to use niche mediaoutlets use data on purchase behavior and engagement from single sourcesurveys such as TGI to profile consumers in detail (M. Poondi, personalcommunication, August 13, 2011).
Systems that fuse panels and census data, such as NCS and Touchpoints,provide large samples, making analyses of outlets with small audiences moremeaningful. However, executives, yet, do not use these data to make deals,as most are unwilling to accept that fused data are true alternatives torespondent-level panel data. For now, they, at best, serve ancillary func-tions that help media owners enhance sales arguments or planners designcross-platform campaign strategies. Finally, panel-based, single source sys-tems that rely on passive measurement, such as EMM, need to significantlyincrease sample sizes to be able to capture exposure to niche media outlets.
Evolving Audience Information Systems 133
It may suffice to conclude, at least for now, that most single source audi-ence information systems focus on the short head of measurement, just astraditional audience information systems.
Incorporating Digital Footprints and Return Path Data
As already noted, rapid digitization of electronic media distribution andgrowth of online social media have created opportunities for audience infor-mation systems to capture behavioral census-like data, which can be usedto construct various measures of exposure to and engagement with con-tent. Although we did not find single source, cross-platform systems (exceptNCS) to be leveraging such opportunities, a host of firms have begun pro-viding such measures. For instance, in the U.S. market alone, there are10 firms utilizing return path data from television set boxes to provide audi-ence information (Telecommunications Research Associates [TRA] Global,2011).
Return path data are capable of providing census-like estimates, and canovercome the problem of small sample sizes that increasingly diminish theaccuracy of panel-based estimates with increasing audience fragmentation,making them attractive to niche media. For instance, TRA, which runs single-source panel-combining, set-top box data with frequent shopper cards, withan effective sample size of 370,000 in 2011 (Cook, 2011), had 12 clients,including two major agencies and niche content providers, such as MTVand Discovery Channel networks (Bell, 2008). However, executives at thesenetworks mainly look at TRA as a way of getting more “color” about theirviewers (Bell, 2008), and are not sure about using these data at the “upfronts”(Bachman, 2010).
We found that various companies are considering opportunities to incor-porate “user information regimes” into audience information systems. Onerecent example is Optimedia’s Content Power Ratings, which use threedimensions—delivery, involvement, and advocacy—to compute a program’sscore (Young, 2011). The delivery is a sum of impressions across platforms;involvement is based on the awareness, loyalty (from primary research), andonline search volume, whereas advocacy is measured from a slew of userinformation regimes based on online buzz and recommendations. Such dataoften show that not all programs that score highest on engagement have thehighest ratings.
Coexistence With Extant Currencies
The use of single source data by market participants motivates the ques-tion about their status as advertising currencies in their respective markets.In general, these systems are currently being used as complements to rather
134 H. Taneja and U. Mamoria
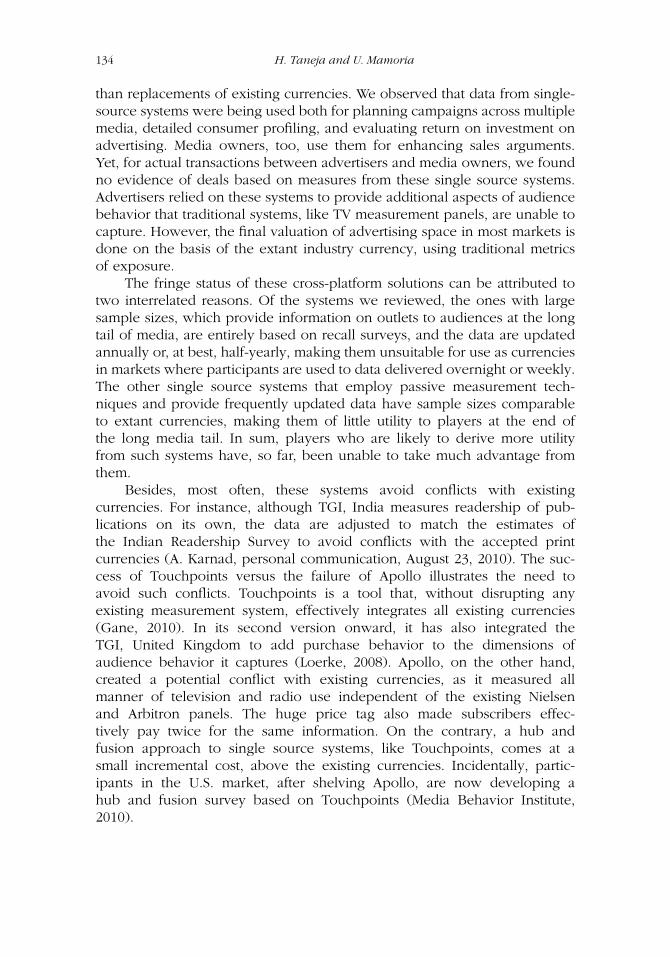
than replacements of existing currencies. We observed that data from single-source systems were being used both for planning campaigns across multiplemedia, detailed consumer profiling, and evaluating return on investment onadvertising. Media owners, too, use them for enhancing sales arguments.Yet, for actual transactions between advertisers and media owners, we foundno evidence of deals based on measures from these single source systems.Advertisers relied on these systems to provide additional aspects of audiencebehavior that traditional systems, like TV measurement panels, are unable tocapture. However, the final valuation of advertising space in most markets isdone on the basis of the extant industry currency, using traditional metricsof exposure.
The fringe status of these cross-platform solutions can be attributed totwo interrelated reasons. Of the systems we reviewed, the ones with largesample sizes, which provide information on outlets to audiences at the longtail of media, are entirely based on recall surveys, and the data are updatedannually or, at best, half-yearly, making them unsuitable for use as currenciesin markets where participants are used to data delivered overnight or weekly.The other single source systems that employ passive measurement tech-niques and provide frequently updated data have sample sizes comparableto extant currencies, making them of little utility to players at the end ofthe long media tail. In sum, players who are likely to derive more utilityfrom such systems have, so far, been unable to take much advantage fromthem.
Besides, most often, these systems avoid conflicts with existingcurrencies. For instance, although TGI, India measures readership of pub-lications on its own, the data are adjusted to match the estimates ofthe Indian Readership Survey to avoid conflicts with the accepted printcurrencies (A. Karnad, personal communication, August 23, 2010). The suc-cess of Touchpoints versus the failure of Apollo illustrates the need toavoid such conflicts. Touchpoints is a tool that, without disrupting anyexisting measurement system, effectively integrates all existing currencies(Gane, 2010). In its second version onward, it has also integrated theTGI, United Kingdom to add purchase behavior to the dimensions ofaudience behavior it captures (Loerke, 2008). Apollo, on the other hand,created a potential conflict with existing currencies, as it measured allmanner of television and radio use independent of the existing Nielsenand Arbitron panels. The huge price tag also made subscribers effec-tively pay twice for the same information. On the contrary, a hub andfusion approach to single source systems, like Touchpoints, comes at asmall incremental cost, above the existing currencies. Incidentally, partic-ipants in the U.S. market, after shelving Apollo, are now developing ahub and fusion survey based on Touchpoints (Media Behavior Institute,2010).
Evolving Audience Information Systems 135
DISCUSSION AND IMPLICATIONS
Our findings suggest that media industries worldwide have taken survey-or fusion-based approaches to design single source audience informationsystems that measure media use across platforms. These systems provideinformation on audience activity beyond exposure that can be used to con-struct measures to segment and subsequently target audiences based onengagement and purchase behavior. Further, by capturing information onmultiple media use and purchase behavior from the same sets of respon-dents, these provide opportunities for planning campaigns across media.Despite these promises, we found that such systems currently served ancil-lary functions and, regardless of long periods of their existence, haveremained at the fringes of the advertising trading process (Napoli, 2011).However, we posit that cross-platform audience information systems willsoon become more central in transactions between advertisers and mediaowners, due to reasons illustrated as follows.
Historically, demonstration of new information about audiences haspaved ways for revisions in institutionally effective conceptions of audiences(Barnes & Thomson, 1994). Today, return path data provide market par-ticipants details about audience numbers to outlets at the end of the longmedia tail—information that previously remained hidden due to the smallsample sizes of traditional audience information systems. Engagement, beingjust an abstract construct, is now a visible phenomenon that can be mone-tized through “user information regimes.” Further, the contemporary mediaenvironment has a larger pool of players, who require audience informa-tion more than ever before. The convergence of digital technologies andmediated content has expanded this pool beyond content providers to alsoinclude erstwhile platform providers and technology companies. These mul-tiple players have distinct institutional interests, which, unlike the past, asingle dominant conception of an institutionally effective audience is unlikelyto satisfy.
In sum, the factors previously highlighted will interact with the growingdissatisfaction of stakeholders with extant systems (Napoli, 2011), to resultin multiple conceptions of institutionally effective audiences. Some of theseconceptions are likely to favor audience information systems that measuremedia use across platforms. However, in pushing the case for these systems,market participants will need to be mindful of certain considerations, two ofwhich can be deduced from our study.
First, systems that focus on integrating and enhancing the varioussources of audience information that currently circulate in the marketplacemay get wider stakeholder support than those that reinvent the wheel.Therefore, instead of completely discarding existing panel-based approaches,when advocating for return path data, vendors should aim at an inte-gration of both methods, resulting in greater sample sizes, yet preserving
136 H. Taneja and U. Mamoria
information on audience demographics. For instance, Internet measure-ment providers comScore and Nielsen Online have integrated server-centricdata into their panels, as rising fragmentation of the Internet cast asper-sions over the reliability of panel data (Bermejo, 2007). In advocating forcross-platform audience information systems, too, taking such integratedapproaches would ensure that these evolving systems remain both usefuland affordable for specialized outlets without being disruptive for existingdominant players.
Second, despite the fact that on digital platforms various user infor-mation regimes have made concepts like engagement publicly visible andhighly tangible, it will be premature to remove exposure altogether fromthe audience valuation equation. Although “buying on engagement seemslike a natural progression . . . [and] quantifying that level of engagement . . .
would be a leap forward for TV sellers” (Jack Kelly, Chief Executive Officerat Universal McCann, as cited in Bruell, 2011), such a leap is unlikely toappeal to all institutional interests. Besides, return path data provide largesamples, which would help improve the quality of exposure data. We, there-fore, suggest that these new audience information systems must provide datain a manner that gives users the flexibility to construct measures using boththese dimensions of audience behavior.
Institutionally effective conceptions of audiences are conventions thatdiffer across markets, owing to distinct institutional factors at play (Balnaves& O’Regan, 2010; Miller, 1994). Therefore, we do not claim that the prescrip-tions we just gave would work for audience information systems in eachmarket. Yet, this study sets the groundwork for future research to exploreinstitutional dynamics in individual markets in greater detail as market partic-ipants worldwide push for audience information systems that measure mediause across platforms.
The field of audience measurement is at a critical juncture (Napoli,2011). At such a time, to the best of our knowledge, this is the firstsystematic study that focuses on the design and usage of cross-platformaudience information systems globally. In doing so, it provides an insightinto the ways in which media industries worldwide are employing single-source measurement to deal with the contemporary challenges in multimediameasurement. The international focus further illustrates that, despite thepeculiarities of each market, there are some uniform technical challenges thatconfront media industries globally as they embrace the newer conventionsof audience measurement.
REFERENCES
Anand, N., & Peterson, R. (2000). When market information constitutes fields:Sensemaking of markets in the commercial music industry. OrganizationScience, 11, 270–284.

Evolving Audience Information Systems 137
Anderson, C. (2006). The long tail: Why the future of business is selling less of more.New York: Hyperion.
Andrews, K., & Napoli, P. (2006). Changing market information regimes: Acase study of the transition to the BookScan audience measurement sys-tem in the US book publishing industry. Journal of Media Economics, 19,33–54.
Bachman, K. (2010, March 24). MTV looks beyond standard ratings with TRA pact.Adweek. Retrieved October 25, 2011, from http://www.adweek.com/news/television/mtv-looks-beyond-standard-ratings-tra-pact-101922
Balnaves, M., & O’Regan, T. (2010). The politics and practice of television rat-ings conventions: Australian and American approaches to broadcast ratings.Continuum, 24, 461–474.
Barnes, B., & Thomson, L. (1994). Power to the people (meter): Audience measure-ment technology and media specialization. In Ettema, J. & Whitney, D. (Eds.),Audiencemaking: How the media create the audience (pp. 75–94). ThousandOaks, CA: Sage.
Bell, L. (2008, November 14). Discovery to use TRA’s single-source database. DirectMarketing News. Retrieved October 25, 2011, from http://www.dmnews.com/discovery-to-use-tras-single-source-database/article/121051/
Bermejo, F. (2007). The Internet audience: Constitution and measurement. NewYork: Peter Lang.
Bermejo, F. (2009). Audience manufacture in historical perspective: From broadcast-ing to Google. New Media & Society, 11, 133.
Bruell, A. (2011, October 5). How media agency CEOs would change the TVupfront. Ad Age® Media News. Retrieved October 25, 2011, from http://adage.com/article/mediaworks/media-agency-ceos-change-tv-upfront/230169/
Calder, B. J., & Malthouse, E. C. (2008). Engagement and advertising effectiveness.In B. J. Calder & the J. L. Kellogg Graduate School of Management (Eds.),Kellogg on advertising & media: The Kellogg School of Management (pp. 1–36).Hoboken, NJ: Wiley.
Cook, W. (2011, June 3). TRA singlesource methodology: An ARF research review.New York: Advertising Research Foundation. Retrieved October 25, 2011, fromhttp://www.thearf.org/assets/research-reviews-recent
Dreblow, R. (2008, November). The WFA blueprint: Everyone gains from evolvingmedia measurement. London: Warc. Retrieved May 25, 2010 from http://www.warc.com/ArticleCenter
Ettema, J. S., & Whitney, D. C. (1994). Audiencemaking: How the media create theaudience. Thousand Oaks, CA: Sage.
Fitzgerald, J., & Jarvis, T. (2004, June). Seeking the Holy Grail: Is single sourcemeasurement the real knight in shining armour for the media indus-try? Paper presented at the ESOMAR Cross Media Conference, Geneva,Switzerland.
Forrester, C. (2009, October 27). Huge rise in India channel costs. Rapid TV News.Retrieved November 2, 2009, from http://www.rapidtvnews.com/index.php/200910275053/huge-rise-in-india-channel-costs.html
Gane, R. (2010, October 29). TouchPoints isn’t an interim solution. . . . London:MediaTel Ltd. Retrieved August, 15, 2011, from http://mediatel.co.uk/newsline/2010/10/29/touchpoints-isnt-an-interim-solution/
138 H. Taneja and U. Mamoria
Global TGI. (n.d.). Our global network: India. London: Author. Retrieved May 25,2010 from http://globaltgi.com/our-network/india
How we collect and process single source data in Australia. (2011). Melbourne,Australia: Roy Morgan Research. Retrieved April 30, 2012 from http://www.roymorgan.com/resources/pdf/factsheets/OZFactBro291111.pdf
Ives, N. (2011, October 3). Magazines to marketers: We’ll prove how much we liftsales. Ad Age® Media News. Retrieved October 25, 2011, from http://adage.com/article/mediaworks/magazines-marketers-prove-lift-sales/230160/
Jenkins, H. (2004). The cultural logic of media convergence. International Journalof Cultural Studies, 7 , 33–44.
Kamin, H. (1989). The age of the single source. Review of Business, 11(1). RetrievedMay 25, 2010, from http://www.freepatentsonline.com/article/Review-Business/7689209.html
Ken Baker Associates. (2006, January 10). TouchPoints site: Development ofthe TouchPoints planning database appraisal. London: IPA. Retrievedfrom http://www.ipa.co.uk/document/touchpoints-site-development-of-the-touchpoints-planning-database-appraisal
Kennedy, R., McDonald, C., & Sharp, B. (2008, February). Pure single source dataand take-off time for Project Apollo. Admap, 43(491), 32–35.
Levine, M., Morgan, G., Hepenstall, N., North, N., & Smith, G. (2001,November). Single source for increased advertising productivity in a multimediaworld. Paper presented at the Advertising Research Foundation, MultimediaCommunications Conference (pp. 9–29). Warc.
Licastro, G. (2007, June). The media monitor in Italy: Single source multimediameasurement. Paper presented at the ESOMAR Worldwide Multi MediaMeasurement Conference; WM3, Dublin, Ireland.
Licastro, G. (2009, May). Single source multimedia audience measurement—TheEurisko Media Monitor. Paper presented at the ESOMAR Worldwide Multi MediaMeasurement Conference, Stockholm, Sweden.
Loerke, S. (2008, December). Is there life after Apollo? ANA Magazine, 58–59.May 2010 Web Server Survey. (2010, May 14). Netcraft.com. Retrieved May
19, 2010, from http://news.netcraft.com/archives/2010/05/14/may_2010_web_server_survey.html
McClellan, S. (2008, February 25). Arbitron, Nielsen end Project Apollo. Adweek.Retrieved May 17, 2010, from http://www.adweek.com/aw/content_display/news/media/e3i3da710641ca059c5b688dba1db227bf9
McDonald, C. (1971). What is the short term effect of advertising? In D. Corkindale& S. Kennedy (Eds.), Measuring the effect of advertising (pp. 463–487).Farnborough, England: Saxon House Studies.
Media Behavior Institute. (2010, March). USA TouchPoint research highlights. Paperpresented at Transformations, 2010 Conference of the American Associationof Advertising Agencies, San Francisco, CA. Retrieved from http://www.cimm-us.org/
Miller, P. (1994). Made to order and standardized audiences. In J. S. Ettema & D.Whitney (Eds.), Audiencemaking: How media create the audience (pp. 57–73).Thousand Oaks, CA: Sage.
Napoli, P. (2003). Audience economics: Media institutions and the audience market-place. New York: Columbia University Press.
Evolving Audience Information Systems 139
Napoli, P. (2005). Audience measurement and media policy: Audience economics,the diversity principle, and the local people meter. Communication Law andPolicy, 10, 349–382.
Napoli, P. (2011). Audience evolution: New technologies and the transformation ofmedia audiences. New York: Columbia University Press.
National Cable & Telecommunication Association. (2011). Industry data.Washington, DC: Author. Retrieved May 19, 2010, from http://www.ncta.com/Statistics.aspx
Neff, J. (2011, March 23). CBS: Viewers’ age and sex shouldn’t matter to mar-keters. Ad Age® Media News. Retrieved October 25, 2011, from http://adage.com/article/mediaworks/cbs-viewers-age-sex-matter-marketers/149534/
Picard, R. (2000). Audience fragmentation and structural limits on media innova-tion and diversity. In J. van Cuilenburg & R. van der Wurff (Eds.), Mediaand open societies: Cultural, economic and policy foundations for opennessand diversity in East and West (pp. 97–103). Amsterdam, Netherlands: HetSpinhus.
Poltrack, D., & Bowen, K. (2011). The future is now: In pursuit of a more efficientand effective media strategy. Journal of Advertising Research, 51, 345–355.
Robinson, L. (2009, May). The IPA TouchPoints initiative—Its effects on the marketplace and its future plans. Paper presented at the ESOMAR Worldwide MultiMedia Measurement Conference, Stockholm, Sweden.
Robinson, L., & Turner, D. (2007). Delivering the dream: The IPA TouchPointsInitiative. Paper presented at the ESOMAR Worldwide Multi Media MeasurementConference; WM3, Dublin, Ireland.
Rothman, J. (1988, July). Data fusion and single source surveys. Admap, 276 , 37–41.TRA Global. (2011, May). TV set top box data: U.S. market structure (White
Paper). Jack Myers Media Business Report. Retrieved August 25, 2011 fromhttp://media.jackmyers.com/documents/TRA+Sector+White+Paper+May+2011+Final.pdf
TGI India (2008). Mumbai, India: IMRB International. Retrieved April 30, 2012 fromhttp://www.imrbint.com/index.php?option=com_content&view=article&id=22:tgi-india-a-single-source-marketing-communication-and-planning-tool&catid=5:syndicated-offers&Itemid=8
TGI India (n.d.). London: Kantar Media. Retrieved from http://www.tgisurveys.com/whatis/
Webster, J. (2005). Beneath the veneer of fragmentation: Television audi-ence polarization in a multichannel world. Journal of Communication, 55,366–382.
Webster, J. (2008). Developments in audience measurement and research. In B. J.Calder (Ed.), Kellogg on advertising and media (pp. 123–138). Hoboken, NJ:Wiley.
Webster, J. (2010). User information regimes: How social media shape patterns ofconsumption. Northwestern University Law Review, 104, 592–613.
Webster, J., & Ksiazek, T. B. (2012). The dynamics of audience fragmentation: Publicattention in an age of digital media. Journal of Communication, 62, 39–56.
Webster, J., Phalen, P., & Lichty, L. (2006). Ratings analysis: The theory and practiceof audience research. Mahwah, NJ: Lawrence Erlbaum Associates, Inc.

140 H. Taneja and U. Mamoria
White, R. (2007, April). Single source: WARC best practice. London: Warc. Retrievedfrom http://www.warc.com/ArticleCenter
Wood, L., & Gloeckler, D. C. (2007, June). Project Apollo: Consumer-centricinsights—The dawn of a new era of advertising research. Paper presented atthe ESOMAR Worldwide Multi Media Measurement Conference; WM3, Dublin,Ireland.
Young, A. (2011, May 18). Viewpoint: Rating TV programs in today’s media world.Ad Age® Media News. Retrieved October 25, 2011, from http://adage.com/article/special-report-tv-upfront/tv-shows-rank-engagement-advocacy-factored/227617/