Measuring immersion and affect in a brain-computer interface game
85
Immersion and affect in a brain-computer interface game Gido Hakvoort Committee: Dr. M. Poel Prof. dr. ir. A. Nijholt Dr. J. Zwiers H. G¨ urk¨ ok, M.Sc. D. Plass-Oude Bos, M.Sc. June 16, 2011
-
Upload
independent -
Category
Documents
-
view
4 -
download
0
Transcript of Measuring immersion and affect in a brain-computer interface game

Immersion and affectin a brain-computer
interface game
Gido Hakvoort
Committee:Dr. M. Poel
Prof. dr. ir. A. NijholtDr. J. Zwiers
H. Gurkok, M.Sc.D. Plass-Oude Bos, M.Sc.
June 16, 2011

Immersion and affect in a
brain-computer interface game
Gido Hakvoort
Enschede, June 16, 2011
Master ThesisHuman Media Interaction
Faculty EEMCSUniversity of Twente
Graduation Committee:Dr. Mannes Poel (1st supervisor)
Prof. dr. ir. Anton NijholtDr. Job Zwiers
Hayrettin Gurkok, M.Sc.Danny Plass-Oude Bos, M.Sc.

Abstract
As the scope of the brain-computer interface (BCI) applications is extendingfrom medical to recreational use, the expectations of BCIs are also changing.Although the performance of BCIs is still important, finding suitable BCI modal-ities and investigating their influence on user experience demand more and moreattention. As BCIs have widely been used in medical applications, to facilitatemaking selections, it would be imaginable to apply similar BCIs to recreationalapplications. However, whether they are suitable for recreational applicationsis unclear as they have rarely been evaluated for user experience. In this studytwo BCI selection methods and a comparable non-BCI selection method wereintegrated into a computer game to evaluate user experience in terms of im-mersion and affect. The BCI selection methods were based on the P300 andsteady-state visually evoked potential (SSVEP) paradigms. An experiment withfourteen participants showed that the SSVEP selection method was capable ofenriching the user experience in terms of immersion and affect. Participantswere significantly more immersed and the SSVEP selection method was foundmore positively affective. Although it was expected that P300 would enrich userexperience, it did not.

Preface
While being an undergraduate I quickly became aware that it was the reci-procity between different research fields that really appealed to me. On theintersection of research fields you need to find creative solutions to unify them.Although I had never realised that an academic career could be something forme, in my second year I realised you need knowledge before you can share it,and preferably a lot as some people, including myself, never stop asking ’why?’.These realisations led me to adjusting my goals and I decided to pursue a mas-ter’s degree. In my final year I started looking for a suitable master programmewhere I could broaden my knowledge of the interaction between human andcomputer which is why I enrolled myself at the University of Twente for themaster Human Media Interaction (HMI).
During my second year at HMI, I followed a course on machine learning whereI came in contact with Boris Reuderink, a PhD student researching brain-computer interfaces in the context for games. Since he was appointed as mysupervisor for the machine learning course, we had conversations about his re-search but also about the differences between HMI and my undergraduate edu-cation. I became aware that although I had technical skills, I lacked theoreticalcompetencies and experience which are important for an academic career. Atthat time I also had to choose a direction for my master thesis and I decided totake brain-computer interfaces as my research topic. It offered ways to gain the-oretical competencies and experience, while I was still able to use my practicalskills.
I started my master thesis together with Michel Obbink and during the firstcouple of months we went through a lot of theoretical material and developedMind the Sheep!, the game we used for both our researches. After these monthswe took of in different directions and continued our researches separately. Myresearch has led to this thesis in which I try to describe the thought processeswhich I have been going through, the experiments that I have conducted and ofcourse the results I have found.
Part of the research described in this thesis will be presented at the 13th IFIPTC13 Conference on Human-Computer Interaction (INTERACT 2011) thatwill be held in September 2011 in Lisbon. The paper will also appear in theproceedings of INTERACT 2011 and can be found in Appendix I.
Gido Hakvoort
Enschede, June 16, 2011
i

Acknowledgements
When I started my master thesis and chose brain-computer interfaces as myresearch topic, I knew it would not be easy. However, without the help andsupport of some important people it would have been much more difficult whichis why I would like to thank them.
First of all, I owe many thanks to my best friend and brother, Michiel Hakvoort.I know it must have been hard sometimes, listening while I was reciting mythought processes and ideas. But you were always available, listened and gavevaluable feedback, support and technical suggestions which aided in the devel-opment of Mind the Sheep!.
Of course I like to thank the members of my graduation committee, MannesPoel, Anton Nijholt, Job Zwiers, Hayrettin Gurkok and Danny Plass-Oude Boswho have supported me during my master thesis. I had regular meetings withthree of them and I would like to thank them in particular. Hayrettin Gurkok,I lost count of how many times I dropped by your office, but after each meetingI left with a renewed sense of motivation. If it were for advice, input or justto talk, you always made time. I enjoyed our discussions and I’m grateful forthe opportunity to assist in your research. Danny Plass-Oude Bos, your criticalquestions and remarks have definitely increased the quality of my research andthesis. Beside our meetings we also went to Researchers’ Night to give demon-strations. I remember you had a deadline that same day. I still don’t know howyou pulled off giving the demonstration, participate in social events and at thesame time finish the paper before the deadline. I do know you were so dedicatedthat you wouldn’t stop until they turned off the wireless network and kicked usout of the building. Mannes Poel, I’m aware that I sometimes wandered off orwanted to do too much, you made sure that I stayed close the core of my masterthesis.
I was also given the opportunity to turn my research into a paper for a conferenceand I would like to thank Anton Nijholt for giving me the opportunity to presentthe paper myself.
Furthermore I’d like to thank Michel Obbink, for the discussions on both ourworks, his cooperation and valuable input. I’m glad we became good friends.Boris Reuderink who inspired me to choose brain-computer interfaces as myresearch topic and who was available for technical questions, Christian Muhl forhis input on the human aspect of brain-computer interfaces and Jorian Blomand Dick Meijer for their input on statistical analysis.
Last but not least, I’d like to thank my friends and family for providing distrac-tion and relaxation in many ways such as playing games, making sushi, playingsports, watching movies or series, day trips and barbecues. Even when thingsdid not go as planned, you kept me going and cheerful.
ii

Contents
I Define 1
1 Introduction 21.1 Background . . . . . . . . . . . . . . . . . . . . . . . . . . . . . . 21.2 Motivation . . . . . . . . . . . . . . . . . . . . . . . . . . . . . . 21.3 Objectives . . . . . . . . . . . . . . . . . . . . . . . . . . . . . . . 31.4 Research Question . . . . . . . . . . . . . . . . . . . . . . . . . . 31.5 Hypotheses . . . . . . . . . . . . . . . . . . . . . . . . . . . . . . 31.6 Outline . . . . . . . . . . . . . . . . . . . . . . . . . . . . . . . . 3
2 Brain-Computer Interfaces 52.1 What Are They? . . . . . . . . . . . . . . . . . . . . . . . . . . . 52.2 BCIs for Selections . . . . . . . . . . . . . . . . . . . . . . . . . . 6
2.2.1 P300 . . . . . . . . . . . . . . . . . . . . . . . . . . . . . . 62.2.2 Steady-state Visually Evoked Potential . . . . . . . . . . 6
2.3 BCIs in Games . . . . . . . . . . . . . . . . . . . . . . . . . . . . 6
3 Experiencing Games 93.1 Immersion . . . . . . . . . . . . . . . . . . . . . . . . . . . . . . . 93.2 Affect . . . . . . . . . . . . . . . . . . . . . . . . . . . . . . . . . 103.3 Flow . . . . . . . . . . . . . . . . . . . . . . . . . . . . . . . . . . 113.4 Game Experience and BCIs . . . . . . . . . . . . . . . . . . . . . 12
II Research 13
4 Method 144.1 Approach . . . . . . . . . . . . . . . . . . . . . . . . . . . . . . . 144.2 The Game: Mind the Sheep! . . . . . . . . . . . . . . . . . . . . 144.3 Selection Methods . . . . . . . . . . . . . . . . . . . . . . . . . . 15
4.3.1 P300 selection . . . . . . . . . . . . . . . . . . . . . . . . 164.3.2 SSVEP selection . . . . . . . . . . . . . . . . . . . . . . . 164.3.3 Non-BCI selection . . . . . . . . . . . . . . . . . . . . . . 16
4.4 Questionnaires . . . . . . . . . . . . . . . . . . . . . . . . . . . . 174.5 Analysis . . . . . . . . . . . . . . . . . . . . . . . . . . . . . . . . 17
5 Experiment 195.1 Participants . . . . . . . . . . . . . . . . . . . . . . . . . . . . . . 195.2 Procedure . . . . . . . . . . . . . . . . . . . . . . . . . . . . . . . 19
iii

5.3 Detecting BCI Selections . . . . . . . . . . . . . . . . . . . . . . . 215.3.1 P300 . . . . . . . . . . . . . . . . . . . . . . . . . . . . . . 215.3.2 Steady-state Visually Evoked Potential . . . . . . . . . . 21
III Report 22
6 Results 236.1 Immersion . . . . . . . . . . . . . . . . . . . . . . . . . . . . . . . 236.2 Affect . . . . . . . . . . . . . . . . . . . . . . . . . . . . . . . . . 246.3 Game Statistics . . . . . . . . . . . . . . . . . . . . . . . . . . . . 25
7 Discussion 267.1 Immersion . . . . . . . . . . . . . . . . . . . . . . . . . . . . . . . 267.2 Affect . . . . . . . . . . . . . . . . . . . . . . . . . . . . . . . . . 277.3 Game Statistics . . . . . . . . . . . . . . . . . . . . . . . . . . . . 27
8 Conclusion 29
IV Appendices 35
A Acronyms used in thesis 36
B Determining SSVEP parameters 38B.1 Experiment Setup . . . . . . . . . . . . . . . . . . . . . . . . . . 39B.2 SSVEP Classifier . . . . . . . . . . . . . . . . . . . . . . . . . . . 39B.3 Stimulus Size . . . . . . . . . . . . . . . . . . . . . . . . . . . . . 40B.4 Stimulus Frequencies . . . . . . . . . . . . . . . . . . . . . . . . . 41
C Detailed Experiment Protocol 44
D Experiment Information for Participants 46
E Participant Consent Form 49
F Participant Demographic Information Questionnaire 52
G Participant self-assessment manikin (SAM) Questionnaire 55
H Participant Immersion Questionnaire 58
I INTERACT 2011 Conference Paper 61
iv

List of Figures
2.1 Block diagram of a BCI system . . . . . . . . . . . . . . . . . . . 52.2 Jay Lauf and Buzz Aldring playing Brainball (a). In-game avatar
changes based on player’s stress level in AlphaWoW (b) . . . . . 72.3 A screenshot of MindBalance (a). Subject playing Bacteria Hunt
(b). . . . . . . . . . . . . . . . . . . . . . . . . . . . . . . . . . . . 7
3.1 Levels of involvement with their barriers . . . . . . . . . . . . . . 103.2 Emotions in the valance and arousal space . . . . . . . . . . . . . 113.3 Flow as a dynamic balance between challenge and skills . . . . . 11
4.1 Screenshot of Mind the Sheep! . . . . . . . . . . . . . . . . . . . 154.2 Screenshot of the selection methods when active . . . . . . . . . 15
5.1 Participant playing Mind the Sheep! . . . . . . . . . . . . . . . . 20
B.1 Screen layout of the monitor during the pre-experiment study . . 39
v

List of Tables
6.1 Scores of the five immersion factors and total immersion, averagedover participants. Values are represented as µ(σ) with highestvalues marked grey. A significant difference (p < 0.05) or trend(p < 0.10) depending on the used selection method is indicatedwith ∗ or † respectively. . . . . . . . . . . . . . . . . . . . . . . . 23
6.2 Average SAM scores, the values are represented as µ(σ) withhighest values marked grey. . . . . . . . . . . . . . . . . . . . . . 24
6.3 Average number of selections per minute, average selection du-ration (in seconds) and normalised game duration. All presentedas µ(σ) with highest values marked grey. A significant difference(p < 0.05) depending on the used selection method is indicatedby ∗. . . . . . . . . . . . . . . . . . . . . . . . . . . . . . . . . . . 25
B.1 Average recall and precision for power spectral density analysis(PSDA) based classification . . . . . . . . . . . . . . . . . . . . . 41
B.2 Average recall and precision for canonical correlation analysis(CCA) based classification . . . . . . . . . . . . . . . . . . . . . . 41
B.3 Average recall and precision for stimuli with size of 2 centimeter 41B.4 Average recall and precision for stimuli with size of 3 centimeter 41B.5 Average recall and precision for each combination . . . . . . . . . 43
vi

Part I
Define
1

Chapter 1
Introduction
1.1 Background
A brain-computer interface (BCI) can be described as a direct communicationlink between the brain and the machine. In a BCI system, signals from the brainare analyzed to determine the user’s state of mind or intentions. In order to dothis, BCIs rely on the presence of distinctive brain-signals which in turn can betranslated into actions [38]. BCI systems have been applied for medical use tohelp disabled users by giving back mobility [13] and breaking the isolation ofpeople with physiological disorders [11, 16].
As successful applications of BCIs make their appearance in the news andcommercial BCI input devices become publicly available, BCIs find their wayinto recreational use. However, as the scope of BCI applications is extendingfrom medical to recreational use, the expectations for BCIs are also changing.Currently they are unable to meet the high performance and accuracy of ex-isting input modalities such as mouse and keyboard, and are therefore unfit asreplacement. Instead they should be seen as separate modalities which can beused beside, or in combination with, existing input modalities [26].
1.2 Motivation
A common method to assess BCIs is by expressing their performance in bitsper minute, which can be calculated by using the mean classification accuracyand the number of available classes [40]. Although this gives meaningful detailson the information transfer rate (ITR) of a BCI, other factors may be justas important when applying BCIs for recreational use. Where increasing theperformance and ITR of BCIs has always been an important goal for medicalstudies, how BCIs are applied as modalities and the influence they have on theuser experience becomes more and more important when they are applied forrecreational use.
However, whether BCIs are suitable for recreational applications is as yetunclear as BCIs have rarely been evaluated for user experience. They may turnout to be valuable additions for recreational applications such as games whichare developed to be challenging and enjoyable. As gamers love working withnew technologies, are capable of adapting quickly to a new environment and
2

are used to the concept that games have to be mastered [25], they will be moreindulgent towards BCI modalities and the inaccuracy of BCIs can even becomea challenging factor.
1.3 Objectives
The purpose of this study is to evaluate two BCIs for user experience in theterms of immersion and affect. As making selections is an important aspect inmany applications and BCIs can be used to make selections, two distinct BCIselection methods will be used in this study. Together with a comparable non-BCI selection method they will be integrated into a computer game to determineif they can enhance user experience. The BCI selection methods will be usedas a primary control and are based on P300 and SSVEP which will be furtherexplained in Chapter 2.
The selection methods will be used in parallel with, instead of replacing an,existing modality to make the interface more interesting and engaging. Theresults and setup of the study will be presented in this thesis.
1.4 Research Question
The question that arises is whether a BCI can enrich the user experience in termsof immersion and affect, furthermore, is there a difference between differenttypes of BCIs in terms of immersion and affect.
1.5 Hypotheses
As there are no intermediate actions required while using a BCI, it lets usersengage with an environment on a different level. However, this does not mean itenriches the user experience. For this the BCIs need not only to be engaging butalso enjoyable, have a nice flow and be user friendly. As SSVEP is found to beannoying, especially at low frequencies [22], it is expected that it will not matchthese requirements and possibly even deprive user experience. A BCI based onP300 is less pronounced and therefore expected to enhance user experience interms of immersion and affect.
1.6 Outline
This thesis is divided into three main parts, Define, Research and Report.
Define is the first part and it will set the context of this thesis by provid-ing related work. What are brain-computer interfaces, how can they be usedand how are they applied within games. Readers who are familiar with BCIs,SSVEP and P300 can skip Chapter 2. Related work on user experience willbe described in Chapter 3 which will provide more information on immersion,affect and flow and how they can be influenced by input modalities.
Research is the second part of the thesis and it will describe the approach
3

used to answer to the research question, the game, the selection methods andthe experimental setup in more detail.
Report is the final part and it will start with the results obtained from theexperiments. In Chapter 7 the results are discussed to see whether they wereexpected and what they imply. In the conclusion, Chapter 8, the thesis is sum-marized, conclusions are drawn and lessons learned are described.
4

Chapter 2
Brain-Computer Interfaces
2.1 What Are They?
A BCI can be described as a communication link between brain and machine.In a BCI system, signals from the brain are being analyzed to determine theuser’s state of mind or intentions, which in turn can be translated into actions[38]. A diagram of a BCI system can be seen in Figure 2.1. BCI systems havebeen applied for medical use to help disabled people by giving back mobility[13] and breaking the isolation of people with physiological disorders [11, 16].For the signal acquisition there are many different measurement methods suchas electroencephalography (EEG), magnetoencephalography (MEG), functionalmagnetic resonance imaging (fMRI) or near-infrared spectroscopy (NIRS). Allof them are non-invasive methods requiring no surgical procedures. Especiallyin the area of healthy user BCIs research, EEG measurements have become verypopular as its relatively cheap and has a high temporal resolution [38].
Figure 2.1: Block diagram of a BCI system including acquisition, processingand deployment, based on [36].
5

To determine a user’s state of mind or intentions BCIs rely on the presence ofdistinctive brain signals. One of the most frequently used brain signals in EEG-based BCI systems are event-related potentials (ERPs) which are responses ofthe brain that are the direct result of an external or internal event. These ERPusually occur when the brain is exposed to any kind of visual, somatosensory oraural stimulus, mental activity, or when omitting a stimulus that was repeatedlyoccurring. Two brain signals, which have both been used in medical applicationsto facilitate making selections, are P300 and SSVEP.
2.2 BCIs for Selections
2.2.1 P300
One of the most used ERPs is the P300 which can be triggered by rarely oc-curring, or significant stimuli. The P300 response appears roughly 300 ms afterstimulus presentation as a positive peak in the user’s brain signals. Althoughthe P300 can be measured throughout the brain, it is most profound at the pari-etal region of the scalp [16]. The unpredictability of the stimulus has a strongeffect on the P300 and the oddball paradigm is frequently used to increase itsamplitude. By mixing low probability targets with high probability non-targets,the unpredictability of a target increases, thereby increasing the P300 amplitude[2]. By determining the difference between target and non-target stimulationresponses, P300 can be used to make selections. This functionality is used inthe P300 speller applications [11].
2.2.2 Steady-state Visually Evoked Potential
Another member of the ERP family is steady-state visually evoked potential(SSVEP) [2]. In most cases SSVEPs are triggered by presenting a modulatedvisual stimulus with a periodic signal, usually at frequencies above 5 Hz, to auser. The periodic signal of the stimulus can then be traced back in the measuredbrain signals which are mostly recorded from the occipital region of the scalp[35]. The power of an SSVEP only covers a narrow bandwidth matching thatof the stimulus [21]. This makes them relatively easy to detect, which is whythe BCI selection method used in this study was based on SSVEP.
2.3 BCIs in Games
A study by Reuderink [32] summarizes BCI games that were present at thattime. Based on the used BCI paradigms, the BCI games were divided intothree groups, feedback games, ERP games and imagined movement games.Most feedback games apply the concept of relaxation as modality, where theplayer’s state of relaxation influences the game. Two examples are Brainball[15], where a steel ball moves away from the most relaxed player, Figure 2.2(a),and AlphaWoW [30] where the player’s stress level controls the shape of anin-game avatar, see Figure 2.2(b). Although AlphaWoW did not yet exist dur-ing Reuderink’s summary it is mentioned here as the BCI is applied in a multimodal setting instead of replacing an existing modality like mouse or keyboard.
6

(a) (b)
Figure 2.2: Jay Lauf and Buzz Aldring playing Brainball2(a). In-game avatarchanges based on player’s stress level in AlphaWoW (b).
The ERP games apply the concept of brain responses that are the directresult to a stimuli. Two of these responses are P300 and SSVEP which aredescribed in Section 2.2. An example using P300 is a study by Bayliss [1] whereparticipants could interact with a number of objects (e.g. a lamp, a televisionset) and turn them on or off. The P300 responses were used to determinewith which object a participant wished to interact and an action was performedaccordingly (e.g. turning on the television set). The SSVEP paradigm is oftenapplied as selection method, for example in the game MindBalance [18], seeFigure 2.3(a). Participants had to balance an avatar on a cord by focusing on oneof two checkerboards which flickered at different frequencies (to elicit a SSVEP).Another example where SSVEP is applied, is Bacteria Hunt [23], where playershad to control an amoeba and hunt down as many bacteria as possible, see Figure2.3(b). Although Bacteria Hunt does not appear in Reuderink’s summary (asit was developed later), it is worth mentioning as it is a multi modal, multiparadigm BCI game. Players steer the amoeba with a keyboard and as theybecome more stressed, steering the amoeba becomes more difficult. At the sametime, eating bacteria is done by focusing on a SSVEP stimulus.
(a) (b)
Figure 2.3: A screenshot of MindBalance (a). Subject playing Bacteria Hunt(b).
The last group defined by Reuderink use the concept of motor activity. Incase movement is imagined or performed, distinct brain signals are generatedand can in turn be detected. A major advantage of BCI system relying on motor
2Picture by Dave Bullock (http://eecue.com)
7

activity it that they do not depend on stimuli presentation and can thereforebe controlled solely from the brain. An example is a virtual meeting room inwhich users could explore the room by imagining left or right hand movementsthereby rotating the view.
Most of the games reported in Reuderink’s summary replace an existinginput modalitiy (e.g. mouse or keyboard) with a BCI and were evaluated interms of bits per minute. Although this gives meaningful details on the ITR ofa BCI applied in a specific context, other factors such as immersion, flow andaffect may be important when applying BCIs in games.
8
Chapter 3
Experiencing Games
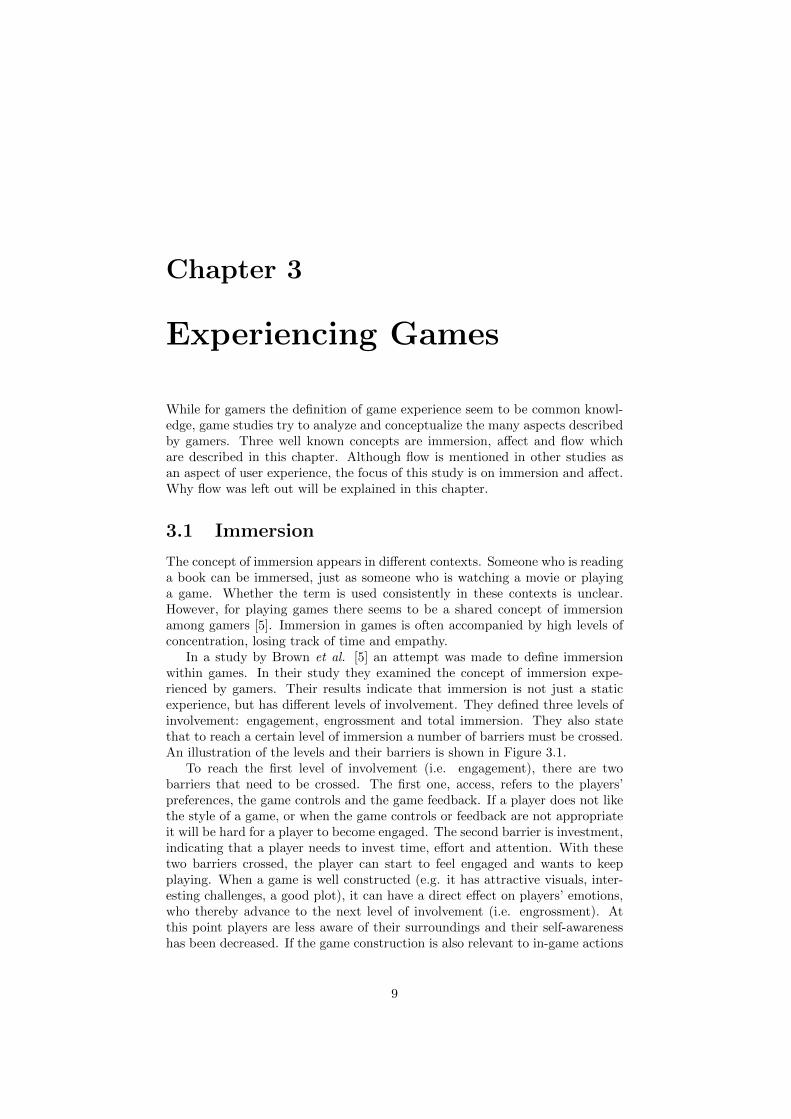
While for gamers the definition of game experience seem to be common knowl-edge, game studies try to analyze and conceptualize the many aspects describedby gamers. Three well known concepts are immersion, affect and flow whichare described in this chapter. Although flow is mentioned in other studies asan aspect of user experience, the focus of this study is on immersion and affect.Why flow was left out will be explained in this chapter.
3.1 Immersion
The concept of immersion appears in different contexts. Someone who is readinga book can be immersed, just as someone who is watching a movie or playinga game. Whether the term is used consistently in these contexts is unclear.However, for playing games there seems to be a shared concept of immersionamong gamers [5]. Immersion in games is often accompanied by high levels ofconcentration, losing track of time and empathy.
In a study by Brown et al. [5] an attempt was made to define immersionwithin games. In their study they examined the concept of immersion expe-rienced by gamers. Their results indicate that immersion is not just a staticexperience, but has different levels of involvement. They defined three levels ofinvolvement: engagement, engrossment and total immersion. They also statethat to reach a certain level of immersion a number of barriers must be crossed.An illustration of the levels and their barriers is shown in Figure 3.1.
To reach the first level of involvement (i.e. engagement), there are twobarriers that need to be crossed. The first one, access, refers to the players’preferences, the game controls and the game feedback. If a player does not likethe style of a game, or when the game controls or feedback are not appropriateit will be hard for a player to become engaged. The second barrier is investment,indicating that a player needs to invest time, effort and attention. With thesetwo barriers crossed, the player can start to feel engaged and wants to keepplaying. When a game is well constructed (e.g. it has attractive visuals, inter-esting challenges, a good plot), it can have a direct effect on players’ emotions,who thereby advance to the next level of involvement (i.e. engrossment). Atthis point players are less aware of their surroundings and their self-awarenesshas been decreased. If the game construction is also relevant to in-game actions
9

Engrossment
Engagement
Total immersion
Game construction
AtmosphereEmpathy
InvestmentAccess
Figure 3.1: Levels of involvement with their barriers as defined by Brown et al.[5].
and location, this gives players the opportunity to become fully immersed asthey need to invest more attention to the created atmosphere. Besides atmo-sphere the last barrier which needs to be crossed to reach the final level, totalimmersion, is empathy. Although it is not necessary for players to empathisewith the in-game situation, they can feel attached to in-game characters.
Some of the aforementioned barriers are related to human characteristics,such as personal preferences, empathy and the will to invest time and attention.Others are related to the construction of the game such as the graphics, a plotand atmosphere. However, to reach a state of total immersion an importantbarrier to take is related to the controls. Through them gamers translate theirintentions into in-game actions [28] and controls should become virtually invis-ible to the gamer. As intentions originate from the brain, users first need totranslate their intentions into real world actions to handle the controls. Even ifthese real world actions become virtually invisible for the user, they still need tobe performed. Using a BCI to detect intentions may allow them to be translateddirectly into in-game actions, making the real world actions redundant.
In a study by Jennett et al. [17] immersion in games was further investigated.They identified five factors of immersion: cognitive involvement, real worlddissociation, emotional involvement, challenge and control. They also developeda questionnaire to measure the total immersion and its factors. As in the studyof Brown et al., some factors were related to human characteristics (cognitiveinvolvement, real world dissociation and emotional involvement) and others wererelated to the construction of the game (challenge and control).
3.2 Affect
Affect can be referred to as experiencing emotions and has some overlap withimmersion [17]. It has a large impact on how well users are able to perform tasksand how they respond to possible usability problems. According to Norman[27], a more positive affect causes users to be more indulgent towards minorusability problems. Although there are many dimensions associated with affect,according to Picard [29] the three most commonly used dimensions of emotionare valence, arousal and dominance. Picard also states that the valence and
10

arousal dimensions are critical in recreational applications.
Arousal
Valence
glad
happy
delighted
pleased
excited
contented
relaxed
calm
sad
depressed
bored
tired
alarmed
angry
frustrated
stressed
Figure 3.2: Emotions in the valance and arousal space
Bradley et al. [4] developed a questionnaire, the self-assessment manikin(SAM), to measure emotional responses in these three dimensions. In Fig. 3.2some emotions associated with valence and arousal can be seen. Integrating theselection methods into an enjoyable, challenging and task oriented environment,such as a game, should result in a more positive affect in terms of valenceand arousal which will aid users to overcome the inaccuracy of the selectionmethods.
3.3 Flow
Flow is a concept with which many gamers are all too familiar with and itcan be described as a state of consciousness in which users achieve a dynamicbalance between challenge and skills [6]. The concept of flow is applicable tovarious fields and Csikszentmihalyi did extensive research on the topic of flow,which according to him could lead towards an optimal experience. In his stud-ies he found that flow was often associated with one or more of the followingeight components, high levels of concentration, losing track of time, merging ac-tion and awareness, loss of self-consciousness, direct feedback, balance betweenchallenge and skills, sense of control and clear goals [9].
Flow
Arousal
Apathy
Worry
Anxiety
Control
RelaxationBoredomC
hallenge
Skills
Figure 3.3: Flow as a dynamic balance between challenge and skills [9].
11
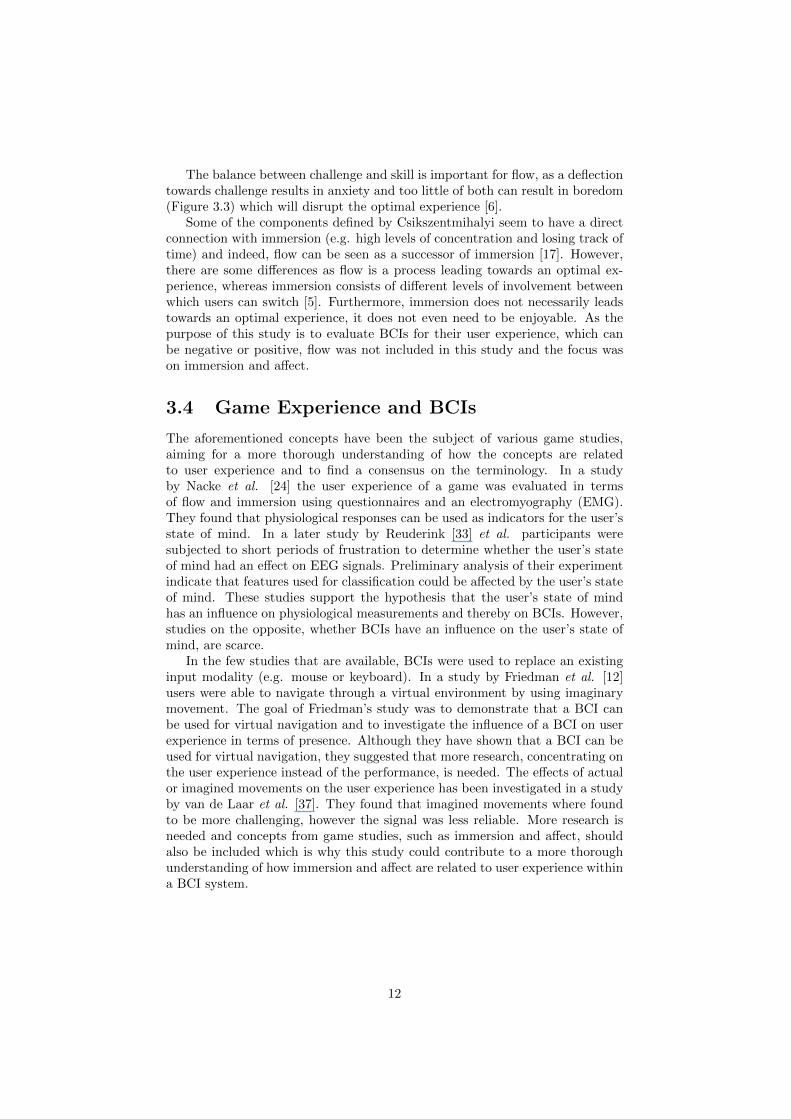
The balance between challenge and skill is important for flow, as a deflectiontowards challenge results in anxiety and too little of both can result in boredom(Figure 3.3) which will disrupt the optimal experience [6].
Some of the components defined by Csikszentmihalyi seem to have a directconnection with immersion (e.g. high levels of concentration and losing track oftime) and indeed, flow can be seen as a successor of immersion [17]. However,there are some differences as flow is a process leading towards an optimal ex-perience, whereas immersion consists of different levels of involvement betweenwhich users can switch [5]. Furthermore, immersion does not necessarily leadstowards an optimal experience, it does not even need to be enjoyable. As thepurpose of this study is to evaluate BCIs for their user experience, which canbe negative or positive, flow was not included in this study and the focus wason immersion and affect.
3.4 Game Experience and BCIs
The aforementioned concepts have been the subject of various game studies,aiming for a more thorough understanding of how the concepts are relatedto user experience and to find a consensus on the terminology. In a studyby Nacke et al. [24] the user experience of a game was evaluated in termsof flow and immersion using questionnaires and an electromyography (EMG).They found that physiological responses can be used as indicators for the user’sstate of mind. In a later study by Reuderink [33] et al. participants weresubjected to short periods of frustration to determine whether the user’s stateof mind had an effect on EEG signals. Preliminary analysis of their experimentindicate that features used for classification could be affected by the user’s stateof mind. These studies support the hypothesis that the user’s state of mindhas an influence on physiological measurements and thereby on BCIs. However,studies on the opposite, whether BCIs have an influence on the user’s state ofmind, are scarce.
In the few studies that are available, BCIs were used to replace an existinginput modality (e.g. mouse or keyboard). In a study by Friedman et al. [12]users were able to navigate through a virtual environment by using imaginarymovement. The goal of Friedman’s study was to demonstrate that a BCI canbe used for virtual navigation and to investigate the influence of a BCI on userexperience in terms of presence. Although they have shown that a BCI can beused for virtual navigation, they suggested that more research, concentrating onthe user experience instead of the performance, is needed. The effects of actualor imagined movements on the user experience has been investigated in a studyby van de Laar et al. [37]. They found that imagined movements where foundto be more challenging, however the signal was less reliable. More research isneeded and concepts from game studies, such as immersion and affect, shouldalso be included which is why this study could contribute to a more thoroughunderstanding of how immersion and affect are related to user experience withina BCI system.
12

Part II
Research
13

Chapter 4
Method
4.1 Approach
To determine whether BCI selection methods can enrich the user experience,two BCI selection methods were assessed in terms of immersion and affect usingstandard questionnaires. The results were compared against a non-BCI selectionmethod. All selection methods needed to be alike and comparable. As theselection methods were compared based on their user experience a measurablelevel of enjoyment was needed in the environment. Since games are developedfor being both challenging and enjoyable a simple game would be a perfectground for the environment. Gamers love working with new technologies, arecapable of adapting quickly to a new environment and are used to the conceptthat games have to be mastered [25]. Therefore a simple game was developed togive the players an enjoyable challenge in which the BCI and non-BCI selectionmethod can be integrated.
4.2 The Game: Mind the Sheep!
Mind the Sheep! consists of a playground representing a meadow on which afew obstacles, such as fences, gates or trees, are placed. There are three dogs inthe playground which are controlled by the player. Depending on the objectivesof a specific level, the playground can be populated with a number of sheep orcollectibles. A screenshot of the game can be seen in Fig. 4.1 with ten whitesheep and three black dogs. The goal of the game is to gather all sheep into apen or gather all collectibles as quickly as possible using the three dogs. Playerscan use one of the selection methods to select one of the three dogs.
To move a dog, players point at any location on the playground with themouse and start the current selection method by pressing the left mouse button.As long as they hold down the mouse button the selection method continues tobe operative thereby increasing the accuracy of the selection method. Releasingthe mouse button stops the selection method and one of the dogs is moved to thelocation indicated by the player. When players indicate a position unreachablefor the dog, the instruction is ignored. As the accuracy of the selection methodsincrease over time, there is a trade-off between accuracy and speed. It alsorequires users to multi-task as they need to concentrate on a dog and keep an
14

Figure 4.1: Screenshot of Mind the Sheep! with three black dogs and ten whitesheep. The pen is located in the center.
eye on the sheep at the same time.The dogs use a simple A* search based path finding algorithm to move to
a specific location on the map. By default, sheep will walk around and grazerandomly. However, when a dog approaches, they will tend to flock and moveaway from the dog allowing them to be herded in a desired direction. Theflocking behavior is introduced by using the boids algorithm [34]. By positioningthe dogs at strategic locations on the map a flock of sheep can be directed intothe pen.
4.3 Selection Methods
The BCI and non-BCI selection methods were integrated into Mind the Sheep!.However, as players would not want to continuously make selections, they wereable to start and stop the selection methods thereby controlling the presenceof the stimuli for the BCI selection methods. An illustration of the selectionmethods when active can be seen in Figure 4.2.
(a) (b) (c)
Figure 4.2: Screenshot of the selection methods when active, with P300, SSVEPand non-BCI selection in (a), (b) and (c) respectively.
15

4.3.1 P300 selection
To extend Mind the Sheep! with a selection method based on P300, dogs werehighlighted for 100 ms with circles in a random order (to elicit a P300 response)while the selection method was operational. As long as a player held the mousebutton pressed, EEG data was collected. When the mouse button was released,the collected data was analysed and a selection was made. As players were ableto select one out of three dogs, the target stimulus would occur with a probabilityof 0.3. As higher target probabilities result in lower P300 amplitudes [10], threeinvisible targets were added to ensure a target probability of 0.16, equal to thespeller application used in work of Hoffmann et al. [16].
For the P300 selection method some parameters needed to be determined,such as the inter-stimulus interval (ISI), the size of the stimuli and the clas-sifier. In a study conducted by Farwell et al. [11], two different ISIs (125 msand 500 ms) and four classifiers (covariance, SWDA, peak picking and areameasurement) were compared. As multiple target stimulations result in higherclassification accuracies and a shorter ISI did not interfere with eliciting a P300response, an ISI of 100 ms was used. The classifiers based on covariance andstepwise linear discriminant analysis (SWDA) require training and the classi-fiers based on peak picking is less accurate with a shorter ISI, which is why areameasurement was used to detect P300 responses. To be consistent with theother selection methods the size of the P300 stimuli was set to 3 centimeters.
4.3.2 SSVEP selection
For the SSVEP-based BCI selection method, dogs were replaced with circlesflickering at different frequencies while the selection method was operational.EEG data was collected as long as the player held the mouse button pressed.Upon releasing the mouse button, the collected data was analysed and a selectionwas made.
For the SSVEP selection method some parameters needed to be determined,such as the frequencies to use, the size of the stimuli and the classifier. For thisa small pre-experiment study with 7 participants was conducted. A completeoverview of the setup and results of the pre-experiment study can be found inAppendix B.
Based on the results of the pre-experiment study a canonical correlationanalysis (CCA) based classifier was selected as its overall performance was bet-ter, had lower inter-subject variability and a better signal-to-noise ratio (SNR).For the frequency set, 7.5 Hz, 8.57 Hz and 12 Hz had the best performance.However, participants noticed differences in stimulus frequencies which couldlead to a preference towards one of the three dogs based on its classification ac-curacy. Therefore, a frequency set with higher frequencies was chosen, namely10 Hz, 12 Hz and 15 Hz, making it harder to distinguish them. Based on thepre-experiment study the size of the stimuli was set to 3 centimeters.
4.3.3 Non-BCI selection
The BCI selection method introduces a challenge factor when a selection isbeing made as users need to concentrate on a stimulus to make an accurateselection. The main challenge is to gather enough data to be able to make a
16

good detection, which is directly related to the time the selection method isoperative. Although it would be much easier for users to make a selection bypointing and clicking with a mouse, this would offer little challenge and givethe non-BCI selection method a great advantage when compared with the BCIselection method. To pose a similar challenge in the non-BCI selection method,it was modelled to be similar to the BCI selection method in terms of the timerequired for an accurate selection.
Similar to the BCI selection method users were able to start and stop thenon-BCI selection method. When operative, the dogs were highlighted one at atime with an increasing highlight period. The diameter of the stimuli was keptthe same as in the BCI selection method, 3 centimeters. When users stoppedthe selection method, the current highlighted dog was selected.
To make an accurate selection, users had to react in time when the dog theywanted to select was highlighted. With a highlight period of 250 ms users shouldhave enough time to react as this is close to the average human reaction time[19]. The highlight period should reach 250 ms only by the time that is equalto the time needed to make a selection using the BCI selection method, whichis around 2.5 seconds [20]. Therefore, the highlight period started with 100 msand was increased with 5% after every highlight, with a maximum highlightperiod of 500 ms.
4.4 Questionnaires
To measure the affective reaction of players while playing the game, a SAM [4]was used as to measure emotional responses in three dimensions (i.e. valence,arousal and dominance). It was expected that if players became more frustratedby using a selection method, this would result in higher arousal and lower valencescores. The dominance would also be higher if players had the feeling that aselection method was working properly and that they were in control.
The questionnaire by Jennett et al. [17] was used to measure players’ immer-sion. It contains 31 questions and is designed to measure the total immersionas well as five different factors of immersion (cognitive involvement, emotionalinvolvement, real world dissociation, challenge and control). Although valence,arousal and dominance scores would probably differ between selection methodsfor which players have an aversion, this does not necessarily mean players wouldnot become immersed in the game.
Furthermore some game statistics, such as the number of selections, theduration of the selections and the time needed to finish the game were collectedwhile they played the game. Ideally players would use all the dogs as this wouldmake it easier to gather the sheep. The number of times a particular dog wasselected and the time needed to finish the game would be good indications ofhow well a selection method performed for a player.
4.5 Analysis
After the experiments, scores were obtained for the total immersion, the fiveimmersion factors, the SAM questionnaire and the game statistics. The re-sults from the SAM questionnaire were averaged over the three trials to get an
17

average score for the valence, arousal and dominance scales. The number ofselections were normalised to the game duration as to get the number of selec-tions per minute and were averaged over the three trials. The game durationwas normalised to the time limit per trial and was averaged over the three trials.
The averaged results were examined on evident differences. As each partic-ipant used all three selection methods and normally distributed samples couldneither be assumed nor proved, the Friedman test was used to determine if therewere significant differences (p < 0.05) in immersion, affect or game statistics de-pending on the selection method. In case Friedman’s test indicated a significantdifference, post-hoc analysis with the Wilcoxon signed-rank tests was conductedon the different combinations of selection methods to examine where the dif-ferences occurred. For the post-hoc analysis no alpha correction was appliedas it was conducted only to examine where the differences occurred in caseFriedman’s test indicated a significant difference.
Due to differences in the designs of the statistical tests it is possible that theconclusions of Friedman’s test and the post-hoc analysis lead to a contradiction.Should this be the case, all results will be given and a possible explanation ofthe significant difference will be given in the discussion (Chapter 7).
To determine the relationship between immersion and affect, the Pearsonproduct-moment correlation coefficient (PMCC) was obtained for total immer-sion and the valence, arousal and dominance scales.
18

Chapter 5
Experiment
5.1 Participants
Fourteen participants (6 female and 8 male), aged between 17 and 25 (µ =21.14, σ = 2.88) participated in the experiment. All participants except forone had normal or corrected-to-normal vision and described themselves as dailycomputer users. Although eight participants had at least one-time experiencewith EEG, eleven participants had no experience with BCIs. Before the ex-periment, all participants signed an informed consent form and they were paidaccording to institution’s regulations.
5.2 Procedure
Prior to the experiment participants were given a small questionnaire to obtaindemographic information and they had to sign an informed consent form. Theyread the instructions on how to play the game and the setup of the experimentwas explained. The experiment held in this study consisted of three differentsessions. In each session a participant used one of the selection methods (i.e.P300, SSVEP or non-BCI) while playing Mind the Sheep!. Each participantused all three selection methods. However, a counterbalanced measures designwas used to avoid confounding variables such as learning a strategy to play thegame.
Each session was divided into three trials, a familiarity trial, an easy trialand a difficult trial. In the familiarity trial participants could get used to theselection method by selecting and moving the dogs. During this trial, partici-pants had to collect 10 objects which were placed across the playground. Next,in the easy trial, participants had to pen a small flock of 5 sheep using the dogs.During this trial two pens were placed on the playground, one on the left andone on the right of the screen to make the task easier for the participants. Fi-nally, in the difficult trial, participants had to gather 10 sheep, which were morescattered across the playground, into one pen that was placed in the center ofthe playground. After each trial participants were requested to fill in the SAMquestionnaire. At the end of a session participants filled in the questionnaire onimmersion and were given a break of five minutes. A detailed overview of theexperiment’s procedure can be found in Appendix C.
19

The layout of the playgrounds across the trials was kept the same to ensureno playground was more difficult for one of the selection methods. Howeverto ensure that participants did not create an optimal strategy for a specifictrial, the positions of the dogs, collectible objects and sheep were altered forthe different selection methods. To ensure that the experiment would take toolong, a timeout was set for each trial for the participants to finish the levelby collecting all objects or gathering all sheep into a pen. Participants had 3minutes, 5 minutes and 10 minutes for the familiarity, easy and difficult trialsrespectively. Since immersion in games is often accompanied by losing track oftime, the time left was not visible for the participants. Otherwise it could haveinfluenced their perception of the elapsed time.
The game ran on a PC and was connected to a projector1 which was usedto create a more enjoyable environment. The projector was mounted on theceiling and projected the game on a screen approximately 3 meters away froma participant. The sizes of the stimuli were scaled proportionally with theincreased distance to the screen. To make sure the frequencies for the SSVEPbased BCI selection method were correctly presented by the projector they werevalidated with a light sensor. Participants sat on a chair behind a table and byusing the mouse, which was placed on the table, they were able to start andstop the selection methods. The data acquisition ran on a separate PC and sentthe raw EEG data to the game PC. An impression of the setup can be seen inFigure 5.1.
Figure 5.1: Participant playing Mind the Sheep!
1Mitsubishi WD510U, 93.3”, 60Hz, 1360x768
20

5.3 Detecting BCI Selections
To make selections using a BCI selection method, EEG data needs to be recordedand analysed. For this 32 electrodes were placed according to the international10-20 system [31] prior to the experiment. For the EEG data acquisition aBioSemi ActiveTwo system2 was used. The electrodes and analysis which areused are different for each BCI selection method.
5.3.1 P300
During each P300 selection EEG data was used from the electrode located atPz. Before the data was classified a number of preprocessing operations wereapplied to the data based on work of Hoffmann et al [16].
First the EEG data was re-referenced to the common average reference(CAR) [8] of all 32 electrodes after which the data was filtered with a 2nd orderforward-backward Butterworth band-pass with high-pass and low-pass frequen-cies set to 1.0 Hz and 12.0 Hz, respectively. For each target single trails wereextracted, after which the trials were averaged. Trials started at the onset (i.e.at the beginning of the intensification of the stimulus) and ended 1000 ms afterthe stimulus appeared. To reduce the effect of outliers in the data, caused byeye movement, eye blinks or muscle activity, a 80% Winsorisation was appliedto the data where all samples below the 10th percentile were replaced by the10th percentile and all sample above the 90th percentile were replaced by the90th percentile. Finally the samples where scaled linearly to an interval of [−1,1].
For the classification the area measurement based on work of Farwell et al[11] was used, which summarizes the area under the P300 curve within a certainwindow. The window for the P300 ranged from 220 to 500 ms. The target withthe largest area was classified as the target a player was focusing on.
5.3.2 Steady-state Visually Evoked Potential
During each SSVEP selection EEG data was used from eight parietal-occipitalelectrodes (i.e. Pz, P3, P4, PO3, PO4, Oz, O1, O2 ). The EEG data was re-referenced to the CAR of all 32 electrodes, after which the CCA based detectionmethod was used to determine which frequency the participant was focusing on.
Using CCA is a relatively new approach where sets of reference signals areconstructed for each one of the stimulation frequencies. Each set contains thesine and cosine for the first, second and third harmonic of the stimulationfrequency. The re-referenced EEG data and each set with reference signals areused as input for the CCA. CCA tries to find pairs of linear transformationsfor the two sets such that when the transformations are applied the resultingsets have a maximal correlation. The stimulation frequency with the highestmaximum correlation is classified as the frequency the participant was focusingon.
2BioSemi, Amsterdam, The Netherlands
21

Part III
Report
22
Chapter 6
Results
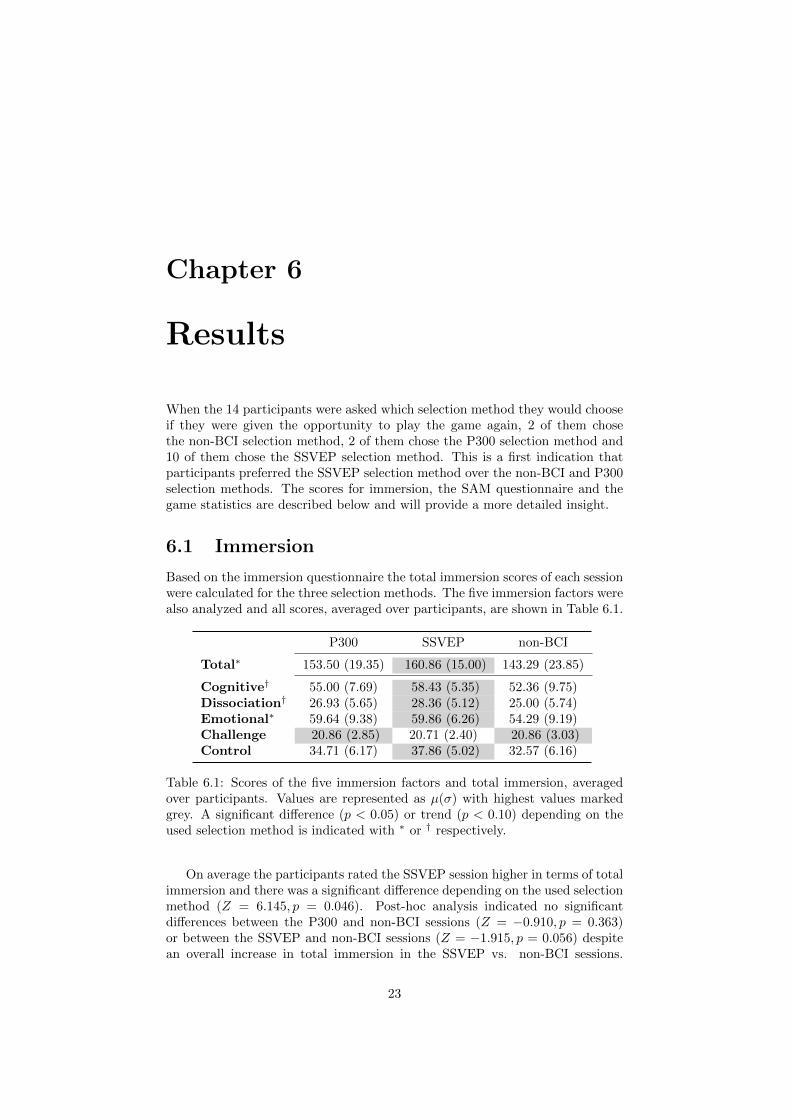
When the 14 participants were asked which selection method they would chooseif they were given the opportunity to play the game again, 2 of them chosethe non-BCI selection method, 2 of them chose the P300 selection method and10 of them chose the SSVEP selection method. This is a first indication thatparticipants preferred the SSVEP selection method over the non-BCI and P300selection methods. The scores for immersion, the SAM questionnaire and thegame statistics are described below and will provide a more detailed insight.
6.1 Immersion
Based on the immersion questionnaire the total immersion scores of each sessionwere calculated for the three selection methods. The five immersion factors werealso analyzed and all scores, averaged over participants, are shown in Table 6.1.
P300 SSVEP non-BCI
Total∗ 153.50 (19.35) 160.86 (15.00) 143.29 (23.85)
Cognitive† 55.00 (7.69) 58.43 (5.35) 52.36 (9.75)Dissociation† 26.93 (5.65) 28.36 (5.12) 25.00 (5.74)Emotional∗ 59.64 (9.38) 59.86 (6.26) 54.29 (9.19)Challenge 20.86 (2.85) 20.71 (2.40) 20.86 (3.03)Control 34.71 (6.17) 37.86 (5.02) 32.57 (6.16)
Table 6.1: Scores of the five immersion factors and total immersion, averagedover participants. Values are represented as µ(σ) with highest values markedgrey. A significant difference (p < 0.05) or trend (p < 0.10) depending on theused selection method is indicated with ∗ or † respectively.
On average the participants rated the SSVEP session higher in terms of totalimmersion and there was a significant difference depending on the used selectionmethod (Z = 6.145, p = 0.046). Post-hoc analysis indicated no significantdifferences between the P300 and non-BCI sessions (Z = −0.910, p = 0.363)or between the SSVEP and non-BCI sessions (Z = −1.915, p = 0.056) despitean overall increase in total immersion in the SSVEP vs. non-BCI sessions.
23

However, there was a significant increase in total immersion in the P300 vs.SSVEP sessions (Z = −2.064, p = 0.039).
The five immersion factors show the same tendency as the total immersion.All immersion factors, except the challenge factor, are rated higher in the SSVEPsession. For the emotional involvement factor there was a significant differencedepending on the used selection method (Z = 6.143, p = 0.046). However, post-hoc analysis could not indicate what caused this significant difference. Therewas no significant difference in the P300 vs. non-BCI sessions (Z = −1.635, p =0.102), nor in the SSVEP vs. non-BCI sessions (Z = −1.696, p = 0.090). Therewas also no significant difference between the P300 and SSVEP sessions (Z =−0.409, p = 0.683).
For the cognitive involvement factor a trend was visible depending on theused selection method (Z = 5.880, p = 0.053). Post-hoc analysis revealed atrend between the SSVEP and non-BCI sessions (Z = −2.122, p = 0.034) andbetween the P300 and SSVEP sessions (Z = −2.081, p = 0.037). There was notrend between the P300 and non-BCI sessions (Z = −0.6299, p = 0.5287).
The used selection method also had an effect on the real world dissociationfactor as a trend was visible (Z = 5.698, p = 0.058). Post-hoc analysis did notreveal a trend between the P300 and non-BCI sessions (Z = −0.770, p = 0.441)or between the P300 and SSVEP sessions (Z = −1.258, p = 0.209). However,there was a trend between the SSVEP and non-BCI sessions (Z = −1.926, p =0.054).
Using a different selection method had no significant effect on the challenge(Z = 0.157, p = 0.925) and control (Z = 3.569, p = 0.168) factors.
6.2 Affect
Based on the SAM questionnaire the total SAM scores were calculated for theselection methods and the average results are shown in Table 6.2.
P300 SSVEP non-BCI
Valence 6.14 (1.32) 7.00 (1.38) 6.26 (1.64)Arousal 4.52 (2.24) 4.40 (2.38) 4.79 (2.40)Dominance 4.93 (1.60) 6.02 (1.69) 5.64 (2.55)
Table 6.2: Average SAM scores, the values are represented as µ(σ) with highestvalues marked grey.
Despite an overall increase in valence in the SSVEP session compared tothe P300 or non-BCI sessions, there was no significant difference dependingon the used selection method for the valence scale (Z = 2.625, p = 0.269).Participants were more aroused in the non-BCI session, however, for the arousalscale there was no significant difference depending on the used selection method(Z = 0.311, p = 0.856). There was an overall increase in dominance in the P300vs. SSVEP sessions, however, no significant difference depending on the usedselection method was found (Z = 3.309, p = 0.191).
24

6.3 Game Statistics
Most participants were able to finish the familiarity and easy trials, regardlessthe selection method, within the given time limit. However, of the 14 partici-pants only 5 were able to finish the difficult trial while using the P300 selectionmethod. Whereas for the SSVEP and non-BCI selection methods respectively13 and 11 participants finished the difficult trial.
The game statistics which were collected during the experiments are shownin Table 6.3, showing the average number of selections per minute, the averageselection duration (in seconds) and the normalised game duration.
P300 SSVEP non-BCI
Selections∗ 8.42 (2.84) 11.54 (3.13) 15.48 (14.32)Selection duration∗ 3.94 (2.02) 2.15 (1.97) 1.85 (1.12)Game duration∗ 0.78 (0.25) 0.50 (0.22) 0.55 (0.27)
Table 6.3: Average number of selections per minute, average selection duration(in seconds) and normalised game duration. All presented as µ(σ) with highestvalues marked grey. A significant difference (p < 0.05) depending on the usedselection method is indicated by ∗.
On average the number of selections per minute was higher in the non-BCIsession and there was a significant difference depending on the used selectionmethod (Z = 14.714, p = 0.0006). Post-hoc analysis indicated no significantdifferences between the SSVEP and non-BCI sessions (Z = −1.726, p = 0.084).However, there was a significant increase in selections per minute in the P300vs. non-BCI sessions (Z = −3.296, p = 0.001) and the P300 vs. SSVEP sessions(Z = −2.417, p = 0.016).
Compared to the SSVEP and non-BCI sessions the average selection du-ration is much higher for the P300 session. There was a significant differ-ence depending on the used selection method for the average selection duration(Z = 16.000, p = 0.0003). Post-hoc analysis revealed a significant difference be-tween the P300 and non-BCI session (Z = −3.296, p = 0.001) and between theP300 and SSVEP session (Z = −2.542, p = 0.01). However, there was no sig-nificant difference in the SSVEP vs. non-BCI sessions (Z = −0.785, p = 0.433).
The game duration shows how much of the available time participants neededto finish a trial, where a score of 1.0 indicates that participants needed allavailable time to finish a trial. On average the game duration was higher in theP300 session and there was a significant difference in game duration dependingon the used selection method (Z = 18.429, p = 0.0001). Post-hoc analysisrevealed a significant difference between the P300 and non-BCI sessions (Z =−3.296, p = 0.001) and between the P300 and SSVEP sessions (Z = −3.233, p =0.001). There was no significant difference between the SSVEP and non-BCIsessions (Z = −1.350, p = 0.177).
25

Chapter 7
Discussion
7.1 Immersion
It was expected that only P300 would enrich the user experience since SSVEPis generally considered as annoying. However, for the immersion it seems thecontrary is true. Most participants indicated that they preferred playing thegame with the SSVEP selection method, which seems to be supported by theresults of the immersion questionnaire. There was a significant increase in totalimmersion between the P300 and SSVEP sessions. This indicates that partici-pants were more immersed using the SSVEP selection method than when usingthe P300 selection method. Furthermore, there was an overall increase in to-tal immersion between the SSVEP and non-BCI sessions. Although this wasnot significant it can be seen as a trend, indicating that the SSVEP selectionmethod could enrich the user experience in terms of immersion.
For the P300 and SSVEP selection methods no physical actions were re-quired, whereas for the non-BCI selection method, participants still had totranslate their intentions into an physical action (i.e. stopping the selectionmethod at the correct time). However, for the P300 selection method, partic-ipants still had to perform a mental action (i.e. count how often a dog washighlighted). This could have interfered with participants becoming fully im-mersed while using the P300 selection method. For the SSVEP selection methodparticipants only had to stare at the dog they wished to select. As participantswere able to translate their intentions directly, without requiring any type ofactions, into in-game actions while using the SSVEP selection method, theymight have become more easily immersed.
Further inspection showed an overall increase for the SSVEP session com-pared to the P300 or non-BCI sessions in four of the five immersion factors. Theaverage scores for the challenge factor are virtually identical for the three ses-sions, indicating that participants did not find the game more challenging usingone of the three selection methods. The used selection method had no signif-icant effect on the challenge factor. To determine if participants experienceddifficulties while using one of the selection methods, the control factor mightbe a better indicator than the challenge factor. Despite an overall reduction inthe control factor for the P300 and non-BCI sessions compared to the SSVEPsession, it was not significant. This would indicate that participants did not
26

experience more (or less) difficulties while using one of the selection methods.However, as there is no ground truth for the accuracy of the selection meth-ods and an overall reduction was observed in the control factor for the P300and non-BCI sessions compared to the SSVEP session, more data could proveotherwise.
Although post-hoc analysis could not indicate what caused the significantdifference for the emotional involvement factor, the average scores for the P300and SSVEP sessions were almost equal, 59.64 and 59.86 respectively. The aver-age score for the non-BCI session was lower (54.29), which could indicate thatSSVEP and P300 together caused the significant difference for the emotionalinvolvement factor. Participants seemed to enjoy making (successful) selectionsusing a BCI, they became more emotionally involved, less aware of their sur-roundings and needed to focus on the game, which was supported by the realworld dissociation and cognitive involvement factors where trends were revealedbetween the SSVEP and non-BCI sessions and the P300 and non-BCI sessions.
7.2 Affect
The used selection method did not seems to have a significant effect on theresults of the SAM questionnaire. However, there was an overall increase invalence between the SSVEP and non-BCI sessions and between the P300 andSSVEP sessions. There was a strong correlation between the total immersionand valence (ρ = 0.68), indicating that being more immersed was also foundmore positively affective. This could have been caused by participants’ feel-ing of control as there was also a strong correlation between total immersionand dominance (ρ = 0.67). In other words, in this case the SSVEP selectionmethod let participants translate their intentions directly into in-game actions,giving them an increased feeling of control leading to a more positively affectiveexperience.
7.3 Game Statistics
It was expected that if a selection method performed well, a participant wouldneed less selections and time to finish the game as all three dogs could be placedstrategically. The used selection method had indeed a significant effect on thenumber of selections per minute as there was a significant reduction in selectionsper minute between the P300 and non-BCI sessions and between the P300 andSSVEP sessions. To deal with the trade-off between accuracy and speed someparticipants developed a strategy, which could explain the significant reductionin number of selection per minute for the P300 selection method comparedto the non-BCI selection method. When they wanted to be accurate in theirselections, they waited long enough to make an accurate selection. However,when they wanted to be quick, they moved all three dogs as one by pressing themouse button rapidly while pointing at a location on the playground. Althoughthis behavior was observed for all three selection methods, for the P300 andSSVEP selection methods participants appeared to switch between precise andquick whenever they wished. For the non-BCI selection method they appearedto prefer only making quick selections.
27

Although participants needed less selections per minute to finish the gamein the P300 session, there was a significant increase in game duration betweenthe P300 and non-BCI sessions and between the P300 and SSVEP sessions,indicating that participants needed more time to finish the game while usingthe P300 selection method. The P300 selection method apparently gave par-ticipants some difficulties as a reduction in both selections and game durationwas expected. The used selection method also had a significant effect on the se-lection duration. There was a significant increase in selection duration betweenthe P300 and non-BCI sessions and between the P300 and SSVEP sessions, in-dicating that participants used more time to make a selection using the P300selection method. As participants understood that an accurate BCI selectiondid require more time, they adjusted the selection duration accordingly. Thisindicated that the P300 selection method did indeed introduce some difficultiesas the game and selections duration increased in the P300 session.
Between the SSVEP and non-BCI sessions there was also an increase in se-lection duration, although not significant. Participants seemed to accept thatfor a good P300 or SSVEP selection they had to wait a couple of seconds. How-ever, for the non-BCI selection method they understood that it was related totheir own reaction speed and suddenly they appeared to be in a hurry. Althoughthe non-BCI selection method was modeled to be similar to the BCI selectionmethods, it might have had an effect on the preference of the participants, asthey did not want to wait to make a selection. The non-BCI selection methoddid introduce the same challenge and required participants to multi-task simi-larly to the P300 and SSVEP selection methods. However, participants seemedto be more indulgent towards the BCI selection methods than towards the non-BCI selection method. This could be caused by the curiosity of participants forthe P300 or SSVEP selection methods or the self overestimation by participantswhile using the non-BCI selection method.
28

Chapter 8
Conclusion
In this study two BCI system were compared to a non-BCI system to evaluatethe user experience in terms of immersion and affect. For the BCI systems,selection methods based on SSVEP and P300 were integrated into a game,introducing a challenge factor. A comparable non-BCI selection method basedon time was also implemented into the game, introducing an equal challenge.Fourteen participants played the game with all selection methods in three levelswith increasing difficulty. They rated each selection method on immersion andaffect.
Based on the results it is evident that in this case SSVEP is capable ofenriching the user experience in terms of immersion and affect. Participantswere significantly more immersed and the SSVEP selection method was foundmore positively affective. Although it was expected that P300 would enrich userexperience, it did not. For users to become totally immersed, a BCI systemfacilitating in making selection should effortlessly submit to the intentions ofthe users and not elicit any disruptions. This is why the SSVEP selectionmethod makes it easier for users to become immersed as they are able to directlytranslate their intentions into in-game actions. A SSVEP selection method onlyrequires users to focus at the target they wish to select. It does not require anyphysical action as with the non-BCI selection method, nor any mental action,as with the P300 selection method.
Furthermore, participants appeared to have more patience when using theBCI selection methods than when using the non-BCI selection method, whichcould have been caused by the curiosity of participants for the BCI selectionmethods or the self overestimation by participants while using the non-BCIselection method.
When a BCI is applied in recreational applications to make selections from asmall set and an important goal is immersion, according to this study a selectionmethod based on SSVEP is recommended. Although P300 is fit to make selec-tions, it introduces disruptions that hinders immersion and thereby positiveaffect. Although future improvements on P300 recognition could reintroduceP300 as a viable option, for now it should be applied differently to enrich userexperience in terms of immersion and affect. For example, in a more subtle wayby detecting whether users noticed that something happened or changed in theenvironment. This could well be a topic for future studies. It would also beinteresting to look at long term effects on immersion and affect. Is the SSVEP
29

selection method still significantly more immersive when participants are usedto it and is the indulgence towards the BCI selection methods permanent or onlytemporary? Given the intended purpose of this research, it would be interest-ing to use commercial BCI input devices (e.g. Emotiv’s EPOC). This requiresa proper study comparing the equipment used in this research and commercialBCIs to determine the differences and if they are feasible to use within the setupof this experiment. Adding a selection method based on pointing and clicking,which was left out of this research, could be added in future studies to deter-mine the cognitive load as the selection methods used in this study requiredparticipants to multi-task. Finally, other (non-)BCI selection methods, such asspeech, gestures or gaze tracking could also prove to increase immersion andaffect and should be investigated in future studies.
30

Bibliography
[1] Bayliss, J. D. Use of the evoked potential P3 component for control in avirtual apartment. IEEE Transactions on Neural Systems and Rehabilita-tion Engineering 11, 2 (2003), 113 – 116.
[2] Beverina, F., Palmas, G., Silvoni, S., Piccione, F., and Giove,S. User adaptive BCIs: SSVEP and P300 based interfaces. PsychNologyJournal 1, 4 (2003), 331–354.
[3] Bin, G., Gao, X., Yan, Z., Hong, B., and ShangkaiGao. An on-line multi-channel SSVEP-based brain–computer interface using a canoni-cal correlation analysis method. Journal of Neural Engineering 6, 4 (2009),046002.
[4] Bradley, M. M., and Lang, P. J. Measuring emotion: The self-assessment manikin and the semantic differential. Journal of BehaviorTherapy and Experimental Psychiatry 25, 1 (1994), 49–59.
[5] Brown, E., and Cairns, P. A grounded investigation of game immersion.In CHI ’04 extended abstracts on Human factors in computing systems(2004), ACM, pp. 1297–1300.
[6] Chen, J. Flow in games (and everything else). Commun. ACM 50, 4(2007), 31–34.
[7] Cheng, M., Gao, X., Gao, S., and Xu, D. Design and implementationof a brain-computer interface with high transfer rates. IEEE Transactionson Biomedical Engineering 49, 10 (2002), 1181–1186.
[8] Cooper, R., Osselton, J., and Shaw, J. EEG technology. Butter-worths, 1969.
[9] Csikszentmihalyi, M. Flow: The Psychology of Optimal Experience.Harper Perennial, New York, 1990.
[10] Duncan-Johnson, C., and Donchin, E. On quantifying surprise:The variation of event-related potentials with subjective probability. Psy-chophysiology 14, 5 (1977), 456–467.
[11] Farwell, L., and Donchin, E. Talking off the top of your head: to-ward a mental prosthesis utilizing event-related brain potentials. Electroen-cephalography and Clinical Neurophysiology 70, 6 (1988), 510–523.
31

[12] Friedman, D., Leeb, R., Guger, C., Steed, A., Pfurtscheller, G.,and Slater, M. Navigating virtual reality by thought: What is it like?Presence: Teleoperators and Virtual Environments 16, 1 (2007), 100–110.
[13] Galan, F., Nuttin, M., Lew, E., Ferrez, P., Vanacker, G.,Philips, J., Van Brussel, H., and Millan, J. An asynchronous andnon-invasive brain-actuated wheelchair. In 13th International Symposiumon Robotics Research (2007).
[14] Hakvoort, G., Reuderink, B., and Obbink, M. Comparison of PSDAand CCA detection methods in a SSVEP-based BCI-system. Technical Re-port TR-CTIT-11-03, Centre for Telematics and Information Technology,University of Twente, 2011.
[15] Hjelm, S. I., and Browall, C. Brainball - using brain activity for coolcompetition. In Proceedings of the First Nordic Conference on Human-Computer Interaction (2000).
[16] Hoffmann, U., Vesin, J., Ebrahimi, T., and Diserens, K. An effi-cient P300-based brain-computer interface for disabled subjects. Journalof Neuroscience Methods 167, 1 (2008), 115–125.
[17] Jennett, C., Cox, A., Cairns, P., Dhoparee, S., Epps, A., Tijs, T.,and Walton, A. Measuring and defining the experience of immersion ingames. International Journal of Human-Computer Studies 66, 9 (2008),641–661.
[18] Lalor, E. C., Kelly, S. P., Finucane, C., Burke, R., Smith, R.,Reilly, R. B., and McDarby, G. Steady-State VEP-Based Brain-Computer Interface Control in an Immersive 3D Gaming Environment.EURASIP Journal on Applied Signal Processing 2005, 19 (2005), 3156 –3164.
[19] Lansing, R., Schwartz, E., and Lindsley, D. Reaction time and EEGactivation under alerted and nonalerted conditions. Journal of Experimen-tal Psychology 58, 1 (1959), 1–7.
[20] Lin, Z., Zhang, C., Wu, W., and Gao, X. Frequency RecognitionBased on Canonical Correlation Analysis for SSVEP-Based BCIs. IEEETransactions on Biomedical Engineering 53, 12 (2006), 2610–2614.
[21] Lopez, M., Pelayo, F., Madrid, E., and Prieto, A. Statisticalcharacterization of steady-state visual evoked potentials and their use inbrain–computer interfaces. Neural Processing Letters 29, 3 (2009), 179–187.
[22] Molina, G. G. Detection of high-frequency steady state visual evoked po-tentials using phase rectified reconstruction. In Eusipco (Lausanne, Switzer-land, Aug. 2008).
[23] Muhl, C., Gurkok, H., Plass-Oude Bos, D., Thurlings, M.,Scherffig, L., Duvinage, M., Elbakyan, A., Kang, S., Poel, M.,and Heylen, D. Bacteria hunt: A multimodal, multiparadigm bci game.In Fifth International Summer Workshop on Multimodal Interfaces (2009),University of Genua.
32

[24] Nacke, L., and Lindley, C. A. Flow and immersion in first-personshooters: measuring the player’s gameplay experience. In Proceedings ofthe 2008 Conference on Future Play: Research, Play, Share (2008), FuturePlay ’08, ACM, pp. 81–88.
[25] Nijholt, A., Plass-Oude Bos, D., and Reuderink, B. Turning short-comings into challenges: Brain-computer interfaces for games. Entertain-ment Computing 1, 2 (2009), 85–94.
[26] Nijholt, A., Tan, D., Allison, B., del R. Milan, J., andGraimann, B. Brain-Computer Interfaces for HCI and Games. In CHI ’08extended abstracts on Human factors in computing systems (2008), ACM,pp. 3925–3928.
[27] Norman, D. Emotion & design: attractive things work better. Interac-tions 9, 4 (2002), 36–42.
[28] Pagulayan, R., Keeker, K., Wixon, D., Romero, R., and Fuller,T. User-centered design in games. In The human-computer interactionhandbook (2002), pp. 883–906.
[29] Picard, R. Affective computing. The MIT press, 2000.
[30] Plass-Oude Bos, D., Reuderink, B., Laar, B., Gurkok, H., Muhl,C., Poel, M., Nijholt, A., and Heylen, D. Brain-computer interfacingand games. In Brain-Computer Interfaces, Human-Computer InteractionSeries. Springer London, 2010, pp. 149–178.
[31] Reilly, E. L. EEG Recording and Operation of the Apparatus. In: Elec-troencephalography: Basic Principles, Clinical Applications and RelatedFields. Lippincott Williams & Wilkins, 1999, pp. 139–160.
[32] Reuderink, B. Games and brain-computer interfaces: The state of theart, 2008.
[33] Reuderink, B., Nijholt, A., and Poel, M. Affective pacman: Afrustrating game for brain-computer interface experiments. In IntelligentTechnologies for Interactive Entertainment, vol. 9 of Lecture Notes of theInstitute for Computer Sciences, Social Informatics and Telecommunica-tions Engineering. Springer, 2009, pp. 221–227.
[34] Reynolds, C. W. Flocks, herds and schools: A distributed behavioralmodel. In SIGGRAPH ’87 Proceedings of the 14th annual conference onComputer graphics and interactive techniques (1987), ACM, pp. 25–34.
[35] Ruen Shan, L., Ibrahim, F., and Moghavvemi, M. Assessment ofSteady-State Visual Evoked Potential for Brain Computer Communication.In 3rd Kuala Lumpur International Conference on Biomedical Engineering2006 (2006), Springer, pp. 352–354.
[36] Thorpe, J., van Oorschot, P. C., and Somayaji, A. Pass-thoughts:authenticating with our minds. In Proceedings of the 2005 workshop onNew security paradigms (2005), NSPW ’05, ACM, pp. 45–56.
33

[37] van de Laar, B., Reuderink, B., Plass-Oude Bos, D., and Heylen,D. Evaluating user experience of actual and imagined movement in BCIgaming. International journal of Gaming and Computer Mediated Simula-tions 2, 4 (2010), 33–47.
[38] van Gerven, M., Farquhar, J., Schaefer, R., Vlek, R., Geuze, J.,Nijholt, A., Ramsey, N., Haselager, P., Vuurpijl, L., Gielen, S.,and Desain, P. The brain–computer interface cycle. Journal of NeuralEngineering 6, 4 (2009), 041001.
[39] Volosyak, I., Cecotti, H., and Graser, A. Impact of Frequency Se-lection on LCD Screens for SSVEP Based Brain-Computer Interfaces. Bio-Inspired Systems: Computational and Ambient Intelligence (2009), 706–713.
[40] Wolpaw, J., Ramoser, H., McFarland, D., and Pfurtscheller, G.EEG-based communication: improved accuracy by response verification.IEEE Transactions on Rehabilitation Engineering 6 (1998), 326–333.
34

Part IV
Appendices
35

Appendix A
Acronyms used in thesis
36

BCI brain-computer interface
EEG electroencephalography
MEG magnetoencephalography
NIRS near-infrared spectroscopy
fMRI functional magnetic resonance imaging
ERP event-related potential
SSVEP steady-state visually evoked potential
ISI inter-stimulus interval
EMG electromyography
CAR common average reference
SNR signal-to-noise ratio
ITR information transfer rate
CCA canonical correlation analysis
PMCC Pearson product-moment correlation coefficient
SWDA stepwise linear discriminant analysis
FFT fast Fourier transform
PSD power spectral density
PSDA power spectral density analysis
SAM self-assessment manikin
37

Appendix B
Determining SSVEPparameters
38

B.1 Experiment Setup
During this experiment participants sat in a comfortable chair at approximately70 cm in front of a LCD monitor1 on which the stimuli were presented. A smallwhite cross was placed at the center of an LCD monitor on a black background(Fig. B.1). During the study participants were exposed to different types oftrials, in which the presented stimulus varied in size and frequency. The detailedsetup of the pre-experiment study was described in [14].
Figure B.1: Screen layout of the monitor during the pre-experiment study
Based on the work of Volosyak et al. [39], 7 different frequencies (6.00 Hz,6.67 Hz, 7.50 Hz, 8.57 Hz, 10.00 Hz, 12.00 Hz and 15.00 Hz) were used. Theirstudy showed that frequencies which are integer factors of the refresh rate ofan LCD monitor are more suitable for presenting stimuli. Using the factor ofthe refresh rate produces a more stable stimulus frequency because only wholeframes are visible on the LCD screen. The diameters of the stimuli were set to2 and 3 centimeters, which is consistent with the work in the literature [7, 20].
In each trial one stimulus, a blinking white circle, appeared at the locationof the cross. Participants had to focus for 4 seconds on the stimulus. Betweentrials, participants had 6 seconds rest to relax their vision. All trials werepresented 25 times and were placed in a random order prior to the experiment.Thus, for each participant, 25 segments of 4 seconds of data were recorded foreach unique trial. The complete experiment lasted 60 minutes and was dividedinto 4 sessions of equal length. Between the sessions, participants could relaxin order to reduce the effect of visual fatigue.
For offline analysis, continuous EEG activity was recorded using a BioSemiActiveTwo system2 with a sampling rate of 512 Hz. Recordings were taken from32 scalp electrodes, placed according to the international 10-20 system [31].
B.2 SSVEP Classifier
One of the most popular and widely used methods to detect the presenceof SSVEPs is power spectral density analysis (PSDA) where a fast Fourier
1Samsung SyncMaster 203B, 20”, 60Hz, 1280x10242BioSemi, Amsterdam, The Netherlands
39

transform (FFT) is used to estimate the power spectral density (PSD) of atime window of the user’s EEG-signal. The magnitude of each stimulation fre-quency can then be used for classification [7]. A relatively new approach is usingCCA where the correlations between the user’s EEG-signal and each stimula-tion frequency can be used for classification. CCA-based detection methodshave some improvements and advantages compared to PSDA-based detectionmethods, such as better SNR, lower inter-subject variability and the possibilityto use harmonic frequencies [3, 20]. To determine which classifier to use, all tri-als in this experiment were classified with a CCA and a PSDA based detectionmethod and the results were compared.
For the PSDA-based detection, EEG data from Oz was filtered with a band-pass filter of 4 - 35 Hz. The data was re-referenced with CAR using all 32electrodes and a FFT was performed every 0.3 seconds with a FFT-size of512 data points. For each of the stimuli frequencies the sum of the extractedmagnitudes of its first and second harmonics were used for classification. Thestimuli frequency with the highest value, which also exceeded two times theaverage magnitude of the FFT, was classified as the presented frequency. Thefirst two classifications of the 4 second stimuli were dropped as they containnon-stimulated data and might influence the performance. The rest of the clas-sifications are used in a majority vote to determine the presented frequency.
For the CCA-based detection, EEG data was acquired from eight differentelectrodes (Pz, P3, P4, PO3, PO4, Oz, O1, O2 ). The acquired EEG data wasre-referenced with CAR [8] using all 32 electrodes. Sets of reference signals wereconstructed for each one of the stimulation frequencies where each set containedthe sine and cosine for the first, second and third harmonic of a stimulationfrequency. The re-referenced EEG data and each set with reference signals wereused as input for the CCA. CCA tries to find pairs of linear transformationsfor the two sets such that when the transformations are applied the resultingsets have a maximal correlation. The stimulation frequency with the highestmaximum correlation was classified as the frequency the participant was focusing[14].
The average recall and precision for each of the 7 frequencies are shown inTables B.1 and B.2. It can be seen that the CCA based detection method hashigher recall and precision values than the PSDA based detection method. AWilcoxon signed-rank test between the average recall values showed that thisdifference is significant (Z = −2.20, p < 0.05). Based on these results a CCAbased detection method was used for determining the size and frequencies andfor the final experiments.
B.3 Stimulus Size
For the game to be controllable the size of the stimuli should be large enough toelicit well detectable SSVEP responses. However, larger stimuli will take up alarger part of the playground and could get in the way of the rest of the game.This means that the stimuli should also not be to large. In experiments heldby Cheng et al. [7] and Lin et al. [20] the size of the stimuli varied between2 and 4 centimeters and were well detectable. During this experiment stimuliwith 2 different sizes were presented to the participants. The size of the stimuliwere set to 2 or 3 centimeters. The recorded EEG activity was classified using
40

Recall Precision
6 72.00 23.916.67 29.71 48.157.5 45.14 42.478.57 48.00 73.6810 61.71 51.4312 27.43 96.0015 17.14 100.00
Table B.1: Average recall andprecision for PSDA based clas-sification
Recall Precision
6 62.29 46.586.67 46.29 61.367.5 65.71 55.028.57 68.57 63.1610 80.00 48.2812 52.00 91.0015 39.43 98.57
Table B.2: Average recall andprecision for CCA based classi-fication
a detection method based on CCA.The average recall and precision for each of the 7 frequencies are shown in
Tables B.3 and B.4. It can be seen that the larger stimuli elicit SSVEP responseswhich result in higher recall and precision values than the smaller stimuli. AWilcoxon signed-rank test between the average recall values showed that thisdifference is significant (Z = −2.37, p < 0.05). Based on these results, for thefinal experiment the size of the stimuli was set to 3 centimeter.
Recall Precision
6 53.14 34.706.67 36.57 46.047.5 50.86 48.638.57 54.60 49.4810 69.14 35.3812 34.29 86.9615 17.71 100.00
Table B.3: Average recall andprecision for stimuli with size of2 centimeter
Recall Precision
6 62.29 46.586.67 46.29 61.367.5 65.71 55.028.57 68.57 63.1610 80.00 48.2812 52.00 91.0015 39.43 98.57
Table B.4: Average recall andprecision for stimuli with size of3 centimeter
B.4 Stimulus Frequencies
Of the 7 different frequencies only three were used in the game, one for each dog.Which frequencies to use was determind by testing each possible combination.The number of combination can be expressed as
(nk
)and can be calculated with(
nk
)= n!
k!(n−k)! . In this case, with n = 7 and k = 3 the number of combinations
is 35. For each combination all relavant epochs were extracted and classifiedusing the CCA-based classifier. The reference signals for the CCA (Y ), onlycontained the reference to the three frequencies available in the combination.
The averaged recall and precision are shown in Table B.5. It can be seenthat set 27 with frequencies 7.5 Hz, 8.57 Hz and 12 Hz has the best performance.Since the number of frames used for this combination, i.e., 8, 7 and 5 are all co-
41

prime to eachother, the first harmonic the frequencies have in common is 60 Hz.For sets with only co-prime based frequencies the harmonics used in the CCAbased detection do not interfer with eachother. Unlike sets where the numberof used frames are not co-primes, such as set 8 where the second harmonic of6 Hz is similar to the first harmonic of 12 Hz. This increases the possiblity ofmisclassifications.
42

Recall Precision
1: 6, 6.67, 7.5 73.14 74.012: 6, 6.67, 8.57 74.10 74.503: 6, 6.67, 10 69.52 70.494: 6, 6.67, 12 70.29 76.005: 6, 6.67, 15 72.38 76.396: 6, 7.5, 8.57 81.33 81.637: 6, 7.5, 10 73.90 74.478: 6, 7.5, 12 75.05 79.409: 6, 7.5, 15 72.19 77.7310: 6, 8.57, 10 76.95 77.4711: 6, 8.57, 12 76.95 80.4612: 6, 8.57, 15 78.86 82.5613: 6, 10, 12 71.62 75.5114: 6, 10, 15 72.00 77.4515: 6, 12, 15 73.90 83.6716: 6.67, 7.5, 8.57 77.33 77.4917: 6.67, 7.5, 10 74.48 75.2618: 6.67, 7.5, 12 75.81 76.5219: 6.67, 7.5, 15 70.86 77.4220: 6.67, 8.57, 10 76.00 76.5021: 6.67, 8.57, 12 78.29 78.7022: 6.67, 8.57, 15 78.29 80.0323: 6.67, 10, 12 76.76 77.9524: 6.67, 10, 15 73.33 77.3225: 6.67, 12, 15 77.90 79.6026: 7.5, 8.57, 10 82.48 82.9127: 7.5, 8.57, 12 84.95 85.1128: 7.5, 8.57, 15 78.29 82.4829: 7.5, 10, 12 80.76 81.6230: 7.5, 10, 15 73.14 78.6931: 7.5, 12, 15 76.19 81.6632: 8.57, 10, 12 81.90 82.6833: 8.57, 10, 15 78.10 82.2334: 8.57, 12, 15 81.71 84.6635: 10, 12, 15 78.10 83.08
Table B.5: Average recall and precision for each combination
43

Appendix C
Detailed ExperimentProtocol
44

1. Introduction (30 min)
(a) Welcome the participant (2 min)
(b) Give a short introduction (3 min)
(c) Participant fills in and signs consent form (5 min)
(d) Participant fills in short questionnairem Measure participant’s headcircumference and put on EEG cap in the meantime (20 min)
2. Experiment (33 min) x 3
(a) Short introduction (1 min)
(b) Part one: familiarity trial (4 min)
i. Participant plays Mind the Sheep! and must collect 10 objectswhich are placed across the playground within 3 minutes (3 min)
ii. Participant fills in SAM questionnaire (1 min)
(c) Part Two: easy trial (6 min)
i. Participant plays Mind the Sheep! and must pen a small flockof 5 sheep within 5 minutes (5 min)
ii. Participant fills in SAM questionnaire (1 min)
(d) Part Three: Difficult trial (11 min)
i. Participant plays Mind the Sheep! and must pen a flock of 10sheep within 10 minutes (10 min)
ii. Participant fills in SAM questionnaire (1 min)
(e) Participant fills in questionnaire on immersion (6 min)
(f) A small brake and some drinks (5 min)
3. Ask for preference of participant
4. End of experiment
45

Appendix D
Experiment Information forParticipants
46

Welcome Participant,
In a minute you will be playing Mind the Sheep! In this document you’ll find abrief explanation on how to play it and some extra information.
The Game
Mind the Sheep! consists of a playground representing a meadow. On thisplayground there are a few obstacles, e.g. trees, fences, rocks, etc. On thisplayground you will also find three herding dogs which are under your control.
If you want to move a herding dog, point the Wiimote at any location on theplayground and start the current selection methods by pressing the A button.Now you can select one of the herding dogs by using a selection method. Whenyou release the A button the selection methods stops and moves one of the threedogs to the location you indicated. Note: when a herding dog was unable tofind a route to the indicated location it will not response.
Selection Methods
During this experiment you will use three different selection methods. Two ofthem (SSVEP-based and P300-based) will use data from you brain which willbe recorded through electroencephalography (EEG).
SSVEP-based selection
During this selection method, all three herding dogs will start to flicker. Youcan select a herding dog by focusing on it. Tip: Staring/gazing for a longerperiod at a herding dog could increase the performance
P300-based selection
During this selection method, the three herding dogs will be highlighted in arandom order. Focus on the herding dog you want to select. Tip: Count thenumber of times the herding dog is highlighted to increase the performance.
Timed-based selection
All herding dogs will be highlighted one at the time. At first the highlightedherding dog will change rapidly. But as you wait longer, this will gradually slowdown.
47

Experiment Setup
There are three different parts for each one of the selection methods. Aftereach part you’ll have to answer three simple questions and at the end fill in oneslightly larger questionnaire.
Part 1
First you’ll get some time to get familiar with the current selection method.During this part there are some bones placed on the playground. Your goalis to collect all of them and at the same time get familiar with the selectionmethod.
Part 2
During this part the playground will be populated with a number of sheep.Sheep will respond to any nearby herding dog by running away from it and tryto find other sheep. On the playground you will also find a pen (indicated witha fence). Your goal is to get the sheep into a pen by using the herding dogs.
Part 3
This part is the same as part 2, but with more sheep, making the game moredifficult.
Well, thats it. Have fun.
48

Appendix E
Participant Consent Form
49

Determining BCI parameters
Participant Consent Form
I have been asked to participate in a research study conducted by Michel Obbinkand Gido Hakvoort. My participation in this study is entirely voluntary. Itis recommended that I read the information below and ask questions aboutanything I do not understand before deciding whether or not to participate.
PURPOSE OF THE STUDY
I understand that this study is designed to find a set of parameters for laterresearch that will gain knowledge about physiological interaction with computergames. I understand that the entire process will involve a recording session of upto two hours in which I have several opportunities for a break. We do howeveradvise you to have a toilet break before we start placing the electrodes. Shouldyou at any time during the experiment experience discomfort, then please informThe Experimenter immediately.
PROCEDURES
If I volunteer to participate in this study, I will be asked to undergo 32-channeltopographic EEG acquisition for approximately 2 hours. During this time Iwill be asked to sit still and obsere visual stimuli that are presented to me ona computer screen. I understand that The Experimenter will remain near methroughout the study and is available for questions at any time.
POTENTIAL RISKS AND DISCOMFORTS
I understand that EEG acquisition requires the placement of electrodes on thescalp for the purpose of recording an EEG. There are few risks associated withthis procedure. There is a remote possibility of skin irritation from the elec-trode gel used to attach electrodes. Techniques used to attach electrodes havebeen used at numerous research institutions for many years with no significantnegative side effects reported.
I understand that I can remove the electrodes or the cap at any time if I desireand there is no risk of electroshock from this procedure. We do not expect anypsychological, legal or financial risks for participating in the research, but asalways, there may be possible unforeseeable risks that have not been identified.Important: If you have illnesses, are undergoing medical treatment or areknown to ever had an epileptic seizure, please inform The Experimenter as soonas possible. For questions about this please contact The Experimenter.
50

RIGHTS OF RESEARCH SUBJECTS
I understand that the recorded EEG is anonymised and can and will only be pro-cessed, published and presented in its anonymised form. Any other informationprovided by me during the research study will be disclosed to anyone outsidethe research team without written permission, except if necessary to protect mywell-being, e.g., if I am injured and need emergency care or required by law.When the results of the research are published and discussed in conferences,no information will be included that reveals my identity. In any photographs,videos or audiotape records taken during the study my identity will be protectedor disguised.
I may withdraw my consent at any time and discontinue my participation with-out penalty. I am not waiving any legal rights or remedies because of myparticipation in this research study.
SIGNATURE OF RESEARCH SUBJECT OR LEGAL REPRESENTATIVE
I have read and understand the information provided above. I have been givenan opportunity to ask questions and all of my questions have been answered tomy satisfaction.
BY SIGNING THIS FORM, I WILLINGLY AGREE TO PARTICIPATE INTHE RESEARCH IT DESCRIBES.
NAME (BLOCK CAPITALS): . . . . . . . . . . . . . . . . . . . . . . . . . . . . . . . . . . . . . . . . . . . . . .
Signed: . . . . . . . . . . . . . . . . . . . . . . . . . . . . . . . . . . . . . . Date: . . . . . . . . . . . . . . . . .
I, The Experimenter, confirm that I have fully explained the purpose and natureof the research study and the risks involved.
NAME (BLOCK CAPITALS): . . . . . . . . . . . . . . . . . . . . . . . . . . . . . . . . . . . . . . . . . . . . . .
Signed: . . . . . . . . . . . . . . . . . . . . . . . . . . . . . . . . . . . . . . Date: . . . . . . . . . . . . . . . . .
51

Appendix F
Participant DemographicInformation Questionnaire
52

Participant Questionnaire
Before starting the experiment, we would like to have some demographic in-formation about you. This information will be used only for research purposesand will not be shared with third parties. Your anonymity will be kept in caseof scientific publishing. Please answer the questions below correctly with yourbest knowledge.
Demographic information
1. Surname; Initial(s) :
2. Age :
3. Mother tongue :
4. Gender :# Male# Female
5. Vision :# Normal# Corrected# Not corrected
6. Handedness :# Left# Right# Both
7. Compter usage :# Every day# Every 2-3 days# Once a week# More than once a month# Less than once a month# Never
8. BCI experience :# Never# Once# More than once
9. EEG experience :# Never# Once# More than once
53

Other details
10. Substance consumption 6 hours before the experiment :
None 1 units 2 units 3 units MoreAlcohol # # # # #Coffee # # # # #High sugar content drink # # # # #Tobacco # # # # #Black Tea # # # # #Energy drink # # # # #
11. Hours of sleep before the experiment :
12. Any drugs / medications used :
13. Attention / neurological / psychiatric deficiencies :
14. Preferred address / number for contact :
54

Appendix G
Participant SAMQuestionnaire
55

Self-Assessment Manikin (SAM)On each of the next few pages you will find 3 sets of 5 figures. These sets of figures,called Self-Assessment Manikin (SAM), are used to rate how you felt while using aselection method to play Mind the Sheep!. After each part (as described in the gameexplanation) you will rate all three figures. For each part you will use one completepage on which three kinds of feelings are shown: unhappy vs. happy, calm vs. excitedand controlled vs. controlling.
The first SAM scale describes unhappy vs. happy. The figures differ along the scale,ranging from a frown to a smile. At one end of this scale you felt completely unhappy,unsatisfied, bored, melancholic, annoyed, despaired. If you felt completely unhappywhile using a selection method to play Mind the Sheep!, you can indicate this bycircling the number 1. At the other end of this scale you felt completely happy, satis-fied, contented, hopeful, pleased. By circling the number 9, you indicate that you feltcompletely happy. If you felt somewhere in between while using a selection methodto play Mind the Sheep!, you can circle one of the other numbers.
The second SAM scale describes calm vs. excited. Again the figures differ alongthe scale. At one end of this scale you felt completely relaxed, calm, unaroused, slug-gish, sleepy, dull. You can indicate that you felt completely relaxed by circling thenumber 1. At the other end of this scale you felt completely aroused, excited, jittery,frenzied, stimulated, wide-awake. If you felt completely aroused while using a selec-tion method to play Mind the Sheep!, you can indicate this by circling the number 9.If you circle one of the other numbers you will indicate you felt somewhere in between.
The third and last scale describes controlled vs. controlling. At one end of this scaleyou felt completely controlled, cared-for, influenced, submissive, awed, guided. If youfelt completely controlled, you can indicate this by circling the number 1. At theother end you will again find the opposite feeling, completely in control, controlling,important, influential, dominant, autonomous. If you felt completely in control whileusing a selection method to play Mind the Sheep!, circle the number 9. Circle one ofthe other number to indicate you felt somewhere in between.
Important: Please rate each one of the figures as you actually felt while you used aselection methods to play Mind the Sheep!.
56

Describe how you felt while usingthe current selection method
57

Appendix H
Participant ImmersionQuestionnaire
58

Immersion Questionnaire
Please answer the following questions by selecting the relevant number. Inparticular, remember that these questions are asking you about how you felt atthe end of the game using this selection method.
1. To what extent did the game hold your attention?Not at all 1 2 3 4 5 6 7 A lot
2. To what extent did you feel you were focussed on the game?Not at all 1 2 3 4 5 6 7 A lot
3. How much effort did you put into playing the game?Very little 1 2 3 4 5 6 7 A lot
4. Did you feel that you were trying your best?Not at all 1 2 3 4 5 6 7 Very much so
5. To what extent did you lose track of time?Not at all 1 2 3 4 5 6 7 A lot
6. To what extent did you feel consciously aware of being in thereal world whilst playing?Not at all 1 2 3 4 5 6 7 Very much so
7. To what extent did you forget about your everyday concerns?Not at all 1 2 3 4 5 6 7 A lot
8. To what extent were you aware of yourself in your surroundings?Not at all 1 2 3 4 5 6 7 Very aware
9. To what extent did you notice events taking place around you?Not at all 1 2 3 4 5 6 7 A lot
10. Did you feel the urge at any point to stop playing and see whatwas happening around you?Not at all 1 2 3 4 5 6 7 Very much so
11. To what extent did you feel that you were interacting with thegame environment?Not at all 1 2 3 4 5 6 7 Very much so
12. To what extent did you feel as though you were separated fromyour real-world environment?Not at all 1 2 3 4 5 6 7 Very much so
13. To what extent did you feel that the game was something youwere experiencing, rather than something you were just doing?Not at all 1 2 3 4 5 6 7 Very much so
14. To what extent was your sense of being in the game environmentstronger than your sense of being in the real world?Not at all 1 2 3 4 5 6 7 Very much so
15. At any point did you find yourself becoming so involved thatyou were unaware you were even using controls?Not at all 1 2 3 4 5 6 7 Very much so
59

16. To what extent did you feel as though you were moving throughthe game according to your own will?Not at all 1 2 3 4 5 6 7 Very much so
17. To what extent did you find the game challenging?Not at all 1 2 3 4 5 6 7 Very difficult
18. Were there any times during the game in which you just wantedto give up?Not at all 1 2 3 4 5 6 7 A lot
19. To what extent did you feel motivated while playing?Not at all 1 2 3 4 5 6 7 A lot
20. To what extent did you find the game easy?Not at all 1 2 3 4 5 6 7 Very much so
21. To what extent did you feel like you were making progress to-ward the end of the game?Not at all 1 2 3 4 5 6 7 A lot
22. How well do you think you performed in the game?Very poor 1 2 3 4 5 6 7 Very well
23. To what extent did you feel emotionally attached to the game?Not at all 1 2 3 4 5 6 7 Very much so
24. To what extent were you interested in seeing how the game’sevents would progress?Not at all 1 2 3 4 5 6 7 A lot
25. How much did you want to “win” the game?Not at all 1 2 3 4 5 6 7 Very much so
26. Were you in suspense about whether or not you would win orlose the game?Not at all 1 2 3 4 5 6 7 Very much so
27. At any point did you find yourself become so involved that youwanted to speak to the game directly?Not at all 1 2 3 4 5 6 7 Very much so
28. To what extent did you enjoy the graphics and the imagery ofthe game?Not at all 1 2 3 4 5 6 7 A lot
29. How much would you say you enjoyed playing the game?Not at all 1 2 3 4 5 6 7 A lot
30. When interrupted, were you disappointed that the game wasover?Not at all 1 2 3 4 5 6 7 Very much so
31. Would you like to play the game again?Definitely not 1 2 3 4 5 6 7 Definitely yes
60

Appendix I
INTERACT 2011Conference Paper
61
Measuring immersion and affect in abrain-computer interface game
Gido Hakvoort, Hayrettin Gurkok, Danny Plass-Oude Bos, Michel Obbink,and Mannes Poel
University of Twente, Faculty EEMCS,P.O. Box 217, 7500 AE, Enschede
The [email protected],[email protected],[email protected],
[email protected],[email protected]
Abstract. brain-computer interfaces (BCIs) have widely been used inmedical applications, to facilitate making selections. However, whetherthey are suitable for recreational applications is unclear as they haverarely been evaluated for user experience. As the scope of the BCI appli-cations is expanding from medical to recreational use, the expectationsof BCIs are also changing. Although the performance of BCIs is still im-portant, finding suitable BCI modalities and investigating their influenceon user experience demand more and more attention. In this study a BCIselection method and a comparable non-BCI selection method were in-tegrated into a computer game to evaluate user experience in terms ofimmersion and affect. An experiment with seventeen participants showedthat the BCI selection method was more immersive and positively affec-tive than the non-BCI selection method. Participants also seemed to bemore indulgent towards the BCI selection method.
Keywords: Brain-computer interfaces, affective computing, immersion,games
1 Introduction
A brain-computer interface (BCI) can be described as a communication linkbetween the brain and the machine. In a BCI system, signals from the brain areanalyzed to determine the user’s state of mind or intentions, which in turn canbe translated into actions [9]. BCI systems have been applied for medical useto help disabled users by giving back mobility [8] and breaking the isolation ofpeople with physiological disorders [7,11].
As successful applications of BCIs become news and commercial BCI inputdevices become publicly available, BCIs are finding their way into recreationaluse. However, as the scope of BCI applications is expanding from medical torecreational use, the expectations for BCIs are also changing. Currently they areunable to meet the high performance and accuracy of existing input modalities

2 Gido Hakvoort et al.
such as mouse and keyboard, and are therefore unfit as replacement. Insteadthey should be seen as separate modalities which can be used beside, or incombination with, existing input modalities [17]. However, using BCI as inputmodality still comes with many challenges. Where increasing the performanceof BCIs has always been an important goal for medical studies, the way theyare applied as modalities and the influence they have on the user experience isbecoming more and more important for recreational BCI applications.
Whether BCIs are suitable for recreational applications is as yet unclearas they have rarely been evaluated for user experience. They may turn outto be valuable additions for recreational applications such as games which aredeveloped to be challenging and enjoyable. Moreover the inaccuracy of BCIscan become a challenging factor in games. As gamers love working with newtechnologies, are capable of adapting quickly to a new environment and are usedto the concept that games have to be mastered [16], they may be more indulgenttowards BCI modalities.
The purpose of this study was to evaluate a BCI system for user experiencein the terms of affect and immersion. As making selections is an importantaspect in many games and BCIs are frequently used to make selections, a BCIselection method was used in this study. One of the most frequently used brainsignals in BCI systems to make selections is the steady-state visually evokedpotential (SSVEP) [1]. In most cases SSVEPs are triggered by presenting amodulated visual stimulus with a periodic signal, usually at frequencies above5 Hz, to a user. The periodic signal of the stimulus can then be traced back inthe measured brain signals which are mostly recorded from the occipital regionof the scalp [23]. The power of an SSVEP only covers a narrow bandwidthmatching that of the stimulus [15]. This makes them relatively easy to detect,which is why the BCI selection method used in this study was based on SSVEP.The BCI selection method and a comparable non-BCI selection method wereintegrated into a computer game where both introduced a challenge factor. Asthe BCI selection method would be able to directly translate the user intentionsinto in-game actions, it was expected that it would enrich the user experience interms of immersion and affect.
How immersion and affect can be influenced by input modalities will be ex-plained in the background in section 2. The BCI and non-BCI selection methodsand how they were integrated in a game will be described in section 3. In section4 the experimental setup and how both selection methods were evaluated willbe explained. After this, the results of the experiment will be reported, followedby the discussion and the conclusion.
2 Background
2.1 Immersion
Immersion has meaning in various contexts, such as while reading a book, watch-ing a movie or playing games. Whether the term is used consistently in these

Measuring immersion and affect in a brain-computer interface game 3
contexts is unclear. However, for playing games there seems to be a shared con-cept of immersion among gamers [4]. Immersion in games is often accompaniedby high levels of concentration, losing track of time and empathy.
In a study by Brown et al. [4] an attempt was made to define immersionwithin games. In their study they examined the concept of immersion expe-rienced by gamers. Their results indicate that immersion is not just a staticexperience, but has different levels of involvement. They defined three levels ofinvolvement: engagement, engrossment and total immersion. They also state thatto reach a certain level of immersion, a number of barriers must be crossed. Someof these barriers are related to human characteristics, such as personal prefer-ences, empathy and the will to invest time and attention. Others are related tothe construction of the game such as the graphics, a plot and atmosphere. How-ever, to reach a state of total immersion an important barrier to take is relatedto the controls. Through them gamers translate their intentions into in-gameactions [19] and virtually controls should become invisible to the gamer. As in-tentions originate from the brain, users first need to translate their intentionsinto real world actions to handle the controls. Even if these real world actionsbecome virtually invisible for the user, they still need to be performed. Using aBCI to detect intentions may allow them to be translated directly into in-gameactions, making the real world actions redundant.
In a study by Jennett et al. [12] immersion in games was further investigated.They identified five factors of immersion: cognitive involvement, real world disso-ciation, emotional involvement, challenge and control. As in the study of Brownet al., some factors were related to human characteristics (cognitive involvement,real world dissociation and emotional involvement) and others were related tothe construction of the game (challenge and control). To measure these factors,as well as the total immersion, they developed a questionnaire which was alsoused in this study to measure the immersion while using the BCI and non-BCIselection methods.
2.2 Affect
Affect can be referred to as experiencing emotions and has some overlap withimmersion [12]. It has a large impact on how well users are able to perform tasksand how they respond to possible usability problems. According to Norman [18],a more positive affect causes users to be more indulgent towards minor usabilityproblems. Although there are many dimensions associated with affect, accord-ing to Picard [20] the three most commonly used dimensions of emotion arevalence, arousal and dominance. Picard also notes that the valence and arousaldimensions are critical in recreational applications.
Bradley et al. [3] developed a questionnaire, the self-assessment manikin(SAM), to measure emotional responses in these three dimensions. In Fig. 1some emotions associated with valence and arousal can be seen. Integrating theselection methods into an enjoyable, challenging and task oriented environment,such as a game, should result in a more positive affect in terms of valence andarousal which will aid users to overcome the inaccuracy of the selection methods.

4 Gido Hakvoort et al.
Arousal
Valence
glad
happy
delighted
pleased
excited
contented
relaxed
calm
sad
depressed
bored
tired
alarmed
angry
frustrated
stressed
Fig. 1. Emotions in the valance and arousal space
3 Selection Methods
To measure the effects of the BCI and non-BCI selection methods on the userexperience in terms of immersion and affect, the selection methods were inte-grated into a simple game. The game, called Mind the Sheep!, offered the playersan enjoyable, challenging and task oriented environment.
3.1 Mind the Sheep!
Mind the Sheep! consists of a playground representing a meadow on which afew obstacles, such as fences, gates or trees are placed. There are three dogs inthe playground which are controlled by the player. Depending on the objectivesof a specific level, the playground can be populated with a number of sheep orcollectibles. A screenshot of the game can be seen in Fig. 2 with ten white sheepand three black dogs. The goal of the game is to gather all sheep into a pen orgather all collectibles as quickly as possible using the three dogs. Players can useone of the selection methods to select one of the three dog.
To move a dog, players point at any location on the playground with themouse and start the current selection method by pressing the left mouse button.As long as they hold down the mouse button the selection method continues tobe operative thereby increasing the accuracy of the selection method. Releasingthe mouse button stops the selection method and one of the dogs is moved tothe location indicated by the player. When players indicate a position unreach-able for the dogs, the instruction is ignored. As the accuracy of the selectionmethods increase over time, there is a trade-off between accuracy and speed. Italso requires users to multi-task as they need to concentrate on a dog and keepan eye on the sheep at the same time.

Measuring immersion and affect in a brain-computer interface game 5
Fig. 2. Screenshot of Mind the Sheep! with three black dogs and ten white sheep. Thepen is located in the center.
The dogs use a simple A* search based path finding algorithm to move toa specific location on the map. By default, sheep will walk around and grazerandomly. However, when a dog approaches, they will tend to flock and moveaway from the dog allowing them to be herded in a desired direction. The flockingbehavior is introduced by using the boids algorithm [22]. By positioning the dogsat strategic locations on the map a flock of sheep can be directed into the pen.
3.2 BCI Selection
To use SSVEPs for making selections, stimuli emitting unique periodic signalsshould be presented to a user simultaneously. When a user focuses on one ofthe stimuli, the periodic signal of that stimulus can be traced back in the user’sbrain signals. As each stimulus represents a single target, the correspondingtarget can then be determined as the selected one. As users would not wantto continuously make selections, they were able to start and stop this selectionmethod thereby controlling the presence of the stimuli. The size of the stimuliand the frequency of their periodic signals have an influence on the how well theyare reflected in user’s brain signals. Therefore, these properties were determinedin a pre-experiment study.
In the pre-experiment study a small white cross was placed at the center ofan LCD monitor on a black background (Fig. 3). During the study participantswere exposed to different types of trials, in which the presented stimulus varied insize and frequency. The detailed setup of the pre-experiment study was describedin [10].

6 Gido Hakvoort et al.
Fig. 3. Screen layout of the monitor during the pre-experiment study
Based on the work of Volosyak et al. [24], 7 different frequencies (6.00 Hz,6.67 Hz, 7.50 Hz, 8.57 Hz, 10.00 Hz, 12.00 Hz and 15.00 Hz) were used. Theirstudy showed that frequencies which are integer factors of the refresh rate ofan LCD monitor are more suitable for presenting stimuli. Using the factor ofthe refresh rate produces a more stable stimulus frequency because only wholeframes are visible on the LCD screen. The diameters of the stimuli were set to2 and 3 centimeters, which is consistent with the work in the literature [5,14].
In each trial a simple stimulus, a blinking white circle, appeared at the loca-tion of the cross. The participant focussed for 4 seconds on the stimulus. Betweentrials, participants had 6 seconds rest to relax their vision. All trials were pre-sented 25 times and were placed in a random order prior to the study, thusfor each participant, 25 segments of 4 seconds of data were recorded for eachdifferent trial.
The results of the pre-experiment study with 7 participants indicated that agood set of frequencies is 10 Hz, 12 Hz and 15 Hz with a diameter of 3 centimeters.Without any training, the frequencies in this set were classified correctly with anaverage recall of 78.1 % (σ = 18.5) using a CCA-based detection method whichwill be further explained in section 4.2.
3.3 Non-BCI Selection
The BCI selection method introduces a challenge factor when a selection is beingmade as users need to concentrate on a stimulus to make an accurate selection.The main challenge is to gather enough data to be able to make a good detection,which is directly related to the time the selection method is operative. Althoughit would be much easier for users to make a selection by pointing and clickingwith a mouse, this would offer little challenge and give the non-BCI selectionmethod a great advantage when compared with the BCI selection method. Topose a similar challenge in the non-BCI selection method, it was modelled to be

Measuring immersion and affect in a brain-computer interface game 7
similar to the BCI selection method in terms of the time required for an accurateselection.
Similar to the BCI selection method users were able to start and stop thenon-BCI selection method. When operative, the dogs were highlighted one at atime with an increasing highlight period. The diameter of the stimuli were keptthe same as in the BCI selection method, 3 centimeters. When users stoppedthe selection method, the current highlighted dog was selected.
To make an accurate selection, users had to react in time when the dog theywanted to select was highlighted. With a highlight period of 250 ms users shouldhave enough time to react as this is close to the average human reaction time[13]. The highlight period should reach 250 ms only by the time that is equalto the time needed to make a selection using the BCI selection method, whichis around 2.5 seconds [14]. Therefore, the highlight period started with 100 msand was increased 5% after every highlight, with a maximum highlight periodof 500 ms.
4 Methods
4.1 Experimental Setup
The experiment held in this study consisted of two different sessions. In eachsession a participant used one of the selection methods (BCI or non-BCI) whileplaying Mind the Sheep!. Each participant used both selection methods. How-ever, a counterbalanced measures design was used to avoid confounding variablessuch as learning a strategy to play the game.
Each session was divided into three trials, a familiarity trial, an easy trial anda difficult trial. In the familiarity trial participants could get used to the selectionmethod by selecting and moving the dogs. During this trial, participants had tocollect 10 objects which were placed across the playground. Next, in the easytrial, participants had to pen a small flock of 5 sheep using the dogs. During thistrial two pens were placed on the playground, one on the left and one on the rightof the screen to make the task easier for the participants. Finally, in the difficulttrial, participants had to gather 10 sheep, which were more scattered acrossthe playground, into one pen that was placed in the center of the playground.Between the two sessions, participants were given a break of ten minutes.
The layout of the playgrounds across the trials were kept the same to ensureno playground was more difficult for one of the selection methods. However toensure that participants did not create an optimal strategy for a specific trial, thepositions of the dogs, collectible objects and sheep were altered for the differentselection methods.
A timeout was set for each trial for the participants to finish the level by col-lecting all objects or gathering all sheep into a pen. Participants had 3 minutes,5 minutes and 10 minutes for the familiarity, easy and difficult trials respectively.Since immersion in games is often accompanied by losing track of time, the timeleft was not visible for the participants. Otherwise it could have influenced theirperception of the elapsed time.

8 Gido Hakvoort et al.
The game ran on a PC which was connected to a projector1. The projectorwas mounted on the ceiling and projected the game on a screen approximately3 meters away from a participant. The sizes of the stimuli were scaled propor-tionally with the increased distance to the screen. To make sure the frequenciesfor the SSVEP based BCI selection method were correctly presented by theprojector they were checked with a light sensor.
Participants sat on a chair behind a table and by using the mouse on the tablethey were able to start and stop the selection methods. The data acquisition ranon a separate PC and sent the raw electroencephalography (EEG) data to thegame PC.
4.2 SSVEP Detection
Prior to the experiment, 32 electrodes were placed according to the international10-20 system [21]. For the EEG data acquisition a BioSemi ActiveTwo system2
was used. During each SSVEP selection EEG data was used from eight parietal-occipital electrodes (i.e. Pz, P3, P4, PO3, PO4, Oz, O1, O2 ). The EEG data wasre-referenced to the common average reference (CAR) [6] of all 32 electrodes,after which a detection method was used to determine which frequency theparticipant was focusing on.
There are various methods to detect the presence of SSVEP. One of themost popular and widely used detection methods is power spectral densityanalysis (PSDA) where a fast Fourier transform (FFT) is used to estimate thepower spectral density (PSD) of a time window of the EEG signal. The magni-tude of each stimulation frequency can then be used for classification. A relativelynew approach is using canonical correlation analysis (CCA) where sets of ref-erence signals are constructed for each one of the stimulation frequencies. Eachset contains the sine and cosine for the first, second and third harmonic of thestimulation frequency. The re-referenced EEG data and each set with referencesignals are used as input for the CCA. CCA tries to find pairs of linear trans-formations for the two sets such that when the transformations are applied theresulting sets have a maximal correlation. The stimulation frequency with thehighest maximum correlation is classified as the frequency the participant wasfocusing on.
As CCA-based detection methods have some improvements and advantagescompared to PSDA-based detection methods, such as better signal-to-noise ratio(SNR), lower inter-subject variability and the possibility of using harmonic fre-quencies [2], a CCA-based detection method was used in this study.
4.3 Questionnaires and Data Acquisition
To measure the affective reaction of the participants while playing the game,they were requested to fill in a SAM [3] after each trial. It was expected that
1 Mitsubishi WD510U, 93.3”, 60Hz, 1360x7682 BioSemi, Amsterdam, The Netherlands

Measuring immersion and affect in a brain-computer interface game 9
if participants became more frustrated by using a selection method, this wouldresult in higher arousal and lower valence scores. The dominance would alsobe higher if participants had the feeling that a selection method was workingproperly and that they were in control.
After each session participants filled in a questionnaire on immersion. Thequestionnaire by Jennett et al. [12] was used for this. It contains 31 questionsand is designed to measure the total immersion as well as five different factorsof immersion (cognitive involvement, emotional involvement, real world dissoci-ation, challenge and control). Although valence, arousal and dominance wouldprobably differ between selection methods for which participants have an aver-sion, this does not necessarily mean participants would not become immersed inthe game.
Furthermore some game statistics, such as the number of times a dog wasselected, the total number of selections, the average selection duration and thetime participants needed to finish a trial were collected while participants playedthe game. Ideally participants would use all the dogs as this would make it easierto gather the sheep. The number of times a particular dog was selected would be agood indication of how well the selection methods performed for the participants.
At the end of the experiment participants were asked which selection methodthey would like to use if they were given the opportunity to play the gameagain. This should have given a good indication of which selection method theparticipant preferred.
After the experiments, scores were obtained for the total immersion, the fiveimmersion factors, the SAM questionnaire and the game statistics. The resultsfrom the SAM questionnaire were averaged over the three trials to get an averagescore for the valence, arousal and dominance scales. As each participant usedboth selection methods, the scores were compared using a Wilcoxon signed-ranktest to determine if there was a significant difference between the two selectionmethods.
4.4 Participants
Seventeen participants (7 female and 10 male), aged between 17 and 37 (µ =22.00, σ = 4.74) participated in the experiment. All participants except for onehad normal or corrected-to-normal vision and described themselves as daily com-puter users. Although eight participants had at least one-time experience withEEG, fourteen participants had no experience with BCIs. Before the experiment,all participants signed an informed consent form and they were paid accordingto institution’s regulations.
5 Results
When the 17 participants were asked which selection method they would chooseif they were given the opportunity to play the game again, 5 of them chose thenon-BCI selection method and 12 of them chose the BCI selection method. This

10 Gido Hakvoort et al.
is a first indication that participants prefer the BCI selection method over thenon-BCI selection method. A detailed insight might be provided by the scores forimmersion, the SAM questionnaire and the game statistics, which are describedbelow.
5.1 Immersion
Based on the immersion questionnaire the total immersion score was calculatedfor both selection methods. On average the participants rated the BCI selectionmethod (µ = 160, σ = 14.55) higher than the non-BCI selection method (µ =144, σ = 21.89). This difference was significant (Z = −2.155, p = 0.031).
The five immersion factors were also analyzed and the scores, averaged overparticipants, are shown in Table 1. The scores for all factors, except for the chal-lenge factor, are higher for the BCI selection method. The five immersion factorswere examined for significant differences between the BCI and non-BCI selectionmethods. There are significant differences for the cognitive involvement factor(Z = −2.219, p = 0.026), the real world dissociation factor (Z = −1.992, p =0.046), the emotional involvement factor (Z = −2.013, p = 0.044) and the controlfactor (Z = −2.310, p = 0.021). For the challenge factor no significant difference(Z = −0.476, p = 0.634) was found.
Table 1. Scores of the five immersion factors, averaged over participants. Values arerepresented as µ(σ) with ∗ indicating a significant difference with p < 0.05.
non-BCI BCI
Cognitive∗ 53.12 (9.01) 58.47 (5.36)Dissociation∗ 25.18 (5.64) 28.06 (4.79)Emotional∗ 54.35 (8.54) 59.88 (5.95)Challenge 20.88 (2.89) 20.71 (2.34)Control∗ 32.06 (5.77) 37.06 (5.08)
5.2 Affect
Based on the SAM questionnaire the total SAM scores were calculated for bothselection methods and the average results are shown in Table 2.
For the valence scale the difference was significant (Z = −2.012, p = 0.044),however, no significant difference was found for the arousal (Z = −0.315, p =0.752) or dominance (Z = −0.403, p = 0.687) scores.

Measuring immersion and affect in a brain-computer interface game 11
Table 2. Average SAM scores, the values are represented as µ(σ) with ∗ indicating asignificant difference of p < 0.05
non-BCI BCI
Valence∗ 6.37 (1.55) 7.08 (1.31)Arousal 4.82 (2.31) 4.53 (2.37)Dominance 5.65 (2.46) 6.08 (1.64)
5.3 Game Statistics
The game statistics which were collected during the experiments are shown inTables 3 and 4. They show the number of selections and the average selec-tion time. For the number of selections (Table 3) there are significant differ-ences for the easy task trial (Z = −2.202, p = 0.028) and the difficult task trial(Z = −2.107, p = 0.035). However, no significant difference was found for thefamiliarity trial (Z = −1.866, p = 0.062).
Table 3. Average number of selections for each trial, presented as µ(σ) with ∗ indi-cating a significant difference of p < 0.05.
non-BCI BCI
Familiarity 12.53 (4.87) 10.47 (2.67)Easy∗ 43.00 (26.27) 27.88 (7.86)Difficult∗ 98.88 (65.90) 74.12 (30.28)
Table 4. Average selection time (in seconds) for each trial, presented as µ(σ).
non-BCI BCI
Familiarity 1.92 (0.86) 2.49 (1.71)Easy 1.96 (1.04) 2.64 (2.63)Difficult 1.95 (1.31) 1.71 (0.85)
Although no significant differences were found for the average selection time(Table 4) between the BCI and non-BCI selection methods for any of the threetrials, it can be seen that for the familiarity and easy task trials the averageselection times for the BCI selection were around 0.5 seconds higher. However,for the difficult task trial the average selection time was lower.

12 Gido Hakvoort et al.
6 Discussion
Most participants indicated that they preferred playing the game with the BCIselection method. This seems to be supported by the results of the immersionquestionnaire. The total immersion score was significantly higher for the BCIselection method, indicating that participants were more immersed than whenusing the non-BCI selection method. For the BCI selection method participantsonly had to make their intentions clear to the BCI system by concentrating on thedog they wished to selected. Besides starting and stopping the selection method,there were no other actions required. However, for the non-BCI selection method,participants still had to translate their intentions into an action, stopping theselection method at the correct time. As participants were able to translate theirintentions directly into in-game actions while using the BCI selection method,they might have become more easily immersed.
Further inspection of the five immersion factors showed that all factors, ex-cept for the challenge factor, were significantly higher for the BCI selectionmethod. The questions related to the challenge factor were about the game itself.As the averages of the challenge factor were almost equal for the two selectionmethods, they indicate that participants did not find the game more challengingusing one of the two selection methods. For using the selection methods, thecontrol factor might be a better indicator. As the control factor was significantlylower for the non-BCI selection method, it indicates that participants had moretrouble using the non-BCI selection.
The results of the SAM questionnaire indicate that participants were morecontent using the BCI selection method. The results of the cognitive involvementand real world dissociation factors were also significantly higher for the BCIselection method. This could have been caused by the fact that participants hadto concentrate on a dog while using the BCI selection method and did not haveto translate their intentions into real world actions.
Some participants developed a strategy to deal with the trade-off betweenaccuracy and speed. When they wanted to be accurate in their selections, theywaited long enough to make an accurate selection. However, when they wantedto be quick, they moved all three dogs as one by pressing rapidly at a location onthe playground. Although this behavior was observed for both selection methods,for the BCI selection method participants appeared to switch between preciseand quick whenever they wished. However, for the non-BCI selection methodthey appeared to prefer only making quick selections, explaining the significantlyhigher number of selection for the non-BCI selection method.
For the BCI selection method the number of selections was lower and, al-though not significant, the average selection time was higher. Participants werealso more immersed and content. Apparently, participants accepted that for agood SSVEP detection they had to wait a couple of seconds. However, for thenon-BCI selection method they understood that it was related to their own reac-tion speed and suddenly they appeared to be in a hurry. Although the non-BCIselection method was modeled to be similar to the BCI selection method, it mighthave had an effect on the preference of the participants, as they did not want to
Measuring immersion and affect in a brain-computer interface game 13
wait to make a selection. The non-BCI selection method did introduce the samechallenge and required participants to multi-task similarly to the BCI selectionmethod. However, participants seemed to be more indulgent towards the BCIselection method than towards the non-BCI selection method. This could becaused by the curiosity of participants for the BCI selection method or the selfoverestimation by participants while using the non-BCI selection method.
7 Conclusion
In this study a BCI system was compared to a non-BCI system to evaluate theuser experience in terms of immersion and affect. For the BCI system a selectionmethod based on SSVEP was integrated into a game, introducing a challengefactor. A comparable non-BCI selection method based on time was also imple-mented into the game, introducing an equal challenge. Seventeen participantsplayed the game with both selection methods in three trials. They rated eachselection method on immersion and affect.
The results show that the BCI selection method was found to be more immer-sive and positively affective than the non-BCI selection method. While using theBCI selection method participants were able to directly translate their intentionsinto in-game actions, which made it easier for them to become more immersed.In this case, the user experience in terms of immersion and affect seemed to beimproved while using the BCI selection method. Furthermore, participants ap-peared to have more patience when using the BCI selection method than whenusing the non-BCI selection method, which could have been caused by the cu-riosity of participants for the BCI selection method or the self overestimation byparticipants while using the non-BCI selection method.
For future studies it would be interesting to look at long term effects on im-mersion and affect. Is the BCI selection method still significantly more immersiveand affective when participants are used to it? Another question is whether theindulgence towards the BCI selection method is permanent or only temporary.It would also be interesting to add a selection method based on pointing andclicking which was left out of this research. Thereby testing for the cognitiveload as the selection methods used in this study required participants to multi-task. Given the intended purpose of this research, it would also be interestingto use commercial BCI input devices (e.g. Emotiv’s EPOC). This would alsorequire a proper study comparing the equipment used in this research and com-mercial BCIs to determine the differences and if they are feasible to use withinthe setup of this experiment. Other (non-)BCI selection methods, such as speechand gestures could also prove to increase immersion and affect.
Acknowledgments. The authors gratefully acknowledge the support of theBrainGain Smart Mix Programme of the Netherlands Ministry of EconomicAffairs and the Netherlands Ministry of Education, Culture and Science. Theauthors would also like to thank Michiel Hakvoort for his technical support onthe game and Lynn Packwood for improving the language of this paper.

14 Gido Hakvoort et al.
References
1. Beverina, F., Palmas, G., Silvoni, S., Piccione, F., Giove, S.: User adaptive BCIs:SSVEP and P300 based interfaces. PsychNology Journal 1(4), 331–354 (2003)
2. Bin, G., Gao, X., Yan, Z., Hong, B., ShangkaiGao: An online multi-channel SSVEP-based brain–computer interface using a canonical correlation analysis method.Journal of Neural Engineering 6(4), 046002 (2009)
3. Bradley, M.M., Lang, P.J.: Measuring emotion: The self-assessment manikin andthe semantic differential. Journal of Behavior Therapy and Experimental Psychi-atry 25(1), 49–59 (1994)
4. Brown, E., Cairns, P.: A grounded investigation of game immersion. In: CHI ’04extended abstracts on Human factors in computing systems. pp. 1297–1300. ACM(2004)
5. Cheng, M., Gao, X., Gao, S., Xu, D.: Design and implementation of a brain-computer interface with high transfer rates. IEEE Transactions on BiomedicalEngineering 49(10), 1181–1186 (2002)
6. Cooper, R., Osselton, J., Shaw, J.: EEG technology. Butterworths (1969)7. Farwell, L., Donchin, E.: Talking off the top of your head: toward a mental pros-
thesis utilizing event-related brain potentials. Electroencephalography and ClinicalNeurophysiology 70(6), 510–523 (1988)
8. Galan, F., Nuttin, M., Lew, E., Ferrez, P., Vanacker, G., Philips, J., Van Brussel,H., Millan, J.: An asynchronous and non-invasive brain-actuated wheelchair. In:13th International Symposium on Robotics Research (2007)
9. van Gerven, M., Farquhar, J., Schaefer, R., Vlek, R., Geuze, J., Nijholt, A., Ramsey,N., Haselager, P., Vuurpijl, L., Gielen, S., Desain, P.: The brain–computer interfacecycle. Journal of Neural Engineering 6(4), 041001 (2009)
10. Hakvoort, G., Reuderink, B., Obbink, M.: Comparison of PSDA and CCA detec-tion methods in a SSVEP-based BCI-system. Technical Report TR-CTIT-11-03,Centre for Telematics and Information Technology, University of Twente (2011)
11. Hoffmann, U., Vesin, J., Ebrahimi, T., Diserens, K.: An efficient P300-based brain-computer interface for disabled subjects. Journal of Neuroscience Methods 167(1),115–125 (2008)
12. Jennett, C., Cox, A., Cairns, P., Dhoparee, S., Epps, A., Tijs, T., Walton, A.: Mea-suring and defining the experience of immersion in games. International Journalof Human-Computer Studies 66(9), 641–661 (2008)
13. Lansing, R., Schwartz, E., Lindsley, D.: Reaction time and EEG activation underalerted and nonalerted conditions. Journal of Experimental Psychology 58(1), 1–7(1959)
14. Lin, Z., Zhang, C., Wu, W., Gao, X.: Frequency Recognition Based on CanonicalCorrelation Analysis for SSVEP-Based BCIs. IEEE Transactions on BiomedicalEngineering 53(12), 2610–2614 (2006)
15. Lopez, M., Pelayo, F., Madrid, E., Prieto, A.: Statistical characterization of steady-state visual evoked potentials and their use in brain–computer interfaces. NeuralProcessing Letters 29(3), 179–187 (2009)
16. Nijholt, A., Plass-Oude Bos, D., Reuderink, B.: Turning shortcomings into chal-lenges: Brain-computer interfaces for games. Entertainment Computing 1(2), 85–94(2009)
17. Nijholt, A., Tan, D., Allison, B., del R. Milan, J., Graimann, B.: Brain-ComputerInterfaces for HCI and Games. In: CHI ’08 extended abstracts on Human factorsin computing systems. pp. 3925–3928. ACM (2008)

Measuring immersion and affect in a brain-computer interface game 15
18. Norman, D.: Emotion & design: attractive things work better. Interactions 9(4),36–42 (2002)
19. Pagulayan, R., Keeker, K., Wixon, D., Romero, R., Fuller, T.: User-centered designin games. In: The human-computer interaction handbook. pp. 883–906 (2002)
20. Picard, R.: Affective computing. The MIT press (2000)21. Reilly, E.L.: EEG Recording and Operation of the Apparatus. In: Electroen-
cephalography: Basic Principles, Clinical Applications and Related Fields, pp. 139–160. Lippincott Williams & Wilkins (1999)
22. Reynolds, C.W.: Flocks, herds and schools: A distributed behavioral model. In:SIGGRAPH ’87 Proceedings of the 14th annual conference on Computer graphicsand interactive techniques. pp. 25–34. ACM (1987)
23. Ruen Shan, L., Ibrahim, F., Moghavvemi, M.: Assessment of Steady-State Vi-sual Evoked Potential for Brain Computer Communication. In: 3rd Kuala LumpurInternational Conference on Biomedical Engineering 2006. pp. 352–354. Springer(2006)
24. Volosyak, I., Cecotti, H., Graser, A.: Impact of Frequency Selection on LCD Screensfor SSVEP Based Brain-Computer Interfaces. Bio-Inspired Systems: Computa-tional and Ambient Intelligence pp. 706–713 (2009)