Measuring Compact Urban Form: A Case of Nagpur City, India
27
Sustainability 2014, 6, 4246-4272; doi:10.3390/su6074246 sustainability ISSN 2071-1050 www.mdpi.com/journal/sustainability Case Report Measuring Compact Urban Form: A Case of Nagpur City, India Rajashree Kotharkar 1,† , Pankaj Bahadure 1,†, * and Neha Sarda 2,† 1 Department of Architecture and Planning, Visvesvaraya National Institute of Technology, Nagpur 440010, India; E-Mail: [email protected] or [email protected] 2 Architect-Planner, Nagpur 440010, India; E-Mail: [email protected] † These authors contributed equally to this work. * Author to whom correspondence should be addressed; E-Mail: [email protected] or [email protected]; Tel.: +91-712-280-1063; Fax: +91-712-280-1376. Received: 23 March 2014; in revised form: 29 May 2014 / Accepted: 6 June 2014 / Published: 9 July 2014 Abstract: The compact city concept is adopted in city planning policies of many developed countries for the following benefits: efficient use of land while curtailing sprawl, reduction in transport network and reliance on mass transport, a socially interactive environment with vibrancy of activities, economic viability, etc. However, it is still debated whether the cities in developing countries like India, which are already dense, will really benefit from the compact city form. Measuring urban form and compactness of these cities becomes more important for understanding the spatial urban structure to intervene accordingly for sustainable urban development. This paper explores various parameters and dimensions of measurement of compactness. Urban form characteristics and their indicators are derived for the study of Nagpur city, India. This study is an attempt to measure the urban form to derive the benefits of compactness. The study indicates that Nagpur city, inherently has a compact form, but may disperse in near future; and there is a need to implement policies to retain its compact character to achieve sustainable urban development. Keywords: compact cities; urban form; planning Indian cities; measuring urban compactness; sustainable urban development OPEN ACCESS
-
Upload
vnitnagpur -
Category
Documents
-
view
2 -
download
0
Transcript of Measuring Compact Urban Form: A Case of Nagpur City, India

Sustainability 2014, 6, 4246-4272; doi:10.3390/su6074246
sustainability ISSN 2071-1050
www.mdpi.com/journal/sustainability
Case Report
Measuring Compact Urban Form: A Case of Nagpur City, India
Rajashree Kotharkar 1,†
, Pankaj Bahadure 1,†,
* and Neha Sarda 2,†
1 Department of Architecture and Planning, Visvesvaraya National Institute of Technology, Nagpur
440010, India; E-Mail: [email protected] or [email protected] 2 Architect-Planner, Nagpur 440010, India; E-Mail: [email protected]
† These authors contributed equally to this work.
* Author to whom correspondence should be addressed; E-Mail: [email protected] or
[email protected]; Tel.: +91-712-280-1063; Fax: +91-712-280-1376.
Received: 23 March 2014; in revised form: 29 May 2014 / Accepted: 6 June 2014 /
Published: 9 July 2014
Abstract: The compact city concept is adopted in city planning policies of many developed
countries for the following benefits: efficient use of land while curtailing sprawl, reduction
in transport network and reliance on mass transport, a socially interactive environment with
vibrancy of activities, economic viability, etc. However, it is still debated whether the cities
in developing countries like India, which are already dense, will really benefit from the
compact city form. Measuring urban form and compactness of these cities becomes more
important for understanding the spatial urban structure to intervene accordingly for
sustainable urban development. This paper explores various parameters and dimensions of
measurement of compactness. Urban form characteristics and their indicators are derived
for the study of Nagpur city, India. This study is an attempt to measure the urban form to
derive the benefits of compactness. The study indicates that Nagpur city, inherently has a
compact form, but may disperse in near future; and there is a need to implement policies to
retain its compact character to achieve sustainable urban development.
Keywords: compact cities; urban form; planning Indian cities; measuring urban compactness;
sustainable urban development
OPEN ACCESS
Sustainability 2014, 6 4247
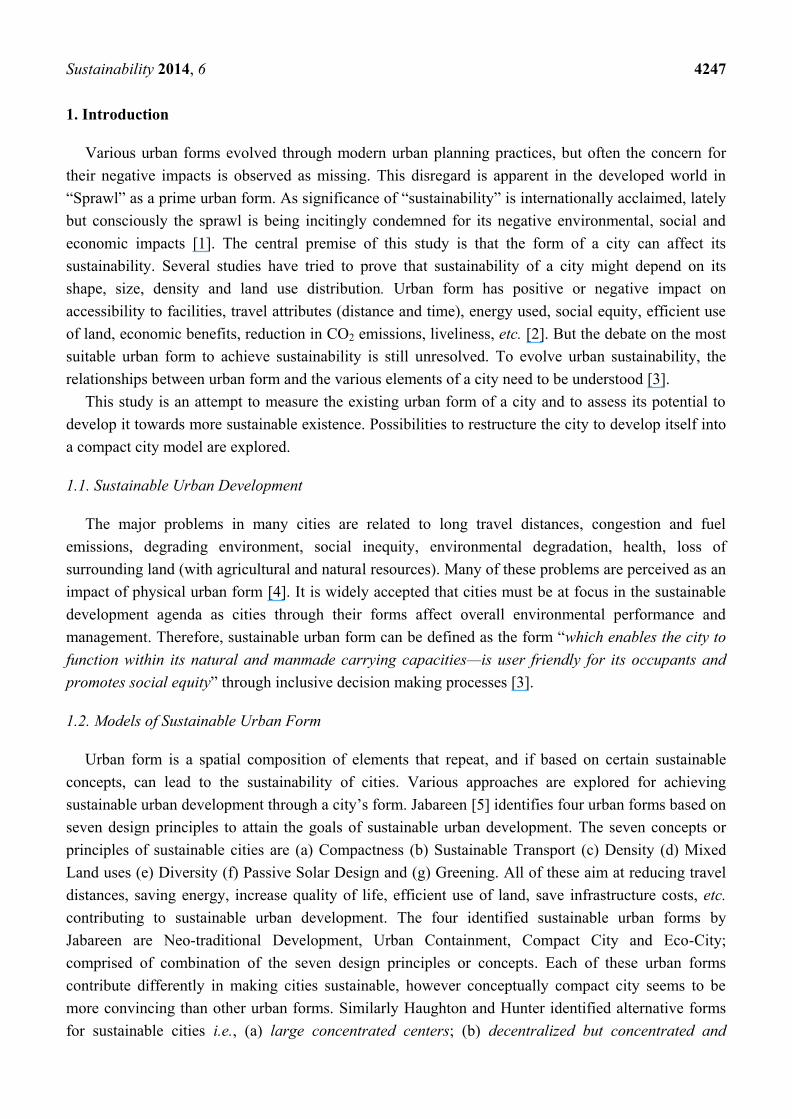
1. Introduction
Various urban forms evolved through modern urban planning practices, but often the concern for
their negative impacts is observed as missing. This disregard is apparent in the developed world in
―Sprawl‖ as a prime urban form. As significance of ―sustainability‖ is internationally acclaimed, lately
but consciously the sprawl is being incitingly condemned for its negative environmental, social and
economic impacts [1]. The central premise of this study is that the form of a city can affect its
sustainability. Several studies have tried to prove that sustainability of a city might depend on its
shape, size, density and land use distribution. Urban form has positive or negative impact on
accessibility to facilities, travel attributes (distance and time), energy used, social equity, efficient use
of land, economic benefits, reduction in CO2 emissions, liveliness, etc. [2]. But the debate on the most
suitable urban form to achieve sustainability is still unresolved. To evolve urban sustainability, the
relationships between urban form and the various elements of a city need to be understood [3].
This study is an attempt to measure the existing urban form of a city and to assess its potential to
develop it towards more sustainable existence. Possibilities to restructure the city to develop itself into
a compact city model are explored.
1.1. Sustainable Urban Development
The major problems in many cities are related to long travel distances, congestion and fuel
emissions, degrading environment, social inequity, environmental degradation, health, loss of
surrounding land (with agricultural and natural resources). Many of these problems are perceived as an
impact of physical urban form [4]. It is widely accepted that cities must be at focus in the sustainable
development agenda as cities through their forms affect overall environmental performance and
management. Therefore, sustainable urban form can be defined as the form ―which enables the city to
function within its natural and manmade carrying capacities—is user friendly for its occupants and
promotes social equity‖ through inclusive decision making processes [3].
1.2. Models of Sustainable Urban Form
Urban form is a spatial composition of elements that repeat, and if based on certain sustainable
concepts, can lead to the sustainability of cities. Various approaches are explored for achieving
sustainable urban development through a city’s form. Jabareen [5] identifies four urban forms based on
seven design principles to attain the goals of sustainable urban development. The seven concepts or
principles of sustainable cities are (a) Compactness (b) Sustainable Transport (c) Density (d) Mixed
Land uses (e) Diversity (f) Passive Solar Design and (g) Greening. All of these aim at reducing travel
distances, saving energy, increase quality of life, efficient use of land, save infrastructure costs, etc.
contributing to sustainable urban development. The four identified sustainable urban forms by
Jabareen are Neo-traditional Development, Urban Containment, Compact City and Eco-City;
comprised of combination of the seven design principles or concepts. Each of these urban forms
contribute differently in making cities sustainable, however conceptually compact city seems to be
more convincing than other urban forms. Similarly Haughton and Hunter identified alternative forms
for sustainable cities i.e., (a) large concentrated centers; (b) decentralized but concentrated and

Sustainability 2014, 6 4248
compact settlements linked by public transport; (c) dispersal in self-sufficient communities [6].
The variations described mostly deal with the form of a compact city. Compact urban form
development becomes one of the approaches that seem to have the potential to play an important role
in designing sustainable cities.
1.3. Urbanization in India
The last few decades have experienced unprecedented urban growth in the developing world,
particularly in Asia and Africa, where a three times increase in the built up urban area (up to 0.6
million square km of cities with million plus populations) from year 2000 to 2030 is projected [7].
Developing countries see it as an opportunity for development and accept it as preferable.
Urbanization is perceived as the result of up gradation of human civilizations with proven benefits of
economic growth and development. Developing countries need cities to attract human capital for basic
economic sustenance [8].
Indian cities occupy 10% of the world’s total urban area and house more than one tenth of the world
urban population [9]. The present pace and scale of urbanization in India will shortly result in the
majority of its population residing in urban areas, which may threaten its sustainability. The quality of
life in already strained cities is likely to degrade further, and the tremendous rate of urbanization will
have a significant environmental impact. The development of self-capability is a challenge, while the
opportunity is in creating growth which is socially inclusive and environmentally friendly [10].
The urbanization in India will definitely have an impact on global sustainability as India’s share in global ecological footprint will increase in near future (refer Table 1). Hence, building sustainable
cities will be a key to hold India’s growth in future.
Table 1. Status of Urban India with relation to the World.
Continent/Country Average (Persons per
Hectare)
% of World’s Urban Area
% of World’s Urban Population
World 43 100 100
Africa 70 11.2 10.3
North America 16 13.4 13.5
South America 57 7.7 8.5
Australia 14 0.7 0.7
Europe (EU) 28 9.3 7.4
Russia 32 4.2 2.6
Asia 70 51.3 56.0
India 120 10.1 10.6
1.4. Concept of Compact City
The genesis of Compact City lies in the sustainability imperatives of resource conservation and
waste-minimization as embodied in the Brundtland Commission report and the UNCED Agenda 21
proposals published in the late eighties and the early nineties [11].
Ewing’s argued idea is ―high densities impels less space observed per capita with more land for
agriculture and open spaces; bus and rail serves better in dense settlements with lesser reliance on

Sustainability 2014, 6 4249
automobiles; and higher densities reduce society’s environmental footprint and slow the consumption
of nonrenewable resources‖ [12]. A compact city form can facilitate for mass transport and reduction
in travel distances, emphasis on pedestrian traffic, efficient use of land through high population
densities, social cohesion and cultural development, and the economy in per capita cost of
infrastructure provision and minor businesses by making a supportive threshold population available,
implanting more vibrancy in cities. The benefits of compact cities are perceived more through high
density and public transit [13].
Thus, a possible solution offered for achieving sustainable urban form is that of ―Compact City
Model Development‖. Essentially the compact city model defined as ―…a high density, mixed use development, within a restrictive geographical area with enhanced public transport and infrastructure
facilities‖. However, there are debates about the merits of a compact urban form. The excess increase
in building and population density may result in overcrowding in residential areas as is seen from the
examples of Hong Kong. Provision of ample amount of per capita open space is important to maintain
quality of life, which becomes difficult in compact cities. Irrespective of the type of urban form,
management of the city is more important to achieve sustainability, and it is more complex in compact
urban forms [5]. The contained urban land in compact settlements which is shared by more people with
high density may have higher land prices not affordable to disadvantageous groups. Noise pollution is
the major concern in mix land use areas and conflict may occur with diversified uses. Adaptability to
compact living, high density and mass transit is highly culturally and regionally dependent. Compact
forms may be more prone to devastation in case of disasters. Thus, the constraints lie in provision of
open spaces, overcrowding, complex urban management, increased land prices, pollution, regional
adaptability, disaster resiliency, etc.
2. Measuring the Urban Form
2.1. Need for Measuring Urban Form
Cities are constantly evolving and at any point of time exhibit their unique character through their
urban structure, which can be mapped and measured. Cities have a hidden structure which is to be
understood only through analyzing the data, more particularly the land use and population distribution.
It becomes evident in today’s context to monitor and manage the spatial expansion of cities which is more complex now [14,15].
The scales at which urban form can be measured include the individual building, street, urban
block, neighborhood and city [16]. These levels of spatial disaggregation influence how urban form is
measured, analyzed and ultimately understood. Understanding the spatial organization of a city allows
planners to (i) decide the course of action for future development; (ii) frame strategies that are integral
to the existing spatial structure; and (iii) influence the evolution of the existing structure in a manner
consistent with planning objectives [15,17]. Spatial structure of a city is a result of impact of events,
technologies, policies and preferences throughout the history of a city, and hence investigating it is
much more complex and challenging [2].
Though compact urban form is seen as a sustainable urban form, it is important to measure the
compactness of urban form through various urban characteristics, for its intended benefits.

Sustainability 2014, 6 4250
2.2. Approaches for Measuring Urban Form
Various measures of urban form are developed by researchers, which also include the methods of
diagnosing sprawl in a city. The research work majorly relates to understanding the impact of urban
form on transport behavior and environmental, social, and economic variables. The indicators (refer to
Table 2) broadly represent key urban form characteristics and mainly attempt to study the four aspects:
(i) resident population distribution over the urban area measured by density distribution; (ii) distribution
of areas of commercial and recreational activities, services, employment, etc. within the city in relation
to the place of residence; measured by diversity, mixed use; accessibility, composition, size, shape;
(iii) nature of transportation network and modes people use for travel; (iv) design quality of the built
form encouraging or discouraging certain behaviors. Thus, urban form can be studied and evaluated on
the basis of analysis of the data related to the above aspects [2].
Table 2. Various Approaches to Measure Urban Form; Source: [2], Literature Review.
S. No. Researcher Trends Measured Indicators/Study Variables
1 Jabareen, Y.R. [5] Urban Form Types and their
Sustainability
Assessment of urban forms for their sustainability through ranking of various urban
elements or concepts in each urban form type viz. Density, Diversity, Mixed land use,
Compactness, Sustainable Transportation, Passive Solar Design and Ecological Design
(Greening)
2 Galster, G., et al. [18] Urban Sprawl Index Measurable aspects of land use patterns: density, continuity, concentration, clustering,
centrality, nuclearity, mixed use and proximity
3 Ewing R., Pendall, R.
and Chen, D. [19]
Sprawl Indices for
four components
Indicators of urban form: (a) residential density; (b) neighborhood mix of homes,
jobs and services; (c) strength of activity centers and downtowns;
(d) accessibility of the street network
4 Bertaud, A. [14] Spatial Structure of City
Two principal components (a) the spatial distribution of the population as recorded by
census data and (b) the pattern of trips made by people when they go from their
residence to other locations for work, school, shopping, social activity, etc.
5 Song, Y. and
Knaap, G. [20] Development patterns
Five key characteristics of neighborhood form: street design and circulation system;
density; land use mix; accessibility; and pedestrian access.
6 Krizek, K.J. [21]
Relationship between
neighborhood accessibility
and transportation behavior
Composite indicator of neighborhood accessibility based on housing density,
landuse mix (number of employees in neighborhood retail) and street design.
7 Hess, P.M., et al. [22] Relationship between site
design and pedestrian travel. Using block size and length and completeness of sidewalks as indicators
8 Burton, E. [23] Relationship between
density social equity
Key urban form characteristics looked at were: density, mix of uses, and
intensification.
9 Fulton, W., et al. [24] Trends in urban form and
land consumption Actual measurement of urbanized land and density in metropolitan areas
10 Knaap et al. [16] Multidisciplinary measures
of urban sprawl
Measurement of density- its distribution and variation; measures of shape,
accessibility, transport networks, neighborhood design, landscape ecology, etc.
11 Tsai, Y. [25]
Measures to distinguish
compactness from sprawl;
at the metropolitan level
Measuring form through dimensions of—size (population), density, degree of
equal distribution (Gini coefficient) and degree of clustering (Moran coefficient)

Sustainability 2014, 6 4251
3. Methodology
3.1. Aim, Objective and Case Study Selection
The aim of this study is to measure the urban form for discovering the potential of its compactness
if present. The objectives are: (i) to explore various measures of urban form through literature review;
(ii) to derive appropriate indicators and to find out whether present urban form of the selected city
contains compact urban characteristics which are favorable for achieving sustainable urban development.
The premise of this study is that compact urban form is sustainable.
Initially a set of urban form characteristics and the respective indicators are derived from the literature
review. As a case study, Nagpur city—the largest city in central India within a radius of 500 km with
considerable urban growth and influence on the region is selected (refer to Table 3 for statistics). The
urban context of Nagpur city is studied by interpreting data collected (through secondary sources) for
measuring and understanding the urban form. At the end, the level of compact development of Nagpur is
assessed through data analysis and findings. The conclusions drawn are used to propose policies and
strategies to intervene and restructure the urban form to achieve sustainable (compact) urban form.
Table 3. Landuse Distribution as per Development Plan 2000–2011 of Nagpur and
Comparison with UDPFI Guidelines (Source: [26,27]).
Sr.
No. Major Landuse Purpose
Area
(ha)
% to Total
Area
% to Developed Land
Actual Existing in City (%) UDPFI Recommendations (%)
1 Residential 3500 16.08 41.966 40–45
2 Commercial 185 0.85 2.218 3–4
3 Industrial 225 1.08 2.697 8–12
4 Public Purpose 2000 9.19 23.980 10–12
5 Public Utility 100 0.47 1.199
6 Roads 555 2.55 6.654 12–14
7 Railway 440 2.08 5.275
8 Airport 525 2.42 6.294 -
9 Garden and Playground 150 0.69 1.798 18–20
10 Developable Vacant Land 660 3.03 7.919 -
Total Developed Area 8340 38.40 - -
11 Agriculture 8000 36.78 - -
12 Forest 225 1.03 - -
13 Water Tank 456 2.09 - -
14 Nallas (Rivulets) 380 1.74 - -
15 Non-Developable Land 4355 20.02 - -
Total Area under Municipal Corporation 21756 100 - -
3.2. Analysis: Measuring the Urban Form of Nagpur City
3.2.1. Analyzing Form of the City
Nagpur has a history of 300 years and its urban growth expanded from the central historic core.
Alain Bertaud’s [14] method of analyzing the spatial organization of a city is used to assess whether

Sustainability 2014, 6 4252
Nagpur city demonstrates a monocentric, polycentric or a composite model. Here, the spatial organization
of a city means the two superimposed patterns—(i) the spatial pattern of population distribution within
the city’s built up area when people are at home and (ii) the pattern of movement people make around
the city during the day. Thus, after superimposing the two patterns i.e., population distribution and
population movement pattern, the model derived for Nagpur city is found to be a composite model i.e.,
mono—polycentric model with a dominant center and some sub-centers (Sub centers identified within
the city on the basis of Origin and Destination survey for intra city trips. These are the special zones
where trip-ends are very high [28]); and with simultaneous radial and random movements of people
across the urban area [28]. The ―Center of Gravity‖ (CG) (Center of Gravity is the point to which the
sum of distance from all other points of the shape (i.e., urban builtup area) is the shortest) identified is
Sitabuldi (Sitabuldi area has been identified as the CBD as well as CG which is located in the center of
the city, along the major interchange node i.e. railway station, inter-city and intra-city bus stations. It is
a major interface between East and West city parts) area (refer Figure 1).
Figure 1. Nagpur’s composite model of spatial organization: Density Distribution; Traffic movements; Sub-Centers and Sitabuldi area as CG.
3.2.2. Derived Set of Indicators
A set of urban form characteristics are identified and their indicators are derived with reference to
the literature (refer to Table 4).
For the purpose of measuring the spatial structure/urban form of the city, the set of indicators for
mixed use and land composition characteristics (item F in Table 4) are mapped and analyzed at the
ward (tract) level as they could not be mapped at the city level. This is out of the scope of this paper
and hence omitted in the discussion.

Sustainability 2014, 6 4253
Table 4. Derived Set of Urban form Characteristics and Indicators.
Key Urban Form
Characteristics Indicators
Key Urban Form
Characteristics Indicators
A. Density Gross population density
Average (built up area) density
Landuse spilt up
Average land consumption per person
D. Accessibility
Service Accessibility
Public transport
Accessibility
B. Density
Distribution/Dispersion
Density profile
Density gradient
Population by distance to the center
of gravity or CBD
E. Shape Dispersion Index
C. Transportation
Network
Mode share
Average trip length
Road network density
Congestion index
Walkability index
F. Mixed Use
Land Composition
Land use split up
Ratio of residential to
non-residential use
Ratio of built to open
area
4. Data Interpretation
The urban context of Nagpur is studied; the findings are then used to assess the existing level of city’s
compactness and to evaluate the appropriateness of compact development as a growth option for Nagpur.
The detailed interpretations of the derived urban form characteristics in this study are described below.
4.1. Density
Density and its spatial distribution is a basic component of urban form and is used widely for sprawl
assessments. Reduction in density over time is considered an indication of urban sprawl and density
distribution defines the compactness of urban form [2]. More logically, the density calculations should
be based on the built-up area (developed area (Developed area/Built up area: Measures land area
consumed by urban activities within a metropolitan area across administrative boundaries. It does not
include large parks (>4Ha), airport, agricultural land, undeveloped vacant land and water bodies. In
this study, such areas are deducted to calculate built-up area (developed area), e.g., the areas under
campuses of government restricted areas, educational and research institutes (e.g., VNIT, NEERI and
Central Jail) etc.)) rather than the administrative area of the city. This is because a city may not be
occupying the whole administrative area or may spill over the administrative area limits or has large
undeveloped patches within administrative area; and hence may not represent the true average population
density. Three indicators are derived to understand the ―Density‖ pattern in the city: (i) Gross
population density (ii) Average (built up area) density; (iii) Average land consumption per person.
The total area under Development Plan 2000–2011 of Nagpur is 235.21 square km, consists of the
area under Nagpur Municipal Corporation (NMC) and area outside of NMC limits admeasuring 217.56
square km and 17.65 square km respectively. For administrative purposes, the NMC area is divided
into 10 zones which are presently subdivided into 136 wards [26]. To understand Nagpur city’s context internationally, a comparison with similar world cities is done with respect to population size, density
and urban area (refer to Table 5).

Sustainability 2014, 6 4254
4.1.1. Gross Population Density & Average (Built up Area) Density
It is observed that in Nagpur, almost 50% zones and about 25% of total 136 wards have gross
population density below 100 pph (Figure 2 and Figure 3a,b). In some peripheral wards density is as low as
20–32 pph whereas inner and core area density is as high as 750–1000 pph. As per UDPFI (Urban
Development Plans Formulation and Implementation (UDPFI) Guidelines are prepared and published by
Ministry of Urban Development, Government of India, New Delhi in 1996 to facilitate preparation of
spatial development plans of urban centers in India) guidelines, urban density of developed area should be
100–150 pph [27]. Two dominant density range in Nagpur are of 75–150 and 250–400 pph and population
is mainly concentrated within 5 km radius from CG. The gross density increased almost three times
since 1971 whereas the average (builtup area) density increased one and a half times (refer to Table 6).
Figure 2. Density Distribution Map of Nagpur City (Ward wise), 2001.
Figure 3. (a) Zone Wise Population Distribution, 2001 & 2011; (b) % of City’s Area Covered by Population Densities.
(a) (b)

Sustainability 2014, 6 4255
Table 5. Comparison of Nagpur City with World Cities (Source: [9]).
A: Similar Population Wise
Countries Guiyang (China) Lisbon Tampa USA) Manchester (UK) Pretoria Brasilia Nagpur
Population 2,600,000 2,669,000 2,683,000 2,560,000 2,550,000 2,426,000 2,405,665
Urban Area of city (Hectares) 32400 65800 264700 630 123000 67300 21756
Gross Population Density (pph) 86 28 10 41 21 36 111
B: Similar Urban Area Wise
Countries Leipzig (Germany) Zurich Daegu (S.Korea) Catania (Italy) Shiraj (Iran) Mendoza (Argentina) Nagpur
Urban Area of city (Hectares) 24600 24600 24600 24600 24600 24600 21756
Population 575,000 747,000 2,400,000 720,000 1,729,000 970,000 2,405,665
Gross Population Density (pph) 23 30 98 29 70 39 111
C: Similar Density Wise
Countries Lima Lahore Jos (Nigeria) San Salvador Singapore Xinxiang Nagpur
Gross Population Density (pph) 113 113 110 108 105 103 111
Urban Area of city (Hectares) 85500 73800 7000 15500 51800 10400 21756
Population 9,668,000 8,376,000 772,000 1,672,000 5,428,000 1,068,000 2,405,665
Table 6. General Statistics about Nagpur City (Source: [26,29], Census of India Data).
Year 1971 1981 1991 2001 2011
Adm. Area of city (Hectares) - 21756 21756 21756 21756
Population 864,488 1,219,461 1,650,751 2,051,946 2,405,665
Gross Population Density (pph) 40 56 76 94 111
Developed (built up) Area (Hectares) 7057 8425 9794 12481 13609
Developed Area (built up) Density (pph) 123 145 169 164 178

Sustainability2014, 6 4256
4.1.2. Land Use Split up
As per the Development Plan of Nagpur 2000–2011, out of the total area of 21,756 hectares
available within the Municipal Corporation limits, only 8340 hectares (38%) was notified for development
(refer Table 3). Another about 38% of the land was kept under agriculture and forest cover and 4% was
under nallahs (rivulets) and water bodies. As per Urban Development Plans Formulation and
Implementation (UDPFI) guidelines, the land use distribution of developed land (as proposed in
Development Plan) conforms to the guidelines in the case of residential usage. Presently, much of the
agricultural green belt is encroached upon and developed as built-up residential sprawl. The city has
large agriculture land, forest cover and institutional open spaces which is compensating the deficit of
land under parks and gardens (recreational spaces) which is only 2%. There is need to avail more land
for recreational purposes from the proportion of land earmarked for public and semi-public use. This
will increase the proportion and accessibility of commercial and recreational uses to support high
density and compact development. Almost 660 Ha (i.e., approximately 8%) of developable vacant land
is still available within the NMC administrative limits [26,29] that may be put to use.
4.1.3. Average Land Consumption Per Capita
The land consumption per capita is directly derived from the density. Figure 4 and Table 7 show the
per capita land consumption for Nagpur. In absence of ideal figures for land consumption, benchmarks
may be decided by comparing space consumption by other uses, in this case the transport mode is
compared [14]. The dotted line in Figure 4 shows the amount of land space required by a car to park
and to maneuver which is 40 sqm. In 2011, the developed land area per person in Nagpur was 56.57 sqm,
so it may be inferred that in Nagpur a car consumes almost 70% space of a person. Individual use of
car as transport means will be more disruptive in cities with lesser consumption of land per capita.
In cities with very low land consumption per capita, such as Nagpur or even in other metropolitans
around the world like Shanghai, Moscow and Paris the car is encroaching on people’s share of space, which is spatially more disastrous in very dense cities. To carve for more space for vehicles, the
policies for promoting dispersal of population will be adopted resulting in low population densities and
sprawl. Alternately, the option of restricting car use will retain and promote compact developments [14].
Figure 4. Average land consumption per capita for Nagpur.

Sustainability 2014, 6 4257
Table 7. Land Consumption Change Over Decades.
Year 1971 1981 1991 2001 2011 land space required by a Car
Per Capita Land Consumption (sqm) 81.63 69.09 59.33 62.98 56.57 40.00
4.2. Density Distribution/Dispersion
Population is distributed or dispersed within a metropolitan area (developed urban area or urbanized
area) with varying densities. ―Density distribution‖ pattern in a city can be understood through three
indicators: (i) density profile; (ii) population by distance to the CBD or Center of Gravity (CG) and
(iii) density gradient.
4.2.1. Density Profile
The density profile is derived by plotting population on x-y axis where vertical axis denotes the
urban builtup area densities or developed area densities and the horizontal axis represents the distance
from the CBD or CG in regular intervals of 1 km. Figure 5 shows the rings (at approximately 1 km
interval) around CG delineated as per the ward boundaries of Nagpur. The rings are not perfectly
circular due to the constraint of ward wise population data availability. Thus, the density profile
represents the dispersion across metropolitan area and agglomeration of people around CBD or CG.
Figure 5. Consecutive rings at a horizontal spacing of 1 km centered on the CG are
rearranged as per the ward delineation.
A negatively sloped exponential curve is formed if the densities are high at the center of city and
decrease away towards periphery [14]. Thus, the average trip length i.e., the median distance per

Sustainability 2014, 6 4258
person to the CBD will be less in such case where more people reside near CBD [30]. On the contrary,
longer average trip lengths will occur in positively sloped density profile.
The spatial distribution of density in a metropolitan area determines the shape performance in terms
of average travel distance from CBD or CG. The density profile is a measure of the average
consumption of land and distribution of this consumption across the city. It also determines the origin
of majority of trips within a city [15].
By observing the density distribution map of Nagpur city (Figure 2), it can be inferred that the
density profile in Figure 6a is not a very true representation of the actual spatial density distribution
pattern within the city. The north-south railway line divides the city into east and west parts. These
parts hold distinct urban characteristics. There seems to a high pressure on East, as all the high range
densities are concentrated in the East part only. Therefore, to analyze the actual density distribution
pattern within the city, the density profile of East and West Nagpur is also mapped separately and
compared (Figure 7).
Figure 6. (a) Density Profile and Distribution from CG; (b) Cumulative Population by
Distance from CG or CBD, for Nagpur city (year 2001).
(a) (b)
Figure 7. East-West Distribution of Density Profile.
Sustainability 2014, 6 4259
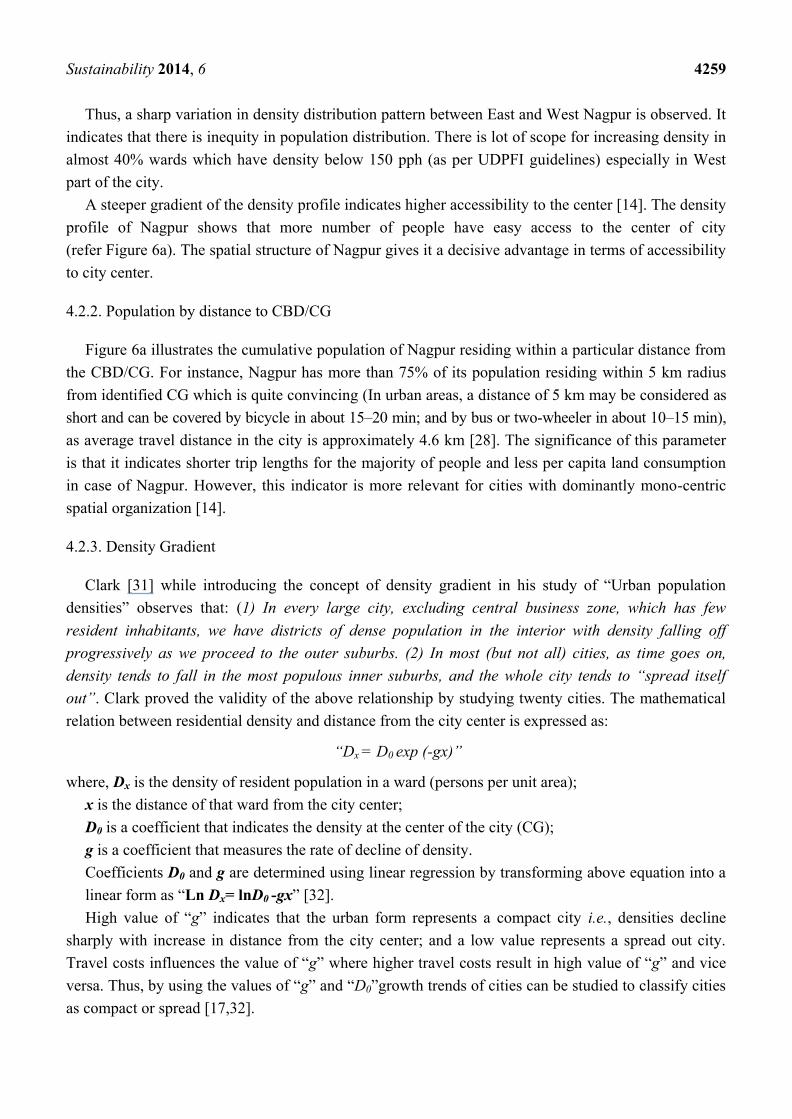
Thus, a sharp variation in density distribution pattern between East and West Nagpur is observed. It
indicates that there is inequity in population distribution. There is lot of scope for increasing density in
almost 40% wards which have density below 150 pph (as per UDPFI guidelines) especially in West
part of the city.
A steeper gradient of the density profile indicates higher accessibility to the center [14]. The density
profile of Nagpur shows that more number of people have easy access to the center of city
(refer Figure 6a). The spatial structure of Nagpur gives it a decisive advantage in terms of accessibility
to city center.
4.2.2. Population by distance to CBD/CG
Figure 6a illustrates the cumulative population of Nagpur residing within a particular distance from
the CBD/CG. For instance, Nagpur has more than 75% of its population residing within 5 km radius
from identified CG which is quite convincing (In urban areas, a distance of 5 km may be considered as
short and can be covered by bicycle in about 15–20 min; and by bus or two-wheeler in about 10–15 min),
as average travel distance in the city is approximately 4.6 km [28]. The significance of this parameter
is that it indicates shorter trip lengths for the majority of people and less per capita land consumption
in case of Nagpur. However, this indicator is more relevant for cities with dominantly mono-centric
spatial organization [14].
4.2.3. Density Gradient
Clark [31] while introducing the concept of density gradient in his study of ―Urban population densities‖ observes that: (1) In every large city, excluding central business zone, which has few
resident inhabitants, we have districts of dense population in the interior with density falling off
progressively as we proceed to the outer suburbs. (2) In most (but not all) cities, as time goes on,
density tends to fall in the most populous inner suburbs, and the whole city tends to ―spread itself out‖. Clark proved the validity of the above relationship by studying twenty cities. The mathematical
relation between residential density and distance from the city center is expressed as:
―Dx = D0 exp (-gx)‖
where, Dx is the density of resident population in a ward (persons per unit area);
x is the distance of that ward from the city center;
D0 is a coefficient that indicates the density at the center of the city (CG);
g is a coefficient that measures the rate of decline of density.
Coefficients D0 and g are determined using linear regression by transforming above equation into a
linear form as ―Ln Dx= lnD0 -gx‖ [32]. High value of ―g‖ indicates that the urban form represents a compact city i.e., densities decline
sharply with increase in distance from the city center; and a low value represents a spread out city.
Travel costs influences the value of ―g‖ where higher travel costs result in high value of ―g‖ and vice
versa. Thus, by using the values of ―g‖ and ―D0‖growth trends of cities can be studied to classify cities
as compact or spread [17,32].

Sustainability 2014, 6 4260
In a similar study in India, Adhvaryu [31] calculated density gradient values for Ahmedabad city
over a span of three decades and observed that density gradients in Ahmedabad are becoming flatter
over the years, and represent a similarity with the exponential model derived by Clark.
The density gradient values calculated in this study of Nagpur for the years 1971 to 2011 show a
declining trend (refer to Figure 8 and Table 8). It is inferred that the city is exhibiting a tendency
towards ―spreading out‖ or dispersion. The city center densities declined during the last few decades
hinting that people are moving out from central areas to peripheral ones, as predicted by Clark. The
density gradient value (for year 1991) of Nagpur is compared with other world cities to know the
similitude (refer to Table 9). Density gradient directly represents the urban sprawl, wherein a flattening
density gradient indicates the sprawl with increasing densities in the periphery. In the case of polycentric
cities it may be an exception as the densities are higher around multiple centers or nodes, resulting in
flatter density gradient.
Figure 8. Density Gradients for Nagpur City from 1971–2011.
Table 8. Density gradient values for Nagpur City.
Year 1971 1981 1991 2001 2011
―g‖ value for Nagpur −0.549 −0.442 −0.429 −0.304 −0.188
―D0‖ value for Nagpur 6.735 6.658 6.888 6.415 6.044
―R2‖ value for Nagpur 0.398 0.320 0.273 0.320 0.172
Table 9. Comparison of Density gradient values (1990 data) of World Cities with Nagpur
City Source [17].
Countries Brasilia Hong Kong Mexico City Singapore Cape Town Barcelona Atlanta Guangzhou Moscow Nagpur
―g‖ value +0.037 −0.113 −0.034 −0.195 +0.010 −0.98 −0.036 −0.489 +0.047 −0.429
―R2‖ value 0.34 0.69 0.79 0.97 0.32 0.89 0.97 0.95 0.44 0.32
4.3. Transportation Network
There is a strong relationship between transport networks and urban forms. Better intra urban connectivity
and accessibility is a prerequisite for sustaining compact urban form. Hence, the transportation network
is an important urban form characteristic at all spatial scales (metropolitan level, sub-metropolitan or

Sustainability 2014, 6 4261
neighborhood level). Better connectivity with transport facilities and shorter trip distances encourage
the use of non-motorized modes, which results in better air quality and imbibing a greater sense of
belonging among residents: these are the desired ingredients of the compact urban form [2].
In this part of the study, five indicators (all the indicators under transportation network have been
derived on the basis of secondary source data i.e., transportation and household surveys conducted by a
government appointed agency (L&T Ramboll) in the year August 2007) are selected directly from the
secondary sources to understand the transportation network in the city: (i) Mode share; (ii) Average
trip length; (iii) Road network density; (iv) Congestion index; (v) Walkability index. The secondary
data and indicator values in this set are based on a study by Wilber Smith Associates [33].
4.3.1. Mode share
―Significant number of trips in Indian cities is made by foot, i.e. around 16%–58%‖ [33]. Another
study specific for Nagpur by L&T Ramboll in 2008 put the figure of non-motorized traffic as 58%,
while other modes as: Cars—1%, IPT—9%, Bus—5% [28] (refer to Table 10). In case of Nagpur,
non-motorized mode of transportation has a high share in modal split and a very less share of cars
(refer to Figure 9a for national comparison), therefore the approach and strategies should be either to
increase or at least maintain the high share of non-motorized traffic. If compared with large cities
around the world (Figure 9b), Nagpur has less share of transit or public transport modes, this may be
due to less investment in public transport infrastructure and probably due its medium city size.
Table 10. Mode Share of Trips in Nagpur (Source: [28,33]).
Transit Mode % of Trips
(Source [28])
% of Trips
(Source [33])
Ideal Values (%) for this Category
of City (2–4 million) (Source [33])
Non-Motorized mode (Walk) 25.6 20 -
Non-Motorized mode (Cycle Rickshaw and Bicycle) 32.4 28 15–20
Two-wheelers 26.6 35 10–15
Cars 0.9 3
Bus 4.9 12 60–70
Intermediate Public Transport (IPT) 9.2 2
Figure 9. (a) Mode Share Comparison (National), Source [33]; (b) Mode Share
Comparison (Global), Source [34].
(a) (b)

Sustainability 2014, 6 4262
4.3.2. Average Trip Length
Average trip length is calculated as the ratio of total passenger- kilometers travelled to the total
number of trips. Trip length is directly related to the city size or area of a city; trip length increases as
city size increases. It is also dependent on the population density distribution over the urbanized area.
In Nagpur city, 64.85% of work trips and about 74.16% of business trips are confined to a distance
of 5 km while 69.37% of education trips and 65.67% of shopping trips are confined to distance
of 3 km. The key observations are: (i) average travel distance in the city is 4.6 km and average travel
time is 18.64 min; (ii) average travel distance for purpose of work and business is 5.3 km; (iii) trip
length by mode (under private mode of transportation), the average travel distance is 6.46 km by 2
wheelers and 9.92 km by cars [28]. Thus, it may be concluded that the average trip length for Nagpur is
shorter (as per the study conducted by Wilber Smith Associates (2008) the average trip length for
Nagpur is shorter when compared to few cities having similar population range and much shorter when
compared to large cities in India) and the majority of trips are within 5 km.
4.3.3. Road Network Density
The main road network consists of the primary and secondary road network (arterial) and
it essentially services major intra urban connections. Road Network Density assesses penetration
of transport arteries into the urban builtup areas and their accessibility. This indicator also evaluates
the road capacity and permeability of urban land. Higher value of road network density and lower
value of road length per person indicates sustainable urban form with respect to transportation
parameters (refer to Figure 10 showing Seoul, Singapore, Hong Kong, etc. with more reliance on
transit or public mode). Higher road network density may curb congestion on roads by providing more
transport corridors and route alternatives. Less road length per person may indicate higher congestion
levels if more reliance is on private modes i.e., cars [35]. As the city spreads out with decline in
population density, the road network density may decline and road length per person may increase. In
Nagpur, the total length of major roads is 500 km (plus 1500 km internal roads) [36]. The gross road
network density calculated is 22.98 m/ha (total road length/total builtup of city) and builtup area road
network density is 36.74 m/ha; road length per person is 0.2078 m/person.
Figure 10. Road Network Density for Nagpur and World Cities [35,36].

Sustainability 2014, 6 4263
4.3.4. Congestion Index
Congestion may lead to increase in travel time due to less travel speed which in turn reduces road
efficiency. In other terms, higher congestion reduces the mobility i.e., how effectively users can
perform trips. Increase in congestion leads to lesser safety, degrading environment and limiting
economic developments [33]. Congestion and mobility are like antonyms, most often the same
measures of effectiveness can be used to monitor both of them.
The congestion index is formulated as follows: Congestion index = 1 − (A/M); where, M is
Desirable Average journey speed on major road networks of a city during peak hour, which is
assumed as 30 kmph, and A is Average journey speed observed on major corridors of the city during
peak hours. In a study by Wilber Smith and Associates, the index for the 30 Indian cities is presented
in Figure 11. A lower index value indicates better mobility and lower congestion levels. For Nagpur,
the evaluated value of congestion index is 0.24, which is close to the average index value reflecting an
average road network system in the city. Chandigarh has the lowest congestion index (value-0),
reflecting the very good quality of road network [33].
Figure 11. Congestion Index for Indian Cities, Source: [33].
4.3.5. Walkability Index
Though a significant number of trips in Indian cities are made by foot (16%–58%), pedestrian
infrastructure and facilities in Indian cities are inadequate and neglected. A walkability index—considering
availability of foot path on major corridors and overall facility rating by pedestrians, is developed in a
study by Wilber Smith Associates [33] and performance of pedestrian infrastructure is evaluated. It is
expressed as: Walkability Index = [(W1 x Availability) + (W2 x Facility rating)]; where, W1 and W2 are
Parametric weights (assumed 50% for both), Availability is Footpath length/Length of major roads in
the city, and Facility Rating is a ―Score‖ estimated based on opinion on available pedestrian facility.
Figure 12 shows the walkability index calculated for the 30 Indian cities where in higher index value
indicates better pedestrian facilities. For Nagpur, the evaluated value of walkability index is 0.67, which is
above the average index value reflecting that the city has above average or moderate pedestrian facilities.
Though, it is far below the walkability index value for London which is estimated at 1.5 to 1.7 [33].

Sustainability 2014, 6 4264
Figure 12. Walkability Index for Indian Cities, Source: [33].
4.4. Accessibility (Proximity)
Accessibility or proximity of a service, place, or intended activity may be described as how
efficiently with less time and travel distance a person can reach there. It can be measured as the
distance to the nearest place or activity, number of places or activities within a given distance, etc.
Often, it is dependent on the accessibility of travel facilities and the landuse planning [2]. This is a
different approach to study the efficiency of transport network from the conventional one where
transportation is perceived only as motor vehicle traffic, per capita vehicle ownership, vehicle-kilometers,
average traffic speed, roadway, level of service, etc. [33].
Two types of Accessibility indices are developed as part of the study by Wilber Smith Associates [33],
they are (i) Public Transport Accessibility Index and (ii) Service Accessibility Index.
4.4.1. Public Transport Accessibility Index
It is formulated as the inverse of the average distance (in km) required to be travelled to reach the
nearest bus-stop/railway station (suburban/metro) by residents. Higher the index means better public
transport accessibility. For Nagpur the index value is 1.05. i.e., same as the average value for various
Indian cities [33] (refer to Figure 13).
4.4.2. Service Accessibility Index
This index is based on the percentage of work trips completed within 15 min time and 30 min time
for each city. Higher index indicates better service accessibility. In Nagpur, almost 35% of total work
trips are made within 15 min and almost 78% of work trips are accessible within 30 min time. For

Sustainability 2014, 6 4265
Nagpur, index value is 0.78, which is above the average index value of 0.68 (refer to Figure 14)
reflecting that the city has good service accessibility [33]. This could be a result of moderate trip
lengths due to medium city size.
Figure 13. Public Transport Accessibility Index, Source: [33].
Figure 14. Service Accessibility Index, Source [33].
4.5. Shape Performance
The shape of a city can determine its compactness as ―intuition suggests that the more compact and
circular cities should have shorter travel distances‖ [16]. ―Dispersion index‖ (The dispersion index
(earlier known as compactness index) was first defined by Bertaud and Malpezzi in 1999 as: ―All else
being equal, a city shape which decreases the distance between people’s residence and the main place
of work and consumption will be more favorable to the functioning of labor and consumer markets.
For a given built-up area, the shorter the average distance per person to the main place of work or the
main commercial areas, the better would be the performance of the city shape‖ [14]) is used to
evaluate the shape performance of the city.

Sustainability 2014, 6 4266
Dispersion Index
The study of spatial structure of a city involves two components: (a) the distribution of population
over entire city’s built-up areas and (b) the pattern of trips people make from their residence to reach the
place of desired activity. Bertaud argues that the pattern of trips can be expressed as the average distance
per person to the center. In case of a monocentric city, the center is the CBD and in a polycentric city,
the center is assumed to be the geometric center of the city called the center of gravity (CG). Average
distance per person to the center is calculated as: ―[the] product of distance from the centroid of a ward
to the city center and the respective ward’s population‖ and the sum of such products for all wards
divided by city’s total population. Thus, it depends on the weighted score given to each ward as per its population or density [14]. The average distance per person to the geometric center (CG) or CBD, which
will be shorter in a city with less built up area than in a city with more built up area. Hence, the measure
to compare shapes (or spatial structure) of different cities shall be independent of the built up area.
―Dispersion index‖ is calculated as the ratio of ―the average distance per person to the center and the
average distance per person to the center of a circle whose area would be equal to the built up area‖ with
uniform density. This measure called as dispersion index ―p‖ which can be mathematically expressed as:
p = (∑ diwi)/[2/3(A/π)1/2
] or p = (∑ diwi)/(2/3)r
where, di is the distance of the centroid of the ith tract (or ward or zone) from the CBD or CG, weighted by
the tract’s share of population wi; A is the built-up area of the city; r is the radius of a circle with area A [14].
The spatial distribution of population can be mapped in 3D graphical form where each tract or ward
is given a height proportioned to its population (refer to Figure 15 for Nagpur city). The spatial distribution
of population can be simply mapped using census data for the wards in a city. This graphical representation
is a three-dimensional map wherein the height of each of the wards is scaled to its population. The
dispersion index reflects the ―shape performance‖ of a city indicating whether a city is compact or dispersed. As this index is independent of the area and the density of a city; comparison of various
cities with different shapes, sizes, and densities or study of the same city over time, can be made using
this index [14]. Table 11 shows dispersion index values for various cities around globe, wherein the
trend of compactness or dispersion is reiterated from the values in Table 9 for density gradient values.
Figure 15. 3D Representation of Spatial Distribution of Population for Nagpur City.
Sustainability 2014, 6 4267
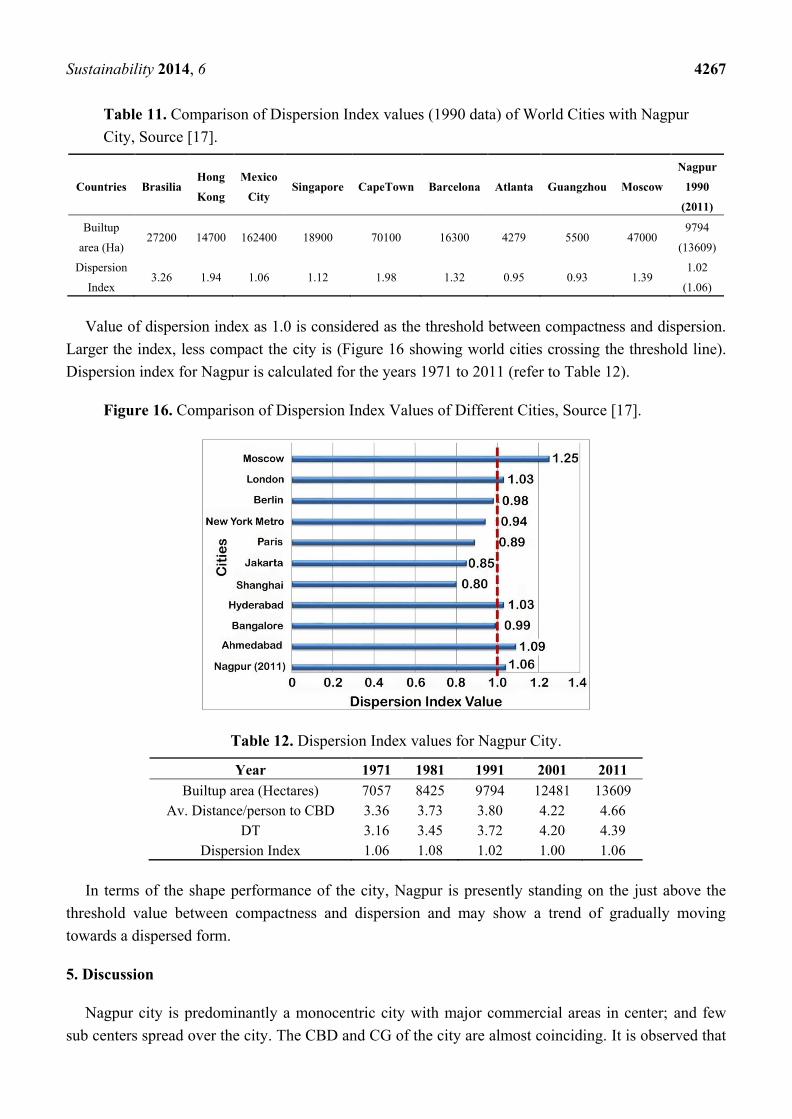
Table 11. Comparison of Dispersion Index values (1990 data) of World Cities with Nagpur
City, Source [17].
Countries Brasilia Hong
Kong
Mexico
City Singapore CapeTown Barcelona Atlanta Guangzhou Moscow
Nagpur
1990
(2011)
Builtup
area (Ha) 27200 14700 162400 18900 70100 16300 4279 5500 47000
9794
(13609)
Dispersion
Index 3.26 1.94 1.06 1.12 1.98 1.32 0.95 0.93 1.39
1.02
(1.06)
Value of dispersion index as 1.0 is considered as the threshold between compactness and dispersion.
Larger the index, less compact the city is (Figure 16 showing world cities crossing the threshold line).
Dispersion index for Nagpur is calculated for the years 1971 to 2011 (refer to Table 12).
Figure 16. Comparison of Dispersion Index Values of Different Cities, Source [17].
Table 12. Dispersion Index values for Nagpur City.
Year 1971 1981 1991 2001 2011
Builtup area (Hectares) 7057 8425 9794 12481 13609
Av. Distance/person to CBD 3.36 3.73 3.80 4.22 4.66
DT 3.16 3.45 3.72 4.20 4.39
Dispersion Index 1.06 1.08 1.02 1.00 1.06
In terms of the shape performance of the city, Nagpur is presently standing on the just above the
threshold value between compactness and dispersion and may show a trend of gradually moving
towards a dispersed form.
5. Discussion
Nagpur city is predominantly a monocentric city with major commercial areas in center; and few
sub centers spread over the city. The CBD and CG of the city are almost coinciding. It is observed that

Sustainability 2014, 6 4268
the population densities in central areas are very high (750–1000 pph) while in the periphery they are
very less (20–32 pph). 25% of wards and 50% of zones have density below 100 pph. 60% of land area
is occupied by low density wards (below 100 pph). Large tracts of land are allocated for peripheral
wards (as the division is based on population) which is increasing the scope for low density sprawl.
Whereas the policy should be to keep the land reserved for future development rather than allowing
development on entire available peripheral land. There seems to be a lot of scope for increasing density
in almost 40% wards which have density below 150 pph (UDPFI guidelines suggest a moderate urban
density of 150 pph). Comparatively East part of Nagpur has higher density than the West part of the
city. Inequity in population distribution, along with disparity in landuse distribution is seen. There is an
increased pressure on East Nagpur. This is undesirable as equity is one of the parameter for sustainability.
The density distribution follows the exponential curve as suggested by Clark’s theory (of distribution of urban population densities) and the tendency of population moving from the center
to the peripheral areas is observed. The present density profile of the city indicates that a major
population portion is concentrated near the city center (within a distance of 5 kms from the city center
or CBD) but presently tends to move from the center to peripheral areas. This movement of people is
likely to be further accentuated in the near future with the upcoming development and extension of
city’s infrastructure and facilities in the city’s periphery. This will promote sprawl and increase the
travel distance.
The density gradient curves for Nagpur plotted for last fifty years indicate that the densities in
central areas are decreasing hinting at spreading out of the city and increase in average travel length.
This is a universal phenomenon as the densities in central areas can’t be increased beyond a certain
limit. People move out under pressures of congestion, overcrowding, pollution, etc. With an increase in
population people need to be settled in other areas away from the center. However, this outflow can be
controlled and slowed by improving the central area quality. The density gradient values for Nagpur
need to be monitored and compared over timeline and with other cities to know the dispersal status of
the city. The dispersion index values for Nagpur for last fifty years are in range of 1.00 to 1.08 which
is very close to the watershed value (1.0) between compactness and dispersion. Though the change is
not much, it is towards dispersion.
The measures for understanding the transportation network indicate an average score for Nagpur.
Though the car ownership is low, but steadily increasing and is not a good trend for a medium size and
compact city. A car consumes some of the space of a person here, therefore increasing dependency on
private modes of transportation will be disruptive. Nagpur already has a high percentage (58%) of
non-motorized mode of transportation, therefore the approach and strategies should be either to
increase or at least maintain the present share. In terms of accessibility/proximity, it is observed that
the accessibility to public modes of transportation and its share is poor (5% by buses); therefore the
approach should be to enhance and improve this facility. Better accessibility to public modes of
transportation will ultimately lead to reduced dependency on private modes; thus helping in increasing
or at least maintaining the existing reliance on non-motorized modes of transportation. The road
network density (length per hectare) in the city is at par with the other dense Asian cities (Figure 10).
The road length per person is quite less which again indicates the potential for congestion and hence a
need to discourage car use.

Sustainability 2014, 6 4269
It is observed from the city level land use composition that open areas, recreational and
public/semi-public landuses are unevenly distributed within the city and their concentration is in West
Nagpur. Therefore, the approach should be to maintain equity in allocation of growth centers and other
landuses—to achieve polycentric model with adequate mixed use and heterogeneous development.
New development nodes should be identified and existing sub centers (nodes) may be strengthened.
A total of approximately 876 Ha of land (including vacant developable land and brown fields) is
available for new development within the NMC administrative limits. Utilizing this vacant land will
promote infill rather than using new peripheral land. The last decade trend points towards increase in
density in intermediate wards indicating infill and its demand too.
Nagpur city has a maximum Floor Space Index (FSI) (FSI is the ratio of total builtup allowed for a
building to the total plot/land area. A concept similar to FAR) of 1.0 except in congested areas. There
is need to increase the FSI (at least in high accessibility areas and along transport corridors) to increase
density and reduce travel distance. In addition, it will deal majorly with overcrowding in built spaces,
increase in city size (land area) and high price of built units [37]. However, there will be high
probabilities of pollution and the risk of effect of linear development on property values. Reforms for
allocation of FSI are required and the topic is being debated even at national level. Increasing density
alone without infrastructure up gradation may have an adverse impact on sustainability as it will
increase congestion and put strain on infrastructure and services. Therefore, for achieving the aforesaid
goals of compact city form, infrastructure improvement and provision of more amenities and other
facilities, along with improvement in transport network is necessary. This will hold high densities and
sustain the compact urban form with less negativities. Better urban management, administration and
strict regulations are the prerequisites to extract the benefits of compact living [38]. Large scale
capacity building initiatives need to be undertaken by the municipal authority. Inclusive planning with
more involvement and participation of people in the planning process cater the social and economic
needs. The high component of informal sector has to be included in planning as neglecting it may be a
deterrent to the compact city development. Compact city concept relates to environmental, social and
economic benefits and they must be kept at the focus while carving urban planning policies. Poverty
and social inequality must be addressed in the concept.
Though the compact city model is still under debate regarding its claims for achieving sustainability but
if proper precautions are taken this model will definitely deliver its perceived benefits for Indian cities.
6. Conclusions
The study concluded that the measures of urban form characteristics (related to density distribution
and shape performance) discussed in this paper show that Nagpur has all components of a compact
city. The city is presently compact but gradually dispersing. On the basis of the analysis done in this
study, it may be concluded that Nagpur is presently standing on the threshold between compactness
and dispersion. The compact urban form characteristics of the city, which were present for decades,
facilitated shorter travel distances, prevalence of mix landuse, higher densities with compact urban
fabric in core and intermediate areas, high share of non-motorized travel modes, etc. Timely
intervention to restructure the urban form may retain its comparatively compact urban form in future.

Sustainability 2014, 6 4270
There is a high possibility that deterrents to achieve sustainable urban development will be at work.
Lack of proper regulations and required institutional framework for fulfilling the high demand for
compact and high density built areas can lead to overcrowding and environmental degradation. In
addition, the city will suffer from pollution, noise, lack of privacy, isolation, breakdown of identity,
etc. The component of informal development in the developing country cities is high, which is a
deterrent to the success of compact city policies. High densities and more built area may accentuate
heat island effect and vulnerability to disasters.
The compact city model can be recommended as the appropriate model to achieve sustainable urban
development in context of Nagpur city, but with a word of caution. This paper suggests that such
analysis can be very informative and useful for understanding the existing spatial structure and
evolution of a city over time and accordingly intervention in the process of planning can be made.
Author Contributions
Rajashree Kotharkar, the first author, took the initiative for study on compact city concept and
provided a methodology, framework for study and structure of the paper. The author is instrumental in
revisions and deriving part conclusions. Pankaj Bahadure, second author, conceived the study,
shortlisted the indicators, collected and analyzed data on world cities and Nagpur city from 1971 to
2011 (except for 2001) and discussed the findings. Neha Sarda, author three in sequence collected and
analyzed the data for 2001, is also responsible for the first draft of the paper, initial mapping, partly
graphical representation of figures and discussion.
Conflicts of Interest
The authors declare no conflict of interest.
References
1. Jenks, M.; Williams, K.; Burton, E. The Compact City: A Sustainable Urban Form?
Chapman and Hall: London, UK, 1996.
2. Johnson, A. Monitoring Settlement Sustainability-A Review of Practice. In Proceedings of the
Conference on Politics of Planning, New Zealand Planning Institute Conference, Palmerston
North, New Zealand, 27–30 March 2007.
3. Williams, K.; Burton, E.; Jenks, M. Achieving Sustainable Urban Form; E & FN Spon: London,
UK, 2000.
4. Barrow, C.J. Sustainable Development: Concept, Value and Practice. Third World Plan. Rev.
1995, 17, 369–386.
5. Jabareen, Y.R. Sustainable Urban Forms: Their Typologies, Models and Concepts. J. Plan. Educ. Res.
2006, 26, 38–52.
6. Frey, H. Designing the City: Towards A More Sustainable Urban Form; Spon Press: London, UK
and New York, NY, USA, 1999.
7. United Nations Population Fund. State of World Population; UNFPA: New York, NY, USA, 2007.

Sustainability 2014, 6 4271
8. Suzuki, H.; Dastur, A.; Moffat, S.; Yabuki, N.; Maruyama, H. Ecological Cities as Economic
Cities. In Eco2 Cities: Ecological Cities As Economic Cities; The World Bank: Washington, DC,
USA, 2010; pp. 13–28.
9. Demographia World Urban Areas (Built-up Urban Areas or World Agglomerations) 10th Annual
Edition: March 2014. Available online: http://demographia.com/db-worldua.pdf (accessed on 12
April 2014).
10. Booz & Co, CISCO. Intelligent Urbanization-Roadmap for India; Confederation of Indian
Industries: New Delhi, India, 2010.
11. Burgess, R. The Compact City Debate: A Global Perspective. In Compact Cities: Sustainable
Urban Forms for Developing Countries; Burgess, R., Jenks, M., Eds.; Spon Press: London, UK,
2000; pp. 9–24.
12. Ewing, R.H. Characteristics, Causes, and Effects of Sprawl: A Literature Review. In Urban
Ecology; Marzluff, J.M., Shulenberger, E., Endlicher, W., Alberti, M., Bradley, G., Ryan, C.,
Simon, U., ZumBrunnen, C., Eds.; Springer: New York, NY, USA, 2008; pp. 519–535.
13. Marcotullio, P.J. The Compact City, Environmental Transition Theory and Asia-Pacific Urban
Sustainable Development. In Proceedings of the International Workshop on New Approaches to
Land Management for Sustainable Urban Regions, Department of Urban Engineering, University
of Tokyo, Tokyo, Japan, 29–31 October 2001.
14. Bertaud, A. Metropolis: A Measure of the Spatial Organization of 7 Large Cities.
Available online: http://alain-bertaud.com/images/AB_Metropolis_Spatial_Organization.pdf.
(accessed on 9 June 2013).
15. Bertaud, A. The Spatial Structure of Cities: International Examples of The Interaction of
Government, Topography and Markets. Available online: http://alain-bertaud.com/AB_Files/
AB_Transcript_3_Spatial_organization.pdf (accessed on 9 June 2013).
16. Knaap, G.J.; Song, Y.; Ewing, R.; Clifton, K. Seeing The Elephant: Multi-Disciplinary Measures
of Urban Sprawl. Available online: http://smartgrowth.umd.edu/assets/documents/research/
knaapsongewingetal_2005.pdf (accessed on 7 July 2013).
17. Bertaud, A.; Malpezzi, S. The Spatial Distribution of Population in 48 World Cities: Implications
for Economies in Transition. alain-bertaud.com. 2003. Available online: http://alainbertaud.com/
wp-content/uploads/2013/06/Spatia_-Distribution_of_Pop_-50_-Cities.pdf (accessed on 7 July 2013).
18. Glaster, G.; Hanson, R.; Ratcliffe, M.R.; Wolman, H.; Coleman, S.; Freihage, J. Wrestling Sprawl
to the Ground: Defining and measuring an elusive. Hous. Policy Debate 2001, 12, 681–717.
19. Ewing, R.; Pendall, R.; Chen, D. Smart Growth America. Available online: http://www.
smartgrowthamerica.org/documents/MeasuringSprawl.pdf (accessed on 16 September 2013).
20. Song, Y.; Knaap, G. Measuring Urban Sprawl: Is Portland Winning the War on Sprawl? J. Am.
Plan. Assoc. 2004, 70, 210–225.
21. Krizek, K.J. Operationalizing Neighborhood Accessibility for Land Use-Travel Behavior
Research and Regional Modeling. J. Plan. Educ. Res. 2003, 22, 270–287.
22. Hess, P.M.; Moudon, A.V.; Snyder, M.C.; Stanilov, K. Site Design and Pedestrian Travel.
Transp. Res. Record 1999, 1674, 9–19.
23. Burton, E. Potential of the Compact City for Promoting Social Equity. In Achieving Sustainable
Urban Form; Williams, K., Jenks, M., Eds.; Routledge: New York, NY, USA, 2000; pp. 19–29.
Sustainability 2014, 6 4272
24. Fulton, W.B.; Pendall, R. Who Sprawls Most?: How Growth Patterns Differ across the US;
Brookings Institution, Center on Urban and Metropolitan Policy: Washington, DC, USA, 2001.
25. Tsai, Y. Quantifying Urban Form: Compactness versus Sprawl. Urban Stud. 2005, 2, 141–161.
26. Town Planning Department. Revised Development Plan. of Nagpur 1986–2011. Town Planning
Department: Maharashtra, India, 2001.
27. UDPFI Guidelines; Ministry of Urban Development: New Delhi, India, 1996.
28. L&T-Ramboll Consulting Engineers Limited. Preparation of Master Plan/Perspective Plan for
Transportation System of Nagpur City 2031; Nagpur Municipal Corporation: Nagpur, India, 2007.
29. Global Scientific Inc. Nagpur City Environmental Status Report: 2011–2012; Nagpur Municipal
Corporation: Nagpur, India, 2011.
30. Bertaud, A. The Spatial Organization of Cities: Deliberate Outcome or Unforeseen Consequence?
Available online: http://alain-bertaud.com/images/AB_The_spatial_organization_of_cities_
Version_3.pdf (accessed on 9 June 2013).
31. Adhvaryu, B. Analyzing Evolution of Urban Spatial Structure: A Case Study of Ahmedabad,
India. Environ. Plan. B 2011, 38, 850–863.
32. Clark, C. Urban Population Densities. J. Royal Stat. Soc. Ser. A (General) 1951, 114, 490–496.
33. Wilber Smith Associates. Study on Traffic and Transportation Policies and Strategies in Urban.
Areas in India; Ministry of Urban Development: New Delhi, India, 2008.
34. Kenworthy, J.R.; Laube, F.B.; Newman, P.W.G.; Barter, P.; Raad, T.; Poboon, C.; Guia, B., Jr. An
International Sourcebook of Automobile Dependence in Cities 1960–1990; University Press of
Colorado: Boulder, CO, USA, 2000.
35. Barter, P.A. Transport Dilemmas in Dense Urban Areas: Examples from Eastern Asia. In
Compact Cities: Sustainable Urban Form for Developing Countries; Burgess, R., Jenks, M., Eds.;
Spon Press: London, UK and New York, NY, USA, 2000; pp. 275–276.
36. The Communities Group International (TCGI); AECOM. City Development Plan: Nagpur,
Maharashtra, India; USAID & CRISIL: Mumbai, India, 2006.
37. Bertaud, A. Mumbai FSI Conundrum: The perfect storm: The four factors restricting the construction
of new floor space in Mumbai. Available online: http://alain-bertaud.com/AB_Files/AB_Mumbai_
FSI_conundrum.pdf (accessed on 9 June 2013).
38. Kotharkar, R.; Bahadure, P.; Vyas, A. Compact City Concept: It’s Relevance and Applicability for Planning of Indian Cities. In Proceedings of the 28th International PLEA Conference,
Opportunities, Limits & Needs: Towards an Environmentally Responsible Architecture, Lima,
Perú, 7–9 November 2012.
© 2014 by the authors; licensee MDPI, Basel, Switzerland. This article is an open access article
distributed under the terms and conditions of the Creative Commons Attribution license
(http://creativecommons.org/licenses/by/3.0/).