Measuring and modeling physics students' conceptual knowledge structures through term association...
26
Submitted 06.02.2002 © 2002 UMass Physics Education Research Group Measuring and Modeling Physics Students’ Conceptual Knowledge Structures Through Term Association Times Ian D. Beatty University of Massachusetts, Amherst, MA, USA 1 William J. Gerace University of Massachusetts, Amherst, MA, USA Robert J. Dufresne University of Massachusetts, Amherst, MA, USA Traditional problem-based exams are not efficient instruments for assessing the “structure” of physics students’ conceptual knowledge or for providing diagnostically detailed feedback to students and teachers. We present the Free Term Entry task, a candidate assessment instrument for exploring the connections between concepts in a student’s understanding of a subject. In this task, a student is given a general topic area and asked to respond with as many terms from the topic area as possible in a given time; the “thinking time” between each term-entry event is recorded along with the response terms. The task was given to students from two different introductory physics classes. Response term thinking times were found to correlate with the strength of the association between two concepts. In addition, sets of thinking times from the task show distinct, characteristic patterns which might prove valuable for student assessment. We propose a quantitative dynamical model named the Matrix Walk Model which is able to match many aspects of the observed data. One particular feature of the data — a distinct “spike” superimposed on the otherwise log-normal distribution of most thinking time sets — has not been fit. The spike, other patterns observed in the data, and the proposed phenomenological model could all benefit from a grounding in cognitive theory. Keywords: physics, assessment, conceptual knowledge, concept map, modeling, term association. 1 Address for correspondence: Dr. Ian Beatty, Physics Department, Lederle Graduate Research Tower 417A, University of Massachusetts, Amherst MA 01003-4525 USA. E-mail: [email protected]. Home page: http://umperg.physics.umass.edu/
-
Upload
independent -
Category
Documents
-
view
0 -
download
0
Transcript of Measuring and modeling physics students' conceptual knowledge structures through term association...

Submitted 06.02.2002 © 2002 UMass Physics Education Research Group
Measuring and Modeling Physics Students’Conceptual Knowledge Structures Through
Term Association Times
Ian D. BeattyUniversity of Massachusetts, Amherst, MA, USA1
William J. GeraceUniversity of Massachusetts, Amherst, MA, USA
Robert J. DufresneUniversity of Massachusetts, Amherst, MA, USA
Traditional problem-based exams are not efficient instruments forassessing the “structure” of physics students’ conceptual knowledge orfor providing diagnostically detailed feedback to students andteachers. We present the Free Term Entry task, a candidate assessmentinstrument for exploring the connections between concepts in astudent’s understanding of a subject. In this task, a student is given ageneral topic area and asked to respond with as many terms from thetopic area as possible in a given time; the “thinking time” betweeneach term-entry event is recorded along with the response terms. Thetask was given to students from two different introductory physicsclasses. Response term thinking times were found to correlate with thestrength of the association between two concepts. In addition, sets ofthinking times from the task show distinct, characteristic patternswhich might prove valuable for student assessment. We propose aquantitative dynamical model named the Matrix Walk Model which isable to match many aspects of the observed data. One particularfeature of the data — a distinct “spike” superimposed on the otherwiselog-normal distribution of most thinking time sets — has not been fit.The spike, other patterns observed in the data, and the proposedphenomenological model could all benefit from a grounding incognitive theory.
Keywords: physics, assessment, conceptual knowledge, concept map,modeling, term association.
1 Address for correspondence: Dr. Ian Beatty, Physics Department, Lederle Graduate
Research Tower 417A, University of Massachusetts, Amherst MA 01003-4525 USA. E-mail:[email protected]. Home page: http://umperg.physics.umass.edu/

2 Measuring and Modeling Physics Students’ Conceptual Knowledge…
I. Introduction“Assessment drives pedagogy” is an oft-heard phrase in educational
research circles. It derives from the tendency of grade-conscious students tooptimize their learning for exam results, and of results-conscious teachers tooptimize their curriculum for class performance on assessments. It holdstrue for the style as well as the content of assessments: if tests target roteknowledge, students will perceive that as the objective of instruction; if theytarget conceptual reasoning and transfer, students will more likely focus onthose.
Therefore, assessment is presently a lively topic of educational research(Nichols, Chipman, & Brennan, 1995). Much of this research is devoted todeveloping cognitively diagnostic, formative assessments. “Cognitivelydiagnostic” means the assessments can be used to characterize the state ofknowledge of individual students with enough detail to guide students’subsequent learning efforts and teachers’ subsequent interventions, asopposed to merely characterizing the learning of a population of students(e.g., for curriculum evaluation) benchmarking students’ gross level ofmastery (e.g., for placement decisions). “Formative” means the assessmentsare used in an ongoing way during instruction to guide and enhanceteaching and learning, rather than after instruction to evaluate success.
Cognitively diagnostic assessment requires two foundations: instrumentsthat can probe and gather data on relevant features of a student’s state ofknowledge, and a model of topic knowledge and learning by which the datamay be interpreted. Development of these two foundations is necessarilyinterdependent, because any proposed probe instrument can only bejustified through the interpretability of the data it yields, and interpretationrequires a model; and a model is justified by its ability to explain observeddata. This chicken-and-egg relationship is common to all young researchfields.
Acknowledging this, we have attempted to simultaneously developassessment methods for probing introductory physics students’ state ofknowledge at a fundamental level, and a complementary quantitative modelof conceptual knowledge. In a previous paper (Beatty & Gerace, 2001) weproposed a family of computer-based tasks as assessment instruments, andpresented data suggesting that the tasks are sensitive to relevant aspects ofstudents’ conceptual knowledge structure (CKS). In this paper we focus on oneof those tasks, analyzing in more detail the data it can provide. In addition,we suggest a simple quantitative dynamical model of CKS and how it isaccessed which can “explain” the observed data.
It is not our intent here to suggest new research tools for basic cognitivescience research, nor to propose a mature, ready-to-use assessmentinstrument, nor to present a complete or fundamental cognitive model.Rather, it is to explore the potential of a new (in this context) assessmentapproach for eliciting information about students’ CKS, and to demonstratehow the data produced can be quantitatively modeled. That is, we areattempting a “proof-of-concept” venture. Our results are for the domain ofintroductory physics, but we see no reason why they might not be

Measuring and Modeling Physics Students’ Conceptual Knowledge… 3
applicable to other educational levels and other subjects in which conceptualunderstanding is important.
Section II motivates and describes the Free Term Entry assessment task.Section III phenomenologically describes data obtained via the task. SectionIV defines the Matrix Walk Model and evaluates its ability to reproduceexperimentally observed data. Section V discusses the results.
II. Probing Conceptual Knowledge StructureIt is useful to represent physics knowledge as divided into four general
categories: conceptual knowledge, operational and procedural knowledge,problem-state knowledge, and strategic knowledge (Chi, Feltovich, & Glaser,1981; Dufresne, Leonard, & Gerace, 1992; Gerace, 1992; Larkin, 1979;Leonard, Gerace, Dufresne, & Mestre, 1999). Conceptual knowledgeincludes concepts and general ideas such as “work” and “conservation ofenergy” and the associations between them. Operational and proceduralknowledge includes equations, operations, and procedures such as defininga coordinate system or identifying all forms of energy present in a situation.Problem-state knowledge includes recognition of previously encounteredproblems and memory of relevant facts about their solution. Strategicknowledge links elements of the other categories into higher-level elementsthat guide the entire problem-solving process, like a stratagem fordetermining the principles to apply to a problem or methods of error-checking an answer.
Research results have revealed that for expert-like behaviors such asqualitative analysis, reasoning, and knowledge transfer to novel situations,conceptual knowledge is especially important (for a review, see Bransford,Brown, & Cocking, 1999). In particular, the organization and not just thecontent of an individual’s conceptual knowledge is crucial: experts havecontextually appropriate access to knowledge; it is the structure ofinterconnections between knowledge elements which allows such access; andexperts’ knowledge is structured around key principles (Chi et al., 1981;Hardiman, Dufresne, & Mestre, 1989; and work reviewed in Mestre &Touger, 1989; Redish, 1994; Zajchowski & Martin, 1993).
Therefore, we seek methods to assess as directly as possible students’conceptual knowledge structure (CKS) — the content of, organization of,and interconnections within conceptual knowledge. In addition to asufficiently detailed model of conceptual knowledge and its access, thisrequires assessment instruments (probes) sensitive to elements of CKS.Conventional problem-based assessments are insufficient, because theyindicate whether a student can do a problem but not why she is able orunable to. A student might fail to solve a particular problem for manydifferent reasons: for example, failure to interpret the problem situation asintended, incorrect or insufficient physical intuition, ignorance of thenecessary principle, misapplication of the correct principle, algebraic ornumerical error, general cognitive overload and confusion, or failure toanswer the precise question being asked. If a student’s written solutions arehand-graded, it might be possible to infer the nature of the student’smistake; doing this for many students and for many problems per student is

4 Measuring and Modeling Physics Students’ Conceptual Knowledge…
impractical. And even then, identifying the nature of the student’s mistakedoes not necessarily indicate the particular failure of knowledge, conceptualor otherwise, causing it.
A general, qualitative model of conceptual knowledge structure whichhas seen some success is the semantic map (Quillian, 1968; Woods, 1975):concepts are represented as labeled nodes like “energy” and “movement”,and the relationships between concepts as labeled, oriented links like “is anexample of” and “causes”. This perspective led to the development ofconcept mapping as a research and assessment tool, in which students areasked to construct or to complete a semantic map for some topic area(Novak & Gowin, 1984). The resulting diagram is interpreted as adescription, perhaps partial, of the subject’s conceptual knowledgestructure. Many variants of the task have been investigated. In general,investigators find it to be useful for research, instruction, and small-scaleassessment, but impractical for widespread use (Rice, Ryan, & Samson, 1998;Ruiz-Primo & Shavelson, 1996; Young, 1993).
In accordance with the semantic map nodes-and-links picture ofconceptual knowledge, we have devised some computer-based tasks withwhich to obtain quantitative experimental data on the interconnections(links) between physics students’ conceptual knowledge elements (Beatty,2000; Beatty & Gerace, 2001). This paper will consider one of those tasks, theFree Term Entry (FTE) task.
FTE is a sort of “quasi-free association” in which subjects are given atopic area and asked to respond with a sequence of terms they considerassociated with the topic area. A subject is presented with a general topicarea such as “introductory mechanics” or “the material covered in thephysics course you just completed”. The subject is asked to think of termsthat he associates with this topic area, and to type these terms into acomputer, spontaneously and without forethought, as they come to mind.The response terms and associated timing information are recorded. Thetask is not truly “free” association since the subject is asked to eschew termsoutside of the specified topic and to avoid entering any term more thanonce. The task lasts for a specified total duration, perhaps 15 to 45 minutes,and subjects typically enter between 40 and 120 terms.
Figure 1 shows the dialog box presented to the subject for term entry.When the subject finishes typing a term, he presses the keyboard’s “return”key or clicks the “Enter” button and the typed term disappears, leaving thetyping box ready for another term. The “Clear” button erases any currently-typed text without entering it, and the “Pause” button allows the subject tointerrupt the task briefly (to ask a question, for example). Subjects aregenerally discouraged from using the pause facility. The data recordedconsists of the list of response terms in the order they are entered, the time atwhich the typing of each term begins (defined as the time at which the firstcharacter is typed into an empty box), and the time at which the subjectpresses “return” to enter each term.
The FTE task has been designed to focus on terms rather than onequations, propositions, or other kinds of entities because a term seems to bethe closest accessible approximation to a “conceptual building block”. It has

Measuring and Modeling Physics Students’ Conceptual Knowledge… 5
proven difficult to rigorously define term. When instructing subjects, a termis loosely defined to be one or perhaps two or three words describing oneconcept, idea, or thing. Some examples of terms drawn from introductorymechanics are “kinematics”, “Newton’s first law”, “pulley” and “problem-solving”. Statements like “energy is conserved in an elastic collision” are notconsidered to be terms, but rather propositions involving multiple termsand their relationship. “Conservation of energy”, on the other hand, wouldbe accepted as a term, since it serves as the name of a physics idea.
The task is intended to explore the space of terms constituting a subject’s“active vocabulary” of concepts for the topic area by allowing subjects todisplay their own choice of terms, rather than prompting them with apreselected set. The task is also intended to elicit subjects’ spontaneousassociations rather than considered, reflective decisions (e.g., for conceptmap drawing). It is hypothesized that the duration of pauses between termentries, and the grouping of term entries into clusters separated by longerfallow periods, can reveal information about what terms a subject associatesclosely. Since the list of terms and times comprising an FTE data set forms aone-dimensional series, and the space of conceptual knowledge elementsand their interconnections requires at least two dimensions to represent (forexample, as a matrix of connection strengths), the FTE task can neverprovide a complete probe of a subject’s conceptual interconnections.Nevertheless, it might prove to be a useful sampling of thoseinterconnections.
Ultimately, for practical assessment, we do not expect the FTE task to beused in isolation but rather in conjunction with complementary tasksdescribed elsewhere (Beatty, 2000; Beatty & Gerace, 2001), and perhaps withas-yet-undeveloped tasks. In this paper it is considered alone, however, forthe purpose of understanding the data it provides and constructing a model.
III. PhenomenologyThis section will describe the data obtained by the Free Term Entry task,
focusing on aspects that will shape the modeling efforts of Section IV.Subsection A describes the data and indicates how it was acquired.Subsection B presents evidence that the timing information captured by the
Figure 1: Term entry dialog box for the Free Term Entry (FTE) task.
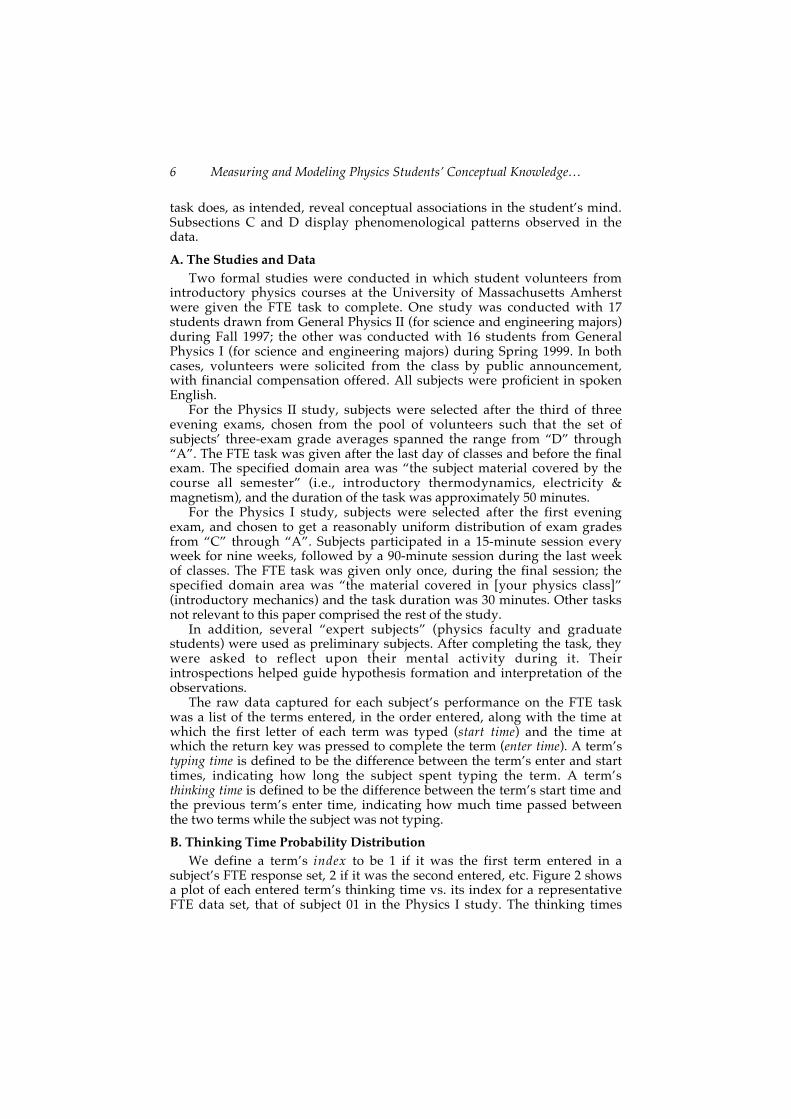
6 Measuring and Modeling Physics Students’ Conceptual Knowledge…
task does, as intended, reveal conceptual associations in the student’s mind.Subsections C and D display phenomenological patterns observed in thedata.
A. The Studies and DataTwo formal studies were conducted in which student volunteers from
introductory physics courses at the University of Massachusetts Amherstwere given the FTE task to complete. One study was conducted with 17students drawn from General Physics II (for science and engineering majors)during Fall 1997; the other was conducted with 16 students from GeneralPhysics I (for science and engineering majors) during Spring 1999. In bothcases, volunteers were solicited from the class by public announcement,with financial compensation offered. All subjects were proficient in spokenEnglish.
For the Physics II study, subjects were selected after the third of threeevening exams, chosen from the pool of volunteers such that the set ofsubjects’ three-exam grade averages spanned the range from “D” through“A”. The FTE task was given after the last day of classes and before the finalexam. The specified domain area was “the subject material covered by thecourse all semester” (i.e., introductory thermodynamics, electricity &magnetism), and the duration of the task was approximately 50 minutes.
For the Physics I study, subjects were selected after the first eveningexam, and chosen to get a reasonably uniform distribution of exam gradesfrom “C” through “A”. Subjects participated in a 15-minute session everyweek for nine weeks, followed by a 90-minute session during the last weekof classes. The FTE task was given only once, during the final session; thespecified domain area was “the material covered in [your physics class]”(introductory mechanics) and the task duration was 30 minutes. Other tasksnot relevant to this paper comprised the rest of the study.
In addition, several “expert subjects” (physics faculty and graduatestudents) were used as preliminary subjects. After completing the task, theywere asked to reflect upon their mental activity during it. Theirintrospections helped guide hypothesis formation and interpretation of theobservations.
The raw data captured for each subject’s performance on the FTE taskwas a list of the terms entered, in the order entered, along with the time atwhich the first letter of each term was typed (start time) and the time atwhich the return key was pressed to complete the term (enter time). A term’styping time is defined to be the difference between the term’s enter and starttimes, indicating how long the subject spent typing the term. A term’sthinking time is defined to be the difference between the term’s start time andthe previous term’s enter time, indicating how much time passed betweenthe two terms while the subject was not typing.
B. Thinking Time Probability DistributionWe define a term’s index to be 1 if it was the first term entered in a
subject’s FTE response set, 2 if it was the second entered, etc. Figure 2 showsa plot of each entered term’s thinking time vs. its index for a representativeFTE data set, that of subject 01 in the Physics I study. The thinking times

Measuring and Modeling Physics Students’ Conceptual Knowledge… 7
appear randomly distributed inside an envelope that increases with termindex, with short times occurring throughout the task and longer times morelikely to occur late in the task.
Disregarding for now the systematic trend of increasing times with termindex, each subject’s set of thinking times can be analyzed as if it were a setof uncorrelated values drawn from a random distribution, and the nature ofthat distribution can be explored. Figure 3 shows a histogram of the naturallogarithms of the thinking times for the data depicted in Figure 2. Thenatural logarithm of the times has been used because short times are farmore common than long times, and a linear scale that included the longesttimes would lose detail for the short times. The distribution appearsapproximately normal (Gaussian), indicating that the distribution ofthinking times themselves is approximately log-normal. (A random variableobeys a log-normal distribution if its logarithm obeys a normal distribution.)Deviating from normality, the histogram has a slight skew to the right and asignificant spike superimposed on the leading edge.
These three features — normality, skew, and spike — are in fact commonto almost all of the data sets collected, except where obscured by statisticalnoise in sets with relatively few response terms. Examination of thehistograms for all 33 subjects in both studies shows that most of thehistograms display a pronounced spike on the left edge of a broad peak, andvery few of the histograms do not have at least a rudimentary bump there.The evidence for a “spike plus Gaussian” distribution of thinking timelogarithms is strong, and this is a distinguishing feature of the data forcandidate models to reproduce. The thinking times describing the spike and
100
80
60
40
20
0
thin
kin
g t
ime
[s]
160140120100806040200
term index
Figure 2: Thinking time vs. term index for subject 01’s FTE data from thePhysics I study.

8 Measuring and Modeling Physics Students’ Conceptual Knowledge…
peak locations and the fraction of counts ascribable to the spike mighteventually be interpretable as characteristic cognitive measures of thesubject. In addition, with a sufficient model, best-fit parameters obtainedfrom a student’s data set by fitting a log-normal or other distribution to thethinking times might be informative.
C. Temporal CorrelationsThe previous subsection examined FTE thinking times as if they were
uncorrelated numbers drawn from a random distribution. Such adescription is incomplete: the times form a well-ordered sequence from thebeginning to the end of the task, and both overall trends and correlationsbetween neighboring values are likely. Examining Figure 2 and equivalentplots for other subjects, two global patterns are evident:• As the task progresses, long thinking times become more frequent, and
the long times that appear tend to have much larger values; and• Short times continue to occur throughout the task.
Both patterns make intuitive sense: term entries become increasingly sparselater in the task, with longer pauses, because subjects have already enteredmost of their readily accessible terms and have to think hard to recalladditional terms; and term entries tend to occur in clusters separated byshort times because when a subject thinks of a term, it often suggests otherconnected terms. Post-task interviews confirm that these interpretationsmatch subjects’ experiences.
25
20
15
10
5
0
cou
nt
543210-1-2ln( thinking time / 1 second )
data normal fit
Figure 3: Histogram of the natural logarithms of the thinking times for subject01’s FTE data from the Physics I study, with best-fit normal probabilitydistribution function (PDF).

Measuring and Modeling Physics Students’ Conceptual Knowledge… 9
The inherent noisiness of the data make it difficult to quantitativelycharacterize these patterns. Nevertheless, a predictive model should attemptto reproduce them at least qualitatively.
D. Thinking Times v. Term RelatednessThe basic hypothesis underlying the design of the FTE task is that a
subject’s list of terms, together with the associated timing data, containsinformation about the subject’s CKS. A subordinate hypothesis is that usefulinformation can be extracted from the timing data itself, without reference tothe meaning of the response terms. This is important for the eventual designof automated assessment/evaluation systems, and is significant formodeling that attempts to interpret FTE data.
This subsection relates FTE thinking times to one aspect of termmeanings: the degree to which the meaning of a term in a subject’s responselist is related or unrelated to the meanings of the terms immediatelypreceding it in the list. According to the introspective testimony of expertswho served as FTE subjects in preliminary studies, term entry events can becrudely classified into two types: those for which the term to be entered wasimmediately suggested by terms directly preceding it, and those for whichthe subject had to search his memory for some period of time to think of theterm. According to these expert subjects, the immediately suggested termswere generally closely related in meaning to one of the prior few terms,while the terms thought of after a period of mental searching were usuallyrelated distantly or not at all to prior terms. This suggests the followinghypothesis: let the term jump refer to a term which is “relatively unrelated”to any one of the previous few terms in an FTE response list; then, in FTEresponse data, longer thinking times should be statistically more likely tooccur for jumps, while short thinking times should be more likely to occurfor non-jumps.
To make this hypothesis testable, “relatively unrelated” and “previousfew terms” must be defined. A neighborhood of three preceding terms wasused (n = 3), rather than the one immediately preceding term, becauseinterviews and perusal of term lists suggested that subjects often enter aterm and then enter a sequence of multiple terms that come to mindapproximately simultaneously. That is, a subject enters term A, and almostimmediately thinks of terms B and C which are related to A but notnecessarily related to each other; the subject then enters B and C. C istherefore a jump if one considers it relative to B only, but not if A is also partof the context. It is the testimony of some expert subjects that sometimeswhen they think of a term they perceive a “fork” in the mental path, withtwo possible “threads” of related terms that they could follow. In such a casethey often try to follow one thread while it is productive, and then return tothe fork and pick up the other thread. It seems reasonable that if the firstthread is longer than about three terms, remembering and returning to theother thread is likely to require a pause for reflective thinking, thus sharingthe characteristics of a jump and warranting classification as such.
Each term in each response list analyzed was compared to the threeprevious responses in the list by one domain expert (the first author), andsubjectively declared to be a jump or a non-jump. Making explicit the

10 Measuring and Modeling Physics Students’ Conceptual Knowledge…
criteria used to judge whether any pair of terms is related or not is difficult.Experts seem to possess an intuitive notion of whether terms are related, buthave difficulty explicitly generalizing their criteria, probably because termscan have many possible kinds of relationships. In addition, experts tend touse contextual information in their judgments, inferring what the subjectwas thinking while entering a series of terms and deciding whether a term isa jump in that context. The following list specifies some situations in whichtwo terms would be considered related (i.e., a non-jump):• They were both within a sufficiently narrow topic area (e.g., collision-
related terms, or graph-related terms, or angular momentum terms);• They were analogous elements of a set or list (e.g., kinds of forces, or
units of measure, or key principles of mechanics);• One was a subclass or special case of the other (e.g., “force” and “spring
[force]”, or “motion” and “rotation”);• One was a situation or problem type in which the other figures
significantly (e.g., “falling objects” and “gravity”, or “collision” and“impulse”);
• They were mathematically related (e.g., “work” and “impulse”, or“velocity” and “position”); or
• One was a feature or element of the other (e.g., “slope” and “graph”, or“force” and “free-body diagram”).
This is not a complete list, but it illustrates the kinds of relationshipsconsidered.
Note that a very important question has been ignored so far: related towhom? The original hypothesis was that long thinking times correlate withterms unrelated to immediately preceding terms according to the subject’s ownknowledge structure. When an expert analyzing a subject’s data identifiesterms as jumps or non-jumps, however, the judgment of relatedness is madeaccording to the expert’s understanding of the domain, not the subject’s. So,even if the hypothesis is completely correct and thinking times correlateperfectly with jumps, analysis by an expert would not show a perfectcorrelation unless the expert and subject were in complete agreement aboutwhat terms are and are not strongly related. We assume, however, that anexpert with experience teaching the domain material can make judgmentsbased on a structure that is reasonably close to what earnest students, or atleast the more apt ones, possess. With that assumption, the operationalhypothesis to test is that long thinking times will correlate noisily butsignificantly with jumps as perceived by an expert. Having subjects judgethe relatedness of their own term pairs would be desirable, but requiresresearch tools and techniques that are still being developed.
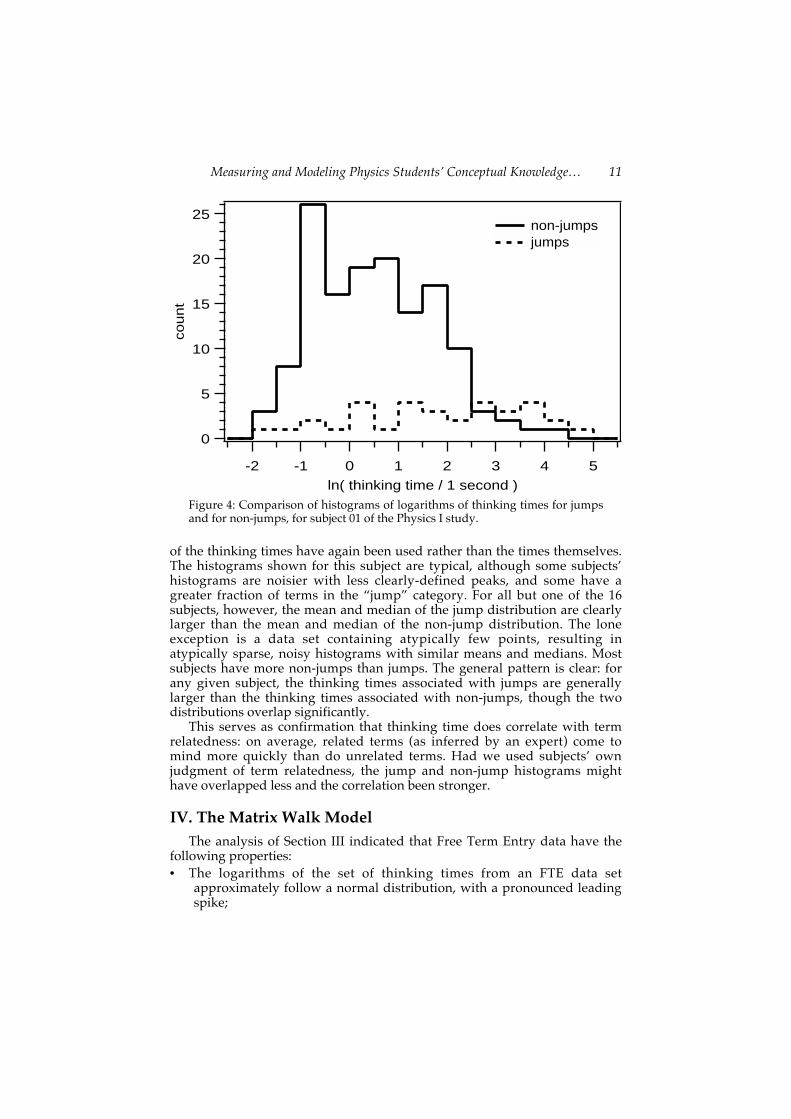
For each of the 16 subjects in the Physics I study, a domain expertreviewed the list of response terms for the FTE task and classified each termas a jump or non-jump as explained above. The set of thinking times for thesubject’s task performance was then divided into a subset containingthinking times for jumps and a subset containing thinking times for non-jumps. Figure 4 shows histograms of these two subsets for the examplesubject used above, superimposed on one set of axes. The natural logarithms
Measuring and Modeling Physics Students’ Conceptual Knowledge… 11
of the thinking times have again been used rather than the times themselves.The histograms shown for this subject are typical, although some subjects’histograms are noisier with less clearly-defined peaks, and some have agreater fraction of terms in the “jump” category. For all but one of the 16subjects, however, the mean and median of the jump distribution are clearlylarger than the mean and median of the non-jump distribution. The loneexception is a data set containing atypically few points, resulting inatypically sparse, noisy histograms with similar means and medians. Mostsubjects have more non-jumps than jumps. The general pattern is clear: forany given subject, the thinking times associated with jumps are generallylarger than the thinking times associated with non-jumps, though the twodistributions overlap significantly.
This serves as confirmation that thinking time does correlate with termrelatedness: on average, related terms (as inferred by an expert) come tomind more quickly than do unrelated terms. Had we used subjects’ ownjudgment of term relatedness, the jump and non-jump histograms mighthave overlapped less and the correlation been stronger.
IV. The Matrix Walk ModelThe analysis of Section III indicated that Free Term Entry data have the
following properties:• The logarithms of the set of thinking times from an FTE data set
approximately follow a normal distribution, with a pronounced leadingspike;
25
20
15
10
5
0
count
543210-1-2
ln( thinking time / 1 second )
non-jumps jumps
Figure 4: Comparison of histograms of logarithms of thinking times for jumpsand for non-jumps, for subject 01 of the Physics I study.

12 Measuring and Modeling Physics Students’ Conceptual Knowledge…
• The rate of term entry gradually and unevenly decreases throughout taskcompletion, as increasingly large thinking times appear, but tightclusters still appear; and
• A term’s thinking time depends, at least in part, on how strongly theterm is related to the previous term.
A model that purports to represent the cognitive processes underlying asubject’s observed behavior on an FTE task should display these features.
In this section we present the matrix walk model, which is capable ofdisplaying most of the listed features. The model is intended to be simpleyet reasonable, relatively abstract, and quantitative. It is constructed in sucha way that thinking times are entirely determined by term relationshipstrengths. It will be shown that the model can produce a distribution ofthinking times that is approximately log-normal, and naturally exhibits adecreasing term entry rate throughout a simulated FTE task; the leading-edge spike found in real FTE data has not yet been recreated, however.Connecting the model to lower-level descriptions of cognition, such asneural network models (Hertz, Krogh, & Palmer, 1991; Hopfield, 1982) orproduction system models (Anderson, 1993), has not been attempted.
A. Model DescriptionThe model represents a subject’s conceptual knowledge store for a
particular domain as an N by N link matrix L of real numbers, where N is thenumber of knowledge elements in the structure. These knowledge elements areassumed to represent concepts or, equivalently, terms. The model does notascribe a specific meaning like “energy” or “vector” to any of the knowledgeelements; they are abstract. Each matrix element Li,j (i ∈ {1, 2, …, N}, j ∈ {1, 2,…, N}) represents the strength of the link from element j to element i: thedegree to which element j “triggers” or “brings to mind” element i. L is notnecessarily symmetric, and its diagonal elements are irrelevant.
The “dynamics” of the model is an algorithm called the walk whichrepresents carrying out an FTE task, and which produces simulated FTEdata analogous to the data collected from subjects. The algorithm is a set ofrules for generating a list of the knowledge elements {ak} representing aresponse term list, given a specific matrix and a choice for the initial“prompt” term. A thinking time τ k is determined for each element. Themodel does not address typing times.
The walk is defined by the following steps:
1 . The first “active” element is arbitrarily chosen as element one: a0 = 1.There is no associated thinking time. This element is ineligible for futureselection.
2. Given a currently active element ak, the next active element ak+1 is chosento be the one for which the link strength La ak k+1 , is maximal, excludingpreviously-active elements a0, a1, …, ak. In other words, look at all thelinks leading from the current element, and follow the strongest whichleads to an unvisited element.

Measuring and Modeling Physics Students’ Conceptual Knowledge… 13
3 . The thinking time for the recall process of step 2 is defined to beτ k a aL
k k+ = ( )+1 1τ , , where τ(s) is a recall function which will be discussed
below. [In the notation used here, τ (s) represents a mathematical
function, while τk represents one particular thinking time value.]
4. Update the “counter” variable k ! k + 1.
5. Go back to step 2 and repeat, unless a criterion for task termination (e.g.,total number of terms) has been met, in which case the task is finished.
To complete the model, values for the matrix elements of L must bespecified, and the recall function τ(s) must be defined.
B. Choice of Recall FunctionWithin the model, the thinking time associated with a particular FTE
response element (term) is uniquely determined by the link strength to thatelement from the previously entered element. The recall function τ(s)determines the mapping between link strength value and thinking time. Thefollowing restrictions are imposed on the recall function:• It should tend to small values (zero or some specified minimum possible
thinking time) for link strengths approaching their maximum possiblevalue;
• It should tend to infinity for link strengths approaching their minimumpossible value; and
• It should be a relatively simple, well behaved mathematical functionamenable to analysis.
The first two criteria reflect the notion that strong conceptual connectionsshould produce quick responses, while weak connections should producedelayed responses. Since FTE thinking times in the study data wereobserved over more than two orders of magnitude, with vanishingly smallfrequencies of the largest times, having the recall function tendasymptotically to infinity is appropriate. The third criterion enforcesparsimony and analytic convenience.
For link strengths between zero and one, two candidate recall functionsare the logarithmic recall function
τ x x( ) = − ( )α ln [1]
and the power-law recall function
τ x x( ) = −( )−α βγ [2],
where α, β, and γ are model parameters with ranges α > 0, 0 < β ≤ 1, and
γ ≥ 1. For both functions, the parameter α sets the time scale. For the power

14 Measuring and Modeling Physics Students’ Conceptual Knowledge…
law, β determines the minimum possible thinking time, and γ controls therelative abundance of long vs. short thinking times.
In the absence of a priori theoretical arguments for the form of the recallfunction (which might come from lower-level cognitive science principles), aparticular recall function can only be chosen based on its simplicity and itssuccess in helping the model reproduce observed data patterns.
C. Amorphous MatrixA simple way to populate a link matrix and investigate the behavior of
the model is to choose random numbers for all link strengths. This producesan “amorphous” or “structureless” matrix: one with no large-scale structureor pattern. Accordingly, link matrices were constructed by randomlydrawing all link strengths from a distribution uniform between zero andone. The irrelevant diagonal elements were set to zero. The amorphousmatrix is analytically convenient because it is possible to work backwards,deriving the recall function necessary to produce any desired distribution of(simulated) thinking times.
To simplify initial investigations, a log-normal distribution of thinkingtimes was chosen as the goal since observed FTE data was crudely log-normal. (Predicting the leading spike seen in real FTE data with a morecomplicated, non-monotonic recall function was not attempted.)Determining a recall function that provides the appropriate distribution ofthinking times is done by deriving an expression for the probability densityfunction (PDF) of the strengths of the links “followed” by the model walkfor a given distribution of link strengths, and determining the choice ofrecall function necessary to map that to the desired distribution of thinkingtimes.
A simplification must be made to deal with the fact that the distributionchanges as elements are chosen and the pool of “eligible” elementsdwindles. It is assumed that whenever an element is chosen and madeineligible, a new element with new randomly-chosen link matrix elementsreplaces it. This is equivalent to assuming that the number of elementschosen during a complete FTE task is much smaller than the total number Nof available elements. Another way to look at it is that the distributionderived only describes the first thinking time of a task for each of anensemble of subjects. Since the calculation is only intended to aid in theselection of a recall function and reasonable choices for the recall function’sparameters, this approximation is not a major compromise.
The walk algorithm prescribes that an element is chosen as a responseterm by finding the i for which Li,j has the largest value, given the previouslychosen element j. For a random link matrix, this means choosing the largestof N–1 random numbers drawn independently from a distribution uniformbetween zero and one. The probability distribution for the result is therefore
p s N sN( ) = −( ) −1 2 [3],
where s is the value of the selected link strength (matrix element). Thisdistribution has the distinctive feature that for large N it weights strengths

Measuring and Modeling Physics Students’ Conceptual Knowledge… 15
close to one extremely strongly and assigns vanishing probability to othervalues. The implications of this feature are important and will be discussedbelow.
Given a recall function τ(s), the distribution of thinking times q(τ)corresponding to the distribution of selected link strengths p(s) is describedby the relation
q p q p ssτ τ τ τ ττ
( ) = ( ) ⇒ ( ) = ( )( ) ( )d s ds
d
d[4],
where s(τ) is the inverse of the recall function τ(s). If the desired distribution
q(τ) is known, the recall function can be solved for by integrating Equation 4to get
d ds ss
′ ′( ) = ′ ′( )∫ ∫τ ττ
q p0
1
[5],
performing the integrals, and solving for τ in terms of s.To produce thinking times with a log-normal distribution,
q expln
τπ σ τ
τ µσ
( ) =− ( ) −( )
1
2 2
2
2 [6]
where µ and σ describe the mean and width of the peak, respectively, on alogarithmic plot. Inserting this and Equation 3 into Equation 5, integrating,and solving for τ results in
τ µ σs sN( ) = − −( )( )− −exp erf2 2 11 1 [7]
where erf–1(x) is the inverse of the error function erf(x). The inverse errorfunction can be evaluated numerically but is analytically difficult,suggesting that one of the candidate recall functions presented in Equations1 and 2 would be a better choice for the model if it could reasonablyapproximate Equation 7 with the right parameter choices.
The logarithmic and power-law recall functions of Equations 1 and 2were compared to the derived function of Equation 7. To determineparameter values for α, β, and γ, each was chi-squared fit to Equation 7 with
µ and σ chosen from a typical data set. Various values of N ≤ 10 were used;N ≥ 200 would be more realistic, but the range of values produced by thefunction for large N is so extreme that numerical overflow problems result.
It was found that the power-law recall function can better approximatethe log-normal-derived recall function than can the logarithmic recallfunction. Furthermore, the best-fit value of β is effectively unity. Though

16 Measuring and Modeling Physics Students’ Conceptual Knowledge…
these results hold for relatively small values of N, they seem likely to holdfor larger N as well and suggest that the best choice for a model recallfunction would be the power-law. The power-law can apparently besimplified by fixing β = 1, which means that recall times can range from zeroto infinity.
Using Equation 4, the approximate distribution of early thinking timesgenerated by the model (before element ineligibility becomes a significanteffect) can be determined:
q τα γ
τα
β γ( ) = − +
− − +
N
N1
11
[8].
As discussed during analysis of the study data, it is more convenient towork with the logarithms of the thinking times. The distribution of thinkingtime logarithms for the model can be derived from Equation 8 with a simplechange of variables, yielding
r z e ez z z z( ) = +( )− − − +( )η β
η0 0
1[9],
where z ≡ ( )ln τ , z0 ≡ ( )ln α , and η γ≡ −( )N 1 . This distribution ought toresemble a Gaussian curve, and it does, as seen in Figure 5. With β fixed atunity, the model only provides two parameters to control the shape of the
0.30
0.25
0.20
0.15
0.10
0.05
0.00
r( z
)
86420-2-4-6z - z0
η = 0.5 η = 1.0 η = 1.5 η = 2.0 η = 2.5 η = 3.0
Figure 5: Probability distribution function r(z) for logarithms of thinking timesgenerated by power-law recall function, for a range of values of the parameterη and for β = 1.
Measuring and Modeling Physics Students’ Conceptual Knowledge… 17
distribution, since N and γ always appear in the same combination (labeled
η). α determines z0, a horizontal axis offset (equivalent to setting the time
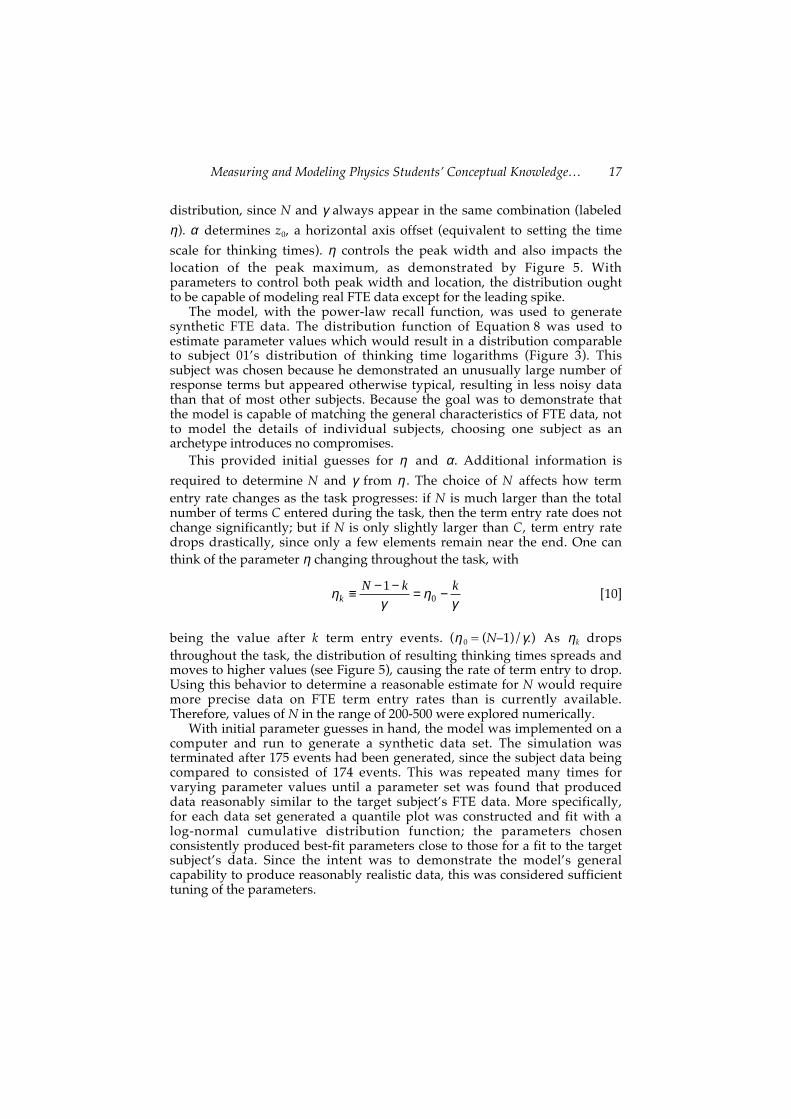
scale for thinking times). η controls the peak width and also impacts thelocation of the peak maximum, as demonstrated by Figure 5. Withparameters to control both peak width and location, the distribution oughtto be capable of modeling real FTE data except for the leading spike.
The model, with the power-law recall function, was used to generatesynthetic FTE data. The distribution function of Equation 8 was used toestimate parameter values which would result in a distribution comparableto subject 01’s distribution of thinking time logarithms (Figure 3). Thissubject was chosen because he demonstrated an unusually large number ofresponse terms but appeared otherwise typical, resulting in less noisy datathan that of most other subjects. Because the goal was to demonstrate thatthe model is capable of matching the general characteristics of FTE data, notto model the details of individual subjects, choosing one subject as anarchetype introduces no compromises.
This provided initial guesses for η and α. Additional information is
required to determine N and γ from η . The choice of N affects how termentry rate changes as the task progresses: if N is much larger than the totalnumber of terms C entered during the task, then the term entry rate does notchange significantly; but if N is only slightly larger than C, term entry ratedrops drastically, since only a few elements remain near the end. One canthink of the parameter η changing throughout the task, with
ηγ
ηγk
N k k≡ − − = −10 [10]
being the value after k term entry events. (η 0 = (N–1)/γ.) As ηk dropsthroughout the task, the distribution of resulting thinking times spreads andmoves to higher values (see Figure 5), causing the rate of term entry to drop.Using this behavior to determine a reasonable estimate for N would requiremore precise data on FTE term entry rates than is currently available.Therefore, values of N in the range of 200-500 were explored numerically.
With initial parameter guesses in hand, the model was implemented on acomputer and run to generate a synthetic data set. The simulation wasterminated after 175 events had been generated, since the subject data beingcompared to consisted of 174 events. This was repeated many times forvarying parameter values until a parameter set was found that produceddata reasonably similar to the target subject’s FTE data. More specifically,for each data set generated a quantile plot was constructed and fit with alog-normal cumulative distribution function; the parameters chosenconsistently produced best-fit parameters close to those for a fit to the targetsubject’s data. Since the intent was to demonstrate the model’s generalcapability to produce reasonably realistic data, this was considered sufficienttuning of the parameters.

18 Measuring and Modeling Physics Students’ Conceptual Knowledge…
The final set of parameter values chosen was N = 300, γ = 75, and α = 15
sec, with β still fixed at 1. The resulting histogram for one instantiation (i.e.,one randomly generated link matrix) is shown in Figure 6, along with a best-fit log-normal curve (actually a best-fit normal curve to the logarithms of thethinking times). For comparison, the equivalent plot for subject 01’s FTEdata can be seen in Figure 3. It is evident from these plots and from similarplots for other randomly generated link matrices that the model is capable ofproducing thinking time distributions that resemble real FTE thinking timedistributions, though without the leading spike and slight skew seen in mostsubject’s data. The model generally produces more outliers on both sides ofthe distribution than is seen in subject data. Low-end outliers could perhapsbe eliminated by choosing a value of β smaller than 1.
Figure 7 shows thinking times in order of occurrence for the same model-generated data (including randomly-generated typing times); forcomparison, Figure 2 shows a similar plot for subject 01’s data. The twoplots are not unreasonably different in their gross characteristics, aside fromone very long time in the model plot due to one of the aforementionedoutliers. The model data does show a tendency towards decreasing termentry rate as the task progresses, and longer thinking times are significantlymore likely to be found during the later part of the task.
The model appears relatively successful with an amorphous matrix.However, it is unsatisfying in one significant aspect, the size of the
30
25
20
15
10
5
0
cou
nt
543210-1-2-3
ln( thinking time / 1 second )
data normal fit
Figure 6: Histogram of logarithms of thinking times for model-generated data,using N = 300, γ = 75, α = 15 sec, and β = 1. The probability density curve forthe best-fit normal distribution is shown. (Compare to Figure 3.)

Measuring and Modeling Physics Students’ Conceptual Knowledge… 19
parameter γ needed to produce a reasonable thinking time distribution. For
plausible model output, it was found that η = (N–1)/γ must be close to 4.0,
and N must be approximately 300, which requires γ to be approximately 75,a huge value for an exponent. This can be understood in terms ofdistributions. The distribution of link strengths chosen according to themodel’s next-element selection algorithm is given by Equation 3. For largeN, this distribution is astronomically heavily weighted in favor of valuesextremely close to one: the mean value of the distribution is (N–1)/N, whichis 0.9967 for N = 300. This makes sense: for each walk step, the largest of aset of N–1 links is being selected. Because all strengths responsible forthinking times are therefore extremely close to one, with very little variation,a hypersensitive recall function is required to produce an acceptable rangeof thinking times. Thus γ , the exponent in the power law recall function ofEquation 3, must be huge. This is unacceptable for a model that aspires to becognitively interpretable, and may be interpreted as evidence that a matrixof randomly chosen numbers is not a good model of a subject’s conceptualknowledge store and that other matrix-filling schemes should beinvestigated.
D. Fractal MatrixInspection of FTE responses from the studies shows that many terms
entered by subjects are connected only tenuously if at all to the previousterm, and analysis showed that these cases tend to correlate with largerthinking times. It therefore seems reasonable to insist on a model in which
100
80
60
40
20
0
thin
kin
g t
ime
[s]
160140120100806040200
term index
extends to 209.6 s
Figure 7: Thinking time vs. term index for model-generated data of Figure 6.(Compare to Figure 2.)

20 Measuring and Modeling Physics Students’ Conceptual Knowledge…
longer thinking times result from weak links, not from links almost equal tothe strongest links. This suggests that the link matrix representingconnections between knowledge elements should not be filled with numbersrandomly drawn between zero and one, but according to a different andmore structured scheme that forces the walk algorithm to select a broaderrange of link strengths. One possibility is to fill a randomly-chosen subset ofthe elements with numbers between zero and one, and set the rest to zero: a“sparse amorphous matrix”. If the number of nonzero elements in eachcolumn is the same, defined to be M, then all of the preceding subsection’scalculations for the amorphous matrix hold except for Equation 11, with Mreplacing N . Effectively, this modification allows one to reduce theparameter γ to a less problematic value without “running out of elements”too soon in the task by reducing N.
A different approach is to construct a matrix with a clustered structure.Qualitative results from physics education research suggest that a physicsexpert’s knowledge structure is hierarchical, with strongly interlinkedclusters of concepts, less strongly interlinked clusters of clusters(“metaclusters”), yet less strongly interlinked clusters of metaclusters, etc.(Gerace, Leonard, Dufresne, & Mestre, 1997). The resulting FTE “walk”through such a matrix should encounter all of the elements in a cluster, andthen follow a weaker link to a new cluster within the same metacluster.Eventually, the metacluster would be exhausted and an even weaker linkwould be followed to a meta-metacluster. According to interviews, FTEsubjects perceive themselves to enter a set of closely-related terms (e.g., on“circular motion” or “types of forces”), exhaust it, and then move on toanother tightly-associated set.
One algorithm for generating a matrix with such a fractal structure is asfollows. The algorithm requires that the number of knowledge elements Nbe a power of 2. First, assign each matrix element a “zone” index asdescribed in Figure 8; call the resulting matrix of zone indices Z. Second,generate a “deterministic” matrix D of link strengths based on eachelement’s zone:
D Zi j i j, ,d≡ ( ) [11]
where
d zz z
z( ) ≡
≠( )=( )
−ρ 0
0 0[12]
and ρ is a model parameter that determines how weakly-linked metaclustersare relative to clusters. Third, generate a “random” matrix R of linkstrengths, in which diagonal elements are zero and off-diagonals arerandomly selected from a distribution uniform between zero and one.Finally, combine the deterministic and random matrices into the final linkmatrix according to

Measuring and Modeling Physics Students’ Conceptual Knowledge… 21
L D R≡ −( ) +1 λ λ [13]
where λ is a new model parameter that controls the degree of randomness in
the link matrix. If λ = 1, the model reduces to the amorphous link matrix
version studied in the previous subsection. When λ → 0, the matrix limits to
a regular, orderly fractal, although λ cannot be strictly zero without causingthe walk matrix to encounter ties in its decision-making step.
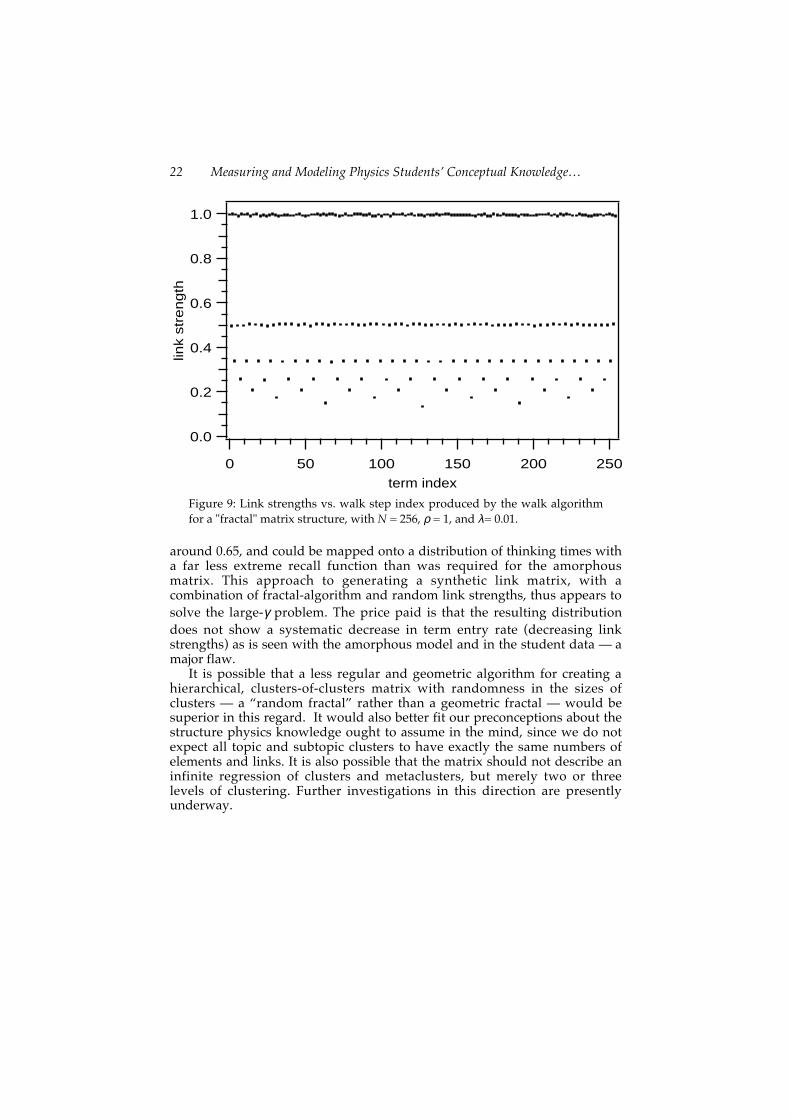
This matrix is successful at distributing the link strengths selected by thewalk across a wider range than is produced by the amorphous matrix.Figure 9 shows a plot of link strength selected vs. walk step index for onerun of the model with N = 256, ρ = 1, and λ = 0.01. Clearly, the link strengthsproduced are distributed among several values between approximately 0.1and 1, although they fall into distinct narrow bands with large gaps, andoccur in a regular pattern as the walk progresses. This is a consequence ofthe regularity of the link matrix.
By increasing the randomness parameter λ, one can “smear out” thebands until they overlap, simultaneously decreasing the orderliness of thewalk. Figure 10 shows a plot like that of Figure 9, but for one run of themodel with λ = 0.4. The resulting link strengths are approximately 0.45 andgreater. A histogram of the link strengths (not shown) is softly peaked
Figure 8: Zone number assigned to each matrix element for fractal algorithm.
22 Measuring and Modeling Physics Students’ Conceptual Knowledge…
around 0.65, and could be mapped onto a distribution of thinking times witha far less extreme recall function than was required for the amorphousmatrix. This approach to generating a synthetic link matrix, with acombination of fractal-algorithm and random link strengths, thus appears tosolve the large-γ problem. The price paid is that the resulting distributiondoes not show a systematic decrease in term entry rate (decreasing linkstrengths) as is seen with the amorphous model and in the student data — amajor flaw.
It is possible that a less regular and geometric algorithm for creating ahierarchical, clusters-of-clusters matrix with randomness in the sizes ofclusters — a “random fractal” rather than a geometric fractal — would besuperior in this regard. It would also better fit our preconceptions about thestructure physics knowledge ought to assume in the mind, since we do notexpect all topic and subtopic clusters to have exactly the same numbers ofelements and links. It is also possible that the matrix should not describe aninfinite regression of clusters and metaclusters, but merely two or threelevels of clustering. Further investigations in this direction are presentlyunderway.
1.0
0.8
0.6
0.4
0.2
0.0
link
stre
ng
th
250200150100500
term index
Figure 9: Link strengths vs. walk step index produced by the walk algorithmfor a "fractal" matrix structure, with N = 256, ρ = 1, and λ= 0.01.

Measuring and Modeling Physics Students’ Conceptual Knowledge… 23
V. DiscussionSection II of this paper defined and motivated the Free Term Entry task, a
proposed instrument that is being investigated as a new approach to“cognitively diagnostic assessment”. Section III described two distinctivephenomenological characteristics of observed FTE data: an approximatelylog-normal distribution of thinking time values which displays a leadingspike and slight skew, and a general decrease in term entry rate as the taskprogresses. In addition, it presented evidence that the “thinking time” datacaptured by the FTE task depends at least partially on the strength of therelationship between term pairs in the subject’s conceptual knowledgestructure (CKS). These characteristics provide a target for modeling efforts.
Section IV proposed a simple, quantitative, dynamical model for how asubject accesses her CKS to generate observed FTE data. The fundamentalcomponents of the model are a “link matrix” describing the subject’s CKS, a“recall function” indicating how the thinking time to remember a termdepends on the term’s association with the previous term, and a “walk”algorithm for selecting the sequence of knowledge elements (terms). Thesection investigated the model’s ability to simulate FTE thinking times,using two different schemes for filling the link matrix. It was found thatfilling the matrix with random numbers could produce reasonable-lookingoutput, although an unacceptably extreme recall function was required.Mixing the random matrix with a deterministic matrix having a geometric
1.0
0.8
0.6
0.4
0.2
0.0
link
stre
ng
th
250200150100500
term index
Figure 10: Same as Figure 9, but with λ = 0.4.

24 Measuring and Modeling Physics Students’ Conceptual Knowledge…
fractal structure allowed a more reasonable recall function, but lost themodel’s ability to demonstrate decreasing term entry rate.
The leading spike is a very interesting aspect of the observed data.Neither class of link matrix investigated here is capable of reproducing thespike without arbitrarily postulating a non-monotonic recall function. Thespike might be a clue to a “realistic” link matrix structure, or an indicationthat the matrix walk model as proposed is fundamentally insufficient toexplain FTE data. In general, a two-peaked distribution for a randomvariable suggests that two different mechanisms of production are involved,so perhaps two different recall processes are at work during FTE taskcompletion.
Perhaps readers with a more extensive background in cognitive sciencecan connect the model to established knowledge of cognitive mechanisms. Acognitive hypothesis for the spike-plus-peak distribution would beparticularly useful, as would an a priori argument for a particular form of therecall function.
The FTE task is unlikely to be useful for practical assessment by itself, butcould be valuable when combined with other, related tasks. One such task isthe Term Prompted Term Entry (TPTE) task, in which students are presentedwith several different terms from a subject area, one at a time (Beatty, 2000;Beatty & Gerace, 2001). For each, they are asked to respond spontaneouslywith terms they consider “related” to the prompt term, until ten terms havebeen entered or ten seconds have passed without a term being entered.Where the FTE is intended to explore widely the concepts a subjectassociates with a subject and the general patterns of connectivity withinthem, the TPTE is designed to probe connections in more detail.
Consider an assessment method in which students are first given an FTEtask to collect a vocabulary for a subject (and perhaps make some generaldeductions about the students’ knowledge characteristics), and then given abattery of TPTE tasks with various terms they had responded with duringthe FTE and other TPTE tasks. In this way it might be possible and practicalto construct a detailed, quantitative “map” of each students’ conceptualknowledge structure for the subject.
As a research question, it would be interesting to gather many such mapsfor students and “expert” physicists of various levels, and look for generalfeatures and patterns which correlate with subject mastery. The connectivitypatterns found could also suggest appropriate link-matrix constructionalgorithms for the Matrix Walk Model.
The kind of assessment described above could clearly be defeated bystudents that primed themselves by memorizing vocabulary listsbeforehand. The approach would therefore not be useful for high-stakes“summative” assessment for assigning grades and determining placementsand admissions, but rather for ongoing “formative” assessment to guideclass-to-class teaching and learning.
Overall, the work described herein is not intended as a definitivepresentation of conclusions, either empirical or theoretical. Rather, it ismeant to suggest a novel approach to the challenge of assessment. It is alsomeant to serve as a kind of “existence proof” of the plausibility of bringing

Measuring and Modeling Physics Students’ Conceptual Knowledge… 25
quantitative cognitive modeling into practical physics education research,and ultimately into educational practice.
ReferencesAnderson, J. R. (1993). Rules of the Mind. Hillsdale, New Jersey: Lawrence Erlbaum
Associates.Beatty, I. D. (2000). ConMap: Investigating New Computer-Based Approaches to Assessing
Conceptual Knowledge Structure in Physics. Ph.D. dissertation, University ofMassachusetts, Amherst.
Beatty, I. D., & Gerace, W. J. (2001). Probing physics students’ conceptual knowledgestructures through term association. Physics Education Research Supplement to TheAmerican Journal of Physics, (in press).
Bransford, J. D., Brown, A. L., & Cocking, R. R. (Eds.). (1999). How People Learn: Brain,Mind, Experience, and School. Washington, D.C.: National Academy Press.
Chi, M. T. H., Feltovich, P. J., & Glaser, R. (1981). Categorization and representationof physics problems by experts and novices. Cognitive Science, 5, 121-152.
Dufresne, R. J., Leonard, W. J., & Gerace, W. J. (1992). Research-based materials fordeveloping a conceptual approach to science. Paper presented at the Workshop onResearch in Science and Mathematics Education, Cathedral Peak, South Africa.
Gerace, W. J. (1992). Contributions from cognitive research to mathematics and scienceeducation. Paper presented at the Workshop on Research in Science andMathematics Education, Cathedral Peak, South Africa.
Gerace, W. J., Leonard, W. J., Dufresne, R. J., & Mestre, J. P. (1997). Concept-basedproblem solving: Combining educational research results and practical experience tocreate a framework for learning physics and to derive effective classroom practices(PERG-1997#05-AUG#2-26pp). Amherst: University of Massachusetts PhysicsEducation Research Group.
Hardiman, P. T., Dufresne, R. J., & Mestre, J. P. (1989). The relation between problemcategorization and problem solving among experts and novices. Memory andCognition, 17(5), 627-638.
Hertz, J., Krogh, A., & Palmer, R. G. (1991). Introduction to the Theory of NeuralComputation. Redwood City, California: Addison-Wesley.
Hopfield, J. H. (1982). Neural networks and physical systems with emergentcollective computational abilities. Proceedings of the National Academy of SciencesUSA, 79(April), 2554-2558.
Larkin, J. H. (1979). Information processing models and science instruction. In J.Lochhead & J. Clement (Eds.), Cognitive Process Instruction (pp. 109-118).Philadelphia, Pennsylvania: The Franklin Institute Press.
Leonard, W. J., Gerace, W. J., Dufresne, R. J., & Mestre, J. P. (1999). Concept-BasedProblem Solving. In W. J. Leonard, R. J. Dufresne, W. J. Gerace, & J. P. Mestre,Teacher's Guide to Accompany "Minds•On Physics: Motion". Dubuque, Iowa:Kendall/Hunt.
Mestre, J., & Touger, J. (1989). Cognitive research — what’s in it for physics teachers?The Physics Teacher, 27(6), 447-456.
Nichols, P. D., Chipman, S. F., & Brennan, R. L. (1995). Cognitively DiagnosticAssessment. Hillsdale, New Jersey: Lawrence Erlbaum Associates.
Novak, J. D., & Gowin, D. B. (1984). Learning How to Learn. Englewood Cliffs, NewJersey: Prentice-Hall.
Quillian, M. R. (1968). Semantic memory. In M. L. Minsky (Ed.), Semantic InformationProcessing (pp. 216-260). Cambridge, MA: MIT Press.
Redish, E. F. (1994). Implications of cognitive studies for teaching physics. AmericanJournal of Physics, 62(9), 796-803.

26 Measuring and Modeling Physics Students’ Conceptual Knowledge…
Rice, D. C., Ryan, J. M., & Samson, S. M. (1998). Using concept maps to assess studentlearning in the science classroom: Must different methods compete? Journal ofResearch in Science Teaching, 35(10), 1103-1127.
Ruiz-Primo, M. A., & Shavelson, R. J. (1996). Problems and issues in the use ofconcept maps in science assessment. Journal of Research in Science Teaching, 33(6),569-600.
Woods, W. A. (1975). What’s in a link: Foundations for semantic networks. In D. G.Bobrow & A. Collins (Eds.), Representation and understanding (pp. 35-82). NewYork: Academic Press.
Young, M. J. (1993). Quantitative measures for the assessment of declarative knowledgestructure characteristics. Unpublished Ph.D., University of Pittsburgh, Pittsburgh,PA.
Zajchowski, R., & Martin, J. (1993). Differences in the problem solving of strongerand weaker novices in physics: Knowledge, strategies, or knowledge structure?Journal of Research in Science Teaching, 30(5), 459-470.