Measuring Air Leakage Characteristics with Flexible Double Air Chambers
7
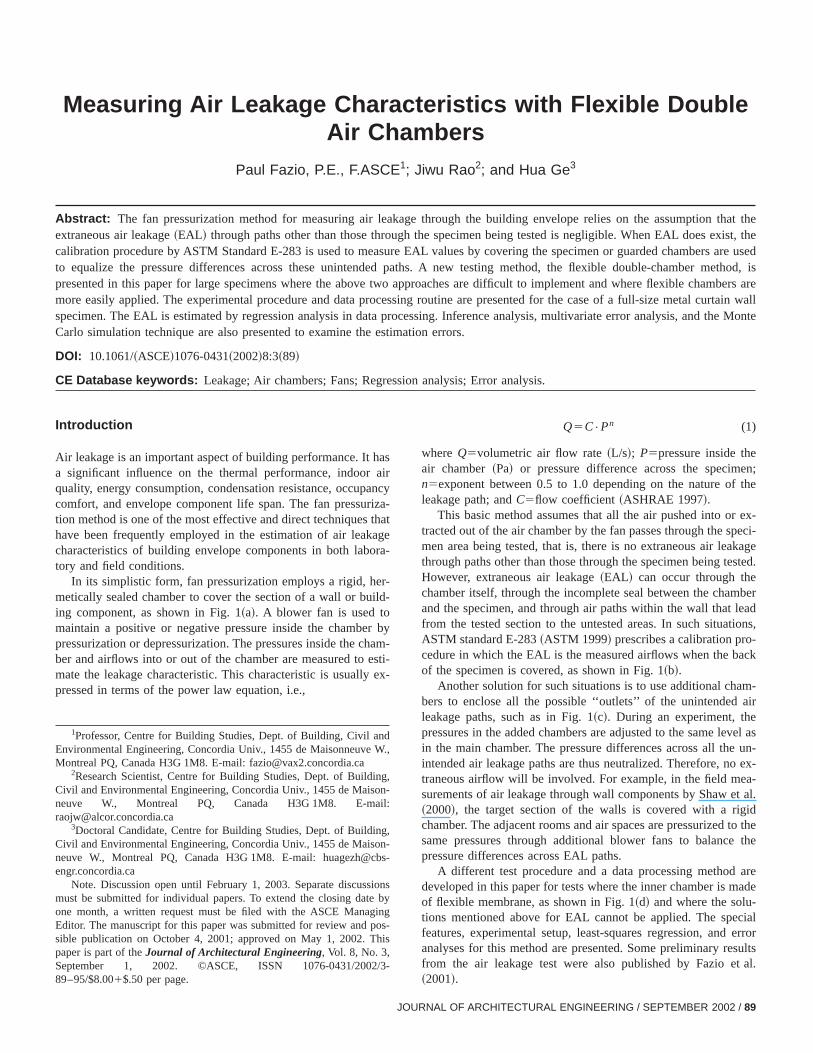
Measuring Air Leakage Characteristics with Flexible Double Air Chambers Paul Fazio, P.E., F.ASCE 1 ; Jiwu Rao 2 ; and Hua Ge 3 Abstract: The fan pressurization method for measuring air leakage through the building envelope relies on the assumption that the extraneous air leakage ~EAL! through paths other than those through the specimen being tested is negligible. When EAL does exist, the calibration procedure by ASTM Standard E-283 is used to measure EAL values by covering the specimen or guarded chambers are used to equalize the pressure differences across these unintended paths. A new testing method, the flexible double-chamber method, is presented in this paper for large specimens where the above two approaches are difficult to implement and where flexible chambers are more easily applied. The experimental procedure and data processing routine are presented for the case of a full-size metal curtain wall specimen. The EAL is estimated by regression analysis in data processing. Inference analysis, multivariate error analysis, and the Monte Carlo simulation technique are also presented to examine the estimation errors. DOI: 10.1061/~ASCE!1076-0431~2002!8:3~89! CE Database keywords: Leakage; Air chambers; Fans; Regression analysis; Error analysis. Introduction Air leakage is an important aspect of building performance. It has a significant influence on the thermal performance, indoor air quality, energy consumption, condensation resistance, occupancy comfort, and envelope component life span. The fan pressuriza- tion method is one of the most effective and direct techniques that have been frequently employed in the estimation of air leakage characteristics of building envelope components in both labora- tory and field conditions. In its simplistic form, fan pressurization employs a rigid, her- metically sealed chamber to cover the section of a wall or build- ing component, as shown in Fig. 1~a!. A blower fan is used to maintain a positive or negative pressure inside the chamber by pressurization or depressurization. The pressures inside the cham- ber and airflows into or out of the chamber are measured to esti- mate the leakage characteristic. This characteristic is usually ex- pressed in terms of the power law equation, i.e., Q 5C • P n (1) where Q5volumetric air flow rate ~L/s!; P5pressure inside the air chamber ~Pa! or pressure difference across the specimen; n5exponent between 0.5 to 1.0 depending on the nature of the leakage path; and C5flow coefficient ~ASHRAE 1997!. This basic method assumes that all the air pushed into or ex- tracted out of the air chamber by the fan passes through the speci- men area being tested, that is, there is no extraneous air leakage through paths other than those through the specimen being tested. However, extraneous air leakage ~EAL! can occur through the chamber itself, through the incomplete seal between the chamber and the specimen, and through air paths within the wall that lead from the tested section to the untested areas. In such situations, ASTM standard E-283 ~ASTM 1999! prescribes a calibration pro- cedure in which the EAL is the measured airflows when the back of the specimen is covered, as shown in Fig. 1~b!. Another solution for such situations is to use additional cham- bers to enclose all the possible ‘‘outlets’’ of the unintended air leakage paths, such as in Fig. 1~c!. During an experiment, the pressures in the added chambers are adjusted to the same level as in the main chamber. The pressure differences across all the un- intended air leakage paths are thus neutralized. Therefore, no ex- traneous airflow will be involved. For example, in the field mea- surements of air leakage through wall components by Shaw et al. ~2000!, the target section of the walls is covered with a rigid chamber. The adjacent rooms and air spaces are pressurized to the same pressures through additional blower fans to balance the pressure differences across EAL paths. A different test procedure and a data processing method are developed in this paper for tests where the inner chamber is made of flexible membrane, as shown in Fig. 1~d! and where the solu- tions mentioned above for EAL cannot be applied. The special features, experimental setup, least-squares regression, and error analyses for this method are presented. Some preliminary results from the air leakage test were also published by Fazio et al. ~2001!. 1 Professor, Centre for Building Studies, Dept. of Building, Civil and Environmental Engineering, Concordia Univ., 1455 de Maisonneuve W., Montreal PQ, Canada H3G 1M8. E-mail: [email protected] 2 Research Scientist, Centre for Building Studies, Dept. of Building, Civil and Environmental Engineering, Concordia Univ., 1455 de Maison- neuve W., Montreal PQ, Canada H3G 1M8. E-mail: [email protected] 3 Doctoral Candidate, Centre for Building Studies, Dept. of Building, Civil and Environmental Engineering, Concordia Univ., 1455 de Maison- neuve W., Montreal PQ, Canada H3G 1M8. E-mail: huagezh@cbs- engr.concordia.ca Note. Discussion open until February 1, 2003. Separate discussions must be submitted for individual papers. To extend the closing date by one month, a written request must be filed with the ASCE Managing Editor. The manuscript for this paper was submitted for review and pos- sible publication on October 4, 2001; approved on May 1, 2002. This paper is part of the Journal of Architectural Engineering, Vol. 8, No. 3, September 1, 2002. ©ASCE, ISSN 1076-0431/2002/3- 89–95/$8.001$.50 per page. JOURNAL OF ARCHITECTURAL ENGINEERING / SEPTEMBER 2002 / 89
-
Upload
independent -
Category
Documents
-
view
1 -
download
0
Transcript of Measuring Air Leakage Characteristics with Flexible Double Air Chambers
that thexist, thes are usedmethod, ismbers areurtain wallthe Monte
Measuring Air Leakage Characteristics with Flexible DoubleAir Chambers
Paul Fazio, P.E., F.ASCE1; Jiwu Rao2; and Hua Ge3
Abstract: The fan pressurization method for measuring air leakage through the building envelope relies on the assumptionextraneous air leakage~EAL! through paths other than those through the specimen being tested is negligible. When EAL does ecalibration procedure by ASTM Standard E-283 is used to measure EAL values by covering the specimen or guarded chamberto equalize the pressure differences across these unintended paths. A new testing method, the flexible double-chamberpresented in this paper for large specimens where the above two approaches are difficult to implement and where flexible chamore easily applied. The experimental procedure and data processing routine are presented for the case of a full-size metal cspecimen. The EAL is estimated by regression analysis in data processing. Inference analysis, multivariate error analysis, andCarlo simulation technique are also presented to examine the estimation errors.
DOI: 10.1061/~ASCE!1076-0431~2002!8:3~89!
CE Database keywords: Leakage; Air chambers; Fans; Regression analysis; Error analysis.
hasairancrizathaagera-
r-ild-
r bhamesti
ex
en;the
ex-peci-kagested.
bereadions,-ack
m-air
vel asun-ex-
a-t al.idto thethe
areade
cialerror
sultst al.
ndW.,
ng,on-il:
g,on-bs-
ionby
ingos-his
/3-
Introduction
Air leakage is an important aspect of building performance. Ita significant influence on the thermal performance, indoorquality, energy consumption, condensation resistance, occupcomfort, and envelope component life span. The fan pressution method is one of the most effective and direct techniqueshave been frequently employed in the estimation of air leakcharacteristics of building envelope components in both labotory and field conditions.
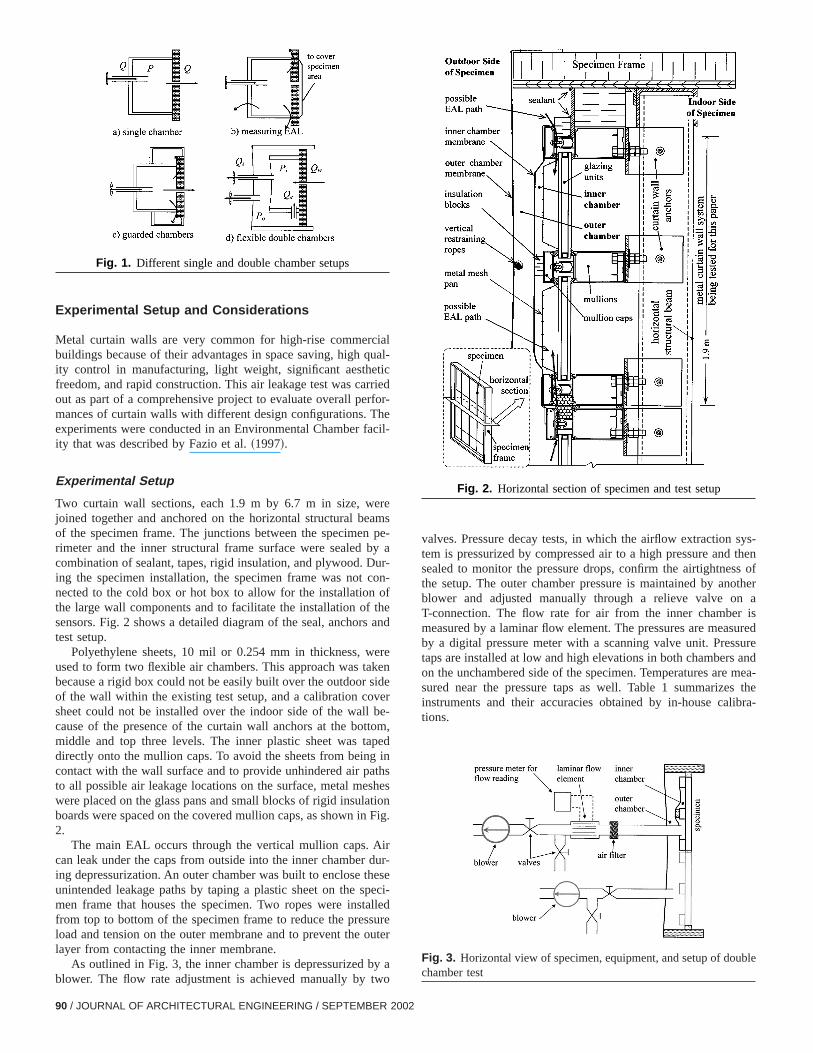
In its simplistic form, fan pressurization employs a rigid, hemetically sealed chamber to cover the section of a wall or buing component, as shown in Fig. 1~a!. A blower fan is used tomaintain a positive or negative pressure inside the chambepressurization or depressurization. The pressures inside the cber and airflows into or out of the chamber are measured tomate the leakage characteristic. This characteristic is usuallypressed in terms of the power law equation, i.e.,
1Professor, Centre for Building Studies, Dept. of Building, Civil aEnvironmental Engineering, Concordia Univ., 1455 de MaisonneuveMontreal PQ, Canada H3G 1M8. E-mail: [email protected]
2Research Scientist, Centre for Building Studies, Dept. of BuildiCivil and Environmental Engineering, Concordia Univ., 1455 de Maisneuve W., Montreal PQ, Canada H3G 1M8. [email protected]
3Doctoral Candidate, Centre for Building Studies, Dept. of BuildinCivil and Environmental Engineering, Concordia Univ., 1455 de Maisneuve W., Montreal PQ, Canada H3G 1M8. E-mail: [email protected]
Note. Discussion open until February 1, 2003. Separate discussmust be submitted for individual papers. To extend the closing dateone month, a written request must be filed with the ASCE ManagEditor. The manuscript for this paper was submitted for review and psible publication on October 4, 2001; approved on May 1, 2002. Tpaper is part of theJournal of Architectural Engineering, Vol. 8, No. 3,September 1, 2002. ©ASCE, ISSN 1076-0431/200289–95/$8.001$.50 per page.
JOU
y-t
y-
--
Q5C•Pn (1)
whereQ5volumetric air flow rate~L/s!; P5pressure inside theair chamber~Pa! or pressure difference across the specimn5exponent between 0.5 to 1.0 depending on the nature ofleakage path; andC5flow coefficient~ASHRAE 1997!.
This basic method assumes that all the air pushed into ortracted out of the air chamber by the fan passes through the smen area being tested, that is, there is no extraneous air leathrough paths other than those through the specimen being teHowever, extraneous air leakage~EAL! can occur through thechamber itself, through the incomplete seal between the chamand the specimen, and through air paths within the wall that lfrom the tested section to the untested areas. In such situatASTM standard E-283~ASTM 1999! prescribes a calibration procedure in which the EAL is the measured airflows when the bof the specimen is covered, as shown in Fig. 1~b!.
Another solution for such situations is to use additional chabers to enclose all the possible ‘‘outlets’’ of the unintendedleakage paths, such as in Fig. 1~c!. During an experiment, thepressures in the added chambers are adjusted to the same lein the main chamber. The pressure differences across all theintended air leakage paths are thus neutralized. Therefore, notraneous airflow will be involved. For example, in the field mesurements of air leakage through wall components by Shaw e~2000!, the target section of the walls is covered with a rigchamber. The adjacent rooms and air spaces are pressurizedsame pressures through additional blower fans to balancepressure differences across EAL paths.
A different test procedure and a data processing methoddeveloped in this paper for tests where the inner chamber is mof flexible membrane, as shown in Fig. 1~d! and where the solu-tions mentioned above for EAL cannot be applied. The spefeatures, experimental setup, least-squares regression, andanalyses for this method are presented. Some preliminary refrom the air leakage test were also published by Fazio e~2001!.
s
RNAL OF ARCHITECTURAL ENGINEERING / SEPTEMBER 2002 / 89
ialua
ticrrierforhecil
ereampe
byur-onofthe
an
erekenide
verbe-tompedin
thsshetionFig
irdures
pecallesureute
y awo
sys-thens ofother
ais
suredureandmea-
thebra-
ble
Experimental Setup and Considerations
Metal curtain walls are very common for high-rise commercbuildings because of their advantages in space saving, high qity control in manufacturing, light weight, significant aesthefreedom, and rapid construction. This air leakage test was caout as part of a comprehensive project to evaluate overall pemances of curtain walls with different design configurations. Texperiments were conducted in an Environmental Chamber faity that was described by Fazio et al.~1997!.
Experimental Setup
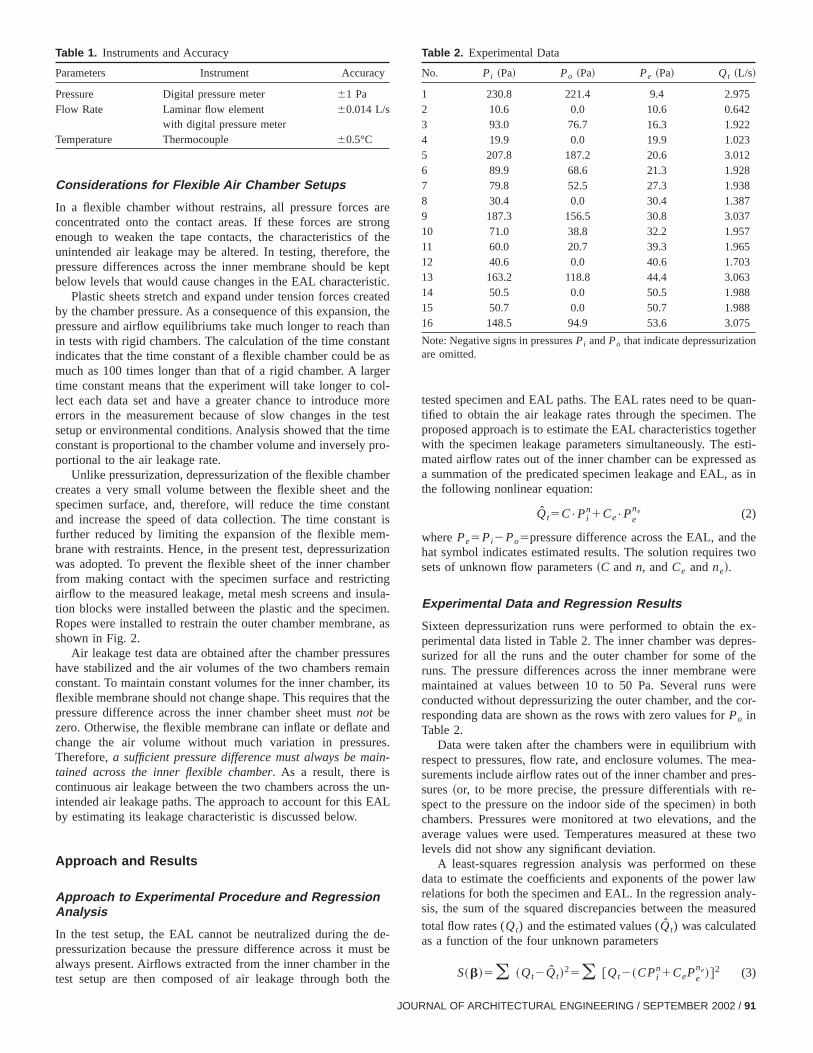
Two curtain wall sections, each 1.9 m by 6.7 m in size, wjoined together and anchored on the horizontal structural beof the specimen frame. The junctions between the specimenrimeter and the inner structural frame surface were sealedcombination of sealant, tapes, rigid insulation, and plywood. Ding the specimen installation, the specimen frame was not cnected to the cold box or hot box to allow for the installationthe large wall components and to facilitate the installation ofsensors. Fig. 2 shows a detailed diagram of the seal, anchorstest setup.
Polyethylene sheets, 10 mil or 0.254 mm in thickness, wused to form two flexible air chambers. This approach was tabecause a rigid box could not be easily built over the outdoor sof the wall within the existing test setup, and a calibration cosheet could not be installed over the indoor side of the wallcause of the presence of the curtain wall anchors at the botmiddle and top three levels. The inner plastic sheet was tadirectly onto the mullion caps. To avoid the sheets from beingcontact with the wall surface and to provide unhindered air pato all possible air leakage locations on the surface, metal mewere placed on the glass pans and small blocks of rigid insulaboards were spaced on the covered mullion caps, as shown in2.
The main EAL occurs through the vertical mullion caps. Acan leak under the caps from outside into the inner chambering depressurization. An outer chamber was built to enclose thunintended leakage paths by taping a plastic sheet on the smen frame that houses the specimen. Two ropes were instfrom top to bottom of the specimen frame to reduce the presload and tension on the outer membrane and to prevent the olayer from contacting the inner membrane.
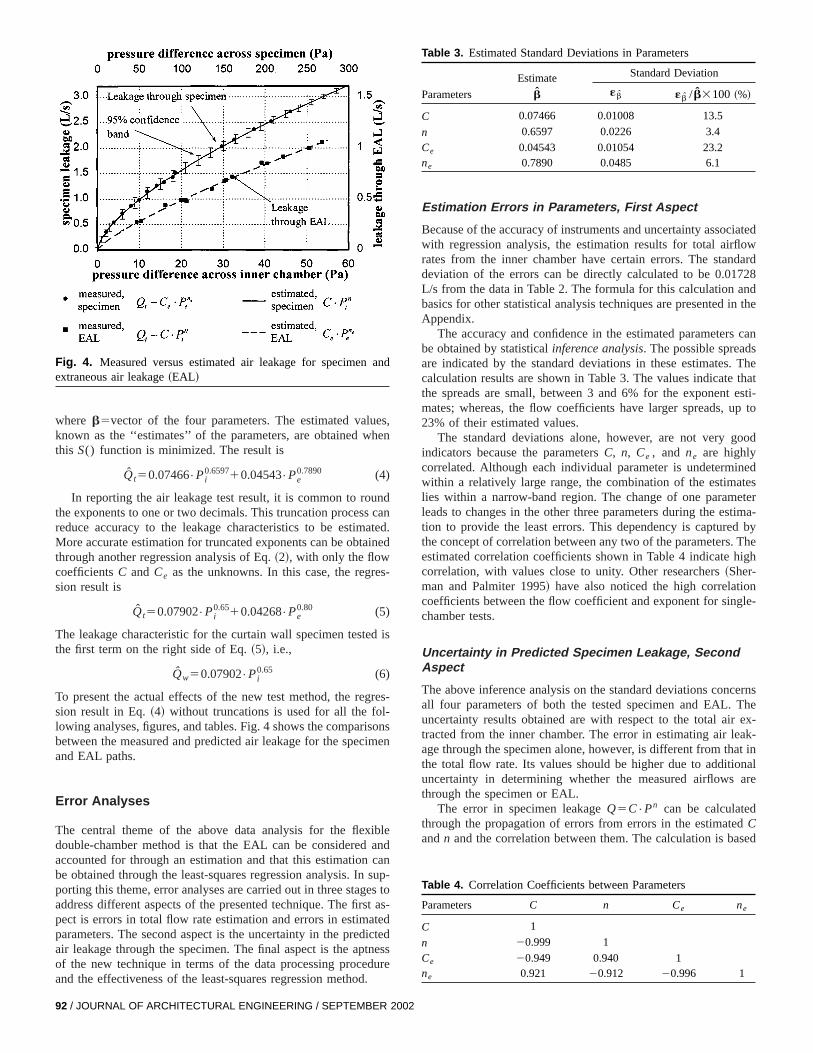
As outlined in Fig. 3, the inner chamber is depressurized bblower. The flow rate adjustment is achieved manually by t
Fig. 1. Different single and double chamber setups
90 / JOURNAL OF ARCHITECTURAL ENGINEERING / SEPTEMBER 2002
l-
d-
-
s-
a
-
d
,
s
.
-ei-d
r
valves. Pressure decay tests, in which the airflow extractiontem is pressurized by compressed air to a high pressure andsealed to monitor the pressure drops, confirm the airtightnesthe setup. The outer chamber pressure is maintained by anblower and adjusted manually through a relieve valve onT-connection. The flow rate for air from the inner chambermeasured by a laminar flow element. The pressures are meaby a digital pressure meter with a scanning valve unit. Presstaps are installed at low and high elevations in both chamberson the unchambered side of the specimen. Temperatures aresured near the pressure taps as well. Table 1 summarizesinstruments and their accuracies obtained by in-house calitions.
Fig. 2. Horizontal section of specimen and test setup
Fig. 3. Horizontal view of specimen, equipment, and setup of douchamber test
aretronf th, thke
sticeaten, thhanante agercol-mote
imepro
berth
tannt im-atiobe
tingsulen
e, a
ureain
r, itst th
andes.in-
e uEAL
de-st btheth
uan-Thetheresti-d ass in
hetwo
ex-res-thewereere
cor-
ithmea-res-re-
thee two
heselaw
aly-sured
n
Considerations for Flexible Air Chamber Setups
In a flexible chamber without restrains, all pressure forcesconcentrated onto the contact areas. If these forces are senough to weaken the tape contacts, the characteristics ounintended air leakage may be altered. In testing, thereforepressure differences across the inner membrane should bebelow levels that would cause changes in the EAL characteri
Plastic sheets stretch and expand under tension forces crby the chamber pressure. As a consequence of this expansiopressure and airflow equilibriums take much longer to reach tin tests with rigid chambers. The calculation of the time constindicates that the time constant of a flexible chamber could bmuch as 100 times longer than that of a rigid chamber. A lartime constant means that the experiment will take longer tolect each data set and have a greater chance to introduceerrors in the measurement because of slow changes in thesetup or environmental conditions. Analysis showed that the tconstant is proportional to the chamber volume and inverselyportional to the air leakage rate.
Unlike pressurization, depressurization of the flexible chamcreates a very small volume between the flexible sheet andspecimen surface, and, therefore, will reduce the time consand increase the speed of data collection. The time constafurther reduced by limiting the expansion of the flexible mebrane with restraints. Hence, in the present test, depressurizwas adopted. To prevent the flexible sheet of the inner chamfrom making contact with the specimen surface and restricairflow to the measured leakage, metal mesh screens and intion blocks were installed between the plastic and the specimRopes were installed to restrain the outer chamber membranshown in Fig. 2.
Air leakage test data are obtained after the chamber presshave stabilized and the air volumes of the two chambers remconstant. To maintain constant volumes for the inner chambeflexible membrane should not change shape. This requires thapressure difference across the inner chamber sheet mustnot bezero. Otherwise, the flexible membrane can inflate or deflatechange the air volume without much variation in pressurTherefore,a sufficient pressure difference must always be matained across the inner flexible chamber. As a result, there iscontinuous air leakage between the two chambers across thintended air leakage paths. The approach to account for thisby estimating its leakage characteristic is discussed below.
Approach and Results
Approach to Experimental Procedure and RegressionAnalysis
In the test setup, the EAL cannot be neutralized during thepressurization because the pressure difference across it mualways present. Airflows extracted from the inner chamber intest setup are then composed of air leakage through both
Table 1. Instruments and Accuracy
Parameters Instrument Accuracy
Pressure Digital pressure meter 61 PaFlow Rate Laminar flow element
with digital pressure meter60.014 L/s
Temperature Thermocouple 60.5°C
JOU
geept.de
s
rest
-
ets
nr
a-.s
s
e
n-
e
e
tested specimen and EAL paths. The EAL rates need to be qtified to obtain the air leakage rates through the specimen.proposed approach is to estimate the EAL characteristics togewith the specimen leakage parameters simultaneously. Themated airflow rates out of the inner chamber can be expressea summation of the predicated specimen leakage and EAL, athe following nonlinear equation:
Q̂t5C•Pin1Ce•Pe
ne (2)
wherePe5Pi2Po5pressure difference across the EAL, and that symbol indicates estimated results. The solution requiressets of unknown flow parameters~C andn, andCe andne!.
Experimental Data and Regression Results
Sixteen depressurization runs were performed to obtain theperimental data listed in Table 2. The inner chamber was depsurized for all the runs and the outer chamber for some ofruns. The pressure differences across the inner membranemaintained at values between 10 to 50 Pa. Several runs wconducted without depressurizing the outer chamber, and theresponding data are shown as the rows with zero values forPo inTable 2.
Data were taken after the chambers were in equilibrium wrespect to pressures, flow rate, and enclosure volumes. Thesurements include airflow rates out of the inner chamber and psures~or, to be more precise, the pressure differentials withspect to the pressure on the indoor side of the specimen! in bothchambers. Pressures were monitored at two elevations, andaverage values were used. Temperatures measured at theslevels did not show any significant deviation.
A least-squares regression analysis was performed on tdata to estimate the coefficients and exponents of the powerrelations for both the specimen and EAL. In the regression ansis, the sum of the squared discrepancies between the meatotal flow rates (Qt) and the estimated values (Q̂t) was calculatedas a function of the four unknown parameters
S~b!5( ~Qt2Q̂t!25( @Qt2~CPi
n1CePene!#2 (3)
Table 2. Experimental Data
No. Pi ~Pa! Po ~Pa! Pe ~Pa! Qt ~L/s!
1 230.8 221.4 9.4 2.9752 10.6 0.0 10.6 0.6423 93.0 76.7 16.3 1.9224 19.9 0.0 19.9 1.0235 207.8 187.2 20.6 3.0126 89.9 68.6 21.3 1.9287 79.8 52.5 27.3 1.9388 30.4 0.0 30.4 1.3879 187.3 156.5 30.8 3.03710 71.0 38.8 32.2 1.95711 60.0 20.7 39.3 1.96512 40.6 0.0 40.6 1.70313 163.2 118.8 44.4 3.06314 50.5 0.0 50.5 1.98815 50.7 0.0 50.7 1.98816 148.5 94.9 53.6 3.075
Note: Negative signs in pressuresPi andPo that indicate depressurizatioare omitted.
RNAL OF ARCHITECTURAL ENGINEERING / SEPTEMBER 2002 / 91
es,hen
ndca
ateine
s-
d i
res-sonime
ibleancansu
es tt atedicte
tnesdur.
iatedowdard728ndn the
cansThe
thatesti-p to
ood
nedtesetertima-
byTheigh
nle-
ernsTheex-ak-t innalare
dsed
and
where b5vector of the four parameters. The estimated valuknown as the ‘‘estimates’’ of the parameters, are obtained wthis S() function is minimized. The result is
Q̂t50.07466•Pi0.659710.04543•Pe
0.7890 (4)
In reporting the air leakage test result, it is common to routhe exponents to one or two decimals. This truncation processreduce accuracy to the leakage characteristics to be estimMore accurate estimation for truncated exponents can be obtathrough another regression analysis of Eq.~2!, with only the flowcoefficientsC and Ce as the unknowns. In this case, the regresion result is
Q̂t50.07902•Pi0.6510.04268•Pe
0.80 (5)
The leakage characteristic for the curtain wall specimen testethe first term on the right side of Eq.~5!, i.e.,
Q̂w50.07902•Pi0.65 (6)
To present the actual effects of the new test method, the regsion result in Eq.~4! without truncations is used for all the following analyses, figures, and tables. Fig. 4 shows the comparibetween the measured and predicted air leakage for the specand EAL paths.
Error Analyses
The central theme of the above data analysis for the flexdouble-chamber method is that the EAL can be consideredaccounted for through an estimation and that this estimationbe obtained through the least-squares regression analysis. Inporting this theme, error analyses are carried out in three stagaddress different aspects of the presented technique. The firspect is errors in total flow rate estimation and errors in estimaparameters. The second aspect is the uncertainty in the predair leakage through the specimen. The final aspect is the apof the new technique in terms of the data processing proceand the effectiveness of the least-squares regression method
Fig. 4. Measured versus estimated air leakage for specimenextraneous air leakage~EAL!
92 / JOURNAL OF ARCHITECTURAL ENGINEERING / SEPTEMBER 2002
nd.d
s
-
sn
d
p-os-
ds
e
Estimation Errors in Parameters, First Aspect
Because of the accuracy of instruments and uncertainty assocwith regression analysis, the estimation results for total airflrates from the inner chamber have certain errors. The standeviation of the errors can be directly calculated to be 0.01L/s from the data in Table 2. The formula for this calculation abasics for other statistical analysis techniques are presented iAppendix.
The accuracy and confidence in the estimated parametersbe obtained by statisticalinference analysis. The possible spreadare indicated by the standard deviations in these estimates.calculation results are shown in Table 3. The values indicatethe spreads are small, between 3 and 6% for the exponentmates; whereas, the flow coefficients have larger spreads, u23% of their estimated values.
The standard deviations alone, however, are not very gindicators because the parametersC, n, Ce , and ne are highlycorrelated. Although each individual parameter is undetermiwithin a relatively large range, the combination of the estimalies within a narrow-band region. The change of one paramleads to changes in the other three parameters during the estion to provide the least errors. This dependency is capturedthe concept of correlation between any two of the parameters.estimated correlation coefficients shown in Table 4 indicate hcorrelation, with values close to unity. Other researchers~Sher-man and Palmiter 1995! have also noticed the high correlatiocoefficients between the flow coefficient and exponent for singchamber tests.
Uncertainty in Predicted Specimen Leakage, SecondAspect
The above inference analysis on the standard deviations concall four parameters of both the tested specimen and EAL.uncertainty results obtained are with respect to the total airtracted from the inner chamber. The error in estimating air leage through the specimen alone, however, is different from thathe total flow rate. Its values should be higher due to additiouncertainty in determining whether the measured airflowsthrough the specimen or EAL.
The error in specimen leakageQ5C•Pn can be calculatedthrough the propagation of errors from errors in the estimateCandn and the correlation between them. The calculation is ba
Table 3. Estimated Standard Deviations in Parameters
Parameters
Estimate
b̂
Standard Deviation
«b̂ «b̂ /b̂3100 ~%!
C 0.07466 0.01008 13.5
n 0.6597 0.0226 3.4
Ce 0.04543 0.01054 23.2ne 0.7890 0.0485 6.1
Table 4. Correlation Coefficients between Parameters
Parameters C n Ce ne
C 1
n 20.999 1
Ce 20.949 0.940 1ne 0.921 20.912 20.996 1
darbe
re-ent
a-
,
ient
thestares-reat thsurtions t
od75%as
ore
agehin
ds
thathine aircan
Pa,
forthisthe
ima-un-od.e oftive
rm-vesdomta byed.onser-ovidere-
ionthe
inononteof
lyAd-d intionsith
on the multivariate error analysis. For the specimen, the standeviation in the estimated air leakage by the double chammethod is expressed as
«Q5F S ]Q
]C«CD 2
1S ]Q
]n«nD 2
12g~C,n!•US ]Q
]C«CD •S ]Q
]n«nD UG1/2
(7)
whereg(C,n)5correlation coefficient betweenC andn ~Clifford1973!. This equation indicated that the standard deviation islated to the correlation between the flow coefficient and exponas represented by the third term on the right side of Eq.~7!, inaddition to their contribution through the ‘‘direct’’ error propagtion as represented by the first two terms.
Because the correlation coefficientsg are close to minus oneas listed in Table 4, this equation can be simplified whenP.2.8 Pa
«Q5U]Q
]CU«C2U]Q
]nU«n5Pn•«C2CPn ln P•«n (8)
The relative standard deviation, also known as the coefficof variance, for the corresponding specimen leakage is
«Q
Q5
«C
C2 ln P•«n5
«C
C2~n ln P!
«n
n(9)
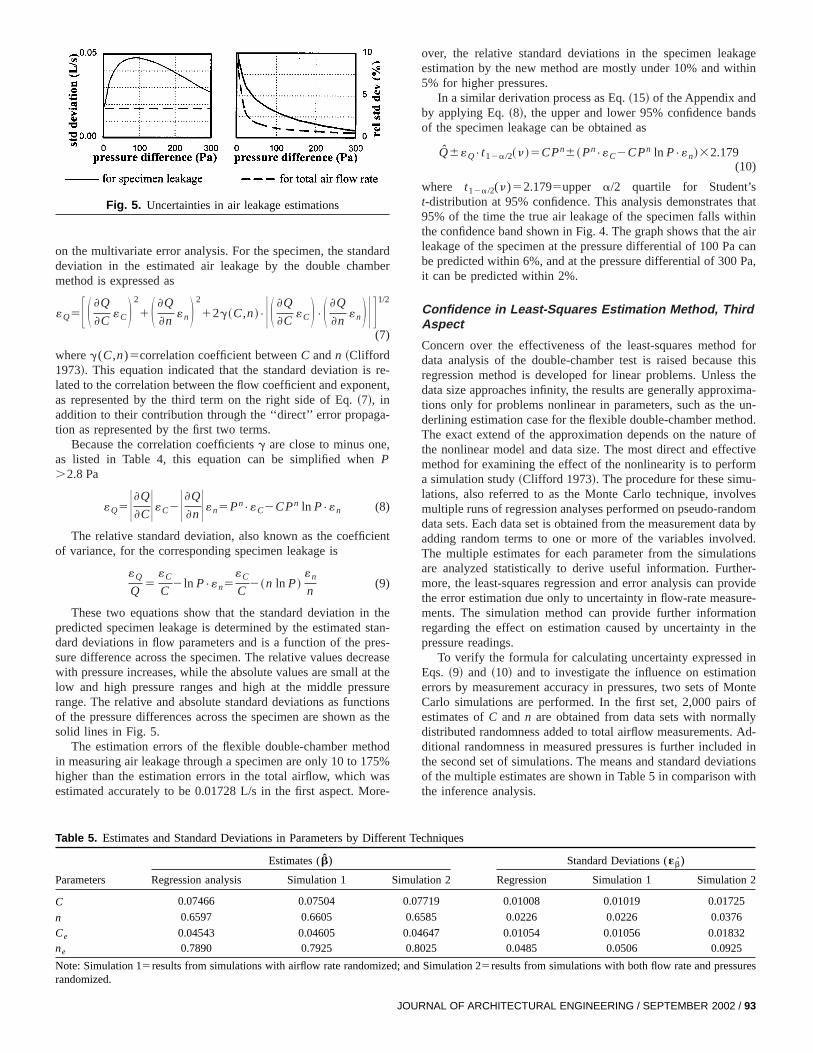
These two equations show that the standard deviation inpredicted specimen leakage is determined by the estimateddard deviations in flow parameters and is a function of the psure difference across the specimen. The relative values decwith pressure increases, while the absolute values are small alow and high pressure ranges and high at the middle presrange. The relative and absolute standard deviations as funcof the pressure differences across the specimen are shown asolid lines in Fig. 5.
The estimation errors of the flexible double-chamber methin measuring air leakage through a specimen are only 10 to 1higher than the estimation errors in the total airflow, which westimated accurately to be 0.01728 L/s in the first aspect. M
Fig. 5. Uncertainties in air leakage estimations
JOU
dr
,
n-
seeeshe
-
over, the relative standard deviations in the specimen leakestimation by the new method are mostly under 10% and wit5% for higher pressures.
In a similar derivation process as Eq.~15! of the Appendix andby applying Eq.~8!, the upper and lower 95% confidence banof the specimen leakage can be obtained as
Q̂6«Q•t12a/2~n!5CPn6~Pn•«C2CPn ln P•«n!32.179
(10)
where t12a/2(n)52.1795upper a/2 quartile for Student’st-distribution at 95% confidence. This analysis demonstrates95% of the time the true air leakage of the specimen falls witthe confidence band shown in Fig. 4. The graph shows that thleakage of the specimen at the pressure differential of 100 Pabe predicted within 6%, and at the pressure differential of 300it can be predicted within 2%.
Confidence in Least-Squares Estimation Method, ThirdAspect
Concern over the effectiveness of the least-squares methoddata analysis of the double-chamber test is raised becauseregression method is developed for linear problems. Unlessdata size approaches infinity, the results are generally approxtions only for problems nonlinear in parameters, such as thederlining estimation case for the flexible double-chamber methThe exact extend of the approximation depends on the naturthe nonlinear model and data size. The most direct and effecmethod for examining the effect of the nonlinearity is to perfoa simulation study~Clifford 1973!. The procedure for these simulations, also referred to as the Monte Carlo technique, involmultiple runs of regression analyses performed on pseudo-randata sets. Each data set is obtained from the measurement daadding random terms to one or more of the variables involvThe multiple estimates for each parameter from the simulatiare analyzed statistically to derive useful information. Furthmore, the least-squares regression and error analysis can prthe error estimation due only to uncertainty in flow-rate measuments. The simulation method can provide further informatregarding the effect on estimation caused by uncertainty inpressure readings.
To verify the formula for calculating uncertainty expressedEqs. ~9! and ~10! and to investigate the influence on estimatierrors by measurement accuracy in pressures, two sets of MCarlo simulations are performed. In the first set, 2,000 pairsestimates ofC and n are obtained from data sets with normaldistributed randomness added to total airflow measurements.ditional randomness in measured pressures is further includethe second set of simulations. The means and standard deviaof the multiple estimates are shown in Table 5 in comparison wthe inference analysis.
ion 2
res
Table 5. Estimates and Standard Deviations in Parameters by Different Techniques
Parameters
Estimates (b̂) Standard Deviations («b̂)
Regression analysis Simulation 1 Simulation 2 Regression Simulation 1 Simulat
C 0.07466 0.07504 0.07719 0.01008 0.01019 0.01725
n 0.6597 0.6605 0.6585 0.0226 0.0226 0.0376
Ce 0.04543 0.04605 0.04647 0.01054 0.01056 0.01832ne 0.7890 0.7925 0.8025 0.0485 0.0506 0.0925
Note: Simulation 15results from simulations with airflow rate randomized; and Simulation 25results from simulations with both flow rate and pressurandomized.
RNAL OF ARCHITECTURAL ENGINEERING / SEPTEMBER 2002 / 93
theonm., thst
n inithrouionscen bnb
leasstath
darrity.
inbe
odertaiTheentaintan
blerroate
men
ted
o thrlates b
-p-
othle-
heva
-t
ical
ured
flow
n
eenthe
er,
Three observations can be obtained from Table 5. First,estimates for flow parameters have almost no difference amdifferent methods, with a maximum 3.4% disparity among theSecond, for standard deviations in the estimated parameterssimulations with only airflow rate randomized provide almoequal results to the analytical inference analysis, as showcolumns 6 and 5 of Table 5. Third, the simulation runs, wfurther randomness in the pressure measurements, induce a70% higher estimated deviations, because of inherent limitatof the least-squares regression method in not considering untainties in the pressure measurements. Two conclusions cadrawn. First, the least-squares regression method provides uased estimates for the flow parameters. This means that thesquares regression analysis can be used with confidence to elish the air leakage characteristic through the specimen usingflexible double-chamber method. Second, the estimated standeviations in estimates are not affected by the nonlineaHence, Eqs.~9!–~11! can be used to evaluate the uncertaintiesthe air leakage through the specimen by the double-chammethod.
Conclusions
The flexible double-chamber method in a depressurization mwas used successfully to determine the air leakage of a cuwall section having considerable extraneous air leakage.method was applied in a laboratory setting during a comprehsive test program to evaluate the overall performance of curwalls of various designs. The setting prevented the use of sdard air leakage test methods. The reliability of the flexidouble-chamber method was confirmed through extensive eanalyses, and the air leakage rate of the specimen was estimwithin 2% at 300 Pa pressure. The air leakage of this speciestablished through this method is 3.2 L/s, i.e., 0.25 L/s•m2, at apressure differential of 300 Pa. Further validation is suggesbefore implementing this method commercially.
Appendix: Statistical Regression and InferenceAnalysis
The methods and calculations used in this paper are related tordinary least-squares~OLS! regression analysis for nonlineamodels and associated statistical inference analysis. These retopics have been extensively covered in many books such aBates and Watts~1988!, Beck and Arnold~1977!, and Ratkowsky~1983!. This Appendix will briefly present the information involved without being concerned with the fundamental assumtion, derivation and applicability.
The problem of estimating air leakage characteristics for bthe specimen and EAL from data obtained in flexible doubchamber tests is to obtainp54 parameters,b5@C n Ce ne#
T, inEq. ~2! from N sets of experimental data$Qt ,Pi ,Pe%. By theprinciple of OLS, the estimation is obtained by minimizing tsum of squared deviations between measured and predictedues
S~b!5( @Q2~CPin1CePe
n2!#2 (11)
The subscriptt in the total air flow rates is omitted in the Appendix for simplicity. S() is a nonlinear function of two independenvariables with four unknown parameters. The solution,b̂, can beobtained by using minimization routines in various mathematsoftware packages.
94 / JOURNAL OF ARCHITECTURAL ENGINEERING / SEPTEMBER 2002
g
e
nd
r-ei-t-b-ed
r
n
-
-
rd
e
dy
l-
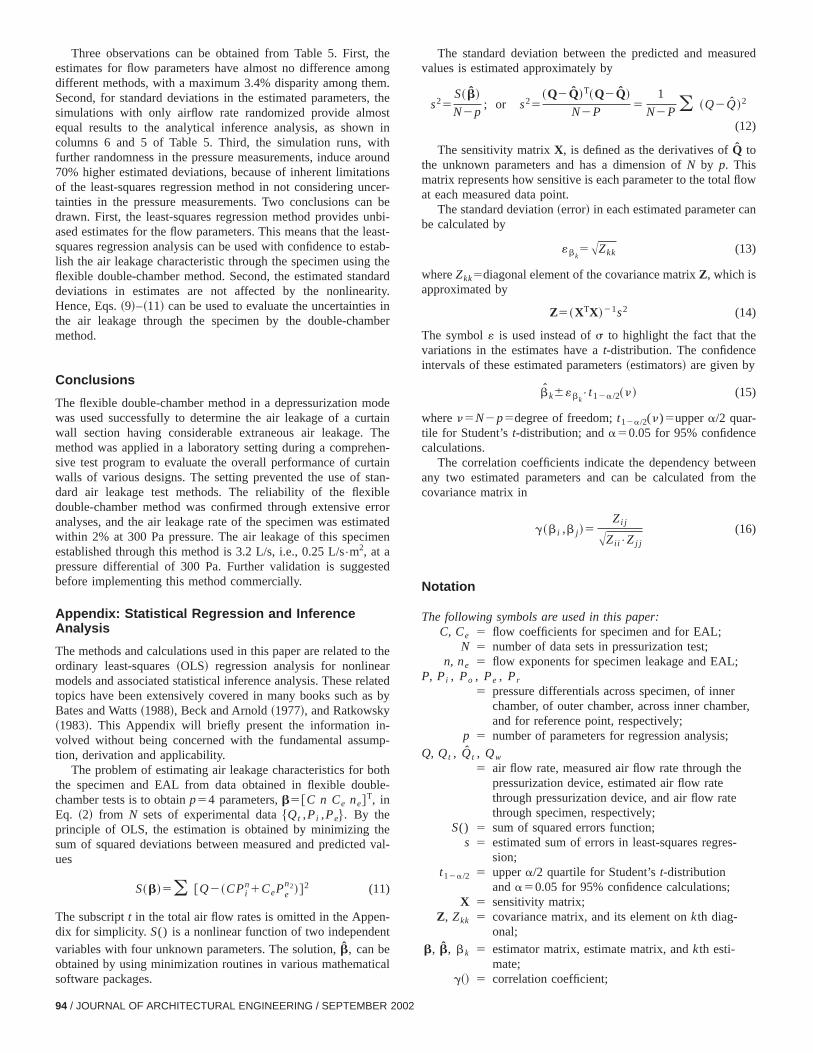
The standard deviation between the predicted and measvalues is estimated approximately by
s25S~b̂!
N2p; or s25
~Q2Q̂!T~Q2Q̂!
N2P5
1
N2P ( ~Q2Q̂!2
(12)
The sensitivity matrixX, is defined as the derivatives ofQ̂ tothe unknown parameters and has a dimension ofN by p. Thismatrix represents how sensitive is each parameter to the totalat each measured data point.
The standard deviation~error! in each estimated parameter cabe calculated by
«bk5AZkk (13)
whereZkk5diagonal element of the covariance matrixZ, which isapproximated by
Z5~XTX!21s2 (14)
The symbol« is used instead ofs to highlight the fact that thevariations in the estimates have at-distribution. The confidenceintervals of these estimated parameters~estimators! are given by
b̂k6«bk•t12a/2~n! (15)
wheren5N2p5degree of freedom;t12a/2(n)5uppera/2 quar-tile for Student’st-distribution; anda50.05 for 95% confidencecalculations.
The correlation coefficients indicate the dependency betwany two estimated parameters and can be calculated fromcovariance matrix in
g~b i ,b j !5Zi j
AZii •Zj j
(16)
Notation
The following symbols are used in this paper:C, Ce 5 flow coefficients for specimen and for EAL;
N 5 number of data sets in pressurization test;n, ne 5 flow exponents for specimen leakage and EAL;
P, Pi , Po , Pe , Pr
5 pressure differentials across specimen, of innerchamber, of outer chamber, across inner chamband for reference point, respectively;
p 5 number of parameters for regression analysis;Q, Qt , Q̂t , Qw
5 air flow rate, measured air flow rate through thepressurization device, estimated air flow ratethrough pressurization device, and air flow ratethrough specimen, respectively;
S() 5 sum of squared errors function;s 5 estimated sum of errors in least-squares regres-
sion;t12a/2 5 uppera/2 quartile for Student’st-distribution
anda50.05 for 95% confidence calculations;X 5 sensitivity matrix;
Z, Zkk 5 covariance matrix, and its element onkth diag-onal;
b, b̂, bk 5 estimator matrix, estimate matrix, andkth esti-mate;
g~! 5 correlation coefficient;
gi-
airder
d
g
-
-
«, «C , «n , «Q
5 standard deviation~error!, standard deviations forflow efficient, for flow exponent, and for flowrate, respectively; and
n 5 degree of freedom.
References
American Society of Heating, Refrigerating and Air-Conditioning Enneers~ASHRAE!. ~1997!. ‘‘Ventilation and infiltration Chapter 25.’’ASHRAE Fundamentals Handbook (SI Ed.), ASHRAE, Atlanta.
ASTM. ~1999!. ‘‘Standard test method for determining the rate ofleakage through exterior windows, curtain walls, and doors unspecified pressure differences across the specimen.’’E283-91, WestConshohocken, Pa.
Bates, D. M., and Watts, D. G.~1988!. Nonlinear regression analysis anits applications, Wiley, New York.
JOU
Beck, J. V. and Arnold, K. J.~1977!. Parameter estimation in engineerinand science, Wiley, New York.
Clifford, A. A. ~1973!. Multivariate error analysis: A handbook of errorpropagation and calculation in many-parameter systems, Wiley, NewYork.
Fazio, P., Athienitis, A., Marsh, C., and Rao, J.~1997!. ‘‘Environmentalchamber for investigation of building envelope performance,’’J. Ar-chit. Eng.,3~2!, 97–102.
Fazio, P., Ge, H., and Rao, J.~2001!. ‘‘Measuring air leakage of full-scalecurtain wall sections using a non-rigid air-chamber method,’’Int.Conf. on Building Envelope Systems and Technologies (ICBEST), Ot-tawa, 269–273.
Ratkowsky, D. A.~1983!. Nonlinear regression modeling: A unified practical approach, Marcel Dekker, New York.
Shaw, C. Y., Magee, R. J., and Poirier, G. F.~2000!. ‘‘Measured airtight-ness of an installed skylight.’’ASHRAE Trans.,106~1!, 713–718.
Sherman, M., and Palmiter, L.~1995!. ‘‘Uncertainties in fan pressuriza-tion measurements.’’Airflow performance of building envelopes, components, and systems, ASTM STP 1255, M. P. Modera and A. K.Persily, eds., 266–283.
RNAL OF ARCHITECTURAL ENGINEERING / SEPTEMBER 2002 / 95