Measurement of $\nu_\mu$-induced charged-current neutral pion production cross sections on mineral...
21
arXiv:1010.3264v4 [hep-ex] 10 Feb 2011 Measurement of ν μ -induced charged-current neutral pion production cross sections on mineral oil at E ν ∈ 0.5 − 2.0 GeV A. A. Aguilar-Arevalo, 14 C. E. Anderson, 19 A. O. Bazarko, 16 S. J. Brice, 8 B. C. Brown, 8 L. Bugel, 13 J. Cao, 15 L. Coney, 6 J. M. Conrad, 13 D. C. Cox, 10 A. Curioni, 19 R. Dharmapalan, 1 Z. Djurcic, 2 D. A. Finley, 8 B. T. Fleming, 19 R. Ford, 8 F. G. Garcia, 8 G. T. Garvey, 11 J. Grange, 9 C. Green, 8, 11 J. A. Green, 10, 11 T. L. Hart, 5 E. Hawker, 4, 11 R. Imlay, 12 R. A. Johnson, 4 G. Karagiorgi, 13 P. Kasper, 8 T. Katori, 10, 13 T. Kobilarcik, 8 I. Kourbanis, 8 S. Koutsoliotas, 3 E. M. Laird, 16 S. K. Linden, 19 J. M. Link, 18 Y. Liu, 15 Y. Liu, 1 W. C. Louis, 11 K. B. M. Mahn, 6 W. Marsh, 8 C. Mauger, 11 V. T. McGary, 13 G. McGregor, 11 W. Metcalf, 12 P. D. Meyers, 16 F. Mills, 8 G. B. Mills, 11 J. Monroe, 6 C. D. Moore, 8 J. Mousseau, 9 R. H. Nelson, 5, ∗ P. Nienaber, 17 J. A. Nowak, 12 B. Osmanov, 9 S. Ouedraogo, 12 R. B. Patterson, 16 Z. Pavlovic, 11 D. Perevalov, 1, 8 C. C. Polly, 8 E. Prebys, 8 J. L. Raaf, 4 H. Ray, 9 B. P. Roe, 15 A. D. Russell, 8 V. Sandberg, 11 R. Schirato, 11 D. Schmitz, 8 M. H. Shaevitz, 6 F. C. Shoemaker, 16, † D. Smith, 7 M. Soderberg, 19 M. Sorel, 6, ‡ P. Spentzouris, 8 J. Spitz, 19 I. Stancu, 1 R. J. Stefanski, 8 M. Sung, 12 H. A. Tanaka, 16 R. Tayloe, 10 M. Tzanov, 5 R. G. Van de Water, 11 M. O. Wascko, 12, § D. H. White, 11 M. J. Wilking, 5 H. J. Yang, 15 G. P. Zeller, 8 and E. D. Zimmerman 5 (MiniBooNE Collaboration) 1 University of Alabama; Tuscaloosa, AL 35487 2 Argonne National Laboratory; Argonne, IL 60439 3 Bucknell University; Lewisburg, PA 17837 4 University of Cincinnati; Cincinnati, OH 45221 5 University of Colorado; Boulder, CO 80309 6 Columbia University; New York, NY 10027 7 Embry-Riddle Aeronautical University; Prescott, AZ 86301 8 Fermi National Accelerator Laboratory; Batavia, IL 60510 9 University of Florida; Gainesville, FL 32611 10 Indiana University; Bloomington, IN 47405 11 Los Alamos National Laboratory; Los Alamos, NM 87545 12 Louisiana State University; Baton Rouge, LA 70803 13 Massachusetts Institute of Technology; Cambridge, MA 02139 14 Instituto de Ciencias Nucleares, Universidad Nacional Aut´ onoma de M´ exico, D.F. 04510, M´ exico 15 University of Michigan; Ann Arbor, MI 48109 16 Princeton University; Princeton, NJ 08544 17 Saint Mary’s University of Minnesota; Winona, MN 55987 18 Virginia Polytechnic Institute & State University; Blacksburg, VA 24061 19 Yale University; New Haven, CT 06520 (Dated: February 11, 2011) Using a custom 3 ˇ Cerenkov-ring fitter, we report cross sections for νμ-induced charged-current single π 0 production on mineral oil (CH2) from a sample of 5810 candidate events with 57% signal purity over an energy range of 0.5 − 2.0 GeV. This includes measurements of the absolute total cross section as a function of neutrino energy, and flux-averaged differential cross sections measured in terms of Q 2 , μ - kinematics, and π 0 kinematics. The sample yields a flux-averaged total cross section of (9.2 ± 0.3stat. ± 1.5syst. ) × 10 -39 cm 2 /CH2 at mean neutrino energy of 0.965 GeV. PACS numbers: 13.15.+g, 25.30.Pt I. INTRODUCTION The charged-current interaction of a muon neutrino producing a single neutral pion (CCπ 0 ) most commonly * Present address: California Institute of Technology; Pasadena, CA 91125 † deceased ‡ Present address: IFIC, Universidad de Valencia and CSIC; 46071 Valencia, Spain § Present address: Imperial College; London SW7 2AZ, United Kingdom occurs through the Δ(1232) resonance for neutrino ener- gies below 2 GeV. As there is no coherent contribution to CCπ 0 production, this process is an ideal probe of purely incoherent pion-production processes and thus offers ad- ditional kinematic information on π 0 production beyond what is measured in the neutral-current channel [1, 2]. Previous measurements of CCπ 0 production at these en- ergies were made on deuterium at the ANL 12 ft bubble chamber [3, 4] and the BNL 7 ft bubble chamber [5]. To- tal cross-section measurements were reported on samples of 202.2 [4] and 853.5 [5] events for the ANL and BNL experiments respectively. Previous measurements [6, 7] were also performed at higher neutrino energy on a vari-
-
Upload
independent -
Category
Documents
-
view
4 -
download
0
Transcript of Measurement of $\nu_\mu$-induced charged-current neutral pion production cross sections on mineral...

arX
iv:1
010.
3264
v4 [
hep-
ex]
10
Feb
2011
Measurement of νµ-induced charged-current neutral pion production cross sections on
mineral oil at Eν ∈ 0.5− 2.0 GeV
A. A. Aguilar-Arevalo,14 C. E. Anderson,19 A. O. Bazarko,16 S. J. Brice,8 B. C. Brown,8 L. Bugel,13 J. Cao,15
L. Coney,6 J. M. Conrad,13 D. C. Cox,10 A. Curioni,19 R. Dharmapalan,1 Z. Djurcic,2 D. A. Finley,8
B. T. Fleming,19 R. Ford,8 F. G. Garcia,8 G. T. Garvey,11 J. Grange,9 C. Green,8, 11 J. A. Green,10, 11 T. L. Hart,5
E. Hawker,4, 11 R. Imlay,12 R. A. Johnson,4 G. Karagiorgi,13 P. Kasper,8 T. Katori,10, 13 T. Kobilarcik,8
I. Kourbanis,8 S. Koutsoliotas,3 E. M. Laird,16 S. K. Linden,19 J. M. Link,18 Y. Liu,15 Y. Liu,1 W. C. Louis,11
K. B. M. Mahn,6 W. Marsh,8 C. Mauger,11 V. T. McGary,13 G. McGregor,11 W. Metcalf,12 P. D. Meyers,16
F. Mills,8 G. B. Mills,11 J. Monroe,6 C. D. Moore,8 J. Mousseau,9 R. H. Nelson,5, ∗ P. Nienaber,17
J. A. Nowak,12 B. Osmanov,9 S. Ouedraogo,12 R. B. Patterson,16 Z. Pavlovic,11 D. Perevalov,1, 8 C. C. Polly,8
E. Prebys,8 J. L. Raaf,4 H. Ray,9 B. P. Roe,15 A. D. Russell,8 V. Sandberg,11 R. Schirato,11 D. Schmitz,8
M. H. Shaevitz,6 F. C. Shoemaker,16, † D. Smith,7 M. Soderberg,19 M. Sorel,6, ‡ P. Spentzouris,8 J. Spitz,19
I. Stancu,1 R. J. Stefanski,8 M. Sung,12 H. A. Tanaka,16 R. Tayloe,10 M. Tzanov,5 R. G. Van de Water,11
M. O. Wascko,12, § D. H. White,11 M. J. Wilking,5 H. J. Yang,15 G. P. Zeller,8 and E. D. Zimmerman5
(MiniBooNE Collaboration)1University of Alabama; Tuscaloosa, AL 35487
2Argonne National Laboratory; Argonne, IL 604393Bucknell University; Lewisburg, PA 17837
4University of Cincinnati; Cincinnati, OH 452215University of Colorado; Boulder, CO 803096Columbia University; New York, NY 10027
7Embry-Riddle Aeronautical University; Prescott, AZ 863018Fermi National Accelerator Laboratory; Batavia, IL 60510
9University of Florida; Gainesville, FL 3261110Indiana University; Bloomington, IN 47405
11Los Alamos National Laboratory; Los Alamos, NM 8754512Louisiana State University; Baton Rouge, LA 70803
13Massachusetts Institute of Technology; Cambridge, MA 0213914Instituto de Ciencias Nucleares, Universidad Nacional Autonoma de Mexico, D.F. 04510, Mexico
15University of Michigan; Ann Arbor, MI 4810916Princeton University; Princeton, NJ 08544
17Saint Mary’s University of Minnesota; Winona, MN 5598718Virginia Polytechnic Institute & State University; Blacksburg, VA 24061
19Yale University; New Haven, CT 06520
(Dated: February 11, 2011)
Using a custom 3 Cerenkov-ring fitter, we report cross sections for νµ-induced charged-currentsingle π0 production on mineral oil (CH2) from a sample of 5810 candidate events with 57% signalpurity over an energy range of 0.5 − 2.0 GeV. This includes measurements of the absolute totalcross section as a function of neutrino energy, and flux-averaged differential cross sections measuredin terms of Q2, µ− kinematics, and π0 kinematics. The sample yields a flux-averaged total crosssection of (9.2± 0.3stat. ± 1.5syst.)× 10−39 cm2/CH2 at mean neutrino energy of 0.965 GeV.
PACS numbers: 13.15.+g, 25.30.Pt
I. INTRODUCTION
The charged-current interaction of a muon neutrinoproducing a single neutral pion (CCπ0) most commonly
∗ Present address: California Institute of Technology; Pasadena,
CA 91125† deceased‡ Present address: IFIC, Universidad de Valencia and CSIC; 46071
Valencia, Spain§ Present address: Imperial College; London SW7 2AZ, United
Kingdom
occurs through the ∆(1232) resonance for neutrino ener-gies below 2 GeV. As there is no coherent contribution toCCπ0 production, this process is an ideal probe of purelyincoherent pion-production processes and thus offers ad-ditional kinematic information on π0 production beyondwhat is measured in the neutral-current channel [1, 2].Previous measurements of CCπ0 production at these en-ergies were made on deuterium at the ANL 12 ft bubblechamber [3, 4] and the BNL 7 ft bubble chamber [5]. To-tal cross-section measurements were reported on samplesof 202.2 [4] and 853.5 [5] events for the ANL and BNLexperiments respectively. Previous measurements [6, 7]were also performed at higher neutrino energy on a vari-
2
ety of targets.
Using Cerenkov light detection techniques, this pa-per revisits this topic and measures CCπ0 production oncarbon. In order to extract such interactions from themore dominant charged-current quasi-elastic (CCQE)and charged-current single π+ (CCπ+) production pro-cesses, a custom fitter has been developed to isolate andfit both the µ− and the π0 in a CCπ0 event. This fitteralso accurately reconstructs the kinematics of these in-teractions providing a means with which to extract bothtotal and single-differential cross sections. Additionallyreported is a measurement of the flux-averaged total crosssection. This work presents the most comprehensive mea-surements of CCπ0 interactions to date, at energies be-low 2 GeV, on a sample of events 3.5 times that of thecombined previous measurements. Results include thetotal cross section, the single-differential cross section inQ2, and the first measurements of single-differential crosssections in terms of final-state particle kinematics. Thereported cross sections provide a combined measure ofthe primary interaction cross section, nuclear effects incarbon, and pion re-interactions in the target nucleus.
II. FINAL STATE INTERACTIONS &
OBSERVABLE CCπ0
Because this measurement is being performed on a nu-clear target, particular attention must be paid to howthe sample is being defined, especially given how nuclearand final-state effects can influence the observables. Thedominant effect is final state interactions (FSI) which arethe re-interactions of particles created from the neutrino-nucleon interaction with the nuclear medium of the tar-get nucleus. FSI change the experimental signature of aneutrino-nucleon interaction. For example, if a π+ froma CCπ+ interaction is absorbed within the target nucleusand none of the outgoing nucleons are detected, then theevent is indistinguishable from a CCQE interaction. Ad-ditionally, if the π+ charge exchanges then the interactionis indistinguishable from a CCπ0 interaction. This is dueto the fact that the nuclear debris is typically unobserv-able in a Cerenkov-style detector. The understanding ofFSI effects is model-dependent, with large uncertaintieson the FSI cross sections. An “observable” interaction istherefore defined by the leptons and mesons that remainafter FSI effects. Observable interactions are also inclu-sive of all nucleon final states. To reduce the FSI-modeldependence of the measurements reported here, the sig-nal is defined as a µ− and a single π0 that exits the targetnucleus, with any number of nucleons, and with no ad-ditional mesons or leptons surviving the nucleus. Thisis referred to as an observable CCπ0 event. The resultspresented here are not corrected for nuclear effects andintra-nuclear interactions.
III. THE MINIBOONE EXPERIMENT
The Mini Booster Neutrino Experiment (Mini-BooNE) [8] is a high-statistics low-energy neutrino exper-iment located at Fermilab. A beam of 8 GeV kinetic en-ergy protons is taken from the Booster [9] and impingedupon a 71 cm long beryllium target. The data set pre-sented in this paper corresponds to 6.27×10²⁰ p.o.t. (pro-tons on target) with an uncertainty of 2%. The result-ing pions and kaons are (de)focused according to theircharge by a toroidal magnetic field created by an alu-minum magnetic focusing horn; positive charge selectionis used for this data. These mesons then decay in a 50 mlong air-filled pipe before the remnant beam impacts asteel beam dump. The predominantly νµ-neutrino beampasses through 500 m of dirt before interacting in a spher-ical 800 ton, 12 m diameter, mineral oil (CH2), Cerenkovdetector. The center of the detector is positioned 541 mfrom the beryllium target. The inner surface of the detec-tor is painted black and instrumented with 1280 inward-facing 8 inch photomultiplier-tubes (PMTs) providing11.3% photocathode coverage. A thin, optically-isolatedshell surrounds the main tank region and acts to veto en-tering and exiting charged particles from the main tank.The veto region is painted white and instrumented with240 tangentially-facing 8 inch PMTs. A full descriptionof the MiniBooNE detector can be found in Ref. [10].
The neutrino beam is simulated within a Geant4 [11]Monte Carlo (MC) framework. All relevant componentsof the primary proton beam line, beryllium target, alu-minum focusing horn, collimator, meson decay volume,beam dump, and surrounding earth are modeled [12].The total p-Be and p-Al cross sections are set by theGlauber model [13]. Wherever possible, inelastic pro-duction cross sections are fit to external data. The neu-trino beam is dominated by νµ produced by π+ decayin flight. The π+ production cross sections are set bya Sanford-Wang [14] fit to π+ production data providedby the HARP [15] and E910 [16] experiments. The high-energy (Eν > 2.4 GeV) neutrino flux is dominated byνµ from K+ decays. The K+ production cross sectionsare set by fitting data from Refs. [17–24] to a Feynmanscaling parametrization. The production of protons andneutrons on the target are set using the MARS [25] sim-ulation. The νe, νµ, and νe contributions to the flux areunimportant for this measurement. Ref. [12] describesthe full details of the neutrino-flux prediction and esti-mation of its systematic uncertainty. It should be notedthat the MiniBooNE neutrino data has not been used totune the flux prediction.
Interactions of neutrinos with the detector materialsare simulated using the v3 Nuance event generator [26].The Nuance event generator is a comprehensive simu-lation of 99 neutrino and anti-neutrino interactions onnuclear targets over an energy range from 100 MeVto 1 TeV. The dominant interaction in MiniBooNE,CCQE, is modeled according to Smith-Moniz [27]; how-ever, the axial mass, MA, has been adjusted for better

3
agreement with the MiniBooNE data to M effA = 1.23 ±
0.20 GeV/c2 [28]. The target nucleus is simulated withnucleons bound in a relativistic Fermi gas (RFG) [27]with binding energy EB = 34 ± 9 MeV and Fermi mo-mentum pF = 220 ± 30 MeV/c [29] (on carbon). TheRFG model is further modified by shape fits to Q2, forbetter agreement of the CCQE interaction to MiniBooNEdata [28]. The Rein-Sehgal model [30] is used to predictthe production of single-pion final states for both CC andNC modes. This model includes 18 non-strange baryonresonances below 2 GeV in mass and their interferenceterms. The model [30] predicts the ∆(1232) resonanceto account for 71% of CCπ0 production (84% of resonantproduction); a 14% contribution from higher mass reso-nances; a 15% contribution from non-resonant processes.The non-resonant processes are added ad hoc to improveagreement to past data [30]. They and are not indica-tive of actual non-resonant contributions but allow foradditional inelastic contributions. The quarks are mod-eled as relativistic harmonic oscillators a la the Feynman-Kislinger-Ravndal model [31]. The axial mass for single-pion production is M1π
A = 1.10 ± 0.27 GeV/c2, and formulti-pion production it is MNπ
A = 1.30 ± 0.52 GeV/c2.The model includes the re-interactions of both baryonresonances, pions, and nucleons with the spectator nu-cleons leading to the production of additional pions, pioncharge-exchange, and pion absorption. For observableCCπ+ interactions, the model is reweighted to match theMiniBooNE data by a technique described in §VIA.The MiniBooNE detector is simulated within a
Geant3 [32] MC. This MC handles the propagation ofparticles after they exit the neutrino-target nucleus, sub-sequent interactions with the mineral oil [33], and mostimportantly, the propagation and interactions of opticalphotons. Photons with wavelengths between 250-650 nmare considered. The production, scattering, fluorescence,absorption, and reflections of these photons are mod-eled in a 35 parameter custom optical model [10, 34, 35].The detector MC also simulates photon detection by thePMTs and the effects of detector electronics. The ab-sorption (π+ → \π) and charge-exchange (π+ → π0) ofπ+ particles on carbon are fixed to external data [36–38]with uncertainties of 35% and 50% respectively.
IV. EVENT RECONSTRUCTION
Particles traversing the mineral oil are detected by theCerenkov and scintillation light they produce. The rela-tive abundances of these emissions, along with the shapeof the total Cerenkov angular distribution, are used toclassify the type of particle in the detector. For a singleparticle, an “extended track” is fit using a maximum-likelihood method for several possible particle hypothe-ses. For each considered particle type, the likelihood isa function of the initial vertex, kinetic energy, and direc-tion. For a given set of track parameters, the likelihoodfunction calculates probability density functions (PDFs)
for each of the 1280 PMTs in the main portion of the de-tector [34, 39]. Separate PDFs for the initial hit time andtotal integrated charge are produced. As the data acqui-sition records only the initial hit time and total chargefor each PMT, the Cerenkov and scintillation contribu-tions are indistinguishable for a given hit; however, theyare distinguishable statistically. The likelihood is formedas the product of the probabilities, calculated from thePDFs. The initial track parameters are varied using Mi-
nuit [40] and the results of the best fit likelihood de-termines the parameters for both the particle type andkinematics.
The extended-track reconstruction is scalable to anynumber of tracks. The charge PDFs are constructed byadding the predicted charges from each track together todetermine the overall predicted charge. The time PDFsare calculated separately for each track, and separatelyfor the Cerenkov and scintillation portions, then timesorted and weighted by the probability that a particu-lar PDF caused the initial hit [10, 34]. The reconstruc-tion needed for an observable CCπ0 event requires threetracks: a µ− track and two photon tracks from a commonvertex [41, 42]. The final state is defined by a µ−, a π0,and nuclear debris. The µ− is directly fit by the recon-struction, along with its decay electron. The π0 decaysinto two photons with a branching fraction of 98.8% [43]at the neutrino interaction vertex (cτ = 25.1 nm). Thetwo photons are fit by the reconstruction. Photons pro-duce Cerenkov rings both by converting (λ = 67 cm) intoe+e− pairs through interactions with the mineral oil andby Compton scattering. The nuclear debris is ignored inthe reconstruction as it is rarely above Cerenkov thresh-old and therefore only contributes to scintillation light.As the calculation of the kinetic energy of a track is dom-inated by the Cerenkov ring, the added scintillation lightis effectively split uniformly among the three tracks andjustifiably ignored.
The novelty of the CCπ0 event reconstruction is theability to find and reconstruct three Cerenkov rings. TheCCπ0 likelihood function is parametrized by the eventvertex (x, y, z), the event start time (t), the µ− directionand kinetic energy (θµ, φµ, Eµ), the first γ direction andenergy (θ1, φ1, E1), the first γ conversion length (s1), thesecond γ direction and energy (θ2, φ2, E2), and conver-sion length (s2). Ring, or track finding is performed ina stepwise fashion. The first track is seeded in the likeli-hood function and fixed by the µ one-track fit describedin Ref. [39]. The second track is scanned through 400evenly-spaced points in solid angle assuming 200 MeVkinetic energy and no γ conversion length. The best scanpoint is then allowed to float for both tracks simultane-ously. The third track is found by fixing the two tracksand scanning again in solid angle for the third track.Once the third track is found, the best-scan point, alongwith the two fixed tracks, are allowed to float. This stageof the fit, referred to as the “generic” three-track fit, de-termines a seed for the event vertex, track directions,and track energies. A series of three parallel fits are then

4
performed to determine track particle types and the fi-nal fit kinematics. Each of these fits is seeded with thegeneric three-track fit. The fits assign a µ− hypothesisto one of the tracks and a γ hypothesis to the other two,allowing for the possibility that the µ− was not foundby the original µ one-track fit and was found during thefirst or second scan. The conversion lengths are seeded at50 cm and fit along with the kinetic energies while keep-ing all the other parameters fixed, thereby determiningtheir seeds for the final portion of the fit. The final stageof each fit allows all parameters to float, taking advantageof Minuit’s Improve function [40]. A term is added tothe fit negative-log-likelihoods comparing the directionfrom the fit event vertex to the fit µ− decay vertex ver-sus the fit µ− direction weighting by the separation of thevertices. This term improves the identification of the par-ticle types. The likelihoods are then compared to choosethe best fit. For further details see Ref. [41].
[GeV]0 0.2 0.4 0.6 0.8 1 1.2
frac
tiona
l res
olut
ion
0
0.05
0.1
0.15
0.2
0.25
-µ T
c0π
p
θcos -1 0 1
]°an
gula
r re
solu
tion
[
0
2
4
6
8
10
12-µ
0π
FIG. 1. Top: Fractional Gaussian resolutions as functionsof Tµ (solid) and |pπ0 |c (dashed). Bottom: Angular resolu-tions as functions of cos θµ (solid) and cos θπ0 (dashed). Theresolutions between each particle type are also correlated.
The quality of the reconstruction is assessed by evalu-ating the residual resolutions of the signal using the MC.Fig. 1 shows the residual resolutions for both the µ− andthe π0. The overall µ− kinetic-energy fractional resolu-tion is 7.4%, and the angular resolution is 2◦. The π0,being a combination of the two fit photons, has an overallmomentum resolution of 12.5% and angular resolution of7.8◦. The energy and momentum resolutions are worseat lower energies and momenta and flatten out towardlarger values. The µ− angular resolution is mostly flatand is only slightly better in the forward direction. Theπ0 angular resolution gets much better in the forwarddirection as forward going π0 tend to have larger mo-
mentum. The resolutions between each particle type arealso somewhat correlated. Additionally, the interaction-vertex resolution is 16 cm.The initial neutrino energy is calculated, assuming that
the signal events are from the reaction νµn → µ−π0p,from the measured µ− and π0 kinematics under three as-sumptions: the interaction target is a stationary neutron,the hadronic recoil is a proton, and the neutrino is travel-ing in the beam direction. Under these assumptions, Eν
is constrained even if the proton is unmeasured [42]. Theassumption of a stationary neutron contributes to smear-ing of the reconstructed neutrino energy because of theneutron’s momentum distribution. The neutrino-energyresolution is 11%. Ideally one would measure the pro-ton, and additional hadronic debris; however, as theseparticles are rarely above Cerenkov threshold, it is im-practical to do so in MiniBooNE. Also, as only 70% ofthe observable CCπ0 interactions are nucleon-level CCπ0
on neutrons, additional smearing is due to CCπ+ charge-exchanges on protons or other inelastic processes produc-ing a π0 in the final state. These smearings are not ex-pected to be large. The 4-momentum transfer, Q2, to thehadronic system can be calculated from the reconstructedmuon and neutrino momentum [42]. The calculation ofthe nucleon resonance mass is performed from the neu-trino and muon momentum also assuming a stationaryneutron (see appendix).
V. EVENT SELECTION
Isolating observable CCπ0 interactions is challengingas such events are expected to comprise only 4% of thedata set [26]. The sample is dominated by observable νµ-CCQE (44%), with contributions from observable CCπ+
(19%), and other CC and NC modes. Basic sorting is firstperformed to separate different classes of events based ontheir PMT hit distributions. Then the sample is furtherrefined by cutting on reconstructed quantities to yield anobservable CCπ0 dominated sample. Each cut is appliedand optimized in succession and will be discuss over theremainder of this section.The detector is triggered by a signal from the Booster
accelerator indicating a proton-beam pulse in the Boosterneutrino beam line. All activity in the detector isrecorded for 19.2 µs starting 4.6 µs before the 1.6 µsneutrino-beam time window. The detector activity isgrouped into “subevents:” clusters in time of PMT hits.Groups of 10 or more PMT hits, within a 200 ns win-dow, with time spacings between the hits of no morethan 10 ns with at most two spacings less than 20 ns,define a subevent [10]. In an ideal neutrino event, thefirst subevent is always caused by the prompt neutrinointeraction; subsequent subevents are due to electronsfrom stopped-muon decays. Neutrino events with onesubevent are primarily due to neutral-current interac-tions and νe-CCQE. Two-subevent events are from νµ-CCQE, CCπ0, and NCπ+. Three-subevent events are al-

5
most completely CCπ+, with some multi-π production.Stopped muon decays produce electrons with a maximumenergy of 53 MeV which never cause more than 200 PMThits in the central detector.To select a sample of contained events, a requirement
is made to reject events that penetrate the veto. Theseevents typically cause more than 6 veto PMT hits. There-fore, a two-subevent sample is defined by requiring morethan 200 tank PMT hits in the first subevent, fewer than200 tank PMT hits in the second, and fewer than 6 vetoPMT hits for each subevent. The two-subevent sam-ple is predicted to be 71% νµ-CCQE, 16% CCπ+, and6% CCπ0. Observable CCπ+ events make it into thetwo-subevent sample for several reasons: primarily byπ+ → π0 and π+ → \π in mineral oil, by fast muon de-cays whose electrons occur during the prior subevent, andby µ− capture on nucleons affecting 8% of µ− in mineraloil. The two-subevent filter keeps 40% of CCQE andCCπ0 interactions while rejecting 80% of CCπ+ interac-tions. The rejection of CCQE and signal is mainly fromµ− that exit the tank. Additionally, events are lost bythe 8% µ− capture rate on carbon.
[GeV]one-trackµT
0.4 0.6 0.8 1 1.2 1.4 1.6 1.8 2
) e/L µ
log
(L
-0.3
-0.25
-0.2
-0.15
-0.1
-0.05
0
0.05
0.1
0πCCCCQE
FIG. 2. (color online) The one-track fit likelihood ratio vs. theone-track muon fit kinetic energy. A separation of CCQEevents (red “o”) relative to CCπ0 events (grey “x”) is per-formed by selecting events below the black line. For clarity,the events plotted are prescaled by 1000 and 100 for CCQEand CCπ0 respectively. The cut is optimized on the full non-prescaled MC sample.
To isolate a purer sample of observable CCπ0 eventsfrom the two-subevent sample, before the observableCCπ0 fit is performed, νµ-CCQE events are rejected bycutting on the ratio of the νµ-CCQE fit likelihood to theνe-CCQE fit likelihood as a function of µ−-fit kinetic en-ergy (see Fig. 2). This cut is motivated by the fact thatνµ-CCQE interactions are dominated by a sharp muonring, while CCπ0 interactions (with the addition of two
photon rings) will look “fuzzier” and more electron-liketo the fitter. The cut, which has been optimized to re-ject CCQE, rejects 96% of observable νµ-CCQE whileretaining 85% of observable CCπ0 [41]. Additionally, areconstructed radius cut of rrec < 550 cm is used to con-strain events to within the fiducial volume.
smallest angle between tracks [radians]
0 0.2 0.4 0.6 0.8 1 1.2 1.4 1.6 1.8 2
even
ts
0
500
1000
1500
2000
2500
3000
3500
4000
4500
Data
MC prediction
µidentified
µmis-ID
FIG. 3. The smallest angle between two of the three recon-structed tracks. Displayed are the data (with statistical er-rors), total MC (solid), identified µ− (dashed), and mis-IDedµ− (dotted). The cut selects events above 0.6 radians.
To reject misreconstructed signal events, along withcertain backgrounds, a cut is applied to reject events iftwo of the three Cerenkov rings reconstruct on top ofone another. When this occurs the fitter ambiguouslydivides the total energy between the two tracks. Forcases where there are two or fewer rings, the fitter willplace two of the tracks in the same direction. For caseswhere there are three or more Cerenkov rings, the fit-ter can still get trapped with two tracks on top of oneanother. This can happen either because of asymmet-ric π0 decays, a µ− near or below Cerenkov threshold, adominant µ− ring, or events that truly have overlappingtracks. In all of these cases, the reconstruction becomespoor, especially the identification of the µ− in the event.Fig. 3 shows the smallest reconstructed angle betweentwo of the three reconstructed tracks for both data andMC. The MC events are separated into samples that cor-rectly identified the µ− and those that did not. A cut isoptimized on signal events in the MC to reject misiden-tified µ−, and rejects events with track separations lessthan 0.6 radians [41]. This cut reduces the expected µ−
misidentification rate to the 20% level. Additionally theobservable CCπ0 fraction is increased to 38% and theobservable CCQE fraction is reduced to 13%.The next series of cuts reject non-π0 backgrounds. The
first requirement compares the observable CCπ0 fit like-lihood vs. a generic three-track fit and selects events that

6
)generic
/Lfit
log(L-0.1 0 0.1 0.2 0.3 0.4 0.5 0.6
even
ts
0
100
200
300
400
500
600
700
800
900
1000
Data
MC prediction
0πObservable CC0πBackground
0πBackground no
FIG. 4. The logarithm of the ratio of the observable CCπ0 fitlikelihood to a generic three-track fit. Displayed are the data(with statistical errors), total MC (solid), observable CCπ0
(dashed), backgrounds with a π0 in the final state or producedafter the event (dotted), and backgrounds with no π0 (dot-dashed). The cut selects events above 0.06.
are more CCπ0-like. As the observable CCπ0 fit is ac-tually a generic–µγγ from a common vertex–fit, this cutselects events that match this criterion. The second cutis on the reconstructed γγ mass about the expected π0
mass. This cut demands that the photons are consis-tent with a π0 decay. The combination of these cutsdefine the observable CCπ0 sample. Fig. 4 shows the log-arithm of the ratio of the observable CCπ0 fit over thegeneric three-track fit likelihoods. The MC is separatedinto three samples: observable CCπ0, background eventswith a π0 in the final state or created later in the event,and background events with no π0. Both the observ-able CCπ0 and backgrounds with a π0 are more µγγ-likethan events with no π0 in the event. Additionally, as thebackgrounds with a π0 either have multiple pions or theπ0 was produced away from the event vertex, the likeli-hood ratio for these events tend slightly more toward thegeneric fit. Events with no π0 peak sharply at low ratiovalues. The optimization rejects non-π0 backgrounds byselecting events greater than 0.06 in this ratio [41].
The final cut on the reconstructed γγ mass defines theobservable CCπ0 event sample. Fig. 5 shows the recon-structed γγ mass for both data and MC. No assump-tion is used in the fit that the two photons result froma π0 decay; nevertheless, both data and MC peak at theknown π0 mass. The predicted background MC with aπ0 in the final state, or a π0 produced after the event,has a broader peak than the signal MC. This broadeningoccurs for the same reasons discussed for the likelihoodratio; these events either produced a π0 away from theµ− vertex, or there are multiple pions in the final state.
]2 [GeV/cγγm
0 0.05 0.1 0.15 0.2 0.25 0.3 0.35 0.4
even
ts
0
100
200
300
400
500
600
700
800
900
1000
Data
MC prediction
0πObservable CC0πBackground
0πBackground no
FIG. 5. The reconstructed γγ mass. Displayed are the data(with statistical errors), total MC (solid), observable CCπ0
(dashed), backgrounds with a π0 in the final state or producedafter the event (dotted), and backgrounds with no π0 (dot-dashed). The vertical dotted line is the known π0 mass.
TABLE I. The expected efficiency and purity of observableCCπ0 events as a function of applied cut.
cut description efficiency purity
none 100% 3.6%
Two-subevent and Tank and Veto hits 38.2% 5.6%
CCπ0 filter and fiducial volume 27.9% 29.6%
Misreconstruction 10.3% 38.1%
Likelihood ratio and mγγ 6.4% 57.0%
As one might expect, background events with no π0 inthe final state show no discernible mass peak and pile upat low mass with a long misreconstructed tail extendingout to high mass. A cut is optimized to select eventsaround the known π0 mass [0.09 < mγγ < 0.2 GeV] toreject non-π0 backgrounds (low mass cut) and to increasesignal purity (high mass cut) [41]. The addition of theseselection cuts increases the observable CCπ0 purity to57% with 6% efficiency. After all cuts, the observableCCπ0 candidate sample contains 5810 events in data for6.27 × 1020 p.o.t. while the MC predicts 4160.2 events.Table I summarizes the effects of the cuts on the MCsample, while Table II summarizes the background con-tent of the observable CCπ0 candidate sample.
VI. ANALYSIS
The extraction of observable CCπ0 cross sections fromthe event sample requires a subtraction of backgroundevents, corrections for detector effects and cut efficiencies,

7
TABLE II. The expected background composition of theCCπ0 candidate sample by observable mode. The level ofobservable CCπ+ events are determined by the method de-scribed in Section VIA. The symbol X represents all nuclearfinal states and photons, and N ≥ 2 and M ≥ 1 are the num-ber of pions in the final state. Other backgrounds includedeep inelastic scattering and NC elastic scattering.
observable fraction of
mode description background
CCπ+ νµCH2 → µ−π+X 52.0%
CCQE νµCH2 → µ−X 15.4%
CCmulti-π νµCH2 → µ−(Nπ)X 14.0%
NC-π ν CH2 → ν (Mπ)X 8.8%
others 9.8%
a well-understood flux, and an estimation of the numberof interaction targets. The cross sections are determinedby
∂σ
∂x
∣
∣
∣
i=
∑
j Uij(Nj −Bj)
nΦiǫi∆xi
, (1)
where x is the variable of interest, i labels a bin of themeasurement, ∆xi is the bin width, Nj is the number ofevents in data of bin j, Bj is the expected background,Uij is a matrix element that unfolds out detector effects,ǫi is the bin efficiency, Φi is the predicted neutrino flux,and n is the number of interaction targets. For the single-differential cross-section measurements, the flux factor,Φi, is constant and equals the total flux. For the totalcross-section measurement as a function of neutrino en-ergy the flux factor is per energy bin. The extracted crosssections require a detailed understanding of the measure-ments or predictions of the quantities in Eqn. 1, andtheir associated systematic uncertainties. By construc-tion, the signal cross-section prediction has minimal im-pact on the measurements. Wherever the prediction canaffect a measurement, usually through the systematic er-ror calculations, the dependence is duly noted.
A. CCπ+ backgrounds
The first stage of the cross-section measurement is tosubtract the expected background contributions from themeasured event rate. This is complicated by the fact thatpreviously measured modes in MiniBooNE (CCQE [44],NCπ0 [1], and CCπ+ [45]) show substantial normaliza-tion discrepancies with the Nuance prediction. The sin-gle largest background, observable CCπ+, is well con-strained by measurements within the MiniBooNE dataset. The observable CCQE in the sample is at a smallenough level not warrant further constraint. Most of theremaining backgrounds are unmeasured but individuallysmall.The CCπ+ backgrounds are important to constrain
for two reasons: they contribute the largest single back-
ground, and π+ → π0 and π+ → \π processes in the min-eral oil have large uncertainties. In particular, π+ → π0
in mineral oil is, by definition, not an observable CCπ0
because the π0 did not originate in the target nucleus.By tying the observable CCπ+ production to measure-ments within the MiniBooNE data, the uncertainty onthis background can also be further reduced. The to-tal error is separated into an uncertainty on CCπ+ pro-duction and an uncertainty on π+ → π0 and π+ → \πprocesses in mineral oil occurring external to the initialtarget nucleus. Using the high statistics MiniBooNE 3-subevent sample, many measurements of the absolute ob-servable CCπ+ production cross sections have been per-formed [45, 46]. This observable CCπ+ sample is pre-dicted to be 90% pure [45, 46] making it the purest modemeasured in the MiniBooNE data set to date. It is avery useful sample for this analysis as the bulk of theCCπ+ background events in the CCπ0 sample fall in thekinematic region well-measured by the observable CCπ+
data. The measurements used are from the tables inRef. [46]. Because the re-interaction cross sections forπ+ → π0 and π+ → \π are strong functions of π+ energy,the constraint on CCπ+ events is applied as a function ofπ+ kinetic energy and neutrino energy. Fig. 6 shows the
data
/ N
UA
NC
E
0.9
1
1.1
1.2
1.3
1.4
1.5
[GeV]νE0.6 0.8 1 1.2 1.4 1.6 1.8 2
[G
eV]
+ πT
0
0.05
0.1
0.15
0.2
0.25
0.3
0.35
0.4
FIG. 6. (color online) The ratio of the measured observableCCπ+ cross section to the Nuance prediction. The ratio isplotted as a function of Tπ+ and Eν .
ratio of the measured observable CCπ+ cross section as afunction of π+ and neutrino energies to the Nuance pre-dicted cross section. As the differential cross section withrespect to π+ kinetic energy was not reported for binswith small numbers of events, the reweighting function ispatched by the ratio of the total observable CCπ+ crosssection as a function of neutrino energy. This reweightingfactor (as high as 1.6 in some bins) is applied to everyobservable CCπ+ event in the MC sample. All figuresand numbers presented in this article have this reweight-

8
ing applied. By using the MiniBooNE data to constrainthe CCπ+ backgrounds, strict reliance on the Nuance
implementation of the Rein-Sehgal model to predict thisimportant background is avoided.
B. Background subtraction
The MC predicts a sample that is 57% pure observ-able CCπ0 after all analysis cuts. A 23% contributionof observable CCπ+ interactions is set by prior measure-ments in the MiniBooNE data. The remaining 20% of theevent sample is mostly comprised of CCQE and multi-π final-state events (see Table II). These backgrounds,while thought to be produced in larger quantities thanthe MC prediction, are set by the MC as there is no clearmethod to extract the normalization of many of thesemodes from the current data. If the normalizations aredifferent–but on the same order as previously measuredmodes–they would change the final results by at most afew percent. The uncertainties applied to the produc-tion of these backgrounds more than cover the possiblenormalization differences. After subtracting the back-grounds from the data the sample contains 3725.5 signalevents with Eν ∈ 0.5 − 2.0 GeV, which should be com-pared to 2372.2 predicted events. This is a normalizationdifference of 1.6, the largest normalization difference thathas been observed in the MiniBooNE data thus far. Thisis attributed to the large effects of pion re-interactionswhich can directly influence the measured cross sectionfor observable CCπ0 production and the fact that theNuance prediction appears low even when compared toprior measurements on deuterium data [47].
C. Unfolding & flux restriction
To correct for the effects of detector resolution andreconstruction, a method of data unfolding is per-formed [48]. The unfolding method constructs a responsematrix from the MC that maps reconstructed quantitiesto their predicted values. The chosen method utilizes theBayesian technique described in Ref. [49]. This methodof data unfolding requires a Bayesian prior for the sig-nal sample, which produces an intrinsic bias. This biasis the only way that the signal cross-section model af-fects the measured cross sections. In effect, this allowsthe signal cross-section model to pull the measured crosssections toward the shape of the distributions producedfrom the model while preserving the normalization mea-sured in the data; nevertheless, strict dependence on thesignal cross-section is avoided. For these measurements,the level of uncertainty on the signal model cover the ef-fect of the bias on the central value. For situations wherethe unfolding is applied to a distribution that is signifi-cantly different than the Bayesian prior, the granularityof the unfolding matrix needs to be increased to stabi-lize the calculation of the systematic uncertainty. Oth-
erwise the uncertainties would be larger than expecteddue to larger intrinsic bias. For the total cross sec-tion as a function of neutrino energy, the unfolding actson the background-subtracted reconstructed neutrino en-ergy and unfolds back to the neutrino energy prior tothe interaction. For each of the flux-averaged differen-tial cross-section measurements, the unfolding acts onthe two-dimensional space of neutrino energy and the re-constructed quantity of a particular measurement. Forfinal-state particles, µ− and π0, the unfolding corrects tothe kinematics after final-state effects, and are the leastmodel dependent. For the 4-momentum transfer, Q2,the unfolding extracts to Q2 calculated from the initialneutrino and the final-state µ−. In both the total crosssection and flux-averaged differential cross section in Q2,the final-state interaction model does bias the measure-ments. Uncertainties in the signal cross-section model,along with the final-state interaction model, are expectedto cover this bias. The unfolded two-dimensional distri-butions are restricted to a region of unfolded neutrinoenergy between 0.5 − 2.0 GeV. This effectively restrictsthe differential cross-section measurements over the samerange of neutrino energy, and flux, as the total cross-section measurement.
D. Efficiency correction
The unfolded distributions are next corrected by a bin-by-bin efficiency. The efficiencies are estimated by takingthe ratio of MC signal events after cuts to the predicteddistribution of signal events without cuts but restrictedto the fiducial volume. The efficiency is insensitive tochanges in the underlying MC prediction to within theMC statistical error. While this additional statistical er-ror is not large, it is properly accounted for in the errorcalculation. The overall efficiency for selecting observ-able CCπ0 interactions is 6.4%; the bulk of the events(∼ 60%) are lost by demanding a µ− that stops and de-cays in the MiniBooNE tank. The cuts to reduce thebackgrounds and preserve well-reconstructed events ac-count for the remainder.
E. Neutrino flux
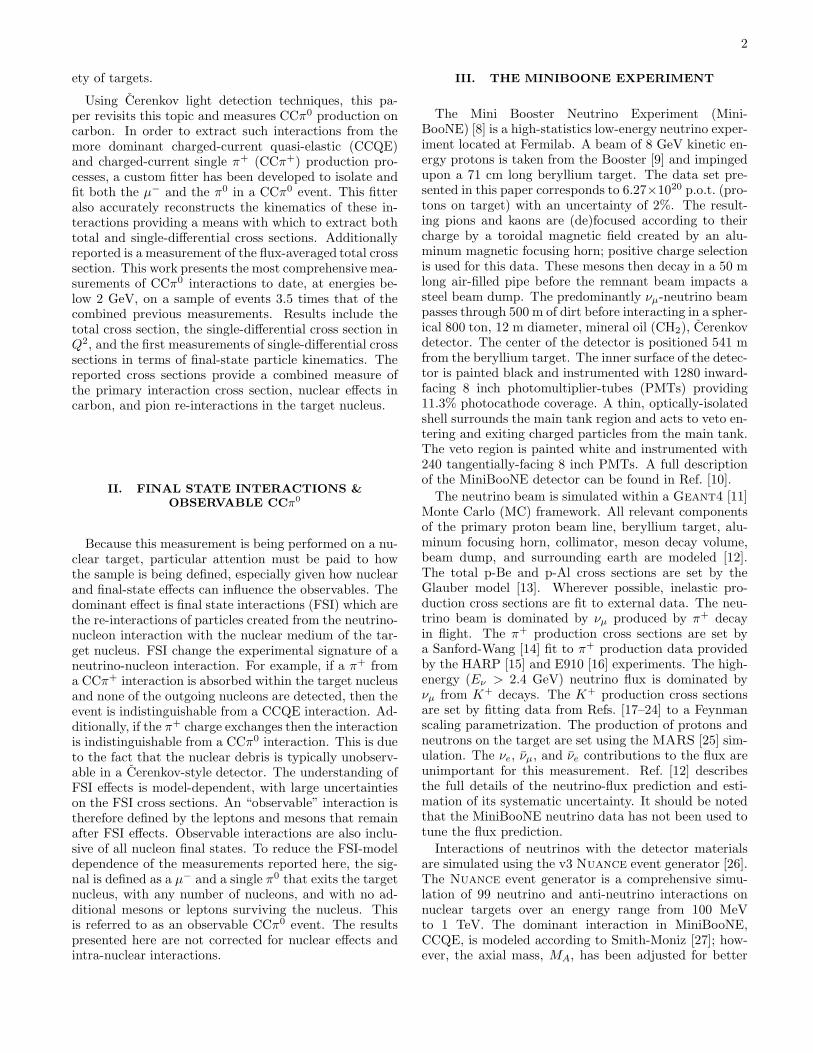
A major difficulty in extracting absolute cross sectionsis the need for an accurate flux prediction. The Mini-BooNE flux prediction [12] comes strictly from fits to ex-ternal data [15–24] and makes no use of the MiniBooNEneutrino data. Fig. 7 shows the predicted νµ flux withsystematic uncertainties. The flux is restricted by theunfolding method to the range 0.5–2.0 GeV, althoughcontributions from the flux outside of this range affectthe systematic uncertainties of the unfolding method.The integrated flux over this range is predicted to beΦν = (3.545± 0.259)× 10−10 νµ/p.o.t./cm
2.
9
[GeV]νE0.6 0.8 1 1.2 1.4 1.6 1.8 2
/ G
eV2
/ p.
o.t.
/ cm
µν
0
0.1
0.2
0.3
0.4
0.5
-910×
FIG. 7. (color online) The predicted νµ flux with systematicuncertainties over the range 0.5–2.0 GeV. A table containingthe values of the flux, along with a full-correlation matrix, isprovided in Table. V of the appendix.
F. Number of targets
The Marcol 7 mineral oil is composed of long chainsof hydrocarbons. The interaction target is one link in ahydrocarbon chain; CH2 chains with an additional hy-drogen atom at each end. The molecular weight is theweight of one unit of the chain averaged over the av-erage chain length. The density of the mineral oil isρoil = 0.845± 0.001 g/cm3 [10]. Thermal variations overthe course of the run were less than 1%. The fiducial vol-ume is defined to be a sphere 550 cm in radius. Therefore,there are (2.517± 0.003)× 1031 interaction targets.
VII. SYSTEMATIC UNCERTAINTIES
Sources of systematic uncertainties are separated intotwo types: flux sources and detector sources. Fluxsources affect the number, type, and momentum of theneutrino beam at the detector. Detector sources affectthe interaction of neutrinos in the mineral oil and sur-rounding materials, the interactions of the produced par-ticles with the medium, the creation and propagation ofoptical photons, and the uncertainties associated withthe detector electronics. Whenever possible, the inputsources to the systematic uncertainty calculations are fitto both ex-and in-situ data and varied within their fullerror matrices. These variations are propagated throughthe entire analysis chain and determine the systematic er-ror separately for each quantity of interest. For sourcesthat affect the number of interactions (e.g. flux and cross-section sources), the central value MC is reweighted by
taking the ratio of the value of the underlying parame-ter’s excursion to that of the central value. This is doneto reduce statistical variations in the underlying system-atics. Sources that change the properties of an eventrequire separate sets of MC to evaluate the error matri-ces. The unfortunate aspect of this method is it intro-duces additional statistical error from the excursion. Ifthe generated sets are large, then this additional error issmall.
A. Flux sources
The main sources of flux uncertainties come from parti-cle production and propagation in the Booster neutrinobeam line. The proton-beryllium interactions produceπ+, π−, K+, and K0 particles that decay into νµ neu-trinos. The dominant source of νµ in the flux range of0.5–2.0 GeV is π+ decay. The π+ production uncertain-ties are determined by propagating the HARP measure-ment error matrix by spline interpolation and reweight-ing into an error matrix describing the contribution of π+
production to the MiniBooNE νµ flux uncertainty [12].Over the flux range of this analysis, the total uncertaintyon π+ production introduces a 6.6% uncertainty on theνµ-flux. These uncertainties would be larger if the en-tire neutrino flux were considered in these measurements;however, as the largest flux uncertainties are in regionsof phase space that cannot produce a CCπ0 interaction,it was prudent to restrict the flux range. Horn relateduncertainties stem from horn-current variations and skin-depth effects (which mainly affect the high-energy neu-trino flux), along with other beam related effects (e.g.secondary interactions), and provide an additional 3.8%uncertainty. No other source contributes more than 0.2%(K+ production) to the uncertainty. The total uncer-tainty on the flux over the range 0.5–2.0 GeV, from allflux-related sources, is 7.3%. As the flux prediction af-fects the measured cross sections through the flux weight-ing, background subtraction, and unfolding, the result-ing uncertainties on the measured total cross section are7.5% and 7.3% for horn variations and π+ productionrespectively.
B. Detector sources
Uncertainties associated with the detector result from:neutrino-interaction cross sections, charged-particle in-teractions in the mineral oil, the creation and interactionof photons in the mineral oil, and the detector read-outelectronics. The neutrino-interaction cross sections arevaried in Nuance within their error matrices. Thesevariations mainly affect the background predictions; how-ever, the expected signal variations (i.e. flux and signalcross-section variations) do affect the unfolding. Thevariations of the background cross sections cover the dif-ferences seen in the MiniBooNE data; the variations of

10
the signal cover the bias introduced through the cho-sen unfolding method. The uncertainty on the observ-able CCπ+ cross section is constrained by measurementswithin the data [45, 46] assuming no bin-to-bin correla-tions. The total cross-section uncertainty on the observ-able CCπ0 cross-section measurement is 5.8%.The creation and propagation of optical photons in
the mineral oil is referred to as the optical model. Sev-eral ex-situmeasurements were performed on the mineraloil to accurately describe elastic Rayleigh and inelasticRaman scattering, along with the fluorescence compo-nents [10, 35]. Additionally, reflections and PMT effi-ciencies are included in the model, which is defined by atotal of 35 correlated parameters. These parameters arevaried, in a correlated manner, over a set of data-sizedMC samples. The uncertainty calculated from these MCsamples contains an additional amount of statistical er-ror; however, in this analysis, the bulk of the additionalstatistical error is smoothed out by forcing each MC tohave the same underlying true distributions. The opti-cal model uncertainty on the total cross-section measure-ment is 2.8%.Variations in the detector electronics are estimated as
PMT effects. The first measures the PMT response byadjusting the discriminator threshold from 0.1 photoelec-trons (PE) to 0.2 PE. The second measures the correla-tion between the charge and time of the PMT hits. Theseuncertainties contribute 5.7% and 1.1% to the total crosssection respectively.The dominant uncertainty on the cross-section mea-
surements comes from the uncertainty of π+ → π0 andπ+ → \π in the mineral oil occurring external to the ini-tial target nucleus where the effects of π+ → π0 andπ+ → \π internal the target nucleus are included in thesemeasurements. The uncertainty on the π+ → π0 crosssection on mineral oil is 50% and for π+ → \π it is 35%.The uncertainties come from external data [36]. Theseuncertainties affect this measurement to a large degreebecause of the much larger observable CCπ+ interactionrate (by a factor of 5.2). While this uncertainty is small inthe observable CCπ+ cross-section measurements, manyCCπ+ that undergo either π+ → π0 or π+ → \π in themineral oil end up in the CCπ0 candidate sample. Theuncertainty on the CCπ0 cross sections of π+ → π0 andπ+ → \π from observable CCπ+ interactions is 12.9%.The uncertainty applied to CC(NC)multi-π, NCπ+, andother backgrounds is included in the background cross-section uncertainties.
C. Discussion
The total systematic uncertainty, from all sources, onthe observable CCπ0 total cross-section measurement is18.7%. The total uncertainty is found by summing allof the individual error matrices. The largest uncertainty,π+ → π0 and π+ → \π in the mineral oil, is 12.9%; theflux uncertainties are 10.5%; the remaining detector and
neutrino cross-section uncertainties are 8.6%. The totalstatistical uncertainty is 3.3%. Table III summarizes theeffects of all sources of systematic uncertainty. Clearly,the limiting factor on the measurement is the understand-ing of π+ → π0 and π+ → \π in mineral oil external tothe target nucleus. The two simplest ways to reduce thisuncertainty in future experiments are to improve the un-derstanding of pion scattering in a medium, or to use afine-grained detector that can observe the π+ before thecharge-exchange or absorption. Beyond that, gains canalways be made from an improved understanding of theincoming neutrino flux.
TABLE III. Summary of systematic uncertainties.
source uncertainty
π+ → π0 & π+ → \π in mineral oil 12.9%
νµ flux 10.5%
ν cross section 5.8%
detector electronics 5.8%
optical model 2.8%
total 18.7%
VIII. RESULTS
This report presents measurements of the observableCCπ0 cross section as a function of neutrino energy, andflux-averaged differential cross sections in Q2, Eµ, cos θµ,|pπ0 |, and cos θπ0 . These measurements provide the mostcomplete information about this interaction on a nucleartarget (CH2) at these energies (0.5–2.0 GeV) to date.Great care has been taken to measure cross sections withminimal neutrino-interaction model dependence. First,the definition of an observable CCπ0 interaction limitsthe dependence of these measurements on the internalπ+ → π0 and π → \π models. Second, most of the mea-surements are presented in terms of the observed final-state particle kinematics further reducing the dependenceof the measurements on the FSI model. Any exceptionsto these are noted with the measurements.The first result, a measurement of the total observable
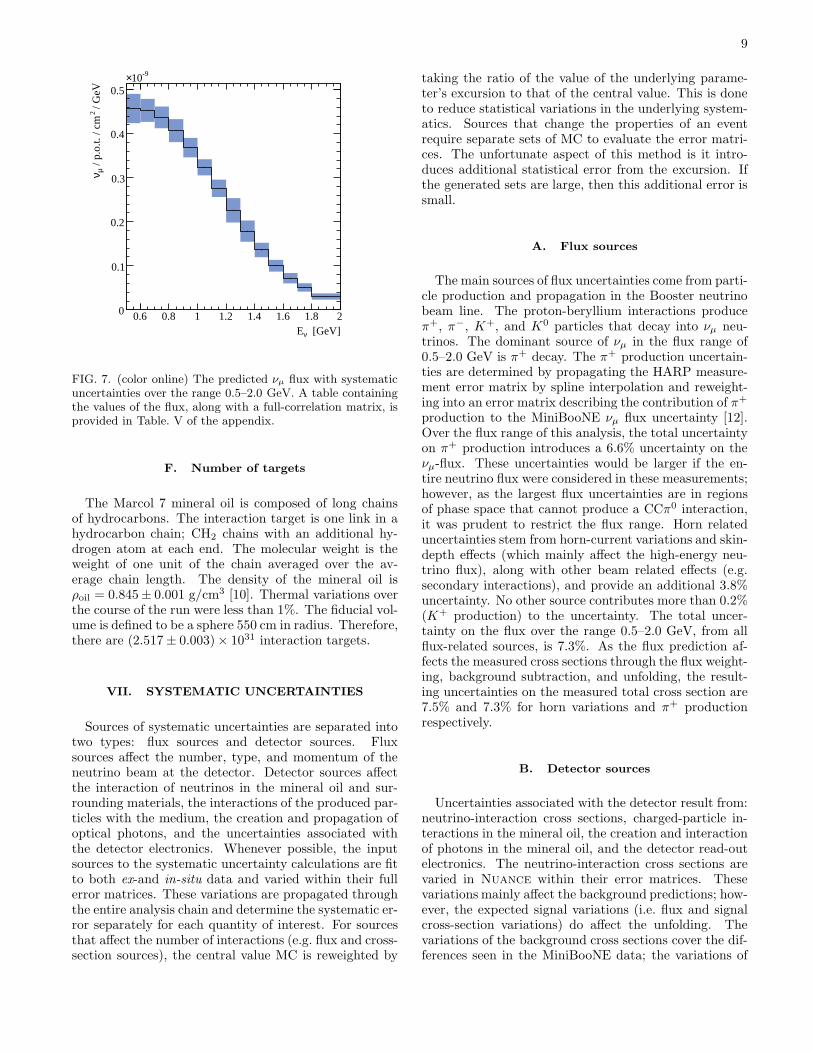
CCπ0 cross section is shown in Fig. 8. This measurementis performed by integrating Eqn. 1 over neutrino energy.This result does contain some dependence on the initialneutrino-interaction model as the unfolding extracts backto the initial neutrino energy; however, this dependenceis not expected to be large. The total measured sys-tematic uncertainty is 18.7%, and is slightly higher thanthe uncertainties presented for the cross sections with-out this dependence. The total cross section is higherat all energies than is expected from the combination ofthe initial interaction [30] and FSI as implemented inNuance. An enhancement is also observed in other re-cent charged-current cross-section measurements [44, 45];however, the enhancement is a factor of 1.56±0.26 larger
11
[GeV]νE0.6 0.8 1 1.2 1.4 1.6 1.8 2
] 2 /
CH
2 N
’) [
cm0 π -
µ→
N µν(σ
0
5
10
15
20
25
-3910×
Statistical error
Systematic error
NUANCE
FIG. 8. (color online) The total observable CCπ0 cross sec-tion as a function of neutrino energy. The uncertainty is dom-inated by π+ charge-exchange and absorption in the mineraloil external the target nucleus. The total systematic uncer-tainty on the cross section is 18.7%. The central-value mea-surement, uncertainties, and correlation matrix are tabulatedin Table VI of the appendix.
than the prediction here.
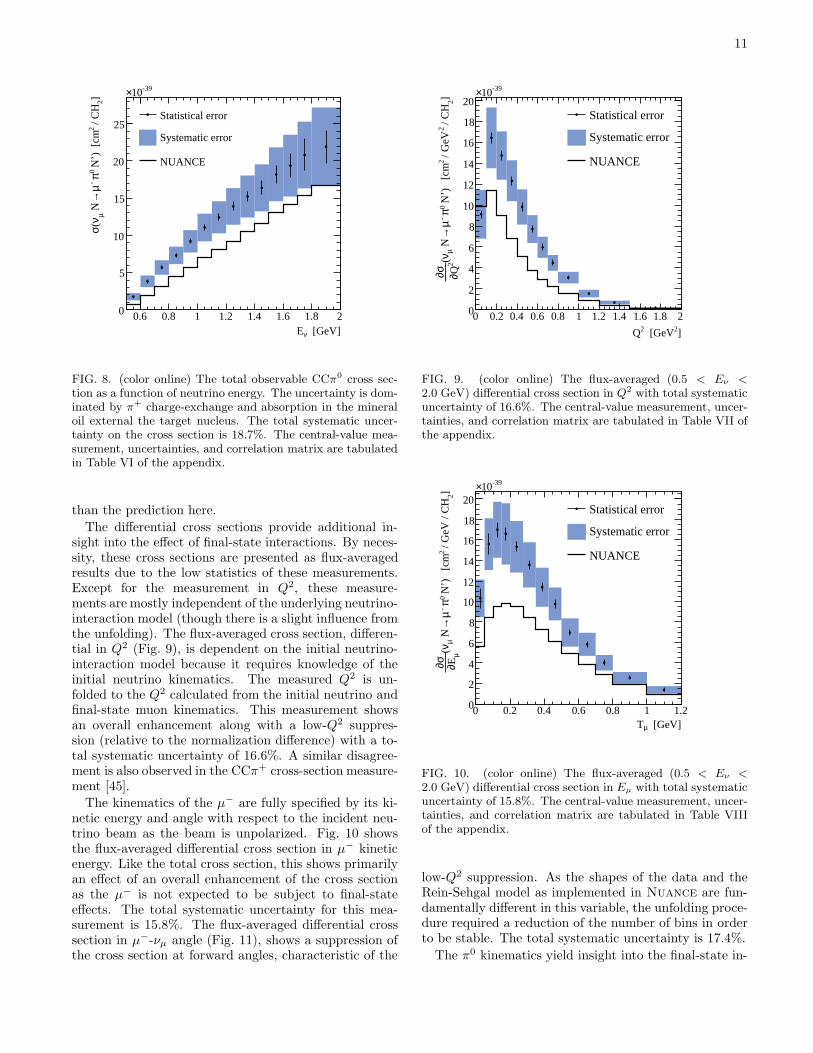
The differential cross sections provide additional in-sight into the effect of final-state interactions. By neces-sity, these cross sections are presented as flux-averagedresults due to the low statistics of these measurements.Except for the measurement in Q2, these measure-ments are mostly independent of the underlying neutrino-interaction model (though there is a slight influence fromthe unfolding). The flux-averaged cross section, differen-tial in Q2 (Fig. 9), is dependent on the initial neutrino-interaction model because it requires knowledge of theinitial neutrino kinematics. The measured Q2 is un-folded to the Q2 calculated from the initial neutrino andfinal-state muon kinematics. This measurement showsan overall enhancement along with a low-Q2 suppres-sion (relative to the normalization difference) with a to-tal systematic uncertainty of 16.6%. A similar disagree-ment is also observed in the CCπ+ cross-section measure-ment [45].
The kinematics of the µ− are fully specified by its ki-netic energy and angle with respect to the incident neu-trino beam as the beam is unpolarized. Fig. 10 showsthe flux-averaged differential cross section in µ− kineticenergy. Like the total cross section, this shows primarilyan effect of an overall enhancement of the cross sectionas the µ− is not expected to be subject to final-stateeffects. The total systematic uncertainty for this mea-surement is 15.8%. The flux-averaged differential crosssection in µ−-νµ angle (Fig. 11), shows a suppression ofthe cross section at forward angles, characteristic of the
]2 [GeV2Q
0 0.2 0.4 0.6 0.8 1 1.2 1.4 1.6 1.8 2
] 2 /
CH
2 /
GeV
2 N
’)
[cm
0 π -µ
→ N µν( 2
Q∂σ∂
0
2
4
6
8
10
12
14
16
18
20-3910×
Statistical error
Systematic error
NUANCE
FIG. 9. (color online) The flux-averaged (0.5 < Eν <2.0 GeV) differential cross section in Q2 with total systematicuncertainty of 16.6%. The central-value measurement, uncer-tainties, and correlation matrix are tabulated in Table VII ofthe appendix.
[GeV]µT0 0.2 0.4 0.6 0.8 1 1.2
] 2 /
GeV
/ C
H2
N’)
[c
m0 π -
µ→
N µν( µ E∂σ∂
0
2
4
6
8
10
12
14
16
18
20
-3910×
Statistical error
Systematic error
NUANCE
FIG. 10. (color online) The flux-averaged (0.5 < Eν <2.0 GeV) differential cross section in Eµ with total systematicuncertainty of 15.8%. The central-value measurement, uncer-tainties, and correlation matrix are tabulated in Table VIIIof the appendix.
low-Q2 suppression. As the shapes of the data and theRein-Sehgal model as implemented in Nuance are fun-damentally different in this variable, the unfolding proce-dure required a reduction of the number of bins in orderto be stable. The total systematic uncertainty is 17.4%.
The π0 kinematics yield insight into the final-state in-

12
µθcos -1 -0.8 -0.6 -0.4 -0.2 -0 0.2 0.4 0.6 0.8 1
] 2 /
CH
2 N
’)
[cm
0 π -µ
→ N µν( µθ
cos
∂
σ∂
0
2
4
6
8
10
12
14
16-3910×
Statistical error
Systematic error
NUANCE
FIG. 11. (color online) The flux-averaged (0.5 < Eν <2.0 GeV) differential cross section in cos θµ with total sys-tematic uncertainty of 17.4%. The central-value measure-ment, uncertainties, and correlation matrix are tabulated inTable IX of the appendix.
teraction effects and are also fully specified by two mea-surements: the pion momentum and angle with respectto the neutrino beam direction. Fig. 12 shows the flux-
[GeV/c]0π
p0 0.2 0.4 0.6 0.8 1 1.2 1.4
]2
/ G
eV/c
/ C
H2
N’)
[c
m0 π -
µ→
N µν( 0 π p∂σ∂
0
5
10
15
20
25
30
35
-3910×
Statistical error
Systematic error
NUANCE
FIG. 12. (color online) The flux-averaged (0.5 < Eν <2.0 GeV) differential cross section in |pπ0 | with total system-atic uncertainty of 15.9%. The central-value measurement,uncertainties, and correlation matrix are tabulated in Table Xof the appendix.
averaged differential cross section in |pπ0 |. The crosssection is enhanced at low momentum and in the peak,
but agrees with the prediction at higher momentum. Asimilar disagreement is also observed in the NCπ0 cross-section measurements [1]. Interactions of both the nu-cleon resonance and pions with the nuclear medium cancause the ejected π0 to have lower momentum. The totalsystematic uncertainty is 15.9%. Fig. 13 shows the flux-averaged differential cross section in π0-νµ angle. The
0πθcos -1 -0.8 -0.6 -0.4 -0.2 -0 0.2 0.4 0.6 0.8 1
] 2 /
CH
2 N
’)
[cm
0 π -µ
→ N µν( 0 πθ
cos
∂
σ∂0
2
4
6
8
10
12
14
16
18-3910×
Statistical error
Systematic error
NUANCE
FIG. 13. (color online) The flux-averaged (0.5 < Eν <2.0 GeV) differential cross section in cos θπ0 with total sys-tematic uncertainty of 16.3%. The central-value measure-ment, uncertainties, and correlation matrix are tabulated inTable XI of the appendix.
cross section is more forward than the prediction. Thetotal systematic error is 16.3%.Each of the cross-section measurements also provide
a measurement of the flux-averaged total cross section.From these total cross sections, all of the observableCCπ0 cross-section measurements can be compared. Ta-ble IV shows the flux-averaged total cross sections cal-
TABLE IV. Summary of the flux-averaged total cross sec-tions calculated from each cross-section measurement. Theaverage cross section is calculated assuming 100% correlatedsystematics. The flux-averaged neutrino energy is 〈Eν〉Φ =0.965 GeV.
measurement 〈σ〉Φ[×10−39 cm2]
σ(Eν) 9.05±1.44
∂σ/∂Q2 9.28±1.55
∂σ/∂Eµ 9.20±1.47
∂σ/∂ cos θµ 9.10±1.50
∂σ/∂|pπ0 | 9.03±1.54
∂σ/∂ cos θπ0 9.54±1.55
〈σ〉Φ
9.20±1.51
culated from each measurement. The measurements all

13
agree within 6%, well within the uncertainty. Whileall measurements use the same data, small differencescan result from biases due to the efficiencies and un-foldings. The results are combined in a simple aver-age, assuming 100% correlated uncertainties, to yield〈σ〉Φ = (9.20 ± 0.3stat. ± 1.51syst.) × 10−39 cm2/CH2 atflux-averaged neutrino energy of 〈Eν〉Φ = 0.965 GeV.The averaged flux-averaged total cross-section measure-ment is found to be a factor of 1.58± 0.05stat.± 0.26syst.higher than the Nuance prediction.
IX. CONCLUSION
The measurements presented here provide the mostcomplete understanding of CCπ0 interactions at energiesbelow 2 GeV to date. They are the first on a nucleartarget (CH2), at these energies, and provide differentialcross-section measurements in terms of the final state,non-nuclear, particle kinematics. The development ofa novel 3-Cerenkov ring fitter has facilitated the recon-struction of both the π0 and µ− in a CCπ0 interaction.This reconstruction allows for the measurement of the fullkinematics of the event providing for the measurement ofsix cross sections: the total cross section as a function ofneutrino energy, and flux-averaged differential cross sec-tions in Q2, Eµ, cos θµ, |pπ0 |, and cos θπ0 . These crosssections show an enhancement over the initial interactionmodel [30] and FSI effects as implemented in Nuance.The flux-averaged total cross section is measured to be〈σ〉Φ = (9.20 ± 0.3stat. ± 1.51syst.) × 10−39 cm2/CH2 atmean neutrino energy of 〈Eν〉Φ = 0.965 GeV. These mea-surements should prove useful for understanding incoher-ent pion production on nuclear targets.
ACKNOWLEDGMENTS
The authors would like to acknowledge the support ofFermilab, the Department of Energy, and the NationalScience Foundation in the construction, operation, anddata analysis of the Mini Booster Neutrino Experiment.
Appendix: Hadronic invariant mass
The background-subtracted reconstructed nucleon res-onance mass is calculable from the reconstructed neu-
trino and muon 4-momenta. Fig. 14 shows thebackground-subtracted reconstructed invariant mass fordata and the MC expectation. The data has not been cor-rected for cut efficiencies. The fact that the data peakssomewhat below the ∆(1232) resonance while Nuance
peaks at the resonance implies the model is not properlytaking into account final state interaction effects; how-ever, it is observed that the MiniBooNE data is almostcompleted dominated by the ∆(1232) resonance. Thisshift can also be interpreted as an effective change in the
]2 [GeV/cγγNreconstructed m0.8 1 1.2 1.4 1.6 1.8 2
]2 [
even
ts /
GeV
/cγγ
N m∂
n∂0
2000
4000
6000
8000
10000
12000
14000
16000
18000
Statistical error
Systematic error
NUANCE
FIG. 14. (color online) Invariant mass of the hadronic systemfor both data (points with error bars) and the MC prediction(solid line) for the signal mode. The dotted line indicates thelocation of the ∆(1232) resonance.
recoil mass, W , of the hadronic system. Additionally, ithas been verified that CCQE interactions, which do notinvolve a resonance, peak at threshold (not displayed).
Appendix: Tables
The tables presented in this appendix are provided toquantify the flux, Fig. 7, and the cross-section measure-ments, Figs. 8, 9, 10, 11, 12, and 13.
[1] A. A. Aguilar-Arevalo et al. (MiniBooNE), Phys. Rev.D., 81, 013005 (2010).
[2] Y. Kurimoto et al. (SciBooNE), Phys. Rev. D, 81, 111102(2010).
[3] S. B. Barish et al., Phys. Rev. D., 19, 2521 (1979).[4] G. M. Radecky et al., Phys. Rev. D., 25, 1161 (1982).[5] T. Kitagaki et al., Phys. Rev. D., 34, 2554 (1986).
[6] D. Allasia et al., Nucl. Phys. B., 343, 285 (1990).[7] H. J. Grabosch et al., Zeit. Phys. C., 41, 527 (1989).[8] E. Church et al., “A proposal for an experiment
to measure νµ → νe oscillations and νµ disappear-ance at the Fermilab Booster: BooNE,” http://www-boone.fnal.gov/publications/ (1997).
[9] “Fermilab Technical Memo TM-405,” (1973).

14
[10] A. A. Aguilar-Arevalo et al., Nucl. Inst. Meth. A, 599,28 (2009).
[11] S. Agostinelli et al., Nucl. Instrum. Meth., A506, 250(2003).
[12] A. A. Aguilar-Arevalo et al., Phys. Rev. D., 79, 072002(2009).
[13] R. J. Glauber, Lectures in Theoretical Physics, Volume
1, edited by W. E. Britten et al. (1959).[14] J. R. Sanford and C. L. Wang, BNL Note 11299 (1967).[15] M. G. Catanesi et al., European Physical Journal C, 52,
29 (2007).[16] I. Chemakin et al., Phys. Rev. C, 77, 015209 (2008).[17] Y. D. Aleshin, I. A. Drabkin, and V. V. Kolesnikov,
“Production of K± Mesons from Be Targets at 62-Mradat 9.5-GeV/c Incident Proton Momenta,” ITEP-80-1977(1977).
[18] T. Abbott et al., Phys. Rev. D, 45, 3906 (1992).[19] J. V. Allaby et al., CERN Report No. CERN 70-12, (un-
published).[20] D. Dekkers et al., Phys. Rev., 137, B962 (1965).[21] T. Eichten et al., Nuclear Physics B, 44, 333 (1972).[22] R. A. Lundy et al., Phys. Rev. Lett., 14, 504 (1965).[23] G. J. Marmer et al., Phys. Rev., 179, 1294 (1969).[24] I. A. Vorontsov et al., (1988).[25] N. V. Mokhov et al., “MARS Code Developments,” [nucl-
th/9812038] (1998).[26] D. Casper, Nucl. Phys. Proc. Suppl., 112, 161 (2002).[27] R. A. Smith and E. J. Moniz, Nucl. Phys., B43, 605
(1972).[28] A. A. Aguilar-Arevalo et al. (MiniBooNE), Phys. Rev.
Lett., 100, 032301 (2008).[29] E. J. Moniz et al., Phys. Rev. Lett., 26, 445 (1971).
[30] D. Rein and L. Sehgal, Annals of Physics, 133, 79 (1981).[31] Kislinger, M. and Feynman, R. P. and Ravndal, F.,
Phys. Rev. D, 3, 2706 (1971).[32] R. Brun et al., “GEANT3,” CERN-DD/EE/84-1 (1987).[33] C. Zeitnitz and T. A. Gabriel, Nucl. Instrum. Meth.,
A349, 106 (1994).[34] R. B. Patterson, FERMILAB-THESIS-2007-19.[35] B. C. Brown et al. (MiniBooNE), in 2004 IEEE Nucl.
Sci. Symp. Conf. Rec., Vol. 1 (2006) pp. 652–656, alsoavailable as FERMILAB-CONF-04-282-E.
[36] C. Ashery et al., Phys. C, 23, 2173 (1981).[37] M. K. Jones et al., Phys. Rev. C, 48, 2800 (1993).[38] R. D. Ransome et al., Phys. Rev. C, 45, R509 (1992).[39] R. B. Patterson et al., Nucl. Inst. Meth. A, 608, 206
(2009).[40] I. McLaren, CERN Program Library, D506 (1998).[41] R. H. Nelson, FERMILAB-THESIS-2010-09.[42] R. H. Nelson, AIP Conf. Proc., 1189, 201 (2009).[43] C. Amsler et al., Phys. Lett. B., 667, 1 (2008).[44] A. A. Aguilar-Arevalo et al. (MiniBooNE), Phys. Rev.
D., 81, 092005 (2010).[45] A. A. Aguilar-Arevalo et al. (MiniBooNE), “Measure-
ment of Neutrino-Induced Charged-Current ChargedPion Production on Mineral Oil at Eν ∼ 1 GeV,” [hep-ex/1011.3572] (2010).
[46] M. J. Wilking, FERMILAB-THESIS-2009-27.[47] G. P. Zeller, “Low Energy Neutrino Cross Sections: Com-
parison of Various Monte Carlo Predictions to Experi-mental Data,” [hep-ex/0312061] (2003).
[48] G. Cowan, Statistical Data Analysis (Oxford SciencePublications, 1998).
[49] G. D’Agostini, Nucl. Instrum. Meth., A362, 487 (1995).

15
TABLE V. The predicted νµ flux. Tabulated are the central value, total systematic uncertainty, and the correlation matrix. The bin boundaries are tabulated as thelow edge of the bin with the last bin giving both the low and high edge.
Bin edge [GeV] 0.50 0.60 0.70 0.80 0.90 1.00 1.10 1.20 1.30 1.40 1.50 1.60 1.70 1.80-2.00
CV [×10−10 ν/p.o.t./cm2/GeV] 4.57 4.53 4.37 4.07 3.68 3.24 2.76 2.26 1.79 1.36 1.00 0.72 0.51 0.30
Total Syst. ±0.33 ±0.26 ±0.25 ±0.26 ±0.22 ±0.18 ±0.20 ±0.28 ±0.24 ±0.17 ±0.13 ±0.12 ±0.10 ±0.07
0.50 1.00 0.91 0.91 0.79 0.77 0.45 -0.06 -0.35 -0.33 -0.12 0.12 0.19 0.25 0.28
0.60 0.91 1.00 0.92 0.80 0.77 0.54 0.08 -0.16 -0.16 -0.01 0.13 0.15 0.17 0.18
0.70 0.91 0.92 1.00 0.87 0.86 0.61 0.13 -0.19 -0.18 0.04 0.25 0.28 0.31 0.33
0.80 0.79 0.80 0.87 1.00 0.92 0.69 0.15 -0.17 -0.17 0.09 0.35 0.40 0.41 0.44
0.90 0.77 0.77 0.86 0.92 1.00 0.83 0.34 -0.02 -0.01 0.23 0.44 0.47 0.49 0.50
1.00 0.45 0.54 0.61 0.69 0.83 1.00 0.75 0.46 0.44 0.60 0.65 0.62 0.57 0.55
1.10 -0.06 0.08 0.13 0.15 0.34 0.75 1.00 0.89 0.87 0.87 0.70 0.58 0.47 0.38
1.20 -0.35 -0.16 -0.19 -0.17 -0.02 0.46 0.89 1.00 0.98 0.84 0.54 0.40 0.28 0.19
1.30 -0.33 -0.16 -0.18 -0.17 -0.01 0.44 0.87 0.98 1.00 0.91 0.63 0.49 0.38 0.26
1.40 -0.12 -0.01 0.04 0.09 0.23 0.60 0.87 0.84 0.91 1.00 0.89 0.78 0.66 0.53
1.50 0.12 0.13 0.25 0.35 0.44 0.65 0.70 0.54 0.63 0.89 1.00 0.97 0.89 0.79
1.60 0.19 0.15 0.28 0.40 0.47 0.62 0.58 0.40 0.49 0.78 0.97 1.00 0.97 0.91
1.70 0.25 0.17 0.31 0.41 0.49 0.57 0.47 0.28 0.38 0.66 0.89 0.97 1.00 0.97
1.80-2.00 0.28 0.18 0.33 0.44 0.50 0.55 0.38 0.19 0.26 0.53 0.79 0.91 0.97 1.00

16
TABLE VI. The total observable CCπ0 cross section as a function of neutrino energy (Fig. 8). Tabulated are the central value (CV), the total systematic error, thestatistical error, and the correlation matrix for the systematic error. The correlations for the statistical errors are small and not tabulated. The CV, total systematicerror, and statistical errors are multiplied by 1039. The bin boundaries are tabulated as the low edge of the bin with the last bin giving both the low and high edge.
Bin edge [GeV] 0.50 0.60 0.70 0.80 0.90 1.00 1.10 1.20 1.30 1.40 1.50 1.60 1.70 1.80-2.00
CV [×10−39 cm2] 1.76 3.83 5.68 7.31 9.20 11.06 12.42 13.89 15.23 16.38 18.20 19.37 20.80 21.92
Stat. ±0.18 ±0.23 ±0.26 ±0.29 ±0.34 ±0.41 ±0.49 ±0.60 ±0.74 ±0.92 ±1.24 ±1.62 ±2.16 ±2.24
Total Syst. ±0.49 ±0.78 ±0.97 ±1.17 ±1.50 ±1.85 ±2.16 ±2.46 ±2.82 ±3.17 ±3.61 ±4.15 ±4.49 ±5.26
0.50 1.00 0.93 0.80 0.74 0.71 0.77 0.74 0.68 0.63 0.59 0.50 0.50 0.49 0.54
0.60 0.93 1.00 0.96 0.90 0.88 0.86 0.81 0.79 0.72 0.68 0.62 0.56 0.59 0.59
0.70 0.80 0.96 1.00 0.98 0.96 0.92 0.85 0.86 0.79 0.75 0.73 0.64 0.68 0.65
0.80 0.74 0.90 0.98 1.00 0.99 0.96 0.91 0.91 0.87 0.84 0.81 0.75 0.77 0.74
0.90 0.71 0.88 0.96 0.99 1.00 0.97 0.93 0.94 0.89 0.86 0.85 0.77 0.80 0.75
1.00 0.77 0.86 0.92 0.96 0.97 1.00 0.99 0.98 0.95 0.92 0.89 0.85 0.86 0.83
1.10 0.74 0.81 0.85 0.91 0.93 0.99 1.00 0.99 0.97 0.96 0.91 0.91 0.90 0.89
1.20 0.68 0.79 0.86 0.91 0.94 0.98 0.99 1.00 0.99 0.97 0.95 0.91 0.92 0.89
1.30 0.63 0.72 0.79 0.87 0.89 0.95 0.97 0.99 1.00 0.99 0.97 0.96 0.95 0.94
1.40 0.59 0.68 0.75 0.84 0.86 0.92 0.96 0.97 0.99 1.00 0.98 0.98 0.97 0.96
1.50 0.50 0.62 0.73 0.81 0.85 0.89 0.91 0.95 0.97 0.98 1.00 0.97 0.97 0.94
1.60 0.50 0.56 0.64 0.75 0.77 0.85 0.91 0.91 0.96 0.98 0.97 1.00 0.97 0.98
1.70 0.49 0.59 0.68 0.77 0.80 0.86 0.90 0.92 0.95 0.97 0.97 0.97 1.00 0.97
1.80-2.00 0.54 0.59 0.65 0.74 0.75 0.83 0.89 0.89 0.94 0.96 0.94 0.98 0.97 1.00

17
TABLE VII. The flux-averaged observable CCπ0 differential cross section in Q2 over the flux range Eν ∈ (0.5 − 2.0 GeV) (Fig. 9). Tabulated are the central value(CV), the total systematic error, the statistical error, and the correlation matrix for the systematic error. The correlations for the statistical errors are small and nottabulated. The CV, total systematic error, and statistical errors are multiplied by 1039. The bin boundaries are tabulated as the low edge of the bin with the last bingiving both the low and high edge.
Bin edge [GeV2] 0.00 0.10 0.20 0.30 0.40 0.50 0.60 0.70 0.80 1.00 1.20 1.50-2.00
CV [×10−39 cm2/GeV2] 9.12 16.41 14.72 12.32 9.82 7.70 5.97 4.48 3.07 1.55 0.70 0.18
Stat. ±0.39 ±0.52 ±0.49 ±0.45 ±0.41 ±0.36 ±0.33 ±0.30 ±0.17 ±0.12 ±0.07 ±0.02
Total Syst. ±2.33 ±2.90 ±2.31 ±1.96 ±1.68 ±1.33 ±1.00 ±0.75 ±0.55 ±0.36 ±0.18 ±0.07
0.00 1.00 0.94 0.95 0.91 0.78 0.78 0.87 0.84 0.83 0.70 0.71 0.60
0.10 0.94 1.00 0.94 0.90 0.66 0.68 0.91 0.78 0.81 0.61 0.66 0.62
0.20 0.95 0.94 1.00 0.97 0.83 0.84 0.90 0.82 0.79 0.76 0.70 0.53
0.30 0.91 0.90 0.97 1.00 0.81 0.83 0.93 0.73 0.70 0.76 0.60 0.41
0.40 0.78 0.66 0.83 0.81 1.00 0.99 0.67 0.81 0.70 0.89 0.72 0.37
0.50 0.78 0.68 0.84 0.83 0.99 1.00 0.73 0.79 0.68 0.91 0.69 0.34
0.60 0.87 0.91 0.90 0.93 0.67 0.73 1.00 0.71 0.72 0.69 0.60 0.49
0.70 0.84 0.78 0.82 0.73 0.81 0.79 0.71 1.00 0.97 0.77 0.91 0.78
0.80 0.83 0.81 0.79 0.70 0.70 0.68 0.72 0.97 1.00 0.72 0.93 0.87
1.00 0.70 0.61 0.76 0.76 0.89 0.91 0.69 0.77 0.72 1.00 0.80 0.43
1.20 0.71 0.66 0.70 0.60 0.72 0.69 0.60 0.91 0.93 0.80 1.00 0.87
1.50-2.00 0.60 0.62 0.53 0.41 0.37 0.34 0.49 0.78 0.87 0.43 0.87 1.00

18
TABLE VIII. The flux-averaged observable CCπ0 differential cross section in Eµ over the flux range Eν ∈ (0.5− 2.0 GeV) in bins of Eµ −mµ (Fig. 10). Tabulated arethe central value (CV), the total systematic error, the statistical error, and the correlation matrix for the systematic error. The correlations for the statistical errorsare small and not tabulated. The CV, total systematic error, and statistical errors are multiplied by 1039. The bin boundaries are tabulated as the low edge of the binwith the last bin giving both the low and high edge.
Bin edge [GeV] 0.00 0.05 0.10 0.15 0.20 0.28 0.35 0.42 0.50 0.60 0.70 0.80 1.00-1.20
CV [×10−39 cm2/GeV] 10.31 15.60 17.00 16.58 15.33 13.57 11.38 9.76 6.97 5.82 4.03 2.55 1.38
Stat. ±0.96 ±1.03 ±0.75 ±0.63 ±0.48 ±0.47 ±0.45 ±0.43 ±0.32 ±0.32 ±0.28 ±0.19 ±0.21
Total Syst. ±1.83 ±2.52 ±2.73 ±3.00 ±2.52 ±2.21 ±1.91 ±1.60 ±1.38 ±1.12 ±0.76 ±0.58 ±0.36
0.00 1.00 0.50 0.75 0.70 0.66 0.82 0.75 0.65 0.76 0.89 0.62 0.31 0.34
0.05 0.50 1.00 0.87 0.83 0.88 0.78 0.80 0.85 0.67 0.57 0.86 0.78 0.56
0.10 0.75 0.87 1.00 0.93 0.91 0.92 0.92 0.90 0.85 0.82 0.87 0.67 0.51
0.15 0.70 0.83 0.93 1.00 0.83 0.90 0.87 0.90 0.91 0.81 0.90 0.61 0.42
0.20 0.66 0.88 0.91 0.83 1.00 0.91 0.93 0.90 0.75 0.77 0.87 0.84 0.70
0.28 0.82 0.78 0.92 0.90 0.91 1.00 0.95 0.91 0.91 0.92 0.88 0.66 0.58
0.35 0.75 0.80 0.92 0.87 0.93 0.95 1.00 0.93 0.85 0.87 0.88 0.75 0.65
0.42 0.65 0.85 0.90 0.90 0.90 0.91 0.93 1.00 0.89 0.78 0.92 0.79 0.57
0.50 0.76 0.67 0.85 0.91 0.75 0.91 0.85 0.89 1.00 0.89 0.84 0.53 0.38
0.60 0.89 0.57 0.82 0.81 0.77 0.92 0.87 0.78 0.89 1.00 0.78 0.47 0.45
0.70 0.62 0.86 0.87 0.90 0.87 0.88 0.88 0.92 0.84 0.78 1.00 0.77 0.55
0.80 0.31 0.78 0.67 0.61 0.84 0.66 0.75 0.79 0.53 0.47 0.77 1.00 0.72
1.00-1.20 0.34 0.56 0.51 0.42 0.70 0.58 0.65 0.57 0.38 0.45 0.55 0.72 1.00

19
TABLE IX. The flux-averaged observable CCπ0 differential cross section in cos θµ over the flux range Eν ∈ (0.5− 2.0 GeV) (Fig. 11). Tabulated are the central value(CV), the total systematic error, the statistical error, and the correlation matrix for the systematic error. The correlations for the statistical errors are small and nottabulated. The CV, total systematic error, and statistical errors are multiplied by 1039. The bin boundaries are tabulated as the low edge of the bin with the last bingiving both the low and high edge.
Bin edge -1.00 -0.60 -0.30 0.00 0.20 0.40 0.60 0.80 0.90-1.00
CV [×10−39 cm2] 1.01 1.55 2.46 3.60 4.65 6.58 10.32 13.11 11.51
Stat. ±0.08 ±0.11 ±0.13 ±0.18 ±0.19 ±0.23 ±0.28 ±0.47 ±0.46
Total Syst. ±0.25 ±0.32 ±0.40 ±0.54 ±0.76 ±1.22 ±1.59 ±2.29 ±2.92
-1.00 1.00 0.61 0.67 0.45 0.58 0.86 0.34 0.66 0.53
-0.60 0.61 1.00 0.84 0.63 0.87 0.77 0.70 0.84 0.71
-0.30 0.67 0.84 1.00 0.78 0.90 0.83 0.80 0.92 0.83
0.00 0.45 0.63 0.78 1.00 0.76 0.64 0.90 0.80 0.87
0.20 0.58 0.87 0.90 0.76 1.00 0.79 0.84 0.92 0.84
0.40 0.86 0.77 0.83 0.64 0.79 1.00 0.60 0.87 0.76
0.60 0.34 0.70 0.80 0.90 0.84 0.60 1.00 0.84 0.92
0.80 0.66 0.84 0.92 0.80 0.92 0.87 0.84 1.00 0.92
0.90-1.00 0.53 0.71 0.83 0.87 0.84 0.76 0.92 0.92 1.00

20
TABLE X. The flux-averaged observable CCπ0 differential cross section in |pπ0 | over the flux range Eν ∈ (0.5 − 2.0 GeV) (Fig. 12). Tabulated are the central value(CV), the total systematic error, the statistical error, and the correlation matrix for the systematic error. The correlations for the statistical errors are small and nottabulated. The CV, total systematic error, and statistical errors are multiplied by 1039. The bin boundaries are tabulated as the low edge of the bin with the last bingiving both the low and high edge.
Bin edge [GeV/c] 0.00 0.10 0.15 0.20 0.25 0.30 0.40 0.50 0.60 0.80 1.00-1.40
CV [×1039 cm2/GeV/c] 4.92 26.65 32.90 28.99 19.02 13.65 7.41 4.27 1.90 0.87 0.19
Stat. ±0.37 ±1.10 ±1.05 ±0.87 ±0.61 ±0.37 ±0.31 ±0.33 ±0.25 ±0.35 ±0.21
Total Syst. ±1.34 ±4.94 ±5.00 ±4.31 ±3.09 ±2.49 ±2.01 ±1.14 ±0.63 ±0.40 ±0.79
0.00 1.00 0.74 0.83 0.52 0.82 0.79 0.47 0.25 0.26 0.44 0.02
0.10 0.74 1.00 0.92 0.74 0.90 0.70 0.30 0.51 0.58 0.26 -0.41
0.15 0.83 0.92 1.00 0.85 0.97 0.88 0.56 0.59 0.57 0.36 -0.14
0.20 0.52 0.74 0.85 1.00 0.82 0.84 0.73 0.84 0.72 0.26 0.05
0.25 0.82 0.90 0.97 0.82 1.00 0.90 0.55 0.61 0.63 0.38 -0.16
0.30 0.79 0.70 0.88 0.84 0.90 1.00 0.84 0.69 0.57 0.48 0.24
0.40 0.47 0.30 0.56 0.73 0.55 0.84 1.00 0.72 0.46 0.44 0.63
0.50 0.25 0.51 0.59 0.84 0.61 0.69 0.72 1.00 0.89 0.35 0.08
0.60 0.26 0.58 0.57 0.72 0.63 0.57 0.46 0.89 1.00 0.39 -0.19
0.80 0.44 0.26 0.36 0.26 0.38 0.48 0.44 0.35 0.39 1.00 0.24
1.00-1.40 0.02 -0.41 -0.14 0.05 -0.16 0.24 0.63 0.08 -0.19 0.24 1.00

21
TABLE XI. The flux-averaged observable CCπ0 differential cross section in cos θπ0 over the flux range Eν ∈ (0.5− 2.0 GeV) (Fig. 13). Tabulated are the central value(CV), the total systematic error, the statistical error, and the correlation matrix for the systematic error. The correlations for the statistical errors are small and nottabulated. The CV, total systematic error, and statistical errors are multiplied by 1039. The bin boundaries are tabulated as the low edge of the bin with the last bingiving both the low and high edge.
Bin edge -1.00 -0.70 -0.40 -0.20 -0.10 0.00 0.10 0.20 0.30 0.40 0.50 0.60 0.70 0.80 0.90-1.00
CV [×10−39 cm2] 2.34 2.45 2.83 2.76 2.77 3.06 3.55 4.01 4.57 5.47 6.44 7.66 9.14 11.36 14.59
Stat. ±0.16 ±0.12 ±0.14 ±0.18 ±0.17 ±0.18 ±0.19 ±0.21 ±0.22 ±0.26 ±0.29 ±0.33 ±0.39 ±0.49 ±0.66
Total Syst. ±0.44 ±0.45 ±0.50 ±0.46 ±0.49 ±0.59 ±0.60 ±0.69 ±0.76 ±0.95 ±1.05 ±1.26 ±1.48 ±2.08 ±2.83
-1.00 1.00 0.87 0.78 0.78 0.84 0.62 0.85 0.84 0.78 0.85 0.81 0.86 0.80 0.63 0.81
-0.70 0.87 1.00 0.70 0.78 0.87 0.63 0.91 0.81 0.71 0.92 0.86 0.88 0.80 0.60 0.88
-0.40 0.78 0.70 1.00 0.67 0.69 0.48 0.76 0.93 0.86 0.71 0.70 0.80 0.80 0.60 0.68
-0.20 0.78 0.78 0.67 1.00 0.96 0.92 0.90 0.75 0.82 0.84 0.93 0.89 0.90 0.90 0.84
-0.10 0.84 0.87 0.69 0.96 1.00 0.88 0.95 0.80 0.82 0.91 0.94 0.91 0.89 0.82 0.90
0.00 0.62 0.63 0.48 0.92 0.88 1.00 0.80 0.59 0.75 0.72 0.87 0.77 0.81 0.90 0.75
0.10 0.85 0.91 0.76 0.90 0.95 0.80 1.00 0.89 0.84 0.95 0.93 0.94 0.91 0.77 0.93
0.20 0.84 0.81 0.93 0.75 0.80 0.59 0.89 1.00 0.92 0.85 0.83 0.88 0.87 0.68 0.82
0.30 0.78 0.71 0.86 0.82 0.82 0.75 0.84 0.92 1.00 0.80 0.86 0.87 0.90 0.83 0.80
0.40 0.85 0.92 0.71 0.84 0.91 0.72 0.95 0.85 0.80 1.00 0.92 0.92 0.87 0.71 0.95
0.50 0.81 0.86 0.70 0.93 0.94 0.87 0.93 0.83 0.86 0.92 1.00 0.95 0.93 0.88 0.92
0.60 0.86 0.88 0.80 0.89 0.91 0.77 0.94 0.88 0.87 0.92 0.95 1.00 0.95 0.81 0.93
0.70 0.80 0.80 0.80 0.90 0.89 0.81 0.91 0.87 0.90 0.87 0.93 0.95 1.00 0.88 0.90
0.80 0.63 0.60 0.60 0.90 0.82 0.90 0.77 0.68 0.83 0.71 0.88 0.81 0.88 1.00 0.77
0.90-1.00 0.81 0.88 0.68 0.84 0.90 0.75 0.93 0.82 0.80 0.95 0.92 0.93 0.90 0.77 1.00