La fragmentation des frontières nationales et l'assemblage ...
arX
iv:h
ep-e
x/99
0305
6v2
6 J
un 1
999
DESY–99–041
Measurement of multiplicity and momentum
spectra in the current and target regions
of the Breit frame in Deep Inelastic Scattering
at HERA
ZEUS Collaboration
Abstract
Charged particle production in neutral current deep inelastic scattering (DIS) hasbeen studied using the ZEUS detector. The evolution of the mean multiplicities,scaled momenta and transverse momenta in Q2 and x for 10 < Q2 < 5120 GeV2
and x > 6 × 10⁻⁴ has been investigated in the current and target fragmentationregions of the Breit frame. Distributions in the target region, using HERA datafor the first time, are compared to distributions in the current region. Predictionsbased on MLLA and LPHD are inconsistent with the data.
The ZEUS Collaboration
J. Breitweg, S. Chekanov, M. Derrick, D. Krakauer, S. Magill, B. Musgrave, J. Repond,R. Stanek, R. YoshidaArgonne National Laboratory, Argonne, IL, USA p
M.C.K. MattinglyAndrews University, Berrien Springs, MI, USA
G. Abbiendi, F. Anselmo, P. Antonioli, G. Bari, M. Basile, L. Bellagamba, D. Boscherini,A. Bruni, G. Bruni, G. Cara Romeo, G. Castellini1, L. Cifarelli2, F. Cindolo, A. Contin,N. Coppola, M. Corradi, S. De Pasquale, P. Giusti, G. Iacobucci3, G. Laurenti, G. Levi,A. Margotti, T. Massam, R. Nania, F. Palmonari, A. Pesci, A. Polini, G. Sartorelli,Y. Zamora Garcia4, A. ZichichiUniversity and INFN Bologna, Bologna, Italy f
C. Amelung, A. Bornheim, I. Brock, K. Coboken, J. Crittenden, R. Deffner, M. Eckert5,H. Hartmann, K. Heinloth, L. Heinz6, E. Hilger, H.-P. Jakob, A. Kappes, U.F. Katz,R. Kerger, E. Paul, M. Pfeiffer7, J. Rautenberg, H. Schnurbusch, A. Stifutkin, J. Tandler,A. Weber, H. WieberPhysikalisches Institut der Universitat Bonn, Bonn, Germany c
D.S. Bailey, O. Barret, W.N. Cottingham, B. Foster8, G.P. Heath, H.F. Heath,J.D. McFall, D. Piccioni, J. Scott, R.J. TapperH.H. Wills Physics Laboratory, University of Bristol, Bristol, U.K. o
M. Capua, A. Mastroberardino, M. Schioppa, G. SusinnoCalabria University, Physics Dept.and INFN, Cosenza, Italy f
H.Y. Jeoung, J.Y. Kim, J.H. Lee, I.T. Lim, K.J. Ma, M.Y. Pac9
Chonnam National University, Kwangju, Korea h
A. Caldwell, N. Cartiglia, Z. Jing, W. Liu, B. Mellado, J.A. Parsons, S. Ritz10, R. Sacchi,S. Sampson, F. Sciulli, Q. Zhu11
Columbia University, Nevis Labs., Irvington on Hudson, N.Y., USA q
P. Borzemski, J. Chwastowski, A. Eskreys, J. Figiel, K. Klimek, K. Olkiewicz,M.B. Przybycien, L. ZawiejskiInst. of Nuclear Physics, Cracow, Poland j
L. Adamczyk12, B. Bednarek, K. Jelen, D. Kisielewska, A.M. Kowal, T. Kowalski,M. Przybycien, E. Rulikowska-Zarebska, L. Suszycki, J. ZajacFaculty of Physics and Nuclear Techniques, Academy of Mining and Metallurgy, Cracow,
Poland j
Z. Dulinski, A. KotanskiJagellonian Univ., Dept. of Physics, Cracow, Poland k
L.A.T. Bauerdick, U. Behrens, H. Beier13, J.K. Bienlein, C. Burgard, K. Desler, G. Drews,A. Fox-Murphy, U. Fricke, F. Goebel, P. Gottlicher, R. Graciani, T. Haas, W. Hain,G.F. Hartner, D. Hasell14, K. Hebbel, K.F. Johnson15, M. Kasemann16, W. Koch,U. Kotz, H. Kowalski, L. Lindemann, B. Lohr, M. Martınez, J. Milewski17, M. Milite,T. Monteiro18, M. Moritz, D. Notz, A. Pellegrino, F. Pelucchi, K. Piotrzkowski,M. Rohde, P.R.B. Saull, A.A. Savin, U. Schneekloth, O. Schwarzer19, F. Selonke,M. Sievers, S. Stonjek, E. Tassi, D. Westphal20, G. Wolf, U. Wollmer, C. Youngman,W. ZeunerDeutsches Elektronen-Synchrotron DESY, Hamburg, Germany
I
B.D. Burow21, C. Coldewey, H.J. Grabosch, A. Lopez-Duran Viani, A. Meyer, K. Monig,S. Schlenstedt, P.B. StraubDESY Zeuthen, Zeuthen, Germany
G. Barbagli, E. Gallo, P. PelferUniversity and INFN, Florence, Italy f
G. Maccarrone, L. VotanoINFN, Laboratori Nazionali di Frascati, Frascati, Italy f
A. Bamberger, S. Eisenhardt22, P. Markun, H. Raach, S. WolfleFakultat fur Physik der Universitat Freiburg i.Br., Freiburg i.Br., Germany c
J.T. Bromley, N.H. Brook23, P.J. Bussey, A.T. Doyle, S.W. Lee, N. Macdonald,G.J. McCance, D.H. Saxon, L.E. Sinclair, I.O. Skillicorn, E. Strickland, R. WaughDept. of Physics and Astronomy, University of Glasgow, Glasgow, U.K. o
I. Bohnet, N. Gendner, U. Holm, A. Meyer-Larsen, H. Salehi, K. WickHamburg University, I. Institute of Exp. Physics, Hamburg, Germany c
A. Garfagnini, I. Gialas24, L.K. Gladilin25, D. Kcira26, R. Klanner, E. Lohrmann,G. Poelz, F. ZetscheHamburg University, II. Institute of Exp. Physics, Hamburg, Germany c
T.C. Bacon, J.E. Cole, G. Howell, L. Lamberti27, K.R. Long, D.B. Miller, A. Prinias28,J.K. Sedgbeer, D. Sideris, A.D. Tapper, R. WalkerImperial College London, High Energy Nuclear Physics Group, London, U.K. o
U. Mallik, S.M. WangUniversity of Iowa, Physics and Astronomy Dept., Iowa City, USA p
P. Cloth, D. FilgesForschungszentrum Julich, Institut fur Kernphysik, Julich, Germany
T. Ishii, M. Kuze, I. Suzuki29, K. Tokushuku30, S. Yamada, K. Yamauchi, Y. YamazakiInstitute of Particle and Nuclear Studies, KEK, Tsukuba, Japan g
S.H. Ahn, S.H. An, S.J. Hong, S.B. Lee, S.W. Nam31, S.K. ParkKorea University, Seoul, Korea h
H. Lim, I.H. Park, D. SonKyungpook National University, Taegu, Korea h
F. Barreiro, J.P. Fernandez, G. Garcıa, C. Glasman32, J.M. Hernandez33, L. Labarga,J. del Peso, J. Puga, I. Redondo34, J. TerronUniver. Autonoma Madrid, Depto de Fısica Teorica, Madrid, Spain n
F. Corriveau, D.S. Hanna, J. Hartmann35, W.N. Murray5, A. Ochs, S. Padhi,M. Riveline, D.G. Stairs, M. St-Laurent, M. WingMcGill University, Dept. of Physics, Montreal, Quebec, Canada a, b
T. TsurugaiMeiji Gakuin University, Faculty of General Education, Yokohama, Japan
V. Bashkirov36, B.A. DolgosheinMoscow Engineering Physics Institute, Moscow, Russia l
G.L. Bashindzhagyan, P.F. Ermolov, Yu.A. Golubkov, L.A. Khein, N.A. Korotkova,I.A. Korzhavina, V.A. Kuzmin, O.Yu. Lukina, A.S. Proskuryakov, L.M. Shcheglova37,A.N. Solomin37, S.A. ZotkinMoscow State University, Institute of Nuclear Physics, Moscow, Russia m
II
C. Bokel, M. Botje, N. Brummer, J. Engelen, E. Koffeman, P. Kooijman, A. van Sighem,H. Tiecke, N. Tuning, J.J. Velthuis, W. Verkerke, J. Vossebeld, L. Wiggers, E. de WolfNIKHEF and University of Amsterdam, Amsterdam, Netherlands i
D. Acosta38, B. Bylsma, L.S. Durkin, J. Gilmore, C.M. Ginsburg, C.L. Kim, T.Y. Ling,P. NylanderOhio State University, Physics Department, Columbus, Ohio, USA p
H.E. Blaikley, R.J. Cashmore18, A.M. Cooper-Sarkar, R.C.E. Devenish, J.K. Edmonds,J. Große-Knetter39, N. Harnew, T. Matsushita, V.A. Noyes40, A. Quadt18, O. Ruske,M.R. Sutton, R. Walczak, D.S. WatersDepartment of Physics, University of Oxford, Oxford, U.K. o
A. Bertolin, R. Brugnera, R. Carlin, F. Dal Corso, U. Dosselli, S. Dusini, S. Limentani,M. Morandin, M. Posocco, L. Stanco, R. Stroili, C. VociDipartimento di Fisica dell’ Universita and INFN, Padova, Italy f
L. Iannotti41, B.Y. Oh, J.R. Okrasinski, W.S. Toothacker, J.J. WhitmorePennsylvania State University, Dept. of Physics, University Park, PA, USA q
Y. IgaPolytechnic University, Sagamihara, Japan g
G. D’Agostini, G. Marini, A. Nigro, M. RasoDipartimento di Fisica, Univ. ’La Sapienza’ and INFN, Rome, Italy f
C. Cormack, J.C. Hart, N.A. McCubbin, T.P. ShahRutherford Appleton Laboratory, Chilton, Didcot, Oxon, U.K. o
D. Epperson, C. Heusch, H.F.-W. Sadrozinski, A. Seiden, R. Wichmann, D.C. WilliamsUniversity of California, Santa Cruz, CA, USA p
N. PavelFachbereich Physik der Universitat-Gesamthochschule Siegen, Germany c
H. Abramowicz42, S. Dagan43, S. Kananov43, A. Kreisel, A. Levy43, A. SchechterRaymond and Beverly Sackler Faculty of Exact Sciences, School of Physics, Tel-Aviv
University,
Tel-Aviv, Israel e
T. Abe, T. Fusayasu, M. Inuzuka, K. Nagano, K. Umemori, T. YamashitaDepartment of Physics, University of Tokyo, Tokyo, Japan g
R. Hamatsu, T. Hirose, K. Homma44, S. Kitamura45, T. NishimuraTokyo Metropolitan University, Dept. of Physics, Tokyo, Japan g
M. Arneodo46, R. Cirio, M. Costa, M.I. Ferrero, S. Maselli, V. Monaco, C. Peroni,M.C. Petrucci, M. Ruspa, A. Solano, A. StaianoUniversita di Torino, Dipartimento di Fisica Sperimentale and INFN, Torino, Italy f
M. DardoII Faculty of Sciences, Torino University and INFN - Alessandria, Italy f
D.C. Bailey, C.-P. Fagerstroem, R. Galea, T. Koop, G.M. Levman, J.F. Martin, R.S. Orr,S. Polenz, A. Sabetfakhri, D. SimmonsUniversity of Toronto, Dept. of Physics, Toronto, Ont., Canada a
J.M. Butterworth, C.D. Catterall, M.E. Hayes, E.A. Heaphy, T.W. Jones, J.B. LaneUniversity College London, Physics and Astronomy Dept., London, U.K. o
J. Ciborowski, G. Grzelak47, R.J. Nowak, J.M. Pawlak, R. Pawlak, B. Smalska,T. Tymieniecka, A.K. Wroblewski, J.A. Zakrzewski, A.F. ZarneckiWarsaw University, Institute of Experimental Physics, Warsaw, Poland j
III
M. Adamus, T. GadajInstitute for Nuclear Studies, Warsaw, Poland j
O. Deppe, Y. Eisenberg43, D. Hochman, U. Karshon43
Weizmann Institute, Department of Particle Physics, Rehovot, Israel d
W.F. Badgett, D. Chapin, R. Cross, C. Foudas, S. Mattingly, D.D. Reeder, W.H. Smith,A. Vaiciulis48, T. Wildschek, M. WodarczykUniversity of Wisconsin, Dept. of Physics, Madison, WI, USA p
A. Deshpande, S. Dhawan, V.W. HughesYale University, Department of Physics, New Haven, CT, USA p
S. Bhadra, W.R. Frisken, R. Hall-Wilton, M. Khakzad, S. Menary, W.B. SchmidkeYork University, Dept. of Physics, Toronto, Ont., Canada a
IV
1 also at IROE Florence, Italy2 now at Univ. of Salerno and INFN Napoli, Italy3 also at DESY4 supported by Worldlab, Lausanne, Switzerland5 now a self-employed consultant6 now at Spectral Design GmbH, Bremen7 now at EDS Electronic Data Systems GmbH, Troisdorf, Germany8 also at University of Hamburg, Alexander von Humboldt Research Award9 now at Dongshin University, Naju, Korea
10 now at NASA Goddard Space Flight Center, Greenbelt, MD 20771, USA11 now at Greenway Trading LLC12 supported by the Polish State Committee for Scientific Research, grant No. 2P03B1491213 now at Innosoft, Munich, Germany14 now at Massachusetts Institute of Technology, Cambridge, MA, USA15 visitor from Florida State University16 now at Fermilab, Batavia, IL, USA17 now at ATM, Warsaw, Poland18 now at CERN19 now at ESG, Munich20 now at Bayer A.G., Leverkusen, Germany21 now an independent researcher in computing22 now at University of Edinburgh, Edinburgh, U.K.23 PPARC Advanced fellow24 visitor of Univ. of Crete, Greece, partially supported by DAAD, Bonn - Kz. A/98/1676425 on leave from MSU, supported by the GIF, contract I-0444-176.07/9526 supported by DAAD, Bonn - Kz. A/98/1271227 supported by an EC fellowship28 PPARC Post-doctoral fellow29 now at Osaka Univ., Osaka, Japan30 also at University of Tokyo31 now at Wayne State University, Detroit32 supported by an EC fellowship number ERBFMBICT 97252333 now at HERA-B/DESY supported by an EC fellowship No.ERBFMBICT 98298134 supported by the Comunidad Autonoma de Madrid35 now at debis Systemhaus, Bonn, Germany36 now at Loma Linda University, Loma Linda, CA, USA37 partially supported by the Foundation for German-Russian Collaboration DFG-RFBR
(grant no. 436 RUS 113/248/3 and no. 436 RUS 113/248/2)38 now at University of Florida, Gainesville, FL, USA39 supported by the Feodor Lynen Program of the Alexander von Humboldt foundation40 now with Physics World, Dirac House, Bristol, U.K.41 partly supported by Tel Aviv University42 an Alexander von Humboldt Fellow at University of Hamburg43 supported by a MINERVA Fellowship44 now at ICEPP, Univ. of Tokyo, Tokyo, Japan45 present address: Tokyo Metropolitan University of Health Sciences, Tokyo 116-8551,Japan
V
46 now also at Universita del Piemonte Orientale, Dipartimento di Scienze Mediche,via Solaroli 17, I-28100 Novara, Italy
47 supported by the Polish State Committee for Scientific Research, grant No. 2P03B0930848 now at University of Rochester, Rochester, NY, USA
VI

a supported by the Natural Sciences and Engineering Research Council of Canada(NSERC)
b supported by the FCAR of Quebec, Canadac supported by the German Federal Ministry for Education and Science, Research and
Technology (BMBF), under contract numbers 057BN19P, 057FR19P, 057HH19P,057HH29P, 057SI75I
d supported by the MINERVA Gesellschaft fur Forschung GmbH, the German IsraeliFoundation, and by the Israel Ministry of Science
e supported by the German-Israeli Foundation, the Israel Science Foundation, theU.S.-Israel Binational Science Foundation, and by the Israel Ministry of Science
f supported by the Italian National Institute for Nuclear Physics (INFN)g supported by the Japanese Ministry of Education, Science and Culture (the Mon-
busho) and its grants for Scientific Researchh supported by the Korean Ministry of Education and Korea Science and Engineering
Foundationi supported by the Netherlands Foundation for Research on Matter (FOM)j supported by the Polish State Committee for Scientific Research, grant No. 115/E-
343/SPUB/P03/154/98, 2P03B03216, 2P03B04616, 2P03B10412, 2P03B05315, andby the German Federal Ministry of Education and Science, Research and Technology(BMBF)
k supported by the Polish State Committee for Scientific Research (grant No.2P03B08614 and 2P03B06116)
l partially supported by the German Federal Ministry for Education and Science,Research and Technology (BMBF)
m supported by the Fund for Fundamental Research of Russian Ministry for Scienceand Education and by the German Federal Ministry for Education and Science,Research and Technology (BMBF)
n supported by the Spanish Ministry of Education and Science through funds providedby CICYT
o supported by the Particle Physics and Astronomy Research Councilp supported by the US Department of Energyq supported by the US National Science Foundation
VII
1 Introduction
This paper reports the results of a study of the properties of the hadronic final statein neutral current positron-proton deep inelastic scattering (DIS). The fragmentation ofthe struck quark in DIS is compared to that of the quarks produced in e+e− annihila-tion, allowing the concept of universality of fragmentation in different processes to betested. A comparison is also made of the fragmentation associated with the outgoingstruck quark to that in the target region; the latter is associated with the initial stateradiation from the incoming proton. The data are compared to analytical QuantumChromodynamic (QCD) predictions for the momenta spectra for both the current andtarget region.The event kinematics of DIS are determined by the negative square of the four-momentumof the virtual exchanged boson, Q2 ≡ −q2, and the Bjorken scaling variable, x =Q2/2P ·q, where P is the four-momentum of the proton. In the Quark Parton Model(QPM), the interacting quark from the proton carries four-momentum xP. The variabley, the fractional energy transfer to the proton in its rest frame, is related to x andQ2 by y ≈ Q2/xs, where
√s is the positron-proton centre of mass energy. The invari-
ant mass, W , of the hadronic system is related to x,Q2 and the proton mass, mp, byW 2 = Q2(1 − x)/x + m2
p. At fixed Q2, the W 2 behaviour reflects the x dependence.A natural frame in which to study the dynamics of the hadronic final state in DIS is theBreit frame [1]. In this frame, the exchanged virtual boson (γ∗) is completely space-likeand has a four-momentum q = (0, 0, 0,−Q = −2xPBreit) ≡ (E, px, py, pz), wherePBreit is the momentum of the proton in the Breit frame. The particles produced in theinteraction can be assigned to one of two regions: the current region if their z-momentumin the Breit frame is negative, and the target region if their z-momentum is positive (seeFig. 1). The main advantage of this frame is that it gives a maximal separation of theincoming and outgoing partons in the QPM. In this model the maximum momentum aparticle can have in the current region is Q/2, while in the target region the maximumis Q(1 − x)/2x. In the Breit frame, unlike the hadronic centre of mass (γ∗p) frame, thetwo regions are asymmetric, particularly at low x, where the target region occupies mostof the available phase space.The measurements presented here extend the previous studies of fragmentation in theBreit frame performed at HERA [2–4]. Increased statistics coming from an integratedluminosity of 38 pb−1 lead to a significant improvement in the precision of the scaledmomentum distributions of the charged particles in the current fragmentation region.A subset of data, corresponding to 6.4 pb−1, has also been used to measure a smallpart of the target fragmentation region (the dark shaded region indicated in Fig. 1);the study of the target region is limited by acceptance and systematic effects ratherthan by statistics. The scaled and the transverse momentum distributions of chargedparticles in the hadronic final state are measured in the current and target regionsof the Breit frame as a function of x and Q2 in the ranges 10 < Q2 < 5120 GeV2
and x > 6 × 10⁻⁴. Comparisons are made with Monte Carlo models, QCD analyticalcalculations and e+e− data.
1
2 QCD Models
The current region in the ep Breit frame is analogous to a single hemisphere of e+e−
annihilation. In e+e− → qq annihilation the two quarks are produced with equal andopposite momenta, ±√
see/2. The fragmentation of these quarks can be compared to thatof the quark struck from the proton; this quark has an outgoing momentum −Q/2 in theBreit frame. In the direction of this struck quark the scaled momentum spectra of theparticles, expressed in terms of xp = 2pBreit/Q, are expected [5–7] to have a dependenceon Q similar to that observed in e+e− annihilation at energy
√see = Q, with no x
dependence. The effects of higher order processes not present in e+e− annihilation arediscussed in Ref. [8].Results from e+e− annihilation support the need for coherence effects in perturbativeQCD [9–13]. The phenomenon of coherence is a natural consequence of the quantummechanical treatment of the parton cascade. Long wavelength gluons are unable toresolve individual colour charges of partons within the parton cascade. This has theeffect that the available phase space for soft gluon emissions is reduced to an angular-ordered region, due to destructive interference. This leads to a number of importantdifferences in the properties of the partonic final state relative to the incoherent case.The most notable of these are a slower rise in the multiplicity of partons with increasinginitial parton energy, and the modification of the parton logarithmic momentum spectrato a skewed Gaussian form, often referred to as the “hump-backed” plateau [12]. Theparton level predictions in practice depend on two free parameters, a running strongcoupling, governed by a QCD scale Λ, and an energy cut-off, Q0, below which theparton evolution is truncated. In this case Λ is an effective scale parameter and is notto be identified with the standard QCD scale, e.g. ΛMS. In particular, predictions canbe made at Q0 = Λ yielding the so-called limiting spectrum.Within the framework of the modified leading log approximation (MLLA) there arepredictions of how the higher order moments of the parton momentum spectra shouldevolve with the energy scale [14, 15]. The MLLA calculations are made at the partonlevel. The hypothesis of local parton hadron duality (LPHD) [16], which relates theobserved hadron distributions to the calculated parton distributions via a constant ofproportionality, is used in conjunction with the parton predictions of the MLLA toallow the calculation to be directly compared to data. There is uncertainty about theenergy scale at which the applicability of LPHD breaks down, in which case the partonpredictions cannot be compared to the hadron distributions.DIS at low x allows a study of fragmentation in the target region following the initialscattering off a sea quark (or antiquark). The description based on MLLA [17] is shownschematically in Fig. 2, where the quark box at the top of the gluon ladder represents thescattered sea quark plus its antiquark partner. There are various contributions to thesecalculations. Contribution C, the top leg of the quark box, corresponds to fragmentationin the current region. Three further contributions (T1, T2 and T3), which are sourcesof soft gluons, are considered in these analytical calculations to be associated with thetarget region. It is predicted [17] that the contribution T1 behaves in the same way asthe current quark C and so should have no x dependence. The contribution T2 is dueto the colour field between the remnant and the struck quark, and the contribution T3corresponds to the fragmentation of the rungs in the gluon ladder. Both T2 and T3 arepredicted to have x and Q2 dependences which differ from T1. Both the T1 and T2
2

contributions have been calculated and give particles of momenta < Q/2. The collineargluons T3, on the other hand, generally fragment to particles with momentum >∼Q/2. Forvalues of the scaled momentum xp < 1.0, the region of phase space is analogous to thecurrent region and has contributions mainly from T1 and T2. The parton momentumspectra predicted by MLLA, over a range of Q2 and x, are shown in more detail inRef. [6]. In the target region these spectra are approximately Gaussian for xp < 1; theypeak at a value of xp ∼ 0.1−0.2 in the range of x and Q2 measured in this paper, fallingto a plateau region for 1 < xp < (1 − x)/x (the maximum value of xp in the targetregion). The acceptance of the ZEUS detector allows the study of the contributionsfrom C, from T1 and from T2.Scaling violations are predicted in the fragmentation functions, which represent theprobability for a parton to fragment into a particular hadron carrying a given fractionof the parton’s energy. Fragmentation functions incorporate the long-distance non-perturbative physics of the hadronisation process in which the observed hadrons areformed from final state partons of the hard scattering process. Like parton densities,they cannot be calculated in perturbative QCD but can be evolved with the hard-process scale, using the DGLAP evolution [18] equations, from a starting distribution ata defined energy scale; this starting distribution can be derived from a fit to data. If thefragmentation functions are combined with the cross sections for the inclusive productionof each parton type in the given physical process, predictions can be made for scalingviolations, expressed as the Q2 evolution of the xp spectra of final state hadrons [19].These scaling violations allow a measurement of the strong coupling constant, αs, andsuch studies have been performed at LEP [20,21] by incorporating lower energy PETRAdata. The NLO calculations (CYCLOPS) [22] of the scaled momentum distribution existfor DIS but as yet the appropriate fragmentation functions at different values of Λ
MS
do not exist to allow the extraction of αs from DIS data.
3 Experimental Setup
The data presented here were taken at the positron-proton collider HERA using theZEUS detector. The 38 pb−1 of data corresponds to data taken in 1994-1996 and partof the 1997 data sample. The 1995 data alone, corresponding to 6.4 pb−1, was used to in-vestigate the target region. During the period 1994-1997 HERA operated with positronsof energy Ee = 27.5 GeV and protons with energy 820 GeV. The ZEUS detector is amultipurpose detector. Of particular importance in this analysis are the central trackingdetector (CTD) and the uranium-scintillator calorimeter (CAL). A detailed descriptionof the ZEUS detector can be found in [23,24].Throughout this paper we use the standard ZEUS right-handed coordinate system, inwhich X = Y = Z = 0 is the nominal interaction point, the positive Z-axis points inthe direction of the proton beam (referred to as the forward direction) and the X-axisis horizontal, pointing towards the centre of HERA.The tracking system consists of a central tracking chamber (CTD) [25] in a 1.43 Tsolenoidal magnetic field. The CTD, which surrounds the beampipe, is a drift chamberconsisting of 72 cylindrical layers, arranged in 9 superlayers. Superlayers with wiresparallel to the beam axis alternate with those inclined at a small angle to give a stereoview. The single hit efficiency of the CTD is greater than 95%. The resolution of
3
the transverse momentum, pt(lab), in the laboratory frame for full-length tracks canbe parametrised as σ(pt(lab))/pt(lab) = 0.0058pt(lab) ⊕ 0.0065 ⊕ 0.0014/pt(lab), withpt(lab) in GeV. (This form is a more precise description of the transverse momentumresolution, particularly at low to medium pt(lab), than that given hitherto).Surrounding the solenoid is the uranium-scintillator calorimeter (CAL) [26], which isdivided into three parts: forward, barrel and rear covering the polar regions 2.6◦ to36.7◦, 36.7◦ to 129.1◦ and 129.1◦ to 176.2◦, respectively. The CAL covers 99.7% of thesolid angle, with holes in the centres of the forward and rear calorimeters to accom-modate the HERA beampipe. Each of the calorimeter parts is subdivided into towerswhich are segmented longitudinally into electromagnetic (EMC) and hadronic (HAC)sections. These sections are further subdivided into cells each of which is read out bytwo photomultipliers. From test beam data, energy resolutions of σE/E = 0.18/
√E for
electrons and σE/E = 0.35/√
E for hadrons (E in GeV) have been obtained.The ZEUS detector is almost hermetic, allowing the kinematic variables x and Q2 tobe reconstructed in a variety of ways using combinations of energies and angles of thepositron and hadronic system. Variables calculated only from the measurements ofthe energy, E′
e, and angle, θe, of the scattered positron are denoted with the subscripte, whilst those calculated from the hadronic system measurements, with the JacquetBlondel method [27], are denoted by the subscript JB. Variables calculated by theseapproaches are used only in the event selection. In the double angle method [28], denotedby DA, the kinematic variables are determined using θe and the angle γH (which is thedirection of the struck quark in the QPM), defined from the hadronic final state.The DA method was used throughout this analysis for the calculation of the boostsand the kinematic variables because it is less sensitive to systematic uncertainties in theenergy measurement than other methods.The triggering and online event selections were identical to those used for the measure-ment of the structure function F2 [29]. The reconstructed tracks used in the charged par-ticle analyses are associated with the primary event vertex and have pt(lab) > 150 MeVand |η(lab)| < 1.75, where η(lab) is the pseudorapidity given by − ln(tan(θ/2)) withθ being the polar angle of the measured track with respect to the proton direction inthe lab. frame. This is the region of CTD acceptance where the detector response andsystematics are best understood.Further selection criteria were applied both to ensure accurate reconstruction of thekinematic variables and to increase the purity of the sample by eliminating backgroundfrom photoproduction processes:
• E′
e ≥ 10 GeV, to achieve a high purity sample of DIS events;
• Q2DA ≥ 10 GeV2, to further enhance the purity of the DIS sample;
• ye ≤ 0.95, to reduce the photoproduction background;
• yJB ≥ 0.04, to give sufficient accuracy for DA reconstruction of Q2 and x;
• 35 ≤ δ =∑
(E − pZ) ≤ 60 GeV where the summation is over all calorimeter cells,to remove photoproduction events and events with large radiative corrections;
• |X| > 16 cm or |Y | > 16 cm, where X and Y are the impact position of thepositron on the CAL, to avoid the region directly adjacent to the rear beampipe;
4
• −40 < Zvertex < 50 cm, to reduce background events from non-ep collisions.
The (x,Q2) bins are listed in Table 1. The sizes of the bins were chosen to give goodstatistics in each bin and to limit the migrations between bins [2]. There is negligiblebackground from non-DIS events.
4 Event Simulation
Monte Carlo event simulation is used to correct for acceptance and resolution effects.The detector simulation is based on the GEANT 3.13 [30] program and incorporatesour best knowledge of the apparatus.To calculate the correction factors, neutral current DIS events were generated, via theDJANGO 6.24 program [31], using HERACLES 4.5.2 [32] which incorporates first orderelectroweak corrections. The QCD cascade was modelled with the colour dipole model,including the boson-gluon fusion process, using the ARIADNE 4.08 [33] program. In thismodel coherence effects are implicitly included in the formalism of the parton cascade.The colour dipole model treats gluons emitted from quark–antiquark (diquark) pairs asradiation from a colour dipole between two partons. This results in partons that are notordered in their transverse momenta. The program uses the Lund string fragmentationmodel [34] for the hadronisation phase, as implemented in JETSET 7.4 [35]. For theanalysis of the 1995 data, two Monte Carlo samples were generated, 4.2 pb−1 with Q2 > 6GeV2 and 15.8 pb−1 with Q2 > 40 GeV2, using the GRV94 [36] parameterisation of theparton distribution functions. For the 1996 and 1997 data, a sample with Q2 > 70GeV2, (with MRSA parton densities [37]), was generated, corresponding to 17.1 pb−1,and a sample with Q2 > 800 GeV2 (with GRV94 parton densities), corresponding to53 pb−1.For the studies of the systematics for the 1995 data, two additional samples of eventswere generated (2.1 pb−1 with Q2 > 6 GeV2 and 9.1 pb−1 with Q2 > 70 GeV2) usingthe HERWIG 5.8d Monte Carlo program [38], where no electroweak radiative correc-tions were applied. In HERWIG, coherence effects in the QCD cascades are included byangular ordering of successive parton emissions and a clustering model is used for thehadronisation [11, 39]. For the 1996 and 1997 data, HERWIG samples with Q2 > 70GeV2 were generated, corresponding to 9.0 pb−1, and Q2 > 800 GeV2 (both with MRSAparton densities), corresponding to 60 pb−1. Both the GRV94 and MRSA parametrisa-tions agree well with the HERA measurements of the proton structure function F2 inthe (x,Q2) range of this analysis [40,41].Another approach to modelling the parton cascade is included in the LEPTO 6.5.1 [42]program, which incorporates the LO αs matrix element matched to DGLAP partonshowers (MEPS). This recent version of LEPTO incorporates the soft colour interaction(SCI) model [43] to describe HERA rapidity gap events. SCI produces changes to theusual string topologies in non-gap events causing the string to overlap itself and thisresults in an increase both of particle number and energy per unit of rapidity.The Linked Dipole Chain model, LDC 1.0, [44] has also been investigated. In this modelthe parton shower evolution is based on a reformulation [45] of the CCFM approach [46]which approximates the BFKL [47] prediction at low x and the DGLAP prediction inthe high x limit. The parton density parametrisation of “set A” [44] was used, whichfits data from H1 and ZEUS. The DGLAP equation predicts strong ordering of the
5
parton transverse momenta while the BFKL equation relaxes this ordering but imposesstrong ordering of the longitudinal momenta. Both the LEPTO and LDC programsuse the Lund string fragmentation model. They were used to compare generator levelcalculations with our data.
5 Correction Procedure
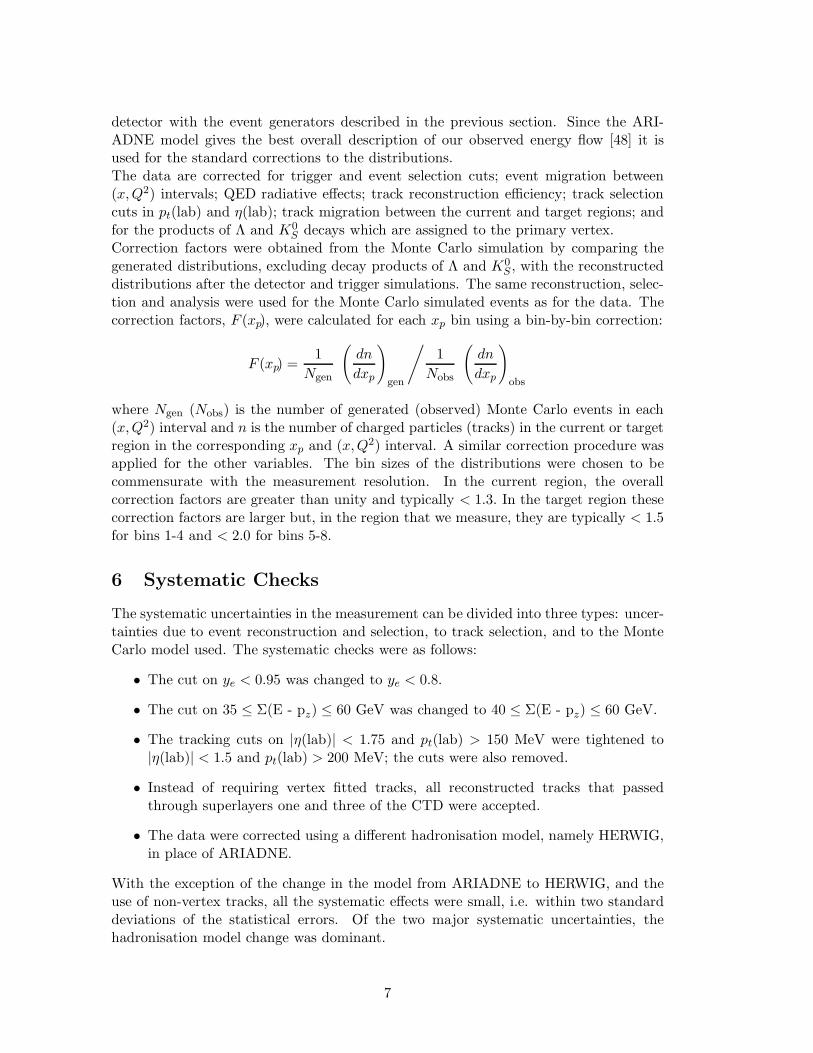
The Monte Carlo event samples were used to determine the mean charged particleacceptance in the current region as a function of (x,Q2). The chosen analysis intervalsin (x,Q2) correspond to regions of high acceptance (between 74 and 96%) in the currentregion of the Breit frame. The acceptance for the limited area of the target region understudy (xp < 1.0) is lower; the ln(1/xp) distributions have a good acceptance aroundtheir peak positions (70-90%) but it falls to about 50% at lower values of ln(1/xp) forthe (x,Q2) bins 1-4 defined in Table 1. Due to the low acceptance and large systematicuncertainties for ln(1/xp) < 1.0 this region is not studied in (x,Q2) bins 5-8 and nostudies in the target region are made beyond bin 8. There is good acceptance (>90%)for both regions under study for pt > 1.0 GeV, where pt is the transverse momentum withrespect to the virtual photon direction in the Breit frame. However the acceptance fallsbelow 50% for pt < 0.5 GeV. These values are well understood in terms of geometricalacceptances.
Bin no. x range Q2 (GeV2) range
1 (6.0 − 12.0)10−4 10 − 20
2 (1.2 − 2.4)10−3 10 − 203 20 − 404 40 − 80
5 (2.4 − 10.0)10−3 20 − 406 40 − 807 80 − 1608 160 − 320
9 (1.0 − 5.0)10−2 160 − 32010 320 − 64011 640 − 1280
12 0.025 − 0.15 1280 − 2560
13 0.05 − 0.25 2560 − 5120
Table 1: The (x,Q2) analysis bins.
About 7% of the tracks generated in the current region migrate to the target region.Migrations into the current region from the target fragmentation region are typicallyless than 5% of the tracks assigned to the current region for Q2 > 320 GeV2. For 10 <Q2 < 320 GeV2 these migrations are on average 12%, reaching 25% for Q2 < 40 GeV2
and low values of y where the hadronic activity is low and the measurement of γH issubject to systematic problems leading to a worse x resolution and hence an uncertaintyin the boost vector to the Breit frame.The correction procedure is based on the detailed Monte Carlo simulation of the ZEUS
6
detector with the event generators described in the previous section. Since the ARI-ADNE model gives the best overall description of our observed energy flow [48] it isused for the standard corrections to the distributions.The data are corrected for trigger and event selection cuts; event migration between(x,Q2) intervals; QED radiative effects; track reconstruction efficiency; track selectioncuts in pt(lab) and η(lab); track migration between the current and target regions; andfor the products of Λ and K0
S decays which are assigned to the primary vertex.Correction factors were obtained from the Monte Carlo simulation by comparing thegenerated distributions, excluding decay products of Λ and K0
S , with the reconstructeddistributions after the detector and trigger simulations. The same reconstruction, selec-tion and analysis were used for the Monte Carlo simulated events as for the data. Thecorrection factors, F (xp), were calculated for each xp bin using a bin-by-bin correction:
F (xp) =1
Ngen
(
dn
dxp
)
gen
/
1
Nobs
(
dn
dxp
)
obs
where Ngen (Nobs) is the number of generated (observed) Monte Carlo events in each(x,Q2) interval and n is the number of charged particles (tracks) in the current or targetregion in the corresponding xp and (x,Q2) interval. A similar correction procedure wasapplied for the other variables. The bin sizes of the distributions were chosen to becommensurate with the measurement resolution. In the current region, the overallcorrection factors are greater than unity and typically < 1.3. In the target region thesecorrection factors are larger but, in the region that we measure, they are typically < 1.5for bins 1-4 and < 2.0 for bins 5-8.
6 Systematic Checks
The systematic uncertainties in the measurement can be divided into three types: uncer-tainties due to event reconstruction and selection, to track selection, and to the MonteCarlo model used. The systematic checks were as follows:
• The cut on ye < 0.95 was changed to ye < 0.8.
• The cut on 35 ≤ Σ(E - pz) ≤ 60 GeV was changed to 40 ≤ Σ(E - pz) ≤ 60 GeV.
• The tracking cuts on |η(lab)| < 1.75 and pt(lab) > 150 MeV were tightened to|η(lab)| < 1.5 and pt(lab) > 200 MeV; the cuts were also removed.
• Instead of requiring vertex fitted tracks, all reconstructed tracks that passedthrough superlayers one and three of the CTD were accepted.
• The data were corrected using a different hadronisation model, namely HERWIG,in place of ARIADNE.
With the exception of the change in the model from ARIADNE to HERWIG, and theuse of non-vertex tracks, all the systematic effects were small, i.e. within two standarddeviations of the statistical errors. Of the two major systematic uncertainties, thehadronisation model change was dominant.
7
Current fragmentation region
The use of non-vertex tracks resulted in an overall increase in the single particle densitiesof 5% to 15% and was fairly flat across the xp range. The use of HERWIG to unfold thedata gave rise to systematic shifts as large as 15%. For Q2 < 80 GeV2 the tendency ofthe correction was to lower the single particle density values at low xp and to increase thevalues at higher xp. For pt in the range 0 < pt < 0.5 GeV, the systematic uncertaintieswere about 10%. They reduced with increasing pt to about 5%.
Target fragmentation region
Systematic effects due to the different hadronisation models were largest (as high as50%) in the ln(1/xp) distributions at high xp. For xp < 0.3 they were typically 10%,increasing to 30% at larger xp. The tracking systematic from non-vertex tracks waslargest at low xp in the lowest Q2 bin where it is 7%, but otherwise was of the order of2%. The pt distribution was little influenced by the model used, as would be expectedfrom the good acceptance, at all but the very lowest transverse momenta. The mean pt
showed a model dependence in the target region of at most 20% which was due to thereduced acceptance for low pt tracks at high xp. In general, unfolding with HERWIGresulted in a higher value of the normalised single particle densities.
7 Results
7.1 Current fragmentation region
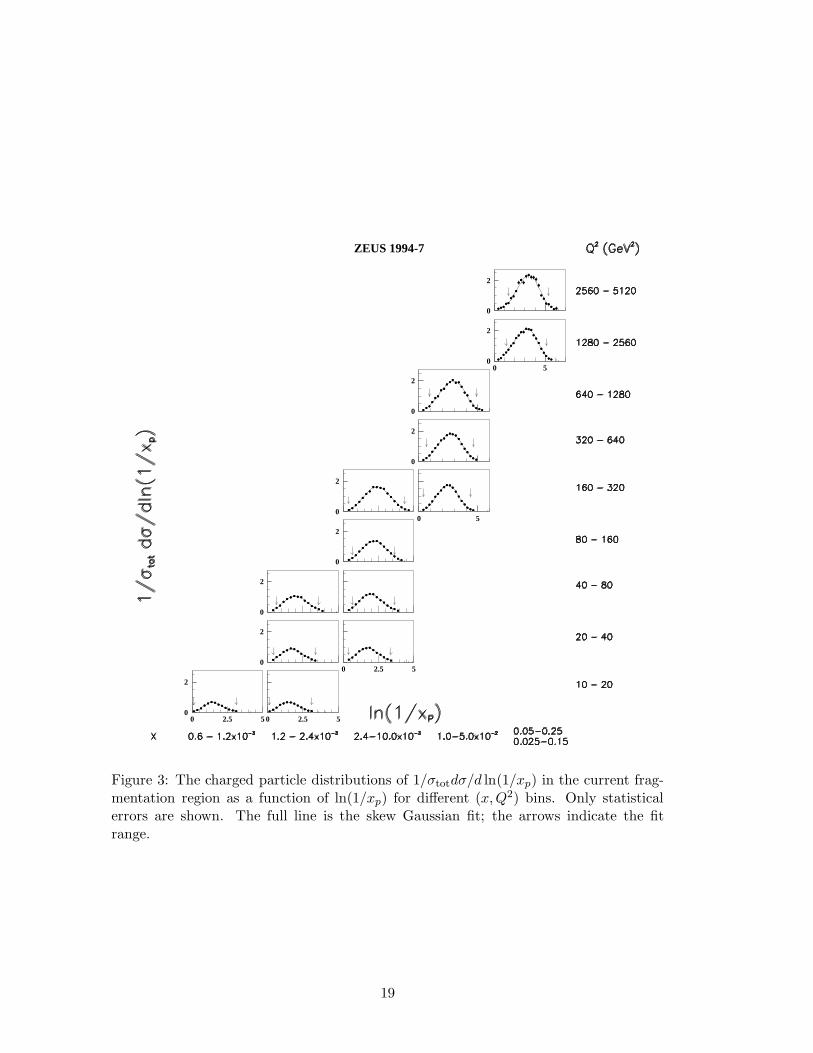
Figure 3 shows the ln(1/xp) distributions for charged particles in the current fragmen-tation region of the Breit frame for different bins of (x,Q2). These distributions areapproximately Gaussian in shape with the mean charged multiplicity given by the in-tegral of the distributions. As Q2 increases, the multiplicity increases and, in addition,the peak of the distribution moves to larger values of ln(1/xp). The moments of theln(1/xp) distributions have been investigated up to the 4th order; the mean (l), width(w), skewness (s) and kurtosis (k) were extracted from each distribution by fitting adistorted Gaussian of the following form:
1
σtot
dσ
d ln(1/xp)∝ exp
(
1
8k − 1
2sδ − 1
4(2 + k)δ2 +
1
6sδ3 +
1
24kδ4
)
, (1)
where δ = (ln(1/xp)− l)/w, over a range of ±1.5 units (for Q2 < 160 GeV2) or ±2 units(for Q2 ≥ 160 GeV2) in ln(1/xp) around the mean. The equation is motivated by theexpression used for the MLLA predictions of the spectra [14]. The smooth curves inFig. 3 result from the fit of equation (1) to the data; they represent the data well.Figure 4 shows the moments of the ln(1/xp) spectra as a function of Q2. It is evidentthat the mean and width increase with increasing Q2, whereas the skewness and kurtosisdecrease. Similar fits performed on e+e− data [49] show a reasonable agreement withour results, consistent with the universality of fragmentation for this distribution.The data are compared to the MLLA predictions of Ref. [15], using a value of Λ =175 MeV, for different values of Q0. A comparison is also made with the predictions ofRef. [14] for the limiting spectrum (Q0 = Λ). The MLLA predictions of the limitingspectrum in Ref. [15] describe the mean well. However both of the MLLA calculations
8
predict a negative skewness which tends towards zero with increasing Q2 in the case ofthe limiting spectra. This is contrary to the measurements. The qualitative descriptionof the behaviour of the skewness with Q2 can be achieved for a truncated cascade(Q0 > Λ), but a consistent description of the mean, width, skewness and kurtosiscannot be achieved. A range of Λ values was investigated and no single value of Λgave a consistent description of all the moments.We conclude that the MLLA predictions, assuming LPHD, do not describe the data.We note however that a moments analysis has been performed [50], taking into accountthe limitations of the massless assumptions of the MLLA predictions, and yields goodagreement between the limiting case of the MLLA [15] and e+e− data over a large energyrange, 3.0 <
√see < 133.0 GeV. A discussion of phase space effects on the ln(1/xp)
distributions is given in ref. [51]. These phase space effects can resemble MLLA.In Fig. 5 the evolution of the moments with Q2 (same DIS data as Fig. 4) are comparedwith the predictions of various Monte Carlo models. Both ARIADNE and LEPTO(with SCI) give a reasonable description of the data, while HERWIG fails to predict theobserved Q2 variation. This is particularly noticeable for skewness and kurtosis. Thediscontinuities in the HERWIG prediction arise from a strong x dependence in bins ofoverlapping Q2. Such an x dependence is not observed in the data. It may be noted that,due to the choice of the maximum scale of the parton shower evolution, there are fewergluons radiated in HERWIG than in the other generators; this could possibly accountfor the poor agreement of HERWIG with our measurement. All Monte Carlo programshave been compared using the default values of their parameters. The LEPTO modelwithout SCI (not shown) describes the data better than does the default version.The inclusive charged particle distribution, 1/σtot dσ/dxp, in the current fragmentationregion of the Breit frame is shown in bins of xp and Q2 in Fig. 6. The fall-off as Q2
increases for xp > 0.3 (corresponding to the production of more particles with a smallerfractional momentum) is indicative of scaling violations in the fragmentation function.The distributions rise with Q2 for xp < 0.1 and are discussed in more detail below. Thedata are compared to e+e− data [52] (divided by two to account for the production of aqq pair) at Q2 = see. For the higher Q2 values shown there is a good agreement betweenthe measurements in the current region of the Breit frame in DIS and the e+e− results;this again supports the universality of fragmentation. The fall-off observed in the ZEUSdata at low xp and low Q2 is greater than that observed in e+e− data at SPEAR [53];this can be attributed to processes not present in e+e− (e.g. scattering off a sea quarkand/or boson gluon fusion (BGF)) which depopulate the current region [8, 54,62].A kinematic correction has recently been suggested [55] to the NLO calculation [22] ofthe inclusive charged particle distribution which has the form:
1
1 + (meff
Qxp)2,
(2)
where meff is an effective mass to account for the massless assumption used in thefragmentation functions. It is expected to lie in the range 0.1 GeV < meff < 1.0 GeV.The xp data are compared to the CYCLOPS NLO QCD calculation incorporating thiscorrection in Fig. 7. This calculation convolutes the fragmentation function of eachtype of parton with the cross sections for their production. It combines a full next-to-leading order matrix element with the MRSA′ parton densities (with ΛQCD = 230 MeV)and NLO fragmentation functions derived from fits to e+e− data [56]. The kinematic
9
correction allows a more legitimate theoretical comparison to lower Q2 and xp thanwas possible in our earlier publication [3]. The bands represent the uncertainty in thepredictions by taking the extreme cases of meff = 0.1 GeV and meff = 1.0 GeV. Theseuncertainties are large at low Q2 and low xp, becoming smaller as Q2 and xp increase.Within these theoretical uncertainties there is good agreement throughout the selectedkinematic range. The kinematic correction describes the general trend of the data butit is not possible to achieve a good χ2 fit for meff over the whole xp and Q2 range. Theuncertainties introduced by these additional processes restrict to high Q2 and high xp
the kinematic range that may be used to extract αs from the observed scaling violations.The pt distributions, 1/σtot dσ/dp2
t , are shown in Fig. 8 for xp < 1.0. The distributionsshow an exponential fall off at low pt although it is evident that a high-pt tail developswith increasing Q2. These high pt tails contribute at most 15% of the cross section.The pt distributions, from the 1995 data, in the first 8 bins of (x,Q2) are shown in
Fig. 9 as closed data points. The straight lines are exponential fits, exp(−b√
p2t + m2
π),to the low pt interval 0.2 - 1.0 GeV, where mπ is the mass of the pion. They yieldslopes of b ∼ 5− 6 GeV−1. The values of b show little Q2 dependence. For bin 8 the lineextending out to higher pt (pt > 1.2 GeV) is a fit to the empirical power law formula [57]A × (1 + pt/pt0)−m. There are strong correlations between A, pt0 and m. Consequentlypt0 has been fixed at 0.75 GeV, a value consistent with the fit with all variables free andthat used by H1 in the analysis of their photoproduction data [58]. With this pt0, theparameterisation fits the data well (χ2/NdF = 5.1/19) and gives m = 5.8 ± 0.4 ± 0.1.These tails are slightly higher if the xp < 1.0 cut is removed (open points in the figure).Particles with xp > 1.0 occur due to hard QCD processes, such as BGF and QCDCompton.
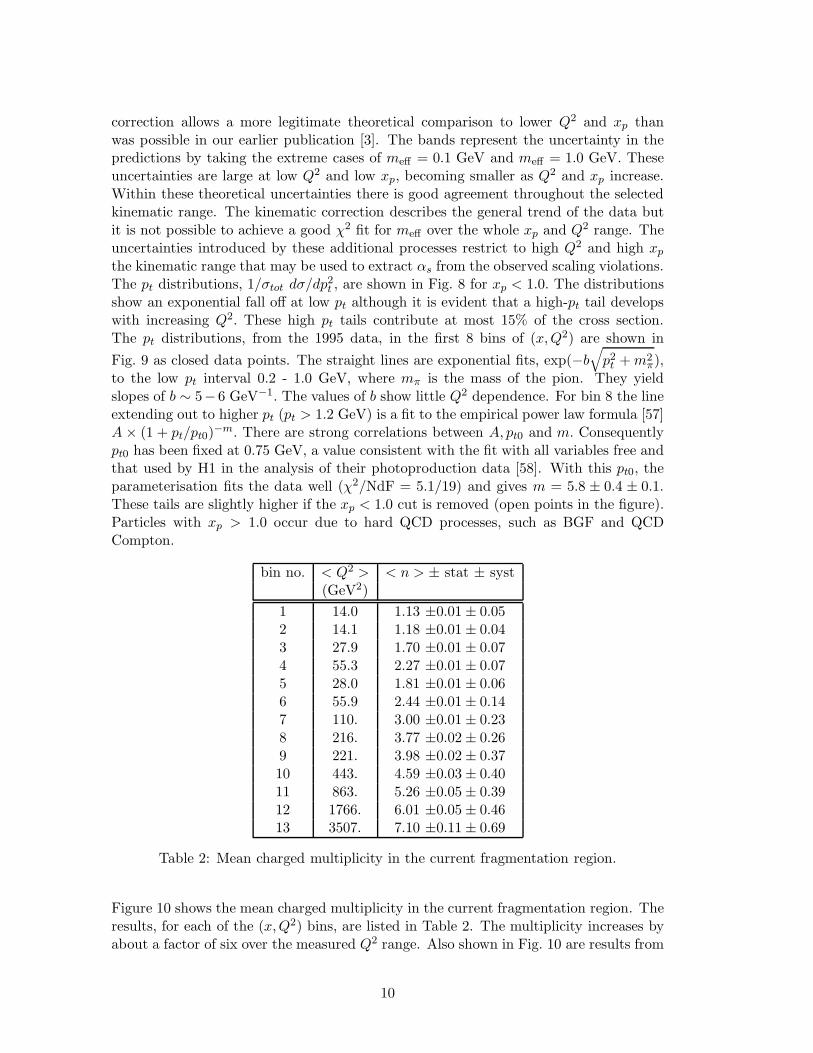
bin no. < Q2 > < n > ± stat ± syst(GeV2)
1 14.0 1.13 ±0.01 ± 0.052 14.1 1.18 ±0.01 ± 0.043 27.9 1.70 ±0.01 ± 0.074 55.3 2.27 ±0.01 ± 0.075 28.0 1.81 ±0.01 ± 0.066 55.9 2.44 ±0.01 ± 0.147 110. 3.00 ±0.01 ± 0.238 216. 3.77 ±0.02 ± 0.269 221. 3.98 ±0.02 ± 0.3710 443. 4.59 ±0.03 ± 0.4011 863. 5.26 ±0.05 ± 0.3912 1766. 6.01 ±0.05 ± 0.4613 3507. 7.10 ±0.11 ± 0.69
Table 2: Mean charged multiplicity in the current fragmentation region.
Figure 10 shows the mean charged multiplicity in the current fragmentation region. Theresults, for each of the (x,Q2) bins, are listed in Table 2. The multiplicity increases byabout a factor of six over the measured Q2 range. Also shown in Fig. 10 are results from
10

e+e− annihilation experiments [59] (scaled down by a factor of 2) and results from fixedtarget DIS data [60] at similar Q2(Q2 < 30 GeV2) to the ZEUS data but correspondingto an x range about two orders of magnitude higher. For Q2 >∼80 GeV2 there is reasonableagreement between the results from e+e− data and ZEUS, again consistent with theuniversality of fragmentation. At lower Q2 the multiplicities measured by ZEUS arelower than those found in the e+e− data and the fixed target DIS data. Similar resultshave recently been observed by the NOMAD collaboration [61]. In this Q2 region thereis a negligible contribution from charmed quarks so that the difference must originatefrom the depopulation of the current region due to the prevalence of boson-gluon fusionprocesses in this low (x,Q2) region [8, 13,62].Figure 11 displays the same ZEUS data as in Fig. 10 but now compared to various MonteCarlo models. Both ARIADNE and HERWIG, with default settings, describe well thevariation of the multiplicity with Q2. LEPTO with SCI, while describing the data atlow Q2, simulates the Q2 evolution incorrectly which leads to an overestimation of themultiplicity at high Q2. This overestimation of the data by LEPTO can be partiallyrectified, as can be seen in Fig. 11(dash-dotted line), by removing SCI from the model.
7.2 Target fragmentation region
The distributions of charged particles in xp and transverse momentum, pt, in the targetregion of the Breit frame are studied as a function of x and Q2, in the range 6× 10⁻⁴ <x < 1 × 10⁻² and 10 < Q2 < 320 GeV2. This analysis, which uses the 1995 data, isrestricted to values of the scaled momenta xp < 1.0 so that similar phase space regionsfor the target and current can be compared. Thus the accepted part of the target regioncorresponds to the contributions T1 and T2 in Fig. 2 and is only a small part of thecomplete phase space, as depicted in Fig. 1. This is also the kinematic region of thetarget fragmentation that has a reasonable acceptance. The corrected data distributionswith combined statistical and systematic errors are shown in Figs. 12-16.The distributions in ln(1/xp) are shown for both the target and current regions inFig. 12. The fitted curves shown are two-piece normal distributions [63] to guide theeye. In contrast to the current region, the target region distribution does not fall tozero as ln(1/xp) tends to zero. Although the magnitude of the single particle densityat the peak position of the current region distribution grows by a factor of about threeover the Q2 range shown, the single particle density of the target distribution, at the xp
value corresponding to the peak of the current distribution (contribution C is equivalentto contribution T1 in Fig. 2), depends less strongly on Q2 and increases by only about30%. In addition the ln(1/xp) distribution shows no significant dependence on x whenQ2 is kept constant. In the target region the peak position of the ln(1/xp) distributionincreases more rapidly with Q2 than in the current region; this is consistent with thebehaviour expected from cylindrical phase space. The approximate Gaussian distribu-tion of the MLLA predictions peaking at ln(1/xp) ∼ 1.5 − 2.5 [6] is not observed. Weconclude that the target distributions are inconsistent with the MLLA predictions whenused in conjunction with LPHD.The ln(1/xp) distributions in the target fragmentation region are compared to MonteCarlo models in Fig. 13. The ARIADNE and Linked Dipole Chain (LDC) modelsdescribe the data well in the measured (x,Q2) bins. The two Monte Carlo modelsbased on DGLAP parton evolution techniques, LEPTO and HERWIG, fail to describe
11

bin no. < Q2 > (GeV2) current < n > target < n >
1 14.0 1.13 ±0.01±0.05 4.95 ±0.01±0.2
2 14.1 1.18 ±0.01±0.04 4.94 ±0.01±0.43 27.9 1.70 ±0.01±0.07 6.11 ±0.02±0.64 55.3 2.27 ±0.01±0.07 7.36 ±0.03±0.3
Table 3: The mean charged multiplicities in the current and target regions for the(x,Q2) analysis bins, in the range 0 < xp < 1. The first error is statistical and thesecond is systematic.
the data. The LEPTO Monte Carlo with SCI describes the data at low Q2 but thedependence on Q2 within the model is incorrect and discrepancies are observed at largeQ2. The HERWIG Monte Carlo gives a poor description of the data in all (x,Q2) bins.The LEPTO generator without SCI (not shown) gives a good description of the data.The mean multiplicity in the target region in the range 0 < xp < 1, shown in Table 3, islarger than in the current region, by about a factor of four in the lowest (x,Q2) bins. Thetarget region multiplicity increases with Q2, but more slowly than that in the currentregion presumably due to the additional fragmentation terms in the target region shownin Fig. 2. Only the first four (x,Q2) bins are studied as they have reasonable acceptanceover the whole of 0 < xp < 1. Fig. 14 shows the ratio of the charged multiplicities inthe target and the current regions as a function of Q2. The ratio falls as Q2 increases.Also shown are comparisons with Monte Carlo models; ARIADNE, LDC and LEPTOwithout SCI all describe the trend of the data. HERWIG, though reproducing the Q2
dependence, fails to predict the magnitude whilst LEPTO with SCI fails to describe theQ2 dependence of the ratio.The pt distributions, 1/σtotdσ/dp2
t , are shown in Fig. 15 and the same fits have beenperformed on these distributions as on the current region pt distributions of Fig. 9.
The fit of the exponential, exp(−b√
p2t + m2
π), gives slopes of b ∼ 5 − 6 GeV−1. Ina similar manner to the distributions in the current region, the values of b exhibitlittle Q2 dependence, but the distributions develop a high-pt tail with increasing Q2.The line plotted for the Q2 interval 160-320 GeV2 is a fit to the power law formulaA×(1+pt/pt0)−m for pt greater than 1.2 GeV. This fits the data well (χ2/NdF = 1.9/19)with pt0 fixed at 0.75 GeV and m = 5.7 ± 0.6 ± 0.1. These high pt tails contain at most15% of the cross section. The values of m in the current and target regions agree withinerrors and are smaller than that found for the ZEUS [57] and H1 [58] photoproductiondata. This is consistent with what would be expected from the point-like nature of theexchanged photon in DIS.To compare the general characteristics of the transverse momentum distributions in thetarget and current regions, the mean pt versus xp is shown in Fig. 16. The mean pt atlarge xp is higher in the current region than in the target region and shows a strongerQ2 dependence than the target region. In the current region the mean pt rises with xp
and reaches a maximum as xp tends to −1. In contrast, in the target region the meanpt tends to a constant value of about 0.6 GeV. Thus the target region pt distributionhas the characteristics of pt-limited phase space with only a small dependence on Q2.The mean pt vs xp distribution in the target region shows no significant dependence on
12
x when Q2 is kept constant.Also shown in Fig. 16 are the Monte Carlo predictions of the ARIADNE and HERWIGmodels. The ARIADNE generator gives a good description of the data and is verysimilar to the predictions of LEPTO and LDC Monte Carlo models. The HERWIGgenerator gives a less satisfactory description of the data. The discrepancy in the targetregion can partially be explained by the lack of intrinsic transverse momentum of theincoming struck quark in the default parameters of HERWIG.The apparent contradiction between the similarity of Figs. 9 and 15 and the differencebetween the mean pt in the current and target regions in Fig. 16 may be understoodin terms of the correlation between xp and pt. In the current region this correlationis strong with the high xp, pt region corresponding to low multiplicity. As the high pt
particles have a strong Q2 dependence, this is reflected in the Q2 dependence of themean pt at high xp. In contrast, in the target region the correlation between xp andpt is small. This results in a lower mean pt at large xp and a mean pt substantiallyindependent of xp and Q2 as xp tends to 1.
8 Summary
Charged particle distributions have been studied in the Breit frame in DIS over a widerange of Q2. The distributions in scaled momentum, xp, and transverse momentum,pt, have been measured for the first time in the target region of the Breit frame for1.2×10−3 < x < 1×10⁻² and 10 < Q2 < 320 GeV2. For scaled momenta in the interval0 < xp < 1 the mean target region charged track multiplicity is found to be larger thanthat measured in the current region; there is no significant x-dependence at fixed Q2.The transverse momentum distributions for both the current and target fragmentationregions exhibit similar properties. A tail at large pt develops as Q2 increases. The meantransverse momentum as a function of xp has a weaker dependence on Q2 in the targetregion than the current region. Whereas in the current region the mean pt increasesapproximately linearly with xp, the mean pt in the target region tends to a constantvalue with increasing xp, consistent with cylindrical phase space.The HERWIG model is unable to describe the Q2 dependence of the ln(1/xp) distri-butions in the target fragmentation region. In contrast the colour dipole model asimplemented in the ARIADNE program, LEPTO generator without SCI and the LDCMonte Carlo, based on a reformulation of the CCFM evolution, all adequately describethe data.In the current region, the results show clear evidence for scaling violations in scaledmomenta as a function of Q2 and support the hypothesis of the coherent nature ofQCD cascades. The data are well described by NLO calculations. The comparisonof our results in the current region of the Breit frame with e+e− data at Q2 = see
for Q2 > 80 GeV2 shows good agreement. The moments of the ln(1/xp) spectra inthe current region exhibit the same energy scale behaviour as those observed in e+e−
data. The observed charged particle spectra are consistent with the universality of quarkfragmentation in e+e− and DIS at high Q2. The moments cannot be described by theMLLA calculations together with LPHD.The target region ln(1/xp) distribution shows a weaker Q2 dependence than the corre-sponding current region distribution. In particular, the magnitude of the single particle
13
density of the target distribution, at the xp value corresponding to the peak of the cur-rent distribution, increases by about 30%, in contrast to a threefold increase for thecurrent region in the Q2-range considered here. The MLLA predictions for the targetregion, in conjunction with LPHD, fail to describe the data.
Acknowledgements
The strong support and encouragement of the DESY Directorate have been invaluable,and we are much indebted to the HERA machine group for their inventiveness anddiligent efforts. The design, construction and installation of the ZEUS detector havebeen made possible by the ingenuity and dedicated efforts of many people from insideDESY and from the home institutes who are not listed as authors. Their contributionsare acknowledged with great appreciation.This paper was completed shortly after the tragic and untimely death of Prof. Dr.B. H. Wiik, Chairman of the DESY directorate. All members of the ZEUS collaborationwish to acknowledge the remarkable role which he played in the success of both theHERA project and of the ZEUS experiment. His inspired scientific leadership, his warmpersonality and his friendship will be sorely missed by us all.
References
[1] R. P. Feynman, ‘Photon-Hadron Interactions’, Benjamin, N.Y. (1972).
[2] ZEUS Collab., M. Derrick et al., Z. Phys. C67 (1995) 93.
[3] ZEUS Collab., M. Derrick et al., Phys. Lett. B414 (1997) 428.
[4] H1 Collab., S. Aid et al., Nucl. Phys. B445 (1995) 3;H1 Collab., C. Adloff et al., Nucl. Phys. B504 (1997) 3.
[5] Yu. Dokshitzer et al., Rev. Mod. Phys. 60 (1988) 373.
[6] A. V. Anisovich et al., Il Nuovo Cimento A106 (1993) 547.
[7] K. Charchu la, J. Phys. G19 (1993) 1587.
[8] K.H. Streng, T.F. Walsh and P.M. Zerwas, Z. Phys. C2 (1979) 237.
[9] A. Bassetto et al., Nucl. Phys. B207 (1982) 189.
[10] A. Mueller, Nucl. Phys. B213 (1983) 85.
[11] B. R. Webber, Nucl. Phys. B238 (1984) 492.
[12] Yu. Dokshitzer, V. Khoze, A. Mueller and S. Troyan, “Basics of Perturbative QCD”,Editions Frontieres, Gif-sur-Yvette, France (1991).
[13] V. Khoze and W. Ochs, Int. J. Mod. Phys. A12 (1997) 2949.
[14] C. P. Fong and B. R. Webber, Phys. Lett. B229 (1989) 289;C. P. Fong and B. R. Webber, Nucl. Phys. B355 (1991) 54.
14
[15] Yu. Dokshitzer, V. Khoze and S. Troyan, Int. J. Mod. Phys. A7 (1992) 1875.
[16] Ya. Azimov et al., Z. Phys. C27 (1985) 65.
[17] Yu. Dokshitzer et al., Sov. Phys. JETP 68 (1988) 1303.
[18] V.N. Gribov and L.N. Lipatov, Sov. J. Nucl. Phys. 15 (1972) 438 and 675;Yu.L. Dokshitzer, Sov. Phys. JETP 46 (1977) 641;G. Altarelli and G. Parisi, Nucl. Phys. B126 (1977) 298.
[19] G. Altarelli et al., Nucl. Phys. B160 (1979) 301;P. Nason and B. R. Webber, Nucl. Phys. B421 (1994) 473.
[20] ALEPH Collab., D. Buskulic et al., Phys. Lett. B357 (1995) 487.
[21] DELPHI Collab., P. Abreu et al., Phys. Lett. B311 (1993) 408;DELPHI Collab., P. Abreu et al., Phys. Lett. B398 (1997) 194.
[22] D. Graudenz, CERN–TH/96–52;D. Graudenz, CYCLOPS program and private communication.
[23] ZEUS Collab., M. Derrick et al., Phys. Lett. B293 (1992) 465;ZEUS Collab., M. Derrick et al., Z. Phys. C63 (1994) 391.
[24] ZEUS Collab., The ZEUS Detector, Status Report 1993, DESY 1993.
[25] N. Harnew et al., Nucl. Inst. Meth. A279 (1989) 290;B. Foster et al., Nucl. Phys. B (Proc. Suppl.) 32 (1993) 181;B. Foster et al., Nucl. Inst. Meth. A338 (1994) 254.
[26] M. Derrick et al., Nucl. Inst. Meth. A309 (1991) 77;A. Andresen et al., Nucl. Inst. Meth. A309 (1991) 101;A. Bernstein et al., Nucl. Inst. Meth. A336 (1993) 23.
[27] F. Jacquet and A. Blondel, Proceedings of the study for an ep facility for Europe,DESY 79/48 (1979) 391.
[28] S. Bentvelsen, J. Engelen and P. Kooijman, Proceedings of the 1991 Workshop onPhysics at HERA, DESY Vol. 1 (1992) 23.
[29] ZEUS Collab., M. Derrick et al., Z. Phys. C72 (1996) 399.
[30] R. Brun et al., GEANT3, CERN DD/EE/84-1 (1987).
[31] K. Charchu la, G. Schuler and H. Spiesberger, Comp. Phys. Comm. 81 (1994) 381.
[32] A. Kwiatkowski, H. Spiesberger and H.-J. Mohring, Proceedings of the 1991 Work-shop on Physics at HERA, DESY Vol. 3 (1992) 1294;A. Kwiatkowski, H. Spiesberger and H.-J. Mohring, Z. Phys. C50 (1991) 165.
[33] L.Lonnblad, ARIADNE version 4.03 program and manual, Comp. Phys. Comm.71 (1992) 15.
[34] B. Andersson et al., Phys. Rep. 97 (1983) 31.
15
[35] T. Sjostrand, Comp. Phys. Comm. 82 (1994) 74;T. Sjostrand, CERN-TH 7112/93 (revised August 1995).
[36] M. Gluck, E. Reya and A. Vogt, Z. Phys. C67 (1995) 433.
[37] A. D. Martin, R. G. Roberts and W. J. Stirling, Phys. Rev. D50 (1994) 6734.
[38] G. Marchesini et al., Comp. Phys. Comm. 67 (1992) 465.
[39] G. Marchesini and B. R. Webber, Nucl. Phys. B310 (1988) 461.
[40] ZEUS Collab., M. Derrick et al., Z. Phys. C65 (1995) 379.
[41] H1 Collab., I. Abt et al., Nucl. Phys. B407 (1993) 515.
[42] G. Ingelman, A. Edin and J. Rathsman, LEPTO 6.5 1, Comp. Phys. Comm. 101(1997) 108.
[43] A. Edin, G. Ingelman and J. Rathsman, Phys. Lett. B366 (1996) 371.
[44] B. Andersson, G. Gustafson and J. Samuelsson, Nucl. Phys. B463 (1996) 217;B. Andersson, G. Gustafson, H. Kharraziha and J. Samuelsson, Z. Phys. C71 (1996)613;H. Kharraziha and L. Lonnblad, JHEP 9803 (1998) 006.
[45] B. Andersson, G. Gustafson and J. Jannelson, Nucl. Phys. B463 (1996) 217.
[46] M. Ciafaloni, Nucl. Phys. B296 (1988) 49;S. Catani, F. Fiorani and G. Marchesini, Phys. Lett. B234 (1990) 339 and Nucl.Phys. B336 (1990) 18;G. Marchesini, Nucl. Phys. B445 (1995) 49.
[47] E.A. Kuraev, L.N. Lipatov and V.S. Fadin, Sov. Phys. JETP 45 (1977) 199;Ya.Ya. Balitzki and L.N. Lipatov, Sov. J. Nucl. Phys. 28 (1978) 822.
[48] ZEUS Collab., M. Derrick et al., Z. Phys. C59 (1993) 231.
[49] OPAL Collab., M.Akrway et al., Phys. Lett. B247 (1990) 617;TASSO Collab., W. Braunschweig et al., Z. Phys. C47 (1990) 187;TASSO Collab., W. Braunschweig et al., Z. Phys. C22 (1984) 307;TOPAZ Collab., R. Itoh et al., Phys. Lett. B345 (1995) 335.
[50] S. Lupia and W. Ochs, Eur. Phys. J. C2 (1998) 307.
[51] E.R. Boudinov, P.V. Chliapnikov and V.A. Uvarov, Phys. Lett. B309 (1993) 210;P.V. Chliapnikov and V.A. Uvarov, Phys.Lett.B431 (1998) 430.
[52] TASSO Collab., W. Braunschweig et al., Z. Phys. C47 (1990) 187 ;MARK II Collab., A. Petersen et al., Phys. Rev. D37 (1988) 1;AMY Collab., Y. K. Li et al., Phys. Rev. D41 (1990) 2675;DELPHI Collab., P. Abreu et al., Phys. Lett. B311, (1993) 408.
[53] MARK II Collab., J. F. Patrick et al., Phys. Rev. Lett. 49 (1982) 1232.
16
[54] ZEUS Collab., M. Derrick et al., Phys. Lett. B338 (1994) 483.
[55] Yu. Dokshitzer and B. R. Webber, discussion at Third UK Phenomenology Work-shop on HERA Physics, Durham, UK, 20-25 Sept 1998.P. Dixon et al., ‘Fragmentation Function Scaling Violations in the Breit Frame’, toappear in J. Phys. G.
[56] J. Binnewies et al., Z. Phys. C65 (1995) 471.
[57] ZEUS Collab., M. Derrick et al., Z. Phys. C67 (1995) 227.
[58] H1 Collab., C. Adloff et al., DESY 98-148, submitted to Eur. Phys. J.
[59] TASSO Collab., W. Braunschweig et al., Z. Phys. C45 (1989) 193;PLUTO Collab., Ch. Berger et al., Phys. Lett. B95 (1980) 313;OPAL Collab., P.D. Acton et al., Z. Phys. C53 (1992) 539;HRS Collab., M. Derrick et al., Phys. Rev. D34 (1986) 3304;MARK1 Collab., J.L. Siegrist et al., Phys. Rev. D26 (1986) 969.
[60] M. Derrick et al., Phys. Lett. B91 (1986) 470.
[61] NOMAD Collab., J. Altegoer et al., Phys. Lett. B445 (1999) 439.
[62] P. Eden, LU TP 98-22, hep-ph/9811229.
[63] Bank of England Quarterly Bulletin , February 1998, and references therein. Thetwo piece normal distribution is
exp
(
(ln(1/xp) − µ)2
2Σ2(1 ± g)
)
,
where µ and Σ are the mode and r.m.s. of the distribution respectively; g is in therange −1. < g < 1. and controls the skewness of the distribution. If ln(1/xp) ≥ µthen the sign in front of g is positive, otherwise it is negative.
17
TARGETCURRENT
(1-x)Q/2x
t
-Q/2Q/2
L
p
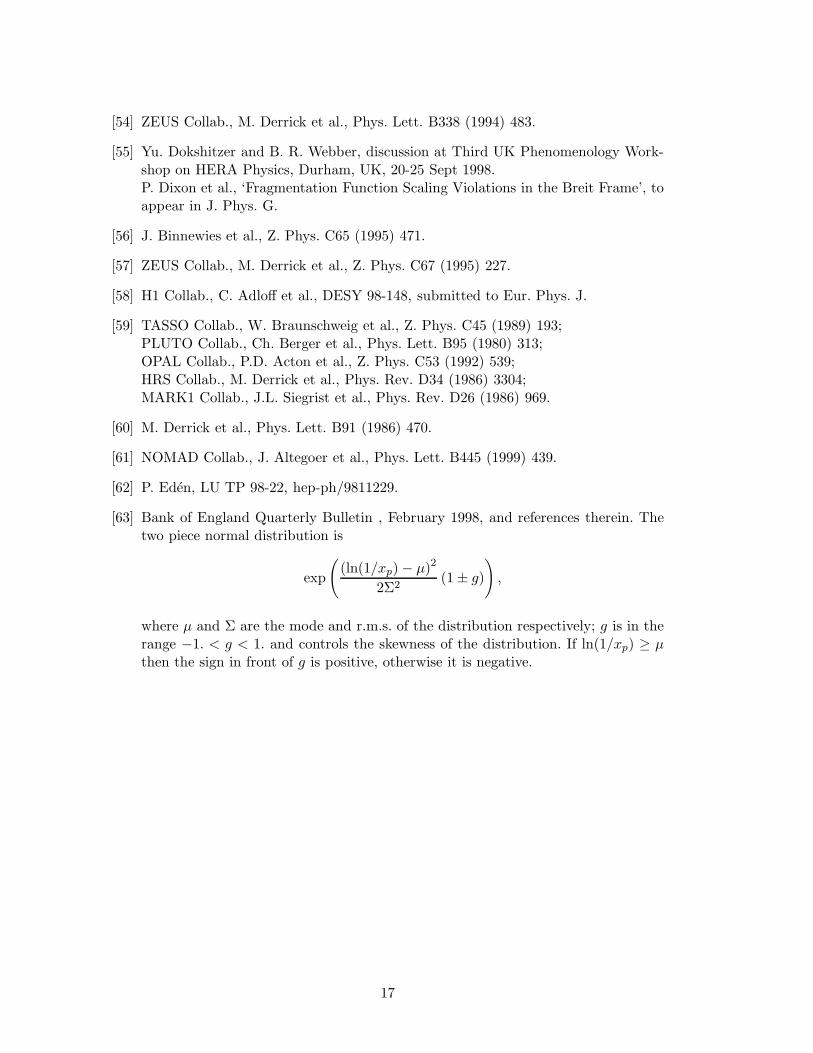
p
Figure 1: The phase space diagram for DIS in the Breit frame, pL denotes the lon-gitudinal momentum axis, referred to as the z−direction, and pt denotes transversemomentum. The dark shaded region indicates the part of the target region under studyin this paper.
-e+ ����� ���������� e+- C6 � T1
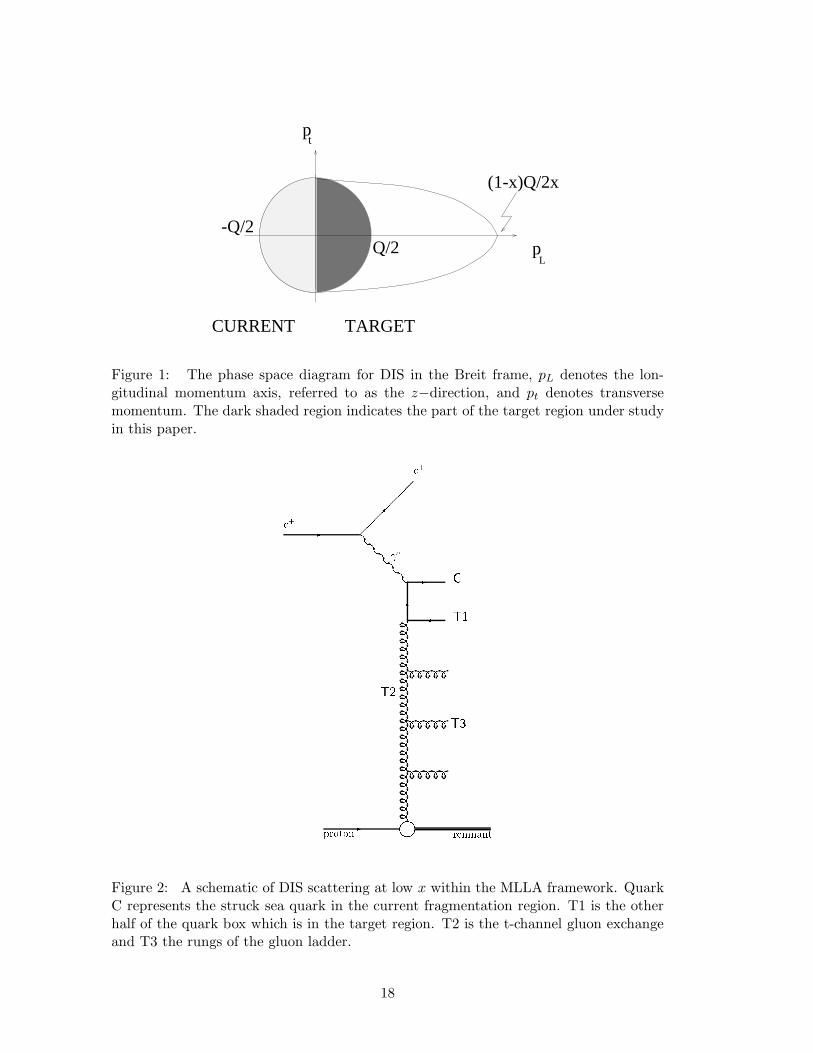
�������������������������������������������������������������������������������-proton remnant������� �� �� �� �������������� �� �� �� �������T3T2 ������� �� �� �� �������
Figure 2: A schematic of DIS scattering at low x within the MLLA framework. QuarkC represents the struck sea quark in the current fragmentation region. T1 is the otherhalf of the quark box which is in the target region. T2 is the t-channel gluon exchangeand T3 the rungs of the gluon ladder.
18
ZEUS 1994-7
0
2
0 2.5 5 0 2.5 5
0
2
0
2
0 2.5 5
0
2
0
2
0
2
0
2
0 5
0
2
0 5
0
2
Figure 3: The charged particle distributions of 1/σtotdσ/d ln(1/xp) in the current frag-mentation region as a function of ln(1/xp) for different (x,Q2) bins. Only statisticalerrors are shown. The full line is the skew Gaussian fit; the arrows indicate the fitrange.
19
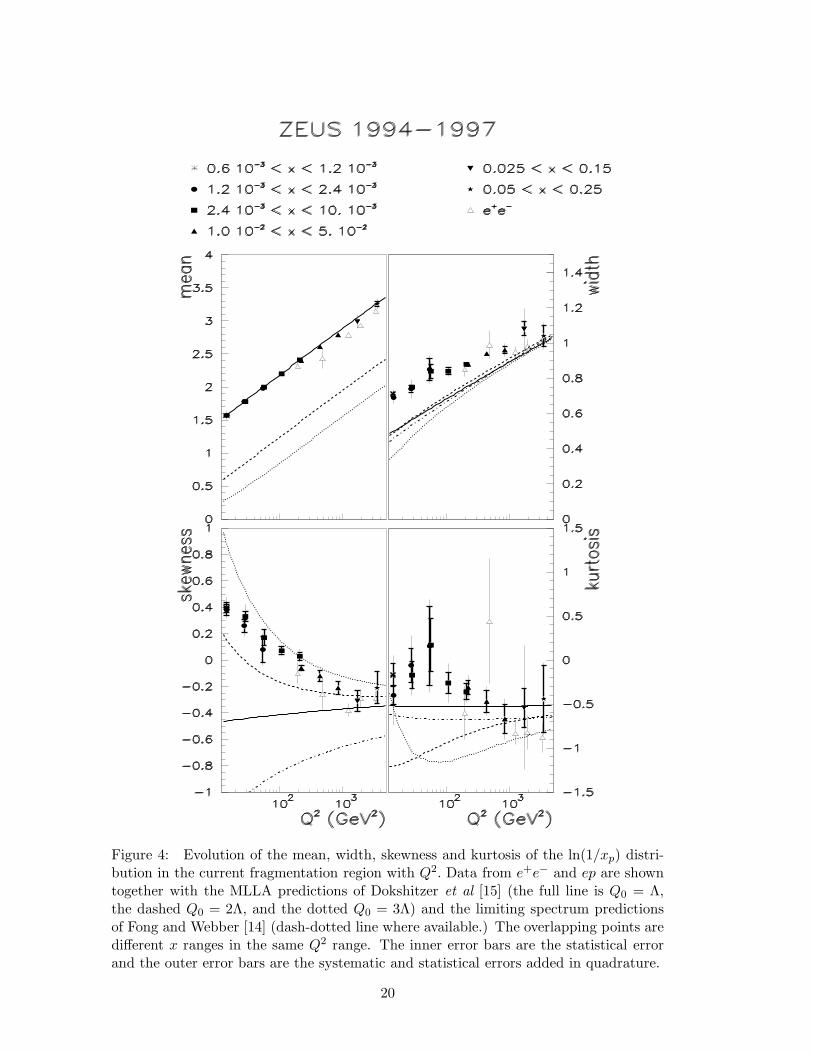
Figure 4: Evolution of the mean, width, skewness and kurtosis of the ln(1/xp) distri-bution in the current fragmentation region with Q2. Data from e+e− and ep are showntogether with the MLLA predictions of Dokshitzer et al [15] (the full line is Q0 = Λ,the dashed Q0 = 2Λ, and the dotted Q0 = 3Λ) and the limiting spectrum predictionsof Fong and Webber [14] (dash-dotted line where available.) The overlapping points aredifferent x ranges in the same Q2 range. The inner error bars are the statistical errorand the outer error bars are the systematic and statistical errors added in quadrature.
20
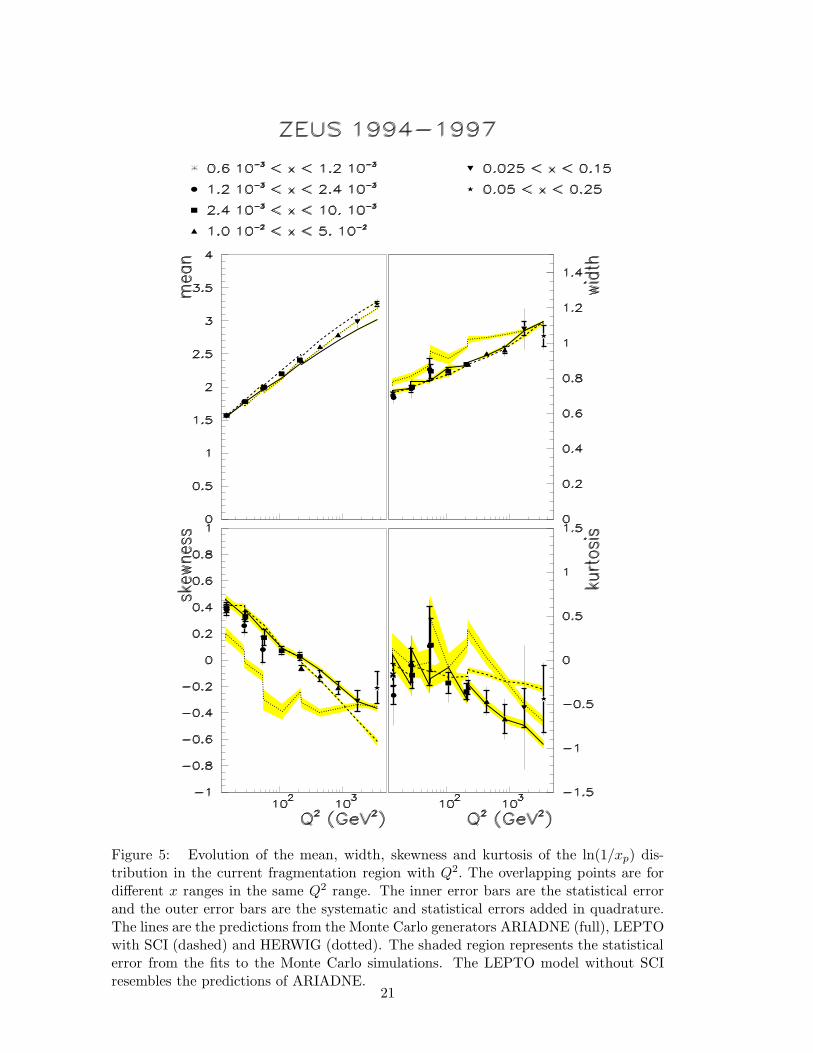
Figure 5: Evolution of the mean, width, skewness and kurtosis of the ln(1/xp) dis-tribution in the current fragmentation region with Q2. The overlapping points are fordifferent x ranges in the same Q2 range. The inner error bars are the statistical errorand the outer error bars are the systematic and statistical errors added in quadrature.The lines are the predictions from the Monte Carlo generators ARIADNE (full), LEPTOwith SCI (dashed) and HERWIG (dotted). The shaded region represents the statisticalerror from the fits to the Monte Carlo simulations. The LEPTO model without SCIresembles the predictions of ARIADNE.
21
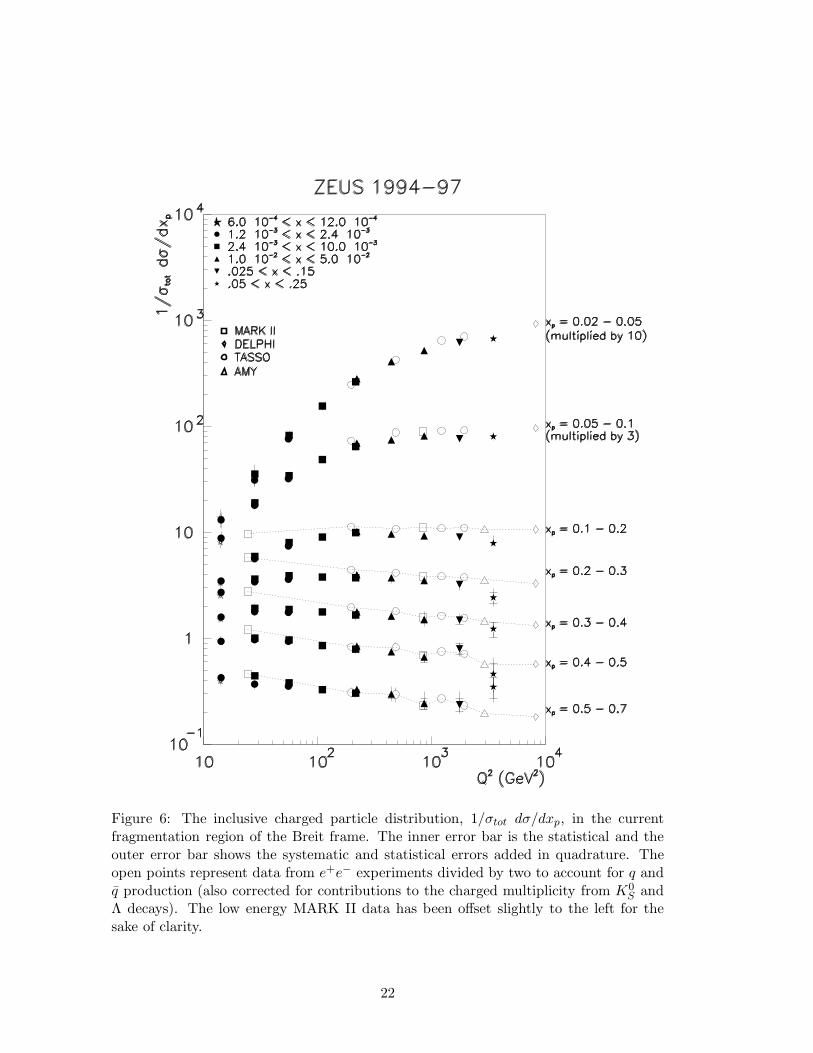
Figure 6: The inclusive charged particle distribution, 1/σtot dσ/dxp, in the currentfragmentation region of the Breit frame. The inner error bar is the statistical and theouter error bar shows the systematic and statistical errors added in quadrature. Theopen points represent data from e+e− experiments divided by two to account for q andq production (also corrected for contributions to the charged multiplicity from K0
S andΛ decays). The low energy MARK II data has been offset slightly to the left for thesake of clarity.
22
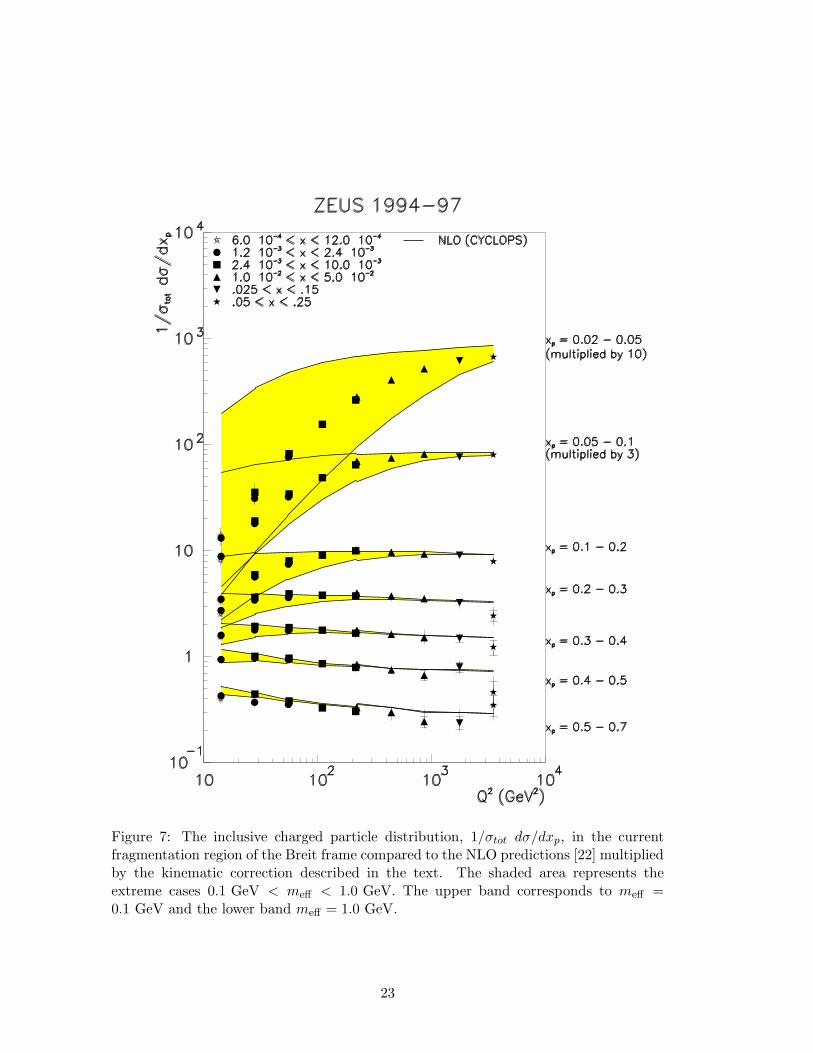
Figure 7: The inclusive charged particle distribution, 1/σtot dσ/dxp, in the currentfragmentation region of the Breit frame compared to the NLO predictions [22] multipliedby the kinematic correction described in the text. The shaded area represents theextreme cases 0.1 GeV < meff < 1.0 GeV. The upper band corresponds to meff =0.1 GeV and the lower band meff = 1.0 GeV.
23
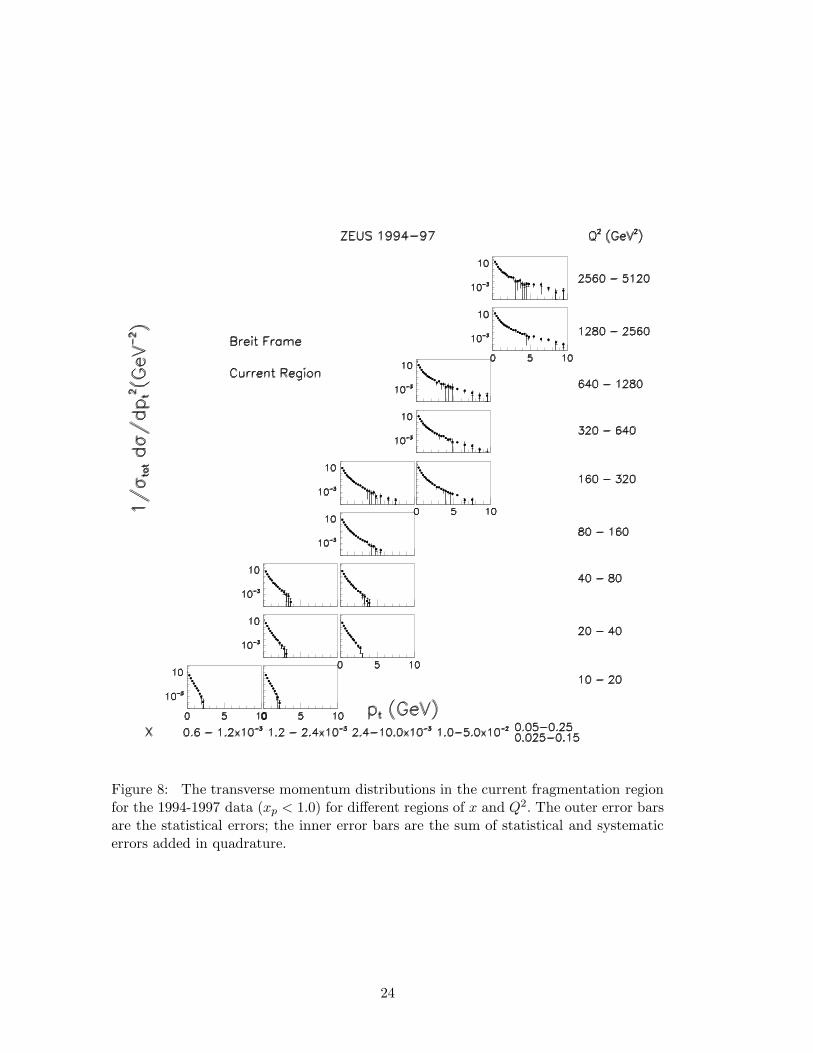
Figure 8: The transverse momentum distributions in the current fragmentation regionfor the 1994-1997 data (xp < 1.0) for different regions of x and Q2. The outer error barsare the statistical errors; the inner error bars are the sum of statistical and systematicerrors added in quadrature.
24
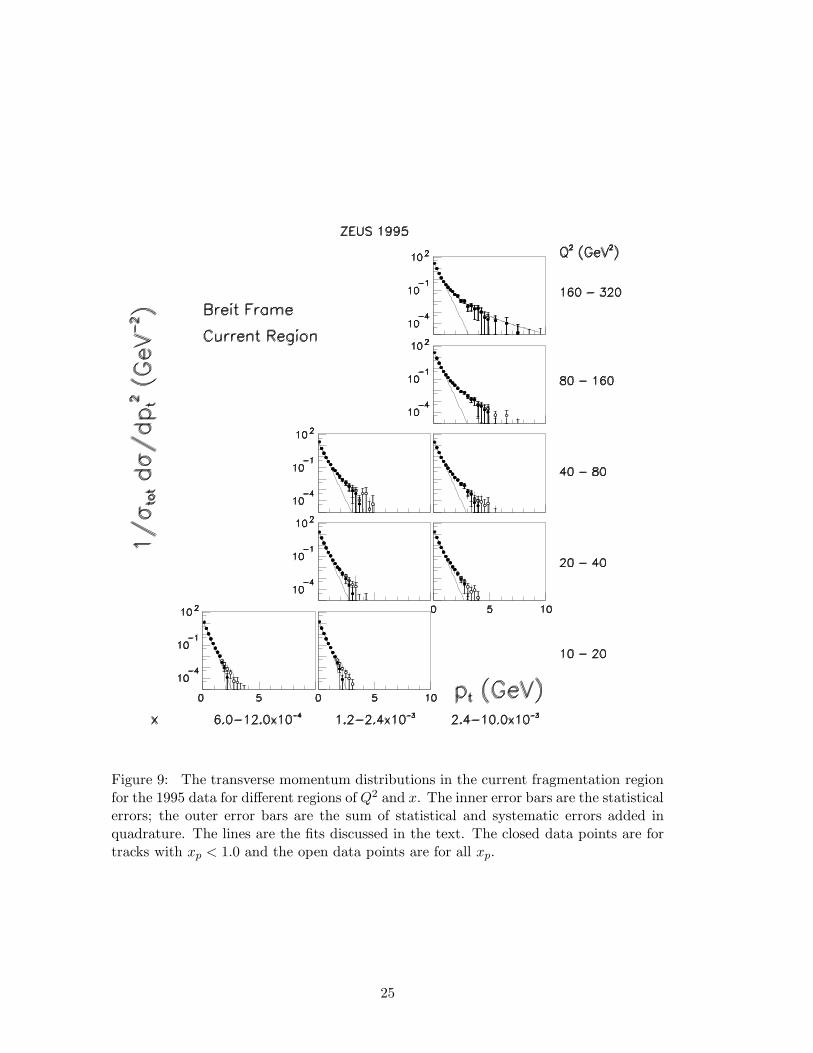
Figure 9: The transverse momentum distributions in the current fragmentation regionfor the 1995 data for different regions of Q2 and x. The inner error bars are the statisticalerrors; the outer error bars are the sum of statistical and systematic errors added inquadrature. The lines are the fits discussed in the text. The closed data points are fortracks with xp < 1.0 and the open data points are for all xp.
25
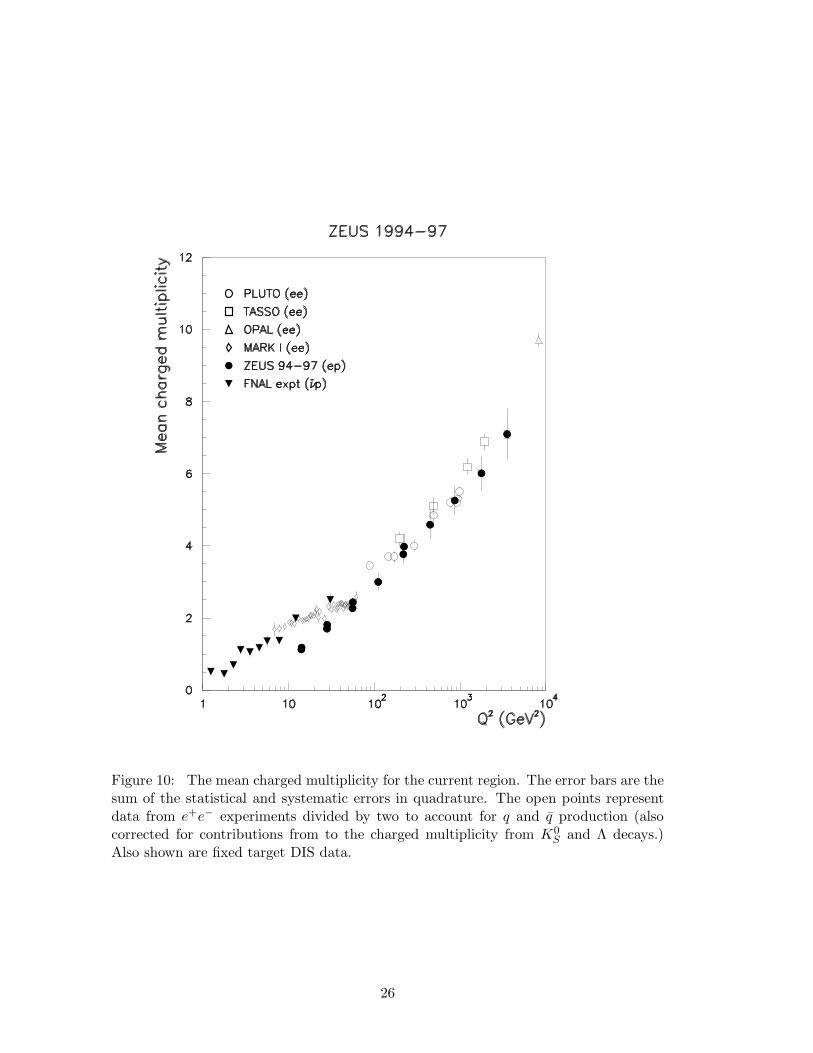
Figure 10: The mean charged multiplicity for the current region. The error bars are thesum of the statistical and systematic errors in quadrature. The open points representdata from e+e− experiments divided by two to account for q and q production (alsocorrected for contributions from to the charged multiplicity from K0
S and Λ decays.)Also shown are fixed target DIS data.
26
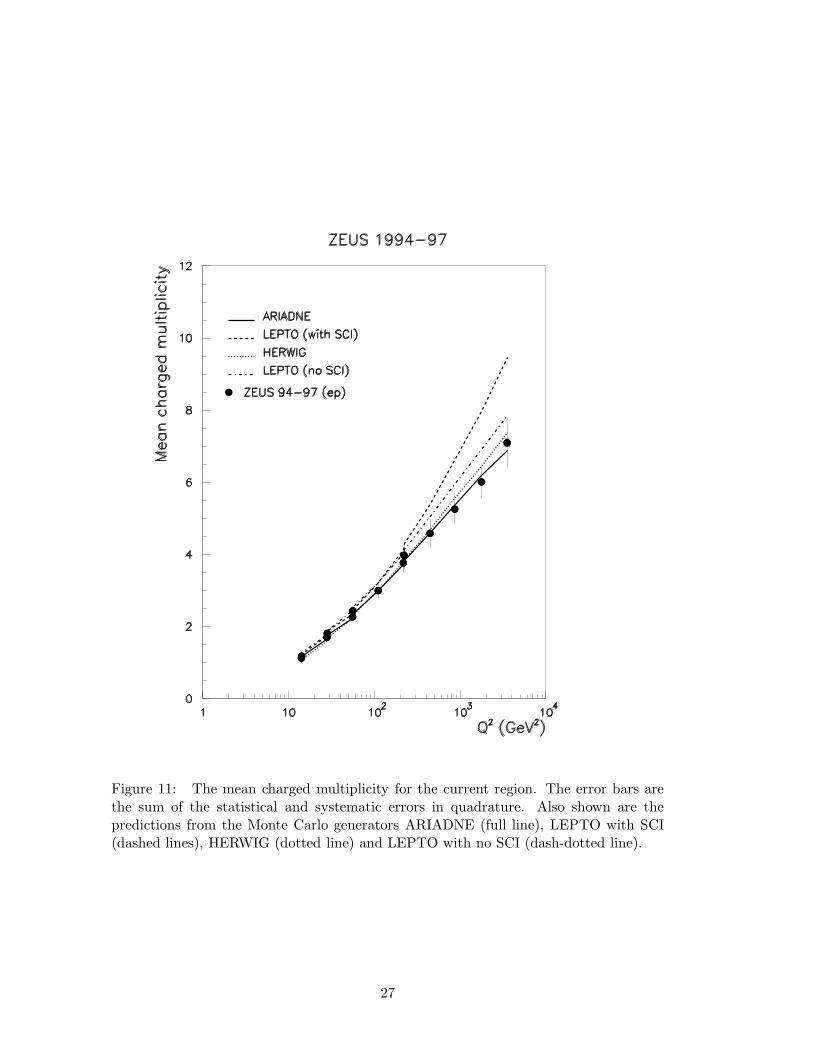
Figure 11: The mean charged multiplicity for the current region. The error bars arethe sum of the statistical and systematic errors in quadrature. Also shown are thepredictions from the Monte Carlo generators ARIADNE (full line), LEPTO with SCI(dashed lines), HERWIG (dotted line) and LEPTO with no SCI (dash-dotted line).
27
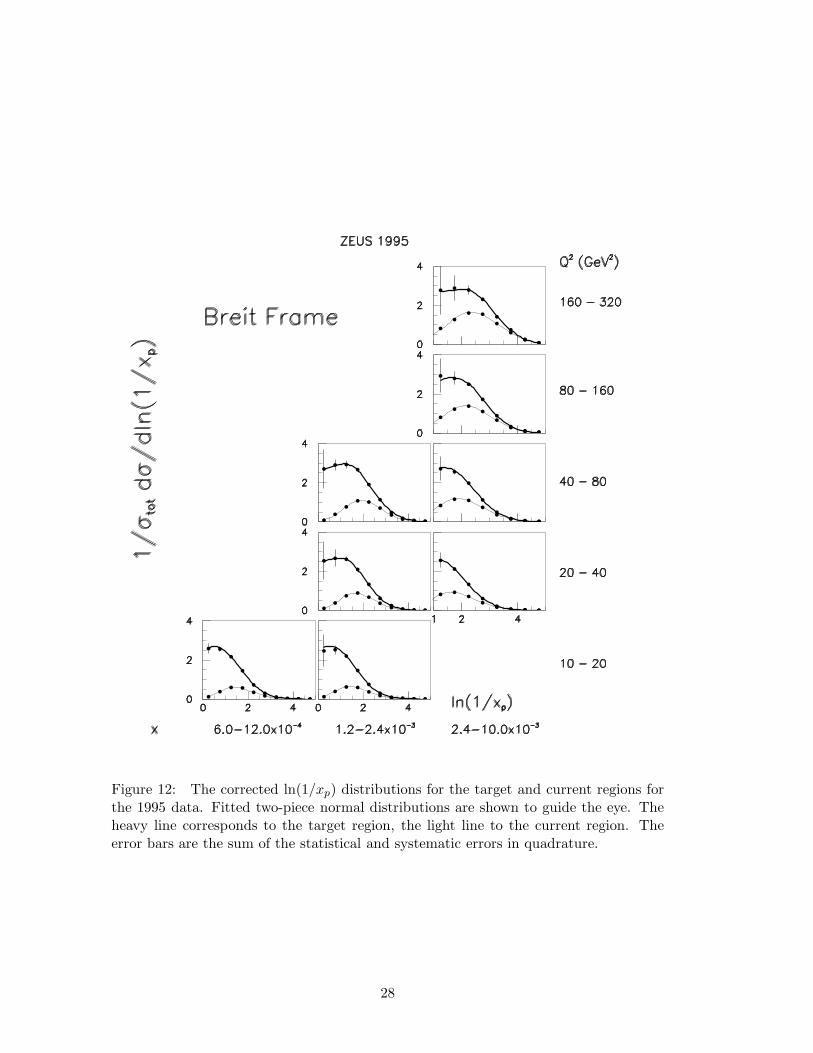
Figure 12: The corrected ln(1/xp) distributions for the target and current regions forthe 1995 data. Fitted two-piece normal distributions are shown to guide the eye. Theheavy line corresponds to the target region, the light line to the current region. Theerror bars are the sum of the statistical and systematic errors in quadrature.
28
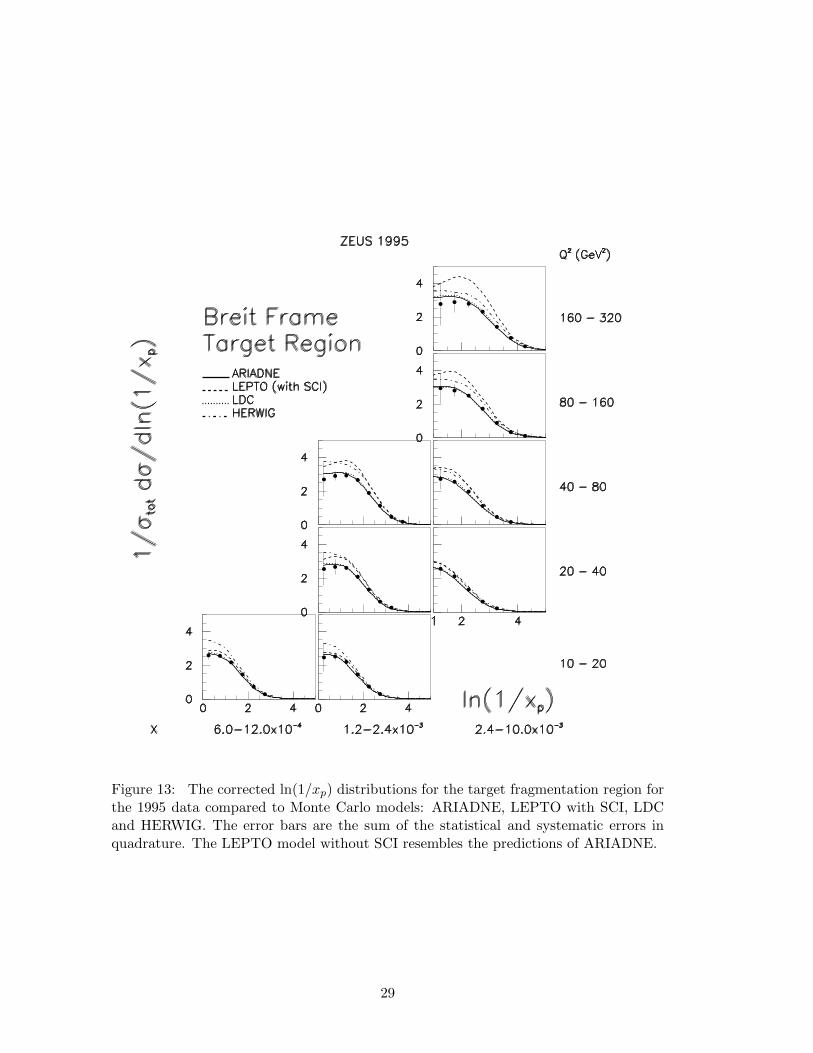
Figure 13: The corrected ln(1/xp) distributions for the target fragmentation region forthe 1995 data compared to Monte Carlo models: ARIADNE, LEPTO with SCI, LDCand HERWIG. The error bars are the sum of the statistical and systematic errors inquadrature. The LEPTO model without SCI resembles the predictions of ARIADNE.
29
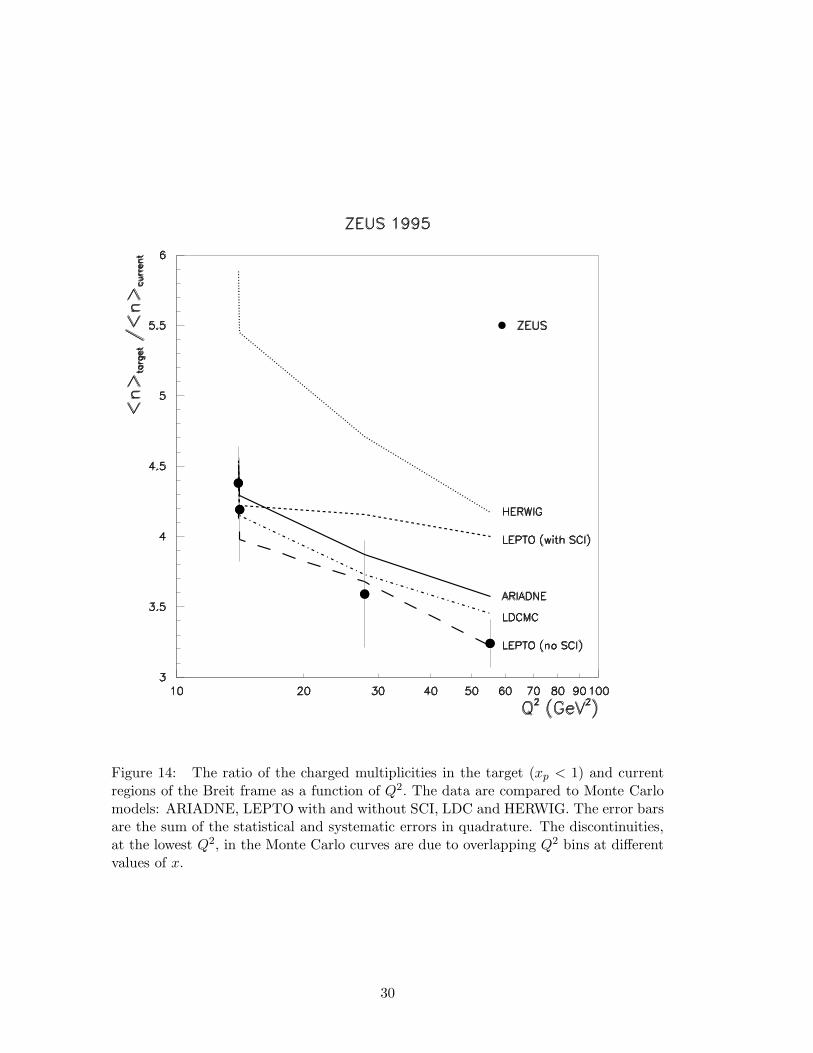
Figure 14: The ratio of the charged multiplicities in the target (xp < 1) and currentregions of the Breit frame as a function of Q2. The data are compared to Monte Carlomodels: ARIADNE, LEPTO with and without SCI, LDC and HERWIG. The error barsare the sum of the statistical and systematic errors in quadrature. The discontinuities,at the lowest Q2, in the Monte Carlo curves are due to overlapping Q2 bins at differentvalues of x.
30
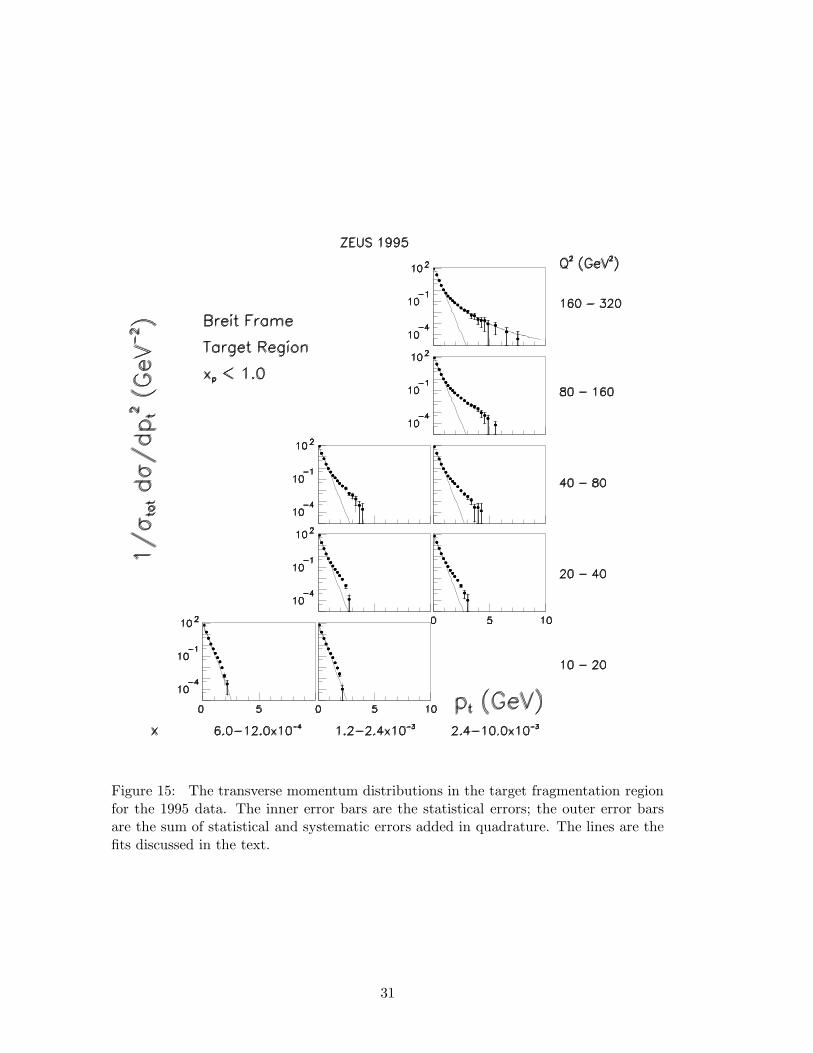
Figure 15: The transverse momentum distributions in the target fragmentation regionfor the 1995 data. The inner error bars are the statistical errors; the outer error barsare the sum of statistical and systematic errors added in quadrature. The lines are thefits discussed in the text.
31

Figure 16: The corrected mean transverse momentum versus scaled momentum dis-tributions for the 1995 data. The inner error bars are the statistical errors; the outererror bars are the sum of statistical and systematic errors added in quadrature. Thefull line indicates the ARIADNE Monte Carlo prediction and the dotted the HERWIGprediction.
32
Copyright © 2022 FDOKUMEN