Development and applications of a city-level alcohol availability and alcohol problems database

Addictive Behavmrs. Vol 21. No. 5. pp. 585-595. 1996
Pergamon Copyright 0 1996 Elsevw Saence Ltd Printed m the USA. All nghts reserved
03n6-4603/96 $15.00 i .oo
SSDI 0306~4603(95)00084-4
MEASUREMENT OF ALCOHOL AND TOBACCO AVAILABILITY
TO UNDERAGE STUDENTS
KNUT-INGE KLEPP,* RHONDA JONES-WEBB,? ALEXANDER C. WAGENAAR,t BRIAN SHORT, DAVID M. MURRAY-T
and JEAN L. FORSTERt *Research Center for Health Promotion, University of Bergen. Bergen. Norway
tDivision of Epidemiology, University of Minnesota. Minneapolis
Abstract - Communities Mobilizing for Change on Alcohol (CMCA) and Tobacco Pohcy Options for Prevention (TPOP) are randomized multicommunity trials designed to reduce the availability of alcohol (CMCA) and tobacco (TPOP) products to underage youth. We as- sessed the test-retest reliability and internal consistency of perceived availability measures de- veloped for surveys of middle and high school students. Two questionnaires were adminis- tered twice. each to separate student populations (CMCA: 9th graders: TPOP: 8th graders) 21 to 26 days apart. A total of 111 (CMCA) and 70 (TPOP) subjects participated at both times (participation rate of 93.3% and 84.3%. respectively). There were no statistlcally significant differences in the distribution of demographic variables. alcohol or tobacco use variables. or availability variables across administrations. The scales assessing perceived access to alcohol or tobacco had high internal consistency (Cronbach’s alpha of 0.84 for alcohol and 0.77 for to- bacco). hut moderate to low test-retest correlations (0.58 and 0.13. respectively). Single-item measures of sources of alcohol and tobacco and reported buy attempts also had moderate to low test-retest correlates (0.10 - 0.65). We recommend that items assessing tobacco and alco- hol availability to underage youth he further developed.
To evaluate the effectiveness of interventions designed to reduce tobacco and alcohol use among adolescents, valid and reliable research instruments are required. A num- ber of studies indicate that adolescents can give reliable and consistent responses to self-report measures of tobacco and alcohol use (Barnea, Rahav, & Teichman, 1987; Brener, Collins, Kann, Warren, & Williams, 1995; Goodstadt, Chan, Sheppard, & Cleve, 1985; Oetting & Beauvais, 1990; O’Malley, Bachman, & Johnston, 1983: Rein- isch, Bell, & Ellickson, 1991). Over the past years, there has been an increased focus on tobacco and alcohol availability as important predictors of use among underage ad- olescents (Boyle, Stedman, & Forster, 1995; Forster, Hourigan & McGovern, 1992; Forster. Klepp & Jeffery, 1989; Lynch & Bonnie, 1994; O’Malley & Wagenaar, 1991; Wagenaar, 1993: Wagenaar et al. 1993). As a result. current educational and policy- oriented intervention studies include perceived availability and specific sources of to- bacco or alcohol for underage adolescents as important outcome variables (Blaine. Hennrikus, Forster, O’Neil, Wolfson. & Pham, 1995: Perry et al., 1993; Wagenaar. Murray, Wolfson, Forster, & Finnean, 1994). Whether adolescents are able to provide reliable reports of their access to tobacco and alcohol is largely unknown. A recent study by Williams and her colleagues found limited support for the reliability of per-
This study was supported by grants ROl AA09142 (A. C. Wagenaar. principal investigator) from the National Institute on Alcohol Abuse and Alcoholism and CA 54893 (J. L. Forster. principal Investigator) from the National Institute of Health.
Correspondence should be sent to Dr. Knut-Inge Klepp. Research Center for Health Promotion. University of Bergen, Oisteinsgate 3,5007 Bergen. Norway.
Requests for reprints should be sent to Dr. Alexander C. Wagenaar. Division of Epidemiology. University of Minnesota. 1300 South Second Street, Suite 300. Minneapohs. MN 55454.

586 K.-I. KLEPP et al
ceived access to alcohol among eighth-grade students (Williams, Toomey, McGovern, Wagenaar, & Perry, 1995). Their perceived access scale had both lower internal con- sistency (Cronbach alpha of 0.57 and 0.64 for boys and girls, respectively) and lower test-retest reliability (0.53 and 0.64 for boys and girls, respectively) compared to scales assessing drug use, peer influence, and self-efficacy (Williams et al., 1995).
Communities Mobilizing for Change on Alcohol (CMCA) is a randomized commu- nity trial designed to alter community policies and practices vis-a-vis the availability of alcohol to underage youth (Wagenaar et al., 1994). Similarly, Tobacco Policy Options for Prevention (TPOP) is a community trial designed to alter community policies and practices vis-a-vis the availability of tobacco to underage youth (Blaine et al., 1996). Both studies include school-based surveys of underage middle-school students. The purpose of this study was to assess the test-retest reliability and internal consistency of the availability measures used in the CMCA and TPOP student surveys. Measures of availability included perceived access, sources of alcohol or tobacco, and reported at- tempts to buy alcohol or tobacco. We compare the. reliability of these measures to reli- ability seen for measures of social norms, reported alcohol or tobacco use, and per- ceived risk of getting caught if using these substances.
METHOD
Two separate populations were recruited. The CMCA questionnaire was tested with ninth-grade students attending one middle school in a modestly sized Minnesota community. This school was recruited from CMCA control districts, and participating students were not part of the main study. The survey was administered in regular classrooms by trained university staff in early October, 1993 (Time l), and again 3 weeks later (Time 2) to the same students. A total of 119 students participated at the first survey, and of these, 111 also participated at follow-up. The data presented in this paper are based on this sample of 111 subjects (participation rate: 93%).
The TPOP questionnaire was similarly tested with eighth-grade students attending one middle school in another modestly sized Minnesota community. This school was recruited from TPOP control districts, and participating students were not part of the main study. The survey was administered in the school’s lunchroom by trained univer- sity staff in early October, 1993 (Time l), and again 4 weeks (26 days) later (Time 2) to the same students. A total of 83 students participated at the first survey, and of these, 70 participated at follow-up (participated rate: 84%) and constitute the sample used in this study.
Questionnaire items for both studies included demographic information such as gender, race, age, and parent’s educational level (Table 1). The CMCA questionnaire included detailed information regarding alcohol use, perceived access to alcohol, spe- cific sources of alcohol, drinking norms, and perceived risk of getting caught drinking. Item content and item response scaling for alcohol-specific items are presented in Ap- pendix A. These items were recoded to provide prevalence estimates of alcohol use (Question I: proportions reporting never drinking, drank in the last year, or drank in the last month; Question II: binge drinking (five or more drinks in a row) during the last 2 weeks; and Question III: average number of drinks at last drinking occasion. Furthermore, we obtained prevalence estimates for various sources of alcohol at last drinking occasion (Question IV), having ever tried to buy alcohol or tried in the last 30 days (Question V), ever been refused to buy alcohol (Question VI), and ever given alco- hol to someone (Sibling, friend or stranger) under 21 years old (Question VII). Questions

Alcohol and tobacco availability 587
Table 1. Consistency of distribution of demographic characteristics across two administrations of the student surveys employed by the Communities Mobilizing for Change on Alcohol and
Tobacco Policy Options for Prevention studies
9th grade 8th Grade
Communities Mobilizing for Change Tobacco Policy Options on Alcohol for Prevention
Test-retest Test-retest Time 1 Time 2 reliability Time 1 Time 2 reliability
(N = 111) (N = 111) (N = 111) (N = 70) (N = 70) (N = 70)
Sex: % female Race: % white Age: mean years (SD) Father’s education: %
<High school >High school Don’t know
Mother’s education: % SHigh school >High school Don’t know
55.9 55.9 1 .oo 48.6 48.6 1 .oo 94.6 95.5 0.90 90.0 87.1 0.72
14.3 (.OS) 14.4 (0.5) 0.80 13.4 (0.6) 13.5 (0.6) 0.87
38.7 33.3 0.76 50.0 45.7 0.4Y 55.0 60.4 35.7 41.4
6.3 6.3 14.3 12.5,
39.1 30.9 0.78 48.6 40.0 0.58 59.1 64.6 38.6 42.9
1.8 4.6 12.9 11.4
assessing perceived access to alcohol (Question VIII), drinking norms (Question IX), and perceived risk of getting caught drinking (Question X) were combined to form
multi-item scales (Table 2; Roman numerals refer to questions in Appendix A).
The TPOP questionnaire included detailed information regarding tobacco use, per-
ceived access to tobacco, specific sources of tobacco, and perceived risk of getting
caught using tobacco. Item content and item response scaling for tobacco specific items included in the TPOP survey are presented in Appendix B. Again, items were recoded to provide prevalence estimates of tobacco use and tobacco purchasing be-
havior, while items assessing perceived access to tobacco or likelihood of being caught using tobacco were combined to form multi-item scales (Table 3; Roman numerals re-
fer to questions in Appendix B). The chi-square test (for dichotomous and polychotomous variables) and the t-test
(for continuous variables) were used to assess the consistency of distributions between
Time 1 and Time 2. The kappa statistics (for dichotomous variables)? unweighted kappa (for polychotomous variables) (FIeiss, 1981), and Pearson’s correlation coeffi-
cients (for continuous variables) were used to examine the consistency of individual
responses (test-retest reliability). Internal consistency for all sales was measured by
Cronbach’s alpha at Time 1 (Cronbach, 1951).
RESULTS
Differences across administrations for demographic characteristics were generally small and nonsignificant. At the individual level, parent’s educational levels were reported
less consistently than the other demographic variables (Table 1). For the TPOP sample, parents’ educational levels had particularly low test-retest correlations (0.49 - 0.58).
For the CMCA sample, differences across administrations for alcohol-related items
were small and nonsignificant (Table 2). The scales Perceived Access to Alcohol and Drinking Norms had high internal consistency (Cronbach’s alpha of 0.84 and 0.91, re-

588 K.-I. KLEPP et al.
Table 2. Communities Mobilizing for Change on Alcohol: Consistency of reported alcohol use and perceived access to alcohol across two administrations of the CMCA Student Alcohol Survey
among 11 respondents”,b”
Time 1
Reported alcohol use 1. Never drank: % 23.6 I. Drank in the last year: % 71.8 I. Drank in the last month: % 40.0
Il. Binge drinking in last 2 weeks: % 12.6 III. Number of drinks at last occasion 3.7 (4.9)
Alcohol availability, drinking norms and likelihood of being caught IV. Source of alcohol at last drinking occasion:
Got it from someone ~21: % 18.0 Got it from someone 221: % 46.0 Bought it at grocery or convenience store: % 0.0 Bought it at liquor store: % 0.9 Bought it at bar or restaurant: % 0.9 Took it from home or friends home: % 17.1
V. Ever tried to buy alcohol: % 8.3 V. Tried to buy alcohol last month: % 3.6
VI. Ever refused purchasing alcohol:% 6.7 VII. Ever given alcohol to someone <21: % 36.9
VIII. Perceived Access to Alcohol (l-7) 4.6 (1.3) IX. Drinking Norms (l-7) 3.5 (1.4) X. Likelihood of Being caught Drinking (l-7) 3.7 (1.2)
Time 2
24.6 71.8 45.5 18.9
4.3 (53)
20.7 41.4
0.0 0.9 0.9
18.9 8.3 2.7 4.8
38.7 4.6 (1.3) 3.5 (1.4) 4.0 (1.2)
Test-retest reliability
0.88 0.78 0.48 0.61 0.45
0.51 0.47
0.39 0.64 0.56 0.47 0.62 0.58 0.79 0.66
aRoman numerals refer to questions in Appendix A. qhe test-retest reliability is measured by kappa statistics for all dichotomous and polychotomous variables and by Pearson’s correlation coefficients for continuous variables (Items III, VIII, IX, and X). ‘Mean values -t standard deviation are presented for items III, VIII, IX, and X.
spectively), while the scale Likelihood of Being Caught Drinking had lower internal consistency (alpha of 0.60). Only three of the alcohol-related variables had a test-re- test correlation of ~0.70, namely lifetime alcohol use (never drank: O&3), alcohol use last year (0.78) and Drinking Norms (0.79). Perceived access to alcohol and the vari- ous sources of alcohol at last drinking occasion all obtained test-retest correlations of 50.60 (Table 2). Binge drinking within the last 2 weeks, Likelihood of being caught drinking, Ever tried to buy alcohol, and ever given alcohol to someone ~21 all ob- tained moderate test-retest correlations (range 0.61466).
Among TPOP participants, there was a nonsignificant trend toward fewer students reporting ever having received a cigarette from a friend or family member from Time 1 to Time 2 (p = .lO). The same tendency was observed for the item assessing how the most recent cigarette was obtained (p = .22). Only minor changes were seen for the other items (Table 3). The two scales, Perceived Access to Tobacco and Likelihood of Being Caught Using Tobacco, both had acceptable internal consistency (alpha of 0.77 and 0.71, respectively). However, these scales had particularly low test-retest correla- tions (0.13 and 0.30, respectively). Items assessing lifetime use of tobacco were the only tobacco-related items with a test-retest correlation of 10.70. Source of last ciga- rette, lifetime source for cigarettes (specifically, friend and family members and sales- person at a business), Tried to buy tobacco last month and Ever given tobacco to someone cl8 all had moderate test-retest correlation (range 0.61465).
Finally, we examined the consistency of reported nonuse across the various alcohol/ tobacco use variables and the “never-used” category for items assessing availability

Alcohol and tobacco availability 589
Table 3. Tobacco Policy Options for Prevention: Consistency of reported tobacco use and perceived access to tobacco across two administrations of the TPOP Student Tobacco Survey among 70 respondents”.h,c
Time 1 Time 2 Test-retest reliability
Reported tobacco use I. Never smoked tobacco: % 52.9 57.1 0.80
II. Regular smokers (weekly): % 10.0 10.0 0.52 III. Ever used smokeless tobacco: % 18.6 17.1 0.76 III. Tried smokeless tobacco > once: % 8.6 8.6 0.82
Tobacco availability and likelihood of being caught IV. How most recent cigarette was obtained: %
never smoked 62.9 71.4 0.61 from friend or family member 34.3 20.0 from vending machine 1.4 2.9 from salesperson at a business 0.0 2.9 stole it from a business 1.4 2.9
V. Have ever obtained cigarettes: % from friend or family member 37.1 24.3 0.64 from vending machine 2.9 7.1 0.26 from salesperson at a business 2.9 5.7 0.65 stole it from a business 2.9 7.1 0.55
VI. Ever tried to buy tobacco: % 9.5 11.1 0.57 VI. Tried to buy tobacco last month: % 4.8 4.8 0.65
VII. Ever refused purchasing tobacco: 7.9 9.5 0.10 VIII. Ever given tobacco to someone ~18: % 15.2 19.7 0.63
IX. Perceived Access to Tobacco (l-7) 3.7 (1.7) 3.9 (1.7) 0.13 X. Likelihood of Being Caught If Using Tobacco (l-7) 3.6 (1.7) 3.7 (1.7) 0.30
aRoman numerals refer to questions in Appendix B. hThe test-retest reliability is measured by kappa statistics for all dichotomous and polychotomous variables and by Pearson’s correlation coefficients for continuous variables (Items 1X and X). (Mean values f standard deviation are presented for items IX and X.
within each questionnaire. We found a high degree of internal agreement for the CMCA alcohol items, with proportion of consistent responses ranging from 97.3% to 99.1% at Time 1 and from 98.2% to 100% at time 2. The internal agreement was slightly lower for tobacco-related items included in TPOP, ranging from 90.0% to 94.3% at Time 1 and from 85.7% to 94.3% at Time 2.
DISCUSSION
The results from this study indicate that items assessing alcohol and tobacco avail- ability had fair temporal stability in the population, as there were only small and non- significant differences across administrations. Furthermore. scales assessing perceived access to alcohol and tobacco had high internal consistency. Items assessing alcohol and tobacco availability had, however, moderate to low test-retest reliability. This was particularly true for items assessing perceived access to tobacco products.
There are several potential explanations for the observed low test-retest reliability of the measures of perceived access. sources of alcohol and tobacco, and reported buy attempts. First of all, we used the Kappa statistics to examine the test-retest reliability for all dichotomous and polychotomous variables. This is a conservative estimate of reliability, particularly for the low prevalence measures included in this manuscript. Pearson correlations were, however, used to measure the test-retest reliability of the

590 K.-I. KLEPP et al.
perceived access scales, which, particularly for tobacco, gave a low test-retest correla- tion (0.13).
Second, the access items themselves might have been poorly worded, therefore con- fusing participants and providing inconsistent responses. If this was the case, however, we would also have expected low internal consistency for both access scales. This was not the case. We observed high Cronbach’s alpha for both Perceived Access to alcohol (0.84) and for Perceived Access to tobacco (0.77). This indicates that for both scales, included questions were related to one another (unidimensionality) and that they measured the intended construct (DeVellis, 1991).
Third, the low test-retest reliability of the perceived access items might be related to response patterns specific to the samples used in these studies. The populations em- ployed in these studies consisted of convenience samples from small towns in the up- per Midwest, consisting primarily of white, middle-class students. These samples are not necessarily representative of eighth- and ninth-grade students in general. In this reliability study, however, both samples were drawn from the respective control popu- lations of the main studies (CMCA and TPOP), and as such represent the target popu- lation. Trained and highly experienced project staff conducted the test-retest surveys according to standard protocols for school-based surveys. The high internal agreement of nonuse reported on the alcohol/tobacco use variables and the “never-used” cate- gory for items assessing availability within each questionnaire indicate that partici- pants made an effort to respond accurately.
Fourth, for his age group (eighth and ninth graders) real changes with respect to al- cohol and tobacco use might take place within a test-retest period of 3-4 weeks. While lifetime estimates of alcohol and tobacco (including alcohol use past year) showed high test-retest reliability with values comparable to those seen in similar studies (Bre- ner et al., 1995; Stein, Lederman, & Shea, 1993) recent use (drinking last month and number of drinks at last occasion) was found to have lower test-retest reliability. Thus, the relatively long test-retest period might have influenced our results.
Finally, perceived access to alcohol and tobacco might not have been a salient topic for a large proportion of the participating students at Time 1. While 40% of the stu- dents in the CMCA sample reported drinking alcohol during the previous one month (Time l), only 10% of the TPOP sample reporting weekly smoking and 9% had tried smokeless tobacco more than once. Thus, as large proportions of the respondents had not recently tried to obtain alcohol or tobacco, they might not have held strong opin- ions about how difficult this would be. The survey itself (Time 1) might have sensitized participating students to this issue and led to increased communication among them. As a result, while the Time 2 reports might have been more accurate, this change re- sulted in low test-retest reliability. This potential explanation would apply particularly to tobacco use because the rates for regular tobacco use were particularly low. This phenomenon, often referred to as reactivity, is a major problem affecting test-retest reliability (Carmines & Zeller, 1979). Repeating this study in a population for whom access to alcohol or tobacco is more salient (subjects with higher use rates) would al- low us to address this potential explanation.
Based on the finding from this reliability study, we conclude that the measures of perceived access to alcohol and tobacco had satisfactory internal consistency. These measures, as well as measures of sources of alcohol and tobacco and reported buy at- tempts had, however, low to moderate test-retest correlates. This, we believe, was pri- marily due to a change in the phenomenon caused by reactivity as well as naturally oc- curring change over a 3- to 4- week period. We recommend that items assessing
Alcohol and tobacco availability 591
tobacco and alcohol availability to underage youth be further developed. Future reli- ability studies ought to be conducted over a l- to 2-week period, include alternative methods such as the alternate-form method (Carmines & Zeller, 1979; DeVellis, 1991) and include ethnically and economically diverse populations to whom access to alco- hol and tobacco are salient topics.
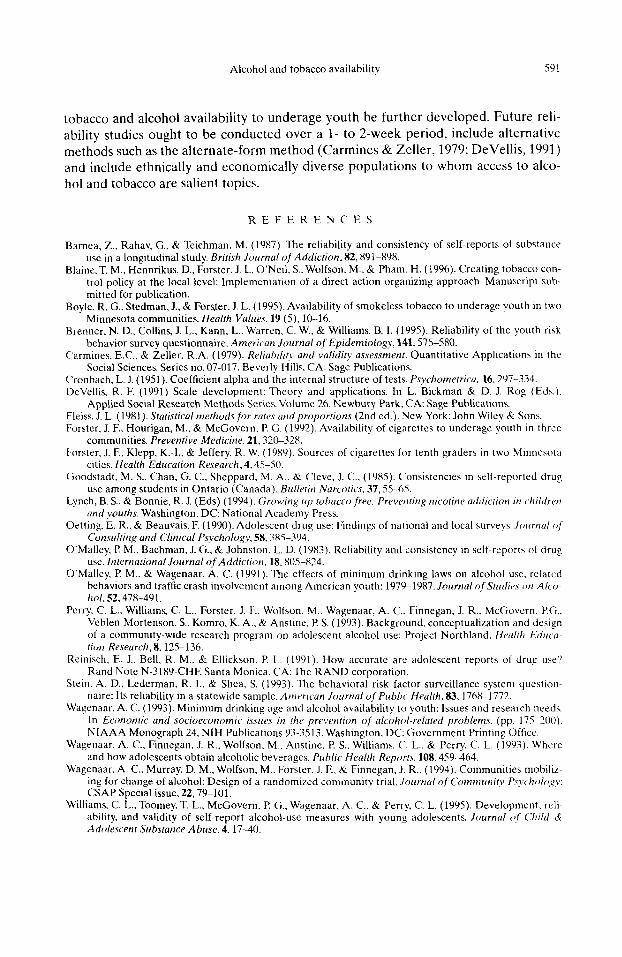
REFERENCES
Barnes. Z., Rahav. G.. & Teichman. M. (19X7). The reliability and consistency of self-reports of substance use in a longitudinal study. British Journal of Addiction. 82.891-898.
Blaine. T. M., Hennrikus, D.. Forster. J. L. O’Neil, S.. Wolfson. M.. & Pham. H. (1996). Creating tobacco con- trol policy at the local level: Implementation of a direct action organizing approach. Manuscript sub- mitted for publication.
Boyle. R. G., Stedman, J., & Fors.ter. J. L. (1995). AvaIlability of smokeless tobacco to underage youth in two Minnesota communities. Health Vahtes. 19 (5). 10-16.
Brenner, N. D.. Collins, J. L., Kann, L.. Warren. C. W., & Williams. B. I. (1995). Reliability of the youth risk behavior survey questionnaire. American Journal of Epidemiology, 141.575-580.
Carmines, E.C.. & Zeller. R.A. (1979). Reliahiliff and validify assessmenf. Quantitative Applications in the Social Sciences. Series no. 07-017. Beverly Hills. CA: Sage Publications.
Cronbach, L. J. (1951). Coefficient alpha and the internal structure of tests. Psychornefricu, 16.297-334. DeVellis. R. F. (lY91) Scale development: Theory and applications. In L. Bickman & D. J. Rog (Eds.).
Applied Social Research Methods Series.Volume 26. Newbury Park, CA: Sage Publications. Fleiss. J. L. (1981). Sfafisfical methods for rafes cmdproporfions (2nd ed.). New York: John Wiley Rr Sons. Forster. J. E. Hourigan, M., & McGovern. P. G. (1992). Availability of cigarettes to underage youth in three
communities. Prevenfive Medicine. 21.32&32X.
Forster. J. F.. Klepp, K.-l., & Jeffery, R. W. (1989). Sources of cigarettes for tenth graders in two Minnesota cities. Healfh Education Research.4.45-SO.
Goodstadt. M. S., Chan. G. C., Sheppard. M. A.. & Cleve. J. C.. (1985). Consistencies in self-reported drug use among students in Ontario (Canada). R~llerirl Narcofics. 37,55-65.
Lynch, B. S.. & Bonnie, R. J. (Eds) (1994). Growing up fohucco ,free. Prevet~fing nicotine addicfion m children
and youths. Washington, DC: National Academy Press. Oetting. E. R., & Beauvais. F. (1990). Adolescent drug use: Findings of national and local surveys. Jorrrncrl of
Consulting and Clinical Psychology. 58.385-394.
O‘Malley. P. M.. Bachman, J. G.. & Johnston. L. D. (1983). Reliability and consistency in self-reports of drug use. Infernafional Journal of Addiction. 18.805-824.
O’Malley. P. M.. & Wagenaar. A. C. (1991). The effects of minimum drinking laws on alcohol use. related behaviors and traffic crash involvement among American youth: 1979-1987. JoltrnalofStlcdirs on A/uI-
hol, 52.478-491.
Perry, C. L.. Williams, C. L.. Forster, J. F.. Wolfson. M., Wagenaar. A. C.. Finnegan, J. R.. McGovern. PG.. Veblen-Mortenson. S., Komro, K. A.. & Anstine. P S. (1993). Background. conceptualization and design of a community-wide research program on adolescent alcohol use: Project Northland. (lea/r/z Eti~c,o- fion Research, 8.125-136.
Reinisch. E. J.. Bell. R. M.. & Ellickson. P. L. (1991). How accurate arc adolescent reports of drug use’? Rand Note N-31X9-CHF. Santa Monica, CA:The RAND corporation.
Stein. A. D., Lederman. R. I.. & Shea. S. (lY93). The behavioral risk factor surveillance system question- naire: Its reliability in a statewide sample. American Journal of Public Heulfh,83,1768-1772.
Wagenaar. A. C. (1993). Minimum drinking age and alcohol availability to youth: Issues and research needs. In Economic and socioeconomic issues in fhe prevenfion of alcohol-related problems. (pp. 175-200). NIAAA Monograph 24. NIH Publications 93-3513. Washington. DC: Government Printing Office.
Wagenaar. A. C., Finnegan. J. R., Wolfson. M.. Anstine. P. S.. Williams, (‘. L.. & Perry, C. L. (1993). Where and how adolescents obtain alcoholic beverages. Public Healrh Reporfs. 108.459464.
Wagenaar. A. C.. Murray. D. M., Wolfson. M.. Forster. J. F.. 6: Finnegan. J. R., (1994). Communities mobiliz- ing for change of alcohol: Design of a randomized community trial, ./olrrnnl of Commtrnif~ P.~~~hr>lo,qy: CSAP Special issue. 22.79-101.
Williams, C. L.. Toomey. T. L., McGovern. P G.. Wagenaar, A. C.. & Perry. C. L. (19Y5). Development. reli- ability. and validity of self-report alcohol-use measures with youns adolescents. Journal of Child Kr
Adolescenf Suhsfance Abuse. 4, 17-40.

592 K.-I. KLEPP et al.
APPENDIX A
Communities Mobilizing for Change on Alcohol: Alcohol items and response scaling
Alcohol use I. When was the last time your drank any alcohol? 1. I’ve never had any alcohol to drink or, the last time was: (mark one answer) 2. sometime in the last week 3. sometime in the last month 4. sometime in the last year 5. more than a year ago
II. The last time you drank any alcohol, how much did you drink? 1. I’ve never had any alcohol to drink or, the last time I drank any alcohol, I had: Please answer for all four categories. Write 00 if you didn’t drink any of this kind of alcohol. Write in the number if you did: - Cans, bottles, or glasses of beer - Bottles of wine coolers - Glasses of wine - Mixed drinks or shots of liquor
III. Think back over the last two weeks. How many times have you had five or more drinks in a row? (A drink is a glass of wine, a bottle of beer, a shot glass of liquor, or a mixed drink or wine cooler.) 1. None 2. Once 3. Twice 4. Three to five times 5. Six to nine times 6. Ten or more times
Source of Alcohol at last drinking occasion IV. The last time you drank any alcohol, how did you get the alcohol?
- I’ve never had any alcohol to drink, or the last time I drank any alcohol: (mark all that apply) - I got it from someone else who was under 21 - I got it from someone else who was 21 or older - I bought it at a grocer or convenience store - I bought it at a liquor store - I bought it at a bar or restaurant - I took it (from home, from a friends home, etc.)
Tried to buy alcohol V. In the last 30 days, how many times did you try to buy alcohol from a store or bar
(whether you were successful or not)? 1. I’ve never tried to buy alcohol from a store or bar 2. I haven’t tried to buy alcohol from a store or bar in the last 30 days.
or, times
VI. In the last 30 days, how many times did a bar or store refuse to sell you alcohol because of your age? 1. I’ve never tried to buy alcohol from a store or bar
Alcohol and tobacco availability 593
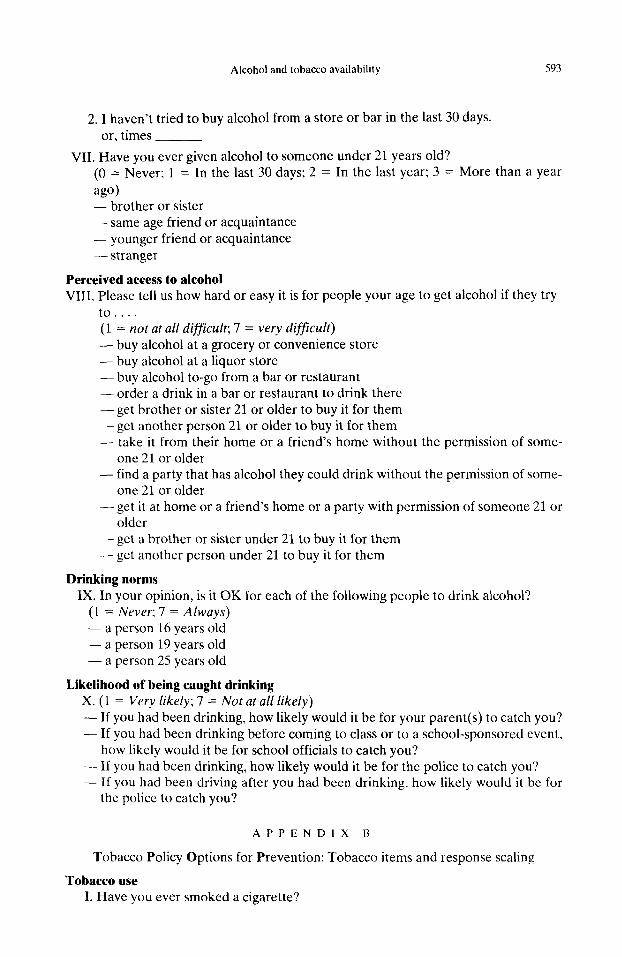
2. I haven’t tried to buy alcohol from a store or bar in the last 30 days. or, times
VII. Have you ever given alcohol to someone under 21 years old? (0 = Never: 1 = In the last 30 days; 2 = In the last year: 3 = More than a year
ago) - brother or sister - same age friend or acquaintance - younger friend or acquaintance - stranger
Perceived access to alcohol VIII. Please tell us how hard or easy it is for people your age to get alcohol if they try
to.... (1 = not at all difficult; 7 = very difficult) - buy alcohol at a grocery or convenience store - buy alcohol at a liquor store - buy alcohol to-go from a bar or restaurant - order a drink in a bar or restaurant to drink there - get brother or sister 21 or older to buy it for them - get another person 21 or older to buy it for them - take it from their home or a friend’s home without the permission of some-
one 21 or older - find a party that has alcohol they could drink without the permission of some-
one 21 or older - get it at home or a friend’s home or a party with permission of someone 21 or
older - get a brother or sister under 21 to buy it for them - get another person under 21 to buy it for them
Drinking norms IX. In your opinion, is it OK for each of the following people to drink alcohol‘?
(1 = Never; 7 = Afways) - a person 16 years old - a person 19 years old - a person 25 years old
Likelihood of being caught drinking X. (1 = Very likely; 7 = Not at all likely) - If you had been drinking, how likely would it be for your parent(s) to catch you‘? - If you had been drinking before coming to class or to a school-sponsored event.
how likely would it be for school officials to catch you? - If you had been drinking, how likely would it be for the police to catch you? - If you had been driving after you had been drinking, how likely would it be for
the police to catch you?
APPENDIX R
Tobacco Policy Options for Prevention: Tobacco items and response scaling
Tobacco use I. Have you ever smoked a cigarette?

s94 K.-l. KLEPP et al.
1. no, never 2. yes, but only once 3. yes, more than once
II. How much do you currently smoke? 1. I don’t smoke 2. not at all in the last 12 months 3. a few times in the last 12 months 4. usually once a month 5. a few times each month 6. usually once a week 7. a few times each week 8. a few times most days 9. about half a pack a day 10. a pack or more each day
III. How many times have you tried chewing tobacco or snuff in your life? 1. never 2. 1 time 3.2-5 times 4.6-10 times 5.11-20 times 6. more than 20 times
Source of cigarettes IV. How did you get your most recent cigarette?
1. I’ve never smoked 2. from a friend or family member 3. from a vending machine 4. bought it from a salesperson at a business 5. stole it from a business
V. Have you ever gotten cigarettes? (Mark all that apply) 1. I’ve never smoked 2. from a friend or family member 3. from a vending machine 4. bought them from a business 5. by stealing them from a business
Tried to buy tobacco VI. In the last 30 days, how many times did you try to buy tobacco products from a
business (whether you were successful or not)? 1. I’ve never tried to buy tobacco products from a business 2. I haven’t tried to buy tobacco from a business in the last 30 days or, times
VII. In the last 30 days, how many times did a business refuse to sell you tobacco products because of your age? 1. I’ve never tried to buy tobacco products from a business 2. I haven’t tried to buy tobacco from a business in the last 30 days or, times
VIII. Have you ever given tobacco products to someone under 18 years old? (0 = Never; 1 = In the last 30 days; 2 = In the last year; 3 = More than a year ago)

Alcohol and tobacco availability
- brother or sister - same age friend or acquaintance - younger friend or acquaintance - stranger
Perceived access to tobacco IX. Please tell us how hard or easy it is for people your age to get tobacco products if
they try to: (1 = not at all dificult; 7 = very difficult): - get them from a friend or family member -buy them from a vending machine - buy them from a salesperson at a business - steal them from a business
Likelihood of being caught using tobacco X. (1 = very likely; 7 = not at all likely)
- If you had been using tobacco, how likely would it be for your parent(s) to catch YOU?
- If you were smoking in public, how likely would it be for the police to do some- thing about it?
- If you bought cigarettes or smokeless tobacco, how likely would it be for the po- lice to catch you?
Copyright © 2022 FDOKUMEN